New Troy, MI Map & Demographics
New Troy Map
New Troy Overview
$38,202
PER CAPITA INCOME
$84,250
AVG FAMILY INCOME
$63,906
AVG HOUSEHOLD INCOME
24.9%
WAGE / INCOME GAP [ % ]
75.1¢/ $1
WAGE / INCOME GAP [ $ ]
0.32
INEQUALITY / GINI INDEX
367
TOTAL POPULATION
181
MALE POPULATION
186
FEMALE POPULATION
97.31
MALES / 100 FEMALES
102.76
FEMALES / 100 MALES
41.4
MEDIAN AGE
2.9
AVG FAMILY SIZE
2.4
AVG HOUSEHOLD SIZE
238
LABOR FORCE [ PEOPLE ]
76.3%
PERCENT IN LABOR FORCE
New Troy Zip Codes
New Troy Area Codes
Income in New Troy
Income Overview in New Troy
Per Capita Income in New Troy is $38,202, while median incomes of families and households are $84,250 and $63,906 respectively.
| Characteristic | Number | Measure |
| Per Capita Income | 367 | $38,202 |
| Median Family Income | 95 | $84,250 |
| Mean Family Income | 95 | $97,415 |
| Median Household Income | 151 | $63,906 |
| Mean Household Income | 151 | $86,051 |
| Income Deficit | 95 | $0 |
| Wage / Income Gap (%) | 367 | 24.92% |
| Wage / Income Gap ($) | 367 | 75.08¢ per $1 |
| Gini / Inequality Index | 367 | 0.32 |
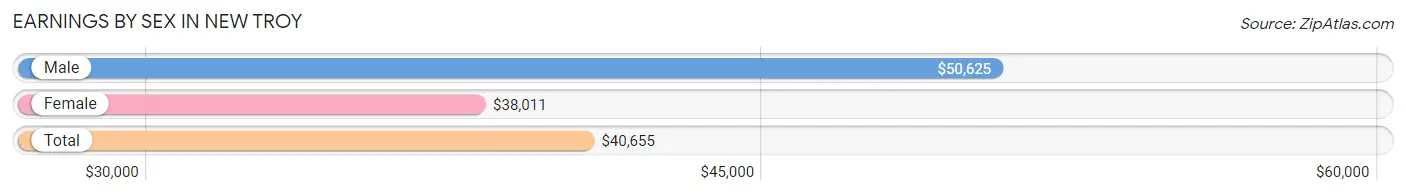
Earnings by Sex in New Troy
Average Earnings in New Troy are $40,655, $50,625 for men and $38,011 for women, a difference of 24.9%.
| Sex | Number | Average Earnings |
| Male | 128 (51.4%) | $50,625 |
| Female | 121 (48.6%) | $38,011 |
| Total | 249 (100.0%) | $40,655 |
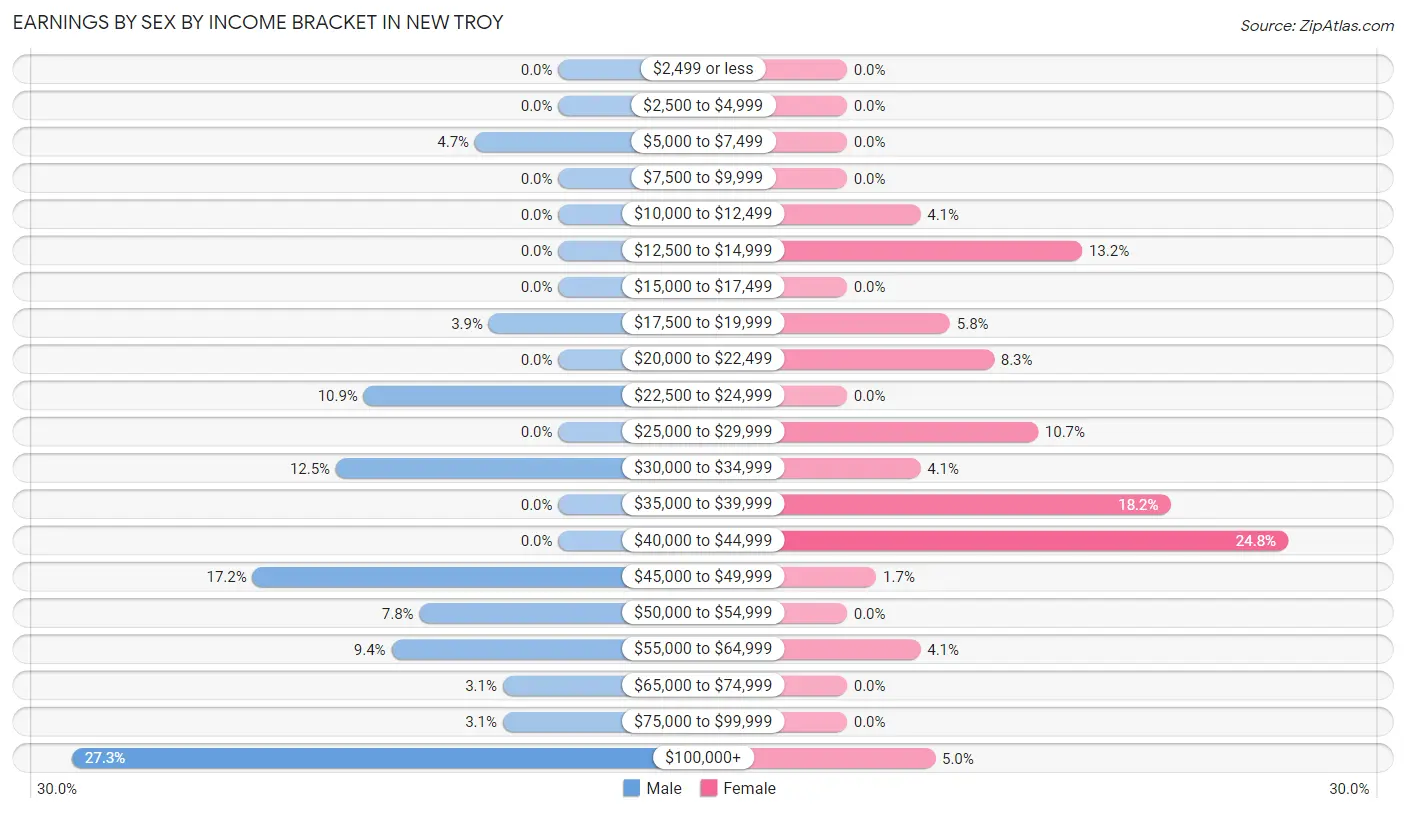
Earnings by Sex by Income Bracket in New Troy
The most common earnings brackets in New Troy are $100,000+ for men (35 | 27.3%) and $40,000 to $44,999 for women (30 | 24.8%).
| Income | Male | Female |
| $2,499 or less | 0 (0.0%) | 0 (0.0%) |
| $2,500 to $4,999 | 0 (0.0%) | 0 (0.0%) |
| $5,000 to $7,499 | 6 (4.7%) | 0 (0.0%) |
| $7,500 to $9,999 | 0 (0.0%) | 0 (0.0%) |
| $10,000 to $12,499 | 0 (0.0%) | 5 (4.1%) |
| $12,500 to $14,999 | 0 (0.0%) | 16 (13.2%) |
| $15,000 to $17,499 | 0 (0.0%) | 0 (0.0%) |
| $17,500 to $19,999 | 5 (3.9%) | 7 (5.8%) |
| $20,000 to $22,499 | 0 (0.0%) | 10 (8.3%) |
| $22,500 to $24,999 | 14 (10.9%) | 0 (0.0%) |
| $25,000 to $29,999 | 0 (0.0%) | 13 (10.7%) |
| $30,000 to $34,999 | 16 (12.5%) | 5 (4.1%) |
| $35,000 to $39,999 | 0 (0.0%) | 22 (18.2%) |
| $40,000 to $44,999 | 0 (0.0%) | 30 (24.8%) |
| $45,000 to $49,999 | 22 (17.2%) | 2 (1.7%) |
| $50,000 to $54,999 | 10 (7.8%) | 0 (0.0%) |
| $55,000 to $64,999 | 12 (9.4%) | 5 (4.1%) |
| $65,000 to $74,999 | 4 (3.1%) | 0 (0.0%) |
| $75,000 to $99,999 | 4 (3.1%) | 0 (0.0%) |
| $100,000+ | 35 (27.3%) | 6 (5.0%) |
| Total | 128 (100.0%) | 121 (100.0%) |
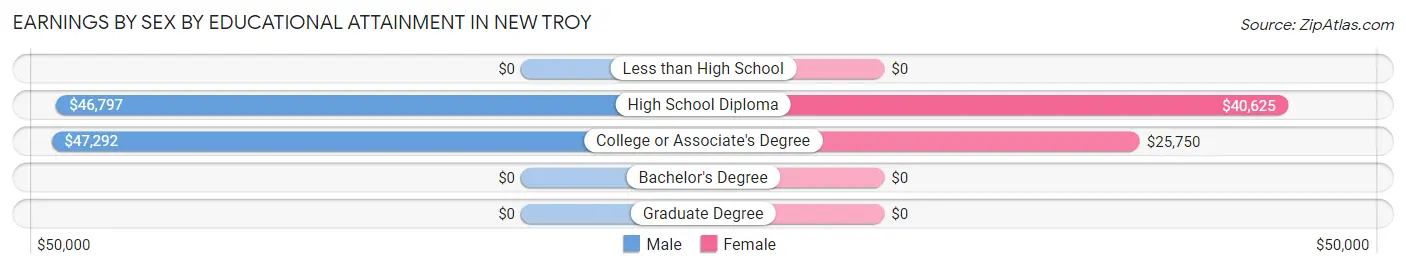
Earnings by Sex by Educational Attainment in New Troy
Average earnings in New Troy are $46,648 for men and $38,750 for women, a difference of 16.9%. Men with an educational attainment of college or associate's degree enjoy the highest average annual earnings of $47,292, while those with high school diploma education earn the least with $46,797. Women with an educational attainment of high school diploma earn the most with the average annual earnings of $40,625, while those with college or associate's degree education have the smallest earnings of $25,750.
| Educational Attainment | Male Income | Female Income |
| Less than High School | - | - |
| High School Diploma | $46,797 | $40,625 |
| College or Associate's Degree | $47,292 | $25,750 |
| Bachelor's Degree | - | - |
| Graduate Degree | - | - |
| Total | $46,648 | $38,750 |
Family Income in New Troy
Family Income Brackets in New Troy
According to the New Troy family income data, there are 30 families falling into the $100,000 to $149,999 income range, which is the most common income bracket and makes up 31.6% of all families.
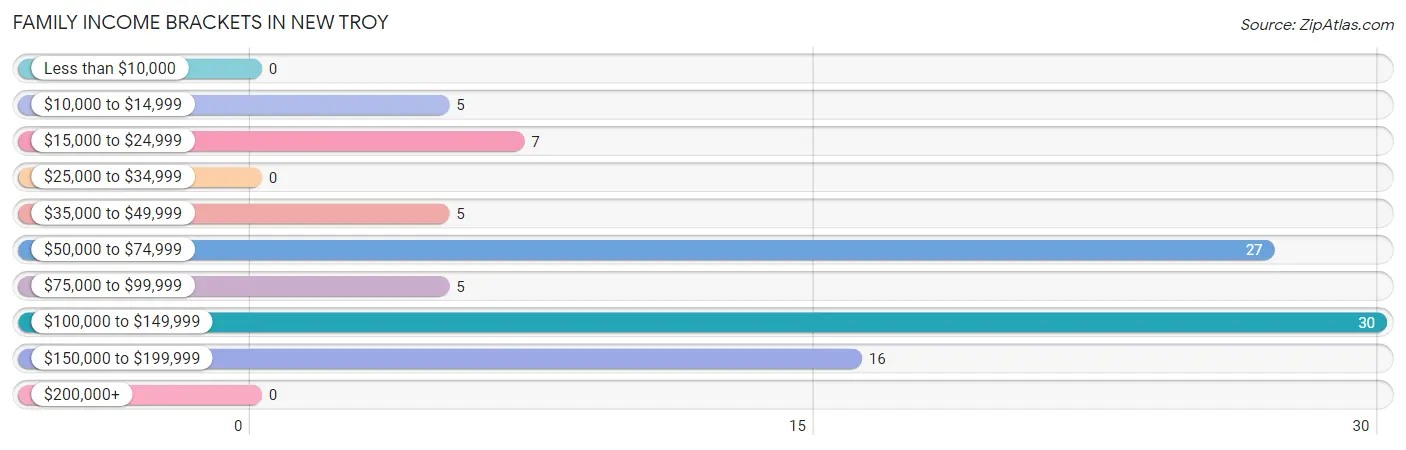
| Income Bracket | # Families | % Families |
| Less than $10,000 | 0 | 0.0% |
| $10,000 to $14,999 | 5 | 5.3% |
| $15,000 to $24,999 | 7 | 7.4% |
| $25,000 to $34,999 | 0 | 0.0% |
| $35,000 to $49,999 | 5 | 5.3% |
| $50,000 to $74,999 | 27 | 28.4% |
| $75,000 to $99,999 | 5 | 5.3% |
| $100,000 to $149,999 | 30 | 31.6% |
| $150,000 to $199,999 | 16 | 16.8% |
| $200,000+ | 0 | 0.0% |
Family Income by Famaliy Size in New Troy
3-person families (40 | 42.1%) account for the highest median family income in New Troy with $146,667 per family, while 3-person families (40 | 42.1%) have the highest median income of $48,889 per family member.
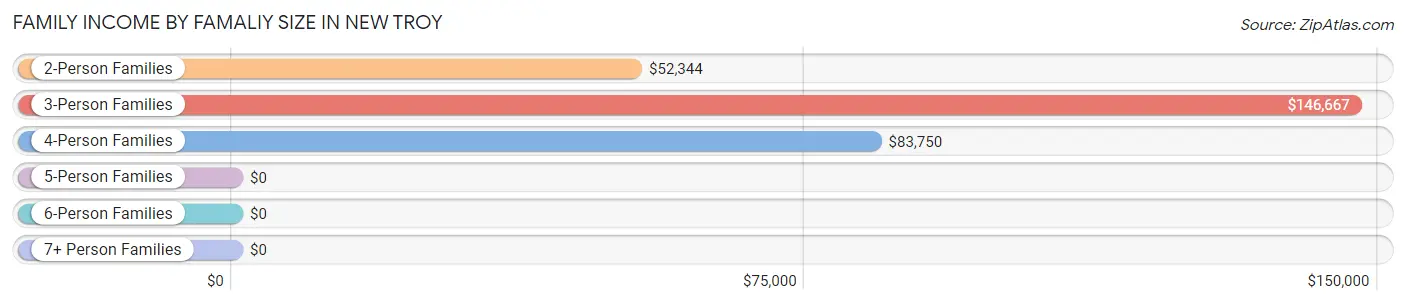
| Income Bracket | # Families | Median Income |
| 2-Person Families | 40 (42.1%) | $52,344 |
| 3-Person Families | 40 (42.1%) | $146,667 |
| 4-Person Families | 15 (15.8%) | $83,750 |
| 5-Person Families | 0 (0.0%) | $0 |
| 6-Person Families | 0 (0.0%) | $0 |
| 7+ Person Families | 0 (0.0%) | $0 |
| Total | 95 (100.0%) | $84,250 |
Family Income by Number of Earners in New Troy
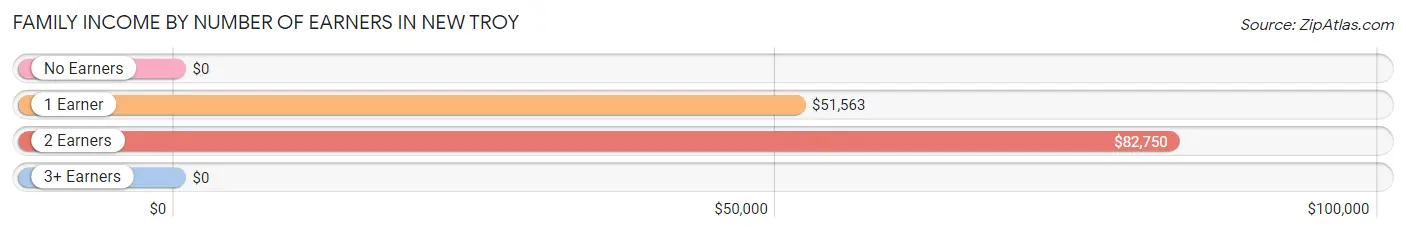
| Number of Earners | # Families | Median Income |
| No Earners | 0 (0.0%) | $0 |
| 1 Earner | 39 (41.0%) | $51,563 |
| 2 Earners | 35 (36.8%) | $82,750 |
| 3+ Earners | 21 (22.1%) | $0 |
| Total | 95 (100.0%) | $84,250 |
Household Income in New Troy
Household Income Brackets in New Troy
With 54 households falling in the category, the $50,000 to $74,999 income range is the most frequent in New Troy, accounting for 35.8% of all households.
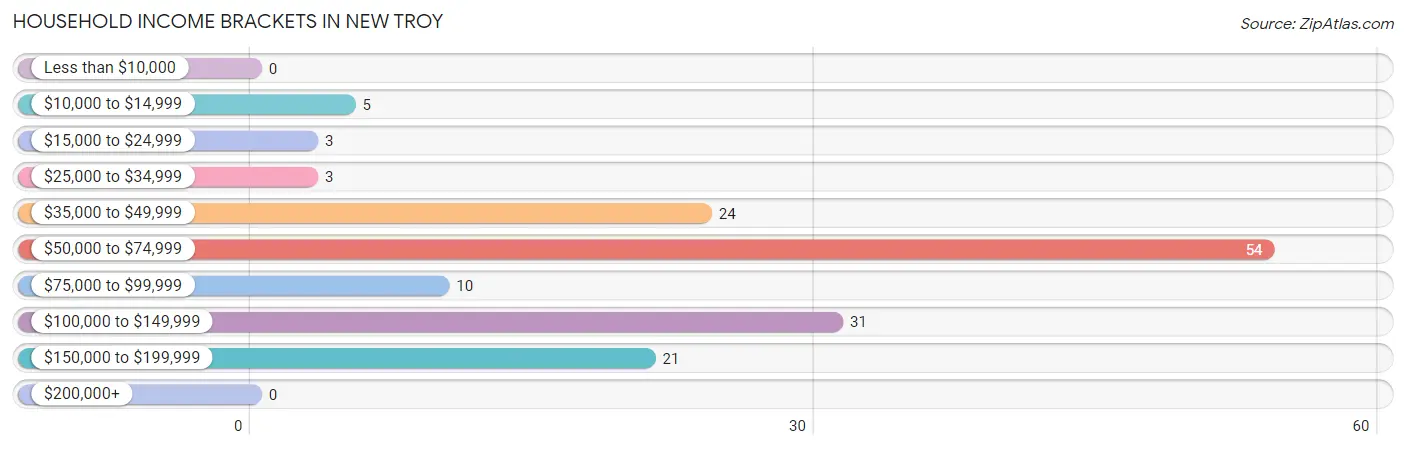
| Income Bracket | # Households | % Households |
| Less than $10,000 | 0 | 0.0% |
| $10,000 to $14,999 | 5 | 3.3% |
| $15,000 to $24,999 | 3 | 2.0% |
| $25,000 to $34,999 | 3 | 2.0% |
| $35,000 to $49,999 | 24 | 15.9% |
| $50,000 to $74,999 | 54 | 35.8% |
| $75,000 to $99,999 | 10 | 6.6% |
| $100,000 to $149,999 | 31 | 20.5% |
| $150,000 to $199,999 | 21 | 13.9% |
| $200,000+ | 0 | 0.0% |
Household Income by Householder Age in New Troy
The median household income in New Troy is $63,906, with the highest median household income of $103,472 found in the 45 to 64 years age bracket for the primary householder. A total of 73 households (48.3%) fall into this category. Meanwhile, the 15 to 24 years age bracket for the primary householder has the lowest median household income of $0, with 19 households (12.6%) in this group.
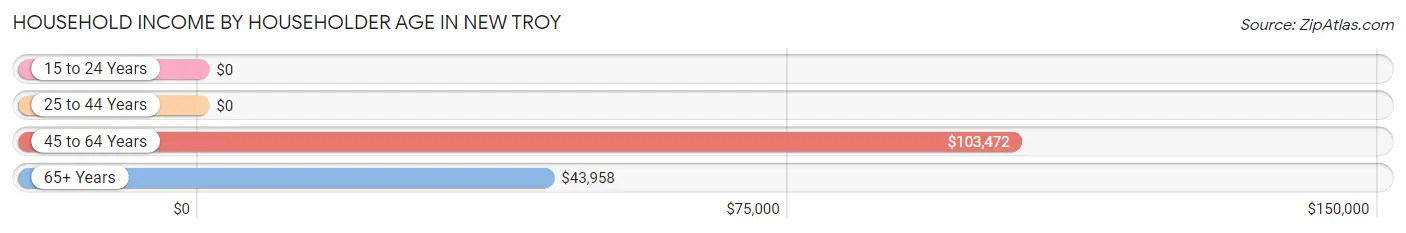
| Income Bracket | # Households | Median Income |
| 15 to 24 Years | 19 (12.6%) | $0 |
| 25 to 44 Years | 40 (26.5%) | $0 |
| 45 to 64 Years | 73 (48.3%) | $103,472 |
| 65+ Years | 19 (12.6%) | $43,958 |
| Total | 151 (100.0%) | $63,906 |
Poverty in New Troy
Income Below Poverty by Sex and Age in New Troy
With 7.3% poverty level for males and 14.5% for females among the residents of New Troy, under 5 year old males and 25 to 34 year old females are the most vulnerable to poverty, with 6 males (100.0%) and 12 females (60.0%) in their respective age groups living below the poverty level.
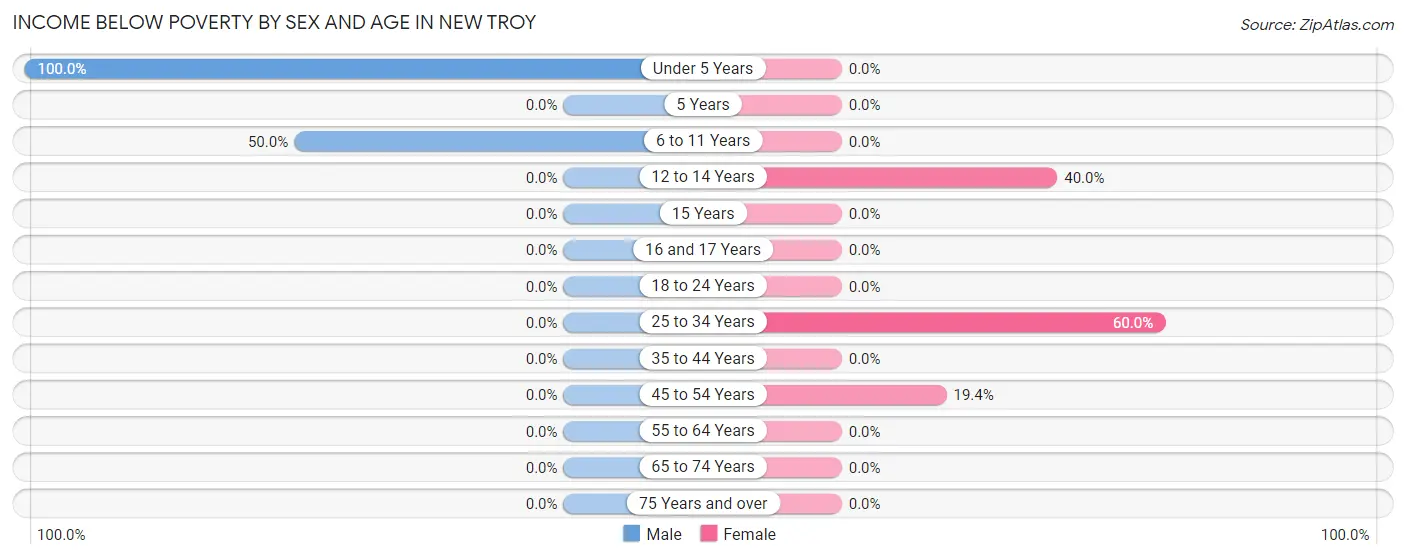
| Age Bracket | Male | Female |
| Under 5 Years | 6 (100.0%) | 0 (0.0%) |
| 5 Years | 0 (0.0%) | 0 (0.0%) |
| 6 to 11 Years | 7 (50.0%) | 0 (0.0%) |
| 12 to 14 Years | 0 (0.0%) | 8 (40.0%) |
| 15 Years | 0 (0.0%) | 0 (0.0%) |
| 16 and 17 Years | 0 (0.0%) | 0 (0.0%) |
| 18 to 24 Years | 0 (0.0%) | 0 (0.0%) |
| 25 to 34 Years | 0 (0.0%) | 12 (60.0%) |
| 35 to 44 Years | 0 (0.0%) | 0 (0.0%) |
| 45 to 54 Years | 0 (0.0%) | 7 (19.4%) |
| 55 to 64 Years | 0 (0.0%) | 0 (0.0%) |
| 65 to 74 Years | 0 (0.0%) | 0 (0.0%) |
| 75 Years and over | 0 (0.0%) | 0 (0.0%) |
| Total | 13 (7.3%) | 27 (14.5%) |
Income Above Poverty by Sex and Age in New Troy
According to the poverty statistics in New Troy, males aged 18 to 24 years and females aged 6 to 11 years are the age groups that are most secure financially, with 100.0% of males and 100.0% of females in these age groups living above the poverty line.
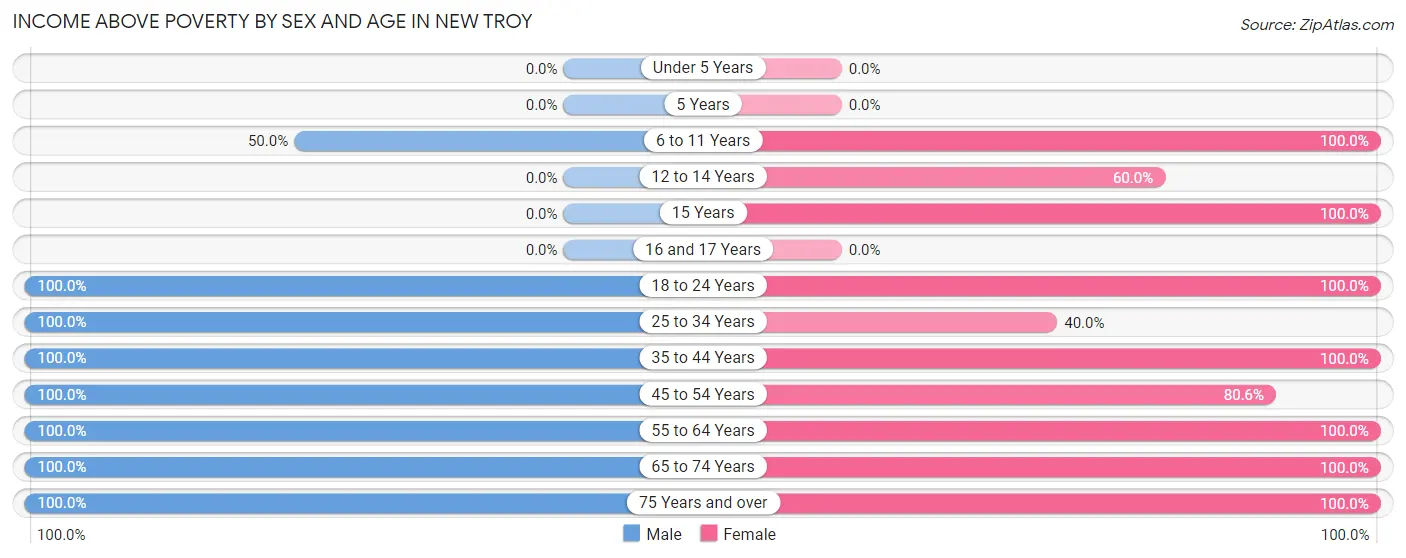
| Age Bracket | Male | Female |
| Under 5 Years | 0 (0.0%) | 0 (0.0%) |
| 5 Years | 0 (0.0%) | 0 (0.0%) |
| 6 to 11 Years | 7 (50.0%) | 5 (100.0%) |
| 12 to 14 Years | 0 (0.0%) | 12 (60.0%) |
| 15 Years | 0 (0.0%) | 6 (100.0%) |
| 16 and 17 Years | 0 (0.0%) | 0 (0.0%) |
| 18 to 24 Years | 50 (100.0%) | 33 (100.0%) |
| 25 to 34 Years | 13 (100.0%) | 8 (40.0%) |
| 35 to 44 Years | 23 (100.0%) | 24 (100.0%) |
| 45 to 54 Years | 17 (100.0%) | 29 (80.6%) |
| 55 to 64 Years | 42 (100.0%) | 26 (100.0%) |
| 65 to 74 Years | 5 (100.0%) | 9 (100.0%) |
| 75 Years and over | 7 (100.0%) | 7 (100.0%) |
| Total | 164 (92.7%) | 159 (85.5%) |
Income Below Poverty Among Married-Couple Families in New Troy
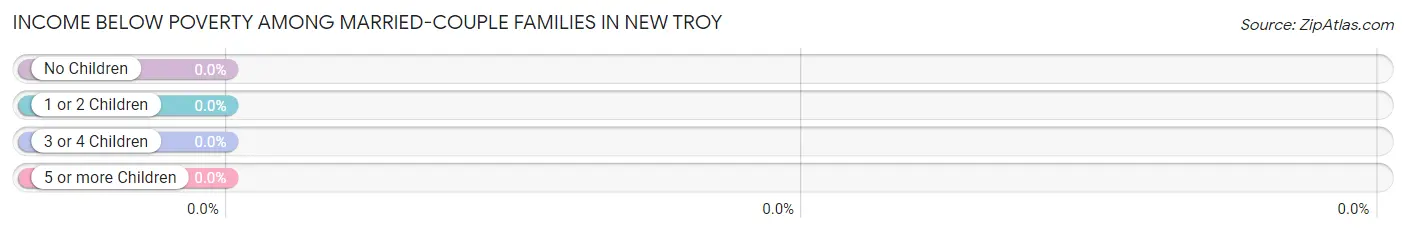
| Children | Above Poverty | Below Poverty |
| No Children | 32 (100.0%) | 0 (0.0%) |
| 1 or 2 Children | 27 (100.0%) | 0 (0.0%) |
| 3 or 4 Children | 0 (0.0%) | 0 (0.0%) |
| 5 or more Children | 0 (0.0%) | 0 (0.0%) |
| Total | 59 (100.0%) | 0 (0.0%) |
Income Below Poverty Among Single-Parent Households in New Troy
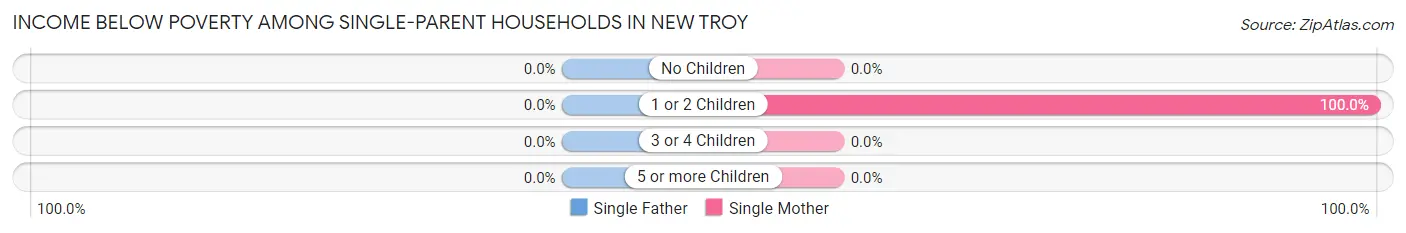
| Children | Single Father | Single Mother |
| No Children | 0 (0.0%) | 0 (0.0%) |
| 1 or 2 Children | 0 (0.0%) | 12 (100.0%) |
| 3 or 4 Children | 0 (0.0%) | 0 (0.0%) |
| 5 or more Children | 0 (0.0%) | 0 (0.0%) |
| Total | 0 (0.0%) | 12 (33.3%) |
Income Below Poverty Among Married-Couple vs Single-Parent Households in New Troy
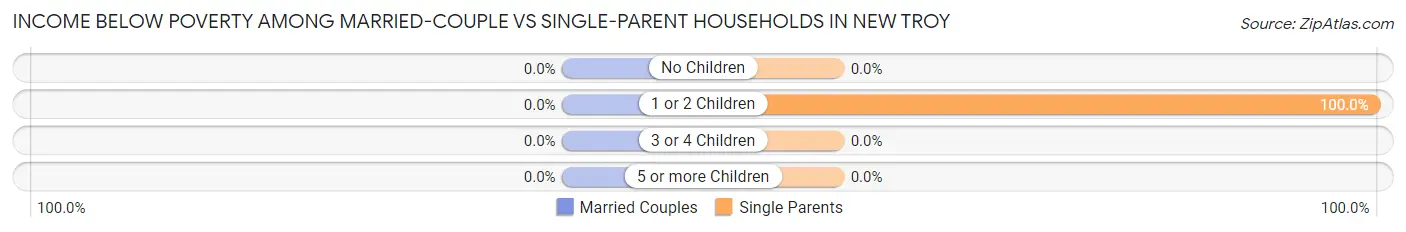
| Children | Married-Couple Families | Single-Parent Households |
| No Children | 0 (0.0%) | 0 (0.0%) |
| 1 or 2 Children | 0 (0.0%) | 12 (100.0%) |
| 3 or 4 Children | 0 (0.0%) | 0 (0.0%) |
| 5 or more Children | 0 (0.0%) | 0 (0.0%) |
| Total | 0 (0.0%) | 12 (33.3%) |
Race in New Troy
The most populous races in New Troy are White / Caucasian (288 | 78.5%), Some other Race (57 | 15.5%), and Two or more Races (22 | 6.0%).
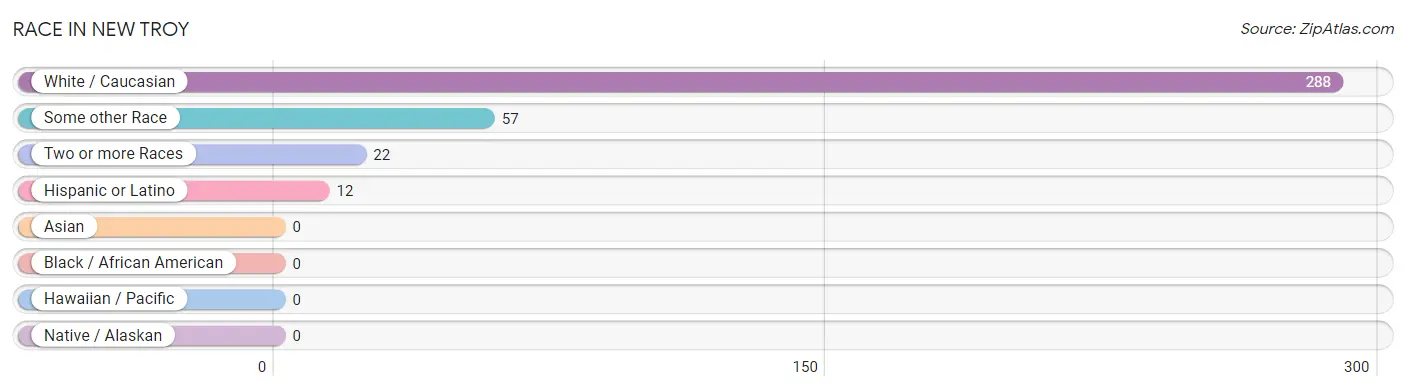
| Race | # Population | % Population |
| Asian | 0 | 0.0% |
| Black / African American | 0 | 0.0% |
| Hawaiian / Pacific | 0 | 0.0% |
| Hispanic or Latino | 12 | 3.3% |
| Native / Alaskan | 0 | 0.0% |
| White / Caucasian | 288 | 78.5% |
| Two or more Races | 22 | 6.0% |
| Some other Race | 57 | 15.5% |
| Total | 367 | 100.0% |
Ancestry in New Troy
The most populous ancestries reported in New Troy are German (99 | 27.0%), English (40 | 10.9%), Irish (25 | 6.8%), Polish (20 | 5.4%), and Scotch-Irish (19 | 5.2%), together accounting for 55.3% of all New Troy residents.
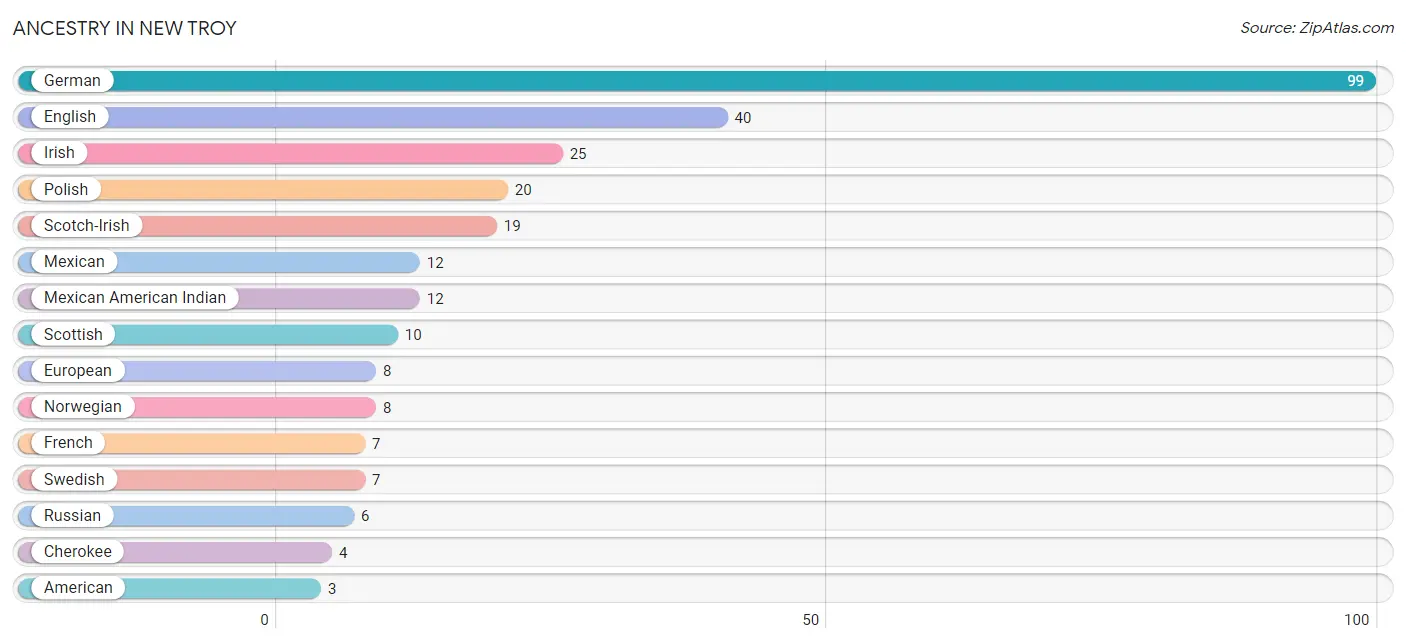
| Ancestry | # Population | % Population |
| American | 3 | 0.8% |
| Cherokee | 4 | 1.1% |
| English | 40 | 10.9% |
| European | 8 | 2.2% |
| French | 7 | 1.9% |
| German | 99 | 27.0% |
| Irish | 25 | 6.8% |
| Mexican | 12 | 3.3% |
| Mexican American Indian | 12 | 3.3% |
| Norwegian | 8 | 2.2% |
| Polish | 20 | 5.4% |
| Russian | 6 | 1.6% |
| Scotch-Irish | 19 | 5.2% |
| Scottish | 10 | 2.7% |
| Swedish | 7 | 1.9% | View All 15 Rows |
Immigrants in New Troy
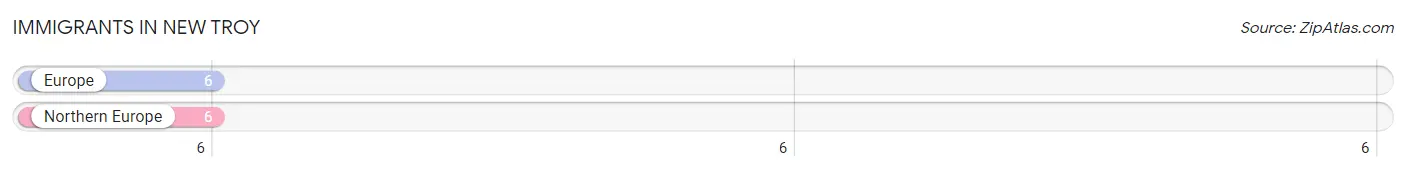
The most numerous immigrant groups reported in New Troy came from Europe (6 | 1.6%), and Northern Europe (6 | 1.6%), together accounting for 3.3% of all New Troy residents.
| Immigration Origin | # Population | % Population |
| Europe | 6 | 1.6% |
| Northern Europe | 6 | 1.6% | View All 2 Rows |
Sex and Age in New Troy
Sex and Age in New Troy
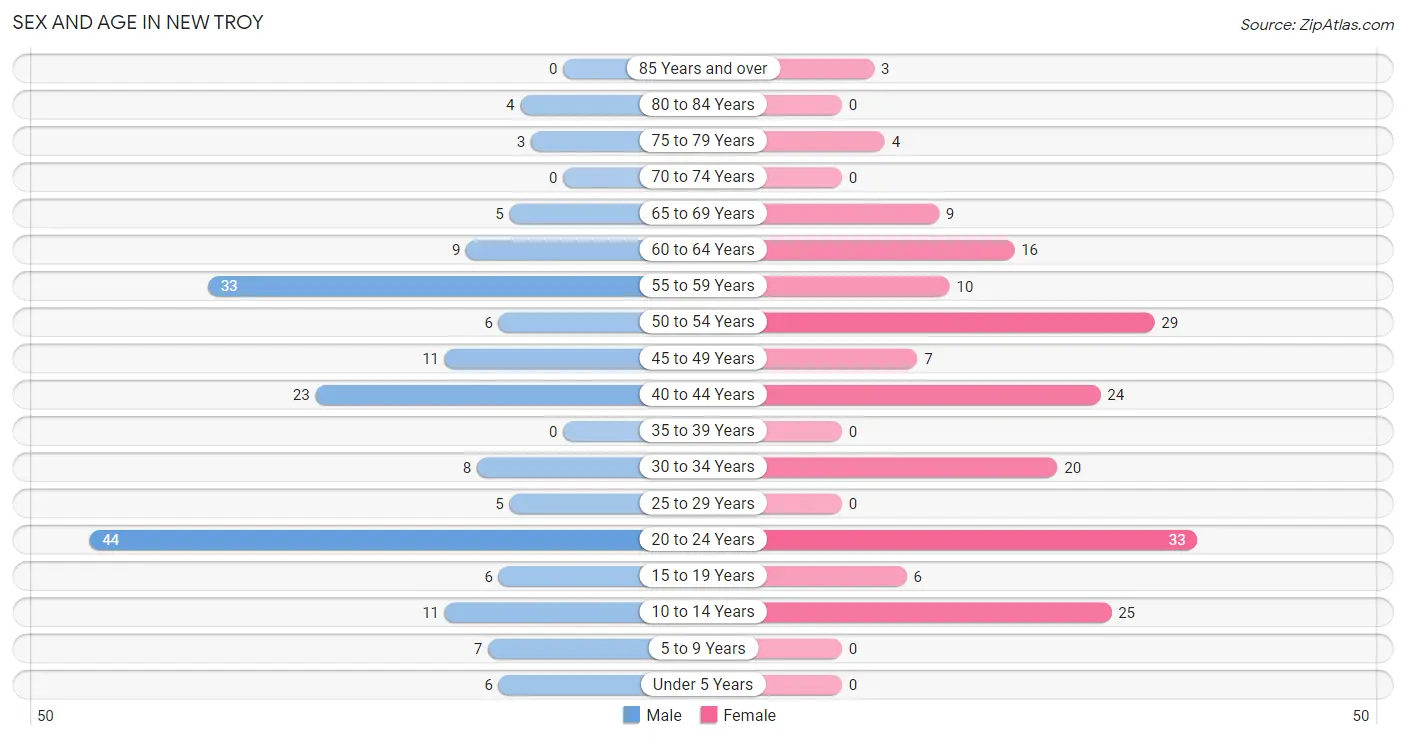
The most populous age groups in New Troy are 20 to 24 Years (44 | 24.3%) for men and 20 to 24 Years (33 | 17.7%) for women.
| Age Bracket | Male | Female |
| Under 5 Years | 6 (3.3%) | 0 (0.0%) |
| 5 to 9 Years | 7 (3.9%) | 0 (0.0%) |
| 10 to 14 Years | 11 (6.1%) | 25 (13.4%) |
| 15 to 19 Years | 6 (3.3%) | 6 (3.2%) |
| 20 to 24 Years | 44 (24.3%) | 33 (17.7%) |
| 25 to 29 Years | 5 (2.8%) | 0 (0.0%) |
| 30 to 34 Years | 8 (4.4%) | 20 (10.7%) |
| 35 to 39 Years | 0 (0.0%) | 0 (0.0%) |
| 40 to 44 Years | 23 (12.7%) | 24 (12.9%) |
| 45 to 49 Years | 11 (6.1%) | 7 (3.8%) |
| 50 to 54 Years | 6 (3.3%) | 29 (15.6%) |
| 55 to 59 Years | 33 (18.2%) | 10 (5.4%) |
| 60 to 64 Years | 9 (5.0%) | 16 (8.6%) |
| 65 to 69 Years | 5 (2.8%) | 9 (4.8%) |
| 70 to 74 Years | 0 (0.0%) | 0 (0.0%) |
| 75 to 79 Years | 3 (1.7%) | 4 (2.1%) |
| 80 to 84 Years | 4 (2.2%) | 0 (0.0%) |
| 85 Years and over | 0 (0.0%) | 3 (1.6%) |
| Total | 181 (100.0%) | 186 (100.0%) |
Families and Households in New Troy
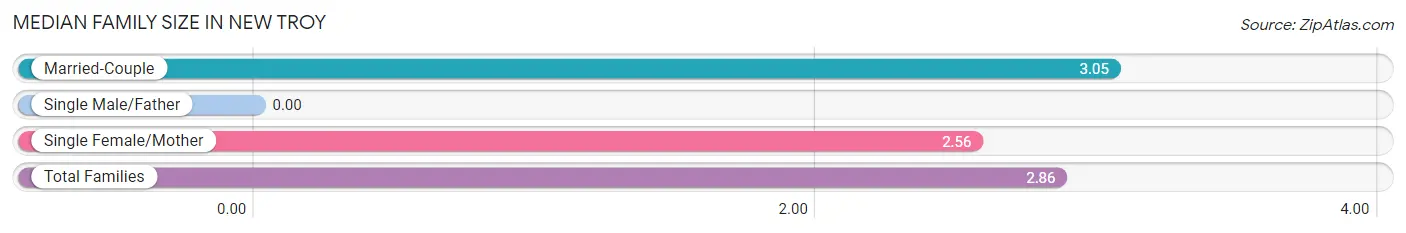
Median Family Size in New Troy
| Family Type | # Families | Family Size |
| Married-Couple | 59 (62.1%) | 3.05 |
| Single Male/Father | 0 (0.0%) | - |
| Single Female/Mother | 36 (37.9%) | 2.56 |
| Total Families | 95 (100.0%) | 2.86 |
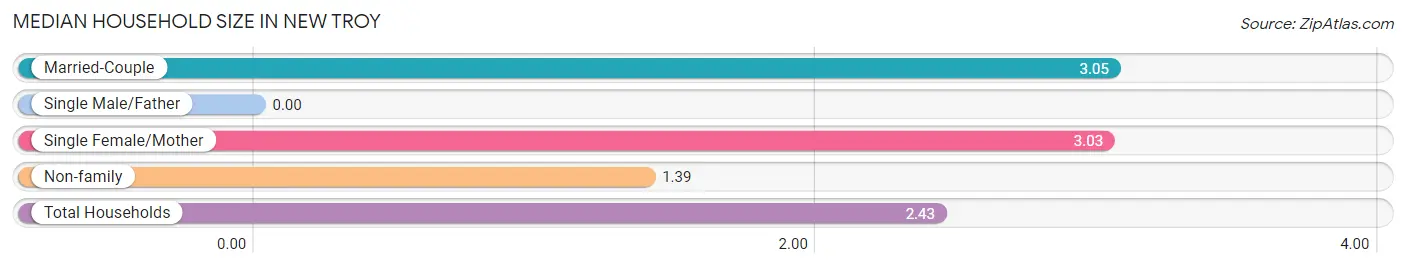
Median Household Size in New Troy
| Household Type | # Households | Household Size |
| Married-Couple | 59 (39.1%) | 3.05 |
| Single Male/Father | 0 (0.0%) | - |
| Single Female/Mother | 36 (23.8%) | 3.03 |
| Non-family | 56 (37.1%) | 1.39 |
| Total Households | 151 (100.0%) | 2.43 |
Household Size by Marriage Status in New Troy
Out of a total of 151 households in New Troy, 95 (62.9%) are family households, while 56 (37.1%) are nonfamily households. The most numerous type of family households are 2-person households, comprising 35, and the most common type of nonfamily households are 1-person households, comprising 36.
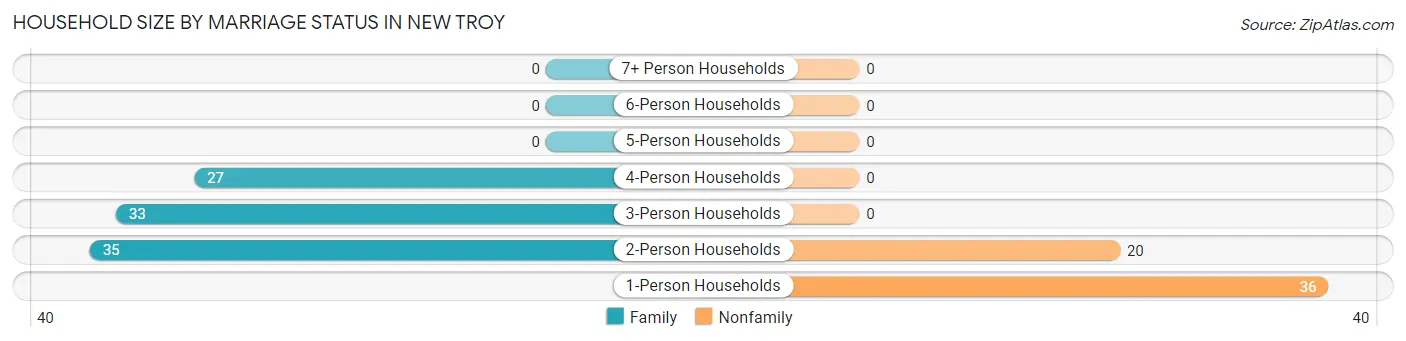
| Household Size | Family Households | Nonfamily Households |
| 1-Person Households | - | 36 (23.8%) |
| 2-Person Households | 35 (23.2%) | 20 (13.3%) |
| 3-Person Households | 33 (21.8%) | 0 (0.0%) |
| 4-Person Households | 27 (17.9%) | 0 (0.0%) |
| 5-Person Households | 0 (0.0%) | 0 (0.0%) |
| 6-Person Households | 0 (0.0%) | 0 (0.0%) |
| 7+ Person Households | 0 (0.0%) | 0 (0.0%) |
| Total | 95 (62.9%) | 56 (37.1%) |
Female Fertility in New Troy
Fertility by Age in New Troy
| Age Bracket | Women with Births | Births / 1,000 Women |
| 15 to 19 years | 0 (0.0%) | 0.0 |
| 20 to 34 years | 0 (0.0%) | 0.0 |
| 35 to 50 years | 0 (0.0%) | 0.0 |
| Total | 0 (0.0%) | 0.0 |
Fertility by Age by Marriage Status in New Troy
| Age Bracket | Married | Unmarried |
| 15 to 19 years | 0 (0.0%) | 0 (0.0%) |
| 20 to 34 years | 0 (0.0%) | 0 (0.0%) |
| 35 to 50 years | 0 (0.0%) | 0 (0.0%) |
| Total | 0 (0.0%) | 0 (0.0%) |
Fertility by Education in New Troy
| Educational Attainment | Women with Births | Births / 1,000 Women |
| Less than High School | 0 (0.0%) | 0.0 |
| High School Diploma | 0 (0.0%) | 0.0 |
| College or Associate's Degree | 0 (0.0%) | 0.0 |
| Bachelor's Degree | 0 (0.0%) | 0.0 |
| Graduate Degree | 0 (0.0%) | 0.0 |
| Total | 0 (0.0%) | 0.0 |
Fertility by Education by Marriage Status in New Troy
| Educational Attainment | Married | Unmarried |
| Less than High School | 0 (0.0%) | 0 (0.0%) |
| High School Diploma | 0 (0.0%) | 0 (0.0%) |
| College or Associate's Degree | 0 (0.0%) | 0 (0.0%) |
| Bachelor's Degree | 0 (0.0%) | 0 (0.0%) |
| Graduate Degree | 0 (0.0%) | 0 (0.0%) |
| Total | 0 (0.0%) | 0 (0.0%) |
Employment Characteristics in New Troy
Employment by Class of Employer in New Troy
Among the 232 employed individuals in New Troy, private company employees (197 | 84.9%), self-employed (incorporated) (18 | 7.8%), and self-employed (not incorporated) (8 | 3.5%) make up the most common classes of employment.
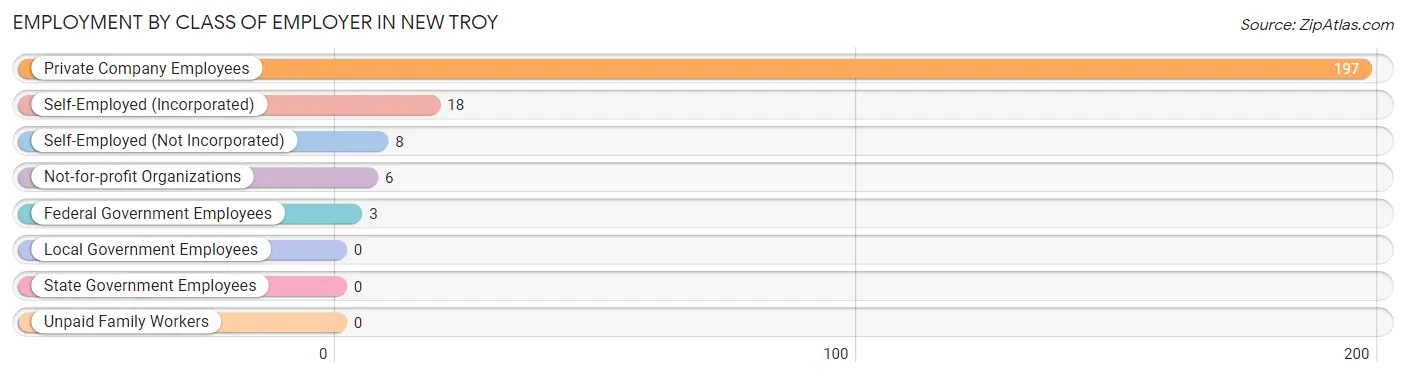
| Employer Class | # Employees | % Employees |
| Private Company Employees | 197 | 84.9% |
| Self-Employed (Incorporated) | 18 | 7.8% |
| Self-Employed (Not Incorporated) | 8 | 3.5% |
| Not-for-profit Organizations | 6 | 2.6% |
| Local Government Employees | 0 | 0.0% |
| State Government Employees | 0 | 0.0% |
| Federal Government Employees | 3 | 1.3% |
| Unpaid Family Workers | 0 | 0.0% |
| Total | 232 | 100.0% |
Employment Status by Age in New Troy
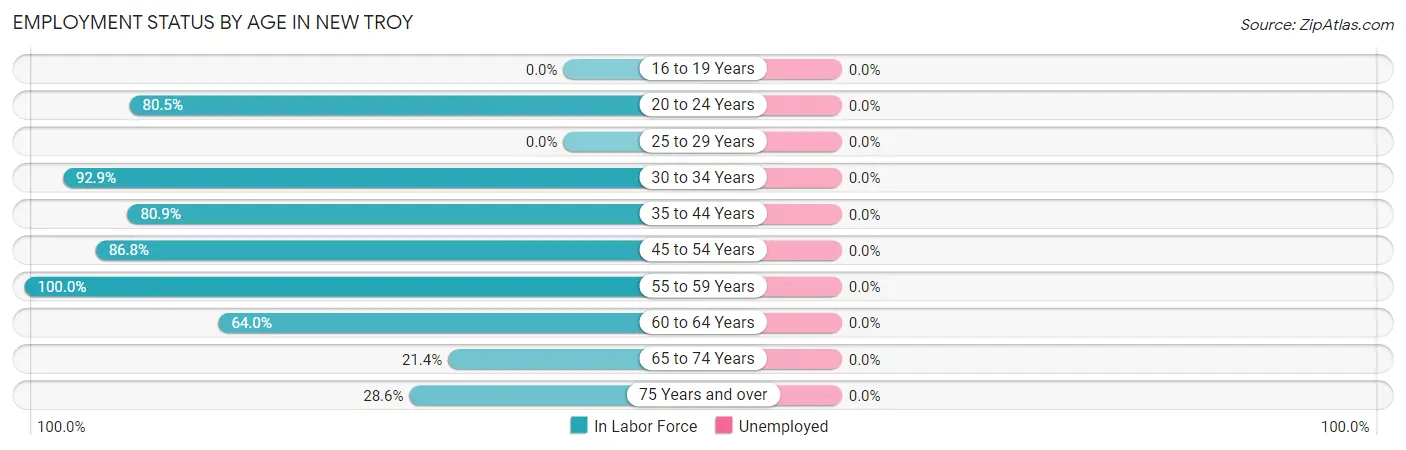
| Age Bracket | In Labor Force | Unemployed |
| 16 to 19 Years | 0 (0.0%) | 0 (0.0%) |
| 20 to 24 Years | 62 (80.5%) | 0 (0.0%) |
| 25 to 29 Years | 0 (0.0%) | 0 (0.0%) |
| 30 to 34 Years | 26 (92.9%) | 0 (0.0%) |
| 35 to 44 Years | 38 (80.9%) | 0 (0.0%) |
| 45 to 54 Years | 46 (86.8%) | 0 (0.0%) |
| 55 to 59 Years | 43 (100.0%) | 0 (0.0%) |
| 60 to 64 Years | 16 (64.0%) | 0 (0.0%) |
| 65 to 74 Years | 3 (21.4%) | 0 (0.0%) |
| 75 Years and over | 4 (28.6%) | 0 (0.0%) |
| Total | 238 (76.3%) | 0 (0.0%) |
Employment Status by Educational Attainment in New Troy
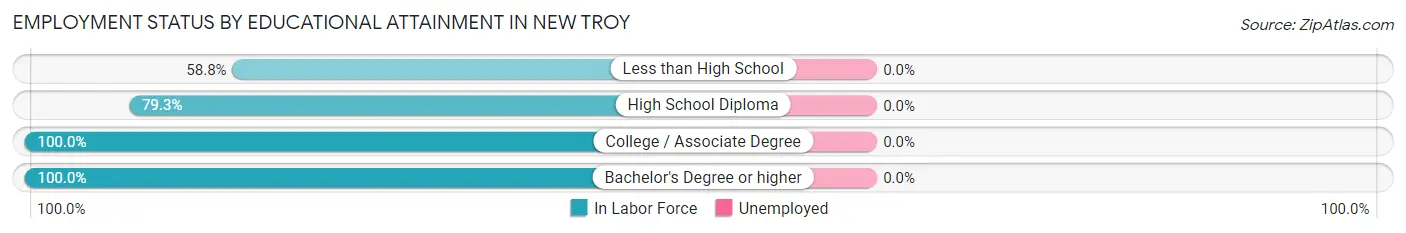
| Educational Attainment | In Labor Force | Unemployed |
| Less than High School | 10 (58.8%) | 0 (0.0%) |
| High School Diploma | 96 (79.3%) | 0 (0.0%) |
| College / Associate Degree | 60 (100.0%) | 0 (0.0%) |
| Bachelor's Degree or higher | 3 (100.0%) | 0 (0.0%) |
| Total | 169 (84.1%) | 0 (0.0%) |
Employment Occupations by Sex in New Troy
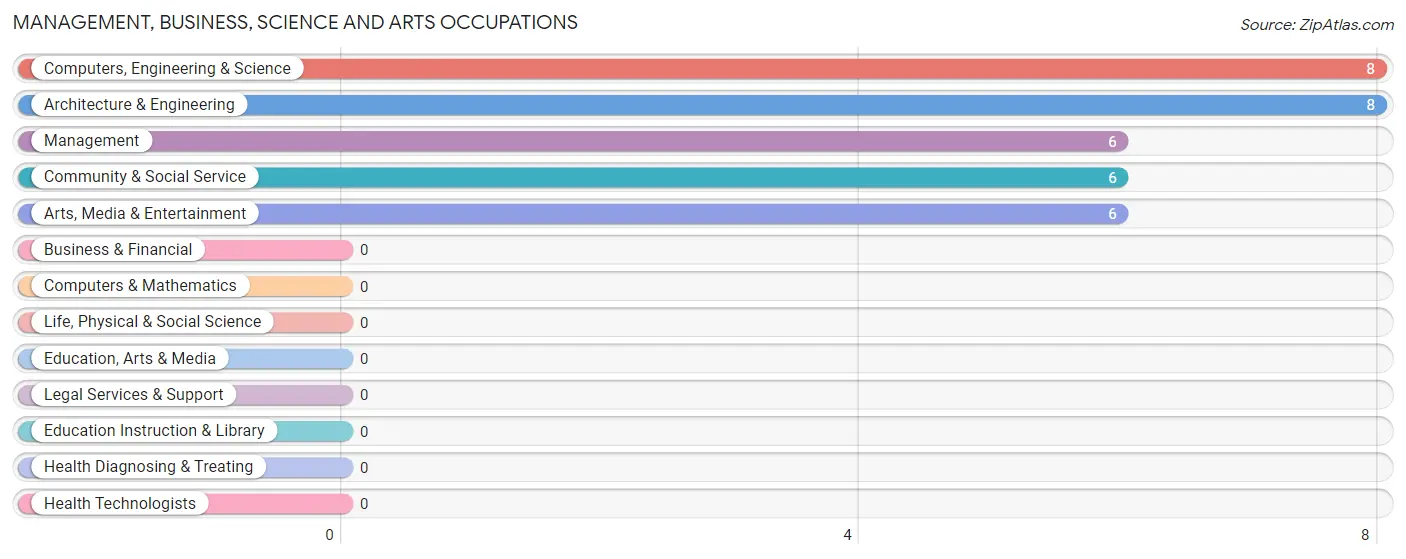
Management, Business, Science and Arts Occupations
The most common Management, Business, Science and Arts occupations in New Troy are Computers, Engineering & Science (8 | 3.4%), Architecture & Engineering (8 | 3.4%), Management (6 | 2.5%), Community & Social Service (6 | 2.5%), and Arts, Media & Entertainment (6 | 2.5%).
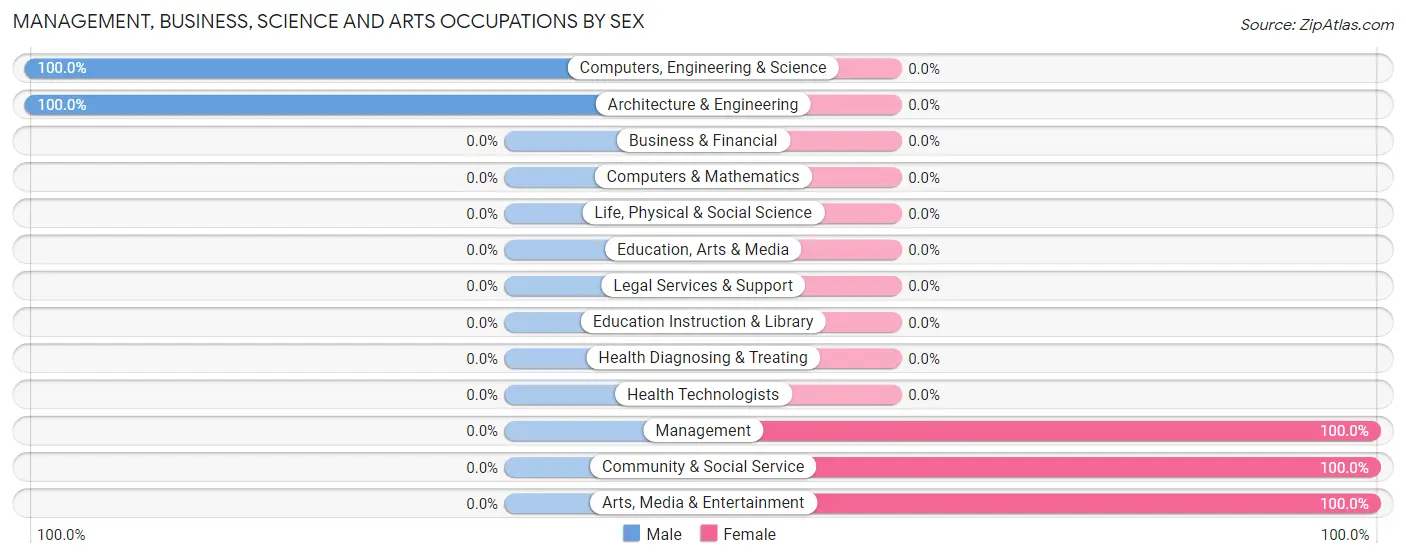
Management, Business, Science and Arts Occupations by Sex
Within the Management, Business, Science and Arts occupations in New Troy, the most male-oriented occupations are Computers, Engineering & Science (100.0%), and Architecture & Engineering (100.0%), while the most female-oriented occupations are Management (100.0%), Community & Social Service (100.0%), and Arts, Media & Entertainment (100.0%).
| Occupation | Male | Female |
| Management | 0 (0.0%) | 6 (100.0%) |
| Business & Financial | 0 (0.0%) | 0 (0.0%) |
| Computers, Engineering & Science | 8 (100.0%) | 0 (0.0%) |
| Computers & Mathematics | 0 (0.0%) | 0 (0.0%) |
| Architecture & Engineering | 8 (100.0%) | 0 (0.0%) |
| Life, Physical & Social Science | 0 (0.0%) | 0 (0.0%) |
| Community & Social Service | 0 (0.0%) | 6 (100.0%) |
| Education, Arts & Media | 0 (0.0%) | 0 (0.0%) |
| Legal Services & Support | 0 (0.0%) | 0 (0.0%) |
| Education Instruction & Library | 0 (0.0%) | 0 (0.0%) |
| Arts, Media & Entertainment | 0 (0.0%) | 6 (100.0%) |
| Health Diagnosing & Treating | 0 (0.0%) | 0 (0.0%) |
| Health Technologists | 0 (0.0%) | 0 (0.0%) |
| Total (Category) | 8 (40.0%) | 12 (60.0%) |
| Total (Overall) | 122 (51.3%) | 116 (48.7%) |
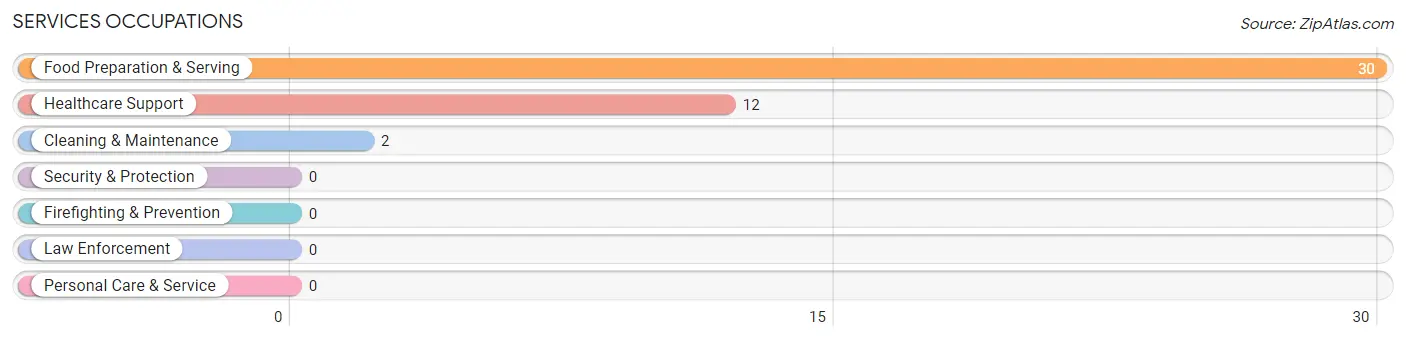
Services Occupations
The most common Services occupations in New Troy are Food Preparation & Serving (30 | 12.6%), Healthcare Support (12 | 5.0%), and Cleaning & Maintenance (2 | 0.8%).
Services Occupations by Sex
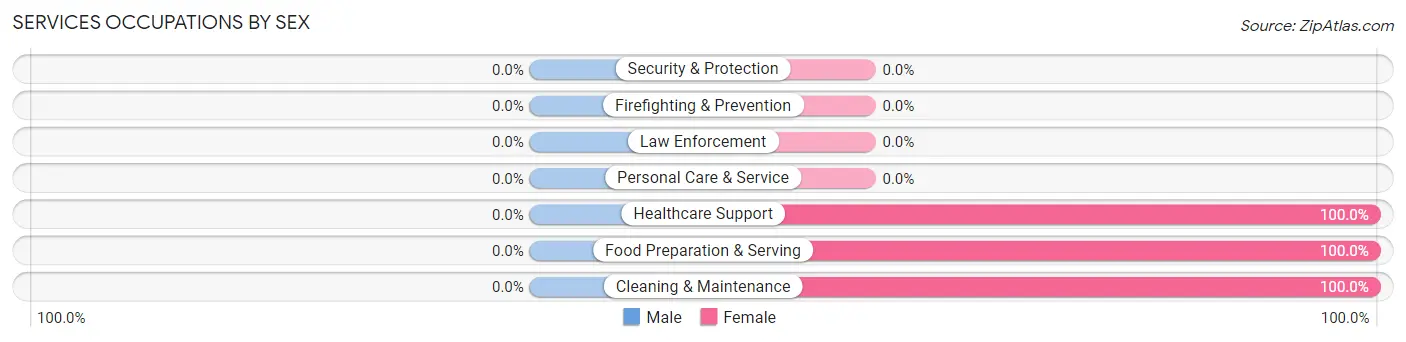
| Occupation | Male | Female |
| Healthcare Support | 0 (0.0%) | 12 (100.0%) |
| Security & Protection | 0 (0.0%) | 0 (0.0%) |
| Firefighting & Prevention | 0 (0.0%) | 0 (0.0%) |
| Law Enforcement | 0 (0.0%) | 0 (0.0%) |
| Food Preparation & Serving | 0 (0.0%) | 30 (100.0%) |
| Cleaning & Maintenance | 0 (0.0%) | 2 (100.0%) |
| Personal Care & Service | 0 (0.0%) | 0 (0.0%) |
| Total (Category) | 0 (0.0%) | 44 (100.0%) |
| Total (Overall) | 122 (51.3%) | 116 (48.7%) |
Sales and Office Occupations
The most common Sales and Office occupations in New Troy are Sales & Related (46 | 19.3%), and Office & Administration (24 | 10.1%).
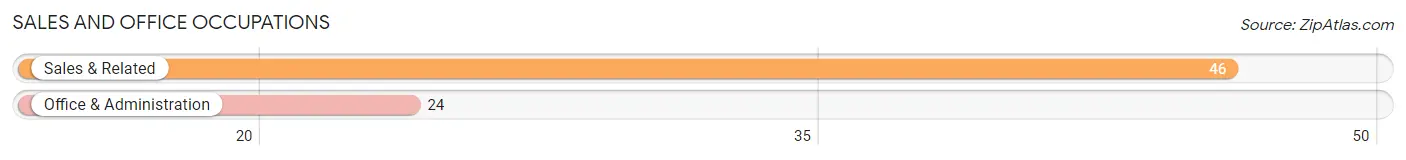
Sales and Office Occupations by Sex

| Occupation | Male | Female |
| Sales & Related | 23 (50.0%) | 23 (50.0%) |
| Office & Administration | 0 (0.0%) | 24 (100.0%) |
| Total (Category) | 23 (32.9%) | 47 (67.1%) |
| Total (Overall) | 122 (51.3%) | 116 (48.7%) |
Natural Resources, Construction and Maintenance Occupations
The most common Natural Resources, Construction and Maintenance occupations in New Troy are Installation, Maintenance & Repair (21 | 8.8%), and Construction & Extraction (9 | 3.8%).

Natural Resources, Construction and Maintenance Occupations by Sex

| Occupation | Male | Female |
| Farming, Fishing & Forestry | 0 (0.0%) | 0 (0.0%) |
| Construction & Extraction | 9 (100.0%) | 0 (0.0%) |
| Installation, Maintenance & Repair | 21 (100.0%) | 0 (0.0%) |
| Total (Category) | 30 (100.0%) | 0 (0.0%) |
| Total (Overall) | 122 (51.3%) | 116 (48.7%) |
Production, Transportation and Moving Occupations
The most common Production, Transportation and Moving occupations in New Troy are Production (64 | 26.9%), and Material Moving (10 | 4.2%).
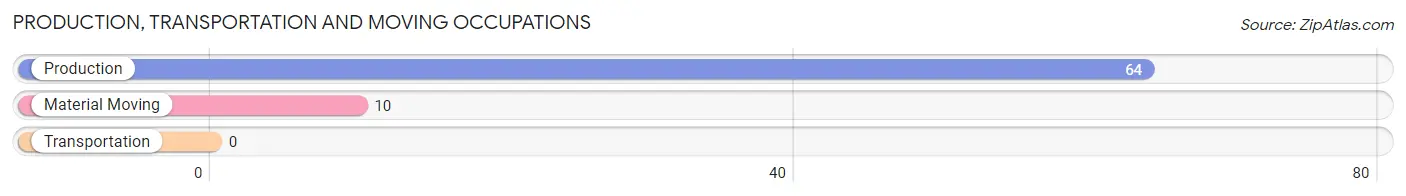
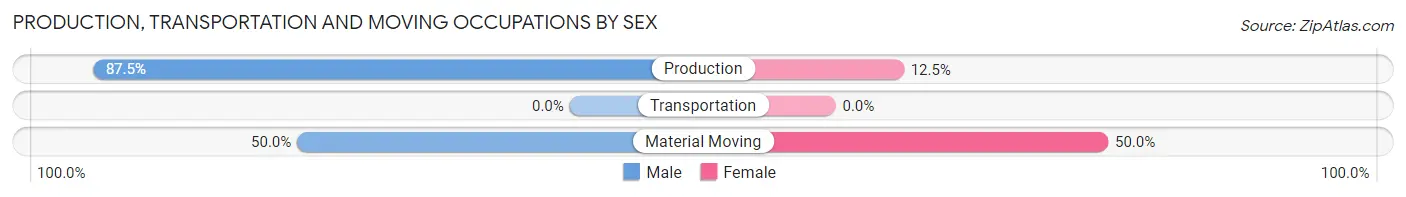
Production, Transportation and Moving Occupations by Sex
| Occupation | Male | Female |
| Production | 56 (87.5%) | 8 (12.5%) |
| Transportation | 0 (0.0%) | 0 (0.0%) |
| Material Moving | 5 (50.0%) | 5 (50.0%) |
| Total (Category) | 61 (82.4%) | 13 (17.6%) |
| Total (Overall) | 122 (51.3%) | 116 (48.7%) |
Employment Industries by Sex in New Troy
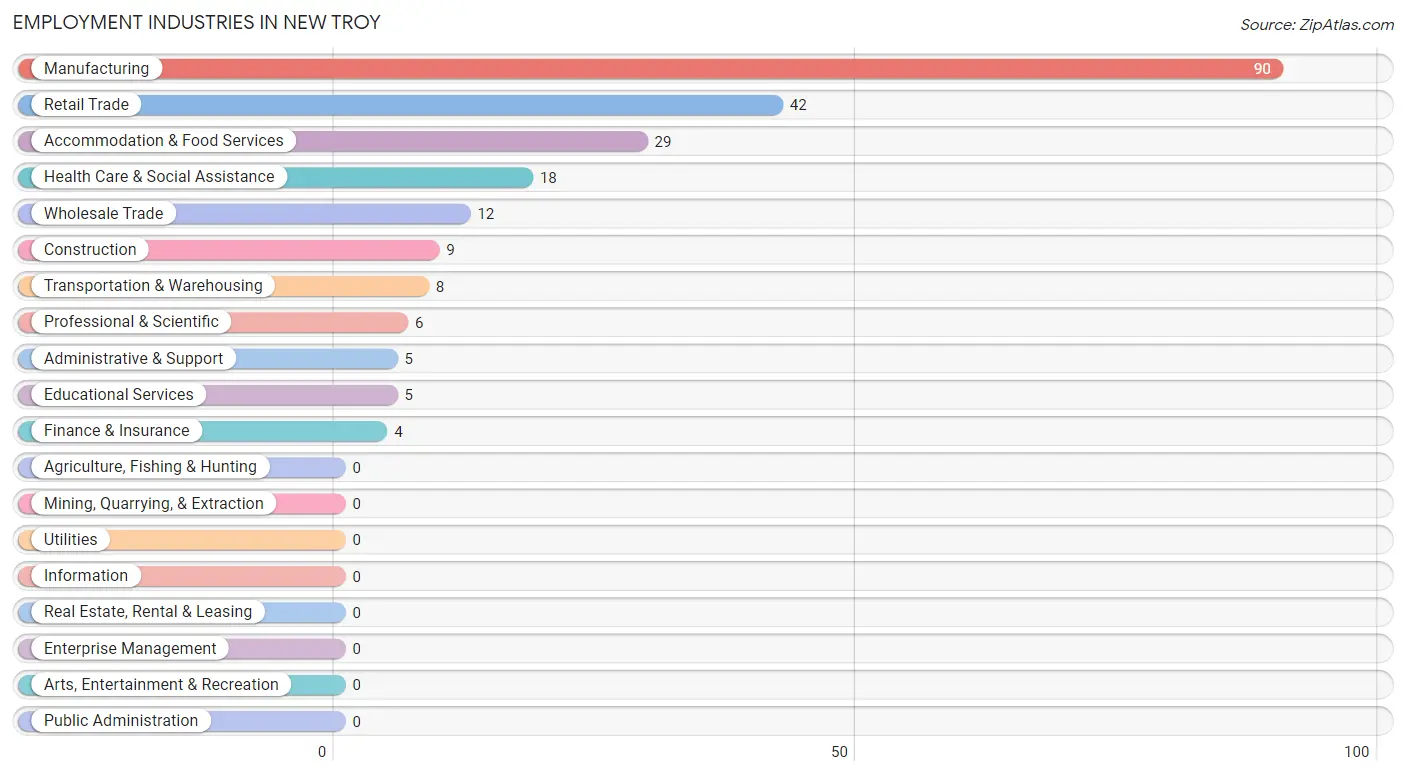
Employment Industries in New Troy
The major employment industries in New Troy include Manufacturing (90 | 37.8%), Retail Trade (42 | 17.6%), Accommodation & Food Services (29 | 12.2%), Health Care & Social Assistance (18 | 7.6%), and Wholesale Trade (12 | 5.0%).
Employment Industries by Sex in New Troy
The New Troy industries that see more men than women are Construction (100.0%), Administrative & Support (100.0%), and Educational Services (100.0%), whereas the industries that tend to have a higher number of women are Transportation & Warehousing (100.0%), Finance & Insurance (100.0%), and Professional & Scientific (100.0%).
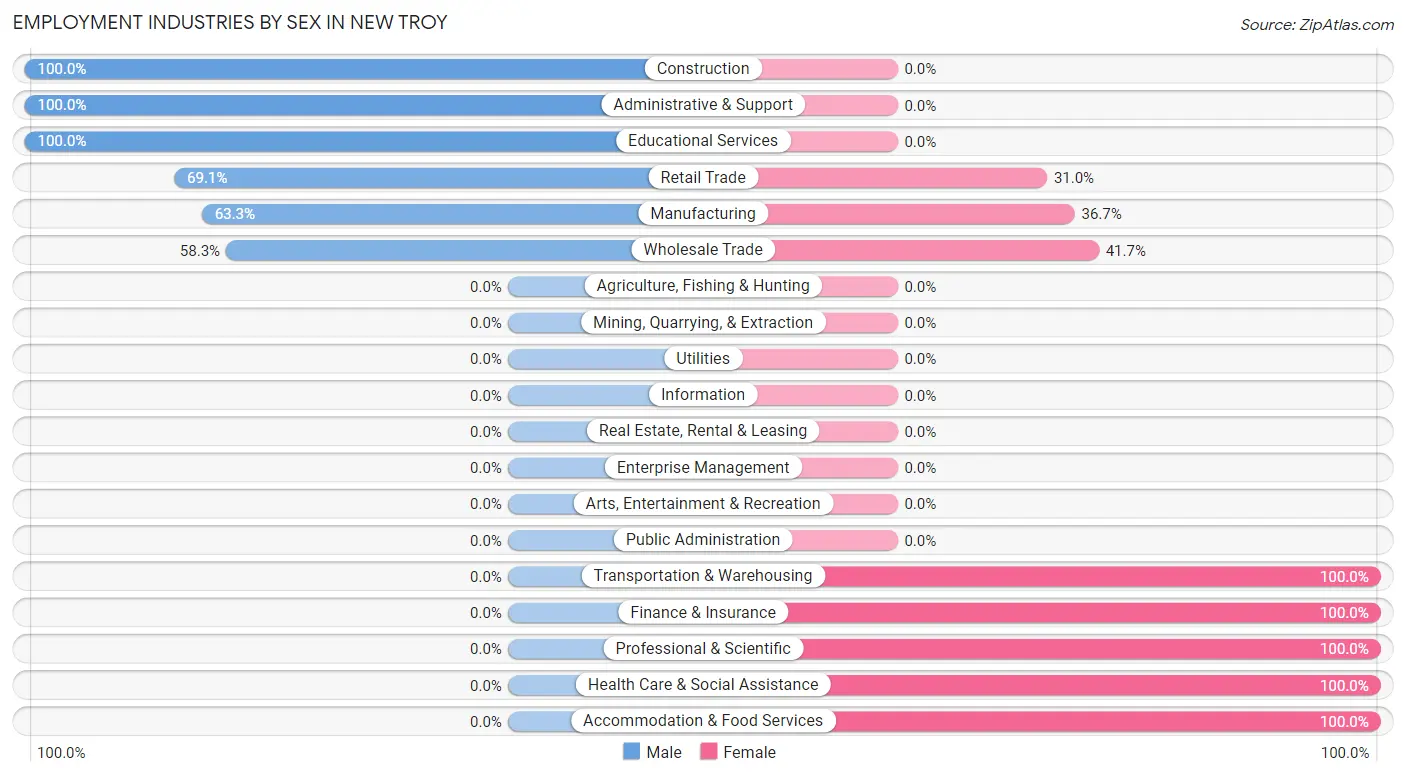
| Industry | Male | Female |
| Agriculture, Fishing & Hunting | 0 (0.0%) | 0 (0.0%) |
| Mining, Quarrying, & Extraction | 0 (0.0%) | 0 (0.0%) |
| Construction | 9 (100.0%) | 0 (0.0%) |
| Manufacturing | 57 (63.3%) | 33 (36.7%) |
| Wholesale Trade | 7 (58.3%) | 5 (41.7%) |
| Retail Trade | 29 (69.1%) | 13 (30.9%) |
| Transportation & Warehousing | 0 (0.0%) | 8 (100.0%) |
| Utilities | 0 (0.0%) | 0 (0.0%) |
| Information | 0 (0.0%) | 0 (0.0%) |
| Finance & Insurance | 0 (0.0%) | 4 (100.0%) |
| Real Estate, Rental & Leasing | 0 (0.0%) | 0 (0.0%) |
| Professional & Scientific | 0 (0.0%) | 6 (100.0%) |
| Enterprise Management | 0 (0.0%) | 0 (0.0%) |
| Administrative & Support | 5 (100.0%) | 0 (0.0%) |
| Educational Services | 5 (100.0%) | 0 (0.0%) |
| Health Care & Social Assistance | 0 (0.0%) | 18 (100.0%) |
| Arts, Entertainment & Recreation | 0 (0.0%) | 0 (0.0%) |
| Accommodation & Food Services | 0 (0.0%) | 29 (100.0%) |
| Public Administration | 0 (0.0%) | 0 (0.0%) |
| Total | 122 (51.3%) | 116 (48.7%) |
Education in New Troy
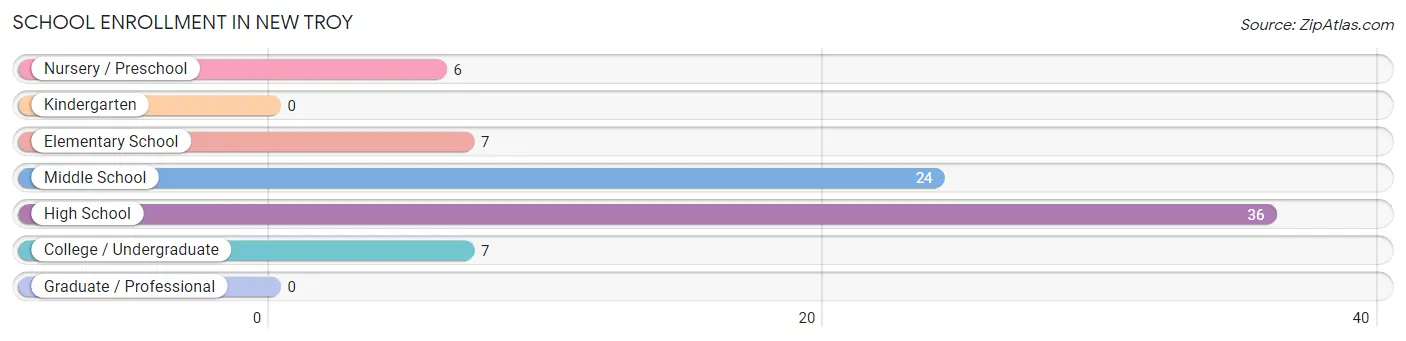
School Enrollment in New Troy
The most common levels of schooling among the 80 students in New Troy are high school (36 | 45.0%), middle school (24 | 30.0%), and elementary school (7 | 8.7%).
| School Level | # Students | % Students |
| Nursery / Preschool | 6 | 7.5% |
| Kindergarten | 0 | 0.0% |
| Elementary School | 7 | 8.7% |
| Middle School | 24 | 30.0% |
| High School | 36 | 45.0% |
| College / Undergraduate | 7 | 8.7% |
| Graduate / Professional | 0 | 0.0% |
| Total | 80 | 100.0% |
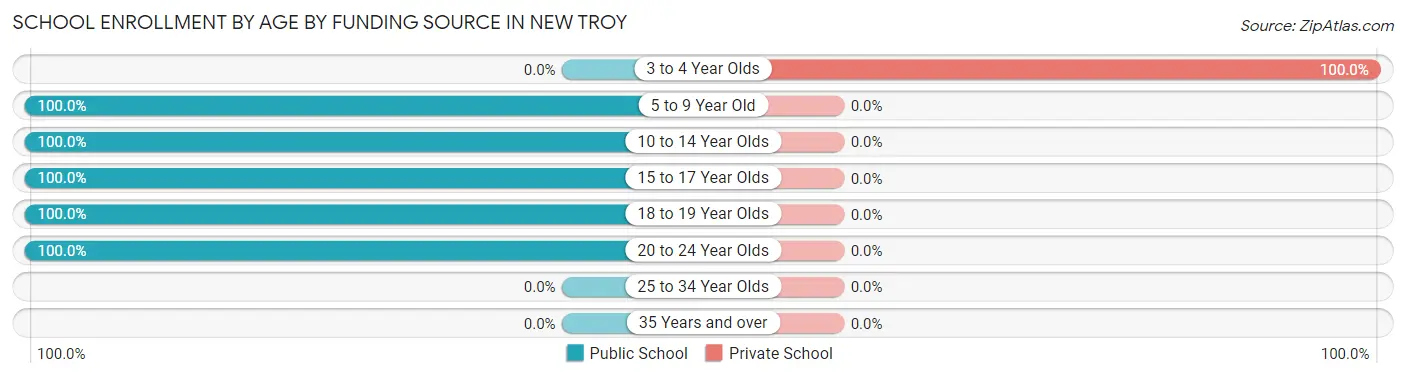
School Enrollment by Age by Funding Source in New Troy
Out of a total of 80 students who are enrolled in schools in New Troy, 6 (7.5%) attend a private institution, while the remaining 74 (92.5%) are enrolled in public schools. The age group of 3 to 4 year olds has the highest likelihood of being enrolled in private schools, with 6 (100.0% in the age bracket) enrolled. Conversely, the age group of 5 to 9 year old has the lowest likelihood of being enrolled in a private school, with 7 (100.0% in the age bracket) attending a public institution.
| Age Bracket | Public School | Private School |
| 3 to 4 Year Olds | 0 (0.0%) | 6 (100.0%) |
| 5 to 9 Year Old | 7 (100.0%) | 0 (0.0%) |
| 10 to 14 Year Olds | 36 (100.0%) | 0 (0.0%) |
| 15 to 17 Year Olds | 6 (100.0%) | 0 (0.0%) |
| 18 to 19 Year Olds | 6 (100.0%) | 0 (0.0%) |
| 20 to 24 Year Olds | 19 (100.0%) | 0 (0.0%) |
| 25 to 34 Year Olds | 0 (0.0%) | 0 (0.0%) |
| 35 Years and over | 0 (0.0%) | 0 (0.0%) |
| Total | 74 (92.5%) | 6 (7.5%) |
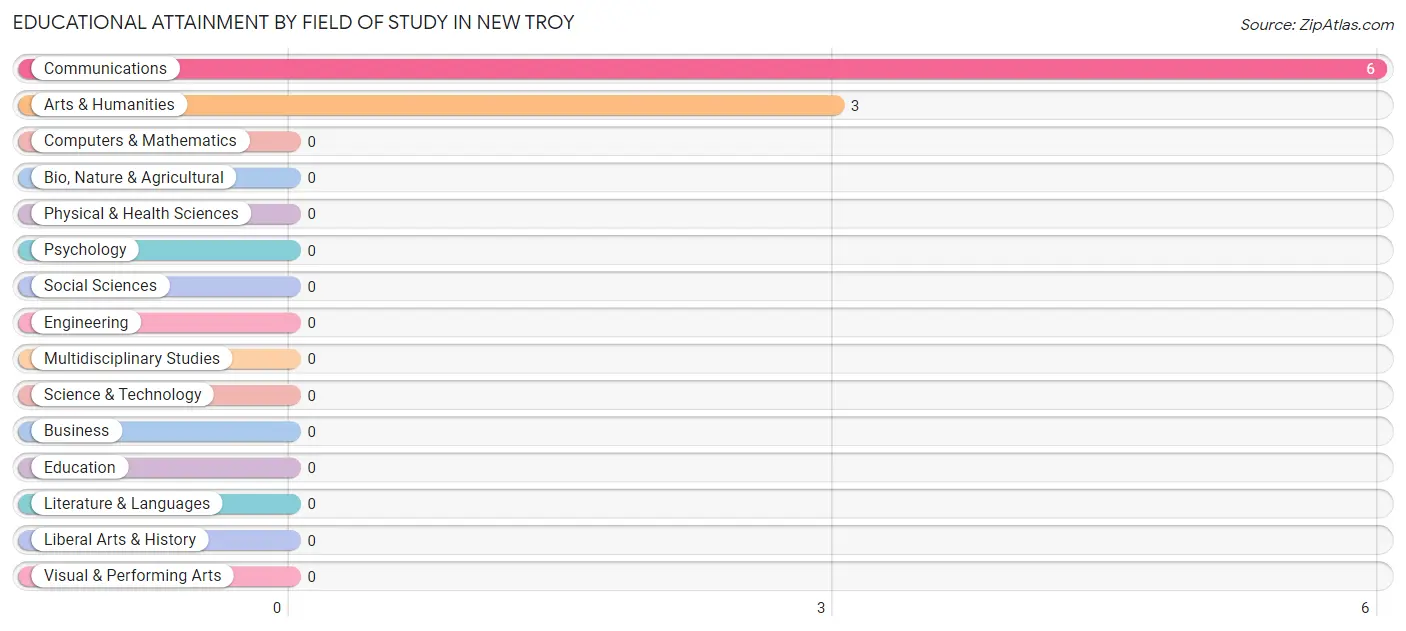
Educational Attainment by Field of Study in New Troy
Communications (6 | 66.7%), and arts & humanities (3 | 33.3%) are the most common fields of study among 9 individuals in New Troy who have obtained a bachelor's degree or higher.
| Field of Study | # Graduates | % Graduates |
| Computers & Mathematics | 0 | 0.0% |
| Bio, Nature & Agricultural | 0 | 0.0% |
| Physical & Health Sciences | 0 | 0.0% |
| Psychology | 0 | 0.0% |
| Social Sciences | 0 | 0.0% |
| Engineering | 0 | 0.0% |
| Multidisciplinary Studies | 0 | 0.0% |
| Science & Technology | 0 | 0.0% |
| Business | 0 | 0.0% |
| Education | 0 | 0.0% |
| Literature & Languages | 0 | 0.0% |
| Liberal Arts & History | 0 | 0.0% |
| Visual & Performing Arts | 0 | 0.0% |
| Communications | 6 | 66.7% |
| Arts & Humanities | 3 | 33.3% |
| Total | 9 | 100.0% |
Transportation & Commute in New Troy
Vehicle Availability by Sex in New Troy
The most prevalent vehicle ownership categories in New Troy are males with 3 vehicles (65, accounting for 56.0%) and females with 3 vehicles (43, making up 56.0%).
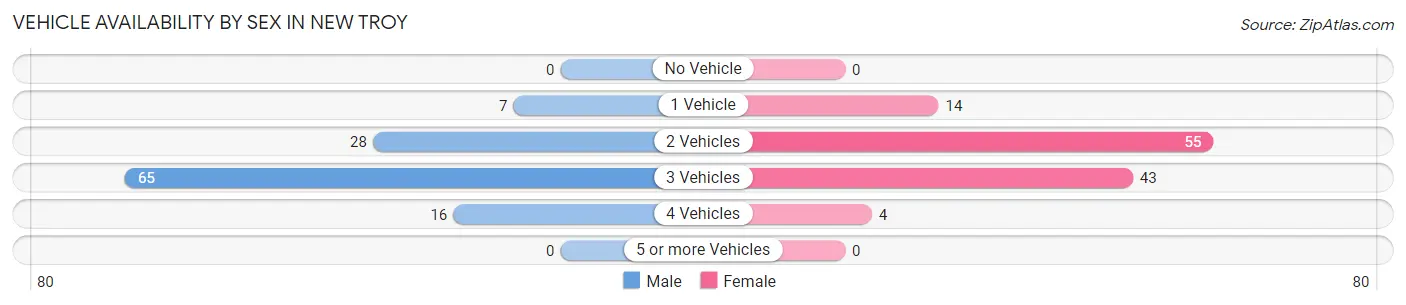
| Vehicles Available | Male | Female |
| No Vehicle | 0 (0.0%) | 0 (0.0%) |
| 1 Vehicle | 7 (6.0%) | 14 (12.1%) |
| 2 Vehicles | 28 (24.1%) | 55 (47.4%) |
| 3 Vehicles | 65 (56.0%) | 43 (37.1%) |
| 4 Vehicles | 16 (13.8%) | 4 (3.5%) |
| 5 or more Vehicles | 0 (0.0%) | 0 (0.0%) |
| Total | 116 (100.0%) | 116 (100.0%) |
Commute Time in New Troy
The most frequently occuring commute durations in New Troy are 20 to 24 minutes (48 commuters, 21.1%), 5 to 9 minutes (45 commuters, 19.8%), and 10 to 14 minutes (44 commuters, 19.4%).
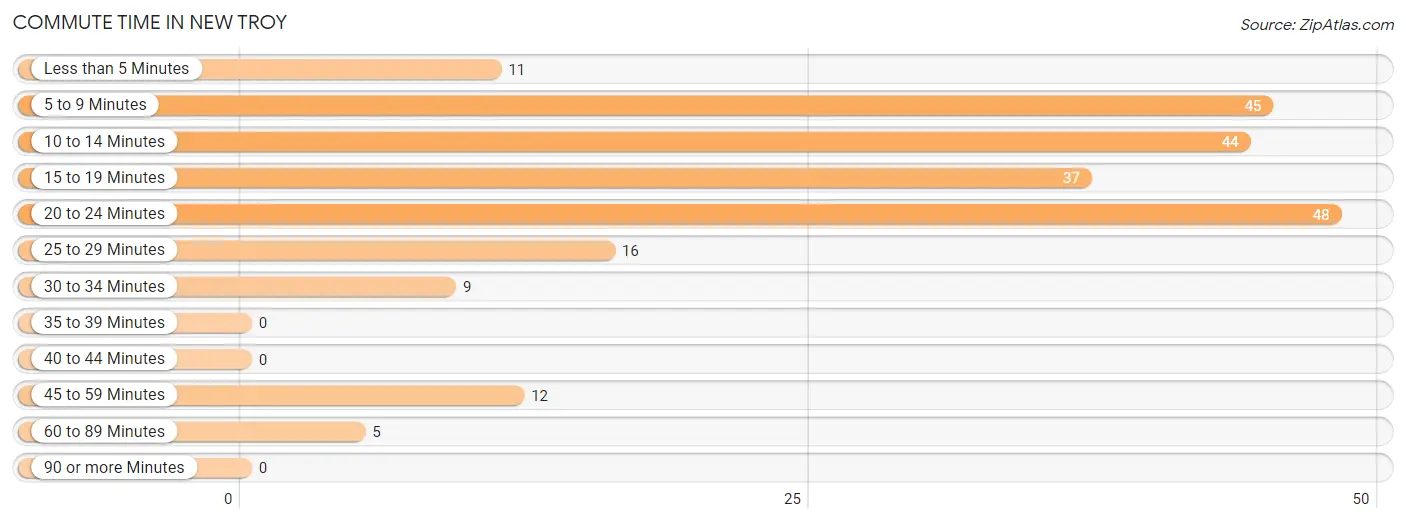
| Commute Time | # Commuters | % Commuters |
| Less than 5 Minutes | 11 | 4.9% |
| 5 to 9 Minutes | 45 | 19.8% |
| 10 to 14 Minutes | 44 | 19.4% |
| 15 to 19 Minutes | 37 | 16.3% |
| 20 to 24 Minutes | 48 | 21.1% |
| 25 to 29 Minutes | 16 | 7.0% |
| 30 to 34 Minutes | 9 | 4.0% |
| 35 to 39 Minutes | 0 | 0.0% |
| 40 to 44 Minutes | 0 | 0.0% |
| 45 to 59 Minutes | 12 | 5.3% |
| 60 to 89 Minutes | 5 | 2.2% |
| 90 or more Minutes | 0 | 0.0% |
Commute Time by Sex in New Troy
The most common commute times in New Troy are 20 to 24 minutes (41 commuters, 35.3%) for males and 10 to 14 minutes (36 commuters, 32.4%) for females.
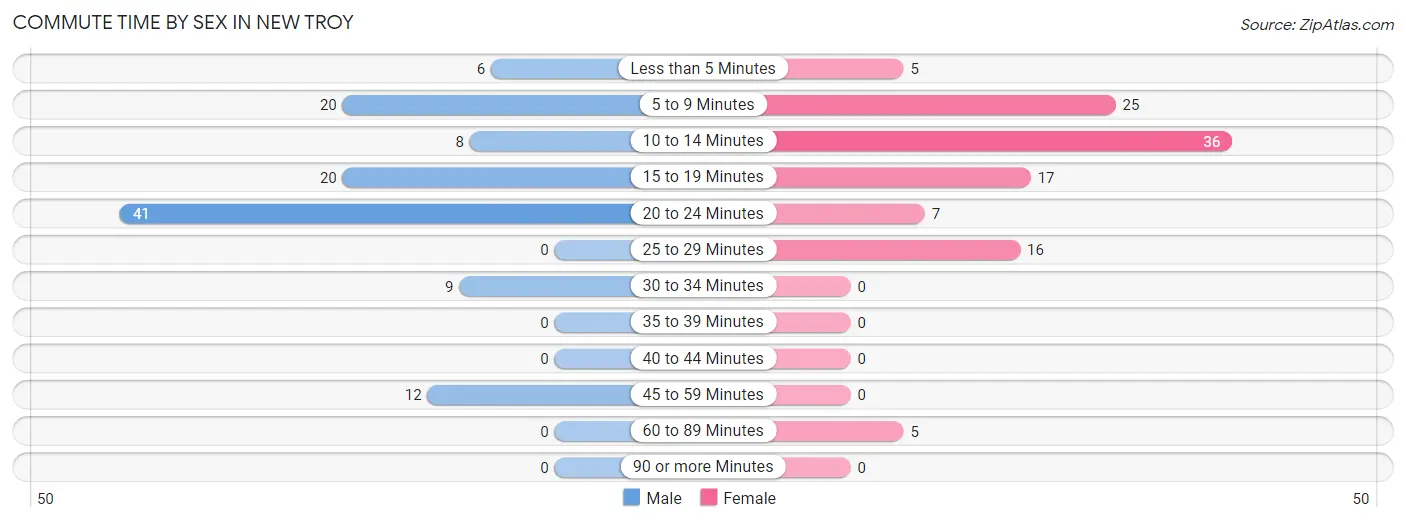
| Commute Time | Male | Female |
| Less than 5 Minutes | 6 (5.2%) | 5 (4.5%) |
| 5 to 9 Minutes | 20 (17.2%) | 25 (22.5%) |
| 10 to 14 Minutes | 8 (6.9%) | 36 (32.4%) |
| 15 to 19 Minutes | 20 (17.2%) | 17 (15.3%) |
| 20 to 24 Minutes | 41 (35.3%) | 7 (6.3%) |
| 25 to 29 Minutes | 0 (0.0%) | 16 (14.4%) |
| 30 to 34 Minutes | 9 (7.8%) | 0 (0.0%) |
| 35 to 39 Minutes | 0 (0.0%) | 0 (0.0%) |
| 40 to 44 Minutes | 0 (0.0%) | 0 (0.0%) |
| 45 to 59 Minutes | 12 (10.3%) | 0 (0.0%) |
| 60 to 89 Minutes | 0 (0.0%) | 5 (4.5%) |
| 90 or more Minutes | 0 (0.0%) | 0 (0.0%) |
Time of Departure to Work by Sex in New Troy
The most frequent times of departure to work in New Troy are 9:00 AM to 9:59 AM (23, 19.8%) for males and 4:00 PM to 11:59 PM (30, 27.0%) for females.
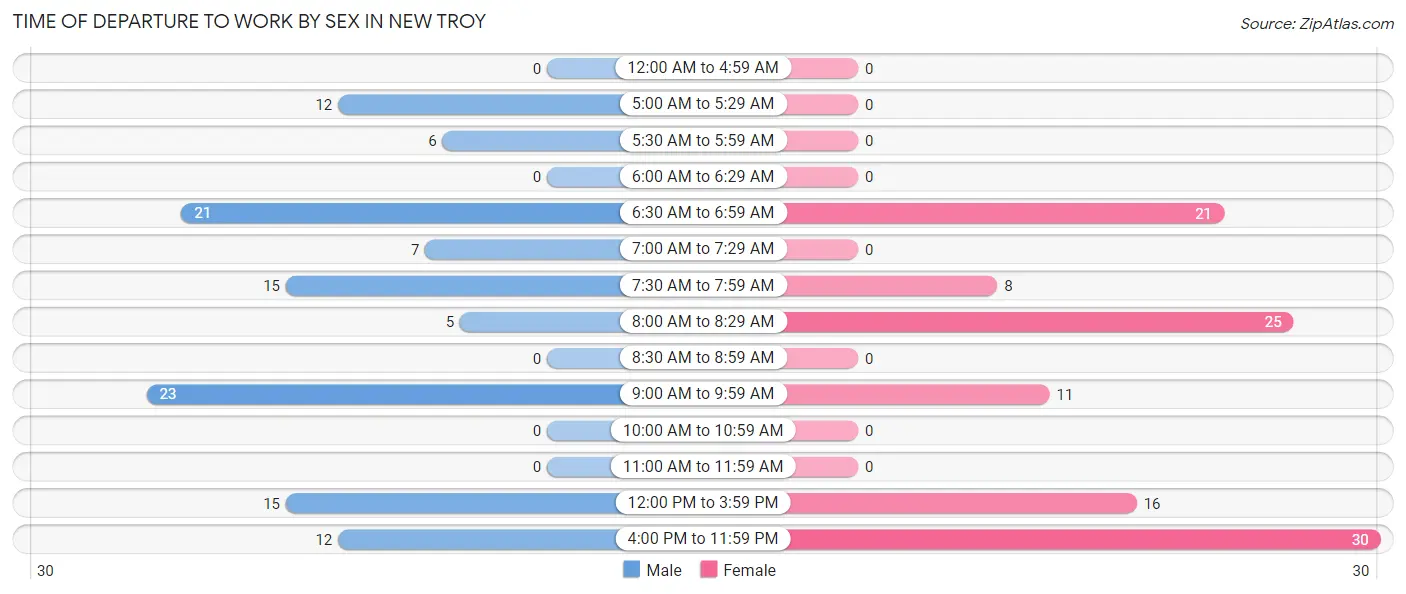
| Time of Departure | Male | Female |
| 12:00 AM to 4:59 AM | 0 (0.0%) | 0 (0.0%) |
| 5:00 AM to 5:29 AM | 12 (10.3%) | 0 (0.0%) |
| 5:30 AM to 5:59 AM | 6 (5.2%) | 0 (0.0%) |
| 6:00 AM to 6:29 AM | 0 (0.0%) | 0 (0.0%) |
| 6:30 AM to 6:59 AM | 21 (18.1%) | 21 (18.9%) |
| 7:00 AM to 7:29 AM | 7 (6.0%) | 0 (0.0%) |
| 7:30 AM to 7:59 AM | 15 (12.9%) | 8 (7.2%) |
| 8:00 AM to 8:29 AM | 5 (4.3%) | 25 (22.5%) |
| 8:30 AM to 8:59 AM | 0 (0.0%) | 0 (0.0%) |
| 9:00 AM to 9:59 AM | 23 (19.8%) | 11 (9.9%) |
| 10:00 AM to 10:59 AM | 0 (0.0%) | 0 (0.0%) |
| 11:00 AM to 11:59 AM | 0 (0.0%) | 0 (0.0%) |
| 12:00 PM to 3:59 PM | 15 (12.9%) | 16 (14.4%) |
| 4:00 PM to 11:59 PM | 12 (10.3%) | 30 (27.0%) |
| Total | 116 (100.0%) | 111 (100.0%) |
Housing Occupancy in New Troy
Occupancy by Ownership in New Troy
Of the total 151 dwellings in New Troy, owner-occupied units account for 116 (76.8%), while renter-occupied units make up 35 (23.2%).
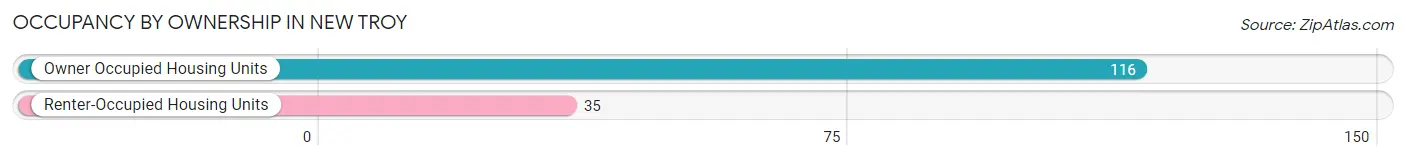
| Occupancy | # Housing Units | % Housing Units |
| Owner Occupied Housing Units | 116 | 76.8% |
| Renter-Occupied Housing Units | 35 | 23.2% |
| Total Occupied Housing Units | 151 | 100.0% |
Occupancy by Household Size in New Troy
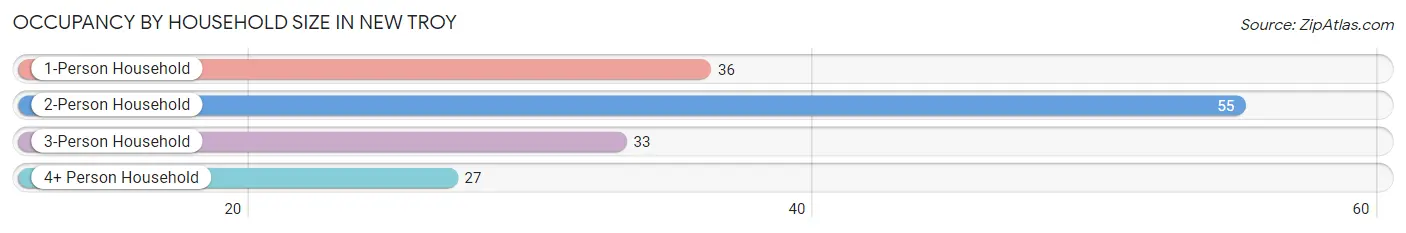
| Household Size | # Housing Units | % Housing Units |
| 1-Person Household | 36 | 23.8% |
| 2-Person Household | 55 | 36.4% |
| 3-Person Household | 33 | 21.8% |
| 4+ Person Household | 27 | 17.9% |
| Total Housing Units | 151 | 100.0% |
Occupancy by Ownership by Household Size in New Troy
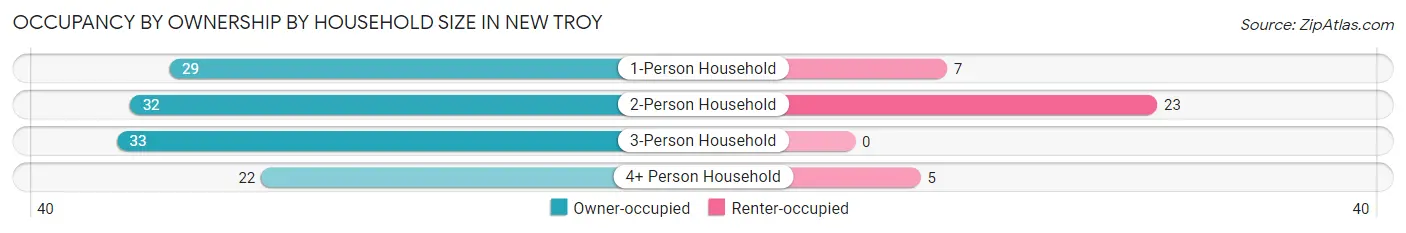
| Household Size | Owner-occupied | Renter-occupied |
| 1-Person Household | 29 (80.6%) | 7 (19.4%) |
| 2-Person Household | 32 (58.2%) | 23 (41.8%) |
| 3-Person Household | 33 (100.0%) | 0 (0.0%) |
| 4+ Person Household | 22 (81.5%) | 5 (18.5%) |
| Total Housing Units | 116 (76.8%) | 35 (23.2%) |
Occupancy by Educational Attainment in New Troy
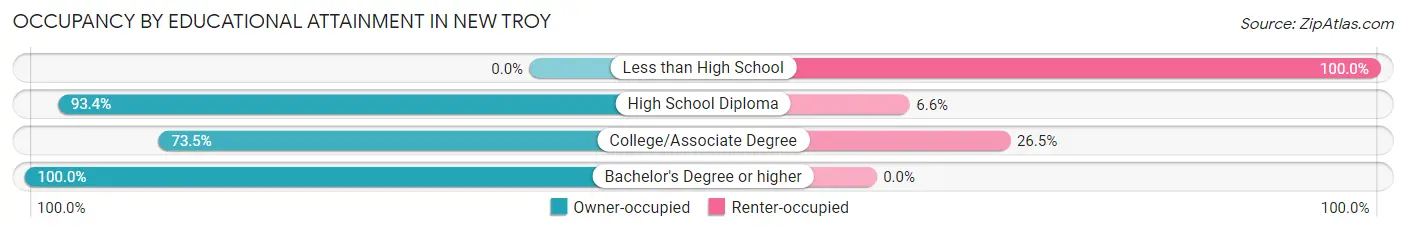
| Household Size | Owner-occupied | Renter-occupied |
| Less than High School | 0 (0.0%) | 17 (100.0%) |
| High School Diploma | 71 (93.4%) | 5 (6.6%) |
| College/Associate Degree | 36 (73.5%) | 13 (26.5%) |
| Bachelor's Degree or higher | 9 (100.0%) | 0 (0.0%) |
Occupancy by Age of Householder in New Troy
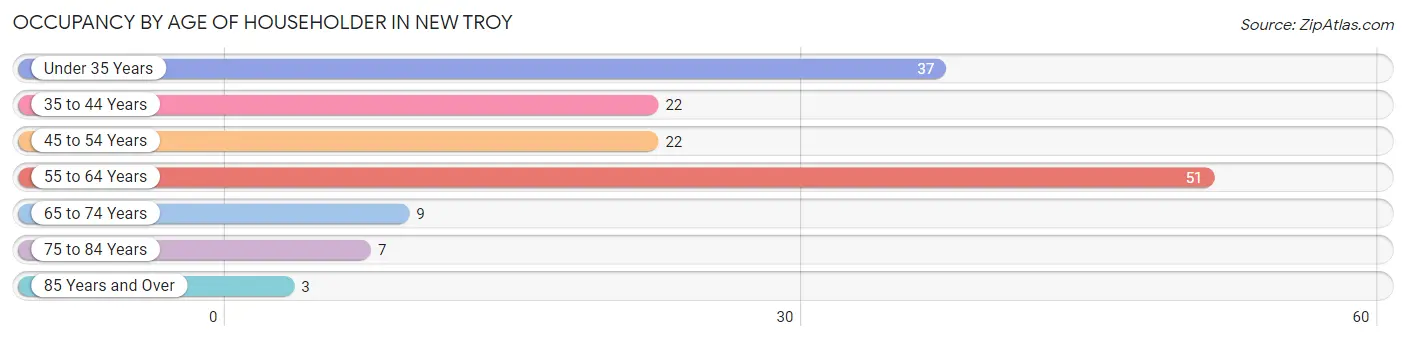
| Age Bracket | # Households | % Households |
| Under 35 Years | 37 | 24.5% |
| 35 to 44 Years | 22 | 14.6% |
| 45 to 54 Years | 22 | 14.6% |
| 55 to 64 Years | 51 | 33.8% |
| 65 to 74 Years | 9 | 6.0% |
| 75 to 84 Years | 7 | 4.6% |
| 85 Years and Over | 3 | 2.0% |
| Total | 151 | 100.0% |
Housing Finances in New Troy
Median Income by Occupancy in New Troy
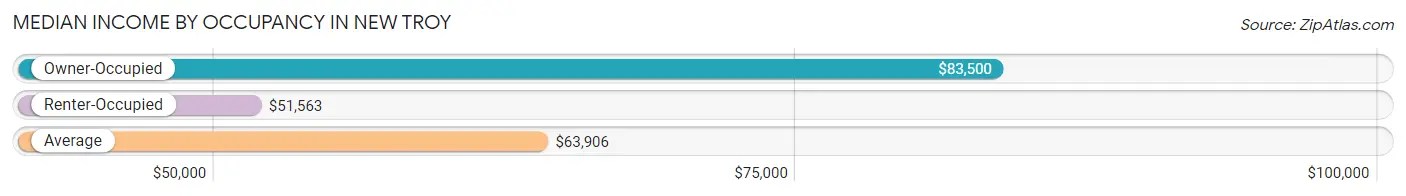
| Occupancy Type | # Households | Median Income |
| Owner-Occupied | 116 (76.8%) | $83,500 |
| Renter-Occupied | 35 (23.2%) | $51,563 |
| Average | 151 (100.0%) | $63,906 |
Occupancy by Householder Income Bracket in New Troy
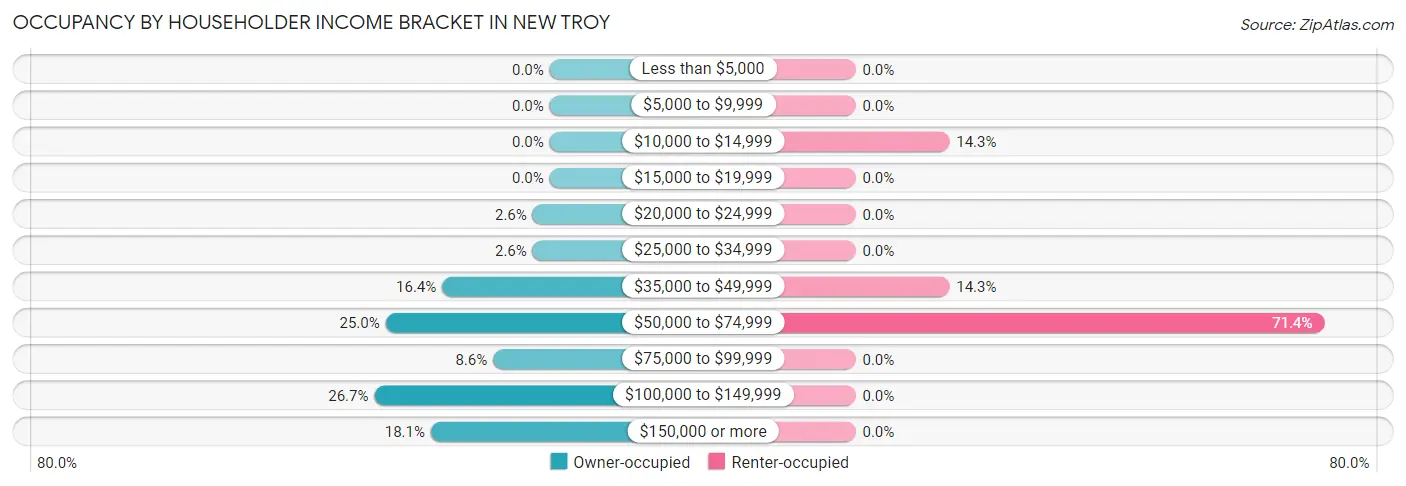
| Income Bracket | Owner-occupied | Renter-occupied |
| Less than $5,000 | 0 (0.0%) | 0 (0.0%) |
| $5,000 to $9,999 | 0 (0.0%) | 0 (0.0%) |
| $10,000 to $14,999 | 0 (0.0%) | 5 (14.3%) |
| $15,000 to $19,999 | 0 (0.0%) | 0 (0.0%) |
| $20,000 to $24,999 | 3 (2.6%) | 0 (0.0%) |
| $25,000 to $34,999 | 3 (2.6%) | 0 (0.0%) |
| $35,000 to $49,999 | 19 (16.4%) | 5 (14.3%) |
| $50,000 to $74,999 | 29 (25.0%) | 25 (71.4%) |
| $75,000 to $99,999 | 10 (8.6%) | 0 (0.0%) |
| $100,000 to $149,999 | 31 (26.7%) | 0 (0.0%) |
| $150,000 or more | 21 (18.1%) | 0 (0.0%) |
| Total | 116 (100.0%) | 35 (100.0%) |
Monthly Housing Cost Tiers in New Troy
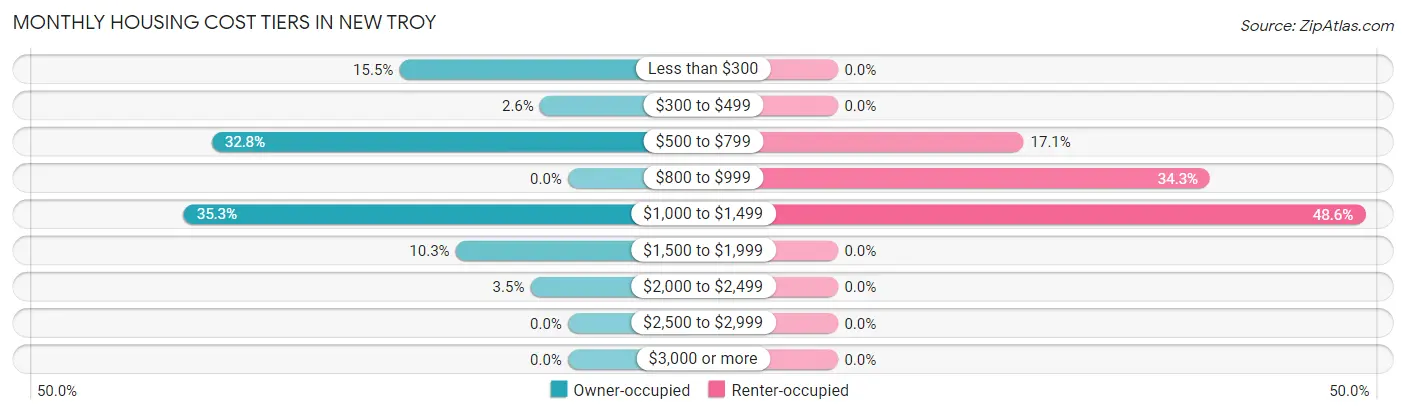
| Monthly Cost | Owner-occupied | Renter-occupied |
| Less than $300 | 18 (15.5%) | 0 (0.0%) |
| $300 to $499 | 3 (2.6%) | 0 (0.0%) |
| $500 to $799 | 38 (32.8%) | 6 (17.1%) |
| $800 to $999 | 0 (0.0%) | 12 (34.3%) |
| $1,000 to $1,499 | 41 (35.3%) | 17 (48.6%) |
| $1,500 to $1,999 | 12 (10.3%) | 0 (0.0%) |
| $2,000 to $2,499 | 4 (3.5%) | 0 (0.0%) |
| $2,500 to $2,999 | 0 (0.0%) | 0 (0.0%) |
| $3,000 or more | 0 (0.0%) | 0 (0.0%) |
| Total | 116 (100.0%) | 35 (100.0%) |
Physical Housing Characteristics in New Troy
Housing Structures in New Troy
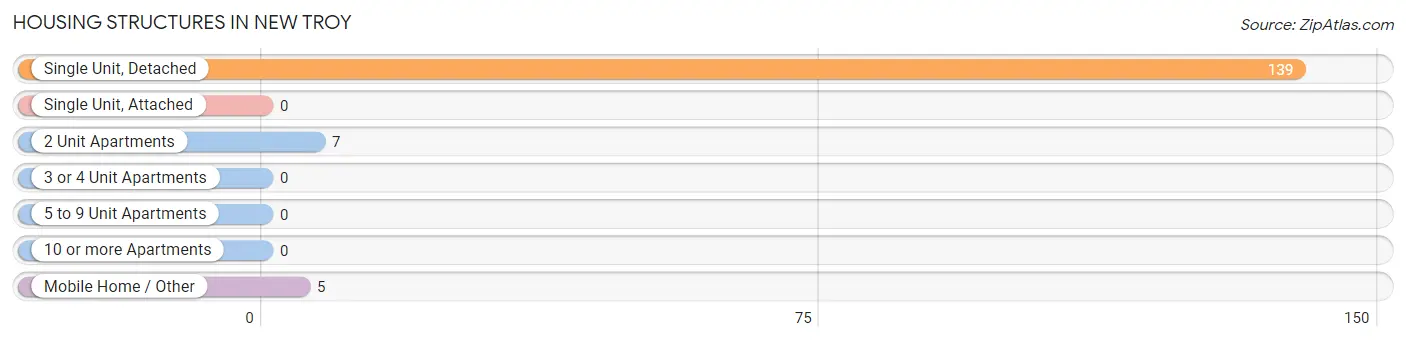
| Structure Type | # Housing Units | % Housing Units |
| Single Unit, Detached | 139 | 92.0% |
| Single Unit, Attached | 0 | 0.0% |
| 2 Unit Apartments | 7 | 4.6% |
| 3 or 4 Unit Apartments | 0 | 0.0% |
| 5 to 9 Unit Apartments | 0 | 0.0% |
| 10 or more Apartments | 0 | 0.0% |
| Mobile Home / Other | 5 | 3.3% |
| Total | 151 | 100.0% |
Housing Structures by Occupancy in New Troy
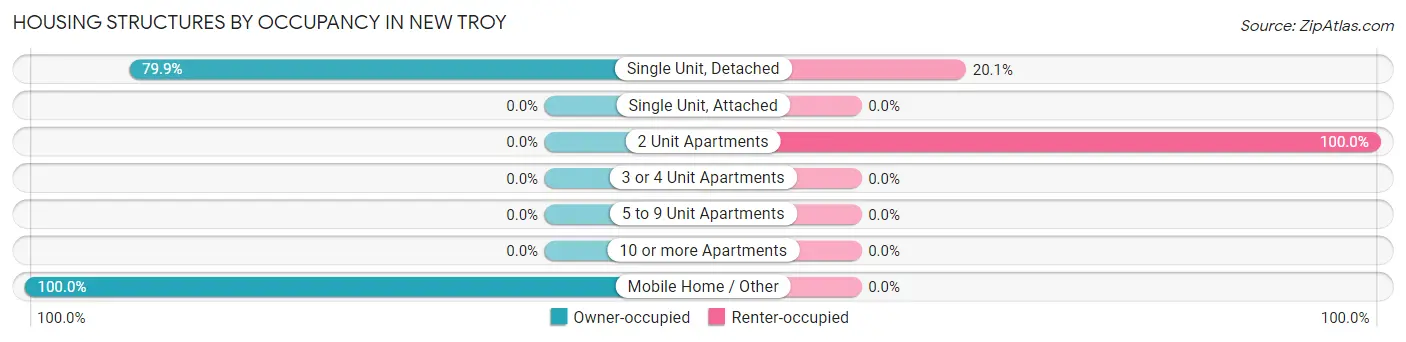
| Structure Type | Owner-occupied | Renter-occupied |
| Single Unit, Detached | 111 (79.9%) | 28 (20.1%) |
| Single Unit, Attached | 0 (0.0%) | 0 (0.0%) |
| 2 Unit Apartments | 0 (0.0%) | 7 (100.0%) |
| 3 or 4 Unit Apartments | 0 (0.0%) | 0 (0.0%) |
| 5 to 9 Unit Apartments | 0 (0.0%) | 0 (0.0%) |
| 10 or more Apartments | 0 (0.0%) | 0 (0.0%) |
| Mobile Home / Other | 5 (100.0%) | 0 (0.0%) |
| Total | 116 (76.8%) | 35 (23.2%) |
Housing Structures by Number of Rooms in New Troy
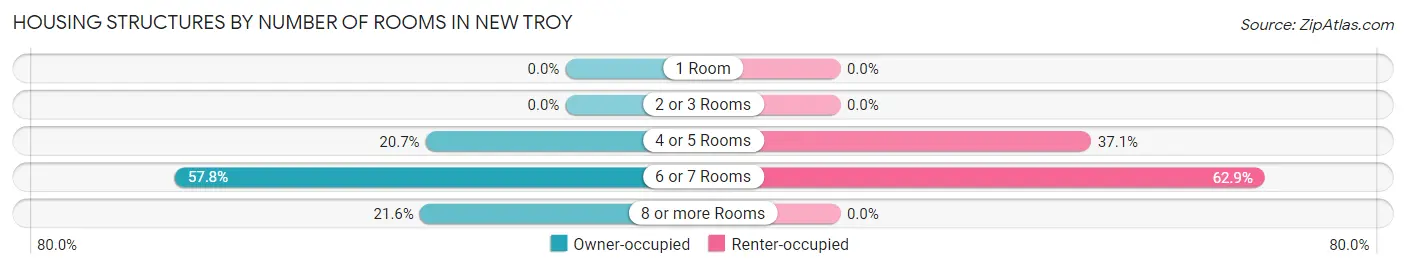
| Number of Rooms | Owner-occupied | Renter-occupied |
| 1 Room | 0 (0.0%) | 0 (0.0%) |
| 2 or 3 Rooms | 0 (0.0%) | 0 (0.0%) |
| 4 or 5 Rooms | 24 (20.7%) | 13 (37.1%) |
| 6 or 7 Rooms | 67 (57.8%) | 22 (62.9%) |
| 8 or more Rooms | 25 (21.5%) | 0 (0.0%) |
| Total | 116 (100.0%) | 35 (100.0%) |
Housing Structure by Heating Type in New Troy
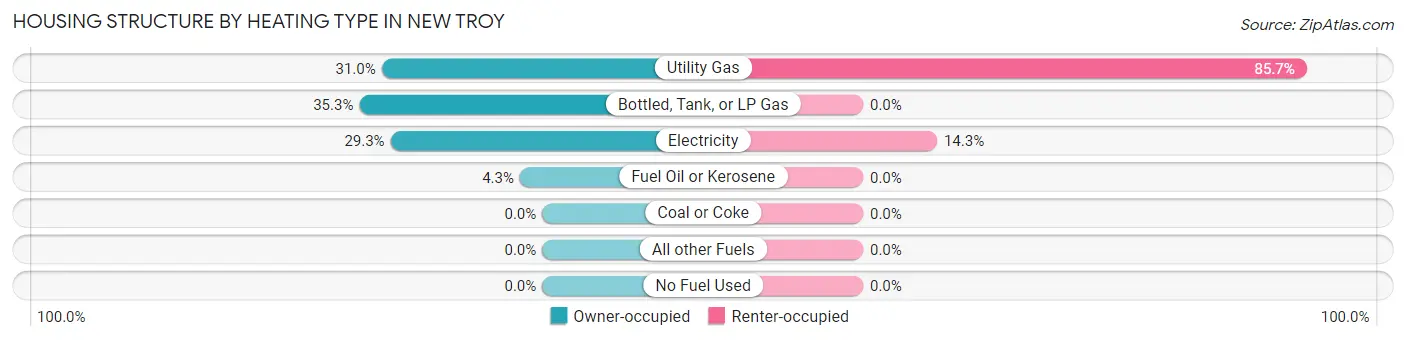
| Heating Type | Owner-occupied | Renter-occupied |
| Utility Gas | 36 (31.0%) | 30 (85.7%) |
| Bottled, Tank, or LP Gas | 41 (35.3%) | 0 (0.0%) |
| Electricity | 34 (29.3%) | 5 (14.3%) |
| Fuel Oil or Kerosene | 5 (4.3%) | 0 (0.0%) |
| Coal or Coke | 0 (0.0%) | 0 (0.0%) |
| All other Fuels | 0 (0.0%) | 0 (0.0%) |
| No Fuel Used | 0 (0.0%) | 0 (0.0%) |
| Total | 116 (100.0%) | 35 (100.0%) |
Household Vehicle Usage in New Troy
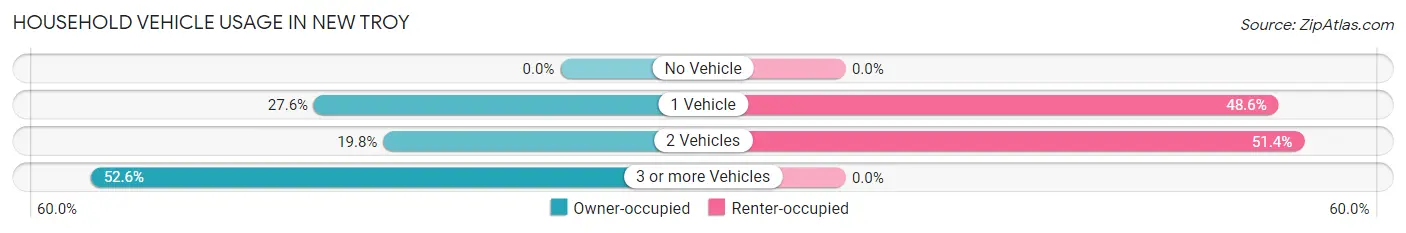
| Vehicles per Household | Owner-occupied | Renter-occupied |
| No Vehicle | 0 (0.0%) | 0 (0.0%) |
| 1 Vehicle | 32 (27.6%) | 17 (48.6%) |
| 2 Vehicles | 23 (19.8%) | 18 (51.4%) |
| 3 or more Vehicles | 61 (52.6%) | 0 (0.0%) |
| Total | 116 (100.0%) | 35 (100.0%) |
Real Estate & Mortgages in New Troy
Real Estate and Mortgage Overview in New Troy
| Characteristic | Without Mortgage | With Mortgage |
| Housing Units | 36 | 80 |
| Median Property Value | $115,000 | $173,300 |
| Median Household Income | $57,000 | $21 |
| Monthly Housing Costs | - | - |
| Real Estate Taxes | $1,000 | $7 |
Property Value by Mortgage Status in New Troy
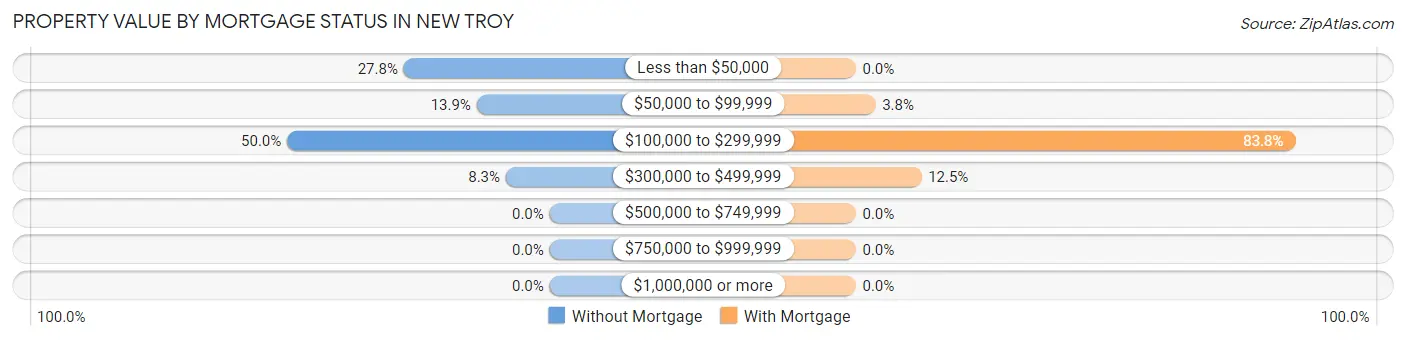
| Property Value | Without Mortgage | With Mortgage |
| Less than $50,000 | 10 (27.8%) | 0 (0.0%) |
| $50,000 to $99,999 | 5 (13.9%) | 3 (3.7%) |
| $100,000 to $299,999 | 18 (50.0%) | 67 (83.8%) |
| $300,000 to $499,999 | 3 (8.3%) | 10 (12.5%) |
| $500,000 to $749,999 | 0 (0.0%) | 0 (0.0%) |
| $750,000 to $999,999 | 0 (0.0%) | 0 (0.0%) |
| $1,000,000 or more | 0 (0.0%) | 0 (0.0%) |
| Total | 36 (100.0%) | 80 (100.0%) |
Household Income by Mortgage Status in New Troy
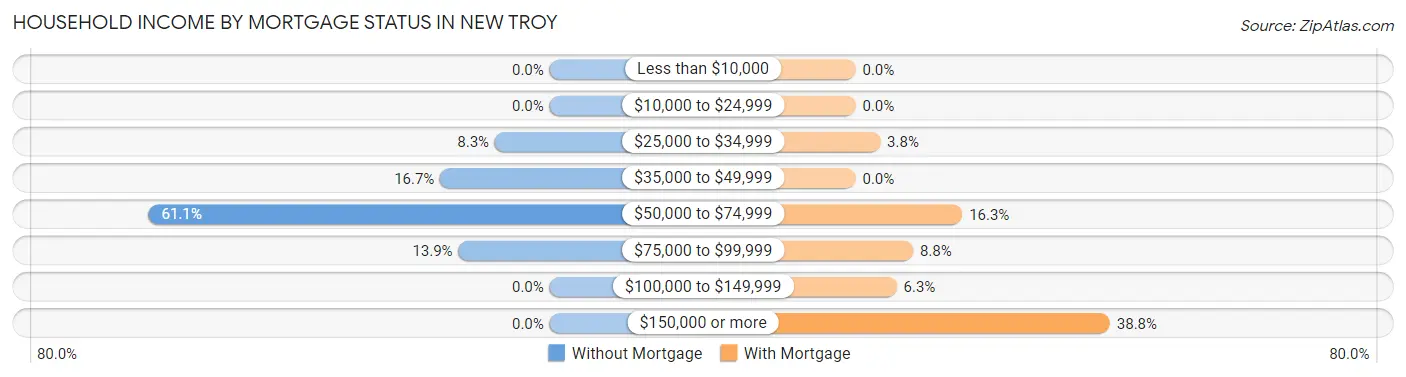
| Household Income | Without Mortgage | With Mortgage |
| Less than $10,000 | 0 (0.0%) | 0 (0.0%) |
| $10,000 to $24,999 | 0 (0.0%) | 0 (0.0%) |
| $25,000 to $34,999 | 3 (8.3%) | 3 (3.7%) |
| $35,000 to $49,999 | 6 (16.7%) | 0 (0.0%) |
| $50,000 to $74,999 | 22 (61.1%) | 13 (16.3%) |
| $75,000 to $99,999 | 5 (13.9%) | 7 (8.7%) |
| $100,000 to $149,999 | 0 (0.0%) | 5 (6.2%) |
| $150,000 or more | 0 (0.0%) | 31 (38.8%) |
| Total | 36 (100.0%) | 80 (100.0%) |
Property Value to Household Income Ratio in New Troy
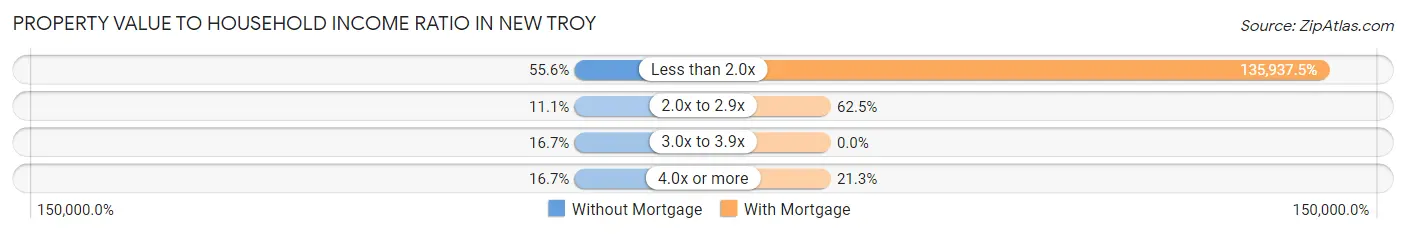
| Value-to-Income Ratio | Without Mortgage | With Mortgage |
| Less than 2.0x | 20 (55.6%) | 108,750 (135,937.5%) |
| 2.0x to 2.9x | 4 (11.1%) | 50 (62.5%) |
| 3.0x to 3.9x | 6 (16.7%) | 0 (0.0%) |
| 4.0x or more | 6 (16.7%) | 17 (21.2%) |
| Total | 36 (100.0%) | 80 (100.0%) |
Real Estate Taxes by Mortgage Status in New Troy
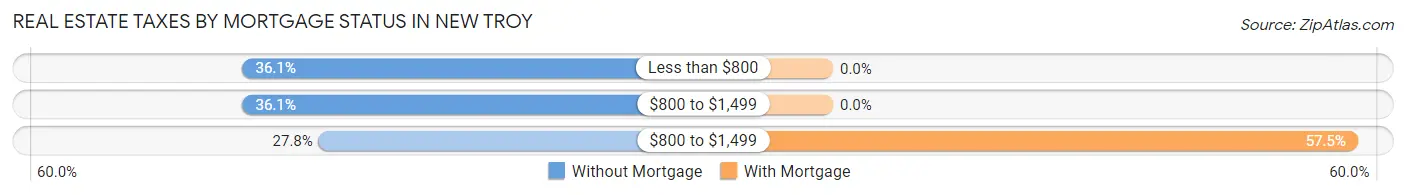
| Property Taxes | Without Mortgage | With Mortgage |
| Less than $800 | 13 (36.1%) | 0 (0.0%) |
| $800 to $1,499 | 13 (36.1%) | 0 (0.0%) |
| $800 to $1,499 | 10 (27.8%) | 46 (57.5%) |
| Total | 36 (100.0%) | 80 (100.0%) |
Health & Disability in New Troy
Health Insurance Coverage by Age in New Troy
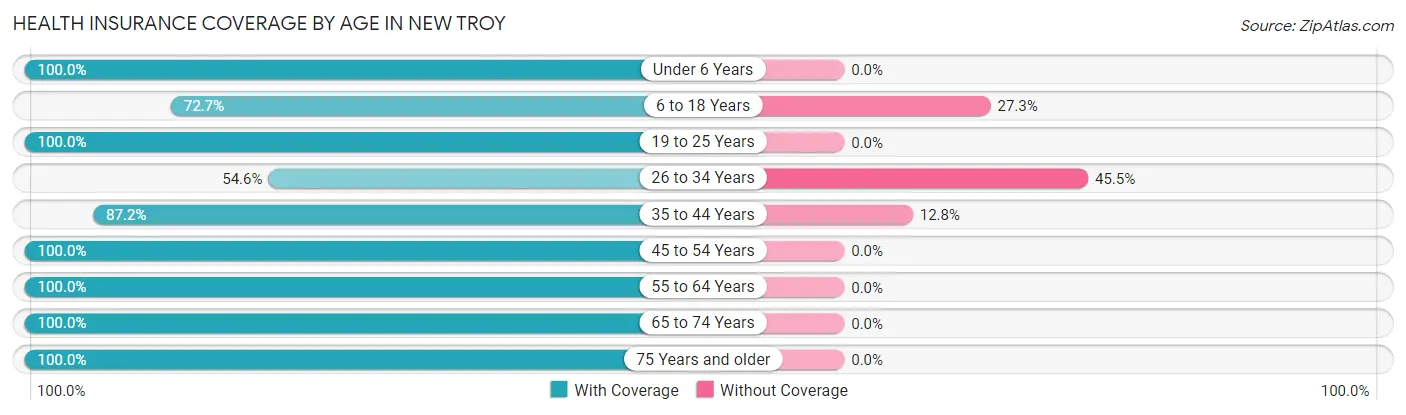
| Age Bracket | With Coverage | Without Coverage |
| Under 6 Years | 6 (100.0%) | 0 (0.0%) |
| 6 to 18 Years | 40 (72.7%) | 15 (27.3%) |
| 19 to 25 Years | 77 (100.0%) | 0 (0.0%) |
| 26 to 34 Years | 18 (54.5%) | 15 (45.5%) |
| 35 to 44 Years | 41 (87.2%) | 6 (12.8%) |
| 45 to 54 Years | 53 (100.0%) | 0 (0.0%) |
| 55 to 64 Years | 68 (100.0%) | 0 (0.0%) |
| 65 to 74 Years | 14 (100.0%) | 0 (0.0%) |
| 75 Years and older | 14 (100.0%) | 0 (0.0%) |
| Total | 331 (90.2%) | 36 (9.8%) |
Health Insurance Coverage by Citizenship Status in New Troy
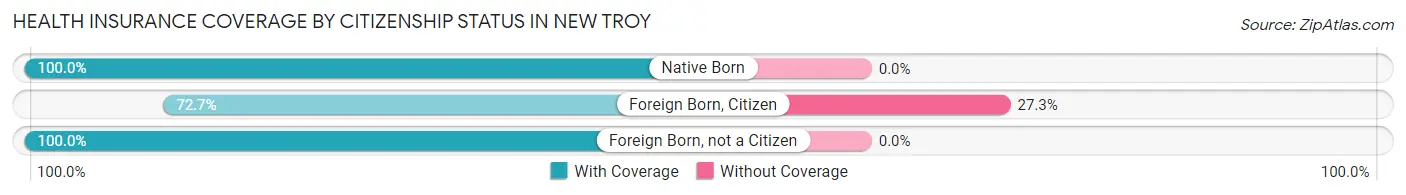
| Citizenship Status | With Coverage | Without Coverage |
| Native Born | 6 (100.0%) | 0 (0.0%) |
| Foreign Born, Citizen | 40 (72.7%) | 15 (27.3%) |
| Foreign Born, not a Citizen | 77 (100.0%) | 0 (0.0%) |
Health Insurance Coverage by Household Income in New Troy
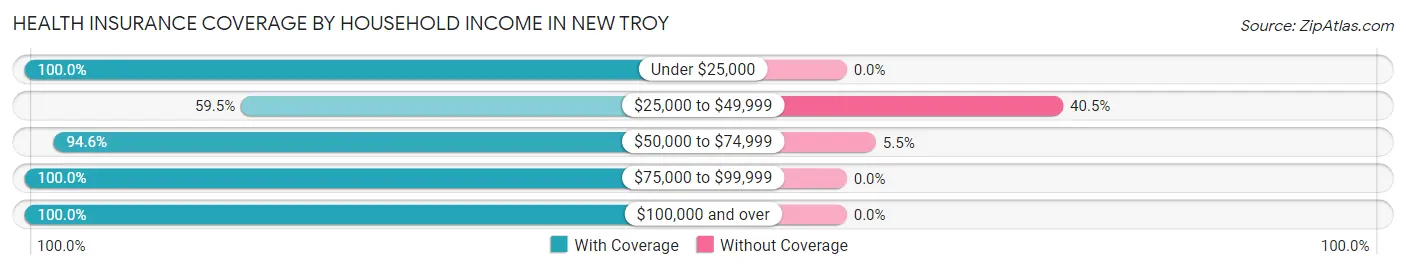
| Household Income | With Coverage | Without Coverage |
| Under $25,000 | 14 (100.0%) | 0 (0.0%) |
| $25,000 to $49,999 | 44 (59.5%) | 30 (40.5%) |
| $50,000 to $74,999 | 104 (94.6%) | 6 (5.4%) |
| $75,000 to $99,999 | 26 (100.0%) | 0 (0.0%) |
| $100,000 and over | 143 (100.0%) | 0 (0.0%) |
Public vs Private Health Insurance Coverage by Age in New Troy
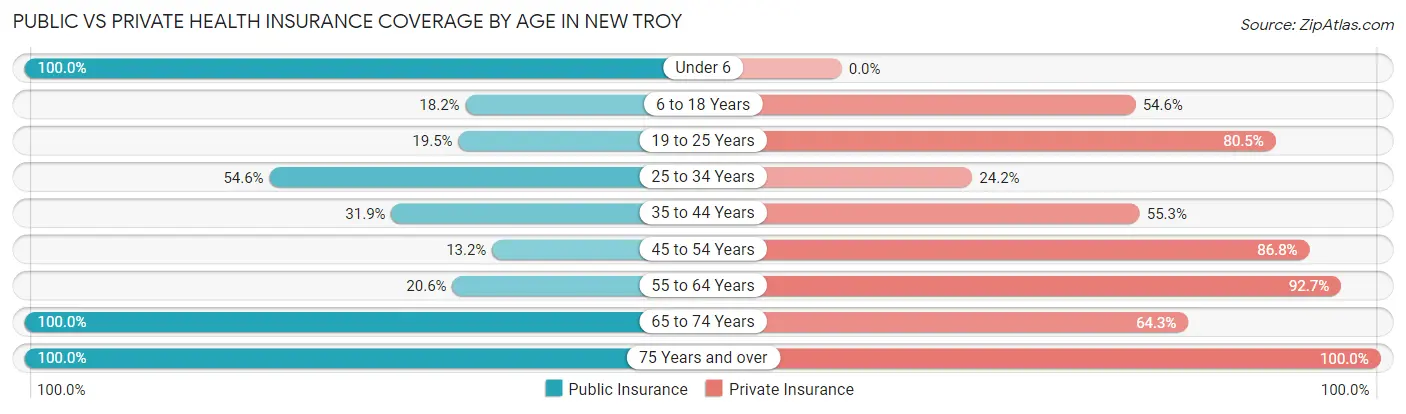
| Age Bracket | Public Insurance | Private Insurance |
| Under 6 | 6 (100.0%) | 0 (0.0%) |
| 6 to 18 Years | 10 (18.2%) | 30 (54.5%) |
| 19 to 25 Years | 15 (19.5%) | 62 (80.5%) |
| 25 to 34 Years | 18 (54.5%) | 8 (24.2%) |
| 35 to 44 Years | 15 (31.9%) | 26 (55.3%) |
| 45 to 54 Years | 7 (13.2%) | 46 (86.8%) |
| 55 to 64 Years | 14 (20.6%) | 63 (92.6%) |
| 65 to 74 Years | 14 (100.0%) | 9 (64.3%) |
| 75 Years and over | 14 (100.0%) | 14 (100.0%) |
| Total | 113 (30.8%) | 258 (70.3%) |
Disability Status by Sex by Age in New Troy
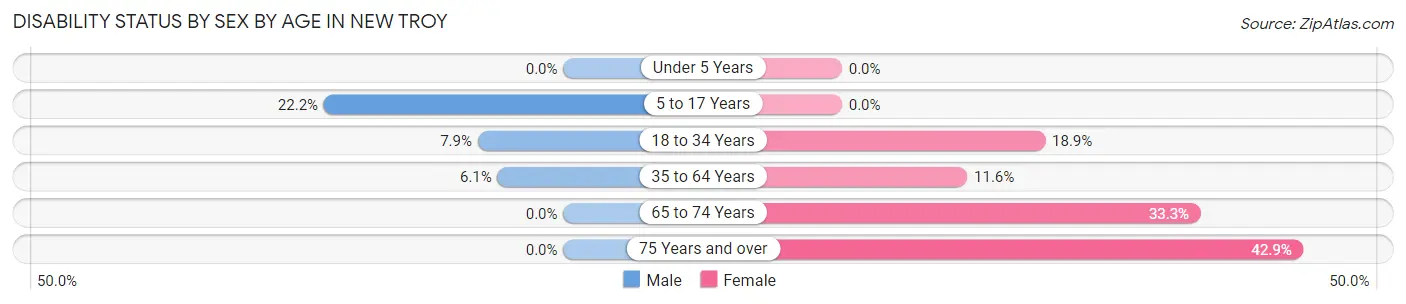
| Age Bracket | Male | Female |
| Under 5 Years | 0 (0.0%) | 0 (0.0%) |
| 5 to 17 Years | 4 (22.2%) | 0 (0.0%) |
| 18 to 34 Years | 5 (7.9%) | 10 (18.9%) |
| 35 to 64 Years | 5 (6.1%) | 10 (11.6%) |
| 65 to 74 Years | 0 (0.0%) | 3 (33.3%) |
| 75 Years and over | 0 (0.0%) | 3 (42.9%) |
Disability Class by Sex by Age in New Troy
Disability Class: Hearing Difficulty
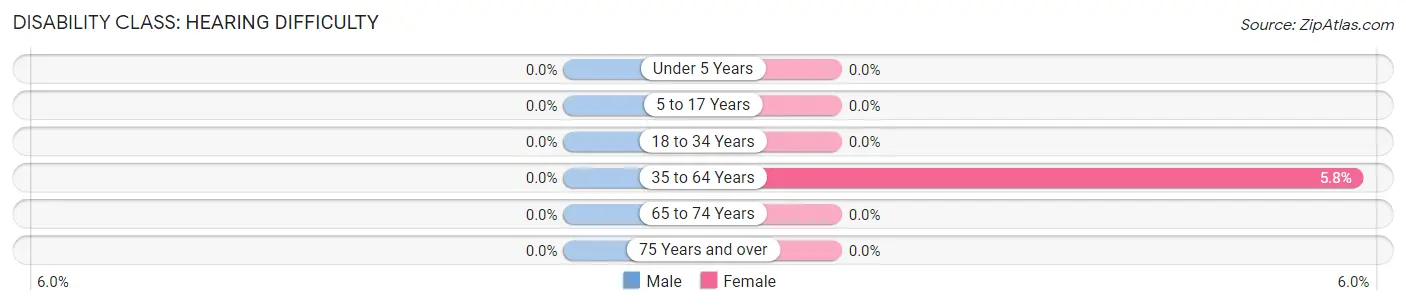
| Age Bracket | Male | Female |
| Under 5 Years | 0 (0.0%) | 0 (0.0%) |
| 5 to 17 Years | 0 (0.0%) | 0 (0.0%) |
| 18 to 34 Years | 0 (0.0%) | 0 (0.0%) |
| 35 to 64 Years | 0 (0.0%) | 5 (5.8%) |
| 65 to 74 Years | 0 (0.0%) | 0 (0.0%) |
| 75 Years and over | 0 (0.0%) | 0 (0.0%) |
Disability Class: Vision Difficulty
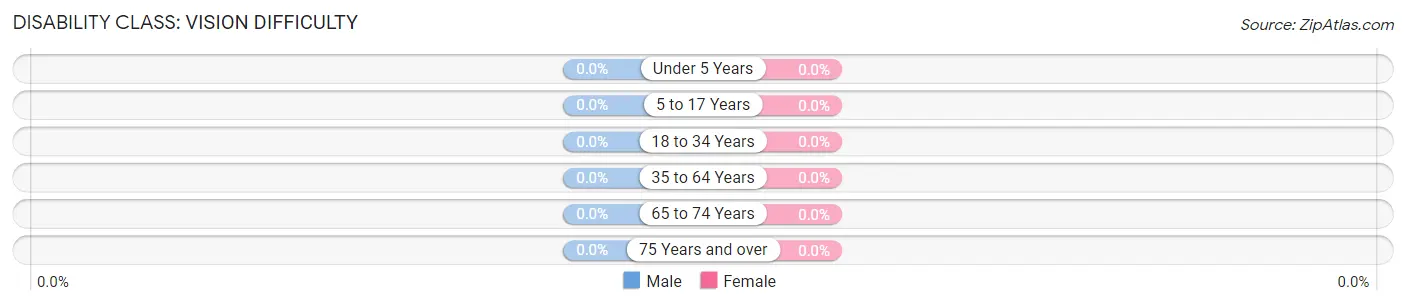
| Age Bracket | Male | Female |
| Under 5 Years | 0 (0.0%) | 0 (0.0%) |
| 5 to 17 Years | 0 (0.0%) | 0 (0.0%) |
| 18 to 34 Years | 0 (0.0%) | 0 (0.0%) |
| 35 to 64 Years | 0 (0.0%) | 0 (0.0%) |
| 65 to 74 Years | 0 (0.0%) | 0 (0.0%) |
| 75 Years and over | 0 (0.0%) | 0 (0.0%) |
Disability Class: Cognitive Difficulty
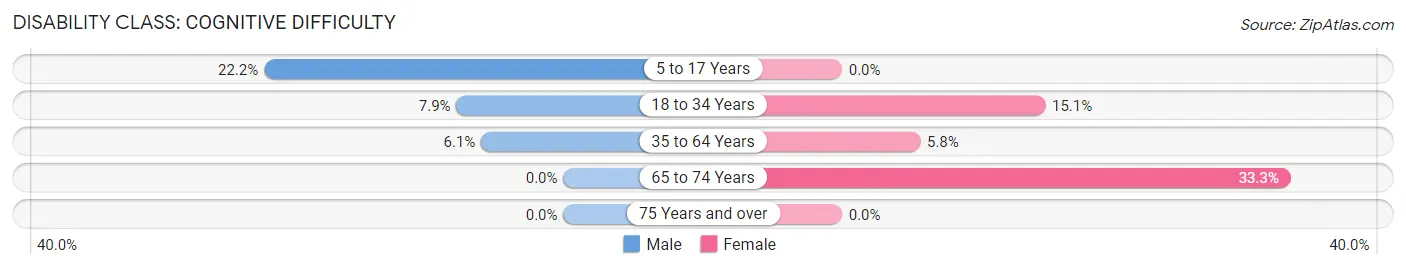
| Age Bracket | Male | Female |
| 5 to 17 Years | 4 (22.2%) | 0 (0.0%) |
| 18 to 34 Years | 5 (7.9%) | 8 (15.1%) |
| 35 to 64 Years | 5 (6.1%) | 5 (5.8%) |
| 65 to 74 Years | 0 (0.0%) | 3 (33.3%) |
| 75 Years and over | 0 (0.0%) | 0 (0.0%) |
Disability Class: Ambulatory Difficulty
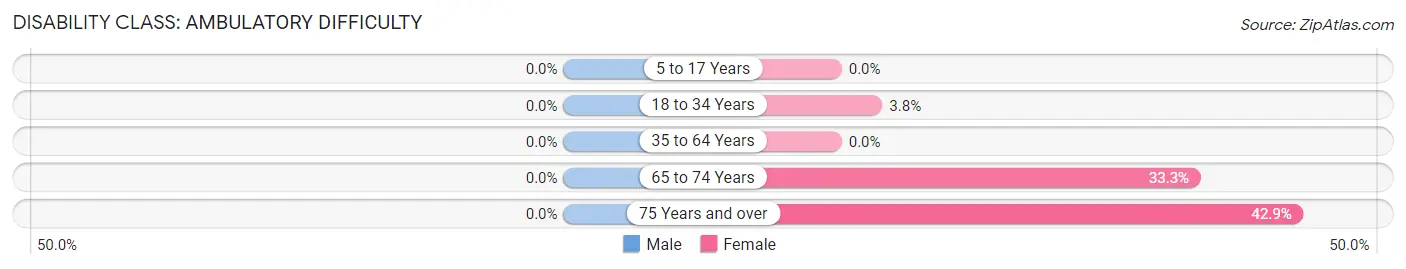
| Age Bracket | Male | Female |
| 5 to 17 Years | 0 (0.0%) | 0 (0.0%) |
| 18 to 34 Years | 0 (0.0%) | 2 (3.8%) |
| 35 to 64 Years | 0 (0.0%) | 0 (0.0%) |
| 65 to 74 Years | 0 (0.0%) | 3 (33.3%) |
| 75 Years and over | 0 (0.0%) | 3 (42.9%) |
Disability Class: Self-Care Difficulty
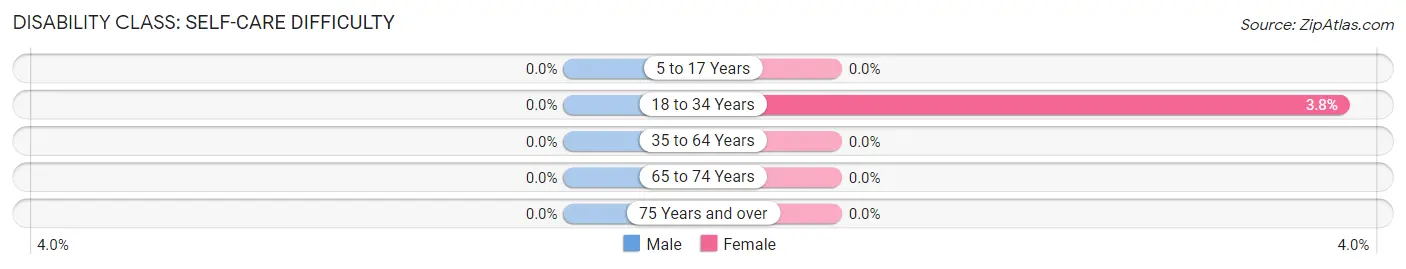
| Age Bracket | Male | Female |
| 5 to 17 Years | 0 (0.0%) | 0 (0.0%) |
| 18 to 34 Years | 0 (0.0%) | 2 (3.8%) |
| 35 to 64 Years | 0 (0.0%) | 0 (0.0%) |
| 65 to 74 Years | 0 (0.0%) | 0 (0.0%) |
| 75 Years and over | 0 (0.0%) | 0 (0.0%) |
Technology Access in New Troy
Computing Device Access in New Troy
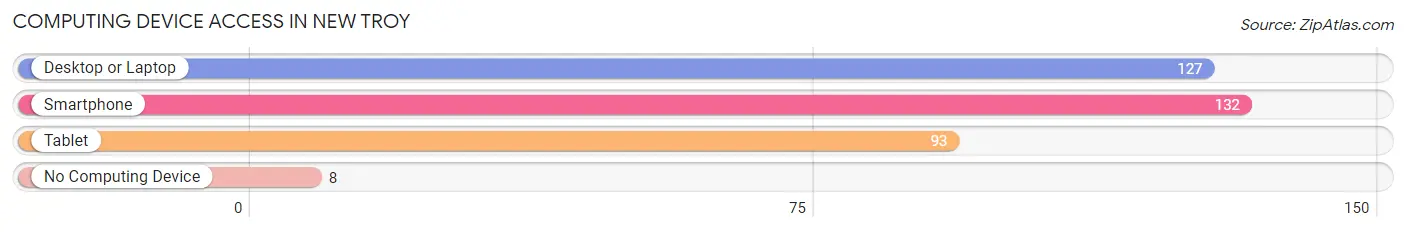
| Device Type | # Households | % Households |
| Desktop or Laptop | 127 | 84.1% |
| Smartphone | 132 | 87.4% |
| Tablet | 93 | 61.6% |
| No Computing Device | 8 | 5.3% |
| Total | 151 | 100.0% |
Internet Access in New Troy
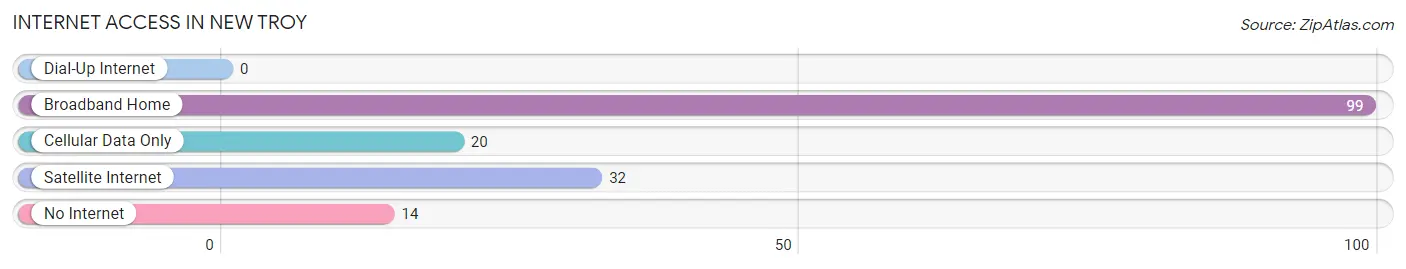
| Internet Type | # Households | % Households |
| Dial-Up Internet | 0 | 0.0% |
| Broadband Home | 99 | 65.6% |
| Cellular Data Only | 20 | 13.3% |
| Satellite Internet | 32 | 21.2% |
| No Internet | 14 | 9.3% |
| Total | 151 | 100.0% |
New Troy Summary
Troy, Michigan is a city located in Oakland County, Michigan, United States. It is a suburb of Detroit and is part of the Metro Detroit area. The city is home to a population of 80,980 people, making it the 11th largest city in the state.
History
Troy was first settled in 1819 by a group of settlers from Troy, New York. The settlers named the area after their hometown and it was incorporated as a village in 1955. The city was officially incorporated as a city in 1955 and has since grown to become one of the largest cities in the state.
Geography
Troy is located in Oakland County, Michigan, and is part of the Metro Detroit area. It is situated on the banks of the Clinton River and is bordered by the cities of Clawson, Rochester Hills, Royal Oak, and Birmingham. The city has a total area of 33.2 square miles, of which 32.9 square miles is land and 0.3 square miles is water.
Economy
Troy is home to a variety of businesses and industries. The city is home to several large corporations, including Flagstar Bank, Kmart, and Delphi Automotive. The city is also home to a number of smaller businesses, including restaurants, retail stores, and professional services.
Demographics
As of the 2010 census, the population of Troy was 80,980. The racial makeup of the city was 79.2% White, 8.2% African American, 0.3% Native American, 8.2% Asian, 0.1% Pacific Islander, and 2.9% from other races. The median household income was $76,824 and the median family income was $90,917.
Conclusion
Troy, Michigan is a city located in Oakland County, Michigan, United States. It is a suburb of Detroit and is part of the Metro Detroit area. The city is home to a population of 80,980 people, making it the 11th largest city in the state. Troy is home to a variety of businesses and industries, and the city has a diverse population. The city is a great place to live, work, and play, and it is a great place to call home.
Common Questions
What is Per Capita Income in New Troy?
Per Capita income in New Troy is $38,202.
What is the Median Family Income in New Troy?
Median Family Income in New Troy is $84,250.
What is the Median Household income in New Troy?
Median Household Income in New Troy is $63,906.
What is Income or Wage Gap in New Troy?
Income or Wage Gap in New Troy is 24.9%.
Women in New Troy earn 75.1 cents for every dollar earned by a man.
What is Inequality or Gini Index in New Troy?
Inequality or Gini Index in New Troy is 0.32.
What is the Total Population of New Troy?
Total Population of New Troy is 367.
What is the Total Male Population of New Troy?
Total Male Population of New Troy is 181.
What is the Total Female Population of New Troy?
Total Female Population of New Troy is 186.
What is the Ratio of Males per 100 Females in New Troy?
There are 97.31 Males per 100 Females in New Troy.
What is the Ratio of Females per 100 Males in New Troy?
There are 102.76 Females per 100 Males in New Troy.
What is the Median Population Age in New Troy?
Median Population Age in New Troy is 41.4 Years.
What is the Average Family Size in New Troy
Average Family Size in New Troy is 2.9 People.
What is the Average Household Size in New Troy
Average Household Size in New Troy is 2.4 People.
How Large is the Labor Force in New Troy?
There are 238 People in the Labor Forcein in New Troy.
What is the Percentage of People in the Labor Force in New Troy?
76.3% of People are in the Labor Force in New Troy.