Lowndesville, SC Map & Demographics
Lowndesville Map
Lowndesville Overview
$64,749
PER CAPITA INCOME
$18,673
FAMILY INCOME DEFICIT
0.59
INEQUALITY / GINI INDEX
184
TOTAL POPULATION
86
MALE POPULATION
98
FEMALE POPULATION
87.76
MALES / 100 FEMALES
113.95
FEMALES / 100 MALES
50.0
MEDIAN AGE
2.6
AVG FAMILY SIZE
2.2
AVG HOUSEHOLD SIZE
59
LABOR FORCE [ PEOPLE ]
40.7%
PERCENT IN LABOR FORCE
Lowndesville Zip Codes
Lowndesville Area Codes
Income in Lowndesville
Income Overview in Lowndesville
| Characteristic | Number | Measure |
| Per Capita Income | 184 | $64,749 |
| Median Family Income | 55 | $0 |
| Mean Family Income | 55 | $202,409 |
| Median Household Income | 85 | $0 |
| Mean Household Income | 85 | $138,569 |
| Income Deficit | 55 | $18,673 |
| Wage / Income Gap (%) | 184 | 0.00% |
| Wage / Income Gap ($) | 184 | 100.00¢ per $1 |
| Gini / Inequality Index | 184 | 0.59 |
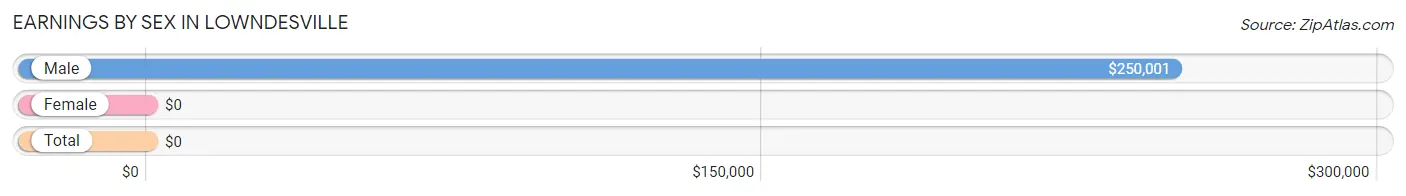
Earnings by Sex in Lowndesville
| Sex | Number | Average Earnings |
| Male | 46 (78.0%) | $250,001 |
| Female | 13 (22.0%) | $0 |
| Total | 59 (100.0%) | $0 |
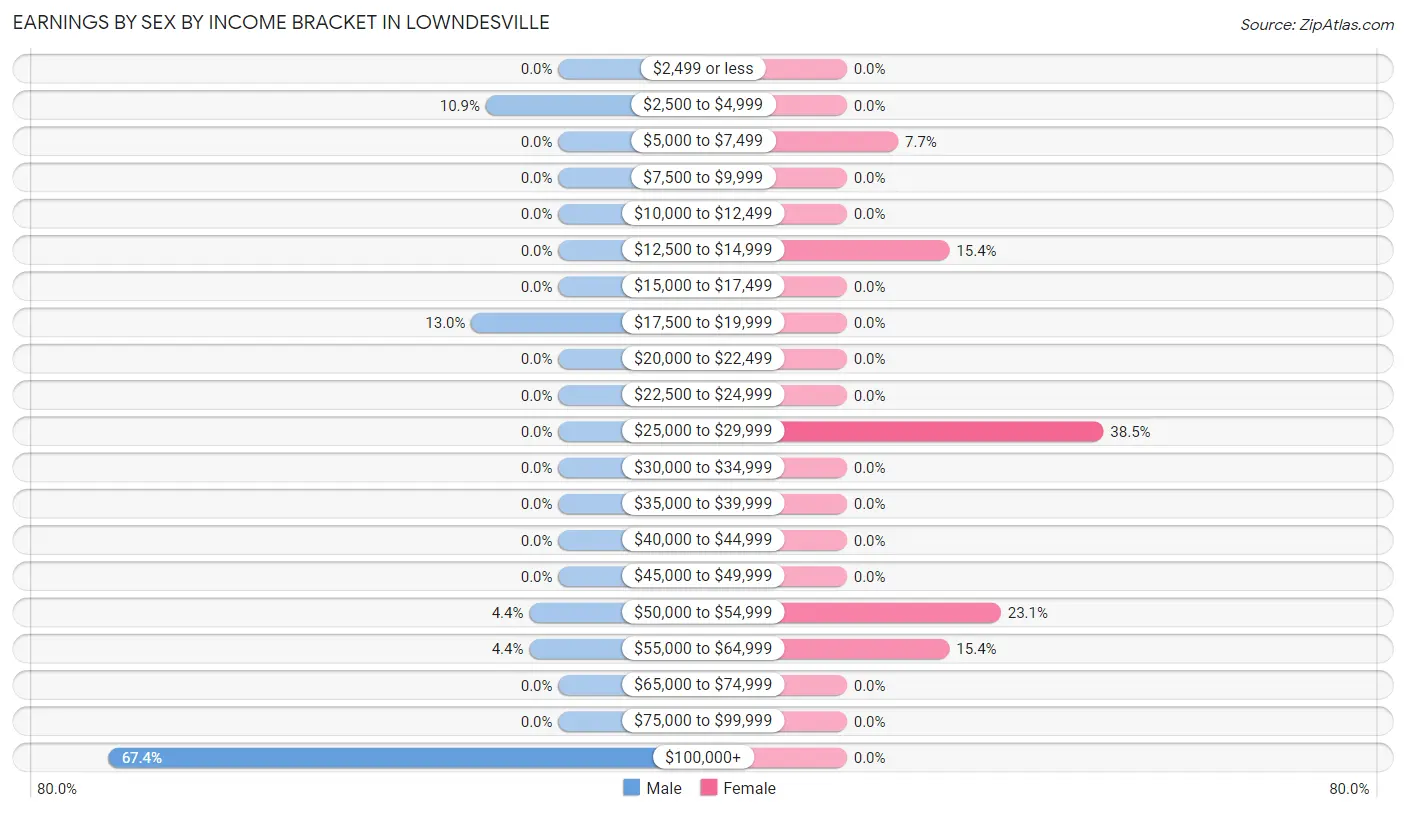
Earnings by Sex by Income Bracket in Lowndesville
The most common earnings brackets in Lowndesville are $100,000+ for men (31 | 67.4%) and $25,000 to $29,999 for women (5 | 38.5%).
| Income | Male | Female |
| $2,499 or less | 0 (0.0%) | 0 (0.0%) |
| $2,500 to $4,999 | 5 (10.9%) | 0 (0.0%) |
| $5,000 to $7,499 | 0 (0.0%) | 1 (7.7%) |
| $7,500 to $9,999 | 0 (0.0%) | 0 (0.0%) |
| $10,000 to $12,499 | 0 (0.0%) | 0 (0.0%) |
| $12,500 to $14,999 | 0 (0.0%) | 2 (15.4%) |
| $15,000 to $17,499 | 0 (0.0%) | 0 (0.0%) |
| $17,500 to $19,999 | 6 (13.0%) | 0 (0.0%) |
| $20,000 to $22,499 | 0 (0.0%) | 0 (0.0%) |
| $22,500 to $24,999 | 0 (0.0%) | 0 (0.0%) |
| $25,000 to $29,999 | 0 (0.0%) | 5 (38.5%) |
| $30,000 to $34,999 | 0 (0.0%) | 0 (0.0%) |
| $35,000 to $39,999 | 0 (0.0%) | 0 (0.0%) |
| $40,000 to $44,999 | 0 (0.0%) | 0 (0.0%) |
| $45,000 to $49,999 | 0 (0.0%) | 0 (0.0%) |
| $50,000 to $54,999 | 2 (4.3%) | 3 (23.1%) |
| $55,000 to $64,999 | 2 (4.3%) | 2 (15.4%) |
| $65,000 to $74,999 | 0 (0.0%) | 0 (0.0%) |
| $75,000 to $99,999 | 0 (0.0%) | 0 (0.0%) |
| $100,000+ | 31 (67.4%) | 0 (0.0%) |
| Total | 46 (100.0%) | 13 (100.0%) |
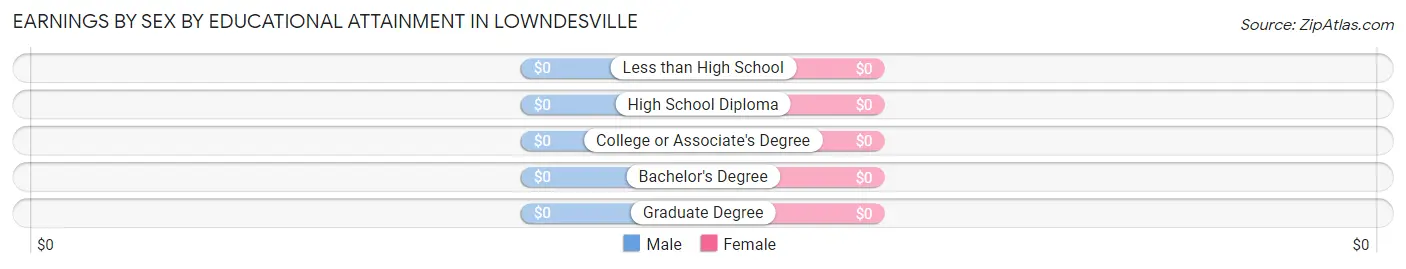
Earnings by Sex by Educational Attainment in Lowndesville
| Educational Attainment | Male Income | Female Income |
| Less than High School | - | - |
| High School Diploma | - | - |
| College or Associate's Degree | - | - |
| Bachelor's Degree | - | - |
| Graduate Degree | - | - |
| Total | $250,001 | $0 |
Family Income in Lowndesville
Family Income Brackets in Lowndesville
According to the Lowndesville family income data, there are 27 families falling into the $200,000+ income range, which is the most common income bracket and makes up 49.1% of all families.
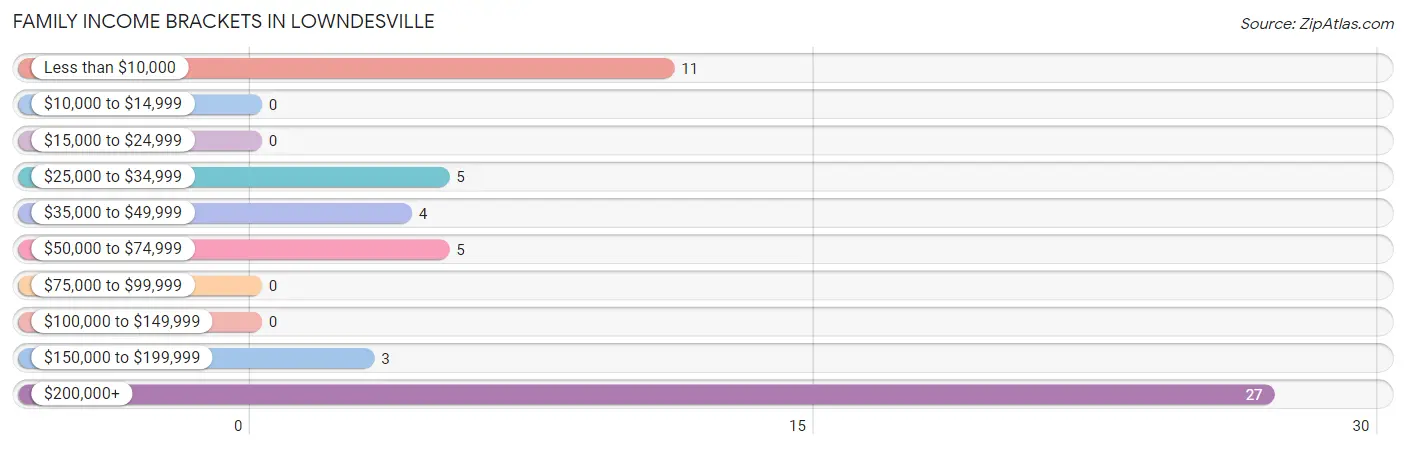
| Income Bracket | # Families | % Families |
| Less than $10,000 | 11 | 20.0% |
| $10,000 to $14,999 | 0 | 0.0% |
| $15,000 to $24,999 | 0 | 0.0% |
| $25,000 to $34,999 | 5 | 9.1% |
| $35,000 to $49,999 | 4 | 7.3% |
| $50,000 to $74,999 | 5 | 9.1% |
| $75,000 to $99,999 | 0 | 0.0% |
| $100,000 to $149,999 | 0 | 0.0% |
| $150,000 to $199,999 | 3 | 5.5% |
| $200,000+ | 27 | 49.1% |
Family Income by Famaliy Size in Lowndesville
2-person families (41 | 74.6%) account for the highest median family income in Lowndesville with $250,001 per family, while 2-person families (41 | 74.6%) have the highest median income of $125,000 per family member.
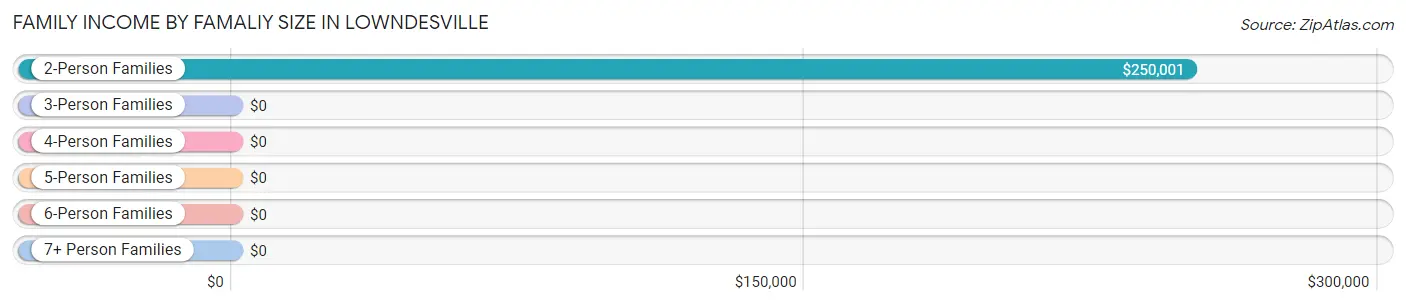
| Income Bracket | # Families | Median Income |
| 2-Person Families | 41 (74.6%) | $250,001 |
| 3-Person Families | 7 (12.7%) | $0 |
| 4-Person Families | 4 (7.3%) | $0 |
| 5-Person Families | 0 (0.0%) | $0 |
| 6-Person Families | 3 (5.4%) | $0 |
| 7+ Person Families | 0 (0.0%) | $0 |
| Total | 55 (100.0%) | $0 |
Family Income by Number of Earners in Lowndesville
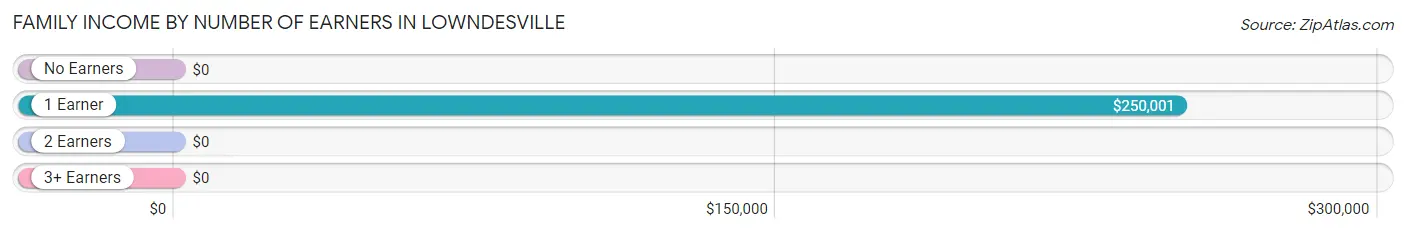
| Number of Earners | # Families | Median Income |
| No Earners | 14 (25.5%) | $0 |
| 1 Earner | 36 (65.4%) | $250,001 |
| 2 Earners | 5 (9.1%) | $0 |
| 3+ Earners | 0 (0.0%) | $0 |
| Total | 55 (100.0%) | $0 |
Household Income in Lowndesville
Household Income Brackets in Lowndesville
With 27 households falling in the category, the $200,000+ income range is the most frequent in Lowndesville, accounting for 31.8% of all households.
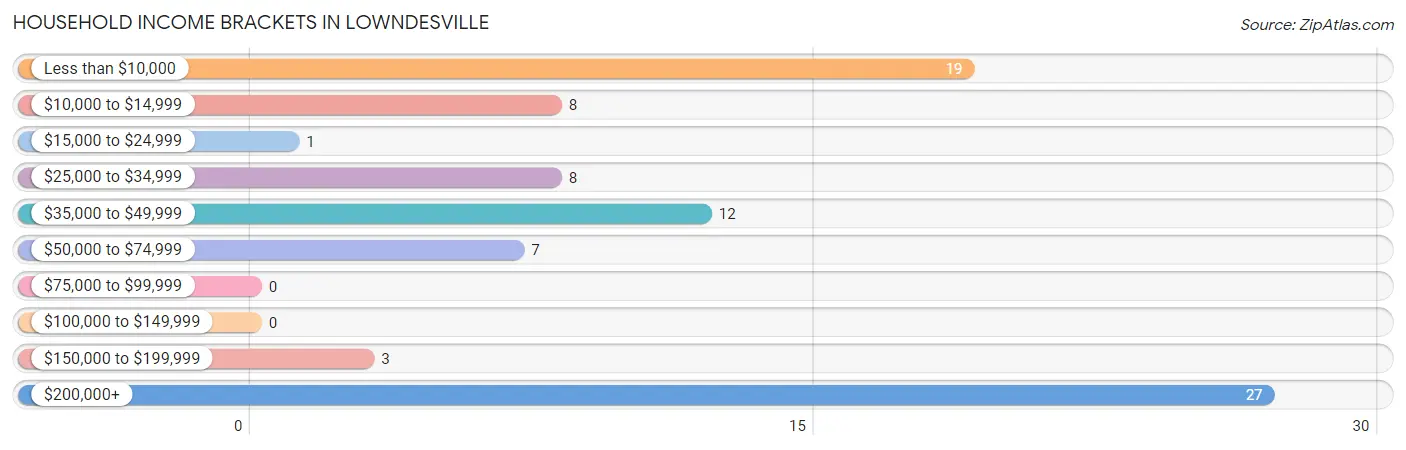
| Income Bracket | # Households | % Households |
| Less than $10,000 | 19 | 22.4% |
| $10,000 to $14,999 | 8 | 9.4% |
| $15,000 to $24,999 | 1 | 1.2% |
| $25,000 to $34,999 | 8 | 9.4% |
| $35,000 to $49,999 | 12 | 14.1% |
| $50,000 to $74,999 | 7 | 8.2% |
| $75,000 to $99,999 | 0 | 0.0% |
| $100,000 to $149,999 | 0 | 0.0% |
| $150,000 to $199,999 | 3 | 3.5% |
| $200,000+ | 27 | 31.8% |
Household Income by Householder Age in Lowndesville
The median household income in Lowndesville is $0, with the highest median household income of $250,001 found in the 45 to 64 years age bracket for the primary householder. A total of 50 households (58.8%) fall into this category. Meanwhile, the 15 to 24 years age bracket for the primary householder has the lowest median household income of $0, with 6 households (7.1%) in this group.
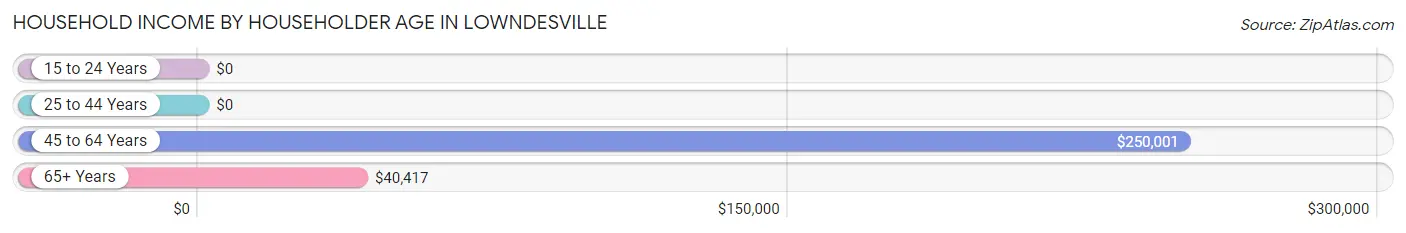
| Income Bracket | # Households | Median Income |
| 15 to 24 Years | 6 (7.1%) | $0 |
| 25 to 44 Years | 13 (15.3%) | $0 |
| 45 to 64 Years | 50 (58.8%) | $250,001 |
| 65+ Years | 16 (18.8%) | $40,417 |
| Total | 85 (100.0%) | $0 |
Poverty in Lowndesville
Income Below Poverty by Sex and Age in Lowndesville
With 23.3% poverty level for males and 32.7% for females among the residents of Lowndesville, 6 to 11 year old males and 18 to 24 year old females are the most vulnerable to poverty, with 3 males (100.0%) and 8 females (80.0%) in their respective age groups living below the poverty level.
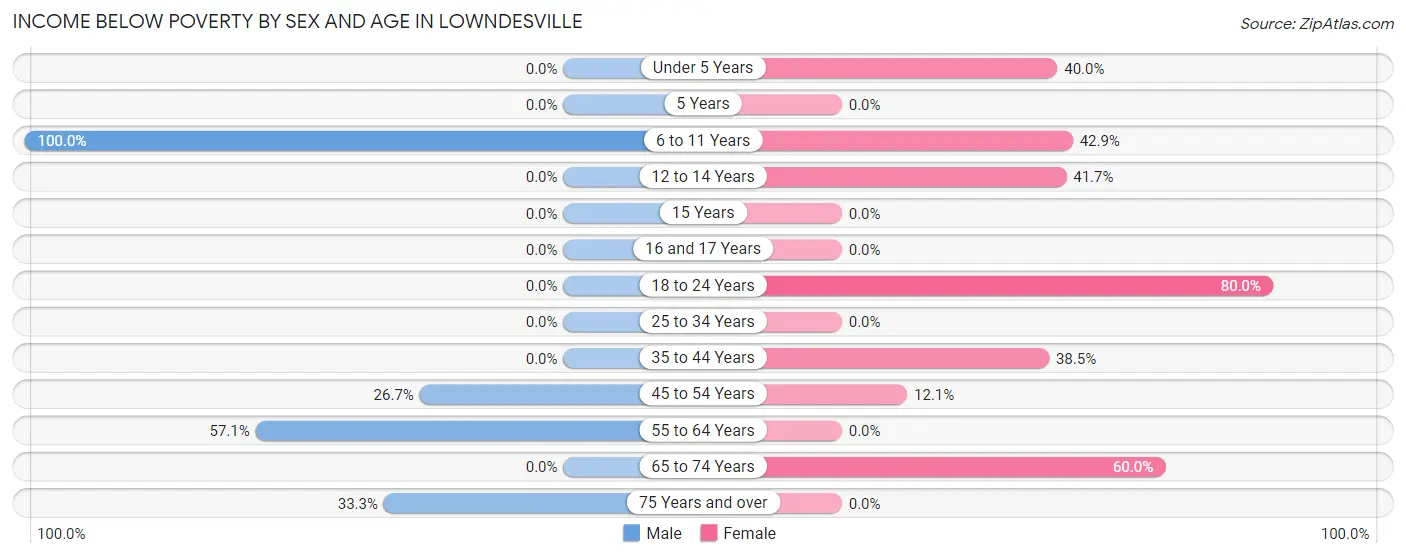
| Age Bracket | Male | Female |
| Under 5 Years | 0 (0.0%) | 4 (40.0%) |
| 5 Years | 0 (0.0%) | 0 (0.0%) |
| 6 to 11 Years | 3 (100.0%) | 3 (42.9%) |
| 12 to 14 Years | 0 (0.0%) | 5 (41.7%) |
| 15 Years | 0 (0.0%) | 0 (0.0%) |
| 16 and 17 Years | 0 (0.0%) | 0 (0.0%) |
| 18 to 24 Years | 0 (0.0%) | 8 (80.0%) |
| 25 to 34 Years | 0 (0.0%) | 0 (0.0%) |
| 35 to 44 Years | 0 (0.0%) | 5 (38.5%) |
| 45 to 54 Years | 12 (26.7%) | 4 (12.1%) |
| 55 to 64 Years | 4 (57.1%) | 0 (0.0%) |
| 65 to 74 Years | 0 (0.0%) | 3 (60.0%) |
| 75 Years and over | 1 (33.3%) | 0 (0.0%) |
| Total | 20 (23.3%) | 32 (32.7%) |
Income Above Poverty by Sex and Age in Lowndesville
According to the poverty statistics in Lowndesville, males aged under 5 years and females aged 16 and 17 years are the age groups that are most secure financially, with 100.0% of males and 100.0% of females in these age groups living above the poverty line.
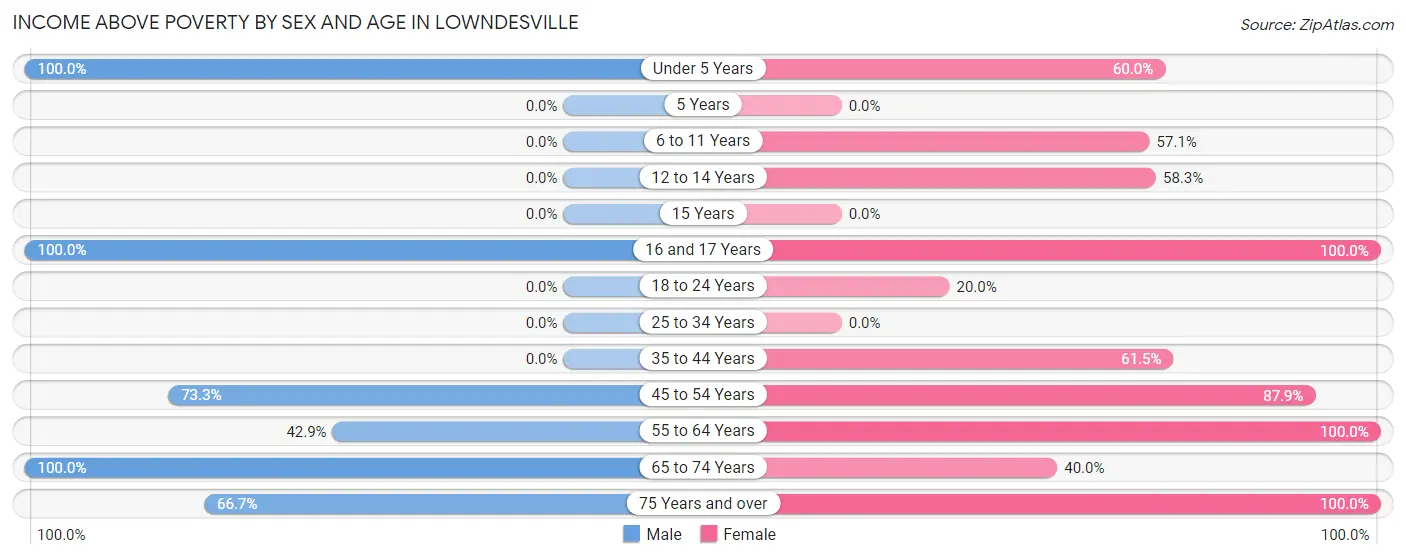
| Age Bracket | Male | Female |
| Under 5 Years | 7 (100.0%) | 6 (60.0%) |
| 5 Years | 0 (0.0%) | 0 (0.0%) |
| 6 to 11 Years | 0 (0.0%) | 4 (57.1%) |
| 12 to 14 Years | 0 (0.0%) | 7 (58.3%) |
| 15 Years | 0 (0.0%) | 0 (0.0%) |
| 16 and 17 Years | 8 (100.0%) | 3 (100.0%) |
| 18 to 24 Years | 0 (0.0%) | 2 (20.0%) |
| 25 to 34 Years | 0 (0.0%) | 0 (0.0%) |
| 35 to 44 Years | 0 (0.0%) | 8 (61.5%) |
| 45 to 54 Years | 33 (73.3%) | 29 (87.9%) |
| 55 to 64 Years | 3 (42.9%) | 3 (100.0%) |
| 65 to 74 Years | 13 (100.0%) | 2 (40.0%) |
| 75 Years and over | 2 (66.7%) | 2 (100.0%) |
| Total | 66 (76.7%) | 66 (67.3%) |
Income Below Poverty Among Married-Couple Families in Lowndesville
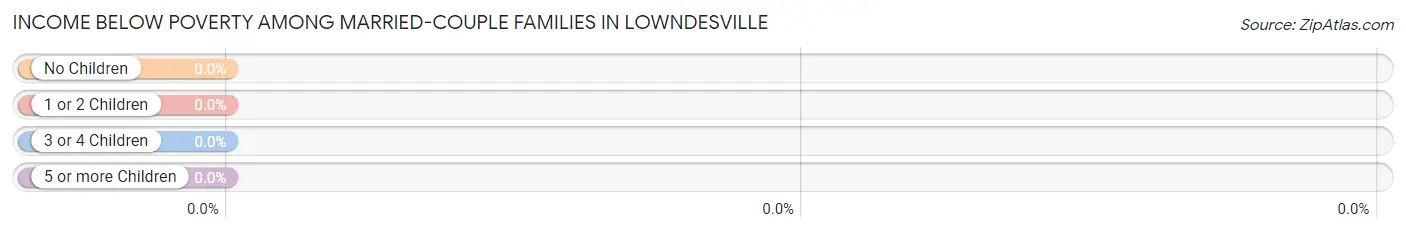
| Children | Above Poverty | Below Poverty |
| No Children | 30 (100.0%) | 0 (0.0%) |
| 1 or 2 Children | 2 (100.0%) | 0 (0.0%) |
| 3 or 4 Children | 3 (100.0%) | 0 (0.0%) |
| 5 or more Children | 0 (0.0%) | 0 (0.0%) |
| Total | 35 (100.0%) | 0 (0.0%) |
Income Below Poverty Among Single-Parent Households in Lowndesville
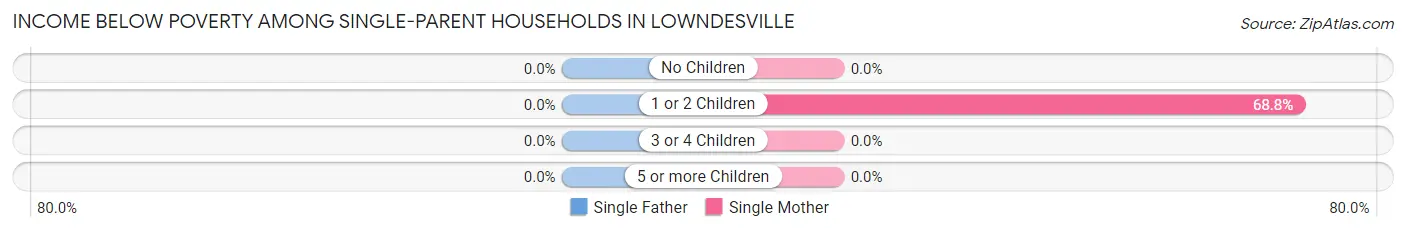
| Children | Single Father | Single Mother |
| No Children | 0 (0.0%) | 0 (0.0%) |
| 1 or 2 Children | 0 (0.0%) | 11 (68.8%) |
| 3 or 4 Children | 0 (0.0%) | 0 (0.0%) |
| 5 or more Children | 0 (0.0%) | 0 (0.0%) |
| Total | 0 (0.0%) | 11 (57.9%) |
Income Below Poverty Among Married-Couple vs Single-Parent Households in Lowndesville
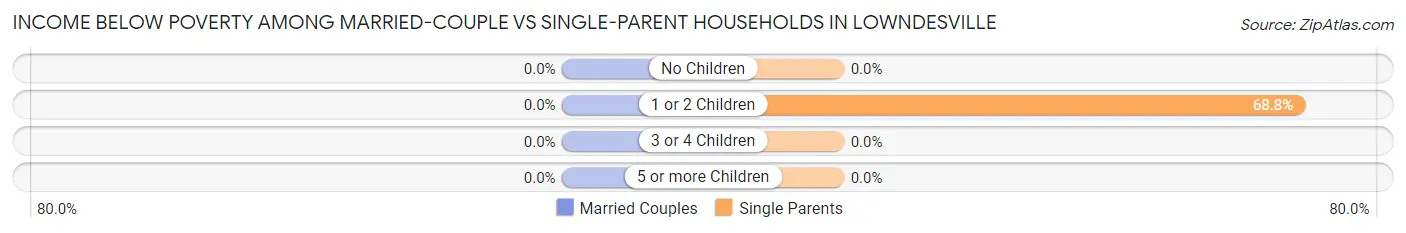
| Children | Married-Couple Families | Single-Parent Households |
| No Children | 0 (0.0%) | 0 (0.0%) |
| 1 or 2 Children | 0 (0.0%) | 11 (68.8%) |
| 3 or 4 Children | 0 (0.0%) | 0 (0.0%) |
| 5 or more Children | 0 (0.0%) | 0 (0.0%) |
| Total | 0 (0.0%) | 11 (55.0%) |
Race in Lowndesville
The most populous races in Lowndesville are White / Caucasian (99 | 53.8%), Asian (53 | 28.8%), and Black / African American (32 | 17.4%).
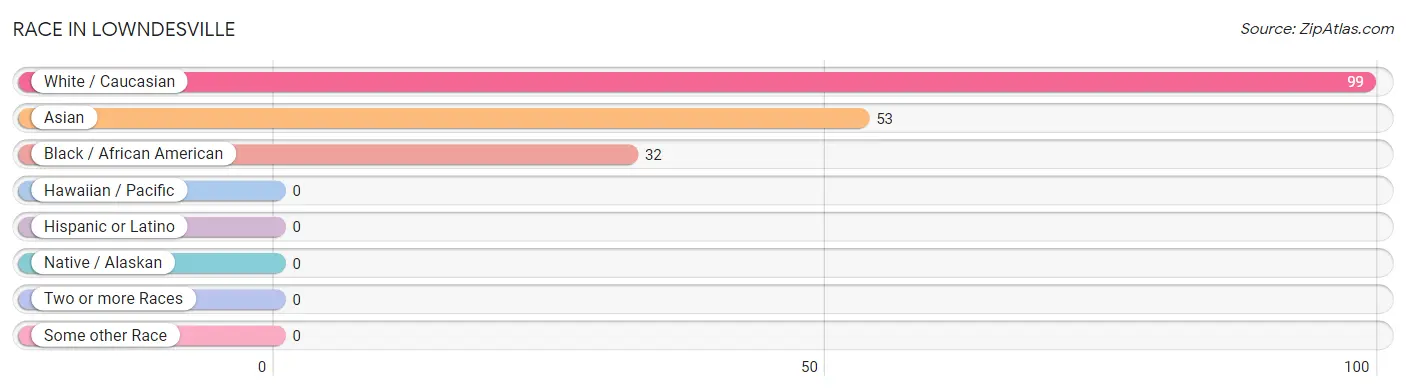
| Race | # Population | % Population |
| Asian | 53 | 28.8% |
| Black / African American | 32 | 17.4% |
| Hawaiian / Pacific | 0 | 0.0% |
| Hispanic or Latino | 0 | 0.0% |
| Native / Alaskan | 0 | 0.0% |
| White / Caucasian | 99 | 53.8% |
| Two or more Races | 0 | 0.0% |
| Some other Race | 0 | 0.0% |
| Total | 184 | 100.0% |
Ancestry in Lowndesville
The most populous ancestries reported in Lowndesville are Thai (53 | 28.8%), African (15 | 8.2%), Subsaharan African (15 | 8.2%), American (10 | 5.4%), and Czech (1 | 0.5%), together accounting for 51.1% of all Lowndesville residents.
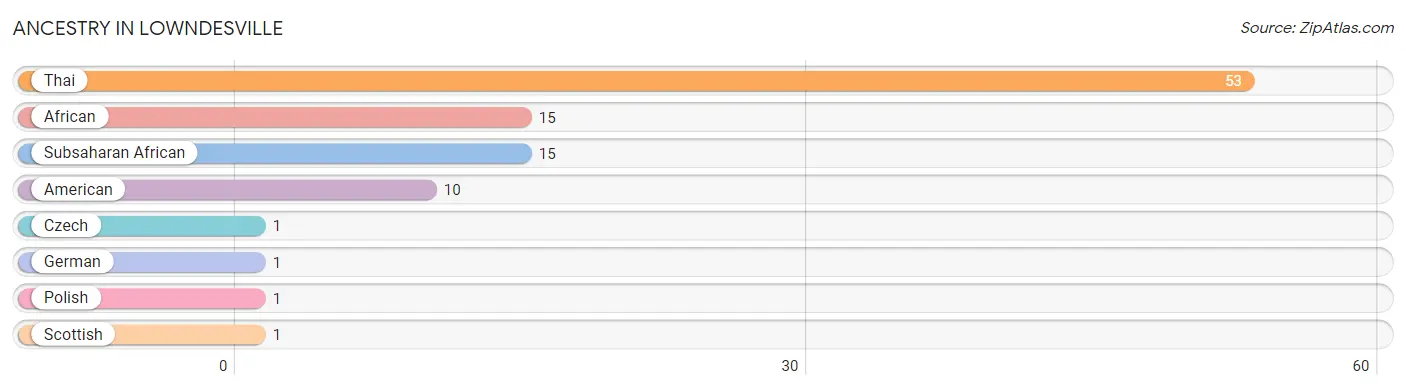
| Ancestry | # Population | % Population |
| African | 15 | 8.2% |
| American | 10 | 5.4% |
| Czech | 1 | 0.5% |
| German | 1 | 0.5% |
| Polish | 1 | 0.5% |
| Scottish | 1 | 0.5% |
| Subsaharan African | 15 | 8.2% |
| Thai | 53 | 28.8% | View All 8 Rows |
Immigrants in Lowndesville
The most numerous immigrant groups reported in Lowndesville came from Asia (53 | 28.8%), India (53 | 28.8%), and South Central Asia (53 | 28.8%), together accounting for 86.4% of all Lowndesville residents.
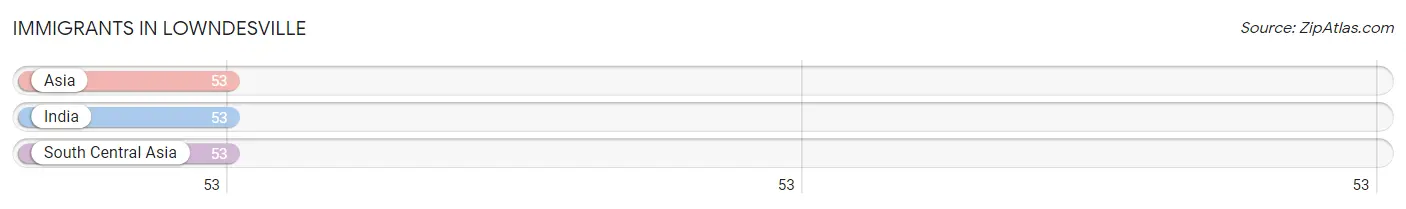
| Immigration Origin | # Population | % Population |
| Asia | 53 | 28.8% |
| India | 53 | 28.8% |
| South Central Asia | 53 | 28.8% | View All 3 Rows |
Sex and Age in Lowndesville
Sex and Age in Lowndesville
The most populous age groups in Lowndesville are 50 to 54 Years (30 | 34.9%) for men and 50 to 54 Years (29 | 29.6%) for women.
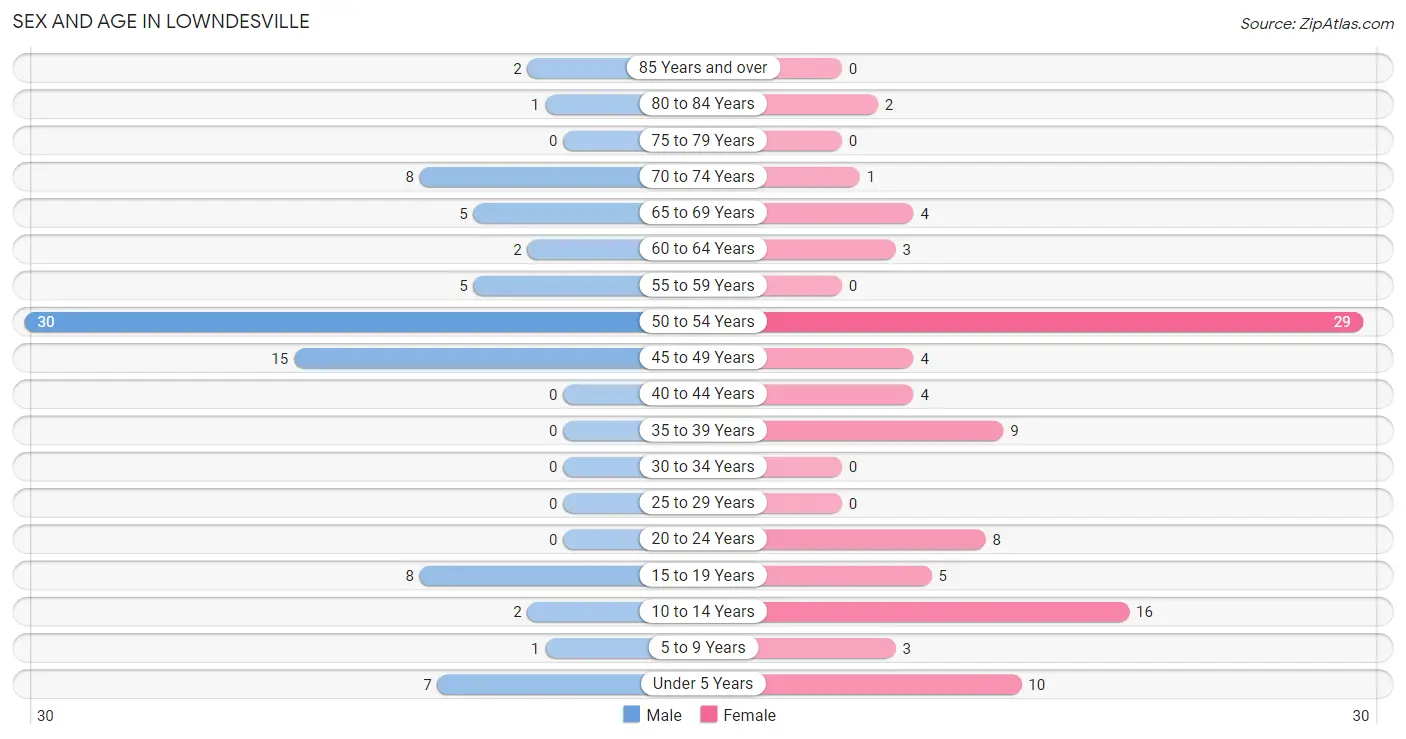
| Age Bracket | Male | Female |
| Under 5 Years | 7 (8.1%) | 10 (10.2%) |
| 5 to 9 Years | 1 (1.2%) | 3 (3.1%) |
| 10 to 14 Years | 2 (2.3%) | 16 (16.3%) |
| 15 to 19 Years | 8 (9.3%) | 5 (5.1%) |
| 20 to 24 Years | 0 (0.0%) | 8 (8.2%) |
| 25 to 29 Years | 0 (0.0%) | 0 (0.0%) |
| 30 to 34 Years | 0 (0.0%) | 0 (0.0%) |
| 35 to 39 Years | 0 (0.0%) | 9 (9.2%) |
| 40 to 44 Years | 0 (0.0%) | 4 (4.1%) |
| 45 to 49 Years | 15 (17.4%) | 4 (4.1%) |
| 50 to 54 Years | 30 (34.9%) | 29 (29.6%) |
| 55 to 59 Years | 5 (5.8%) | 0 (0.0%) |
| 60 to 64 Years | 2 (2.3%) | 3 (3.1%) |
| 65 to 69 Years | 5 (5.8%) | 4 (4.1%) |
| 70 to 74 Years | 8 (9.3%) | 1 (1.0%) |
| 75 to 79 Years | 0 (0.0%) | 0 (0.0%) |
| 80 to 84 Years | 1 (1.2%) | 2 (2.0%) |
| 85 Years and over | 2 (2.3%) | 0 (0.0%) |
| Total | 86 (100.0%) | 98 (100.0%) |
Families and Households in Lowndesville
Median Family Size in Lowndesville
The median family size in Lowndesville is 2.65 persons per family, with single male/father families (1 | 1.8%) accounting for the largest median family size of 3 persons per family. On the other hand, married-couple families (35 | 63.6%) represent the smallest median family size with 2.57 persons per family.
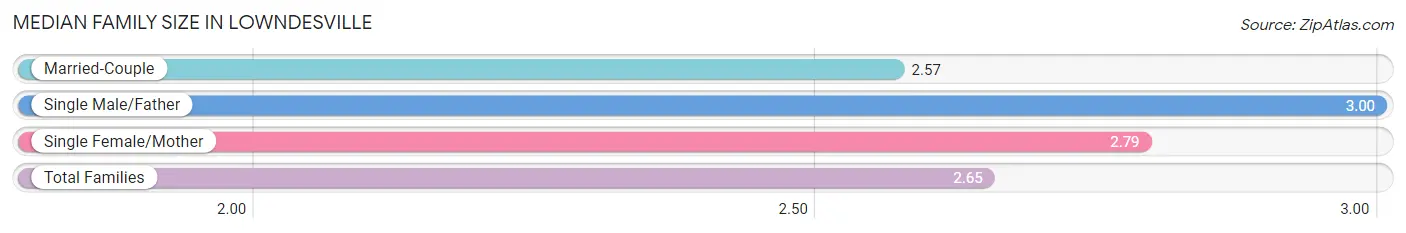
| Family Type | # Families | Family Size |
| Married-Couple | 35 (63.6%) | 2.57 |
| Single Male/Father | 1 (1.8%) | 3.00 |
| Single Female/Mother | 19 (34.5%) | 2.79 |
| Total Families | 55 (100.0%) | 2.65 |
Median Household Size in Lowndesville
The median household size in Lowndesville is 2.16 persons per household, with single male/father households (1 | 1.2%) accounting for the largest median household size of 3 persons per household. non-family households (30 | 35.3%) represent the smallest median household size with 1.27 persons per household.
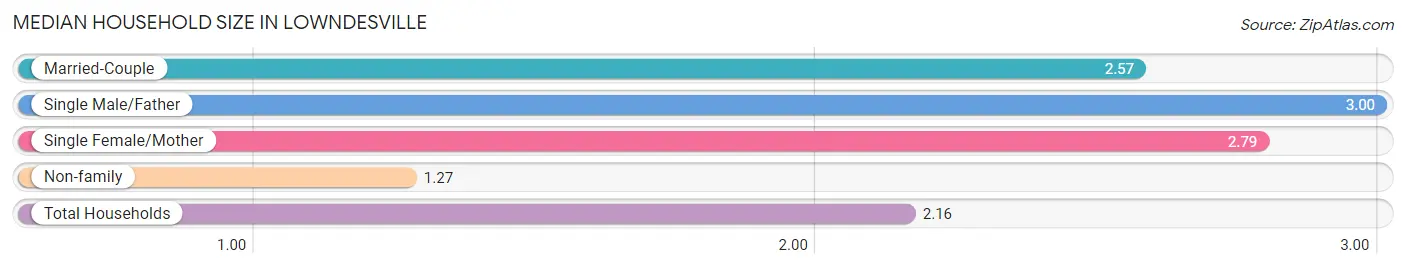
| Household Type | # Households | Household Size |
| Married-Couple | 35 (41.2%) | 2.57 |
| Single Male/Father | 1 (1.2%) | 3.00 |
| Single Female/Mother | 19 (22.4%) | 2.79 |
| Non-family | 30 (35.3%) | 1.27 |
| Total Households | 85 (100.0%) | 2.16 |
Household Size by Marriage Status in Lowndesville
Out of a total of 85 households in Lowndesville, 55 (64.7%) are family households, while 30 (35.3%) are nonfamily households. The most numerous type of family households are 2-person households, comprising 41, and the most common type of nonfamily households are 1-person households, comprising 25.
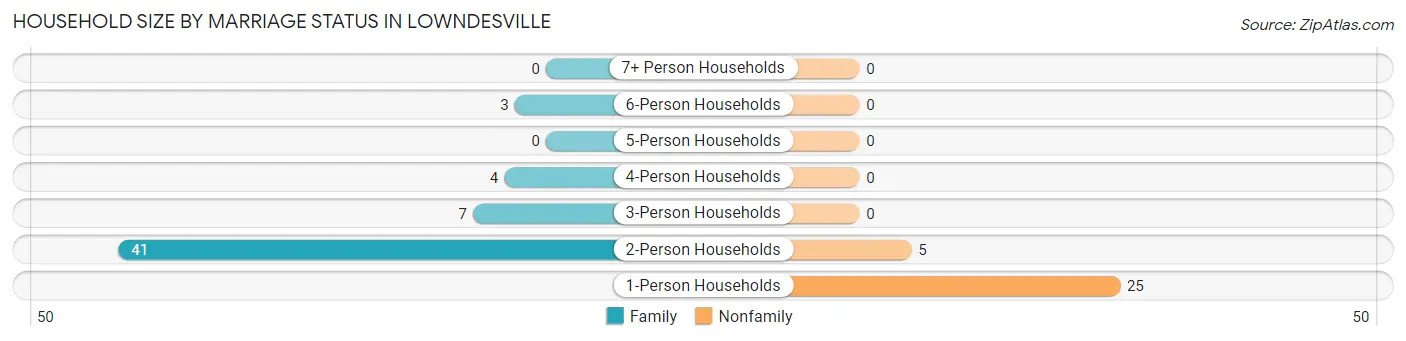
| Household Size | Family Households | Nonfamily Households |
| 1-Person Households | - | 25 (29.4%) |
| 2-Person Households | 41 (48.2%) | 5 (5.9%) |
| 3-Person Households | 7 (8.2%) | 0 (0.0%) |
| 4-Person Households | 4 (4.7%) | 0 (0.0%) |
| 5-Person Households | 0 (0.0%) | 0 (0.0%) |
| 6-Person Households | 3 (3.5%) | 0 (0.0%) |
| 7+ Person Households | 0 (0.0%) | 0 (0.0%) |
| Total | 55 (64.7%) | 30 (35.3%) |
Female Fertility in Lowndesville
Fertility by Age in Lowndesville
| Age Bracket | Women with Births | Births / 1,000 Women |
| 15 to 19 years | 0 (0.0%) | 0.0 |
| 20 to 34 years | 0 (0.0%) | 0.0 |
| 35 to 50 years | 0 (0.0%) | 0.0 |
| Total | 0 (0.0%) | 0.0 |
Fertility by Age by Marriage Status in Lowndesville
| Age Bracket | Married | Unmarried |
| 15 to 19 years | 0 (0.0%) | 0 (0.0%) |
| 20 to 34 years | 0 (0.0%) | 0 (0.0%) |
| 35 to 50 years | 0 (0.0%) | 0 (0.0%) |
| Total | 0 (0.0%) | 0 (0.0%) |
Fertility by Education in Lowndesville
| Educational Attainment | Women with Births | Births / 1,000 Women |
| Less than High School | 0 (0.0%) | 0.0 |
| High School Diploma | 0 (0.0%) | 0.0 |
| College or Associate's Degree | 0 (0.0%) | 0.0 |
| Bachelor's Degree | 0 (0.0%) | 0.0 |
| Graduate Degree | 0 (0.0%) | 0.0 |
| Total | 0 (0.0%) | 0.0 |
Fertility by Education by Marriage Status in Lowndesville
| Educational Attainment | Married | Unmarried |
| Less than High School | 0 (0.0%) | 0 (0.0%) |
| High School Diploma | 0 (0.0%) | 0 (0.0%) |
| College or Associate's Degree | 0 (0.0%) | 0 (0.0%) |
| Bachelor's Degree | 0 (0.0%) | 0 (0.0%) |
| Graduate Degree | 0 (0.0%) | 0 (0.0%) |
| Total | 0 (0.0%) | 0 (0.0%) |
Employment Characteristics in Lowndesville
Employment by Class of Employer in Lowndesville
Among the 54 employed individuals in Lowndesville, self-employed (incorporated) (27 | 50.0%), private company employees (16 | 29.6%), and local government employees (6 | 11.1%) make up the most common classes of employment.
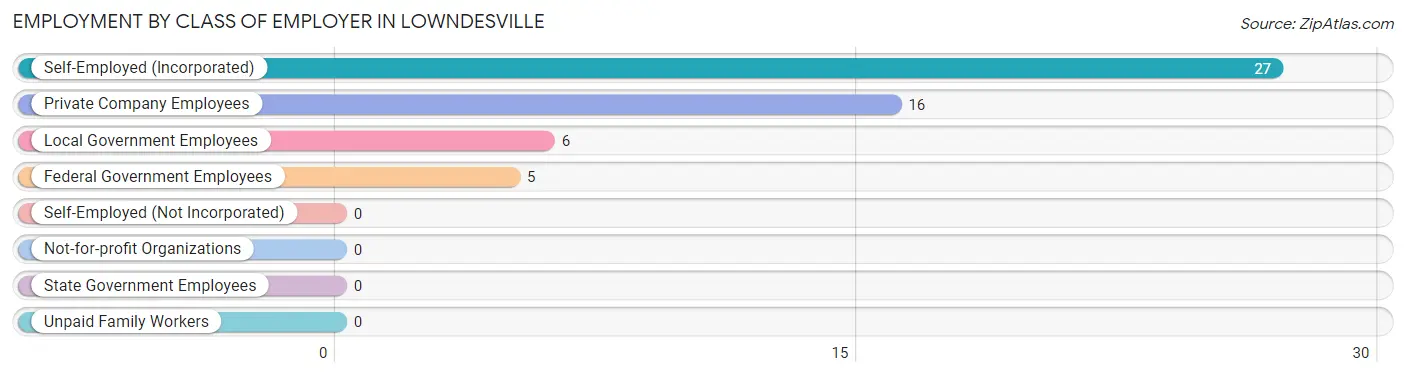
| Employer Class | # Employees | % Employees |
| Private Company Employees | 16 | 29.6% |
| Self-Employed (Incorporated) | 27 | 50.0% |
| Self-Employed (Not Incorporated) | 0 | 0.0% |
| Not-for-profit Organizations | 0 | 0.0% |
| Local Government Employees | 6 | 11.1% |
| State Government Employees | 0 | 0.0% |
| Federal Government Employees | 5 | 9.3% |
| Unpaid Family Workers | 0 | 0.0% |
| Total | 54 | 100.0% |
Employment Status by Age in Lowndesville
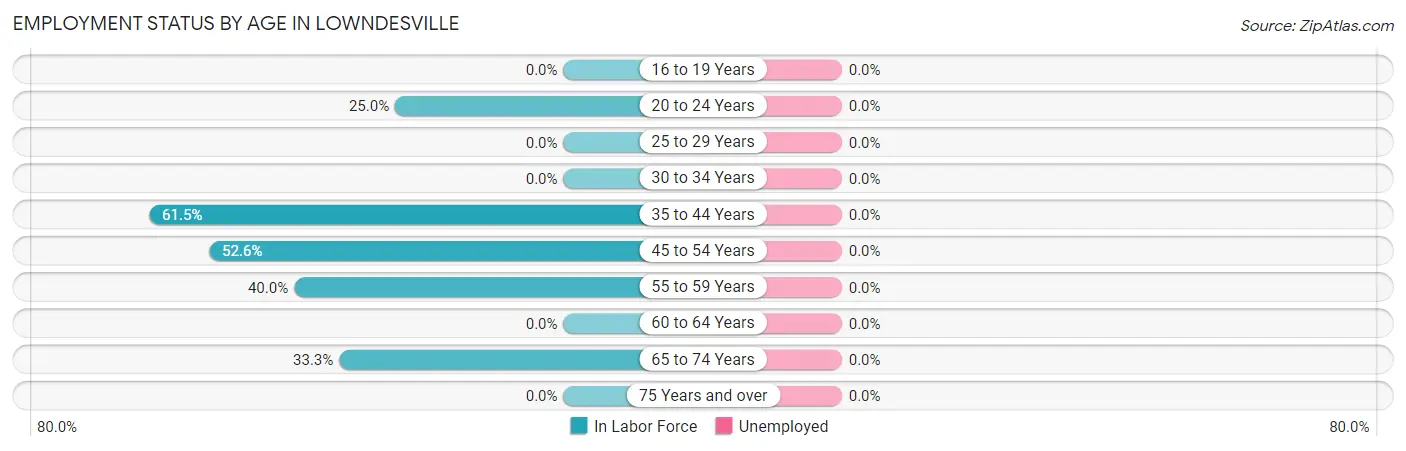
| Age Bracket | In Labor Force | Unemployed |
| 16 to 19 Years | 0 (0.0%) | 0 (0.0%) |
| 20 to 24 Years | 2 (25.0%) | 0 (0.0%) |
| 25 to 29 Years | 0 (0.0%) | 0 (0.0%) |
| 30 to 34 Years | 0 (0.0%) | 0 (0.0%) |
| 35 to 44 Years | 8 (61.5%) | 0 (0.0%) |
| 45 to 54 Years | 41 (52.6%) | 0 (0.0%) |
| 55 to 59 Years | 2 (40.0%) | 0 (0.0%) |
| 60 to 64 Years | 0 (0.0%) | 0 (0.0%) |
| 65 to 74 Years | 6 (33.3%) | 0 (0.0%) |
| 75 Years and over | 0 (0.0%) | 0 (0.0%) |
| Total | 59 (40.7%) | 0 (0.0%) |
Employment Status by Educational Attainment in Lowndesville
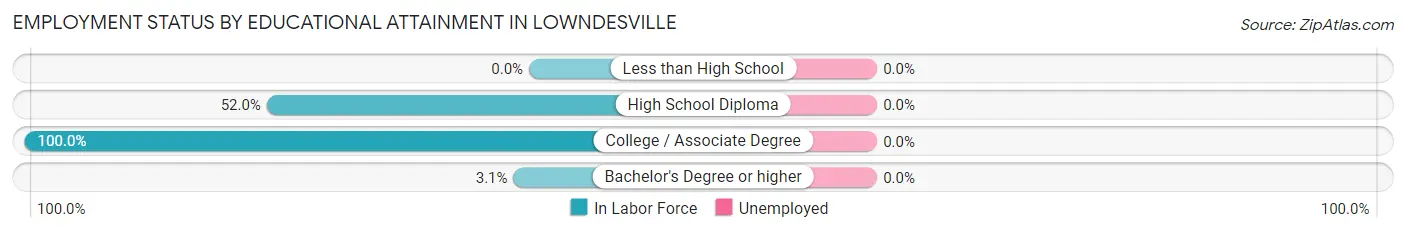
| Educational Attainment | In Labor Force | Unemployed |
| Less than High School | 0 (0.0%) | 0 (0.0%) |
| High School Diploma | 13 (52.0%) | 0 (0.0%) |
| College / Associate Degree | 37 (100.0%) | 0 (0.0%) |
| Bachelor's Degree or higher | 1 (3.1%) | 0 (0.0%) |
| Total | 51 (50.5%) | 0 (0.0%) |
Employment Occupations by Sex in Lowndesville
Management, Business, Science and Arts Occupations
The most common Management, Business, Science and Arts occupations in Lowndesville are Management (34 | 57.6%), Community & Social Service (5 | 8.5%), and Education, Arts & Media (5 | 8.5%).
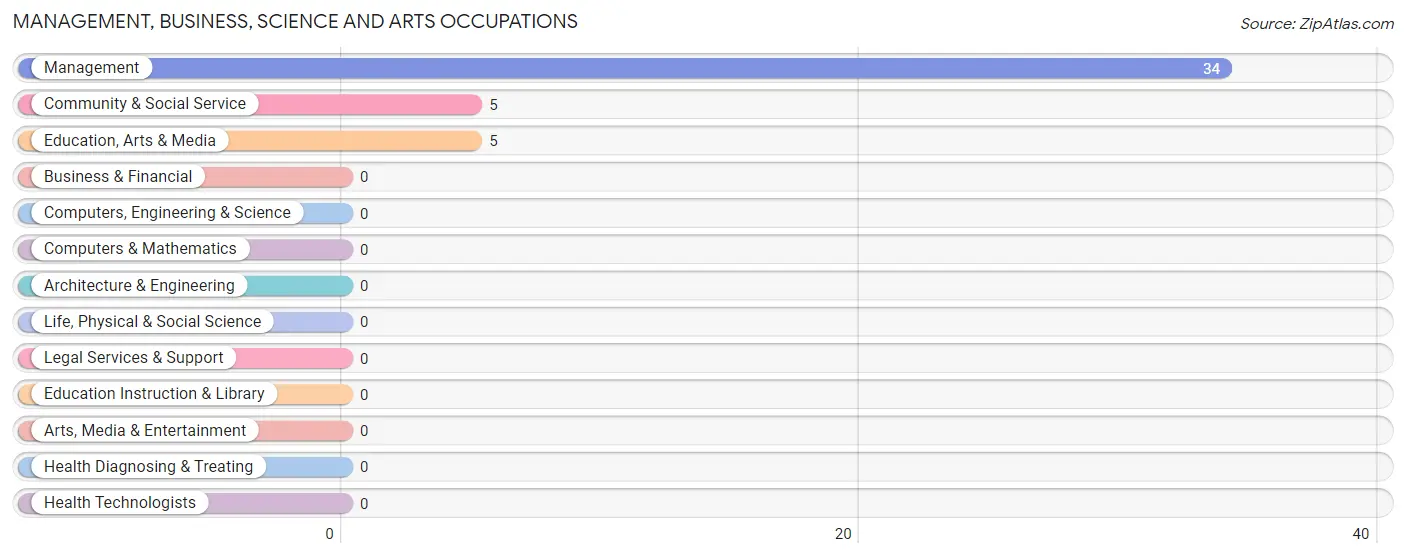
Management, Business, Science and Arts Occupations by Sex
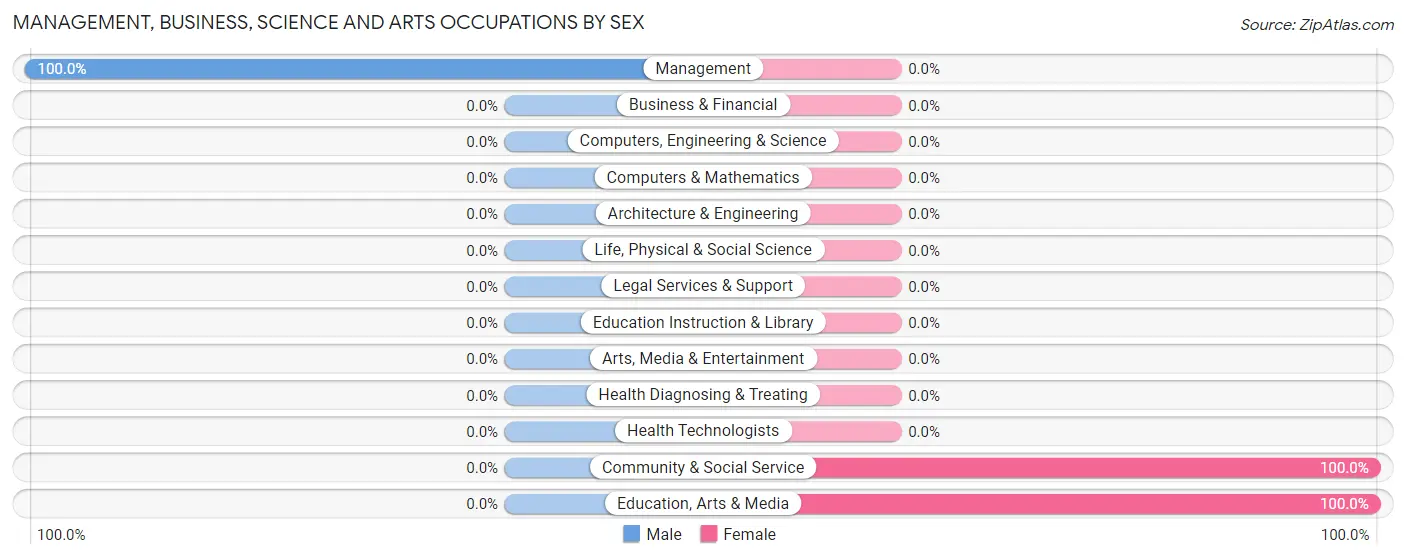
| Occupation | Male | Female |
| Management | 34 (100.0%) | 0 (0.0%) |
| Business & Financial | 0 (0.0%) | 0 (0.0%) |
| Computers, Engineering & Science | 0 (0.0%) | 0 (0.0%) |
| Computers & Mathematics | 0 (0.0%) | 0 (0.0%) |
| Architecture & Engineering | 0 (0.0%) | 0 (0.0%) |
| Life, Physical & Social Science | 0 (0.0%) | 0 (0.0%) |
| Community & Social Service | 0 (0.0%) | 5 (100.0%) |
| Education, Arts & Media | 0 (0.0%) | 5 (100.0%) |
| Legal Services & Support | 0 (0.0%) | 0 (0.0%) |
| Education Instruction & Library | 0 (0.0%) | 0 (0.0%) |
| Arts, Media & Entertainment | 0 (0.0%) | 0 (0.0%) |
| Health Diagnosing & Treating | 0 (0.0%) | 0 (0.0%) |
| Health Technologists | 0 (0.0%) | 0 (0.0%) |
| Total (Category) | 34 (87.2%) | 5 (12.8%) |
| Total (Overall) | 46 (78.0%) | 13 (22.0%) |
Services Occupations
The most common Services occupations in Lowndesville are , and Healthcare Support (3 | 5.1%).
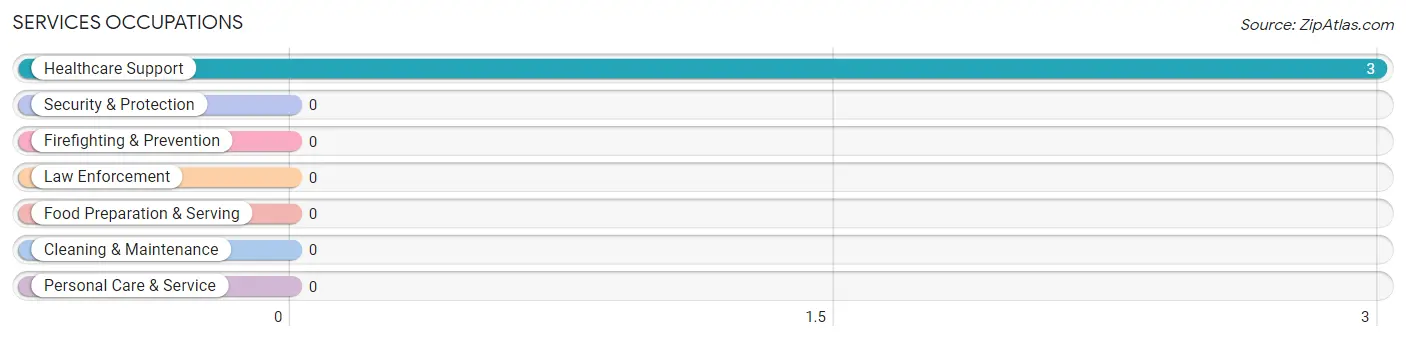
Services Occupations by Sex
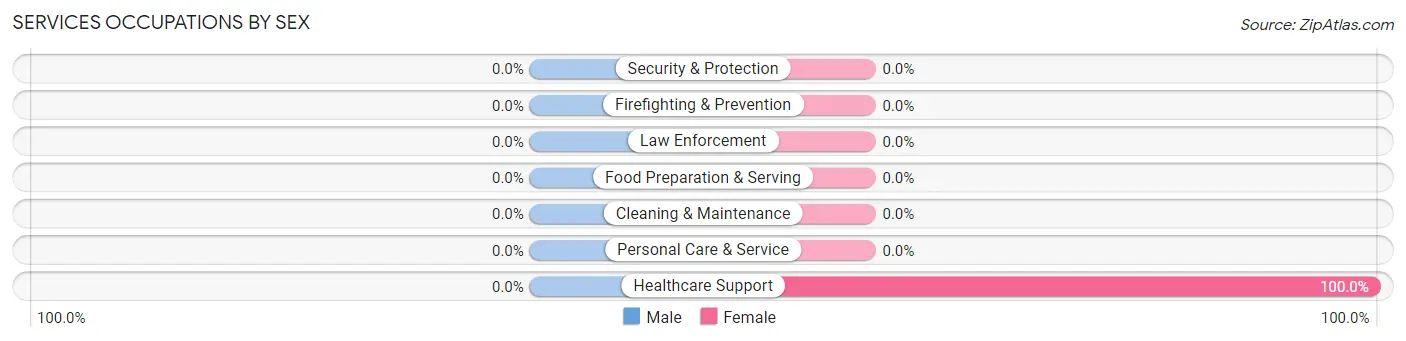
| Occupation | Male | Female |
| Healthcare Support | 0 (0.0%) | 3 (100.0%) |
| Security & Protection | 0 (0.0%) | 0 (0.0%) |
| Firefighting & Prevention | 0 (0.0%) | 0 (0.0%) |
| Law Enforcement | 0 (0.0%) | 0 (0.0%) |
| Food Preparation & Serving | 0 (0.0%) | 0 (0.0%) |
| Cleaning & Maintenance | 0 (0.0%) | 0 (0.0%) |
| Personal Care & Service | 0 (0.0%) | 0 (0.0%) |
| Total (Category) | 0 (0.0%) | 3 (100.0%) |
| Total (Overall) | 46 (78.0%) | 13 (22.0%) |
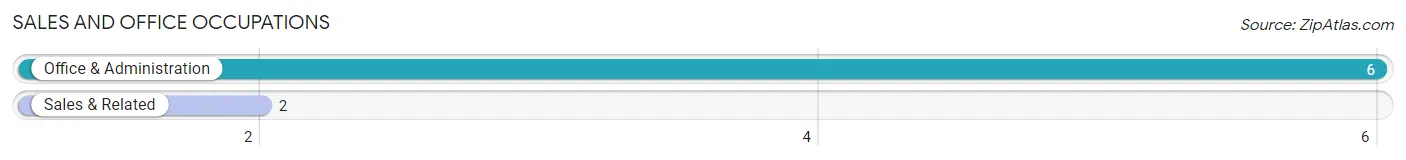
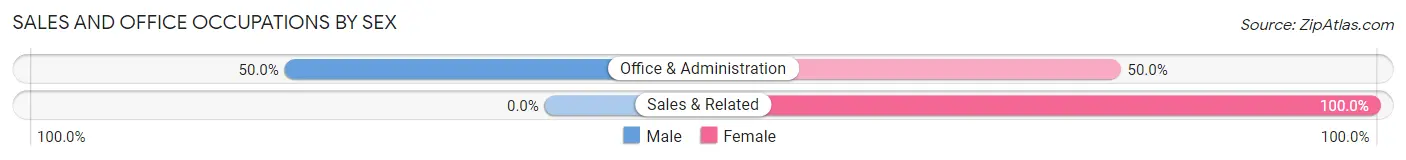
Sales and Office Occupations
The most common Sales and Office occupations in Lowndesville are Office & Administration (6 | 10.2%), and Sales & Related (2 | 3.4%).
Sales and Office Occupations by Sex
| Occupation | Male | Female |
| Sales & Related | 0 (0.0%) | 2 (100.0%) |
| Office & Administration | 3 (50.0%) | 3 (50.0%) |
| Total (Category) | 3 (37.5%) | 5 (62.5%) |
| Total (Overall) | 46 (78.0%) | 13 (22.0%) |
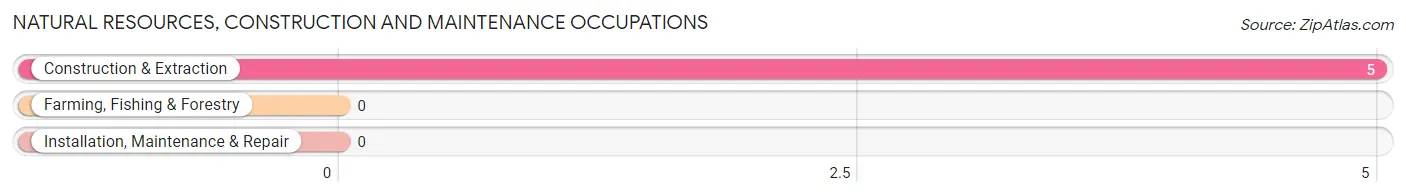
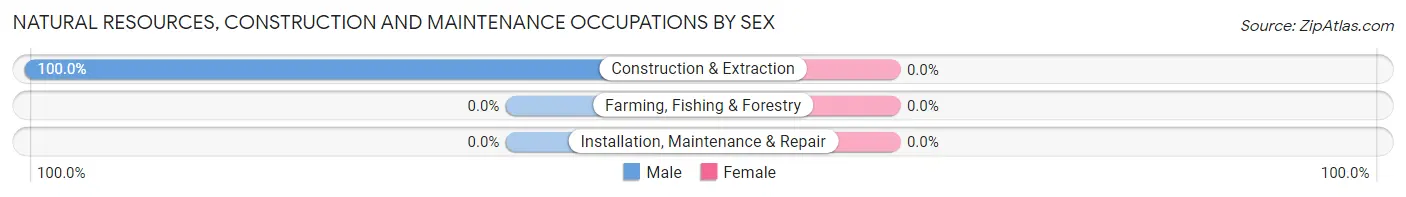
Natural Resources, Construction and Maintenance Occupations
The most common Natural Resources, Construction and Maintenance occupations in Lowndesville are , and Construction & Extraction (5 | 8.5%).
Natural Resources, Construction and Maintenance Occupations by Sex
| Occupation | Male | Female |
| Farming, Fishing & Forestry | 0 (0.0%) | 0 (0.0%) |
| Construction & Extraction | 5 (100.0%) | 0 (0.0%) |
| Installation, Maintenance & Repair | 0 (0.0%) | 0 (0.0%) |
| Total (Category) | 5 (100.0%) | 0 (0.0%) |
| Total (Overall) | 46 (78.0%) | 13 (22.0%) |
Production, Transportation and Moving Occupations
The most common Production, Transportation and Moving occupations in Lowndesville are Production (2 | 3.4%), and Transportation (2 | 3.4%).
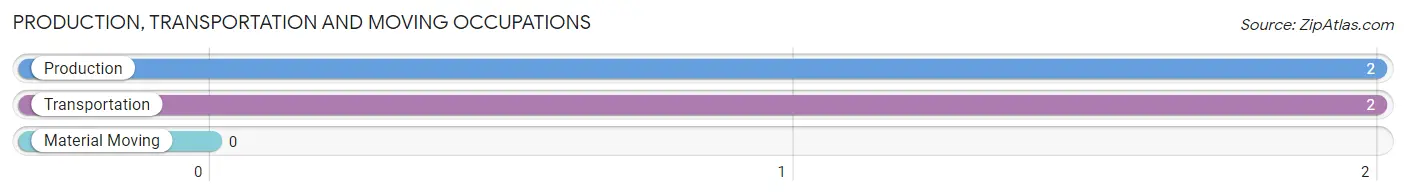
Production, Transportation and Moving Occupations by Sex
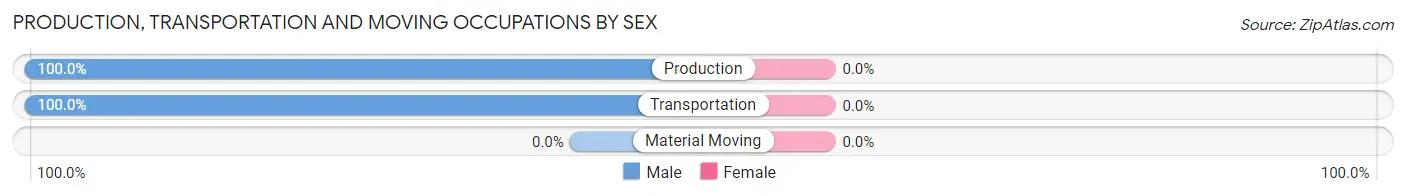
| Occupation | Male | Female |
| Production | 2 (100.0%) | 0 (0.0%) |
| Transportation | 2 (100.0%) | 0 (0.0%) |
| Material Moving | 0 (0.0%) | 0 (0.0%) |
| Total (Category) | 4 (100.0%) | 0 (0.0%) |
| Total (Overall) | 46 (78.0%) | 13 (22.0%) |
Employment Industries by Sex in Lowndesville
Employment Industries in Lowndesville
The major employment industries in Lowndesville include Professional & Scientific (28 | 47.5%), Manufacturing (6 | 10.2%), Public Administration (6 | 10.2%), Agriculture, Fishing & Hunting (5 | 8.5%), and Educational Services (5 | 8.5%).
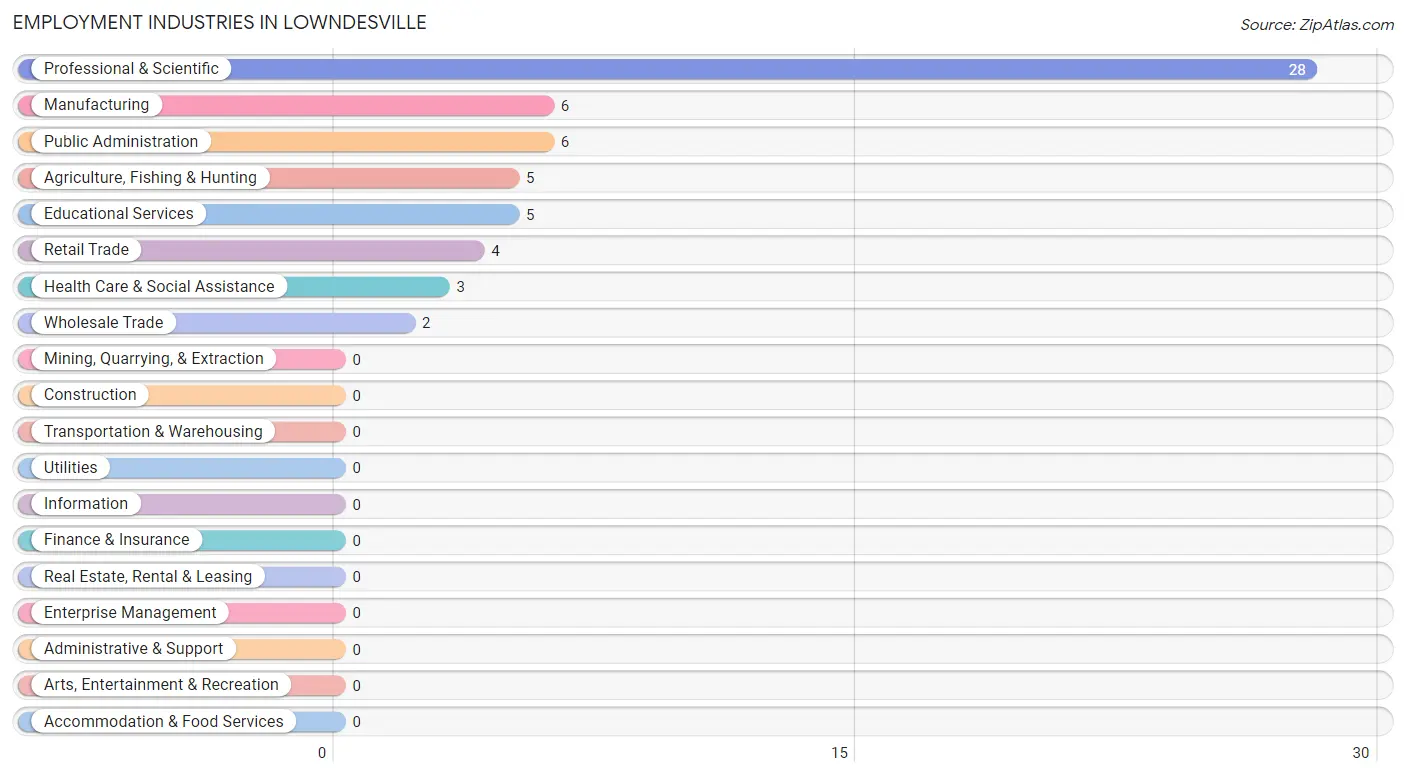
Employment Industries by Sex in Lowndesville
The Lowndesville industries that see more men than women are Agriculture, Fishing & Hunting (100.0%), Manufacturing (100.0%), and Wholesale Trade (100.0%), whereas the industries that tend to have a higher number of women are Retail Trade (100.0%), Educational Services (100.0%), and Health Care & Social Assistance (100.0%).
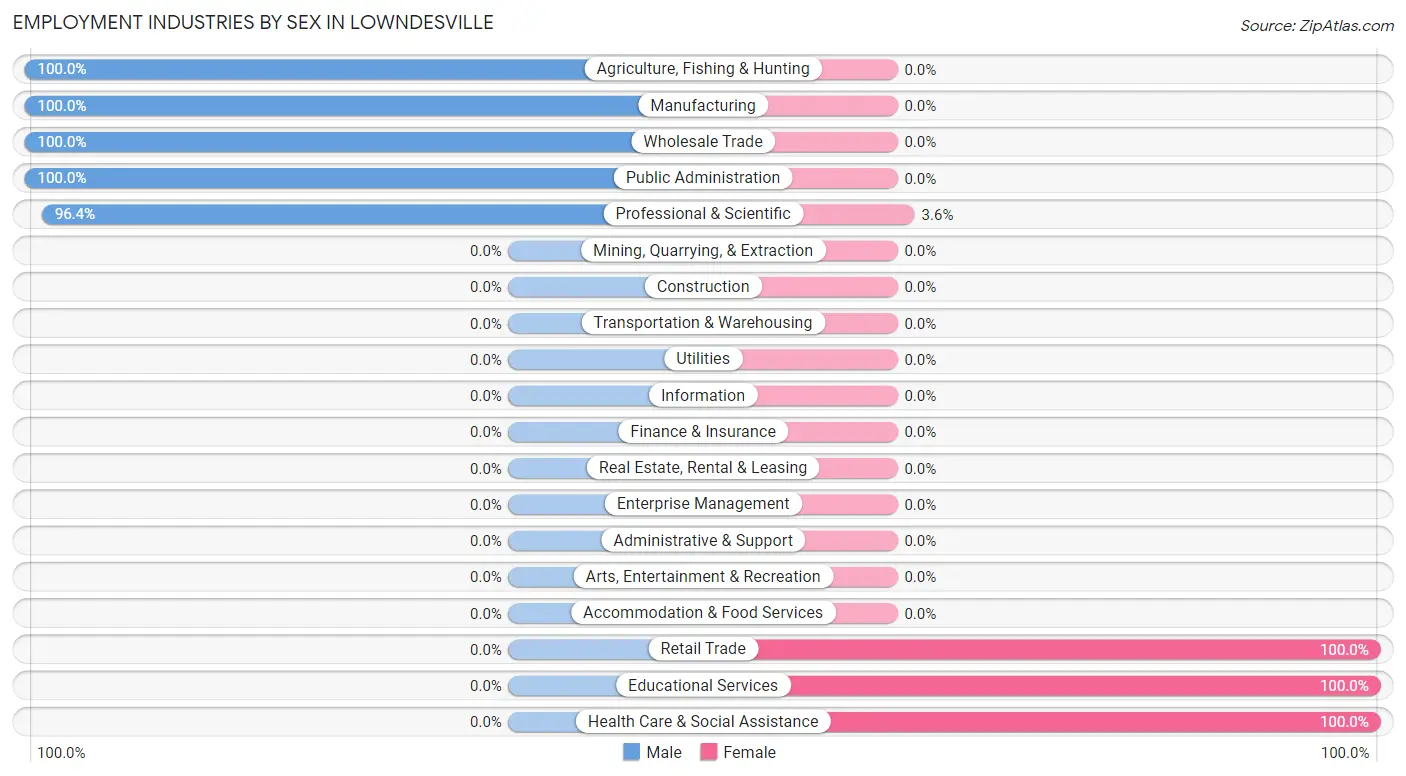
| Industry | Male | Female |
| Agriculture, Fishing & Hunting | 5 (100.0%) | 0 (0.0%) |
| Mining, Quarrying, & Extraction | 0 (0.0%) | 0 (0.0%) |
| Construction | 0 (0.0%) | 0 (0.0%) |
| Manufacturing | 6 (100.0%) | 0 (0.0%) |
| Wholesale Trade | 2 (100.0%) | 0 (0.0%) |
| Retail Trade | 0 (0.0%) | 4 (100.0%) |
| Transportation & Warehousing | 0 (0.0%) | 0 (0.0%) |
| Utilities | 0 (0.0%) | 0 (0.0%) |
| Information | 0 (0.0%) | 0 (0.0%) |
| Finance & Insurance | 0 (0.0%) | 0 (0.0%) |
| Real Estate, Rental & Leasing | 0 (0.0%) | 0 (0.0%) |
| Professional & Scientific | 27 (96.4%) | 1 (3.6%) |
| Enterprise Management | 0 (0.0%) | 0 (0.0%) |
| Administrative & Support | 0 (0.0%) | 0 (0.0%) |
| Educational Services | 0 (0.0%) | 5 (100.0%) |
| Health Care & Social Assistance | 0 (0.0%) | 3 (100.0%) |
| Arts, Entertainment & Recreation | 0 (0.0%) | 0 (0.0%) |
| Accommodation & Food Services | 0 (0.0%) | 0 (0.0%) |
| Public Administration | 6 (100.0%) | 0 (0.0%) |
| Total | 46 (78.0%) | 13 (22.0%) |
Education in Lowndesville
School Enrollment in Lowndesville
The most common levels of schooling among the 41 students in Lowndesville are high school (15 | 36.6%), kindergarten (11 | 26.8%), and middle school (9 | 22.0%).
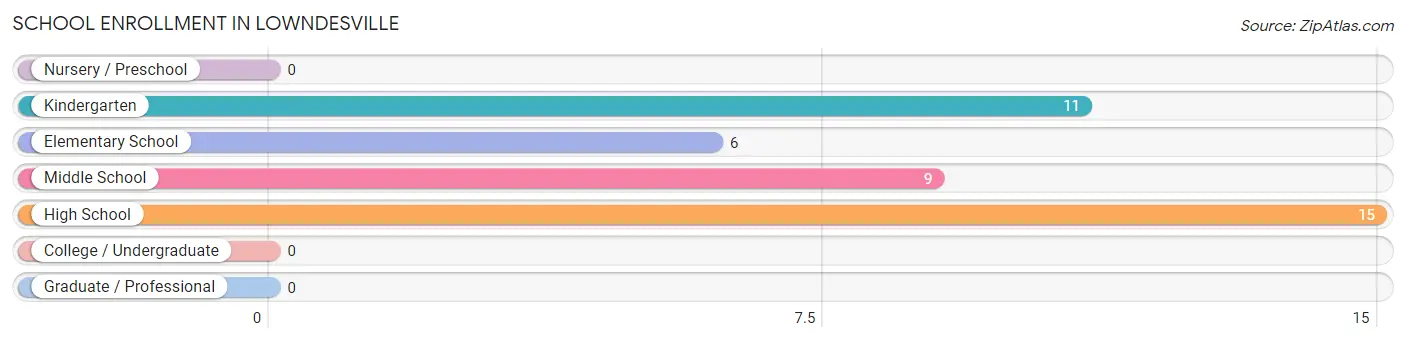
| School Level | # Students | % Students |
| Nursery / Preschool | 0 | 0.0% |
| Kindergarten | 11 | 26.8% |
| Elementary School | 6 | 14.6% |
| Middle School | 9 | 22.0% |
| High School | 15 | 36.6% |
| College / Undergraduate | 0 | 0.0% |
| Graduate / Professional | 0 | 0.0% |
| Total | 41 | 100.0% |
School Enrollment by Age by Funding Source in Lowndesville
Out of a total of 41 students who are enrolled in schools in Lowndesville, 8 (19.5%) attend a private institution, while the remaining 33 (80.5%) are enrolled in public schools. The age group of 15 to 17 year olds has the highest likelihood of being enrolled in private schools, with 8 (72.7% in the age bracket) enrolled. Conversely, the age group of 3 to 4 year olds has the lowest likelihood of being enrolled in a private school, with 11 (100.0% in the age bracket) attending a public institution.
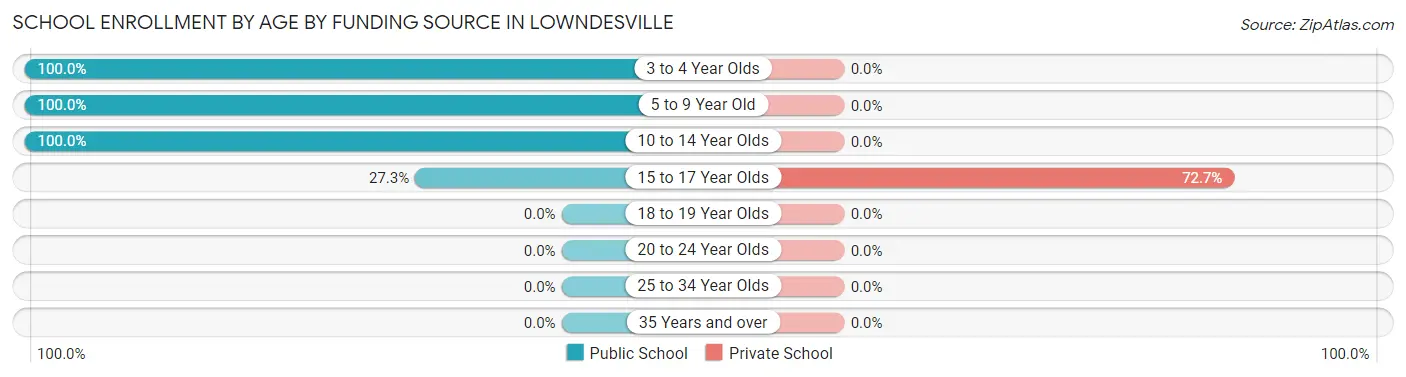
| Age Bracket | Public School | Private School |
| 3 to 4 Year Olds | 11 (100.0%) | 0 (0.0%) |
| 5 to 9 Year Old | 4 (100.0%) | 0 (0.0%) |
| 10 to 14 Year Olds | 15 (100.0%) | 0 (0.0%) |
| 15 to 17 Year Olds | 3 (27.3%) | 8 (72.7%) |
| 18 to 19 Year Olds | 0 (0.0%) | 0 (0.0%) |
| 20 to 24 Year Olds | 0 (0.0%) | 0 (0.0%) |
| 25 to 34 Year Olds | 0 (0.0%) | 0 (0.0%) |
| 35 Years and over | 0 (0.0%) | 0 (0.0%) |
| Total | 33 (80.5%) | 8 (19.5%) |
Educational Attainment by Field of Study in Lowndesville
Communications (26 | 81.2%), business (4 | 12.5%), psychology (1 | 3.1%), and engineering (1 | 3.1%) are the most common fields of study among 32 individuals in Lowndesville who have obtained a bachelor's degree or higher.
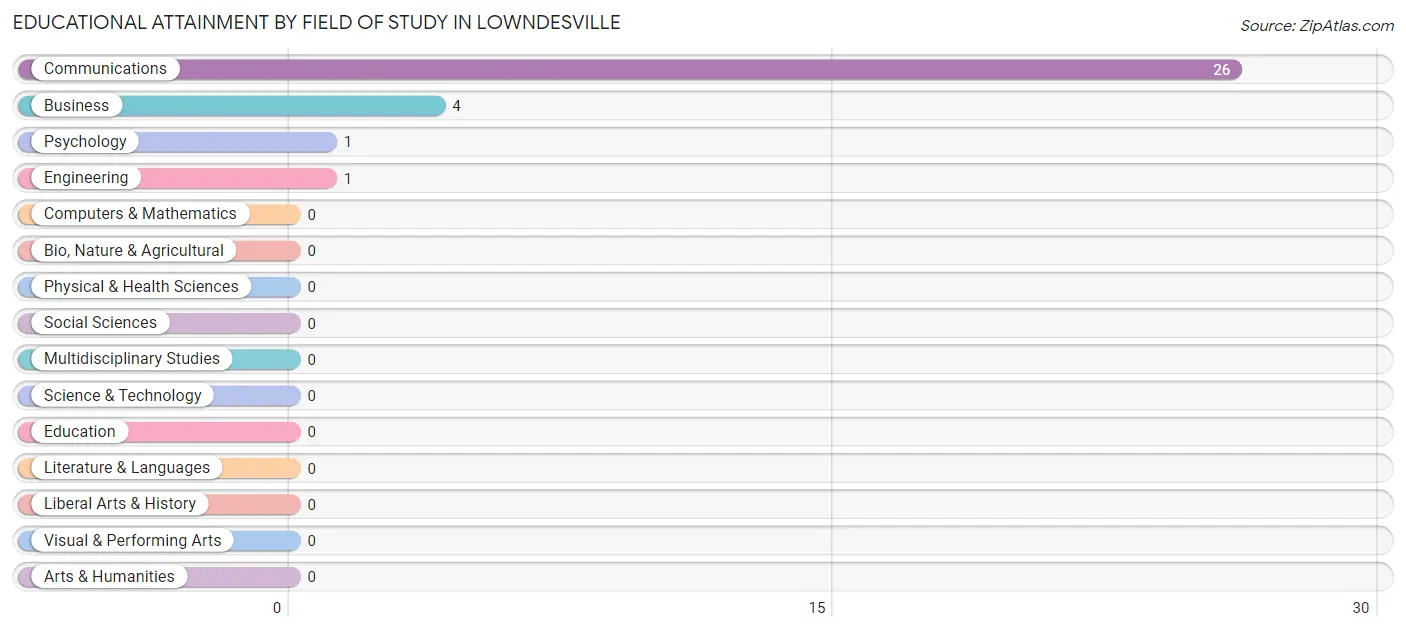
| Field of Study | # Graduates | % Graduates |
| Computers & Mathematics | 0 | 0.0% |
| Bio, Nature & Agricultural | 0 | 0.0% |
| Physical & Health Sciences | 0 | 0.0% |
| Psychology | 1 | 3.1% |
| Social Sciences | 0 | 0.0% |
| Engineering | 1 | 3.1% |
| Multidisciplinary Studies | 0 | 0.0% |
| Science & Technology | 0 | 0.0% |
| Business | 4 | 12.5% |
| Education | 0 | 0.0% |
| Literature & Languages | 0 | 0.0% |
| Liberal Arts & History | 0 | 0.0% |
| Visual & Performing Arts | 0 | 0.0% |
| Communications | 26 | 81.2% |
| Arts & Humanities | 0 | 0.0% |
| Total | 32 | 100.0% |
Transportation & Commute in Lowndesville
Vehicle Availability by Sex in Lowndesville
The most prevalent vehicle ownership categories in Lowndesville are males with 5 or more vehicles (27, accounting for 65.8%) and females with 5 or more vehicles (0, making up 207.7%).
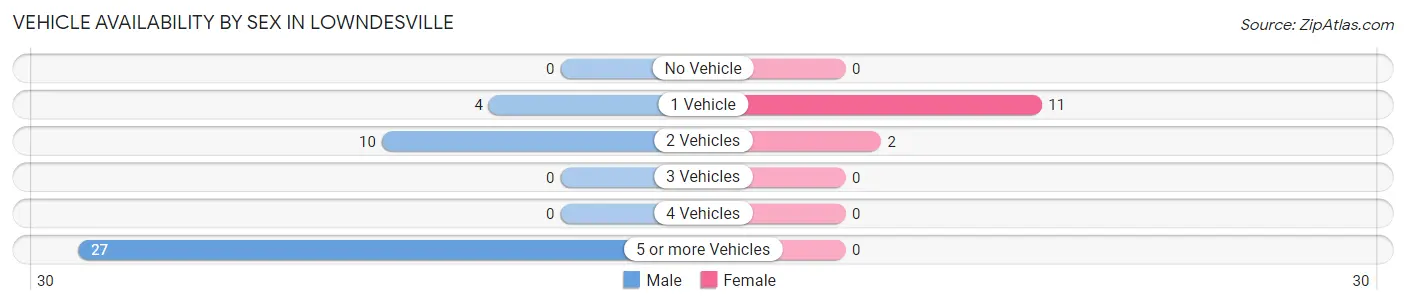
| Vehicles Available | Male | Female |
| No Vehicle | 0 (0.0%) | 0 (0.0%) |
| 1 Vehicle | 4 (9.8%) | 11 (84.6%) |
| 2 Vehicles | 10 (24.4%) | 2 (15.4%) |
| 3 Vehicles | 0 (0.0%) | 0 (0.0%) |
| 4 Vehicles | 0 (0.0%) | 0 (0.0%) |
| 5 or more Vehicles | 27 (65.8%) | 0 (0.0%) |
| Total | 41 (100.0%) | 13 (100.0%) |
Commute Time in Lowndesville
The most frequently occuring commute durations in Lowndesville are 45 to 59 minutes (37 commuters, 68.5%), less than 5 minutes (7 commuters, 13.0%), and 25 to 29 minutes (3 commuters, 5.6%).
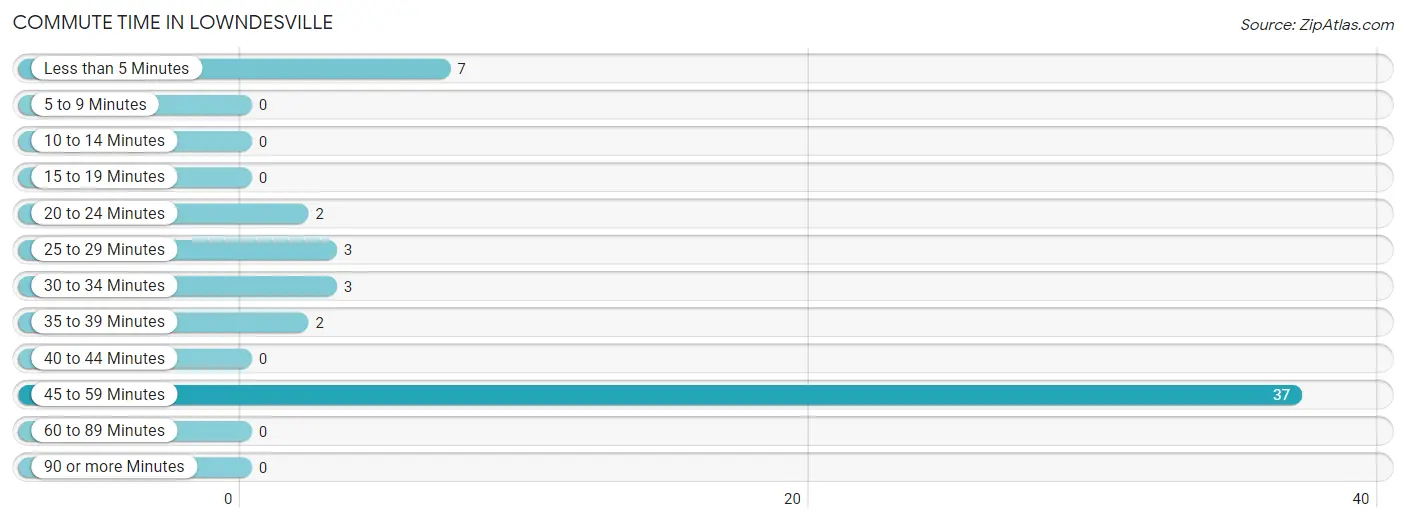
| Commute Time | # Commuters | % Commuters |
| Less than 5 Minutes | 7 | 13.0% |
| 5 to 9 Minutes | 0 | 0.0% |
| 10 to 14 Minutes | 0 | 0.0% |
| 15 to 19 Minutes | 0 | 0.0% |
| 20 to 24 Minutes | 2 | 3.7% |
| 25 to 29 Minutes | 3 | 5.6% |
| 30 to 34 Minutes | 3 | 5.6% |
| 35 to 39 Minutes | 2 | 3.7% |
| 40 to 44 Minutes | 0 | 0.0% |
| 45 to 59 Minutes | 37 | 68.5% |
| 60 to 89 Minutes | 0 | 0.0% |
| 90 or more Minutes | 0 | 0.0% |
Commute Time by Sex in Lowndesville
The most common commute times in Lowndesville are 45 to 59 minutes (27 commuters, 65.8%) for males and 45 to 59 minutes (10 commuters, 76.9%) for females.
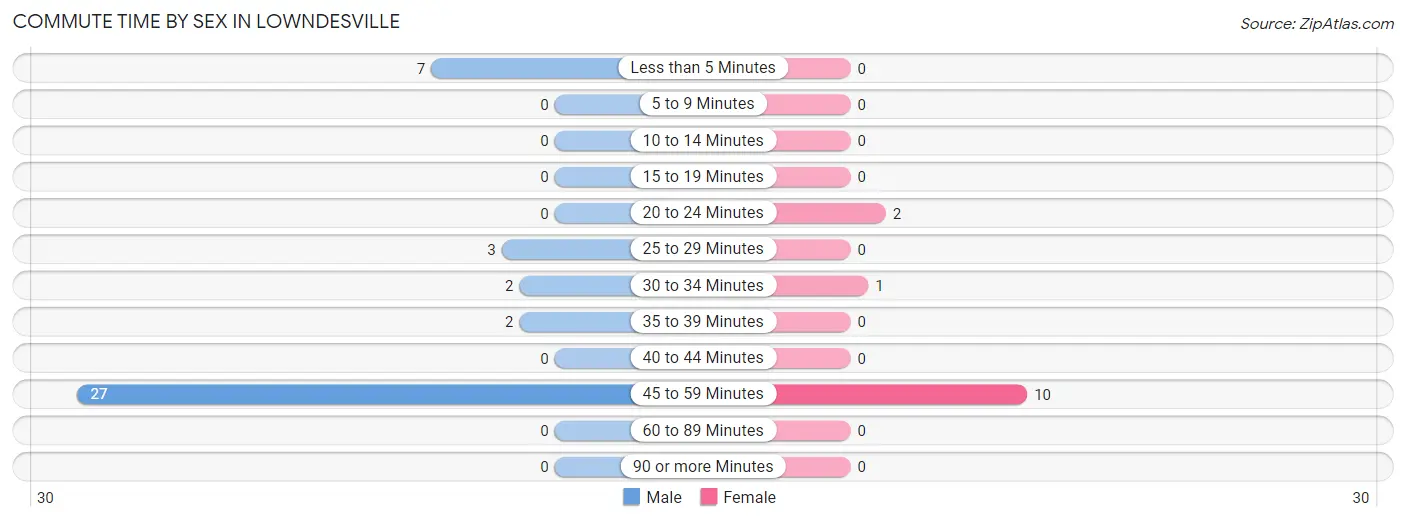
| Commute Time | Male | Female |
| Less than 5 Minutes | 7 (17.1%) | 0 (0.0%) |
| 5 to 9 Minutes | 0 (0.0%) | 0 (0.0%) |
| 10 to 14 Minutes | 0 (0.0%) | 0 (0.0%) |
| 15 to 19 Minutes | 0 (0.0%) | 0 (0.0%) |
| 20 to 24 Minutes | 0 (0.0%) | 2 (15.4%) |
| 25 to 29 Minutes | 3 (7.3%) | 0 (0.0%) |
| 30 to 34 Minutes | 2 (4.9%) | 1 (7.7%) |
| 35 to 39 Minutes | 2 (4.9%) | 0 (0.0%) |
| 40 to 44 Minutes | 0 (0.0%) | 0 (0.0%) |
| 45 to 59 Minutes | 27 (65.8%) | 10 (76.9%) |
| 60 to 89 Minutes | 0 (0.0%) | 0 (0.0%) |
| 90 or more Minutes | 0 (0.0%) | 0 (0.0%) |
Time of Departure to Work by Sex in Lowndesville
The most frequent times of departure to work in Lowndesville are 6:00 AM to 6:29 AM (27, 65.8%) for males and 6:30 AM to 6:59 AM (5, 38.5%) for females.
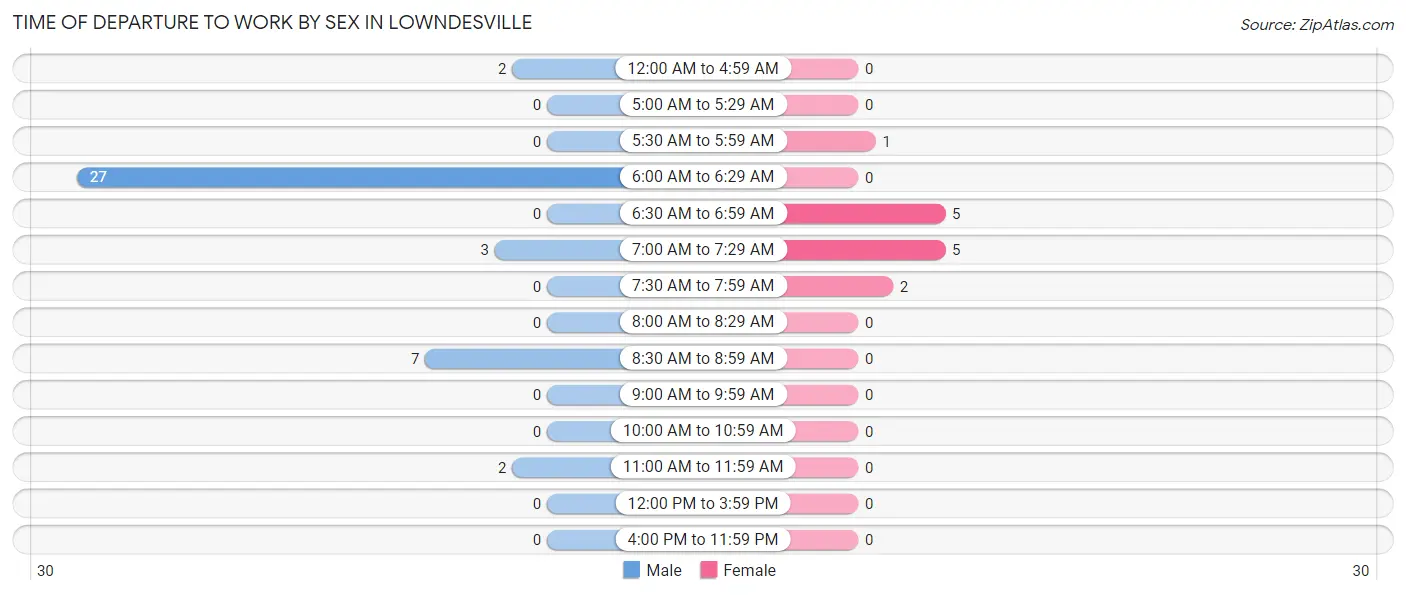
| Time of Departure | Male | Female |
| 12:00 AM to 4:59 AM | 2 (4.9%) | 0 (0.0%) |
| 5:00 AM to 5:29 AM | 0 (0.0%) | 0 (0.0%) |
| 5:30 AM to 5:59 AM | 0 (0.0%) | 1 (7.7%) |
| 6:00 AM to 6:29 AM | 27 (65.8%) | 0 (0.0%) |
| 6:30 AM to 6:59 AM | 0 (0.0%) | 5 (38.5%) |
| 7:00 AM to 7:29 AM | 3 (7.3%) | 5 (38.5%) |
| 7:30 AM to 7:59 AM | 0 (0.0%) | 2 (15.4%) |
| 8:00 AM to 8:29 AM | 0 (0.0%) | 0 (0.0%) |
| 8:30 AM to 8:59 AM | 7 (17.1%) | 0 (0.0%) |
| 9:00 AM to 9:59 AM | 0 (0.0%) | 0 (0.0%) |
| 10:00 AM to 10:59 AM | 0 (0.0%) | 0 (0.0%) |
| 11:00 AM to 11:59 AM | 2 (4.9%) | 0 (0.0%) |
| 12:00 PM to 3:59 PM | 0 (0.0%) | 0 (0.0%) |
| 4:00 PM to 11:59 PM | 0 (0.0%) | 0 (0.0%) |
| Total | 41 (100.0%) | 13 (100.0%) |
Housing Occupancy in Lowndesville
Occupancy by Ownership in Lowndesville
Of the total 85 dwellings in Lowndesville, owner-occupied units account for 57 (67.1%), while renter-occupied units make up 28 (32.9%).
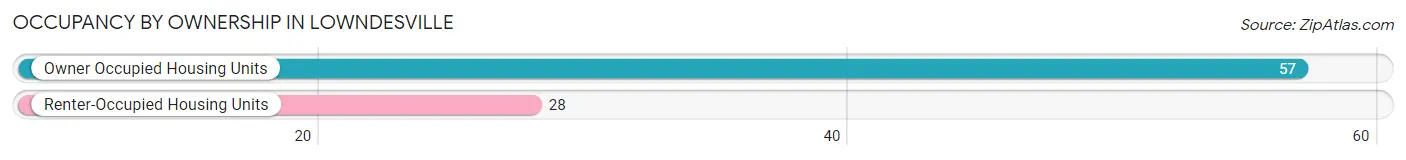
| Occupancy | # Housing Units | % Housing Units |
| Owner Occupied Housing Units | 57 | 67.1% |
| Renter-Occupied Housing Units | 28 | 32.9% |
| Total Occupied Housing Units | 85 | 100.0% |
Occupancy by Household Size in Lowndesville
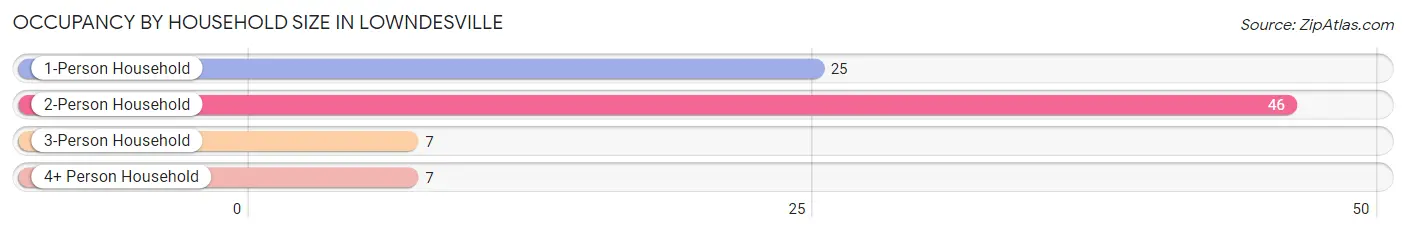
| Household Size | # Housing Units | % Housing Units |
| 1-Person Household | 25 | 29.4% |
| 2-Person Household | 46 | 54.1% |
| 3-Person Household | 7 | 8.2% |
| 4+ Person Household | 7 | 8.2% |
| Total Housing Units | 85 | 100.0% |
Occupancy by Ownership by Household Size in Lowndesville
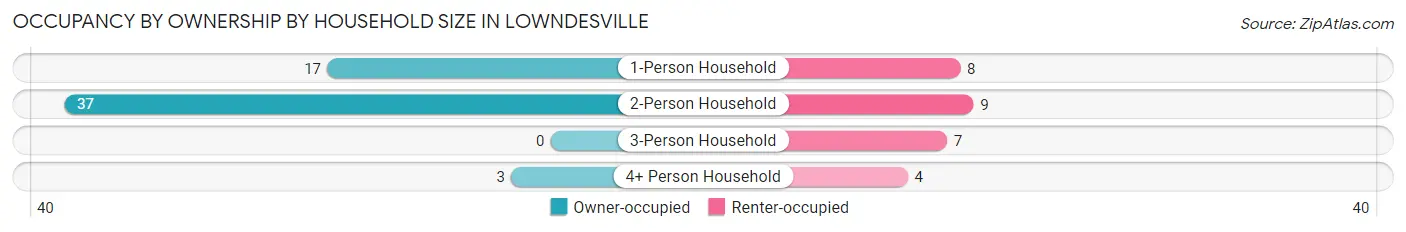
| Household Size | Owner-occupied | Renter-occupied |
| 1-Person Household | 17 (68.0%) | 8 (32.0%) |
| 2-Person Household | 37 (80.4%) | 9 (19.6%) |
| 3-Person Household | 0 (0.0%) | 7 (100.0%) |
| 4+ Person Household | 3 (42.9%) | 4 (57.1%) |
| Total Housing Units | 57 (67.1%) | 28 (32.9%) |
Occupancy by Educational Attainment in Lowndesville
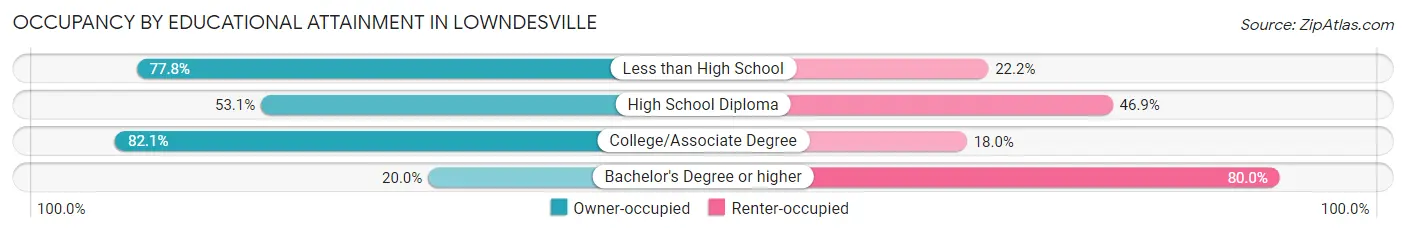
| Household Size | Owner-occupied | Renter-occupied |
| Less than High School | 7 (77.8%) | 2 (22.2%) |
| High School Diploma | 17 (53.1%) | 15 (46.9%) |
| College/Associate Degree | 32 (82.1%) | 7 (17.9%) |
| Bachelor's Degree or higher | 1 (20.0%) | 4 (80.0%) |
Occupancy by Age of Householder in Lowndesville
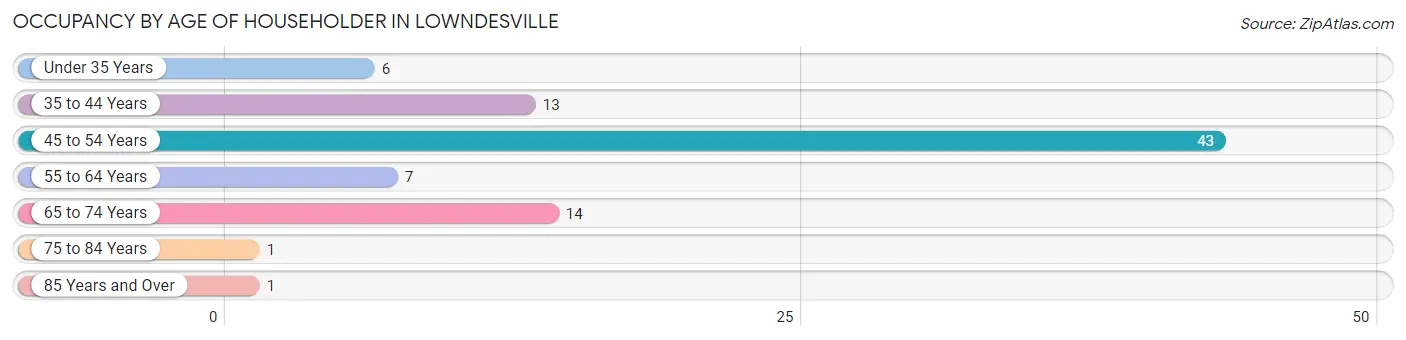
| Age Bracket | # Households | % Households |
| Under 35 Years | 6 | 7.1% |
| 35 to 44 Years | 13 | 15.3% |
| 45 to 54 Years | 43 | 50.6% |
| 55 to 64 Years | 7 | 8.2% |
| 65 to 74 Years | 14 | 16.5% |
| 75 to 84 Years | 1 | 1.2% |
| 85 Years and Over | 1 | 1.2% |
| Total | 85 | 100.0% |
Housing Finances in Lowndesville
Median Income by Occupancy in Lowndesville
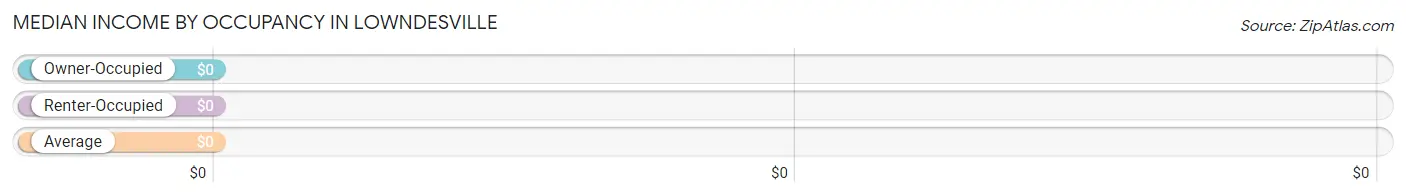
| Occupancy Type | # Households | Median Income |
| Owner-Occupied | 57 (67.1%) | $0 |
| Renter-Occupied | 28 (32.9%) | $0 |
| Average | 85 (100.0%) | $0 |
Occupancy by Householder Income Bracket in Lowndesville
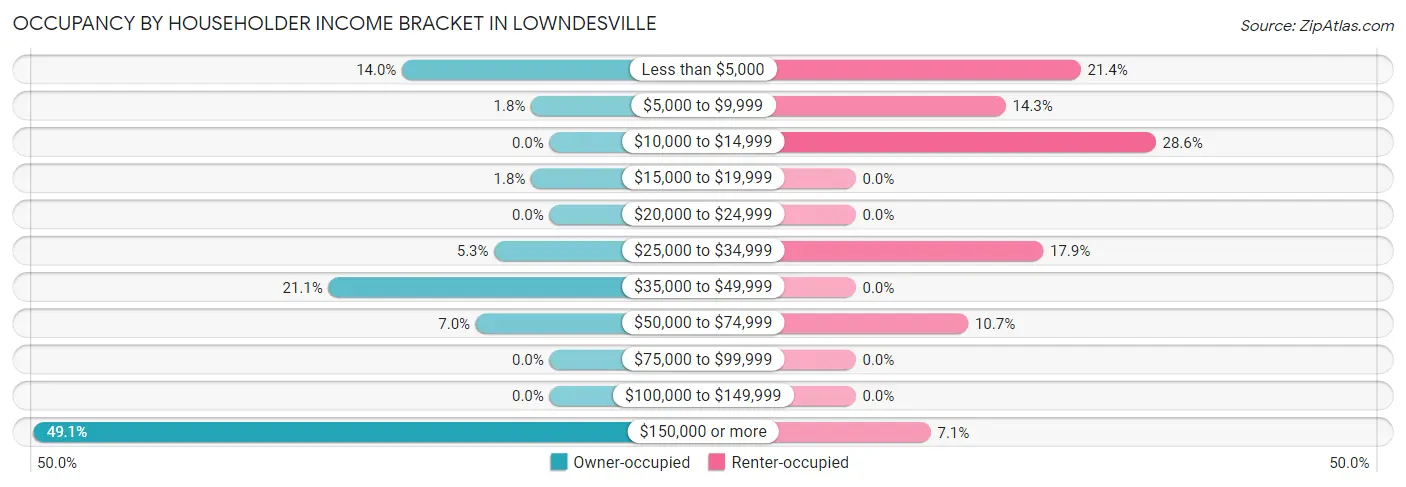
| Income Bracket | Owner-occupied | Renter-occupied |
| Less than $5,000 | 8 (14.0%) | 6 (21.4%) |
| $5,000 to $9,999 | 1 (1.8%) | 4 (14.3%) |
| $10,000 to $14,999 | 0 (0.0%) | 8 (28.6%) |
| $15,000 to $19,999 | 1 (1.8%) | 0 (0.0%) |
| $20,000 to $24,999 | 0 (0.0%) | 0 (0.0%) |
| $25,000 to $34,999 | 3 (5.3%) | 5 (17.9%) |
| $35,000 to $49,999 | 12 (21.0%) | 0 (0.0%) |
| $50,000 to $74,999 | 4 (7.0%) | 3 (10.7%) |
| $75,000 to $99,999 | 0 (0.0%) | 0 (0.0%) |
| $100,000 to $149,999 | 0 (0.0%) | 0 (0.0%) |
| $150,000 or more | 28 (49.1%) | 2 (7.1%) |
| Total | 57 (100.0%) | 28 (100.0%) |
Monthly Housing Cost Tiers in Lowndesville
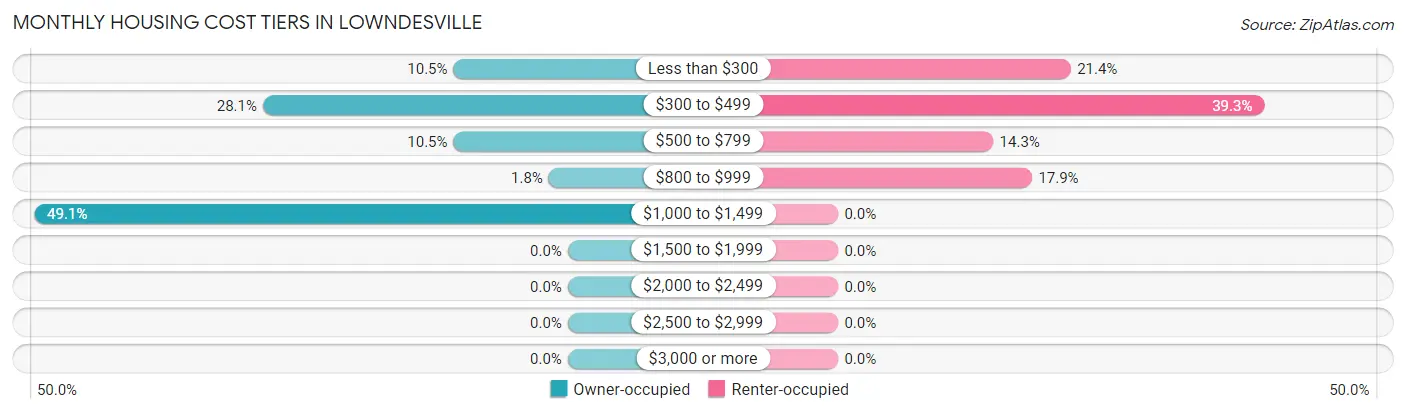
| Monthly Cost | Owner-occupied | Renter-occupied |
| Less than $300 | 6 (10.5%) | 6 (21.4%) |
| $300 to $499 | 16 (28.1%) | 11 (39.3%) |
| $500 to $799 | 6 (10.5%) | 4 (14.3%) |
| $800 to $999 | 1 (1.8%) | 5 (17.9%) |
| $1,000 to $1,499 | 28 (49.1%) | 0 (0.0%) |
| $1,500 to $1,999 | 0 (0.0%) | 0 (0.0%) |
| $2,000 to $2,499 | 0 (0.0%) | 0 (0.0%) |
| $2,500 to $2,999 | 0 (0.0%) | 0 (0.0%) |
| $3,000 or more | 0 (0.0%) | 0 (0.0%) |
| Total | 57 (100.0%) | 28 (100.0%) |
Physical Housing Characteristics in Lowndesville
Housing Structures in Lowndesville
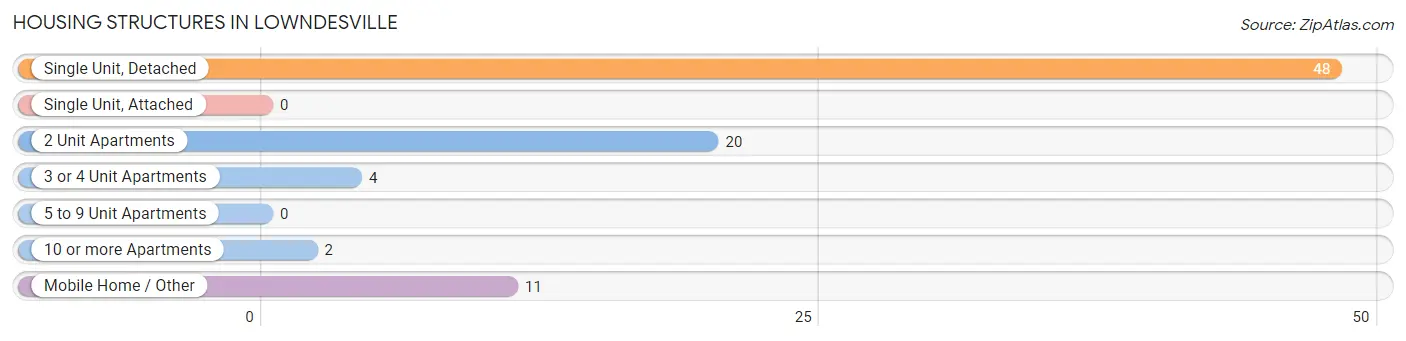
| Structure Type | # Housing Units | % Housing Units |
| Single Unit, Detached | 48 | 56.5% |
| Single Unit, Attached | 0 | 0.0% |
| 2 Unit Apartments | 20 | 23.5% |
| 3 or 4 Unit Apartments | 4 | 4.7% |
| 5 to 9 Unit Apartments | 0 | 0.0% |
| 10 or more Apartments | 2 | 2.4% |
| Mobile Home / Other | 11 | 12.9% |
| Total | 85 | 100.0% |
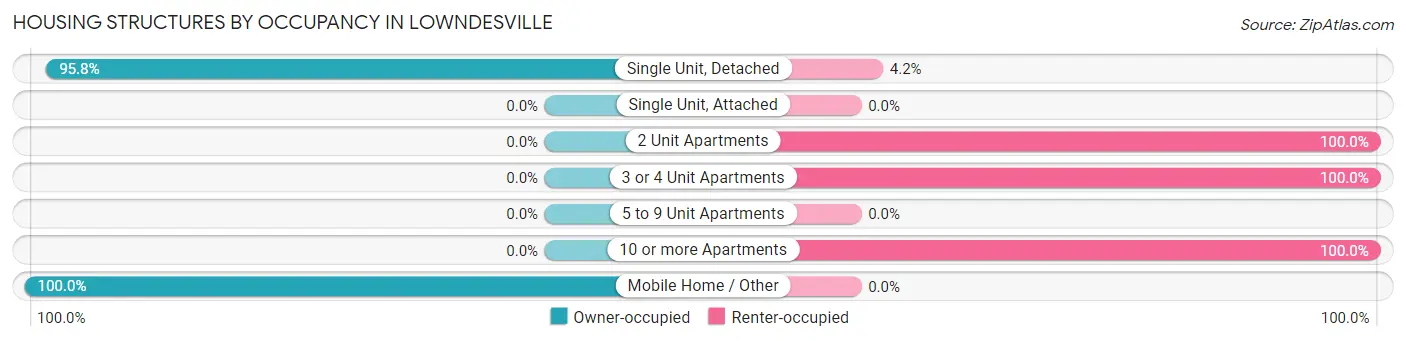
Housing Structures by Occupancy in Lowndesville
| Structure Type | Owner-occupied | Renter-occupied |
| Single Unit, Detached | 46 (95.8%) | 2 (4.2%) |
| Single Unit, Attached | 0 (0.0%) | 0 (0.0%) |
| 2 Unit Apartments | 0 (0.0%) | 20 (100.0%) |
| 3 or 4 Unit Apartments | 0 (0.0%) | 4 (100.0%) |
| 5 to 9 Unit Apartments | 0 (0.0%) | 0 (0.0%) |
| 10 or more Apartments | 0 (0.0%) | 2 (100.0%) |
| Mobile Home / Other | 11 (100.0%) | 0 (0.0%) |
| Total | 57 (67.1%) | 28 (32.9%) |
Housing Structures by Number of Rooms in Lowndesville
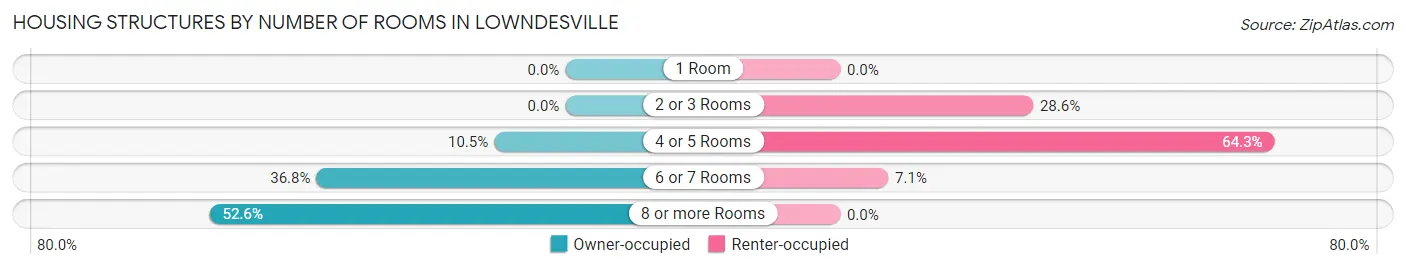
| Number of Rooms | Owner-occupied | Renter-occupied |
| 1 Room | 0 (0.0%) | 0 (0.0%) |
| 2 or 3 Rooms | 0 (0.0%) | 8 (28.6%) |
| 4 or 5 Rooms | 6 (10.5%) | 18 (64.3%) |
| 6 or 7 Rooms | 21 (36.8%) | 2 (7.1%) |
| 8 or more Rooms | 30 (52.6%) | 0 (0.0%) |
| Total | 57 (100.0%) | 28 (100.0%) |
Housing Structure by Heating Type in Lowndesville
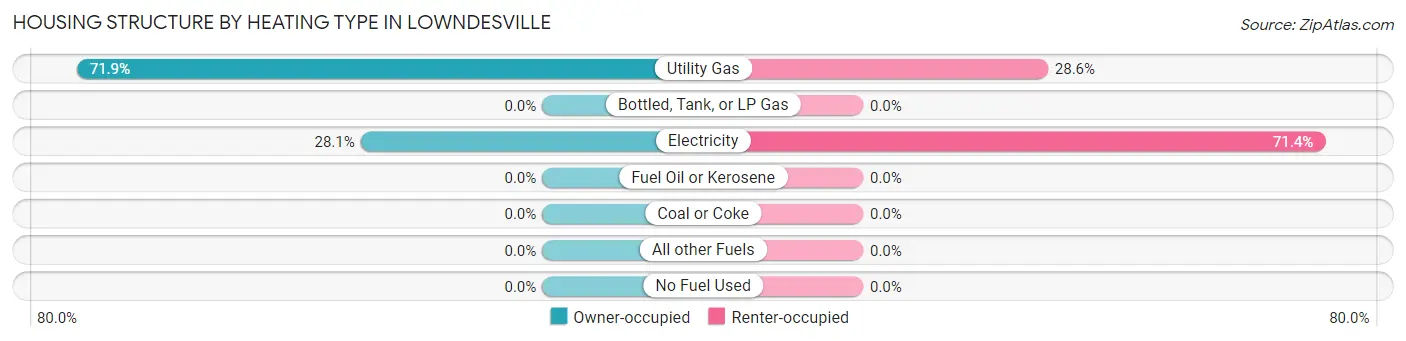
| Heating Type | Owner-occupied | Renter-occupied |
| Utility Gas | 41 (71.9%) | 8 (28.6%) |
| Bottled, Tank, or LP Gas | 0 (0.0%) | 0 (0.0%) |
| Electricity | 16 (28.1%) | 20 (71.4%) |
| Fuel Oil or Kerosene | 0 (0.0%) | 0 (0.0%) |
| Coal or Coke | 0 (0.0%) | 0 (0.0%) |
| All other Fuels | 0 (0.0%) | 0 (0.0%) |
| No Fuel Used | 0 (0.0%) | 0 (0.0%) |
| Total | 57 (100.0%) | 28 (100.0%) |
Household Vehicle Usage in Lowndesville
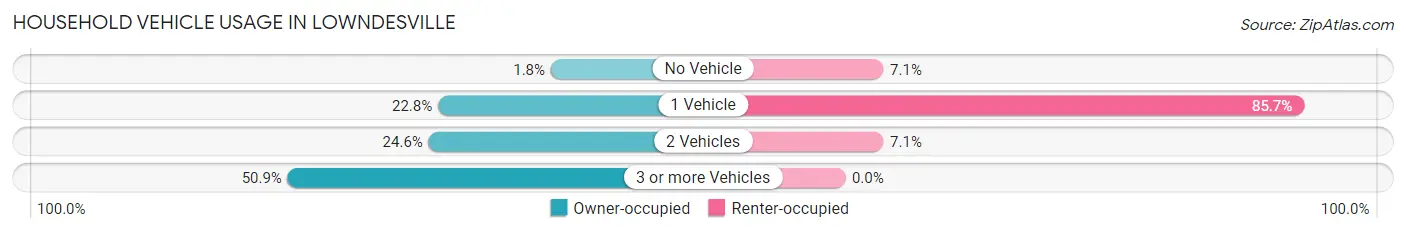
| Vehicles per Household | Owner-occupied | Renter-occupied |
| No Vehicle | 1 (1.8%) | 2 (7.1%) |
| 1 Vehicle | 13 (22.8%) | 24 (85.7%) |
| 2 Vehicles | 14 (24.6%) | 2 (7.1%) |
| 3 or more Vehicles | 29 (50.9%) | 0 (0.0%) |
| Total | 57 (100.0%) | 28 (100.0%) |
Real Estate & Mortgages in Lowndesville
Real Estate and Mortgage Overview in Lowndesville
| Characteristic | Without Mortgage | With Mortgage |
| Housing Units | 52 | 5 |
| Median Property Value | - | - |
| Median Household Income | $250,001 | $0 |
| Monthly Housing Costs | - | - |
| Real Estate Taxes | - | - |
Property Value by Mortgage Status in Lowndesville
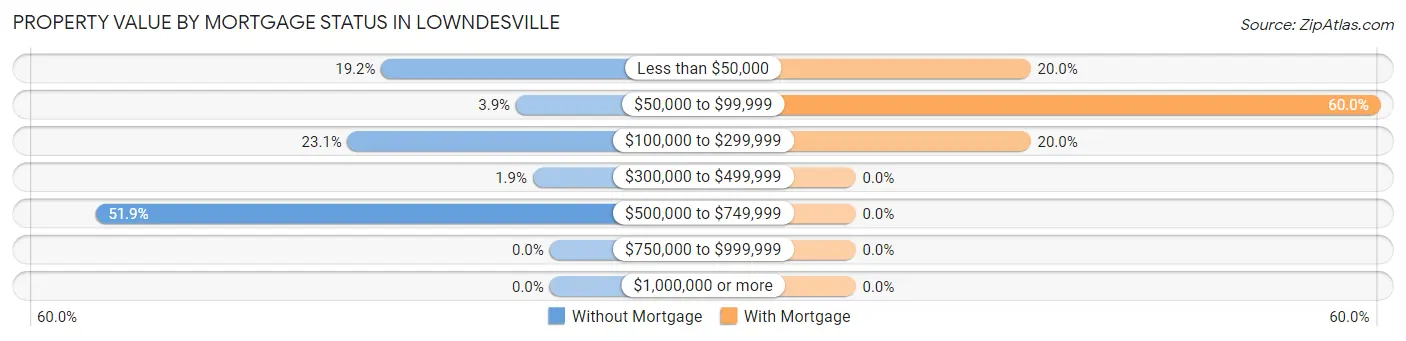
| Property Value | Without Mortgage | With Mortgage |
| Less than $50,000 | 10 (19.2%) | 1 (20.0%) |
| $50,000 to $99,999 | 2 (3.8%) | 3 (60.0%) |
| $100,000 to $299,999 | 12 (23.1%) | 1 (20.0%) |
| $300,000 to $499,999 | 1 (1.9%) | 0 (0.0%) |
| $500,000 to $749,999 | 27 (51.9%) | 0 (0.0%) |
| $750,000 to $999,999 | 0 (0.0%) | 0 (0.0%) |
| $1,000,000 or more | 0 (0.0%) | 0 (0.0%) |
| Total | 52 (100.0%) | 5 (100.0%) |
Household Income by Mortgage Status in Lowndesville
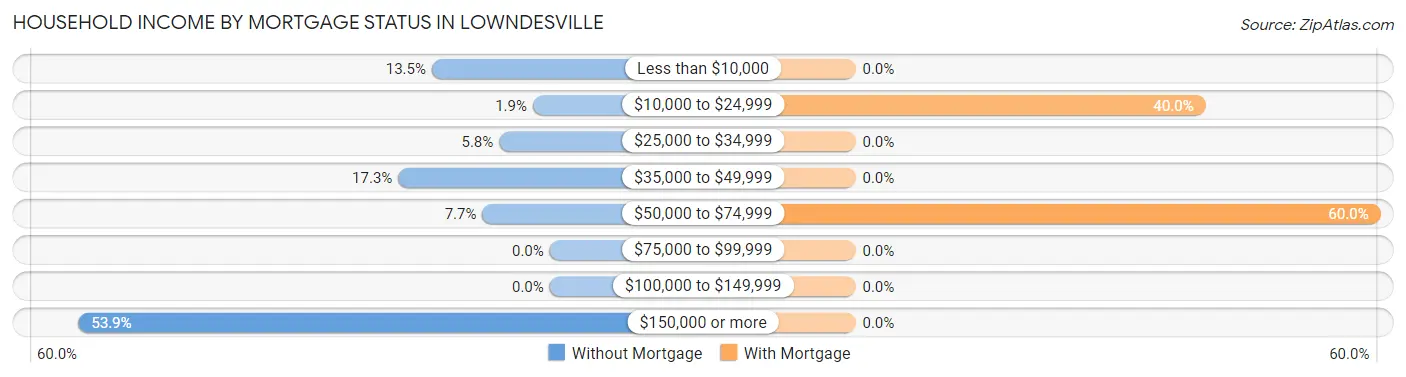
| Household Income | Without Mortgage | With Mortgage |
| Less than $10,000 | 7 (13.5%) | 0 (0.0%) |
| $10,000 to $24,999 | 1 (1.9%) | 2 (40.0%) |
| $25,000 to $34,999 | 3 (5.8%) | 0 (0.0%) |
| $35,000 to $49,999 | 9 (17.3%) | 0 (0.0%) |
| $50,000 to $74,999 | 4 (7.7%) | 3 (60.0%) |
| $75,000 to $99,999 | 0 (0.0%) | 0 (0.0%) |
| $100,000 to $149,999 | 0 (0.0%) | 0 (0.0%) |
| $150,000 or more | 28 (53.8%) | 0 (0.0%) |
| Total | 52 (100.0%) | 5 (100.0%) |
Property Value to Household Income Ratio in Lowndesville
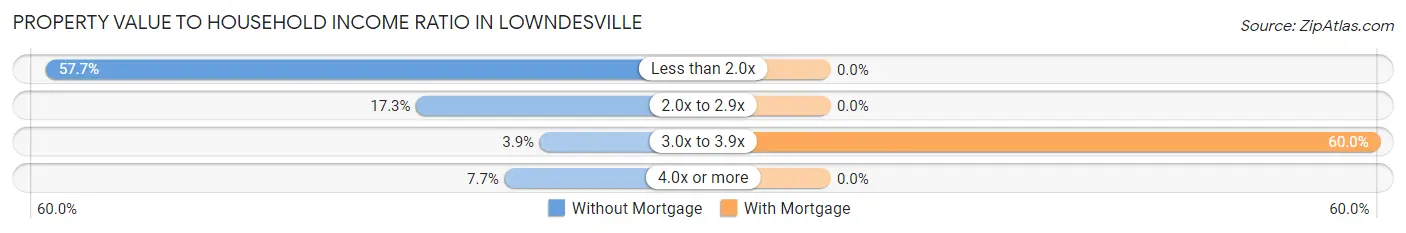
| Value-to-Income Ratio | Without Mortgage | With Mortgage |
| Less than 2.0x | 30 (57.7%) | 0 (0.0%) |
| 2.0x to 2.9x | 9 (17.3%) | 0 (0.0%) |
| 3.0x to 3.9x | 2 (3.8%) | 3 (60.0%) |
| 4.0x or more | 4 (7.7%) | 0 (0.0%) |
| Total | 52 (100.0%) | 5 (100.0%) |
Real Estate Taxes by Mortgage Status in Lowndesville
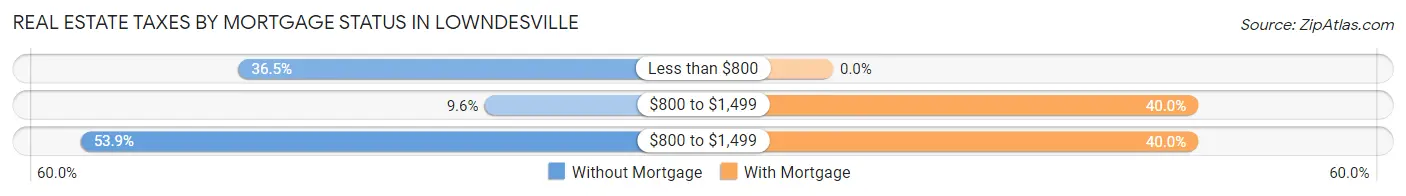
| Property Taxes | Without Mortgage | With Mortgage |
| Less than $800 | 19 (36.5%) | 0 (0.0%) |
| $800 to $1,499 | 5 (9.6%) | 2 (40.0%) |
| $800 to $1,499 | 28 (53.8%) | 2 (40.0%) |
| Total | 52 (100.0%) | 5 (100.0%) |
Health & Disability in Lowndesville
Health Insurance Coverage by Age in Lowndesville
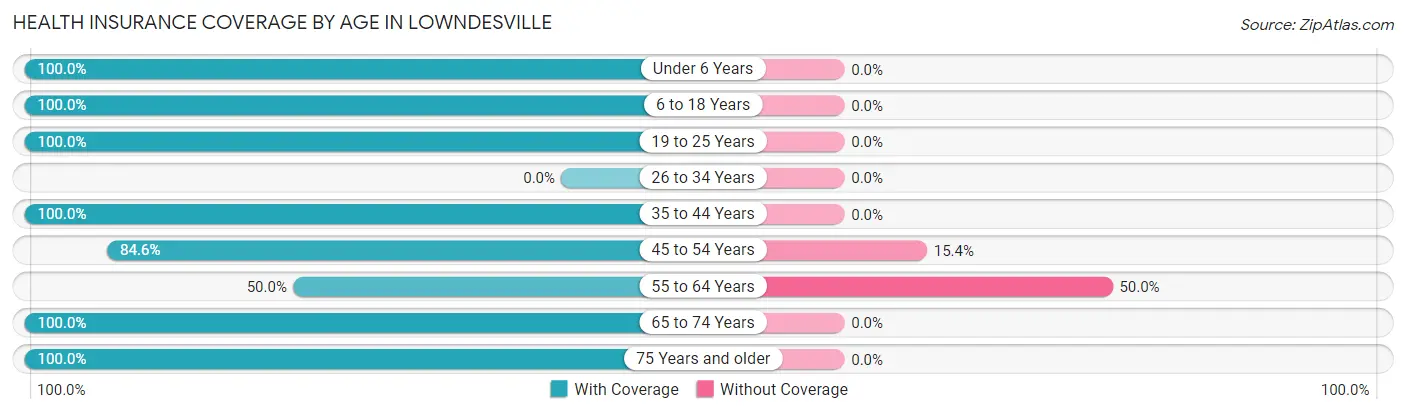
| Age Bracket | With Coverage | Without Coverage |
| Under 6 Years | 17 (100.0%) | 0 (0.0%) |
| 6 to 18 Years | 33 (100.0%) | 0 (0.0%) |
| 19 to 25 Years | 10 (100.0%) | 0 (0.0%) |
| 26 to 34 Years | 0 (0.0%) | 0 (0.0%) |
| 35 to 44 Years | 13 (100.0%) | 0 (0.0%) |
| 45 to 54 Years | 66 (84.6%) | 12 (15.4%) |
| 55 to 64 Years | 5 (50.0%) | 5 (50.0%) |
| 65 to 74 Years | 18 (100.0%) | 0 (0.0%) |
| 75 Years and older | 5 (100.0%) | 0 (0.0%) |
| Total | 167 (90.8%) | 17 (9.2%) |
Health Insurance Coverage by Citizenship Status in Lowndesville
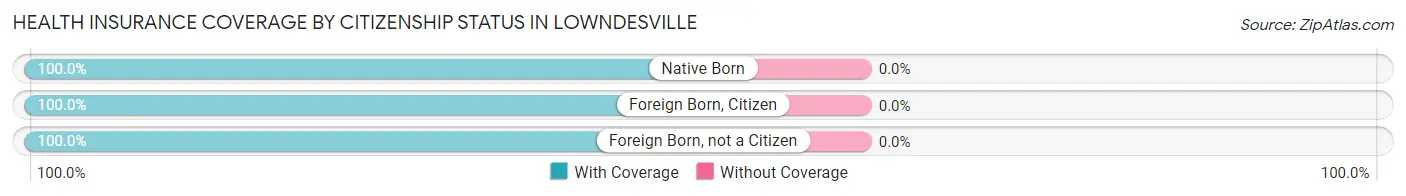
| Citizenship Status | With Coverage | Without Coverage |
| Native Born | 17 (100.0%) | 0 (0.0%) |
| Foreign Born, Citizen | 33 (100.0%) | 0 (0.0%) |
| Foreign Born, not a Citizen | 10 (100.0%) | 0 (0.0%) |
Health Insurance Coverage by Household Income in Lowndesville
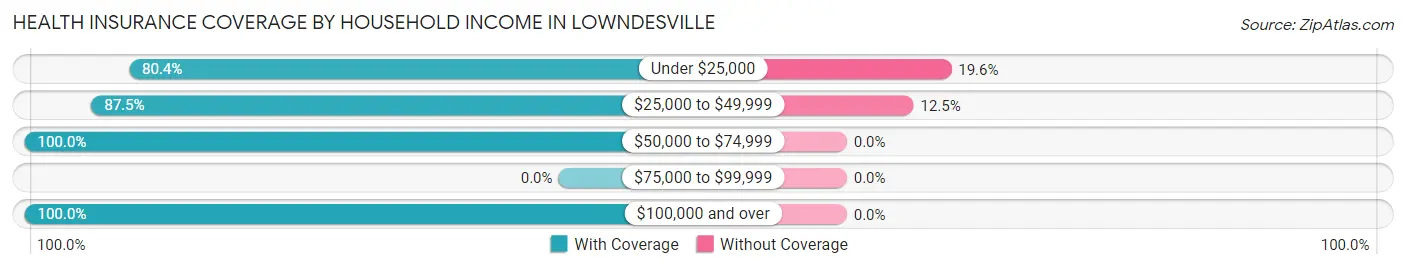
| Household Income | With Coverage | Without Coverage |
| Under $25,000 | 37 (80.4%) | 9 (19.6%) |
| $25,000 to $49,999 | 56 (87.5%) | 8 (12.5%) |
| $50,000 to $74,999 | 11 (100.0%) | 0 (0.0%) |
| $75,000 to $99,999 | 0 (0.0%) | 0 (0.0%) |
| $100,000 and over | 63 (100.0%) | 0 (0.0%) |
Public vs Private Health Insurance Coverage by Age in Lowndesville
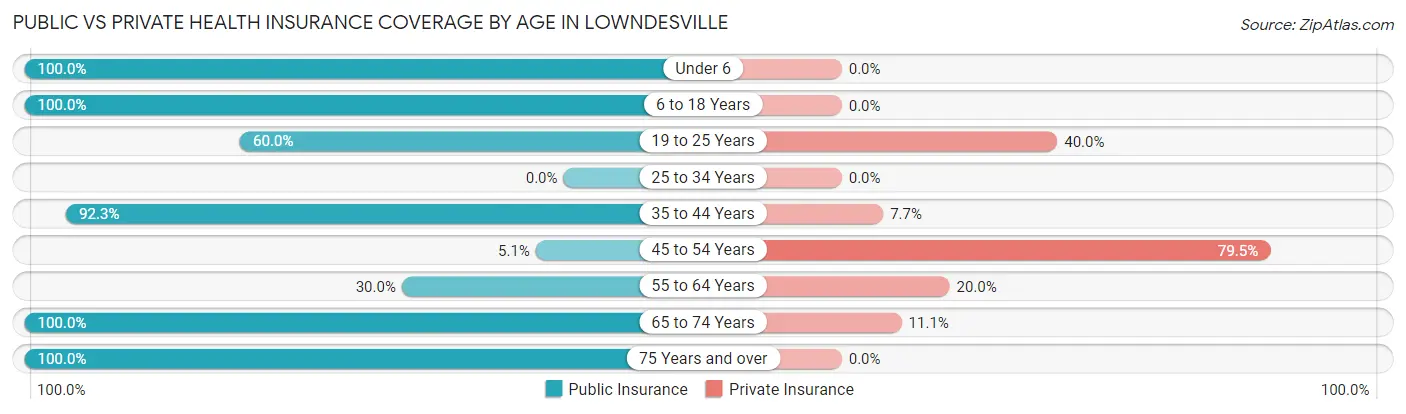
| Age Bracket | Public Insurance | Private Insurance |
| Under 6 | 17 (100.0%) | 0 (0.0%) |
| 6 to 18 Years | 33 (100.0%) | 0 (0.0%) |
| 19 to 25 Years | 6 (60.0%) | 4 (40.0%) |
| 25 to 34 Years | 0 (0.0%) | 0 (0.0%) |
| 35 to 44 Years | 12 (92.3%) | 1 (7.7%) |
| 45 to 54 Years | 4 (5.1%) | 62 (79.5%) |
| 55 to 64 Years | 3 (30.0%) | 2 (20.0%) |
| 65 to 74 Years | 18 (100.0%) | 2 (11.1%) |
| 75 Years and over | 5 (100.0%) | 0 (0.0%) |
| Total | 98 (53.3%) | 71 (38.6%) |
Disability Status by Sex by Age in Lowndesville
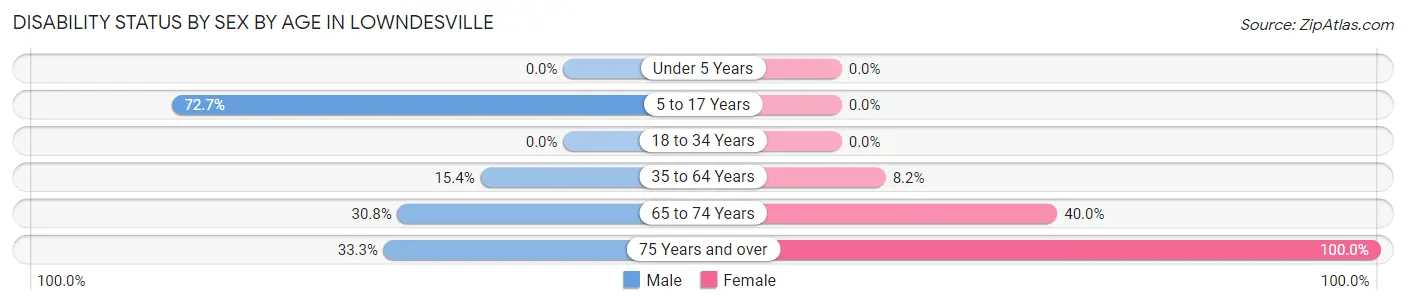
| Age Bracket | Male | Female |
| Under 5 Years | 0 (0.0%) | 0 (0.0%) |
| 5 to 17 Years | 8 (72.7%) | 0 (0.0%) |
| 18 to 34 Years | 0 (0.0%) | 0 (0.0%) |
| 35 to 64 Years | 8 (15.4%) | 4 (8.2%) |
| 65 to 74 Years | 4 (30.8%) | 2 (40.0%) |
| 75 Years and over | 1 (33.3%) | 2 (100.0%) |
Disability Class by Sex by Age in Lowndesville
Disability Class: Hearing Difficulty
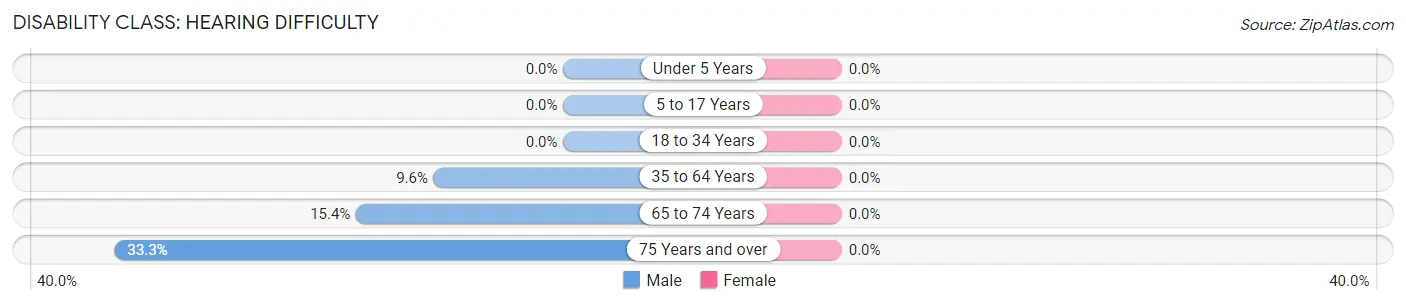
| Age Bracket | Male | Female |
| Under 5 Years | 0 (0.0%) | 0 (0.0%) |
| 5 to 17 Years | 0 (0.0%) | 0 (0.0%) |
| 18 to 34 Years | 0 (0.0%) | 0 (0.0%) |
| 35 to 64 Years | 5 (9.6%) | 0 (0.0%) |
| 65 to 74 Years | 2 (15.4%) | 0 (0.0%) |
| 75 Years and over | 1 (33.3%) | 0 (0.0%) |
Disability Class: Vision Difficulty
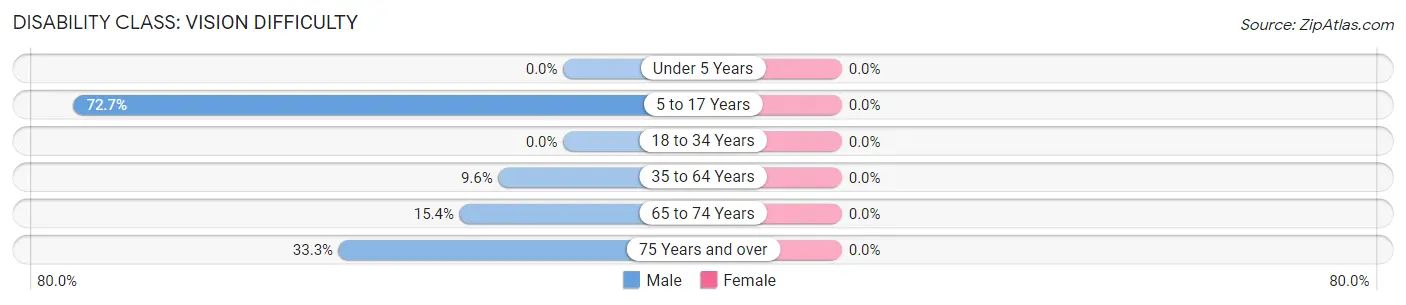
| Age Bracket | Male | Female |
| Under 5 Years | 0 (0.0%) | 0 (0.0%) |
| 5 to 17 Years | 8 (72.7%) | 0 (0.0%) |
| 18 to 34 Years | 0 (0.0%) | 0 (0.0%) |
| 35 to 64 Years | 5 (9.6%) | 0 (0.0%) |
| 65 to 74 Years | 2 (15.4%) | 0 (0.0%) |
| 75 Years and over | 1 (33.3%) | 0 (0.0%) |
Disability Class: Cognitive Difficulty
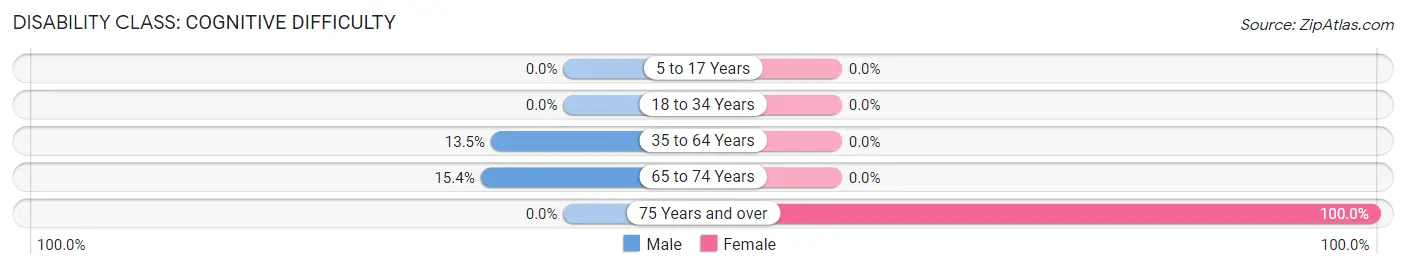
| Age Bracket | Male | Female |
| 5 to 17 Years | 0 (0.0%) | 0 (0.0%) |
| 18 to 34 Years | 0 (0.0%) | 0 (0.0%) |
| 35 to 64 Years | 7 (13.5%) | 0 (0.0%) |
| 65 to 74 Years | 2 (15.4%) | 0 (0.0%) |
| 75 Years and over | 0 (0.0%) | 2 (100.0%) |
Disability Class: Ambulatory Difficulty
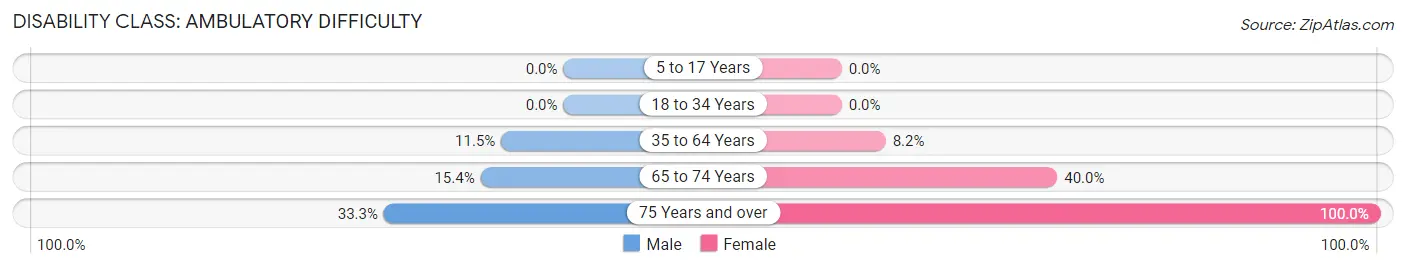
| Age Bracket | Male | Female |
| 5 to 17 Years | 0 (0.0%) | 0 (0.0%) |
| 18 to 34 Years | 0 (0.0%) | 0 (0.0%) |
| 35 to 64 Years | 6 (11.5%) | 4 (8.2%) |
| 65 to 74 Years | 2 (15.4%) | 2 (40.0%) |
| 75 Years and over | 1 (33.3%) | 2 (100.0%) |
Disability Class: Self-Care Difficulty
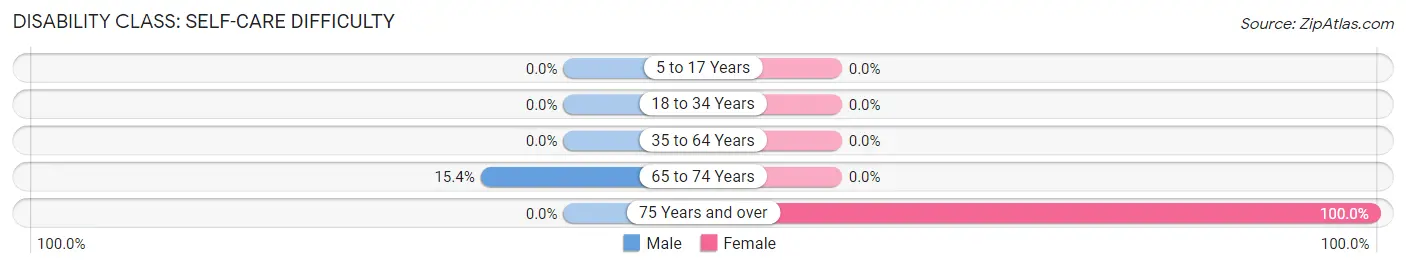
| Age Bracket | Male | Female |
| 5 to 17 Years | 0 (0.0%) | 0 (0.0%) |
| 18 to 34 Years | 0 (0.0%) | 0 (0.0%) |
| 35 to 64 Years | 0 (0.0%) | 0 (0.0%) |
| 65 to 74 Years | 2 (15.4%) | 0 (0.0%) |
| 75 Years and over | 0 (0.0%) | 2 (100.0%) |
Technology Access in Lowndesville
Computing Device Access in Lowndesville
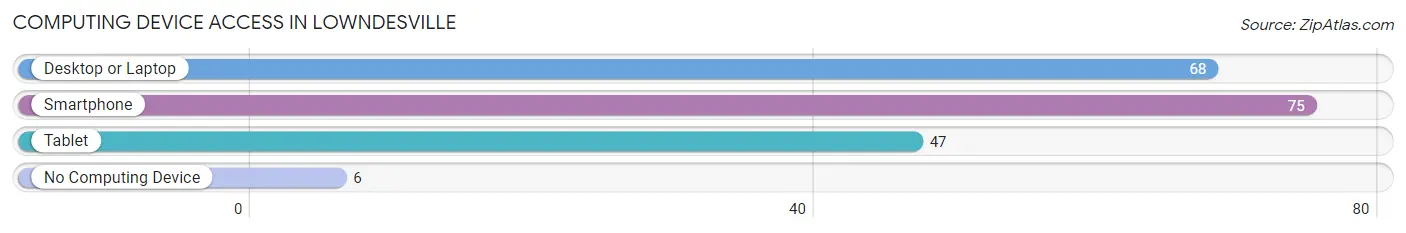
| Device Type | # Households | % Households |
| Desktop or Laptop | 68 | 80.0% |
| Smartphone | 75 | 88.2% |
| Tablet | 47 | 55.3% |
| No Computing Device | 6 | 7.1% |
| Total | 85 | 100.0% |
Internet Access in Lowndesville
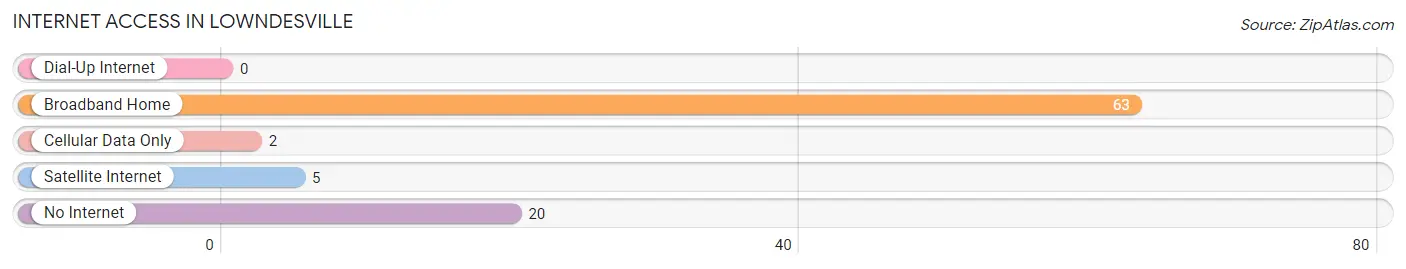
| Internet Type | # Households | % Households |
| Dial-Up Internet | 0 | 0.0% |
| Broadband Home | 63 | 74.1% |
| Cellular Data Only | 2 | 2.4% |
| Satellite Internet | 5 | 5.9% |
| No Internet | 20 | 23.5% |
| Total | 85 | 100.0% |
Lowndesville Summary
Lowndesville is a small unincorporated community located in Abbeville County, South Carolina. It is situated on the banks of the Savannah River, approximately 20 miles from the Georgia border. The town was founded in 1820 by William Lowndes, a prominent planter and politician from the area. Lowndesville is home to a population of approximately 500 people, and is known for its rural charm and small-town atmosphere.
History
Lowndesville was founded in 1820 by William Lowndes, a prominent planter and politician from the area. Lowndes was a member of the South Carolina House of Representatives and served as a delegate to the South Carolina Constitutional Convention of 1868. He was also a major landowner in the area, and his plantation, Lowndesville Plantation, was located just outside of town.
Lowndesville was originally a small farming community, and the town’s economy was largely based on agriculture. In the late 19th century, the town began to grow and develop, and by the early 20th century, it had become a thriving commercial center. The town was home to several stores, a bank, a hotel, and a post office.
In the early 20th century, Lowndesville was also home to a thriving African-American community. The town was home to several churches, a school, and a number of businesses owned by African-Americans. The town was also home to a number of African-American professionals, including doctors, lawyers, and teachers.
Geography
Lowndesville is located in Abbeville County, South Carolina, approximately 20 miles from the Georgia border. The town is situated on the banks of the Savannah River, and is surrounded by rolling hills and forests. The town is located in the foothills of the Blue Ridge Mountains, and is approximately 30 miles from the city of Greenville.
The climate in Lowndesville is mild and humid, with temperatures ranging from the mid-50s in the winter to the mid-80s in the summer. The town receives an average of 48 inches of rain per year, and is located in a region of the country that is prone to severe weather, including tornadoes and hurricanes.
Economy
Lowndesville’s economy is largely based on agriculture. The town is home to several farms, and the surrounding area is known for its production of cotton, corn, soybeans, and other crops. The town is also home to several small businesses, including restaurants, convenience stores, and gas stations.
The town is also home to a number of manufacturing companies, including a furniture factory and a textile mill. The town is also home to a number of service-based businesses, including auto repair shops, beauty salons, and dry cleaners.
Demographics
As of the 2010 census, Lowndesville had a population of 498 people. The town is approximately 75% white, 20% African-American, and 5% Hispanic. The median household income in Lowndesville is $30,000, and the median home value is $90,000. The town has a poverty rate of 22%, and the unemployment rate is 8%.
Lowndesville is home to a number of churches, including Baptist, Methodist, and Presbyterian congregations. The town is also home to a number of schools, including a public elementary school and a private Christian school. The town is served by the Abbeville County School District.
Common Questions
What is Per Capita Income in Lowndesville?
Per Capita income in Lowndesville is $64,749.
What is Family Income Deficit in Lowndesville?
Family Income Deficit in Lowndesville is $18,673.
Families that are below poverty line in Lowndesville earn $18,673 less on average than the poverty threshold level.
What is Inequality or Gini Index in Lowndesville?
Inequality or Gini Index in Lowndesville is 0.59.
What is the Total Population of Lowndesville?
Total Population of Lowndesville is 184.
What is the Total Male Population of Lowndesville?
Total Male Population of Lowndesville is 86.
What is the Total Female Population of Lowndesville?
Total Female Population of Lowndesville is 98.
What is the Ratio of Males per 100 Females in Lowndesville?
There are 87.76 Males per 100 Females in Lowndesville.
What is the Ratio of Females per 100 Males in Lowndesville?
There are 113.95 Females per 100 Males in Lowndesville.
What is the Median Population Age in Lowndesville?
Median Population Age in Lowndesville is 50.0 Years.
What is the Average Family Size in Lowndesville
Average Family Size in Lowndesville is 2.6 People.
What is the Average Household Size in Lowndesville
Average Household Size in Lowndesville is 2.2 People.
How Large is the Labor Force in Lowndesville?
There are 59 People in the Labor Forcein in Lowndesville.
What is the Percentage of People in the Labor Force in Lowndesville?
40.7% of People are in the Labor Force in Lowndesville.