Crenshaw, MS Map & Demographics
Crenshaw Map
Crenshaw Overview
$17,217
PER CAPITA INCOME
$33,819
AVG FAMILY INCOME
$35,685
AVG HOUSEHOLD INCOME
14.2%
WAGE / INCOME GAP [ % ]
85.8¢/ $1
WAGE / INCOME GAP [ $ ]
0.39
INEQUALITY / GINI INDEX
864
TOTAL POPULATION
377
MALE POPULATION
487
FEMALE POPULATION
77.41
MALES / 100 FEMALES
129.18
FEMALES / 100 MALES
38.4
MEDIAN AGE
3.3
AVG FAMILY SIZE
2.6
AVG HOUSEHOLD SIZE
353
LABOR FORCE [ PEOPLE ]
54.6%
PERCENT IN LABOR FORCE
17.6%
UNEMPLOYMENT RATE
Crenshaw Zip Codes
Crenshaw Area Codes
Income in Crenshaw
Income Overview in Crenshaw
Per Capita Income in Crenshaw is $17,217, while median incomes of families and households are $33,819 and $35,685 respectively.
| Characteristic | Number | Measure |
| Per Capita Income | 864 | $17,217 |
| Median Family Income | 213 | $33,819 |
| Mean Family Income | 213 | $47,349 |
| Median Household Income | 329 | $35,685 |
| Mean Household Income | 329 | $44,270 |
| Income Deficit | 213 | $0 |
| Wage / Income Gap (%) | 864 | 14.24% |
| Wage / Income Gap ($) | 864 | 85.76¢ per $1 |
| Gini / Inequality Index | 864 | 0.39 |
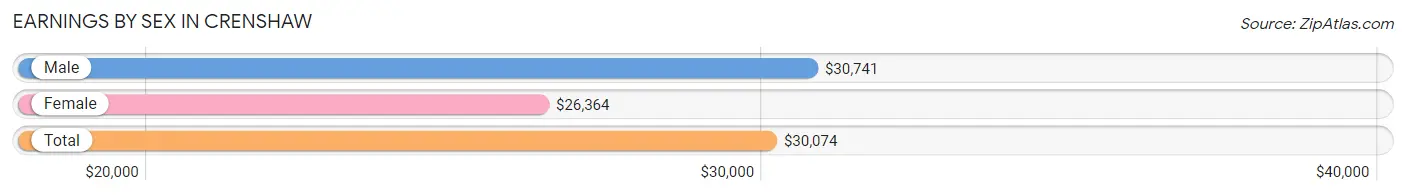
Earnings by Sex in Crenshaw
Average Earnings in Crenshaw are $30,074, $30,741 for men and $26,364 for women, a difference of 14.2%.
| Sex | Number | Average Earnings |
| Male | 164 (50.9%) | $30,741 |
| Female | 158 (49.1%) | $26,364 |
| Total | 322 (100.0%) | $30,074 |
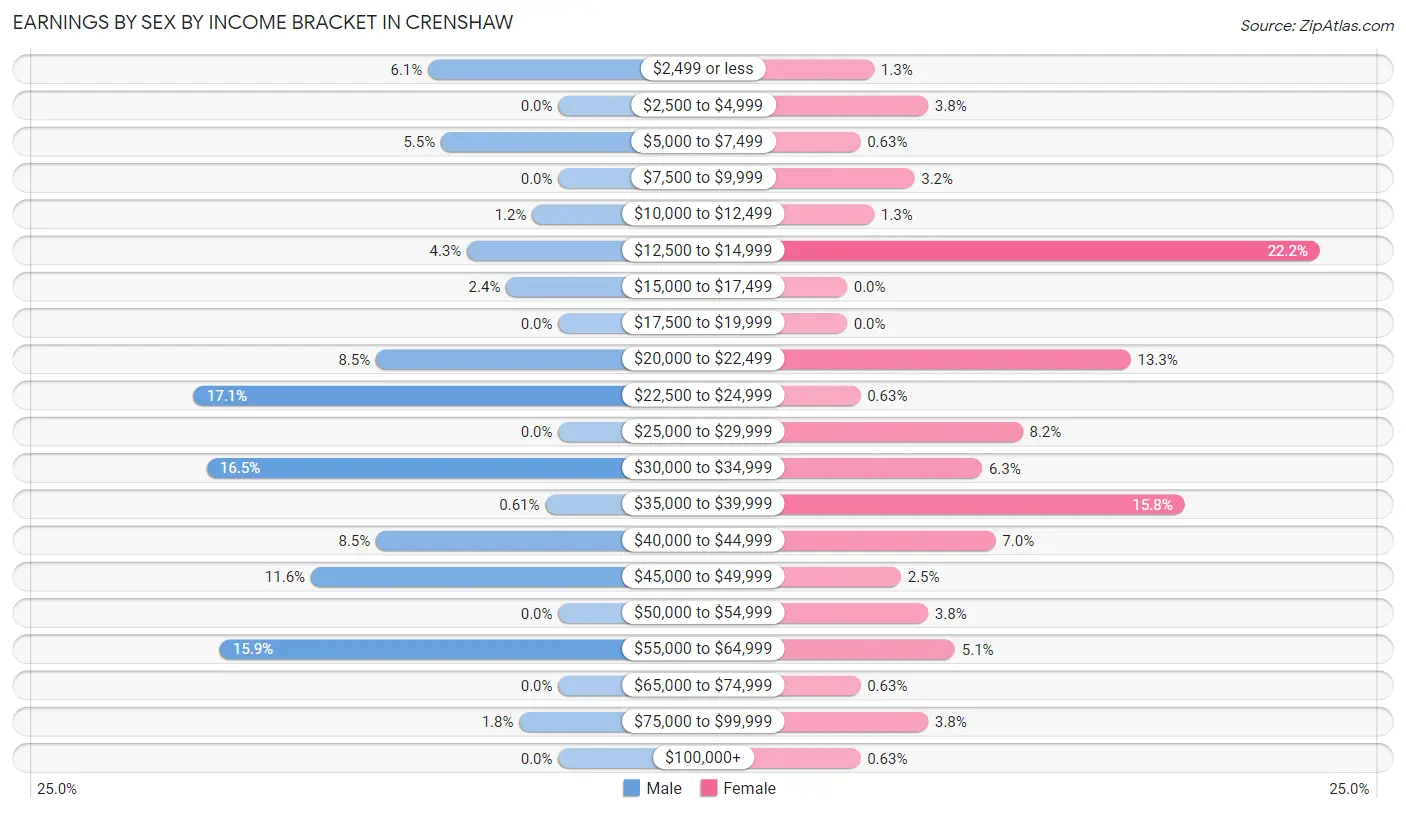
Earnings by Sex by Income Bracket in Crenshaw
The most common earnings brackets in Crenshaw are $22,500 to $24,999 for men (28 | 17.1%) and $12,500 to $14,999 for women (35 | 22.2%).
| Income | Male | Female |
| $2,499 or less | 10 (6.1%) | 2 (1.3%) |
| $2,500 to $4,999 | 0 (0.0%) | 6 (3.8%) |
| $5,000 to $7,499 | 9 (5.5%) | 1 (0.6%) |
| $7,500 to $9,999 | 0 (0.0%) | 5 (3.2%) |
| $10,000 to $12,499 | 2 (1.2%) | 2 (1.3%) |
| $12,500 to $14,999 | 7 (4.3%) | 35 (22.2%) |
| $15,000 to $17,499 | 4 (2.4%) | 0 (0.0%) |
| $17,500 to $19,999 | 0 (0.0%) | 0 (0.0%) |
| $20,000 to $22,499 | 14 (8.5%) | 21 (13.3%) |
| $22,500 to $24,999 | 28 (17.1%) | 1 (0.6%) |
| $25,000 to $29,999 | 0 (0.0%) | 13 (8.2%) |
| $30,000 to $34,999 | 27 (16.5%) | 10 (6.3%) |
| $35,000 to $39,999 | 1 (0.6%) | 25 (15.8%) |
| $40,000 to $44,999 | 14 (8.5%) | 11 (7.0%) |
| $45,000 to $49,999 | 19 (11.6%) | 4 (2.5%) |
| $50,000 to $54,999 | 0 (0.0%) | 6 (3.8%) |
| $55,000 to $64,999 | 26 (15.9%) | 8 (5.1%) |
| $65,000 to $74,999 | 0 (0.0%) | 1 (0.6%) |
| $75,000 to $99,999 | 3 (1.8%) | 6 (3.8%) |
| $100,000+ | 0 (0.0%) | 1 (0.6%) |
| Total | 164 (100.0%) | 158 (100.0%) |
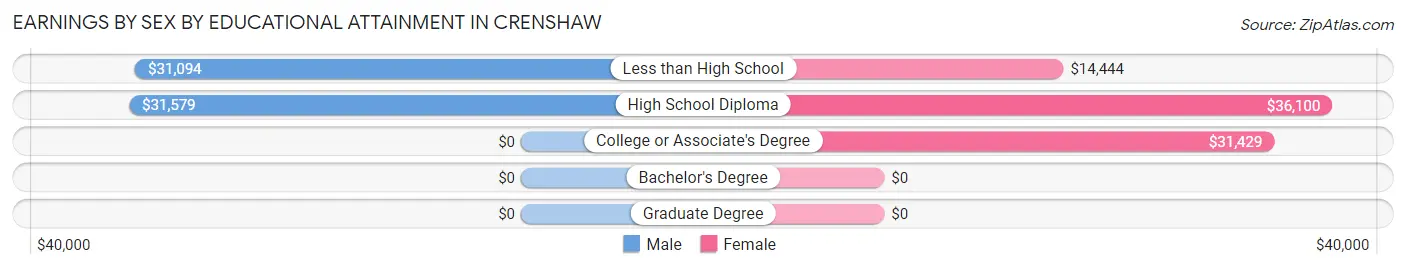
Earnings by Sex by Educational Attainment in Crenshaw
Average earnings in Crenshaw are $31,852 for men and $31,786 for women, a difference of 0.2%. Men with an educational attainment of high school diploma enjoy the highest average annual earnings of $31,579, while those with less than high school education earn the least with $31,094. Women with an educational attainment of high school diploma earn the most with the average annual earnings of $36,100, while those with less than high school education have the smallest earnings of $14,444.
| Educational Attainment | Male Income | Female Income |
| Less than High School | $31,094 | $14,444 |
| High School Diploma | $31,579 | $36,100 |
| College or Associate's Degree | - | - |
| Bachelor's Degree | - | - |
| Graduate Degree | - | - |
| Total | $31,852 | $31,786 |
Family Income in Crenshaw
Family Income Brackets in Crenshaw
According to the Crenshaw family income data, there are 55 families falling into the $25,000 to $34,999 income range, which is the most common income bracket and makes up 25.8% of all families.

| Income Bracket | # Families | % Families |
| Less than $10,000 | 17 | 8.0% |
| $10,000 to $14,999 | 25 | 11.7% |
| $15,000 to $24,999 | 18 | 8.5% |
| $25,000 to $34,999 | 55 | 25.8% |
| $35,000 to $49,999 | 34 | 16.0% |
| $50,000 to $74,999 | 15 | 7.0% |
| $75,000 to $99,999 | 25 | 11.7% |
| $100,000 to $149,999 | 17 | 8.0% |
| $150,000 to $199,999 | 7 | 3.3% |
| $200,000+ | 0 | 0.0% |
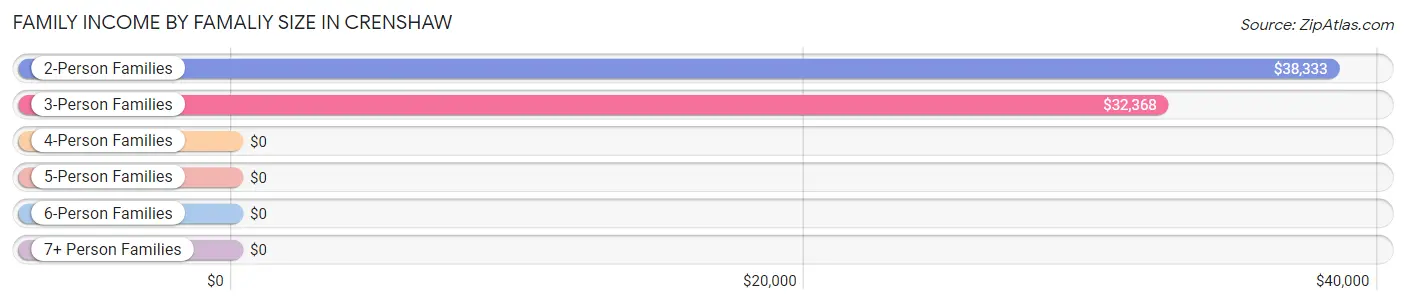
Family Income by Famaliy Size in Crenshaw
2-person families (96 | 45.1%) account for the highest median family income in Crenshaw with $38,333 per family, while 2-person families (96 | 45.1%) have the highest median income of $19,166 per family member.
| Income Bracket | # Families | Median Income |
| 2-Person Families | 96 (45.1%) | $38,333 |
| 3-Person Families | 92 (43.2%) | $32,368 |
| 4-Person Families | 8 (3.8%) | $0 |
| 5-Person Families | 2 (0.9%) | $0 |
| 6-Person Families | 6 (2.8%) | $0 |
| 7+ Person Families | 9 (4.2%) | $0 |
| Total | 213 (100.0%) | $33,819 |
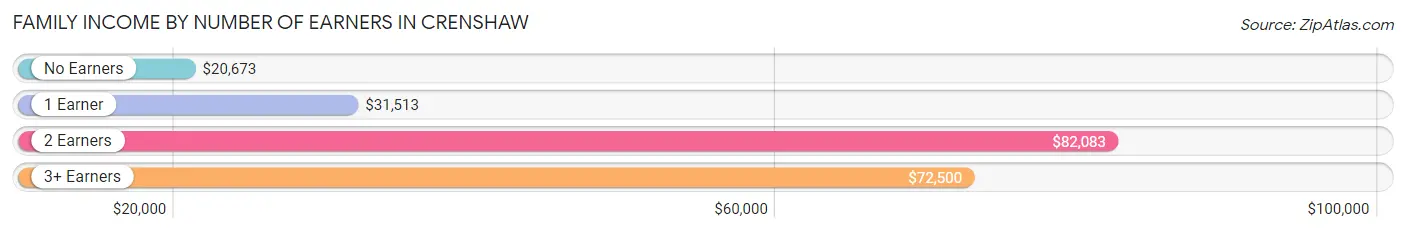
Family Income by Number of Earners in Crenshaw
The median family income in Crenshaw is $33,819, with families comprising 2 earners (57) having the highest median family income of $82,083, while families with no earners (41) have the lowest median family income of $20,673, accounting for 26.8% and 19.3% of families, respectively.
| Number of Earners | # Families | Median Income |
| No Earners | 41 (19.3%) | $20,673 |
| 1 Earner | 111 (52.1%) | $31,513 |
| 2 Earners | 57 (26.8%) | $82,083 |
| 3+ Earners | 4 (1.9%) | $72,500 |
| Total | 213 (100.0%) | $33,819 |
Household Income in Crenshaw
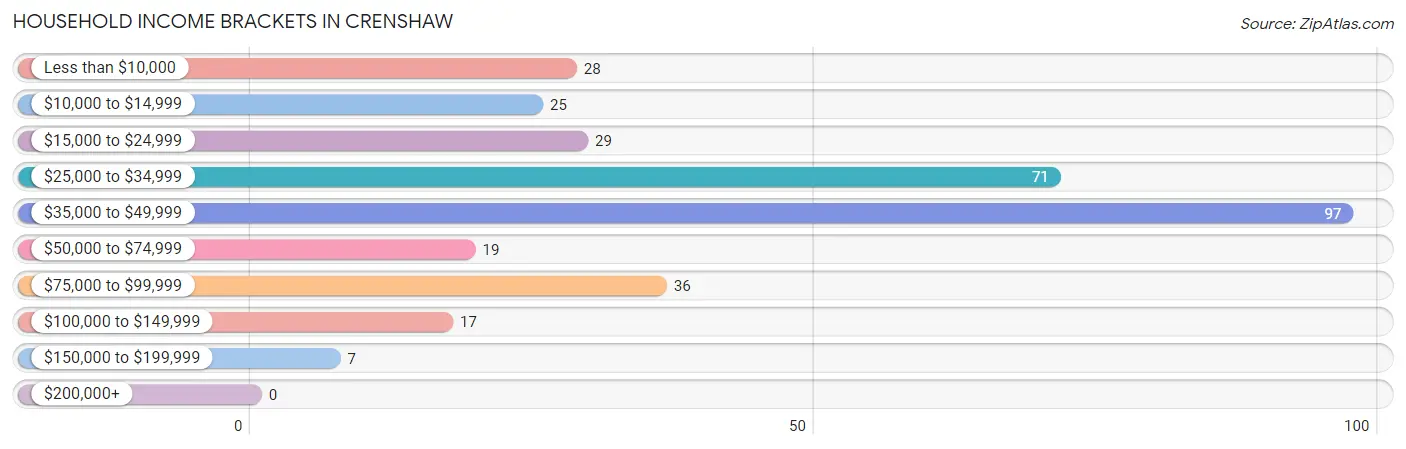
Household Income Brackets in Crenshaw
With 97 households falling in the category, the $35,000 to $49,999 income range is the most frequent in Crenshaw, accounting for 29.5% of all households.
| Income Bracket | # Households | % Households |
| Less than $10,000 | 28 | 8.5% |
| $10,000 to $14,999 | 25 | 7.6% |
| $15,000 to $24,999 | 29 | 8.8% |
| $25,000 to $34,999 | 71 | 21.6% |
| $35,000 to $49,999 | 97 | 29.5% |
| $50,000 to $74,999 | 19 | 5.8% |
| $75,000 to $99,999 | 36 | 10.9% |
| $100,000 to $149,999 | 17 | 5.2% |
| $150,000 to $199,999 | 7 | 2.1% |
| $200,000+ | 0 | 0.0% |
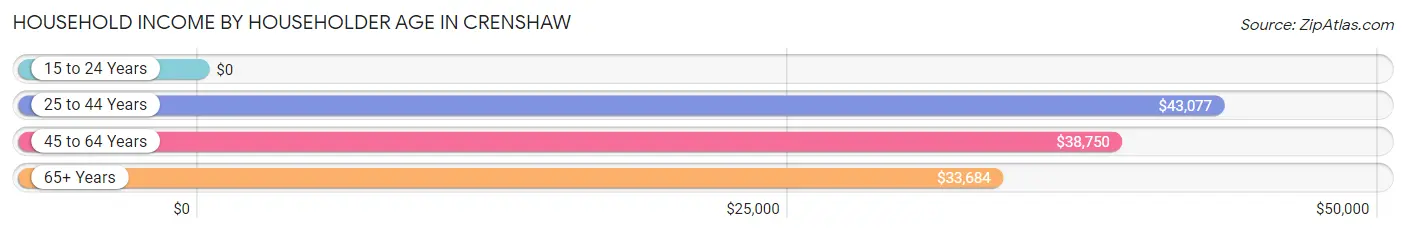
Household Income by Householder Age in Crenshaw
The median household income in Crenshaw is $35,685, with the highest median household income of $43,077 found in the 25 to 44 years age bracket for the primary householder. A total of 68 households (20.7%) fall into this category. Meanwhile, the 15 to 24 years age bracket for the primary householder has the lowest median household income of $0, with 22 households (6.7%) in this group.
| Income Bracket | # Households | Median Income |
| 15 to 24 Years | 22 (6.7%) | $0 |
| 25 to 44 Years | 68 (20.7%) | $43,077 |
| 45 to 64 Years | 113 (34.4%) | $38,750 |
| 65+ Years | 126 (38.3%) | $33,684 |
| Total | 329 (100.0%) | $35,685 |
Poverty in Crenshaw
Income Below Poverty by Sex and Age in Crenshaw
With 18.6% poverty level for males and 39.4% for females among the residents of Crenshaw, under 5 year old males and 5 year old females are the most vulnerable to poverty, with 26 males (100.0%) and 7 females (100.0%) in their respective age groups living below the poverty level.
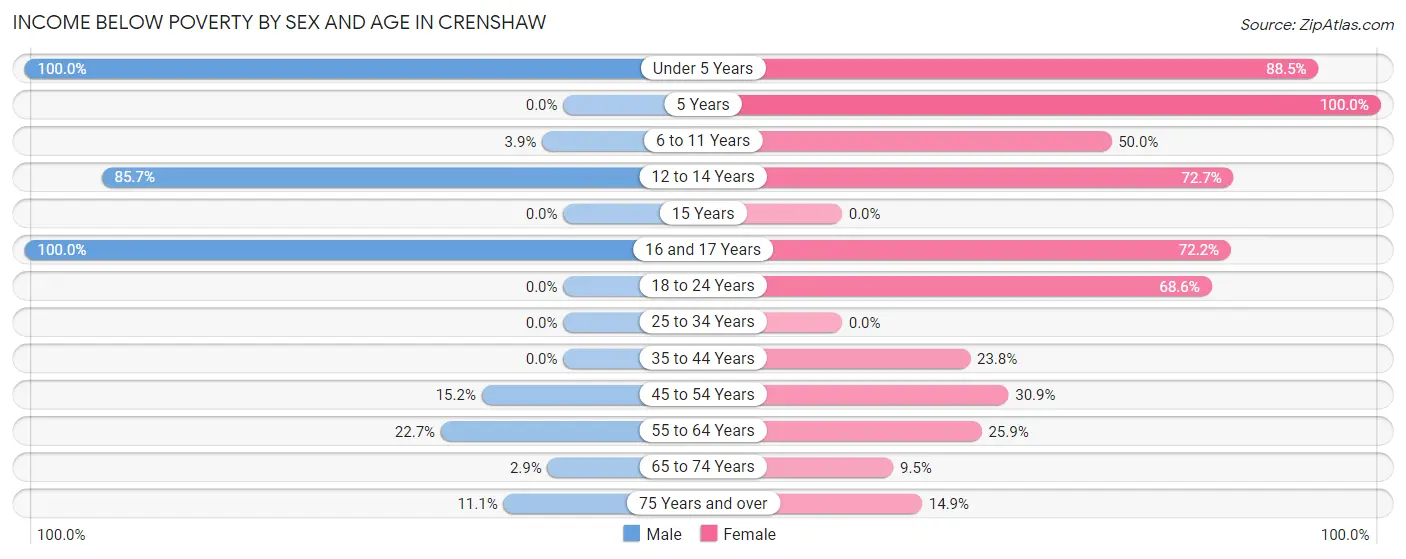
| Age Bracket | Male | Female |
| Under 5 Years | 26 (100.0%) | 46 (88.5%) |
| 5 Years | 0 (0.0%) | 7 (100.0%) |
| 6 to 11 Years | 2 (3.9%) | 16 (50.0%) |
| 12 to 14 Years | 18 (85.7%) | 16 (72.7%) |
| 15 Years | 0 (0.0%) | 0 (0.0%) |
| 16 and 17 Years | 5 (100.0%) | 13 (72.2%) |
| 18 to 24 Years | 0 (0.0%) | 35 (68.6%) |
| 25 to 34 Years | 0 (0.0%) | 0 (0.0%) |
| 35 to 44 Years | 0 (0.0%) | 20 (23.8%) |
| 45 to 54 Years | 10 (15.1%) | 17 (30.9%) |
| 55 to 64 Years | 5 (22.7%) | 7 (25.9%) |
| 65 to 74 Years | 1 (2.9%) | 4 (9.5%) |
| 75 Years and over | 3 (11.1%) | 11 (14.9%) |
| Total | 70 (18.6%) | 192 (39.4%) |
Income Above Poverty by Sex and Age in Crenshaw
According to the poverty statistics in Crenshaw, males aged 5 years and females aged 25 to 34 years are the age groups that are most secure financially, with 100.0% of males and 100.0% of females in these age groups living above the poverty line.
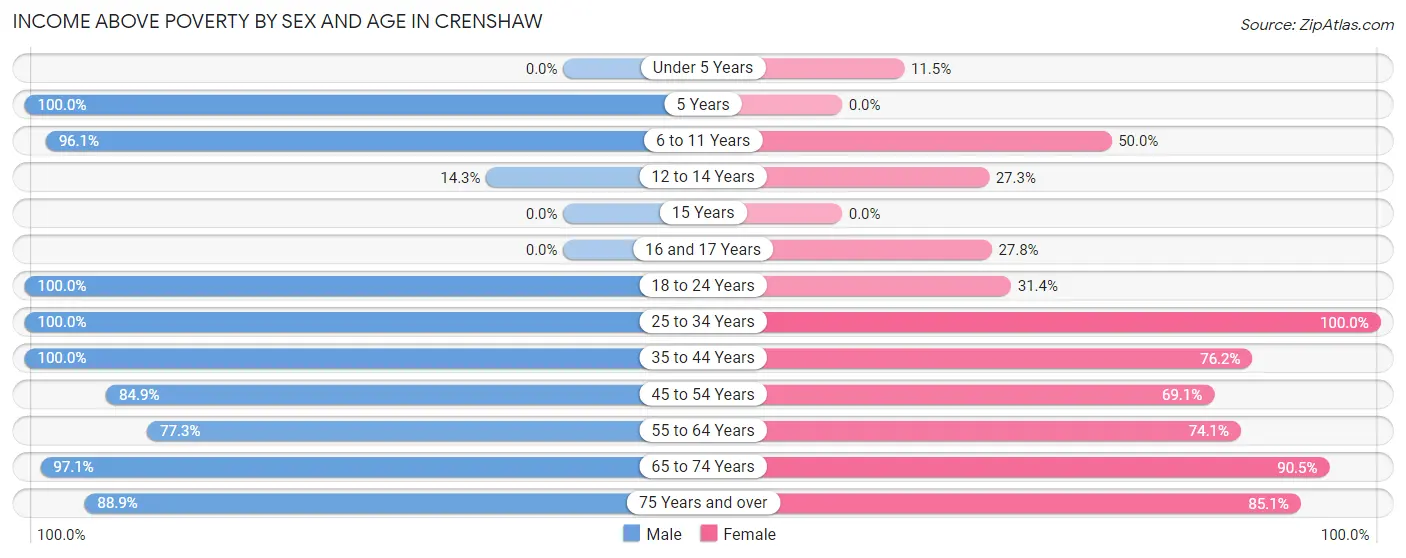
| Age Bracket | Male | Female |
| Under 5 Years | 0 (0.0%) | 6 (11.5%) |
| 5 Years | 6 (100.0%) | 0 (0.0%) |
| 6 to 11 Years | 49 (96.1%) | 16 (50.0%) |
| 12 to 14 Years | 3 (14.3%) | 6 (27.3%) |
| 15 Years | 0 (0.0%) | 0 (0.0%) |
| 16 and 17 Years | 0 (0.0%) | 5 (27.8%) |
| 18 to 24 Years | 54 (100.0%) | 16 (31.4%) |
| 25 to 34 Years | 40 (100.0%) | 23 (100.0%) |
| 35 to 44 Years | 25 (100.0%) | 64 (76.2%) |
| 45 to 54 Years | 56 (84.9%) | 38 (69.1%) |
| 55 to 64 Years | 17 (77.3%) | 20 (74.1%) |
| 65 to 74 Years | 33 (97.1%) | 38 (90.5%) |
| 75 Years and over | 24 (88.9%) | 63 (85.1%) |
| Total | 307 (81.4%) | 295 (60.6%) |
Income Below Poverty Among Married-Couple Families in Crenshaw
The poverty statistics for married-couple families in Crenshaw show that 5.4% or 6 of the total 110 families live below the poverty line. Families with 1 or 2 children have the highest poverty rate of 15.0%, comprising of 3 families. On the other hand, families with 3 or 4 children have the lowest poverty rate of 0.0%, which includes 0 families.
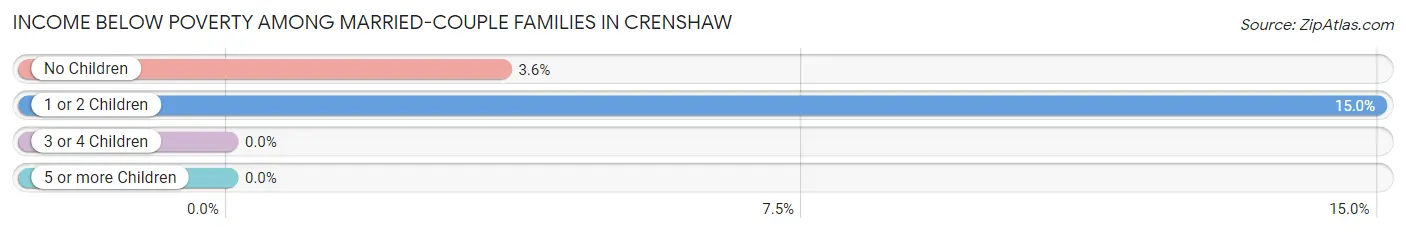
| Children | Above Poverty | Below Poverty |
| No Children | 81 (96.4%) | 3 (3.6%) |
| 1 or 2 Children | 17 (85.0%) | 3 (15.0%) |
| 3 or 4 Children | 6 (100.0%) | 0 (0.0%) |
| 5 or more Children | 0 (0.0%) | 0 (0.0%) |
| Total | 104 (94.6%) | 6 (5.4%) |
Income Below Poverty Among Single-Parent Households in Crenshaw
According to the poverty data in Crenshaw, 12.5% or 3 single-father households and 53.2% or 42 single-mother households are living below the poverty line. Among single-father households, those with no children have the highest poverty rate, with 3 households (60.0%) experiencing poverty. Likewise, among single-mother households, those with 5 or more children have the highest poverty rate, with 8 households (100.0%) falling below the poverty line.
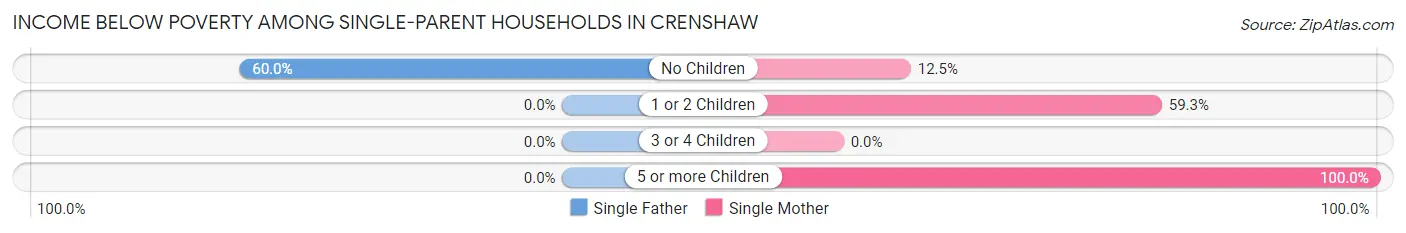
| Children | Single Father | Single Mother |
| No Children | 3 (60.0%) | 2 (12.5%) |
| 1 or 2 Children | 0 (0.0%) | 32 (59.3%) |
| 3 or 4 Children | 0 (0.0%) | 0 (0.0%) |
| 5 or more Children | 0 (0.0%) | 8 (100.0%) |
| Total | 3 (12.5%) | 42 (53.2%) |
Income Below Poverty Among Married-Couple vs Single-Parent Households in Crenshaw
The poverty data for Crenshaw shows that 6 of the married-couple family households (5.4%) and 45 of the single-parent households (43.7%) are living below the poverty level. Within the married-couple family households, those with 1 or 2 children have the highest poverty rate, with 3 households (15.0%) falling below the poverty line. Among the single-parent households, those with 5 or more children have the highest poverty rate, with 8 household (100.0%) living below poverty.
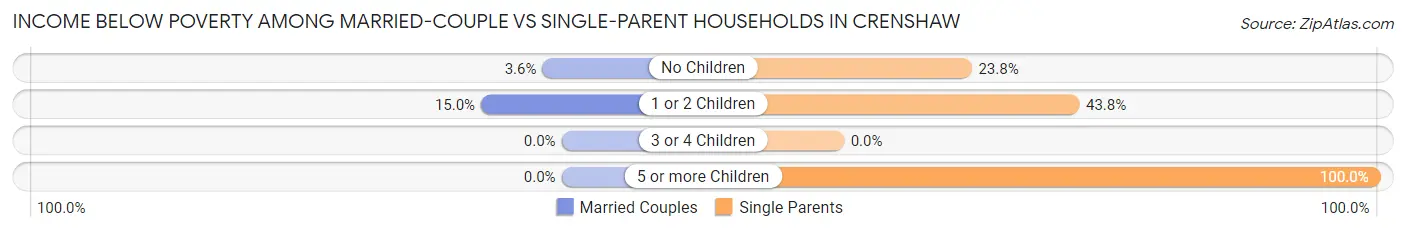
| Children | Married-Couple Families | Single-Parent Households |
| No Children | 3 (3.6%) | 5 (23.8%) |
| 1 or 2 Children | 3 (15.0%) | 32 (43.8%) |
| 3 or 4 Children | 0 (0.0%) | 0 (0.0%) |
| 5 or more Children | 0 (0.0%) | 8 (100.0%) |
| Total | 6 (5.4%) | 45 (43.7%) |
Race in Crenshaw
The most populous races in Crenshaw are Black / African American (686 | 79.4%), White / Caucasian (157 | 18.2%), and Hawaiian / Pacific (18 | 2.1%).
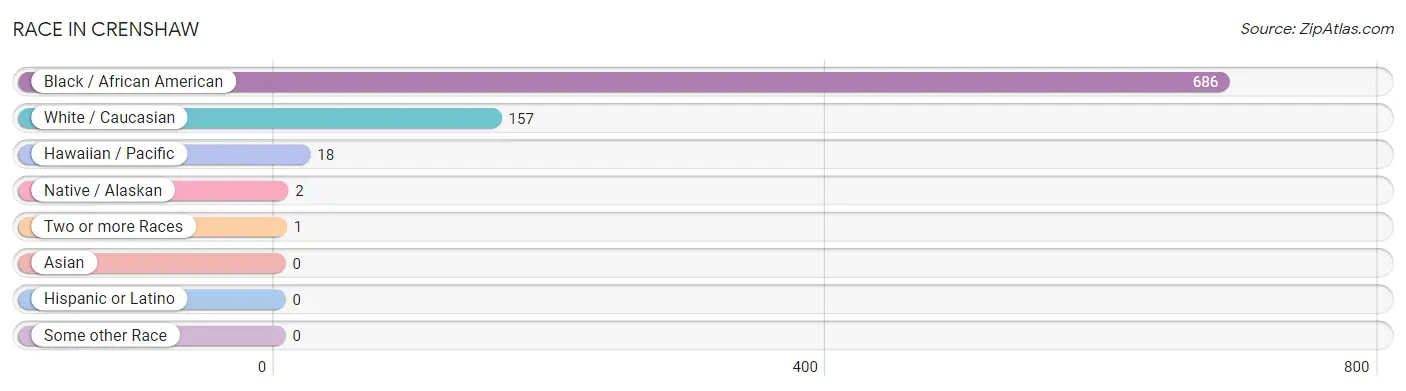
| Race | # Population | % Population |
| Asian | 0 | 0.0% |
| Black / African American | 686 | 79.4% |
| Hawaiian / Pacific | 18 | 2.1% |
| Hispanic or Latino | 0 | 0.0% |
| Native / Alaskan | 2 | 0.2% |
| White / Caucasian | 157 | 18.2% |
| Two or more Races | 1 | 0.1% |
| Some other Race | 0 | 0.0% |
| Total | 864 | 100.0% |
Ancestry in Crenshaw
The most populous ancestries reported in Crenshaw are English (86 | 10.0%), Samoan (18 | 2.1%), American (12 | 1.4%), Irish (9 | 1.0%), and Italian (6 | 0.7%), together accounting for 15.1% of all Crenshaw residents.
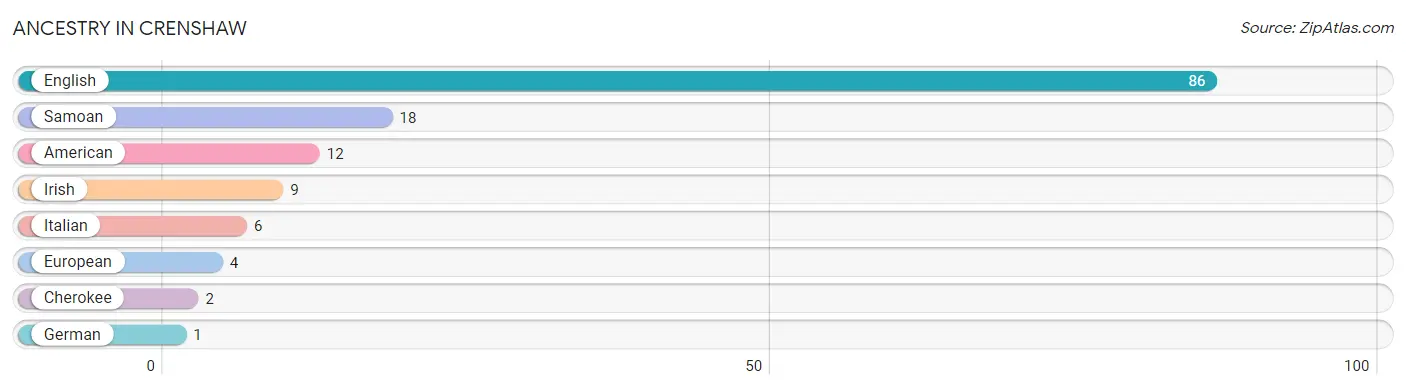
| Ancestry | # Population | % Population |
| American | 12 | 1.4% |
| Cherokee | 2 | 0.2% |
| English | 86 | 10.0% |
| European | 4 | 0.5% |
| German | 1 | 0.1% |
| Irish | 9 | 1.0% |
| Italian | 6 | 0.7% |
| Samoan | 18 | 2.1% | View All 8 Rows |
Immigrants in Crenshaw

| Immigration Origin | # Population | % Population | View All 0 Rows |
Sex and Age in Crenshaw
Sex and Age in Crenshaw
The most populous age groups in Crenshaw are 20 to 24 Years (54 | 14.3%) for men and Under 5 Years (52 | 10.7%) for women.
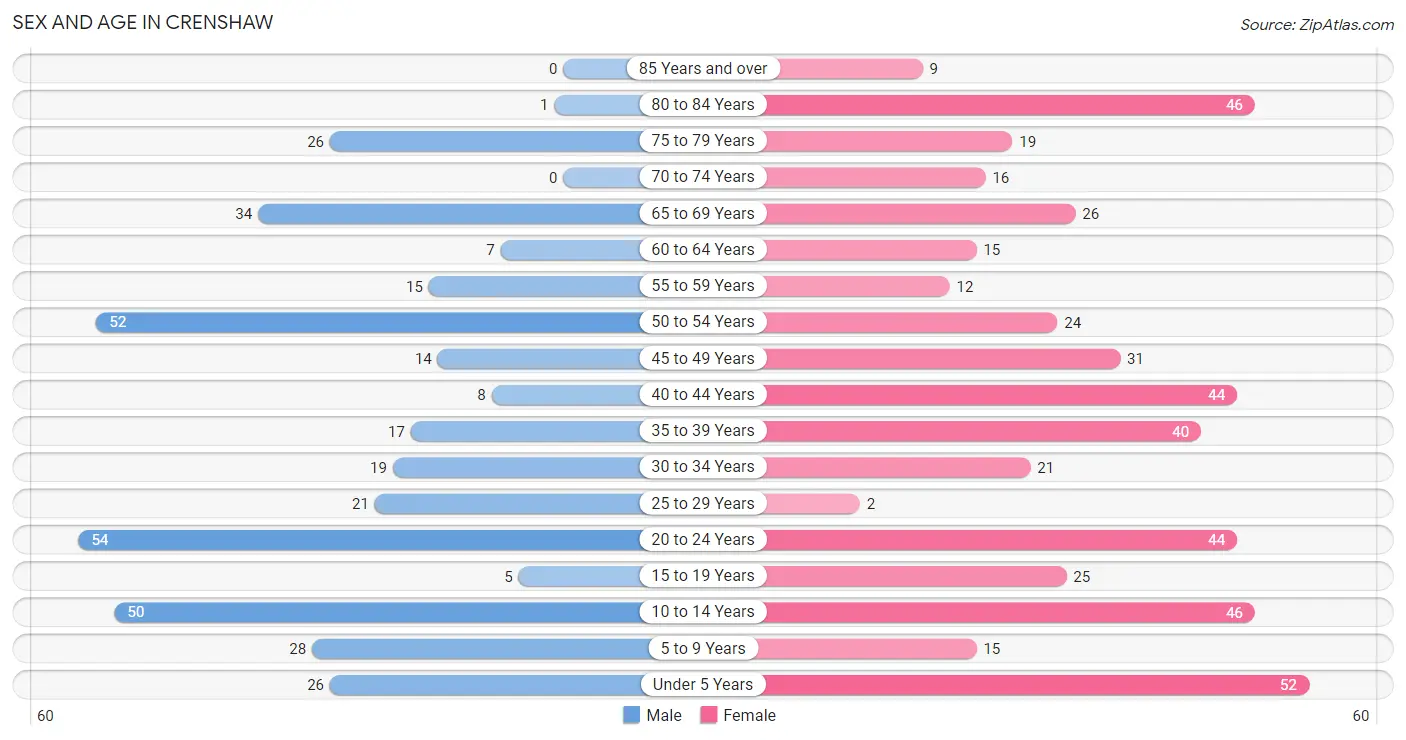
| Age Bracket | Male | Female |
| Under 5 Years | 26 (6.9%) | 52 (10.7%) |
| 5 to 9 Years | 28 (7.4%) | 15 (3.1%) |
| 10 to 14 Years | 50 (13.3%) | 46 (9.5%) |
| 15 to 19 Years | 5 (1.3%) | 25 (5.1%) |
| 20 to 24 Years | 54 (14.3%) | 44 (9.0%) |
| 25 to 29 Years | 21 (5.6%) | 2 (0.4%) |
| 30 to 34 Years | 19 (5.0%) | 21 (4.3%) |
| 35 to 39 Years | 17 (4.5%) | 40 (8.2%) |
| 40 to 44 Years | 8 (2.1%) | 44 (9.0%) |
| 45 to 49 Years | 14 (3.7%) | 31 (6.4%) |
| 50 to 54 Years | 52 (13.8%) | 24 (4.9%) |
| 55 to 59 Years | 15 (4.0%) | 12 (2.5%) |
| 60 to 64 Years | 7 (1.9%) | 15 (3.1%) |
| 65 to 69 Years | 34 (9.0%) | 26 (5.3%) |
| 70 to 74 Years | 0 (0.0%) | 16 (3.3%) |
| 75 to 79 Years | 26 (6.9%) | 19 (3.9%) |
| 80 to 84 Years | 1 (0.3%) | 46 (9.5%) |
| 85 Years and over | 0 (0.0%) | 9 (1.8%) |
| Total | 377 (100.0%) | 487 (100.0%) |
Families and Households in Crenshaw
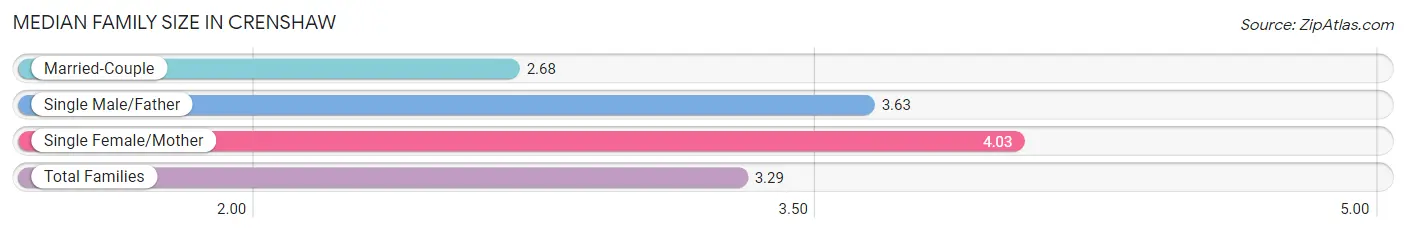
Median Family Size in Crenshaw
The median family size in Crenshaw is 3.29 persons per family, with single female/mother families (79 | 37.1%) accounting for the largest median family size of 4.03 persons per family. On the other hand, married-couple families (110 | 51.6%) represent the smallest median family size with 2.68 persons per family.
| Family Type | # Families | Family Size |
| Married-Couple | 110 (51.6%) | 2.68 |
| Single Male/Father | 24 (11.3%) | 3.63 |
| Single Female/Mother | 79 (37.1%) | 4.03 |
| Total Families | 213 (100.0%) | 3.29 |
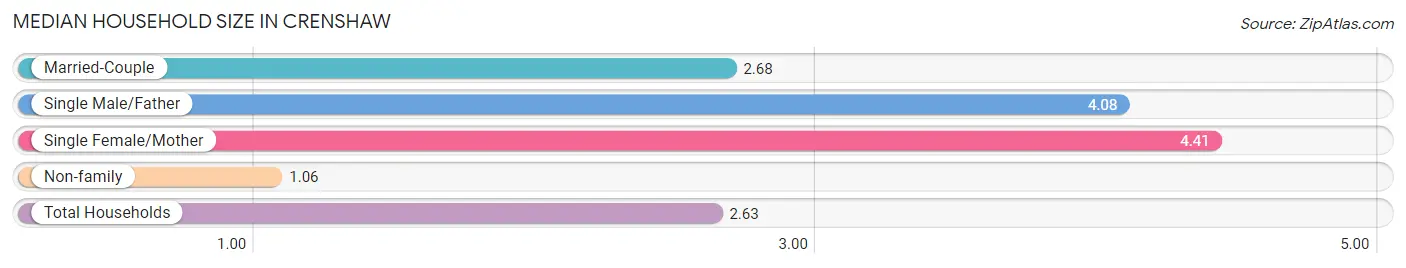
Median Household Size in Crenshaw
The median household size in Crenshaw is 2.63 persons per household, with single female/mother households (79 | 24.0%) accounting for the largest median household size of 4.41 persons per household. non-family households (116 | 35.3%) represent the smallest median household size with 1.06 persons per household.
| Household Type | # Households | Household Size |
| Married-Couple | 110 (33.4%) | 2.68 |
| Single Male/Father | 24 (7.3%) | 4.08 |
| Single Female/Mother | 79 (24.0%) | 4.41 |
| Non-family | 116 (35.3%) | 1.06 |
| Total Households | 329 (100.0%) | 2.63 |
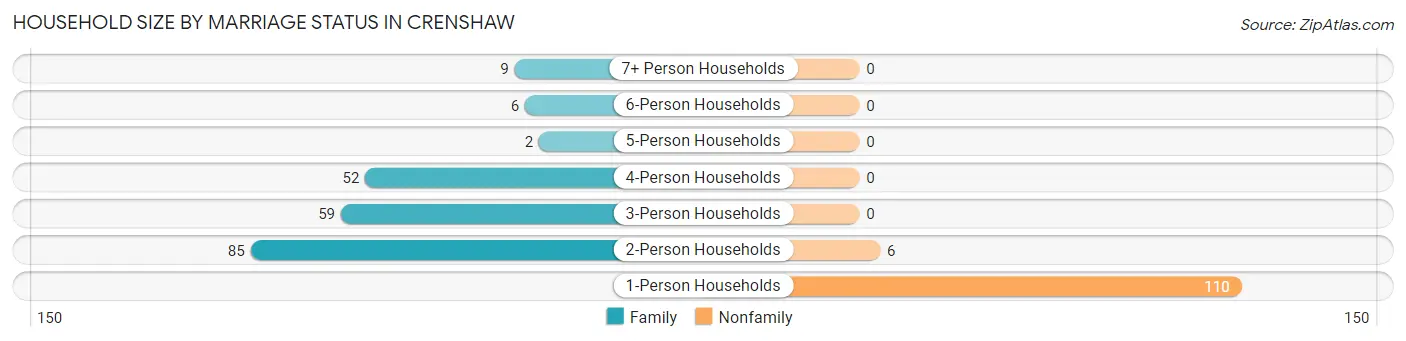
Household Size by Marriage Status in Crenshaw
Out of a total of 329 households in Crenshaw, 213 (64.7%) are family households, while 116 (35.3%) are nonfamily households. The most numerous type of family households are 2-person households, comprising 85, and the most common type of nonfamily households are 1-person households, comprising 110.
| Household Size | Family Households | Nonfamily Households |
| 1-Person Households | - | 110 (33.4%) |
| 2-Person Households | 85 (25.8%) | 6 (1.8%) |
| 3-Person Households | 59 (17.9%) | 0 (0.0%) |
| 4-Person Households | 52 (15.8%) | 0 (0.0%) |
| 5-Person Households | 2 (0.6%) | 0 (0.0%) |
| 6-Person Households | 6 (1.8%) | 0 (0.0%) |
| 7+ Person Households | 9 (2.7%) | 0 (0.0%) |
| Total | 213 (64.7%) | 116 (35.3%) |
Female Fertility in Crenshaw
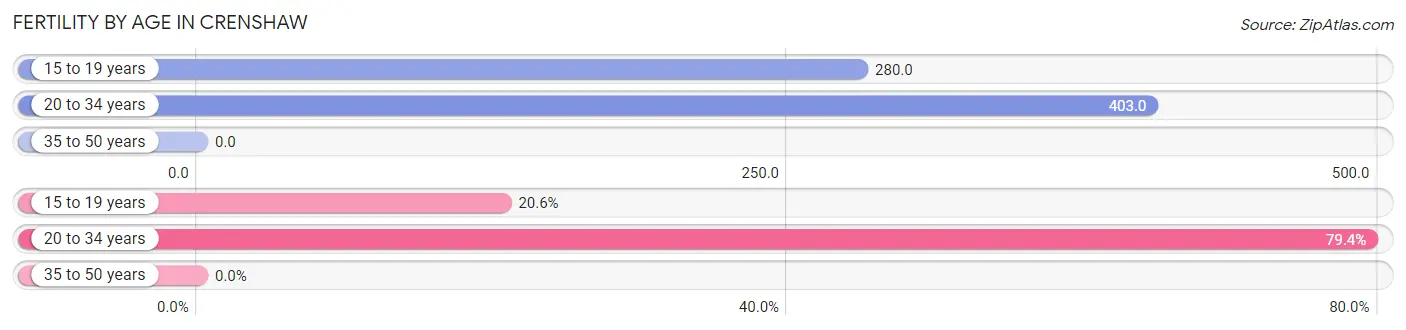
Fertility by Age in Crenshaw
Average fertility rate in Crenshaw is 149.0 births per 1,000 women. Women in the age bracket of 20 to 34 years have the highest fertility rate with 403.0 births per 1,000 women. Women in the age bracket of 20 to 34 years acount for 79.4% of all women with births.
| Age Bracket | Women with Births | Births / 1,000 Women |
| 15 to 19 years | 7 (20.6%) | 280.0 |
| 20 to 34 years | 27 (79.4%) | 403.0 |
| 35 to 50 years | 0 (0.0%) | 0.0 |
| Total | 34 (100.0%) | 149.0 |
Fertility by Age by Marriage Status in Crenshaw
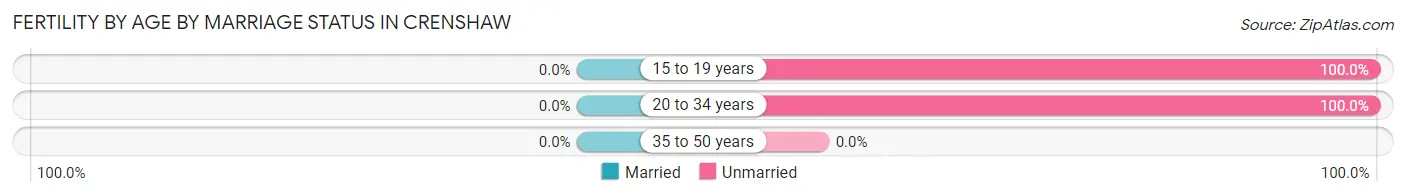
| Age Bracket | Married | Unmarried |
| 15 to 19 years | 0 (0.0%) | 7 (100.0%) |
| 20 to 34 years | 0 (0.0%) | 27 (100.0%) |
| 35 to 50 years | 0 (0.0%) | 0 (0.0%) |
| Total | 0 (0.0%) | 34 (100.0%) |
Fertility by Education in Crenshaw
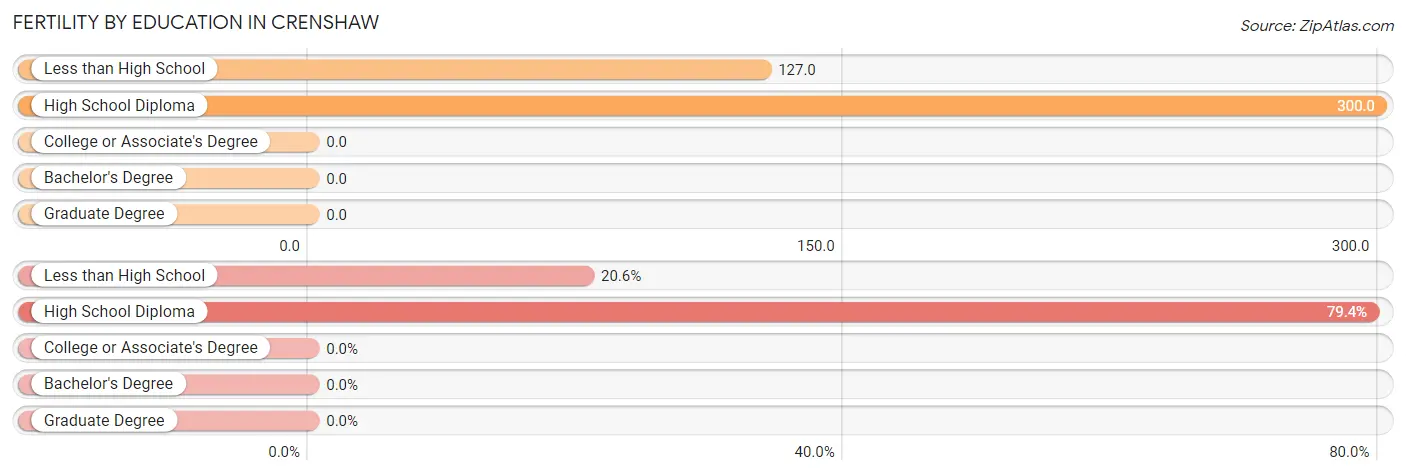
| Educational Attainment | Women with Births | Births / 1,000 Women |
| Less than High School | 7 (20.6%) | 127.0 |
| High School Diploma | 27 (79.4%) | 300.0 |
| College or Associate's Degree | 0 (0.0%) | 0.0 |
| Bachelor's Degree | 0 (0.0%) | 0.0 |
| Graduate Degree | 0 (0.0%) | 0.0 |
| Total | 34 (100.0%) | 149.0 |
Fertility by Education by Marriage Status in Crenshaw
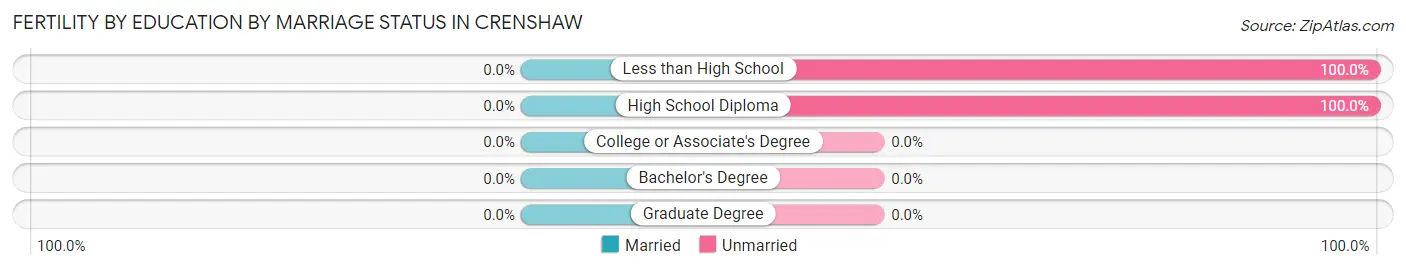
| Educational Attainment | Married | Unmarried |
| Less than High School | 0 (0.0%) | 7 (100.0%) |
| High School Diploma | 0 (0.0%) | 27 (100.0%) |
| College or Associate's Degree | 0 (0.0%) | 0 (0.0%) |
| Bachelor's Degree | 0 (0.0%) | 0 (0.0%) |
| Graduate Degree | 0 (0.0%) | 0 (0.0%) |
| Total | 0 (0.0%) | 34 (100.0%) |
Employment Characteristics in Crenshaw
Employment by Class of Employer in Crenshaw
Among the 288 employed individuals in Crenshaw, private company employees (189 | 65.6%), local government employees (40 | 13.9%), and state government employees (25 | 8.7%) make up the most common classes of employment.
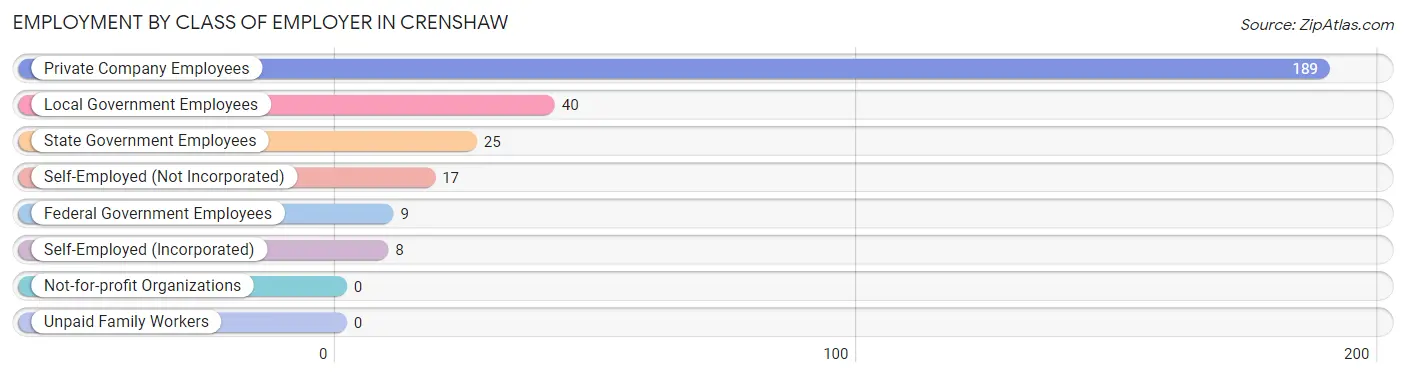
| Employer Class | # Employees | % Employees |
| Private Company Employees | 189 | 65.6% |
| Self-Employed (Incorporated) | 8 | 2.8% |
| Self-Employed (Not Incorporated) | 17 | 5.9% |
| Not-for-profit Organizations | 0 | 0.0% |
| Local Government Employees | 40 | 13.9% |
| State Government Employees | 25 | 8.7% |
| Federal Government Employees | 9 | 3.1% |
| Unpaid Family Workers | 0 | 0.0% |
| Total | 288 | 100.0% |
Employment Status by Age in Crenshaw
According to the labor force statistics for Crenshaw, out of the total population over 16 years of age (647), 54.6% or 353 individuals are in the labor force, with 17.6% or 62 of them unemployed. The age group with the highest labor force participation rate is 25 to 29 years, with 91.3% or 21 individuals in the labor force. Within the labor force, the 25 to 29 years age range has the highest percentage of unemployed individuals, with 61.9% or 13 of them being unemployed.
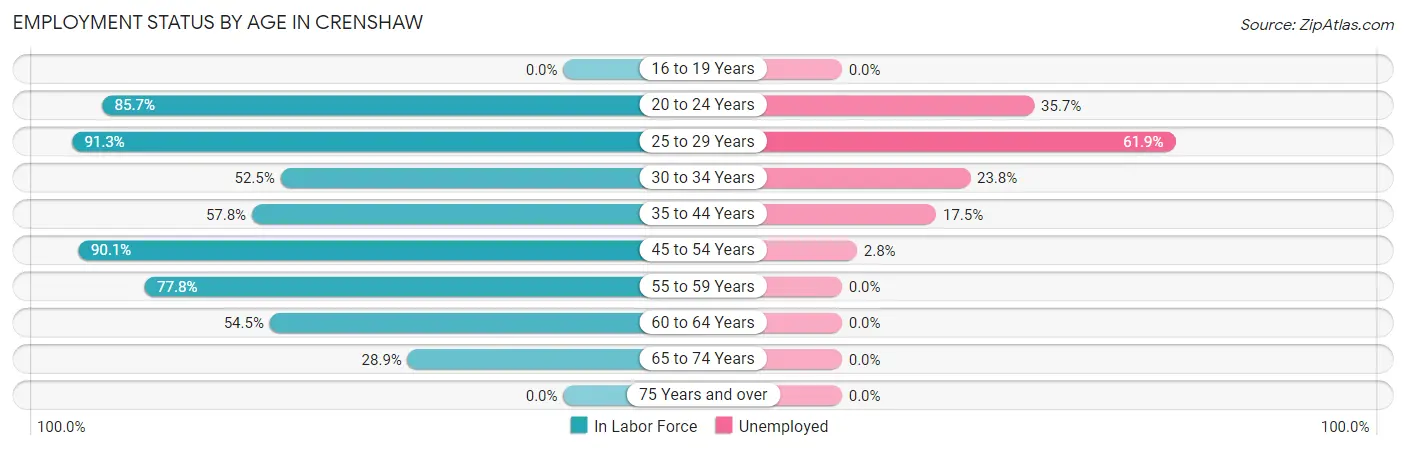
| Age Bracket | In Labor Force | Unemployed |
| 16 to 19 Years | 0 (0.0%) | 0 (0.0%) |
| 20 to 24 Years | 84 (85.7%) | 30 (35.7%) |
| 25 to 29 Years | 21 (91.3%) | 13 (61.9%) |
| 30 to 34 Years | 21 (52.5%) | 5 (23.8%) |
| 35 to 44 Years | 63 (57.8%) | 11 (17.5%) |
| 45 to 54 Years | 109 (90.1%) | 3 (2.8%) |
| 55 to 59 Years | 21 (77.8%) | 0 (0.0%) |
| 60 to 64 Years | 12 (54.5%) | 0 (0.0%) |
| 65 to 74 Years | 22 (28.9%) | 0 (0.0%) |
| 75 Years and over | 0 (0.0%) | 0 (0.0%) |
| Total | 353 (54.6%) | 62 (17.6%) |
Employment Status by Educational Attainment in Crenshaw
According to labor force statistics for Crenshaw, 72.2% of individuals (247) out of the total population between 25 and 64 years of age (342) are in the labor force, with 13.0% or 32 of them being unemployed. The group with the highest labor force participation rate are those with the educational attainment of college / associate degree, with 91.0% or 71 individuals in the labor force. Within the labor force, individuals with college / associate degree education have the highest percentage of unemployment, with 15.5% or 11 of them being unemployed.
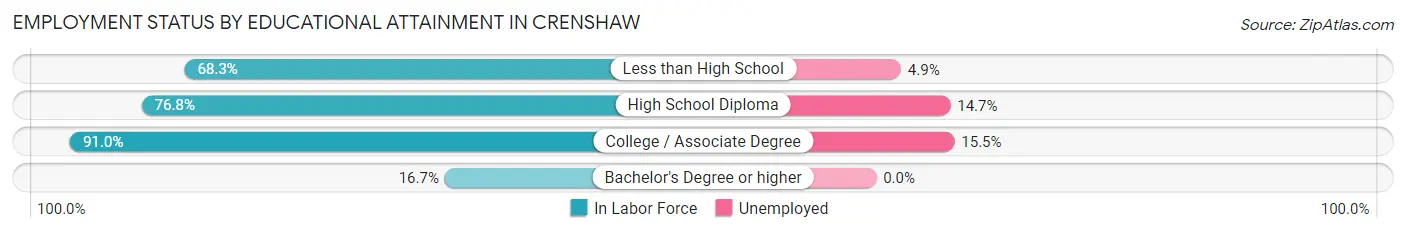
| Educational Attainment | In Labor Force | Unemployed |
| Less than High School | 41 (68.3%) | 3 (4.9%) |
| High School Diploma | 129 (76.8%) | 25 (14.7%) |
| College / Associate Degree | 71 (91.0%) | 12 (15.5%) |
| Bachelor's Degree or higher | 6 (16.7%) | 0 (0.0%) |
| Total | 247 (72.2%) | 44 (13.0%) |
Employment Occupations by Sex in Crenshaw
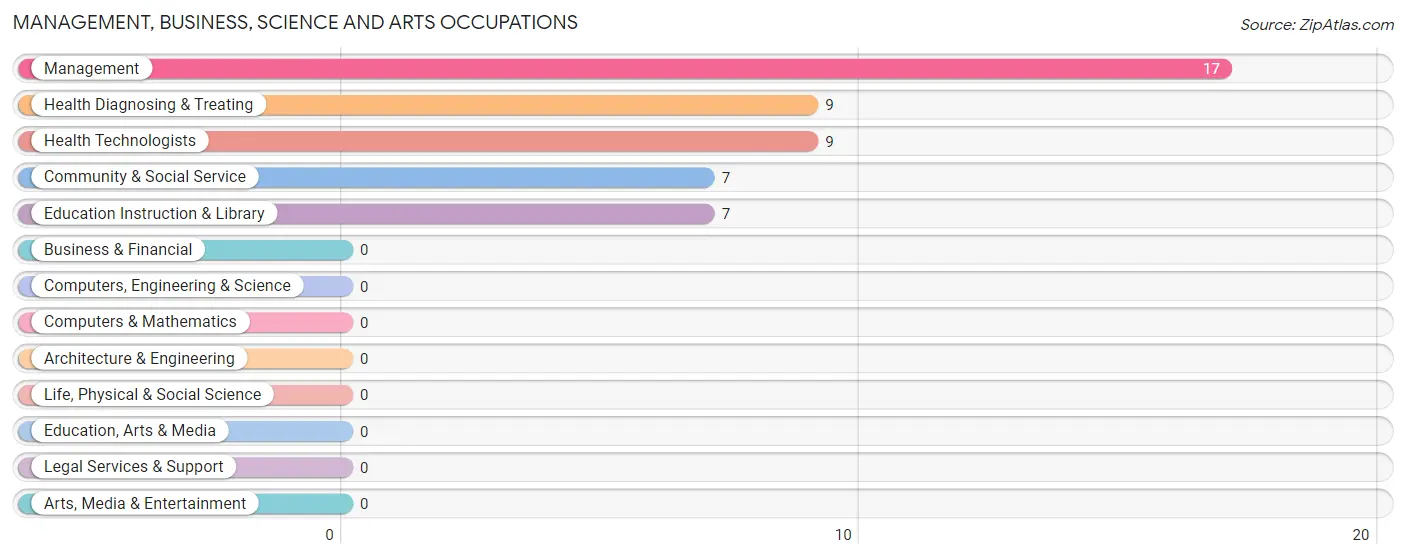
Management, Business, Science and Arts Occupations
The most common Management, Business, Science and Arts occupations in Crenshaw are Management (17 | 5.8%), Health Diagnosing & Treating (9 | 3.1%), Health Technologists (9 | 3.1%), Community & Social Service (7 | 2.4%), and Education Instruction & Library (7 | 2.4%).
Management, Business, Science and Arts Occupations by Sex
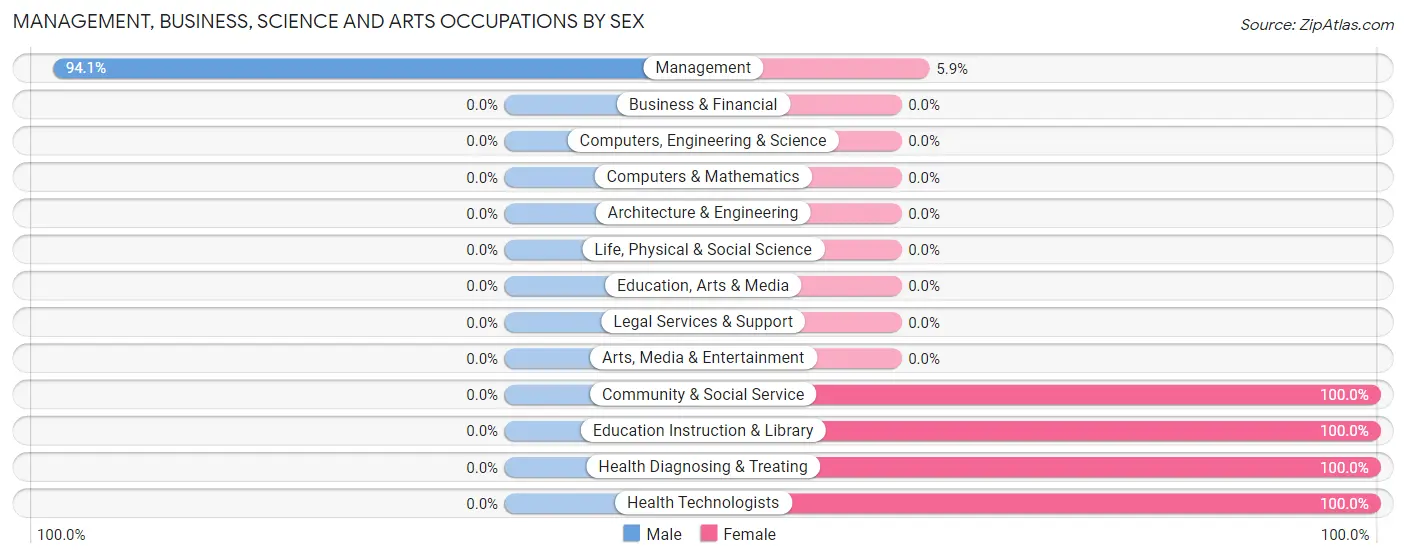
| Occupation | Male | Female |
| Management | 16 (94.1%) | 1 (5.9%) |
| Business & Financial | 0 (0.0%) | 0 (0.0%) |
| Computers, Engineering & Science | 0 (0.0%) | 0 (0.0%) |
| Computers & Mathematics | 0 (0.0%) | 0 (0.0%) |
| Architecture & Engineering | 0 (0.0%) | 0 (0.0%) |
| Life, Physical & Social Science | 0 (0.0%) | 0 (0.0%) |
| Community & Social Service | 0 (0.0%) | 7 (100.0%) |
| Education, Arts & Media | 0 (0.0%) | 0 (0.0%) |
| Legal Services & Support | 0 (0.0%) | 0 (0.0%) |
| Education Instruction & Library | 0 (0.0%) | 7 (100.0%) |
| Arts, Media & Entertainment | 0 (0.0%) | 0 (0.0%) |
| Health Diagnosing & Treating | 0 (0.0%) | 9 (100.0%) |
| Health Technologists | 0 (0.0%) | 9 (100.0%) |
| Total (Category) | 16 (48.5%) | 17 (51.5%) |
| Total (Overall) | 144 (49.5%) | 147 (50.5%) |
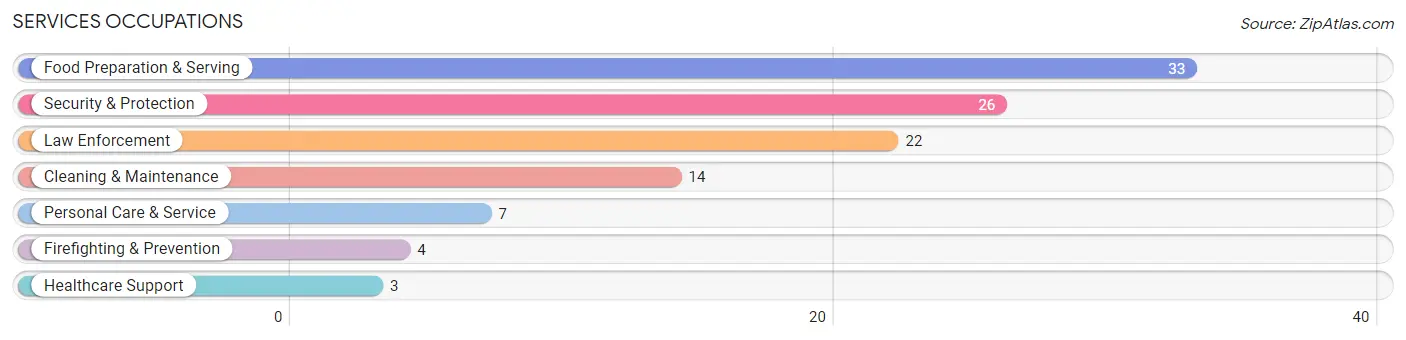
Services Occupations
The most common Services occupations in Crenshaw are Food Preparation & Serving (33 | 11.3%), Security & Protection (26 | 8.9%), Law Enforcement (22 | 7.6%), Cleaning & Maintenance (14 | 4.8%), and Personal Care & Service (7 | 2.4%).
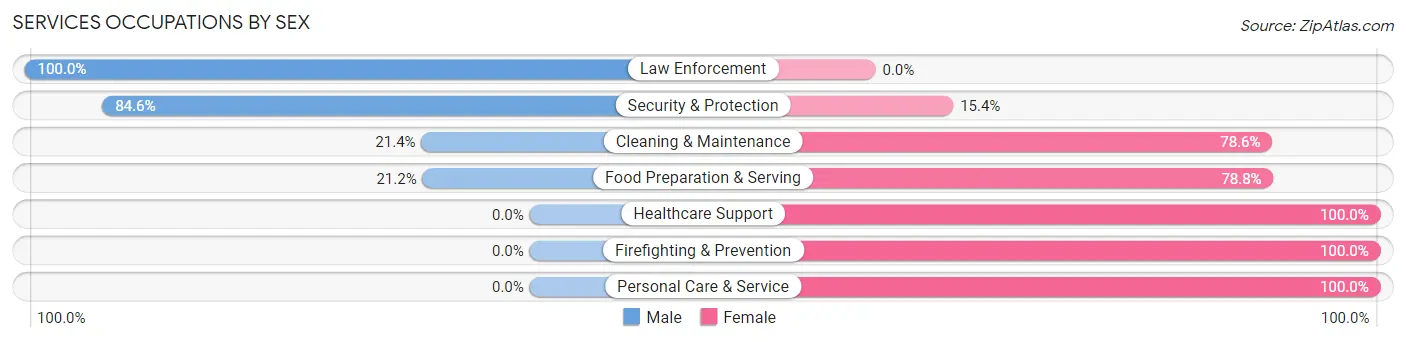
Services Occupations by Sex
Within the Services occupations in Crenshaw, the most male-oriented occupations are Law Enforcement (100.0%), Security & Protection (84.6%), and Cleaning & Maintenance (21.4%), while the most female-oriented occupations are Healthcare Support (100.0%), Firefighting & Prevention (100.0%), and Personal Care & Service (100.0%).
| Occupation | Male | Female |
| Healthcare Support | 0 (0.0%) | 3 (100.0%) |
| Security & Protection | 22 (84.6%) | 4 (15.4%) |
| Firefighting & Prevention | 0 (0.0%) | 4 (100.0%) |
| Law Enforcement | 22 (100.0%) | 0 (0.0%) |
| Food Preparation & Serving | 7 (21.2%) | 26 (78.8%) |
| Cleaning & Maintenance | 3 (21.4%) | 11 (78.6%) |
| Personal Care & Service | 0 (0.0%) | 7 (100.0%) |
| Total (Category) | 32 (38.6%) | 51 (61.5%) |
| Total (Overall) | 144 (49.5%) | 147 (50.5%) |
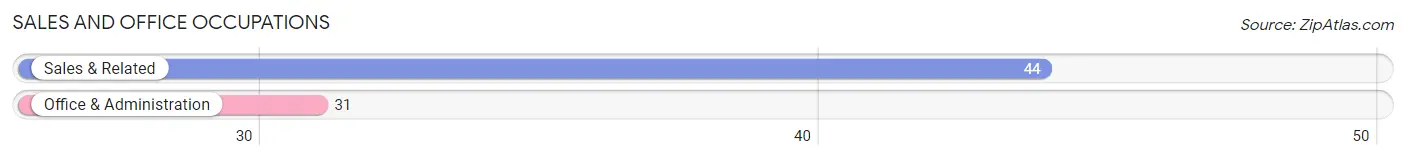
Sales and Office Occupations
The most common Sales and Office occupations in Crenshaw are Sales & Related (44 | 15.1%), and Office & Administration (31 | 10.6%).
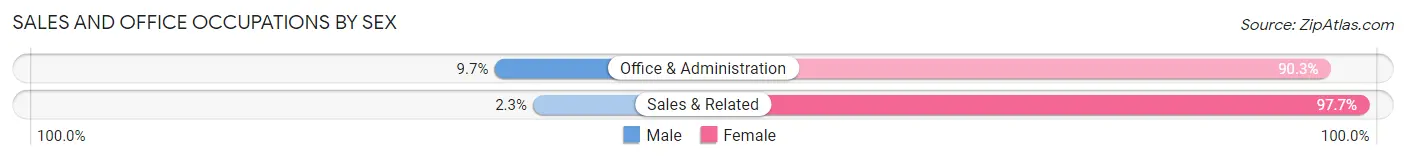
Sales and Office Occupations by Sex
| Occupation | Male | Female |
| Sales & Related | 1 (2.3%) | 43 (97.7%) |
| Office & Administration | 3 (9.7%) | 28 (90.3%) |
| Total (Category) | 4 (5.3%) | 71 (94.7%) |
| Total (Overall) | 144 (49.5%) | 147 (50.5%) |
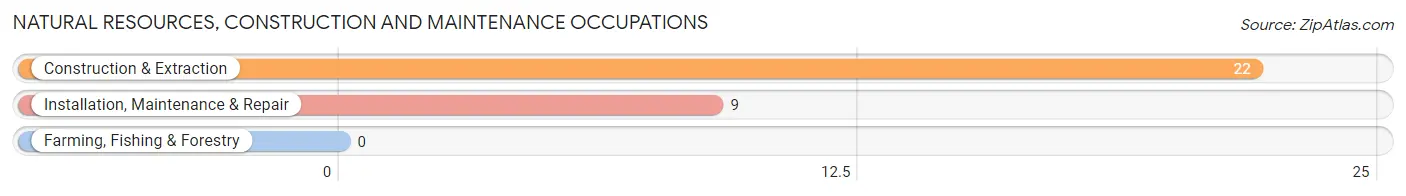
Natural Resources, Construction and Maintenance Occupations
The most common Natural Resources, Construction and Maintenance occupations in Crenshaw are Construction & Extraction (22 | 7.6%), and Installation, Maintenance & Repair (9 | 3.1%).
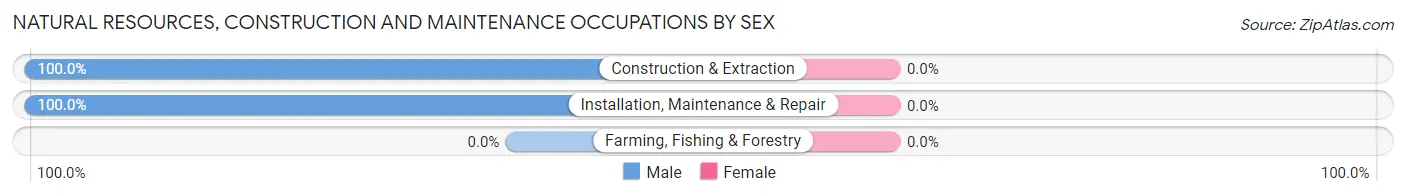
Natural Resources, Construction and Maintenance Occupations by Sex
| Occupation | Male | Female |
| Farming, Fishing & Forestry | 0 (0.0%) | 0 (0.0%) |
| Construction & Extraction | 22 (100.0%) | 0 (0.0%) |
| Installation, Maintenance & Repair | 9 (100.0%) | 0 (0.0%) |
| Total (Category) | 31 (100.0%) | 0 (0.0%) |
| Total (Overall) | 144 (49.5%) | 147 (50.5%) |
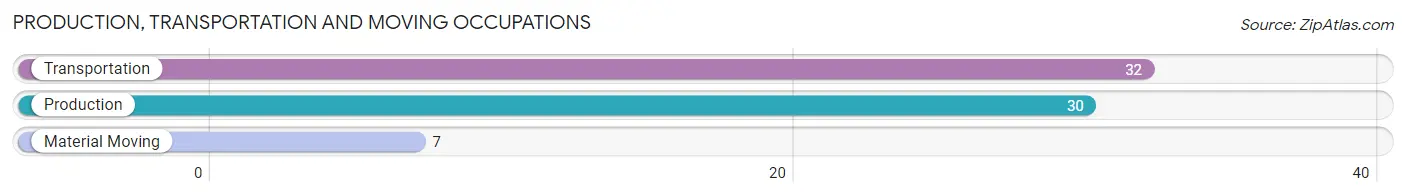
Production, Transportation and Moving Occupations
The most common Production, Transportation and Moving occupations in Crenshaw are Transportation (32 | 11.0%), Production (30 | 10.3%), and Material Moving (7 | 2.4%).
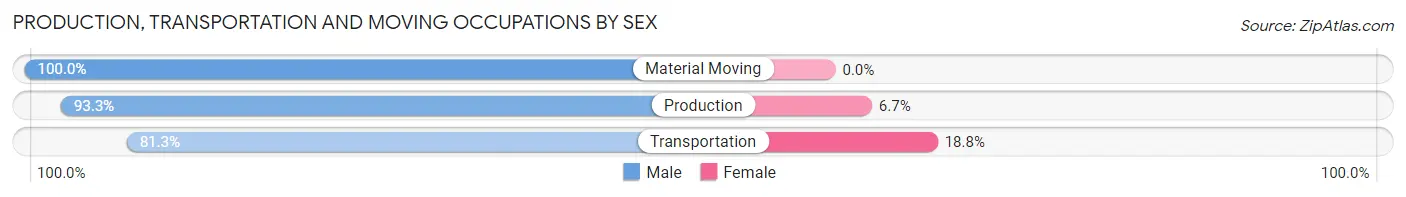
Production, Transportation and Moving Occupations by Sex
| Occupation | Male | Female |
| Production | 28 (93.3%) | 2 (6.7%) |
| Transportation | 26 (81.2%) | 6 (18.8%) |
| Material Moving | 7 (100.0%) | 0 (0.0%) |
| Total (Category) | 61 (88.4%) | 8 (11.6%) |
| Total (Overall) | 144 (49.5%) | 147 (50.5%) |
Employment Industries by Sex in Crenshaw
Employment Industries in Crenshaw
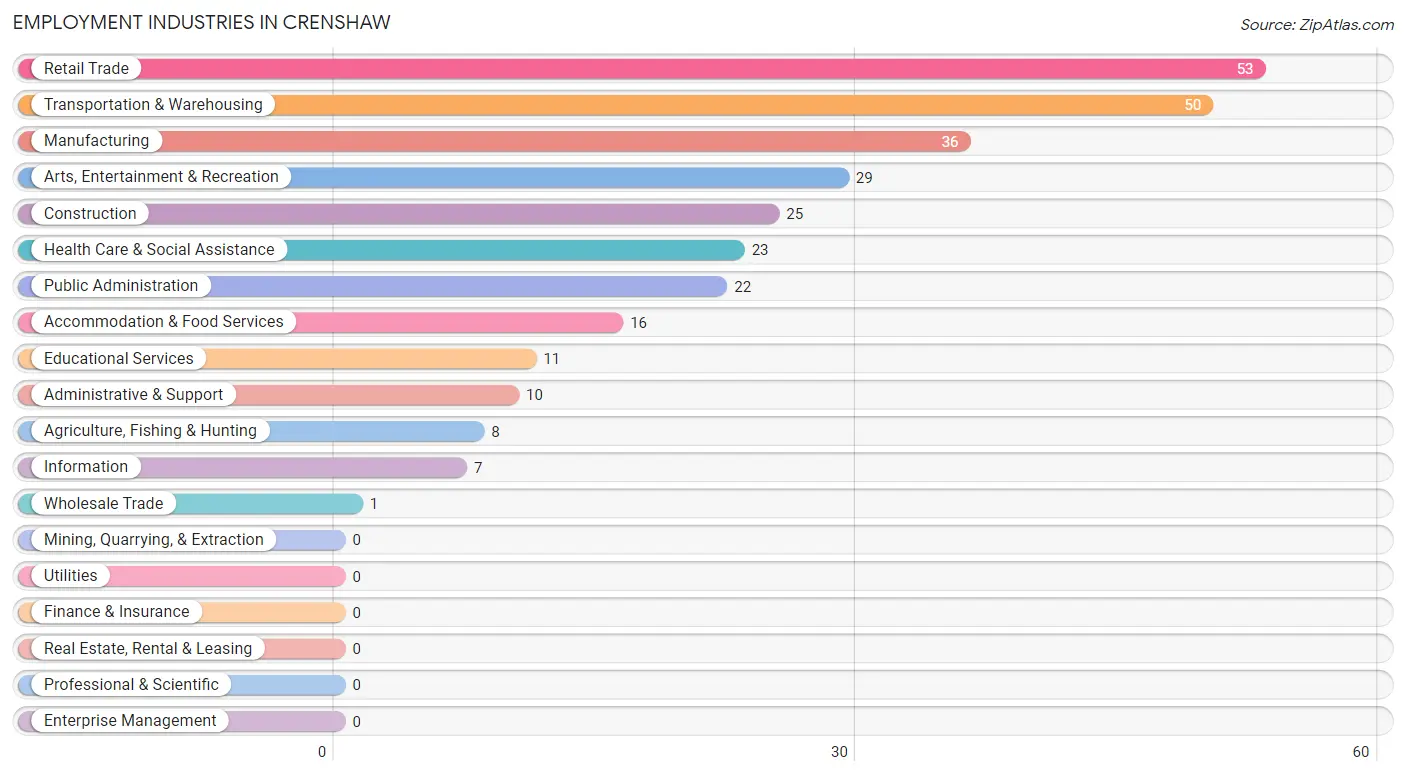
The major employment industries in Crenshaw include Retail Trade (53 | 18.2%), Transportation & Warehousing (50 | 17.2%), Manufacturing (36 | 12.4%), Arts, Entertainment & Recreation (29 | 10.0%), and Construction (25 | 8.6%).
Employment Industries by Sex in Crenshaw
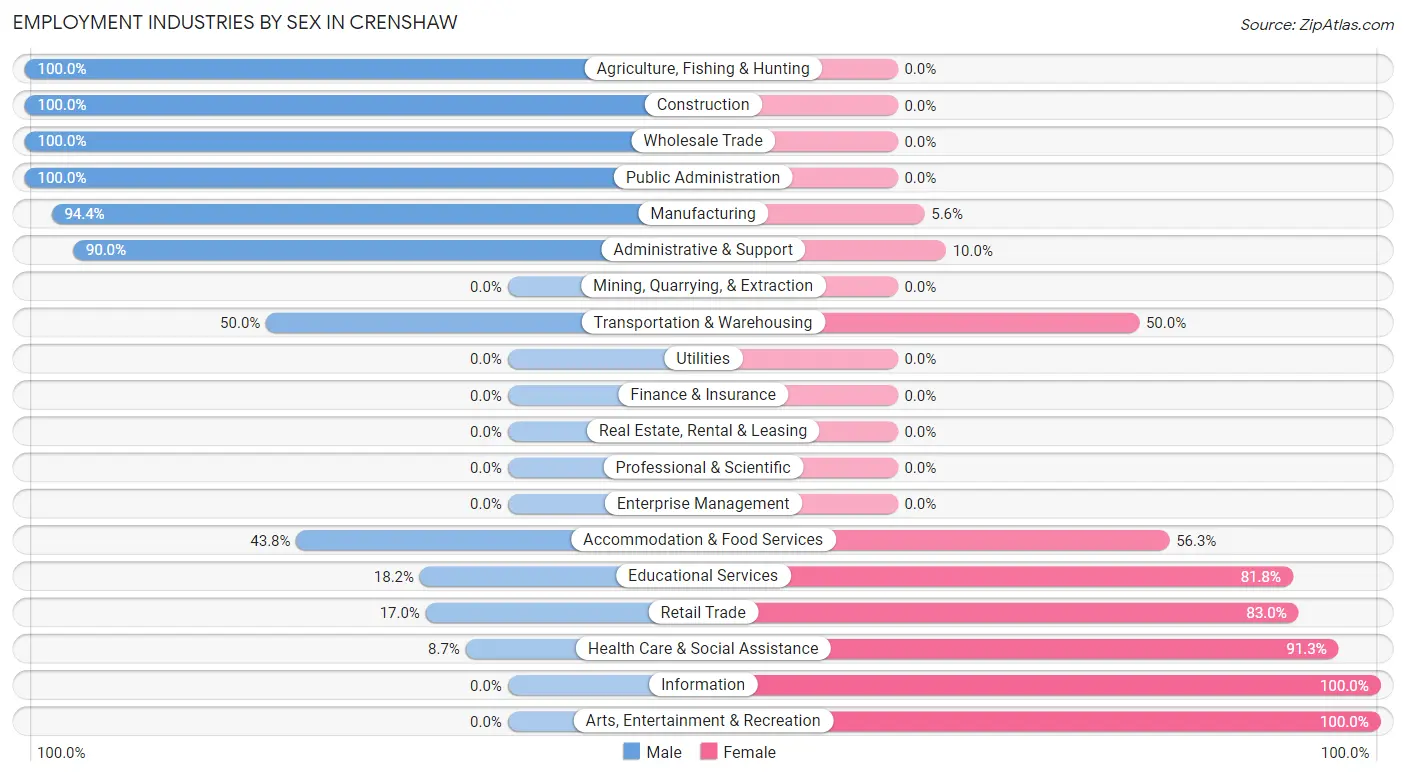
The Crenshaw industries that see more men than women are Agriculture, Fishing & Hunting (100.0%), Construction (100.0%), and Wholesale Trade (100.0%), whereas the industries that tend to have a higher number of women are Information (100.0%), Arts, Entertainment & Recreation (100.0%), and Health Care & Social Assistance (91.3%).
| Industry | Male | Female |
| Agriculture, Fishing & Hunting | 8 (100.0%) | 0 (0.0%) |
| Mining, Quarrying, & Extraction | 0 (0.0%) | 0 (0.0%) |
| Construction | 25 (100.0%) | 0 (0.0%) |
| Manufacturing | 34 (94.4%) | 2 (5.6%) |
| Wholesale Trade | 1 (100.0%) | 0 (0.0%) |
| Retail Trade | 9 (17.0%) | 44 (83.0%) |
| Transportation & Warehousing | 25 (50.0%) | 25 (50.0%) |
| Utilities | 0 (0.0%) | 0 (0.0%) |
| Information | 0 (0.0%) | 7 (100.0%) |
| Finance & Insurance | 0 (0.0%) | 0 (0.0%) |
| Real Estate, Rental & Leasing | 0 (0.0%) | 0 (0.0%) |
| Professional & Scientific | 0 (0.0%) | 0 (0.0%) |
| Enterprise Management | 0 (0.0%) | 0 (0.0%) |
| Administrative & Support | 9 (90.0%) | 1 (10.0%) |
| Educational Services | 2 (18.2%) | 9 (81.8%) |
| Health Care & Social Assistance | 2 (8.7%) | 21 (91.3%) |
| Arts, Entertainment & Recreation | 0 (0.0%) | 29 (100.0%) |
| Accommodation & Food Services | 7 (43.8%) | 9 (56.2%) |
| Public Administration | 22 (100.0%) | 0 (0.0%) |
| Total | 144 (49.5%) | 147 (50.5%) |
Education in Crenshaw
School Enrollment in Crenshaw
The most common levels of schooling among the 170 students in Crenshaw are elementary school (79 | 46.5%), middle school (37 | 21.8%), and high school (18 | 10.6%).

| School Level | # Students | % Students |
| Nursery / Preschool | 11 | 6.5% |
| Kindergarten | 8 | 4.7% |
| Elementary School | 79 | 46.5% |
| Middle School | 37 | 21.8% |
| High School | 18 | 10.6% |
| College / Undergraduate | 17 | 10.0% |
| Graduate / Professional | 0 | 0.0% |
| Total | 170 | 100.0% |
School Enrollment by Age by Funding Source in Crenshaw
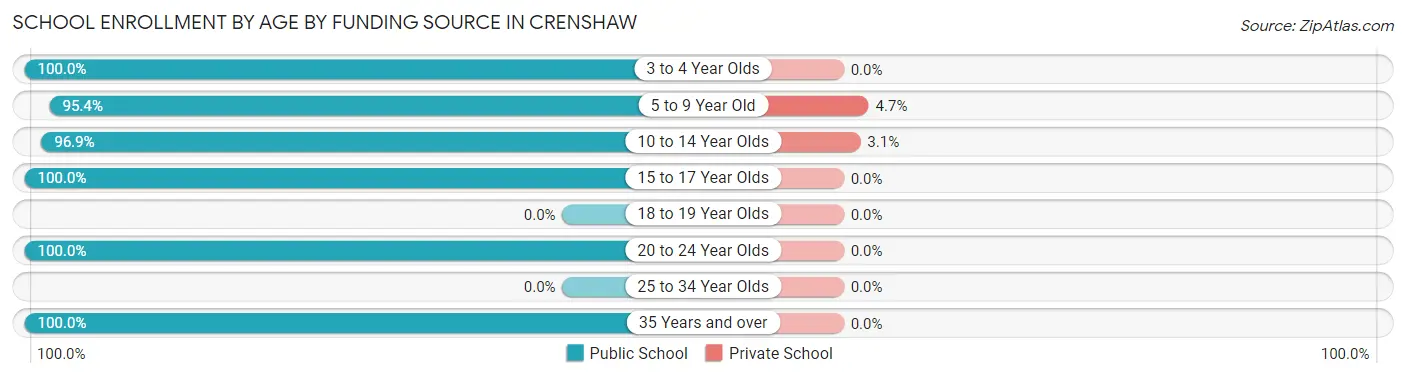
Out of a total of 170 students who are enrolled in schools in Crenshaw, 5 (2.9%) attend a private institution, while the remaining 165 (97.1%) are enrolled in public schools. The age group of 5 to 9 year old has the highest likelihood of being enrolled in private schools, with 2 (4.6% in the age bracket) enrolled. Conversely, the age group of 3 to 4 year olds has the lowest likelihood of being enrolled in a private school, with 4 (100.0% in the age bracket) attending a public institution.
| Age Bracket | Public School | Private School |
| 3 to 4 Year Olds | 4 (100.0%) | 0 (0.0%) |
| 5 to 9 Year Old | 41 (95.4%) | 2 (4.6%) |
| 10 to 14 Year Olds | 93 (96.9%) | 3 (3.1%) |
| 15 to 17 Year Olds | 10 (100.0%) | 0 (0.0%) |
| 18 to 19 Year Olds | 0 (0.0%) | 0 (0.0%) |
| 20 to 24 Year Olds | 15 (100.0%) | 0 (0.0%) |
| 25 to 34 Year Olds | 0 (0.0%) | 0 (0.0%) |
| 35 Years and over | 2 (100.0%) | 0 (0.0%) |
| Total | 165 (97.1%) | 5 (2.9%) |
Educational Attainment by Field of Study in Crenshaw
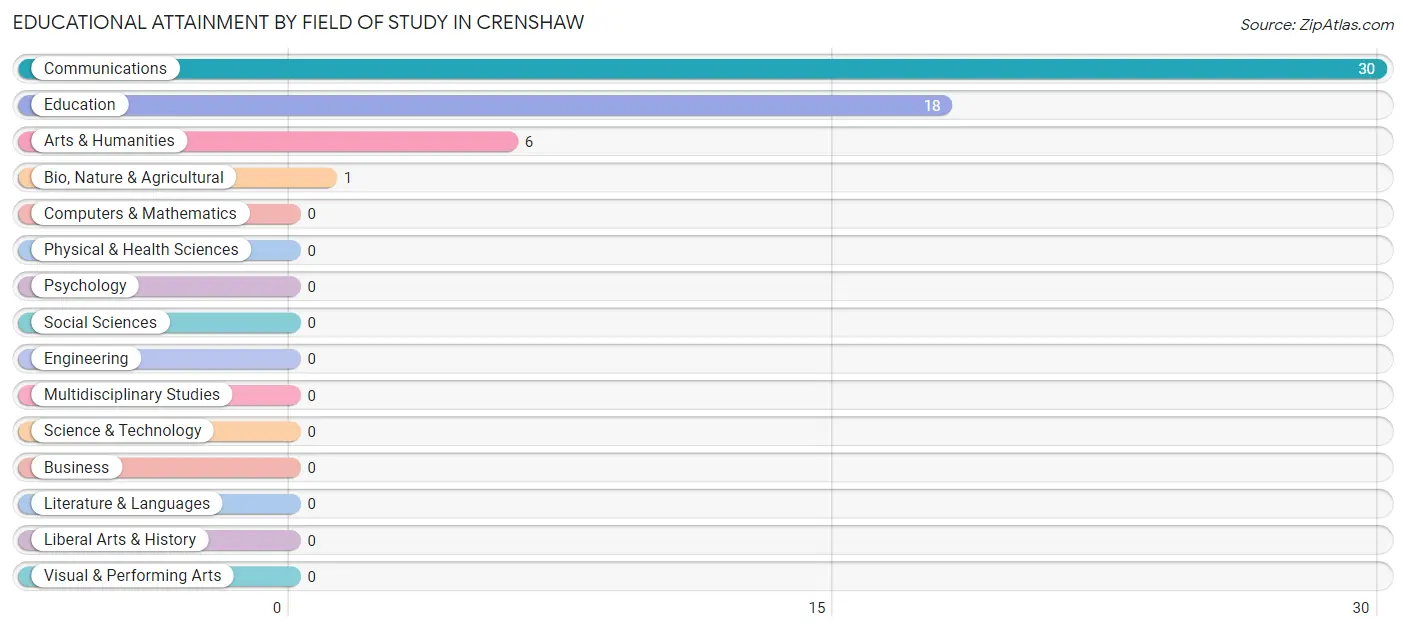
Communications (30 | 54.5%), education (18 | 32.7%), arts & humanities (6 | 10.9%), and bio, nature & agricultural (1 | 1.8%) are the most common fields of study among 55 individuals in Crenshaw who have obtained a bachelor's degree or higher.
| Field of Study | # Graduates | % Graduates |
| Computers & Mathematics | 0 | 0.0% |
| Bio, Nature & Agricultural | 1 | 1.8% |
| Physical & Health Sciences | 0 | 0.0% |
| Psychology | 0 | 0.0% |
| Social Sciences | 0 | 0.0% |
| Engineering | 0 | 0.0% |
| Multidisciplinary Studies | 0 | 0.0% |
| Science & Technology | 0 | 0.0% |
| Business | 0 | 0.0% |
| Education | 18 | 32.7% |
| Literature & Languages | 0 | 0.0% |
| Liberal Arts & History | 0 | 0.0% |
| Visual & Performing Arts | 0 | 0.0% |
| Communications | 30 | 54.5% |
| Arts & Humanities | 6 | 10.9% |
| Total | 55 | 100.0% |
Transportation & Commute in Crenshaw
Vehicle Availability by Sex in Crenshaw
The most prevalent vehicle ownership categories in Crenshaw are males with 2 vehicles (89, accounting for 63.1%) and females with 2 vehicles (70, making up 60.5%).
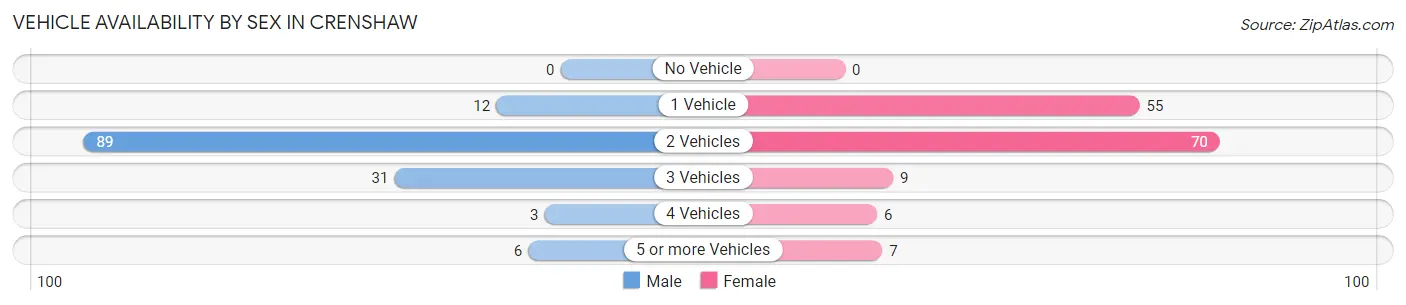
| Vehicles Available | Male | Female |
| No Vehicle | 0 (0.0%) | 0 (0.0%) |
| 1 Vehicle | 12 (8.5%) | 55 (37.4%) |
| 2 Vehicles | 89 (63.1%) | 70 (47.6%) |
| 3 Vehicles | 31 (22.0%) | 9 (6.1%) |
| 4 Vehicles | 3 (2.1%) | 6 (4.1%) |
| 5 or more Vehicles | 6 (4.3%) | 7 (4.8%) |
| Total | 141 (100.0%) | 147 (100.0%) |
Commute Time in Crenshaw
The most frequently occuring commute durations in Crenshaw are 30 to 34 minutes (69 commuters, 24.3%), 60 to 89 minutes (43 commuters, 15.1%), and less than 5 minutes (38 commuters, 13.4%).
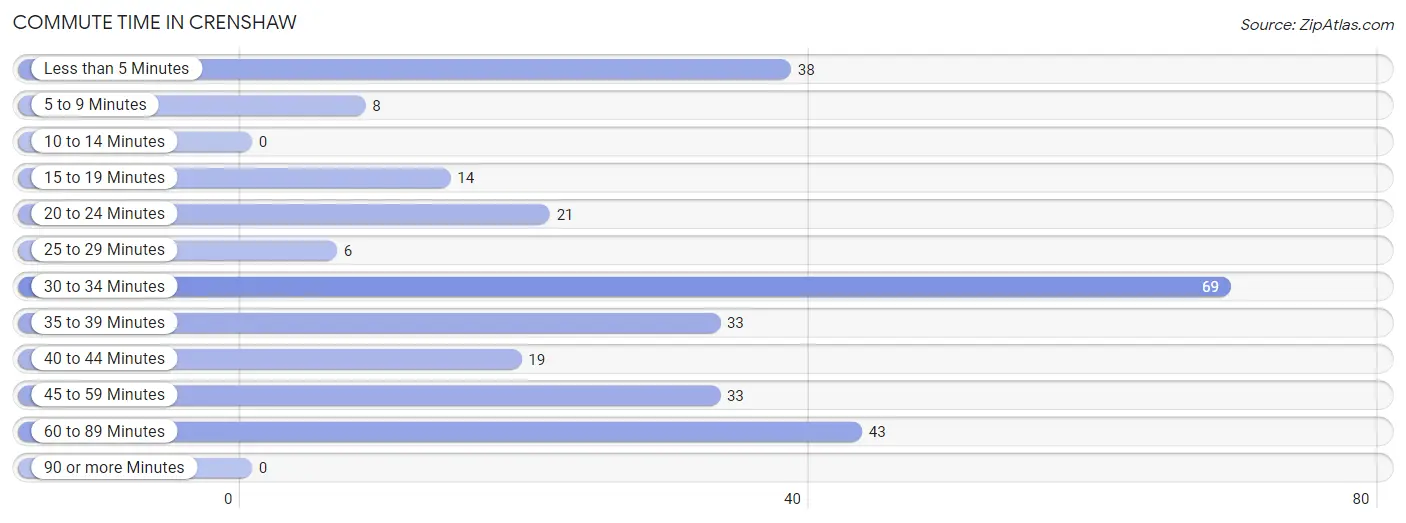
| Commute Time | # Commuters | % Commuters |
| Less than 5 Minutes | 38 | 13.4% |
| 5 to 9 Minutes | 8 | 2.8% |
| 10 to 14 Minutes | 0 | 0.0% |
| 15 to 19 Minutes | 14 | 4.9% |
| 20 to 24 Minutes | 21 | 7.4% |
| 25 to 29 Minutes | 6 | 2.1% |
| 30 to 34 Minutes | 69 | 24.3% |
| 35 to 39 Minutes | 33 | 11.6% |
| 40 to 44 Minutes | 19 | 6.7% |
| 45 to 59 Minutes | 33 | 11.6% |
| 60 to 89 Minutes | 43 | 15.1% |
| 90 or more Minutes | 0 | 0.0% |
Commute Time by Sex in Crenshaw
The most common commute times in Crenshaw are 30 to 34 minutes (33 commuters, 23.4%) for males and 30 to 34 minutes (36 commuters, 25.2%) for females.
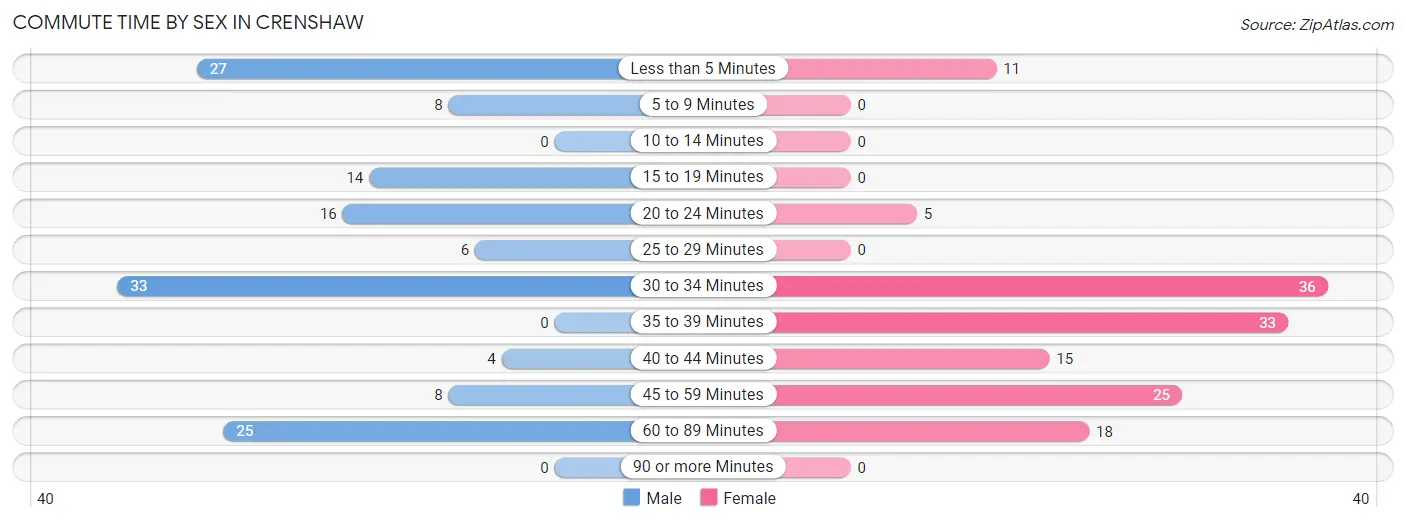
| Commute Time | Male | Female |
| Less than 5 Minutes | 27 (19.2%) | 11 (7.7%) |
| 5 to 9 Minutes | 8 (5.7%) | 0 (0.0%) |
| 10 to 14 Minutes | 0 (0.0%) | 0 (0.0%) |
| 15 to 19 Minutes | 14 (9.9%) | 0 (0.0%) |
| 20 to 24 Minutes | 16 (11.4%) | 5 (3.5%) |
| 25 to 29 Minutes | 6 (4.3%) | 0 (0.0%) |
| 30 to 34 Minutes | 33 (23.4%) | 36 (25.2%) |
| 35 to 39 Minutes | 0 (0.0%) | 33 (23.1%) |
| 40 to 44 Minutes | 4 (2.8%) | 15 (10.5%) |
| 45 to 59 Minutes | 8 (5.7%) | 25 (17.5%) |
| 60 to 89 Minutes | 25 (17.7%) | 18 (12.6%) |
| 90 or more Minutes | 0 (0.0%) | 0 (0.0%) |
Time of Departure to Work by Sex in Crenshaw
The most frequent times of departure to work in Crenshaw are 6:00 AM to 6:29 AM (46, 32.6%) for males and 12:00 PM to 3:59 PM (64, 44.8%) for females.
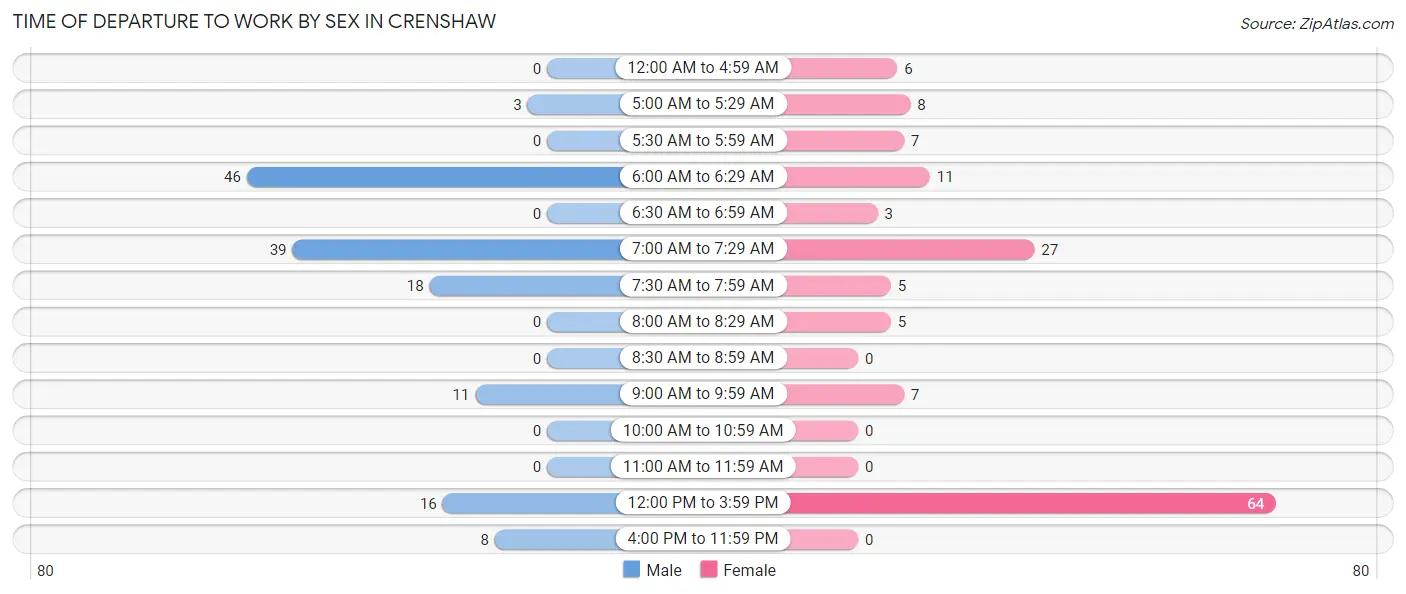
| Time of Departure | Male | Female |
| 12:00 AM to 4:59 AM | 0 (0.0%) | 6 (4.2%) |
| 5:00 AM to 5:29 AM | 3 (2.1%) | 8 (5.6%) |
| 5:30 AM to 5:59 AM | 0 (0.0%) | 7 (4.9%) |
| 6:00 AM to 6:29 AM | 46 (32.6%) | 11 (7.7%) |
| 6:30 AM to 6:59 AM | 0 (0.0%) | 3 (2.1%) |
| 7:00 AM to 7:29 AM | 39 (27.7%) | 27 (18.9%) |
| 7:30 AM to 7:59 AM | 18 (12.8%) | 5 (3.5%) |
| 8:00 AM to 8:29 AM | 0 (0.0%) | 5 (3.5%) |
| 8:30 AM to 8:59 AM | 0 (0.0%) | 0 (0.0%) |
| 9:00 AM to 9:59 AM | 11 (7.8%) | 7 (4.9%) |
| 10:00 AM to 10:59 AM | 0 (0.0%) | 0 (0.0%) |
| 11:00 AM to 11:59 AM | 0 (0.0%) | 0 (0.0%) |
| 12:00 PM to 3:59 PM | 16 (11.4%) | 64 (44.8%) |
| 4:00 PM to 11:59 PM | 8 (5.7%) | 0 (0.0%) |
| Total | 141 (100.0%) | 143 (100.0%) |
Housing Occupancy in Crenshaw
Occupancy by Ownership in Crenshaw
Of the total 329 dwellings in Crenshaw, owner-occupied units account for 172 (52.3%), while renter-occupied units make up 157 (47.7%).
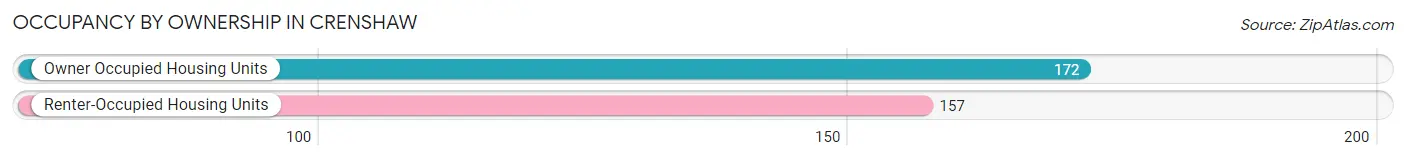
| Occupancy | # Housing Units | % Housing Units |
| Owner Occupied Housing Units | 172 | 52.3% |
| Renter-Occupied Housing Units | 157 | 47.7% |
| Total Occupied Housing Units | 329 | 100.0% |
Occupancy by Household Size in Crenshaw
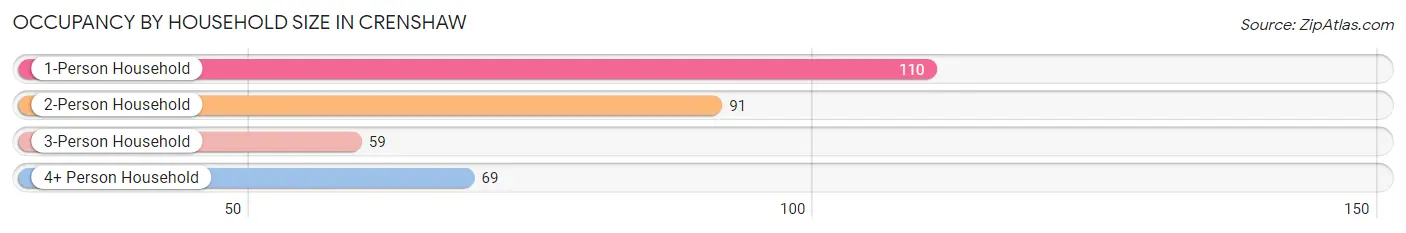
| Household Size | # Housing Units | % Housing Units |
| 1-Person Household | 110 | 33.4% |
| 2-Person Household | 91 | 27.7% |
| 3-Person Household | 59 | 17.9% |
| 4+ Person Household | 69 | 21.0% |
| Total Housing Units | 329 | 100.0% |
Occupancy by Ownership by Household Size in Crenshaw
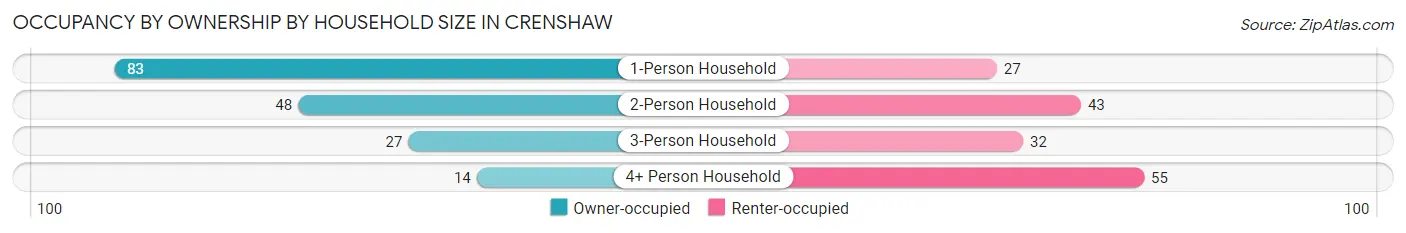
| Household Size | Owner-occupied | Renter-occupied |
| 1-Person Household | 83 (75.4%) | 27 (24.5%) |
| 2-Person Household | 48 (52.7%) | 43 (47.2%) |
| 3-Person Household | 27 (45.8%) | 32 (54.2%) |
| 4+ Person Household | 14 (20.3%) | 55 (79.7%) |
| Total Housing Units | 172 (52.3%) | 157 (47.7%) |
Occupancy by Educational Attainment in Crenshaw
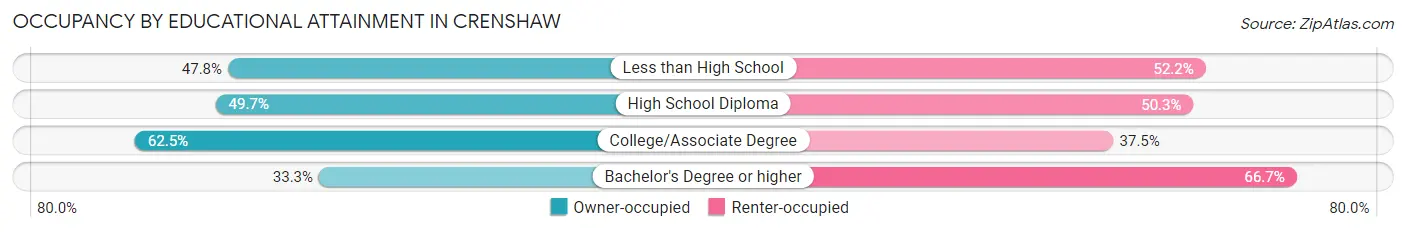
| Household Size | Owner-occupied | Renter-occupied |
| Less than High School | 32 (47.8%) | 35 (52.2%) |
| High School Diploma | 82 (49.7%) | 83 (50.3%) |
| College/Associate Degree | 55 (62.5%) | 33 (37.5%) |
| Bachelor's Degree or higher | 3 (33.3%) | 6 (66.7%) |
Occupancy by Age of Householder in Crenshaw
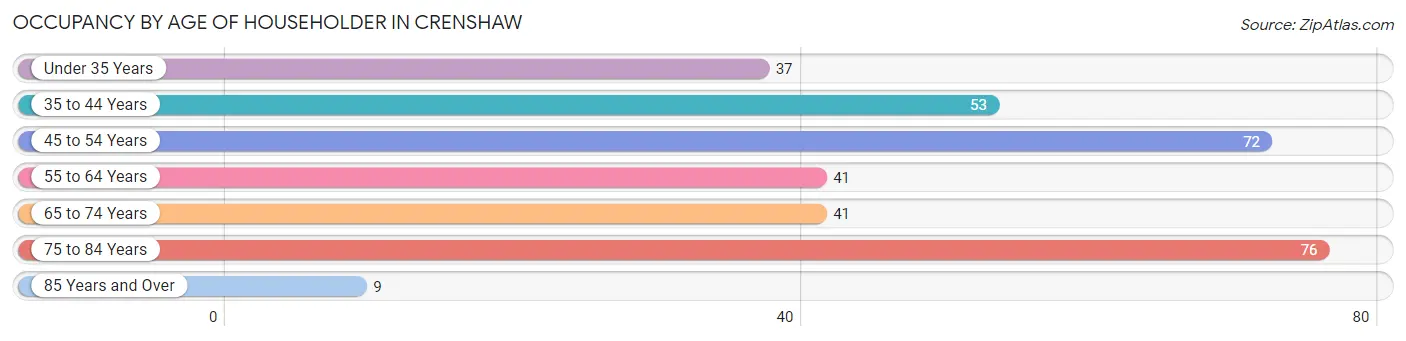
| Age Bracket | # Households | % Households |
| Under 35 Years | 37 | 11.3% |
| 35 to 44 Years | 53 | 16.1% |
| 45 to 54 Years | 72 | 21.9% |
| 55 to 64 Years | 41 | 12.5% |
| 65 to 74 Years | 41 | 12.5% |
| 75 to 84 Years | 76 | 23.1% |
| 85 Years and Over | 9 | 2.7% |
| Total | 329 | 100.0% |
Housing Finances in Crenshaw
Median Income by Occupancy in Crenshaw
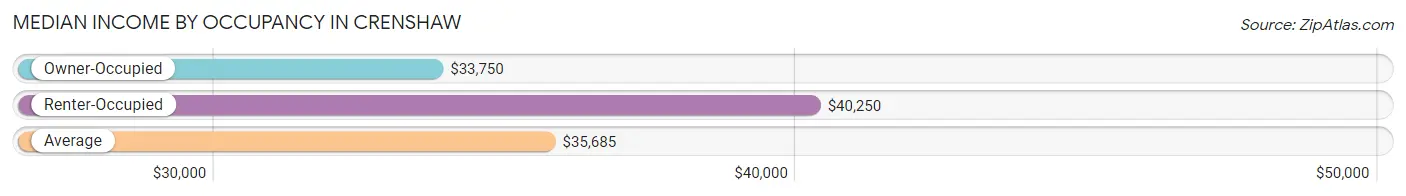
| Occupancy Type | # Households | Median Income |
| Owner-Occupied | 172 (52.3%) | $33,750 |
| Renter-Occupied | 157 (47.7%) | $40,250 |
| Average | 329 (100.0%) | $35,685 |
Occupancy by Householder Income Bracket in Crenshaw
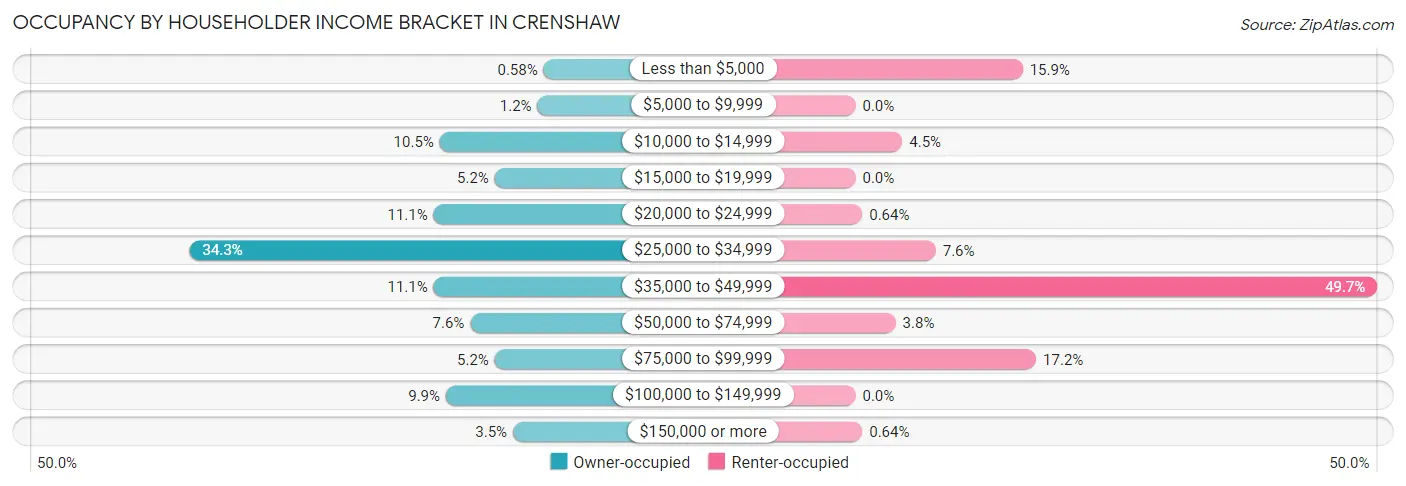
| Income Bracket | Owner-occupied | Renter-occupied |
| Less than $5,000 | 1 (0.6%) | 25 (15.9%) |
| $5,000 to $9,999 | 2 (1.2%) | 0 (0.0%) |
| $10,000 to $14,999 | 18 (10.5%) | 7 (4.5%) |
| $15,000 to $19,999 | 9 (5.2%) | 0 (0.0%) |
| $20,000 to $24,999 | 19 (11.1%) | 1 (0.6%) |
| $25,000 to $34,999 | 59 (34.3%) | 12 (7.6%) |
| $35,000 to $49,999 | 19 (11.1%) | 78 (49.7%) |
| $50,000 to $74,999 | 13 (7.6%) | 6 (3.8%) |
| $75,000 to $99,999 | 9 (5.2%) | 27 (17.2%) |
| $100,000 to $149,999 | 17 (9.9%) | 0 (0.0%) |
| $150,000 or more | 6 (3.5%) | 1 (0.6%) |
| Total | 172 (100.0%) | 157 (100.0%) |
Monthly Housing Cost Tiers in Crenshaw
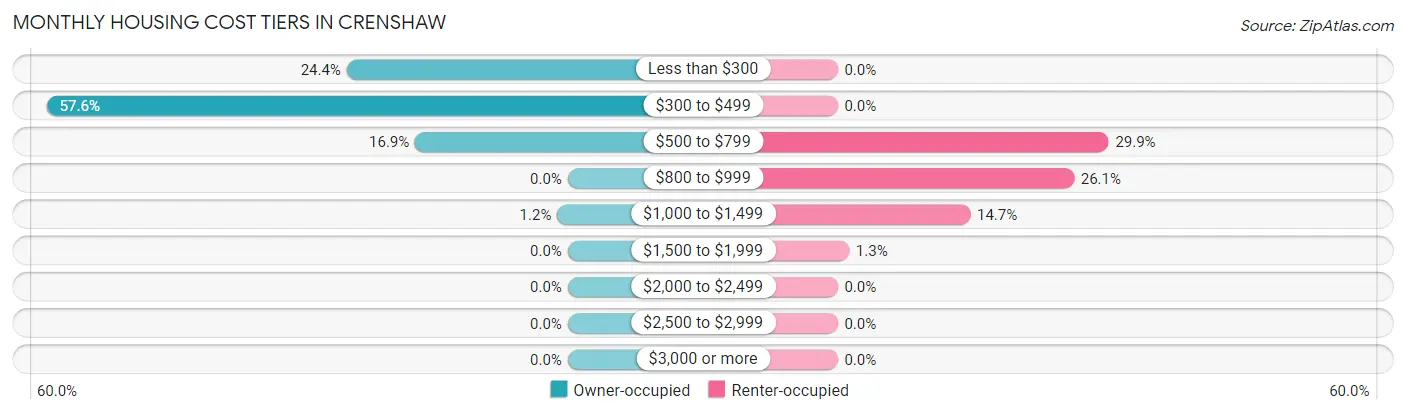
| Monthly Cost | Owner-occupied | Renter-occupied |
| Less than $300 | 42 (24.4%) | 0 (0.0%) |
| $300 to $499 | 99 (57.6%) | 0 (0.0%) |
| $500 to $799 | 29 (16.9%) | 47 (29.9%) |
| $800 to $999 | 0 (0.0%) | 41 (26.1%) |
| $1,000 to $1,499 | 2 (1.2%) | 23 (14.6%) |
| $1,500 to $1,999 | 0 (0.0%) | 2 (1.3%) |
| $2,000 to $2,499 | 0 (0.0%) | 0 (0.0%) |
| $2,500 to $2,999 | 0 (0.0%) | 0 (0.0%) |
| $3,000 or more | 0 (0.0%) | 0 (0.0%) |
| Total | 172 (100.0%) | 157 (100.0%) |
Physical Housing Characteristics in Crenshaw
Housing Structures in Crenshaw
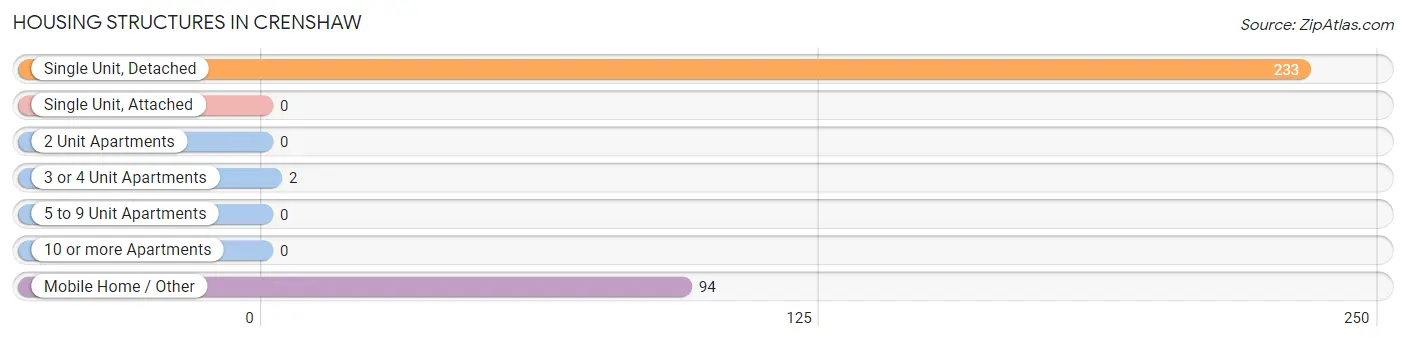
| Structure Type | # Housing Units | % Housing Units |
| Single Unit, Detached | 233 | 70.8% |
| Single Unit, Attached | 0 | 0.0% |
| 2 Unit Apartments | 0 | 0.0% |
| 3 or 4 Unit Apartments | 2 | 0.6% |
| 5 to 9 Unit Apartments | 0 | 0.0% |
| 10 or more Apartments | 0 | 0.0% |
| Mobile Home / Other | 94 | 28.6% |
| Total | 329 | 100.0% |
Housing Structures by Occupancy in Crenshaw
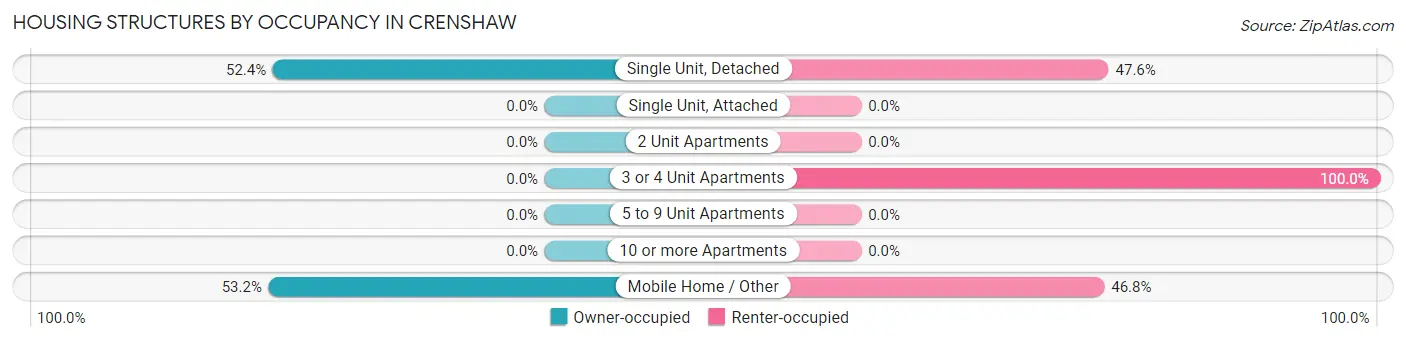
| Structure Type | Owner-occupied | Renter-occupied |
| Single Unit, Detached | 122 (52.4%) | 111 (47.6%) |
| Single Unit, Attached | 0 (0.0%) | 0 (0.0%) |
| 2 Unit Apartments | 0 (0.0%) | 0 (0.0%) |
| 3 or 4 Unit Apartments | 0 (0.0%) | 2 (100.0%) |
| 5 to 9 Unit Apartments | 0 (0.0%) | 0 (0.0%) |
| 10 or more Apartments | 0 (0.0%) | 0 (0.0%) |
| Mobile Home / Other | 50 (53.2%) | 44 (46.8%) |
| Total | 172 (52.3%) | 157 (47.7%) |
Housing Structures by Number of Rooms in Crenshaw
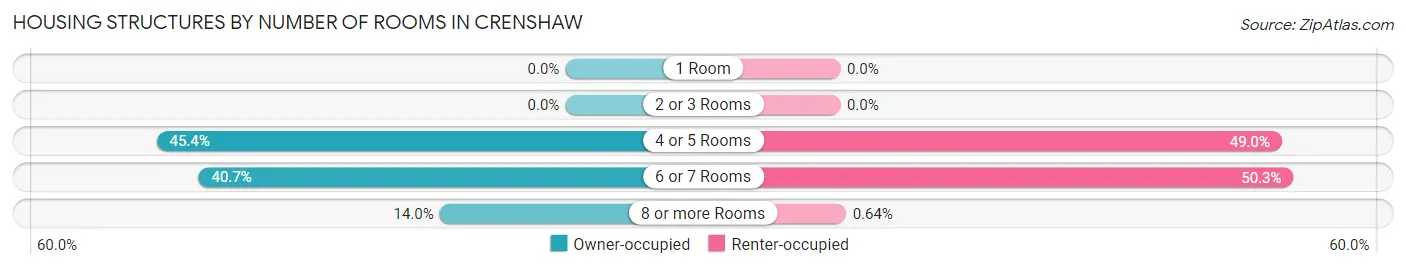
| Number of Rooms | Owner-occupied | Renter-occupied |
| 1 Room | 0 (0.0%) | 0 (0.0%) |
| 2 or 3 Rooms | 0 (0.0%) | 0 (0.0%) |
| 4 or 5 Rooms | 78 (45.4%) | 77 (49.0%) |
| 6 or 7 Rooms | 70 (40.7%) | 79 (50.3%) |
| 8 or more Rooms | 24 (14.0%) | 1 (0.6%) |
| Total | 172 (100.0%) | 157 (100.0%) |
Housing Structure by Heating Type in Crenshaw
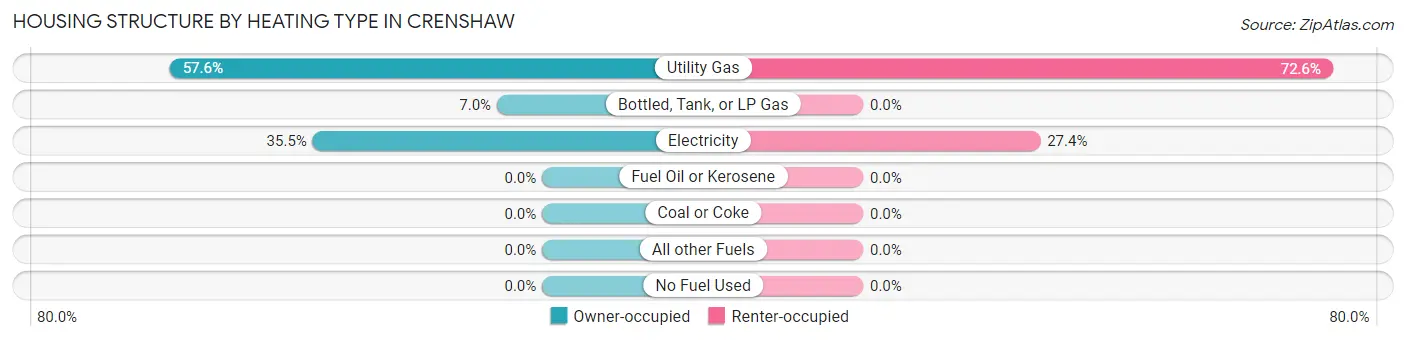
| Heating Type | Owner-occupied | Renter-occupied |
| Utility Gas | 99 (57.6%) | 114 (72.6%) |
| Bottled, Tank, or LP Gas | 12 (7.0%) | 0 (0.0%) |
| Electricity | 61 (35.5%) | 43 (27.4%) |
| Fuel Oil or Kerosene | 0 (0.0%) | 0 (0.0%) |
| Coal or Coke | 0 (0.0%) | 0 (0.0%) |
| All other Fuels | 0 (0.0%) | 0 (0.0%) |
| No Fuel Used | 0 (0.0%) | 0 (0.0%) |
| Total | 172 (100.0%) | 157 (100.0%) |
Household Vehicle Usage in Crenshaw
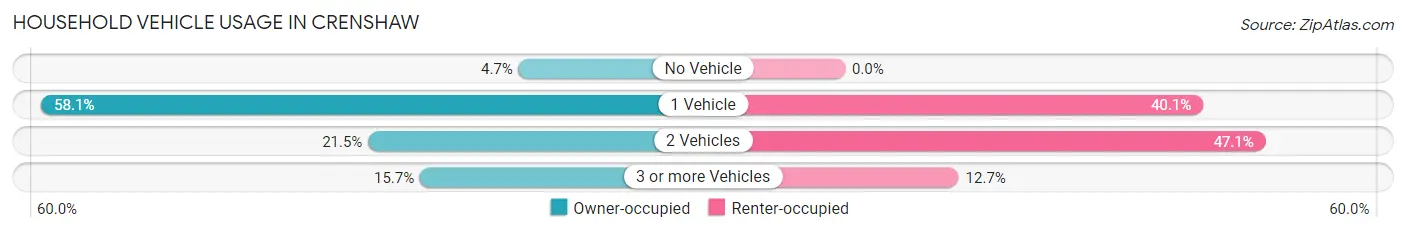
| Vehicles per Household | Owner-occupied | Renter-occupied |
| No Vehicle | 8 (4.6%) | 0 (0.0%) |
| 1 Vehicle | 100 (58.1%) | 63 (40.1%) |
| 2 Vehicles | 37 (21.5%) | 74 (47.1%) |
| 3 or more Vehicles | 27 (15.7%) | 20 (12.7%) |
| Total | 172 (100.0%) | 157 (100.0%) |
Real Estate & Mortgages in Crenshaw
Real Estate and Mortgage Overview in Crenshaw
| Characteristic | Without Mortgage | With Mortgage |
| Housing Units | 151 | 21 |
| Median Property Value | $82,000 | $55,000 |
| Median Household Income | $33,717 | $0 |
| Monthly Housing Costs | $357 | $0 |
| Real Estate Taxes | $199 | $10 |
Property Value by Mortgage Status in Crenshaw
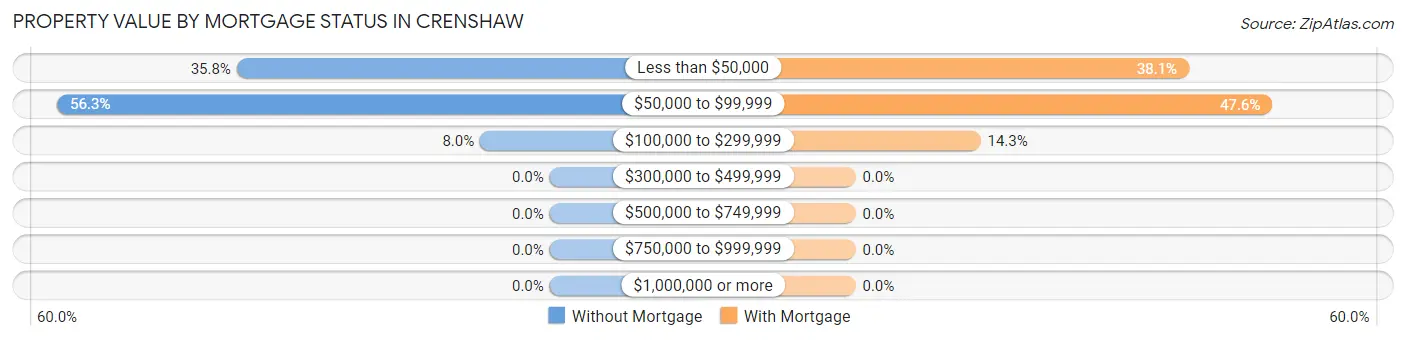
| Property Value | Without Mortgage | With Mortgage |
| Less than $50,000 | 54 (35.8%) | 8 (38.1%) |
| $50,000 to $99,999 | 85 (56.3%) | 10 (47.6%) |
| $100,000 to $299,999 | 12 (8.0%) | 3 (14.3%) |
| $300,000 to $499,999 | 0 (0.0%) | 0 (0.0%) |
| $500,000 to $749,999 | 0 (0.0%) | 0 (0.0%) |
| $750,000 to $999,999 | 0 (0.0%) | 0 (0.0%) |
| $1,000,000 or more | 0 (0.0%) | 0 (0.0%) |
| Total | 151 (100.0%) | 21 (100.0%) |
Household Income by Mortgage Status in Crenshaw
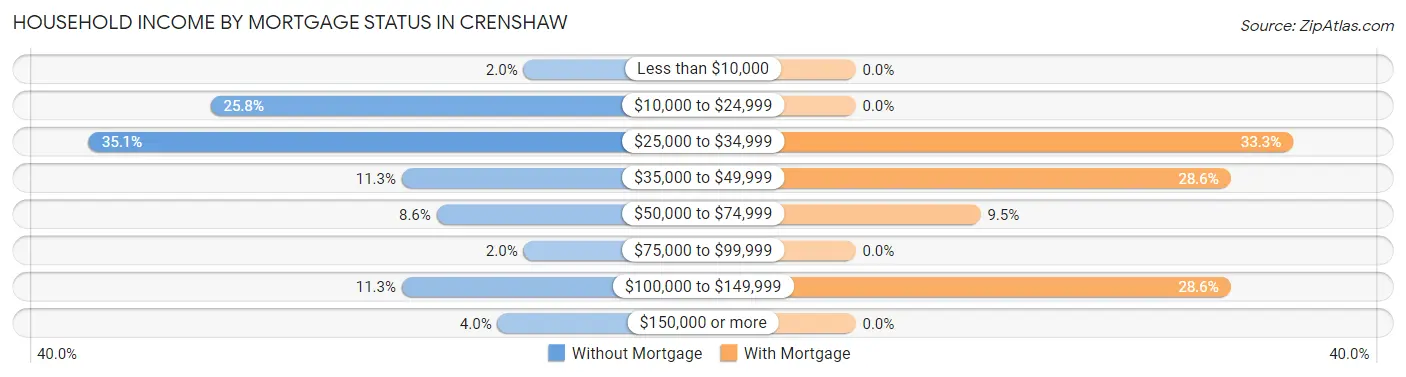
| Household Income | Without Mortgage | With Mortgage |
| Less than $10,000 | 3 (2.0%) | 0 (0.0%) |
| $10,000 to $24,999 | 39 (25.8%) | 0 (0.0%) |
| $25,000 to $34,999 | 53 (35.1%) | 7 (33.3%) |
| $35,000 to $49,999 | 17 (11.3%) | 6 (28.6%) |
| $50,000 to $74,999 | 13 (8.6%) | 2 (9.5%) |
| $75,000 to $99,999 | 3 (2.0%) | 0 (0.0%) |
| $100,000 to $149,999 | 17 (11.3%) | 6 (28.6%) |
| $150,000 or more | 6 (4.0%) | 0 (0.0%) |
| Total | 151 (100.0%) | 21 (100.0%) |
Property Value to Household Income Ratio in Crenshaw
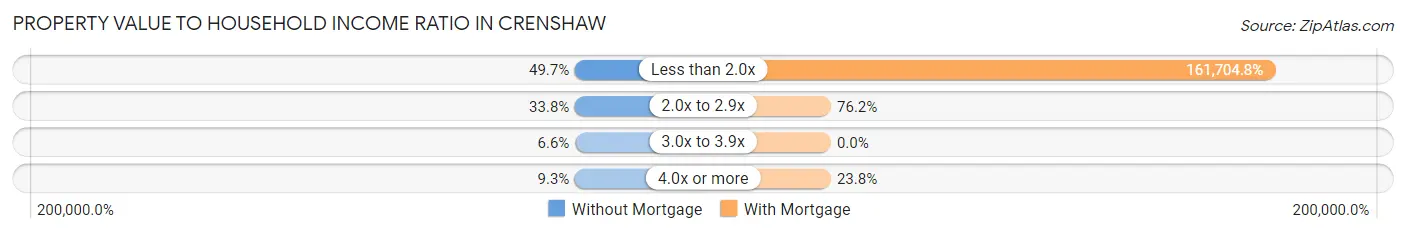
| Value-to-Income Ratio | Without Mortgage | With Mortgage |
| Less than 2.0x | 75 (49.7%) | 33,958 (161,704.8%) |
| 2.0x to 2.9x | 51 (33.8%) | 16 (76.2%) |
| 3.0x to 3.9x | 10 (6.6%) | 0 (0.0%) |
| 4.0x or more | 14 (9.3%) | 5 (23.8%) |
| Total | 151 (100.0%) | 21 (100.0%) |
Real Estate Taxes by Mortgage Status in Crenshaw
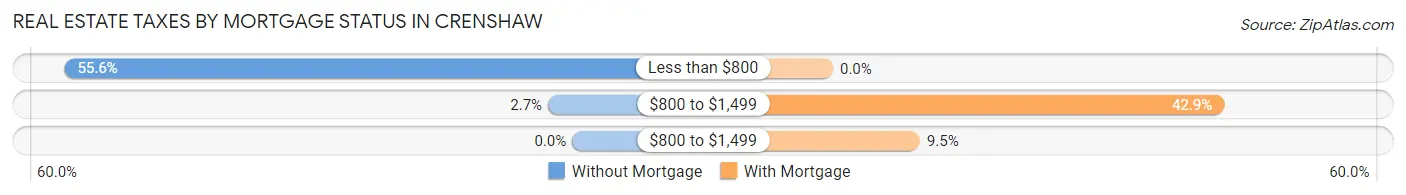
| Property Taxes | Without Mortgage | With Mortgage |
| Less than $800 | 84 (55.6%) | 0 (0.0%) |
| $800 to $1,499 | 4 (2.6%) | 9 (42.9%) |
| $800 to $1,499 | 0 (0.0%) | 2 (9.5%) |
| Total | 151 (100.0%) | 21 (100.0%) |
Health & Disability in Crenshaw
Health Insurance Coverage by Age in Crenshaw
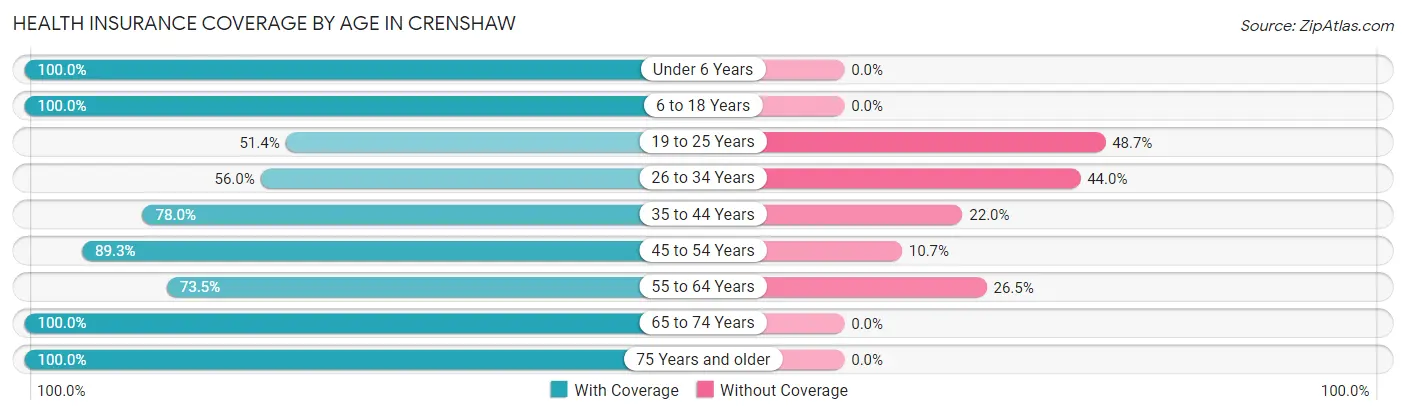
| Age Bracket | With Coverage | Without Coverage |
| Under 6 Years | 91 (100.0%) | 0 (0.0%) |
| 6 to 18 Years | 156 (100.0%) | 0 (0.0%) |
| 19 to 25 Years | 57 (51.3%) | 54 (48.6%) |
| 26 to 34 Years | 28 (56.0%) | 22 (44.0%) |
| 35 to 44 Years | 85 (78.0%) | 24 (22.0%) |
| 45 to 54 Years | 108 (89.3%) | 13 (10.7%) |
| 55 to 64 Years | 36 (73.5%) | 13 (26.5%) |
| 65 to 74 Years | 76 (100.0%) | 0 (0.0%) |
| 75 Years and older | 101 (100.0%) | 0 (0.0%) |
| Total | 738 (85.4%) | 126 (14.6%) |
Health Insurance Coverage by Citizenship Status in Crenshaw
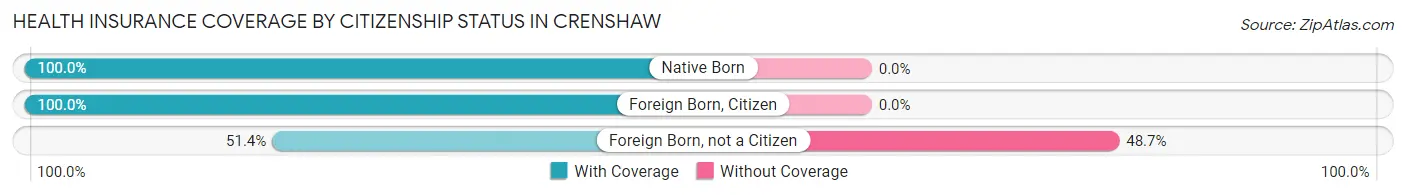
| Citizenship Status | With Coverage | Without Coverage |
| Native Born | 91 (100.0%) | 0 (0.0%) |
| Foreign Born, Citizen | 156 (100.0%) | 0 (0.0%) |
| Foreign Born, not a Citizen | 57 (51.3%) | 54 (48.6%) |
Health Insurance Coverage by Household Income in Crenshaw
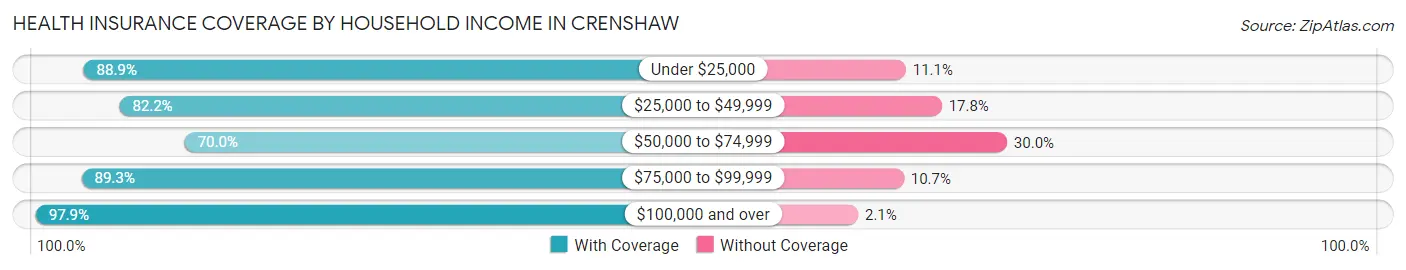
| Household Income | With Coverage | Without Coverage |
| Under $25,000 | 201 (88.9%) | 25 (11.1%) |
| $25,000 to $49,999 | 296 (82.2%) | 64 (17.8%) |
| $50,000 to $74,999 | 56 (70.0%) | 24 (30.0%) |
| $75,000 to $99,999 | 92 (89.3%) | 11 (10.7%) |
| $100,000 and over | 93 (97.9%) | 2 (2.1%) |
Public vs Private Health Insurance Coverage by Age in Crenshaw
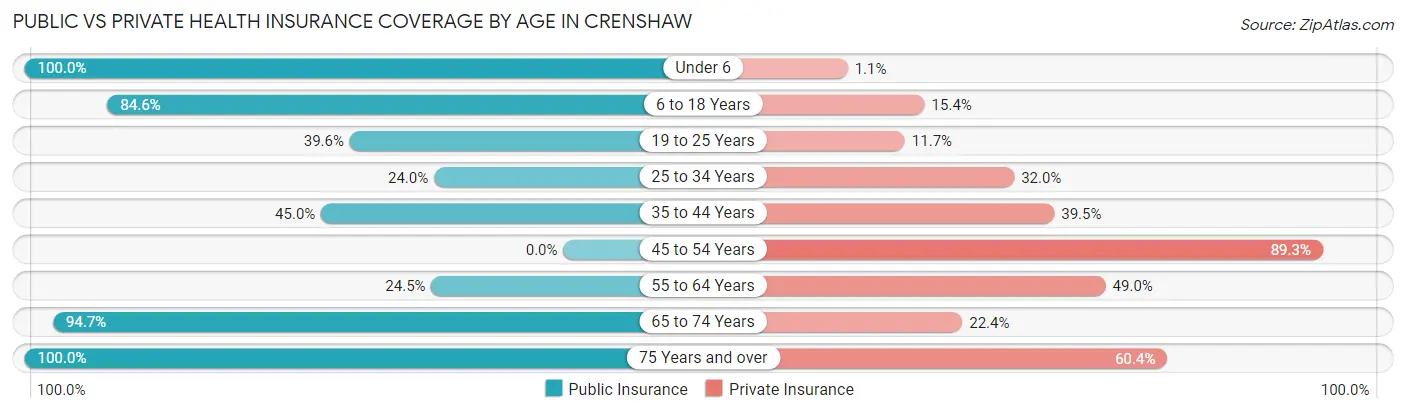
| Age Bracket | Public Insurance | Private Insurance |
| Under 6 | 91 (100.0%) | 1 (1.1%) |
| 6 to 18 Years | 132 (84.6%) | 24 (15.4%) |
| 19 to 25 Years | 44 (39.6%) | 13 (11.7%) |
| 25 to 34 Years | 12 (24.0%) | 16 (32.0%) |
| 35 to 44 Years | 49 (45.0%) | 43 (39.5%) |
| 45 to 54 Years | 0 (0.0%) | 108 (89.3%) |
| 55 to 64 Years | 12 (24.5%) | 24 (49.0%) |
| 65 to 74 Years | 72 (94.7%) | 17 (22.4%) |
| 75 Years and over | 101 (100.0%) | 61 (60.4%) |
| Total | 513 (59.4%) | 307 (35.5%) |
Disability Status by Sex by Age in Crenshaw
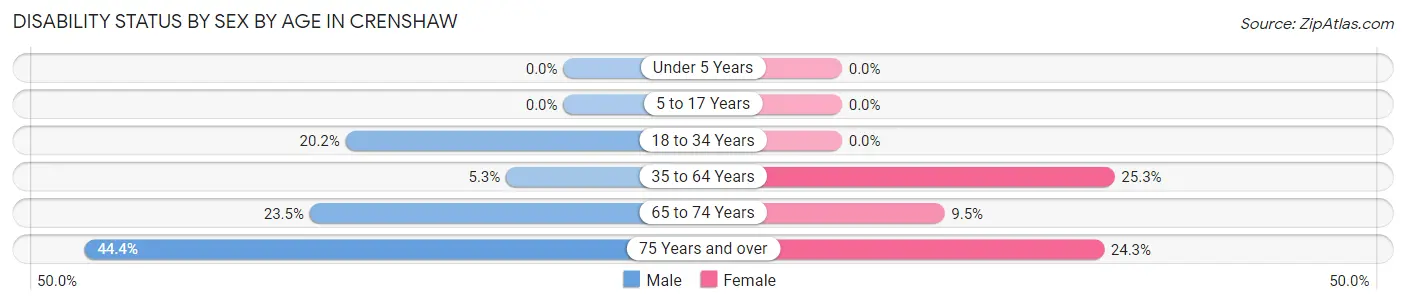
| Age Bracket | Male | Female |
| Under 5 Years | 0 (0.0%) | 0 (0.0%) |
| 5 to 17 Years | 0 (0.0%) | 0 (0.0%) |
| 18 to 34 Years | 19 (20.2%) | 0 (0.0%) |
| 35 to 64 Years | 6 (5.3%) | 42 (25.3%) |
| 65 to 74 Years | 8 (23.5%) | 4 (9.5%) |
| 75 Years and over | 12 (44.4%) | 18 (24.3%) |
Disability Class by Sex by Age in Crenshaw
Disability Class: Hearing Difficulty
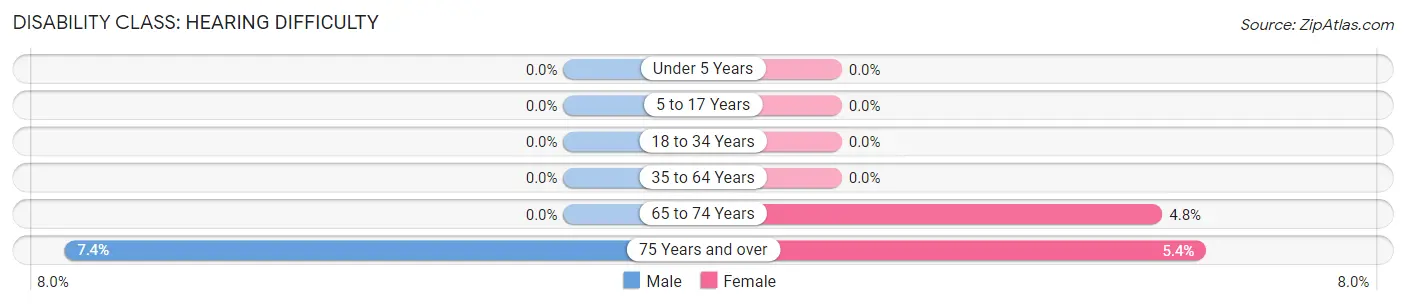
| Age Bracket | Male | Female |
| Under 5 Years | 0 (0.0%) | 0 (0.0%) |
| 5 to 17 Years | 0 (0.0%) | 0 (0.0%) |
| 18 to 34 Years | 0 (0.0%) | 0 (0.0%) |
| 35 to 64 Years | 0 (0.0%) | 0 (0.0%) |
| 65 to 74 Years | 0 (0.0%) | 2 (4.8%) |
| 75 Years and over | 2 (7.4%) | 4 (5.4%) |
Disability Class: Vision Difficulty
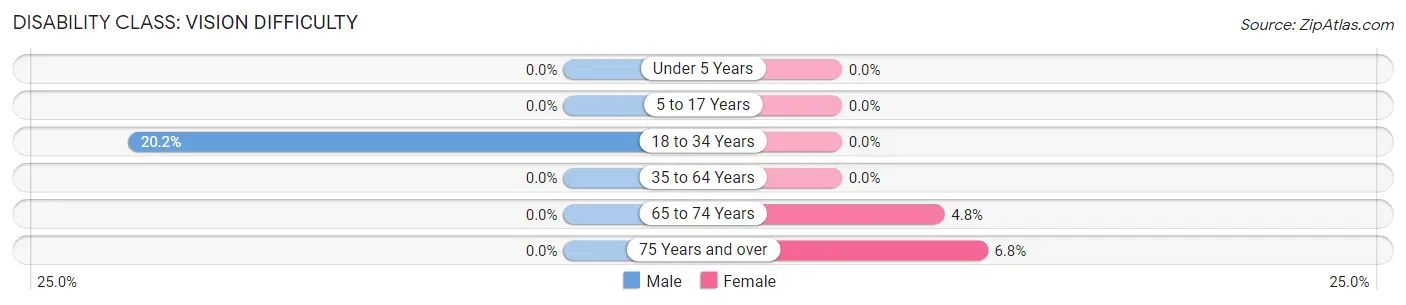
| Age Bracket | Male | Female |
| Under 5 Years | 0 (0.0%) | 0 (0.0%) |
| 5 to 17 Years | 0 (0.0%) | 0 (0.0%) |
| 18 to 34 Years | 19 (20.2%) | 0 (0.0%) |
| 35 to 64 Years | 0 (0.0%) | 0 (0.0%) |
| 65 to 74 Years | 0 (0.0%) | 2 (4.8%) |
| 75 Years and over | 0 (0.0%) | 5 (6.8%) |
Disability Class: Cognitive Difficulty
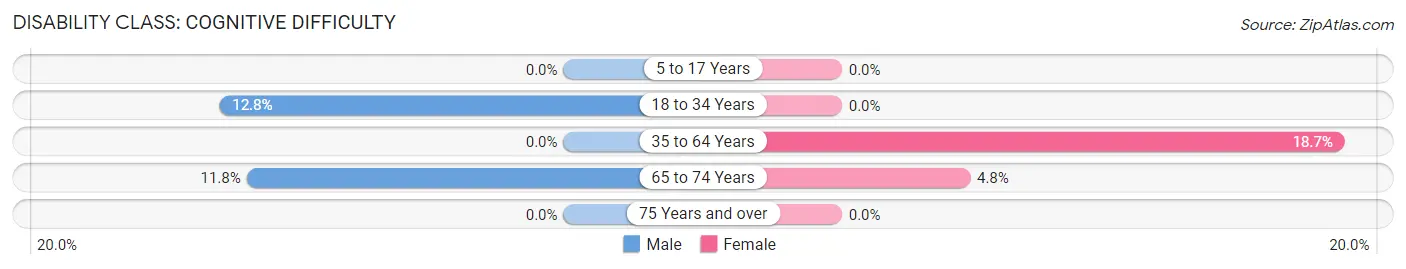
| Age Bracket | Male | Female |
| 5 to 17 Years | 0 (0.0%) | 0 (0.0%) |
| 18 to 34 Years | 12 (12.8%) | 0 (0.0%) |
| 35 to 64 Years | 0 (0.0%) | 31 (18.7%) |
| 65 to 74 Years | 4 (11.8%) | 2 (4.8%) |
| 75 Years and over | 0 (0.0%) | 0 (0.0%) |
Disability Class: Ambulatory Difficulty
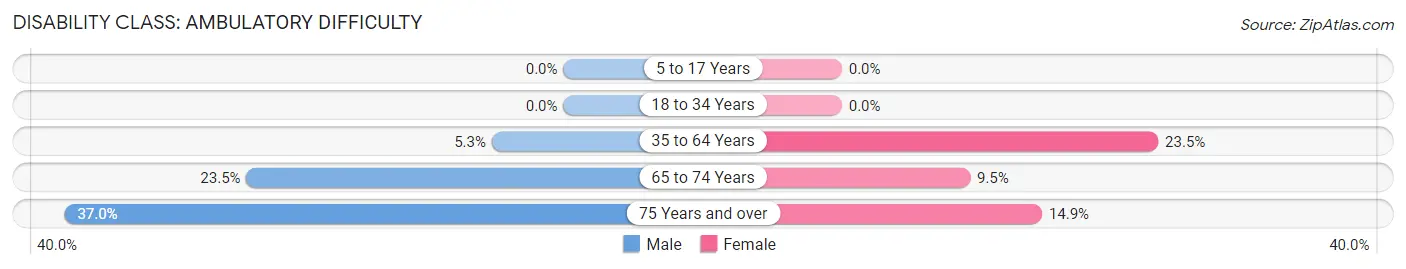
| Age Bracket | Male | Female |
| 5 to 17 Years | 0 (0.0%) | 0 (0.0%) |
| 18 to 34 Years | 0 (0.0%) | 0 (0.0%) |
| 35 to 64 Years | 6 (5.3%) | 39 (23.5%) |
| 65 to 74 Years | 8 (23.5%) | 4 (9.5%) |
| 75 Years and over | 10 (37.0%) | 11 (14.9%) |
Disability Class: Self-Care Difficulty
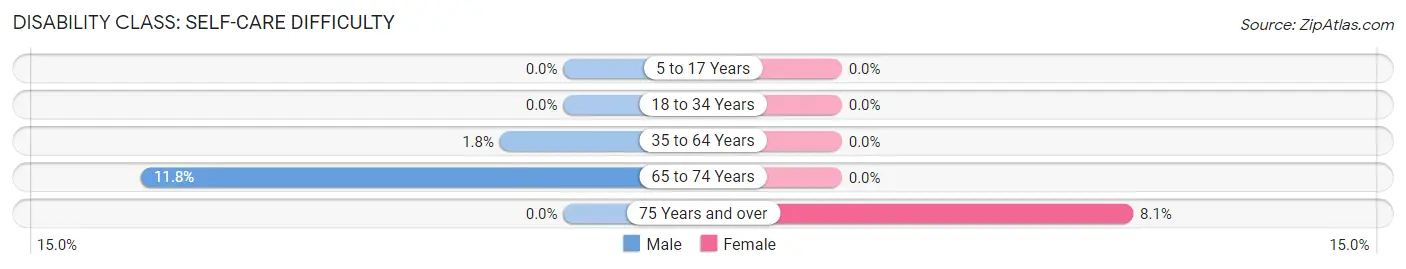
| Age Bracket | Male | Female |
| 5 to 17 Years | 0 (0.0%) | 0 (0.0%) |
| 18 to 34 Years | 0 (0.0%) | 0 (0.0%) |
| 35 to 64 Years | 2 (1.8%) | 0 (0.0%) |
| 65 to 74 Years | 4 (11.8%) | 0 (0.0%) |
| 75 Years and over | 0 (0.0%) | 6 (8.1%) |
Technology Access in Crenshaw
Computing Device Access in Crenshaw
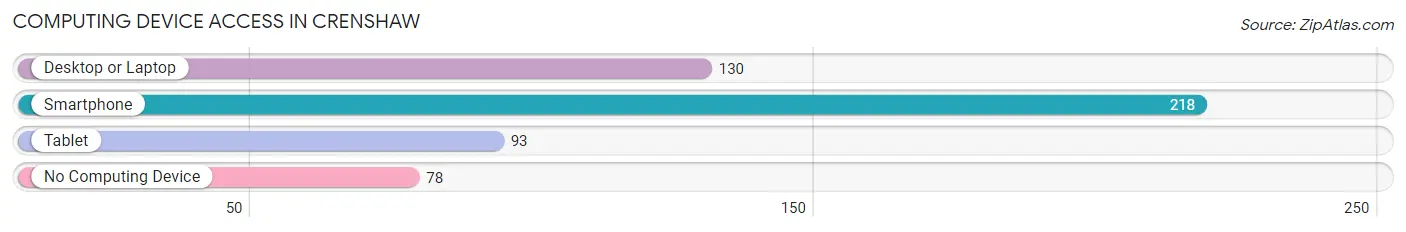
| Device Type | # Households | % Households |
| Desktop or Laptop | 130 | 39.5% |
| Smartphone | 218 | 66.3% |
| Tablet | 93 | 28.3% |
| No Computing Device | 78 | 23.7% |
| Total | 329 | 100.0% |
Internet Access in Crenshaw
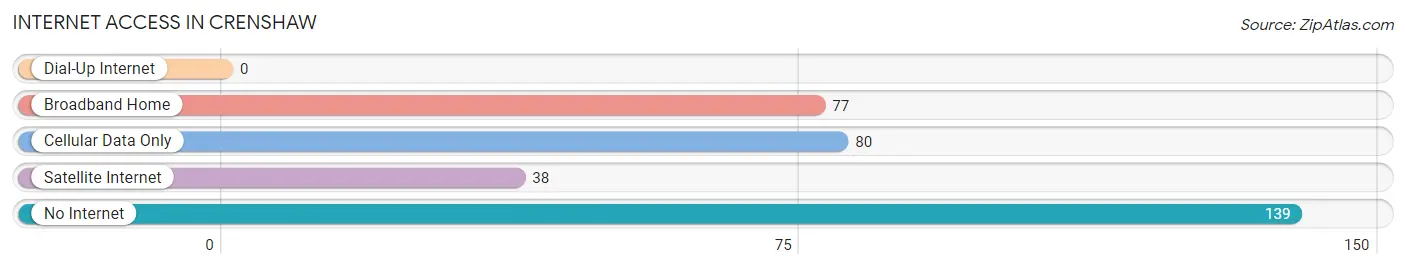
| Internet Type | # Households | % Households |
| Dial-Up Internet | 0 | 0.0% |
| Broadband Home | 77 | 23.4% |
| Cellular Data Only | 80 | 24.3% |
| Satellite Internet | 38 | 11.6% |
| No Internet | 139 | 42.2% |
| Total | 329 | 100.0% |
Crenshaw Summary
Crenshaw is a small town located in the northern part of Mississippi, in the United States. It is situated in Tippah County, and is part of the larger Tupelo metropolitan area. The town has a population of just over 1,000 people, and is known for its rural charm and friendly atmosphere.
History
Crenshaw was founded in 1837, and was named after the Crenshaw family, who were among the first settlers in the area. The town was originally a small farming community, and the main crops grown were cotton and corn. In the late 19th century, the town began to grow and develop, and by the early 20th century, it had become a thriving commercial center. The town was also home to several churches, schools, and other businesses.
In the 1950s, Crenshaw began to experience a decline in population, as many of its residents moved away to larger cities. However, in recent years, the town has seen a resurgence in population, as people have moved back to the area to take advantage of its rural charm and small-town atmosphere.
Geography
Crenshaw is located in the northern part of Mississippi, in the United States. It is situated in Tippah County, and is part of the larger Tupelo metropolitan area. The town is located on the banks of the Tippah River, and is surrounded by rolling hills and lush forests. The town is located about 30 miles from the state capital of Jackson, and is about an hour and a half drive from Memphis, Tennessee.
Economy
Crenshaw’s economy is largely based on agriculture, with the main crops being cotton, corn, soybeans, and wheat. The town also has several small businesses, including a few restaurants, a grocery store, and a few other retail stores. The town is also home to a few manufacturing plants, which provide jobs for many of the town’s residents.
Demographics
As of the 2010 census, Crenshaw had a population of 1,072 people. The racial makeup of the town was 95.3% White, 2.7% African American, 0.2% Native American, 0.2% Asian, 0.1% Pacific Islander, 0.7% from other races, and 0.8% from two or more races. The median household income was $30,938, and the median family income was $37,500. The per capita income was $15,945.
Crenshaw is a small town with a rich history and a friendly atmosphere. It is a great place to live for those who want to experience the rural charm of Mississippi, while still having access to the amenities of a larger city. The town has a strong economy, and its residents are proud of their community and its history.
Common Questions
What is Per Capita Income in Crenshaw?
Per Capita income in Crenshaw is $17,217.
What is the Median Family Income in Crenshaw?
Median Family Income in Crenshaw is $33,819.
What is the Median Household income in Crenshaw?
Median Household Income in Crenshaw is $35,685.
What is Income or Wage Gap in Crenshaw?
Income or Wage Gap in Crenshaw is 14.2%.
Women in Crenshaw earn 85.8 cents for every dollar earned by a man.
What is Inequality or Gini Index in Crenshaw?
Inequality or Gini Index in Crenshaw is 0.39.
What is the Total Population of Crenshaw?
Total Population of Crenshaw is 864.
What is the Total Male Population of Crenshaw?
Total Male Population of Crenshaw is 377.
What is the Total Female Population of Crenshaw?
Total Female Population of Crenshaw is 487.
What is the Ratio of Males per 100 Females in Crenshaw?
There are 77.41 Males per 100 Females in Crenshaw.
What is the Ratio of Females per 100 Males in Crenshaw?
There are 129.18 Females per 100 Males in Crenshaw.
What is the Median Population Age in Crenshaw?
Median Population Age in Crenshaw is 38.4 Years.
What is the Average Family Size in Crenshaw
Average Family Size in Crenshaw is 3.3 People.
What is the Average Household Size in Crenshaw
Average Household Size in Crenshaw is 2.6 People.
How Large is the Labor Force in Crenshaw?
There are 353 People in the Labor Forcein in Crenshaw.
What is the Percentage of People in the Labor Force in Crenshaw?
54.6% of People are in the Labor Force in Crenshaw.
What is the Unemployment Rate in Crenshaw?
Unemployment Rate in Crenshaw is 17.6%.