Mad River, CA Map & Demographics
Mad River Map
Mad River Overview
$25,154
PER CAPITA INCOME
26.6%
WAGE / INCOME GAP [ % ]
73.4¢/ $1
WAGE / INCOME GAP [ $ ]
0.61
INEQUALITY / GINI INDEX
322
TOTAL POPULATION
189
MALE POPULATION
133
FEMALE POPULATION
142.11
MALES / 100 FEMALES
70.37
FEMALES / 100 MALES
55.1
MEDIAN AGE
3.8
AVG FAMILY SIZE
2.3
AVG HOUSEHOLD SIZE
72
LABOR FORCE [ PEOPLE ]
25.1%
PERCENT IN LABOR FORCE
6.9%
UNEMPLOYMENT RATE
Mad River Zip Codes
Mad River Area Codes
Income in Mad River
Income Overview in Mad River
| Characteristic | Number | Measure |
| Per Capita Income | 322 | $25,154 |
| Median Family Income | 60 | $0 |
| Mean Family Income | 60 | $104,315 |
| Median Household Income | 138 | $0 |
| Mean Household Income | 138 | $58,700 |
| Income Deficit | 60 | $0 |
| Wage / Income Gap (%) | 322 | 26.58% |
| Wage / Income Gap ($) | 322 | 73.42¢ per $1 |
| Gini / Inequality Index | 322 | 0.61 |
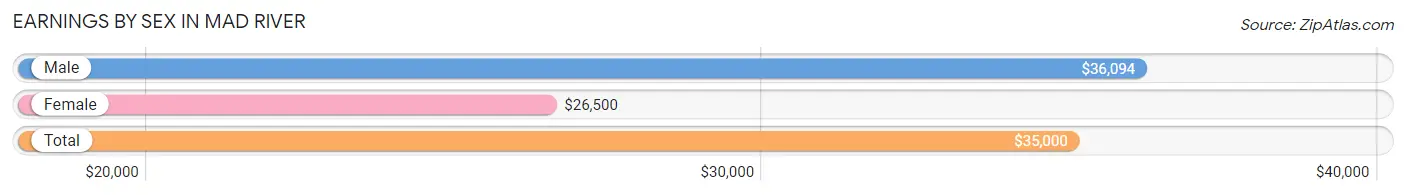
Earnings by Sex in Mad River
Average Earnings in Mad River are $35,000, $36,094 for men and $26,500 for women, a difference of 26.6%.
| Sex | Number | Average Earnings |
| Male | 52 (57.8%) | $36,094 |
| Female | 38 (42.2%) | $26,500 |
| Total | 90 (100.0%) | $35,000 |
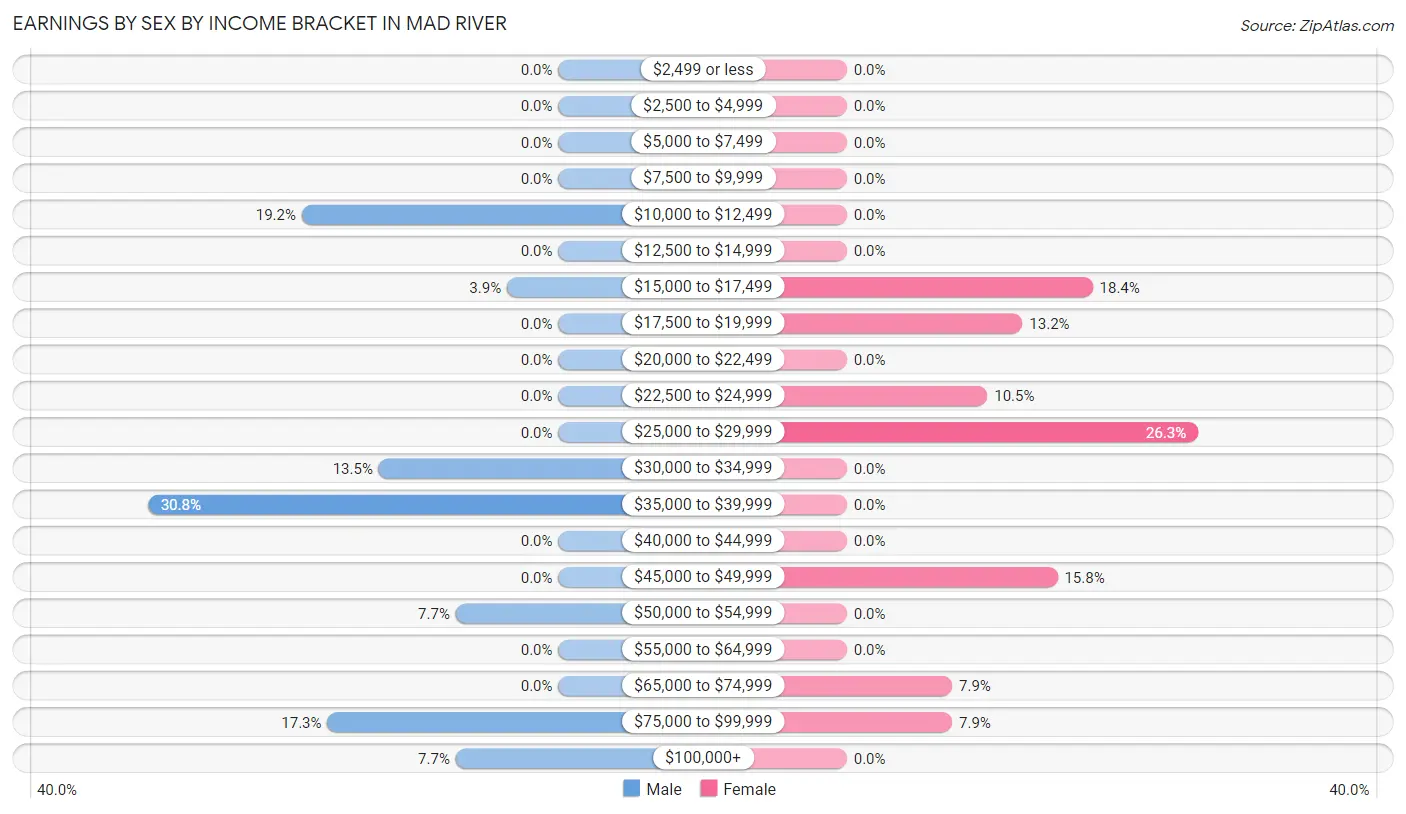
Earnings by Sex by Income Bracket in Mad River
The most common earnings brackets in Mad River are $35,000 to $39,999 for men (16 | 30.8%) and $25,000 to $29,999 for women (10 | 26.3%).
| Income | Male | Female |
| $2,499 or less | 0 (0.0%) | 0 (0.0%) |
| $2,500 to $4,999 | 0 (0.0%) | 0 (0.0%) |
| $5,000 to $7,499 | 0 (0.0%) | 0 (0.0%) |
| $7,500 to $9,999 | 0 (0.0%) | 0 (0.0%) |
| $10,000 to $12,499 | 10 (19.2%) | 0 (0.0%) |
| $12,500 to $14,999 | 0 (0.0%) | 0 (0.0%) |
| $15,000 to $17,499 | 2 (3.8%) | 7 (18.4%) |
| $17,500 to $19,999 | 0 (0.0%) | 5 (13.2%) |
| $20,000 to $22,499 | 0 (0.0%) | 0 (0.0%) |
| $22,500 to $24,999 | 0 (0.0%) | 4 (10.5%) |
| $25,000 to $29,999 | 0 (0.0%) | 10 (26.3%) |
| $30,000 to $34,999 | 7 (13.5%) | 0 (0.0%) |
| $35,000 to $39,999 | 16 (30.8%) | 0 (0.0%) |
| $40,000 to $44,999 | 0 (0.0%) | 0 (0.0%) |
| $45,000 to $49,999 | 0 (0.0%) | 6 (15.8%) |
| $50,000 to $54,999 | 4 (7.7%) | 0 (0.0%) |
| $55,000 to $64,999 | 0 (0.0%) | 0 (0.0%) |
| $65,000 to $74,999 | 0 (0.0%) | 3 (7.9%) |
| $75,000 to $99,999 | 9 (17.3%) | 3 (7.9%) |
| $100,000+ | 4 (7.7%) | 0 (0.0%) |
| Total | 52 (100.0%) | 38 (100.0%) |
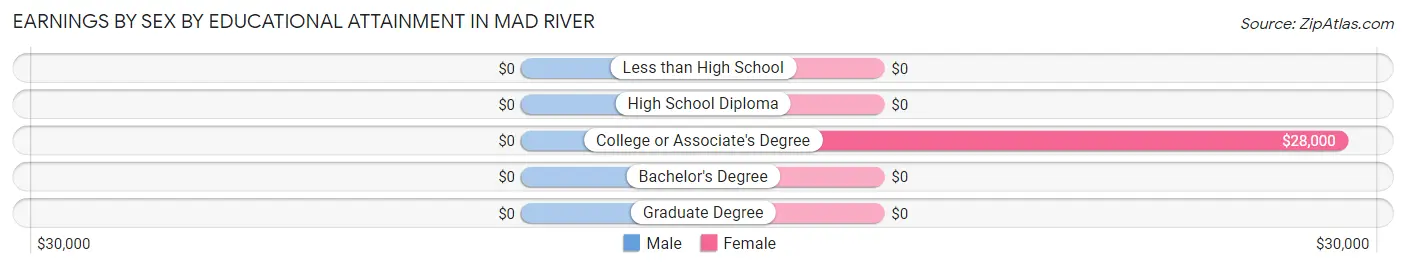
Earnings by Sex by Educational Attainment in Mad River
| Educational Attainment | Male Income | Female Income |
| Less than High School | - | - |
| High School Diploma | - | - |
| College or Associate's Degree | - | - |
| Bachelor's Degree | - | - |
| Graduate Degree | - | - |
| Total | $36,875 | $26,500 |
Family Income in Mad River
Family Income Brackets in Mad River
According to the Mad River family income data, there are 23 families falling into the $150,000 to $199,999 income range, which is the most common income bracket and makes up 38.3% of all families.
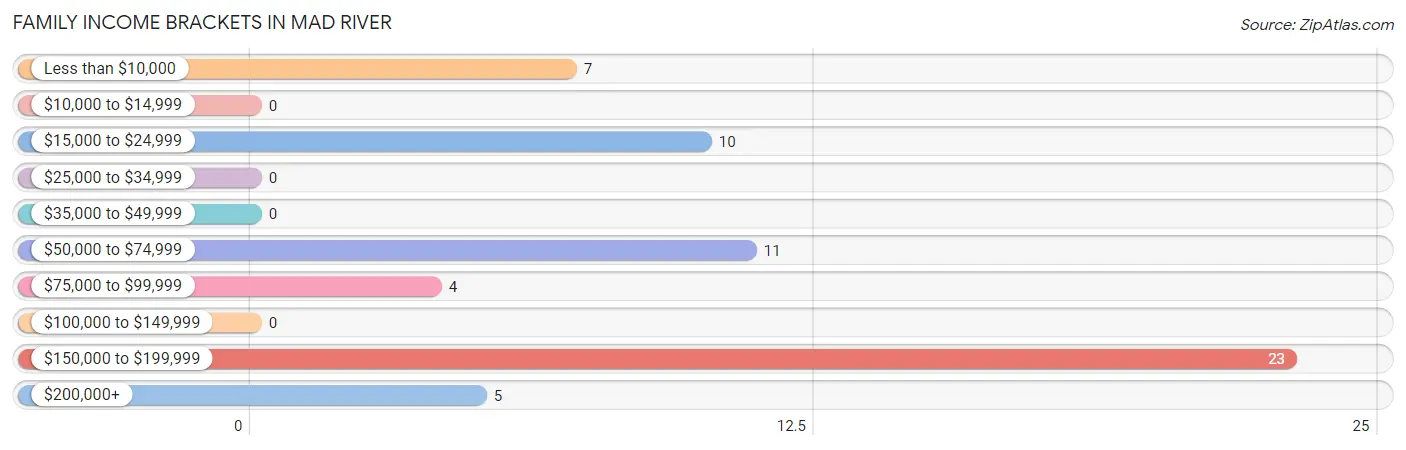
| Income Bracket | # Families | % Families |
| Less than $10,000 | 7 | 11.7% |
| $10,000 to $14,999 | 0 | 0.0% |
| $15,000 to $24,999 | 10 | 16.7% |
| $25,000 to $34,999 | 0 | 0.0% |
| $35,000 to $49,999 | 0 | 0.0% |
| $50,000 to $74,999 | 11 | 18.3% |
| $75,000 to $99,999 | 4 | 6.7% |
| $100,000 to $149,999 | 0 | 0.0% |
| $150,000 to $199,999 | 23 | 38.3% |
| $200,000+ | 5 | 8.3% |
Family Income by Famaliy Size in Mad River
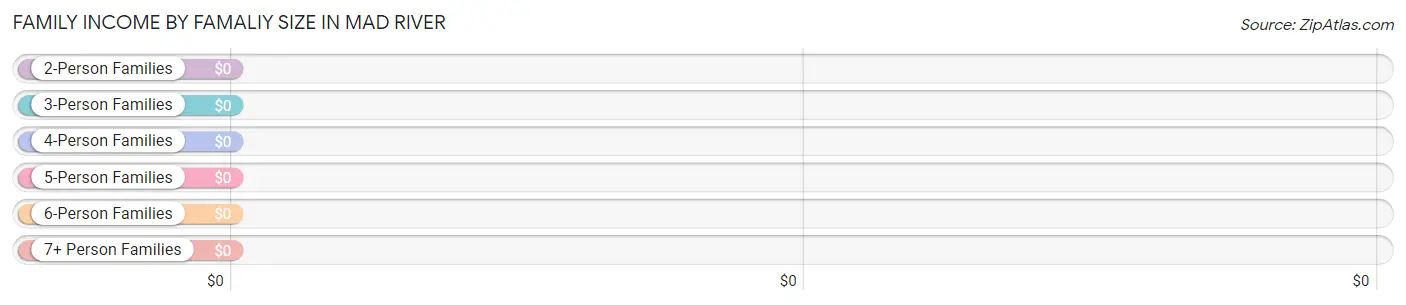
| Income Bracket | # Families | Median Income |
| 2-Person Families | 51 (85.0%) | $0 |
| 3-Person Families | 5 (8.3%) | $0 |
| 4-Person Families | 0 (0.0%) | $0 |
| 5-Person Families | 4 (6.7%) | $0 |
| 6-Person Families | 0 (0.0%) | $0 |
| 7+ Person Families | 0 (0.0%) | $0 |
| Total | 60 (100.0%) | $0 |
Family Income by Number of Earners in Mad River
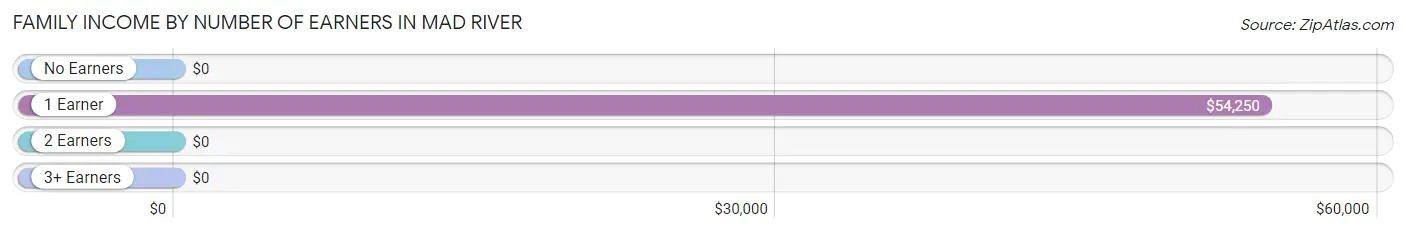
| Number of Earners | # Families | Median Income |
| No Earners | 31 (51.7%) | $0 |
| 1 Earner | 11 (18.3%) | $54,250 |
| 2 Earners | 14 (23.3%) | $0 |
| 3+ Earners | 4 (6.7%) | $0 |
| Total | 60 (100.0%) | $0 |
Household Income in Mad River
Household Income Brackets in Mad River
With 53 households falling in the category, the less than $10,000 income range is the most frequent in Mad River, accounting for 38.4% of all households.
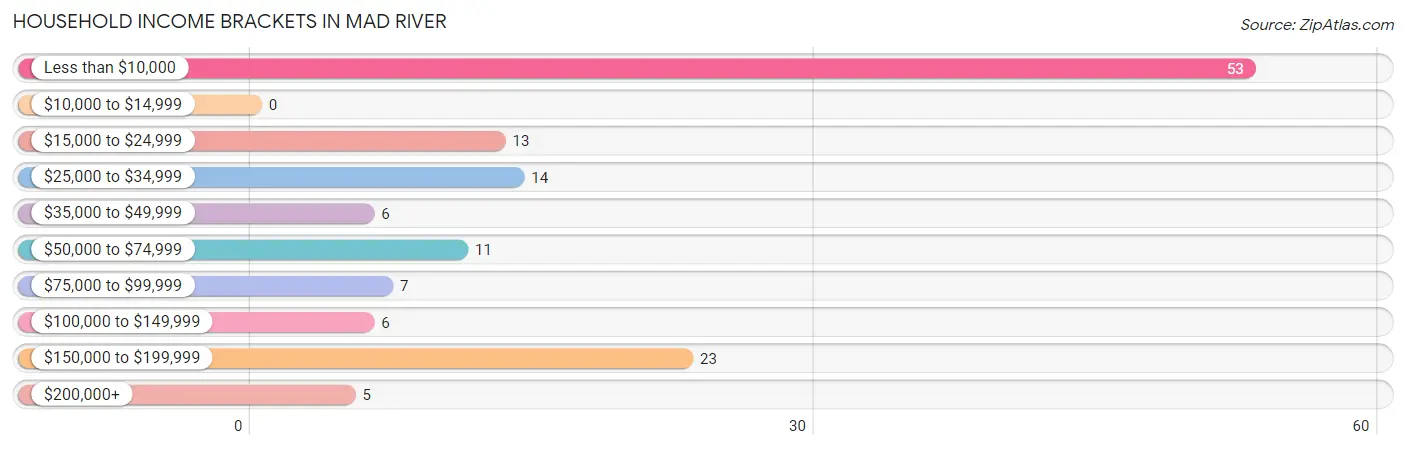
| Income Bracket | # Households | % Households |
| Less than $10,000 | 53 | 38.4% |
| $10,000 to $14,999 | 0 | 0.0% |
| $15,000 to $24,999 | 13 | 9.4% |
| $25,000 to $34,999 | 14 | 10.1% |
| $35,000 to $49,999 | 6 | 4.3% |
| $50,000 to $74,999 | 11 | 8.0% |
| $75,000 to $99,999 | 7 | 5.1% |
| $100,000 to $149,999 | 6 | 4.3% |
| $150,000 to $199,999 | 23 | 16.7% |
| $200,000+ | 5 | 3.6% |
Household Income by Householder Age in Mad River
The median household income in Mad River is $0, with the highest median household income of $2,499 found in the 45 to 64 years age bracket for the primary householder. A total of 52 households (37.7%) fall into this category.
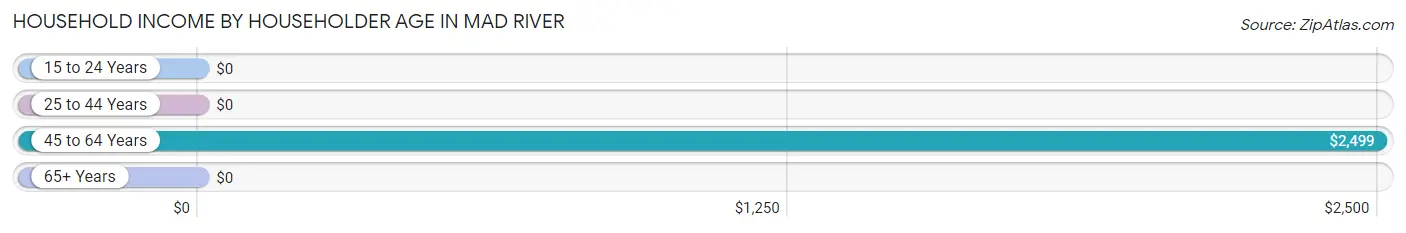
| Income Bracket | # Households | Median Income |
| 15 to 24 Years | 0 (0.0%) | $0 |
| 25 to 44 Years | 42 (30.4%) | $0 |
| 45 to 64 Years | 52 (37.7%) | $2,499 |
| 65+ Years | 44 (31.9%) | $0 |
| Total | 138 (100.0%) | $0 |
Poverty in Mad River
Income Below Poverty by Sex and Age in Mad River
With 47.6% poverty level for males and 20.3% for females among the residents of Mad River, 25 to 34 year old males and under 5 year old females are the most vulnerable to poverty, with 44 males (100.0%) and 27 females (100.0%) in their respective age groups living below the poverty level.
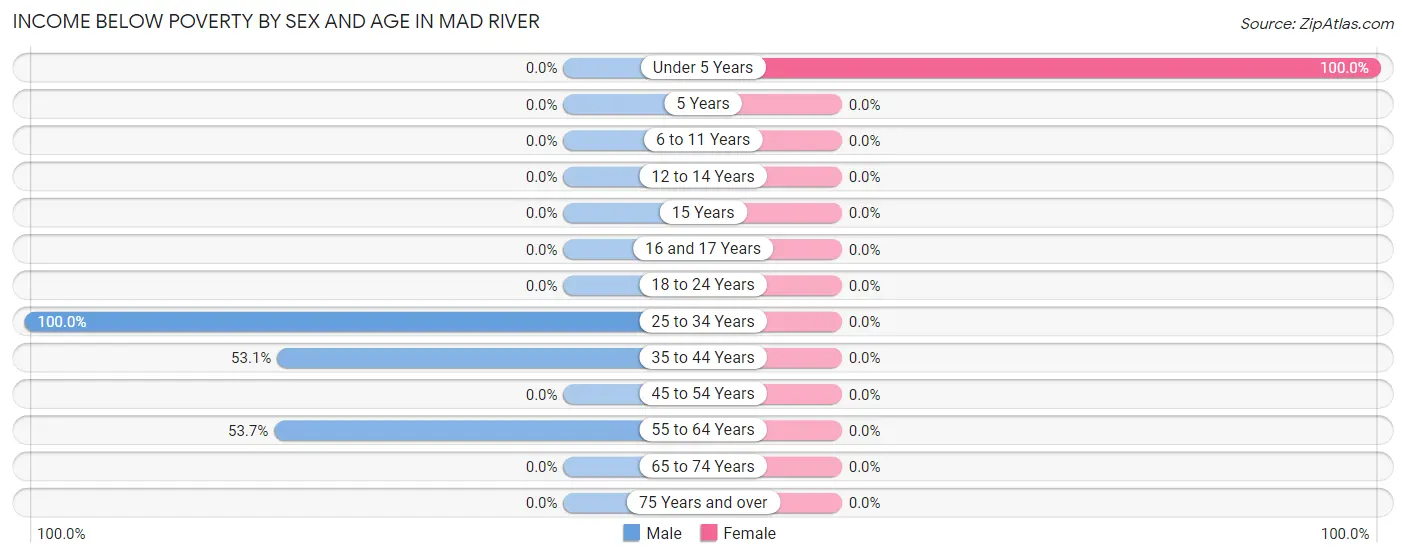
| Age Bracket | Male | Female |
| Under 5 Years | 0 (0.0%) | 27 (100.0%) |
| 5 Years | 0 (0.0%) | 0 (0.0%) |
| 6 to 11 Years | 0 (0.0%) | 0 (0.0%) |
| 12 to 14 Years | 0 (0.0%) | 0 (0.0%) |
| 15 Years | 0 (0.0%) | 0 (0.0%) |
| 16 and 17 Years | 0 (0.0%) | 0 (0.0%) |
| 18 to 24 Years | 0 (0.0%) | 0 (0.0%) |
| 25 to 34 Years | 44 (100.0%) | 0 (0.0%) |
| 35 to 44 Years | 17 (53.1%) | 0 (0.0%) |
| 45 to 54 Years | 0 (0.0%) | 0 (0.0%) |
| 55 to 64 Years | 29 (53.7%) | 0 (0.0%) |
| 65 to 74 Years | 0 (0.0%) | 0 (0.0%) |
| 75 Years and over | 0 (0.0%) | 0 (0.0%) |
| Total | 90 (47.6%) | 27 (20.3%) |
Income Above Poverty by Sex and Age in Mad River
According to the poverty statistics in Mad River, males aged 16 and 17 years and females aged 5 years are the age groups that are most secure financially, with 100.0% of males and 100.0% of females in these age groups living above the poverty line.
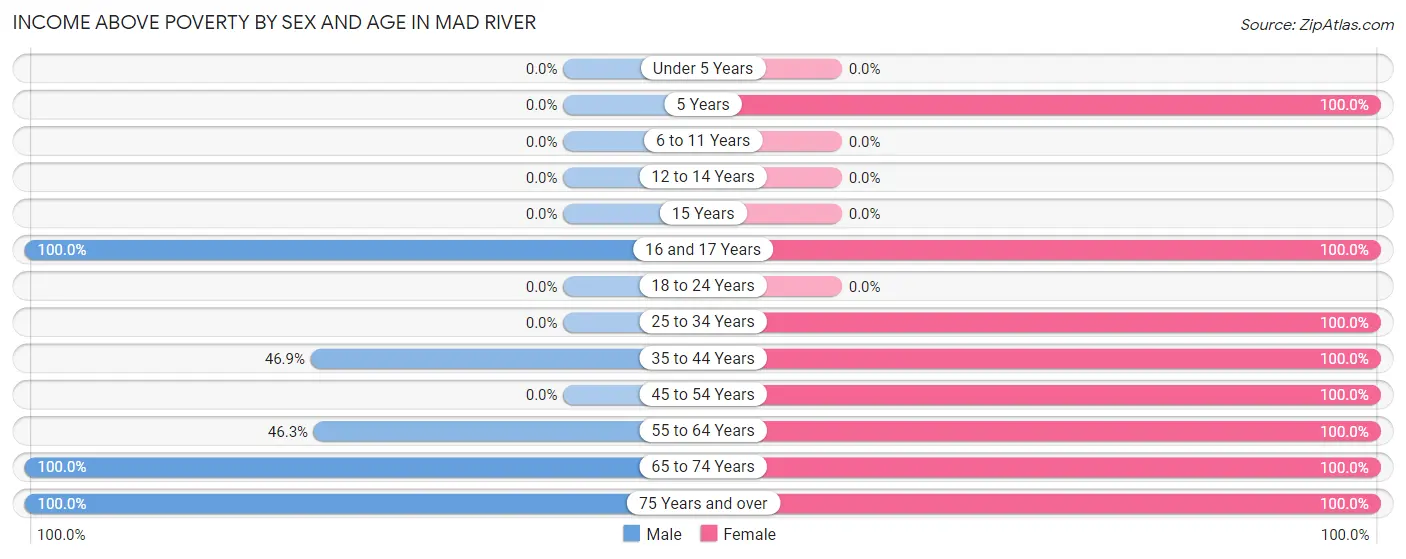
| Age Bracket | Male | Female |
| Under 5 Years | 0 (0.0%) | 0 (0.0%) |
| 5 Years | 0 (0.0%) | 8 (100.0%) |
| 6 to 11 Years | 0 (0.0%) | 0 (0.0%) |
| 12 to 14 Years | 0 (0.0%) | 0 (0.0%) |
| 15 Years | 0 (0.0%) | 0 (0.0%) |
| 16 and 17 Years | 10 (100.0%) | 14 (100.0%) |
| 18 to 24 Years | 0 (0.0%) | 0 (0.0%) |
| 25 to 34 Years | 0 (0.0%) | 7 (100.0%) |
| 35 to 44 Years | 15 (46.9%) | 10 (100.0%) |
| 45 to 54 Years | 0 (0.0%) | 6 (100.0%) |
| 55 to 64 Years | 25 (46.3%) | 27 (100.0%) |
| 65 to 74 Years | 23 (100.0%) | 12 (100.0%) |
| 75 Years and over | 26 (100.0%) | 22 (100.0%) |
| Total | 99 (52.4%) | 106 (79.7%) |
Income Below Poverty Among Married-Couple Families in Mad River
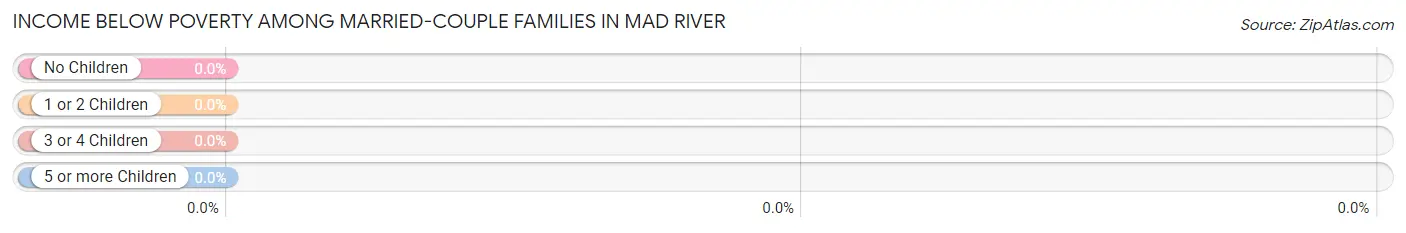
| Children | Above Poverty | Below Poverty |
| No Children | 37 (100.0%) | 0 (0.0%) |
| 1 or 2 Children | 9 (100.0%) | 0 (0.0%) |
| 3 or 4 Children | 0 (0.0%) | 0 (0.0%) |
| 5 or more Children | 0 (0.0%) | 0 (0.0%) |
| Total | 46 (100.0%) | 0 (0.0%) |
Income Below Poverty Among Single-Parent Households in Mad River
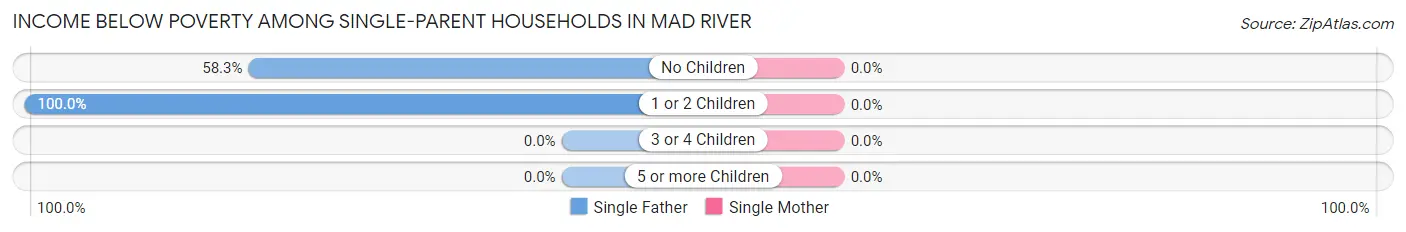
| Children | Single Father | Single Mother |
| No Children | 7 (58.3%) | 0 (0.0%) |
| 1 or 2 Children | 2 (100.0%) | 0 (0.0%) |
| 3 or 4 Children | 0 (0.0%) | 0 (0.0%) |
| 5 or more Children | 0 (0.0%) | 0 (0.0%) |
| Total | 9 (64.3%) | 0 (0.0%) |
Income Below Poverty Among Married-Couple vs Single-Parent Households in Mad River
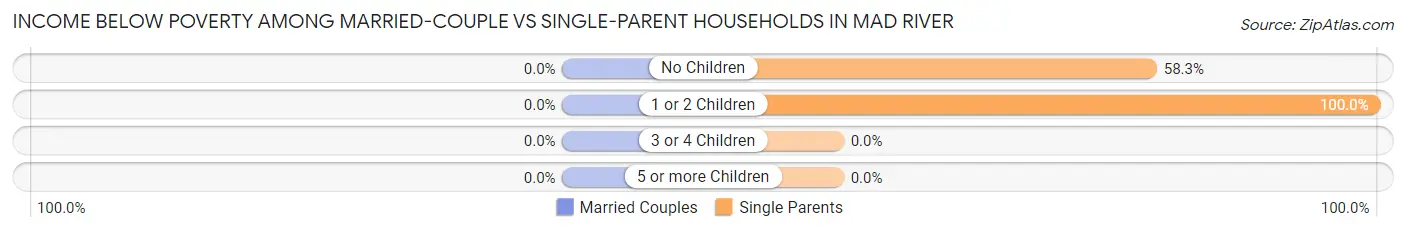
| Children | Married-Couple Families | Single-Parent Households |
| No Children | 0 (0.0%) | 7 (58.3%) |
| 1 or 2 Children | 0 (0.0%) | 2 (100.0%) |
| 3 or 4 Children | 0 (0.0%) | 0 (0.0%) |
| 5 or more Children | 0 (0.0%) | 0 (0.0%) |
| Total | 0 (0.0%) | 9 (64.3%) |
Race in Mad River
The most populous races in Mad River are White / Caucasian (263 | 81.7%), Two or more Races (57 | 17.7%), and Hispanic or Latino (34 | 10.6%).
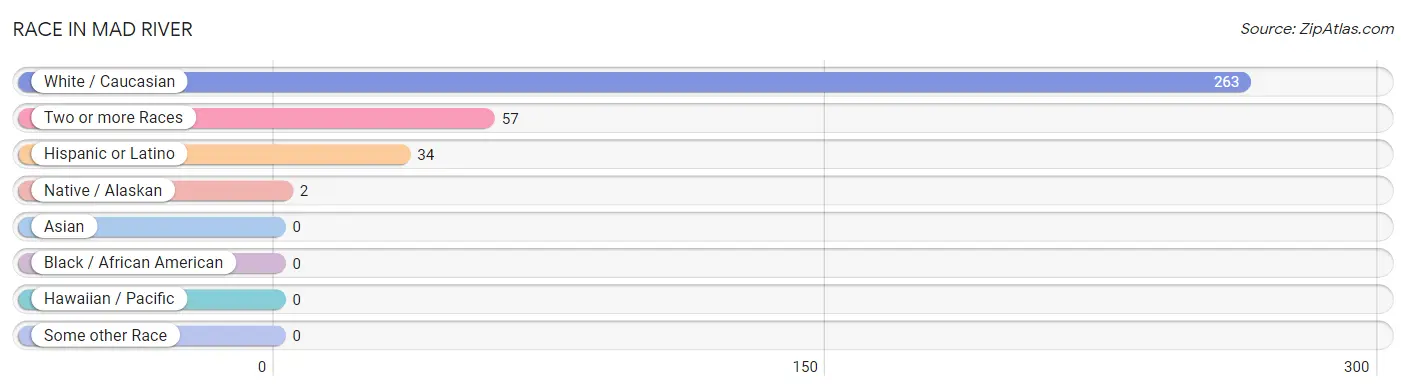
| Race | # Population | % Population |
| Asian | 0 | 0.0% |
| Black / African American | 0 | 0.0% |
| Hawaiian / Pacific | 0 | 0.0% |
| Hispanic or Latino | 34 | 10.6% |
| Native / Alaskan | 2 | 0.6% |
| White / Caucasian | 263 | 81.7% |
| Two or more Races | 57 | 17.7% |
| Some other Race | 0 | 0.0% |
| Total | 322 | 100.0% |
Ancestry in Mad River
The most populous ancestries reported in Mad River are Irish (55 | 17.1%), German (53 | 16.5%), Italian (42 | 13.0%), Mexican (34 | 10.6%), and Mexican American Indian (34 | 10.6%), together accounting for 67.7% of all Mad River residents.
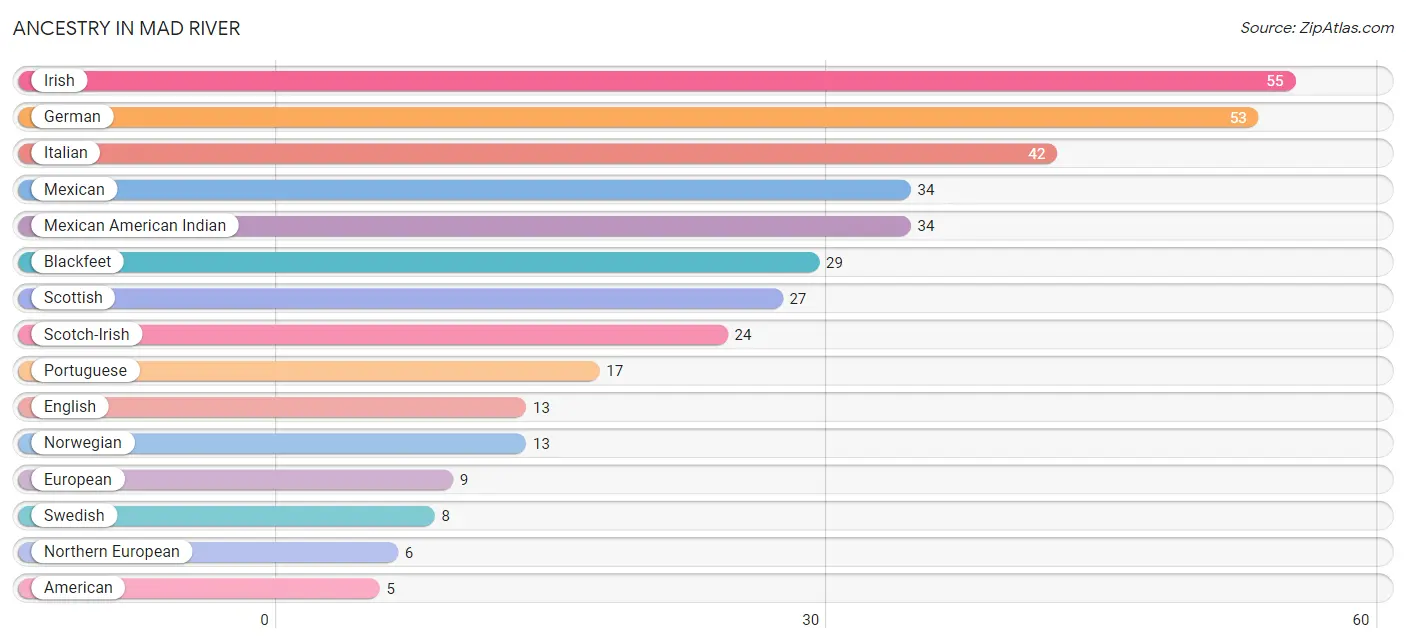
| Ancestry | # Population | % Population |
| American | 5 | 1.5% |
| Blackfeet | 29 | 9.0% |
| English | 13 | 4.0% |
| European | 9 | 2.8% |
| German | 53 | 16.5% |
| Irish | 55 | 17.1% |
| Italian | 42 | 13.0% |
| Mexican | 34 | 10.6% |
| Mexican American Indian | 34 | 10.6% |
| Northern European | 6 | 1.9% |
| Norwegian | 13 | 4.0% |
| Portuguese | 17 | 5.3% |
| Scotch-Irish | 24 | 7.4% |
| Scottish | 27 | 8.4% |
| Swedish | 8 | 2.5% | View All 15 Rows |
Immigrants in Mad River
The most numerous immigrant groups reported in Mad River came from Europe (9 | 2.8%), Northern Europe (9 | 2.8%), and Sweden (9 | 2.8%), together accounting for 8.4% of all Mad River residents.
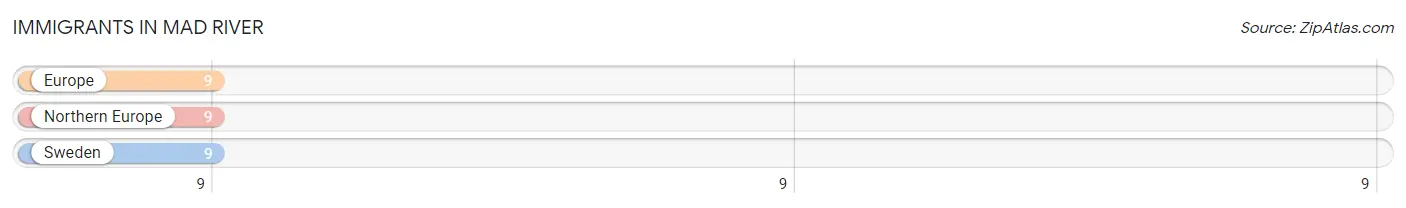
| Immigration Origin | # Population | % Population |
| Europe | 9 | 2.8% |
| Northern Europe | 9 | 2.8% |
| Sweden | 9 | 2.8% | View All 3 Rows |
Sex and Age in Mad River
Sex and Age in Mad River
The most populous age groups in Mad River are 55 to 59 Years (54 | 28.6%) for men and Under 5 Years (27 | 20.3%) for women.
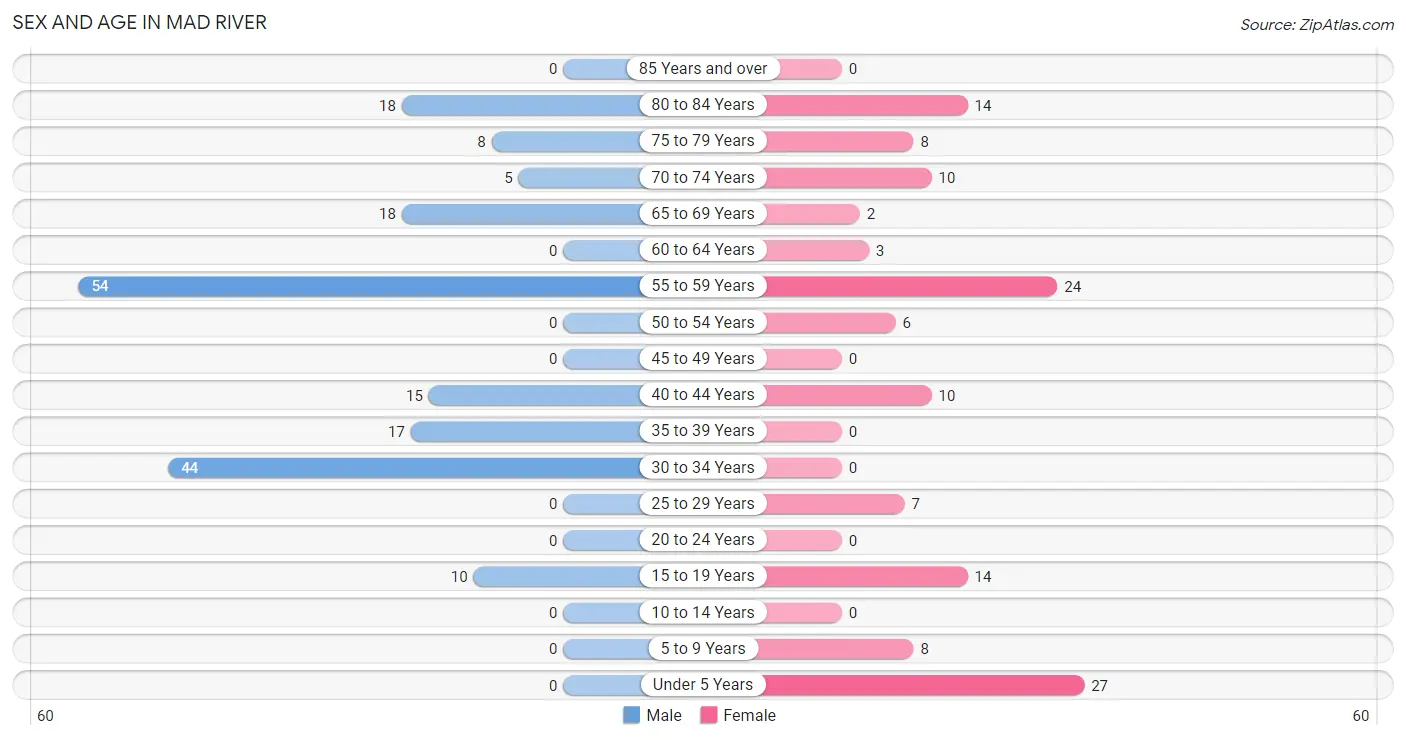
| Age Bracket | Male | Female |
| Under 5 Years | 0 (0.0%) | 27 (20.3%) |
| 5 to 9 Years | 0 (0.0%) | 8 (6.0%) |
| 10 to 14 Years | 0 (0.0%) | 0 (0.0%) |
| 15 to 19 Years | 10 (5.3%) | 14 (10.5%) |
| 20 to 24 Years | 0 (0.0%) | 0 (0.0%) |
| 25 to 29 Years | 0 (0.0%) | 7 (5.3%) |
| 30 to 34 Years | 44 (23.3%) | 0 (0.0%) |
| 35 to 39 Years | 17 (9.0%) | 0 (0.0%) |
| 40 to 44 Years | 15 (7.9%) | 10 (7.5%) |
| 45 to 49 Years | 0 (0.0%) | 0 (0.0%) |
| 50 to 54 Years | 0 (0.0%) | 6 (4.5%) |
| 55 to 59 Years | 54 (28.6%) | 24 (18.0%) |
| 60 to 64 Years | 0 (0.0%) | 3 (2.3%) |
| 65 to 69 Years | 18 (9.5%) | 2 (1.5%) |
| 70 to 74 Years | 5 (2.6%) | 10 (7.5%) |
| 75 to 79 Years | 8 (4.2%) | 8 (6.0%) |
| 80 to 84 Years | 18 (9.5%) | 14 (10.5%) |
| 85 Years and over | 0 (0.0%) | 0 (0.0%) |
| Total | 189 (100.0%) | 133 (100.0%) |
Families and Households in Mad River
Median Family Size in Mad River
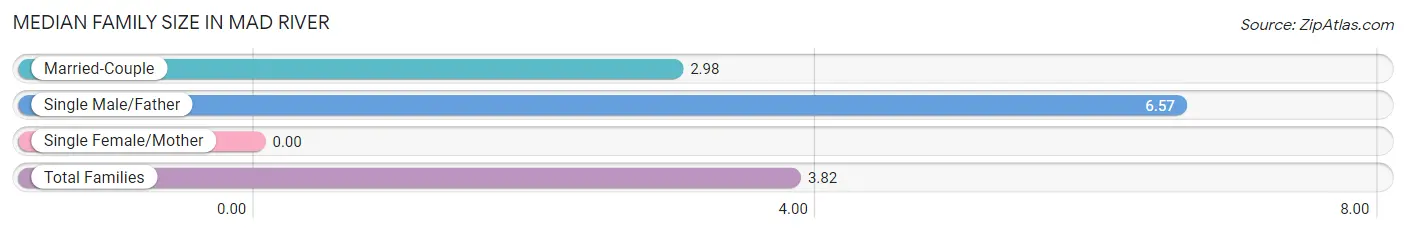
| Family Type | # Families | Family Size |
| Married-Couple | 46 (76.7%) | 2.98 |
| Single Male/Father | 14 (23.3%) | 6.57 |
| Single Female/Mother | 0 (0.0%) | - |
| Total Families | 60 (100.0%) | 3.82 |
Median Household Size in Mad River
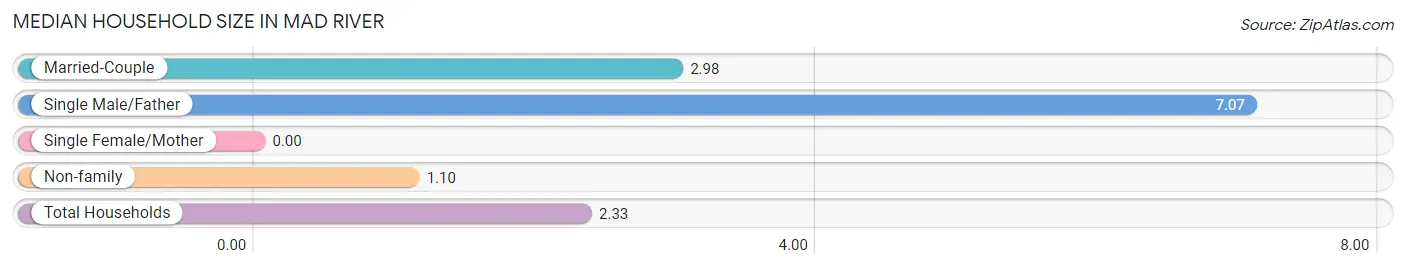
| Household Type | # Households | Household Size |
| Married-Couple | 46 (33.3%) | 2.98 |
| Single Male/Father | 14 (10.1%) | 7.07 |
| Single Female/Mother | 0 (0.0%) | - |
| Non-family | 78 (56.5%) | 1.10 |
| Total Households | 138 (100.0%) | 2.33 |
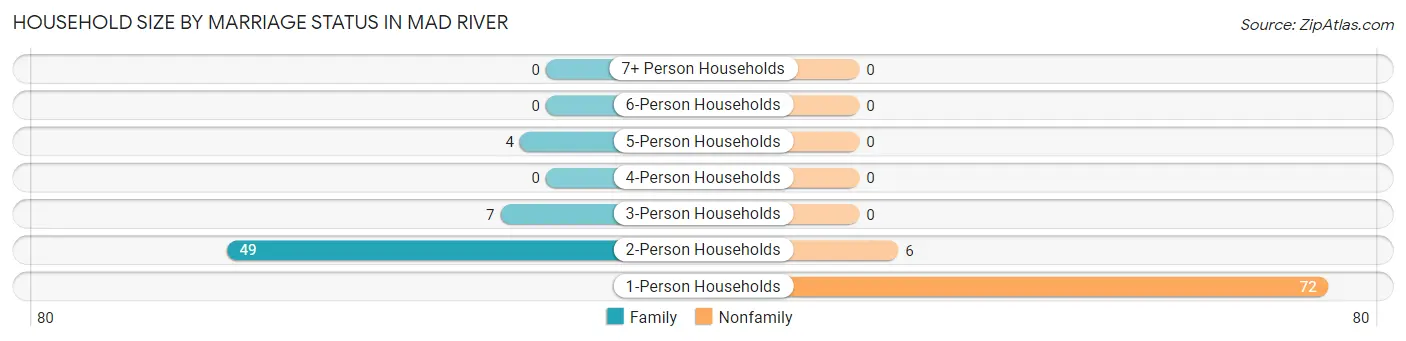
Household Size by Marriage Status in Mad River
Out of a total of 138 households in Mad River, 60 (43.5%) are family households, while 78 (56.5%) are nonfamily households. The most numerous type of family households are 2-person households, comprising 49, and the most common type of nonfamily households are 1-person households, comprising 72.
| Household Size | Family Households | Nonfamily Households |
| 1-Person Households | - | 72 (52.2%) |
| 2-Person Households | 49 (35.5%) | 6 (4.3%) |
| 3-Person Households | 7 (5.1%) | 0 (0.0%) |
| 4-Person Households | 0 (0.0%) | 0 (0.0%) |
| 5-Person Households | 4 (2.9%) | 0 (0.0%) |
| 6-Person Households | 0 (0.0%) | 0 (0.0%) |
| 7+ Person Households | 0 (0.0%) | 0 (0.0%) |
| Total | 60 (43.5%) | 78 (56.5%) |
Female Fertility in Mad River
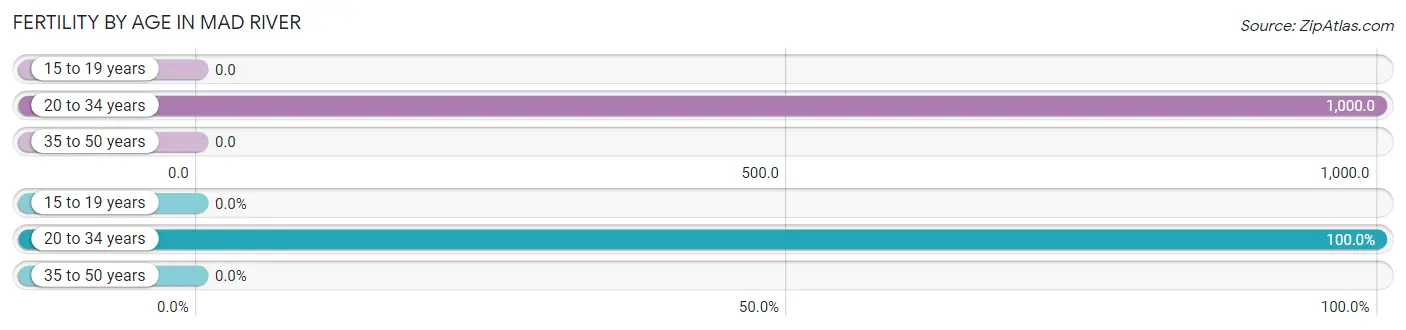
Fertility by Age in Mad River
Average fertility rate in Mad River is 226.0 births per 1,000 women. Women in the age bracket of 20 to 34 years have the highest fertility rate with 1,000.0 births per 1,000 women. Women in the age bracket of 20 to 34 years acount for 100.0% of all women with births.
| Age Bracket | Women with Births | Births / 1,000 Women |
| 15 to 19 years | 0 (0.0%) | 0.0 |
| 20 to 34 years | 7 (100.0%) | 1,000.0 |
| 35 to 50 years | 0 (0.0%) | 0.0 |
| Total | 7 (100.0%) | 226.0 |
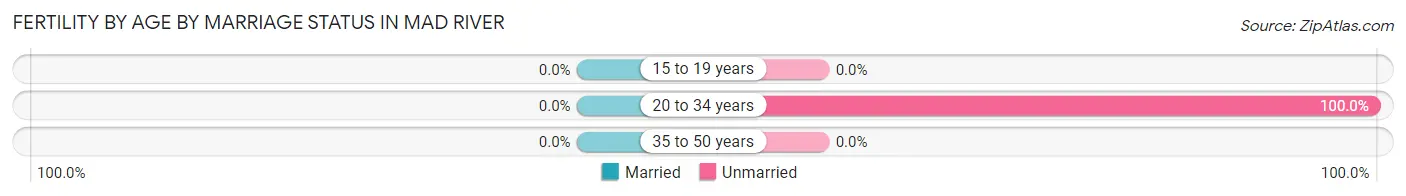
Fertility by Age by Marriage Status in Mad River
| Age Bracket | Married | Unmarried |
| 15 to 19 years | 0 (0.0%) | 0 (0.0%) |
| 20 to 34 years | 0 (0.0%) | 7 (100.0%) |
| 35 to 50 years | 0 (0.0%) | 0 (0.0%) |
| Total | 0 (0.0%) | 7 (100.0%) |
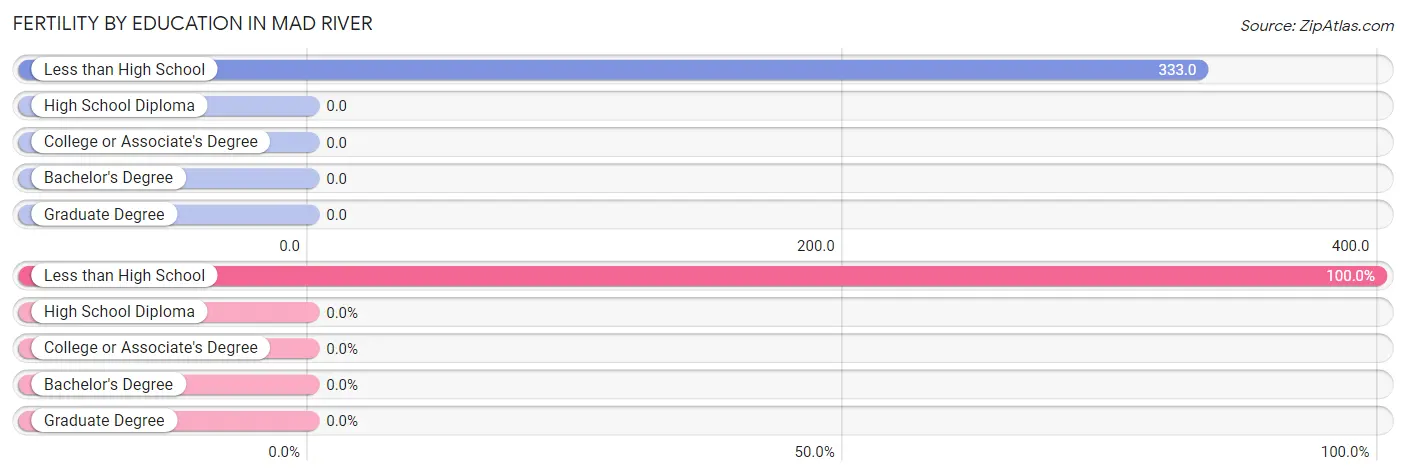
Fertility by Education in Mad River
| Educational Attainment | Women with Births | Births / 1,000 Women |
| Less than High School | 7 (100.0%) | 333.0 |
| High School Diploma | 0 (0.0%) | 0.0 |
| College or Associate's Degree | 0 (0.0%) | 0.0 |
| Bachelor's Degree | 0 (0.0%) | 0.0 |
| Graduate Degree | 0 (0.0%) | 0.0 |
| Total | 7 (100.0%) | 226.0 |
Fertility by Education by Marriage Status in Mad River
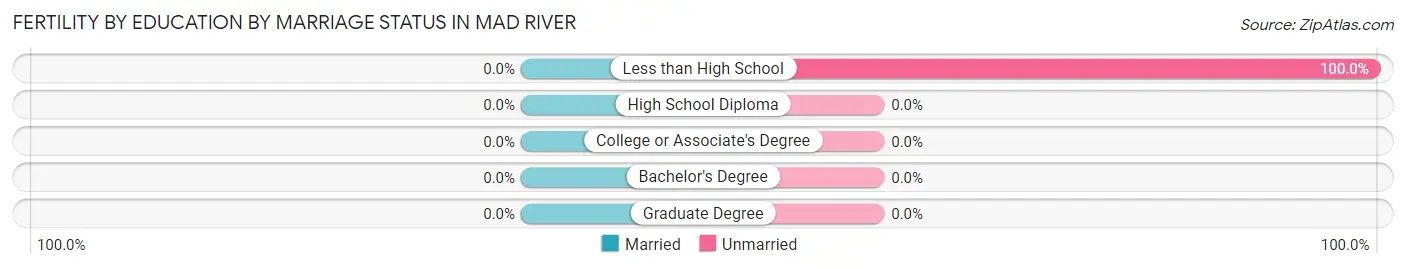
| Educational Attainment | Married | Unmarried |
| Less than High School | 0 (0.0%) | 7 (100.0%) |
| High School Diploma | 0 (0.0%) | 0 (0.0%) |
| College or Associate's Degree | 0 (0.0%) | 0 (0.0%) |
| Bachelor's Degree | 0 (0.0%) | 0 (0.0%) |
| Graduate Degree | 0 (0.0%) | 0 (0.0%) |
| Total | 0 (0.0%) | 7 (100.0%) |
Employment Characteristics in Mad River
Employment by Class of Employer in Mad River
Among the 64 employed individuals in Mad River, self-employed (not incorporated) (25 | 39.1%), private company employees (14 | 21.9%), and state government employees (12 | 18.8%) make up the most common classes of employment.
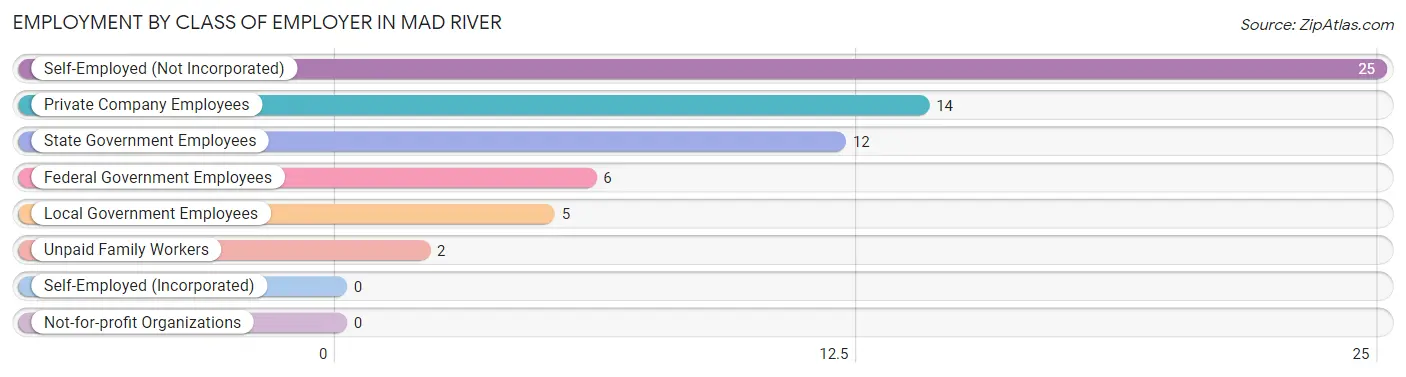
| Employer Class | # Employees | % Employees |
| Private Company Employees | 14 | 21.9% |
| Self-Employed (Incorporated) | 0 | 0.0% |
| Self-Employed (Not Incorporated) | 25 | 39.1% |
| Not-for-profit Organizations | 0 | 0.0% |
| Local Government Employees | 5 | 7.8% |
| State Government Employees | 12 | 18.8% |
| Federal Government Employees | 6 | 9.4% |
| Unpaid Family Workers | 2 | 3.1% |
| Total | 64 | 100.0% |
Employment Status by Age in Mad River
According to the labor force statistics for Mad River, out of the total population over 16 years of age (287), 25.1% or 72 individuals are in the labor force, with 6.9% or 5 of them unemployed. The age group with the highest labor force participation rate is 45 to 54 years, with 100.0% or 6 individuals in the labor force. Within the labor force, the 55 to 59 years age range has the highest percentage of unemployed individuals, with 15.2% or 5 of them being unemployed.
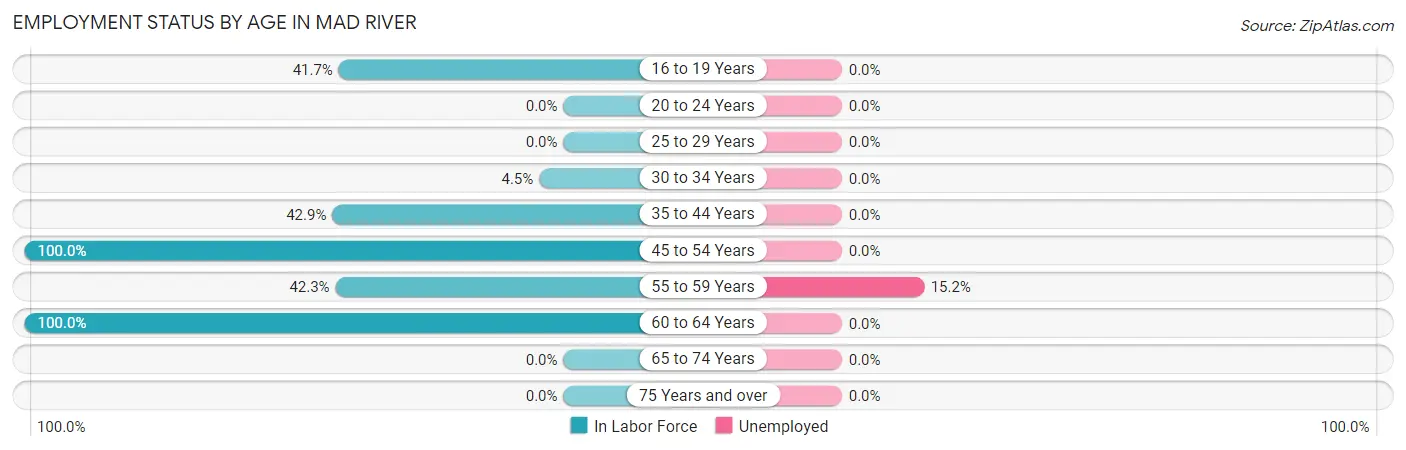
| Age Bracket | In Labor Force | Unemployed |
| 16 to 19 Years | 10 (41.7%) | 0 (0.0%) |
| 20 to 24 Years | 0 (0.0%) | 0 (0.0%) |
| 25 to 29 Years | 0 (0.0%) | 0 (0.0%) |
| 30 to 34 Years | 2 (4.5%) | 0 (0.0%) |
| 35 to 44 Years | 18 (42.9%) | 0 (0.0%) |
| 45 to 54 Years | 6 (100.0%) | 0 (0.0%) |
| 55 to 59 Years | 33 (42.3%) | 5 (15.2%) |
| 60 to 64 Years | 3 (100.0%) | 0 (0.0%) |
| 65 to 74 Years | 0 (0.0%) | 0 (0.0%) |
| 75 Years and over | 0 (0.0%) | 0 (0.0%) |
| Total | 72 (25.1%) | 5 (6.9%) |
Employment Status by Educational Attainment in Mad River
According to labor force statistics for Mad River, 34.4% of individuals (62) out of the total population between 25 and 64 years of age (180) are in the labor force, with 8.1% or 5 of them being unemployed. The group with the highest labor force participation rate are those with the educational attainment of bachelor's degree or higher, with 100.0% or 12 individuals in the labor force. Within the labor force, individuals with college / associate degree education have the highest percentage of unemployment, with 13.9% or 5 of them being unemployed.
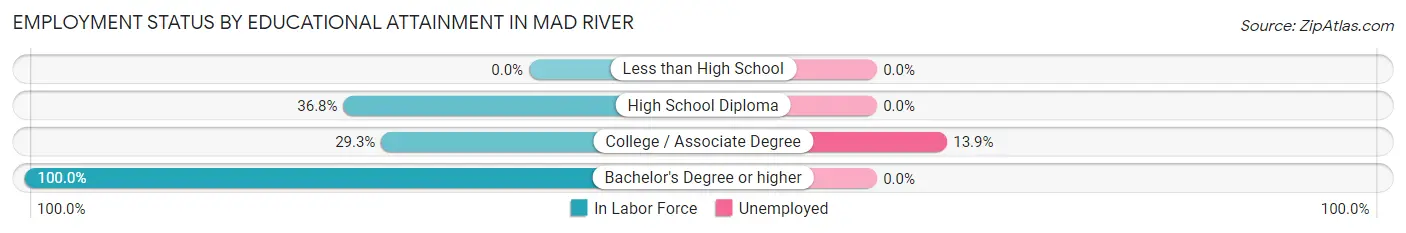
| Educational Attainment | In Labor Force | Unemployed |
| Less than High School | 0 (0.0%) | 0 (0.0%) |
| High School Diploma | 14 (36.8%) | 0 (0.0%) |
| College / Associate Degree | 36 (29.3%) | 17 (13.9%) |
| Bachelor's Degree or higher | 12 (100.0%) | 0 (0.0%) |
| Total | 62 (34.4%) | 15 (8.1%) |
Employment Occupations by Sex in Mad River
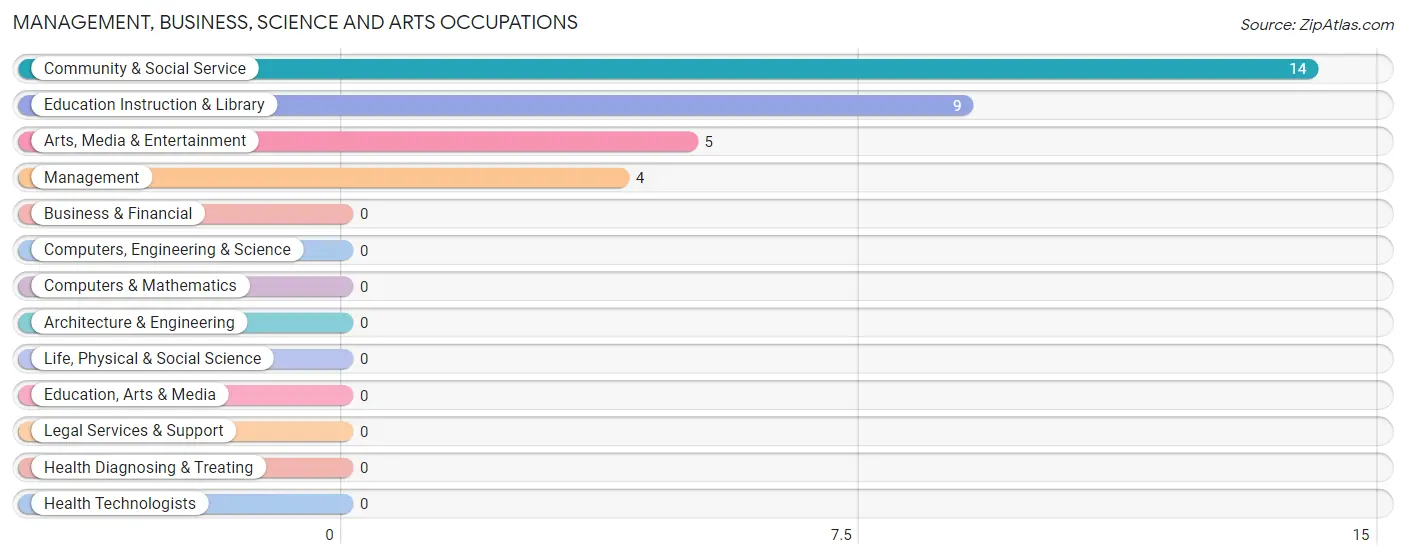
Management, Business, Science and Arts Occupations
The most common Management, Business, Science and Arts occupations in Mad River are Community & Social Service (14 | 20.9%), Education Instruction & Library (9 | 13.4%), Arts, Media & Entertainment (5 | 7.5%), and Management (4 | 6.0%).
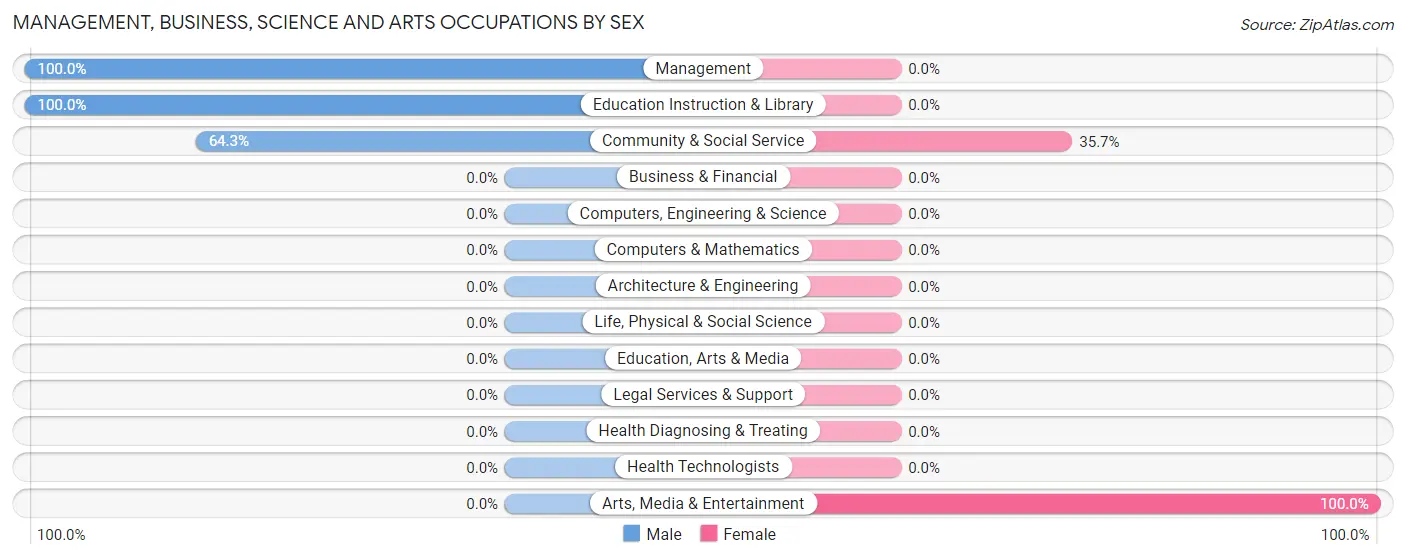
Management, Business, Science and Arts Occupations by Sex
Within the Management, Business, Science and Arts occupations in Mad River, the most male-oriented occupations are Management (100.0%), Education Instruction & Library (100.0%), and Community & Social Service (64.3%), while the most female-oriented occupations are Arts, Media & Entertainment (100.0%), and Community & Social Service (35.7%).
| Occupation | Male | Female |
| Management | 4 (100.0%) | 0 (0.0%) |
| Business & Financial | 0 (0.0%) | 0 (0.0%) |
| Computers, Engineering & Science | 0 (0.0%) | 0 (0.0%) |
| Computers & Mathematics | 0 (0.0%) | 0 (0.0%) |
| Architecture & Engineering | 0 (0.0%) | 0 (0.0%) |
| Life, Physical & Social Science | 0 (0.0%) | 0 (0.0%) |
| Community & Social Service | 9 (64.3%) | 5 (35.7%) |
| Education, Arts & Media | 0 (0.0%) | 0 (0.0%) |
| Legal Services & Support | 0 (0.0%) | 0 (0.0%) |
| Education Instruction & Library | 9 (100.0%) | 0 (0.0%) |
| Arts, Media & Entertainment | 0 (0.0%) | 5 (100.0%) |
| Health Diagnosing & Treating | 0 (0.0%) | 0 (0.0%) |
| Health Technologists | 0 (0.0%) | 0 (0.0%) |
| Total (Category) | 13 (72.2%) | 5 (27.8%) |
| Total (Overall) | 45 (67.2%) | 22 (32.8%) |
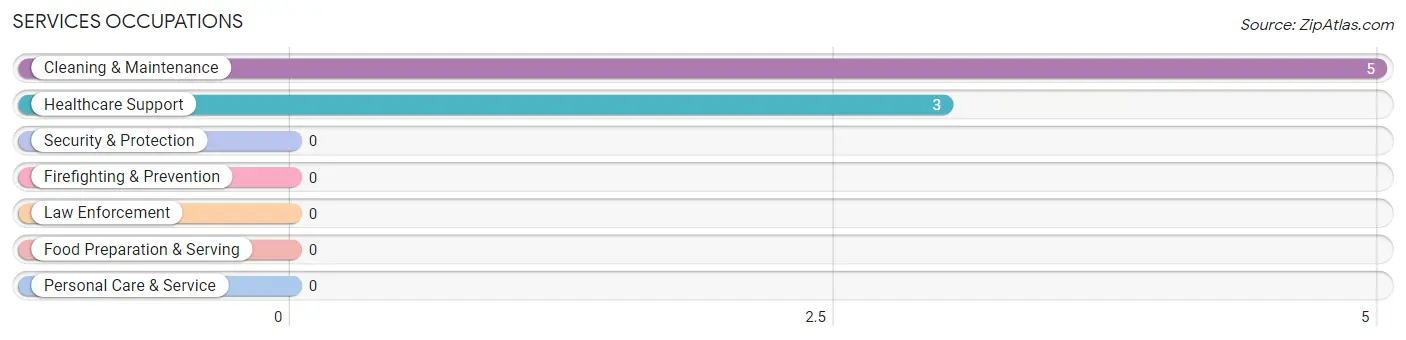
Services Occupations
The most common Services occupations in Mad River are Cleaning & Maintenance (5 | 7.5%), and Healthcare Support (3 | 4.5%).
Services Occupations by Sex
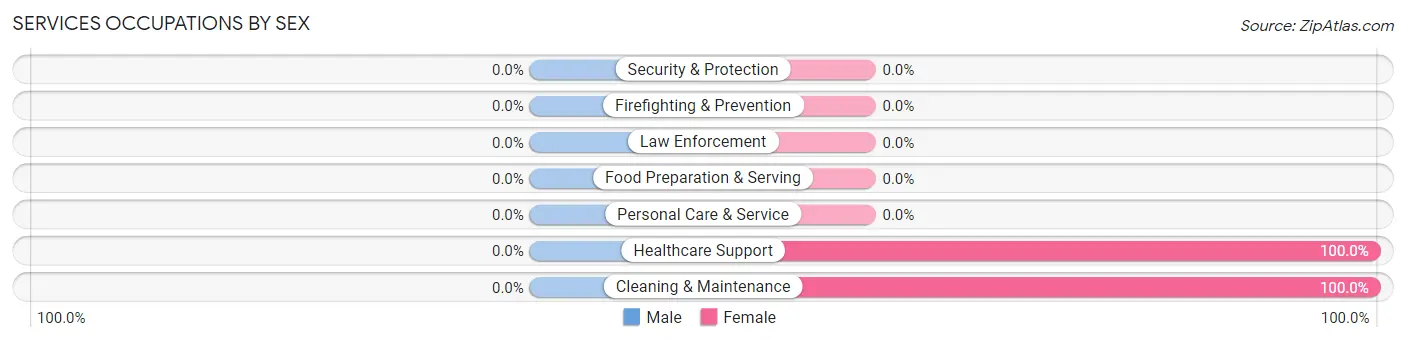
| Occupation | Male | Female |
| Healthcare Support | 0 (0.0%) | 3 (100.0%) |
| Security & Protection | 0 (0.0%) | 0 (0.0%) |
| Firefighting & Prevention | 0 (0.0%) | 0 (0.0%) |
| Law Enforcement | 0 (0.0%) | 0 (0.0%) |
| Food Preparation & Serving | 0 (0.0%) | 0 (0.0%) |
| Cleaning & Maintenance | 0 (0.0%) | 5 (100.0%) |
| Personal Care & Service | 0 (0.0%) | 0 (0.0%) |
| Total (Category) | 0 (0.0%) | 8 (100.0%) |
| Total (Overall) | 45 (67.2%) | 22 (32.8%) |
Sales and Office Occupations
The most common Sales and Office occupations in Mad River are Sales & Related (4 | 6.0%), and Office & Administration (3 | 4.5%).
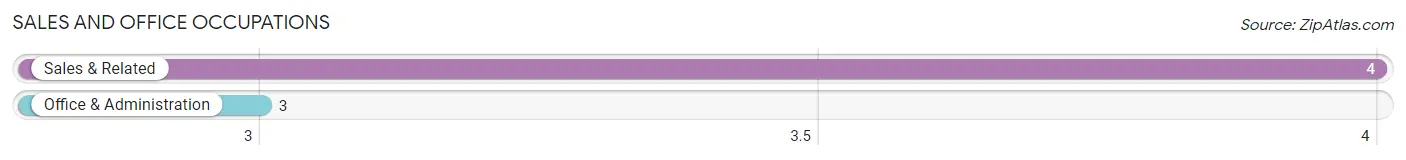
Sales and Office Occupations by Sex

| Occupation | Male | Female |
| Sales & Related | 4 (100.0%) | 0 (0.0%) |
| Office & Administration | 0 (0.0%) | 3 (100.0%) |
| Total (Category) | 4 (57.1%) | 3 (42.9%) |
| Total (Overall) | 45 (67.2%) | 22 (32.8%) |
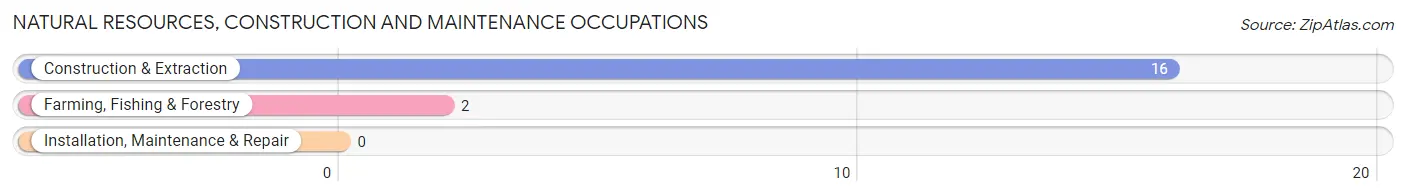
Natural Resources, Construction and Maintenance Occupations
The most common Natural Resources, Construction and Maintenance occupations in Mad River are Construction & Extraction (16 | 23.9%), and Farming, Fishing & Forestry (2 | 3.0%).
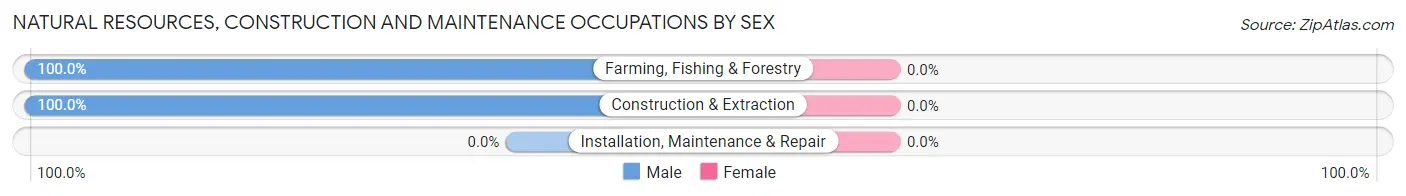
Natural Resources, Construction and Maintenance Occupations by Sex
| Occupation | Male | Female |
| Farming, Fishing & Forestry | 2 (100.0%) | 0 (0.0%) |
| Construction & Extraction | 16 (100.0%) | 0 (0.0%) |
| Installation, Maintenance & Repair | 0 (0.0%) | 0 (0.0%) |
| Total (Category) | 18 (100.0%) | 0 (0.0%) |
| Total (Overall) | 45 (67.2%) | 22 (32.8%) |
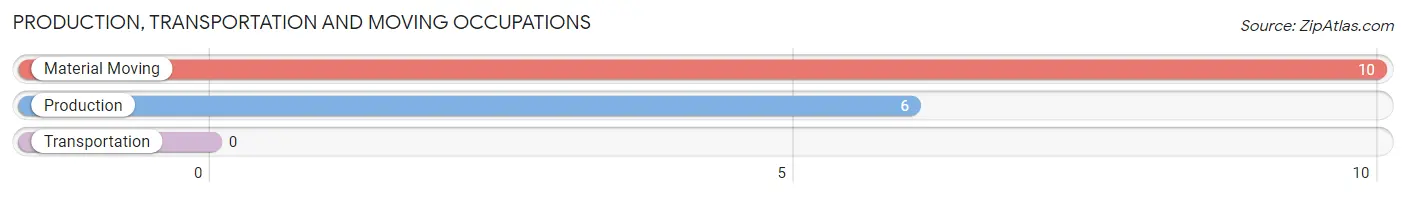
Production, Transportation and Moving Occupations
The most common Production, Transportation and Moving occupations in Mad River are Material Moving (10 | 14.9%), and Production (6 | 9.0%).
Production, Transportation and Moving Occupations by Sex
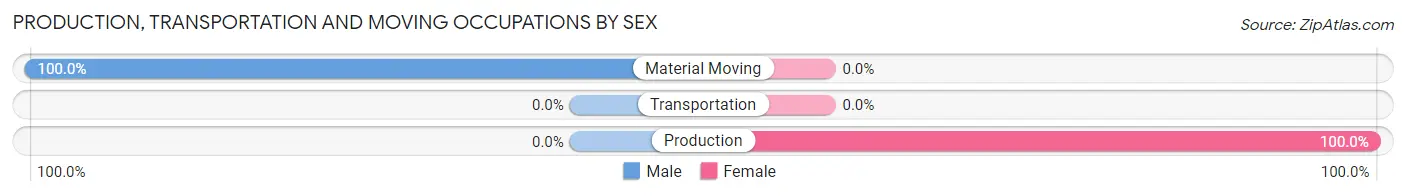
| Occupation | Male | Female |
| Production | 0 (0.0%) | 6 (100.0%) |
| Transportation | 0 (0.0%) | 0 (0.0%) |
| Material Moving | 10 (100.0%) | 0 (0.0%) |
| Total (Category) | 10 (62.5%) | 6 (37.5%) |
| Total (Overall) | 45 (67.2%) | 22 (32.8%) |
Employment Industries by Sex in Mad River
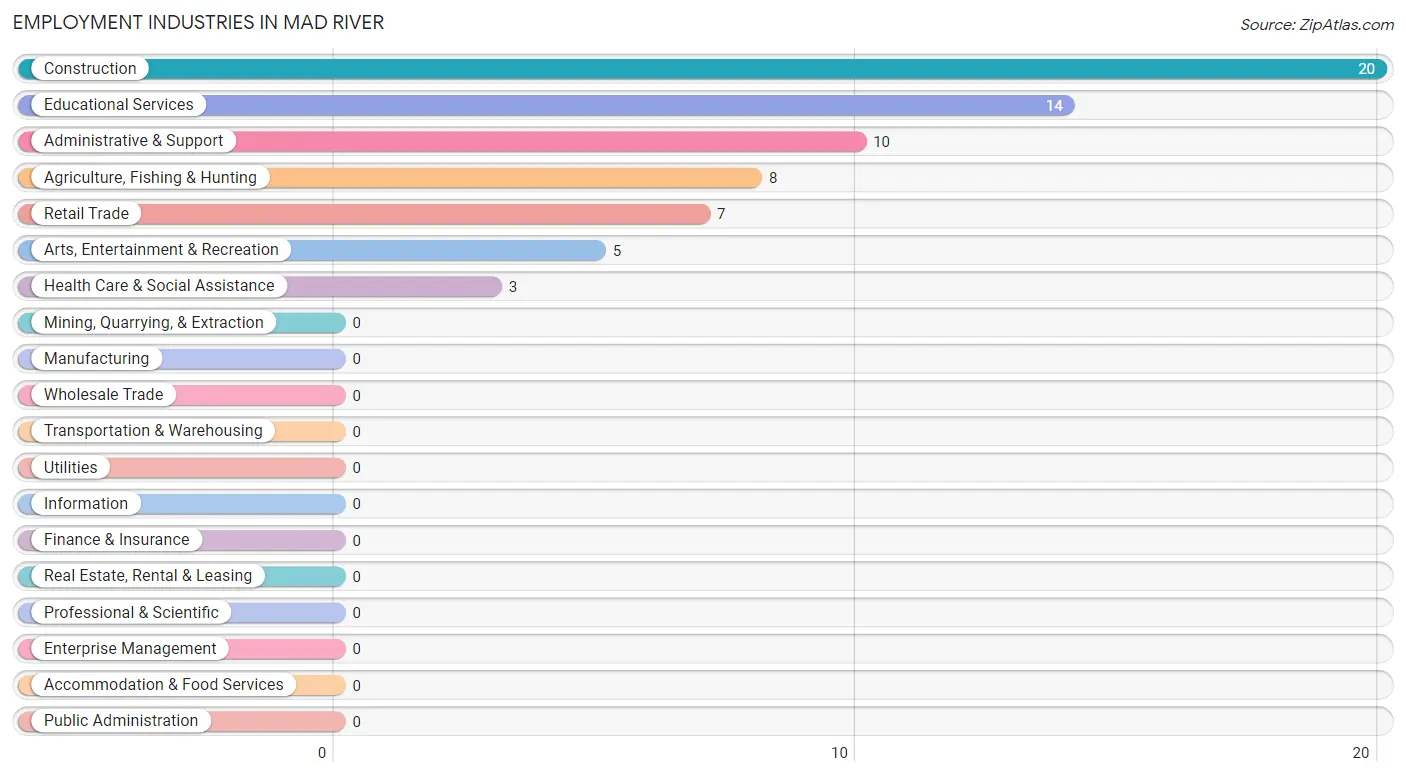
Employment Industries in Mad River
The major employment industries in Mad River include Construction (20 | 29.8%), Educational Services (14 | 20.9%), Administrative & Support (10 | 14.9%), Agriculture, Fishing & Hunting (8 | 11.9%), and Retail Trade (7 | 10.4%).
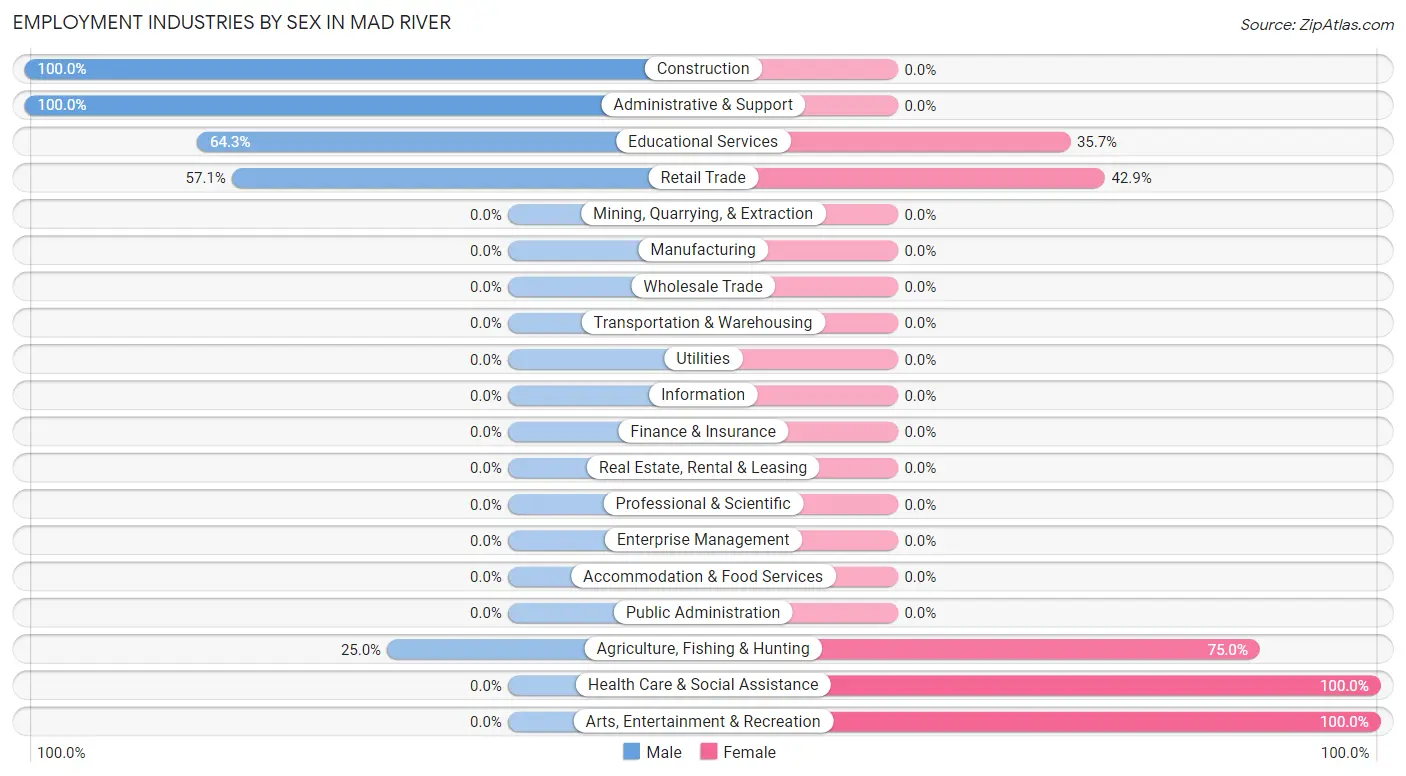
Employment Industries by Sex in Mad River
The Mad River industries that see more men than women are Construction (100.0%), Administrative & Support (100.0%), and Educational Services (64.3%), whereas the industries that tend to have a higher number of women are Health Care & Social Assistance (100.0%), Arts, Entertainment & Recreation (100.0%), and Agriculture, Fishing & Hunting (75.0%).
| Industry | Male | Female |
| Agriculture, Fishing & Hunting | 2 (25.0%) | 6 (75.0%) |
| Mining, Quarrying, & Extraction | 0 (0.0%) | 0 (0.0%) |
| Construction | 20 (100.0%) | 0 (0.0%) |
| Manufacturing | 0 (0.0%) | 0 (0.0%) |
| Wholesale Trade | 0 (0.0%) | 0 (0.0%) |
| Retail Trade | 4 (57.1%) | 3 (42.9%) |
| Transportation & Warehousing | 0 (0.0%) | 0 (0.0%) |
| Utilities | 0 (0.0%) | 0 (0.0%) |
| Information | 0 (0.0%) | 0 (0.0%) |
| Finance & Insurance | 0 (0.0%) | 0 (0.0%) |
| Real Estate, Rental & Leasing | 0 (0.0%) | 0 (0.0%) |
| Professional & Scientific | 0 (0.0%) | 0 (0.0%) |
| Enterprise Management | 0 (0.0%) | 0 (0.0%) |
| Administrative & Support | 10 (100.0%) | 0 (0.0%) |
| Educational Services | 9 (64.3%) | 5 (35.7%) |
| Health Care & Social Assistance | 0 (0.0%) | 3 (100.0%) |
| Arts, Entertainment & Recreation | 0 (0.0%) | 5 (100.0%) |
| Accommodation & Food Services | 0 (0.0%) | 0 (0.0%) |
| Public Administration | 0 (0.0%) | 0 (0.0%) |
| Total | 45 (67.2%) | 22 (32.8%) |
Education in Mad River
School Enrollment in Mad River
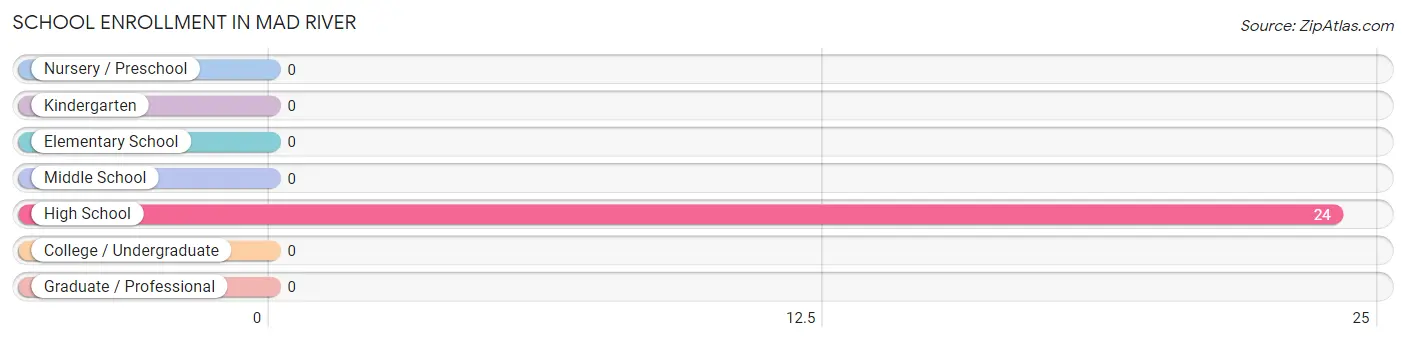
| School Level | # Students | % Students |
| Nursery / Preschool | 0 | 0.0% |
| Kindergarten | 0 | 0.0% |
| Elementary School | 0 | 0.0% |
| Middle School | 0 | 0.0% |
| High School | 24 | 100.0% |
| College / Undergraduate | 0 | 0.0% |
| Graduate / Professional | 0 | 0.0% |
| Total | 24 | 100.0% |
School Enrollment by Age by Funding Source in Mad River
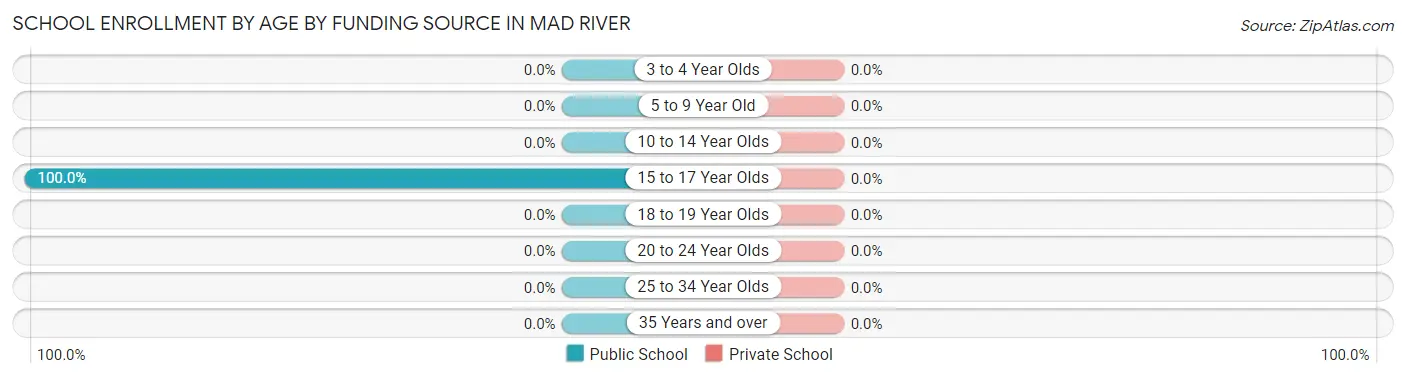
| Age Bracket | Public School | Private School |
| 3 to 4 Year Olds | 0 (0.0%) | 0 (0.0%) |
| 5 to 9 Year Old | 0 (0.0%) | 0 (0.0%) |
| 10 to 14 Year Olds | 0 (0.0%) | 0 (0.0%) |
| 15 to 17 Year Olds | 24 (100.0%) | 0 (0.0%) |
| 18 to 19 Year Olds | 0 (0.0%) | 0 (0.0%) |
| 20 to 24 Year Olds | 0 (0.0%) | 0 (0.0%) |
| 25 to 34 Year Olds | 0 (0.0%) | 0 (0.0%) |
| 35 Years and over | 0 (0.0%) | 0 (0.0%) |
| Total | 24 (100.0%) | 0 (0.0%) |
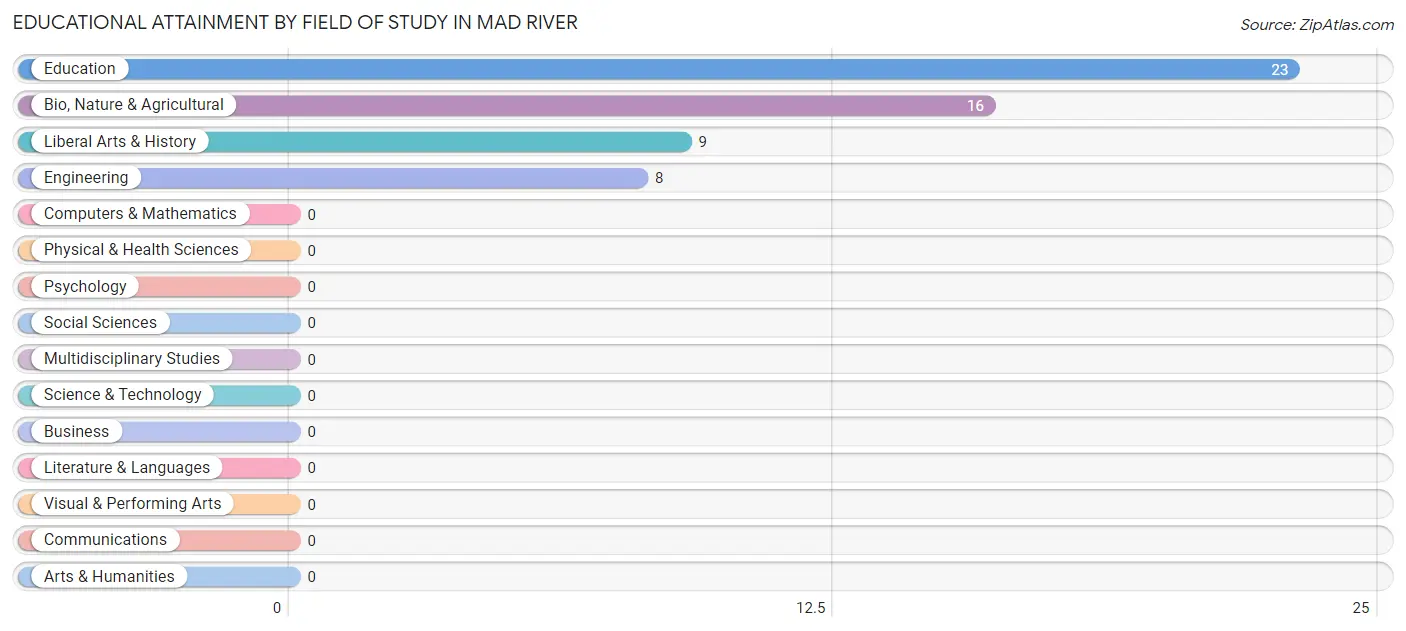
Educational Attainment by Field of Study in Mad River
Education (23 | 41.1%), bio, nature & agricultural (16 | 28.6%), liberal arts & history (9 | 16.1%), and engineering (8 | 14.3%) are the most common fields of study among 56 individuals in Mad River who have obtained a bachelor's degree or higher.
| Field of Study | # Graduates | % Graduates |
| Computers & Mathematics | 0 | 0.0% |
| Bio, Nature & Agricultural | 16 | 28.6% |
| Physical & Health Sciences | 0 | 0.0% |
| Psychology | 0 | 0.0% |
| Social Sciences | 0 | 0.0% |
| Engineering | 8 | 14.3% |
| Multidisciplinary Studies | 0 | 0.0% |
| Science & Technology | 0 | 0.0% |
| Business | 0 | 0.0% |
| Education | 23 | 41.1% |
| Literature & Languages | 0 | 0.0% |
| Liberal Arts & History | 9 | 16.1% |
| Visual & Performing Arts | 0 | 0.0% |
| Communications | 0 | 0.0% |
| Arts & Humanities | 0 | 0.0% |
| Total | 56 | 100.0% |
Transportation & Commute in Mad River
Vehicle Availability by Sex in Mad River
The most prevalent vehicle ownership categories in Mad River are males with 3 vehicles (23, accounting for 51.1%) and females with 3 vehicles (8, making up 121.0%).
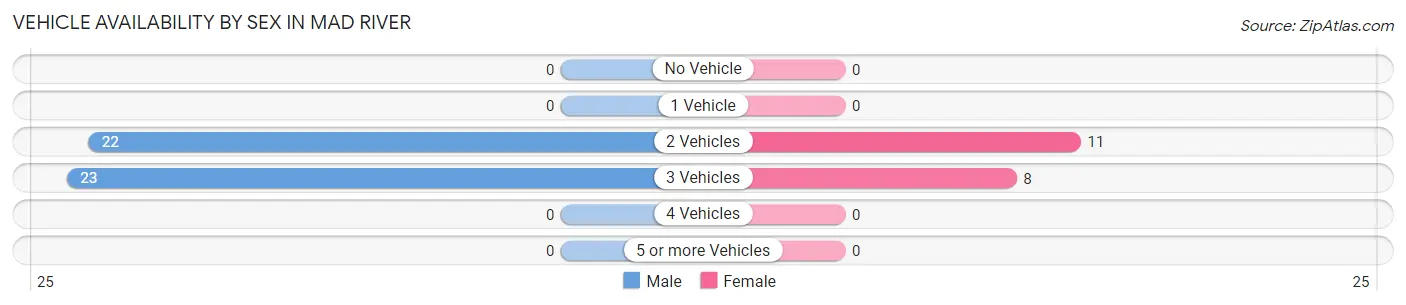
| Vehicles Available | Male | Female |
| No Vehicle | 0 (0.0%) | 0 (0.0%) |
| 1 Vehicle | 0 (0.0%) | 0 (0.0%) |
| 2 Vehicles | 22 (48.9%) | 11 (57.9%) |
| 3 Vehicles | 23 (51.1%) | 8 (42.1%) |
| 4 Vehicles | 0 (0.0%) | 0 (0.0%) |
| 5 or more Vehicles | 0 (0.0%) | 0 (0.0%) |
| Total | 45 (100.0%) | 19 (100.0%) |
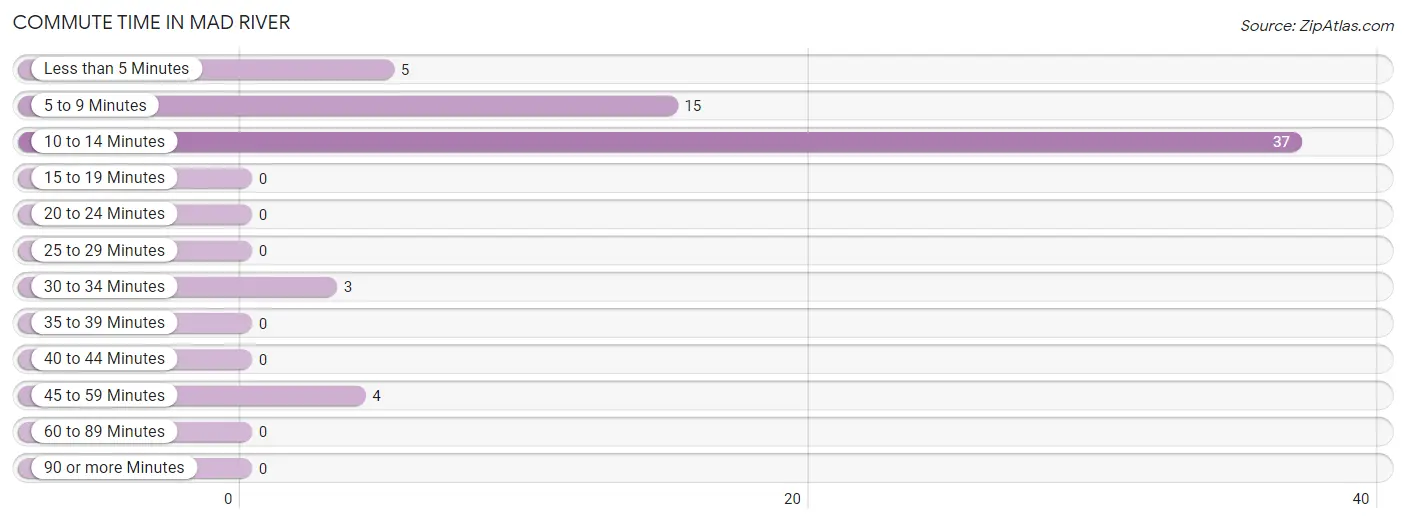
Commute Time in Mad River
The most frequently occuring commute durations in Mad River are 10 to 14 minutes (37 commuters, 57.8%), 5 to 9 minutes (15 commuters, 23.4%), and less than 5 minutes (5 commuters, 7.8%).
| Commute Time | # Commuters | % Commuters |
| Less than 5 Minutes | 5 | 7.8% |
| 5 to 9 Minutes | 15 | 23.4% |
| 10 to 14 Minutes | 37 | 57.8% |
| 15 to 19 Minutes | 0 | 0.0% |
| 20 to 24 Minutes | 0 | 0.0% |
| 25 to 29 Minutes | 0 | 0.0% |
| 30 to 34 Minutes | 3 | 4.7% |
| 35 to 39 Minutes | 0 | 0.0% |
| 40 to 44 Minutes | 0 | 0.0% |
| 45 to 59 Minutes | 4 | 6.2% |
| 60 to 89 Minutes | 0 | 0.0% |
| 90 or more Minutes | 0 | 0.0% |
Commute Time by Sex in Mad River
The most common commute times in Mad River are 10 to 14 minutes (32 commuters, 71.1%) for males and 5 to 9 minutes (6 commuters, 31.6%) for females.
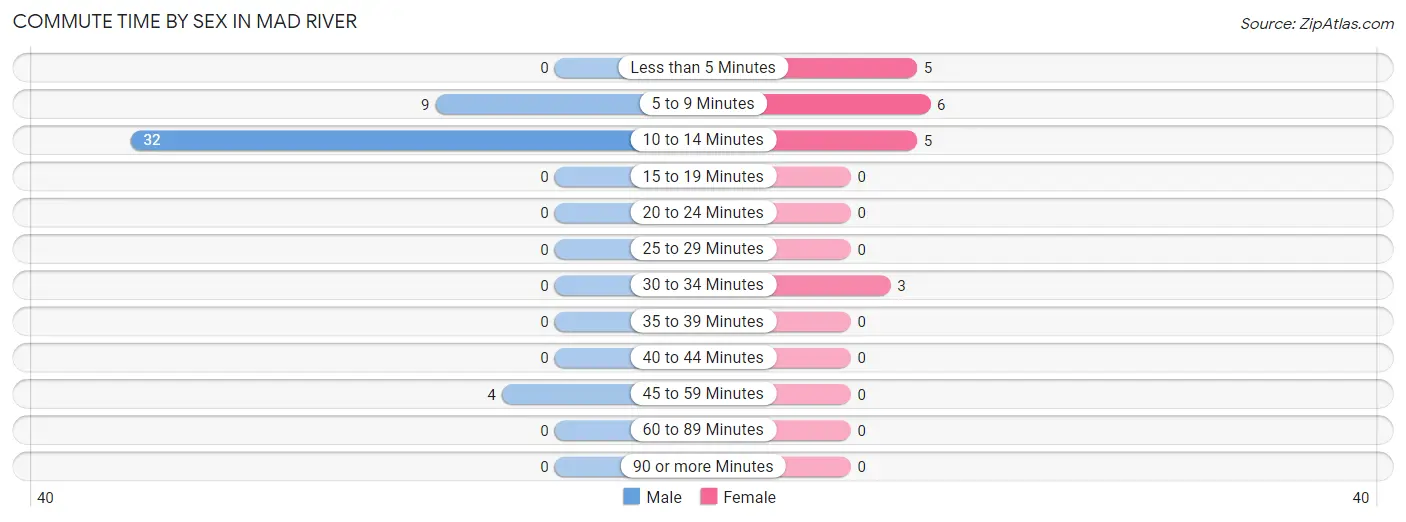
| Commute Time | Male | Female |
| Less than 5 Minutes | 0 (0.0%) | 5 (26.3%) |
| 5 to 9 Minutes | 9 (20.0%) | 6 (31.6%) |
| 10 to 14 Minutes | 32 (71.1%) | 5 (26.3%) |
| 15 to 19 Minutes | 0 (0.0%) | 0 (0.0%) |
| 20 to 24 Minutes | 0 (0.0%) | 0 (0.0%) |
| 25 to 29 Minutes | 0 (0.0%) | 0 (0.0%) |
| 30 to 34 Minutes | 0 (0.0%) | 3 (15.8%) |
| 35 to 39 Minutes | 0 (0.0%) | 0 (0.0%) |
| 40 to 44 Minutes | 0 (0.0%) | 0 (0.0%) |
| 45 to 59 Minutes | 4 (8.9%) | 0 (0.0%) |
| 60 to 89 Minutes | 0 (0.0%) | 0 (0.0%) |
| 90 or more Minutes | 0 (0.0%) | 0 (0.0%) |
Time of Departure to Work by Sex in Mad River
The most frequent times of departure to work in Mad River are 7:30 AM to 7:59 AM (23, 51.1%) for males and 7:30 AM to 7:59 AM (6, 31.6%) for females.
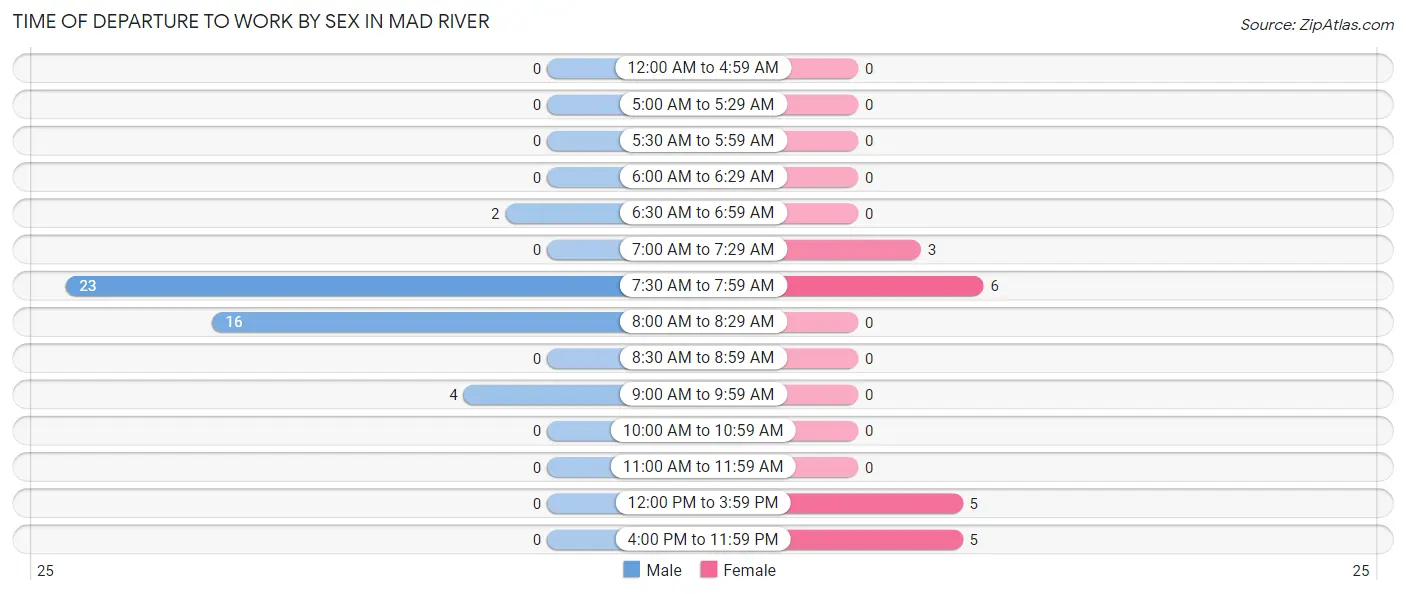
| Time of Departure | Male | Female |
| 12:00 AM to 4:59 AM | 0 (0.0%) | 0 (0.0%) |
| 5:00 AM to 5:29 AM | 0 (0.0%) | 0 (0.0%) |
| 5:30 AM to 5:59 AM | 0 (0.0%) | 0 (0.0%) |
| 6:00 AM to 6:29 AM | 0 (0.0%) | 0 (0.0%) |
| 6:30 AM to 6:59 AM | 2 (4.4%) | 0 (0.0%) |
| 7:00 AM to 7:29 AM | 0 (0.0%) | 3 (15.8%) |
| 7:30 AM to 7:59 AM | 23 (51.1%) | 6 (31.6%) |
| 8:00 AM to 8:29 AM | 16 (35.6%) | 0 (0.0%) |
| 8:30 AM to 8:59 AM | 0 (0.0%) | 0 (0.0%) |
| 9:00 AM to 9:59 AM | 4 (8.9%) | 0 (0.0%) |
| 10:00 AM to 10:59 AM | 0 (0.0%) | 0 (0.0%) |
| 11:00 AM to 11:59 AM | 0 (0.0%) | 0 (0.0%) |
| 12:00 PM to 3:59 PM | 0 (0.0%) | 5 (26.3%) |
| 4:00 PM to 11:59 PM | 0 (0.0%) | 5 (26.3%) |
| Total | 45 (100.0%) | 19 (100.0%) |
Housing Occupancy in Mad River
Occupancy by Ownership in Mad River
Of the total 138 dwellings in Mad River, owner-occupied units account for 96 (69.6%), while renter-occupied units make up 42 (30.4%).
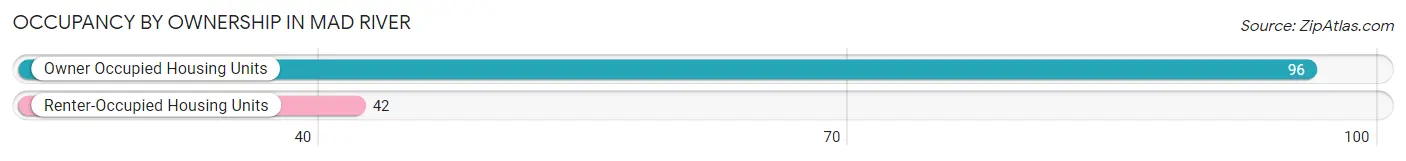
| Occupancy | # Housing Units | % Housing Units |
| Owner Occupied Housing Units | 96 | 69.6% |
| Renter-Occupied Housing Units | 42 | 30.4% |
| Total Occupied Housing Units | 138 | 100.0% |
Occupancy by Household Size in Mad River
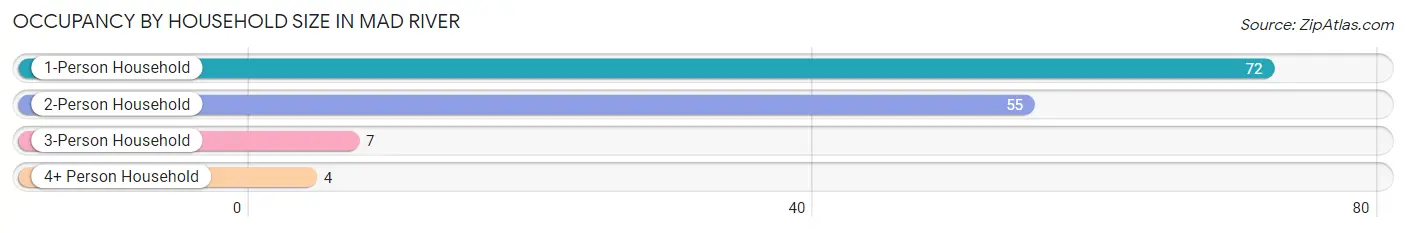
| Household Size | # Housing Units | % Housing Units |
| 1-Person Household | 72 | 52.2% |
| 2-Person Household | 55 | 39.9% |
| 3-Person Household | 7 | 5.1% |
| 4+ Person Household | 4 | 2.9% |
| Total Housing Units | 138 | 100.0% |
Occupancy by Ownership by Household Size in Mad River
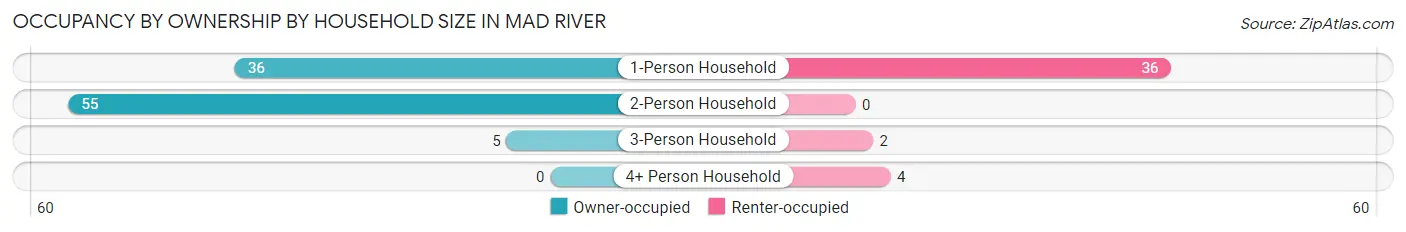
| Household Size | Owner-occupied | Renter-occupied |
| 1-Person Household | 36 (50.0%) | 36 (50.0%) |
| 2-Person Household | 55 (100.0%) | 0 (0.0%) |
| 3-Person Household | 5 (71.4%) | 2 (28.6%) |
| 4+ Person Household | 0 (0.0%) | 4 (100.0%) |
| Total Housing Units | 96 (69.6%) | 42 (30.4%) |
Occupancy by Educational Attainment in Mad River
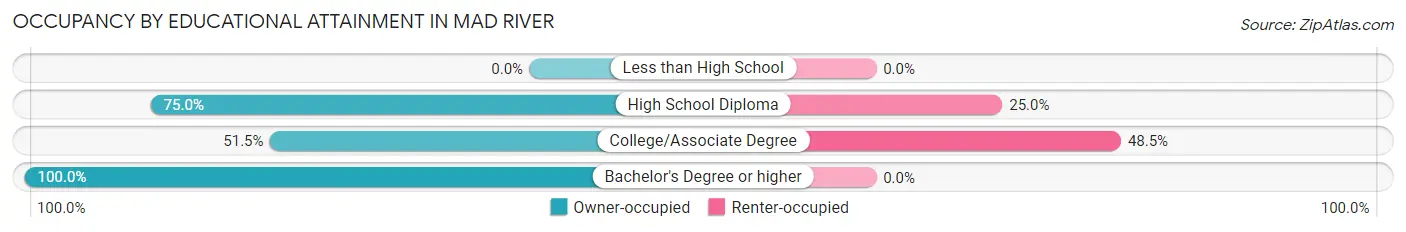
| Household Size | Owner-occupied | Renter-occupied |
| Less than High School | 0 (0.0%) | 0 (0.0%) |
| High School Diploma | 27 (75.0%) | 9 (25.0%) |
| College/Associate Degree | 35 (51.5%) | 33 (48.5%) |
| Bachelor's Degree or higher | 34 (100.0%) | 0 (0.0%) |
Occupancy by Age of Householder in Mad River
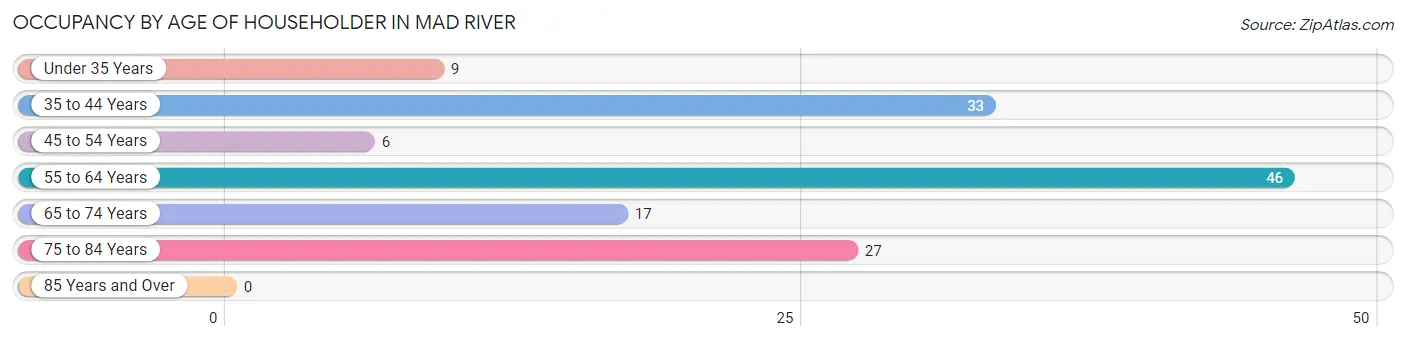
| Age Bracket | # Households | % Households |
| Under 35 Years | 9 | 6.5% |
| 35 to 44 Years | 33 | 23.9% |
| 45 to 54 Years | 6 | 4.3% |
| 55 to 64 Years | 46 | 33.3% |
| 65 to 74 Years | 17 | 12.3% |
| 75 to 84 Years | 27 | 19.6% |
| 85 Years and Over | 0 | 0.0% |
| Total | 138 | 100.0% |
Housing Finances in Mad River
Median Income by Occupancy in Mad River
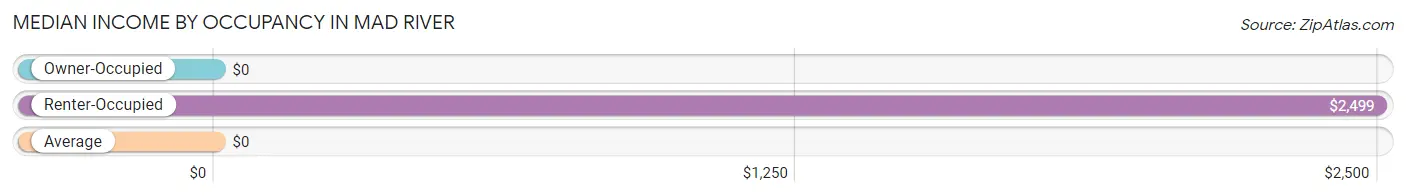
| Occupancy Type | # Households | Median Income |
| Owner-Occupied | 96 (69.6%) | $0 |
| Renter-Occupied | 42 (30.4%) | $2,499 |
| Average | 138 (100.0%) | $0 |
Occupancy by Householder Income Bracket in Mad River
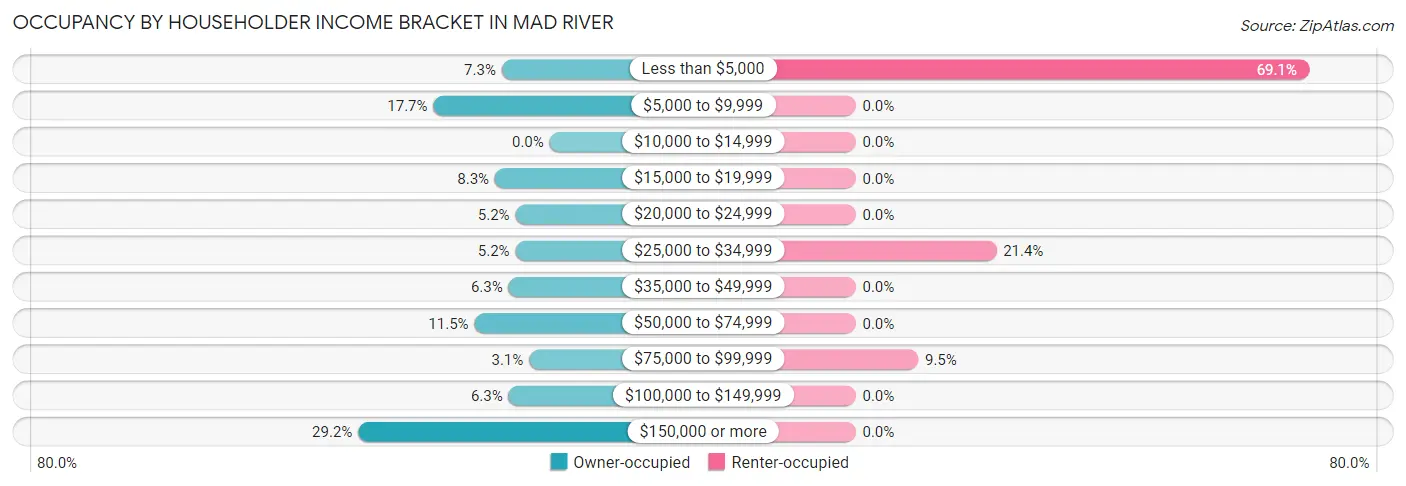
| Income Bracket | Owner-occupied | Renter-occupied |
| Less than $5,000 | 7 (7.3%) | 29 (69.1%) |
| $5,000 to $9,999 | 17 (17.7%) | 0 (0.0%) |
| $10,000 to $14,999 | 0 (0.0%) | 0 (0.0%) |
| $15,000 to $19,999 | 8 (8.3%) | 0 (0.0%) |
| $20,000 to $24,999 | 5 (5.2%) | 0 (0.0%) |
| $25,000 to $34,999 | 5 (5.2%) | 9 (21.4%) |
| $35,000 to $49,999 | 6 (6.2%) | 0 (0.0%) |
| $50,000 to $74,999 | 11 (11.5%) | 0 (0.0%) |
| $75,000 to $99,999 | 3 (3.1%) | 4 (9.5%) |
| $100,000 to $149,999 | 6 (6.2%) | 0 (0.0%) |
| $150,000 or more | 28 (29.2%) | 0 (0.0%) |
| Total | 96 (100.0%) | 42 (100.0%) |
Monthly Housing Cost Tiers in Mad River
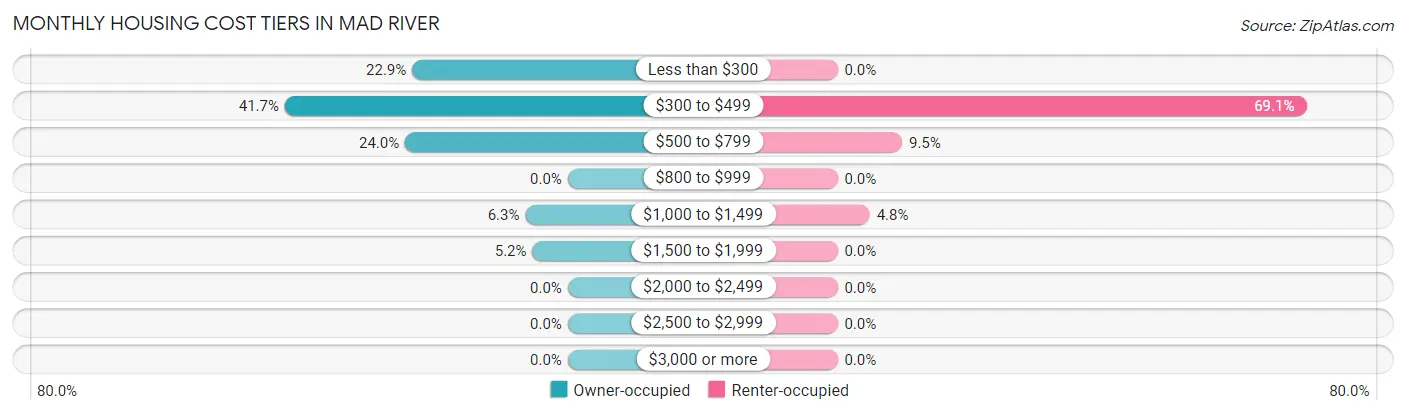
| Monthly Cost | Owner-occupied | Renter-occupied |
| Less than $300 | 22 (22.9%) | 0 (0.0%) |
| $300 to $499 | 40 (41.7%) | 29 (69.1%) |
| $500 to $799 | 23 (24.0%) | 4 (9.5%) |
| $800 to $999 | 0 (0.0%) | 0 (0.0%) |
| $1,000 to $1,499 | 6 (6.2%) | 2 (4.8%) |
| $1,500 to $1,999 | 5 (5.2%) | 0 (0.0%) |
| $2,000 to $2,499 | 0 (0.0%) | 0 (0.0%) |
| $2,500 to $2,999 | 0 (0.0%) | 0 (0.0%) |
| $3,000 or more | 0 (0.0%) | 0 (0.0%) |
| Total | 96 (100.0%) | 42 (100.0%) |
Physical Housing Characteristics in Mad River
Housing Structures in Mad River
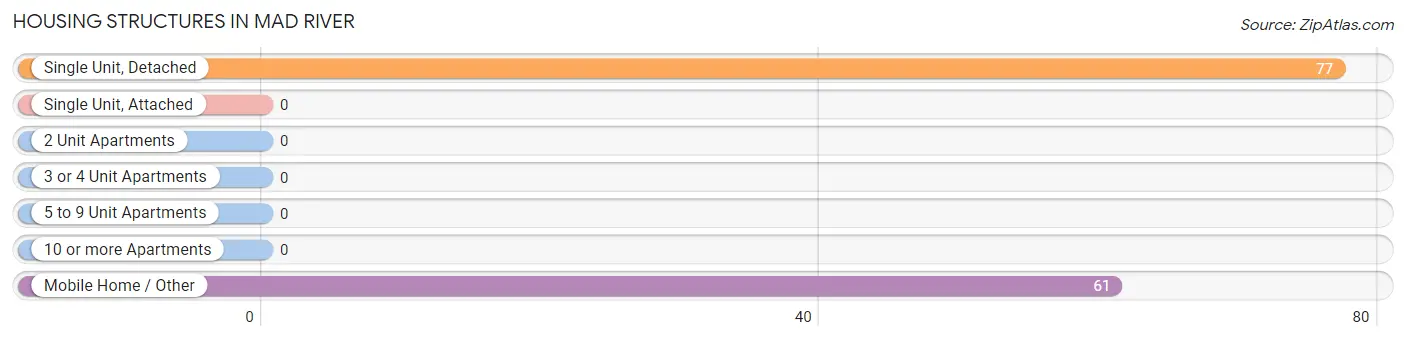
| Structure Type | # Housing Units | % Housing Units |
| Single Unit, Detached | 77 | 55.8% |
| Single Unit, Attached | 0 | 0.0% |
| 2 Unit Apartments | 0 | 0.0% |
| 3 or 4 Unit Apartments | 0 | 0.0% |
| 5 to 9 Unit Apartments | 0 | 0.0% |
| 10 or more Apartments | 0 | 0.0% |
| Mobile Home / Other | 61 | 44.2% |
| Total | 138 | 100.0% |
Housing Structures by Occupancy in Mad River
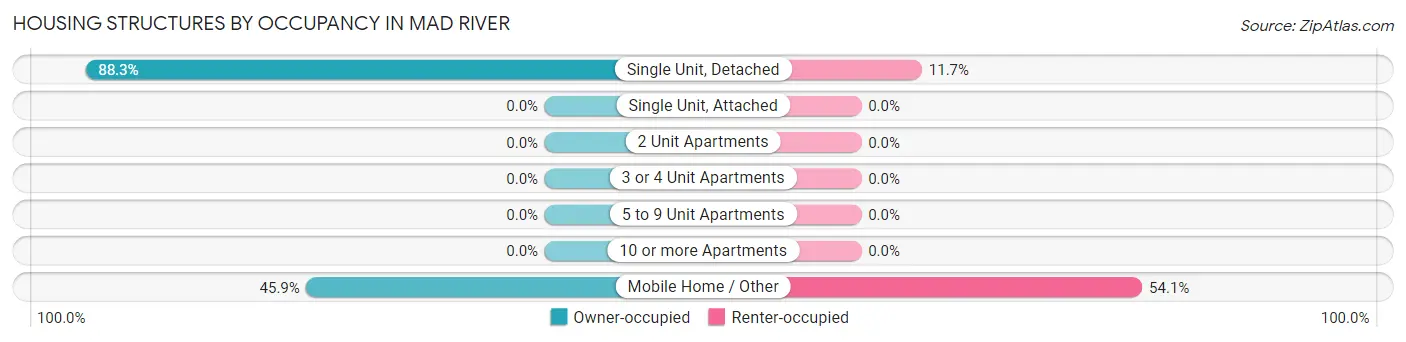
| Structure Type | Owner-occupied | Renter-occupied |
| Single Unit, Detached | 68 (88.3%) | 9 (11.7%) |
| Single Unit, Attached | 0 (0.0%) | 0 (0.0%) |
| 2 Unit Apartments | 0 (0.0%) | 0 (0.0%) |
| 3 or 4 Unit Apartments | 0 (0.0%) | 0 (0.0%) |
| 5 to 9 Unit Apartments | 0 (0.0%) | 0 (0.0%) |
| 10 or more Apartments | 0 (0.0%) | 0 (0.0%) |
| Mobile Home / Other | 28 (45.9%) | 33 (54.1%) |
| Total | 96 (69.6%) | 42 (30.4%) |
Housing Structures by Number of Rooms in Mad River
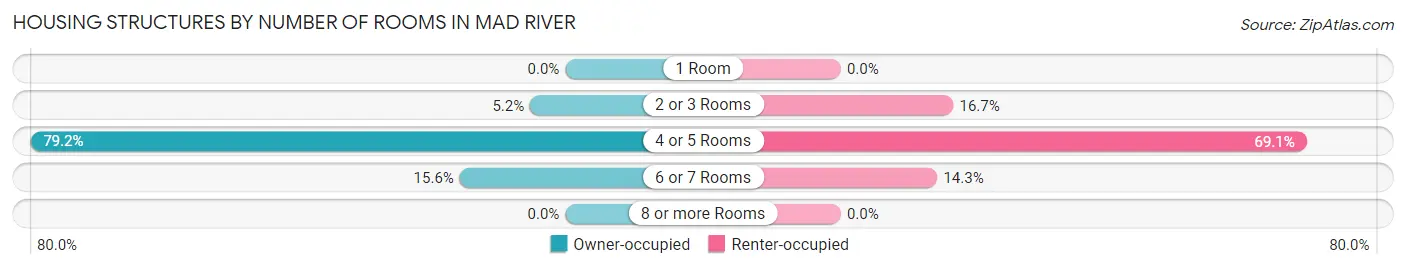
| Number of Rooms | Owner-occupied | Renter-occupied |
| 1 Room | 0 (0.0%) | 0 (0.0%) |
| 2 or 3 Rooms | 5 (5.2%) | 7 (16.7%) |
| 4 or 5 Rooms | 76 (79.2%) | 29 (69.1%) |
| 6 or 7 Rooms | 15 (15.6%) | 6 (14.3%) |
| 8 or more Rooms | 0 (0.0%) | 0 (0.0%) |
| Total | 96 (100.0%) | 42 (100.0%) |
Housing Structure by Heating Type in Mad River
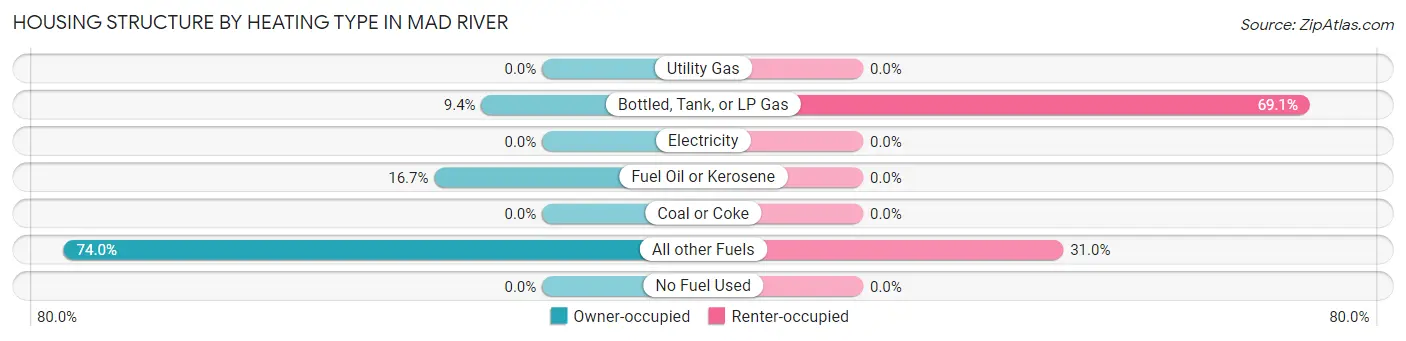
| Heating Type | Owner-occupied | Renter-occupied |
| Utility Gas | 0 (0.0%) | 0 (0.0%) |
| Bottled, Tank, or LP Gas | 9 (9.4%) | 29 (69.1%) |
| Electricity | 0 (0.0%) | 0 (0.0%) |
| Fuel Oil or Kerosene | 16 (16.7%) | 0 (0.0%) |
| Coal or Coke | 0 (0.0%) | 0 (0.0%) |
| All other Fuels | 71 (74.0%) | 13 (30.9%) |
| No Fuel Used | 0 (0.0%) | 0 (0.0%) |
| Total | 96 (100.0%) | 42 (100.0%) |
Household Vehicle Usage in Mad River
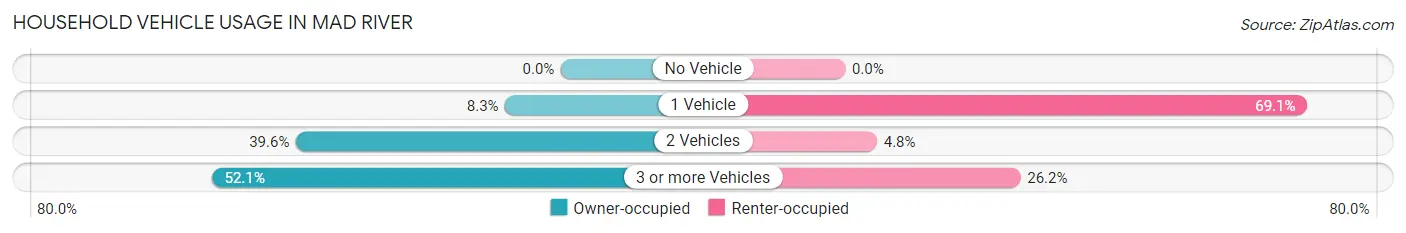
| Vehicles per Household | Owner-occupied | Renter-occupied |
| No Vehicle | 0 (0.0%) | 0 (0.0%) |
| 1 Vehicle | 8 (8.3%) | 29 (69.1%) |
| 2 Vehicles | 38 (39.6%) | 2 (4.8%) |
| 3 or more Vehicles | 50 (52.1%) | 11 (26.2%) |
| Total | 96 (100.0%) | 42 (100.0%) |
Real Estate & Mortgages in Mad River
Real Estate and Mortgage Overview in Mad River
| Characteristic | Without Mortgage | With Mortgage |
| Housing Units | 85 | 11 |
| Median Property Value | $287,500 | $0 |
| Median Household Income | - | - |
| Monthly Housing Costs | $419 | $0 |
| Real Estate Taxes | $941 | $0 |
Property Value by Mortgage Status in Mad River
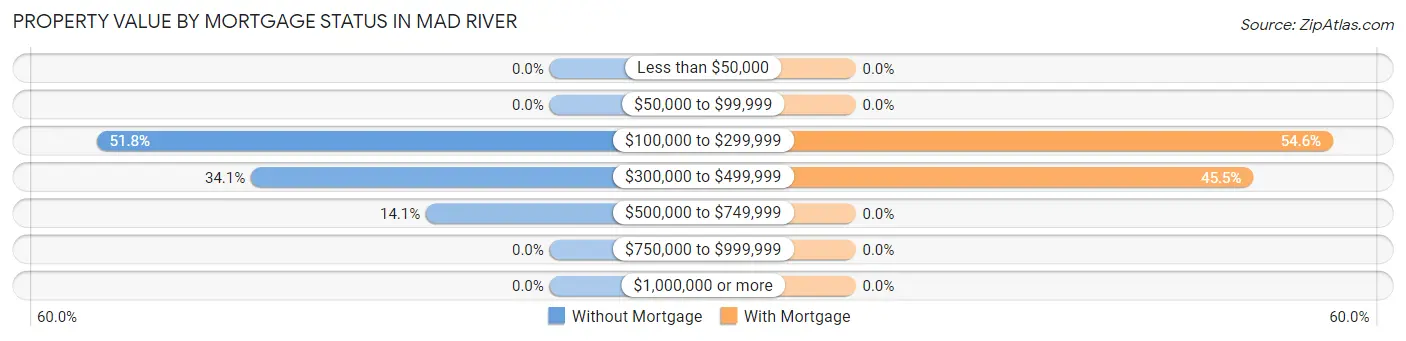
| Property Value | Without Mortgage | With Mortgage |
| Less than $50,000 | 0 (0.0%) | 0 (0.0%) |
| $50,000 to $99,999 | 0 (0.0%) | 0 (0.0%) |
| $100,000 to $299,999 | 44 (51.8%) | 6 (54.5%) |
| $300,000 to $499,999 | 29 (34.1%) | 5 (45.5%) |
| $500,000 to $749,999 | 12 (14.1%) | 0 (0.0%) |
| $750,000 to $999,999 | 0 (0.0%) | 0 (0.0%) |
| $1,000,000 or more | 0 (0.0%) | 0 (0.0%) |
| Total | 85 (100.0%) | 11 (100.0%) |
Household Income by Mortgage Status in Mad River
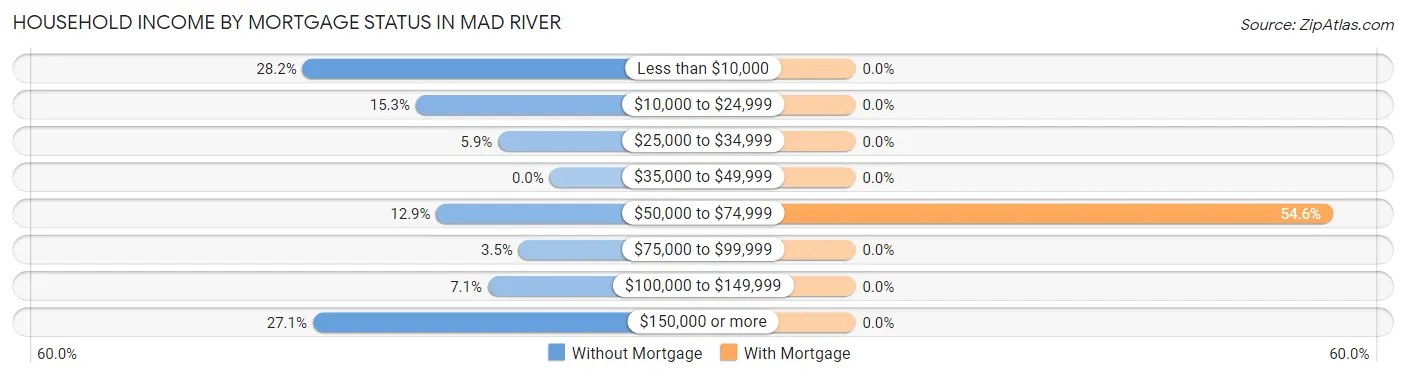
| Household Income | Without Mortgage | With Mortgage |
| Less than $10,000 | 24 (28.2%) | 0 (0.0%) |
| $10,000 to $24,999 | 13 (15.3%) | 0 (0.0%) |
| $25,000 to $34,999 | 5 (5.9%) | 0 (0.0%) |
| $35,000 to $49,999 | 0 (0.0%) | 0 (0.0%) |
| $50,000 to $74,999 | 11 (12.9%) | 6 (54.5%) |
| $75,000 to $99,999 | 3 (3.5%) | 0 (0.0%) |
| $100,000 to $149,999 | 6 (7.1%) | 0 (0.0%) |
| $150,000 or more | 23 (27.1%) | 0 (0.0%) |
| Total | 85 (100.0%) | 11 (100.0%) |
Property Value to Household Income Ratio in Mad River
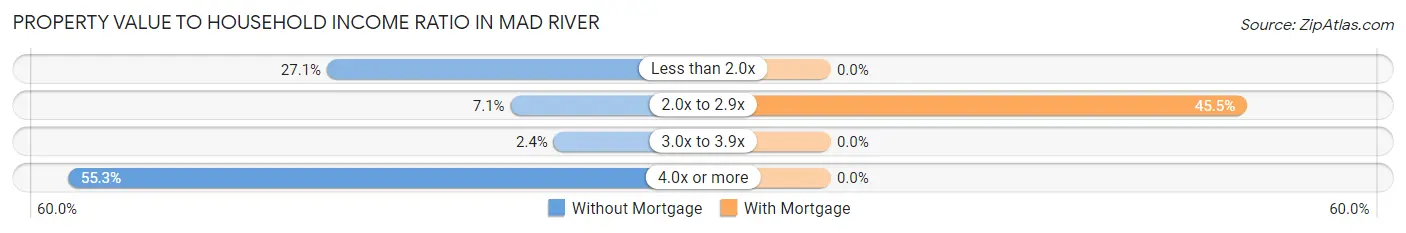
| Value-to-Income Ratio | Without Mortgage | With Mortgage |
| Less than 2.0x | 23 (27.1%) | 0 (0.0%) |
| 2.0x to 2.9x | 6 (7.1%) | 5 (45.5%) |
| 3.0x to 3.9x | 2 (2.4%) | 0 (0.0%) |
| 4.0x or more | 47 (55.3%) | 0 (0.0%) |
| Total | 85 (100.0%) | 11 (100.0%) |
Real Estate Taxes by Mortgage Status in Mad River
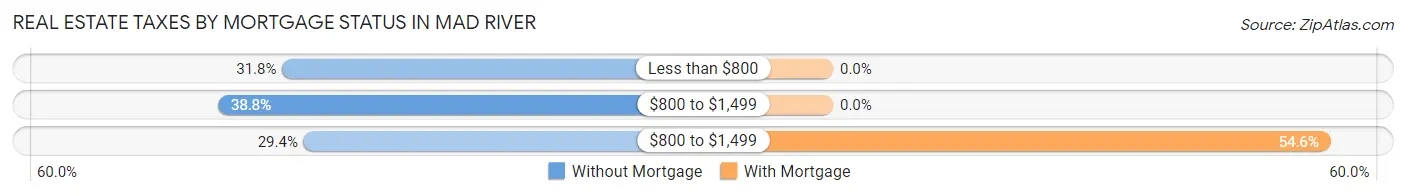
| Property Taxes | Without Mortgage | With Mortgage |
| Less than $800 | 27 (31.8%) | 0 (0.0%) |
| $800 to $1,499 | 33 (38.8%) | 0 (0.0%) |
| $800 to $1,499 | 25 (29.4%) | 6 (54.5%) |
| Total | 85 (100.0%) | 11 (100.0%) |
Health & Disability in Mad River
Health Insurance Coverage by Age in Mad River
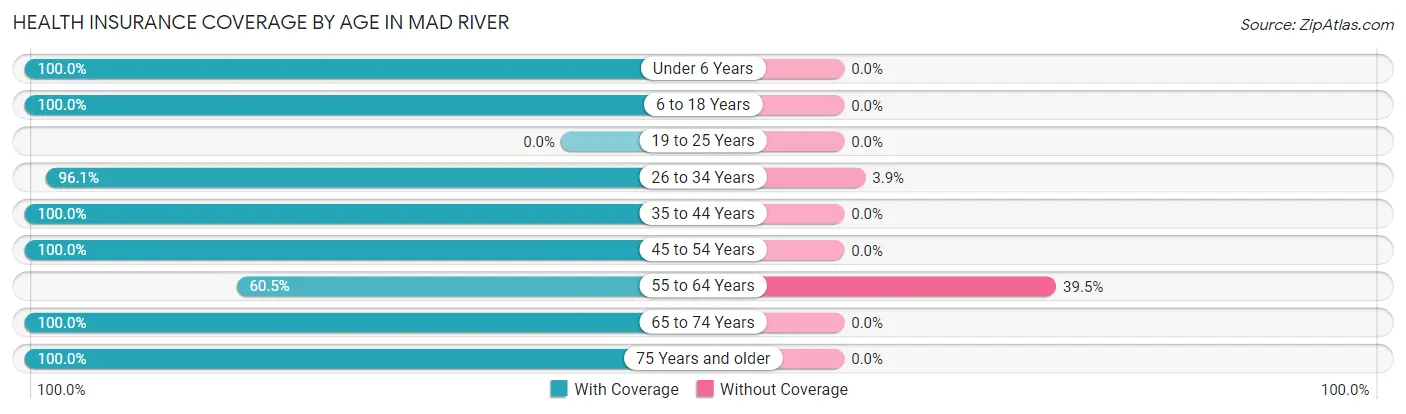
| Age Bracket | With Coverage | Without Coverage |
| Under 6 Years | 35 (100.0%) | 0 (0.0%) |
| 6 to 18 Years | 24 (100.0%) | 0 (0.0%) |
| 19 to 25 Years | 0 (0.0%) | 0 (0.0%) |
| 26 to 34 Years | 49 (96.1%) | 2 (3.9%) |
| 35 to 44 Years | 42 (100.0%) | 0 (0.0%) |
| 45 to 54 Years | 6 (100.0%) | 0 (0.0%) |
| 55 to 64 Years | 49 (60.5%) | 32 (39.5%) |
| 65 to 74 Years | 35 (100.0%) | 0 (0.0%) |
| 75 Years and older | 48 (100.0%) | 0 (0.0%) |
| Total | 288 (89.4%) | 34 (10.6%) |
Health Insurance Coverage by Citizenship Status in Mad River

| Citizenship Status | With Coverage | Without Coverage |
| Native Born | 35 (100.0%) | 0 (0.0%) |
| Foreign Born, Citizen | 24 (100.0%) | 0 (0.0%) |
| Foreign Born, not a Citizen | 0 (0.0%) | 0 (0.0%) |
Health Insurance Coverage by Household Income in Mad River
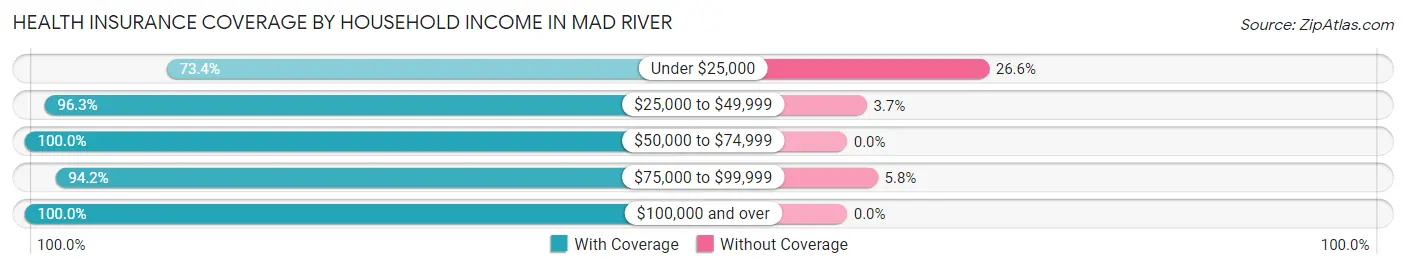
| Household Income | With Coverage | Without Coverage |
| Under $25,000 | 80 (73.4%) | 29 (26.6%) |
| $25,000 to $49,999 | 52 (96.3%) | 2 (3.7%) |
| $50,000 to $74,999 | 37 (100.0%) | 0 (0.0%) |
| $75,000 to $99,999 | 49 (94.2%) | 3 (5.8%) |
| $100,000 and over | 70 (100.0%) | 0 (0.0%) |
Public vs Private Health Insurance Coverage by Age in Mad River
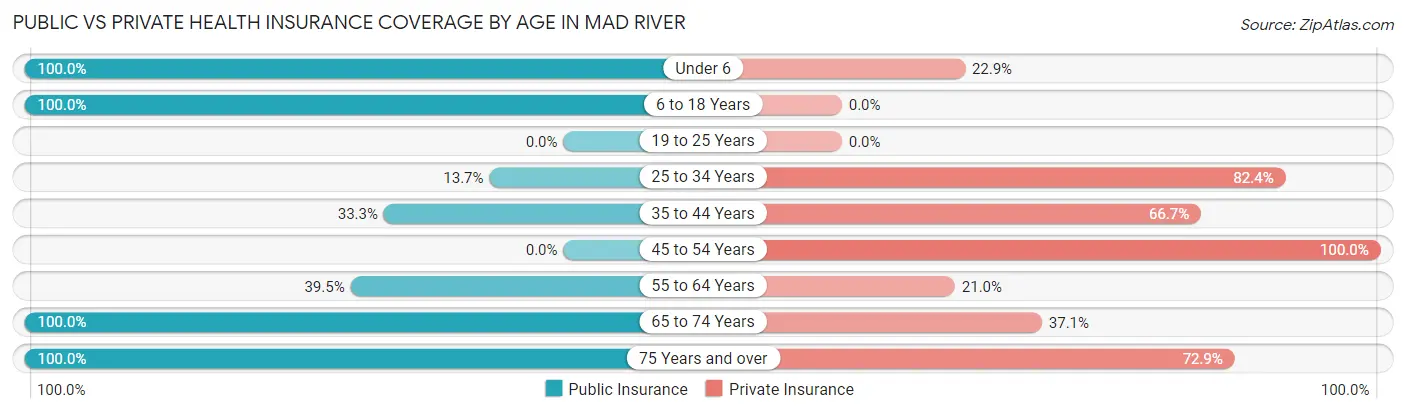
| Age Bracket | Public Insurance | Private Insurance |
| Under 6 | 35 (100.0%) | 8 (22.9%) |
| 6 to 18 Years | 24 (100.0%) | 0 (0.0%) |
| 19 to 25 Years | 0 (0.0%) | 0 (0.0%) |
| 25 to 34 Years | 7 (13.7%) | 42 (82.4%) |
| 35 to 44 Years | 14 (33.3%) | 28 (66.7%) |
| 45 to 54 Years | 0 (0.0%) | 6 (100.0%) |
| 55 to 64 Years | 32 (39.5%) | 17 (21.0%) |
| 65 to 74 Years | 35 (100.0%) | 13 (37.1%) |
| 75 Years and over | 48 (100.0%) | 35 (72.9%) |
| Total | 195 (60.6%) | 149 (46.3%) |
Disability Status by Sex by Age in Mad River
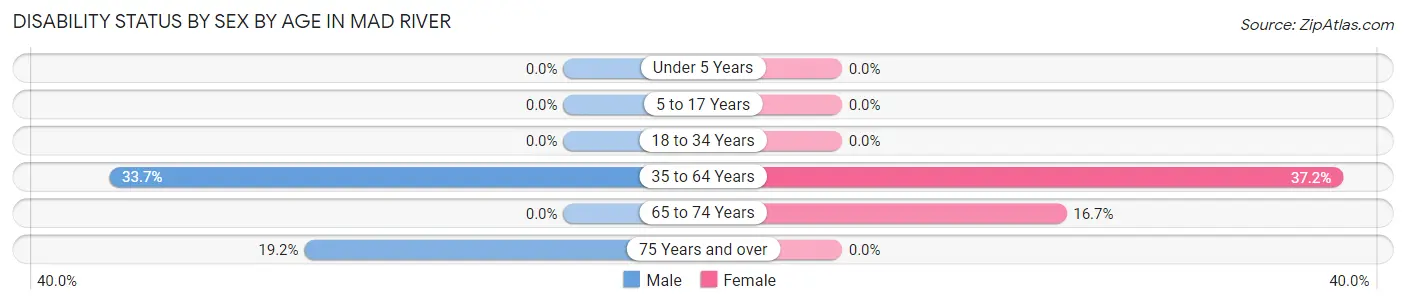
| Age Bracket | Male | Female |
| Under 5 Years | 0 (0.0%) | 0 (0.0%) |
| 5 to 17 Years | 0 (0.0%) | 0 (0.0%) |
| 18 to 34 Years | 0 (0.0%) | 0 (0.0%) |
| 35 to 64 Years | 29 (33.7%) | 16 (37.2%) |
| 65 to 74 Years | 0 (0.0%) | 2 (16.7%) |
| 75 Years and over | 5 (19.2%) | 0 (0.0%) |
Disability Class by Sex by Age in Mad River
Disability Class: Hearing Difficulty
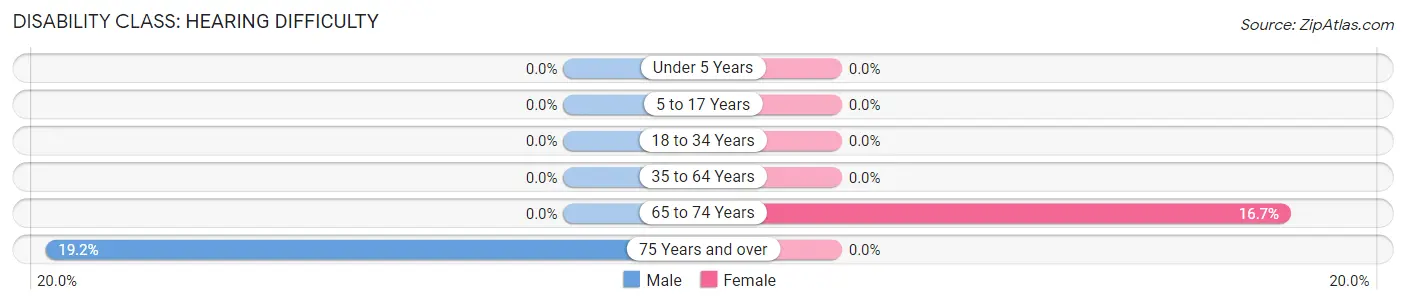
| Age Bracket | Male | Female |
| Under 5 Years | 0 (0.0%) | 0 (0.0%) |
| 5 to 17 Years | 0 (0.0%) | 0 (0.0%) |
| 18 to 34 Years | 0 (0.0%) | 0 (0.0%) |
| 35 to 64 Years | 0 (0.0%) | 0 (0.0%) |
| 65 to 74 Years | 0 (0.0%) | 2 (16.7%) |
| 75 Years and over | 5 (19.2%) | 0 (0.0%) |
Disability Class: Vision Difficulty
| Age Bracket | Male | Female |
| Under 5 Years | 0 (0.0%) | 0 (0.0%) |
| 5 to 17 Years | 0 (0.0%) | 0 (0.0%) |
| 18 to 34 Years | 0 (0.0%) | 0 (0.0%) |
| 35 to 64 Years | 0 (0.0%) | 0 (0.0%) |
| 65 to 74 Years | 0 (0.0%) | 0 (0.0%) |
| 75 Years and over | 0 (0.0%) | 0 (0.0%) |
Disability Class: Cognitive Difficulty
| Age Bracket | Male | Female |
| 5 to 17 Years | 0 (0.0%) | 0 (0.0%) |
| 18 to 34 Years | 0 (0.0%) | 0 (0.0%) |
| 35 to 64 Years | 0 (0.0%) | 0 (0.0%) |
| 65 to 74 Years | 0 (0.0%) | 0 (0.0%) |
| 75 Years and over | 0 (0.0%) | 0 (0.0%) |
Disability Class: Ambulatory Difficulty
| Age Bracket | Male | Female |
| 5 to 17 Years | 0 (0.0%) | 0 (0.0%) |
| 18 to 34 Years | 0 (0.0%) | 0 (0.0%) |
| 35 to 64 Years | 29 (33.7%) | 0 (0.0%) |
| 65 to 74 Years | 0 (0.0%) | 0 (0.0%) |
| 75 Years and over | 0 (0.0%) | 0 (0.0%) |
Disability Class: Self-Care Difficulty
| Age Bracket | Male | Female |
| 5 to 17 Years | 0 (0.0%) | 0 (0.0%) |
| 18 to 34 Years | 0 (0.0%) | 0 (0.0%) |
| 35 to 64 Years | 0 (0.0%) | 0 (0.0%) |
| 65 to 74 Years | 0 (0.0%) | 0 (0.0%) |
| 75 Years and over | 0 (0.0%) | 0 (0.0%) |
Technology Access in Mad River
Computing Device Access in Mad River
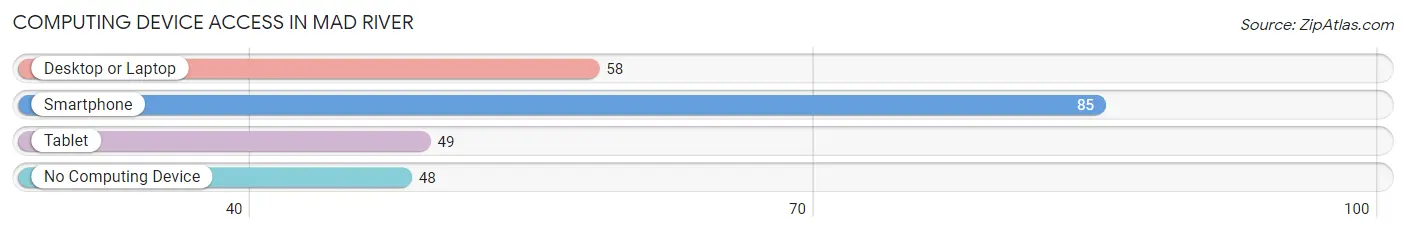
| Device Type | # Households | % Households |
| Desktop or Laptop | 58 | 42.0% |
| Smartphone | 85 | 61.6% |
| Tablet | 49 | 35.5% |
| No Computing Device | 48 | 34.8% |
| Total | 138 | 100.0% |
Internet Access in Mad River
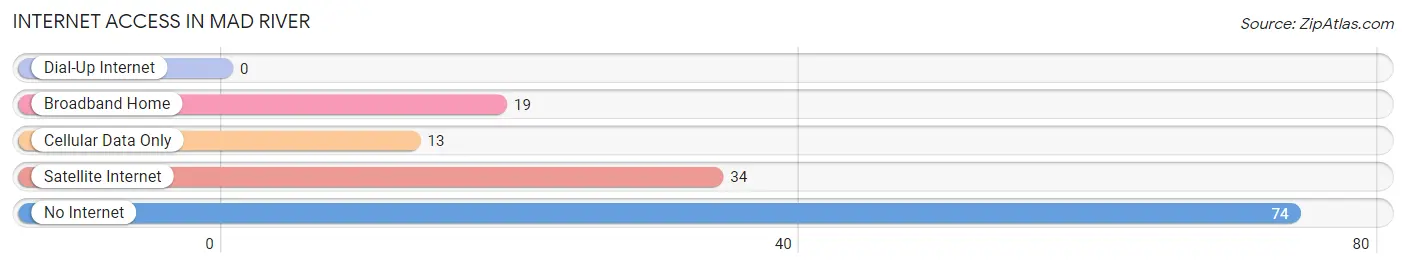
| Internet Type | # Households | % Households |
| Dial-Up Internet | 0 | 0.0% |
| Broadband Home | 19 | 13.8% |
| Cellular Data Only | 13 | 9.4% |
| Satellite Internet | 34 | 24.6% |
| No Internet | 74 | 53.6% |
| Total | 138 | 100.0% |
Mad River Summary
Introduction
The small town of Mad River, California is located in the northern part of the state, in Humboldt County. It is a rural community with a population of just over 1,000 people. The town is situated in a valley surrounded by mountains and is known for its beautiful scenery and outdoor activities. The town has a rich history, with a strong connection to the logging industry and the Native American tribes that have lived in the area for centuries. The economy of Mad River is largely based on tourism, with many visitors coming to the area to enjoy the natural beauty and outdoor activities. The demographics of the town are diverse, with a mix of Native American, Caucasian, and Hispanic residents.
History
The area that is now known as Mad River was originally inhabited by the Wiyot and Yurok Native American tribes. The Wiyot people were the first to settle in the area, and they lived in the area for centuries before the arrival of European settlers. The Yurok people arrived in the area in the late 1700s and established a village near the Mad River.
The first European settlers arrived in the area in the mid-1800s. They were mostly loggers and miners who were drawn to the area by the abundance of natural resources. The town of Mad River was officially established in 1854, and it quickly became a hub for the logging industry. The town was named after the nearby Mad River, which was used to transport logs to the nearby port of Eureka.
The logging industry was the main source of income for the town until the late 1900s, when the industry began to decline. In the early 2000s, the town began to focus on tourism as a way to boost the local economy. The town is now known for its outdoor activities, such as fishing, camping, and hiking.
Geography
Mad River is located in the northern part of California, in Humboldt County. The town is situated in a valley surrounded by mountains, and it is located about 20 miles south of the city of Eureka. The town is located near the Mad River, which is a tributary of the Eel River. The town is also located near the Redwood National and State Parks, which are home to some of the world’s tallest trees.
The climate in Mad River is mild and temperate, with warm summers and cool winters. The average temperature in the summer is around 70 degrees Fahrenheit, and the average temperature in the winter is around 50 degrees Fahrenheit. The town receives an average of 40 inches of rain per year.
Economy
The economy of Mad River is largely based on tourism. The town is known for its outdoor activities, such as fishing, camping, and hiking. The town also has several restaurants, shops, and lodging options for visitors. The town is also home to several small businesses, such as a lumber mill, a sawmill, and a woodworking shop.
The town is also home to several farms, which produce a variety of fruits and vegetables. The town is also home to a winery, which produces a variety of wines.
Demographics
The population of Mad River is just over 1,000 people. The town is diverse, with a mix of Native American, Caucasian, and Hispanic residents. The median age of the town is 44 years old, and the median household income is $45,000. The town has a high rate of homeownership, with over 70% of the population owning their own homes.
Conclusion
Mad River, California is a small rural town located in the northern part of the state. The town has a rich history, with a strong connection to the logging industry and the Native American tribes that have lived in the area for centuries. The economy of Mad River is largely based on tourism, with many visitors coming to the area to enjoy the natural beauty and outdoor activities. The demographics of the town are diverse, with a mix of Native American, Caucasian, and Hispanic residents. Mad River is a beautiful town with a lot to offer, and it is a great place to visit or live.
Common Questions
What is Per Capita Income in Mad River?
Per Capita income in Mad River is $25,154.
What is Income or Wage Gap in Mad River?
Income or Wage Gap in Mad River is 26.6%.
Women in Mad River earn 73.4 cents for every dollar earned by a man.
What is Inequality or Gini Index in Mad River?
Inequality or Gini Index in Mad River is 0.61.
What is the Total Population of Mad River?
Total Population of Mad River is 322.
What is the Total Male Population of Mad River?
Total Male Population of Mad River is 189.
What is the Total Female Population of Mad River?
Total Female Population of Mad River is 133.
What is the Ratio of Males per 100 Females in Mad River?
There are 142.11 Males per 100 Females in Mad River.
What is the Ratio of Females per 100 Males in Mad River?
There are 70.37 Females per 100 Males in Mad River.
What is the Median Population Age in Mad River?
Median Population Age in Mad River is 55.1 Years.
What is the Average Family Size in Mad River
Average Family Size in Mad River is 3.8 People.
What is the Average Household Size in Mad River
Average Household Size in Mad River is 2.3 People.
How Large is the Labor Force in Mad River?
There are 72 People in the Labor Forcein in Mad River.
What is the Percentage of People in the Labor Force in Mad River?
25.1% of People are in the Labor Force in Mad River.
What is the Unemployment Rate in Mad River?
Unemployment Rate in Mad River is 6.9%.