Salvo, NC Map & Demographics
Salvo Map
Salvo Overview
$33,923
PER CAPITA INCOME
$61,534
AVG FAMILY INCOME
$62,159
AVG HOUSEHOLD INCOME
0.27
INEQUALITY / GINI INDEX
201
TOTAL POPULATION
90
MALE POPULATION
111
FEMALE POPULATION
81.08
MALES / 100 FEMALES
123.33
FEMALES / 100 MALES
35.9
MEDIAN AGE
3.2
AVG FAMILY SIZE
2.6
AVG HOUSEHOLD SIZE
114
LABOR FORCE [ PEOPLE ]
75.0%
PERCENT IN LABOR FORCE
Salvo Zip Codes
Salvo Area Codes
Income in Salvo
Income Overview in Salvo
Per Capita Income in Salvo is $33,923, while median incomes of families and households are $61,534 and $62,159 respectively.
| Characteristic | Number | Measure |
| Per Capita Income | 201 | $33,923 |
| Median Family Income | 55 | $61,534 |
| Mean Family Income | 55 | $82,267 |
| Median Household Income | 78 | $62,159 |
| Mean Household Income | 78 | $79,550 |
| Income Deficit | 55 | $0 |
| Wage / Income Gap (%) | 201 | 0.00% |
| Wage / Income Gap ($) | 201 | 100.00¢ per $1 |
| Gini / Inequality Index | 201 | 0.27 |
Earnings by Sex in Salvo
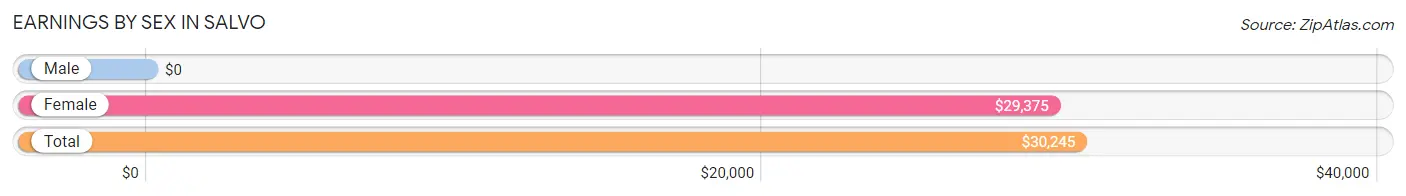
| Sex | Number | Average Earnings |
| Male | 43 (30.7%) | $0 |
| Female | 97 (69.3%) | $29,375 |
| Total | 140 (100.0%) | $30,245 |
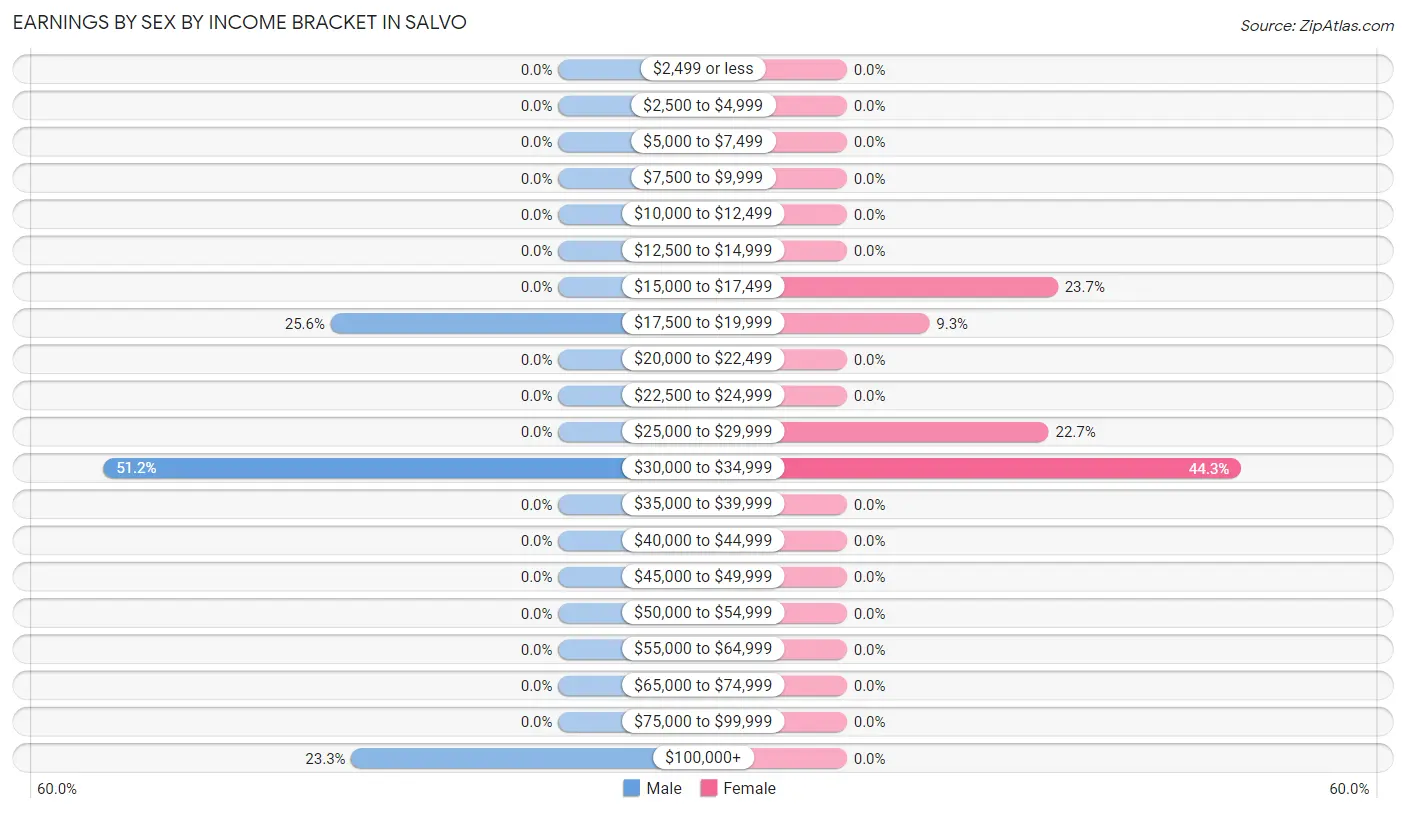
Earnings by Sex by Income Bracket in Salvo
The most common earnings brackets in Salvo are $30,000 to $34,999 for men (22 | 51.2%) and $30,000 to $34,999 for women (43 | 44.3%).
| Income | Male | Female |
| $2,499 or less | 0 (0.0%) | 0 (0.0%) |
| $2,500 to $4,999 | 0 (0.0%) | 0 (0.0%) |
| $5,000 to $7,499 | 0 (0.0%) | 0 (0.0%) |
| $7,500 to $9,999 | 0 (0.0%) | 0 (0.0%) |
| $10,000 to $12,499 | 0 (0.0%) | 0 (0.0%) |
| $12,500 to $14,999 | 0 (0.0%) | 0 (0.0%) |
| $15,000 to $17,499 | 0 (0.0%) | 23 (23.7%) |
| $17,500 to $19,999 | 11 (25.6%) | 9 (9.3%) |
| $20,000 to $22,499 | 0 (0.0%) | 0 (0.0%) |
| $22,500 to $24,999 | 0 (0.0%) | 0 (0.0%) |
| $25,000 to $29,999 | 0 (0.0%) | 22 (22.7%) |
| $30,000 to $34,999 | 22 (51.2%) | 43 (44.3%) |
| $35,000 to $39,999 | 0 (0.0%) | 0 (0.0%) |
| $40,000 to $44,999 | 0 (0.0%) | 0 (0.0%) |
| $45,000 to $49,999 | 0 (0.0%) | 0 (0.0%) |
| $50,000 to $54,999 | 0 (0.0%) | 0 (0.0%) |
| $55,000 to $64,999 | 0 (0.0%) | 0 (0.0%) |
| $65,000 to $74,999 | 0 (0.0%) | 0 (0.0%) |
| $75,000 to $99,999 | 0 (0.0%) | 0 (0.0%) |
| $100,000+ | 10 (23.3%) | 0 (0.0%) |
| Total | 43 (100.0%) | 97 (100.0%) |
Earnings by Sex by Educational Attainment in Salvo
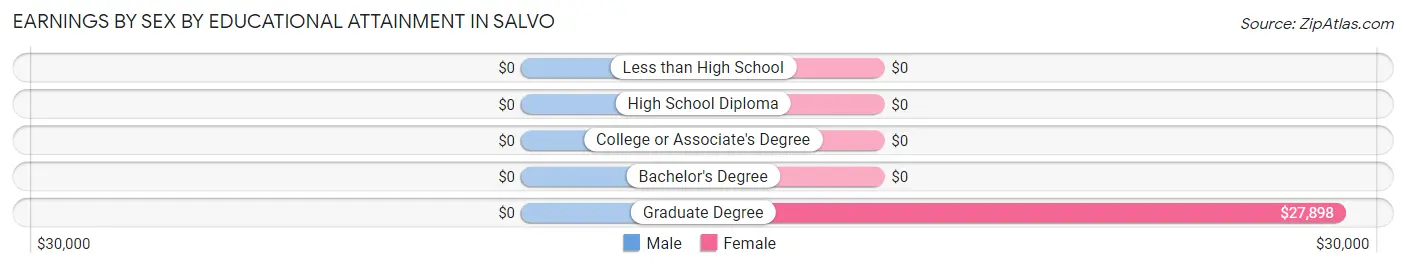
| Educational Attainment | Male Income | Female Income |
| Less than High School | - | - |
| High School Diploma | - | - |
| College or Associate's Degree | - | - |
| Bachelor's Degree | - | - |
| Graduate Degree | - | - |
| Total | - | - |
Family Income in Salvo
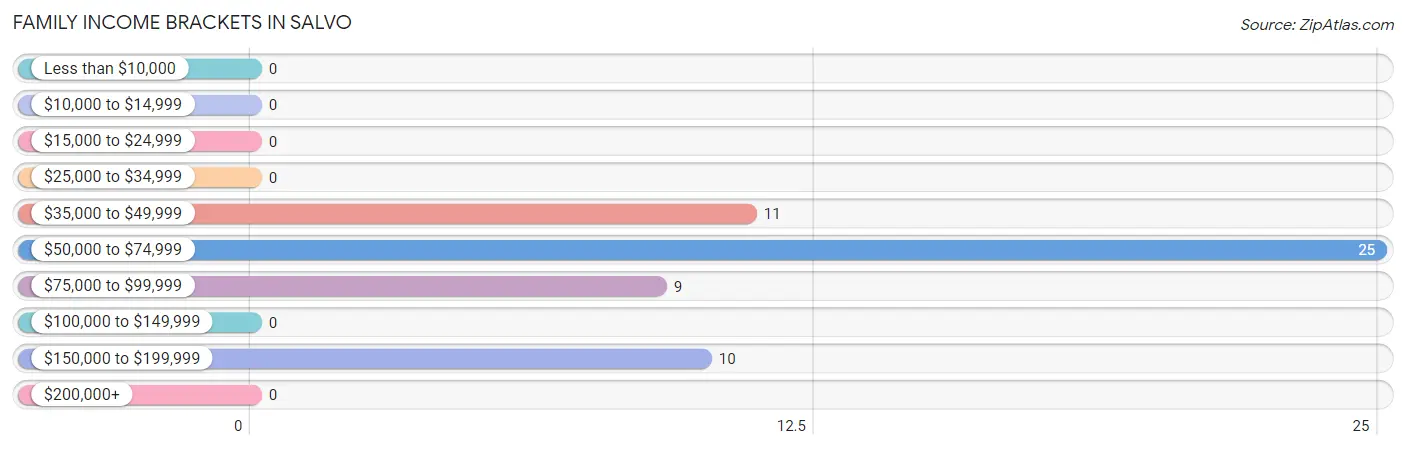
Family Income Brackets in Salvo
According to the Salvo family income data, there are 25 families falling into the $50,000 to $74,999 income range, which is the most common income bracket and makes up 45.5% of all families.
| Income Bracket | # Families | % Families |
| Less than $10,000 | 0 | 0.0% |
| $10,000 to $14,999 | 0 | 0.0% |
| $15,000 to $24,999 | 0 | 0.0% |
| $25,000 to $34,999 | 0 | 0.0% |
| $35,000 to $49,999 | 11 | 20.0% |
| $50,000 to $74,999 | 25 | 45.5% |
| $75,000 to $99,999 | 9 | 16.4% |
| $100,000 to $149,999 | 0 | 0.0% |
| $150,000 to $199,999 | 10 | 18.2% |
| $200,000+ | 0 | 0.0% |
Family Income by Famaliy Size in Salvo
| Income Bracket | # Families | Median Income |
| 2-Person Families | 22 (40.0%) | $0 |
| 3-Person Families | 11 (20.0%) | $0 |
| 4-Person Families | 22 (40.0%) | $0 |
| 5-Person Families | 0 (0.0%) | $0 |
| 6-Person Families | 0 (0.0%) | $0 |
| 7+ Person Families | 0 (0.0%) | $0 |
| Total | 55 (100.0%) | $61,534 |
Family Income by Number of Earners in Salvo
| Number of Earners | # Families | Median Income |
| No Earners | 0 (0.0%) | $0 |
| 1 Earner | 12 (21.8%) | $0 |
| 2 Earners | 43 (78.2%) | $0 |
| 3+ Earners | 0 (0.0%) | $0 |
| Total | 55 (100.0%) | $61,534 |
Household Income in Salvo
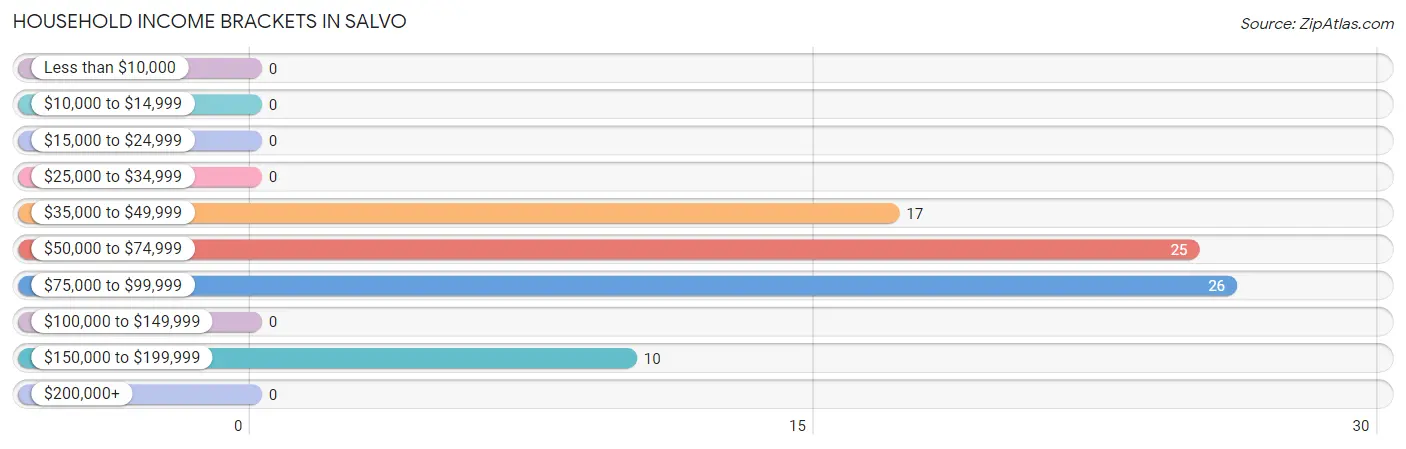
Household Income Brackets in Salvo
With 26 households falling in the category, the $75,000 to $99,999 income range is the most frequent in Salvo, accounting for 33.3% of all households.
| Income Bracket | # Households | % Households |
| Less than $10,000 | 0 | 0.0% |
| $10,000 to $14,999 | 0 | 0.0% |
| $15,000 to $24,999 | 0 | 0.0% |
| $25,000 to $34,999 | 0 | 0.0% |
| $35,000 to $49,999 | 17 | 21.8% |
| $50,000 to $74,999 | 25 | 32.1% |
| $75,000 to $99,999 | 26 | 33.3% |
| $100,000 to $149,999 | 0 | 0.0% |
| $150,000 to $199,999 | 10 | 12.8% |
| $200,000+ | 0 | 0.0% |
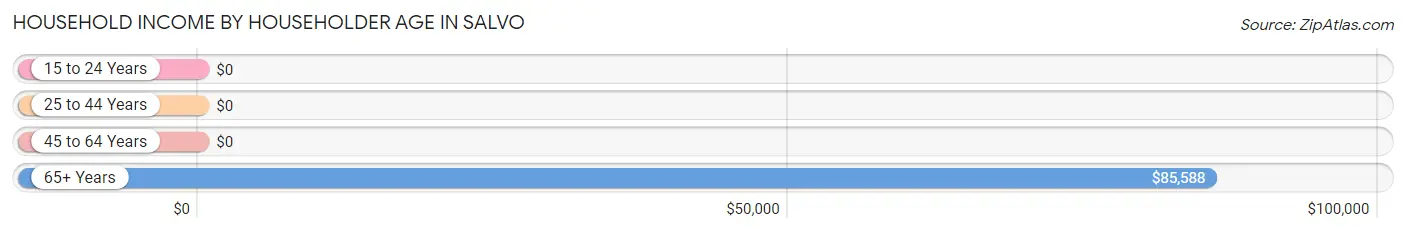
Household Income by Householder Age in Salvo
The median household income in Salvo is $62,159, with the highest median household income of $85,588 found in the 65+ years age bracket for the primary householder. A total of 26 households (33.3%) fall into this category.
| Income Bracket | # Households | Median Income |
| 15 to 24 Years | 0 (0.0%) | $0 |
| 25 to 44 Years | 32 (41.0%) | $0 |
| 45 to 64 Years | 20 (25.6%) | $0 |
| 65+ Years | 26 (33.3%) | $85,588 |
| Total | 78 (100.0%) | $62,159 |
Poverty in Salvo
Income Below Poverty by Sex and Age in Salvo
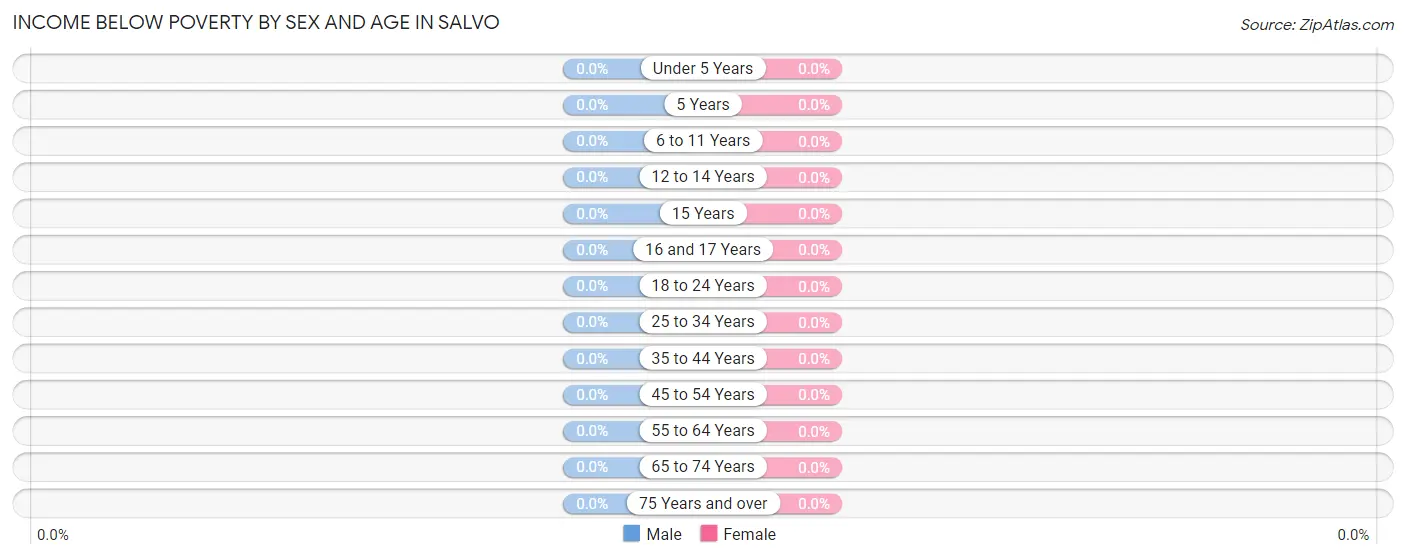
| Age Bracket | Male | Female |
| Under 5 Years | 0 (0.0%) | 0 (0.0%) |
| 5 Years | 0 (0.0%) | 0 (0.0%) |
| 6 to 11 Years | 0 (0.0%) | 0 (0.0%) |
| 12 to 14 Years | 0 (0.0%) | 0 (0.0%) |
| 15 Years | 0 (0.0%) | 0 (0.0%) |
| 16 and 17 Years | 0 (0.0%) | 0 (0.0%) |
| 18 to 24 Years | 0 (0.0%) | 0 (0.0%) |
| 25 to 34 Years | 0 (0.0%) | 0 (0.0%) |
| 35 to 44 Years | 0 (0.0%) | 0 (0.0%) |
| 45 to 54 Years | 0 (0.0%) | 0 (0.0%) |
| 55 to 64 Years | 0 (0.0%) | 0 (0.0%) |
| 65 to 74 Years | 0 (0.0%) | 0 (0.0%) |
| 75 Years and over | 0 (0.0%) | 0 (0.0%) |
| Total | 0 (0.0%) | 0 (0.0%) |
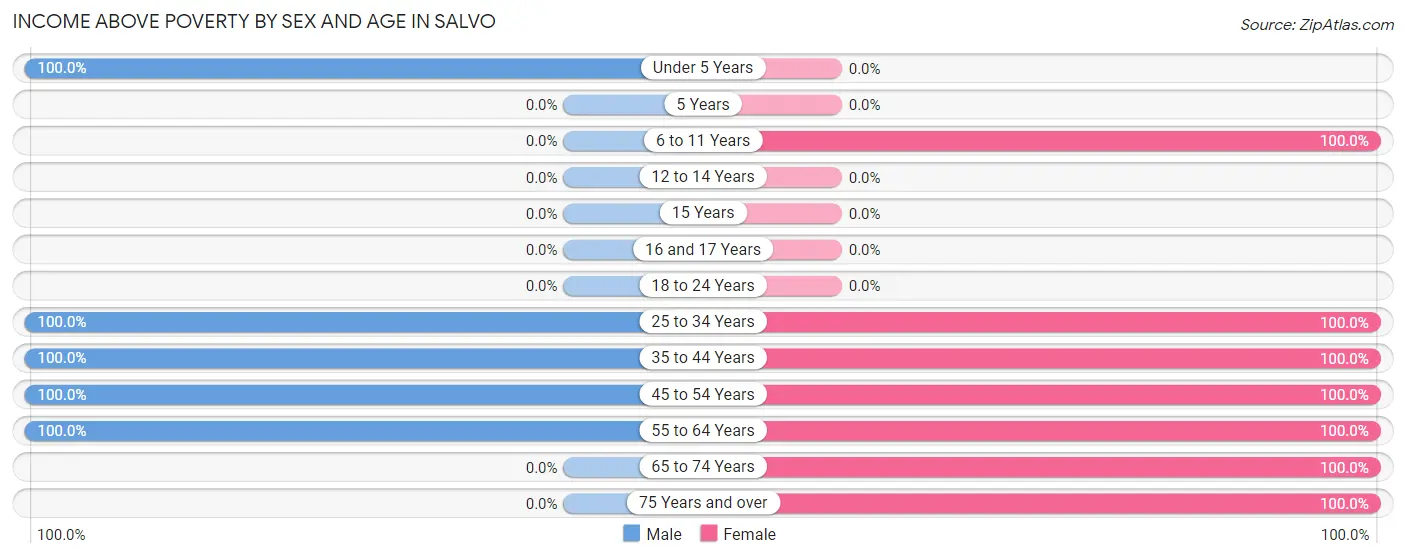
Income Above Poverty by Sex and Age in Salvo
According to the poverty statistics in Salvo, males aged under 5 years and females aged 6 to 11 years are the age groups that are most secure financially, with 100.0% of males and 100.0% of females in these age groups living above the poverty line.
| Age Bracket | Male | Female |
| Under 5 Years | 38 (100.0%) | 0 (0.0%) |
| 5 Years | 0 (0.0%) | 0 (0.0%) |
| 6 to 11 Years | 0 (0.0%) | 11 (100.0%) |
| 12 to 14 Years | 0 (0.0%) | 0 (0.0%) |
| 15 Years | 0 (0.0%) | 0 (0.0%) |
| 16 and 17 Years | 0 (0.0%) | 0 (0.0%) |
| 18 to 24 Years | 0 (0.0%) | 0 (0.0%) |
| 25 to 34 Years | 10 (100.0%) | 22 (100.0%) |
| 35 to 44 Years | 22 (100.0%) | 23 (100.0%) |
| 45 to 54 Years | 11 (100.0%) | 20 (100.0%) |
| 55 to 64 Years | 9 (100.0%) | 9 (100.0%) |
| 65 to 74 Years | 0 (0.0%) | 17 (100.0%) |
| 75 Years and over | 0 (0.0%) | 9 (100.0%) |
| Total | 90 (100.0%) | 111 (100.0%) |
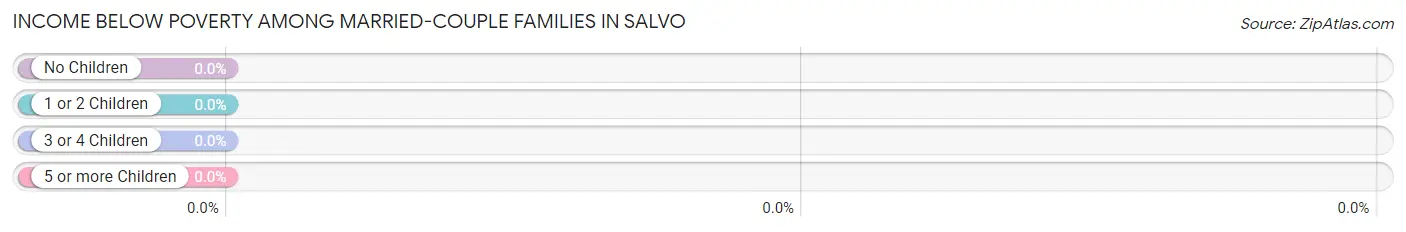
Income Below Poverty Among Married-Couple Families in Salvo
| Children | Above Poverty | Below Poverty |
| No Children | 19 (100.0%) | 0 (0.0%) |
| 1 or 2 Children | 33 (100.0%) | 0 (0.0%) |
| 3 or 4 Children | 0 (0.0%) | 0 (0.0%) |
| 5 or more Children | 0 (0.0%) | 0 (0.0%) |
| Total | 52 (100.0%) | 0 (0.0%) |
Income Below Poverty Among Single-Parent Households in Salvo
| Children | Single Father | Single Mother |
| No Children | 0 (0.0%) | 0 (0.0%) |
| 1 or 2 Children | 0 (0.0%) | 0 (0.0%) |
| 3 or 4 Children | 0 (0.0%) | 0 (0.0%) |
| 5 or more Children | 0 (0.0%) | 0 (0.0%) |
| Total | 0 (0.0%) | 0 (0.0%) |
Income Below Poverty Among Married-Couple vs Single-Parent Households in Salvo
| Children | Married-Couple Families | Single-Parent Households |
| No Children | 0 (0.0%) | 0 (0.0%) |
| 1 or 2 Children | 0 (0.0%) | 0 (0.0%) |
| 3 or 4 Children | 0 (0.0%) | 0 (0.0%) |
| 5 or more Children | 0 (0.0%) | 0 (0.0%) |
| Total | 0 (0.0%) | 0 (0.0%) |
Race in Salvo
The most populous races in Salvo are , and White / Caucasian (201 | 100.0%).
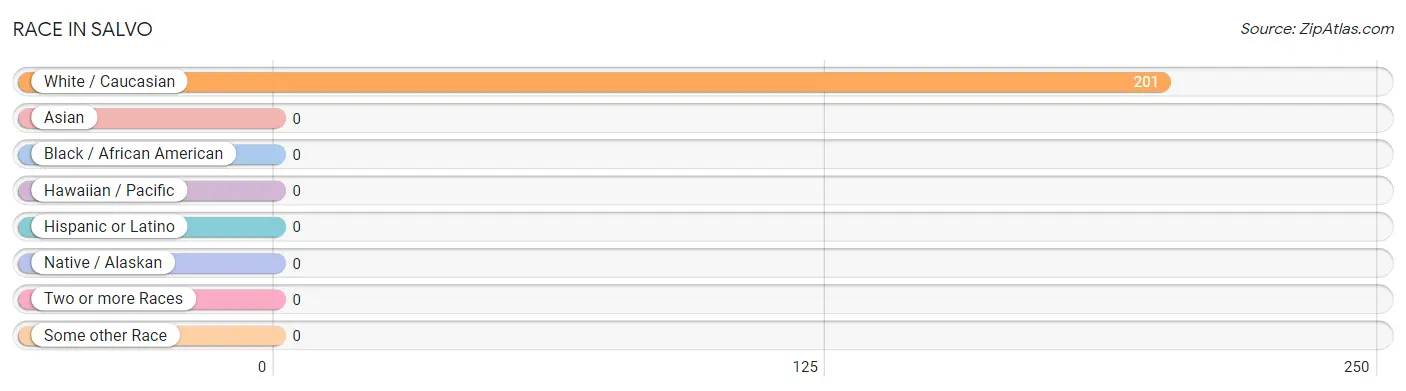
| Race | # Population | % Population |
| Asian | 0 | 0.0% |
| Black / African American | 0 | 0.0% |
| Hawaiian / Pacific | 0 | 0.0% |
| Hispanic or Latino | 0 | 0.0% |
| Native / Alaskan | 0 | 0.0% |
| White / Caucasian | 201 | 100.0% |
| Two or more Races | 0 | 0.0% |
| Some other Race | 0 | 0.0% |
| Total | 201 | 100.0% |
Ancestry in Salvo
The most populous ancestries reported in Salvo are German (60 | 29.8%), Polish (60 | 29.8%), Irish (22 | 11.0%), Ukrainian (22 | 11.0%), and Italian (20 | 10.0%), together accounting for 91.6% of all Salvo residents.
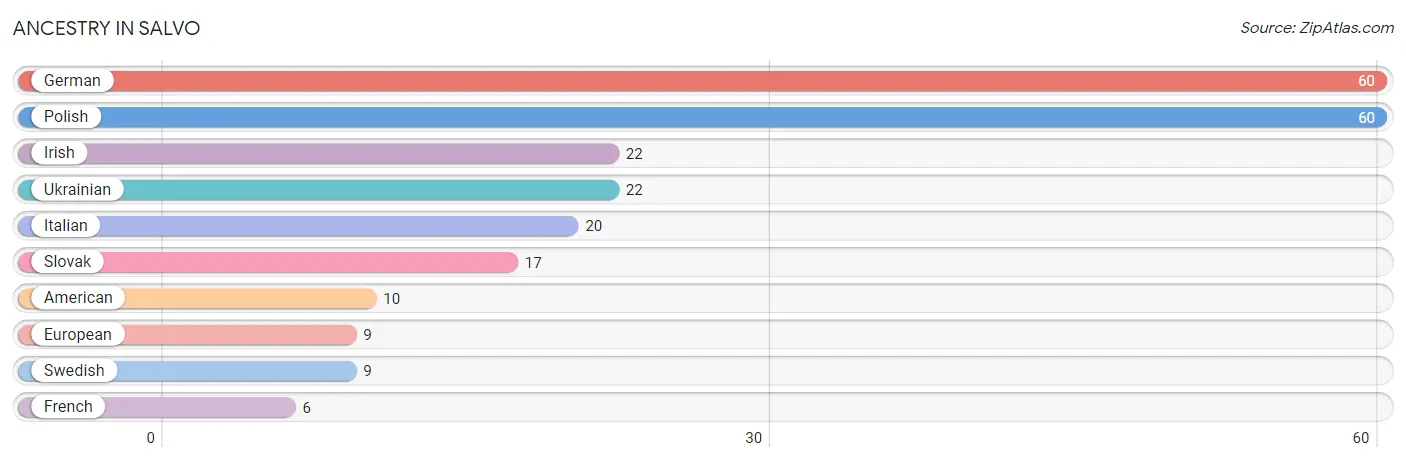
| Ancestry | # Population | % Population |
| American | 10 | 5.0% |
| European | 9 | 4.5% |
| French | 6 | 3.0% |
| German | 60 | 29.8% |
| Irish | 22 | 11.0% |
| Italian | 20 | 10.0% |
| Polish | 60 | 29.8% |
| Slovak | 17 | 8.5% |
| Swedish | 9 | 4.5% |
| Ukrainian | 22 | 11.0% | View All 10 Rows |
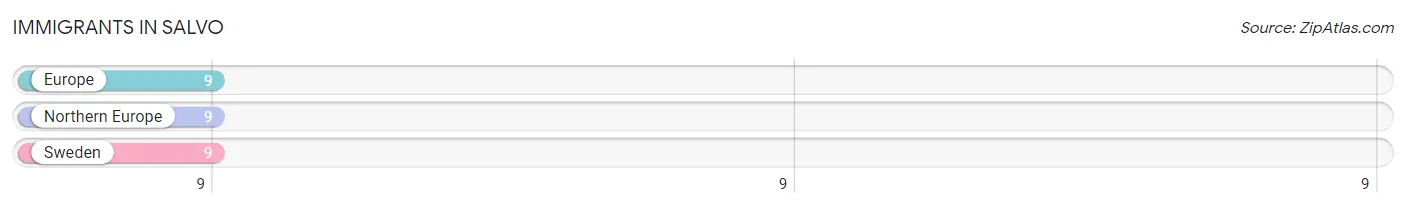
Immigrants in Salvo
The most numerous immigrant groups reported in Salvo came from Europe (9 | 4.5%), Northern Europe (9 | 4.5%), and Sweden (9 | 4.5%), together accounting for 13.4% of all Salvo residents.
| Immigration Origin | # Population | % Population |
| Europe | 9 | 4.5% |
| Northern Europe | 9 | 4.5% |
| Sweden | 9 | 4.5% | View All 3 Rows |
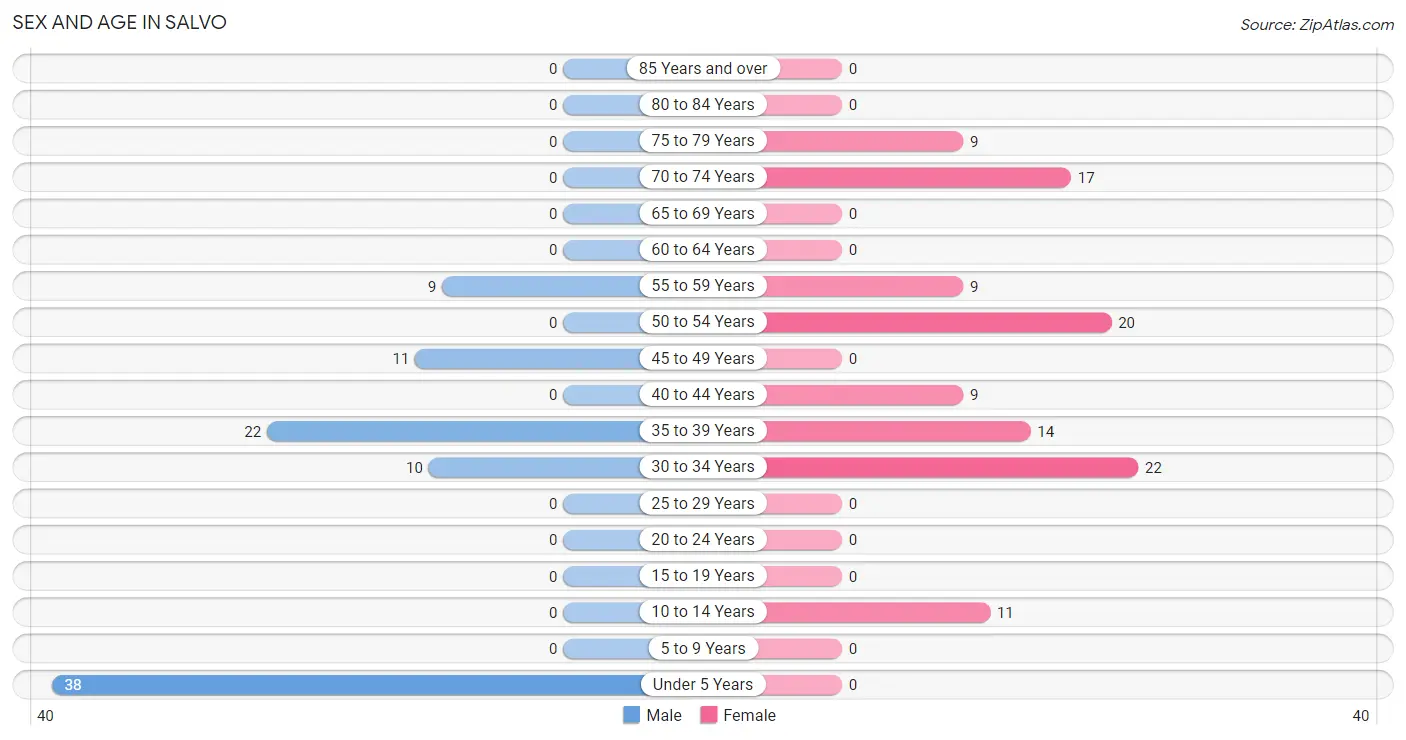
Sex and Age in Salvo
Sex and Age in Salvo
The most populous age groups in Salvo are Under 5 Years (38 | 42.2%) for men and 30 to 34 Years (22 | 19.8%) for women.
| Age Bracket | Male | Female |
| Under 5 Years | 38 (42.2%) | 0 (0.0%) |
| 5 to 9 Years | 0 (0.0%) | 0 (0.0%) |
| 10 to 14 Years | 0 (0.0%) | 11 (9.9%) |
| 15 to 19 Years | 0 (0.0%) | 0 (0.0%) |
| 20 to 24 Years | 0 (0.0%) | 0 (0.0%) |
| 25 to 29 Years | 0 (0.0%) | 0 (0.0%) |
| 30 to 34 Years | 10 (11.1%) | 22 (19.8%) |
| 35 to 39 Years | 22 (24.4%) | 14 (12.6%) |
| 40 to 44 Years | 0 (0.0%) | 9 (8.1%) |
| 45 to 49 Years | 11 (12.2%) | 0 (0.0%) |
| 50 to 54 Years | 0 (0.0%) | 20 (18.0%) |
| 55 to 59 Years | 9 (10.0%) | 9 (8.1%) |
| 60 to 64 Years | 0 (0.0%) | 0 (0.0%) |
| 65 to 69 Years | 0 (0.0%) | 0 (0.0%) |
| 70 to 74 Years | 0 (0.0%) | 17 (15.3%) |
| 75 to 79 Years | 0 (0.0%) | 9 (8.1%) |
| 80 to 84 Years | 0 (0.0%) | 0 (0.0%) |
| 85 Years and over | 0 (0.0%) | 0 (0.0%) |
| Total | 90 (100.0%) | 111 (100.0%) |
Families and Households in Salvo
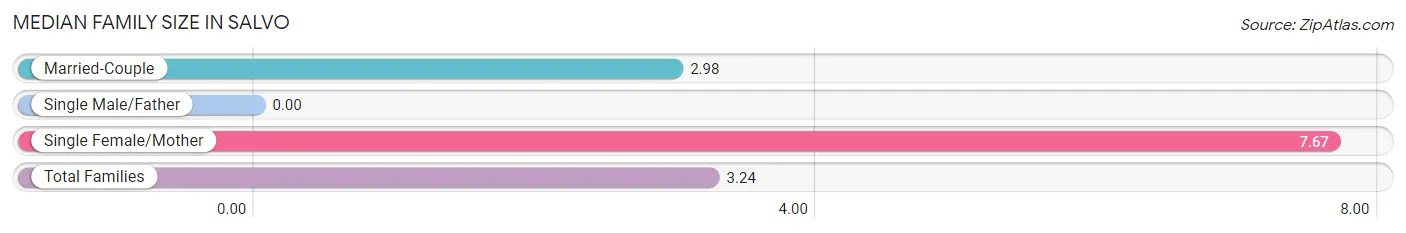
Median Family Size in Salvo
| Family Type | # Families | Family Size |
| Married-Couple | 52 (94.6%) | 2.98 |
| Single Male/Father | 0 (0.0%) | - |
| Single Female/Mother | 3 (5.4%) | 7.67 |
| Total Families | 55 (100.0%) | 3.24 |
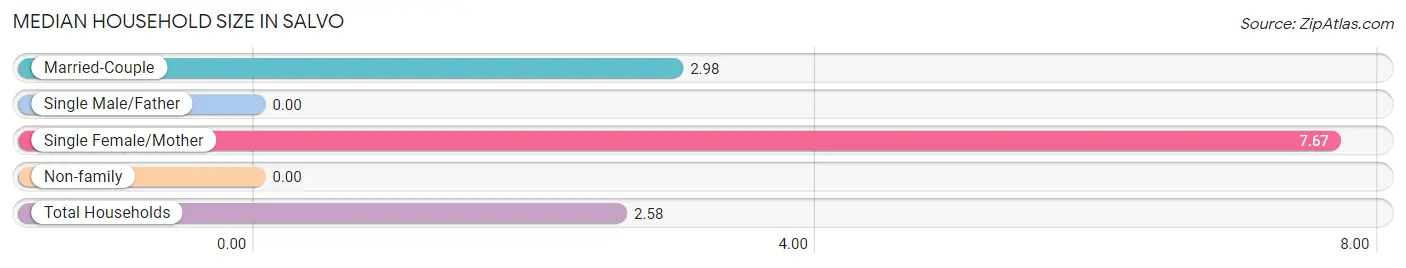
Median Household Size in Salvo
| Household Type | # Households | Household Size |
| Married-Couple | 52 (66.7%) | 2.98 |
| Single Male/Father | 0 (0.0%) | - |
| Single Female/Mother | 3 (3.8%) | 7.67 |
| Non-family | 23 (29.5%) | - |
| Total Households | 78 (100.0%) | 2.58 |
Household Size by Marriage Status in Salvo
Out of a total of 78 households in Salvo, 55 (70.5%) are family households, while 23 (29.5%) are nonfamily households. The most numerous type of family households are 2-person households, comprising 22, and the most common type of nonfamily households are 1-person households, comprising 23.
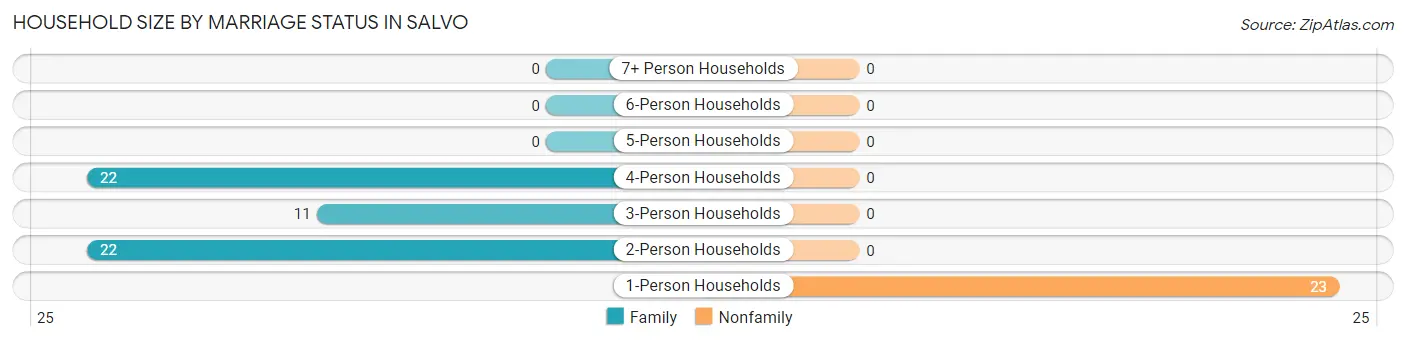
| Household Size | Family Households | Nonfamily Households |
| 1-Person Households | - | 23 (29.5%) |
| 2-Person Households | 22 (28.2%) | 0 (0.0%) |
| 3-Person Households | 11 (14.1%) | 0 (0.0%) |
| 4-Person Households | 22 (28.2%) | 0 (0.0%) |
| 5-Person Households | 0 (0.0%) | 0 (0.0%) |
| 6-Person Households | 0 (0.0%) | 0 (0.0%) |
| 7+ Person Households | 0 (0.0%) | 0 (0.0%) |
| Total | 55 (70.5%) | 23 (29.5%) |
Female Fertility in Salvo
Fertility by Age in Salvo
Average fertility rate in Salvo is 489.0 births per 1,000 women. Women in the age bracket of 20 to 34 years have the highest fertility rate with 1,000.0 births per 1,000 women. Women in the age bracket of 20 to 34 years acount for 100.0% of all women with births.
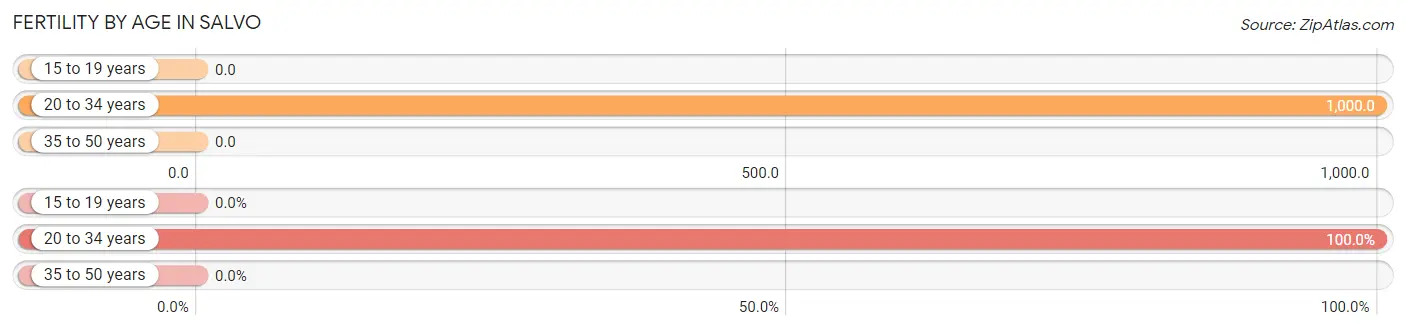
| Age Bracket | Women with Births | Births / 1,000 Women |
| 15 to 19 years | 0 (0.0%) | 0.0 |
| 20 to 34 years | 22 (100.0%) | 1,000.0 |
| 35 to 50 years | 0 (0.0%) | 0.0 |
| Total | 22 (100.0%) | 489.0 |
Fertility by Age by Marriage Status in Salvo
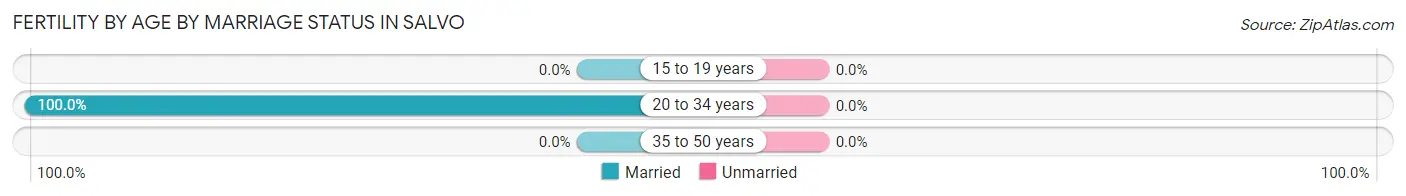
| Age Bracket | Married | Unmarried |
| 15 to 19 years | 0 (0.0%) | 0 (0.0%) |
| 20 to 34 years | 22 (100.0%) | 0 (0.0%) |
| 35 to 50 years | 0 (0.0%) | 0 (0.0%) |
| Total | 22 (100.0%) | 0 (0.0%) |
Fertility by Education in Salvo
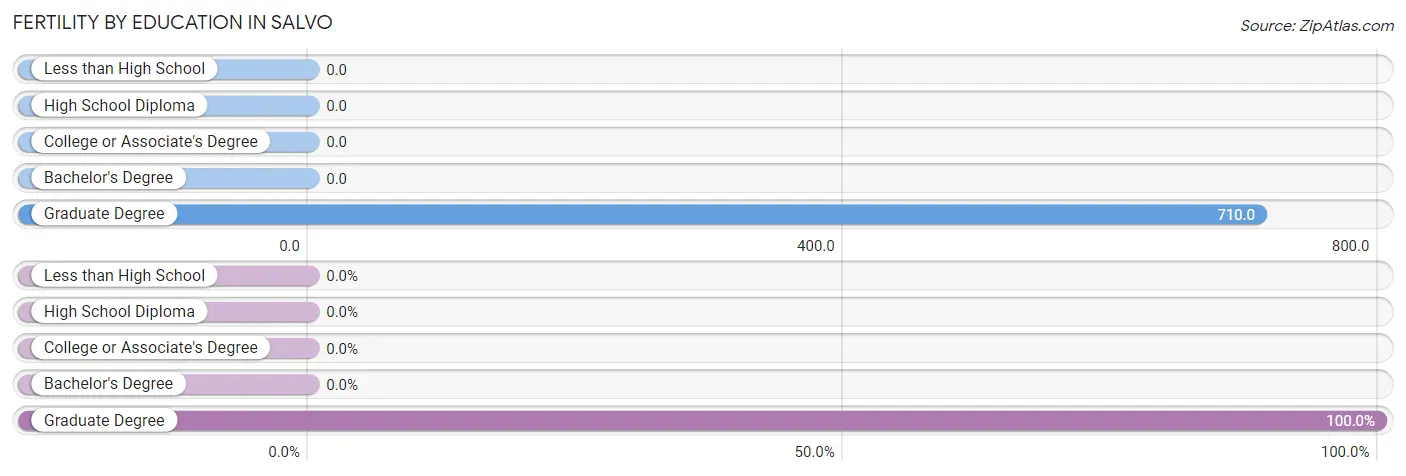
| Educational Attainment | Women with Births | Births / 1,000 Women |
| Less than High School | 0 (0.0%) | 0.0 |
| High School Diploma | 0 (0.0%) | 0.0 |
| College or Associate's Degree | 0 (0.0%) | 0.0 |
| Bachelor's Degree | 0 (0.0%) | 0.0 |
| Graduate Degree | 22 (100.0%) | 710.0 |
| Total | 22 (100.0%) | 489.0 |
Fertility by Education by Marriage Status in Salvo
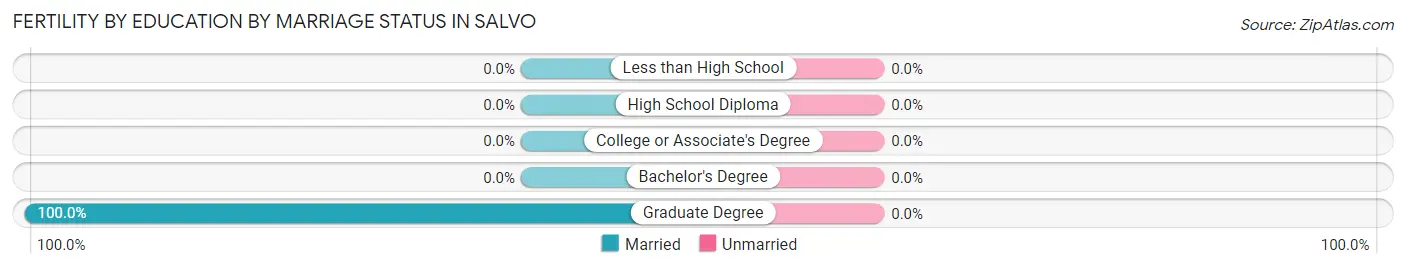
| Educational Attainment | Married | Unmarried |
| Less than High School | 0 (0.0%) | 0 (0.0%) |
| High School Diploma | 0 (0.0%) | 0 (0.0%) |
| College or Associate's Degree | 0 (0.0%) | 0 (0.0%) |
| Bachelor's Degree | 0 (0.0%) | 0 (0.0%) |
| Graduate Degree | 22 (100.0%) | 0 (0.0%) |
| Total | 22 (100.0%) | 0 (0.0%) |
Employment Characteristics in Salvo
Employment by Class of Employer in Salvo
Among the 92 employed individuals in Salvo, private company employees (48 | 52.2%), and self-employed (not incorporated) (44 | 47.8%) make up the most common classes of employment.
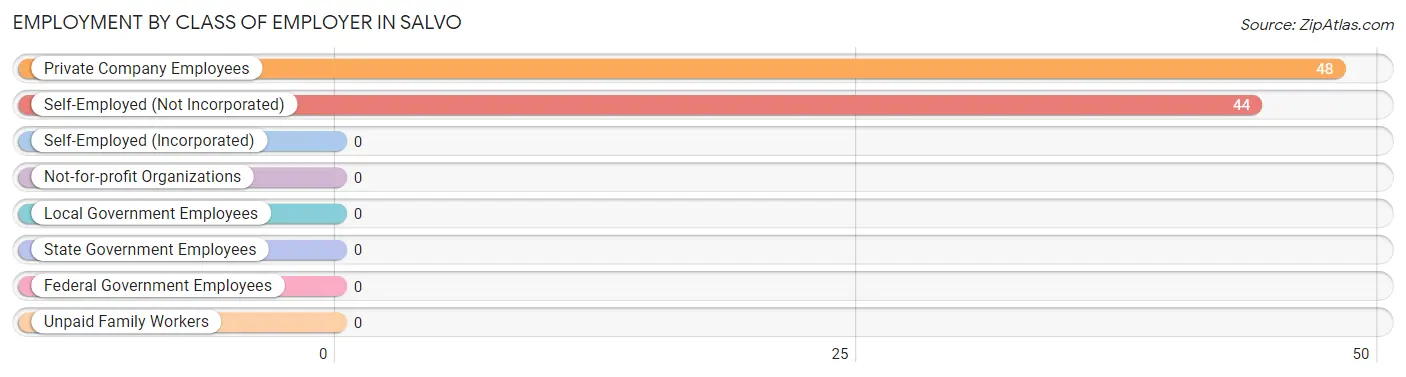
| Employer Class | # Employees | % Employees |
| Private Company Employees | 48 | 52.2% |
| Self-Employed (Incorporated) | 0 | 0.0% |
| Self-Employed (Not Incorporated) | 44 | 47.8% |
| Not-for-profit Organizations | 0 | 0.0% |
| Local Government Employees | 0 | 0.0% |
| State Government Employees | 0 | 0.0% |
| Federal Government Employees | 0 | 0.0% |
| Unpaid Family Workers | 0 | 0.0% |
| Total | 92 | 100.0% |
Employment Status by Age in Salvo
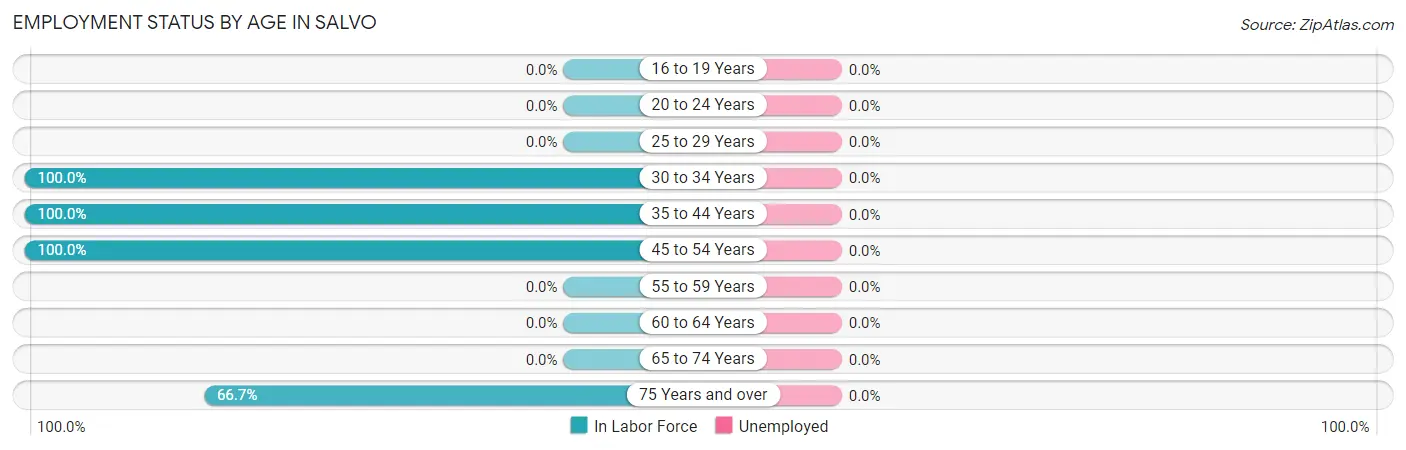
| Age Bracket | In Labor Force | Unemployed |
| 16 to 19 Years | 0 (0.0%) | 0 (0.0%) |
| 20 to 24 Years | 0 (0.0%) | 0 (0.0%) |
| 25 to 29 Years | 0 (0.0%) | 0 (0.0%) |
| 30 to 34 Years | 32 (100.0%) | 0 (0.0%) |
| 35 to 44 Years | 45 (100.0%) | 0 (0.0%) |
| 45 to 54 Years | 31 (100.0%) | 0 (0.0%) |
| 55 to 59 Years | 0 (0.0%) | 0 (0.0%) |
| 60 to 64 Years | 0 (0.0%) | 0 (0.0%) |
| 65 to 74 Years | 0 (0.0%) | 0 (0.0%) |
| 75 Years and over | 6 (66.7%) | 0 (0.0%) |
| Total | 114 (75.0%) | 0 (0.0%) |
Employment Status by Educational Attainment in Salvo
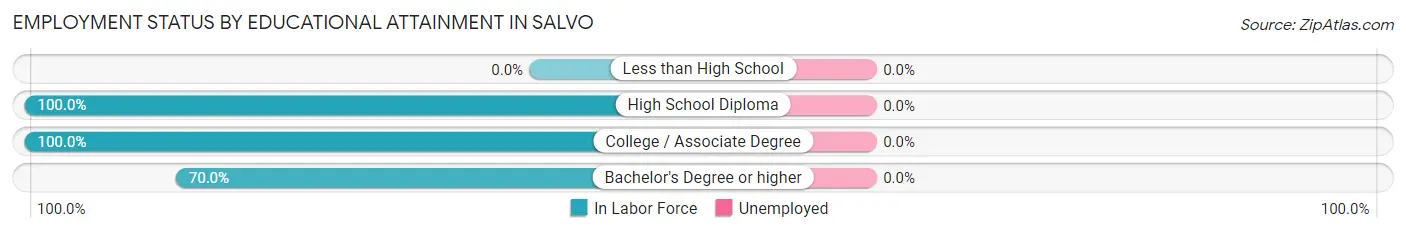
| Educational Attainment | In Labor Force | Unemployed |
| Less than High School | 0 (0.0%) | 0 (0.0%) |
| High School Diploma | 52 (100.0%) | 0 (0.0%) |
| College / Associate Degree | 14 (100.0%) | 0 (0.0%) |
| Bachelor's Degree or higher | 42 (70.0%) | 0 (0.0%) |
| Total | 108 (85.7%) | 0 (0.0%) |
Employment Occupations by Sex in Salvo
Management, Business, Science and Arts Occupations
The most common Management, Business, Science and Arts occupations in Salvo are Community & Social Service (6 | 5.3%), and Arts, Media & Entertainment (6 | 5.3%).
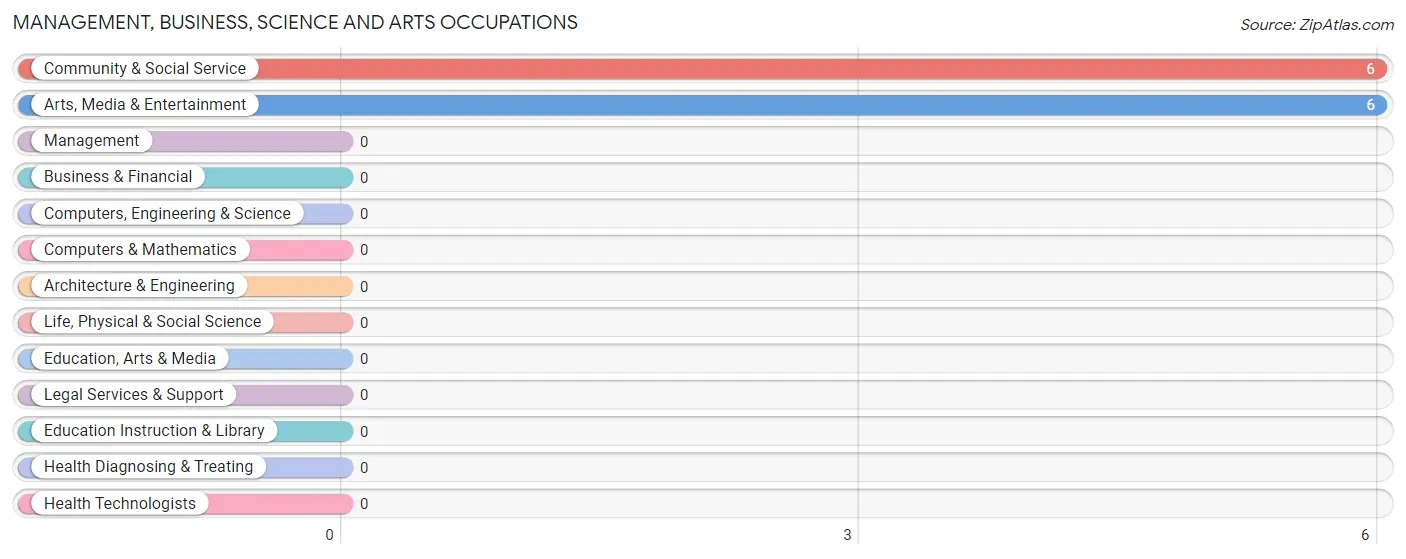
Management, Business, Science and Arts Occupations by Sex
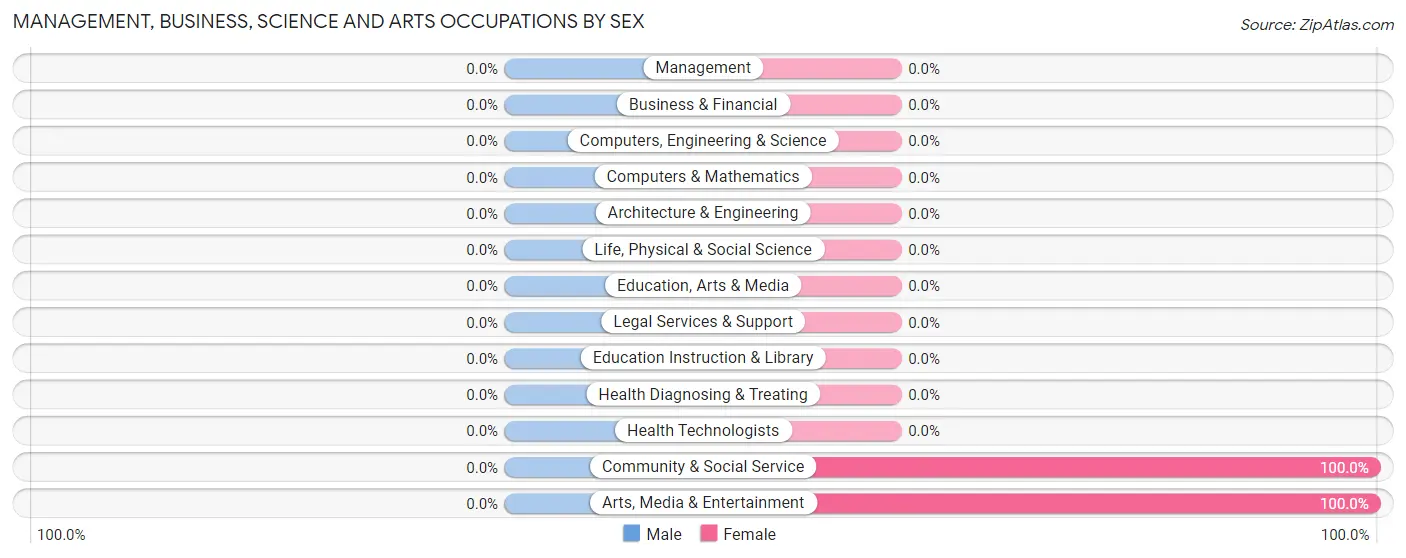
| Occupation | Male | Female |
| Management | 0 (0.0%) | 0 (0.0%) |
| Business & Financial | 0 (0.0%) | 0 (0.0%) |
| Computers, Engineering & Science | 0 (0.0%) | 0 (0.0%) |
| Computers & Mathematics | 0 (0.0%) | 0 (0.0%) |
| Architecture & Engineering | 0 (0.0%) | 0 (0.0%) |
| Life, Physical & Social Science | 0 (0.0%) | 0 (0.0%) |
| Community & Social Service | 0 (0.0%) | 6 (100.0%) |
| Education, Arts & Media | 0 (0.0%) | 0 (0.0%) |
| Legal Services & Support | 0 (0.0%) | 0 (0.0%) |
| Education Instruction & Library | 0 (0.0%) | 0 (0.0%) |
| Arts, Media & Entertainment | 0 (0.0%) | 6 (100.0%) |
| Health Diagnosing & Treating | 0 (0.0%) | 0 (0.0%) |
| Health Technologists | 0 (0.0%) | 0 (0.0%) |
| Total (Category) | 0 (0.0%) | 6 (100.0%) |
| Total (Overall) | 43 (37.7%) | 71 (62.3%) |
Services Occupations
The most common Services occupations in Salvo are , and Food Preparation & Serving (22 | 19.3%).
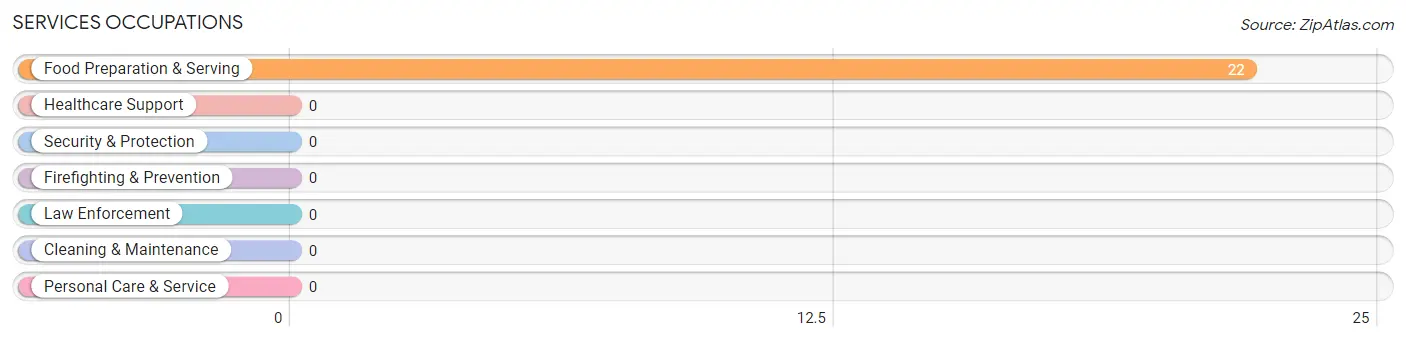
Services Occupations by Sex
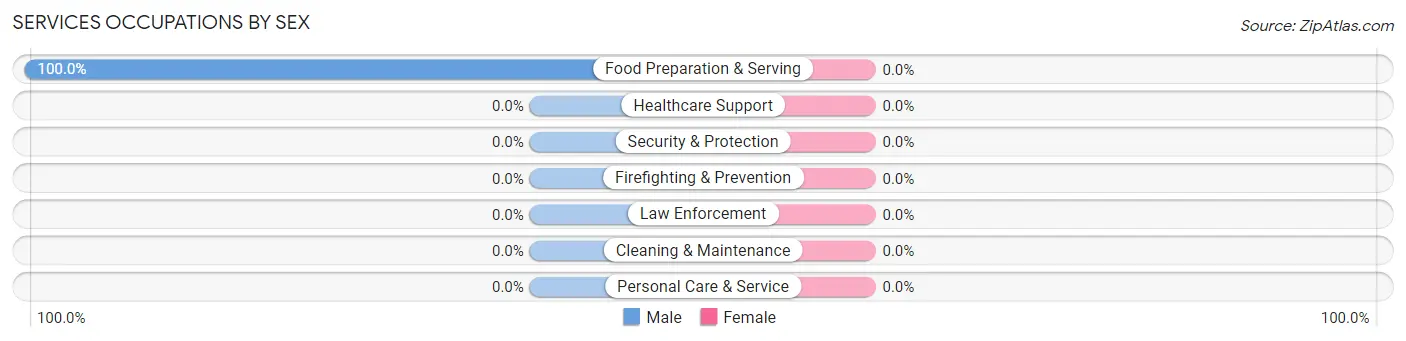
| Occupation | Male | Female |
| Healthcare Support | 0 (0.0%) | 0 (0.0%) |
| Security & Protection | 0 (0.0%) | 0 (0.0%) |
| Firefighting & Prevention | 0 (0.0%) | 0 (0.0%) |
| Law Enforcement | 0 (0.0%) | 0 (0.0%) |
| Food Preparation & Serving | 22 (100.0%) | 0 (0.0%) |
| Cleaning & Maintenance | 0 (0.0%) | 0 (0.0%) |
| Personal Care & Service | 0 (0.0%) | 0 (0.0%) |
| Total (Category) | 22 (100.0%) | 0 (0.0%) |
| Total (Overall) | 43 (37.7%) | 71 (62.3%) |
Sales and Office Occupations
The most common Sales and Office occupations in Salvo are Sales & Related (50 | 43.9%), and Office & Administration (36 | 31.6%).
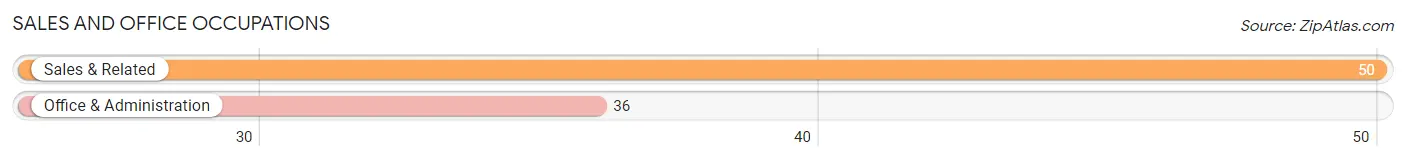
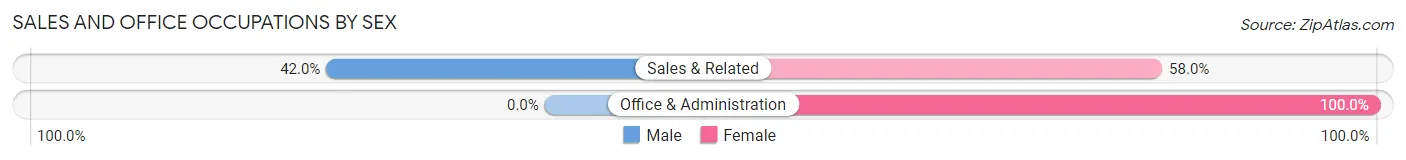
Sales and Office Occupations by Sex
| Occupation | Male | Female |
| Sales & Related | 21 (42.0%) | 29 (58.0%) |
| Office & Administration | 0 (0.0%) | 36 (100.0%) |
| Total (Category) | 21 (24.4%) | 65 (75.6%) |
| Total (Overall) | 43 (37.7%) | 71 (62.3%) |
Natural Resources, Construction and Maintenance Occupations
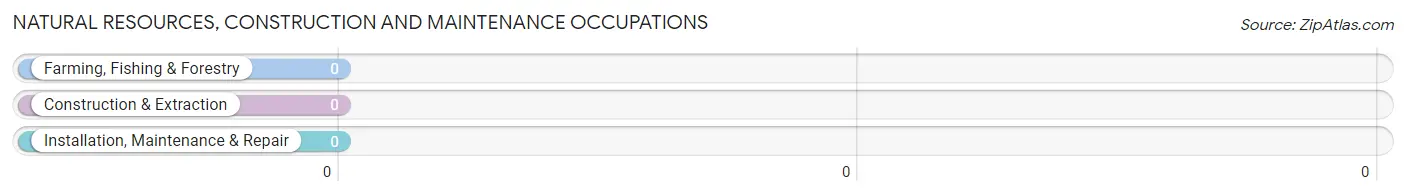
Natural Resources, Construction and Maintenance Occupations by Sex
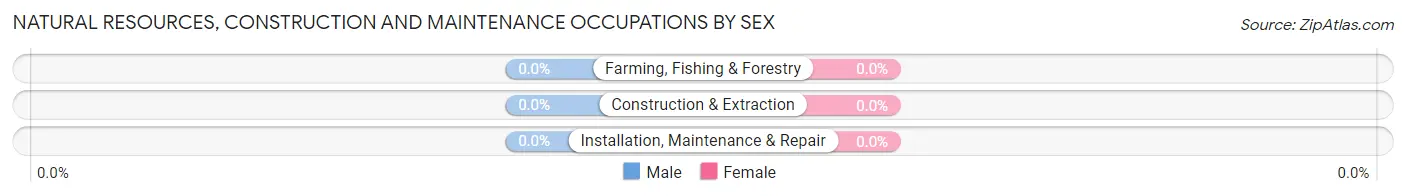
| Occupation | Male | Female |
| Farming, Fishing & Forestry | 0 (0.0%) | 0 (0.0%) |
| Construction & Extraction | 0 (0.0%) | 0 (0.0%) |
| Installation, Maintenance & Repair | 0 (0.0%) | 0 (0.0%) |
| Total (Category) | 0 (0.0%) | 0 (0.0%) |
| Total (Overall) | 43 (37.7%) | 71 (62.3%) |
Production, Transportation and Moving Occupations
Production, Transportation and Moving Occupations by Sex
| Occupation | Male | Female |
| Production | 0 (0.0%) | 0 (0.0%) |
| Transportation | 0 (0.0%) | 0 (0.0%) |
| Material Moving | 0 (0.0%) | 0 (0.0%) |
| Total (Category) | 0 (0.0%) | 0 (0.0%) |
| Total (Overall) | 43 (37.7%) | 71 (62.3%) |
Employment Industries by Sex in Salvo
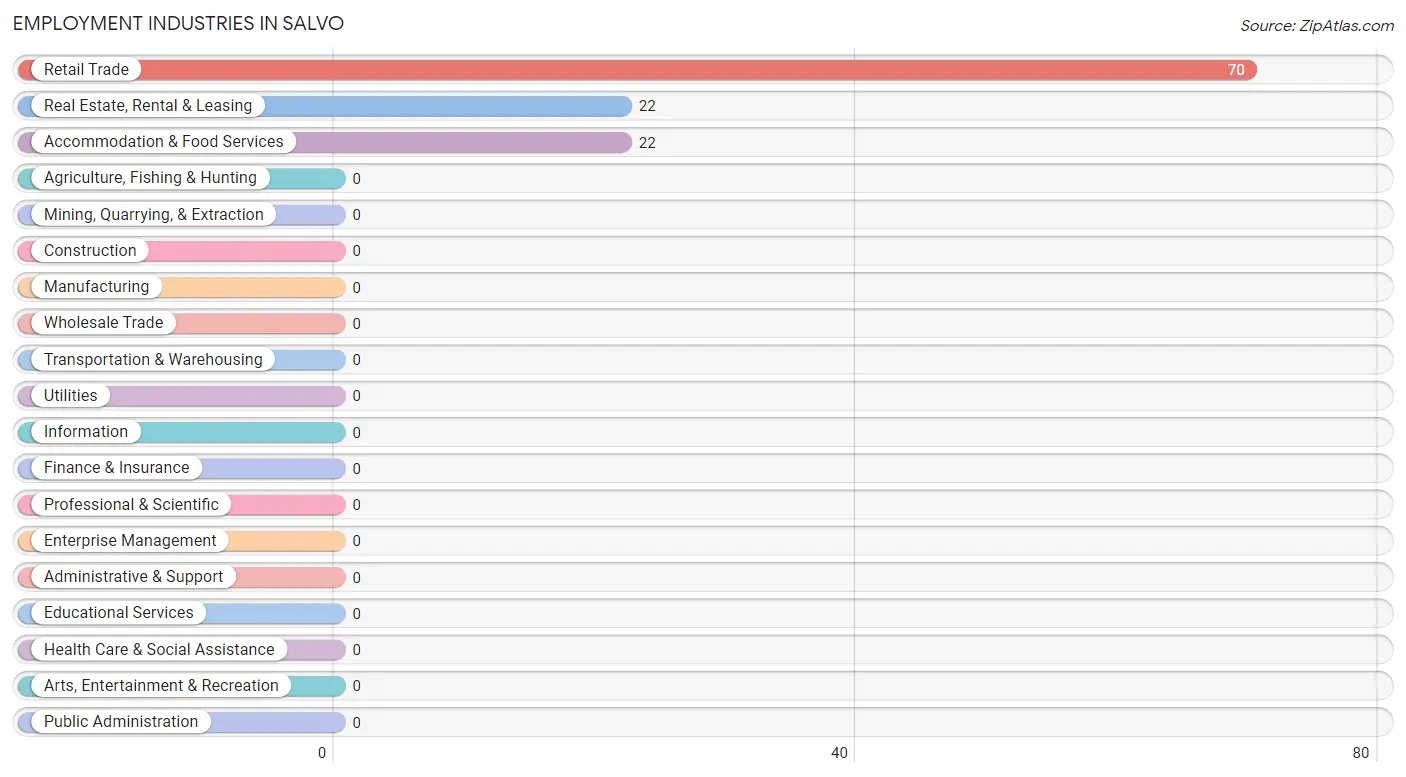
Employment Industries in Salvo
The major employment industries in Salvo include Retail Trade (70 | 61.4%), Real Estate, Rental & Leasing (22 | 19.3%), and Accommodation & Food Services (22 | 19.3%).
Employment Industries by Sex in Salvo
The Salvo industries that see more men than women are Accommodation & Food Services (100.0%), and Retail Trade (30.0%), whereas the industries that tend to have a higher number of women are Real Estate, Rental & Leasing (100.0%), and Retail Trade (70.0%).
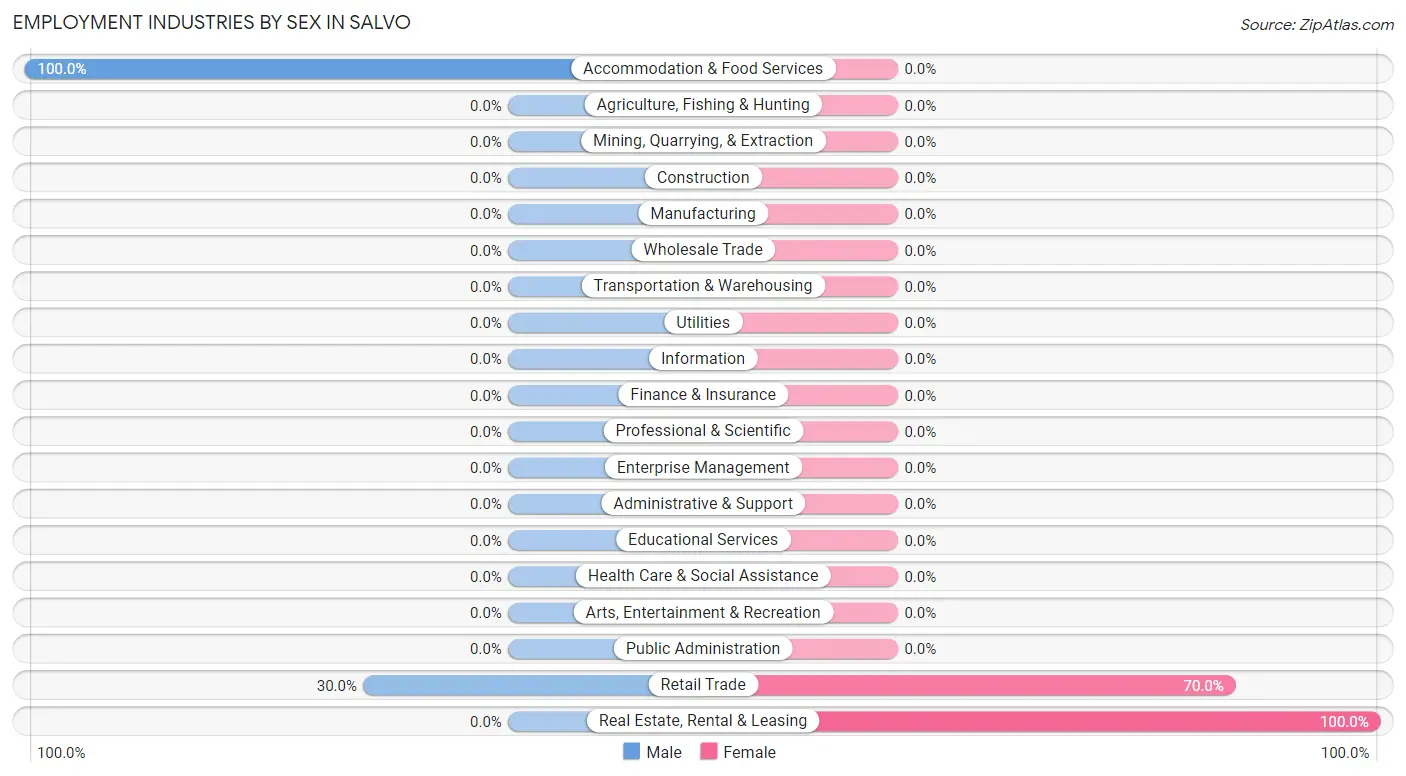
| Industry | Male | Female |
| Agriculture, Fishing & Hunting | 0 (0.0%) | 0 (0.0%) |
| Mining, Quarrying, & Extraction | 0 (0.0%) | 0 (0.0%) |
| Construction | 0 (0.0%) | 0 (0.0%) |
| Manufacturing | 0 (0.0%) | 0 (0.0%) |
| Wholesale Trade | 0 (0.0%) | 0 (0.0%) |
| Retail Trade | 21 (30.0%) | 49 (70.0%) |
| Transportation & Warehousing | 0 (0.0%) | 0 (0.0%) |
| Utilities | 0 (0.0%) | 0 (0.0%) |
| Information | 0 (0.0%) | 0 (0.0%) |
| Finance & Insurance | 0 (0.0%) | 0 (0.0%) |
| Real Estate, Rental & Leasing | 0 (0.0%) | 22 (100.0%) |
| Professional & Scientific | 0 (0.0%) | 0 (0.0%) |
| Enterprise Management | 0 (0.0%) | 0 (0.0%) |
| Administrative & Support | 0 (0.0%) | 0 (0.0%) |
| Educational Services | 0 (0.0%) | 0 (0.0%) |
| Health Care & Social Assistance | 0 (0.0%) | 0 (0.0%) |
| Arts, Entertainment & Recreation | 0 (0.0%) | 0 (0.0%) |
| Accommodation & Food Services | 22 (100.0%) | 0 (0.0%) |
| Public Administration | 0 (0.0%) | 0 (0.0%) |
| Total | 43 (37.7%) | 71 (62.3%) |
Education in Salvo
School Enrollment in Salvo
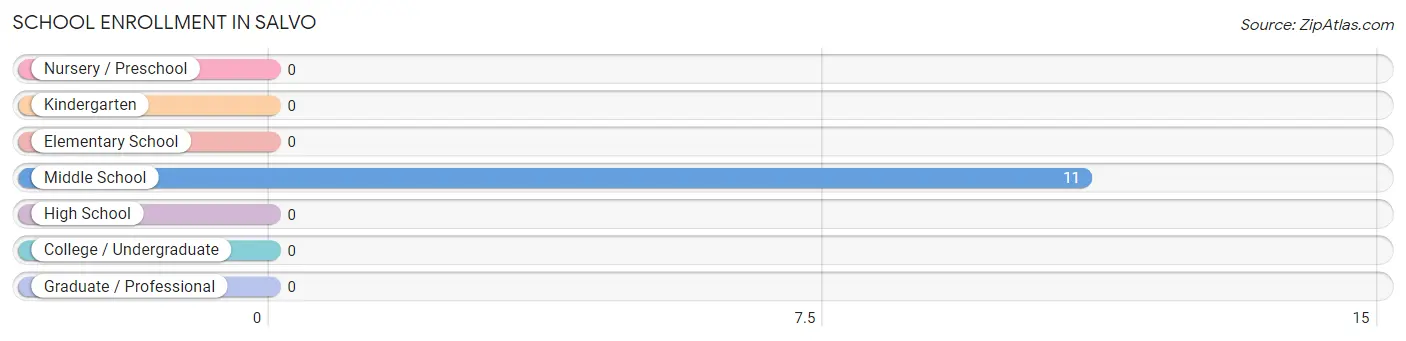
| School Level | # Students | % Students |
| Nursery / Preschool | 0 | 0.0% |
| Kindergarten | 0 | 0.0% |
| Elementary School | 0 | 0.0% |
| Middle School | 11 | 100.0% |
| High School | 0 | 0.0% |
| College / Undergraduate | 0 | 0.0% |
| Graduate / Professional | 0 | 0.0% |
| Total | 11 | 100.0% |
School Enrollment by Age by Funding Source in Salvo
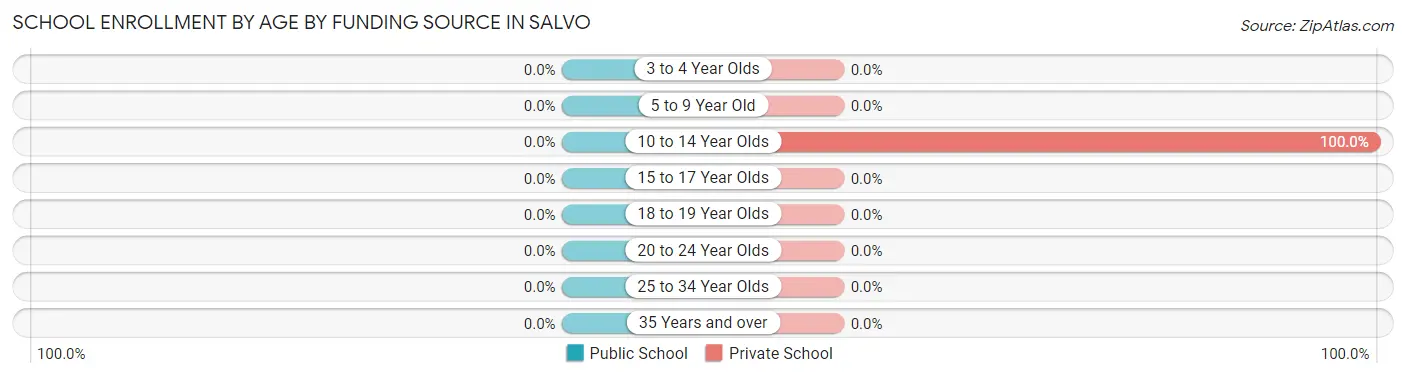
| Age Bracket | Public School | Private School |
| 3 to 4 Year Olds | 0 (0.0%) | 0 (0.0%) |
| 5 to 9 Year Old | 0 (0.0%) | 0 (0.0%) |
| 10 to 14 Year Olds | 0 (0.0%) | 11 (100.0%) |
| 15 to 17 Year Olds | 0 (0.0%) | 0 (0.0%) |
| 18 to 19 Year Olds | 0 (0.0%) | 0 (0.0%) |
| 20 to 24 Year Olds | 0 (0.0%) | 0 (0.0%) |
| 25 to 34 Year Olds | 0 (0.0%) | 0 (0.0%) |
| 35 Years and over | 0 (0.0%) | 0 (0.0%) |
| Total | 0 (0.0%) | 11 (100.0%) |
Educational Attainment by Field of Study in Salvo
Education (23 | 27.7%), physical & health sciences (22 | 26.5%), social sciences (11 | 13.3%), science & technology (9 | 10.8%), and literature & languages (9 | 10.8%) are the most common fields of study among 83 individuals in Salvo who have obtained a bachelor's degree or higher.
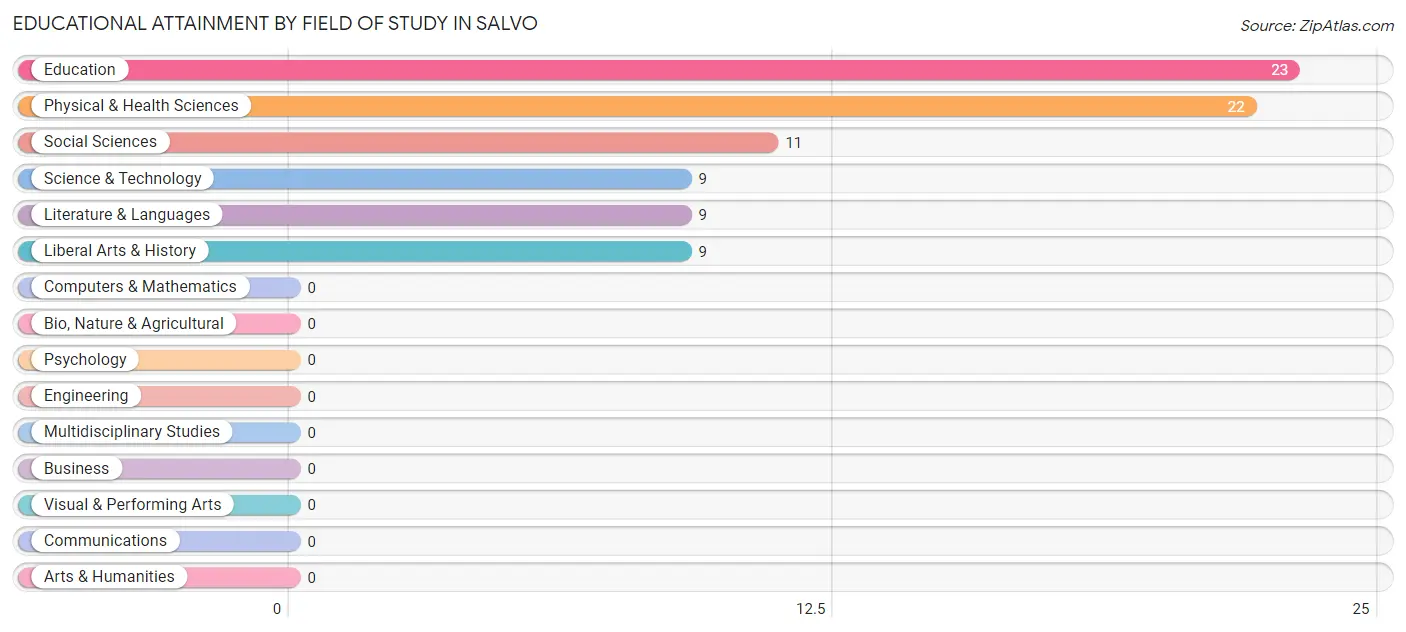
| Field of Study | # Graduates | % Graduates |
| Computers & Mathematics | 0 | 0.0% |
| Bio, Nature & Agricultural | 0 | 0.0% |
| Physical & Health Sciences | 22 | 26.5% |
| Psychology | 0 | 0.0% |
| Social Sciences | 11 | 13.3% |
| Engineering | 0 | 0.0% |
| Multidisciplinary Studies | 0 | 0.0% |
| Science & Technology | 9 | 10.8% |
| Business | 0 | 0.0% |
| Education | 23 | 27.7% |
| Literature & Languages | 9 | 10.8% |
| Liberal Arts & History | 9 | 10.8% |
| Visual & Performing Arts | 0 | 0.0% |
| Communications | 0 | 0.0% |
| Arts & Humanities | 0 | 0.0% |
| Total | 83 | 100.0% |
Transportation & Commute in Salvo
Vehicle Availability by Sex in Salvo
The most prevalent vehicle ownership categories in Salvo are males with 2 vehicles (43, accounting for 100.0%) and females with 2 vehicles (23, making up 87.8%).
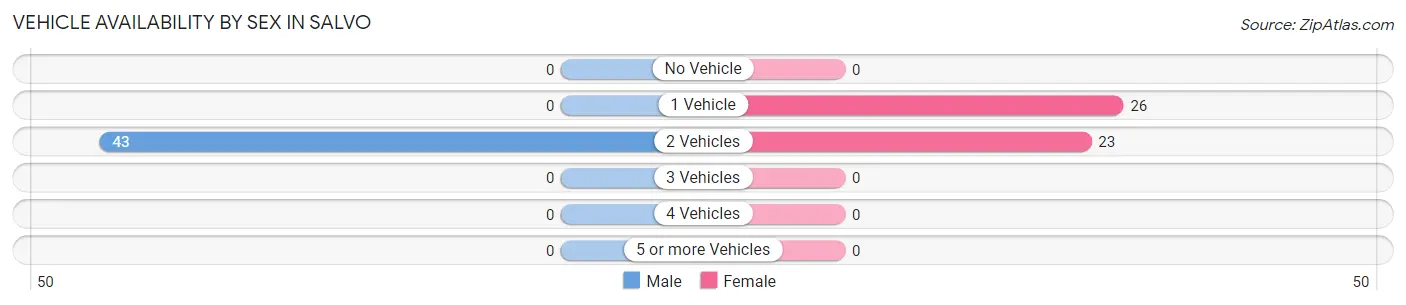
| Vehicles Available | Male | Female |
| No Vehicle | 0 (0.0%) | 0 (0.0%) |
| 1 Vehicle | 0 (0.0%) | 26 (53.1%) |
| 2 Vehicles | 43 (100.0%) | 23 (46.9%) |
| 3 Vehicles | 0 (0.0%) | 0 (0.0%) |
| 4 Vehicles | 0 (0.0%) | 0 (0.0%) |
| 5 or more Vehicles | 0 (0.0%) | 0 (0.0%) |
| Total | 43 (100.0%) | 49 (100.0%) |
Commute Time in Salvo
The most frequently occuring commute durations in Salvo are 45 to 59 minutes (40 commuters, 55.6%), 5 to 9 minutes (22 commuters, 30.6%), and 30 to 34 minutes (10 commuters, 13.9%).
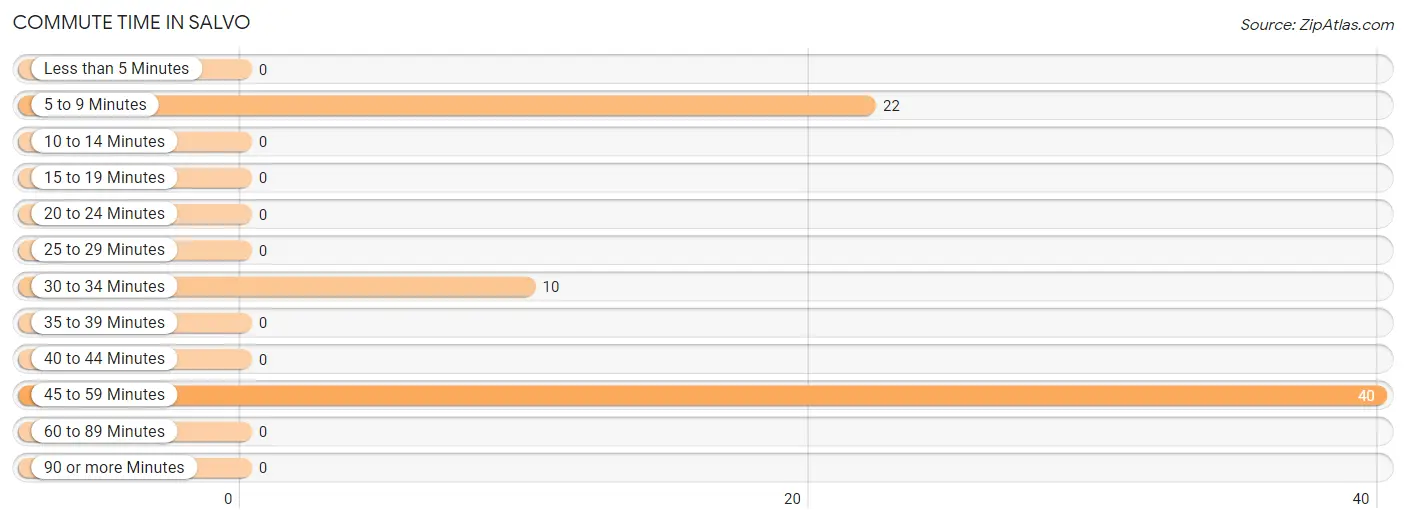
| Commute Time | # Commuters | % Commuters |
| Less than 5 Minutes | 0 | 0.0% |
| 5 to 9 Minutes | 22 | 30.6% |
| 10 to 14 Minutes | 0 | 0.0% |
| 15 to 19 Minutes | 0 | 0.0% |
| 20 to 24 Minutes | 0 | 0.0% |
| 25 to 29 Minutes | 0 | 0.0% |
| 30 to 34 Minutes | 10 | 13.9% |
| 35 to 39 Minutes | 0 | 0.0% |
| 40 to 44 Minutes | 0 | 0.0% |
| 45 to 59 Minutes | 40 | 55.6% |
| 60 to 89 Minutes | 0 | 0.0% |
| 90 or more Minutes | 0 | 0.0% |
Commute Time by Sex in Salvo
The most common commute times in Salvo are 5 to 9 minutes (22 commuters, 51.2%) for males and 45 to 59 minutes (29 commuters, 100.0%) for females.
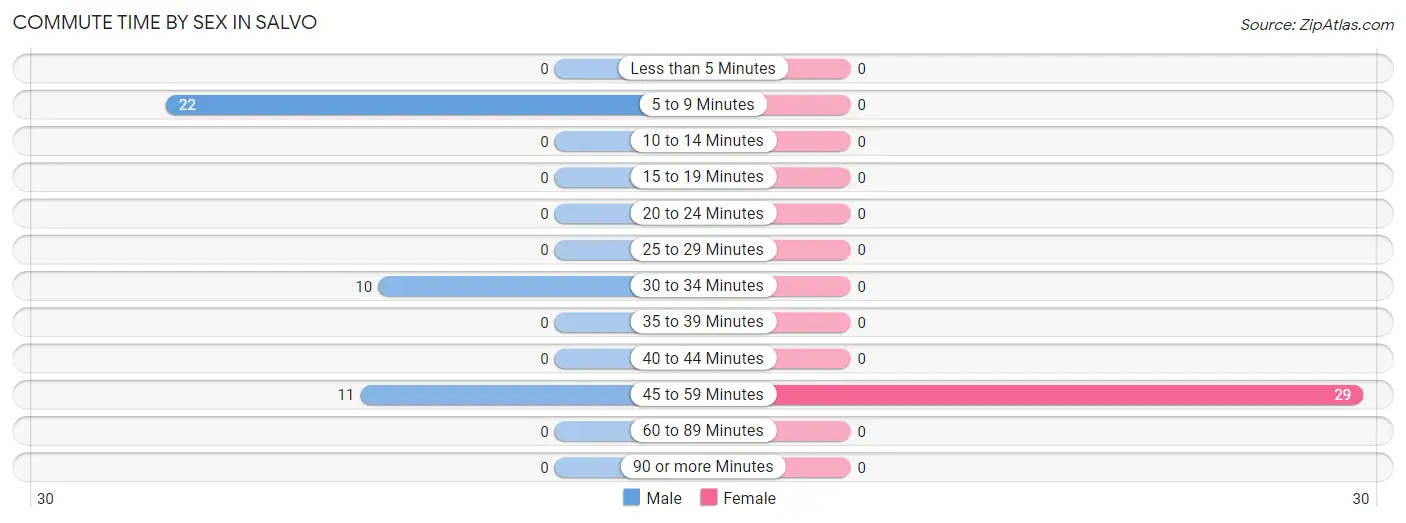
| Commute Time | Male | Female |
| Less than 5 Minutes | 0 (0.0%) | 0 (0.0%) |
| 5 to 9 Minutes | 22 (51.2%) | 0 (0.0%) |
| 10 to 14 Minutes | 0 (0.0%) | 0 (0.0%) |
| 15 to 19 Minutes | 0 (0.0%) | 0 (0.0%) |
| 20 to 24 Minutes | 0 (0.0%) | 0 (0.0%) |
| 25 to 29 Minutes | 0 (0.0%) | 0 (0.0%) |
| 30 to 34 Minutes | 10 (23.3%) | 0 (0.0%) |
| 35 to 39 Minutes | 0 (0.0%) | 0 (0.0%) |
| 40 to 44 Minutes | 0 (0.0%) | 0 (0.0%) |
| 45 to 59 Minutes | 11 (25.6%) | 29 (100.0%) |
| 60 to 89 Minutes | 0 (0.0%) | 0 (0.0%) |
| 90 or more Minutes | 0 (0.0%) | 0 (0.0%) |
Time of Departure to Work by Sex in Salvo
The most frequent times of departure to work in Salvo are 12:00 PM to 3:59 PM (22, 51.2%) for males and 12:00 AM to 4:59 AM (20, 69.0%) for females.
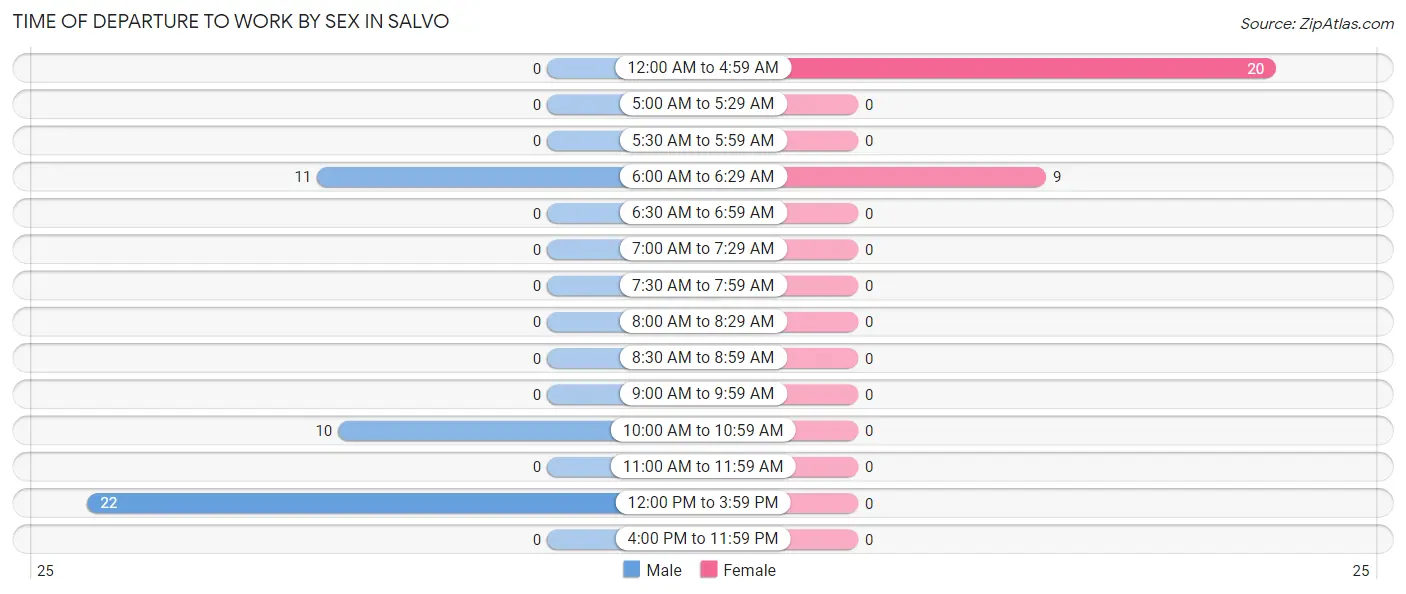
| Time of Departure | Male | Female |
| 12:00 AM to 4:59 AM | 0 (0.0%) | 20 (69.0%) |
| 5:00 AM to 5:29 AM | 0 (0.0%) | 0 (0.0%) |
| 5:30 AM to 5:59 AM | 0 (0.0%) | 0 (0.0%) |
| 6:00 AM to 6:29 AM | 11 (25.6%) | 9 (31.0%) |
| 6:30 AM to 6:59 AM | 0 (0.0%) | 0 (0.0%) |
| 7:00 AM to 7:29 AM | 0 (0.0%) | 0 (0.0%) |
| 7:30 AM to 7:59 AM | 0 (0.0%) | 0 (0.0%) |
| 8:00 AM to 8:29 AM | 0 (0.0%) | 0 (0.0%) |
| 8:30 AM to 8:59 AM | 0 (0.0%) | 0 (0.0%) |
| 9:00 AM to 9:59 AM | 0 (0.0%) | 0 (0.0%) |
| 10:00 AM to 10:59 AM | 10 (23.3%) | 0 (0.0%) |
| 11:00 AM to 11:59 AM | 0 (0.0%) | 0 (0.0%) |
| 12:00 PM to 3:59 PM | 22 (51.2%) | 0 (0.0%) |
| 4:00 PM to 11:59 PM | 0 (0.0%) | 0 (0.0%) |
| Total | 43 (100.0%) | 29 (100.0%) |
Housing Occupancy in Salvo
Occupancy by Ownership in Salvo
Of the total 78 dwellings in Salvo, owner-occupied units account for 50 (64.1%), while renter-occupied units make up 28 (35.9%).
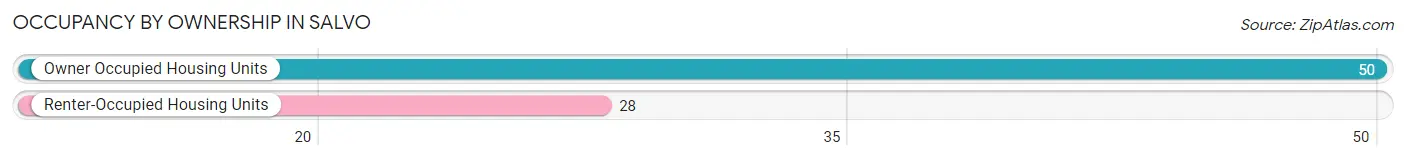
| Occupancy | # Housing Units | % Housing Units |
| Owner Occupied Housing Units | 50 | 64.1% |
| Renter-Occupied Housing Units | 28 | 35.9% |
| Total Occupied Housing Units | 78 | 100.0% |
Occupancy by Household Size in Salvo
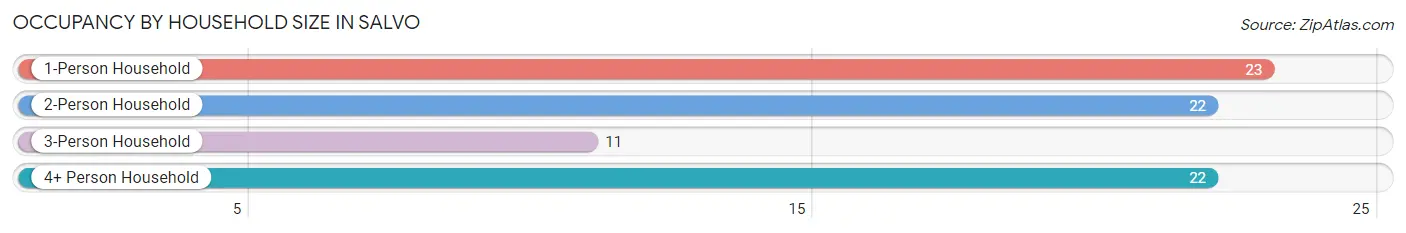
| Household Size | # Housing Units | % Housing Units |
| 1-Person Household | 23 | 29.5% |
| 2-Person Household | 22 | 28.2% |
| 3-Person Household | 11 | 14.1% |
| 4+ Person Household | 22 | 28.2% |
| Total Housing Units | 78 | 100.0% |
Occupancy by Ownership by Household Size in Salvo
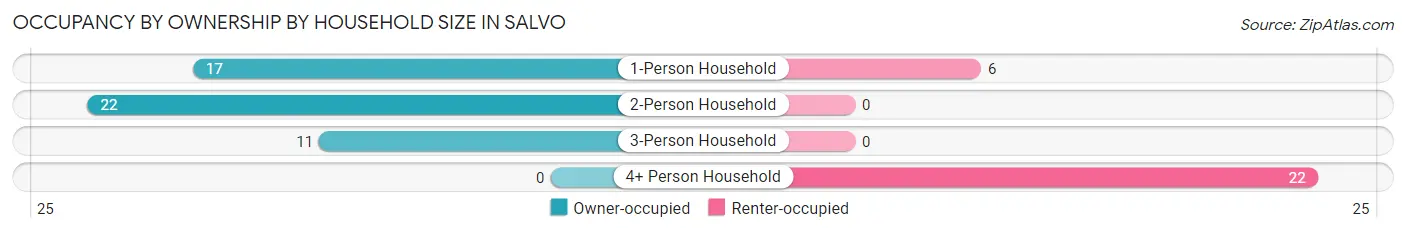
| Household Size | Owner-occupied | Renter-occupied |
| 1-Person Household | 17 (73.9%) | 6 (26.1%) |
| 2-Person Household | 22 (100.0%) | 0 (0.0%) |
| 3-Person Household | 11 (100.0%) | 0 (0.0%) |
| 4+ Person Household | 0 (0.0%) | 22 (100.0%) |
| Total Housing Units | 50 (64.1%) | 28 (35.9%) |
Occupancy by Educational Attainment in Salvo
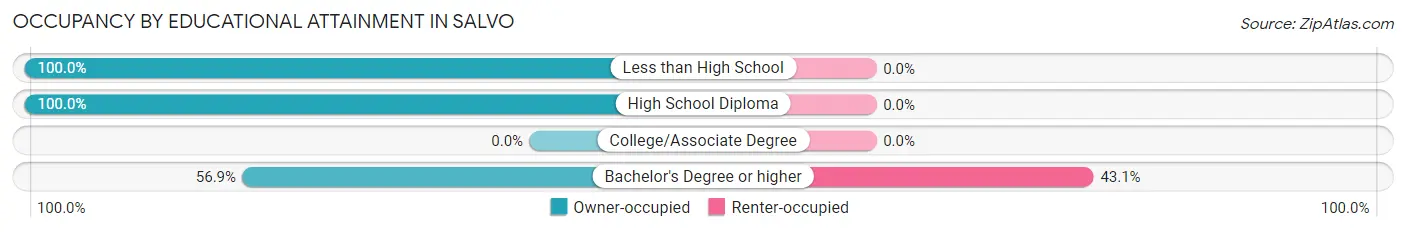
| Household Size | Owner-occupied | Renter-occupied |
| Less than High School | 3 (100.0%) | 0 (0.0%) |
| High School Diploma | 10 (100.0%) | 0 (0.0%) |
| College/Associate Degree | 0 (0.0%) | 0 (0.0%) |
| Bachelor's Degree or higher | 37 (56.9%) | 28 (43.1%) |
Occupancy by Age of Householder in Salvo
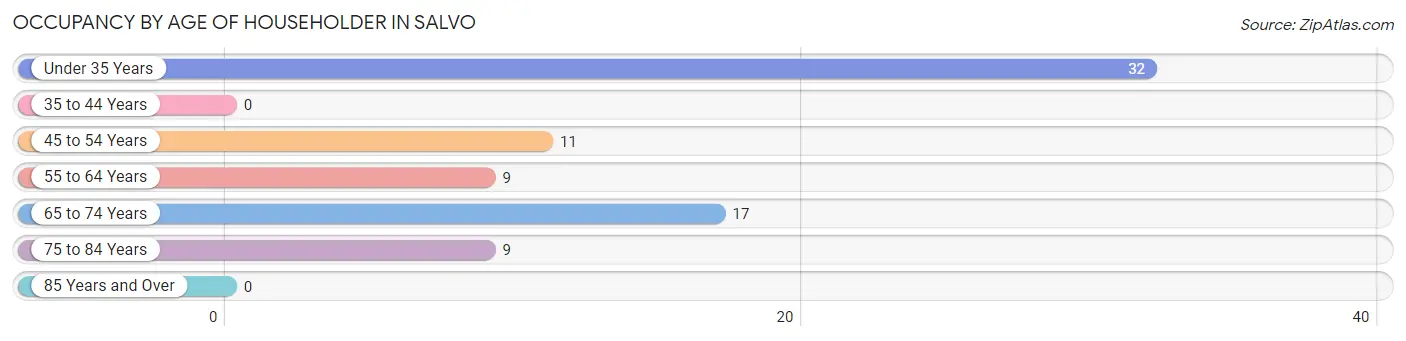
| Age Bracket | # Households | % Households |
| Under 35 Years | 32 | 41.0% |
| 35 to 44 Years | 0 | 0.0% |
| 45 to 54 Years | 11 | 14.1% |
| 55 to 64 Years | 9 | 11.5% |
| 65 to 74 Years | 17 | 21.8% |
| 75 to 84 Years | 9 | 11.5% |
| 85 Years and Over | 0 | 0.0% |
| Total | 78 | 100.0% |
Housing Finances in Salvo
Median Income by Occupancy in Salvo
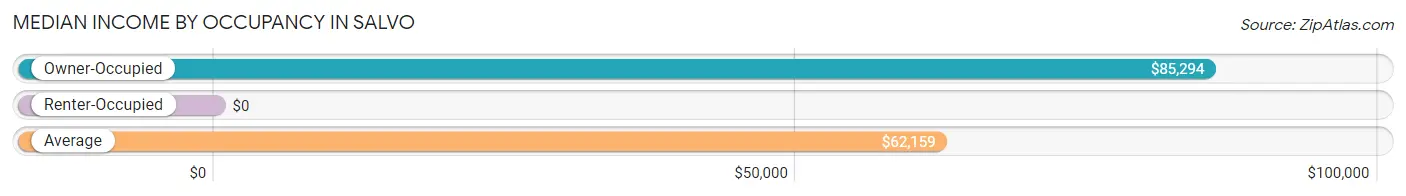
| Occupancy Type | # Households | Median Income |
| Owner-Occupied | 50 (64.1%) | $85,294 |
| Renter-Occupied | 28 (35.9%) | $0 |
| Average | 78 (100.0%) | $62,159 |
Occupancy by Householder Income Bracket in Salvo
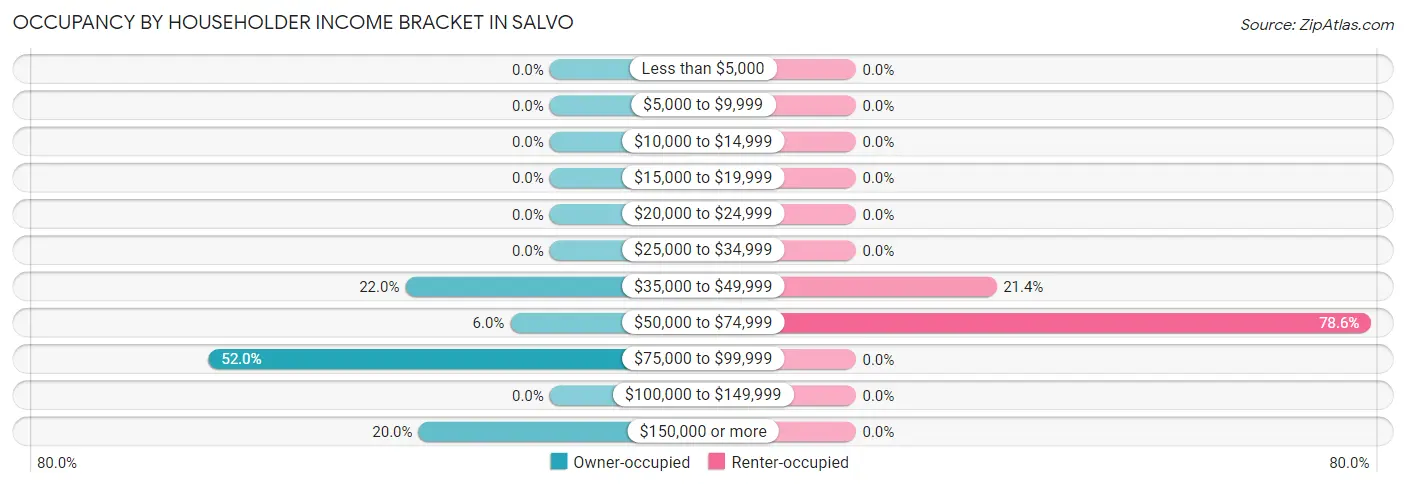
| Income Bracket | Owner-occupied | Renter-occupied |
| Less than $5,000 | 0 (0.0%) | 0 (0.0%) |
| $5,000 to $9,999 | 0 (0.0%) | 0 (0.0%) |
| $10,000 to $14,999 | 0 (0.0%) | 0 (0.0%) |
| $15,000 to $19,999 | 0 (0.0%) | 0 (0.0%) |
| $20,000 to $24,999 | 0 (0.0%) | 0 (0.0%) |
| $25,000 to $34,999 | 0 (0.0%) | 0 (0.0%) |
| $35,000 to $49,999 | 11 (22.0%) | 6 (21.4%) |
| $50,000 to $74,999 | 3 (6.0%) | 22 (78.6%) |
| $75,000 to $99,999 | 26 (52.0%) | 0 (0.0%) |
| $100,000 to $149,999 | 0 (0.0%) | 0 (0.0%) |
| $150,000 or more | 10 (20.0%) | 0 (0.0%) |
| Total | 50 (100.0%) | 28 (100.0%) |
Monthly Housing Cost Tiers in Salvo
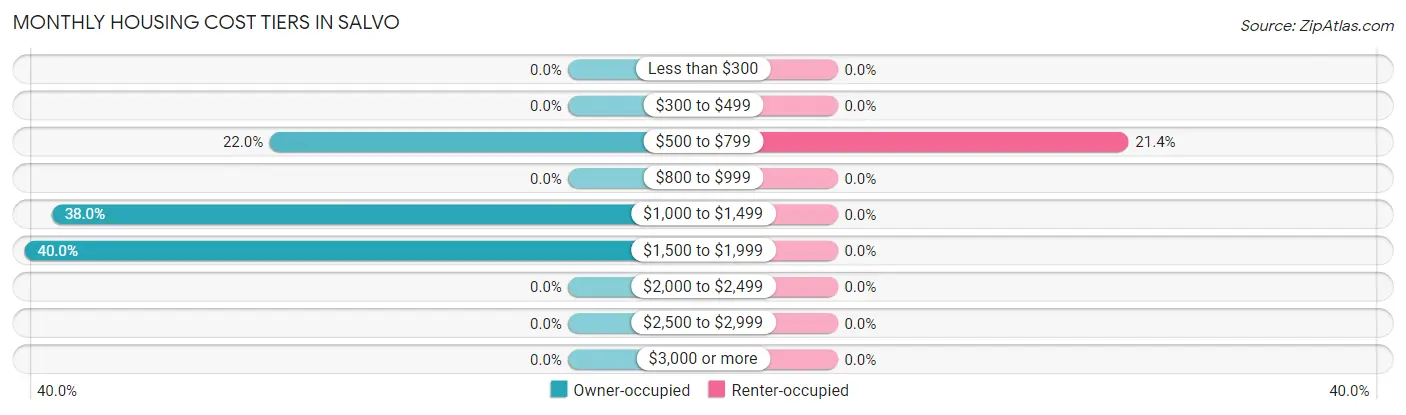
| Monthly Cost | Owner-occupied | Renter-occupied |
| Less than $300 | 0 (0.0%) | 0 (0.0%) |
| $300 to $499 | 0 (0.0%) | 0 (0.0%) |
| $500 to $799 | 11 (22.0%) | 6 (21.4%) |
| $800 to $999 | 0 (0.0%) | 0 (0.0%) |
| $1,000 to $1,499 | 19 (38.0%) | 0 (0.0%) |
| $1,500 to $1,999 | 20 (40.0%) | 0 (0.0%) |
| $2,000 to $2,499 | 0 (0.0%) | 0 (0.0%) |
| $2,500 to $2,999 | 0 (0.0%) | 0 (0.0%) |
| $3,000 or more | 0 (0.0%) | 0 (0.0%) |
| Total | 50 (100.0%) | 28 (100.0%) |
Physical Housing Characteristics in Salvo
Housing Structures in Salvo
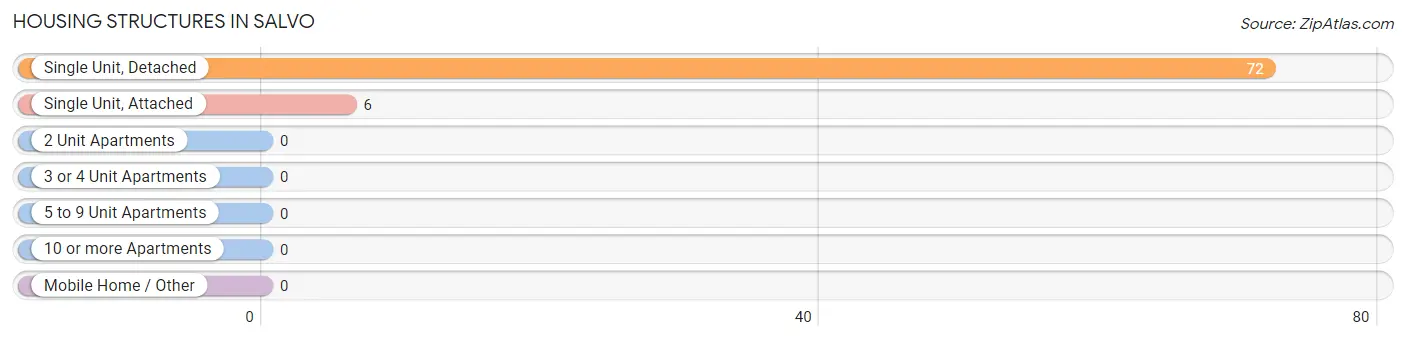
| Structure Type | # Housing Units | % Housing Units |
| Single Unit, Detached | 72 | 92.3% |
| Single Unit, Attached | 6 | 7.7% |
| 2 Unit Apartments | 0 | 0.0% |
| 3 or 4 Unit Apartments | 0 | 0.0% |
| 5 to 9 Unit Apartments | 0 | 0.0% |
| 10 or more Apartments | 0 | 0.0% |
| Mobile Home / Other | 0 | 0.0% |
| Total | 78 | 100.0% |
Housing Structures by Occupancy in Salvo
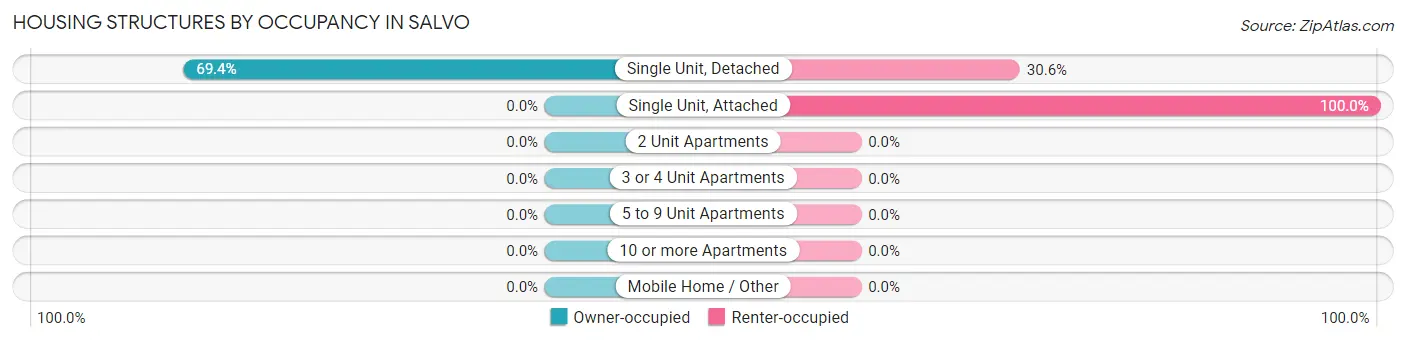
| Structure Type | Owner-occupied | Renter-occupied |
| Single Unit, Detached | 50 (69.4%) | 22 (30.6%) |
| Single Unit, Attached | 0 (0.0%) | 6 (100.0%) |
| 2 Unit Apartments | 0 (0.0%) | 0 (0.0%) |
| 3 or 4 Unit Apartments | 0 (0.0%) | 0 (0.0%) |
| 5 to 9 Unit Apartments | 0 (0.0%) | 0 (0.0%) |
| 10 or more Apartments | 0 (0.0%) | 0 (0.0%) |
| Mobile Home / Other | 0 (0.0%) | 0 (0.0%) |
| Total | 50 (64.1%) | 28 (35.9%) |
Housing Structures by Number of Rooms in Salvo
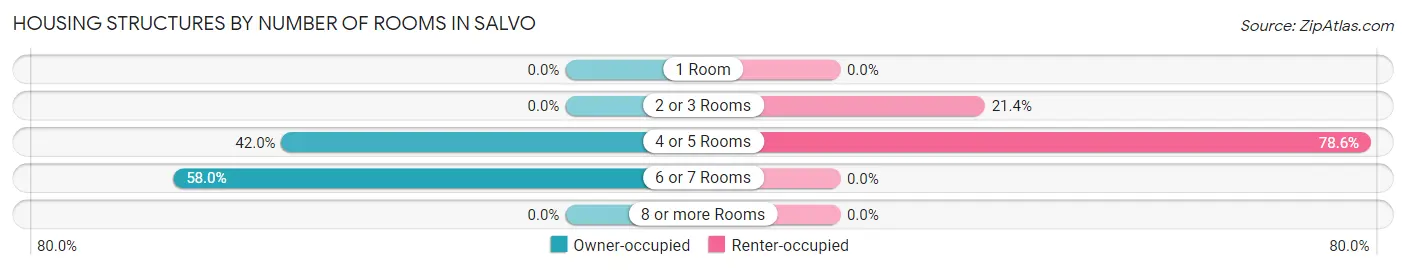
| Number of Rooms | Owner-occupied | Renter-occupied |
| 1 Room | 0 (0.0%) | 0 (0.0%) |
| 2 or 3 Rooms | 0 (0.0%) | 6 (21.4%) |
| 4 or 5 Rooms | 21 (42.0%) | 22 (78.6%) |
| 6 or 7 Rooms | 29 (58.0%) | 0 (0.0%) |
| 8 or more Rooms | 0 (0.0%) | 0 (0.0%) |
| Total | 50 (100.0%) | 28 (100.0%) |
Housing Structure by Heating Type in Salvo
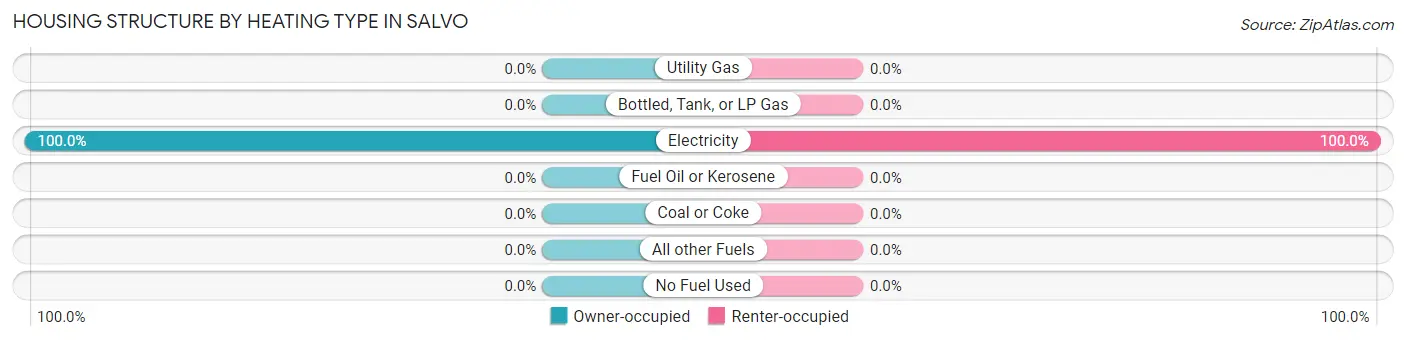
| Heating Type | Owner-occupied | Renter-occupied |
| Utility Gas | 0 (0.0%) | 0 (0.0%) |
| Bottled, Tank, or LP Gas | 0 (0.0%) | 0 (0.0%) |
| Electricity | 50 (100.0%) | 28 (100.0%) |
| Fuel Oil or Kerosene | 0 (0.0%) | 0 (0.0%) |
| Coal or Coke | 0 (0.0%) | 0 (0.0%) |
| All other Fuels | 0 (0.0%) | 0 (0.0%) |
| No Fuel Used | 0 (0.0%) | 0 (0.0%) |
| Total | 50 (100.0%) | 28 (100.0%) |
Household Vehicle Usage in Salvo
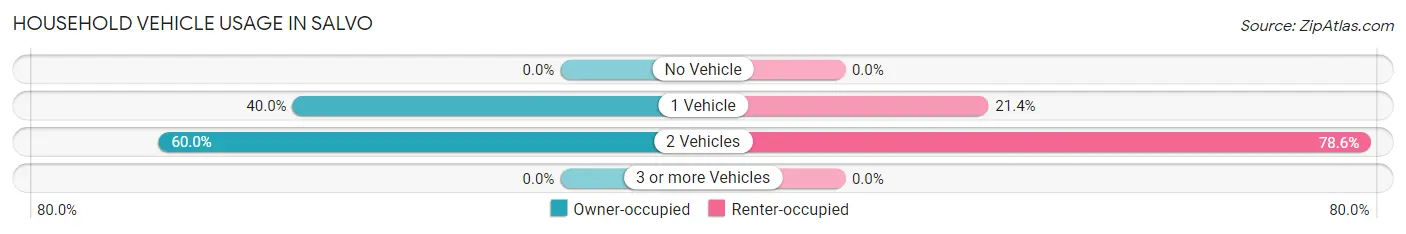
| Vehicles per Household | Owner-occupied | Renter-occupied |
| No Vehicle | 0 (0.0%) | 0 (0.0%) |
| 1 Vehicle | 20 (40.0%) | 6 (21.4%) |
| 2 Vehicles | 30 (60.0%) | 22 (78.6%) |
| 3 or more Vehicles | 0 (0.0%) | 0 (0.0%) |
| Total | 50 (100.0%) | 28 (100.0%) |
Real Estate & Mortgages in Salvo
Real Estate and Mortgage Overview in Salvo
| Characteristic | Without Mortgage | With Mortgage |
| Housing Units | 11 | 39 |
| Median Property Value | - | - |
| Median Household Income | - | - |
| Monthly Housing Costs | - | - |
| Real Estate Taxes | - | - |
Property Value by Mortgage Status in Salvo
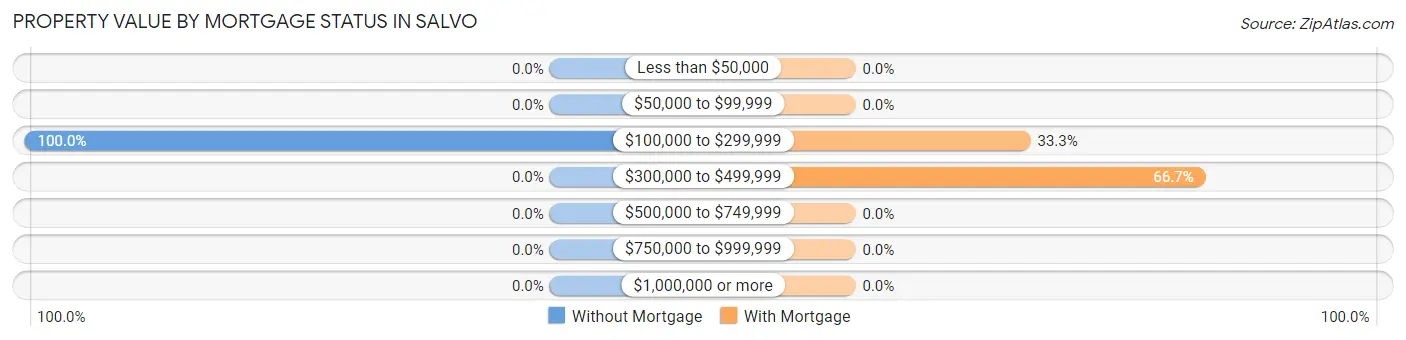
| Property Value | Without Mortgage | With Mortgage |
| Less than $50,000 | 0 (0.0%) | 0 (0.0%) |
| $50,000 to $99,999 | 0 (0.0%) | 0 (0.0%) |
| $100,000 to $299,999 | 11 (100.0%) | 13 (33.3%) |
| $300,000 to $499,999 | 0 (0.0%) | 26 (66.7%) |
| $500,000 to $749,999 | 0 (0.0%) | 0 (0.0%) |
| $750,000 to $999,999 | 0 (0.0%) | 0 (0.0%) |
| $1,000,000 or more | 0 (0.0%) | 0 (0.0%) |
| Total | 11 (100.0%) | 39 (100.0%) |
Household Income by Mortgage Status in Salvo
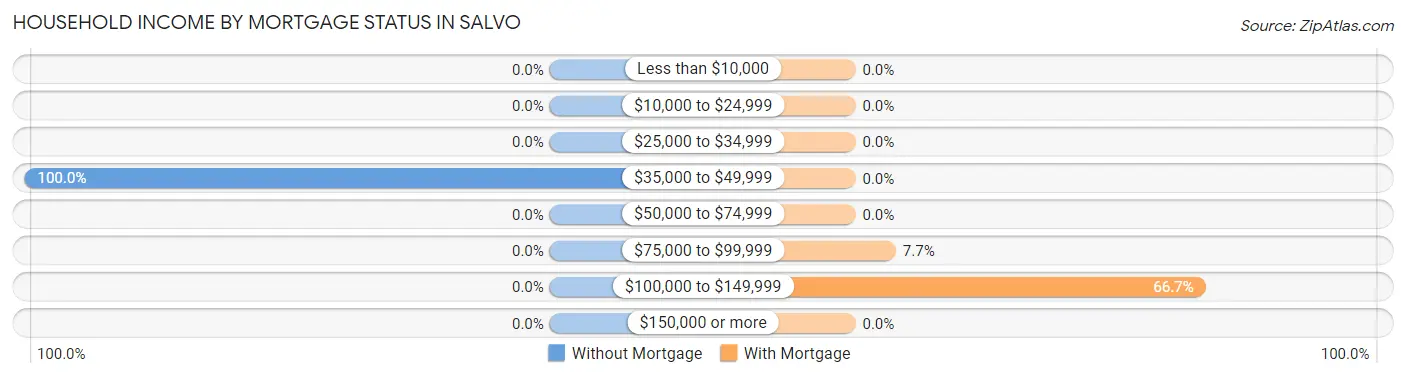
| Household Income | Without Mortgage | With Mortgage |
| Less than $10,000 | 0 (0.0%) | 0 (0.0%) |
| $10,000 to $24,999 | 0 (0.0%) | 0 (0.0%) |
| $25,000 to $34,999 | 0 (0.0%) | 0 (0.0%) |
| $35,000 to $49,999 | 11 (100.0%) | 0 (0.0%) |
| $50,000 to $74,999 | 0 (0.0%) | 0 (0.0%) |
| $75,000 to $99,999 | 0 (0.0%) | 3 (7.7%) |
| $100,000 to $149,999 | 0 (0.0%) | 26 (66.7%) |
| $150,000 or more | 0 (0.0%) | 0 (0.0%) |
| Total | 11 (100.0%) | 39 (100.0%) |
Property Value to Household Income Ratio in Salvo
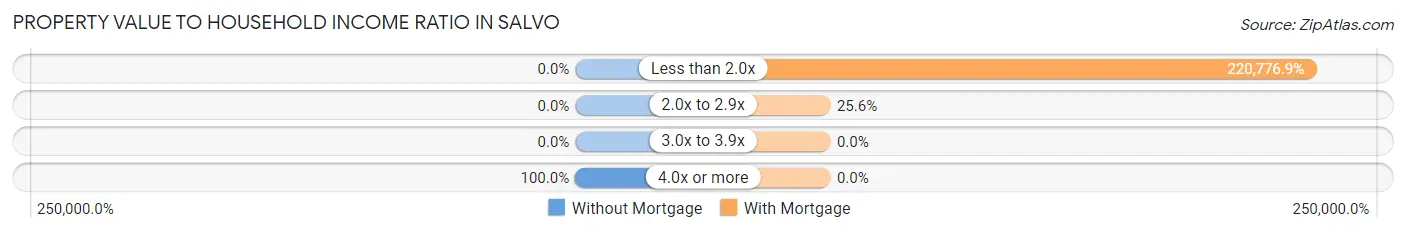
| Value-to-Income Ratio | Without Mortgage | With Mortgage |
| Less than 2.0x | 0 (0.0%) | 86,103 (220,776.9%) |
| 2.0x to 2.9x | 0 (0.0%) | 10 (25.6%) |
| 3.0x to 3.9x | 0 (0.0%) | 0 (0.0%) |
| 4.0x or more | 11 (100.0%) | 0 (0.0%) |
| Total | 11 (100.0%) | 39 (100.0%) |
Real Estate Taxes by Mortgage Status in Salvo
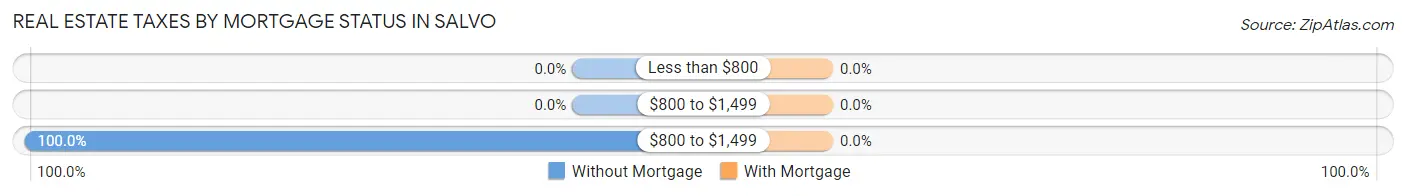
| Property Taxes | Without Mortgage | With Mortgage |
| Less than $800 | 0 (0.0%) | 0 (0.0%) |
| $800 to $1,499 | 0 (0.0%) | 0 (0.0%) |
| $800 to $1,499 | 11 (100.0%) | 0 (0.0%) |
| Total | 11 (100.0%) | 39 (100.0%) |
Health & Disability in Salvo
Health Insurance Coverage by Age in Salvo
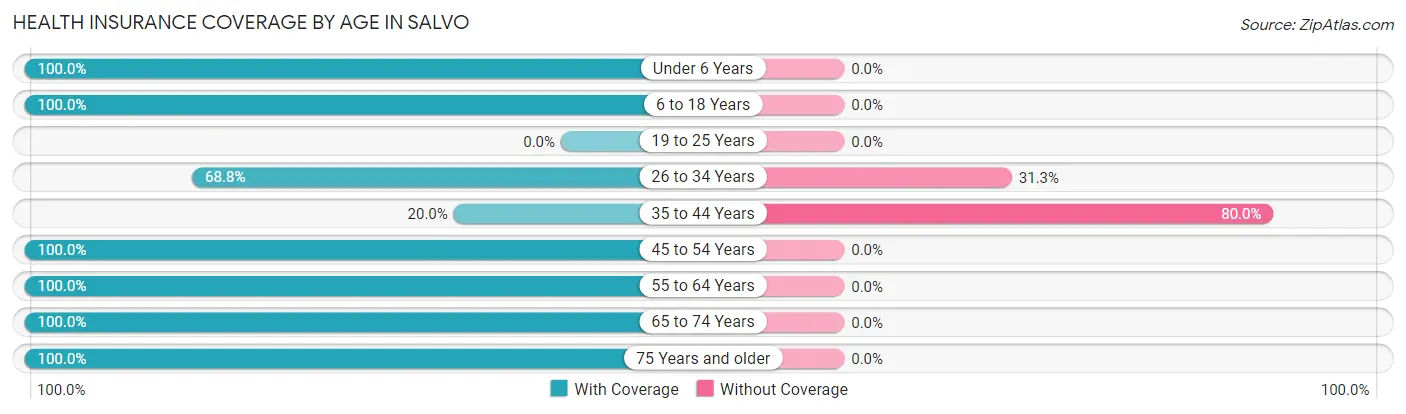
| Age Bracket | With Coverage | Without Coverage |
| Under 6 Years | 38 (100.0%) | 0 (0.0%) |
| 6 to 18 Years | 11 (100.0%) | 0 (0.0%) |
| 19 to 25 Years | 0 (0.0%) | 0 (0.0%) |
| 26 to 34 Years | 22 (68.8%) | 10 (31.2%) |
| 35 to 44 Years | 9 (20.0%) | 36 (80.0%) |
| 45 to 54 Years | 31 (100.0%) | 0 (0.0%) |
| 55 to 64 Years | 18 (100.0%) | 0 (0.0%) |
| 65 to 74 Years | 17 (100.0%) | 0 (0.0%) |
| 75 Years and older | 9 (100.0%) | 0 (0.0%) |
| Total | 155 (77.1%) | 46 (22.9%) |
Health Insurance Coverage by Citizenship Status in Salvo
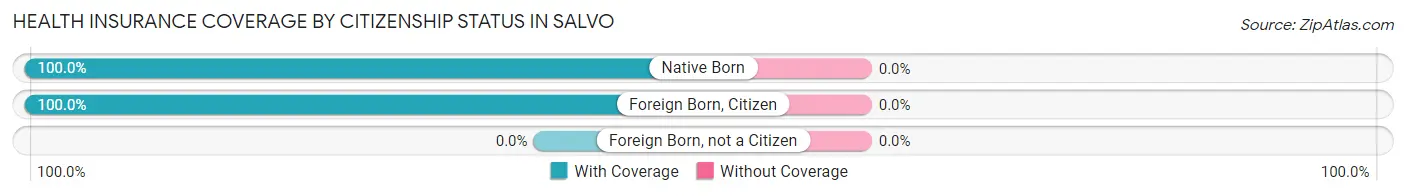
| Citizenship Status | With Coverage | Without Coverage |
| Native Born | 38 (100.0%) | 0 (0.0%) |
| Foreign Born, Citizen | 11 (100.0%) | 0 (0.0%) |
| Foreign Born, not a Citizen | 0 (0.0%) | 0 (0.0%) |
Health Insurance Coverage by Household Income in Salvo
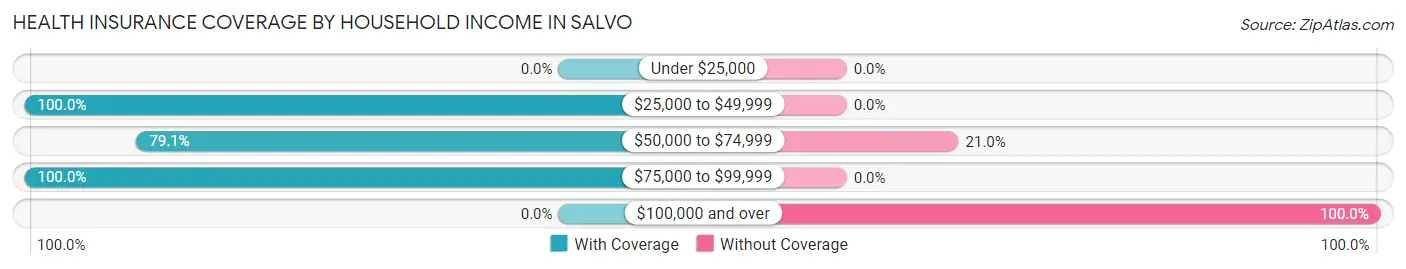
| Household Income | With Coverage | Without Coverage |
| Under $25,000 | 0 (0.0%) | 0 (0.0%) |
| $25,000 to $49,999 | 37 (100.0%) | 0 (0.0%) |
| $50,000 to $74,999 | 83 (79.0%) | 22 (20.9%) |
| $75,000 to $99,999 | 35 (100.0%) | 0 (0.0%) |
| $100,000 and over | 0 (0.0%) | 24 (100.0%) |
Public vs Private Health Insurance Coverage by Age in Salvo
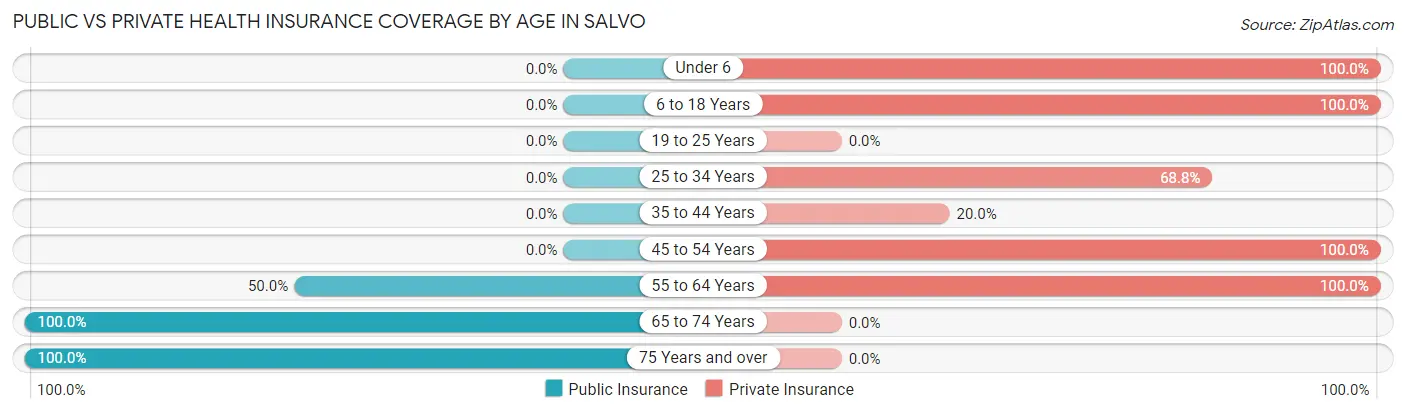
| Age Bracket | Public Insurance | Private Insurance |
| Under 6 | 0 (0.0%) | 38 (100.0%) |
| 6 to 18 Years | 0 (0.0%) | 11 (100.0%) |
| 19 to 25 Years | 0 (0.0%) | 0 (0.0%) |
| 25 to 34 Years | 0 (0.0%) | 22 (68.8%) |
| 35 to 44 Years | 0 (0.0%) | 9 (20.0%) |
| 45 to 54 Years | 0 (0.0%) | 31 (100.0%) |
| 55 to 64 Years | 9 (50.0%) | 18 (100.0%) |
| 65 to 74 Years | 17 (100.0%) | 0 (0.0%) |
| 75 Years and over | 9 (100.0%) | 0 (0.0%) |
| Total | 35 (17.4%) | 129 (64.2%) |
Disability Status by Sex by Age in Salvo
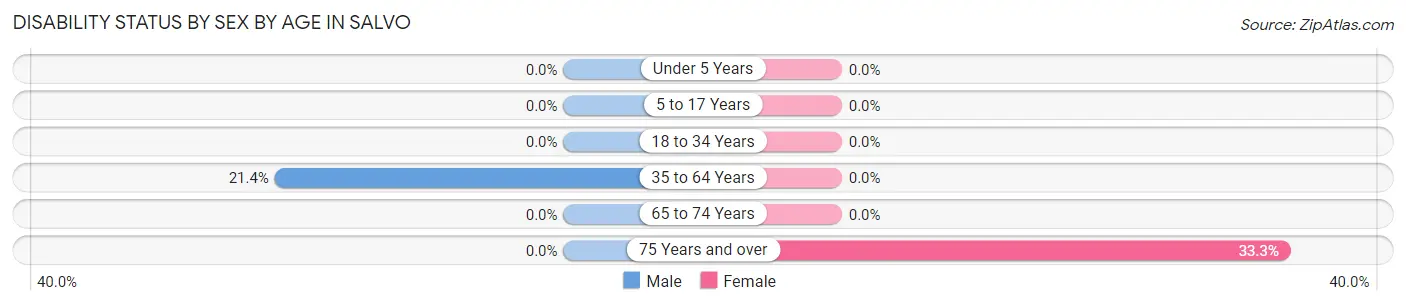
| Age Bracket | Male | Female |
| Under 5 Years | 0 (0.0%) | 0 (0.0%) |
| 5 to 17 Years | 0 (0.0%) | 0 (0.0%) |
| 18 to 34 Years | 0 (0.0%) | 0 (0.0%) |
| 35 to 64 Years | 9 (21.4%) | 0 (0.0%) |
| 65 to 74 Years | 0 (0.0%) | 0 (0.0%) |
| 75 Years and over | 0 (0.0%) | 3 (33.3%) |
Disability Class by Sex by Age in Salvo
Disability Class: Hearing Difficulty
| Age Bracket | Male | Female |
| Under 5 Years | 0 (0.0%) | 0 (0.0%) |
| 5 to 17 Years | 0 (0.0%) | 0 (0.0%) |
| 18 to 34 Years | 0 (0.0%) | 0 (0.0%) |
| 35 to 64 Years | 0 (0.0%) | 0 (0.0%) |
| 65 to 74 Years | 0 (0.0%) | 0 (0.0%) |
| 75 Years and over | 0 (0.0%) | 0 (0.0%) |
Disability Class: Vision Difficulty
| Age Bracket | Male | Female |
| Under 5 Years | 0 (0.0%) | 0 (0.0%) |
| 5 to 17 Years | 0 (0.0%) | 0 (0.0%) |
| 18 to 34 Years | 0 (0.0%) | 0 (0.0%) |
| 35 to 64 Years | 0 (0.0%) | 0 (0.0%) |
| 65 to 74 Years | 0 (0.0%) | 0 (0.0%) |
| 75 Years and over | 0 (0.0%) | 0 (0.0%) |
Disability Class: Cognitive Difficulty
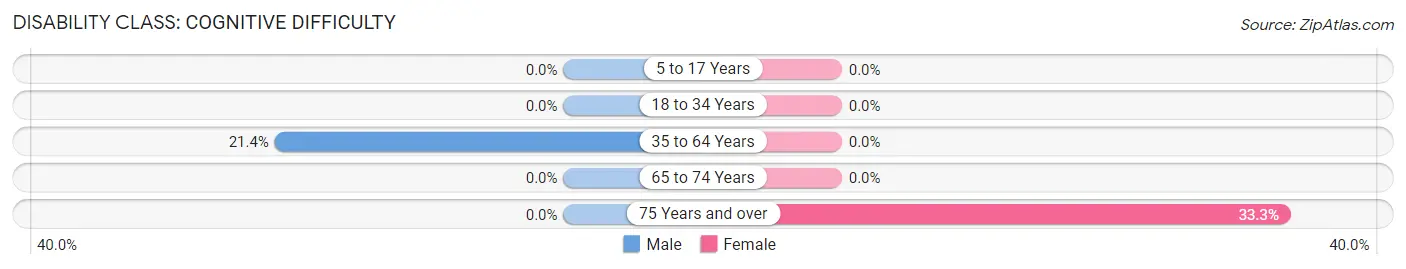
| Age Bracket | Male | Female |
| 5 to 17 Years | 0 (0.0%) | 0 (0.0%) |
| 18 to 34 Years | 0 (0.0%) | 0 (0.0%) |
| 35 to 64 Years | 9 (21.4%) | 0 (0.0%) |
| 65 to 74 Years | 0 (0.0%) | 0 (0.0%) |
| 75 Years and over | 0 (0.0%) | 3 (33.3%) |
Disability Class: Ambulatory Difficulty
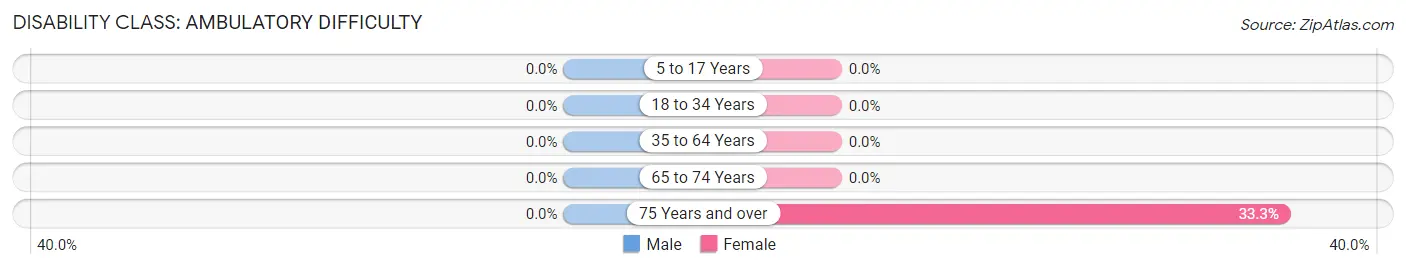
| Age Bracket | Male | Female |
| 5 to 17 Years | 0 (0.0%) | 0 (0.0%) |
| 18 to 34 Years | 0 (0.0%) | 0 (0.0%) |
| 35 to 64 Years | 0 (0.0%) | 0 (0.0%) |
| 65 to 74 Years | 0 (0.0%) | 0 (0.0%) |
| 75 Years and over | 0 (0.0%) | 3 (33.3%) |
Disability Class: Self-Care Difficulty
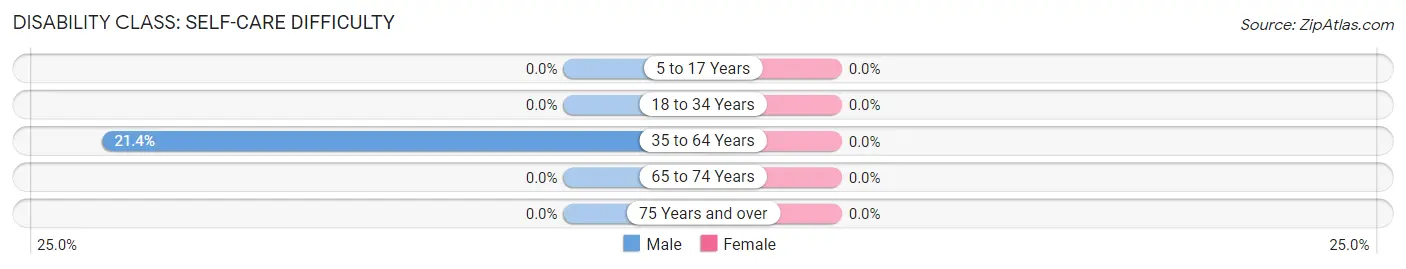
| Age Bracket | Male | Female |
| 5 to 17 Years | 0 (0.0%) | 0 (0.0%) |
| 18 to 34 Years | 0 (0.0%) | 0 (0.0%) |
| 35 to 64 Years | 9 (21.4%) | 0 (0.0%) |
| 65 to 74 Years | 0 (0.0%) | 0 (0.0%) |
| 75 Years and over | 0 (0.0%) | 0 (0.0%) |
Technology Access in Salvo
Computing Device Access in Salvo
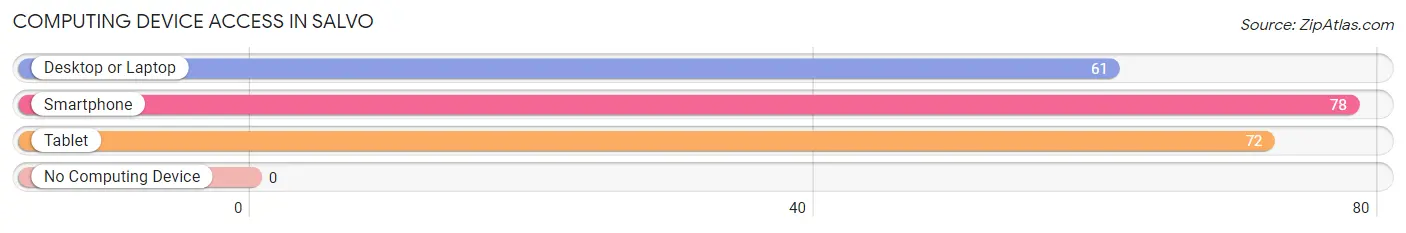
| Device Type | # Households | % Households |
| Desktop or Laptop | 61 | 78.2% |
| Smartphone | 78 | 100.0% |
| Tablet | 72 | 92.3% |
| No Computing Device | 0 | 0.0% |
| Total | 78 | 100.0% |
Internet Access in Salvo
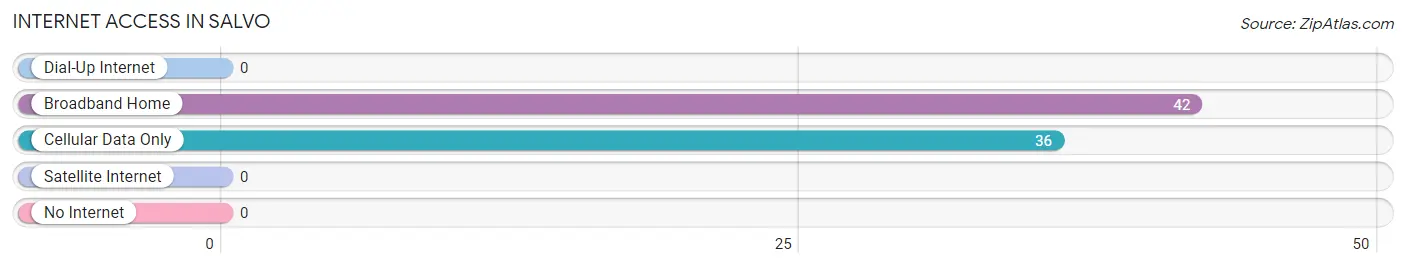
| Internet Type | # Households | % Households |
| Dial-Up Internet | 0 | 0.0% |
| Broadband Home | 42 | 53.8% |
| Cellular Data Only | 36 | 46.2% |
| Satellite Internet | 0 | 0.0% |
| No Internet | 0 | 0.0% |
| Total | 78 | 100.0% |
Salvo Summary
Salvo, North Carolina is a small unincorporated community located in Dare County on the Outer Banks of North Carolina. It is part of the Kill Devil Hills Micropolitan Statistical Area. The population of Salvo was estimated to be around 500 in 2000.
Geography
Salvo is located on the northern end of Hatteras Island, which is part of the Outer Banks of North Carolina. It is bordered by the Atlantic Ocean to the east and the Pamlico Sound to the west. The town is situated between the towns of Rodanthe and Avon. Salvo is approximately 25 miles south of Nags Head and 40 miles north of Ocracoke.
The town is located on a narrow strip of land between the ocean and the sound. The land is mostly flat and is composed of sand and marsh. The area is prone to flooding and is subject to strong winds and storms from the Atlantic Ocean.
History
Salvo was first settled in the late 19th century by fishermen and farmers. The town was originally known as “Salvo’s Landing” and was named after a local fisherman, John Salvo. The town was incorporated in 1911 and was primarily a fishing and farming community.
In the early 20th century, Salvo became a popular tourist destination. The town was home to several hotels and resorts, as well as a number of fishing and hunting lodges. The town was also home to a number of commercial fishing operations.
In the 1950s, Salvo began to experience a decline in its economy. The town’s population began to decline as people moved away in search of better economic opportunities. In the late 1970s, the town was hit hard by Hurricane Belle, which caused extensive damage to the town’s infrastructure.
Economy
The economy of Salvo is largely based on tourism. The town is home to several hotels and resorts, as well as a number of fishing and hunting lodges. The town is also home to a number of commercial fishing operations.
The town is also home to a number of small businesses, including restaurants, convenience stores, and gift shops. The town is also home to a number of art galleries and craft stores.
Demographics
The population of Salvo was estimated to be around 500 in 2000. The town is predominantly white, with a small African American population. The median household income in Salvo is $41,250, which is slightly lower than the national average.
Conclusion
Salvo, North Carolina is a small unincorporated community located in Dare County on the Outer Banks of North Carolina. It is part of the Kill Devil Hills Micropolitan Statistical Area. The town is predominantly white, with a small African American population. The economy of Salvo is largely based on tourism, with a number of hotels and resorts, as well as a number of fishing and hunting lodges. The town is also home to a number of small businesses, including restaurants, convenience stores, and gift shops. The town is also home to a number of art galleries and craft stores.
Common Questions
What is Per Capita Income in Salvo?
Per Capita income in Salvo is $33,923.
What is the Median Family Income in Salvo?
Median Family Income in Salvo is $61,534.
What is the Median Household income in Salvo?
Median Household Income in Salvo is $62,159.
What is Inequality or Gini Index in Salvo?
Inequality or Gini Index in Salvo is 0.27.
What is the Total Population of Salvo?
Total Population of Salvo is 201.
What is the Total Male Population of Salvo?
Total Male Population of Salvo is 90.
What is the Total Female Population of Salvo?
Total Female Population of Salvo is 111.
What is the Ratio of Males per 100 Females in Salvo?
There are 81.08 Males per 100 Females in Salvo.
What is the Ratio of Females per 100 Males in Salvo?
There are 123.33 Females per 100 Males in Salvo.
What is the Median Population Age in Salvo?
Median Population Age in Salvo is 35.9 Years.
What is the Average Family Size in Salvo
Average Family Size in Salvo is 3.2 People.
What is the Average Household Size in Salvo
Average Household Size in Salvo is 2.6 People.
How Large is the Labor Force in Salvo?
There are 114 People in the Labor Forcein in Salvo.
What is the Percentage of People in the Labor Force in Salvo?
75.0% of People are in the Labor Force in Salvo.