Sausalito, CA Map & Demographics
Sausalito Map
Sausalito Overview
$125,046
PER CAPITA INCOME
$238,284
AVG FAMILY INCOME
$163,170
AVG HOUSEHOLD INCOME
29.2%
WAGE / INCOME GAP [ % ]
70.8¢/ $1
WAGE / INCOME GAP [ $ ]
0.49
INEQUALITY / GINI INDEX
7,233
TOTAL POPULATION
3,091
MALE POPULATION
4,142
FEMALE POPULATION
74.63
MALES / 100 FEMALES
134.00
FEMALES / 100 MALES
54.4
MEDIAN AGE
2.5
AVG FAMILY SIZE
1.8
AVG HOUSEHOLD SIZE
4,393
LABOR FORCE [ PEOPLE ]
65.6%
PERCENT IN LABOR FORCE
6.5%
UNEMPLOYMENT RATE
Sausalito Zip Codes
Sausalito Area Codes
Income in Sausalito
Income Overview in Sausalito
Per Capita Income in Sausalito is $125,046, while median incomes of families and households are $238,284 and $163,170 respectively.
| Characteristic | Number | Measure |
| Per Capita Income | 7,233 | $125,046 |
| Median Family Income | 1,573 | $238,284 |
| Mean Family Income | 1,573 | $305,626 |
| Median Household Income | 4,057 | $163,170 |
| Mean Household Income | 4,057 | $219,777 |
| Income Deficit | 1,573 | $0 |
| Wage / Income Gap (%) | 7,233 | 29.19% |
| Wage / Income Gap ($) | 7,233 | 70.81¢ per $1 |
| Gini / Inequality Index | 7,233 | 0.49 |
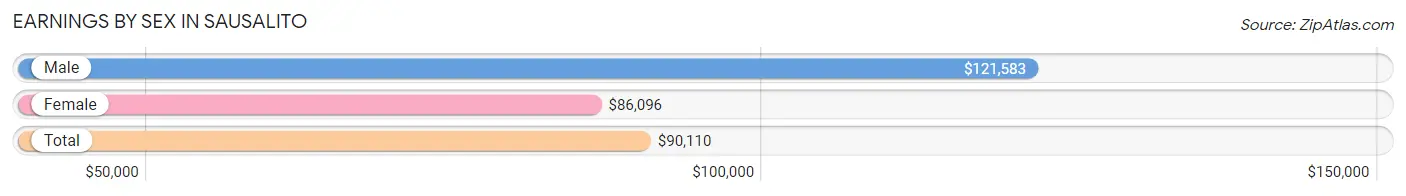
Earnings by Sex in Sausalito
Average Earnings in Sausalito are $90,110, $121,583 for men and $86,096 for women, a difference of 29.2%.
| Sex | Number | Average Earnings |
| Male | 2,115 (46.7%) | $121,583 |
| Female | 2,418 (53.3%) | $86,096 |
| Total | 4,533 (100.0%) | $90,110 |
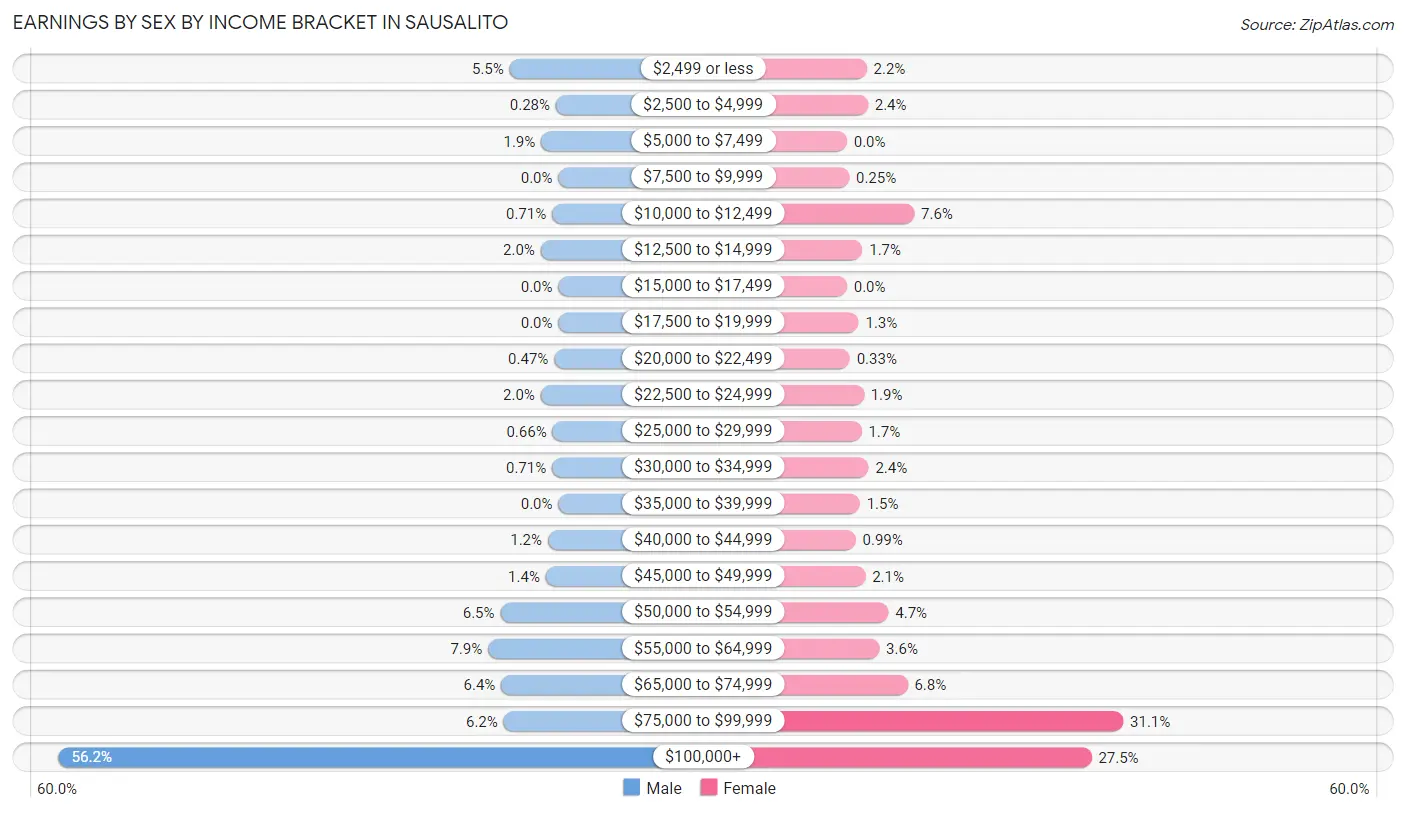
Earnings by Sex by Income Bracket in Sausalito
The most common earnings brackets in Sausalito are $100,000+ for men (1,188 | 56.2%) and $75,000 to $99,999 for women (751 | 31.1%).
| Income | Male | Female |
| $2,499 or less | 116 (5.5%) | 54 (2.2%) |
| $2,500 to $4,999 | 6 (0.3%) | 57 (2.4%) |
| $5,000 to $7,499 | 41 (1.9%) | 0 (0.0%) |
| $7,500 to $9,999 | 0 (0.0%) | 6 (0.3%) |
| $10,000 to $12,499 | 15 (0.7%) | 183 (7.6%) |
| $12,500 to $14,999 | 42 (2.0%) | 42 (1.7%) |
| $15,000 to $17,499 | 0 (0.0%) | 0 (0.0%) |
| $17,500 to $19,999 | 0 (0.0%) | 32 (1.3%) |
| $20,000 to $22,499 | 10 (0.5%) | 8 (0.3%) |
| $22,500 to $24,999 | 42 (2.0%) | 46 (1.9%) |
| $25,000 to $29,999 | 14 (0.7%) | 40 (1.7%) |
| $30,000 to $34,999 | 15 (0.7%) | 59 (2.4%) |
| $35,000 to $39,999 | 0 (0.0%) | 35 (1.5%) |
| $40,000 to $44,999 | 25 (1.2%) | 24 (1.0%) |
| $45,000 to $49,999 | 30 (1.4%) | 50 (2.1%) |
| $50,000 to $54,999 | 138 (6.5%) | 113 (4.7%) |
| $55,000 to $64,999 | 167 (7.9%) | 88 (3.6%) |
| $65,000 to $74,999 | 136 (6.4%) | 165 (6.8%) |
| $75,000 to $99,999 | 130 (6.1%) | 751 (31.1%) |
| $100,000+ | 1,188 (56.2%) | 665 (27.5%) |
| Total | 2,115 (100.0%) | 2,418 (100.0%) |
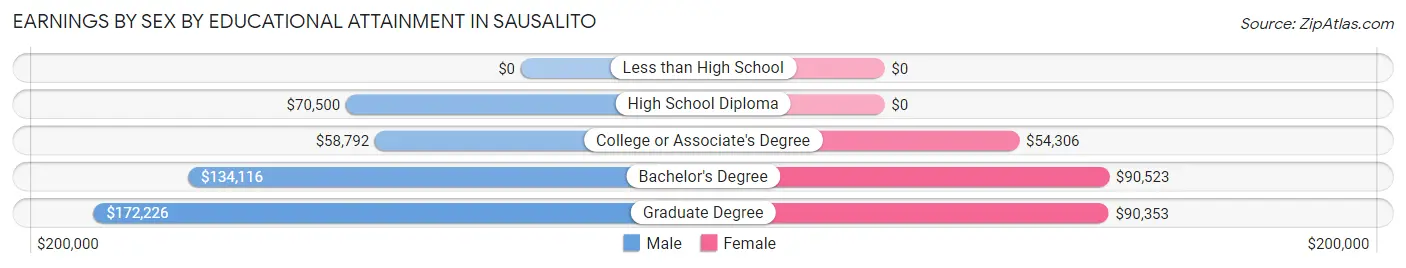
Earnings by Sex by Educational Attainment in Sausalito
Average earnings in Sausalito are $131,711 for men and $86,337 for women, a difference of 34.4%. Men with an educational attainment of graduate degree enjoy the highest average annual earnings of $172,226, while those with college or associate's degree education earn the least with $58,792. Women with an educational attainment of bachelor's degree earn the most with the average annual earnings of $90,523, while those with college or associate's degree education have the smallest earnings of $54,306.
| Educational Attainment | Male Income | Female Income |
| Less than High School | - | - |
| High School Diploma | $70,500 | $0 |
| College or Associate's Degree | $58,792 | $54,306 |
| Bachelor's Degree | $134,116 | $90,523 |
| Graduate Degree | $172,226 | $90,353 |
| Total | $131,711 | $86,337 |
Family Income in Sausalito
Family Income Brackets in Sausalito
According to the Sausalito family income data, there are 892 families falling into the $200,000+ income range, which is the most common income bracket and makes up 56.7% of all families.
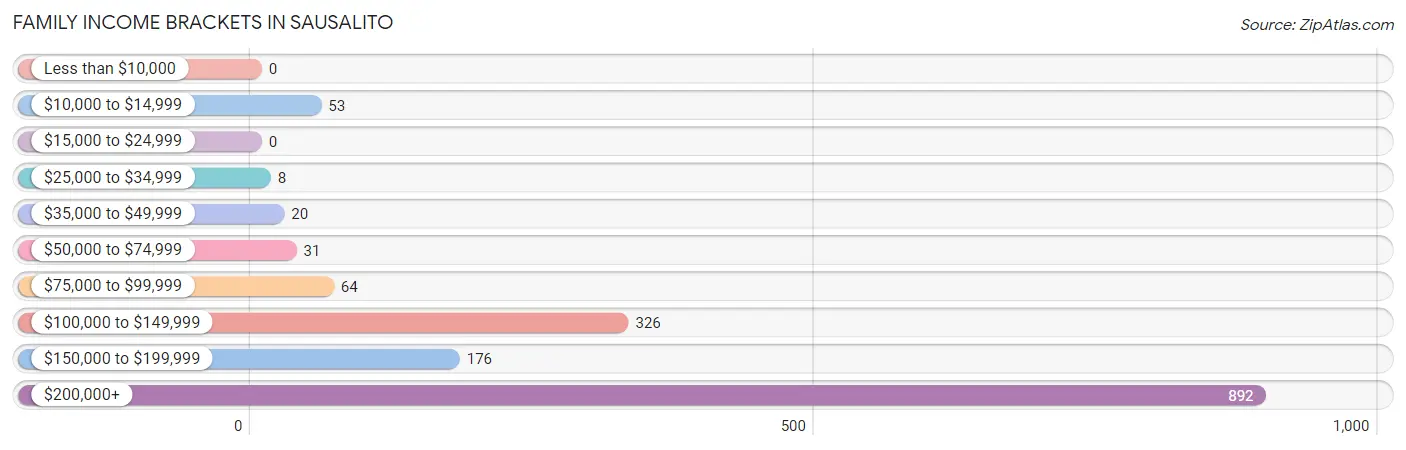
| Income Bracket | # Families | % Families |
| Less than $10,000 | 0 | 0.0% |
| $10,000 to $14,999 | 53 | 3.4% |
| $15,000 to $24,999 | 0 | 0.0% |
| $25,000 to $34,999 | 8 | 0.5% |
| $35,000 to $49,999 | 20 | 1.3% |
| $50,000 to $74,999 | 31 | 2.0% |
| $75,000 to $99,999 | 64 | 4.1% |
| $100,000 to $149,999 | 326 | 20.7% |
| $150,000 to $199,999 | 176 | 11.2% |
| $200,000+ | 892 | 56.7% |
Family Income by Famaliy Size in Sausalito
3-person families (107 | 6.8%) account for the highest median family income in Sausalito with $250,001 per family, while 2-person families (1,235 | 78.5%) have the highest median income of $108,325 per family member.
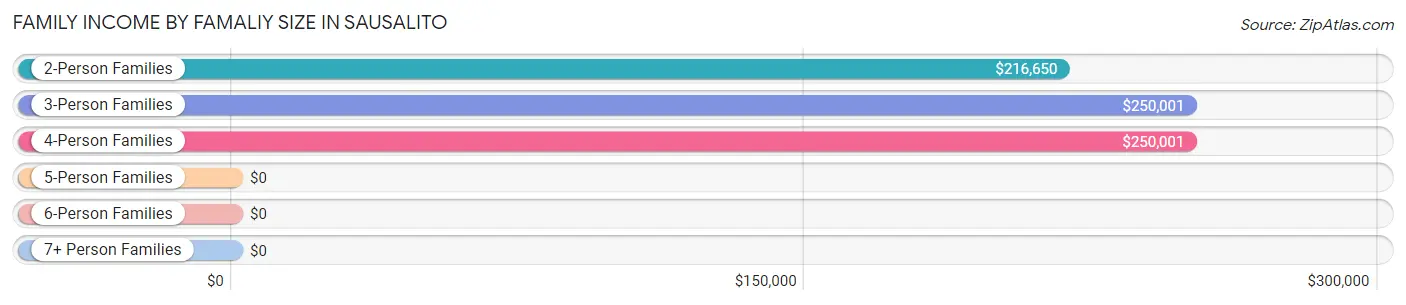
| Income Bracket | # Families | Median Income |
| 2-Person Families | 1,235 (78.5%) | $216,650 |
| 3-Person Families | 107 (6.8%) | $250,001 |
| 4-Person Families | 205 (13.0%) | $250,001 |
| 5-Person Families | 9 (0.6%) | $0 |
| 6-Person Families | 17 (1.1%) | $0 |
| 7+ Person Families | 0 (0.0%) | $0 |
| Total | 1,573 (100.0%) | $238,284 |
Family Income by Number of Earners in Sausalito
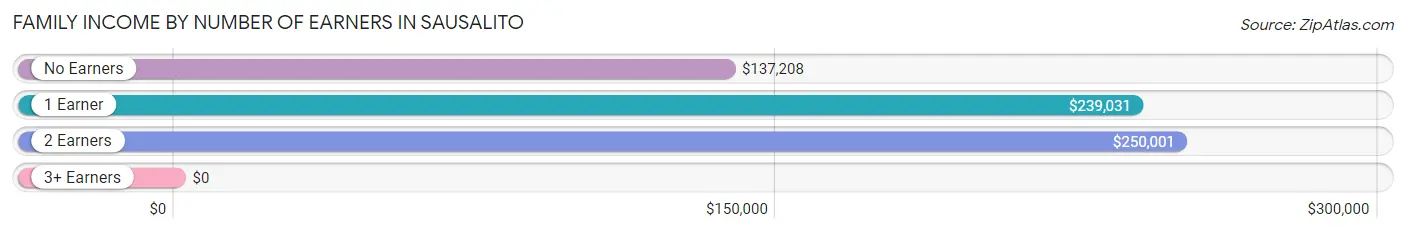
| Number of Earners | # Families | Median Income |
| No Earners | 232 (14.7%) | $137,208 |
| 1 Earner | 646 (41.1%) | $239,031 |
| 2 Earners | 675 (42.9%) | $250,001 |
| 3+ Earners | 20 (1.3%) | $0 |
| Total | 1,573 (100.0%) | $238,284 |
Household Income in Sausalito
Household Income Brackets in Sausalito
With 1,432 households falling in the category, the $200,000+ income range is the most frequent in Sausalito, accounting for 35.3% of all households. In contrast, only 93 households (2.3%) fall into the $15,000 to $24,999 income bracket, making it the least populous group.
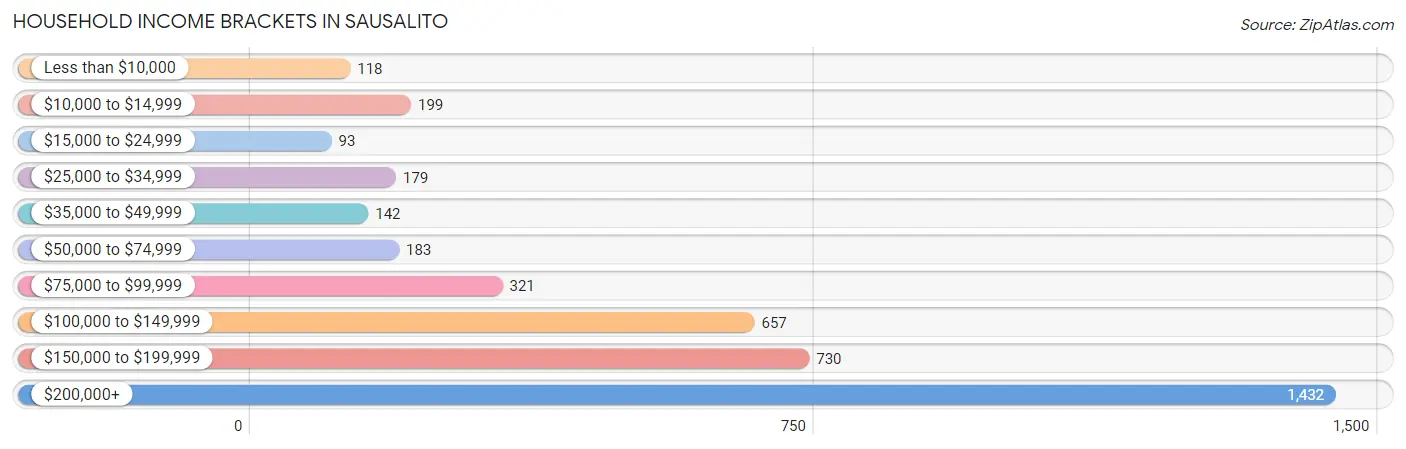
| Income Bracket | # Households | % Households |
| Less than $10,000 | 118 | 2.9% |
| $10,000 to $14,999 | 199 | 4.9% |
| $15,000 to $24,999 | 93 | 2.3% |
| $25,000 to $34,999 | 179 | 4.4% |
| $35,000 to $49,999 | 142 | 3.5% |
| $50,000 to $74,999 | 183 | 4.5% |
| $75,000 to $99,999 | 321 | 7.9% |
| $100,000 to $149,999 | 657 | 16.2% |
| $150,000 to $199,999 | 730 | 18.0% |
| $200,000+ | 1,432 | 35.3% |
Household Income by Householder Age in Sausalito
The median household income in Sausalito is $163,170, with the highest median household income of $193,684 found in the 25 to 44 years age bracket for the primary householder. A total of 1,096 households (27.0%) fall into this category.
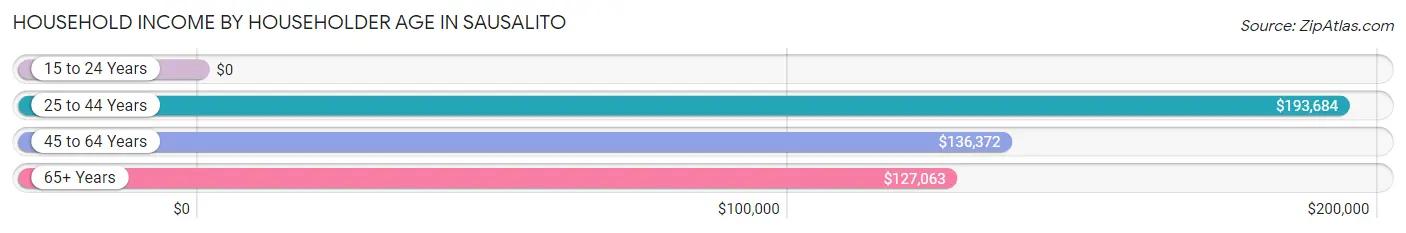
| Income Bracket | # Households | Median Income |
| 15 to 24 Years | 0 (0.0%) | $0 |
| 25 to 44 Years | 1,096 (27.0%) | $193,684 |
| 45 to 64 Years | 1,369 (33.7%) | $136,372 |
| 65+ Years | 1,592 (39.2%) | $127,063 |
| Total | 4,057 (100.0%) | $163,170 |
Poverty in Sausalito
Income Below Poverty by Sex and Age in Sausalito
With 4.5% poverty level for males and 10.0% for females among the residents of Sausalito, 65 to 74 year old males and 25 to 34 year old females are the most vulnerable to poverty, with 85 males (20.1%) and 129 females (24.2%) in their respective age groups living below the poverty level.
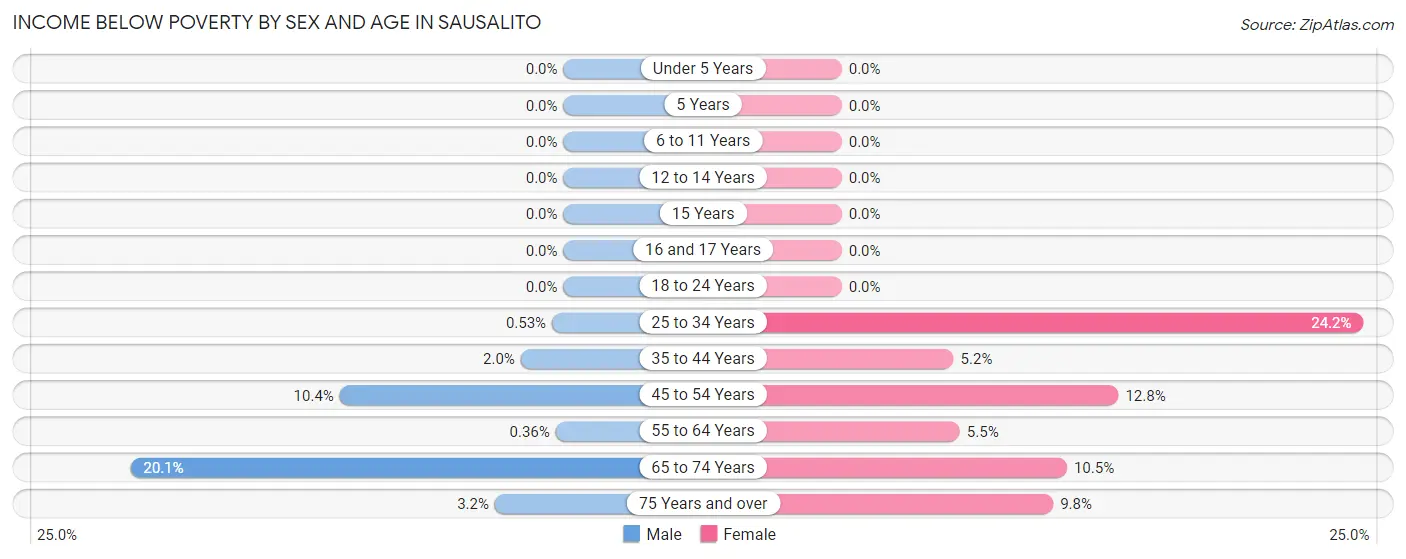
| Age Bracket | Male | Female |
| Under 5 Years | 0 (0.0%) | 0 (0.0%) |
| 5 Years | 0 (0.0%) | 0 (0.0%) |
| 6 to 11 Years | 0 (0.0%) | 0 (0.0%) |
| 12 to 14 Years | 0 (0.0%) | 0 (0.0%) |
| 15 Years | 0 (0.0%) | 0 (0.0%) |
| 16 and 17 Years | 0 (0.0%) | 0 (0.0%) |
| 18 to 24 Years | 0 (0.0%) | 0 (0.0%) |
| 25 to 34 Years | 3 (0.5%) | 129 (24.2%) |
| 35 to 44 Years | 9 (2.0%) | 21 (5.2%) |
| 45 to 54 Years | 27 (10.4%) | 75 (12.8%) |
| 55 to 64 Years | 2 (0.4%) | 37 (5.5%) |
| 65 to 74 Years | 85 (20.1%) | 99 (10.4%) |
| 75 Years and over | 13 (3.2%) | 53 (9.8%) |
| Total | 139 (4.5%) | 414 (10.0%) |
Income Above Poverty by Sex and Age in Sausalito
According to the poverty statistics in Sausalito, males aged under 5 years and females aged under 5 years are the age groups that are most secure financially, with 100.0% of males and 100.0% of females in these age groups living above the poverty line.
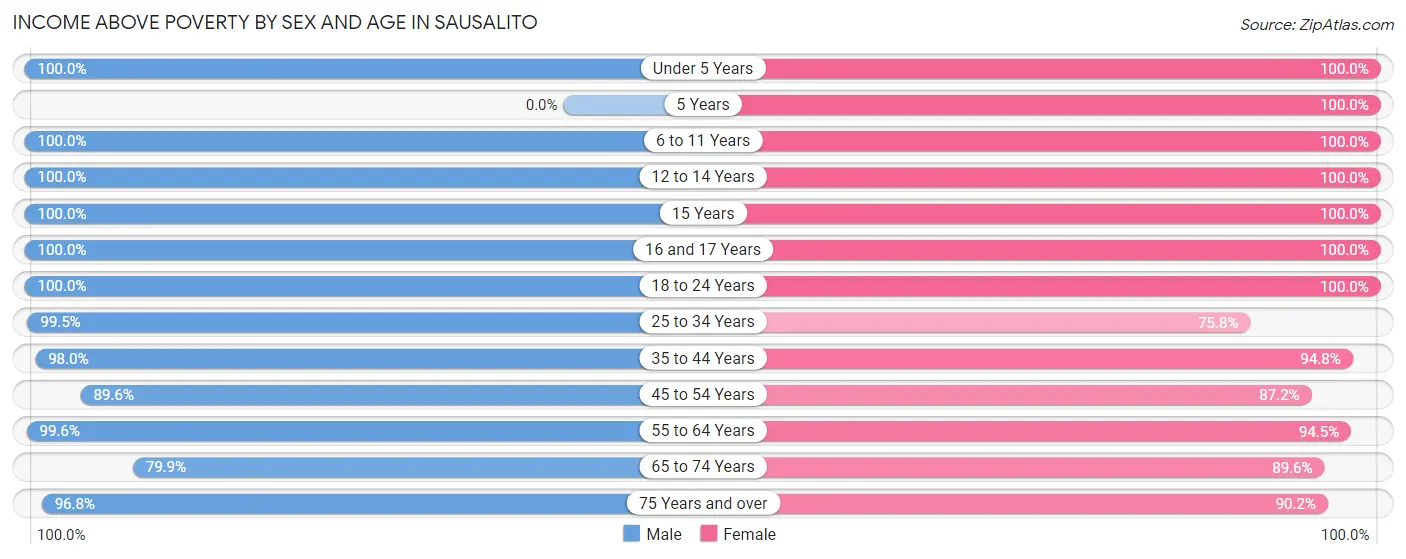
| Age Bracket | Male | Female |
| Under 5 Years | 86 (100.0%) | 121 (100.0%) |
| 5 Years | 0 (0.0%) | 22 (100.0%) |
| 6 to 11 Years | 110 (100.0%) | 84 (100.0%) |
| 12 to 14 Years | 23 (100.0%) | 44 (100.0%) |
| 15 Years | 8 (100.0%) | 22 (100.0%) |
| 16 and 17 Years | 17 (100.0%) | 15 (100.0%) |
| 18 to 24 Years | 176 (100.0%) | 139 (100.0%) |
| 25 to 34 Years | 561 (99.5%) | 404 (75.8%) |
| 35 to 44 Years | 445 (98.0%) | 384 (94.8%) |
| 45 to 54 Years | 233 (89.6%) | 509 (87.2%) |
| 55 to 64 Years | 553 (99.6%) | 638 (94.5%) |
| 65 to 74 Years | 338 (79.9%) | 848 (89.5%) |
| 75 Years and over | 396 (96.8%) | 487 (90.2%) |
| Total | 2,946 (95.5%) | 3,717 (90.0%) |
Income Below Poverty Among Married-Couple Families in Sausalito
The poverty statistics for married-couple families in Sausalito show that 4.1% or 54 of the total 1,313 families live below the poverty line. Families with no children have the highest poverty rate of 4.9%, comprising of 54 families. On the other hand, families with 1 or 2 children have the lowest poverty rate of 0.0%, which includes 0 families.
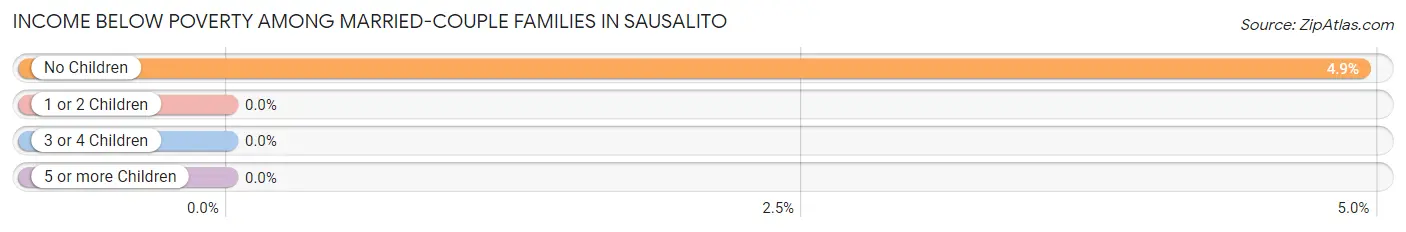
| Children | Above Poverty | Below Poverty |
| No Children | 1,041 (95.1%) | 54 (4.9%) |
| 1 or 2 Children | 218 (100.0%) | 0 (0.0%) |
| 3 or 4 Children | 0 (0.0%) | 0 (0.0%) |
| 5 or more Children | 0 (0.0%) | 0 (0.0%) |
| Total | 1,259 (95.9%) | 54 (4.1%) |
Income Below Poverty Among Single-Parent Households in Sausalito
| Children | Single Father | Single Mother |
| No Children | 0 (0.0%) | 0 (0.0%) |
| 1 or 2 Children | 0 (0.0%) | 0 (0.0%) |
| 3 or 4 Children | 0 (0.0%) | 0 (0.0%) |
| 5 or more Children | 0 (0.0%) | 0 (0.0%) |
| Total | 0 (0.0%) | 0 (0.0%) |
Income Below Poverty Among Married-Couple vs Single-Parent Households in Sausalito
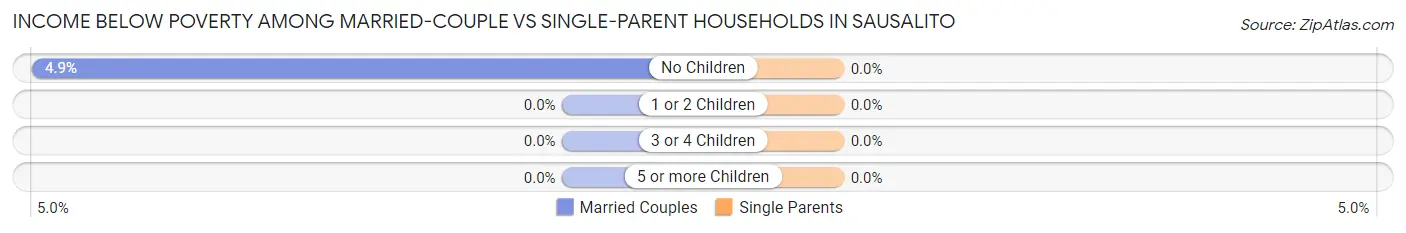
| Children | Married-Couple Families | Single-Parent Households |
| No Children | 54 (4.9%) | 0 (0.0%) |
| 1 or 2 Children | 0 (0.0%) | 0 (0.0%) |
| 3 or 4 Children | 0 (0.0%) | 0 (0.0%) |
| 5 or more Children | 0 (0.0%) | 0 (0.0%) |
| Total | 54 (4.1%) | 0 (0.0%) |
Race in Sausalito
The most populous races in Sausalito are White / Caucasian (6,207 | 85.8%), Hispanic or Latino (615 | 8.5%), and Asian (487 | 6.7%).
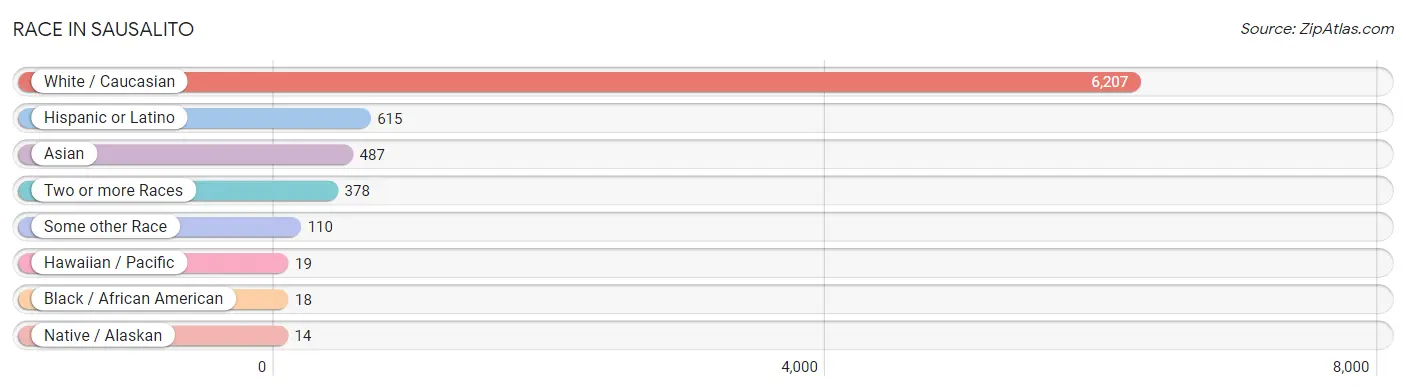
| Race | # Population | % Population |
| Asian | 487 | 6.7% |
| Black / African American | 18 | 0.3% |
| Hawaiian / Pacific | 19 | 0.3% |
| Hispanic or Latino | 615 | 8.5% |
| Native / Alaskan | 14 | 0.2% |
| White / Caucasian | 6,207 | 85.8% |
| Two or more Races | 378 | 5.2% |
| Some other Race | 110 | 1.5% |
| Total | 7,233 | 100.0% |
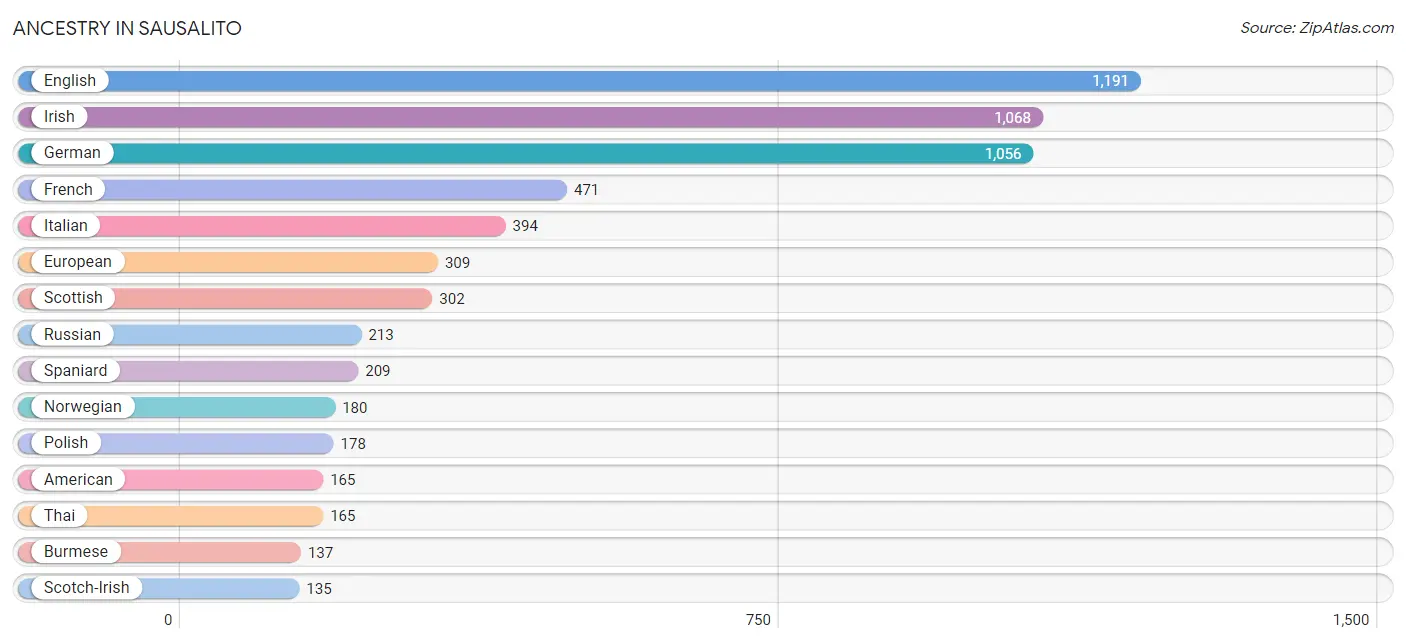
Ancestry in Sausalito
The most populous ancestries reported in Sausalito are English (1,191 | 16.5%), Irish (1,068 | 14.8%), German (1,056 | 14.6%), French (471 | 6.5%), and Italian (394 | 5.4%), together accounting for 57.8% of all Sausalito residents.
| Ancestry | # Population | % Population |
| American | 165 | 2.3% |
| Arab | 49 | 0.7% |
| Austrian | 44 | 0.6% |
| Belgian | 12 | 0.2% |
| Bhutanese | 53 | 0.7% |
| British | 115 | 1.6% |
| Burmese | 137 | 1.9% |
| Canadian | 36 | 0.5% |
| Central American | 4 | 0.1% |
| Colombian | 11 | 0.2% |
| Croatian | 11 | 0.2% |
| Czech | 29 | 0.4% |
| Danish | 20 | 0.3% |
| Dominican | 10 | 0.1% |
| Dutch | 132 | 1.8% |
| Eastern European | 98 | 1.3% |
| Ecuadorian | 16 | 0.2% |
| English | 1,191 | 16.5% |
| European | 309 | 4.3% |
| French | 471 | 6.5% |
| German | 1,056 | 14.6% |
| Greek | 46 | 0.6% |
| Honduran | 4 | 0.1% |
| Hungarian | 53 | 0.7% |
| Indian (Asian) | 81 | 1.1% |
| Irish | 1,068 | 14.8% |
| Israeli | 7 | 0.1% |
| Italian | 394 | 5.4% |
| Korean | 80 | 1.1% |
| Latvian | 7 | 0.1% |
| Lebanese | 22 | 0.3% |
| Lithuanian | 14 | 0.2% |
| Mexican | 100 | 1.4% |
| Mexican American Indian | 11 | 0.2% |
| Navajo | 25 | 0.4% |
| Northern European | 55 | 0.8% |
| Norwegian | 180 | 2.5% |
| Palestinian | 27 | 0.4% |
| Peruvian | 7 | 0.1% |
| Polish | 178 | 2.5% |
| Portuguese | 16 | 0.2% |
| Puerto Rican | 24 | 0.3% |
| Romanian | 7 | 0.1% |
| Russian | 213 | 2.9% |
| Scandinavian | 19 | 0.3% |
| Scotch-Irish | 135 | 1.9% |
| Scottish | 302 | 4.2% |
| Slovene | 9 | 0.1% |
| South American | 34 | 0.5% |
| Spaniard | 209 | 2.9% |
| Spanish American | 11 | 0.2% |
| Sri Lankan | 40 | 0.5% |
| Swedish | 121 | 1.7% |
| Swiss | 68 | 0.9% |
| Syrian | 22 | 0.3% |
| Thai | 165 | 2.3% |
| Ukrainian | 25 | 0.4% |
| Welsh | 67 | 0.9% | View All 58 Rows |
Immigrants in Sausalito
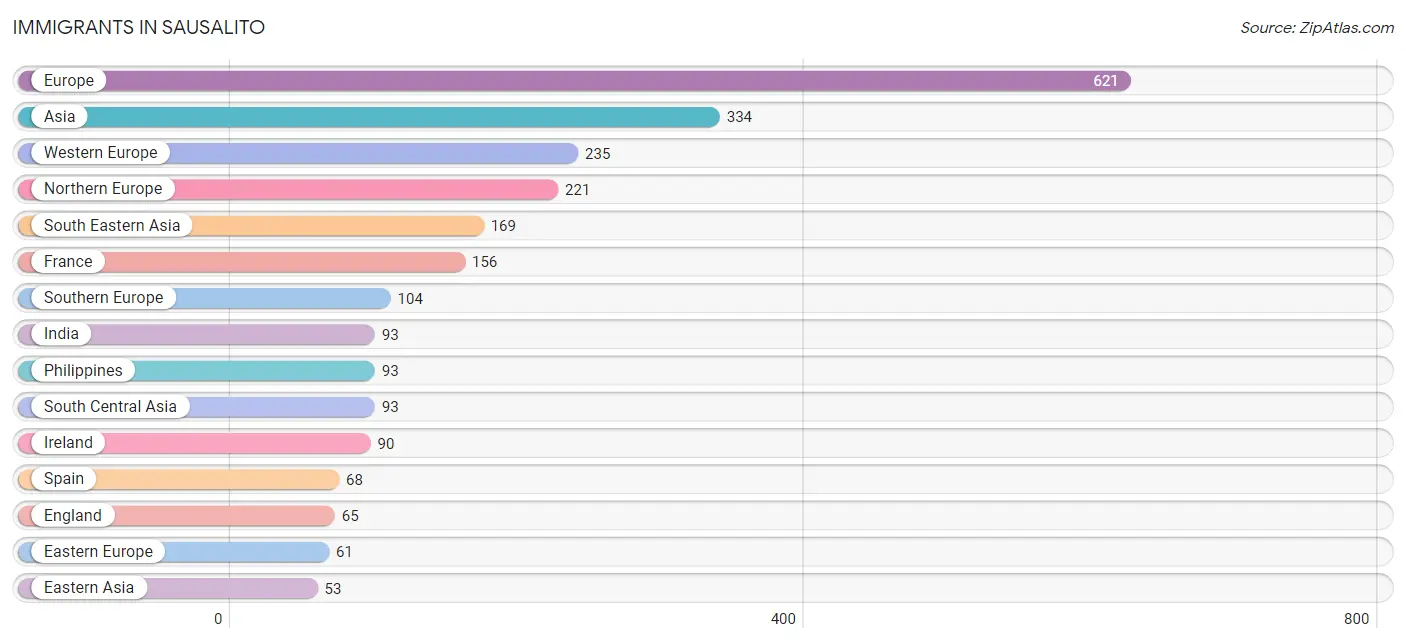
The most numerous immigrant groups reported in Sausalito came from Europe (621 | 8.6%), Asia (334 | 4.6%), Western Europe (235 | 3.3%), Northern Europe (221 | 3.1%), and South Eastern Asia (169 | 2.3%), together accounting for 21.9% of all Sausalito residents.
| Immigration Origin | # Population | % Population |
| Africa | 32 | 0.4% |
| Asia | 334 | 4.6% |
| Australia | 26 | 0.4% |
| Austria | 8 | 0.1% |
| Canada | 45 | 0.6% |
| Central America | 30 | 0.4% |
| China | 31 | 0.4% |
| Denmark | 2 | 0.0% |
| Eastern Asia | 53 | 0.7% |
| Eastern Europe | 61 | 0.8% |
| England | 65 | 0.9% |
| Europe | 621 | 8.6% |
| Fiji | 19 | 0.3% |
| France | 156 | 2.2% |
| Germany | 42 | 0.6% |
| Greece | 14 | 0.2% |
| Guatemala | 30 | 0.4% |
| Hungary | 17 | 0.2% |
| India | 93 | 1.3% |
| Ireland | 90 | 1.2% |
| Israel | 10 | 0.1% |
| Italy | 14 | 0.2% |
| Korea | 22 | 0.3% |
| Kuwait | 9 | 0.1% |
| Latin America | 37 | 0.5% |
| Malaysia | 38 | 0.5% |
| Netherlands | 29 | 0.4% |
| Nigeria | 14 | 0.2% |
| Northern Europe | 221 | 3.1% |
| Norway | 5 | 0.1% |
| Oceania | 45 | 0.6% |
| Peru | 7 | 0.1% |
| Philippines | 93 | 1.3% |
| Poland | 44 | 0.6% |
| Portugal | 8 | 0.1% |
| South Africa | 18 | 0.3% |
| South America | 7 | 0.1% |
| South Central Asia | 93 | 1.3% |
| South Eastern Asia | 169 | 2.3% |
| Southern Europe | 104 | 1.4% |
| Spain | 68 | 0.9% |
| Sweden | 44 | 0.6% |
| Vietnam | 38 | 0.5% |
| Western Africa | 14 | 0.2% |
| Western Asia | 19 | 0.3% |
| Western Europe | 235 | 3.3% | View All 46 Rows |
Sex and Age in Sausalito
Sex and Age in Sausalito
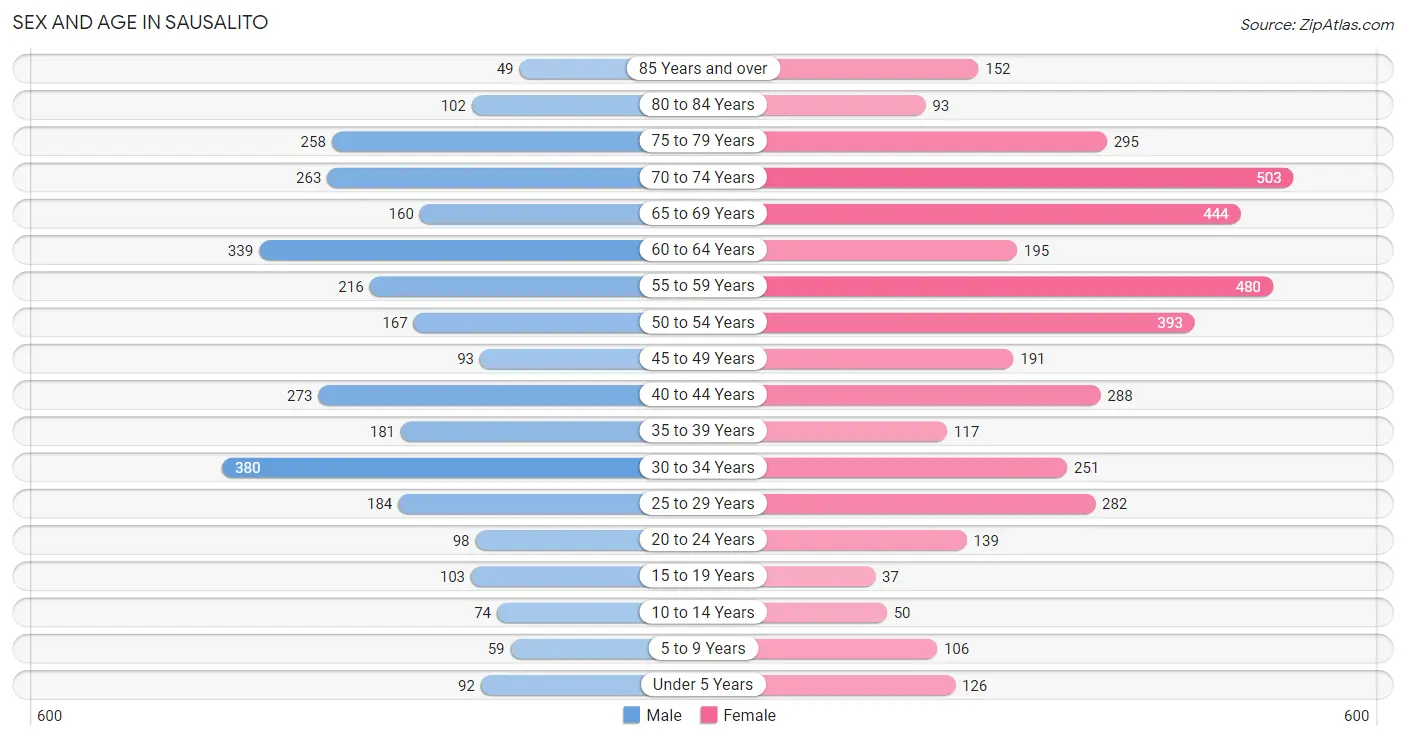
The most populous age groups in Sausalito are 30 to 34 Years (380 | 12.3%) for men and 70 to 74 Years (503 | 12.1%) for women.
| Age Bracket | Male | Female |
| Under 5 Years | 92 (3.0%) | 126 (3.0%) |
| 5 to 9 Years | 59 (1.9%) | 106 (2.6%) |
| 10 to 14 Years | 74 (2.4%) | 50 (1.2%) |
| 15 to 19 Years | 103 (3.3%) | 37 (0.9%) |
| 20 to 24 Years | 98 (3.2%) | 139 (3.4%) |
| 25 to 29 Years | 184 (5.9%) | 282 (6.8%) |
| 30 to 34 Years | 380 (12.3%) | 251 (6.1%) |
| 35 to 39 Years | 181 (5.9%) | 117 (2.8%) |
| 40 to 44 Years | 273 (8.8%) | 288 (7.0%) |
| 45 to 49 Years | 93 (3.0%) | 191 (4.6%) |
| 50 to 54 Years | 167 (5.4%) | 393 (9.5%) |
| 55 to 59 Years | 216 (7.0%) | 480 (11.6%) |
| 60 to 64 Years | 339 (11.0%) | 195 (4.7%) |
| 65 to 69 Years | 160 (5.2%) | 444 (10.7%) |
| 70 to 74 Years | 263 (8.5%) | 503 (12.1%) |
| 75 to 79 Years | 258 (8.4%) | 295 (7.1%) |
| 80 to 84 Years | 102 (3.3%) | 93 (2.2%) |
| 85 Years and over | 49 (1.6%) | 152 (3.7%) |
| Total | 3,091 (100.0%) | 4,142 (100.0%) |
Families and Households in Sausalito
Median Family Size in Sausalito
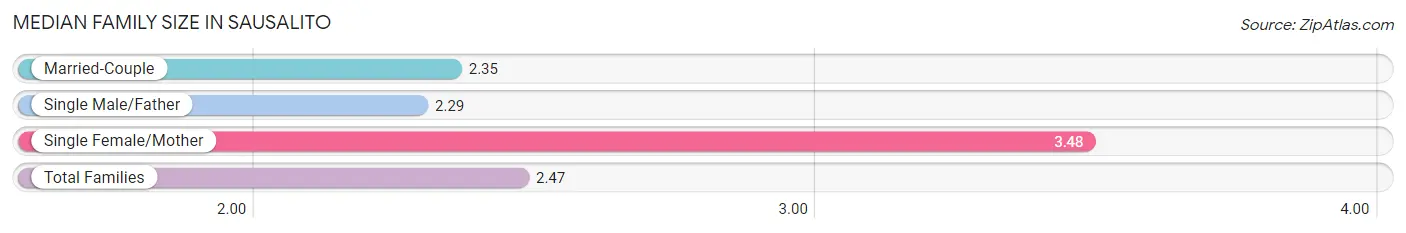
The median family size in Sausalito is 2.47 persons per family, with single female/mother families (170 | 10.8%) accounting for the largest median family size of 3.48 persons per family. On the other hand, single male/father families (90 | 5.7%) represent the smallest median family size with 2.29 persons per family.
| Family Type | # Families | Family Size |
| Married-Couple | 1,313 (83.5%) | 2.35 |
| Single Male/Father | 90 (5.7%) | 2.29 |
| Single Female/Mother | 170 (10.8%) | 3.48 |
| Total Families | 1,573 (100.0%) | 2.47 |
Median Household Size in Sausalito
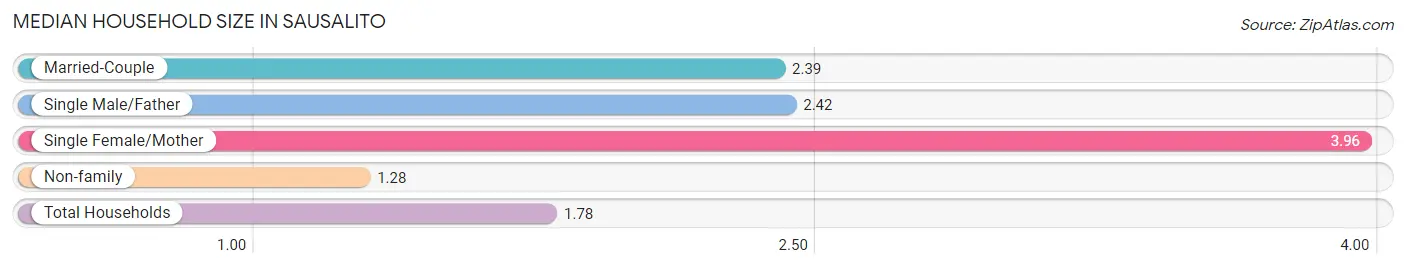
The median household size in Sausalito is 1.78 persons per household, with single female/mother households (170 | 4.2%) accounting for the largest median household size of 3.96 persons per household. non-family households (2,484 | 61.2%) represent the smallest median household size with 1.28 persons per household.
| Household Type | # Households | Household Size |
| Married-Couple | 1,313 (32.4%) | 2.39 |
| Single Male/Father | 90 (2.2%) | 2.42 |
| Single Female/Mother | 170 (4.2%) | 3.96 |
| Non-family | 2,484 (61.2%) | 1.28 |
| Total Households | 4,057 (100.0%) | 1.78 |
Household Size by Marriage Status in Sausalito
Out of a total of 4,057 households in Sausalito, 1,573 (38.8%) are family households, while 2,484 (61.2%) are nonfamily households. The most numerous type of family households are 2-person households, comprising 1,192, and the most common type of nonfamily households are 1-person households, comprising 1,907.
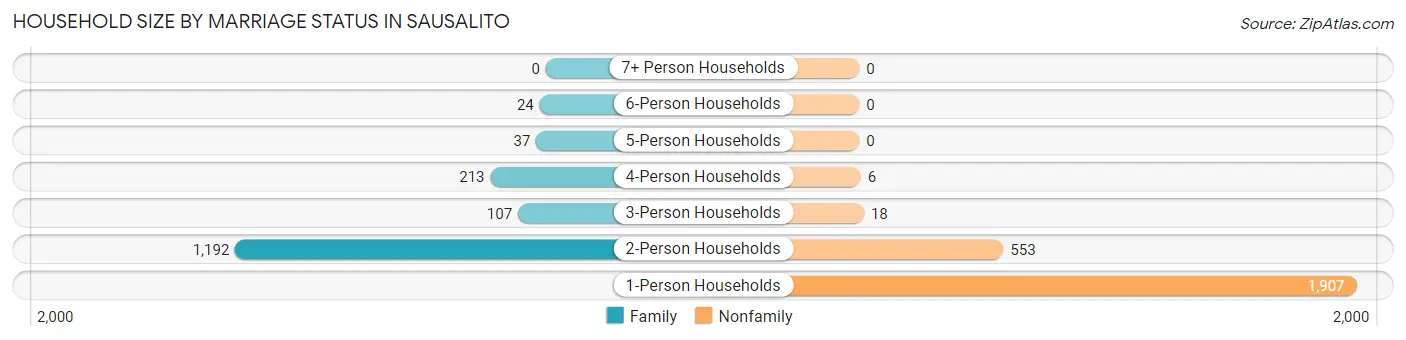
| Household Size | Family Households | Nonfamily Households |
| 1-Person Households | - | 1,907 (47.0%) |
| 2-Person Households | 1,192 (29.4%) | 553 (13.6%) |
| 3-Person Households | 107 (2.6%) | 18 (0.4%) |
| 4-Person Households | 213 (5.2%) | 6 (0.2%) |
| 5-Person Households | 37 (0.9%) | 0 (0.0%) |
| 6-Person Households | 24 (0.6%) | 0 (0.0%) |
| 7+ Person Households | 0 (0.0%) | 0 (0.0%) |
| Total | 1,573 (38.8%) | 2,484 (61.2%) |
Female Fertility in Sausalito
Fertility by Age in Sausalito
Average fertility rate in Sausalito is 55.0 births per 1,000 women. Women in the age bracket of 35 to 50 years have the highest fertility rate with 112.0 births per 1,000 women. Women in the age bracket of 35 to 50 years acount for 100.0% of all women with births.
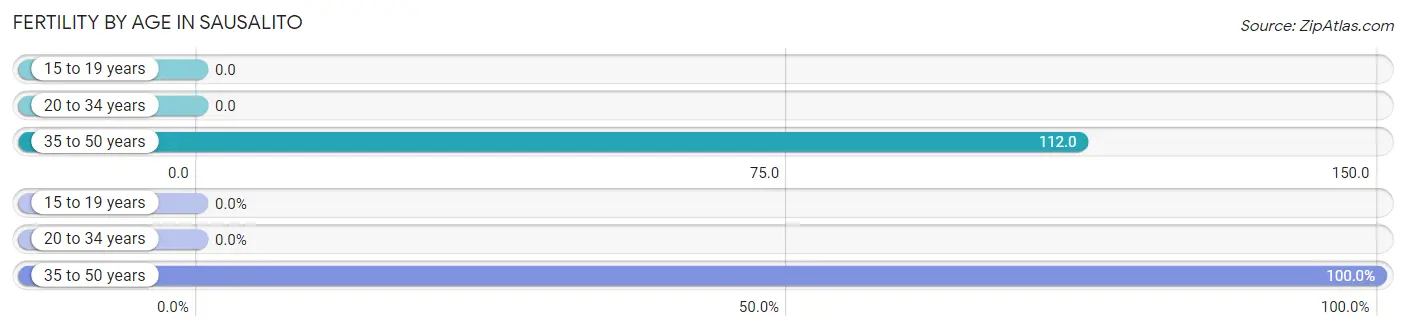
| Age Bracket | Women with Births | Births / 1,000 Women |
| 15 to 19 years | 0 (0.0%) | 0.0 |
| 20 to 34 years | 0 (0.0%) | 0.0 |
| 35 to 50 years | 75 (100.0%) | 112.0 |
| Total | 75 (100.0%) | 55.0 |
Fertility by Age by Marriage Status in Sausalito
86.7% of women with births (75) in Sausalito are married. The highest percentage of unmarried women with births falls into 35 to 50 years age bracket with 13.3% of them unmarried at the time of birth, while the lowest percentage of unmarried women with births belong to 35 to 50 years age bracket with 13.3% of them unmarried.
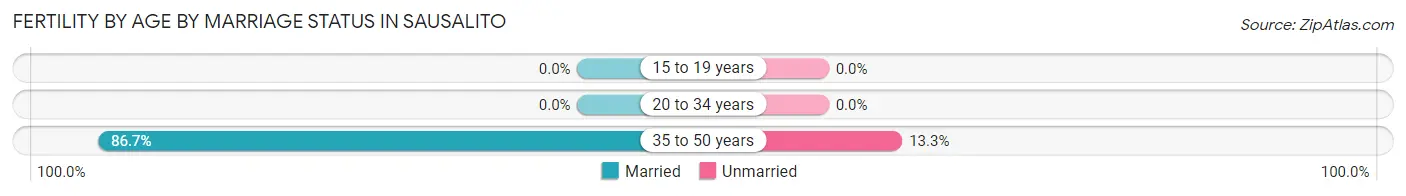
| Age Bracket | Married | Unmarried |
| 15 to 19 years | 0 (0.0%) | 0 (0.0%) |
| 20 to 34 years | 0 (0.0%) | 0 (0.0%) |
| 35 to 50 years | 65 (86.7%) | 10 (13.3%) |
| Total | 65 (86.7%) | 10 (13.3%) |
Fertility by Education in Sausalito
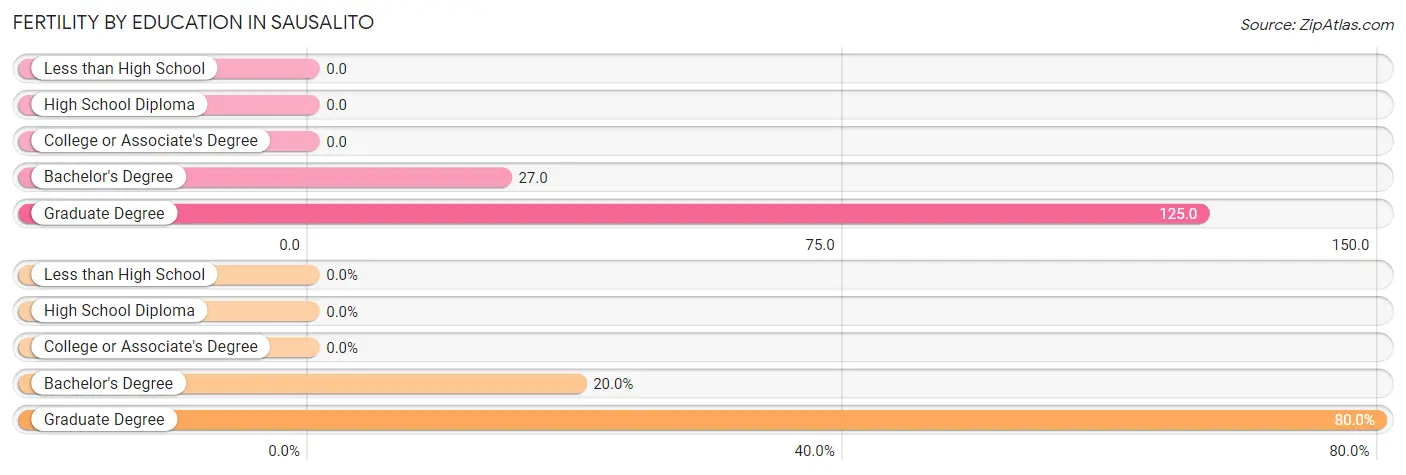
| Educational Attainment | Women with Births | Births / 1,000 Women |
| Less than High School | 0 (0.0%) | 0.0 |
| High School Diploma | 0 (0.0%) | 0.0 |
| College or Associate's Degree | 0 (0.0%) | 0.0 |
| Bachelor's Degree | 15 (20.0%) | 27.0 |
| Graduate Degree | 60 (80.0%) | 125.0 |
| Total | 75 (100.0%) | 55.0 |
Fertility by Education by Marriage Status in Sausalito
13.3% of women with births in Sausalito are unmarried. Women with the educational attainment of bachelor's degree are most likely to be married with 100.0% of them married at childbirth, while women with the educational attainment of graduate degree are least likely to be married with 16.7% of them unmarried at childbirth.
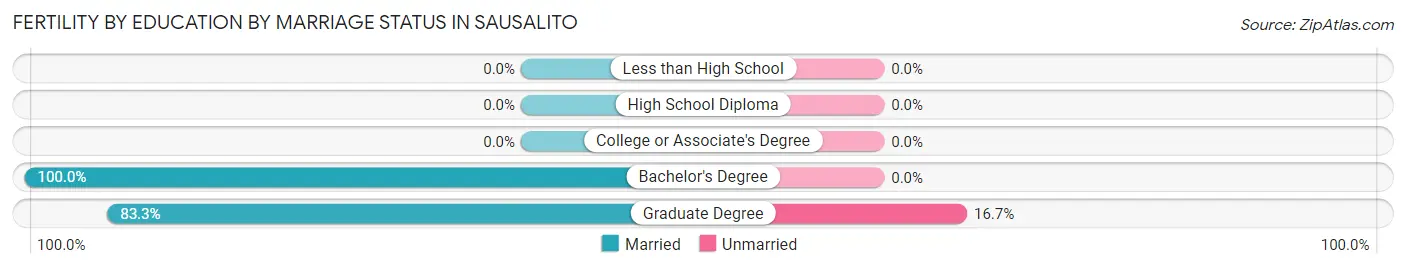
| Educational Attainment | Married | Unmarried |
| Less than High School | 0 (0.0%) | 0 (0.0%) |
| High School Diploma | 0 (0.0%) | 0 (0.0%) |
| College or Associate's Degree | 0 (0.0%) | 0 (0.0%) |
| Bachelor's Degree | 15 (100.0%) | 0 (0.0%) |
| Graduate Degree | 50 (83.3%) | 10 (16.7%) |
| Total | 65 (86.7%) | 10 (13.3%) |
Employment Characteristics in Sausalito
Employment by Class of Employer in Sausalito
Among the 4,032 employed individuals in Sausalito, private company employees (2,765 | 68.6%), self-employed (not incorporated) (596 | 14.8%), and self-employed (incorporated) (429 | 10.6%) make up the most common classes of employment.
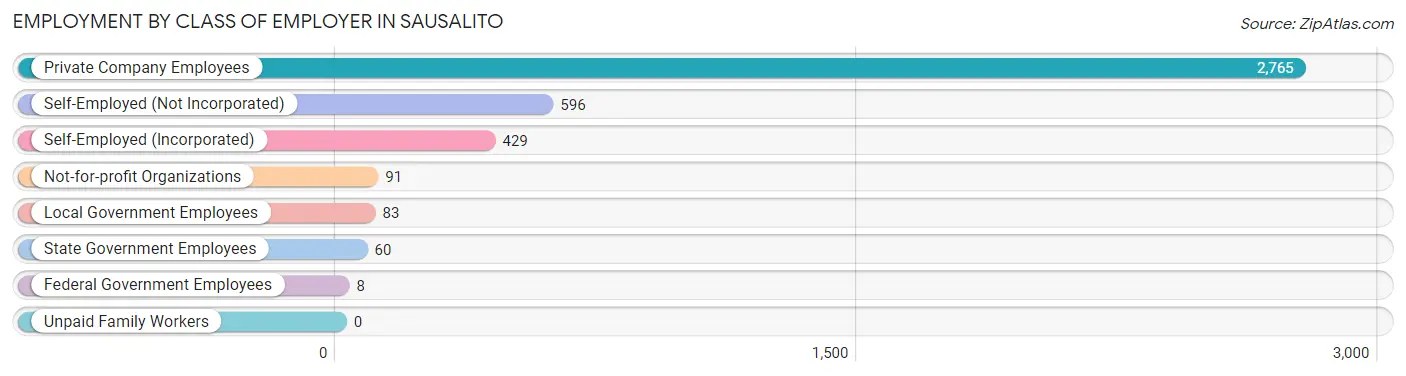
| Employer Class | # Employees | % Employees |
| Private Company Employees | 2,765 | 68.6% |
| Self-Employed (Incorporated) | 429 | 10.6% |
| Self-Employed (Not Incorporated) | 596 | 14.8% |
| Not-for-profit Organizations | 91 | 2.3% |
| Local Government Employees | 83 | 2.1% |
| State Government Employees | 60 | 1.5% |
| Federal Government Employees | 8 | 0.2% |
| Unpaid Family Workers | 0 | 0.0% |
| Total | 4,032 | 100.0% |
Employment Status by Age in Sausalito
According to the labor force statistics for Sausalito, out of the total population over 16 years of age (6,696), 65.6% or 4,393 individuals are in the labor force, with 6.5% or 286 of them unemployed. The age group with the highest labor force participation rate is 25 to 29 years, with 95.7% or 446 individuals in the labor force. Within the labor force, the 20 to 24 years age range has the highest percentage of unemployed individuals, with 78.7% or 129 of them being unemployed.
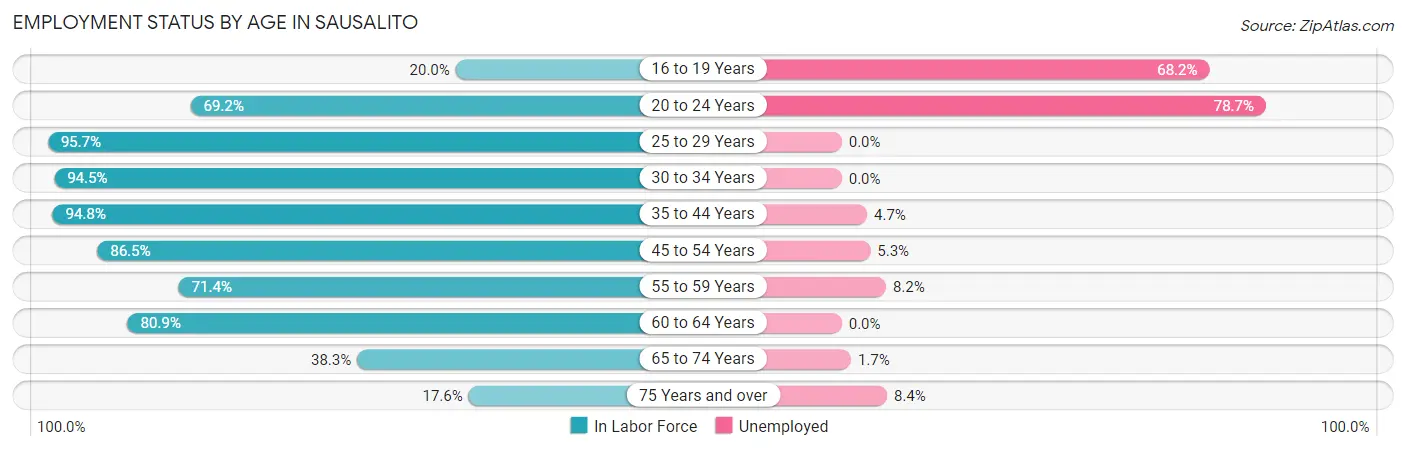
| Age Bracket | In Labor Force | Unemployed |
| 16 to 19 Years | 22 (20.0%) | 15 (68.2%) |
| 20 to 24 Years | 164 (69.2%) | 129 (78.7%) |
| 25 to 29 Years | 446 (95.7%) | 0 (0.0%) |
| 30 to 34 Years | 596 (94.5%) | 0 (0.0%) |
| 35 to 44 Years | 814 (94.8%) | 38 (4.7%) |
| 45 to 54 Years | 730 (86.5%) | 39 (5.3%) |
| 55 to 59 Years | 497 (71.4%) | 41 (8.2%) |
| 60 to 64 Years | 432 (80.9%) | 0 (0.0%) |
| 65 to 74 Years | 525 (38.3%) | 9 (1.7%) |
| 75 Years and over | 167 (17.6%) | 14 (8.4%) |
| Total | 4,393 (65.6%) | 286 (6.5%) |
Employment Status by Educational Attainment in Sausalito
According to labor force statistics for Sausalito, 87.2% of individuals (3,514) out of the total population between 25 and 64 years of age (4,030) are in the labor force, with 3.4% or 119 of them being unemployed. The group with the highest labor force participation rate are those with the educational attainment of less than high school, with 94.9% or 129 individuals in the labor force. Within the labor force, individuals with bachelor's degree or higher education have the highest percentage of unemployment, with 4.4% or 118 of them being unemployed.
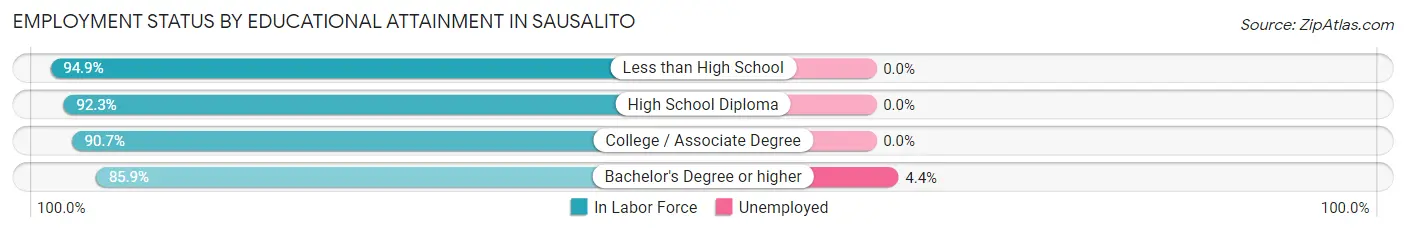
| Educational Attainment | In Labor Force | Unemployed |
| Less than High School | 129 (94.9%) | 0 (0.0%) |
| High School Diploma | 179 (92.3%) | 0 (0.0%) |
| College / Associate Degree | 536 (90.7%) | 0 (0.0%) |
| Bachelor's Degree or higher | 2,671 (85.9%) | 137 (4.4%) |
| Total | 3,514 (87.2%) | 137 (3.4%) |
Employment Occupations by Sex in Sausalito
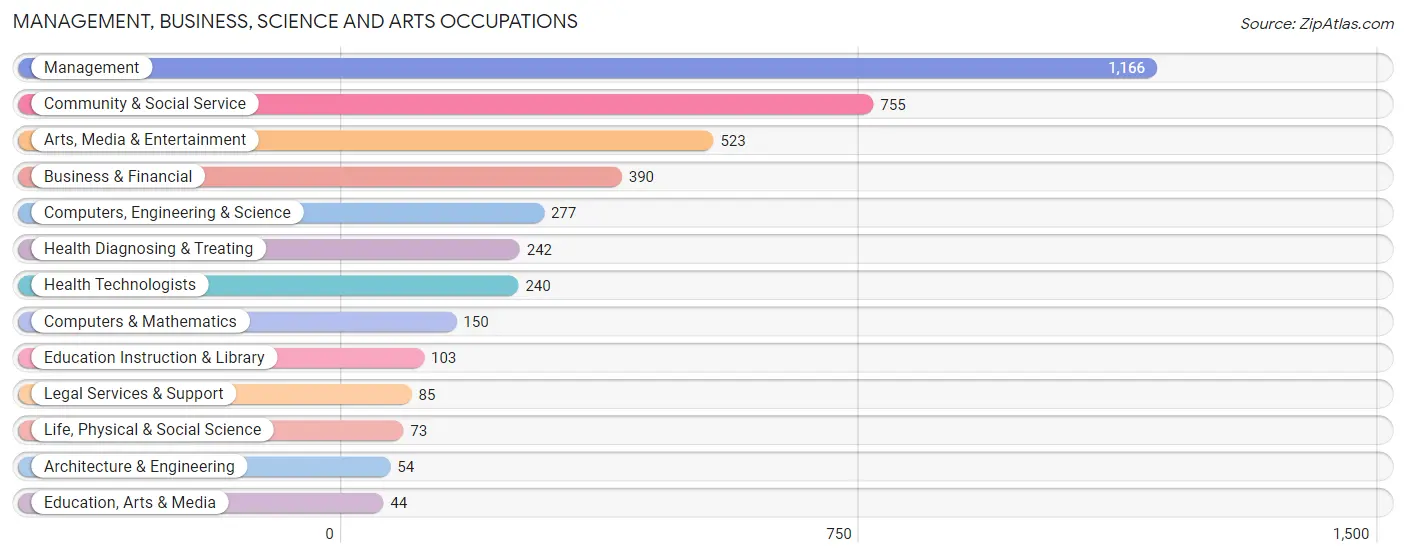
Management, Business, Science and Arts Occupations
The most common Management, Business, Science and Arts occupations in Sausalito are Management (1,166 | 28.4%), Community & Social Service (755 | 18.4%), Arts, Media & Entertainment (523 | 12.7%), Business & Financial (390 | 9.5%), and Computers, Engineering & Science (277 | 6.7%).
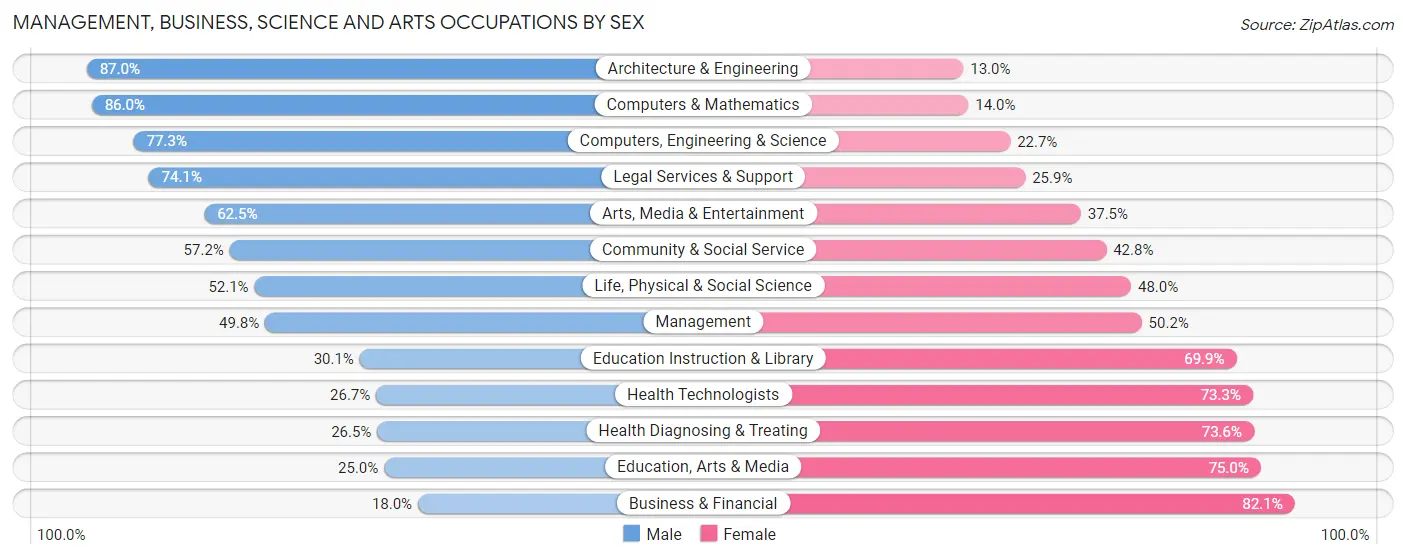
Management, Business, Science and Arts Occupations by Sex
Within the Management, Business, Science and Arts occupations in Sausalito, the most male-oriented occupations are Architecture & Engineering (87.0%), Computers & Mathematics (86.0%), and Computers, Engineering & Science (77.3%), while the most female-oriented occupations are Business & Financial (82.1%), Education, Arts & Media (75.0%), and Health Diagnosing & Treating (73.6%).
| Occupation | Male | Female |
| Management | 581 (49.8%) | 585 (50.2%) |
| Business & Financial | 70 (17.9%) | 320 (82.1%) |
| Computers, Engineering & Science | 214 (77.3%) | 63 (22.7%) |
| Computers & Mathematics | 129 (86.0%) | 21 (14.0%) |
| Architecture & Engineering | 47 (87.0%) | 7 (13.0%) |
| Life, Physical & Social Science | 38 (52.0%) | 35 (47.9%) |
| Community & Social Service | 432 (57.2%) | 323 (42.8%) |
| Education, Arts & Media | 11 (25.0%) | 33 (75.0%) |
| Legal Services & Support | 63 (74.1%) | 22 (25.9%) |
| Education Instruction & Library | 31 (30.1%) | 72 (69.9%) |
| Arts, Media & Entertainment | 327 (62.5%) | 196 (37.5%) |
| Health Diagnosing & Treating | 64 (26.5%) | 178 (73.6%) |
| Health Technologists | 64 (26.7%) | 176 (73.3%) |
| Total (Category) | 1,361 (48.1%) | 1,469 (51.9%) |
| Total (Overall) | 1,897 (46.2%) | 2,211 (53.8%) |
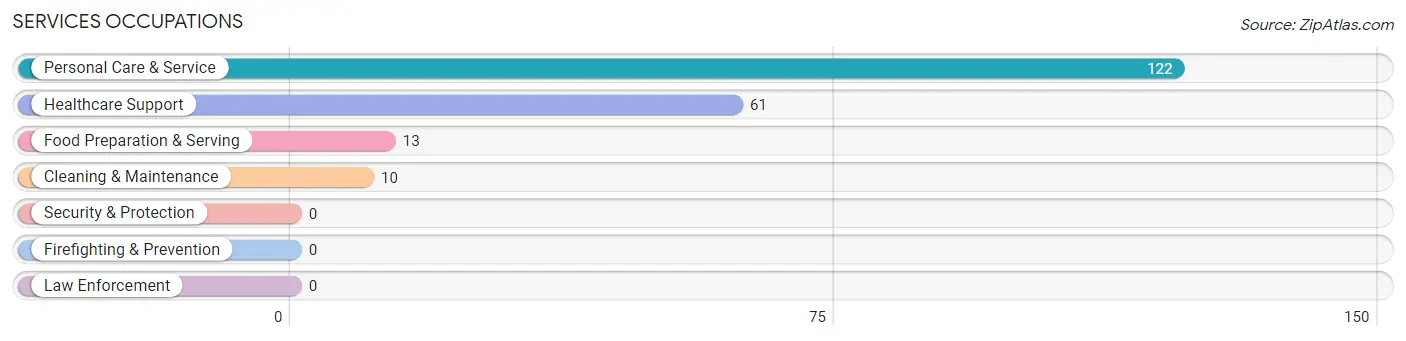
Services Occupations
The most common Services occupations in Sausalito are Personal Care & Service (122 | 3.0%), Healthcare Support (61 | 1.5%), Food Preparation & Serving (13 | 0.3%), and Cleaning & Maintenance (10 | 0.2%).
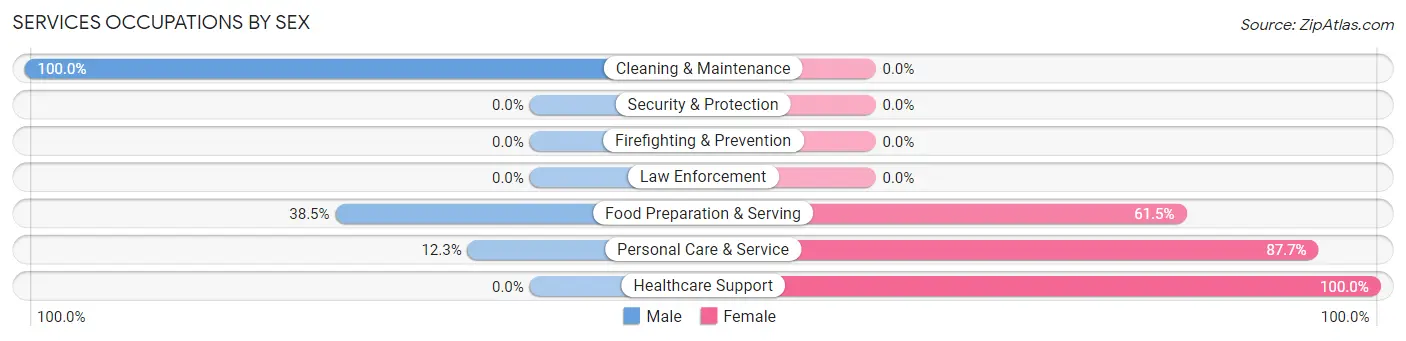
Services Occupations by Sex
Within the Services occupations in Sausalito, the most male-oriented occupations are Cleaning & Maintenance (100.0%), Food Preparation & Serving (38.5%), and Personal Care & Service (12.3%), while the most female-oriented occupations are Healthcare Support (100.0%), Personal Care & Service (87.7%), and Food Preparation & Serving (61.5%).
| Occupation | Male | Female |
| Healthcare Support | 0 (0.0%) | 61 (100.0%) |
| Security & Protection | 0 (0.0%) | 0 (0.0%) |
| Firefighting & Prevention | 0 (0.0%) | 0 (0.0%) |
| Law Enforcement | 0 (0.0%) | 0 (0.0%) |
| Food Preparation & Serving | 5 (38.5%) | 8 (61.5%) |
| Cleaning & Maintenance | 10 (100.0%) | 0 (0.0%) |
| Personal Care & Service | 15 (12.3%) | 107 (87.7%) |
| Total (Category) | 30 (14.6%) | 176 (85.4%) |
| Total (Overall) | 1,897 (46.2%) | 2,211 (53.8%) |
Sales and Office Occupations
The most common Sales and Office occupations in Sausalito are Sales & Related (768 | 18.7%), and Office & Administration (124 | 3.0%).
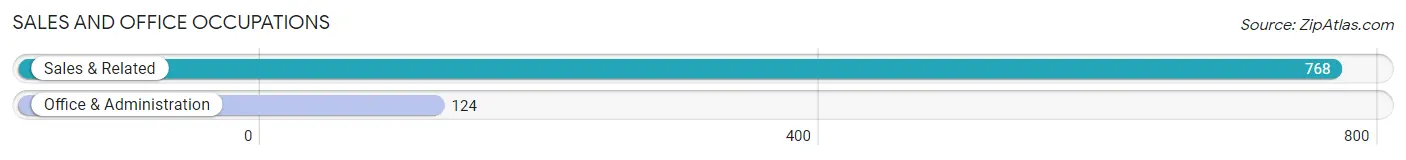
Sales and Office Occupations by Sex
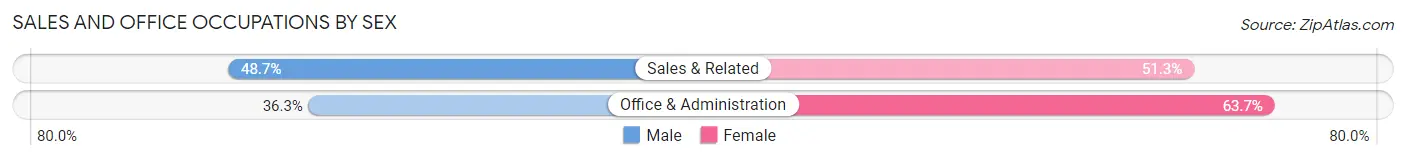
| Occupation | Male | Female |
| Sales & Related | 374 (48.7%) | 394 (51.3%) |
| Office & Administration | 45 (36.3%) | 79 (63.7%) |
| Total (Category) | 419 (47.0%) | 473 (53.0%) |
| Total (Overall) | 1,897 (46.2%) | 2,211 (53.8%) |
Natural Resources, Construction and Maintenance Occupations
The most common Natural Resources, Construction and Maintenance occupations in Sausalito are , and Installation, Maintenance & Repair (35 | 0.9%).
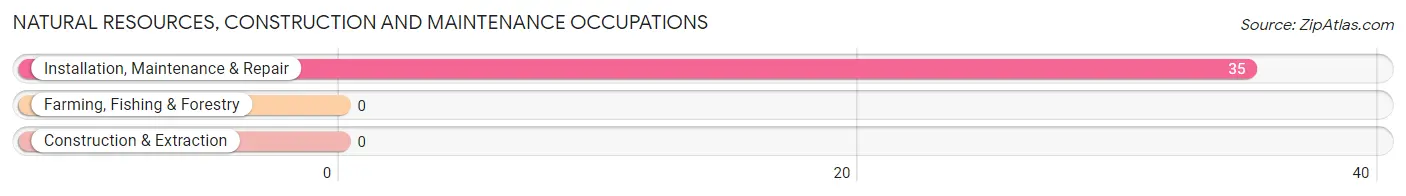
Natural Resources, Construction and Maintenance Occupations by Sex
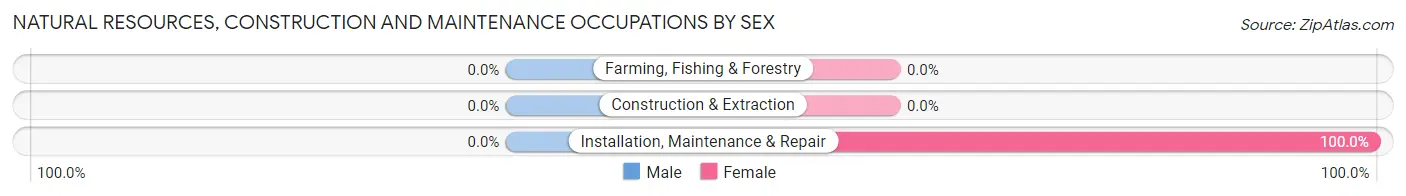
| Occupation | Male | Female |
| Farming, Fishing & Forestry | 0 (0.0%) | 0 (0.0%) |
| Construction & Extraction | 0 (0.0%) | 0 (0.0%) |
| Installation, Maintenance & Repair | 0 (0.0%) | 35 (100.0%) |
| Total (Category) | 0 (0.0%) | 35 (100.0%) |
| Total (Overall) | 1,897 (46.2%) | 2,211 (53.8%) |
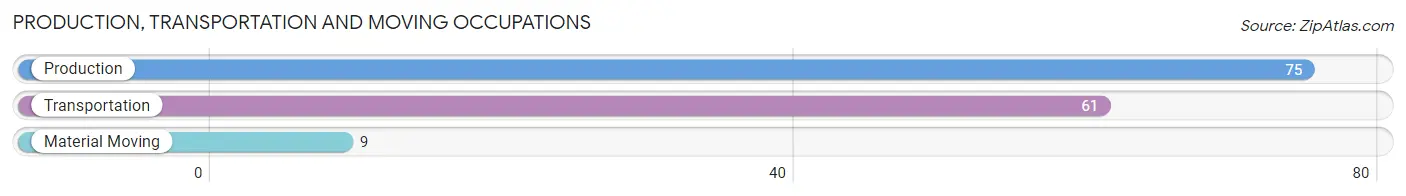
Production, Transportation and Moving Occupations
The most common Production, Transportation and Moving occupations in Sausalito are Production (75 | 1.8%), Transportation (61 | 1.5%), and Material Moving (9 | 0.2%).
Production, Transportation and Moving Occupations by Sex
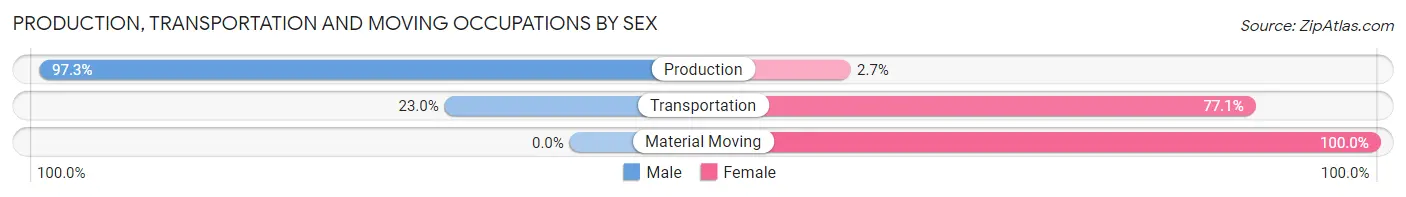
| Occupation | Male | Female |
| Production | 73 (97.3%) | 2 (2.7%) |
| Transportation | 14 (23.0%) | 47 (77.0%) |
| Material Moving | 0 (0.0%) | 9 (100.0%) |
| Total (Category) | 87 (60.0%) | 58 (40.0%) |
| Total (Overall) | 1,897 (46.2%) | 2,211 (53.8%) |
Employment Industries by Sex in Sausalito
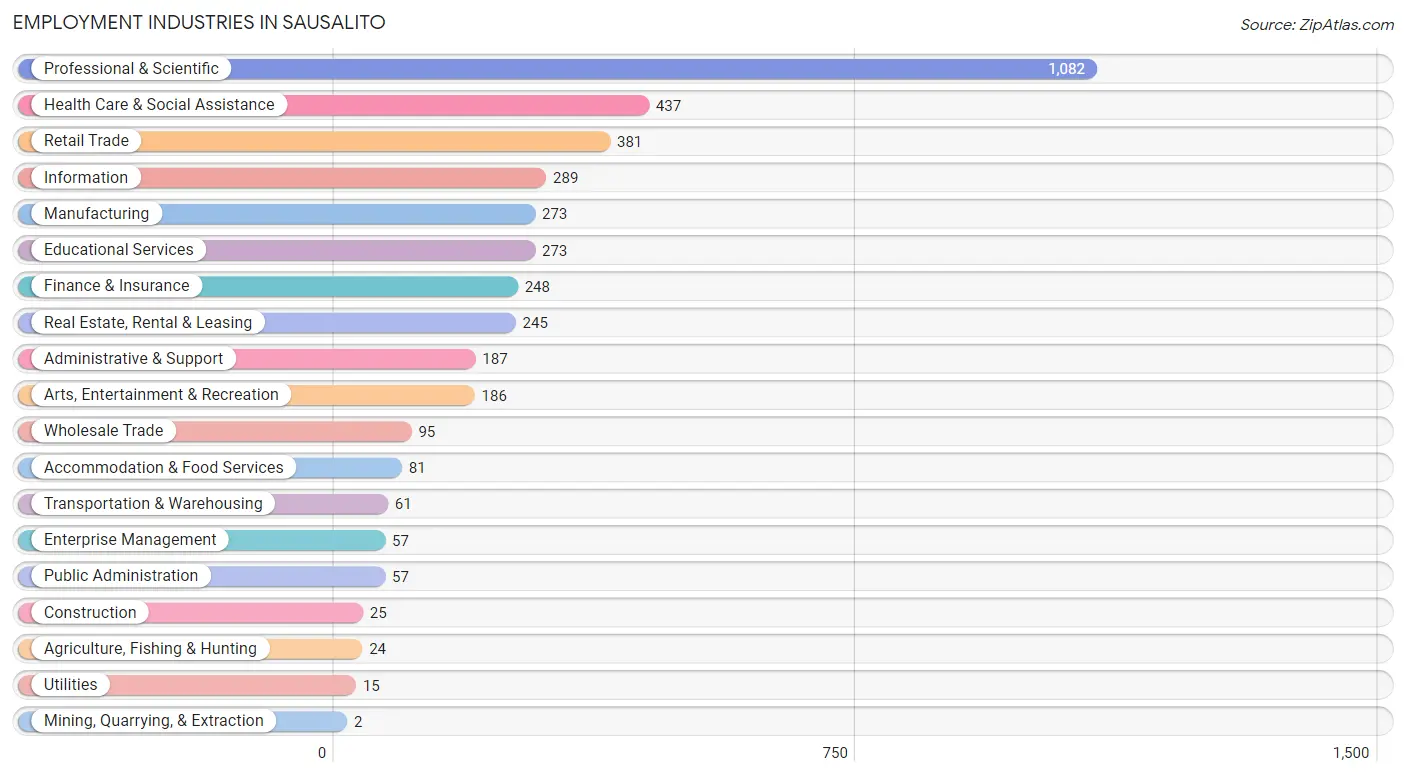
Employment Industries in Sausalito
The major employment industries in Sausalito include Professional & Scientific (1,082 | 26.3%), Health Care & Social Assistance (437 | 10.6%), Retail Trade (381 | 9.3%), Information (289 | 7.0%), and Manufacturing (273 | 6.7%).
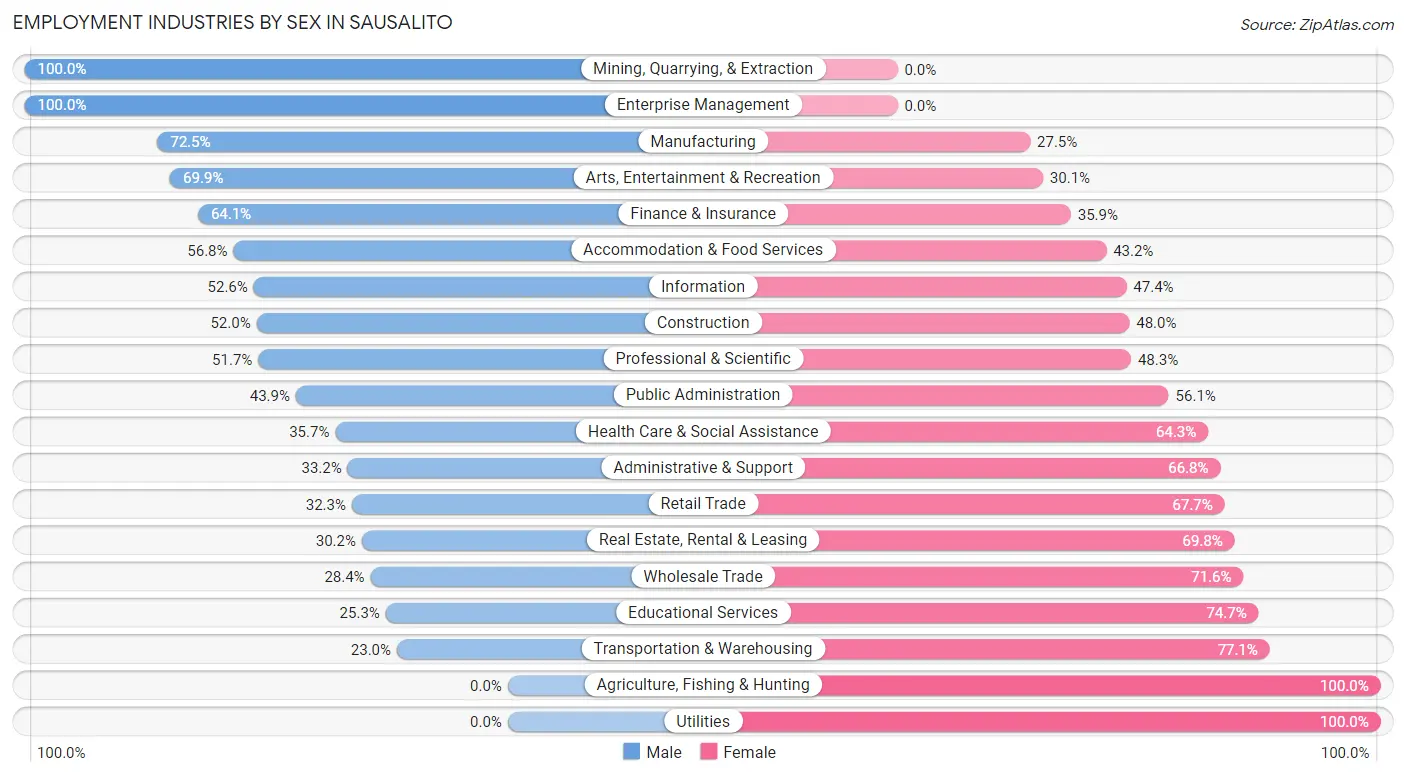
Employment Industries by Sex in Sausalito
The Sausalito industries that see more men than women are Mining, Quarrying, & Extraction (100.0%), Enterprise Management (100.0%), and Manufacturing (72.5%), whereas the industries that tend to have a higher number of women are Agriculture, Fishing & Hunting (100.0%), Utilities (100.0%), and Transportation & Warehousing (77.0%).
| Industry | Male | Female |
| Agriculture, Fishing & Hunting | 0 (0.0%) | 24 (100.0%) |
| Mining, Quarrying, & Extraction | 2 (100.0%) | 0 (0.0%) |
| Construction | 13 (52.0%) | 12 (48.0%) |
| Manufacturing | 198 (72.5%) | 75 (27.5%) |
| Wholesale Trade | 27 (28.4%) | 68 (71.6%) |
| Retail Trade | 123 (32.3%) | 258 (67.7%) |
| Transportation & Warehousing | 14 (23.0%) | 47 (77.0%) |
| Utilities | 0 (0.0%) | 15 (100.0%) |
| Information | 152 (52.6%) | 137 (47.4%) |
| Finance & Insurance | 159 (64.1%) | 89 (35.9%) |
| Real Estate, Rental & Leasing | 74 (30.2%) | 171 (69.8%) |
| Professional & Scientific | 559 (51.7%) | 523 (48.3%) |
| Enterprise Management | 57 (100.0%) | 0 (0.0%) |
| Administrative & Support | 62 (33.2%) | 125 (66.8%) |
| Educational Services | 69 (25.3%) | 204 (74.7%) |
| Health Care & Social Assistance | 156 (35.7%) | 281 (64.3%) |
| Arts, Entertainment & Recreation | 130 (69.9%) | 56 (30.1%) |
| Accommodation & Food Services | 46 (56.8%) | 35 (43.2%) |
| Public Administration | 25 (43.9%) | 32 (56.1%) |
| Total | 1,897 (46.2%) | 2,211 (53.8%) |
Education in Sausalito
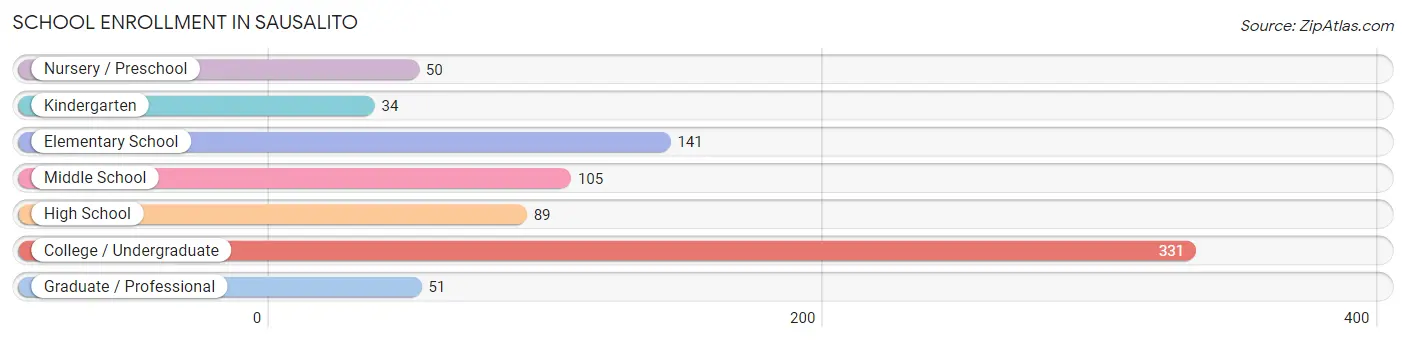
School Enrollment in Sausalito
The most common levels of schooling among the 801 students in Sausalito are college / undergraduate (331 | 41.3%), elementary school (141 | 17.6%), and middle school (105 | 13.1%).
| School Level | # Students | % Students |
| Nursery / Preschool | 50 | 6.2% |
| Kindergarten | 34 | 4.2% |
| Elementary School | 141 | 17.6% |
| Middle School | 105 | 13.1% |
| High School | 89 | 11.1% |
| College / Undergraduate | 331 | 41.3% |
| Graduate / Professional | 51 | 6.4% |
| Total | 801 | 100.0% |
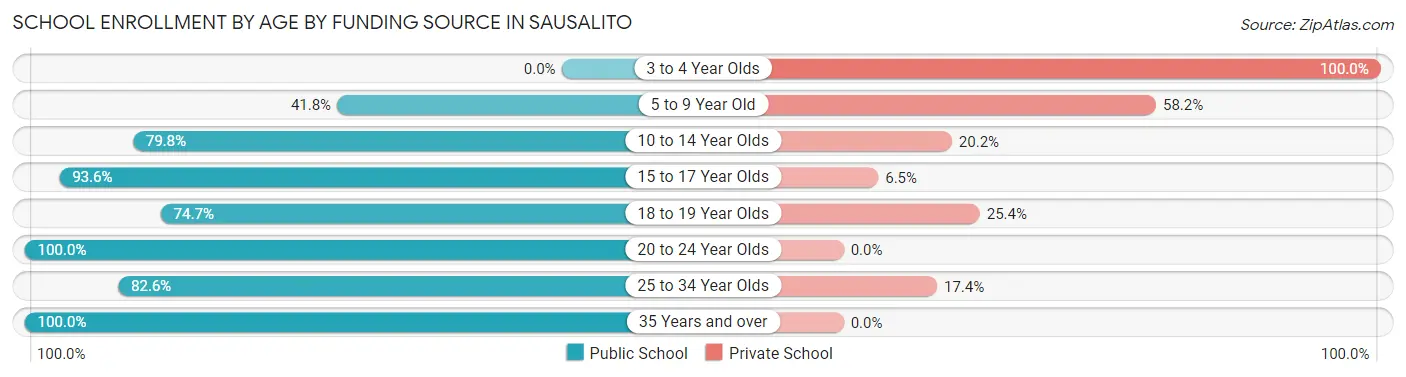
School Enrollment by Age by Funding Source in Sausalito
Out of a total of 801 students who are enrolled in schools in Sausalito, 205 (25.6%) attend a private institution, while the remaining 596 (74.4%) are enrolled in public schools. The age group of 3 to 4 year olds has the highest likelihood of being enrolled in private schools, with 50 (100.0% in the age bracket) enrolled. Conversely, the age group of 20 to 24 year olds has the lowest likelihood of being enrolled in a private school, with 73 (100.0% in the age bracket) attending a public institution.
| Age Bracket | Public School | Private School |
| 3 to 4 Year Olds | 0 (0.0%) | 50 (100.0%) |
| 5 to 9 Year Old | 69 (41.8%) | 96 (58.2%) |
| 10 to 14 Year Olds | 99 (79.8%) | 25 (20.2%) |
| 15 to 17 Year Olds | 58 (93.5%) | 4 (6.5%) |
| 18 to 19 Year Olds | 53 (74.7%) | 18 (25.4%) |
| 20 to 24 Year Olds | 73 (100.0%) | 0 (0.0%) |
| 25 to 34 Year Olds | 57 (82.6%) | 12 (17.4%) |
| 35 Years and over | 187 (100.0%) | 0 (0.0%) |
| Total | 596 (74.4%) | 205 (25.6%) |
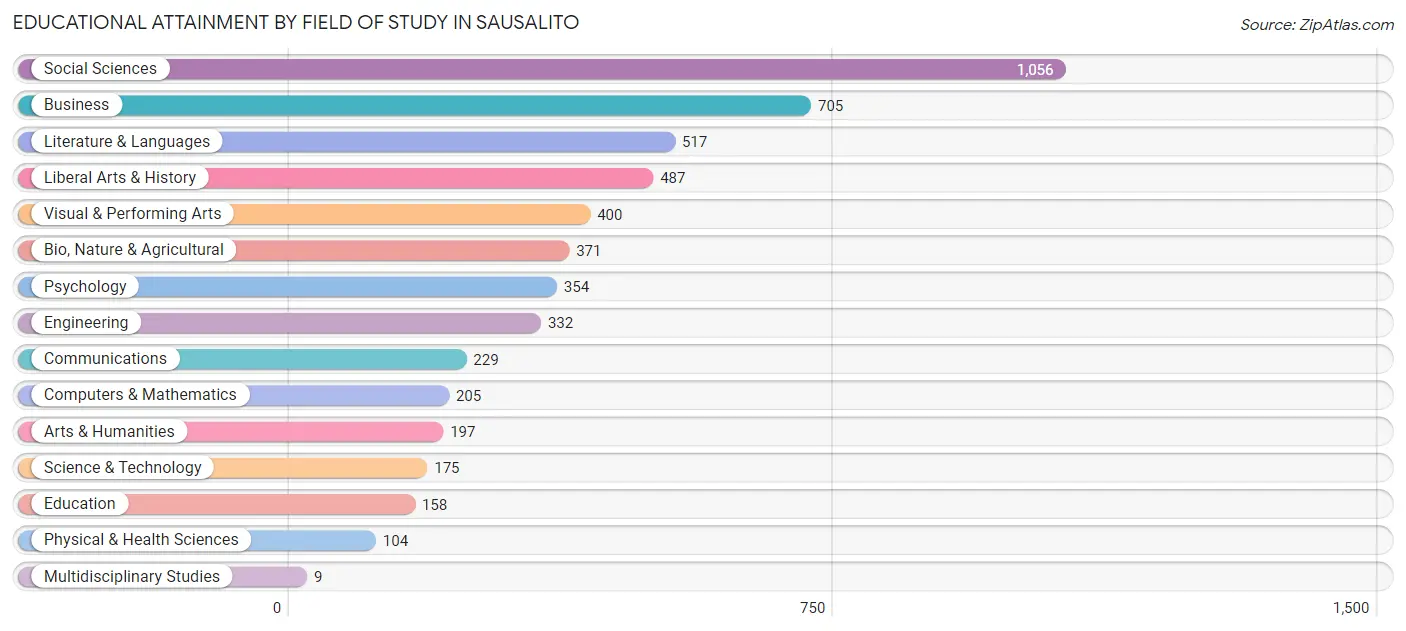
Educational Attainment by Field of Study in Sausalito
Social sciences (1,056 | 19.9%), business (705 | 13.3%), literature & languages (517 | 9.8%), liberal arts & history (487 | 9.2%), and visual & performing arts (400 | 7.5%) are the most common fields of study among 5,299 individuals in Sausalito who have obtained a bachelor's degree or higher.
| Field of Study | # Graduates | % Graduates |
| Computers & Mathematics | 205 | 3.9% |
| Bio, Nature & Agricultural | 371 | 7.0% |
| Physical & Health Sciences | 104 | 2.0% |
| Psychology | 354 | 6.7% |
| Social Sciences | 1,056 | 19.9% |
| Engineering | 332 | 6.3% |
| Multidisciplinary Studies | 9 | 0.2% |
| Science & Technology | 175 | 3.3% |
| Business | 705 | 13.3% |
| Education | 158 | 3.0% |
| Literature & Languages | 517 | 9.8% |
| Liberal Arts & History | 487 | 9.2% |
| Visual & Performing Arts | 400 | 7.5% |
| Communications | 229 | 4.3% |
| Arts & Humanities | 197 | 3.7% |
| Total | 5,299 | 100.0% |
Transportation & Commute in Sausalito
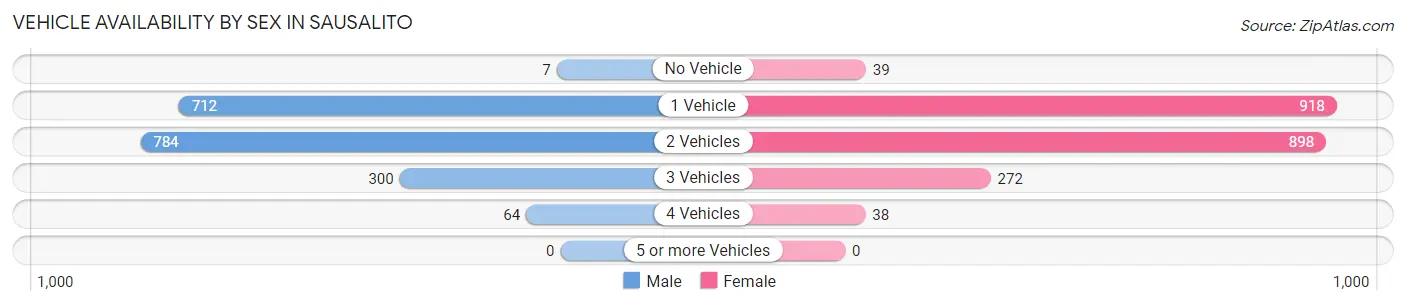
Vehicle Availability by Sex in Sausalito
The most prevalent vehicle ownership categories in Sausalito are males with 2 vehicles (784, accounting for 42.0%) and females with 2 vehicles (898, making up 36.2%).
| Vehicles Available | Male | Female |
| No Vehicle | 7 (0.4%) | 39 (1.8%) |
| 1 Vehicle | 712 (38.1%) | 918 (42.4%) |
| 2 Vehicles | 784 (42.0%) | 898 (41.5%) |
| 3 Vehicles | 300 (16.1%) | 272 (12.6%) |
| 4 Vehicles | 64 (3.4%) | 38 (1.8%) |
| 5 or more Vehicles | 0 (0.0%) | 0 (0.0%) |
| Total | 1,867 (100.0%) | 2,165 (100.0%) |
Commute Time in Sausalito
The most frequently occuring commute durations in Sausalito are 10 to 14 minutes (352 commuters, 14.3%), 45 to 59 minutes (351 commuters, 14.2%), and 30 to 34 minutes (276 commuters, 11.2%).
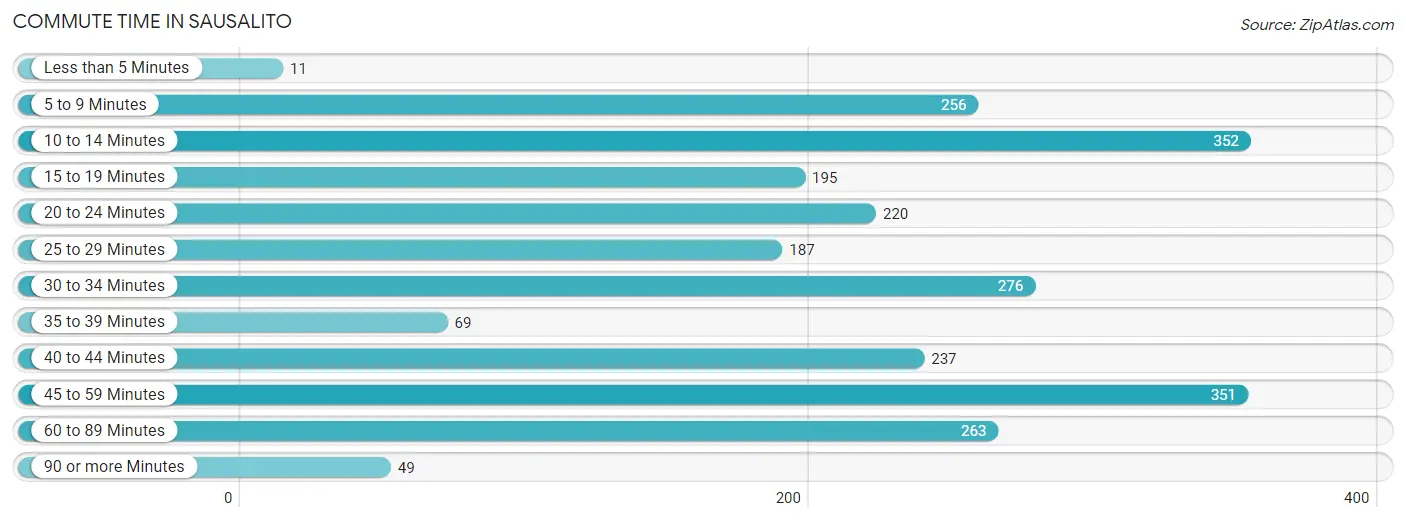
| Commute Time | # Commuters | % Commuters |
| Less than 5 Minutes | 11 | 0.4% |
| 5 to 9 Minutes | 256 | 10.4% |
| 10 to 14 Minutes | 352 | 14.3% |
| 15 to 19 Minutes | 195 | 7.9% |
| 20 to 24 Minutes | 220 | 8.9% |
| 25 to 29 Minutes | 187 | 7.6% |
| 30 to 34 Minutes | 276 | 11.2% |
| 35 to 39 Minutes | 69 | 2.8% |
| 40 to 44 Minutes | 237 | 9.6% |
| 45 to 59 Minutes | 351 | 14.2% |
| 60 to 89 Minutes | 263 | 10.7% |
| 90 or more Minutes | 49 | 2.0% |
Commute Time by Sex in Sausalito
The most common commute times in Sausalito are 45 to 59 minutes (203 commuters, 16.3%) for males and 10 to 14 minutes (217 commuters, 17.8%) for females.
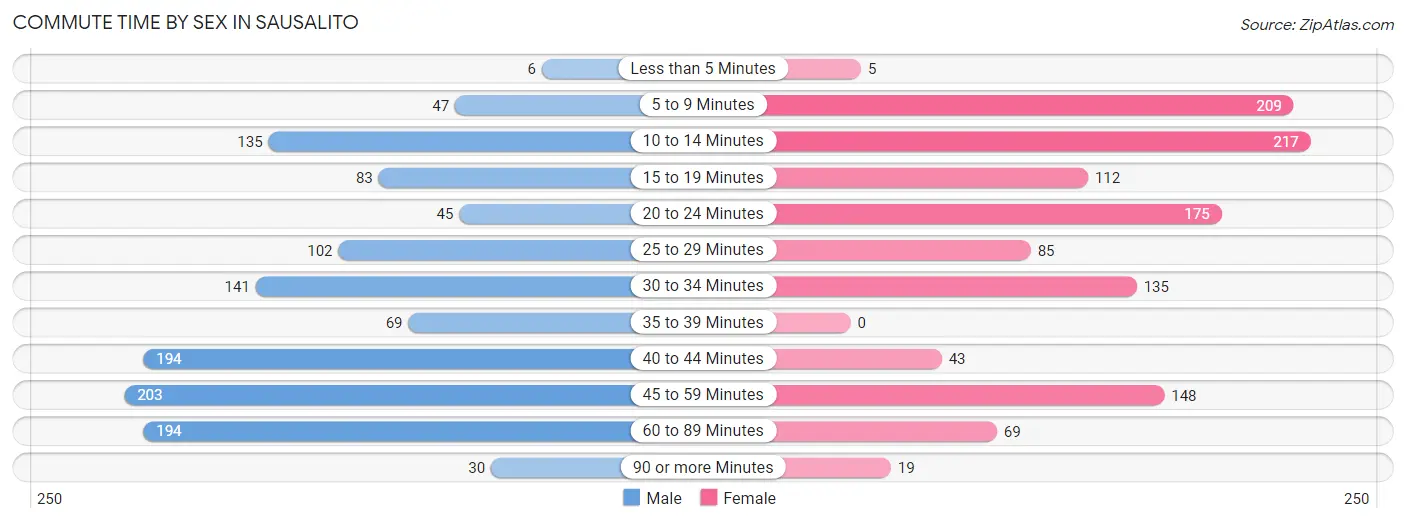
| Commute Time | Male | Female |
| Less than 5 Minutes | 6 (0.5%) | 5 (0.4%) |
| 5 to 9 Minutes | 47 (3.8%) | 209 (17.2%) |
| 10 to 14 Minutes | 135 (10.8%) | 217 (17.8%) |
| 15 to 19 Minutes | 83 (6.7%) | 112 (9.2%) |
| 20 to 24 Minutes | 45 (3.6%) | 175 (14.4%) |
| 25 to 29 Minutes | 102 (8.2%) | 85 (7.0%) |
| 30 to 34 Minutes | 141 (11.3%) | 135 (11.1%) |
| 35 to 39 Minutes | 69 (5.5%) | 0 (0.0%) |
| 40 to 44 Minutes | 194 (15.5%) | 43 (3.5%) |
| 45 to 59 Minutes | 203 (16.3%) | 148 (12.2%) |
| 60 to 89 Minutes | 194 (15.5%) | 69 (5.7%) |
| 90 or more Minutes | 30 (2.4%) | 19 (1.6%) |
Time of Departure to Work by Sex in Sausalito
The most frequent times of departure to work in Sausalito are 8:30 AM to 8:59 AM (296, 23.7%) for males and 8:00 AM to 8:29 AM (260, 21.4%) for females.
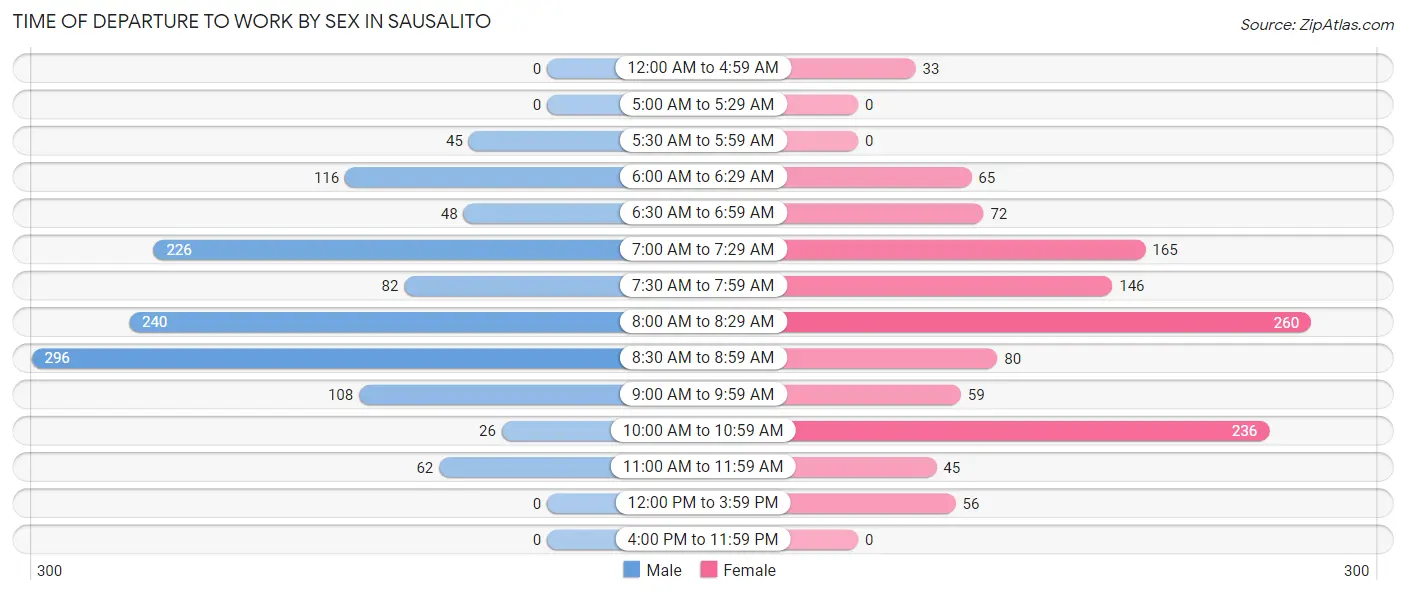
| Time of Departure | Male | Female |
| 12:00 AM to 4:59 AM | 0 (0.0%) | 33 (2.7%) |
| 5:00 AM to 5:29 AM | 0 (0.0%) | 0 (0.0%) |
| 5:30 AM to 5:59 AM | 45 (3.6%) | 0 (0.0%) |
| 6:00 AM to 6:29 AM | 116 (9.3%) | 65 (5.3%) |
| 6:30 AM to 6:59 AM | 48 (3.8%) | 72 (5.9%) |
| 7:00 AM to 7:29 AM | 226 (18.1%) | 165 (13.6%) |
| 7:30 AM to 7:59 AM | 82 (6.6%) | 146 (12.0%) |
| 8:00 AM to 8:29 AM | 240 (19.2%) | 260 (21.4%) |
| 8:30 AM to 8:59 AM | 296 (23.7%) | 80 (6.6%) |
| 9:00 AM to 9:59 AM | 108 (8.6%) | 59 (4.9%) |
| 10:00 AM to 10:59 AM | 26 (2.1%) | 236 (19.4%) |
| 11:00 AM to 11:59 AM | 62 (5.0%) | 45 (3.7%) |
| 12:00 PM to 3:59 PM | 0 (0.0%) | 56 (4.6%) |
| 4:00 PM to 11:59 PM | 0 (0.0%) | 0 (0.0%) |
| Total | 1,249 (100.0%) | 1,217 (100.0%) |
Housing Occupancy in Sausalito
Occupancy by Ownership in Sausalito
Of the total 4,057 dwellings in Sausalito, owner-occupied units account for 2,203 (54.3%), while renter-occupied units make up 1,854 (45.7%).
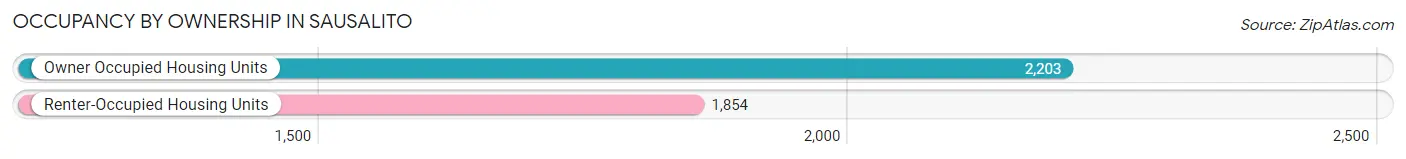
| Occupancy | # Housing Units | % Housing Units |
| Owner Occupied Housing Units | 2,203 | 54.3% |
| Renter-Occupied Housing Units | 1,854 | 45.7% |
| Total Occupied Housing Units | 4,057 | 100.0% |
Occupancy by Household Size in Sausalito
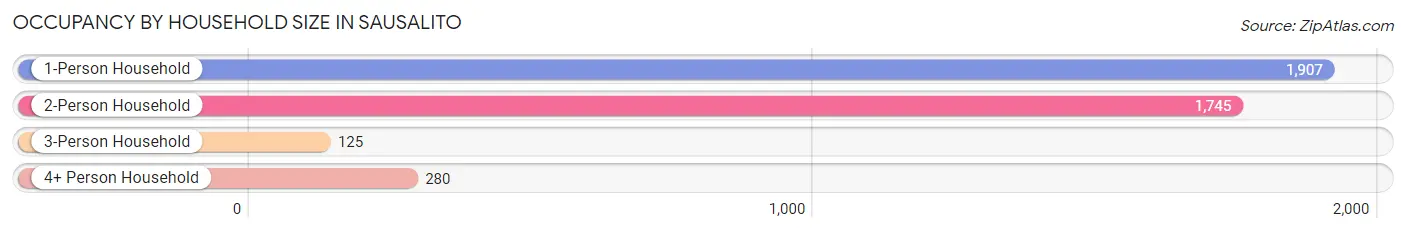
| Household Size | # Housing Units | % Housing Units |
| 1-Person Household | 1,907 | 47.0% |
| 2-Person Household | 1,745 | 43.0% |
| 3-Person Household | 125 | 3.1% |
| 4+ Person Household | 280 | 6.9% |
| Total Housing Units | 4,057 | 100.0% |
Occupancy by Ownership by Household Size in Sausalito
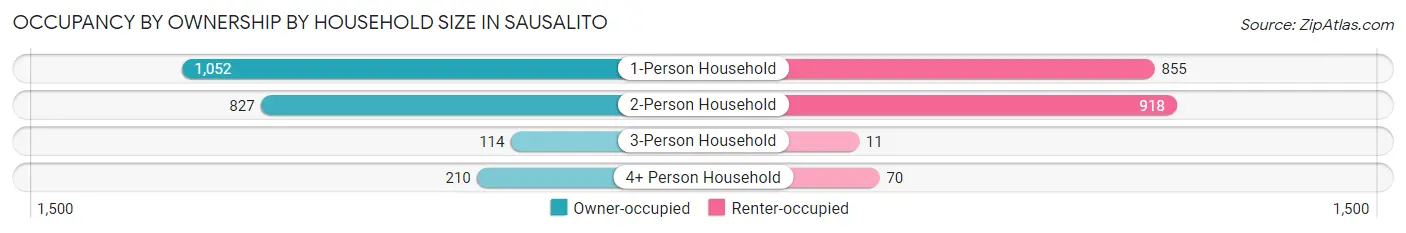
| Household Size | Owner-occupied | Renter-occupied |
| 1-Person Household | 1,052 (55.2%) | 855 (44.8%) |
| 2-Person Household | 827 (47.4%) | 918 (52.6%) |
| 3-Person Household | 114 (91.2%) | 11 (8.8%) |
| 4+ Person Household | 210 (75.0%) | 70 (25.0%) |
| Total Housing Units | 2,203 (54.3%) | 1,854 (45.7%) |
Occupancy by Educational Attainment in Sausalito
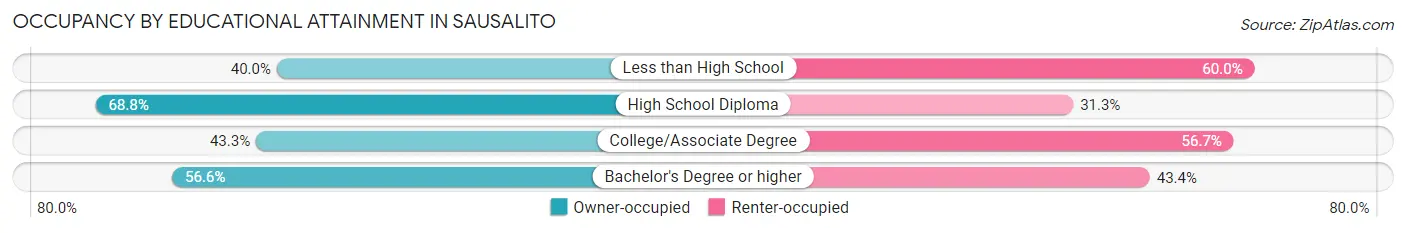
| Household Size | Owner-occupied | Renter-occupied |
| Less than High School | 14 (40.0%) | 21 (60.0%) |
| High School Diploma | 66 (68.8%) | 30 (31.2%) |
| College/Associate Degree | 323 (43.3%) | 423 (56.7%) |
| Bachelor's Degree or higher | 1,800 (56.6%) | 1,380 (43.4%) |
Occupancy by Age of Householder in Sausalito
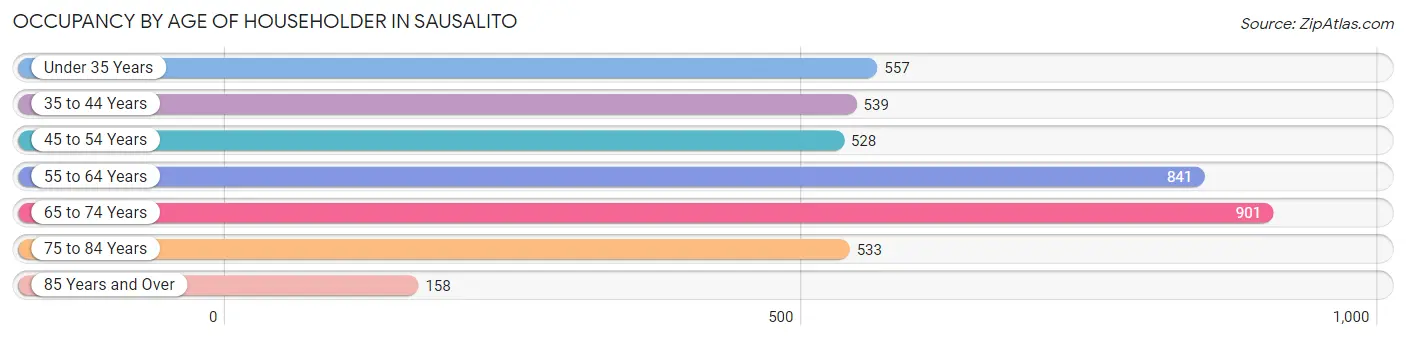
| Age Bracket | # Households | % Households |
| Under 35 Years | 557 | 13.7% |
| 35 to 44 Years | 539 | 13.3% |
| 45 to 54 Years | 528 | 13.0% |
| 55 to 64 Years | 841 | 20.7% |
| 65 to 74 Years | 901 | 22.2% |
| 75 to 84 Years | 533 | 13.1% |
| 85 Years and Over | 158 | 3.9% |
| Total | 4,057 | 100.0% |
Housing Finances in Sausalito
Median Income by Occupancy in Sausalito
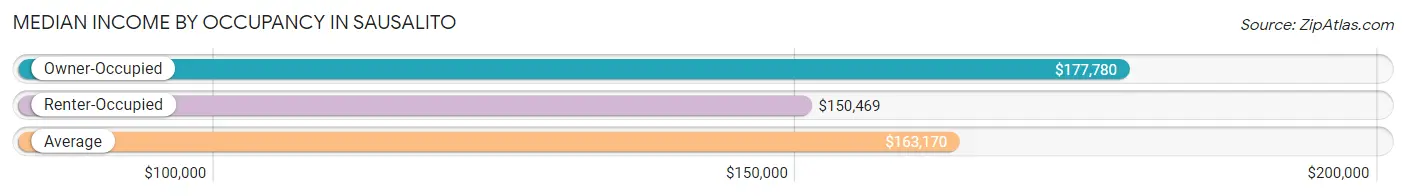
| Occupancy Type | # Households | Median Income |
| Owner-Occupied | 2,203 (54.3%) | $177,780 |
| Renter-Occupied | 1,854 (45.7%) | $150,469 |
| Average | 4,057 (100.0%) | $163,170 |
Occupancy by Householder Income Bracket in Sausalito
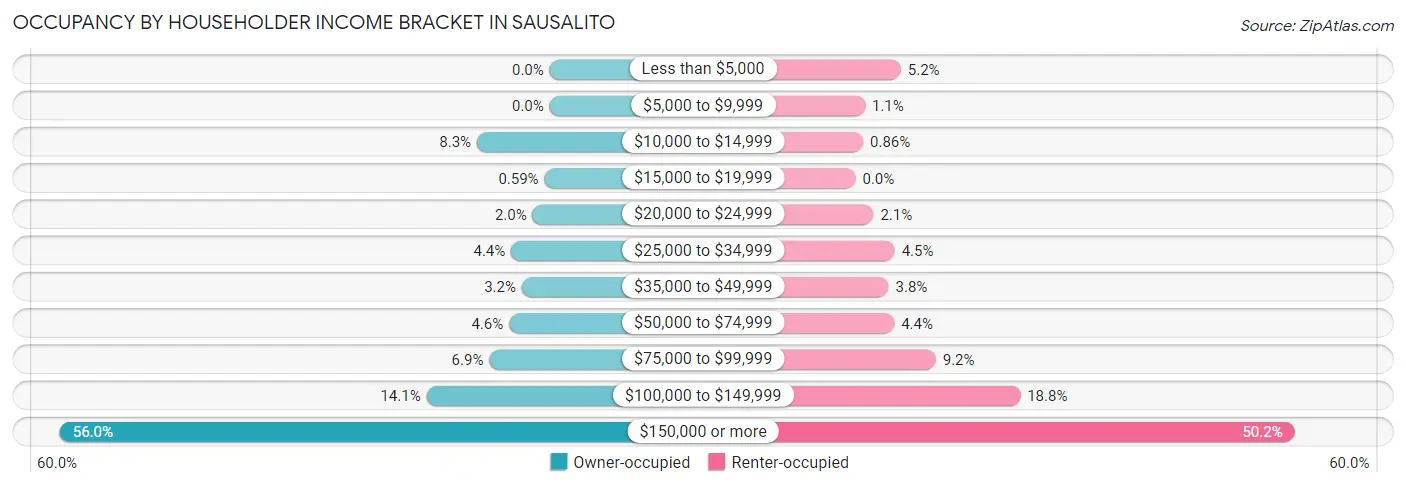
| Income Bracket | Owner-occupied | Renter-occupied |
| Less than $5,000 | 0 (0.0%) | 96 (5.2%) |
| $5,000 to $9,999 | 0 (0.0%) | 20 (1.1%) |
| $10,000 to $14,999 | 183 (8.3%) | 16 (0.9%) |
| $15,000 to $19,999 | 13 (0.6%) | 0 (0.0%) |
| $20,000 to $24,999 | 43 (1.9%) | 38 (2.1%) |
| $25,000 to $34,999 | 97 (4.4%) | 83 (4.5%) |
| $35,000 to $49,999 | 70 (3.2%) | 70 (3.8%) |
| $50,000 to $74,999 | 102 (4.6%) | 82 (4.4%) |
| $75,000 to $99,999 | 152 (6.9%) | 170 (9.2%) |
| $100,000 to $149,999 | 310 (14.1%) | 349 (18.8%) |
| $150,000 or more | 1,233 (56.0%) | 930 (50.2%) |
| Total | 2,203 (100.0%) | 1,854 (100.0%) |
Monthly Housing Cost Tiers in Sausalito
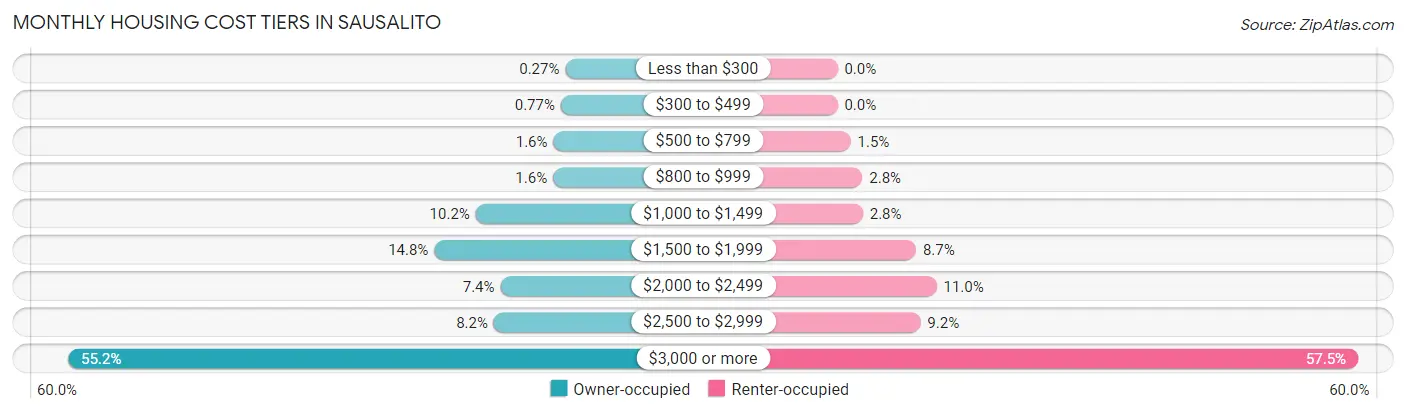
| Monthly Cost | Owner-occupied | Renter-occupied |
| Less than $300 | 6 (0.3%) | 0 (0.0%) |
| $300 to $499 | 17 (0.8%) | 0 (0.0%) |
| $500 to $799 | 35 (1.6%) | 27 (1.5%) |
| $800 to $999 | 36 (1.6%) | 51 (2.8%) |
| $1,000 to $1,499 | 224 (10.2%) | 52 (2.8%) |
| $1,500 to $1,999 | 325 (14.7%) | 161 (8.7%) |
| $2,000 to $2,499 | 164 (7.4%) | 203 (11.0%) |
| $2,500 to $2,999 | 180 (8.2%) | 170 (9.2%) |
| $3,000 or more | 1,216 (55.2%) | 1,066 (57.5%) |
| Total | 2,203 (100.0%) | 1,854 (100.0%) |
Physical Housing Characteristics in Sausalito
Housing Structures in Sausalito
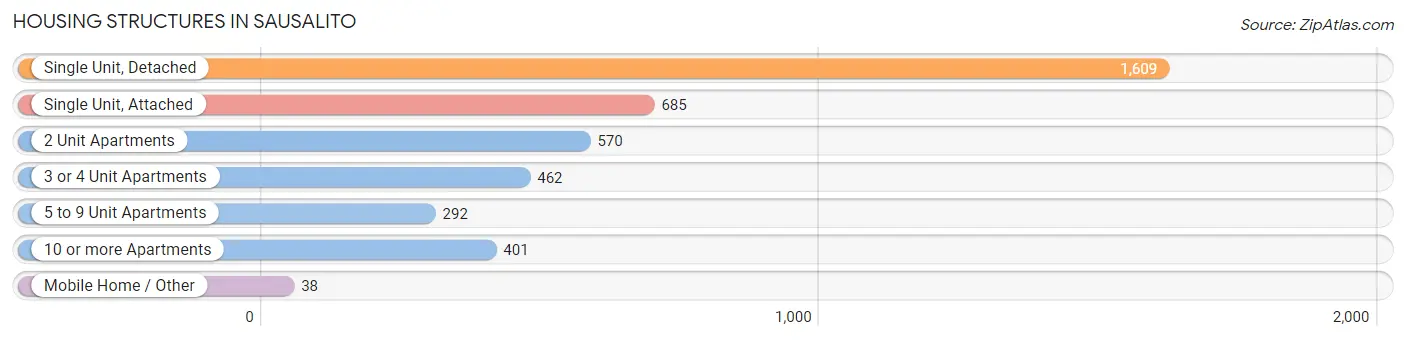
| Structure Type | # Housing Units | % Housing Units |
| Single Unit, Detached | 1,609 | 39.7% |
| Single Unit, Attached | 685 | 16.9% |
| 2 Unit Apartments | 570 | 14.1% |
| 3 or 4 Unit Apartments | 462 | 11.4% |
| 5 to 9 Unit Apartments | 292 | 7.2% |
| 10 or more Apartments | 401 | 9.9% |
| Mobile Home / Other | 38 | 0.9% |
| Total | 4,057 | 100.0% |
Housing Structures by Occupancy in Sausalito
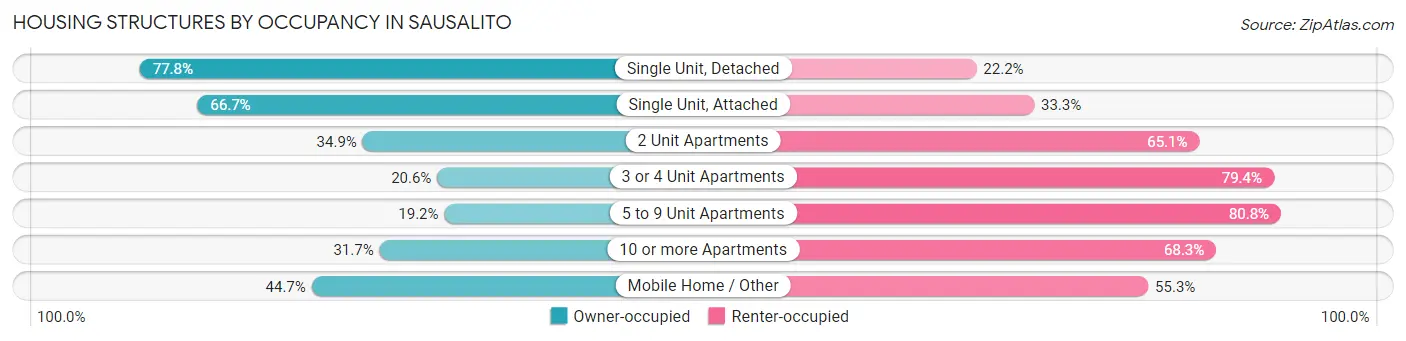
| Structure Type | Owner-occupied | Renter-occupied |
| Single Unit, Detached | 1,252 (77.8%) | 357 (22.2%) |
| Single Unit, Attached | 457 (66.7%) | 228 (33.3%) |
| 2 Unit Apartments | 199 (34.9%) | 371 (65.1%) |
| 3 or 4 Unit Apartments | 95 (20.6%) | 367 (79.4%) |
| 5 to 9 Unit Apartments | 56 (19.2%) | 236 (80.8%) |
| 10 or more Apartments | 127 (31.7%) | 274 (68.3%) |
| Mobile Home / Other | 17 (44.7%) | 21 (55.3%) |
| Total | 2,203 (54.3%) | 1,854 (45.7%) |
Housing Structures by Number of Rooms in Sausalito
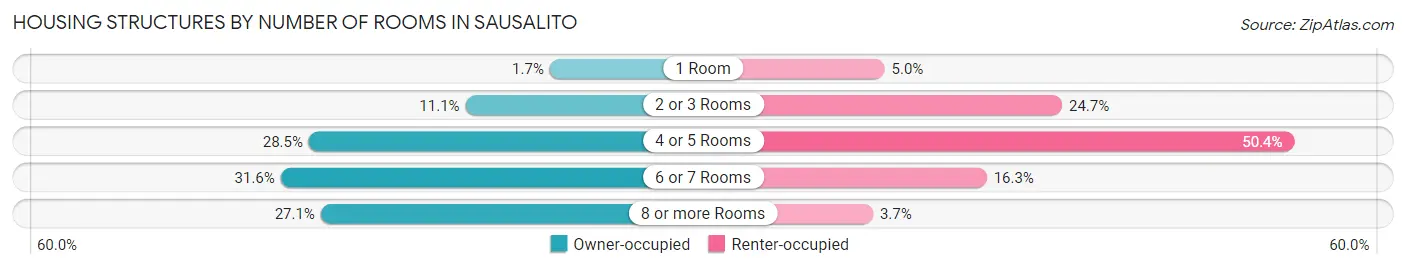
| Number of Rooms | Owner-occupied | Renter-occupied |
| 1 Room | 38 (1.7%) | 92 (5.0%) |
| 2 or 3 Rooms | 244 (11.1%) | 457 (24.6%) |
| 4 or 5 Rooms | 627 (28.5%) | 935 (50.4%) |
| 6 or 7 Rooms | 696 (31.6%) | 302 (16.3%) |
| 8 or more Rooms | 598 (27.1%) | 68 (3.7%) |
| Total | 2,203 (100.0%) | 1,854 (100.0%) |
Housing Structure by Heating Type in Sausalito
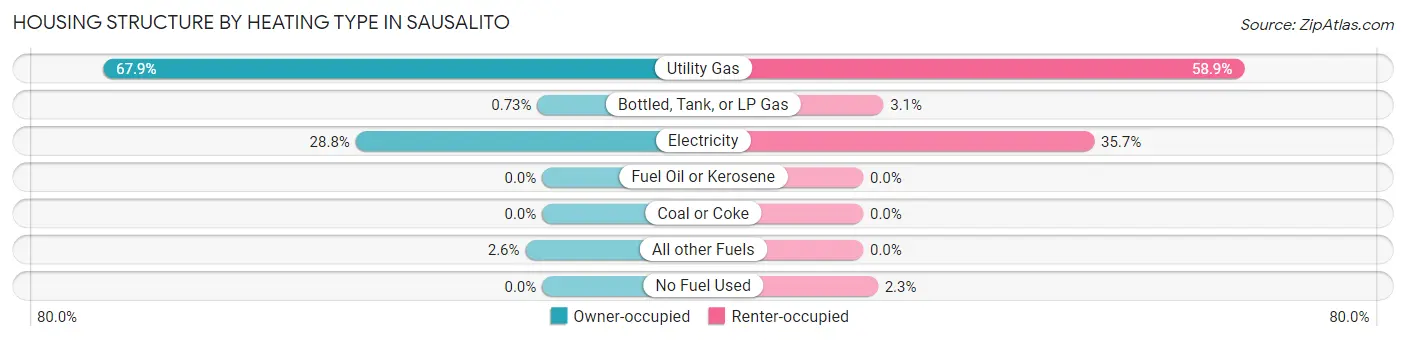
| Heating Type | Owner-occupied | Renter-occupied |
| Utility Gas | 1,495 (67.9%) | 1,092 (58.9%) |
| Bottled, Tank, or LP Gas | 16 (0.7%) | 58 (3.1%) |
| Electricity | 635 (28.8%) | 662 (35.7%) |
| Fuel Oil or Kerosene | 0 (0.0%) | 0 (0.0%) |
| Coal or Coke | 0 (0.0%) | 0 (0.0%) |
| All other Fuels | 57 (2.6%) | 0 (0.0%) |
| No Fuel Used | 0 (0.0%) | 42 (2.3%) |
| Total | 2,203 (100.0%) | 1,854 (100.0%) |
Household Vehicle Usage in Sausalito
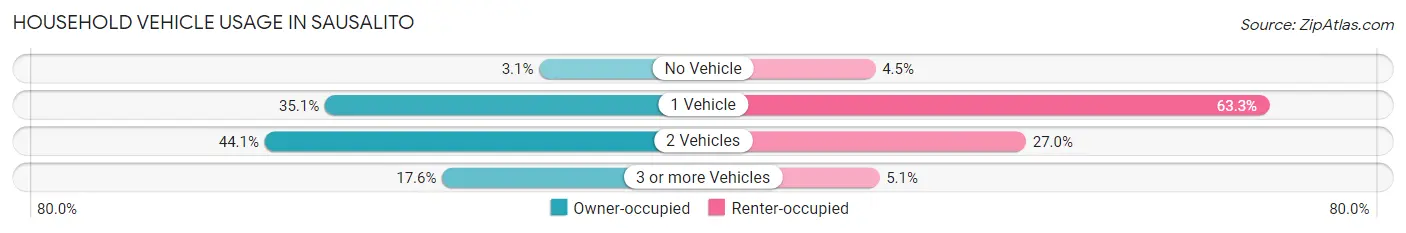
| Vehicles per Household | Owner-occupied | Renter-occupied |
| No Vehicle | 69 (3.1%) | 84 (4.5%) |
| 1 Vehicle | 774 (35.1%) | 1,174 (63.3%) |
| 2 Vehicles | 972 (44.1%) | 501 (27.0%) |
| 3 or more Vehicles | 388 (17.6%) | 95 (5.1%) |
| Total | 2,203 (100.0%) | 1,854 (100.0%) |
Real Estate & Mortgages in Sausalito
Real Estate and Mortgage Overview in Sausalito
| Characteristic | Without Mortgage | With Mortgage |
| Housing Units | 731 | 1,472 |
| Median Property Value | $1,445,300 | $1,821,100 |
| Median Household Income | $152,344 | $860 |
| Monthly Housing Costs | $1,501 | $1,139 |
| Real Estate Taxes | $10,001 | $0 |
Property Value by Mortgage Status in Sausalito
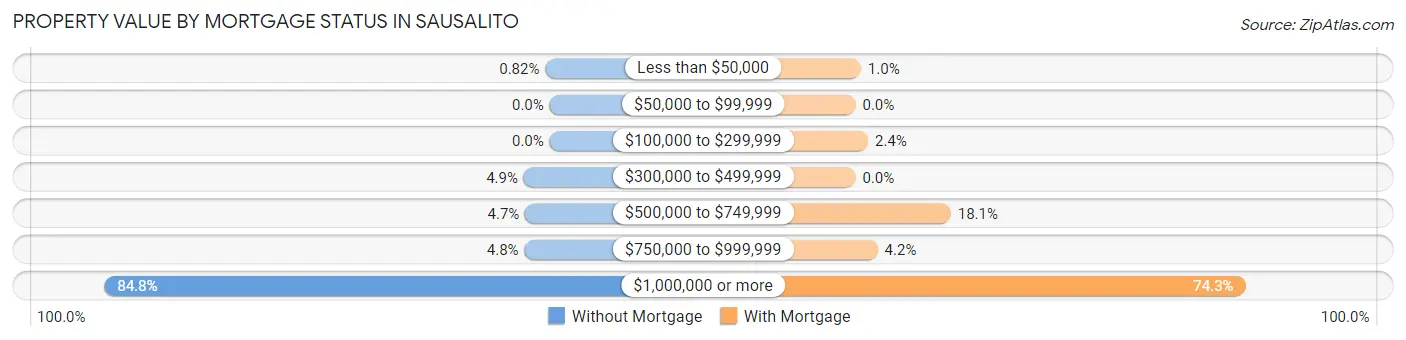
| Property Value | Without Mortgage | With Mortgage |
| Less than $50,000 | 6 (0.8%) | 15 (1.0%) |
| $50,000 to $99,999 | 0 (0.0%) | 0 (0.0%) |
| $100,000 to $299,999 | 0 (0.0%) | 35 (2.4%) |
| $300,000 to $499,999 | 36 (4.9%) | 0 (0.0%) |
| $500,000 to $749,999 | 34 (4.6%) | 267 (18.1%) |
| $750,000 to $999,999 | 35 (4.8%) | 62 (4.2%) |
| $1,000,000 or more | 620 (84.8%) | 1,093 (74.3%) |
| Total | 731 (100.0%) | 1,472 (100.0%) |
Household Income by Mortgage Status in Sausalito
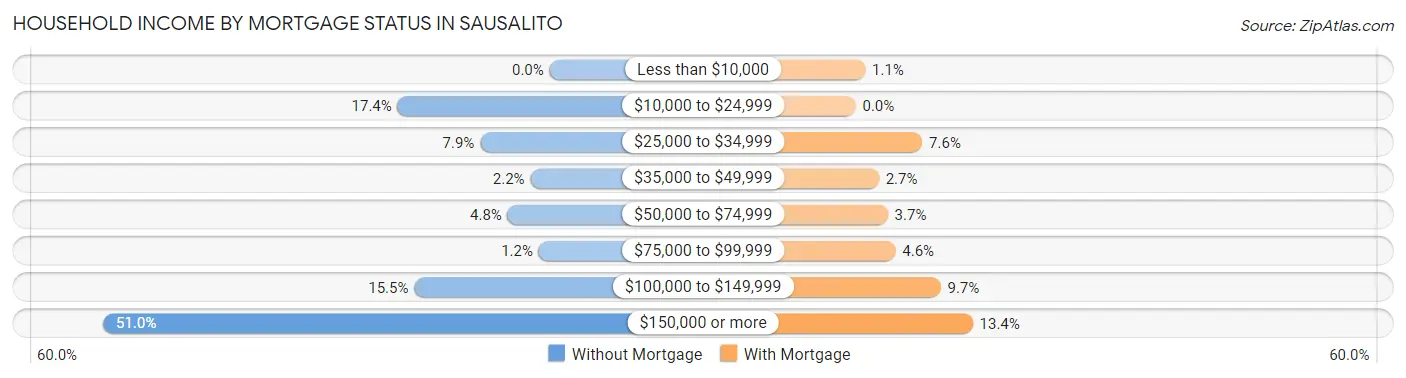
| Household Income | Without Mortgage | With Mortgage |
| Less than $10,000 | 0 (0.0%) | 16 (1.1%) |
| $10,000 to $24,999 | 127 (17.4%) | 0 (0.0%) |
| $25,000 to $34,999 | 58 (7.9%) | 112 (7.6%) |
| $35,000 to $49,999 | 16 (2.2%) | 39 (2.6%) |
| $50,000 to $74,999 | 35 (4.8%) | 54 (3.7%) |
| $75,000 to $99,999 | 9 (1.2%) | 67 (4.5%) |
| $100,000 to $149,999 | 113 (15.5%) | 143 (9.7%) |
| $150,000 or more | 373 (51.0%) | 197 (13.4%) |
| Total | 731 (100.0%) | 1,472 (100.0%) |
Property Value to Household Income Ratio in Sausalito
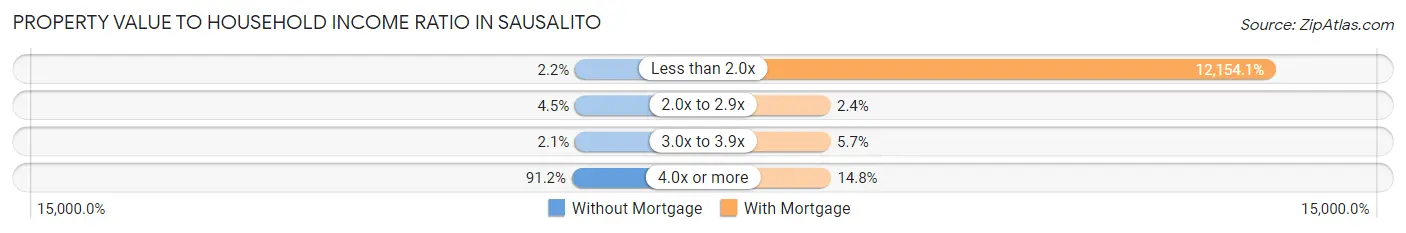
| Value-to-Income Ratio | Without Mortgage | With Mortgage |
| Less than 2.0x | 16 (2.2%) | 178,909 (12,154.1%) |
| 2.0x to 2.9x | 33 (4.5%) | 35 (2.4%) |
| 3.0x to 3.9x | 15 (2.1%) | 84 (5.7%) |
| 4.0x or more | 667 (91.2%) | 218 (14.8%) |
| Total | 731 (100.0%) | 1,472 (100.0%) |
Real Estate Taxes by Mortgage Status in Sausalito
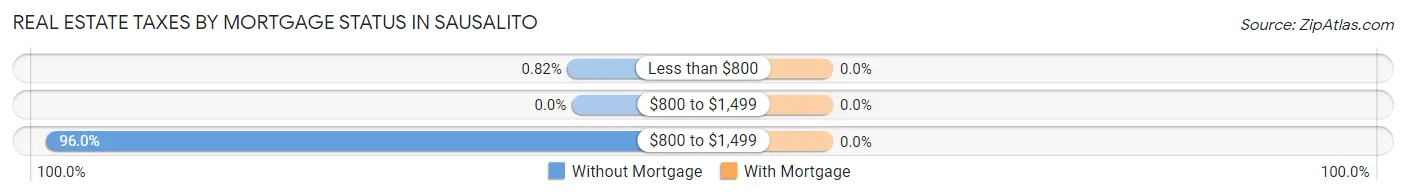
| Property Taxes | Without Mortgage | With Mortgage |
| Less than $800 | 6 (0.8%) | 0 (0.0%) |
| $800 to $1,499 | 0 (0.0%) | 0 (0.0%) |
| $800 to $1,499 | 702 (96.0%) | 0 (0.0%) |
| Total | 731 (100.0%) | 1,472 (100.0%) |
Health & Disability in Sausalito
Health Insurance Coverage by Age in Sausalito
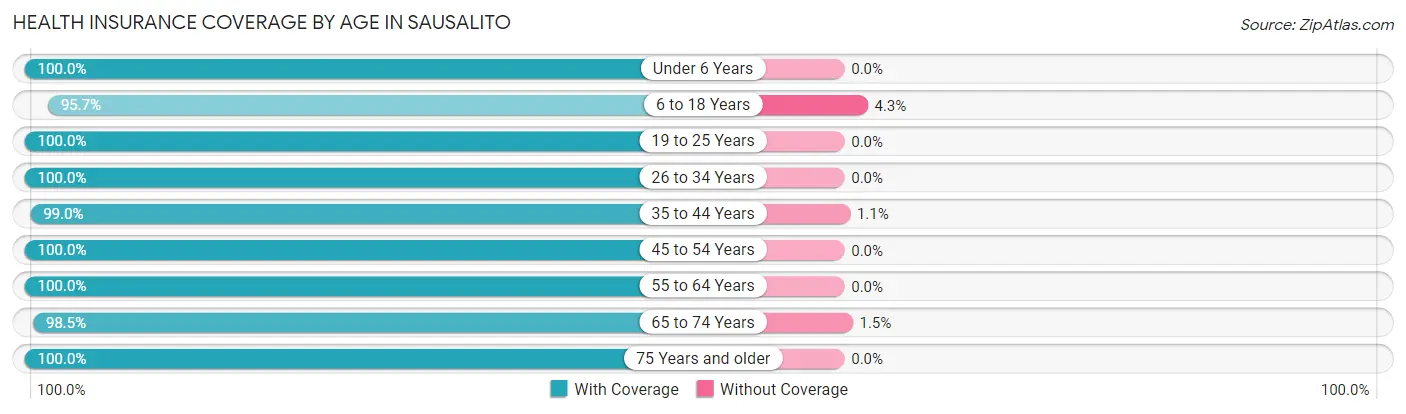
| Age Bracket | With Coverage | Without Coverage |
| Under 6 Years | 240 (100.0%) | 0 (0.0%) |
| 6 to 18 Years | 332 (95.7%) | 15 (4.3%) |
| 19 to 25 Years | 297 (100.0%) | 0 (0.0%) |
| 26 to 34 Years | 1,097 (100.0%) | 0 (0.0%) |
| 35 to 44 Years | 850 (99.0%) | 9 (1.1%) |
| 45 to 54 Years | 844 (100.0%) | 0 (0.0%) |
| 55 to 64 Years | 1,230 (100.0%) | 0 (0.0%) |
| 65 to 74 Years | 1,349 (98.5%) | 21 (1.5%) |
| 75 Years and older | 949 (100.0%) | 0 (0.0%) |
| Total | 7,188 (99.4%) | 45 (0.6%) |
Health Insurance Coverage by Citizenship Status in Sausalito
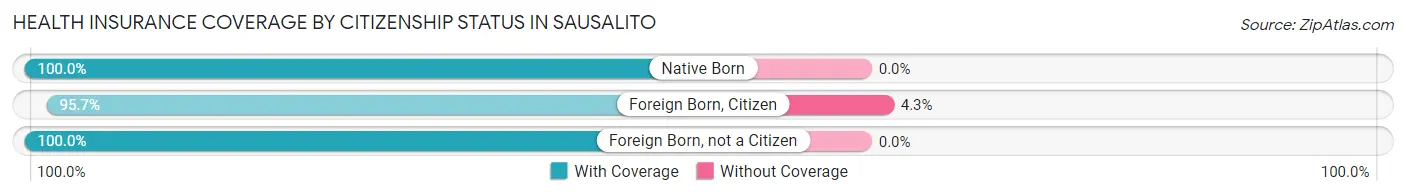
| Citizenship Status | With Coverage | Without Coverage |
| Native Born | 240 (100.0%) | 0 (0.0%) |
| Foreign Born, Citizen | 332 (95.7%) | 15 (4.3%) |
| Foreign Born, not a Citizen | 297 (100.0%) | 0 (0.0%) |
Health Insurance Coverage by Household Income in Sausalito
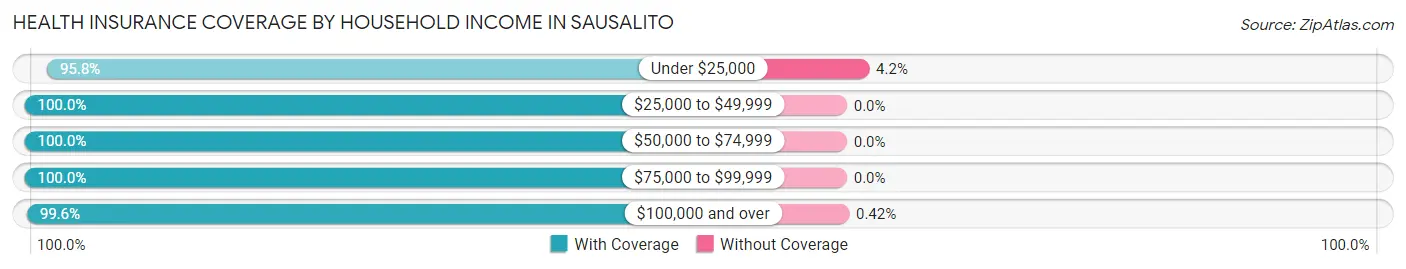
| Household Income | With Coverage | Without Coverage |
| Under $25,000 | 480 (95.8%) | 21 (4.2%) |
| $25,000 to $49,999 | 370 (100.0%) | 0 (0.0%) |
| $50,000 to $74,999 | 219 (100.0%) | 0 (0.0%) |
| $75,000 to $99,999 | 413 (100.0%) | 0 (0.0%) |
| $100,000 and over | 5,676 (99.6%) | 24 (0.4%) |
Public vs Private Health Insurance Coverage by Age in Sausalito
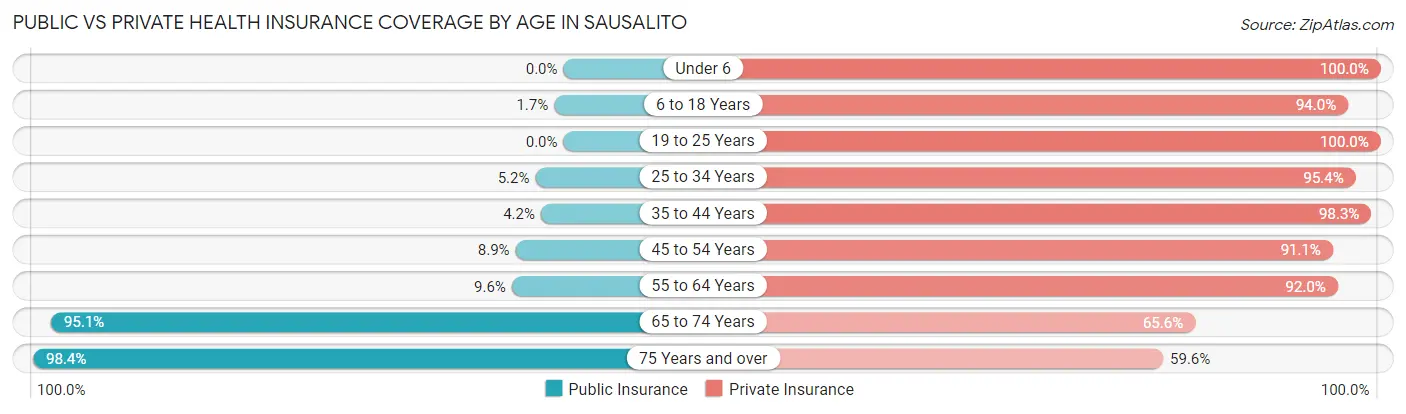
| Age Bracket | Public Insurance | Private Insurance |
| Under 6 | 0 (0.0%) | 240 (100.0%) |
| 6 to 18 Years | 6 (1.7%) | 326 (94.0%) |
| 19 to 25 Years | 0 (0.0%) | 297 (100.0%) |
| 25 to 34 Years | 57 (5.2%) | 1,046 (95.4%) |
| 35 to 44 Years | 36 (4.2%) | 844 (98.3%) |
| 45 to 54 Years | 75 (8.9%) | 769 (91.1%) |
| 55 to 64 Years | 118 (9.6%) | 1,132 (92.0%) |
| 65 to 74 Years | 1,303 (95.1%) | 898 (65.5%) |
| 75 Years and over | 934 (98.4%) | 566 (59.6%) |
| Total | 2,529 (35.0%) | 6,118 (84.6%) |
Disability Status by Sex by Age in Sausalito
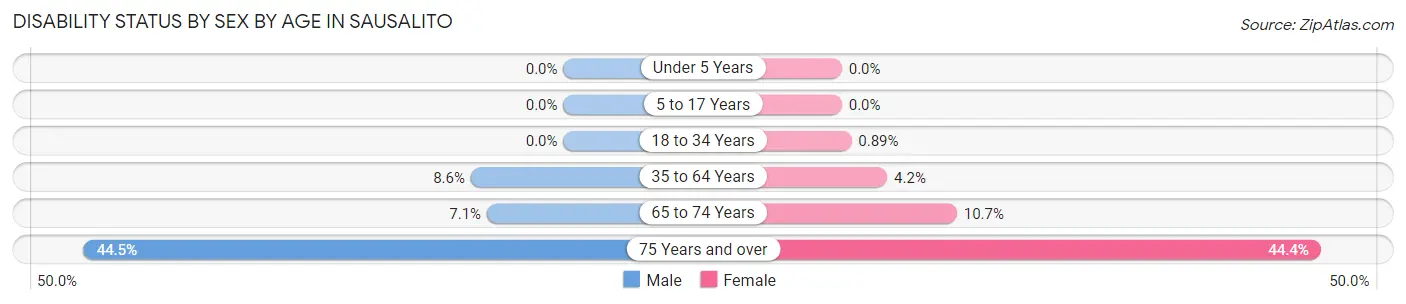
| Age Bracket | Male | Female |
| Under 5 Years | 0 (0.0%) | 0 (0.0%) |
| 5 to 17 Years | 0 (0.0%) | 0 (0.0%) |
| 18 to 34 Years | 0 (0.0%) | 6 (0.9%) |
| 35 to 64 Years | 109 (8.6%) | 70 (4.2%) |
| 65 to 74 Years | 30 (7.1%) | 101 (10.7%) |
| 75 Years and over | 182 (44.5%) | 240 (44.4%) |
Disability Class by Sex by Age in Sausalito
Disability Class: Hearing Difficulty
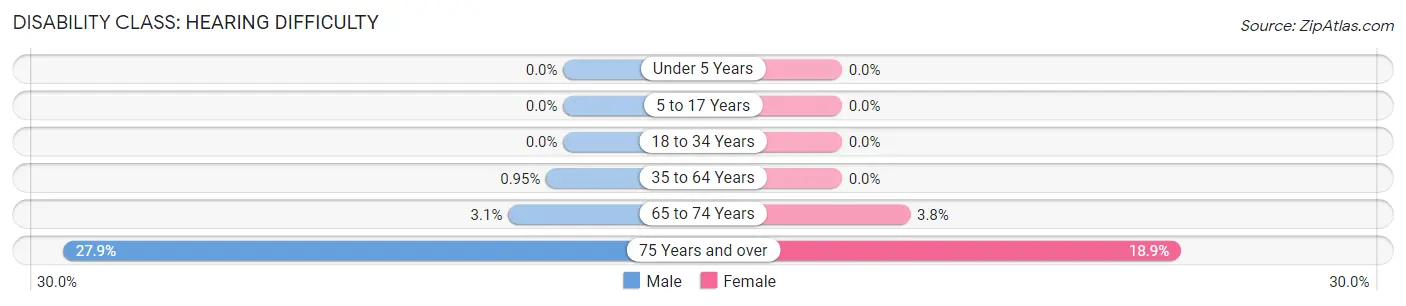
| Age Bracket | Male | Female |
| Under 5 Years | 0 (0.0%) | 0 (0.0%) |
| 5 to 17 Years | 0 (0.0%) | 0 (0.0%) |
| 18 to 34 Years | 0 (0.0%) | 0 (0.0%) |
| 35 to 64 Years | 12 (0.9%) | 0 (0.0%) |
| 65 to 74 Years | 13 (3.1%) | 36 (3.8%) |
| 75 Years and over | 114 (27.9%) | 102 (18.9%) |
Disability Class: Vision Difficulty
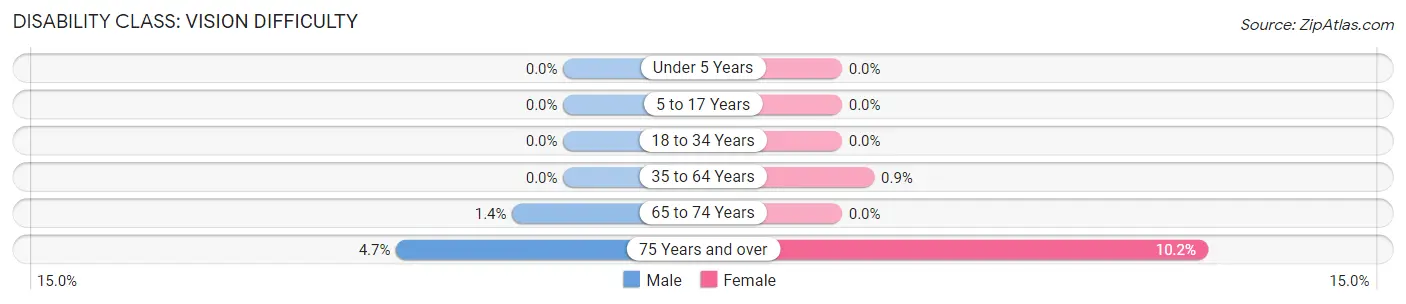
| Age Bracket | Male | Female |
| Under 5 Years | 0 (0.0%) | 0 (0.0%) |
| 5 to 17 Years | 0 (0.0%) | 0 (0.0%) |
| 18 to 34 Years | 0 (0.0%) | 0 (0.0%) |
| 35 to 64 Years | 0 (0.0%) | 15 (0.9%) |
| 65 to 74 Years | 6 (1.4%) | 0 (0.0%) |
| 75 Years and over | 19 (4.6%) | 55 (10.2%) |
Disability Class: Cognitive Difficulty
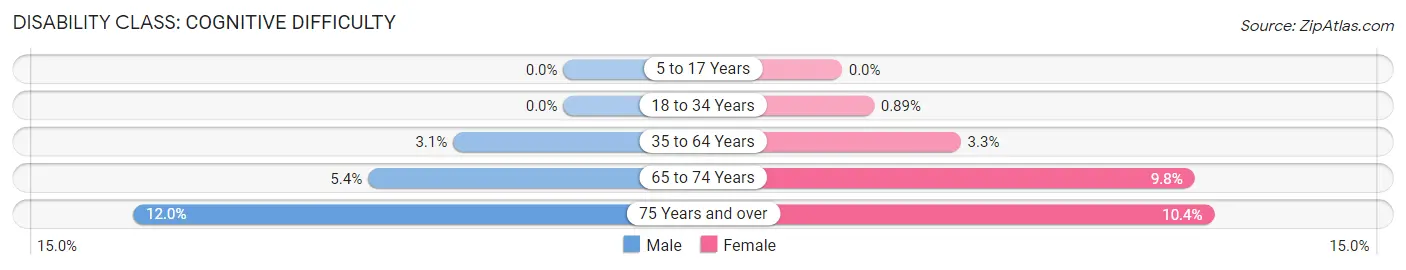
| Age Bracket | Male | Female |
| 5 to 17 Years | 0 (0.0%) | 0 (0.0%) |
| 18 to 34 Years | 0 (0.0%) | 6 (0.9%) |
| 35 to 64 Years | 39 (3.1%) | 55 (3.3%) |
| 65 to 74 Years | 23 (5.4%) | 93 (9.8%) |
| 75 Years and over | 49 (12.0%) | 56 (10.4%) |
Disability Class: Ambulatory Difficulty
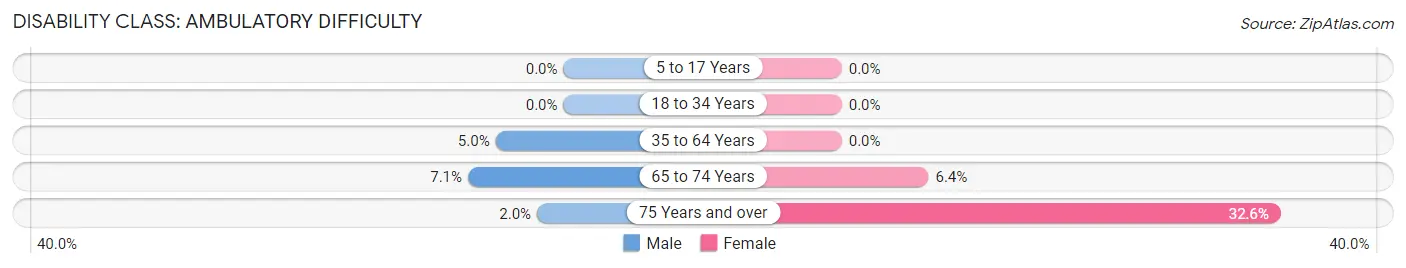
| Age Bracket | Male | Female |
| 5 to 17 Years | 0 (0.0%) | 0 (0.0%) |
| 18 to 34 Years | 0 (0.0%) | 0 (0.0%) |
| 35 to 64 Years | 64 (5.0%) | 0 (0.0%) |
| 65 to 74 Years | 30 (7.1%) | 61 (6.4%) |
| 75 Years and over | 8 (2.0%) | 176 (32.6%) |
Disability Class: Self-Care Difficulty
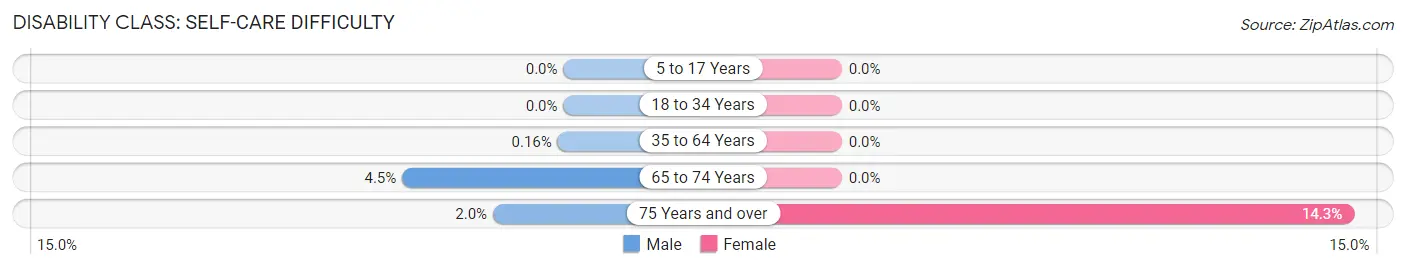
| Age Bracket | Male | Female |
| 5 to 17 Years | 0 (0.0%) | 0 (0.0%) |
| 18 to 34 Years | 0 (0.0%) | 0 (0.0%) |
| 35 to 64 Years | 2 (0.2%) | 0 (0.0%) |
| 65 to 74 Years | 19 (4.5%) | 0 (0.0%) |
| 75 Years and over | 8 (2.0%) | 77 (14.3%) |
Technology Access in Sausalito
Computing Device Access in Sausalito
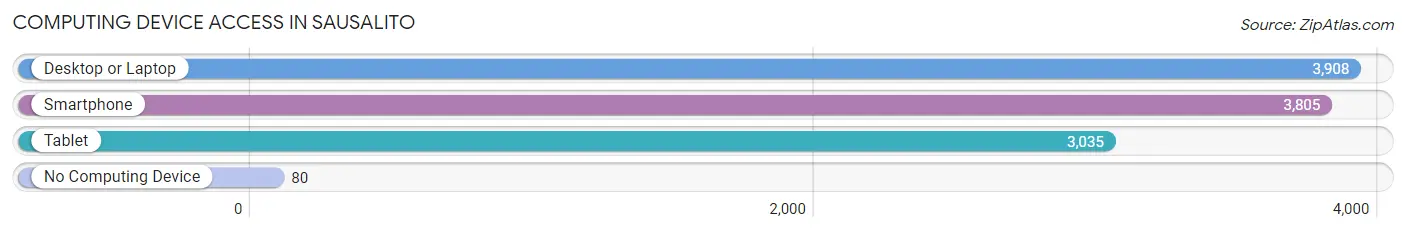
| Device Type | # Households | % Households |
| Desktop or Laptop | 3,908 | 96.3% |
| Smartphone | 3,805 | 93.8% |
| Tablet | 3,035 | 74.8% |
| No Computing Device | 80 | 2.0% |
| Total | 4,057 | 100.0% |
Internet Access in Sausalito
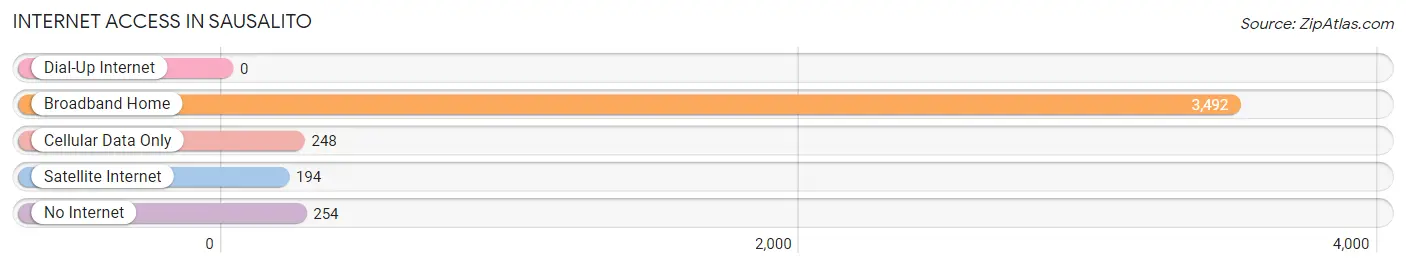
| Internet Type | # Households | % Households |
| Dial-Up Internet | 0 | 0.0% |
| Broadband Home | 3,492 | 86.1% |
| Cellular Data Only | 248 | 6.1% |
| Satellite Internet | 194 | 4.8% |
| No Internet | 254 | 6.3% |
| Total | 4,057 | 100.0% |
Sausalito Summary
Sausalito is a small city located in Marin County, California, just north of San Francisco. It is situated on the northern end of the Golden Gate Bridge, and is known for its picturesque views of the San Francisco Bay and the surrounding hills. The city has a population of approximately 7,000 people, and is a popular tourist destination.
History
The area that is now Sausalito was originally inhabited by the Coast Miwok Native American tribe. The first European settlers arrived in the area in the late 1700s, and the town was officially founded in 1868. The name “Sausalito” is derived from the Spanish word “sausal”, which means “little willow grove”.
The city was initially a fishing and shipbuilding community, and was home to a large number of Italian immigrants. In the early 1900s, the city began to attract wealthy San Franciscans who built large homes on the hillsides overlooking the bay. This influx of wealthy residents led to the development of the city’s tourist industry, which continues to be a major part of the local economy.
Geography
Sausalito is located on the northern end of the Golden Gate Bridge, and is surrounded by the San Francisco Bay on three sides. The city is situated on a hillside, and is known for its stunning views of the bay and the surrounding hills. The city is located in a temperate climate zone, and experiences mild temperatures year-round.
Economy
The economy of Sausalito is largely based on tourism. The city is home to a number of popular attractions, including the Bay Model Visitor Center, the Bay Area Discovery Museum, and the Bay Area Science Museum. The city also has a thriving arts and culture scene, with numerous galleries, shops, and restaurants.
In addition to tourism, Sausalito is also home to a number of businesses, including technology companies, boat builders, and marine supply stores. The city is also home to a number of marinas, which provide docking and storage services for boats.
Demographics
As of the 2010 census, the population of Sausalito was 7,061. The population is predominantly white (83.3%), with smaller percentages of Asian (7.2%), African American (2.2%), and Hispanic or Latino (2.1%) residents. The median household income in the city is $90,845, and the median home value is $1,092,000.
Conclusion
Sausalito is a small city located in Marin County, California, just north of San Francisco. It is situated on the northern end of the Golden Gate Bridge, and is known for its picturesque views of the San Francisco Bay and the surrounding hills. The city has a population of approximately 7,000 people, and is a popular tourist destination. The economy of Sausalito is largely based on tourism, and the city is also home to a number of businesses, including technology companies, boat builders, and marine supply stores. The population of Sausalito is predominantly white, with smaller percentages of Asian, African American, and Hispanic or Latino residents.
Common Questions
What is Per Capita Income in Sausalito?
Per Capita income in Sausalito is $125,046.
What is the Median Family Income in Sausalito?
Median Family Income in Sausalito is $238,284.
What is the Median Household income in Sausalito?
Median Household Income in Sausalito is $163,170.
What is Income or Wage Gap in Sausalito?
Income or Wage Gap in Sausalito is 29.2%.
Women in Sausalito earn 70.8 cents for every dollar earned by a man.
What is Inequality or Gini Index in Sausalito?
Inequality or Gini Index in Sausalito is 0.49.
What is the Total Population of Sausalito?
Total Population of Sausalito is 7,233.
What is the Total Male Population of Sausalito?
Total Male Population of Sausalito is 3,091.
What is the Total Female Population of Sausalito?
Total Female Population of Sausalito is 4,142.
What is the Ratio of Males per 100 Females in Sausalito?
There are 74.63 Males per 100 Females in Sausalito.
What is the Ratio of Females per 100 Males in Sausalito?
There are 134.00 Females per 100 Males in Sausalito.
What is the Median Population Age in Sausalito?
Median Population Age in Sausalito is 54.4 Years.
What is the Average Family Size in Sausalito
Average Family Size in Sausalito is 2.5 People.
What is the Average Household Size in Sausalito
Average Household Size in Sausalito is 1.8 People.
How Large is the Labor Force in Sausalito?
There are 4,393 People in the Labor Forcein in Sausalito.
What is the Percentage of People in the Labor Force in Sausalito?
65.6% of People are in the Labor Force in Sausalito.
What is the Unemployment Rate in Sausalito?
Unemployment Rate in Sausalito is 6.5%.