Linden, CA Map & Demographics
Linden Map
Linden Overview
$42,289
PER CAPITA INCOME
$81,288
AVG FAMILY INCOME
$103,712
AVG HOUSEHOLD INCOME
28.3%
WAGE / INCOME GAP [ % ]
71.7¢/ $1
WAGE / INCOME GAP [ $ ]
0.37
INEQUALITY / GINI INDEX
1,845
TOTAL POPULATION
898
MALE POPULATION
947
FEMALE POPULATION
94.83
MALES / 100 FEMALES
105.46
FEMALES / 100 MALES
35.8
MEDIAN AGE
3.0
AVG FAMILY SIZE
2.6
AVG HOUSEHOLD SIZE
866
LABOR FORCE [ PEOPLE ]
59.4%
PERCENT IN LABOR FORCE
12.6%
UNEMPLOYMENT RATE
Linden Zip Codes
Linden Area Codes
Income in Linden
Income Overview in Linden
Per Capita Income in Linden is $42,289, while median incomes of families and households are $81,288 and $103,712 respectively.
| Characteristic | Number | Measure |
| Per Capita Income | 1,845 | $42,289 |
| Median Family Income | 506 | $81,288 |
| Mean Family Income | 506 | $109,219 |
| Median Household Income | 712 | $103,712 |
| Mean Household Income | 712 | $106,735 |
| Income Deficit | 506 | $0 |
| Wage / Income Gap (%) | 1,845 | 28.34% |
| Wage / Income Gap ($) | 1,845 | 71.66¢ per $1 |
| Gini / Inequality Index | 1,845 | 0.37 |
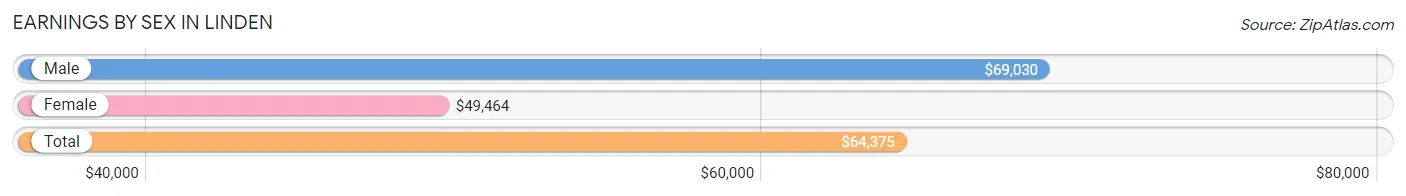
Earnings by Sex in Linden
Average Earnings in Linden are $64,375, $69,030 for men and $49,464 for women, a difference of 28.3%.
| Sex | Number | Average Earnings |
| Male | 469 (52.7%) | $69,030 |
| Female | 421 (47.3%) | $49,464 |
| Total | 890 (100.0%) | $64,375 |
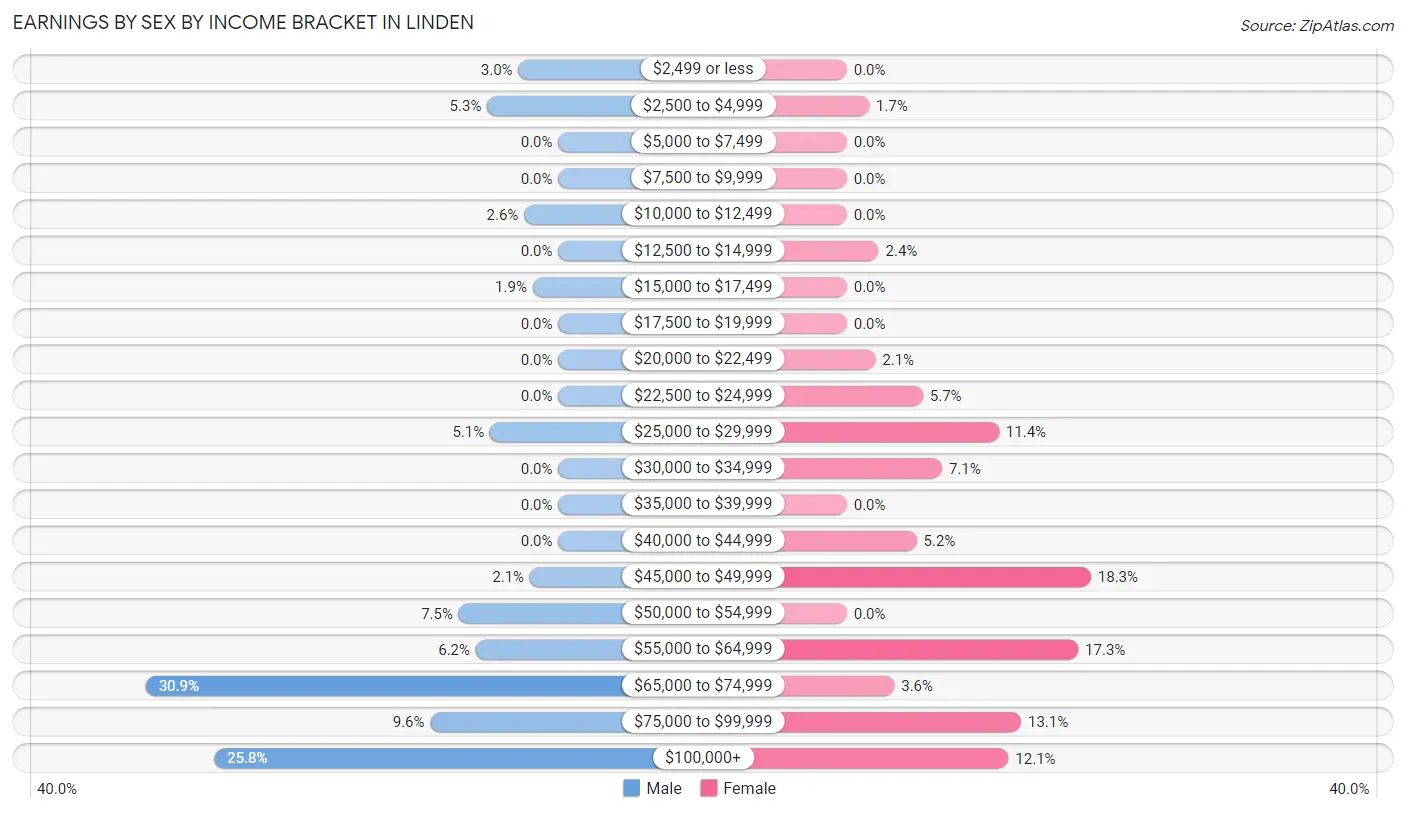
Earnings by Sex by Income Bracket in Linden
The most common earnings brackets in Linden are $65,000 to $74,999 for men (145 | 30.9%) and $45,000 to $49,999 for women (77 | 18.3%).
| Income | Male | Female |
| $2,499 or less | 14 (3.0%) | 0 (0.0%) |
| $2,500 to $4,999 | 25 (5.3%) | 7 (1.7%) |
| $5,000 to $7,499 | 0 (0.0%) | 0 (0.0%) |
| $7,500 to $9,999 | 0 (0.0%) | 0 (0.0%) |
| $10,000 to $12,499 | 12 (2.6%) | 0 (0.0%) |
| $12,500 to $14,999 | 0 (0.0%) | 10 (2.4%) |
| $15,000 to $17,499 | 9 (1.9%) | 0 (0.0%) |
| $17,500 to $19,999 | 0 (0.0%) | 0 (0.0%) |
| $20,000 to $22,499 | 0 (0.0%) | 9 (2.1%) |
| $22,500 to $24,999 | 0 (0.0%) | 24 (5.7%) |
| $25,000 to $29,999 | 24 (5.1%) | 48 (11.4%) |
| $30,000 to $34,999 | 0 (0.0%) | 30 (7.1%) |
| $35,000 to $39,999 | 0 (0.0%) | 0 (0.0%) |
| $40,000 to $44,999 | 0 (0.0%) | 22 (5.2%) |
| $45,000 to $49,999 | 10 (2.1%) | 77 (18.3%) |
| $50,000 to $54,999 | 35 (7.5%) | 0 (0.0%) |
| $55,000 to $64,999 | 29 (6.2%) | 73 (17.3%) |
| $65,000 to $74,999 | 145 (30.9%) | 15 (3.6%) |
| $75,000 to $99,999 | 45 (9.6%) | 55 (13.1%) |
| $100,000+ | 121 (25.8%) | 51 (12.1%) |
| Total | 469 (100.0%) | 421 (100.0%) |
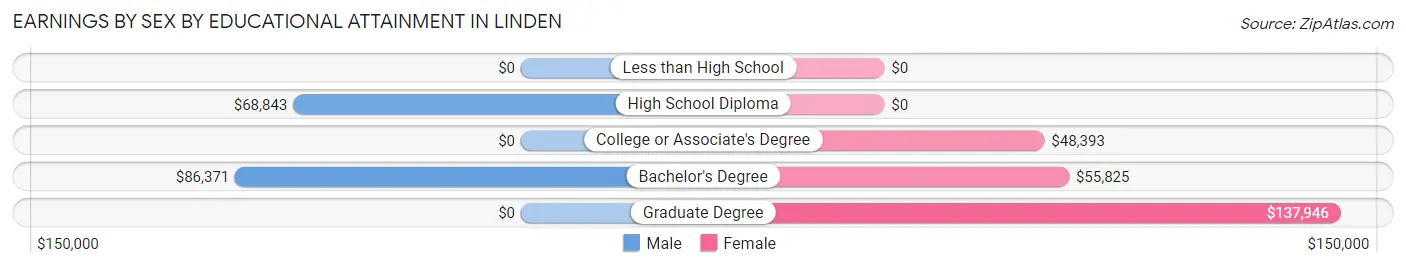
Earnings by Sex by Educational Attainment in Linden
Average earnings in Linden are $69,800 for men and $49,838 for women, a difference of 28.6%. Men with an educational attainment of bachelor's degree enjoy the highest average annual earnings of $86,371, while those with high school diploma education earn the least with $68,843. Women with an educational attainment of graduate degree earn the most with the average annual earnings of $137,946, while those with college or associate's degree education have the smallest earnings of $48,393.
| Educational Attainment | Male Income | Female Income |
| Less than High School | - | - |
| High School Diploma | $68,843 | $0 |
| College or Associate's Degree | - | - |
| Bachelor's Degree | $86,371 | $55,825 |
| Graduate Degree | - | - |
| Total | $69,800 | $49,838 |
Family Income in Linden
Family Income Brackets in Linden
According to the Linden family income data, there are 109 families falling into the $25,000 to $34,999 income range, which is the most common income bracket and makes up 21.5% of all families.
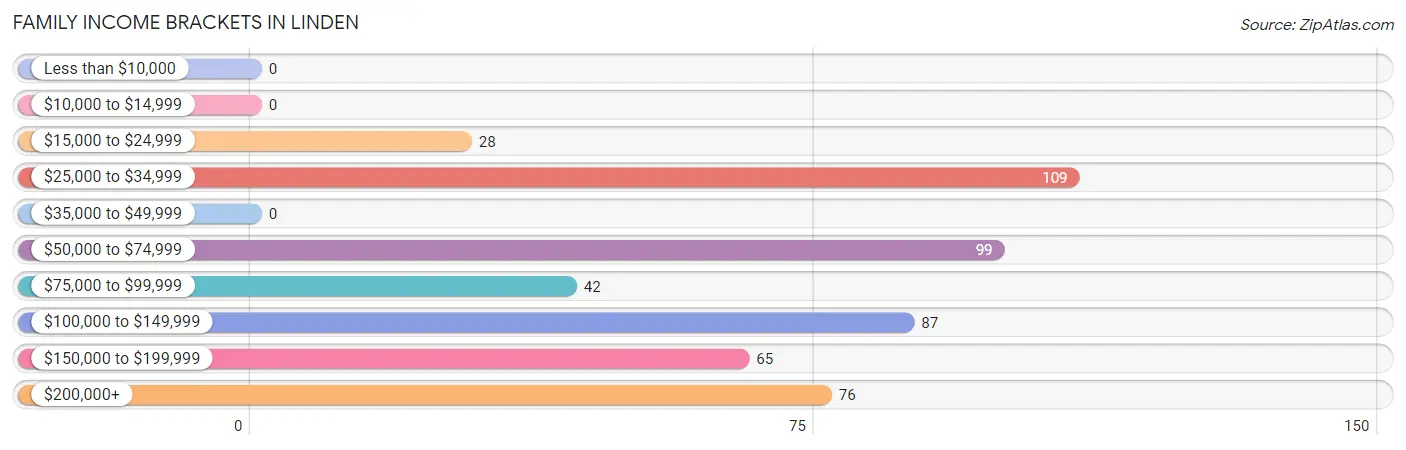
| Income Bracket | # Families | % Families |
| Less than $10,000 | 0 | 0.0% |
| $10,000 to $14,999 | 0 | 0.0% |
| $15,000 to $24,999 | 28 | 5.5% |
| $25,000 to $34,999 | 109 | 21.5% |
| $35,000 to $49,999 | 0 | 0.0% |
| $50,000 to $74,999 | 99 | 19.6% |
| $75,000 to $99,999 | 42 | 8.3% |
| $100,000 to $149,999 | 87 | 17.2% |
| $150,000 to $199,999 | 65 | 12.8% |
| $200,000+ | 76 | 15.0% |
Family Income by Famaliy Size in Linden
4-person families (66 | 13.0%) account for the highest median family income in Linden with $174,219 per family, while 4-person families (66 | 13.0%) have the highest median income of $43,555 per family member.
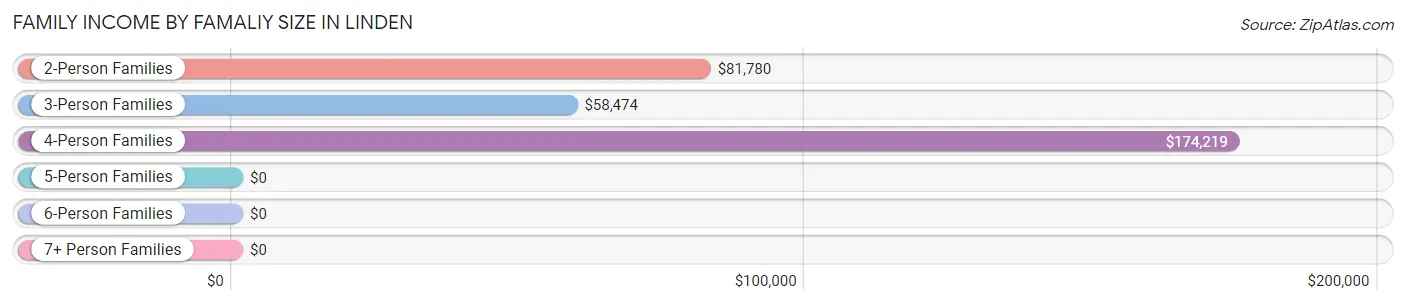
| Income Bracket | # Families | Median Income |
| 2-Person Families | 255 (50.4%) | $81,780 |
| 3-Person Families | 140 (27.7%) | $58,474 |
| 4-Person Families | 66 (13.0%) | $174,219 |
| 5-Person Families | 45 (8.9%) | $0 |
| 6-Person Families | 0 (0.0%) | $0 |
| 7+ Person Families | 0 (0.0%) | $0 |
| Total | 506 (100.0%) | $81,288 |
Family Income by Number of Earners in Linden
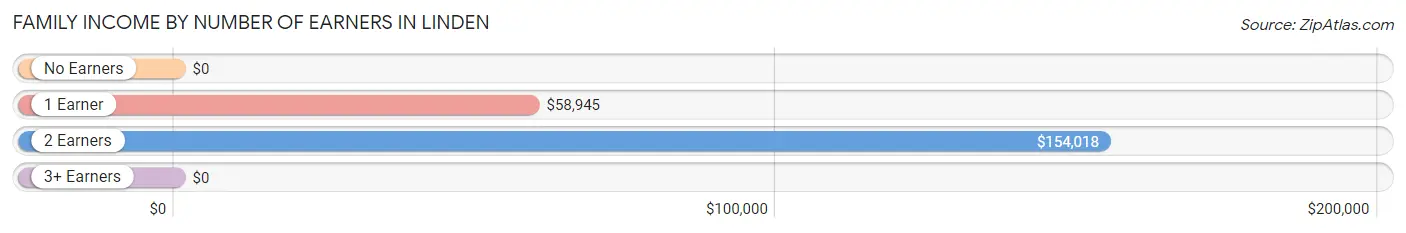
| Number of Earners | # Families | Median Income |
| No Earners | 96 (19.0%) | $0 |
| 1 Earner | 205 (40.5%) | $58,945 |
| 2 Earners | 205 (40.5%) | $154,018 |
| 3+ Earners | 0 (0.0%) | $0 |
| Total | 506 (100.0%) | $81,288 |
Household Income in Linden
Household Income Brackets in Linden
With 224 households falling in the category, the $100,000 to $149,999 income range is the most frequent in Linden, accounting for 31.5% of all households.
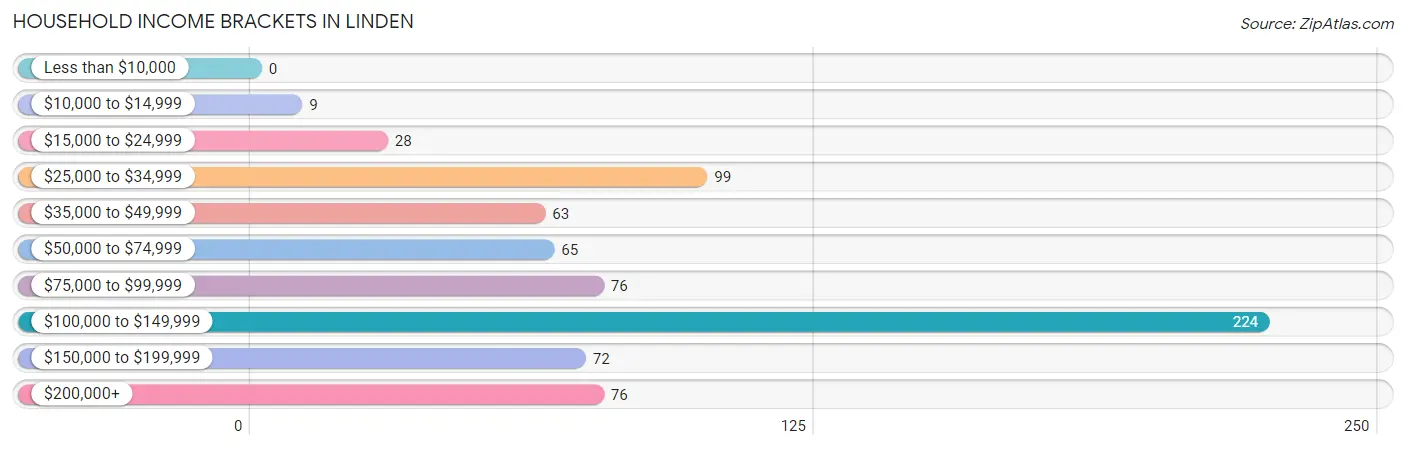
| Income Bracket | # Households | % Households |
| Less than $10,000 | 0 | 0.0% |
| $10,000 to $14,999 | 9 | 1.3% |
| $15,000 to $24,999 | 28 | 3.9% |
| $25,000 to $34,999 | 99 | 13.9% |
| $35,000 to $49,999 | 63 | 8.8% |
| $50,000 to $74,999 | 65 | 9.1% |
| $75,000 to $99,999 | 76 | 10.7% |
| $100,000 to $149,999 | 224 | 31.5% |
| $150,000 to $199,999 | 72 | 10.1% |
| $200,000+ | 76 | 10.7% |
Household Income by Householder Age in Linden
The median household income in Linden is $103,712, with the highest median household income of $126,103 found in the 25 to 44 years age bracket for the primary householder. A total of 280 households (39.3%) fall into this category. Meanwhile, the 15 to 24 years age bracket for the primary householder has the lowest median household income of $0, with 58 households (8.2%) in this group.
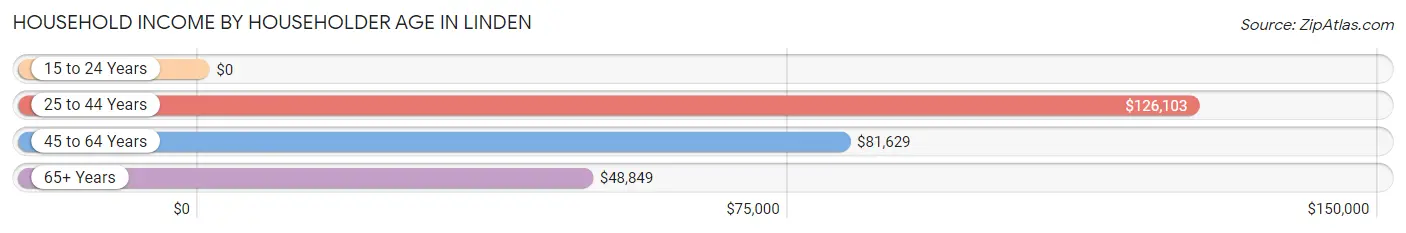
| Income Bracket | # Households | Median Income |
| 15 to 24 Years | 58 (8.2%) | $0 |
| 25 to 44 Years | 280 (39.3%) | $126,103 |
| 45 to 64 Years | 177 (24.9%) | $81,629 |
| 65+ Years | 197 (27.7%) | $48,849 |
| Total | 712 (100.0%) | $103,712 |
Poverty in Linden
Income Below Poverty by Sex and Age in Linden
With 3.2% poverty level for males and 4.9% for females among the residents of Linden, 15 year old males and 12 to 14 year old females are the most vulnerable to poverty, with 9 males (100.0%) and 9 females (39.1%) in their respective age groups living below the poverty level.
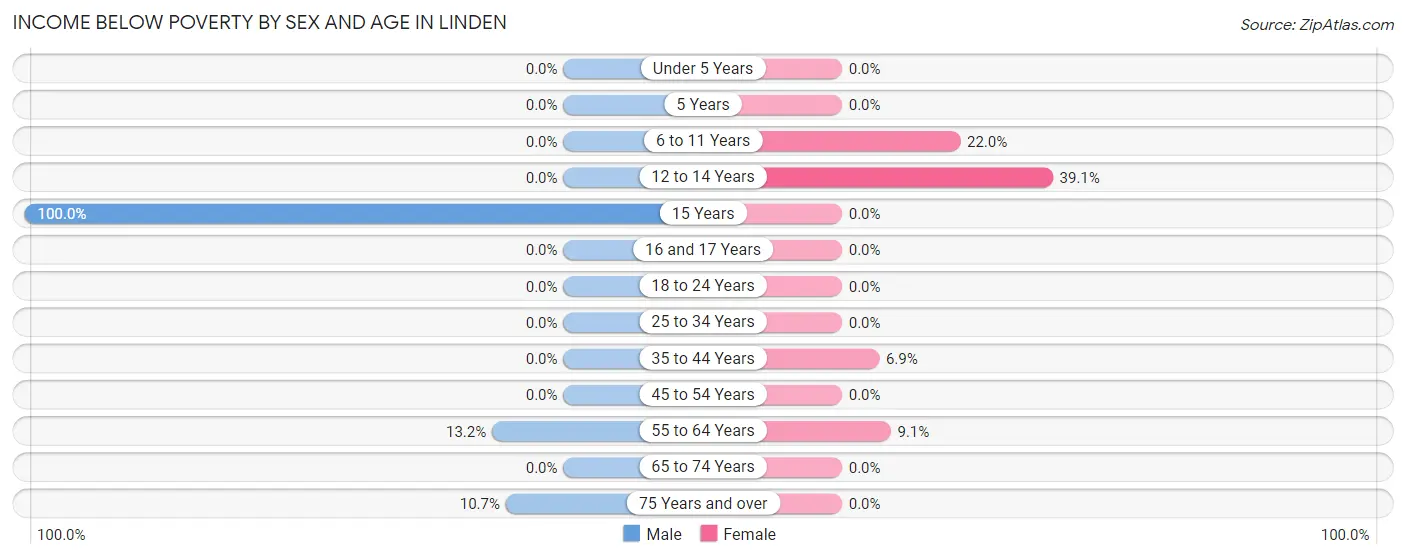
| Age Bracket | Male | Female |
| Under 5 Years | 0 (0.0%) | 0 (0.0%) |
| 5 Years | 0 (0.0%) | 0 (0.0%) |
| 6 to 11 Years | 0 (0.0%) | 9 (22.0%) |
| 12 to 14 Years | 0 (0.0%) | 9 (39.1%) |
| 15 Years | 9 (100.0%) | 0 (0.0%) |
| 16 and 17 Years | 0 (0.0%) | 0 (0.0%) |
| 18 to 24 Years | 0 (0.0%) | 0 (0.0%) |
| 25 to 34 Years | 0 (0.0%) | 0 (0.0%) |
| 35 to 44 Years | 0 (0.0%) | 10 (6.9%) |
| 45 to 54 Years | 0 (0.0%) | 0 (0.0%) |
| 55 to 64 Years | 9 (13.2%) | 18 (9.0%) |
| 65 to 74 Years | 0 (0.0%) | 0 (0.0%) |
| 75 Years and over | 11 (10.7%) | 0 (0.0%) |
| Total | 29 (3.2%) | 46 (4.9%) |
Income Above Poverty by Sex and Age in Linden
According to the poverty statistics in Linden, males aged under 5 years and females aged under 5 years are the age groups that are most secure financially, with 100.0% of males and 100.0% of females in these age groups living above the poverty line.
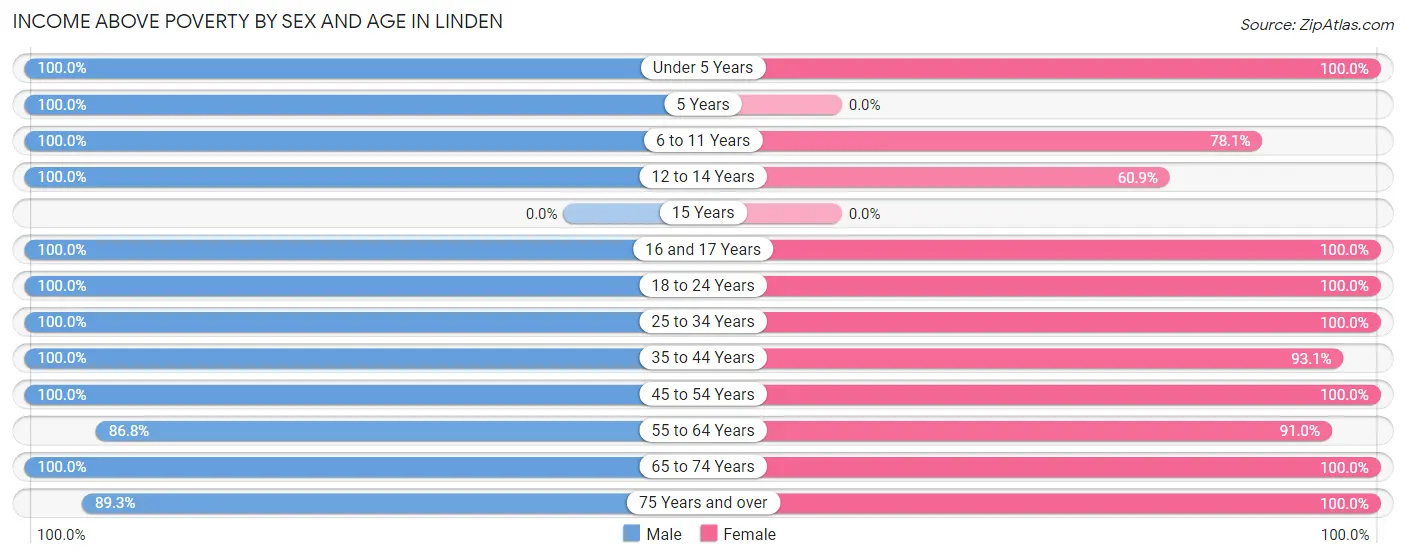
| Age Bracket | Male | Female |
| Under 5 Years | 39 (100.0%) | 126 (100.0%) |
| 5 Years | 29 (100.0%) | 0 (0.0%) |
| 6 to 11 Years | 44 (100.0%) | 32 (78.0%) |
| 12 to 14 Years | 76 (100.0%) | 14 (60.9%) |
| 15 Years | 0 (0.0%) | 0 (0.0%) |
| 16 and 17 Years | 107 (100.0%) | 24 (100.0%) |
| 18 to 24 Years | 80 (100.0%) | 47 (100.0%) |
| 25 to 34 Years | 96 (100.0%) | 116 (100.0%) |
| 35 to 44 Years | 168 (100.0%) | 135 (93.1%) |
| 45 to 54 Years | 43 (100.0%) | 44 (100.0%) |
| 55 to 64 Years | 59 (86.8%) | 181 (90.9%) |
| 65 to 74 Years | 36 (100.0%) | 52 (100.0%) |
| 75 Years and over | 92 (89.3%) | 130 (100.0%) |
| Total | 869 (96.8%) | 901 (95.1%) |
Income Below Poverty Among Married-Couple Families in Linden
The poverty statistics for married-couple families in Linden show that 2.7% or 9 of the total 337 families live below the poverty line. Families with no children have the highest poverty rate of 4.0%, comprising of 9 families. On the other hand, families with 1 or 2 children have the lowest poverty rate of 0.0%, which includes 0 families.
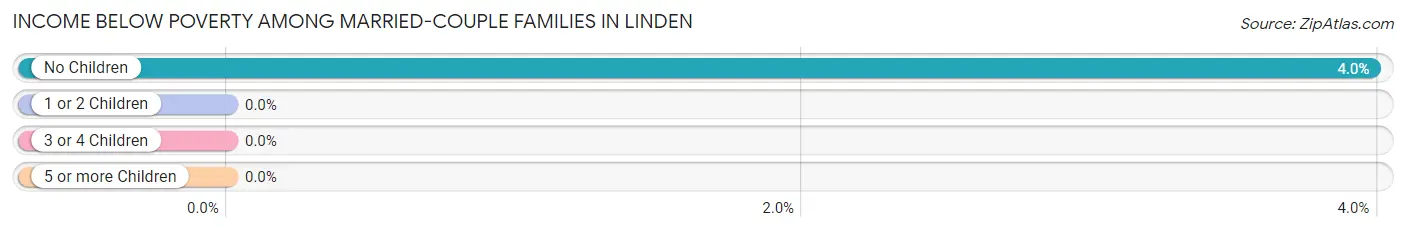
| Children | Above Poverty | Below Poverty |
| No Children | 217 (96.0%) | 9 (4.0%) |
| 1 or 2 Children | 81 (100.0%) | 0 (0.0%) |
| 3 or 4 Children | 30 (100.0%) | 0 (0.0%) |
| 5 or more Children | 0 (0.0%) | 0 (0.0%) |
| Total | 328 (97.3%) | 9 (2.7%) |
Income Below Poverty Among Single-Parent Households in Linden
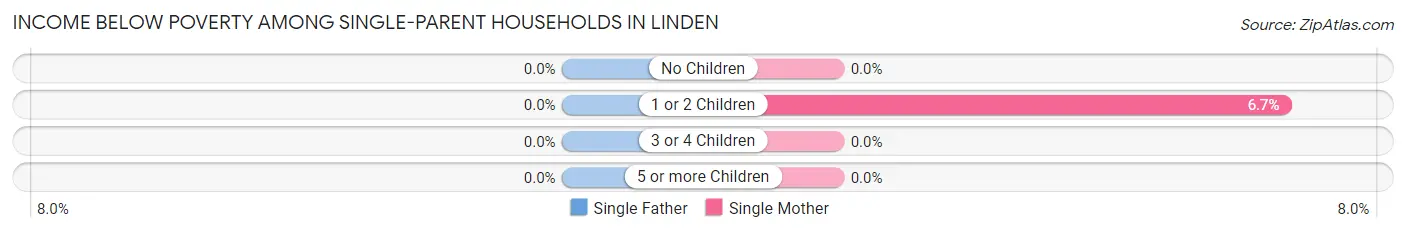
| Children | Single Father | Single Mother |
| No Children | 0 (0.0%) | 0 (0.0%) |
| 1 or 2 Children | 0 (0.0%) | 10 (6.7%) |
| 3 or 4 Children | 0 (0.0%) | 0 (0.0%) |
| 5 or more Children | 0 (0.0%) | 0 (0.0%) |
| Total | 0 (0.0%) | 10 (5.9%) |
Income Below Poverty Among Married-Couple vs Single-Parent Households in Linden
The poverty data for Linden shows that 9 of the married-couple family households (2.7%) and 10 of the single-parent households (5.9%) are living below the poverty level. Within the married-couple family households, those with no children have the highest poverty rate, with 9 households (4.0%) falling below the poverty line. Among the single-parent households, those with 1 or 2 children have the highest poverty rate, with 10 household (6.7%) living below poverty.
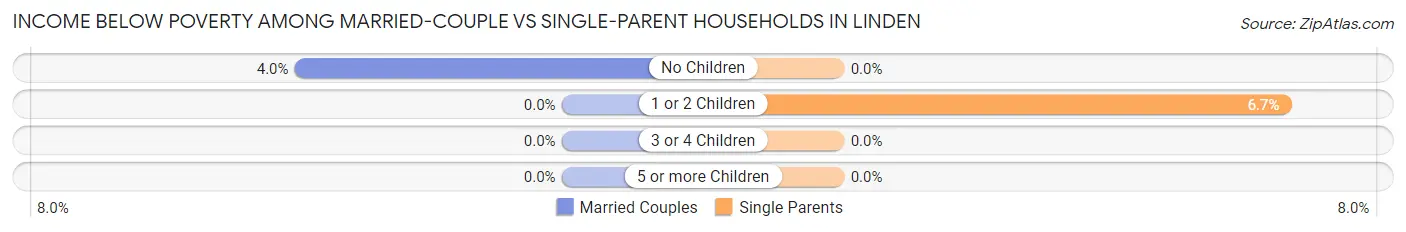
| Children | Married-Couple Families | Single-Parent Households |
| No Children | 9 (4.0%) | 0 (0.0%) |
| 1 or 2 Children | 0 (0.0%) | 10 (6.7%) |
| 3 or 4 Children | 0 (0.0%) | 0 (0.0%) |
| 5 or more Children | 0 (0.0%) | 0 (0.0%) |
| Total | 9 (2.7%) | 10 (5.9%) |
Race in Linden
The most populous races in Linden are White / Caucasian (1,404 | 76.1%), Hispanic or Latino (466 | 25.3%), and Two or more Races (317 | 17.2%).
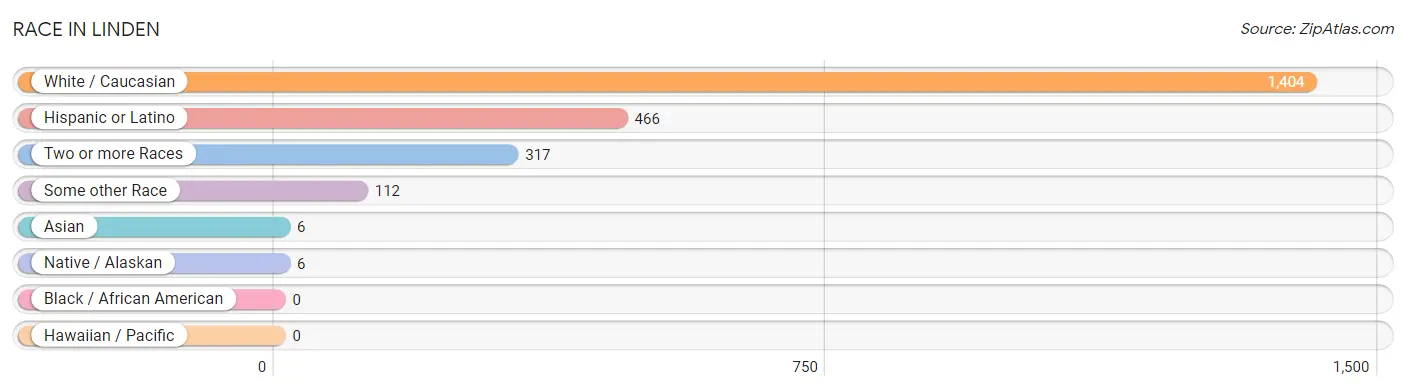
| Race | # Population | % Population |
| Asian | 6 | 0.3% |
| Black / African American | 0 | 0.0% |
| Hawaiian / Pacific | 0 | 0.0% |
| Hispanic or Latino | 466 | 25.3% |
| Native / Alaskan | 6 | 0.3% |
| White / Caucasian | 1,404 | 76.1% |
| Two or more Races | 317 | 17.2% |
| Some other Race | 112 | 6.1% |
| Total | 1,845 | 100.0% |
Ancestry in Linden
The most populous ancestries reported in Linden are Italian (464 | 25.2%), German (332 | 18.0%), Mexican (295 | 16.0%), English (229 | 12.4%), and Dutch (227 | 12.3%), together accounting for 83.8% of all Linden residents.
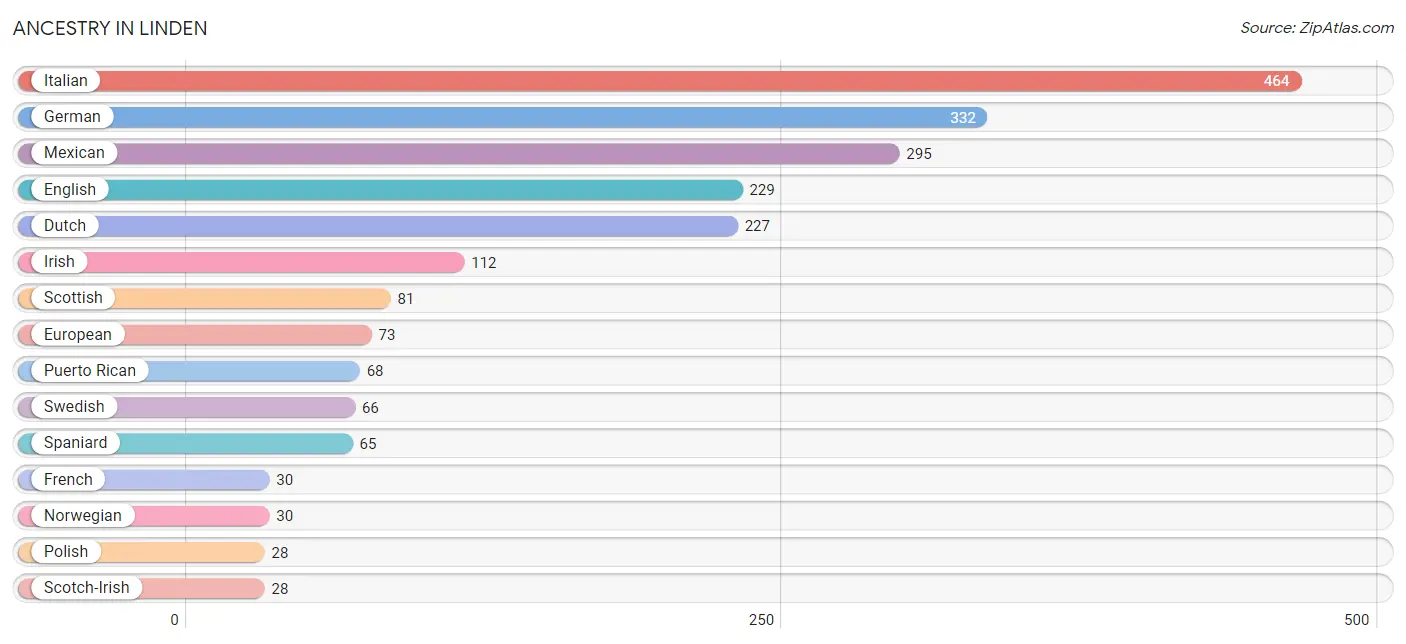
| Ancestry | # Population | % Population |
| American | 15 | 0.8% |
| Bhutanese | 6 | 0.3% |
| British | 18 | 1.0% |
| Crow | 25 | 1.4% |
| Dutch | 227 | 12.3% |
| English | 229 | 12.4% |
| European | 73 | 4.0% |
| French | 30 | 1.6% |
| French Canadian | 17 | 0.9% |
| German | 332 | 18.0% |
| Irish | 112 | 6.1% |
| Italian | 464 | 25.2% |
| Mexican | 295 | 16.0% |
| Navajo | 6 | 0.3% |
| Norwegian | 30 | 1.6% |
| Polish | 28 | 1.5% |
| Puerto Rican | 68 | 3.7% |
| Scotch-Irish | 28 | 1.5% |
| Scottish | 81 | 4.4% |
| Spaniard | 65 | 3.5% |
| Swedish | 66 | 3.6% |
| Ukrainian | 28 | 1.5% | View All 22 Rows |
Immigrants in Linden
The most numerous immigrant groups reported in Linden came from Europe (33 | 1.8%), Northern Europe (33 | 1.8%), Sweden (33 | 1.8%), Central America (6 | 0.3%), and Latin America (6 | 0.3%), together accounting for 6.0% of all Linden residents.
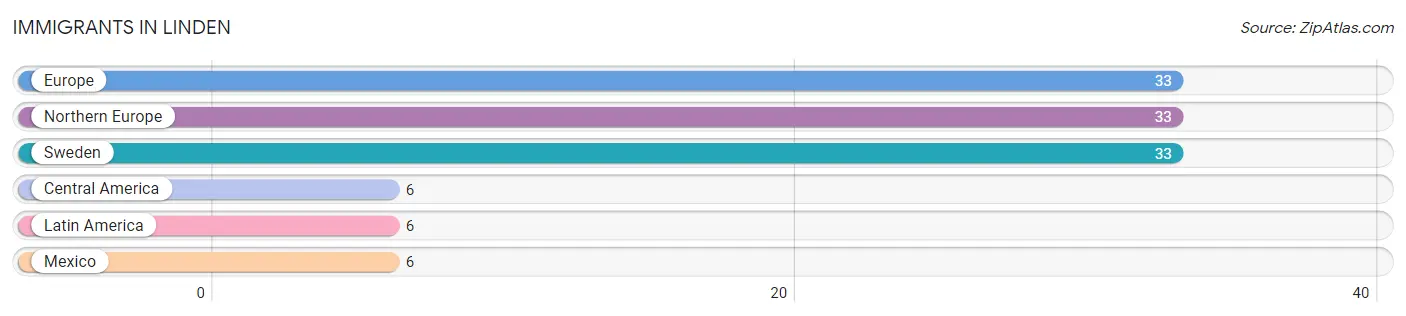
| Immigration Origin | # Population | % Population |
| Central America | 6 | 0.3% |
| Europe | 33 | 1.8% |
| Latin America | 6 | 0.3% |
| Mexico | 6 | 0.3% |
| Northern Europe | 33 | 1.8% |
| Sweden | 33 | 1.8% | View All 6 Rows |
Sex and Age in Linden
Sex and Age in Linden
The most populous age groups in Linden are 15 to 19 Years (116 | 12.9%) for men and 60 to 64 Years (165 | 17.4%) for women.
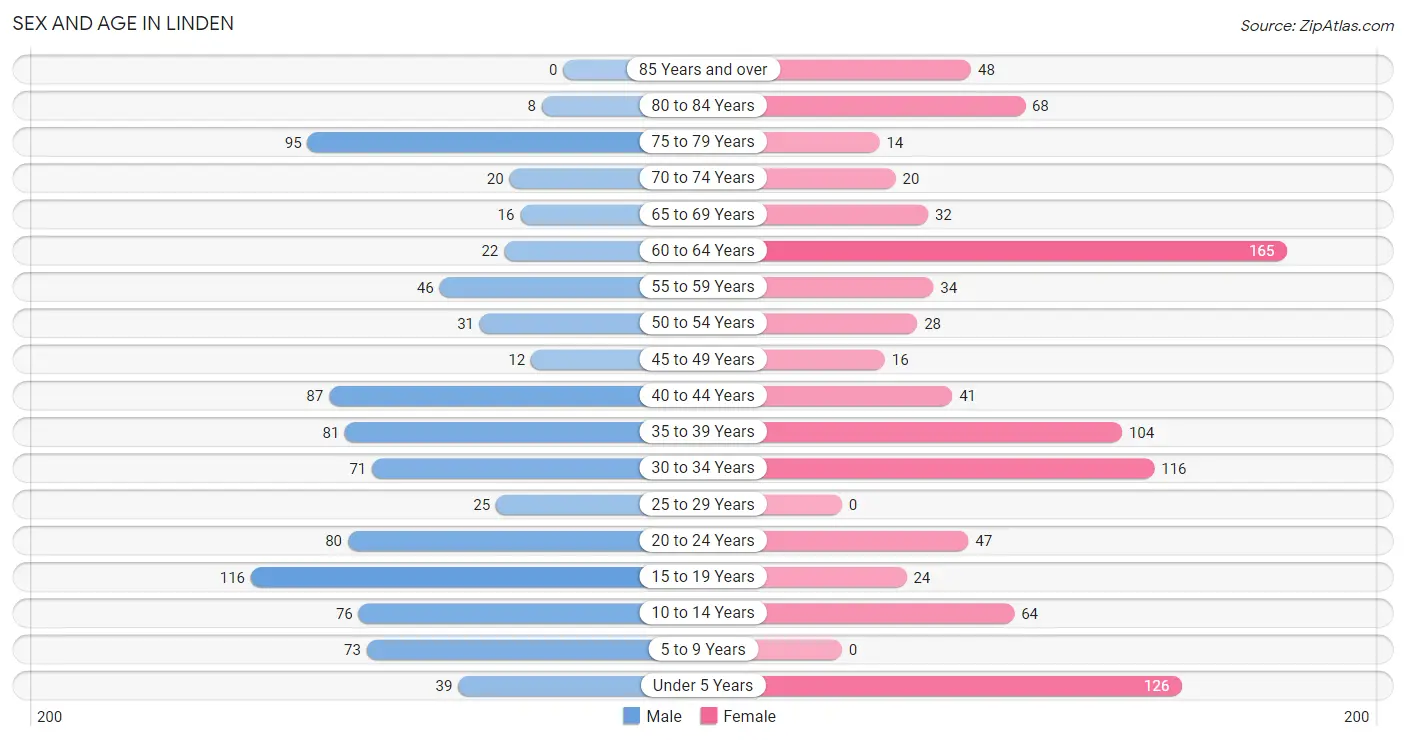
| Age Bracket | Male | Female |
| Under 5 Years | 39 (4.3%) | 126 (13.3%) |
| 5 to 9 Years | 73 (8.1%) | 0 (0.0%) |
| 10 to 14 Years | 76 (8.5%) | 64 (6.8%) |
| 15 to 19 Years | 116 (12.9%) | 24 (2.5%) |
| 20 to 24 Years | 80 (8.9%) | 47 (5.0%) |
| 25 to 29 Years | 25 (2.8%) | 0 (0.0%) |
| 30 to 34 Years | 71 (7.9%) | 116 (12.2%) |
| 35 to 39 Years | 81 (9.0%) | 104 (11.0%) |
| 40 to 44 Years | 87 (9.7%) | 41 (4.3%) |
| 45 to 49 Years | 12 (1.3%) | 16 (1.7%) |
| 50 to 54 Years | 31 (3.5%) | 28 (3.0%) |
| 55 to 59 Years | 46 (5.1%) | 34 (3.6%) |
| 60 to 64 Years | 22 (2.5%) | 165 (17.4%) |
| 65 to 69 Years | 16 (1.8%) | 32 (3.4%) |
| 70 to 74 Years | 20 (2.2%) | 20 (2.1%) |
| 75 to 79 Years | 95 (10.6%) | 14 (1.5%) |
| 80 to 84 Years | 8 (0.9%) | 68 (7.2%) |
| 85 Years and over | 0 (0.0%) | 48 (5.1%) |
| Total | 898 (100.0%) | 947 (100.0%) |
Families and Households in Linden
Median Family Size in Linden
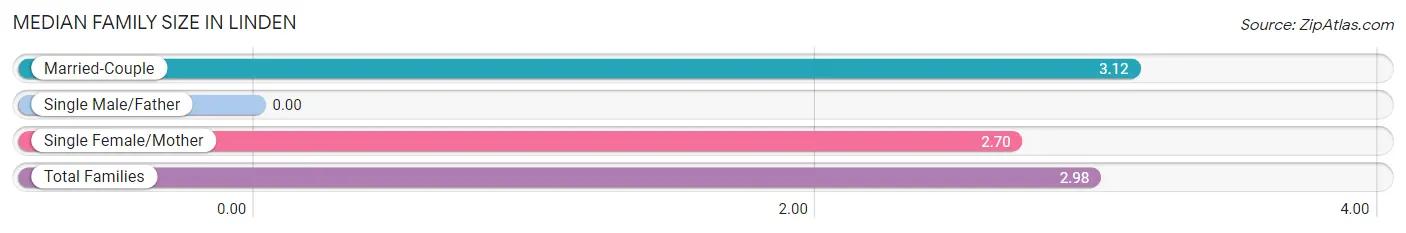
| Family Type | # Families | Family Size |
| Married-Couple | 337 (66.6%) | 3.12 |
| Single Male/Father | 0 (0.0%) | - |
| Single Female/Mother | 169 (33.4%) | 2.70 |
| Total Families | 506 (100.0%) | 2.98 |
Median Household Size in Linden
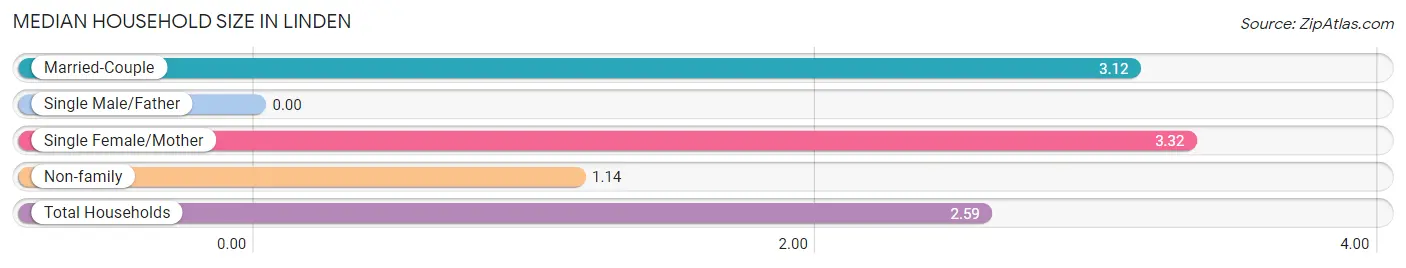
| Household Type | # Households | Household Size |
| Married-Couple | 337 (47.3%) | 3.12 |
| Single Male/Father | 0 (0.0%) | - |
| Single Female/Mother | 169 (23.7%) | 3.32 |
| Non-family | 206 (28.9%) | 1.14 |
| Total Households | 712 (100.0%) | 2.59 |
Household Size by Marriage Status in Linden
Out of a total of 712 households in Linden, 506 (71.1%) are family households, while 206 (28.9%) are nonfamily households. The most numerous type of family households are 2-person households, comprising 236, and the most common type of nonfamily households are 1-person households, comprising 183.
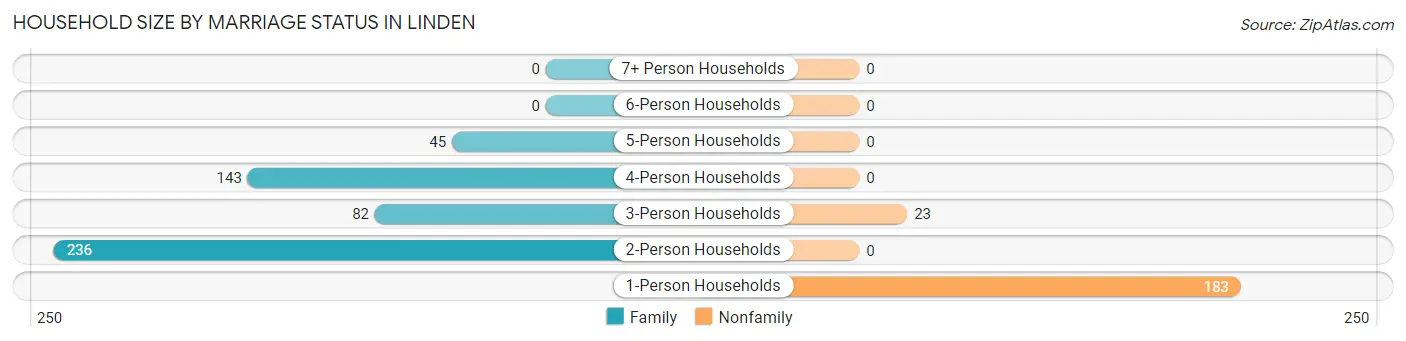
| Household Size | Family Households | Nonfamily Households |
| 1-Person Households | - | 183 (25.7%) |
| 2-Person Households | 236 (33.2%) | 0 (0.0%) |
| 3-Person Households | 82 (11.5%) | 23 (3.2%) |
| 4-Person Households | 143 (20.1%) | 0 (0.0%) |
| 5-Person Households | 45 (6.3%) | 0 (0.0%) |
| 6-Person Households | 0 (0.0%) | 0 (0.0%) |
| 7+ Person Households | 0 (0.0%) | 0 (0.0%) |
| Total | 506 (71.1%) | 206 (28.9%) |
Female Fertility in Linden
Fertility by Age in Linden
Average fertility rate in Linden is 39.0 births per 1,000 women. Women in the age bracket of 20 to 34 years have the highest fertility rate with 86.0 births per 1,000 women. Women in the age bracket of 20 to 34 years acount for 100.0% of all women with births.
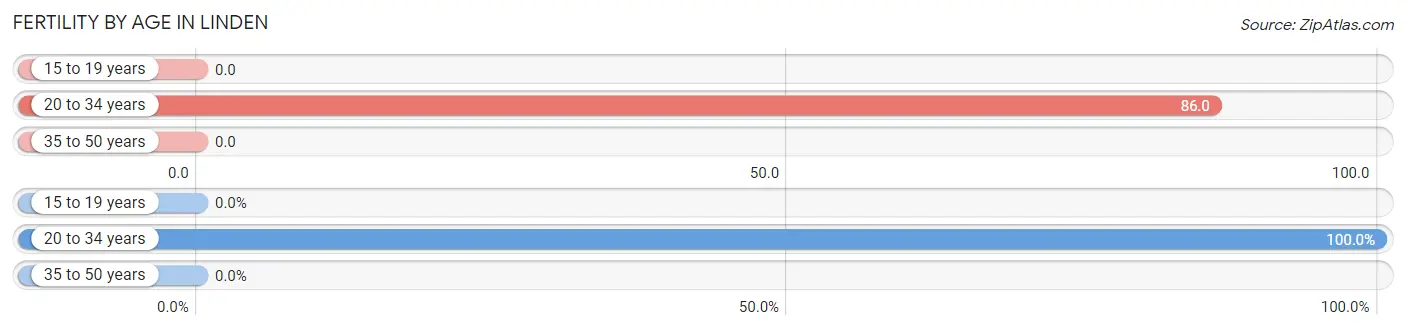
| Age Bracket | Women with Births | Births / 1,000 Women |
| 15 to 19 years | 0 (0.0%) | 0.0 |
| 20 to 34 years | 14 (100.0%) | 86.0 |
| 35 to 50 years | 0 (0.0%) | 0.0 |
| Total | 14 (100.0%) | 39.0 |
Fertility by Age by Marriage Status in Linden
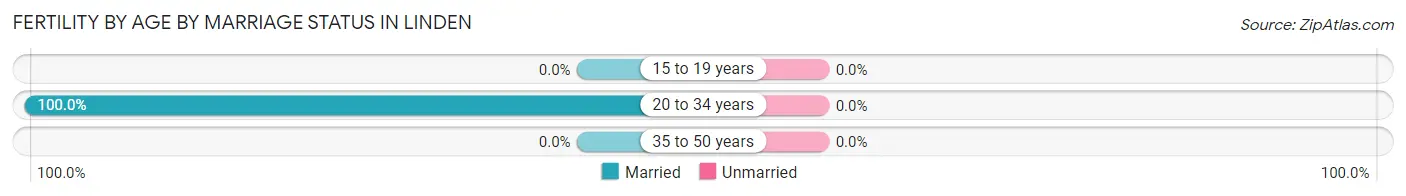
| Age Bracket | Married | Unmarried |
| 15 to 19 years | 0 (0.0%) | 0 (0.0%) |
| 20 to 34 years | 14 (100.0%) | 0 (0.0%) |
| 35 to 50 years | 0 (0.0%) | 0 (0.0%) |
| Total | 14 (100.0%) | 0 (0.0%) |
Fertility by Education in Linden
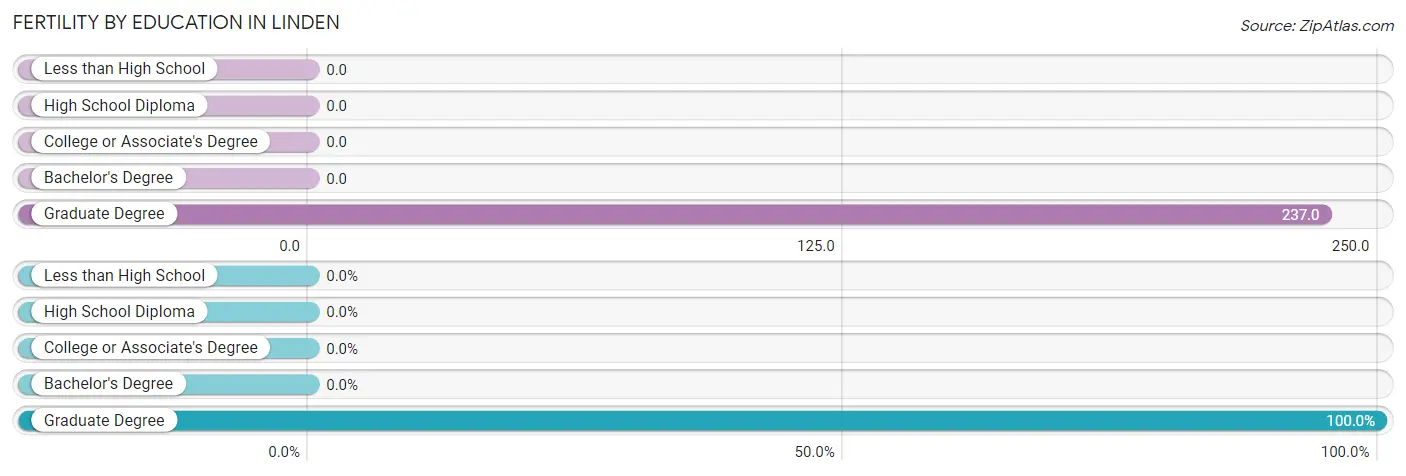
| Educational Attainment | Women with Births | Births / 1,000 Women |
| Less than High School | 0 (0.0%) | 0.0 |
| High School Diploma | 0 (0.0%) | 0.0 |
| College or Associate's Degree | 0 (0.0%) | 0.0 |
| Bachelor's Degree | 0 (0.0%) | 0.0 |
| Graduate Degree | 14 (100.0%) | 237.0 |
| Total | 14 (100.0%) | 39.0 |
Fertility by Education by Marriage Status in Linden
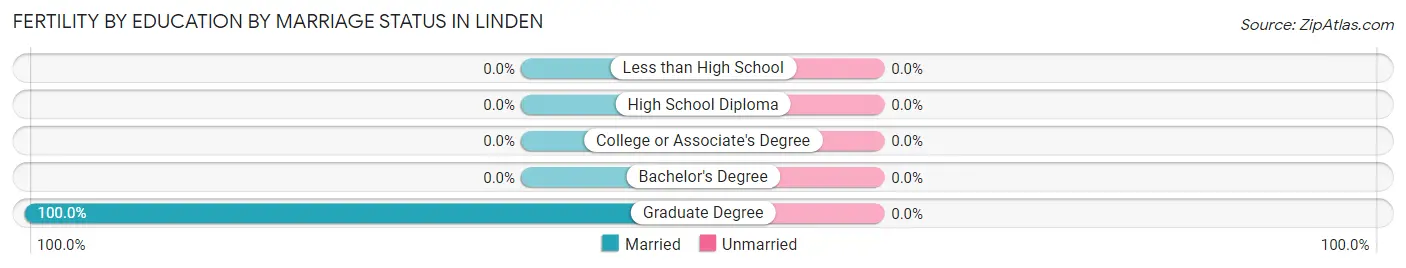
| Educational Attainment | Married | Unmarried |
| Less than High School | 0 (0.0%) | 0 (0.0%) |
| High School Diploma | 0 (0.0%) | 0 (0.0%) |
| College or Associate's Degree | 0 (0.0%) | 0 (0.0%) |
| Bachelor's Degree | 0 (0.0%) | 0 (0.0%) |
| Graduate Degree | 14 (100.0%) | 0 (0.0%) |
| Total | 14 (100.0%) | 0 (0.0%) |
Employment Characteristics in Linden
Employment by Class of Employer in Linden
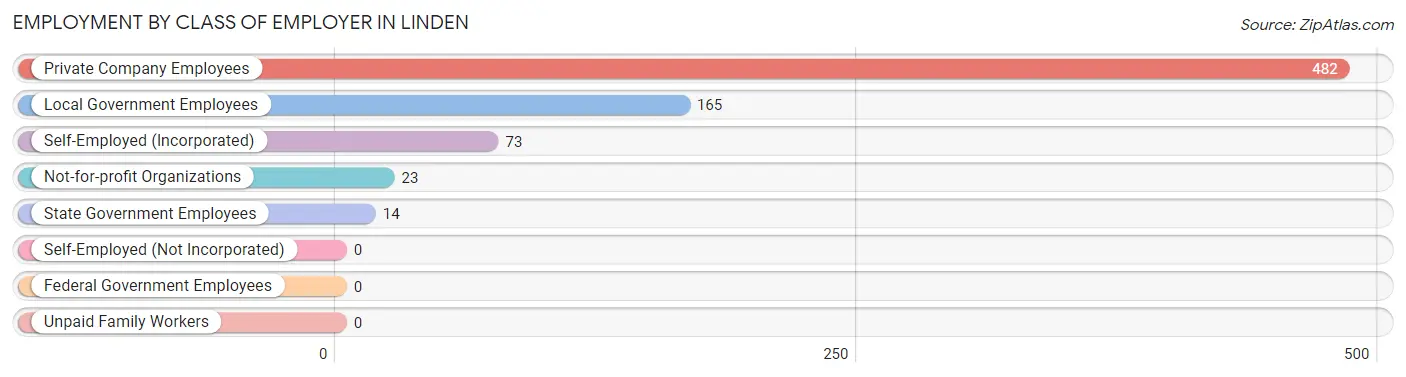
Among the 757 employed individuals in Linden, private company employees (482 | 63.7%), local government employees (165 | 21.8%), and self-employed (incorporated) (73 | 9.6%) make up the most common classes of employment.
| Employer Class | # Employees | % Employees |
| Private Company Employees | 482 | 63.7% |
| Self-Employed (Incorporated) | 73 | 9.6% |
| Self-Employed (Not Incorporated) | 0 | 0.0% |
| Not-for-profit Organizations | 23 | 3.0% |
| Local Government Employees | 165 | 21.8% |
| State Government Employees | 14 | 1.8% |
| Federal Government Employees | 0 | 0.0% |
| Unpaid Family Workers | 0 | 0.0% |
| Total | 757 | 100.0% |
Employment Status by Age in Linden
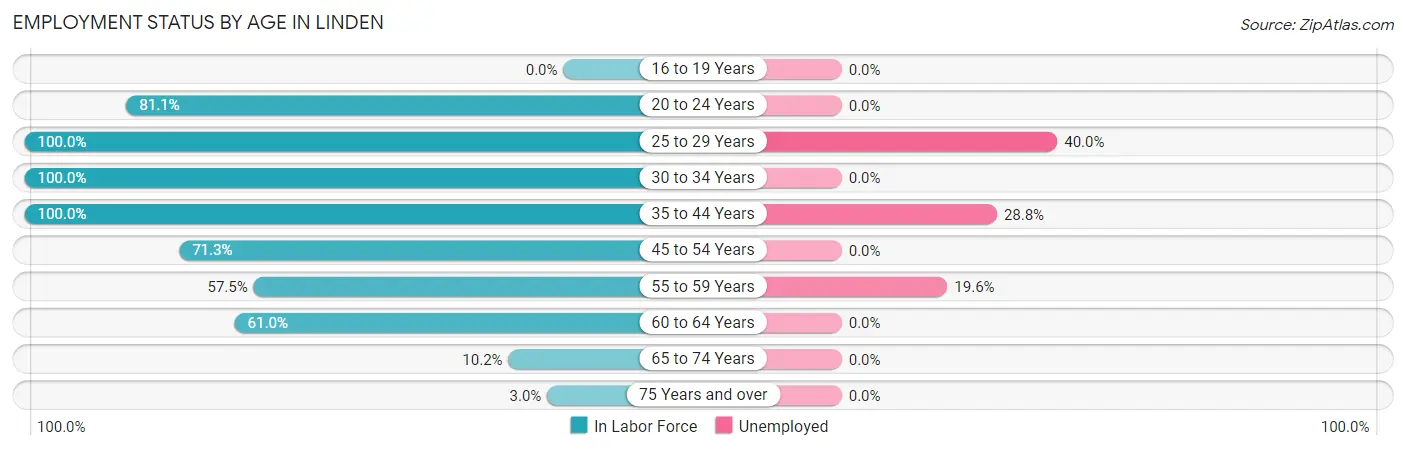
According to the labor force statistics for Linden, out of the total population over 16 years of age (1,458), 59.4% or 866 individuals are in the labor force, with 12.6% or 109 of them unemployed. The age group with the highest labor force participation rate is 25 to 29 years, with 100.0% or 25 individuals in the labor force. Within the labor force, the 25 to 29 years age range has the highest percentage of unemployed individuals, with 40.0% or 10 of them being unemployed.
| Age Bracket | In Labor Force | Unemployed |
| 16 to 19 Years | 0 (0.0%) | 0 (0.0%) |
| 20 to 24 Years | 103 (81.1%) | 0 (0.0%) |
| 25 to 29 Years | 25 (100.0%) | 10 (40.0%) |
| 30 to 34 Years | 187 (100.0%) | 0 (0.0%) |
| 35 to 44 Years | 313 (100.0%) | 90 (28.8%) |
| 45 to 54 Years | 62 (71.3%) | 0 (0.0%) |
| 55 to 59 Years | 46 (57.5%) | 9 (19.6%) |
| 60 to 64 Years | 114 (61.0%) | 0 (0.0%) |
| 65 to 74 Years | 9 (10.2%) | 0 (0.0%) |
| 75 Years and over | 7 (3.0%) | 0 (0.0%) |
| Total | 866 (59.4%) | 109 (12.6%) |
Employment Status by Educational Attainment in Linden
According to labor force statistics for Linden, 85.0% of individuals (747) out of the total population between 25 and 64 years of age (879) are in the labor force, with 14.6% or 109 of them being unemployed. The group with the highest labor force participation rate are those with the educational attainment of bachelor's degree or higher, with 97.5% or 355 individuals in the labor force. Within the labor force, individuals with college / associate degree education have the highest percentage of unemployment, with 43.0% or 96 of them being unemployed.
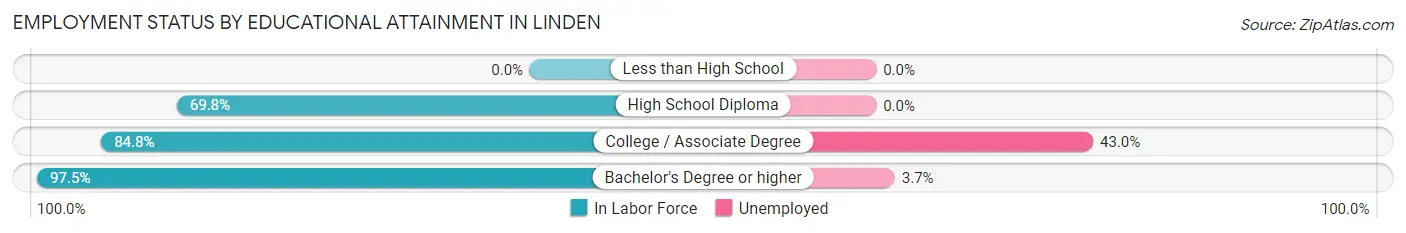
| Educational Attainment | In Labor Force | Unemployed |
| Less than High School | 0 (0.0%) | 0 (0.0%) |
| High School Diploma | 169 (69.8%) | 0 (0.0%) |
| College / Associate Degree | 223 (84.8%) | 113 (43.0%) |
| Bachelor's Degree or higher | 355 (97.5%) | 13 (3.7%) |
| Total | 747 (85.0%) | 128 (14.6%) |
Employment Occupations by Sex in Linden
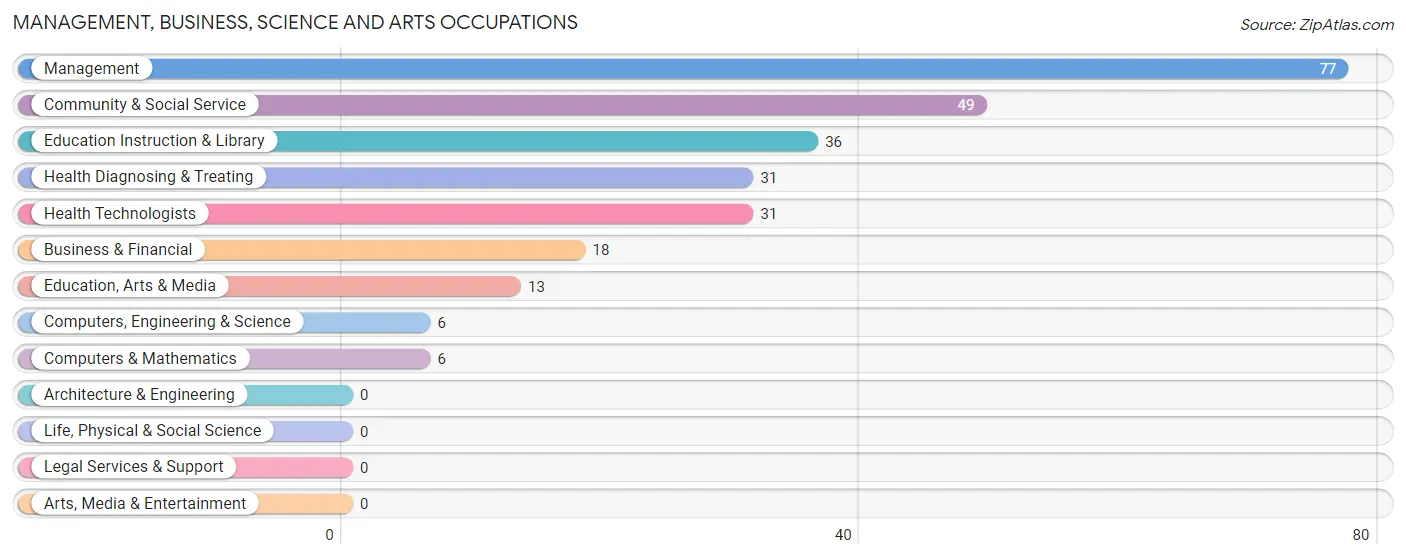
Management, Business, Science and Arts Occupations
The most common Management, Business, Science and Arts occupations in Linden are Management (77 | 10.2%), Community & Social Service (49 | 6.5%), Education Instruction & Library (36 | 4.8%), Health Diagnosing & Treating (31 | 4.1%), and Health Technologists (31 | 4.1%).
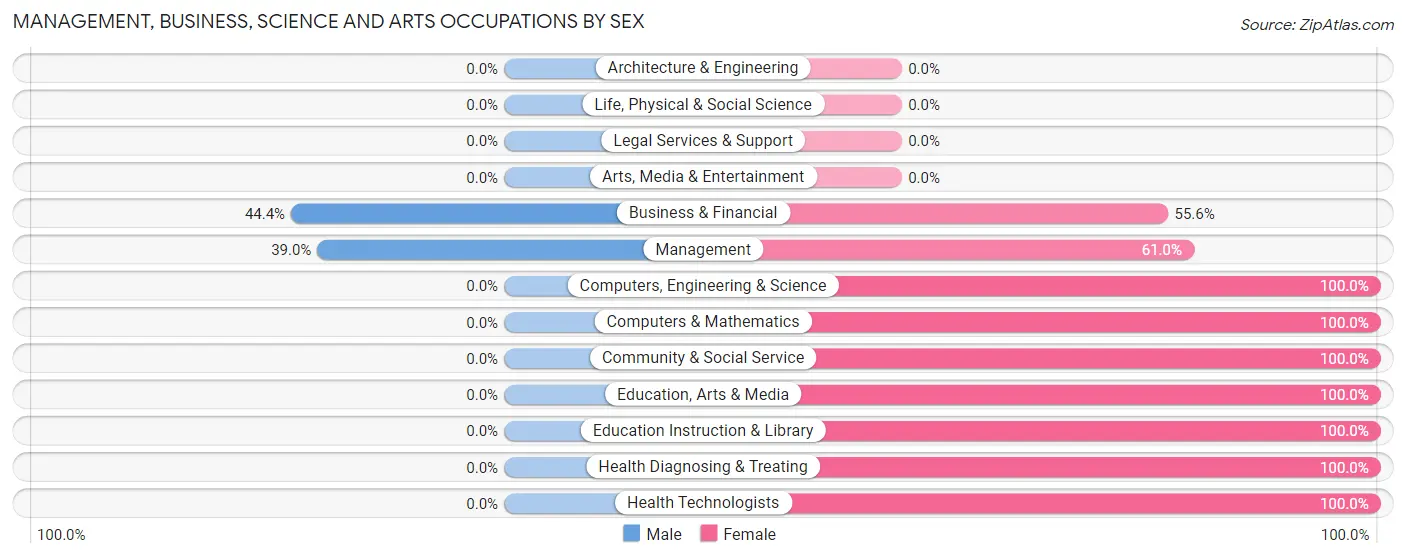
Management, Business, Science and Arts Occupations by Sex
Within the Management, Business, Science and Arts occupations in Linden, the most male-oriented occupations are Business & Financial (44.4%), and Management (39.0%), while the most female-oriented occupations are Computers, Engineering & Science (100.0%), Computers & Mathematics (100.0%), and Community & Social Service (100.0%).
| Occupation | Male | Female |
| Management | 30 (39.0%) | 47 (61.0%) |
| Business & Financial | 8 (44.4%) | 10 (55.6%) |
| Computers, Engineering & Science | 0 (0.0%) | 6 (100.0%) |
| Computers & Mathematics | 0 (0.0%) | 6 (100.0%) |
| Architecture & Engineering | 0 (0.0%) | 0 (0.0%) |
| Life, Physical & Social Science | 0 (0.0%) | 0 (0.0%) |
| Community & Social Service | 0 (0.0%) | 49 (100.0%) |
| Education, Arts & Media | 0 (0.0%) | 13 (100.0%) |
| Legal Services & Support | 0 (0.0%) | 0 (0.0%) |
| Education Instruction & Library | 0 (0.0%) | 36 (100.0%) |
| Arts, Media & Entertainment | 0 (0.0%) | 0 (0.0%) |
| Health Diagnosing & Treating | 0 (0.0%) | 31 (100.0%) |
| Health Technologists | 0 (0.0%) | 31 (100.0%) |
| Total (Category) | 38 (21.0%) | 143 (79.0%) |
| Total (Overall) | 437 (57.7%) | 320 (42.3%) |
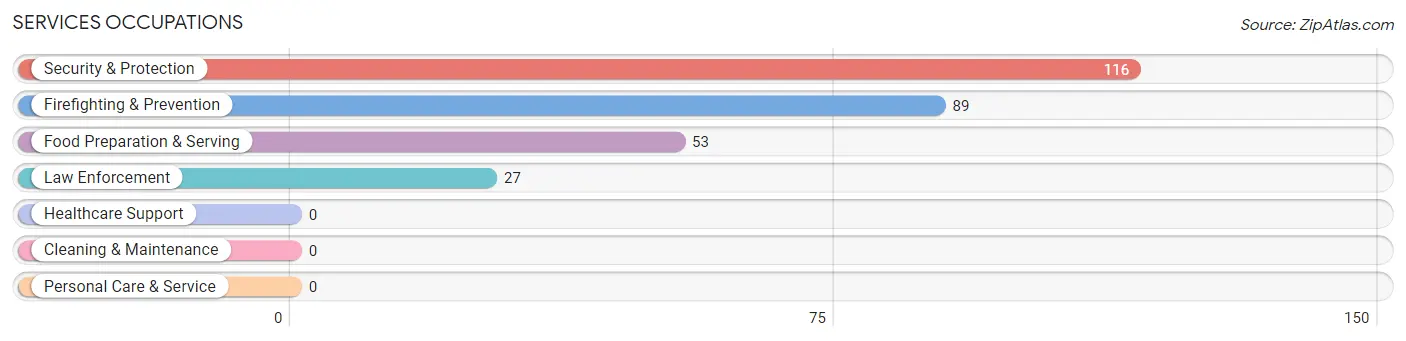
Services Occupations
The most common Services occupations in Linden are Security & Protection (116 | 15.3%), Firefighting & Prevention (89 | 11.8%), Food Preparation & Serving (53 | 7.0%), and Law Enforcement (27 | 3.6%).
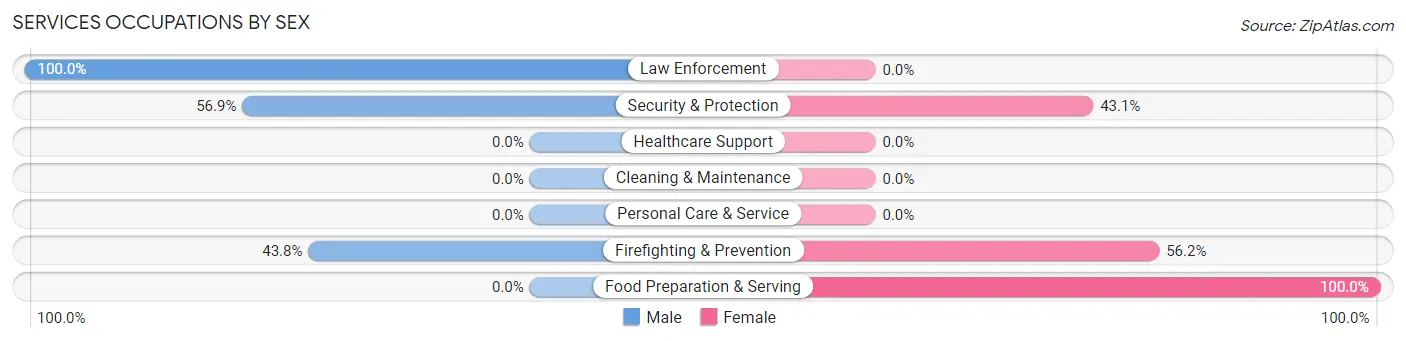
Services Occupations by Sex
Within the Services occupations in Linden, the most male-oriented occupations are Law Enforcement (100.0%), Security & Protection (56.9%), and Firefighting & Prevention (43.8%), while the most female-oriented occupations are Food Preparation & Serving (100.0%), Firefighting & Prevention (56.2%), and Security & Protection (43.1%).
| Occupation | Male | Female |
| Healthcare Support | 0 (0.0%) | 0 (0.0%) |
| Security & Protection | 66 (56.9%) | 50 (43.1%) |
| Firefighting & Prevention | 39 (43.8%) | 50 (56.2%) |
| Law Enforcement | 27 (100.0%) | 0 (0.0%) |
| Food Preparation & Serving | 0 (0.0%) | 53 (100.0%) |
| Cleaning & Maintenance | 0 (0.0%) | 0 (0.0%) |
| Personal Care & Service | 0 (0.0%) | 0 (0.0%) |
| Total (Category) | 66 (39.1%) | 103 (61.0%) |
| Total (Overall) | 437 (57.7%) | 320 (42.3%) |
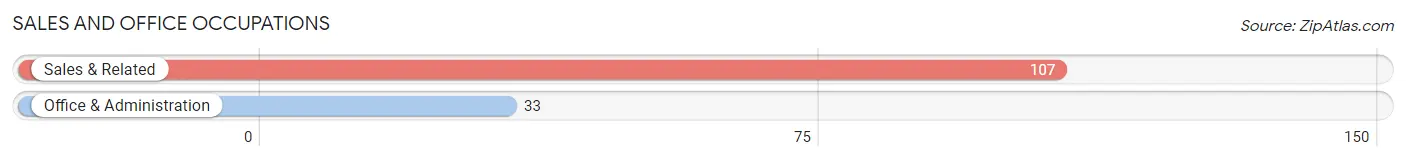
Sales and Office Occupations
The most common Sales and Office occupations in Linden are Sales & Related (107 | 14.1%), and Office & Administration (33 | 4.4%).
Sales and Office Occupations by Sex
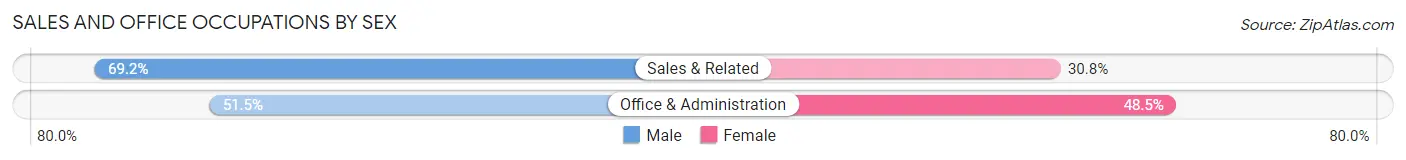
| Occupation | Male | Female |
| Sales & Related | 74 (69.2%) | 33 (30.8%) |
| Office & Administration | 17 (51.5%) | 16 (48.5%) |
| Total (Category) | 91 (65.0%) | 49 (35.0%) |
| Total (Overall) | 437 (57.7%) | 320 (42.3%) |
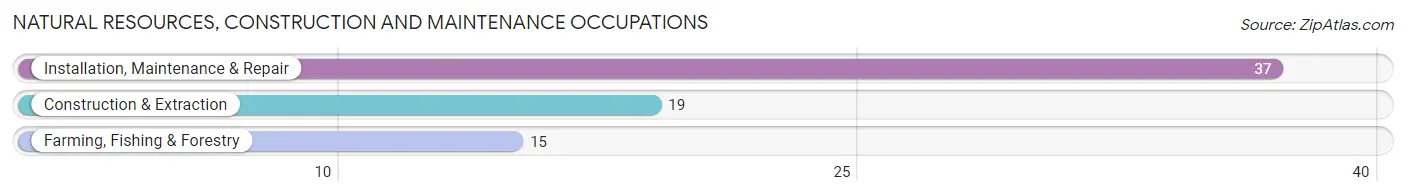
Natural Resources, Construction and Maintenance Occupations
The most common Natural Resources, Construction and Maintenance occupations in Linden are Installation, Maintenance & Repair (37 | 4.9%), Construction & Extraction (19 | 2.5%), and Farming, Fishing & Forestry (15 | 2.0%).
Natural Resources, Construction and Maintenance Occupations by Sex
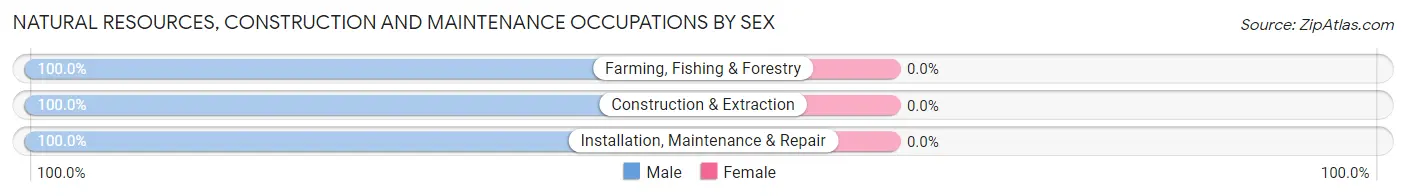
| Occupation | Male | Female |
| Farming, Fishing & Forestry | 15 (100.0%) | 0 (0.0%) |
| Construction & Extraction | 19 (100.0%) | 0 (0.0%) |
| Installation, Maintenance & Repair | 37 (100.0%) | 0 (0.0%) |
| Total (Category) | 71 (100.0%) | 0 (0.0%) |
| Total (Overall) | 437 (57.7%) | 320 (42.3%) |
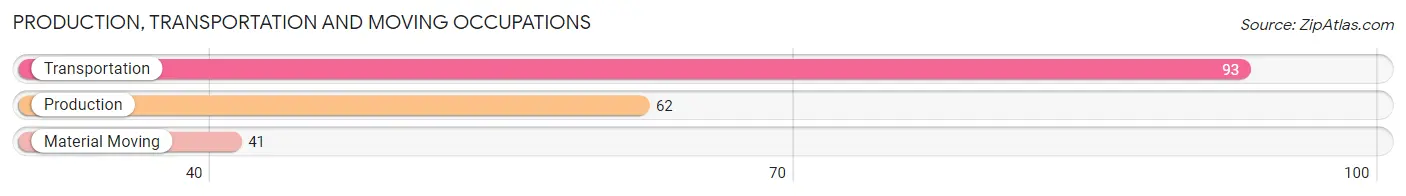
Production, Transportation and Moving Occupations
The most common Production, Transportation and Moving occupations in Linden are Transportation (93 | 12.3%), Production (62 | 8.2%), and Material Moving (41 | 5.4%).
Production, Transportation and Moving Occupations by Sex
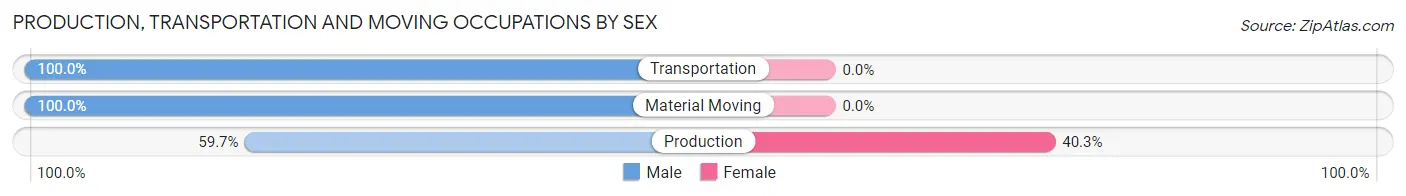
| Occupation | Male | Female |
| Production | 37 (59.7%) | 25 (40.3%) |
| Transportation | 93 (100.0%) | 0 (0.0%) |
| Material Moving | 41 (100.0%) | 0 (0.0%) |
| Total (Category) | 171 (87.2%) | 25 (12.8%) |
| Total (Overall) | 437 (57.7%) | 320 (42.3%) |
Employment Industries by Sex in Linden
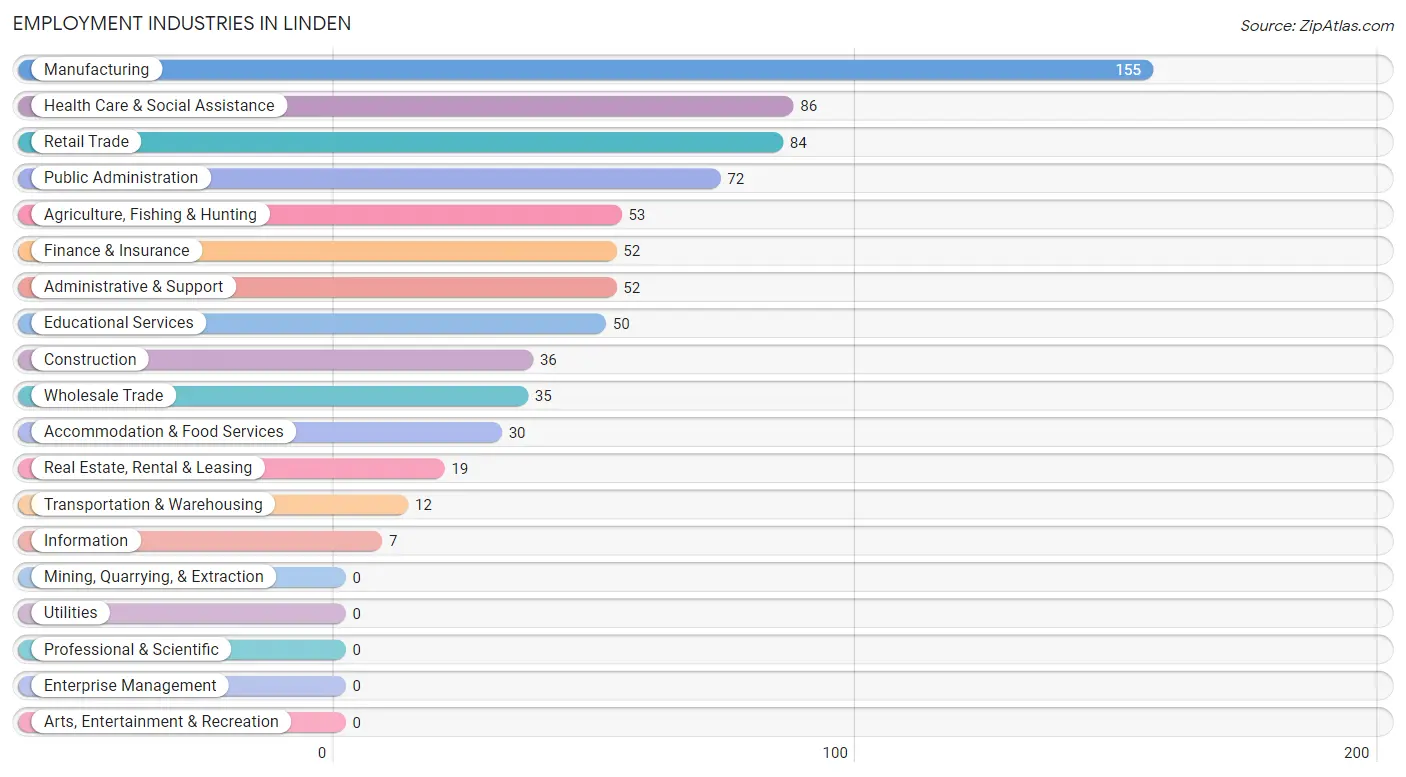
Employment Industries in Linden
The major employment industries in Linden include Manufacturing (155 | 20.5%), Health Care & Social Assistance (86 | 11.4%), Retail Trade (84 | 11.1%), Public Administration (72 | 9.5%), and Agriculture, Fishing & Hunting (53 | 7.0%).
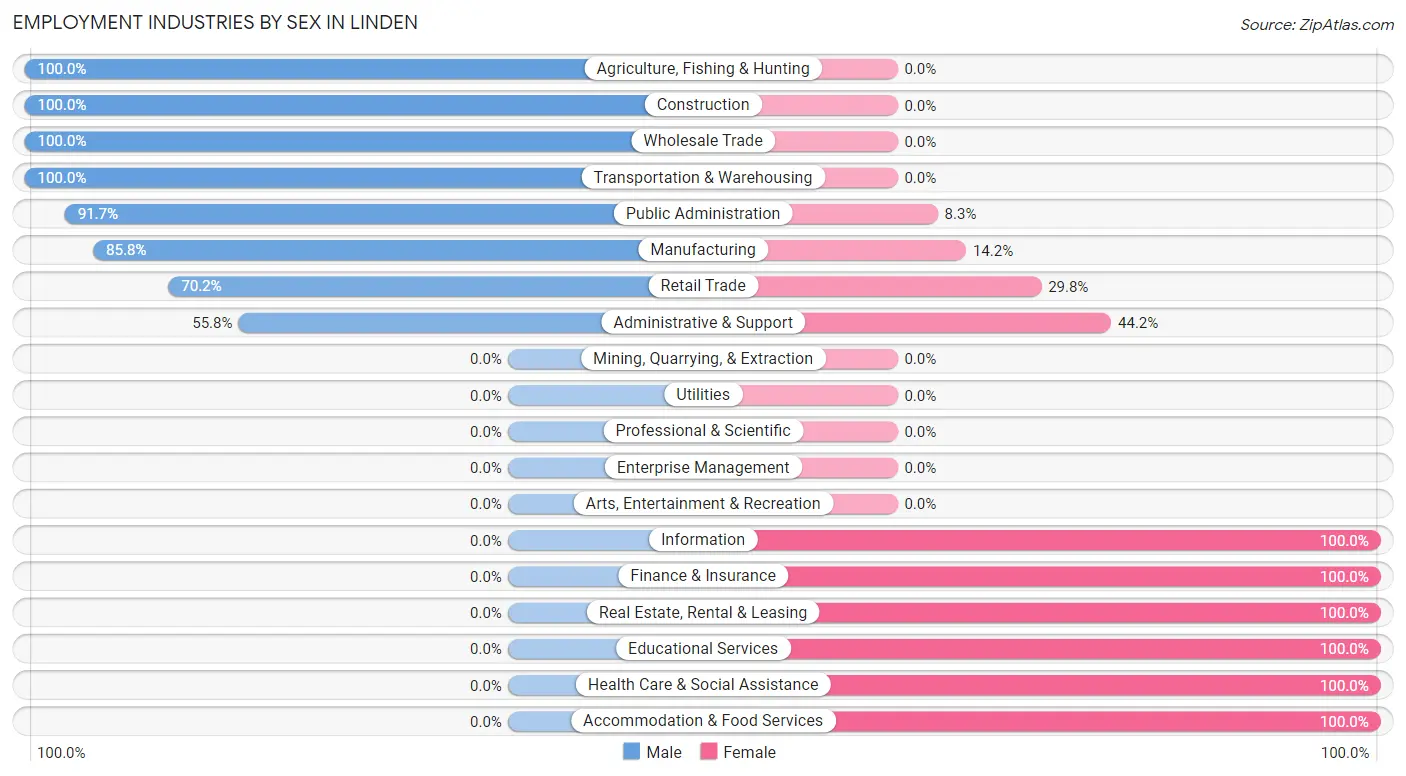
Employment Industries by Sex in Linden
The Linden industries that see more men than women are Agriculture, Fishing & Hunting (100.0%), Construction (100.0%), and Wholesale Trade (100.0%), whereas the industries that tend to have a higher number of women are Information (100.0%), Finance & Insurance (100.0%), and Real Estate, Rental & Leasing (100.0%).
| Industry | Male | Female |
| Agriculture, Fishing & Hunting | 53 (100.0%) | 0 (0.0%) |
| Mining, Quarrying, & Extraction | 0 (0.0%) | 0 (0.0%) |
| Construction | 36 (100.0%) | 0 (0.0%) |
| Manufacturing | 133 (85.8%) | 22 (14.2%) |
| Wholesale Trade | 35 (100.0%) | 0 (0.0%) |
| Retail Trade | 59 (70.2%) | 25 (29.8%) |
| Transportation & Warehousing | 12 (100.0%) | 0 (0.0%) |
| Utilities | 0 (0.0%) | 0 (0.0%) |
| Information | 0 (0.0%) | 7 (100.0%) |
| Finance & Insurance | 0 (0.0%) | 52 (100.0%) |
| Real Estate, Rental & Leasing | 0 (0.0%) | 19 (100.0%) |
| Professional & Scientific | 0 (0.0%) | 0 (0.0%) |
| Enterprise Management | 0 (0.0%) | 0 (0.0%) |
| Administrative & Support | 29 (55.8%) | 23 (44.2%) |
| Educational Services | 0 (0.0%) | 50 (100.0%) |
| Health Care & Social Assistance | 0 (0.0%) | 86 (100.0%) |
| Arts, Entertainment & Recreation | 0 (0.0%) | 0 (0.0%) |
| Accommodation & Food Services | 0 (0.0%) | 30 (100.0%) |
| Public Administration | 66 (91.7%) | 6 (8.3%) |
| Total | 437 (57.7%) | 320 (42.3%) |
Education in Linden
School Enrollment in Linden
The most common levels of schooling among the 495 students in Linden are high school (216 | 43.6%), college / undergraduate (87 | 17.6%), and elementary school (72 | 14.5%).
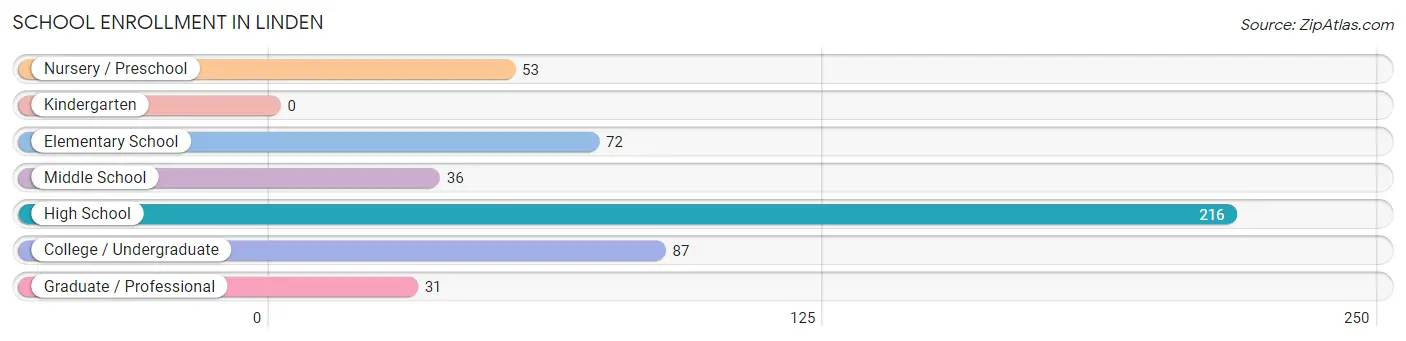
| School Level | # Students | % Students |
| Nursery / Preschool | 53 | 10.7% |
| Kindergarten | 0 | 0.0% |
| Elementary School | 72 | 14.5% |
| Middle School | 36 | 7.3% |
| High School | 216 | 43.6% |
| College / Undergraduate | 87 | 17.6% |
| Graduate / Professional | 31 | 6.3% |
| Total | 495 | 100.0% |
School Enrollment by Age by Funding Source in Linden
Out of a total of 495 students who are enrolled in schools in Linden, 146 (29.5%) attend a private institution, while the remaining 349 (70.5%) are enrolled in public schools. The age group of 3 to 4 year olds has the highest likelihood of being enrolled in private schools, with 53 (100.0% in the age bracket) enrolled. Conversely, the age group of 5 to 9 year old has the lowest likelihood of being enrolled in a private school, with 44 (100.0% in the age bracket) attending a public institution.
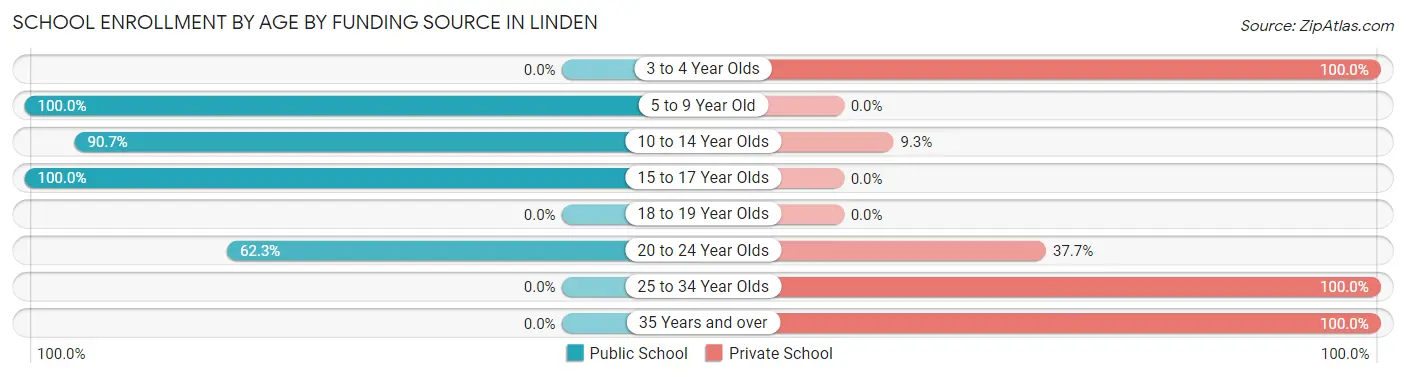
| Age Bracket | Public School | Private School |
| 3 to 4 Year Olds | 0 (0.0%) | 53 (100.0%) |
| 5 to 9 Year Old | 44 (100.0%) | 0 (0.0%) |
| 10 to 14 Year Olds | 127 (90.7%) | 13 (9.3%) |
| 15 to 17 Year Olds | 140 (100.0%) | 0 (0.0%) |
| 18 to 19 Year Olds | 0 (0.0%) | 0 (0.0%) |
| 20 to 24 Year Olds | 38 (62.3%) | 23 (37.7%) |
| 25 to 34 Year Olds | 0 (0.0%) | 50 (100.0%) |
| 35 Years and over | 0 (0.0%) | 7 (100.0%) |
| Total | 349 (70.5%) | 146 (29.5%) |
Educational Attainment by Field of Study in Linden
Science & technology (132 | 29.5%), business (113 | 25.2%), liberal arts & history (50 | 11.2%), bio, nature & agricultural (39 | 8.7%), and computers & mathematics (25 | 5.6%) are the most common fields of study among 448 individuals in Linden who have obtained a bachelor's degree or higher.
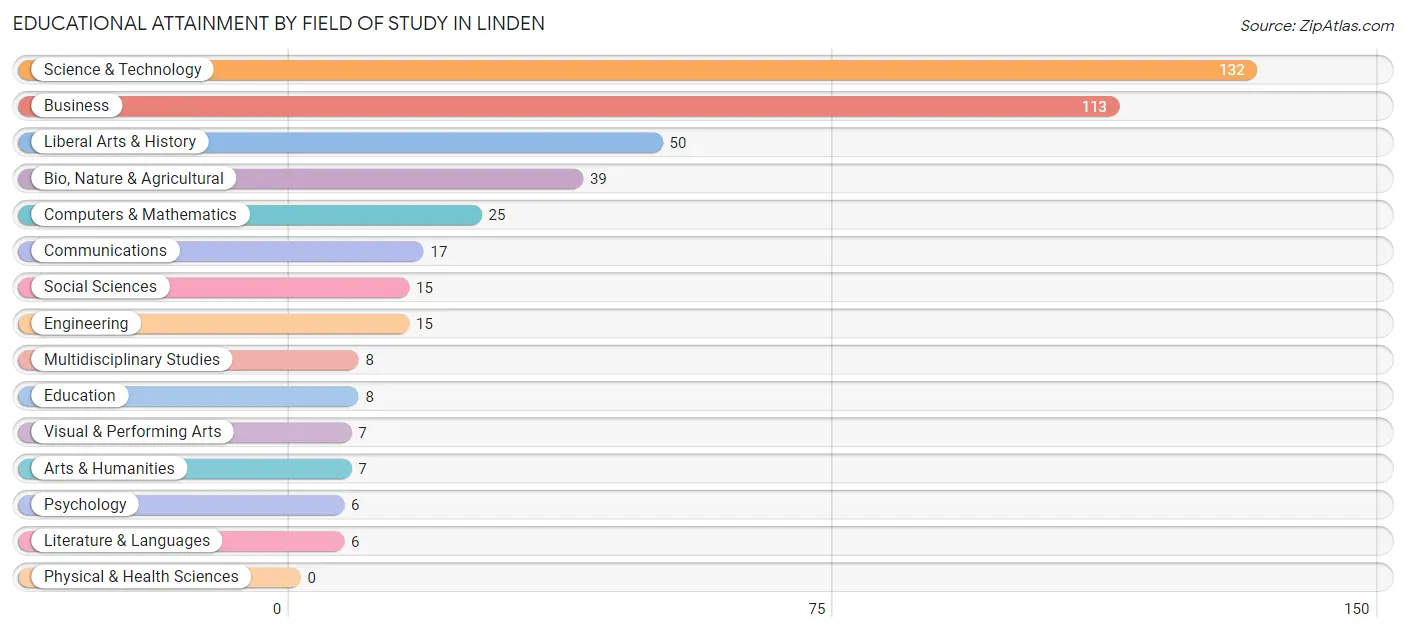
| Field of Study | # Graduates | % Graduates |
| Computers & Mathematics | 25 | 5.6% |
| Bio, Nature & Agricultural | 39 | 8.7% |
| Physical & Health Sciences | 0 | 0.0% |
| Psychology | 6 | 1.3% |
| Social Sciences | 15 | 3.4% |
| Engineering | 15 | 3.4% |
| Multidisciplinary Studies | 8 | 1.8% |
| Science & Technology | 132 | 29.5% |
| Business | 113 | 25.2% |
| Education | 8 | 1.8% |
| Literature & Languages | 6 | 1.3% |
| Liberal Arts & History | 50 | 11.2% |
| Visual & Performing Arts | 7 | 1.6% |
| Communications | 17 | 3.8% |
| Arts & Humanities | 7 | 1.6% |
| Total | 448 | 100.0% |
Transportation & Commute in Linden
Vehicle Availability by Sex in Linden
The most prevalent vehicle ownership categories in Linden are males with 2 vehicles (334, accounting for 76.4%) and females with 2 vehicles (195, making up 104.4%).
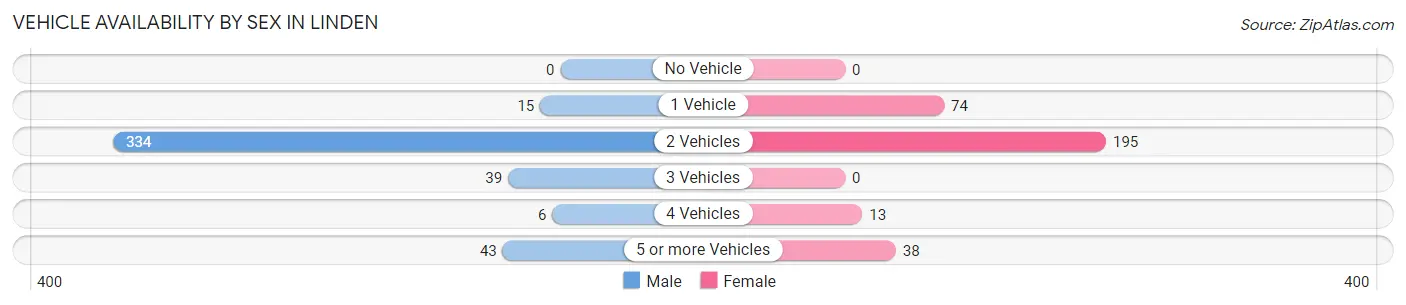
| Vehicles Available | Male | Female |
| No Vehicle | 0 (0.0%) | 0 (0.0%) |
| 1 Vehicle | 15 (3.4%) | 74 (23.1%) |
| 2 Vehicles | 334 (76.4%) | 195 (60.9%) |
| 3 Vehicles | 39 (8.9%) | 0 (0.0%) |
| 4 Vehicles | 6 (1.4%) | 13 (4.1%) |
| 5 or more Vehicles | 43 (9.8%) | 38 (11.9%) |
| Total | 437 (100.0%) | 320 (100.0%) |
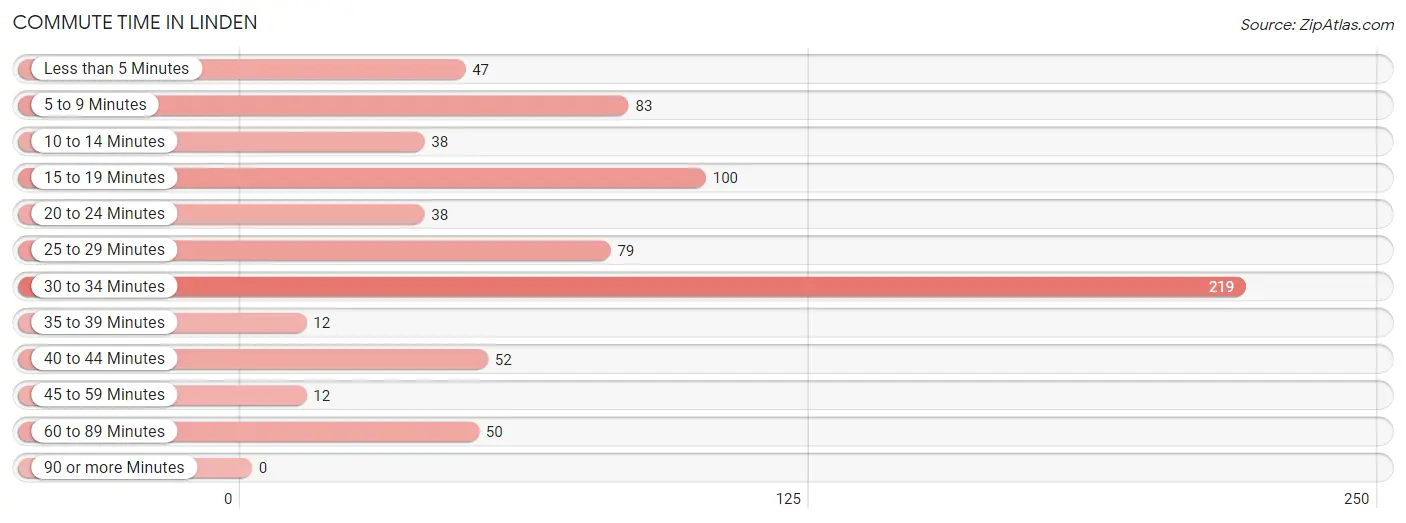
Commute Time in Linden
The most frequently occuring commute durations in Linden are 30 to 34 minutes (219 commuters, 30.0%), 15 to 19 minutes (100 commuters, 13.7%), and 5 to 9 minutes (83 commuters, 11.4%).
| Commute Time | # Commuters | % Commuters |
| Less than 5 Minutes | 47 | 6.4% |
| 5 to 9 Minutes | 83 | 11.4% |
| 10 to 14 Minutes | 38 | 5.2% |
| 15 to 19 Minutes | 100 | 13.7% |
| 20 to 24 Minutes | 38 | 5.2% |
| 25 to 29 Minutes | 79 | 10.8% |
| 30 to 34 Minutes | 219 | 30.0% |
| 35 to 39 Minutes | 12 | 1.6% |
| 40 to 44 Minutes | 52 | 7.1% |
| 45 to 59 Minutes | 12 | 1.6% |
| 60 to 89 Minutes | 50 | 6.9% |
| 90 or more Minutes | 0 | 0.0% |
Commute Time by Sex in Linden
The most common commute times in Linden are 15 to 19 minutes (100 commuters, 23.6%) for males and 30 to 34 minutes (163 commuters, 53.1%) for females.
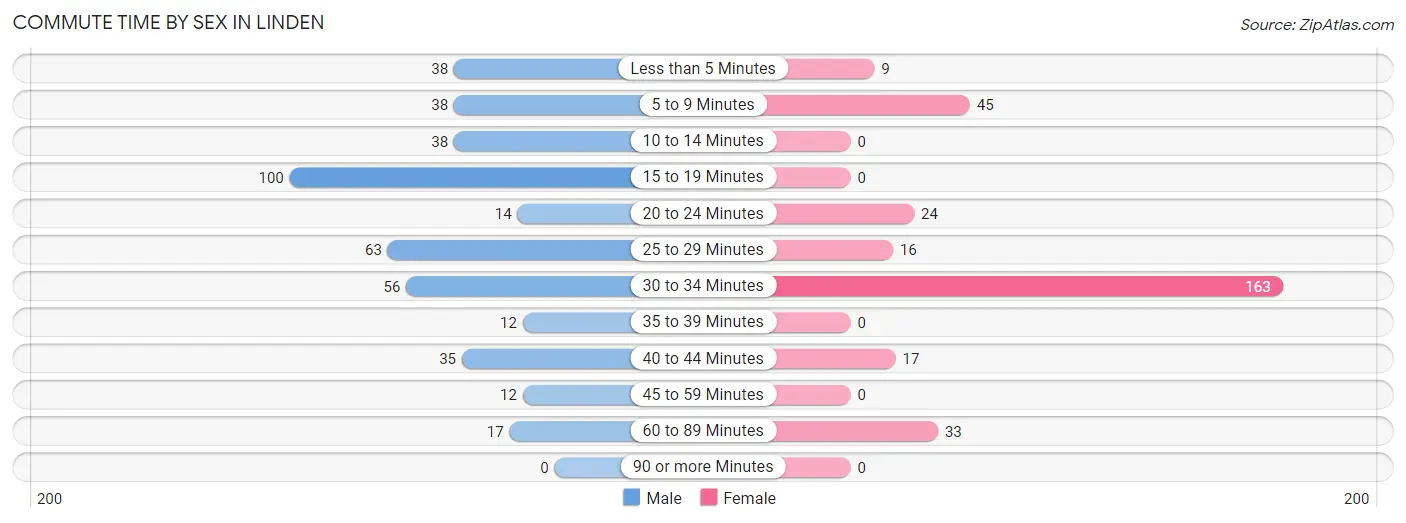
| Commute Time | Male | Female |
| Less than 5 Minutes | 38 (9.0%) | 9 (2.9%) |
| 5 to 9 Minutes | 38 (9.0%) | 45 (14.7%) |
| 10 to 14 Minutes | 38 (9.0%) | 0 (0.0%) |
| 15 to 19 Minutes | 100 (23.6%) | 0 (0.0%) |
| 20 to 24 Minutes | 14 (3.3%) | 24 (7.8%) |
| 25 to 29 Minutes | 63 (14.9%) | 16 (5.2%) |
| 30 to 34 Minutes | 56 (13.2%) | 163 (53.1%) |
| 35 to 39 Minutes | 12 (2.8%) | 0 (0.0%) |
| 40 to 44 Minutes | 35 (8.3%) | 17 (5.5%) |
| 45 to 59 Minutes | 12 (2.8%) | 0 (0.0%) |
| 60 to 89 Minutes | 17 (4.0%) | 33 (10.7%) |
| 90 or more Minutes | 0 (0.0%) | 0 (0.0%) |
Time of Departure to Work by Sex in Linden
The most frequent times of departure to work in Linden are 12:00 AM to 4:59 AM (150, 35.5%) for males and 7:00 AM to 7:29 AM (70, 22.8%) for females.
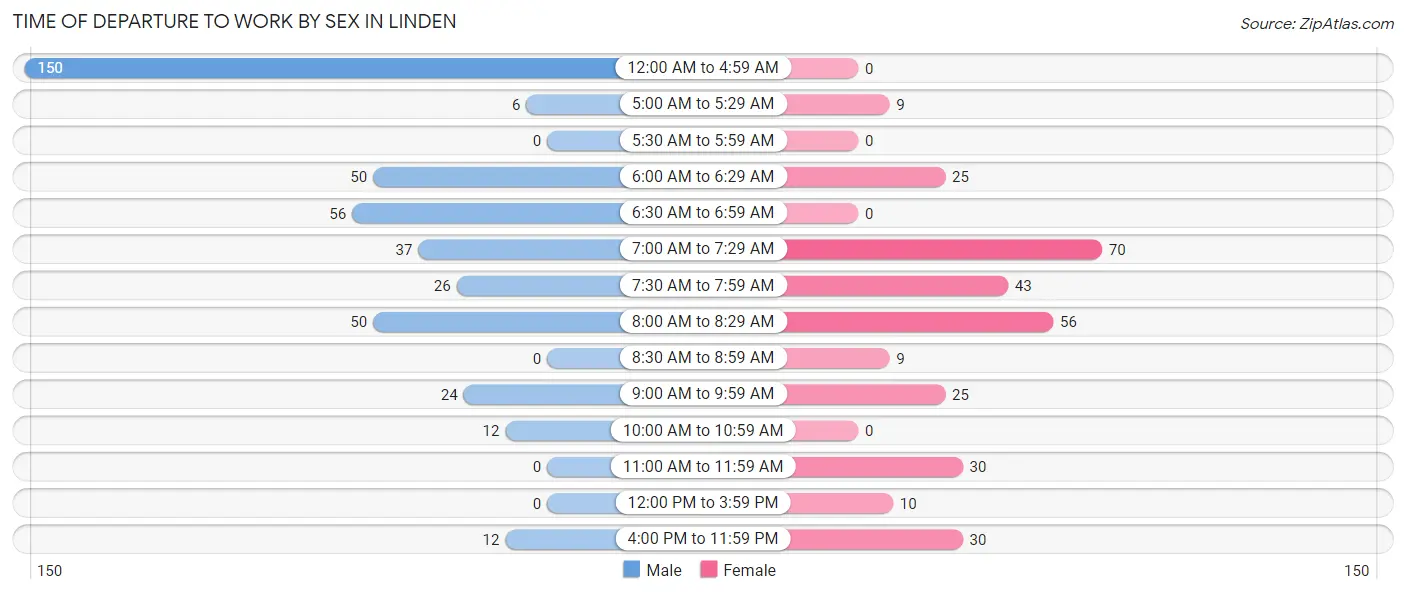
| Time of Departure | Male | Female |
| 12:00 AM to 4:59 AM | 150 (35.5%) | 0 (0.0%) |
| 5:00 AM to 5:29 AM | 6 (1.4%) | 9 (2.9%) |
| 5:30 AM to 5:59 AM | 0 (0.0%) | 0 (0.0%) |
| 6:00 AM to 6:29 AM | 50 (11.8%) | 25 (8.1%) |
| 6:30 AM to 6:59 AM | 56 (13.2%) | 0 (0.0%) |
| 7:00 AM to 7:29 AM | 37 (8.7%) | 70 (22.8%) |
| 7:30 AM to 7:59 AM | 26 (6.1%) | 43 (14.0%) |
| 8:00 AM to 8:29 AM | 50 (11.8%) | 56 (18.2%) |
| 8:30 AM to 8:59 AM | 0 (0.0%) | 9 (2.9%) |
| 9:00 AM to 9:59 AM | 24 (5.7%) | 25 (8.1%) |
| 10:00 AM to 10:59 AM | 12 (2.8%) | 0 (0.0%) |
| 11:00 AM to 11:59 AM | 0 (0.0%) | 30 (9.8%) |
| 12:00 PM to 3:59 PM | 0 (0.0%) | 10 (3.3%) |
| 4:00 PM to 11:59 PM | 12 (2.8%) | 30 (9.8%) |
| Total | 423 (100.0%) | 307 (100.0%) |
Housing Occupancy in Linden
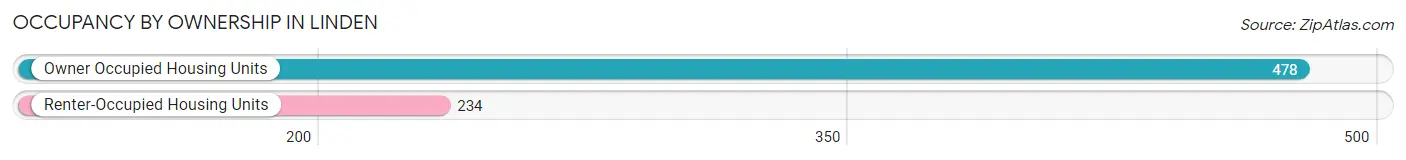
Occupancy by Ownership in Linden
Of the total 712 dwellings in Linden, owner-occupied units account for 478 (67.1%), while renter-occupied units make up 234 (32.9%).
| Occupancy | # Housing Units | % Housing Units |
| Owner Occupied Housing Units | 478 | 67.1% |
| Renter-Occupied Housing Units | 234 | 32.9% |
| Total Occupied Housing Units | 712 | 100.0% |
Occupancy by Household Size in Linden
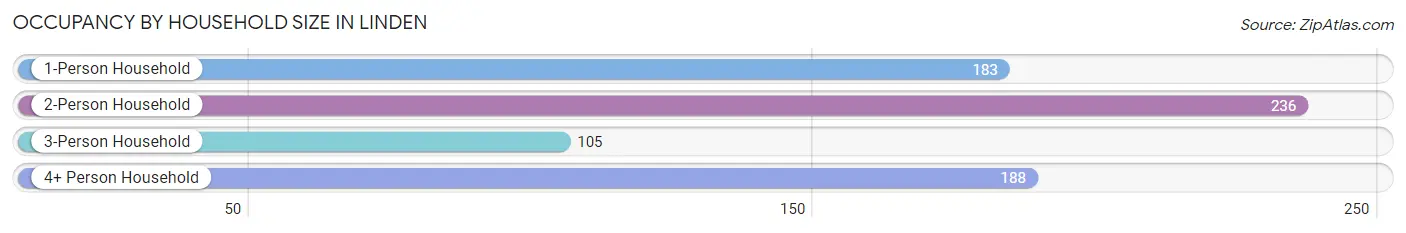
| Household Size | # Housing Units | % Housing Units |
| 1-Person Household | 183 | 25.7% |
| 2-Person Household | 236 | 33.2% |
| 3-Person Household | 105 | 14.7% |
| 4+ Person Household | 188 | 26.4% |
| Total Housing Units | 712 | 100.0% |
Occupancy by Ownership by Household Size in Linden
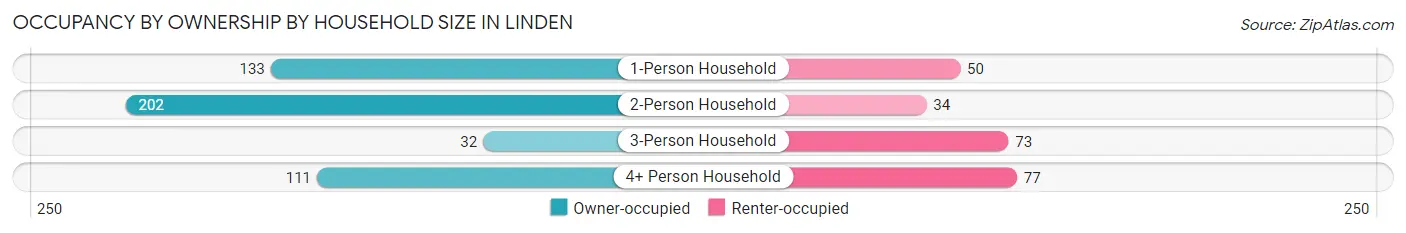
| Household Size | Owner-occupied | Renter-occupied |
| 1-Person Household | 133 (72.7%) | 50 (27.3%) |
| 2-Person Household | 202 (85.6%) | 34 (14.4%) |
| 3-Person Household | 32 (30.5%) | 73 (69.5%) |
| 4+ Person Household | 111 (59.0%) | 77 (41.0%) |
| Total Housing Units | 478 (67.1%) | 234 (32.9%) |
Occupancy by Educational Attainment in Linden
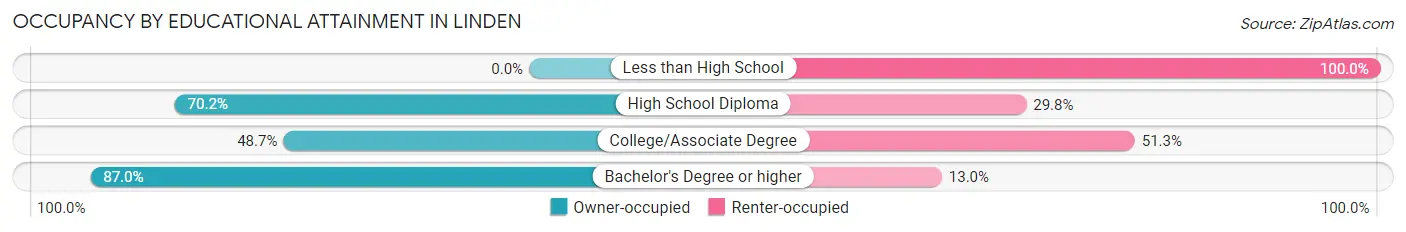
| Household Size | Owner-occupied | Renter-occupied |
| Less than High School | 0 (0.0%) | 10 (100.0%) |
| High School Diploma | 118 (70.2%) | 50 (29.8%) |
| College/Associate Degree | 133 (48.7%) | 140 (51.3%) |
| Bachelor's Degree or higher | 227 (87.0%) | 34 (13.0%) |
Occupancy by Age of Householder in Linden
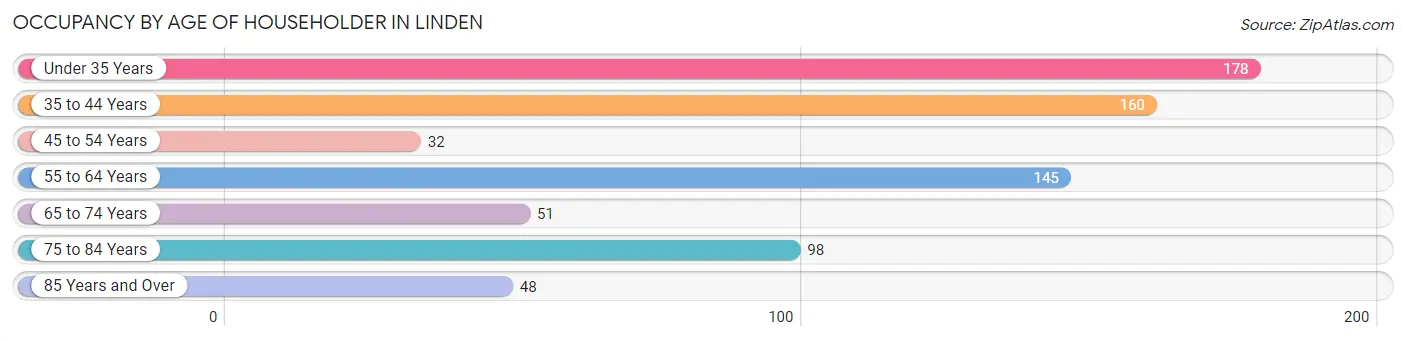
| Age Bracket | # Households | % Households |
| Under 35 Years | 178 | 25.0% |
| 35 to 44 Years | 160 | 22.5% |
| 45 to 54 Years | 32 | 4.5% |
| 55 to 64 Years | 145 | 20.4% |
| 65 to 74 Years | 51 | 7.2% |
| 75 to 84 Years | 98 | 13.8% |
| 85 Years and Over | 48 | 6.7% |
| Total | 712 | 100.0% |
Housing Finances in Linden
Median Income by Occupancy in Linden
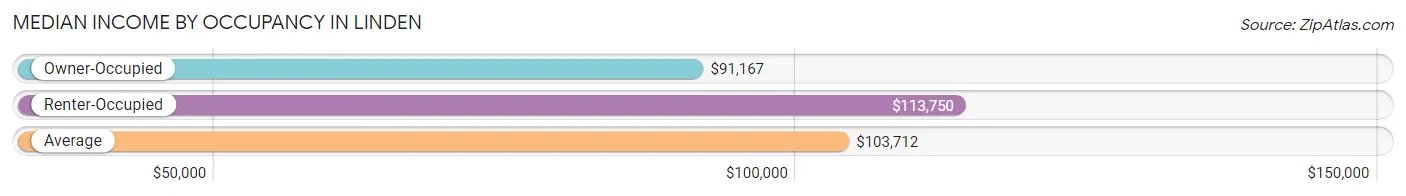
| Occupancy Type | # Households | Median Income |
| Owner-Occupied | 478 (67.1%) | $91,167 |
| Renter-Occupied | 234 (32.9%) | $113,750 |
| Average | 712 (100.0%) | $103,712 |
Occupancy by Householder Income Bracket in Linden
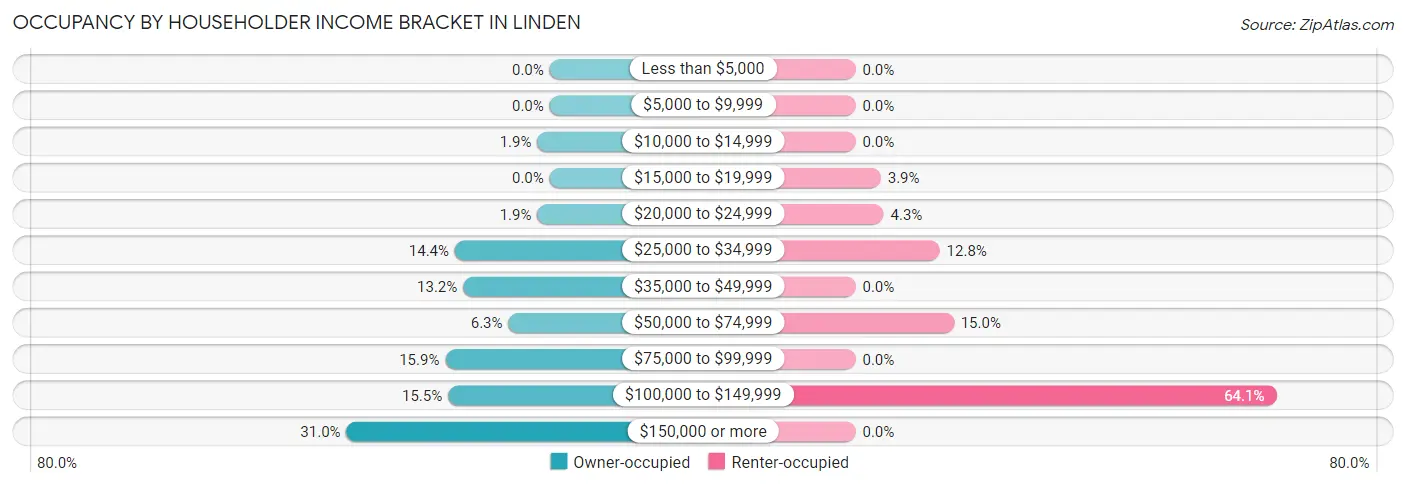
| Income Bracket | Owner-occupied | Renter-occupied |
| Less than $5,000 | 0 (0.0%) | 0 (0.0%) |
| $5,000 to $9,999 | 0 (0.0%) | 0 (0.0%) |
| $10,000 to $14,999 | 9 (1.9%) | 0 (0.0%) |
| $15,000 to $19,999 | 0 (0.0%) | 9 (3.8%) |
| $20,000 to $24,999 | 9 (1.9%) | 10 (4.3%) |
| $25,000 to $34,999 | 69 (14.4%) | 30 (12.8%) |
| $35,000 to $49,999 | 63 (13.2%) | 0 (0.0%) |
| $50,000 to $74,999 | 30 (6.3%) | 35 (15.0%) |
| $75,000 to $99,999 | 76 (15.9%) | 0 (0.0%) |
| $100,000 to $149,999 | 74 (15.5%) | 150 (64.1%) |
| $150,000 or more | 148 (31.0%) | 0 (0.0%) |
| Total | 478 (100.0%) | 234 (100.0%) |
Monthly Housing Cost Tiers in Linden
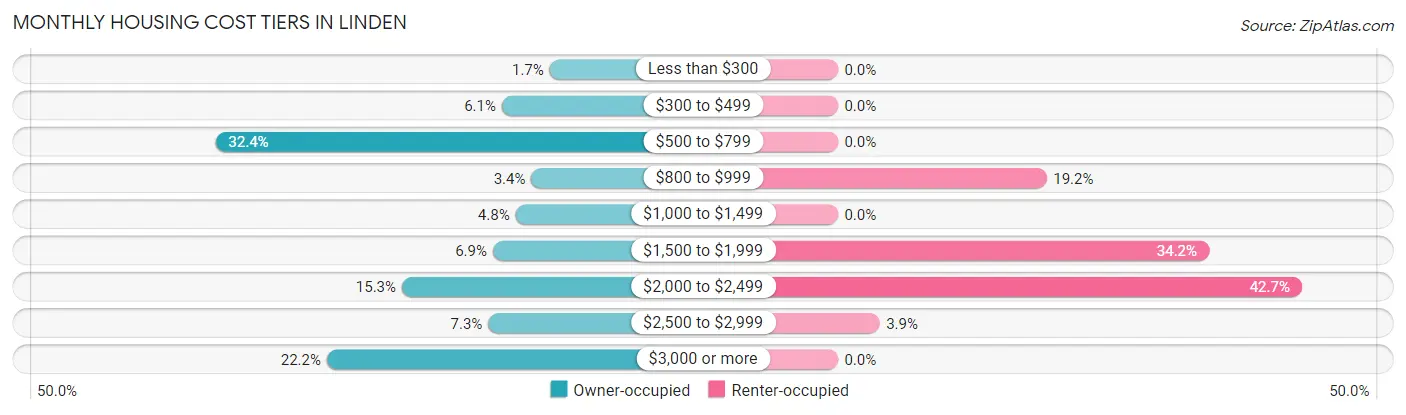
| Monthly Cost | Owner-occupied | Renter-occupied |
| Less than $300 | 8 (1.7%) | 0 (0.0%) |
| $300 to $499 | 29 (6.1%) | 0 (0.0%) |
| $500 to $799 | 155 (32.4%) | 0 (0.0%) |
| $800 to $999 | 16 (3.4%) | 45 (19.2%) |
| $1,000 to $1,499 | 23 (4.8%) | 0 (0.0%) |
| $1,500 to $1,999 | 33 (6.9%) | 80 (34.2%) |
| $2,000 to $2,499 | 73 (15.3%) | 100 (42.7%) |
| $2,500 to $2,999 | 35 (7.3%) | 9 (3.8%) |
| $3,000 or more | 106 (22.2%) | 0 (0.0%) |
| Total | 478 (100.0%) | 234 (100.0%) |
Physical Housing Characteristics in Linden
Housing Structures in Linden
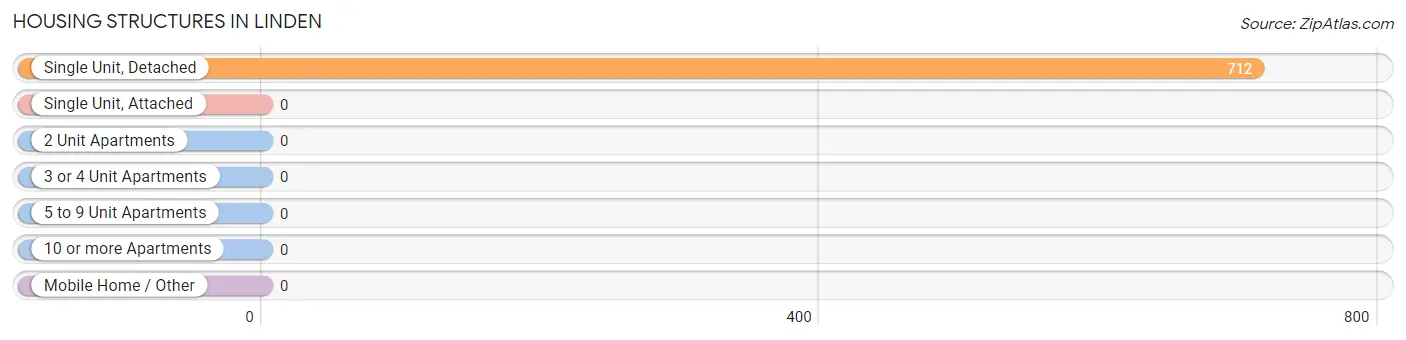
| Structure Type | # Housing Units | % Housing Units |
| Single Unit, Detached | 712 | 100.0% |
| Single Unit, Attached | 0 | 0.0% |
| 2 Unit Apartments | 0 | 0.0% |
| 3 or 4 Unit Apartments | 0 | 0.0% |
| 5 to 9 Unit Apartments | 0 | 0.0% |
| 10 or more Apartments | 0 | 0.0% |
| Mobile Home / Other | 0 | 0.0% |
| Total | 712 | 100.0% |
Housing Structures by Occupancy in Linden
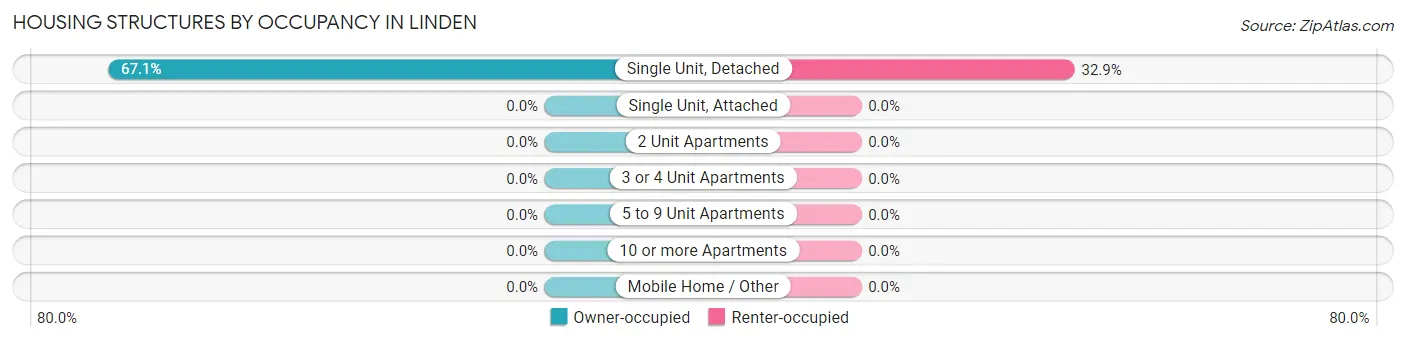
| Structure Type | Owner-occupied | Renter-occupied |
| Single Unit, Detached | 478 (67.1%) | 234 (32.9%) |
| Single Unit, Attached | 0 (0.0%) | 0 (0.0%) |
| 2 Unit Apartments | 0 (0.0%) | 0 (0.0%) |
| 3 or 4 Unit Apartments | 0 (0.0%) | 0 (0.0%) |
| 5 to 9 Unit Apartments | 0 (0.0%) | 0 (0.0%) |
| 10 or more Apartments | 0 (0.0%) | 0 (0.0%) |
| Mobile Home / Other | 0 (0.0%) | 0 (0.0%) |
| Total | 478 (67.1%) | 234 (32.9%) |
Housing Structures by Number of Rooms in Linden
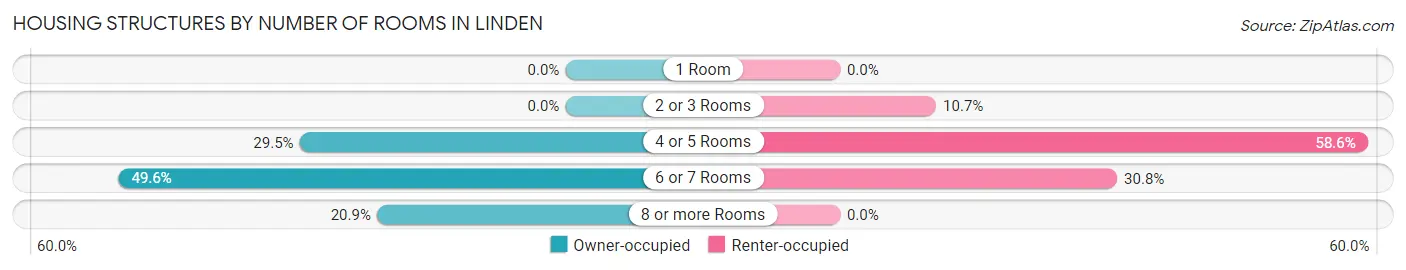
| Number of Rooms | Owner-occupied | Renter-occupied |
| 1 Room | 0 (0.0%) | 0 (0.0%) |
| 2 or 3 Rooms | 0 (0.0%) | 25 (10.7%) |
| 4 or 5 Rooms | 141 (29.5%) | 137 (58.6%) |
| 6 or 7 Rooms | 237 (49.6%) | 72 (30.8%) |
| 8 or more Rooms | 100 (20.9%) | 0 (0.0%) |
| Total | 478 (100.0%) | 234 (100.0%) |
Housing Structure by Heating Type in Linden
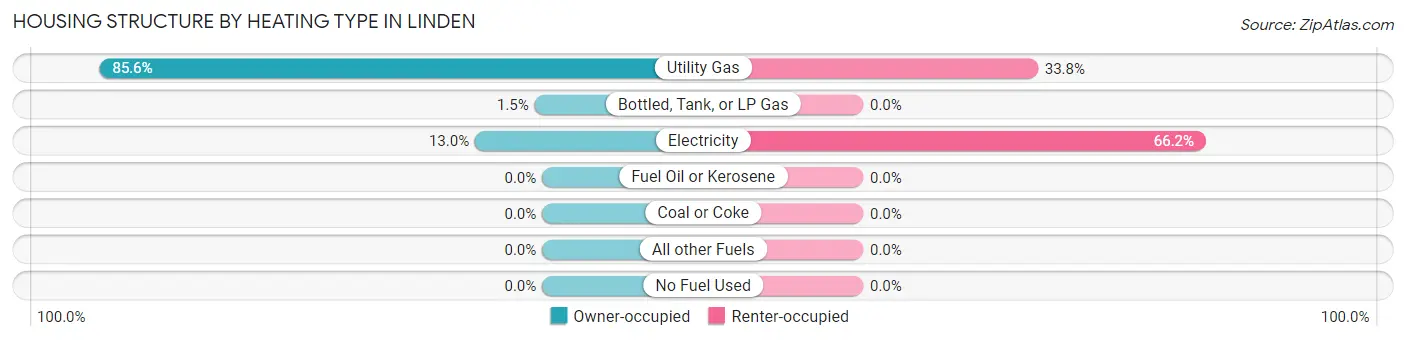
| Heating Type | Owner-occupied | Renter-occupied |
| Utility Gas | 409 (85.6%) | 79 (33.8%) |
| Bottled, Tank, or LP Gas | 7 (1.5%) | 0 (0.0%) |
| Electricity | 62 (13.0%) | 155 (66.2%) |
| Fuel Oil or Kerosene | 0 (0.0%) | 0 (0.0%) |
| Coal or Coke | 0 (0.0%) | 0 (0.0%) |
| All other Fuels | 0 (0.0%) | 0 (0.0%) |
| No Fuel Used | 0 (0.0%) | 0 (0.0%) |
| Total | 478 (100.0%) | 234 (100.0%) |
Household Vehicle Usage in Linden
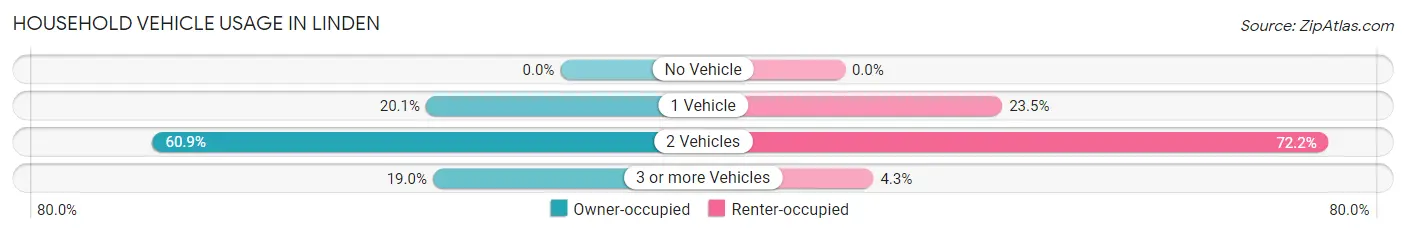
| Vehicles per Household | Owner-occupied | Renter-occupied |
| No Vehicle | 0 (0.0%) | 0 (0.0%) |
| 1 Vehicle | 96 (20.1%) | 55 (23.5%) |
| 2 Vehicles | 291 (60.9%) | 169 (72.2%) |
| 3 or more Vehicles | 91 (19.0%) | 10 (4.3%) |
| Total | 478 (100.0%) | 234 (100.0%) |
Real Estate & Mortgages in Linden
Real Estate and Mortgage Overview in Linden
| Characteristic | Without Mortgage | With Mortgage |
| Housing Units | 215 | 263 |
| Median Property Value | $507,000 | $564,500 |
| Median Household Income | $49,441 | $112 |
| Monthly Housing Costs | $583 | $106 |
| Real Estate Taxes | $2,361 | $0 |
Property Value by Mortgage Status in Linden
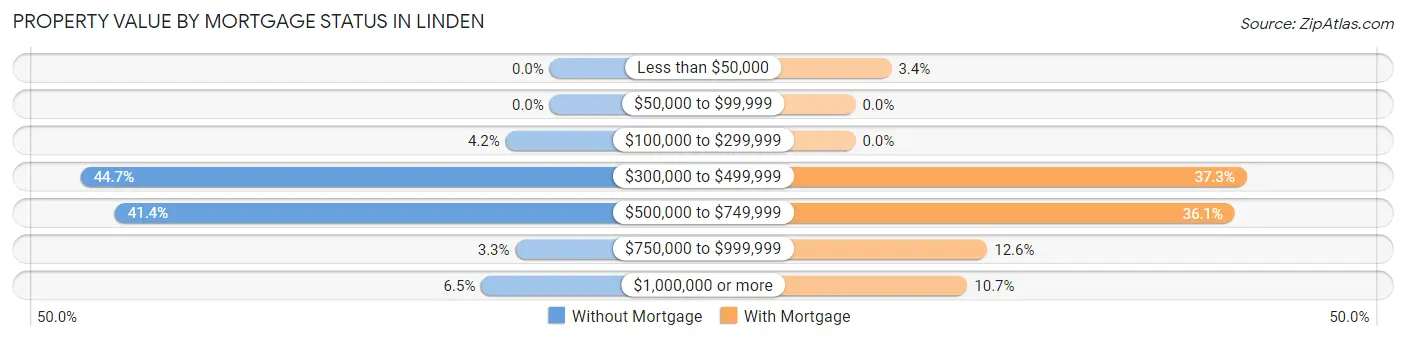
| Property Value | Without Mortgage | With Mortgage |
| Less than $50,000 | 0 (0.0%) | 9 (3.4%) |
| $50,000 to $99,999 | 0 (0.0%) | 0 (0.0%) |
| $100,000 to $299,999 | 9 (4.2%) | 0 (0.0%) |
| $300,000 to $499,999 | 96 (44.7%) | 98 (37.3%) |
| $500,000 to $749,999 | 89 (41.4%) | 95 (36.1%) |
| $750,000 to $999,999 | 7 (3.3%) | 33 (12.6%) |
| $1,000,000 or more | 14 (6.5%) | 28 (10.6%) |
| Total | 215 (100.0%) | 263 (100.0%) |
Household Income by Mortgage Status in Linden
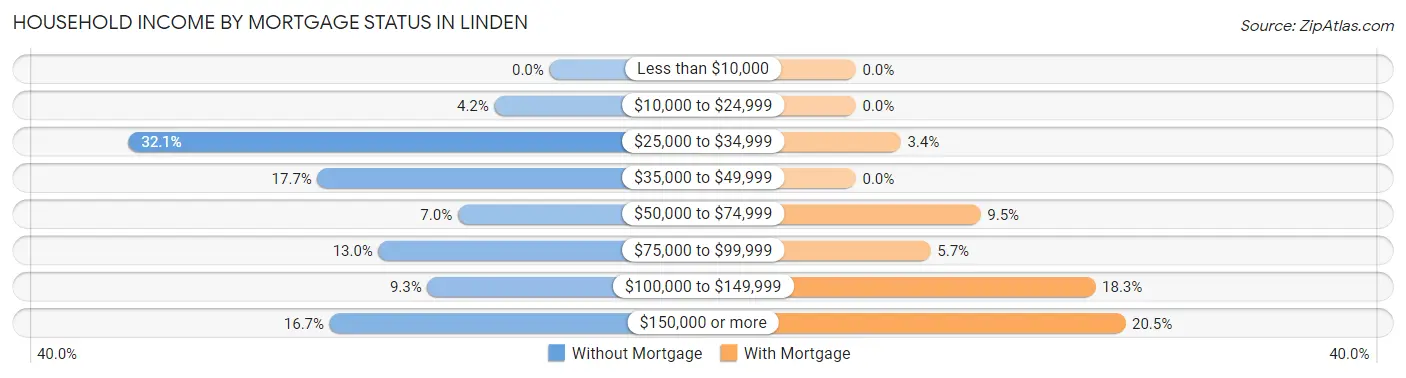
| Household Income | Without Mortgage | With Mortgage |
| Less than $10,000 | 0 (0.0%) | 0 (0.0%) |
| $10,000 to $24,999 | 9 (4.2%) | 0 (0.0%) |
| $25,000 to $34,999 | 69 (32.1%) | 9 (3.4%) |
| $35,000 to $49,999 | 38 (17.7%) | 0 (0.0%) |
| $50,000 to $74,999 | 15 (7.0%) | 25 (9.5%) |
| $75,000 to $99,999 | 28 (13.0%) | 15 (5.7%) |
| $100,000 to $149,999 | 20 (9.3%) | 48 (18.2%) |
| $150,000 or more | 36 (16.7%) | 54 (20.5%) |
| Total | 215 (100.0%) | 263 (100.0%) |
Property Value to Household Income Ratio in Linden
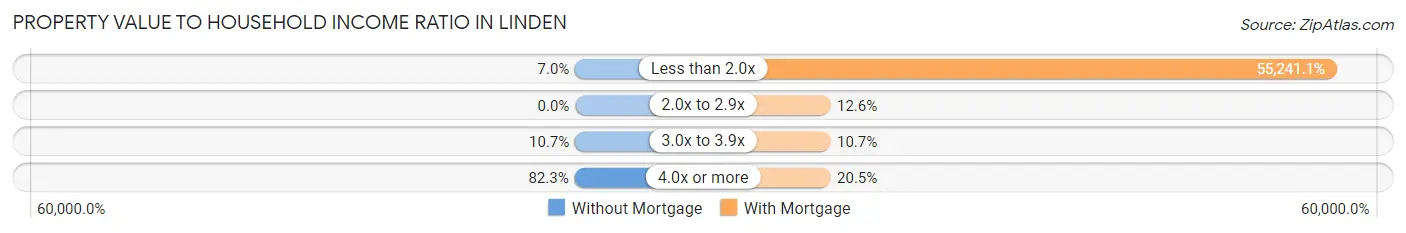
| Value-to-Income Ratio | Without Mortgage | With Mortgage |
| Less than 2.0x | 15 (7.0%) | 145,284 (55,241.1%) |
| 2.0x to 2.9x | 0 (0.0%) | 33 (12.6%) |
| 3.0x to 3.9x | 23 (10.7%) | 28 (10.6%) |
| 4.0x or more | 177 (82.3%) | 54 (20.5%) |
| Total | 215 (100.0%) | 263 (100.0%) |
Real Estate Taxes by Mortgage Status in Linden
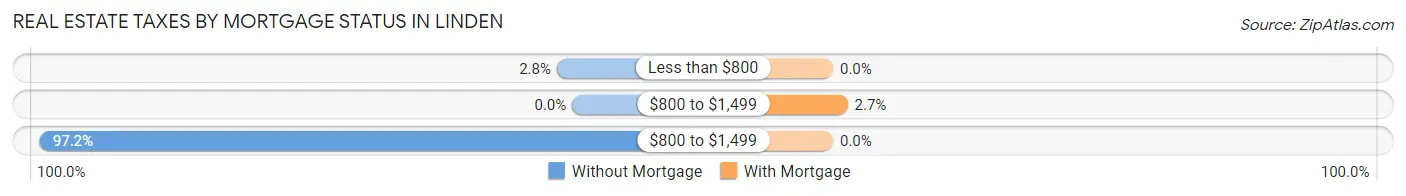
| Property Taxes | Without Mortgage | With Mortgage |
| Less than $800 | 6 (2.8%) | 0 (0.0%) |
| $800 to $1,499 | 0 (0.0%) | 7 (2.7%) |
| $800 to $1,499 | 209 (97.2%) | 0 (0.0%) |
| Total | 215 (100.0%) | 263 (100.0%) |
Health & Disability in Linden
Health Insurance Coverage by Age in Linden
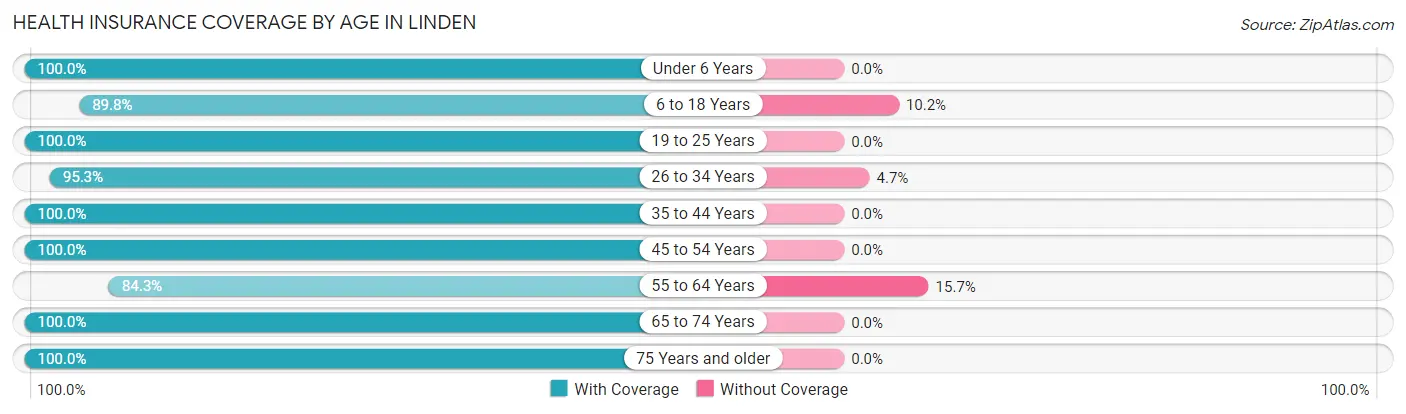
| Age Bracket | With Coverage | Without Coverage |
| Under 6 Years | 194 (100.0%) | 0 (0.0%) |
| 6 to 18 Years | 291 (89.8%) | 33 (10.2%) |
| 19 to 25 Years | 127 (100.0%) | 0 (0.0%) |
| 26 to 34 Years | 202 (95.3%) | 10 (4.7%) |
| 35 to 44 Years | 313 (100.0%) | 0 (0.0%) |
| 45 to 54 Years | 87 (100.0%) | 0 (0.0%) |
| 55 to 64 Years | 225 (84.3%) | 42 (15.7%) |
| 65 to 74 Years | 88 (100.0%) | 0 (0.0%) |
| 75 Years and older | 233 (100.0%) | 0 (0.0%) |
| Total | 1,760 (95.4%) | 85 (4.6%) |
Health Insurance Coverage by Citizenship Status in Linden
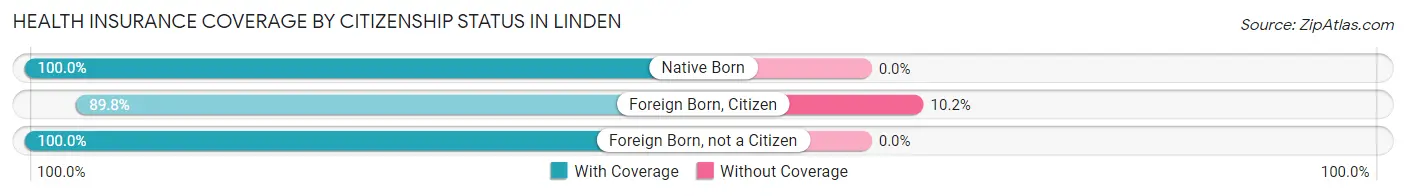
| Citizenship Status | With Coverage | Without Coverage |
| Native Born | 194 (100.0%) | 0 (0.0%) |
| Foreign Born, Citizen | 291 (89.8%) | 33 (10.2%) |
| Foreign Born, not a Citizen | 127 (100.0%) | 0 (0.0%) |
Health Insurance Coverage by Household Income in Linden

| Household Income | With Coverage | Without Coverage |
| Under $25,000 | 78 (89.7%) | 9 (10.3%) |
| $25,000 to $49,999 | 298 (100.0%) | 0 (0.0%) |
| $50,000 to $74,999 | 188 (100.0%) | 0 (0.0%) |
| $75,000 to $99,999 | 51 (43.6%) | 66 (56.4%) |
| $100,000 and over | 1,145 (99.1%) | 10 (0.9%) |
Public vs Private Health Insurance Coverage by Age in Linden
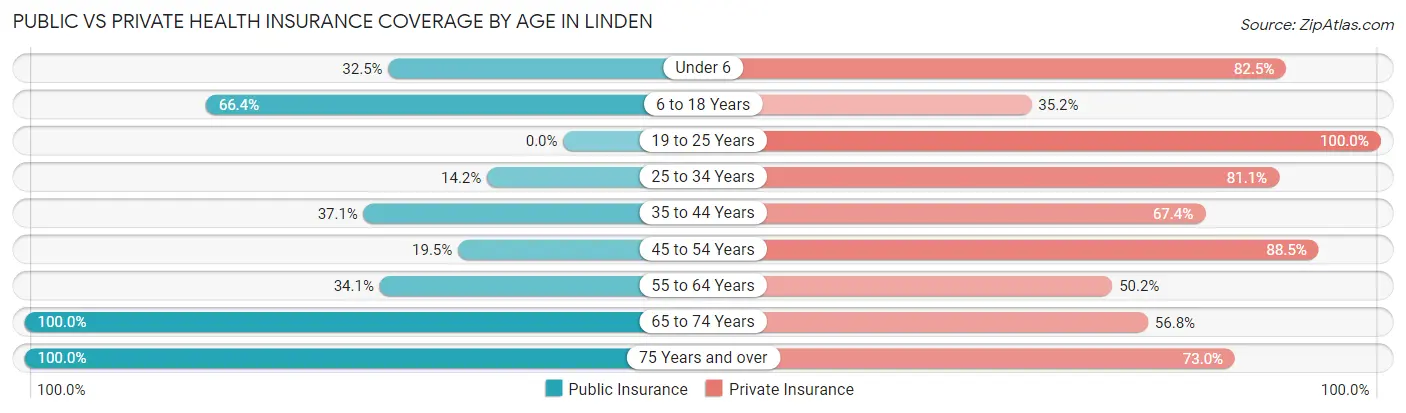
| Age Bracket | Public Insurance | Private Insurance |
| Under 6 | 63 (32.5%) | 160 (82.5%) |
| 6 to 18 Years | 215 (66.4%) | 114 (35.2%) |
| 19 to 25 Years | 0 (0.0%) | 127 (100.0%) |
| 25 to 34 Years | 30 (14.1%) | 172 (81.1%) |
| 35 to 44 Years | 116 (37.1%) | 211 (67.4%) |
| 45 to 54 Years | 17 (19.5%) | 77 (88.5%) |
| 55 to 64 Years | 91 (34.1%) | 134 (50.2%) |
| 65 to 74 Years | 88 (100.0%) | 50 (56.8%) |
| 75 Years and over | 233 (100.0%) | 170 (73.0%) |
| Total | 853 (46.2%) | 1,215 (65.8%) |
Disability Status by Sex by Age in Linden
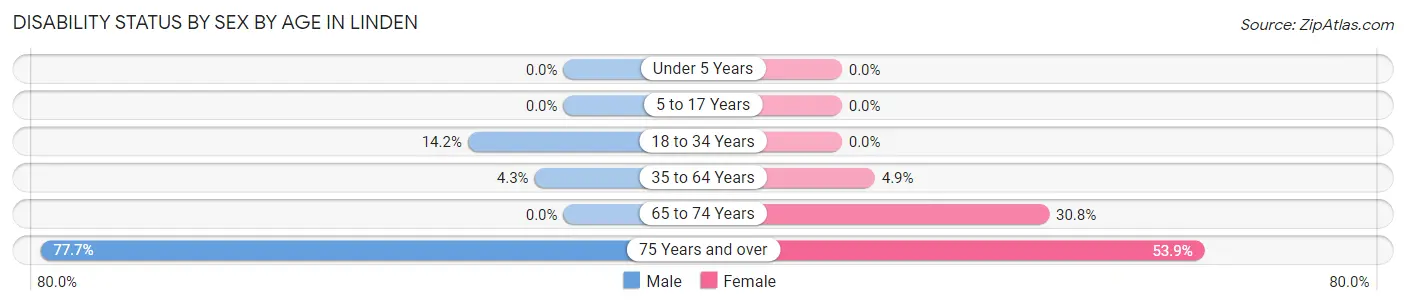
| Age Bracket | Male | Female |
| Under 5 Years | 0 (0.0%) | 0 (0.0%) |
| 5 to 17 Years | 0 (0.0%) | 0 (0.0%) |
| 18 to 34 Years | 25 (14.2%) | 0 (0.0%) |
| 35 to 64 Years | 12 (4.3%) | 19 (4.9%) |
| 65 to 74 Years | 0 (0.0%) | 16 (30.8%) |
| 75 Years and over | 80 (77.7%) | 70 (53.8%) |
Disability Class by Sex by Age in Linden
Disability Class: Hearing Difficulty
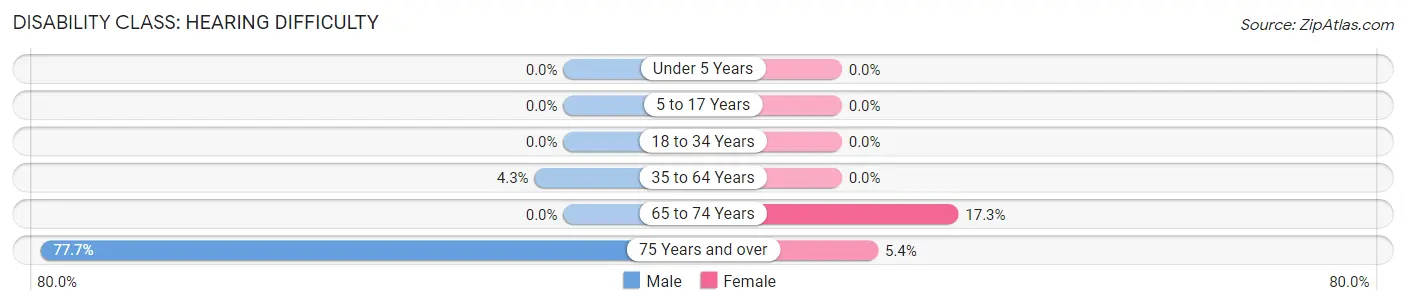
| Age Bracket | Male | Female |
| Under 5 Years | 0 (0.0%) | 0 (0.0%) |
| 5 to 17 Years | 0 (0.0%) | 0 (0.0%) |
| 18 to 34 Years | 0 (0.0%) | 0 (0.0%) |
| 35 to 64 Years | 12 (4.3%) | 0 (0.0%) |
| 65 to 74 Years | 0 (0.0%) | 9 (17.3%) |
| 75 Years and over | 80 (77.7%) | 7 (5.4%) |
Disability Class: Vision Difficulty
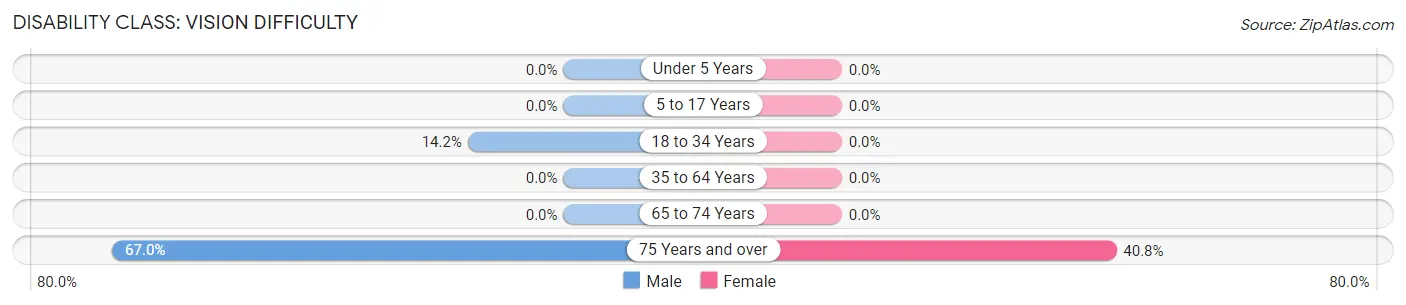
| Age Bracket | Male | Female |
| Under 5 Years | 0 (0.0%) | 0 (0.0%) |
| 5 to 17 Years | 0 (0.0%) | 0 (0.0%) |
| 18 to 34 Years | 25 (14.2%) | 0 (0.0%) |
| 35 to 64 Years | 0 (0.0%) | 0 (0.0%) |
| 65 to 74 Years | 0 (0.0%) | 0 (0.0%) |
| 75 Years and over | 69 (67.0%) | 53 (40.8%) |
Disability Class: Cognitive Difficulty
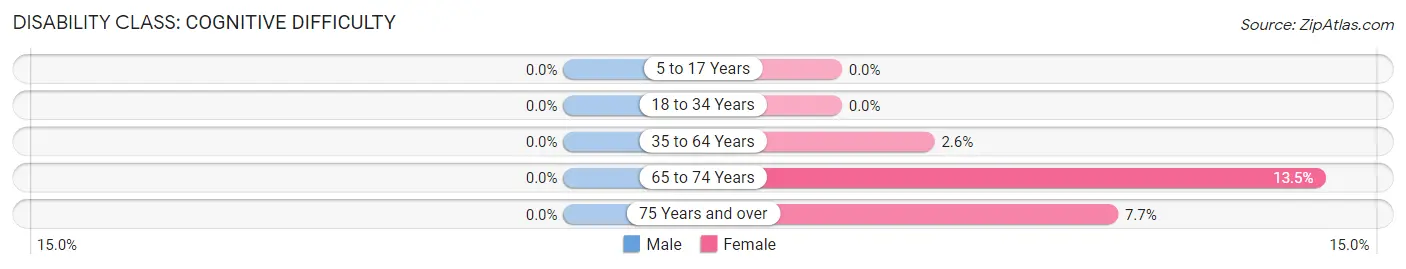
| Age Bracket | Male | Female |
| 5 to 17 Years | 0 (0.0%) | 0 (0.0%) |
| 18 to 34 Years | 0 (0.0%) | 0 (0.0%) |
| 35 to 64 Years | 0 (0.0%) | 10 (2.6%) |
| 65 to 74 Years | 0 (0.0%) | 7 (13.5%) |
| 75 Years and over | 0 (0.0%) | 10 (7.7%) |
Disability Class: Ambulatory Difficulty
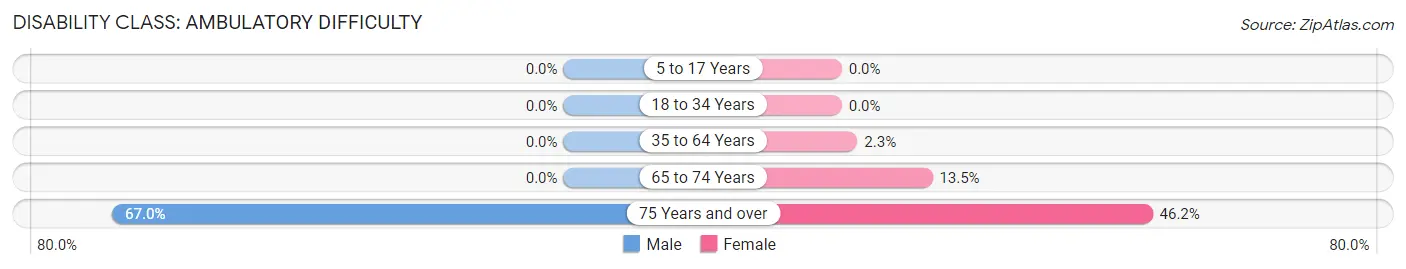
| Age Bracket | Male | Female |
| 5 to 17 Years | 0 (0.0%) | 0 (0.0%) |
| 18 to 34 Years | 0 (0.0%) | 0 (0.0%) |
| 35 to 64 Years | 0 (0.0%) | 9 (2.3%) |
| 65 to 74 Years | 0 (0.0%) | 7 (13.5%) |
| 75 Years and over | 69 (67.0%) | 60 (46.2%) |
Disability Class: Self-Care Difficulty
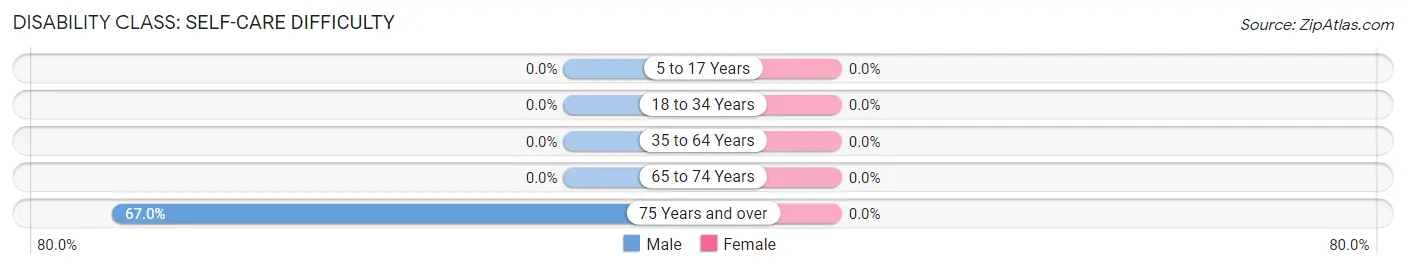
| Age Bracket | Male | Female |
| 5 to 17 Years | 0 (0.0%) | 0 (0.0%) |
| 18 to 34 Years | 0 (0.0%) | 0 (0.0%) |
| 35 to 64 Years | 0 (0.0%) | 0 (0.0%) |
| 65 to 74 Years | 0 (0.0%) | 0 (0.0%) |
| 75 Years and over | 69 (67.0%) | 0 (0.0%) |
Technology Access in Linden
Computing Device Access in Linden
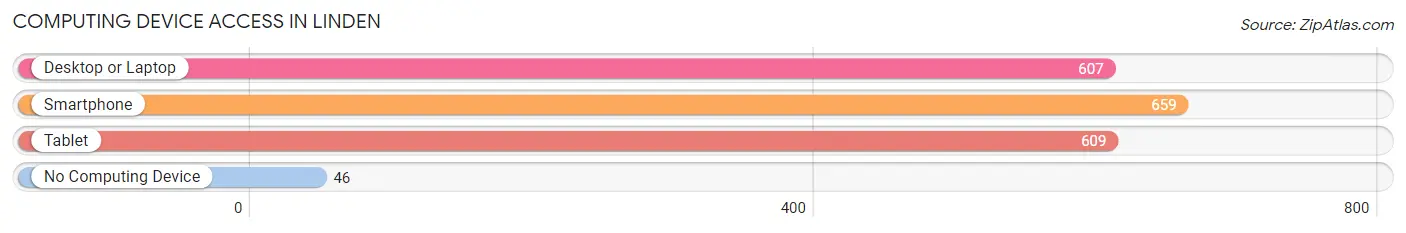
| Device Type | # Households | % Households |
| Desktop or Laptop | 607 | 85.3% |
| Smartphone | 659 | 92.6% |
| Tablet | 609 | 85.5% |
| No Computing Device | 46 | 6.5% |
| Total | 712 | 100.0% |
Internet Access in Linden
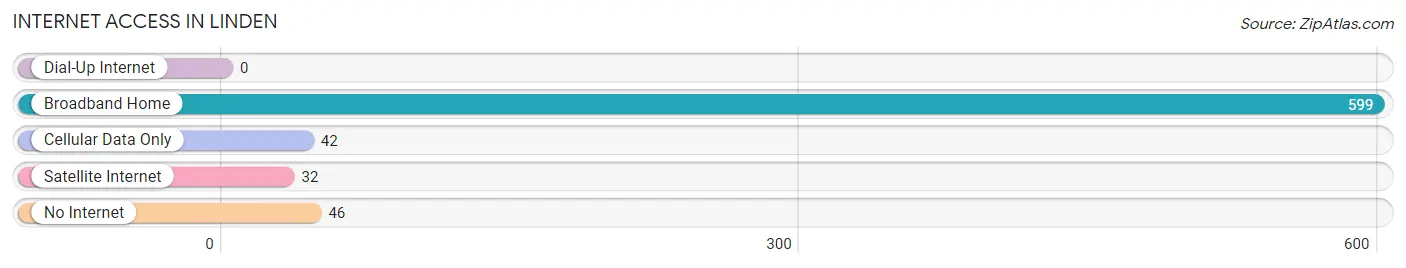
| Internet Type | # Households | % Households |
| Dial-Up Internet | 0 | 0.0% |
| Broadband Home | 599 | 84.1% |
| Cellular Data Only | 42 | 5.9% |
| Satellite Internet | 32 | 4.5% |
| No Internet | 46 | 6.5% |
| Total | 712 | 100.0% |
Linden Summary
Linden, California is a small town located in San Joaquin County, California. It is situated in the Central Valley, approximately 20 miles south of Stockton and 40 miles north of Modesto. The town has a population of approximately 2,000 people and is known for its agricultural production, small-town charm, and close-knit community.
History
The area that is now Linden was originally inhabited by the Yokut Native American tribe. The first European settlers arrived in the area in the early 1800s, and the town was officially founded in 1871. The town was named after a local landowner, John Linden, who donated the land for the town.
In the late 1800s, the town was a major hub for the agricultural industry, with many farms and ranches in the area. The town was also home to a number of businesses, including a blacksmith, a general store, and a hotel.
In the early 1900s, the town began to experience a decline in population as many of the residents moved away to larger cities. However, the town was able to remain a viable community due to its agricultural production.
Geography
Linden is located in the Central Valley of California, approximately 20 miles south of Stockton and 40 miles north of Modesto. The town is situated on the banks of the Mokelumne River, which provides a source of irrigation for the local farms and ranches.
The town is surrounded by rolling hills and farmland, and is located in a temperate climate zone. The average temperature in the summer is around 80 degrees Fahrenheit, and the average temperature in the winter is around 50 degrees Fahrenheit.
Economy
The economy of Linden is largely based on agriculture. The town is home to a number of farms and ranches, which produce a variety of crops, including almonds, walnuts, grapes, and tomatoes. The town is also home to a number of small businesses, including restaurants, shops, and services.
Demographics
As of the 2010 census, the population of Linden was 2,000 people. The town is predominantly white, with approximately 75% of the population identifying as Caucasian. The remaining 25% of the population is made up of African Americans, Hispanics, and Asians.
The median household income in Linden is $50,000, and the median home value is $200,000. The town has a low unemployment rate, and the majority of the population is employed in the agricultural industry.
Conclusion
Linden, California is a small town located in San Joaquin County, California. It is known for its agricultural production, small-town charm, and close-knit community. The town has a population of approximately 2,000 people, and the economy is largely based on agriculture. The town is predominantly white, with a median household income of $50,000 and a median home value of $200,000. Linden is a great place to live and work, and is a great example of a small town in California.
Common Questions
What is Per Capita Income in Linden?
Per Capita income in Linden is $42,289.
What is the Median Family Income in Linden?
Median Family Income in Linden is $81,288.
What is the Median Household income in Linden?
Median Household Income in Linden is $103,712.
What is Income or Wage Gap in Linden?
Income or Wage Gap in Linden is 28.3%.
Women in Linden earn 71.7 cents for every dollar earned by a man.
What is Inequality or Gini Index in Linden?
Inequality or Gini Index in Linden is 0.37.
What is the Total Population of Linden?
Total Population of Linden is 1,845.
What is the Total Male Population of Linden?
Total Male Population of Linden is 898.
What is the Total Female Population of Linden?
Total Female Population of Linden is 947.
What is the Ratio of Males per 100 Females in Linden?
There are 94.83 Males per 100 Females in Linden.
What is the Ratio of Females per 100 Males in Linden?
There are 105.46 Females per 100 Males in Linden.
What is the Median Population Age in Linden?
Median Population Age in Linden is 35.8 Years.
What is the Average Family Size in Linden
Average Family Size in Linden is 3.0 People.
What is the Average Household Size in Linden
Average Household Size in Linden is 2.6 People.
How Large is the Labor Force in Linden?
There are 866 People in the Labor Forcein in Linden.
What is the Percentage of People in the Labor Force in Linden?
59.4% of People are in the Labor Force in Linden.
What is the Unemployment Rate in Linden?
Unemployment Rate in Linden is 12.6%.