Kennedyville, MD Map & Demographics
Kennedyville Map
Kennedyville Overview
$30,161
PER CAPITA INCOME
0.41
INEQUALITY / GINI INDEX
456
TOTAL POPULATION
200
MALE POPULATION
256
FEMALE POPULATION
78.12
MALES / 100 FEMALES
128.00
FEMALES / 100 MALES
42.7
MEDIAN AGE
2.6
AVG FAMILY SIZE
2.8
AVG HOUSEHOLD SIZE
260
LABOR FORCE [ PEOPLE ]
74.3%
PERCENT IN LABOR FORCE
Kennedyville Zip Codes
Kennedyville Area Codes
Income in Kennedyville
Income Overview in Kennedyville
| Characteristic | Number | Measure |
| Per Capita Income | 456 | $30,161 |
| Median Family Income | 124 | $0 |
| Mean Family Income | 124 | $58,874 |
| Median Household Income | 163 | $0 |
| Mean Household Income | 163 | $78,269 |
| Income Deficit | 124 | $0 |
| Wage / Income Gap (%) | 456 | 0.00% |
| Wage / Income Gap ($) | 456 | 100.00¢ per $1 |
| Gini / Inequality Index | 456 | 0.41 |
Earnings by Sex in Kennedyville
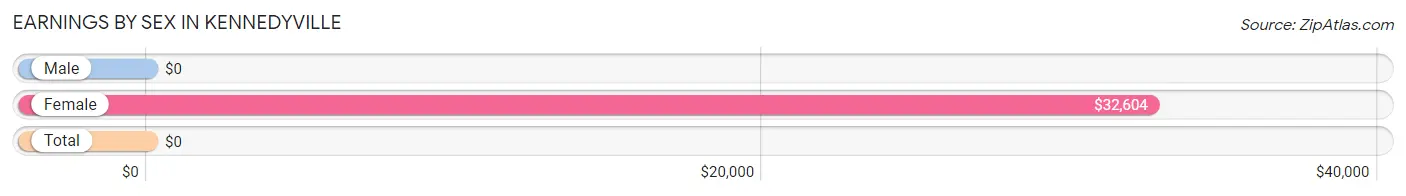
| Sex | Number | Average Earnings |
| Male | 135 (46.6%) | $0 |
| Female | 155 (53.4%) | $32,604 |
| Total | 290 (100.0%) | $0 |
Earnings by Sex by Income Bracket in Kennedyville
The most common earnings brackets in Kennedyville are $15,000 to $17,499 for men (58 | 43.0%) and $35,000 to $39,999 for women (59 | 38.1%).
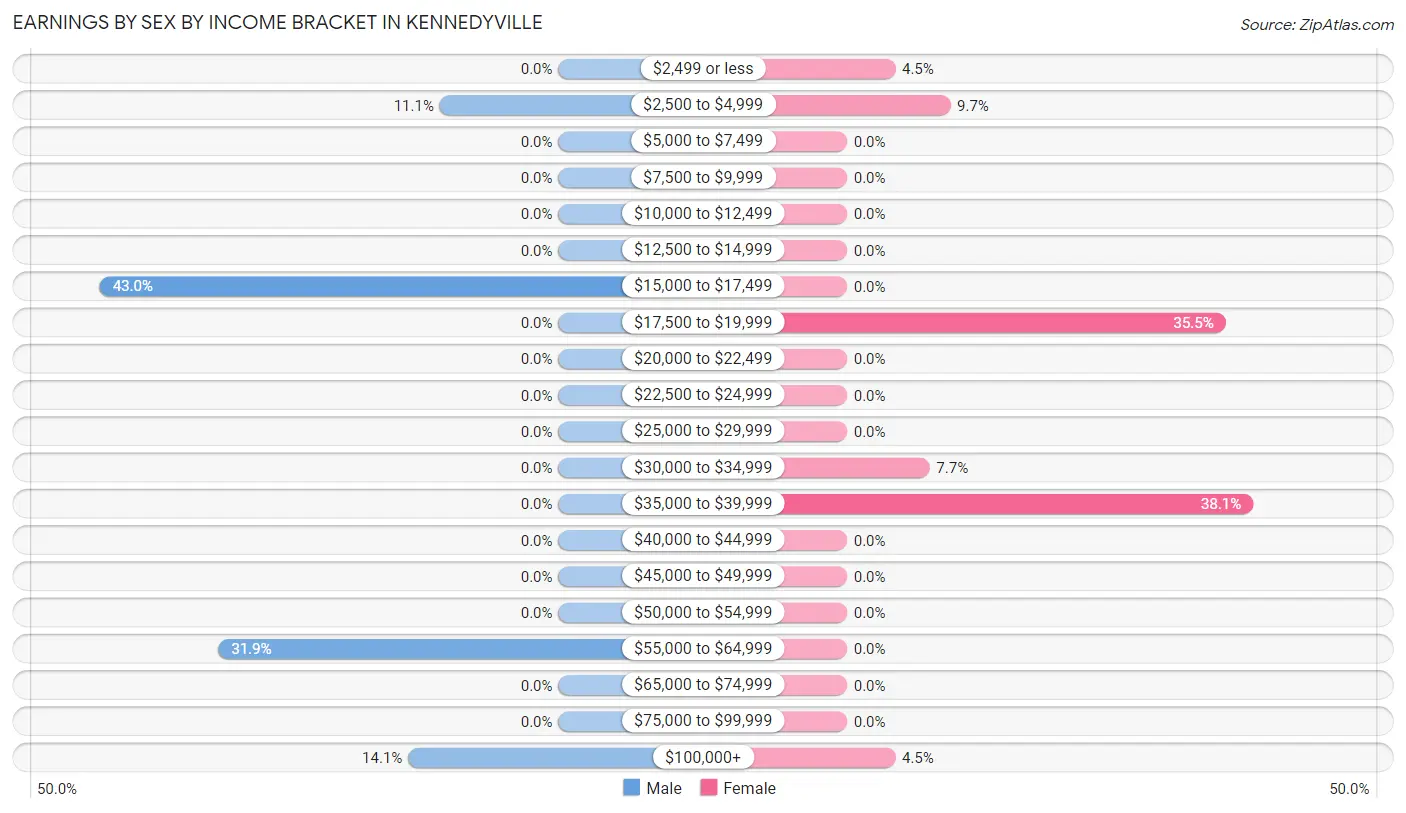
| Income | Male | Female |
| $2,499 or less | 0 (0.0%) | 7 (4.5%) |
| $2,500 to $4,999 | 15 (11.1%) | 15 (9.7%) |
| $5,000 to $7,499 | 0 (0.0%) | 0 (0.0%) |
| $7,500 to $9,999 | 0 (0.0%) | 0 (0.0%) |
| $10,000 to $12,499 | 0 (0.0%) | 0 (0.0%) |
| $12,500 to $14,999 | 0 (0.0%) | 0 (0.0%) |
| $15,000 to $17,499 | 58 (43.0%) | 0 (0.0%) |
| $17,500 to $19,999 | 0 (0.0%) | 55 (35.5%) |
| $20,000 to $22,499 | 0 (0.0%) | 0 (0.0%) |
| $22,500 to $24,999 | 0 (0.0%) | 0 (0.0%) |
| $25,000 to $29,999 | 0 (0.0%) | 0 (0.0%) |
| $30,000 to $34,999 | 0 (0.0%) | 12 (7.7%) |
| $35,000 to $39,999 | 0 (0.0%) | 59 (38.1%) |
| $40,000 to $44,999 | 0 (0.0%) | 0 (0.0%) |
| $45,000 to $49,999 | 0 (0.0%) | 0 (0.0%) |
| $50,000 to $54,999 | 0 (0.0%) | 0 (0.0%) |
| $55,000 to $64,999 | 43 (31.9%) | 0 (0.0%) |
| $65,000 to $74,999 | 0 (0.0%) | 0 (0.0%) |
| $75,000 to $99,999 | 0 (0.0%) | 0 (0.0%) |
| $100,000+ | 19 (14.1%) | 7 (4.5%) |
| Total | 135 (100.0%) | 155 (100.0%) |
Earnings by Sex by Educational Attainment in Kennedyville
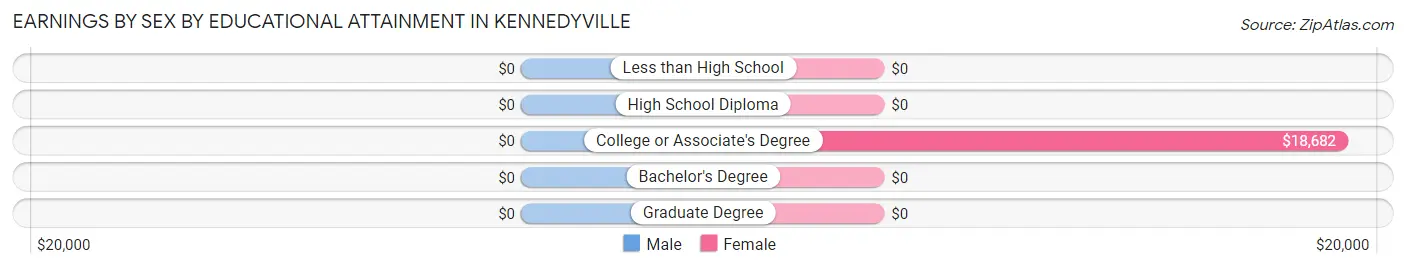
| Educational Attainment | Male Income | Female Income |
| Less than High School | - | - |
| High School Diploma | - | - |
| College or Associate's Degree | - | - |
| Bachelor's Degree | - | - |
| Graduate Degree | - | - |
| Total | - | - |
Family Income in Kennedyville
Family Income Brackets in Kennedyville
According to the Kennedyville family income data, there are 58 families falling into the $25,000 to $34,999 income range, which is the most common income bracket and makes up 46.8% of all families.
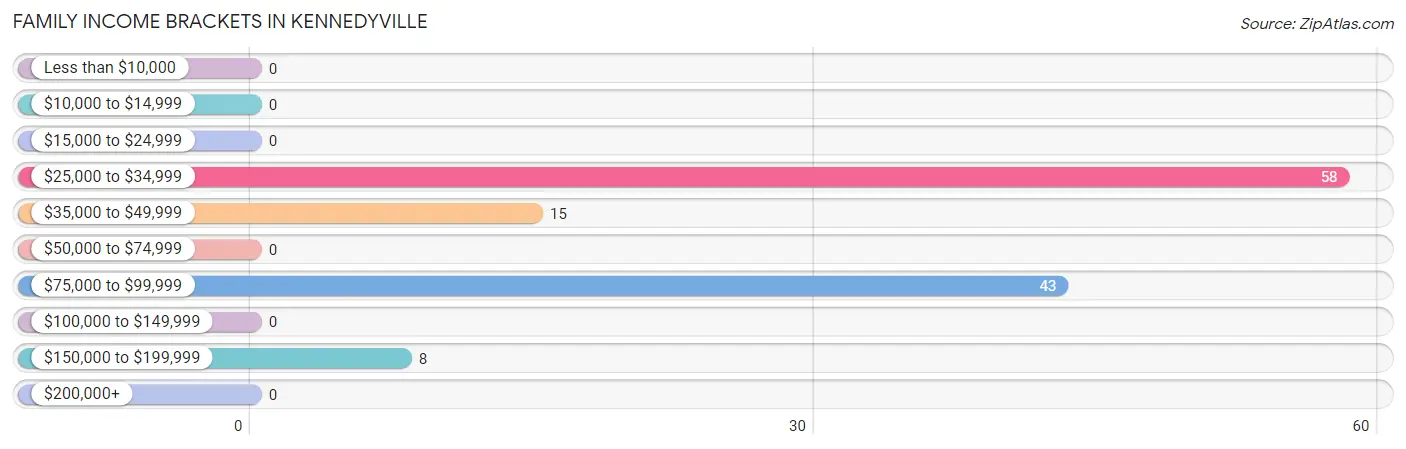
| Income Bracket | # Families | % Families |
| Less than $10,000 | 0 | 0.0% |
| $10,000 to $14,999 | 0 | 0.0% |
| $15,000 to $24,999 | 0 | 0.0% |
| $25,000 to $34,999 | 58 | 46.8% |
| $35,000 to $49,999 | 15 | 12.1% |
| $50,000 to $74,999 | 0 | 0.0% |
| $75,000 to $99,999 | 43 | 34.7% |
| $100,000 to $149,999 | 0 | 0.0% |
| $150,000 to $199,999 | 8 | 6.5% |
| $200,000+ | 0 | 0.0% |
Family Income by Famaliy Size in Kennedyville
| Income Bracket | # Families | Median Income |
| 2-Person Families | 73 (58.9%) | $0 |
| 3-Person Families | 43 (34.7%) | $0 |
| 4-Person Families | 8 (6.5%) | $0 |
| 5-Person Families | 0 (0.0%) | $0 |
| 6-Person Families | 0 (0.0%) | $0 |
| 7+ Person Families | 0 (0.0%) | $0 |
| Total | 124 (100.0%) | $0 |
Family Income by Number of Earners in Kennedyville
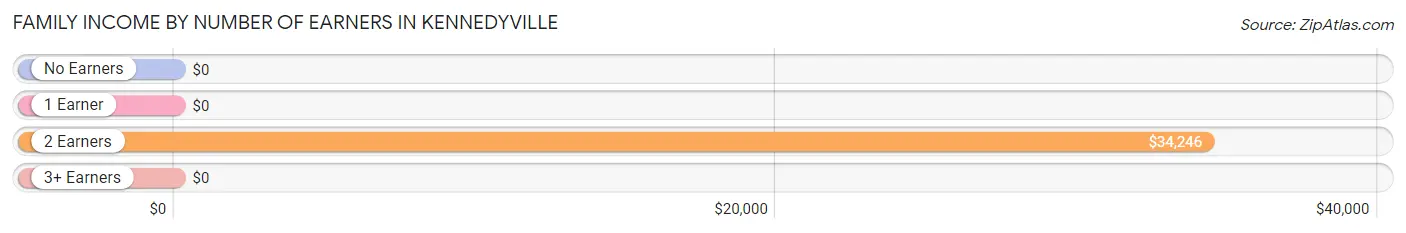
| Number of Earners | # Families | Median Income |
| No Earners | 0 (0.0%) | $0 |
| 1 Earner | 43 (34.7%) | $0 |
| 2 Earners | 81 (65.3%) | $34,246 |
| 3+ Earners | 0 (0.0%) | $0 |
| Total | 124 (100.0%) | $0 |
Household Income in Kennedyville
Household Income Brackets in Kennedyville
With 58 households falling in the category, the $25,000 to $34,999 income range is the most frequent in Kennedyville, accounting for 35.6% of all households.
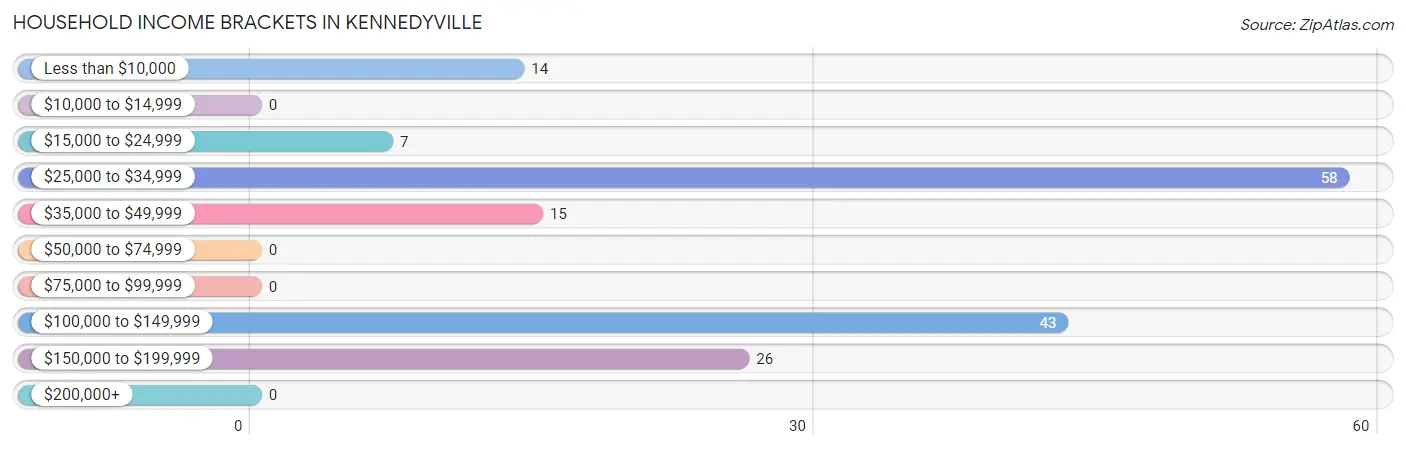
| Income Bracket | # Households | % Households |
| Less than $10,000 | 14 | 8.6% |
| $10,000 to $14,999 | 0 | 0.0% |
| $15,000 to $24,999 | 7 | 4.3% |
| $25,000 to $34,999 | 58 | 35.6% |
| $35,000 to $49,999 | 15 | 9.2% |
| $50,000 to $74,999 | 0 | 0.0% |
| $75,000 to $99,999 | 0 | 0.0% |
| $100,000 to $149,999 | 43 | 26.4% |
| $150,000 to $199,999 | 26 | 16.0% |
| $200,000+ | 0 | 0.0% |
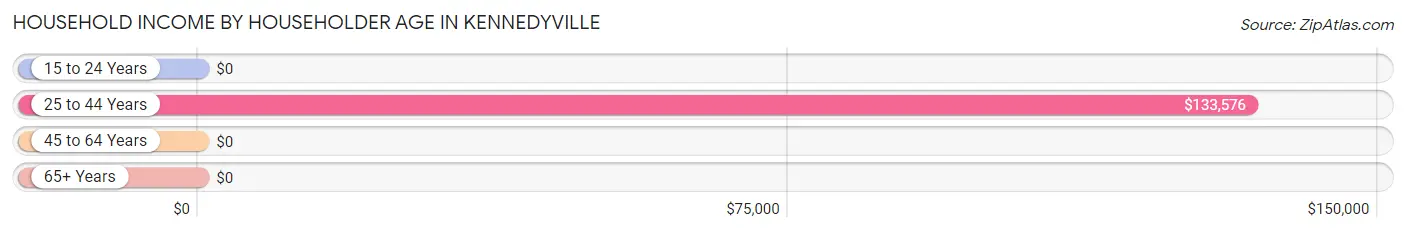
Household Income by Householder Age in Kennedyville
The median household income in Kennedyville is $0, with the highest median household income of $133,576 found in the 25 to 44 years age bracket for the primary householder. A total of 65 households (39.9%) fall into this category.
| Income Bracket | # Households | Median Income |
| 15 to 24 Years | 0 (0.0%) | $0 |
| 25 to 44 Years | 65 (39.9%) | $133,576 |
| 45 to 64 Years | 76 (46.6%) | $0 |
| 65+ Years | 22 (13.5%) | $0 |
| Total | 163 (100.0%) | $0 |
Poverty in Kennedyville
Income Below Poverty by Sex and Age in Kennedyville
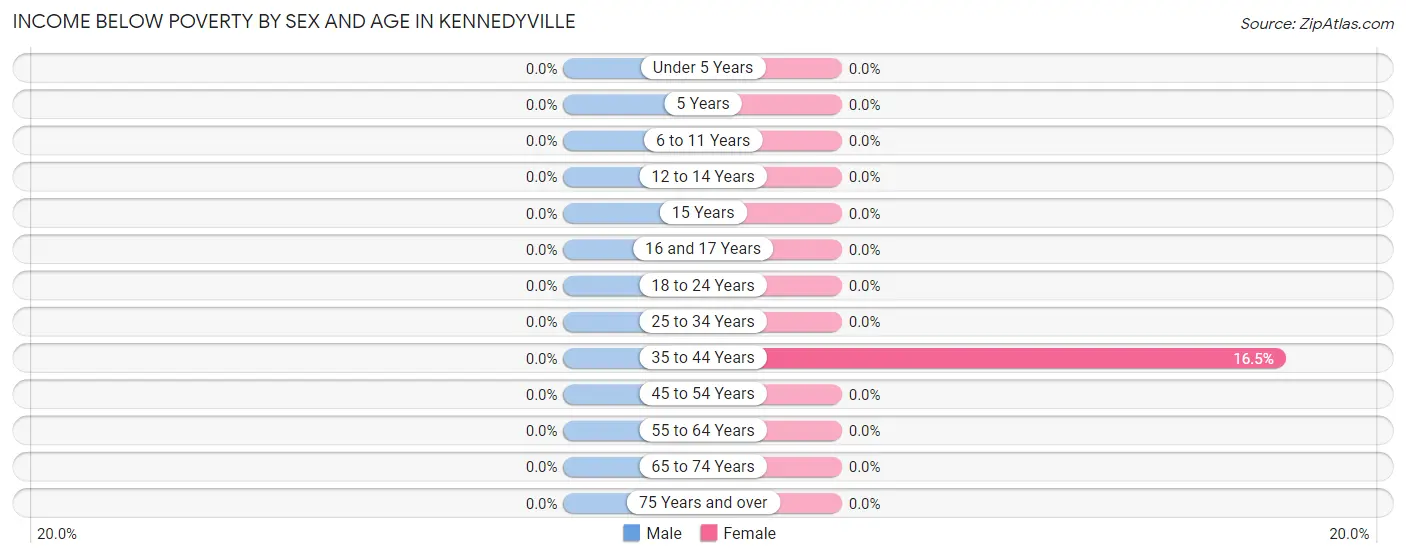
| Age Bracket | Male | Female |
| Under 5 Years | 0 (0.0%) | 0 (0.0%) |
| 5 Years | 0 (0.0%) | 0 (0.0%) |
| 6 to 11 Years | 0 (0.0%) | 0 (0.0%) |
| 12 to 14 Years | 0 (0.0%) | 0 (0.0%) |
| 15 Years | 0 (0.0%) | 0 (0.0%) |
| 16 and 17 Years | 0 (0.0%) | 0 (0.0%) |
| 18 to 24 Years | 0 (0.0%) | 0 (0.0%) |
| 25 to 34 Years | 0 (0.0%) | 0 (0.0%) |
| 35 to 44 Years | 0 (0.0%) | 14 (16.5%) |
| 45 to 54 Years | 0 (0.0%) | 0 (0.0%) |
| 55 to 64 Years | 0 (0.0%) | 0 (0.0%) |
| 65 to 74 Years | 0 (0.0%) | 0 (0.0%) |
| 75 Years and over | 0 (0.0%) | 0 (0.0%) |
| Total | 0 (0.0%) | 14 (6.5%) |
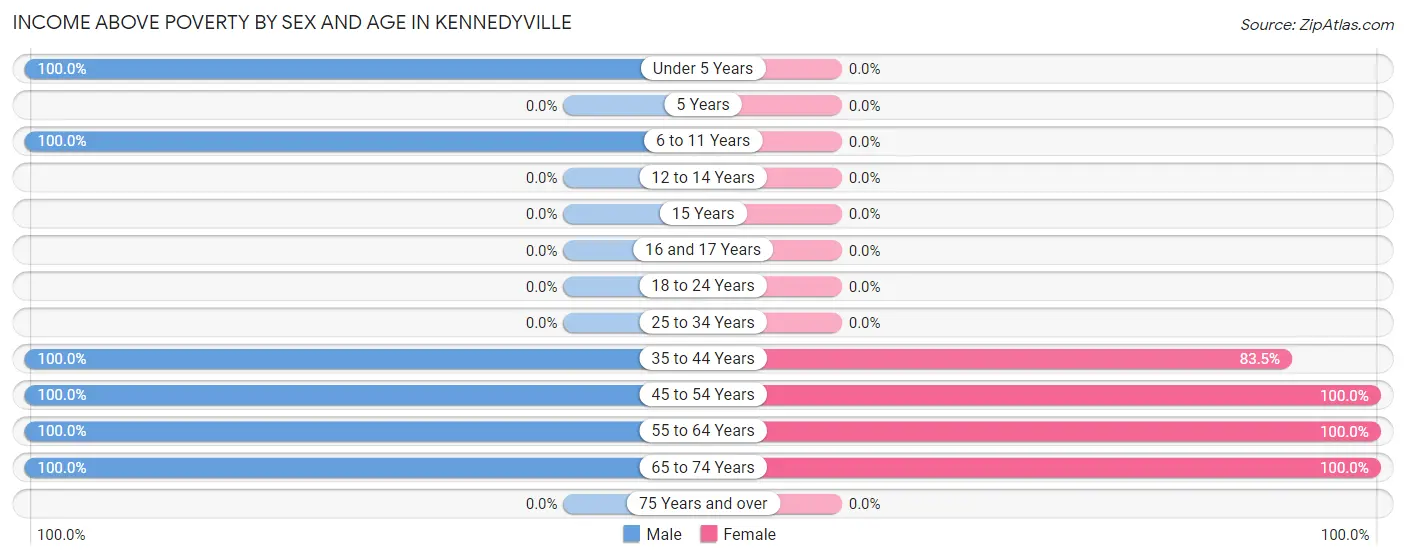
Income Above Poverty by Sex and Age in Kennedyville
According to the poverty statistics in Kennedyville, males aged under 5 years and females aged 45 to 54 years are the age groups that are most secure financially, with 100.0% of males and 100.0% of females in these age groups living above the poverty line.
| Age Bracket | Male | Female |
| Under 5 Years | 10 (100.0%) | 0 (0.0%) |
| 5 Years | 0 (0.0%) | 0 (0.0%) |
| 6 to 11 Years | 55 (100.0%) | 0 (0.0%) |
| 12 to 14 Years | 0 (0.0%) | 0 (0.0%) |
| 15 Years | 0 (0.0%) | 0 (0.0%) |
| 16 and 17 Years | 0 (0.0%) | 0 (0.0%) |
| 18 to 24 Years | 0 (0.0%) | 0 (0.0%) |
| 25 to 34 Years | 0 (0.0%) | 0 (0.0%) |
| 35 to 44 Years | 51 (100.0%) | 71 (83.5%) |
| 45 to 54 Years | 58 (100.0%) | 7 (100.0%) |
| 55 to 64 Years | 11 (100.0%) | 116 (100.0%) |
| 65 to 74 Years | 15 (100.0%) | 7 (100.0%) |
| 75 Years and over | 0 (0.0%) | 0 (0.0%) |
| Total | 200 (100.0%) | 201 (93.5%) |
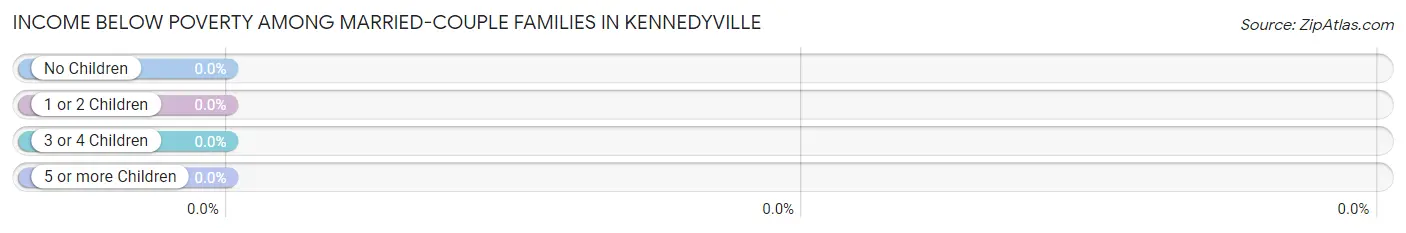
Income Below Poverty Among Married-Couple Families in Kennedyville
| Children | Above Poverty | Below Poverty |
| No Children | 73 (100.0%) | 0 (0.0%) |
| 1 or 2 Children | 8 (100.0%) | 0 (0.0%) |
| 3 or 4 Children | 0 (0.0%) | 0 (0.0%) |
| 5 or more Children | 0 (0.0%) | 0 (0.0%) |
| Total | 81 (100.0%) | 0 (0.0%) |
Income Below Poverty Among Single-Parent Households in Kennedyville
| Children | Single Father | Single Mother |
| No Children | 0 (0.0%) | 0 (0.0%) |
| 1 or 2 Children | 0 (0.0%) | 0 (0.0%) |
| 3 or 4 Children | 0 (0.0%) | 0 (0.0%) |
| 5 or more Children | 0 (0.0%) | 0 (0.0%) |
| Total | 0 (0.0%) | 0 (0.0%) |
Income Below Poverty Among Married-Couple vs Single-Parent Households in Kennedyville
| Children | Married-Couple Families | Single-Parent Households |
| No Children | 0 (0.0%) | 0 (0.0%) |
| 1 or 2 Children | 0 (0.0%) | 0 (0.0%) |
| 3 or 4 Children | 0 (0.0%) | 0 (0.0%) |
| 5 or more Children | 0 (0.0%) | 0 (0.0%) |
| Total | 0 (0.0%) | 0 (0.0%) |
Race in Kennedyville
The most populous races in Kennedyville are , and White / Caucasian (456 | 100.0%).
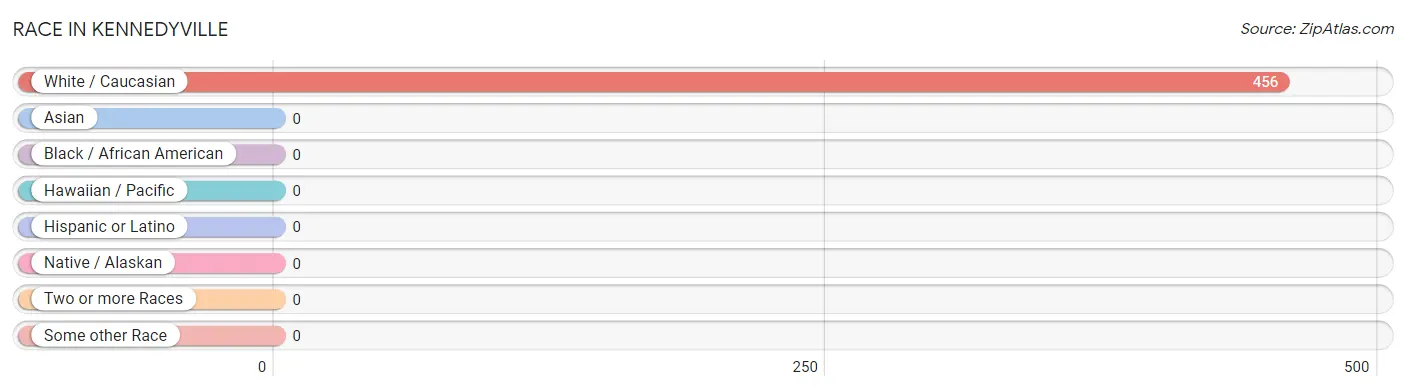
| Race | # Population | % Population |
| Asian | 0 | 0.0% |
| Black / African American | 0 | 0.0% |
| Hawaiian / Pacific | 0 | 0.0% |
| Hispanic or Latino | 0 | 0.0% |
| Native / Alaskan | 0 | 0.0% |
| White / Caucasian | 456 | 100.0% |
| Two or more Races | 0 | 0.0% |
| Some other Race | 0 | 0.0% |
| Total | 456 | 100.0% |
Ancestry in Kennedyville
The most populous ancestries reported in Kennedyville are Irish (97 | 21.3%), Italian (70 | 15.3%), Swedish (58 | 12.7%), German (57 | 12.5%), and Scottish (15 | 3.3%), together accounting for 65.1% of all Kennedyville residents.
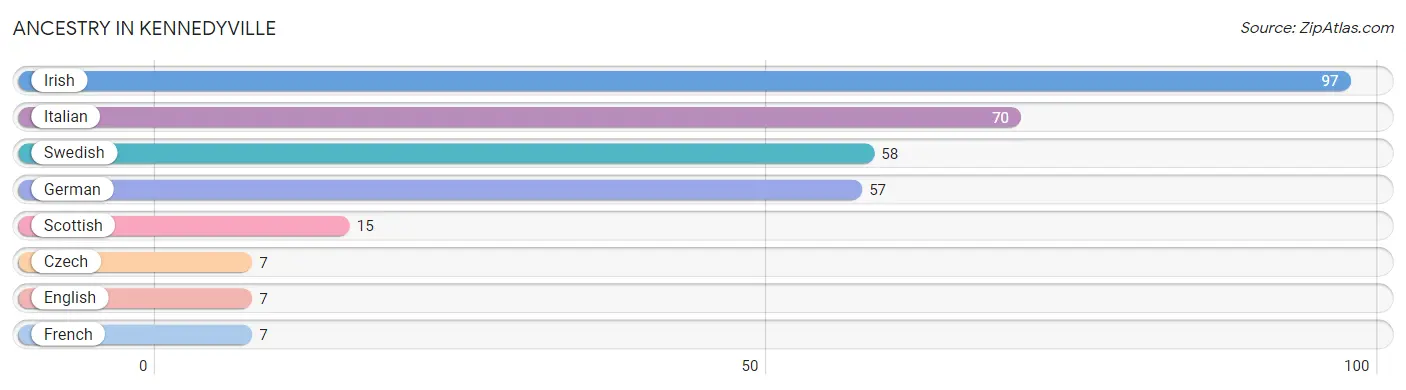
| Ancestry | # Population | % Population |
| Czech | 7 | 1.5% |
| English | 7 | 1.5% |
| French | 7 | 1.5% |
| German | 57 | 12.5% |
| Irish | 97 | 21.3% |
| Italian | 70 | 15.3% |
| Scottish | 15 | 3.3% |
| Swedish | 58 | 12.7% | View All 8 Rows |
Immigrants in Kennedyville
The most numerous immigrant groups reported in Kennedyville came from Europe (58 | 12.7%), Northern Europe (58 | 12.7%), and Sweden (58 | 12.7%), together accounting for 38.2% of all Kennedyville residents.
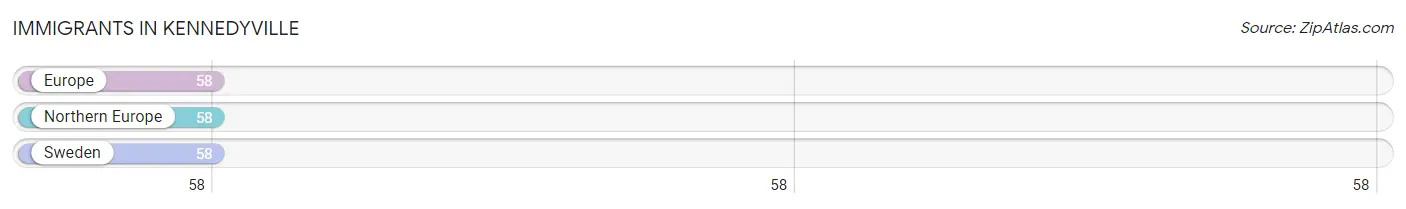
| Immigration Origin | # Population | % Population |
| Europe | 58 | 12.7% |
| Northern Europe | 58 | 12.7% |
| Sweden | 58 | 12.7% | View All 3 Rows |
Sex and Age in Kennedyville
Sex and Age in Kennedyville
The most populous age groups in Kennedyville are 45 to 49 Years (58 | 29.0%) for men and 60 to 64 Years (116 | 45.3%) for women.
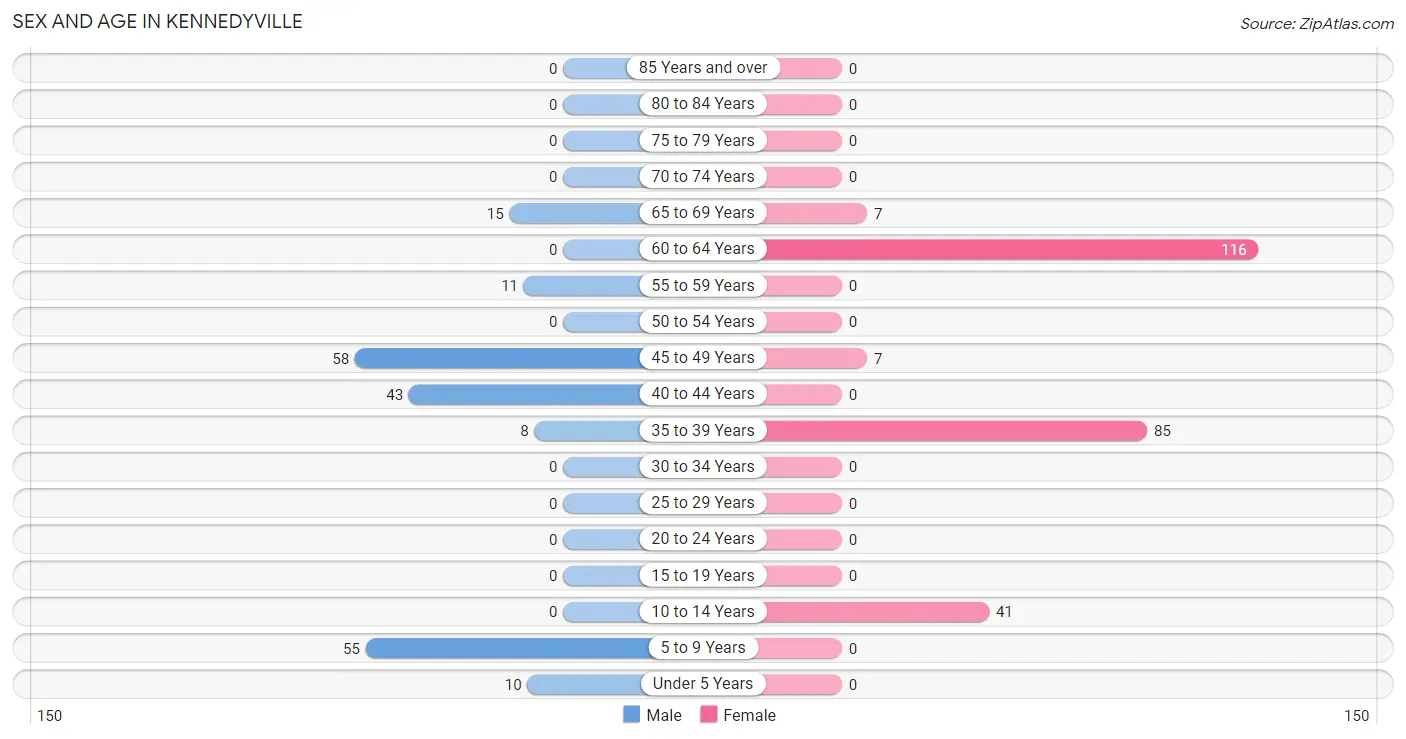
| Age Bracket | Male | Female |
| Under 5 Years | 10 (5.0%) | 0 (0.0%) |
| 5 to 9 Years | 55 (27.5%) | 0 (0.0%) |
| 10 to 14 Years | 0 (0.0%) | 41 (16.0%) |
| 15 to 19 Years | 0 (0.0%) | 0 (0.0%) |
| 20 to 24 Years | 0 (0.0%) | 0 (0.0%) |
| 25 to 29 Years | 0 (0.0%) | 0 (0.0%) |
| 30 to 34 Years | 0 (0.0%) | 0 (0.0%) |
| 35 to 39 Years | 8 (4.0%) | 85 (33.2%) |
| 40 to 44 Years | 43 (21.5%) | 0 (0.0%) |
| 45 to 49 Years | 58 (29.0%) | 7 (2.7%) |
| 50 to 54 Years | 0 (0.0%) | 0 (0.0%) |
| 55 to 59 Years | 11 (5.5%) | 0 (0.0%) |
| 60 to 64 Years | 0 (0.0%) | 116 (45.3%) |
| 65 to 69 Years | 15 (7.5%) | 7 (2.7%) |
| 70 to 74 Years | 0 (0.0%) | 0 (0.0%) |
| 75 to 79 Years | 0 (0.0%) | 0 (0.0%) |
| 80 to 84 Years | 0 (0.0%) | 0 (0.0%) |
| 85 Years and over | 0 (0.0%) | 0 (0.0%) |
| Total | 200 (100.0%) | 256 (100.0%) |
Families and Households in Kennedyville
Median Family Size in Kennedyville
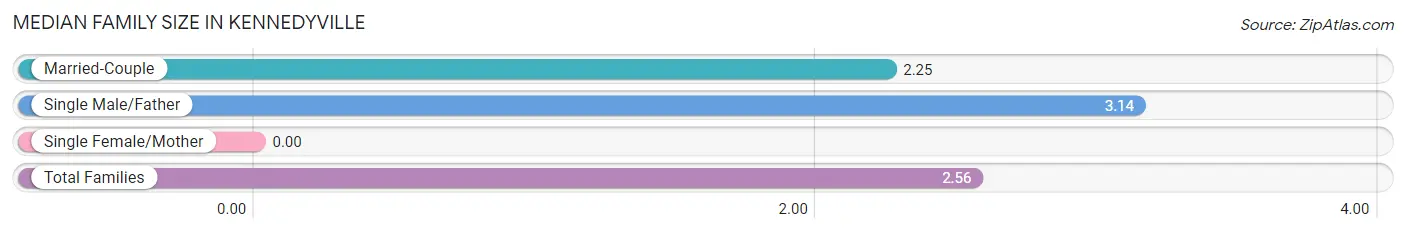
| Family Type | # Families | Family Size |
| Married-Couple | 81 (65.3%) | 2.25 |
| Single Male/Father | 43 (34.7%) | 3.14 |
| Single Female/Mother | 0 (0.0%) | - |
| Total Families | 124 (100.0%) | 2.56 |
Median Household Size in Kennedyville
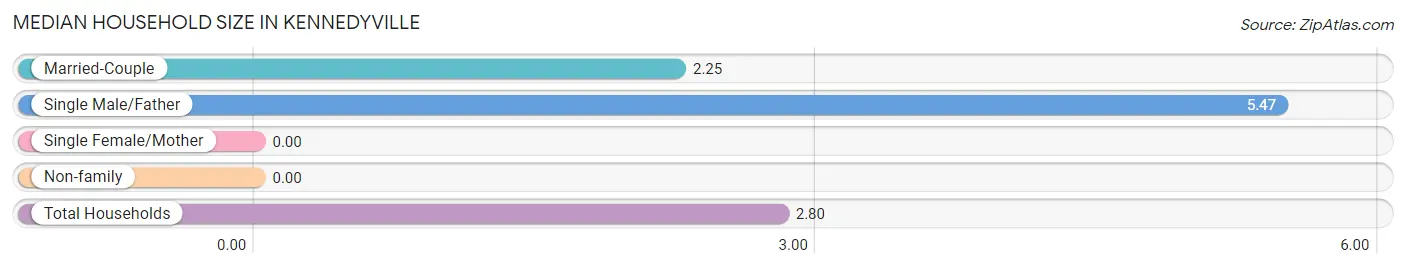
| Household Type | # Households | Household Size |
| Married-Couple | 81 (49.7%) | 2.25 |
| Single Male/Father | 43 (26.4%) | 5.47 |
| Single Female/Mother | 0 (0.0%) | - |
| Non-family | 39 (23.9%) | - |
| Total Households | 163 (100.0%) | 2.80 |
Household Size by Marriage Status in Kennedyville
Out of a total of 163 households in Kennedyville, 124 (76.1%) are family households, while 39 (23.9%) are nonfamily households. The most numerous type of family households are 2-person households, comprising 73, and the most common type of nonfamily households are 1-person households, comprising 39.
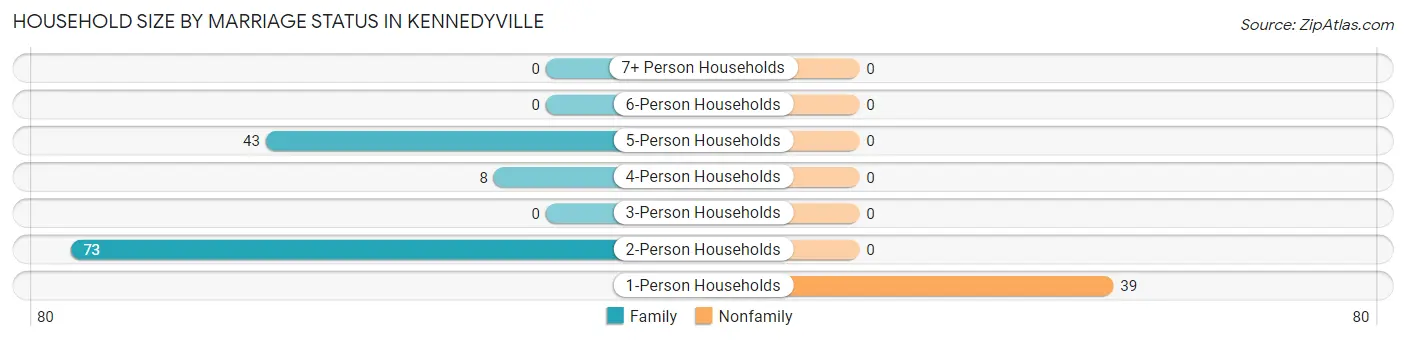
| Household Size | Family Households | Nonfamily Households |
| 1-Person Households | - | 39 (23.9%) |
| 2-Person Households | 73 (44.8%) | 0 (0.0%) |
| 3-Person Households | 0 (0.0%) | 0 (0.0%) |
| 4-Person Households | 8 (4.9%) | 0 (0.0%) |
| 5-Person Households | 43 (26.4%) | 0 (0.0%) |
| 6-Person Households | 0 (0.0%) | 0 (0.0%) |
| 7+ Person Households | 0 (0.0%) | 0 (0.0%) |
| Total | 124 (76.1%) | 39 (23.9%) |
Female Fertility in Kennedyville
Fertility by Age in Kennedyville
| Age Bracket | Women with Births | Births / 1,000 Women |
| 15 to 19 years | 0 (0.0%) | 0.0 |
| 20 to 34 years | 0 (0.0%) | 0.0 |
| 35 to 50 years | 0 (0.0%) | 0.0 |
| Total | 0 (0.0%) | 0.0 |
Fertility by Age by Marriage Status in Kennedyville
| Age Bracket | Married | Unmarried |
| 15 to 19 years | 0 (0.0%) | 0 (0.0%) |
| 20 to 34 years | 0 (0.0%) | 0 (0.0%) |
| 35 to 50 years | 0 (0.0%) | 0 (0.0%) |
| Total | 0 (0.0%) | 0 (0.0%) |
Fertility by Education in Kennedyville
| Educational Attainment | Women with Births | Births / 1,000 Women |
| Less than High School | 0 (0.0%) | 0.0 |
| High School Diploma | 0 (0.0%) | 0.0 |
| College or Associate's Degree | 0 (0.0%) | 0.0 |
| Bachelor's Degree | 0 (0.0%) | 0.0 |
| Graduate Degree | 0 (0.0%) | 0.0 |
| Total | 0 (0.0%) | 0.0 |
Fertility by Education by Marriage Status in Kennedyville
| Educational Attainment | Married | Unmarried |
| Less than High School | 0 (0.0%) | 0 (0.0%) |
| High School Diploma | 0 (0.0%) | 0 (0.0%) |
| College or Associate's Degree | 0 (0.0%) | 0 (0.0%) |
| Bachelor's Degree | 0 (0.0%) | 0 (0.0%) |
| Graduate Degree | 0 (0.0%) | 0 (0.0%) |
| Total | 0 (0.0%) | 0 (0.0%) |
Employment Characteristics in Kennedyville
Employment by Class of Employer in Kennedyville
Among the 260 employed individuals in Kennedyville, private company employees (114 | 43.9%), self-employed (not incorporated) (69 | 26.5%), and local government employees (55 | 21.1%) make up the most common classes of employment.
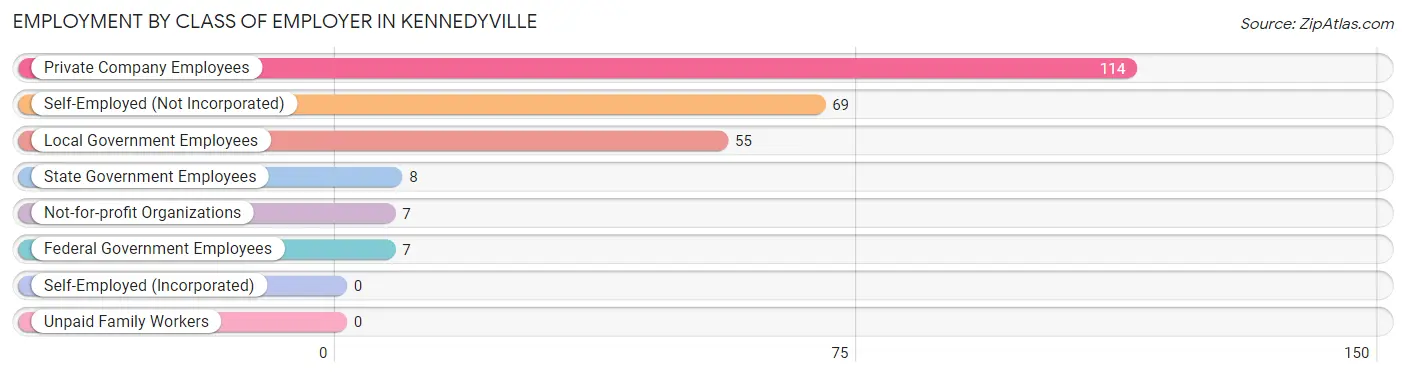
| Employer Class | # Employees | % Employees |
| Private Company Employees | 114 | 43.9% |
| Self-Employed (Incorporated) | 0 | 0.0% |
| Self-Employed (Not Incorporated) | 69 | 26.5% |
| Not-for-profit Organizations | 7 | 2.7% |
| Local Government Employees | 55 | 21.1% |
| State Government Employees | 8 | 3.1% |
| Federal Government Employees | 7 | 2.7% |
| Unpaid Family Workers | 0 | 0.0% |
| Total | 260 | 100.0% |
Employment Status by Age in Kennedyville
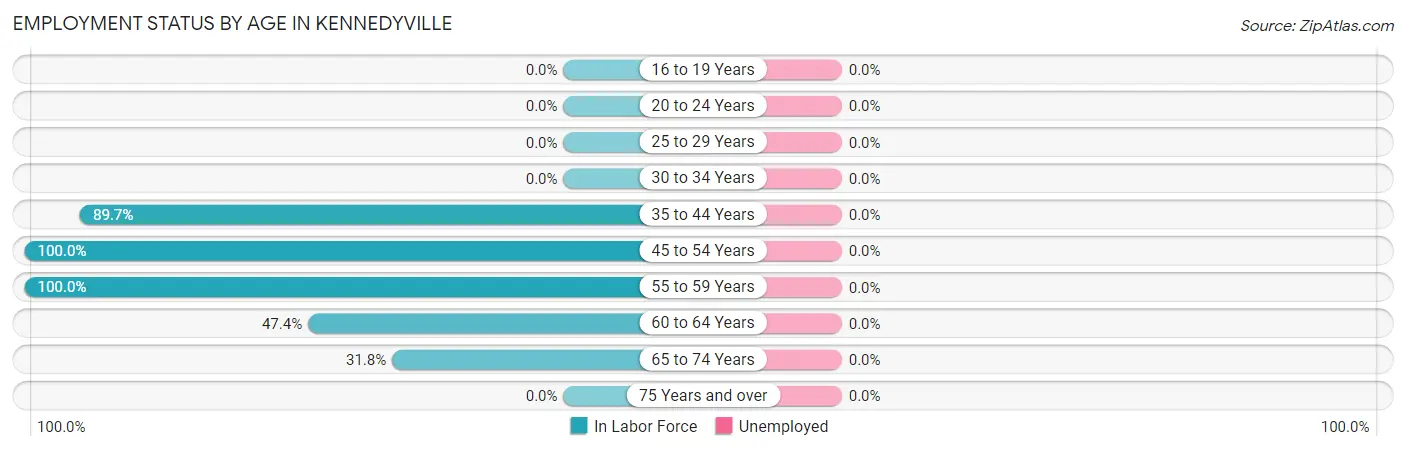
| Age Bracket | In Labor Force | Unemployed |
| 16 to 19 Years | 0 (0.0%) | 0 (0.0%) |
| 20 to 24 Years | 0 (0.0%) | 0 (0.0%) |
| 25 to 29 Years | 0 (0.0%) | 0 (0.0%) |
| 30 to 34 Years | 0 (0.0%) | 0 (0.0%) |
| 35 to 44 Years | 122 (89.7%) | 0 (0.0%) |
| 45 to 54 Years | 65 (100.0%) | 0 (0.0%) |
| 55 to 59 Years | 11 (100.0%) | 0 (0.0%) |
| 60 to 64 Years | 55 (47.4%) | 0 (0.0%) |
| 65 to 74 Years | 7 (31.8%) | 0 (0.0%) |
| 75 Years and over | 0 (0.0%) | 0 (0.0%) |
| Total | 260 (74.3%) | 0 (0.0%) |
Employment Status by Educational Attainment in Kennedyville
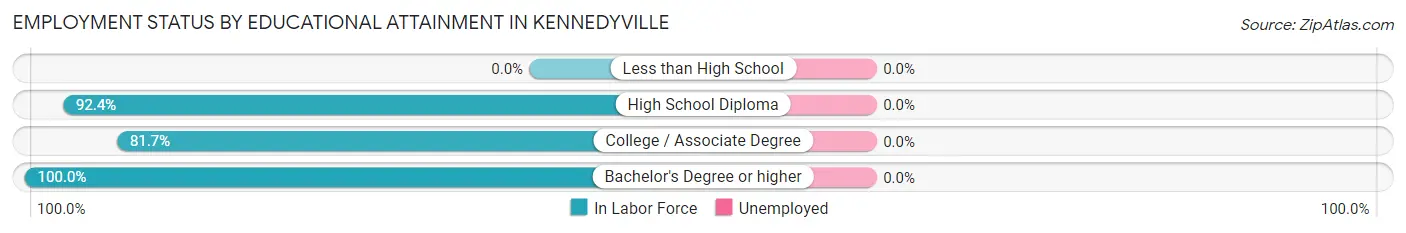
| Educational Attainment | In Labor Force | Unemployed |
| Less than High School | 0 (0.0%) | 0 (0.0%) |
| High School Diploma | 171 (92.4%) | 0 (0.0%) |
| College / Associate Degree | 67 (81.7%) | 0 (0.0%) |
| Bachelor's Degree or higher | 15 (100.0%) | 0 (0.0%) |
| Total | 253 (77.1%) | 0 (0.0%) |
Employment Occupations by Sex in Kennedyville
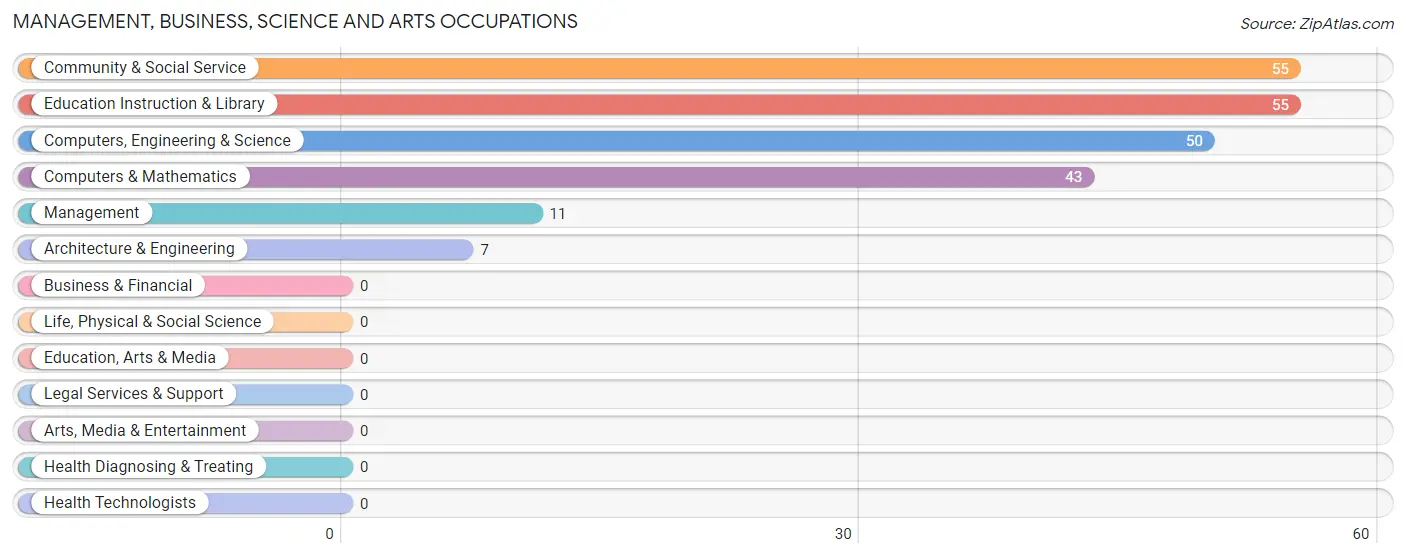
Management, Business, Science and Arts Occupations
The most common Management, Business, Science and Arts occupations in Kennedyville are Community & Social Service (55 | 21.1%), Education Instruction & Library (55 | 21.1%), Computers, Engineering & Science (50 | 19.2%), Computers & Mathematics (43 | 16.5%), and Management (11 | 4.2%).
Management, Business, Science and Arts Occupations by Sex
Within the Management, Business, Science and Arts occupations in Kennedyville, the most male-oriented occupations are Management (100.0%), Computers & Mathematics (100.0%), and Computers, Engineering & Science (86.0%), while the most female-oriented occupations are Architecture & Engineering (100.0%), Community & Social Service (100.0%), and Education Instruction & Library (100.0%).
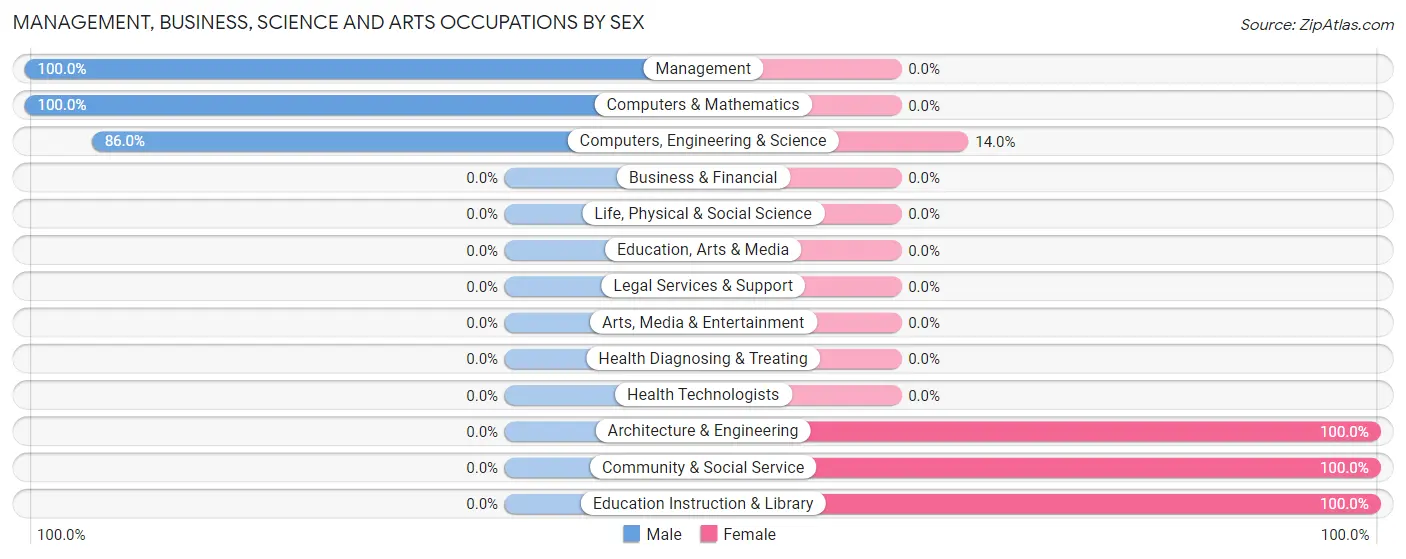
| Occupation | Male | Female |
| Management | 11 (100.0%) | 0 (0.0%) |
| Business & Financial | 0 (0.0%) | 0 (0.0%) |
| Computers, Engineering & Science | 43 (86.0%) | 7 (14.0%) |
| Computers & Mathematics | 43 (100.0%) | 0 (0.0%) |
| Architecture & Engineering | 0 (0.0%) | 7 (100.0%) |
| Life, Physical & Social Science | 0 (0.0%) | 0 (0.0%) |
| Community & Social Service | 0 (0.0%) | 55 (100.0%) |
| Education, Arts & Media | 0 (0.0%) | 0 (0.0%) |
| Legal Services & Support | 0 (0.0%) | 0 (0.0%) |
| Education Instruction & Library | 0 (0.0%) | 55 (100.0%) |
| Arts, Media & Entertainment | 0 (0.0%) | 0 (0.0%) |
| Health Diagnosing & Treating | 0 (0.0%) | 0 (0.0%) |
| Health Technologists | 0 (0.0%) | 0 (0.0%) |
| Total (Category) | 54 (46.6%) | 62 (53.4%) |
| Total (Overall) | 120 (46.2%) | 140 (53.8%) |
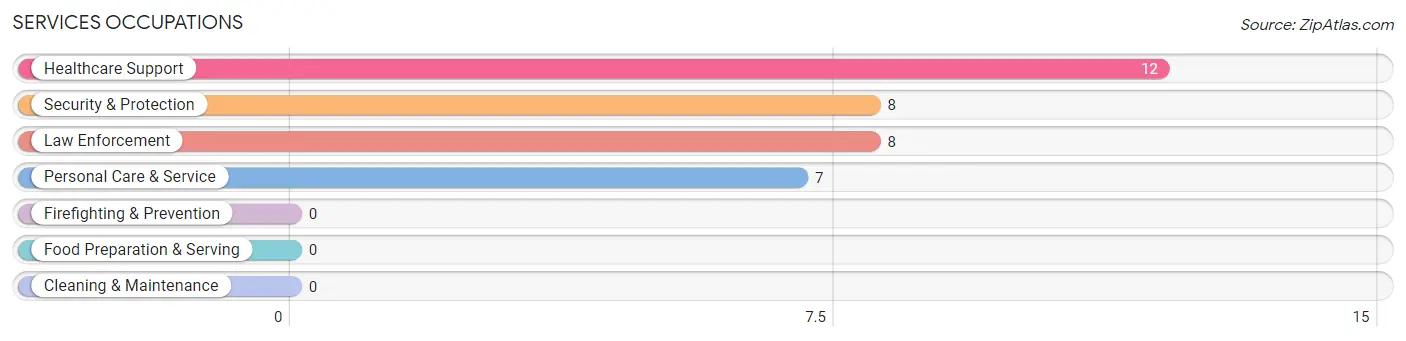
Services Occupations
The most common Services occupations in Kennedyville are Healthcare Support (12 | 4.6%), Security & Protection (8 | 3.1%), Law Enforcement (8 | 3.1%), and Personal Care & Service (7 | 2.7%).
Services Occupations by Sex
Within the Services occupations in Kennedyville, the most male-oriented occupations are Security & Protection (100.0%), and Law Enforcement (100.0%), while the most female-oriented occupations are Healthcare Support (100.0%), and Personal Care & Service (100.0%).
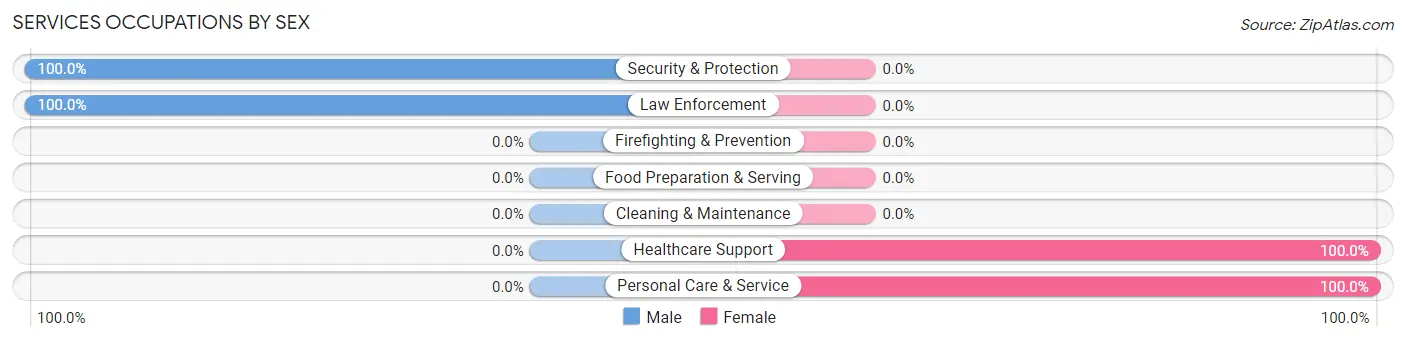
| Occupation | Male | Female |
| Healthcare Support | 0 (0.0%) | 12 (100.0%) |
| Security & Protection | 8 (100.0%) | 0 (0.0%) |
| Firefighting & Prevention | 0 (0.0%) | 0 (0.0%) |
| Law Enforcement | 8 (100.0%) | 0 (0.0%) |
| Food Preparation & Serving | 0 (0.0%) | 0 (0.0%) |
| Cleaning & Maintenance | 0 (0.0%) | 0 (0.0%) |
| Personal Care & Service | 0 (0.0%) | 7 (100.0%) |
| Total (Category) | 8 (29.6%) | 19 (70.4%) |
| Total (Overall) | 120 (46.2%) | 140 (53.8%) |
Sales and Office Occupations
The most common Sales and Office occupations in Kennedyville are Office & Administration (59 | 22.7%), and Sales & Related (58 | 22.3%).
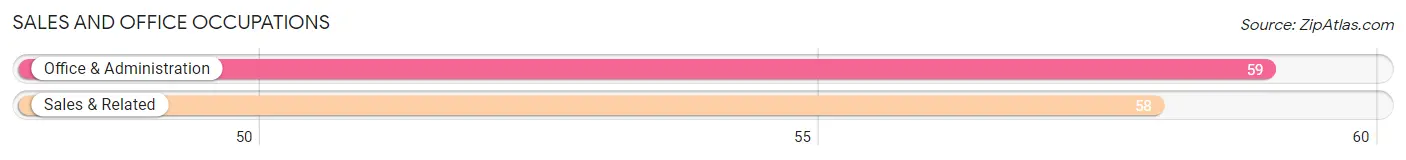
Sales and Office Occupations by Sex
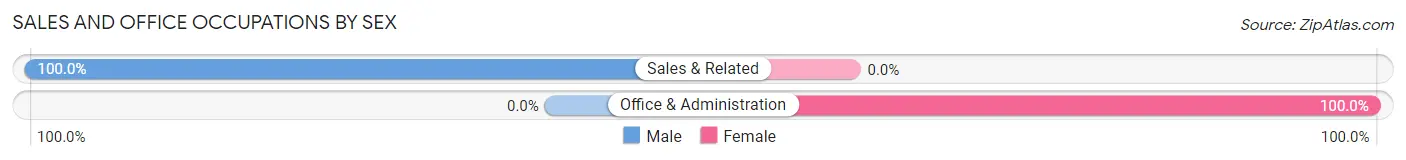
| Occupation | Male | Female |
| Sales & Related | 58 (100.0%) | 0 (0.0%) |
| Office & Administration | 0 (0.0%) | 59 (100.0%) |
| Total (Category) | 58 (49.6%) | 59 (50.4%) |
| Total (Overall) | 120 (46.2%) | 140 (53.8%) |
Natural Resources, Construction and Maintenance Occupations
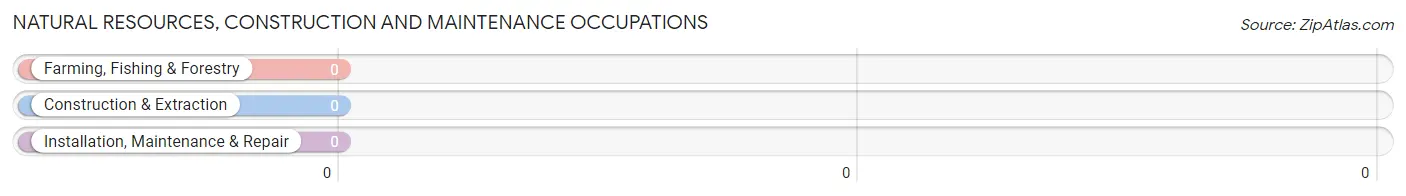
Natural Resources, Construction and Maintenance Occupations by Sex
| Occupation | Male | Female |
| Farming, Fishing & Forestry | 0 (0.0%) | 0 (0.0%) |
| Construction & Extraction | 0 (0.0%) | 0 (0.0%) |
| Installation, Maintenance & Repair | 0 (0.0%) | 0 (0.0%) |
| Total (Category) | 0 (0.0%) | 0 (0.0%) |
| Total (Overall) | 120 (46.2%) | 140 (53.8%) |
Production, Transportation and Moving Occupations
Production, Transportation and Moving Occupations by Sex
| Occupation | Male | Female |
| Production | 0 (0.0%) | 0 (0.0%) |
| Transportation | 0 (0.0%) | 0 (0.0%) |
| Material Moving | 0 (0.0%) | 0 (0.0%) |
| Total (Category) | 0 (0.0%) | 0 (0.0%) |
| Total (Overall) | 120 (46.2%) | 140 (53.8%) |
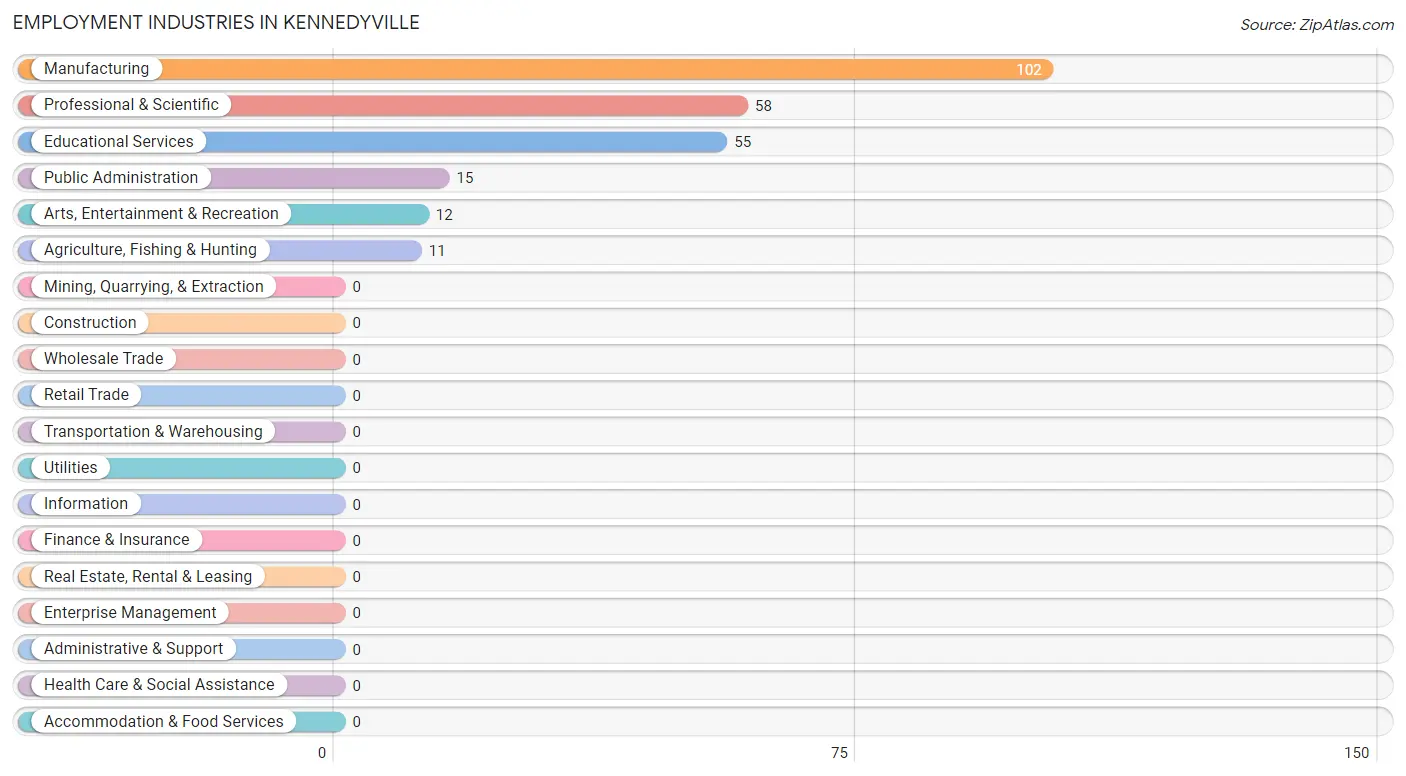
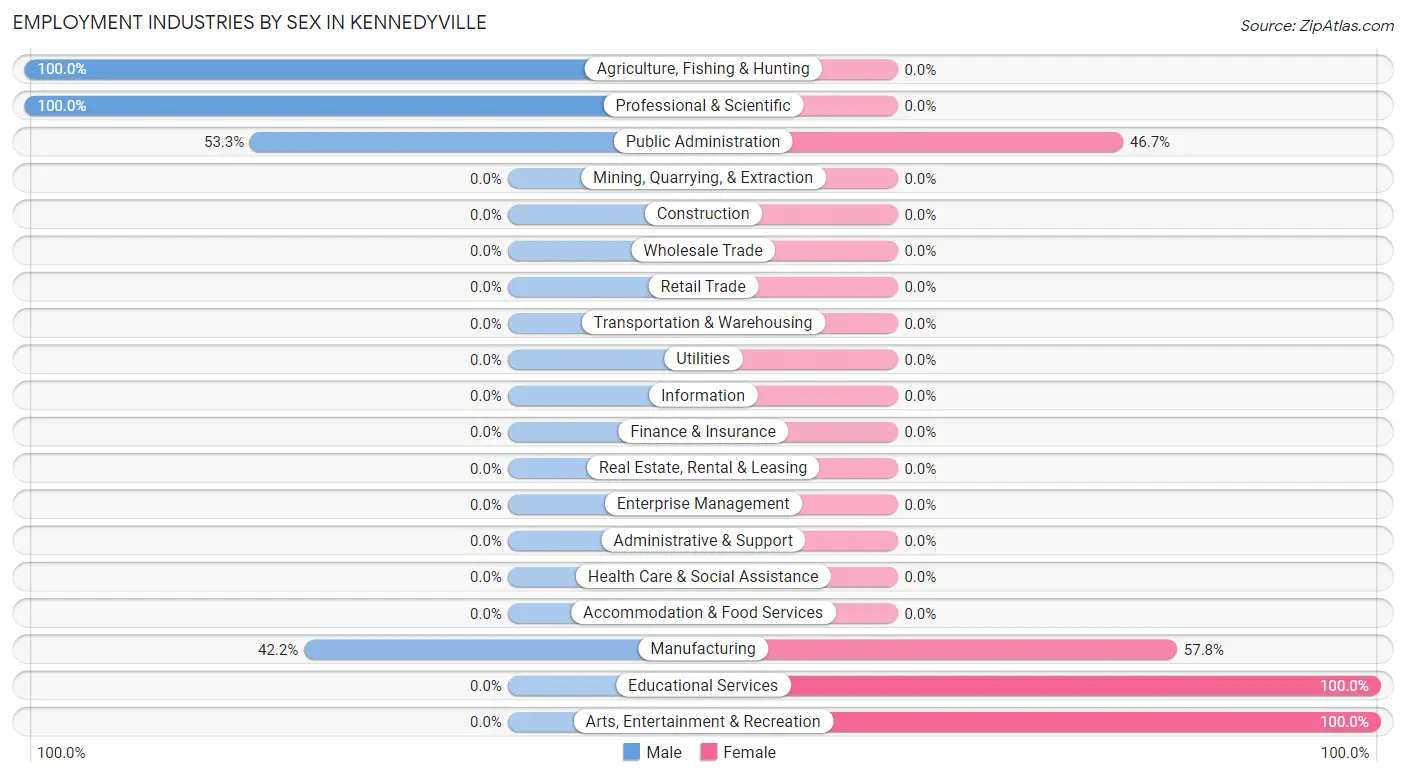
Employment Industries by Sex in Kennedyville
Employment Industries in Kennedyville
The major employment industries in Kennedyville include Manufacturing (102 | 39.2%), Professional & Scientific (58 | 22.3%), Educational Services (55 | 21.1%), Public Administration (15 | 5.8%), and Arts, Entertainment & Recreation (12 | 4.6%).
Employment Industries by Sex in Kennedyville
The Kennedyville industries that see more men than women are Agriculture, Fishing & Hunting (100.0%), Professional & Scientific (100.0%), and Public Administration (53.3%), whereas the industries that tend to have a higher number of women are Educational Services (100.0%), Arts, Entertainment & Recreation (100.0%), and Manufacturing (57.8%).
| Industry | Male | Female |
| Agriculture, Fishing & Hunting | 11 (100.0%) | 0 (0.0%) |
| Mining, Quarrying, & Extraction | 0 (0.0%) | 0 (0.0%) |
| Construction | 0 (0.0%) | 0 (0.0%) |
| Manufacturing | 43 (42.2%) | 59 (57.8%) |
| Wholesale Trade | 0 (0.0%) | 0 (0.0%) |
| Retail Trade | 0 (0.0%) | 0 (0.0%) |
| Transportation & Warehousing | 0 (0.0%) | 0 (0.0%) |
| Utilities | 0 (0.0%) | 0 (0.0%) |
| Information | 0 (0.0%) | 0 (0.0%) |
| Finance & Insurance | 0 (0.0%) | 0 (0.0%) |
| Real Estate, Rental & Leasing | 0 (0.0%) | 0 (0.0%) |
| Professional & Scientific | 58 (100.0%) | 0 (0.0%) |
| Enterprise Management | 0 (0.0%) | 0 (0.0%) |
| Administrative & Support | 0 (0.0%) | 0 (0.0%) |
| Educational Services | 0 (0.0%) | 55 (100.0%) |
| Health Care & Social Assistance | 0 (0.0%) | 0 (0.0%) |
| Arts, Entertainment & Recreation | 0 (0.0%) | 12 (100.0%) |
| Accommodation & Food Services | 0 (0.0%) | 0 (0.0%) |
| Public Administration | 8 (53.3%) | 7 (46.7%) |
| Total | 120 (46.2%) | 140 (53.8%) |
Education in Kennedyville
School Enrollment in Kennedyville
The most common levels of schooling among the 96 students in Kennedyville are elementary school (46 | 47.9%), middle school (41 | 42.7%), and kindergarten (9 | 9.4%).
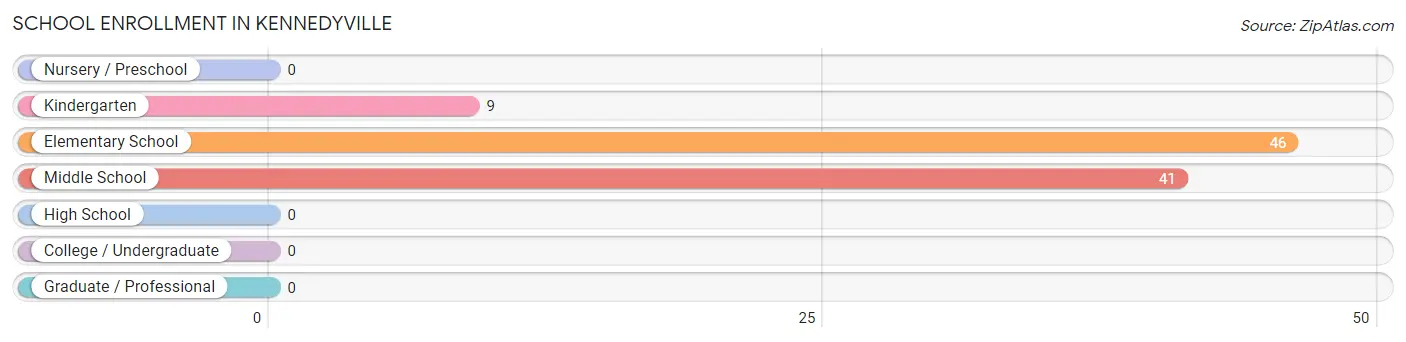
| School Level | # Students | % Students |
| Nursery / Preschool | 0 | 0.0% |
| Kindergarten | 9 | 9.4% |
| Elementary School | 46 | 47.9% |
| Middle School | 41 | 42.7% |
| High School | 0 | 0.0% |
| College / Undergraduate | 0 | 0.0% |
| Graduate / Professional | 0 | 0.0% |
| Total | 96 | 100.0% |
School Enrollment by Age by Funding Source in Kennedyville
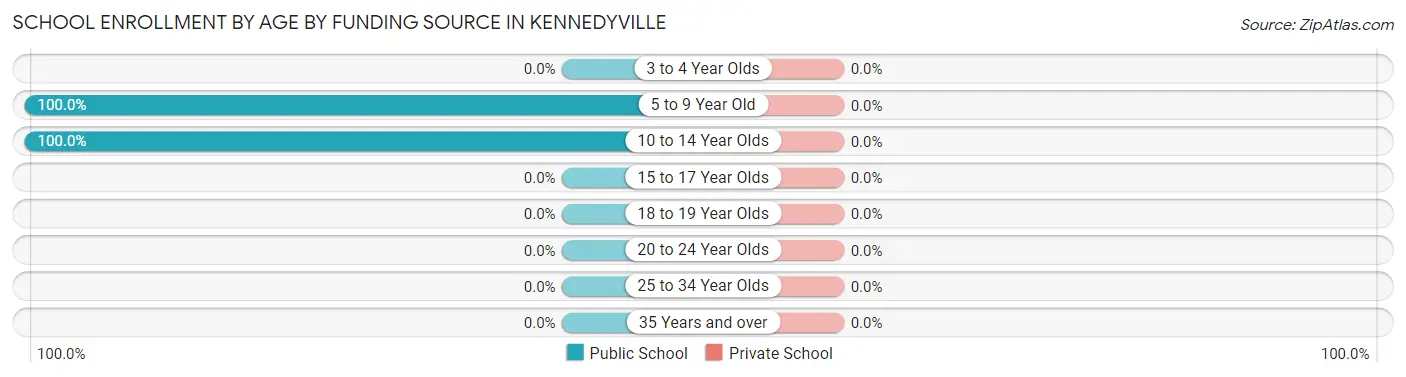
| Age Bracket | Public School | Private School |
| 3 to 4 Year Olds | 0 (0.0%) | 0 (0.0%) |
| 5 to 9 Year Old | 55 (100.0%) | 0 (0.0%) |
| 10 to 14 Year Olds | 41 (100.0%) | 0 (0.0%) |
| 15 to 17 Year Olds | 0 (0.0%) | 0 (0.0%) |
| 18 to 19 Year Olds | 0 (0.0%) | 0 (0.0%) |
| 20 to 24 Year Olds | 0 (0.0%) | 0 (0.0%) |
| 25 to 34 Year Olds | 0 (0.0%) | 0 (0.0%) |
| 35 Years and over | 0 (0.0%) | 0 (0.0%) |
| Total | 96 (100.0%) | 0 (0.0%) |
Educational Attainment by Field of Study in Kennedyville
Business (15 | 50.0%), arts & humanities (8 | 26.7%), and engineering (7 | 23.3%) are the most common fields of study among 30 individuals in Kennedyville who have obtained a bachelor's degree or higher.
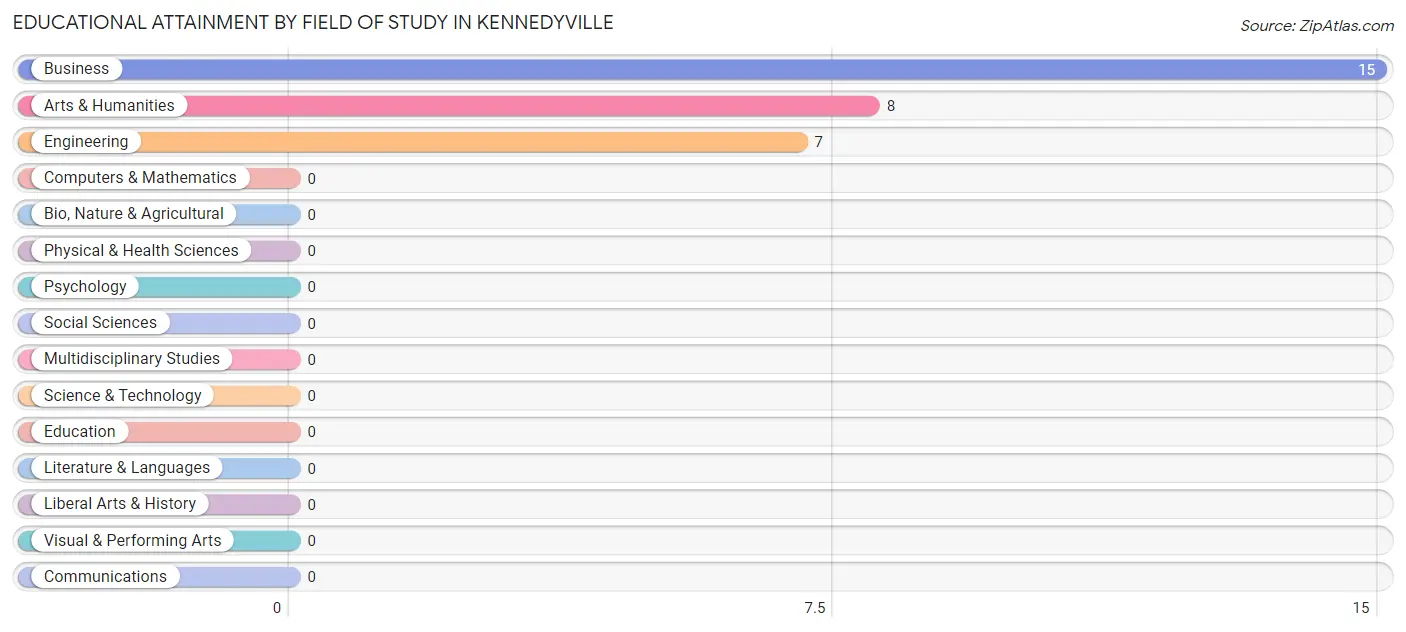
| Field of Study | # Graduates | % Graduates |
| Computers & Mathematics | 0 | 0.0% |
| Bio, Nature & Agricultural | 0 | 0.0% |
| Physical & Health Sciences | 0 | 0.0% |
| Psychology | 0 | 0.0% |
| Social Sciences | 0 | 0.0% |
| Engineering | 7 | 23.3% |
| Multidisciplinary Studies | 0 | 0.0% |
| Science & Technology | 0 | 0.0% |
| Business | 15 | 50.0% |
| Education | 0 | 0.0% |
| Literature & Languages | 0 | 0.0% |
| Liberal Arts & History | 0 | 0.0% |
| Visual & Performing Arts | 0 | 0.0% |
| Communications | 0 | 0.0% |
| Arts & Humanities | 8 | 26.7% |
| Total | 30 | 100.0% |
Transportation & Commute in Kennedyville
Vehicle Availability by Sex in Kennedyville
The most prevalent vehicle ownership categories in Kennedyville are males with 1 vehicle (69, accounting for 57.5%) and females with 1 vehicle (55, making up 49.3%).
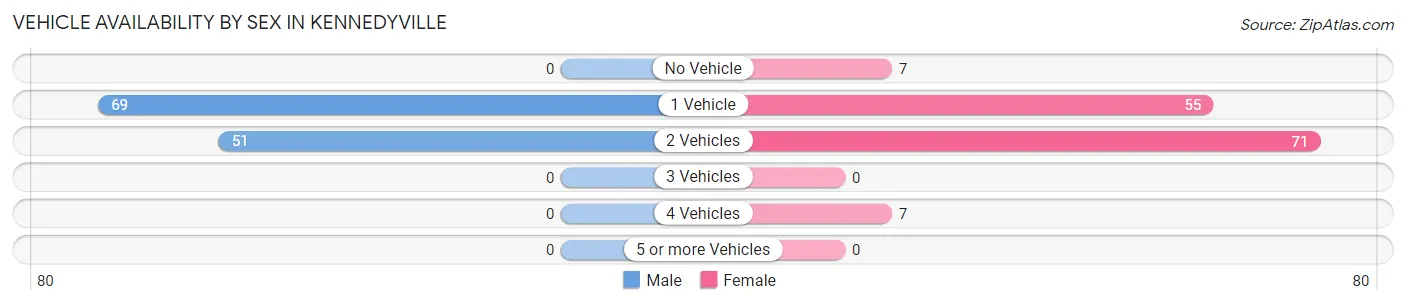
| Vehicles Available | Male | Female |
| No Vehicle | 0 (0.0%) | 7 (5.0%) |
| 1 Vehicle | 69 (57.5%) | 55 (39.3%) |
| 2 Vehicles | 51 (42.5%) | 71 (50.7%) |
| 3 Vehicles | 0 (0.0%) | 0 (0.0%) |
| 4 Vehicles | 0 (0.0%) | 7 (5.0%) |
| 5 or more Vehicles | 0 (0.0%) | 0 (0.0%) |
| Total | 120 (100.0%) | 140 (100.0%) |
Commute Time in Kennedyville
The most frequently occuring commute durations in Kennedyville are 15 to 19 minutes (102 commuters, 40.3%), less than 5 minutes (69 commuters, 27.3%), and 10 to 14 minutes (55 commuters, 21.7%).
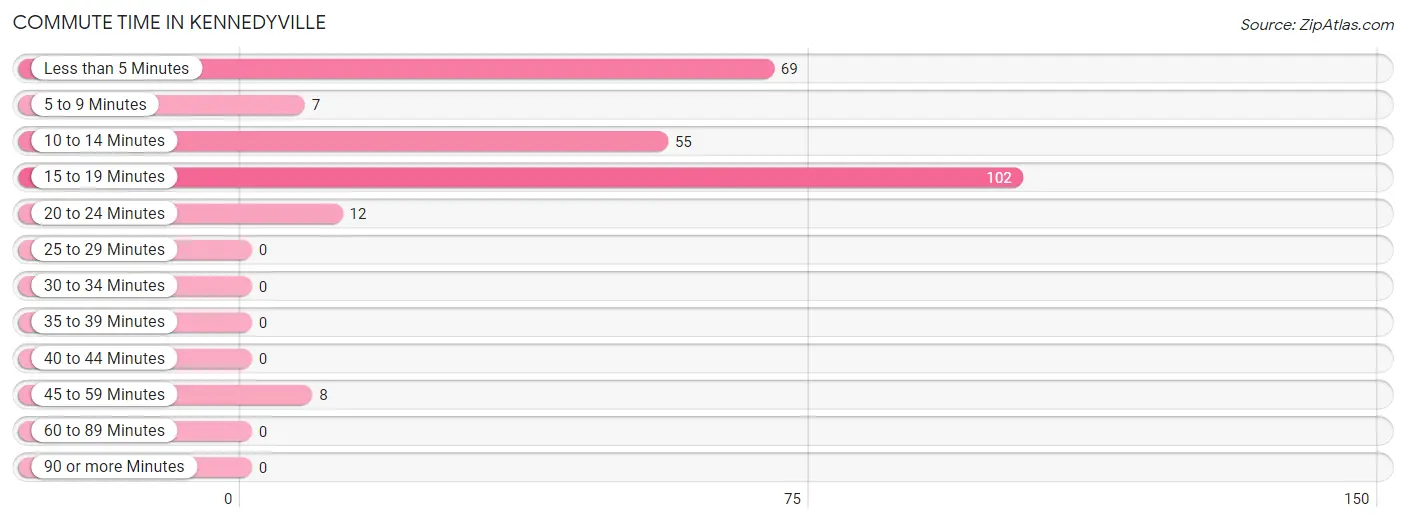
| Commute Time | # Commuters | % Commuters |
| Less than 5 Minutes | 69 | 27.3% |
| 5 to 9 Minutes | 7 | 2.8% |
| 10 to 14 Minutes | 55 | 21.7% |
| 15 to 19 Minutes | 102 | 40.3% |
| 20 to 24 Minutes | 12 | 4.7% |
| 25 to 29 Minutes | 0 | 0.0% |
| 30 to 34 Minutes | 0 | 0.0% |
| 35 to 39 Minutes | 0 | 0.0% |
| 40 to 44 Minutes | 0 | 0.0% |
| 45 to 59 Minutes | 8 | 3.2% |
| 60 to 89 Minutes | 0 | 0.0% |
| 90 or more Minutes | 0 | 0.0% |
Commute Time by Sex in Kennedyville
The most common commute times in Kennedyville are less than 5 minutes (69 commuters, 57.5%) for males and 15 to 19 minutes (59 commuters, 44.4%) for females.
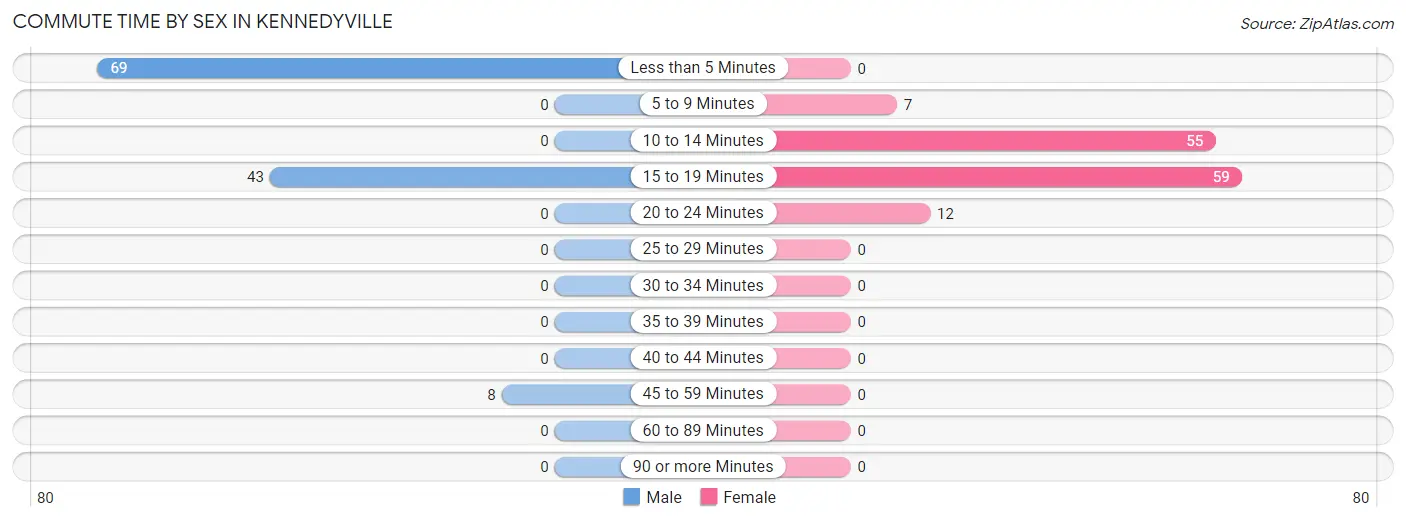
| Commute Time | Male | Female |
| Less than 5 Minutes | 69 (57.5%) | 0 (0.0%) |
| 5 to 9 Minutes | 0 (0.0%) | 7 (5.3%) |
| 10 to 14 Minutes | 0 (0.0%) | 55 (41.3%) |
| 15 to 19 Minutes | 43 (35.8%) | 59 (44.4%) |
| 20 to 24 Minutes | 0 (0.0%) | 12 (9.0%) |
| 25 to 29 Minutes | 0 (0.0%) | 0 (0.0%) |
| 30 to 34 Minutes | 0 (0.0%) | 0 (0.0%) |
| 35 to 39 Minutes | 0 (0.0%) | 0 (0.0%) |
| 40 to 44 Minutes | 0 (0.0%) | 0 (0.0%) |
| 45 to 59 Minutes | 8 (6.7%) | 0 (0.0%) |
| 60 to 89 Minutes | 0 (0.0%) | 0 (0.0%) |
| 90 or more Minutes | 0 (0.0%) | 0 (0.0%) |
Time of Departure to Work by Sex in Kennedyville
The most frequent times of departure to work in Kennedyville are 6:30 AM to 6:59 AM (58, 48.3%) for males and 8:00 AM to 8:29 AM (67, 50.4%) for females.
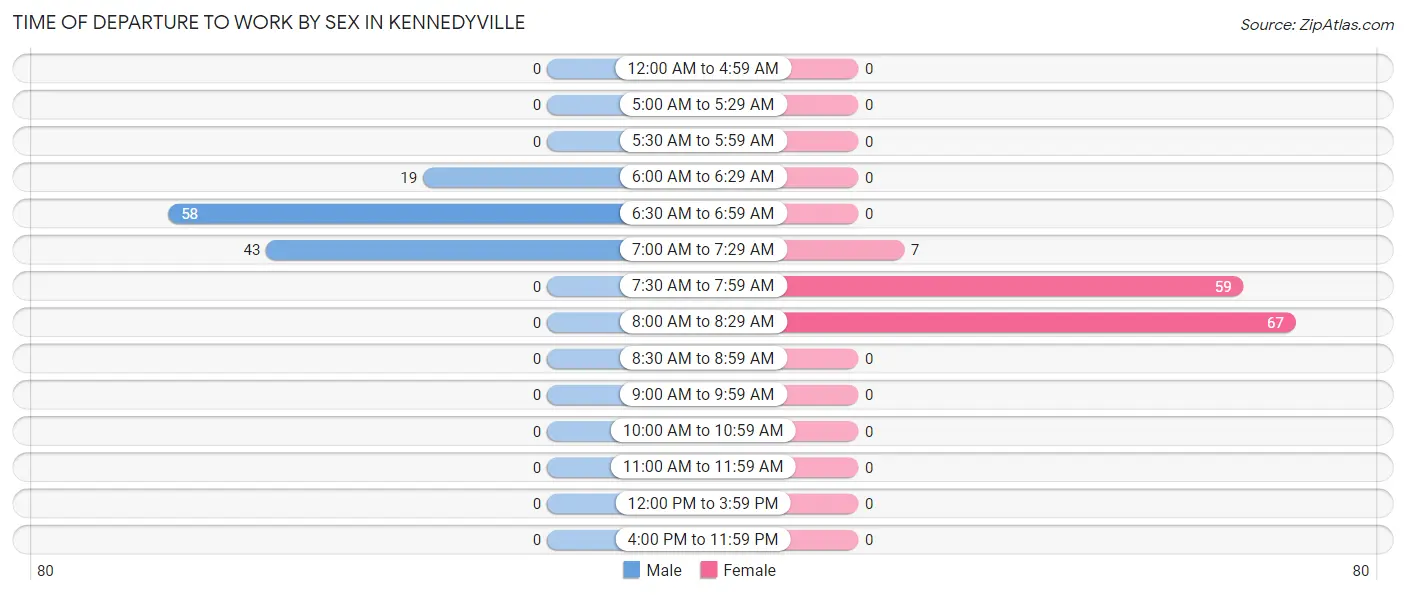
| Time of Departure | Male | Female |
| 12:00 AM to 4:59 AM | 0 (0.0%) | 0 (0.0%) |
| 5:00 AM to 5:29 AM | 0 (0.0%) | 0 (0.0%) |
| 5:30 AM to 5:59 AM | 0 (0.0%) | 0 (0.0%) |
| 6:00 AM to 6:29 AM | 19 (15.8%) | 0 (0.0%) |
| 6:30 AM to 6:59 AM | 58 (48.3%) | 0 (0.0%) |
| 7:00 AM to 7:29 AM | 43 (35.8%) | 7 (5.3%) |
| 7:30 AM to 7:59 AM | 0 (0.0%) | 59 (44.4%) |
| 8:00 AM to 8:29 AM | 0 (0.0%) | 67 (50.4%) |
| 8:30 AM to 8:59 AM | 0 (0.0%) | 0 (0.0%) |
| 9:00 AM to 9:59 AM | 0 (0.0%) | 0 (0.0%) |
| 10:00 AM to 10:59 AM | 0 (0.0%) | 0 (0.0%) |
| 11:00 AM to 11:59 AM | 0 (0.0%) | 0 (0.0%) |
| 12:00 PM to 3:59 PM | 0 (0.0%) | 0 (0.0%) |
| 4:00 PM to 11:59 PM | 0 (0.0%) | 0 (0.0%) |
| Total | 120 (100.0%) | 133 (100.0%) |
Housing Occupancy in Kennedyville
Occupancy by Ownership in Kennedyville
Of the total 163 dwellings in Kennedyville, owner-occupied units account for 106 (65.0%), while renter-occupied units make up 57 (35.0%).
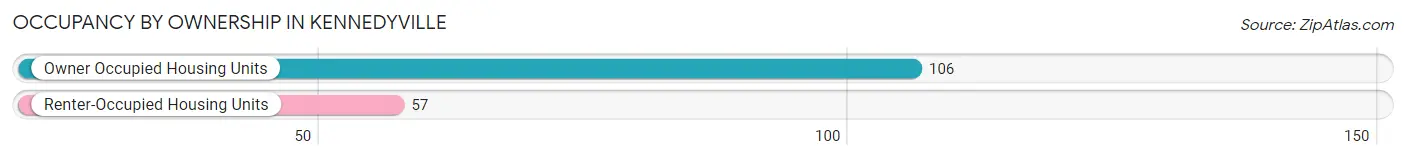
| Occupancy | # Housing Units | % Housing Units |
| Owner Occupied Housing Units | 106 | 65.0% |
| Renter-Occupied Housing Units | 57 | 35.0% |
| Total Occupied Housing Units | 163 | 100.0% |
Occupancy by Household Size in Kennedyville
| Household Size | # Housing Units | % Housing Units |
| 1-Person Household | 39 | 23.9% |
| 2-Person Household | 73 | 44.8% |
| 3-Person Household | 0 | 0.0% |
| 4+ Person Household | 51 | 31.3% |
| Total Housing Units | 163 | 100.0% |
Occupancy by Ownership by Household Size in Kennedyville
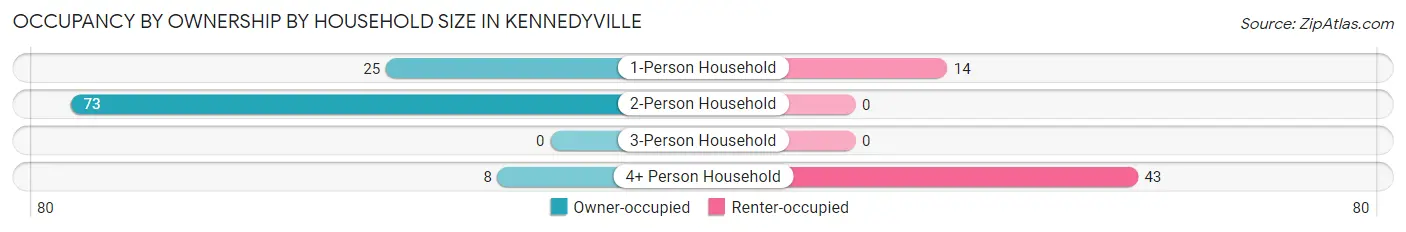
| Household Size | Owner-occupied | Renter-occupied |
| 1-Person Household | 25 (64.1%) | 14 (35.9%) |
| 2-Person Household | 73 (100.0%) | 0 (0.0%) |
| 3-Person Household | 0 (0.0%) | 0 (0.0%) |
| 4+ Person Household | 8 (15.7%) | 43 (84.3%) |
| Total Housing Units | 106 (65.0%) | 57 (35.0%) |
Occupancy by Educational Attainment in Kennedyville
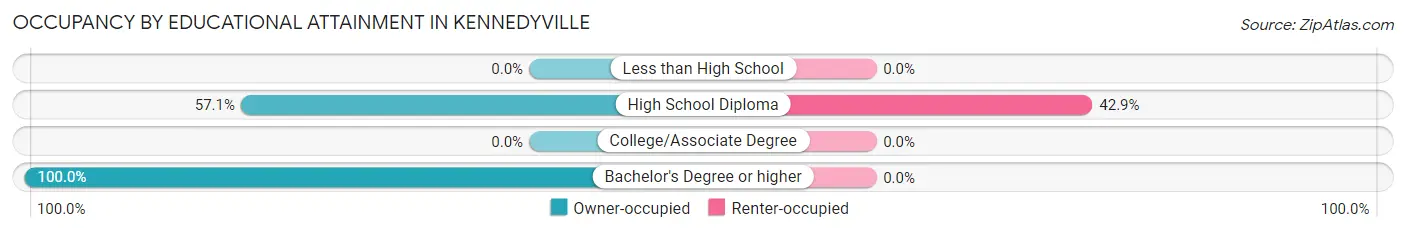
| Household Size | Owner-occupied | Renter-occupied |
| Less than High School | 0 (0.0%) | 0 (0.0%) |
| High School Diploma | 76 (57.1%) | 57 (42.9%) |
| College/Associate Degree | 0 (0.0%) | 0 (0.0%) |
| Bachelor's Degree or higher | 30 (100.0%) | 0 (0.0%) |
Occupancy by Age of Householder in Kennedyville
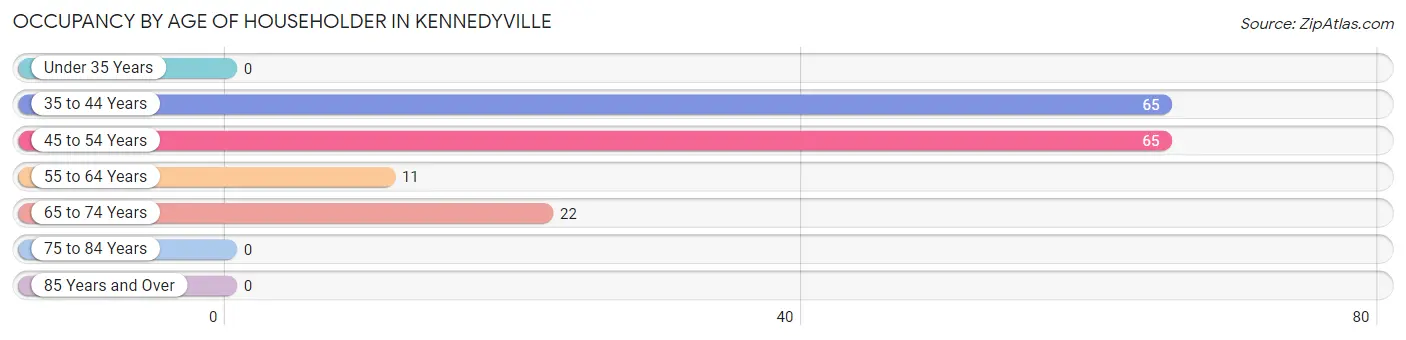
| Age Bracket | # Households | % Households |
| Under 35 Years | 0 | 0.0% |
| 35 to 44 Years | 65 | 39.9% |
| 45 to 54 Years | 65 | 39.9% |
| 55 to 64 Years | 11 | 6.8% |
| 65 to 74 Years | 22 | 13.5% |
| 75 to 84 Years | 0 | 0.0% |
| 85 Years and Over | 0 | 0.0% |
| Total | 163 | 100.0% |
Housing Finances in Kennedyville
Median Income by Occupancy in Kennedyville
| Occupancy Type | # Households | Median Income |
| Owner-Occupied | 106 (65.0%) | $0 |
| Renter-Occupied | 57 (35.0%) | $0 |
| Average | 163 (100.0%) | $0 |
Occupancy by Householder Income Bracket in Kennedyville
| Income Bracket | Owner-occupied | Renter-occupied |
| Less than $5,000 | 0 (0.0%) | 14 (24.6%) |
| $5,000 to $9,999 | 0 (0.0%) | 0 (0.0%) |
| $10,000 to $14,999 | 0 (0.0%) | 0 (0.0%) |
| $15,000 to $19,999 | 7 (6.6%) | 0 (0.0%) |
| $20,000 to $24,999 | 0 (0.0%) | 0 (0.0%) |
| $25,000 to $34,999 | 58 (54.7%) | 0 (0.0%) |
| $35,000 to $49,999 | 15 (14.1%) | 0 (0.0%) |
| $50,000 to $74,999 | 0 (0.0%) | 0 (0.0%) |
| $75,000 to $99,999 | 0 (0.0%) | 0 (0.0%) |
| $100,000 to $149,999 | 0 (0.0%) | 43 (75.4%) |
| $150,000 or more | 26 (24.5%) | 0 (0.0%) |
| Total | 106 (100.0%) | 57 (100.0%) |
Monthly Housing Cost Tiers in Kennedyville
| Monthly Cost | Owner-occupied | Renter-occupied |
| Less than $300 | 0 (0.0%) | 0 (0.0%) |
| $300 to $499 | 0 (0.0%) | 0 (0.0%) |
| $500 to $799 | 0 (0.0%) | 0 (0.0%) |
| $800 to $999 | 22 (20.7%) | 0 (0.0%) |
| $1,000 to $1,499 | 58 (54.7%) | 0 (0.0%) |
| $1,500 to $1,999 | 8 (7.5%) | 14 (24.6%) |
| $2,000 to $2,499 | 0 (0.0%) | 43 (75.4%) |
| $2,500 to $2,999 | 7 (6.6%) | 0 (0.0%) |
| $3,000 or more | 11 (10.4%) | 0 (0.0%) |
| Total | 106 (100.0%) | 57 (100.0%) |
Physical Housing Characteristics in Kennedyville
Housing Structures in Kennedyville
| Structure Type | # Housing Units | % Housing Units |
| Single Unit, Detached | 155 | 95.1% |
| Single Unit, Attached | 8 | 4.9% |
| 2 Unit Apartments | 0 | 0.0% |
| 3 or 4 Unit Apartments | 0 | 0.0% |
| 5 to 9 Unit Apartments | 0 | 0.0% |
| 10 or more Apartments | 0 | 0.0% |
| Mobile Home / Other | 0 | 0.0% |
| Total | 163 | 100.0% |
Housing Structures by Occupancy in Kennedyville
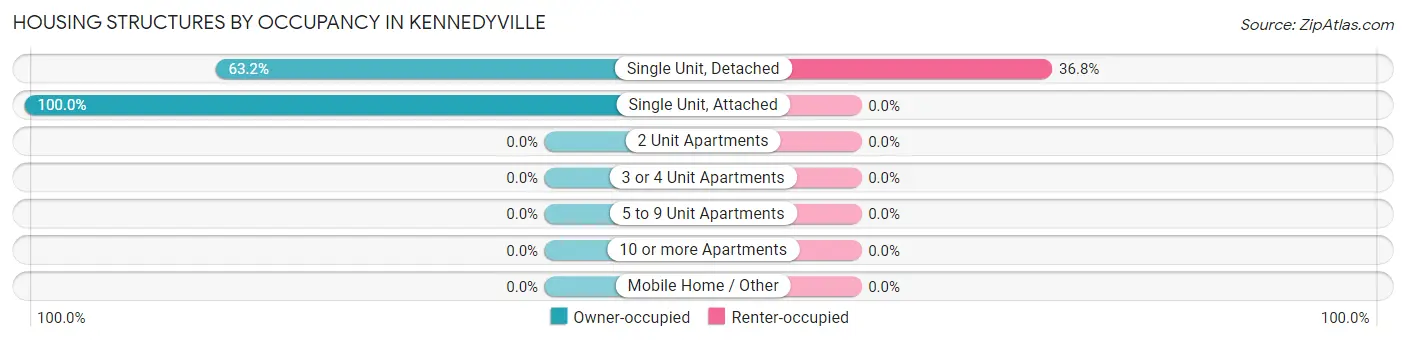
| Structure Type | Owner-occupied | Renter-occupied |
| Single Unit, Detached | 98 (63.2%) | 57 (36.8%) |
| Single Unit, Attached | 8 (100.0%) | 0 (0.0%) |
| 2 Unit Apartments | 0 (0.0%) | 0 (0.0%) |
| 3 or 4 Unit Apartments | 0 (0.0%) | 0 (0.0%) |
| 5 to 9 Unit Apartments | 0 (0.0%) | 0 (0.0%) |
| 10 or more Apartments | 0 (0.0%) | 0 (0.0%) |
| Mobile Home / Other | 0 (0.0%) | 0 (0.0%) |
| Total | 106 (65.0%) | 57 (35.0%) |
Housing Structures by Number of Rooms in Kennedyville
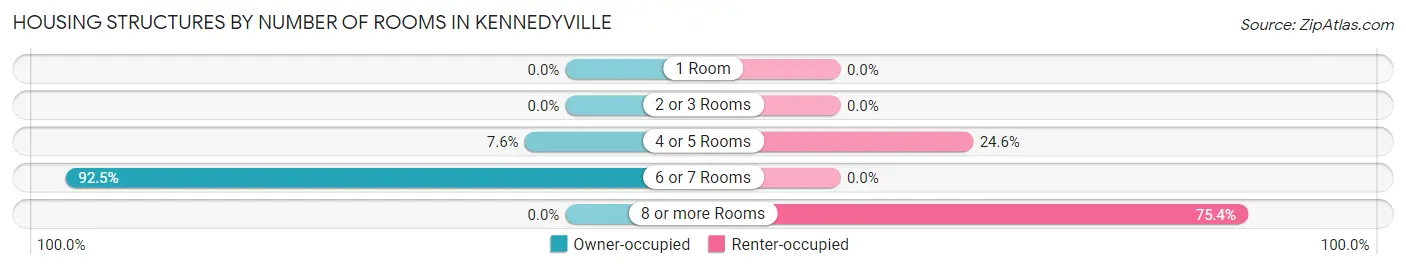
| Number of Rooms | Owner-occupied | Renter-occupied |
| 1 Room | 0 (0.0%) | 0 (0.0%) |
| 2 or 3 Rooms | 0 (0.0%) | 0 (0.0%) |
| 4 or 5 Rooms | 8 (7.5%) | 14 (24.6%) |
| 6 or 7 Rooms | 98 (92.4%) | 0 (0.0%) |
| 8 or more Rooms | 0 (0.0%) | 43 (75.4%) |
| Total | 106 (100.0%) | 57 (100.0%) |
Housing Structure by Heating Type in Kennedyville
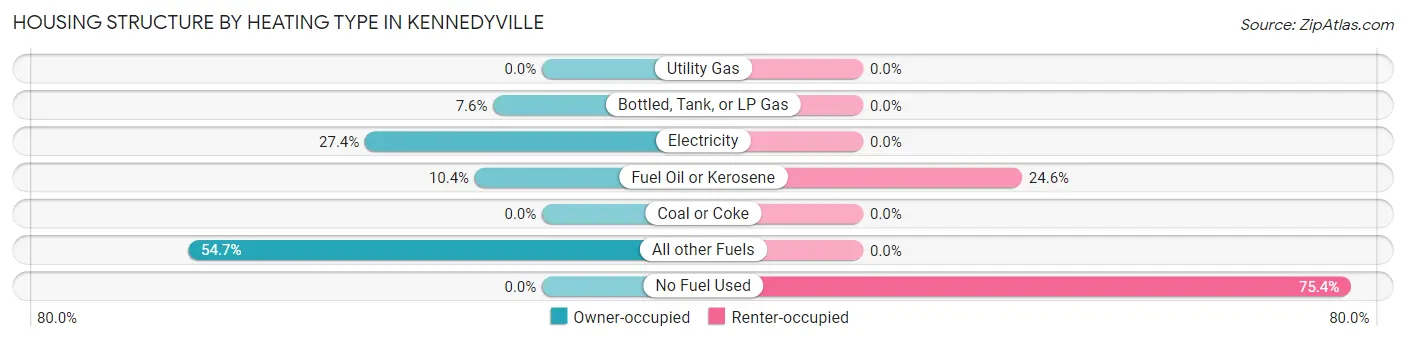
| Heating Type | Owner-occupied | Renter-occupied |
| Utility Gas | 0 (0.0%) | 0 (0.0%) |
| Bottled, Tank, or LP Gas | 8 (7.5%) | 0 (0.0%) |
| Electricity | 29 (27.4%) | 0 (0.0%) |
| Fuel Oil or Kerosene | 11 (10.4%) | 14 (24.6%) |
| Coal or Coke | 0 (0.0%) | 0 (0.0%) |
| All other Fuels | 58 (54.7%) | 0 (0.0%) |
| No Fuel Used | 0 (0.0%) | 43 (75.4%) |
| Total | 106 (100.0%) | 57 (100.0%) |
Household Vehicle Usage in Kennedyville
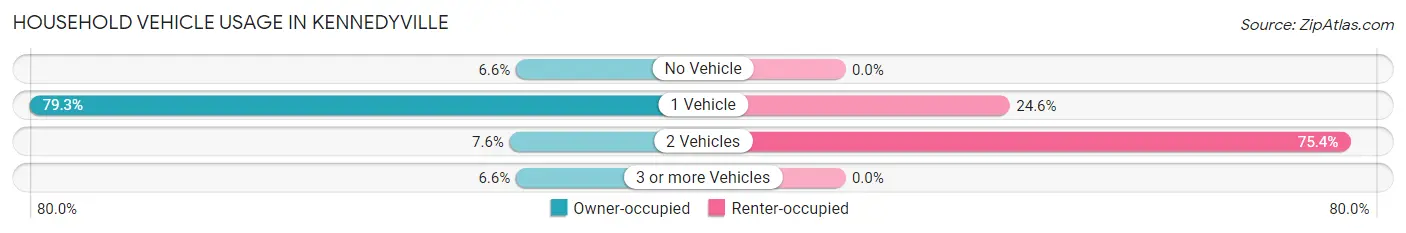
| Vehicles per Household | Owner-occupied | Renter-occupied |
| No Vehicle | 7 (6.6%) | 0 (0.0%) |
| 1 Vehicle | 84 (79.2%) | 14 (24.6%) |
| 2 Vehicles | 8 (7.5%) | 43 (75.4%) |
| 3 or more Vehicles | 7 (6.6%) | 0 (0.0%) |
| Total | 106 (100.0%) | 57 (100.0%) |
Real Estate & Mortgages in Kennedyville
Real Estate and Mortgage Overview in Kennedyville
| Characteristic | Without Mortgage | With Mortgage |
| Housing Units | 0 | 106 |
| Median Property Value | - | - |
| Median Household Income | - | - |
| Monthly Housing Costs | - | - |
| Real Estate Taxes | - | - |
Property Value by Mortgage Status in Kennedyville
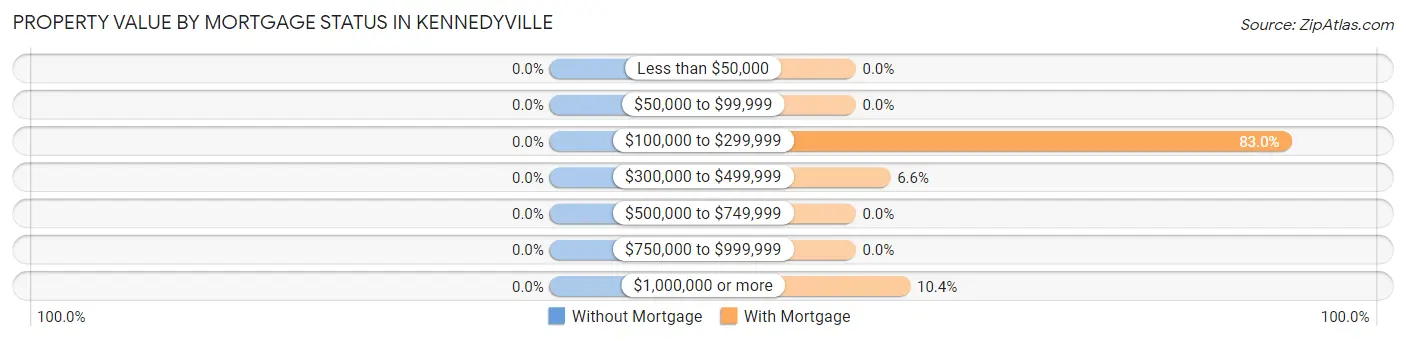
| Property Value | Without Mortgage | With Mortgage |
| Less than $50,000 | 0 (0.0%) | 0 (0.0%) |
| $50,000 to $99,999 | 0 (0.0%) | 0 (0.0%) |
| $100,000 to $299,999 | 0 (0.0%) | 88 (83.0%) |
| $300,000 to $499,999 | 0 (0.0%) | 7 (6.6%) |
| $500,000 to $749,999 | 0 (0.0%) | 0 (0.0%) |
| $750,000 to $999,999 | 0 (0.0%) | 0 (0.0%) |
| $1,000,000 or more | 0 (0.0%) | 11 (10.4%) |
| Total | 0 (0.0%) | 106 (100.0%) |
Household Income by Mortgage Status in Kennedyville
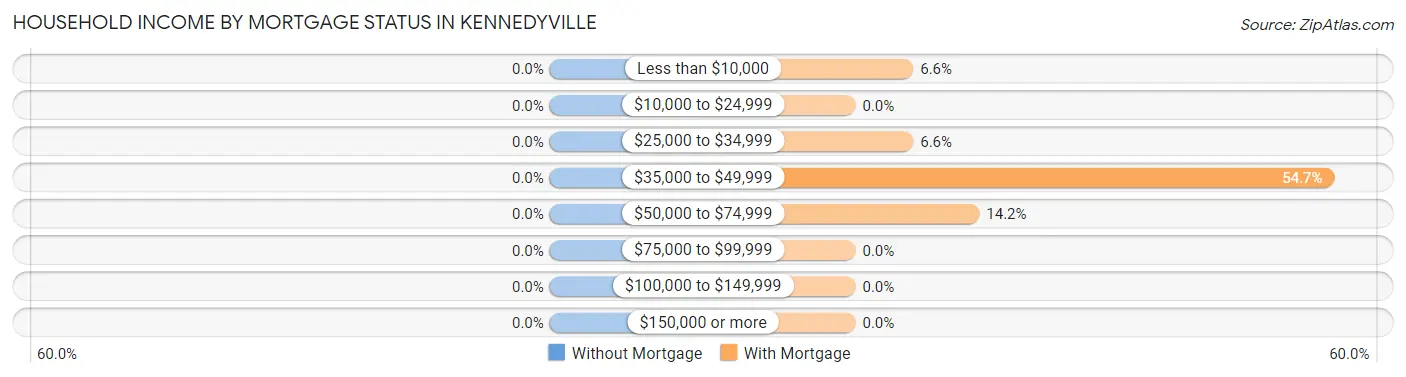
| Household Income | Without Mortgage | With Mortgage |
| Less than $10,000 | 0 (0.0%) | 7 (6.6%) |
| $10,000 to $24,999 | 0 (0.0%) | 0 (0.0%) |
| $25,000 to $34,999 | 0 (0.0%) | 7 (6.6%) |
| $35,000 to $49,999 | 0 (0.0%) | 58 (54.7%) |
| $50,000 to $74,999 | 0 (0.0%) | 15 (14.1%) |
| $75,000 to $99,999 | 0 (0.0%) | 0 (0.0%) |
| $100,000 to $149,999 | 0 (0.0%) | 0 (0.0%) |
| $150,000 or more | 0 (0.0%) | 0 (0.0%) |
| Total | 0 (0.0%) | 106 (100.0%) |
Property Value to Household Income Ratio in Kennedyville
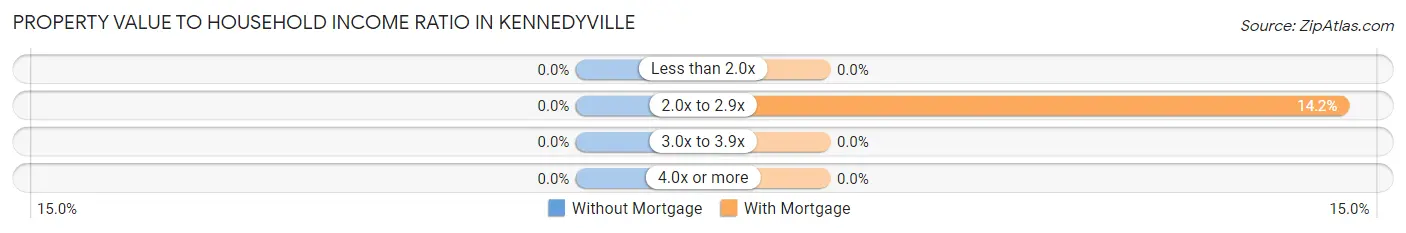
| Value-to-Income Ratio | Without Mortgage | With Mortgage |
| Less than 2.0x | 0 (0.0%) | 0 (0.0%) |
| 2.0x to 2.9x | 0 (0.0%) | 15 (14.1%) |
| 3.0x to 3.9x | 0 (0.0%) | 0 (0.0%) |
| 4.0x or more | 0 (0.0%) | 0 (0.0%) |
| Total | 0 (0.0%) | 106 (100.0%) |
Real Estate Taxes by Mortgage Status in Kennedyville
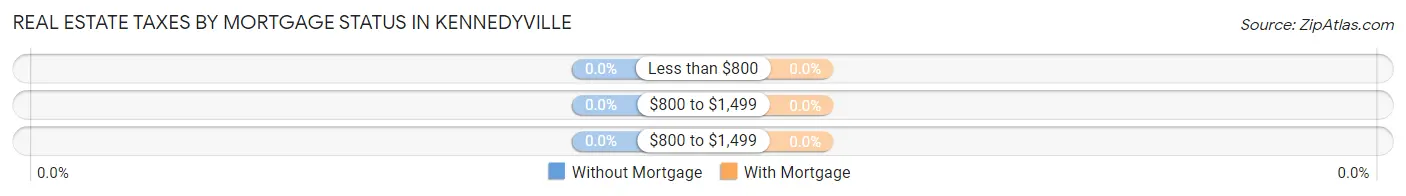
| Property Taxes | Without Mortgage | With Mortgage |
| Less than $800 | 0 (0.0%) | 0 (0.0%) |
| $800 to $1,499 | 0 (0.0%) | 0 (0.0%) |
| $800 to $1,499 | 0 (0.0%) | 0 (0.0%) |
| Total | 0 (0.0%) | 106 (100.0%) |
Health & Disability in Kennedyville
Health Insurance Coverage by Age in Kennedyville
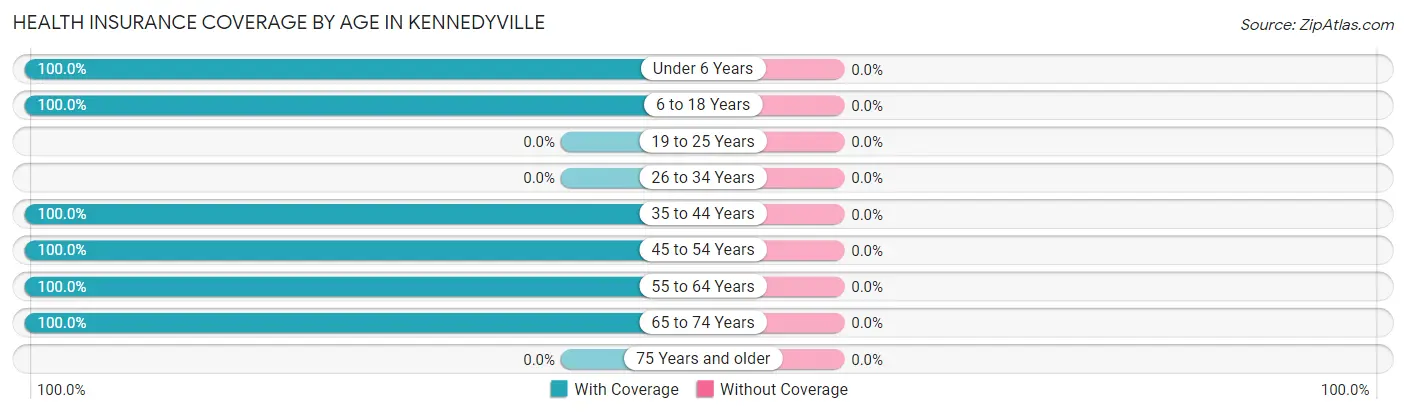
| Age Bracket | With Coverage | Without Coverage |
| Under 6 Years | 10 (100.0%) | 0 (0.0%) |
| 6 to 18 Years | 96 (100.0%) | 0 (0.0%) |
| 19 to 25 Years | 0 (0.0%) | 0 (0.0%) |
| 26 to 34 Years | 0 (0.0%) | 0 (0.0%) |
| 35 to 44 Years | 136 (100.0%) | 0 (0.0%) |
| 45 to 54 Years | 65 (100.0%) | 0 (0.0%) |
| 55 to 64 Years | 127 (100.0%) | 0 (0.0%) |
| 65 to 74 Years | 22 (100.0%) | 0 (0.0%) |
| 75 Years and older | 0 (0.0%) | 0 (0.0%) |
| Total | 456 (100.0%) | 0 (0.0%) |
Health Insurance Coverage by Citizenship Status in Kennedyville
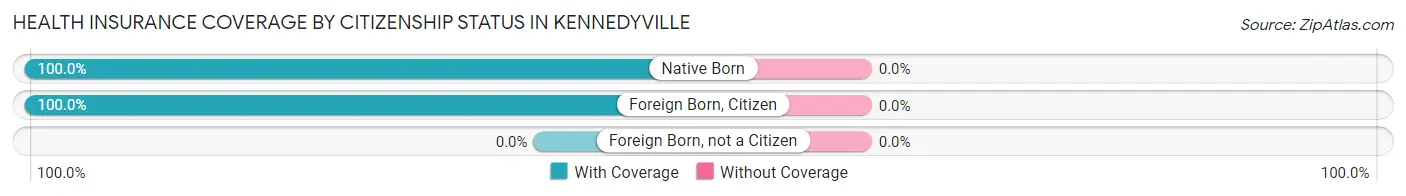
| Citizenship Status | With Coverage | Without Coverage |
| Native Born | 10 (100.0%) | 0 (0.0%) |
| Foreign Born, Citizen | 96 (100.0%) | 0 (0.0%) |
| Foreign Born, not a Citizen | 0 (0.0%) | 0 (0.0%) |
Health Insurance Coverage by Household Income in Kennedyville
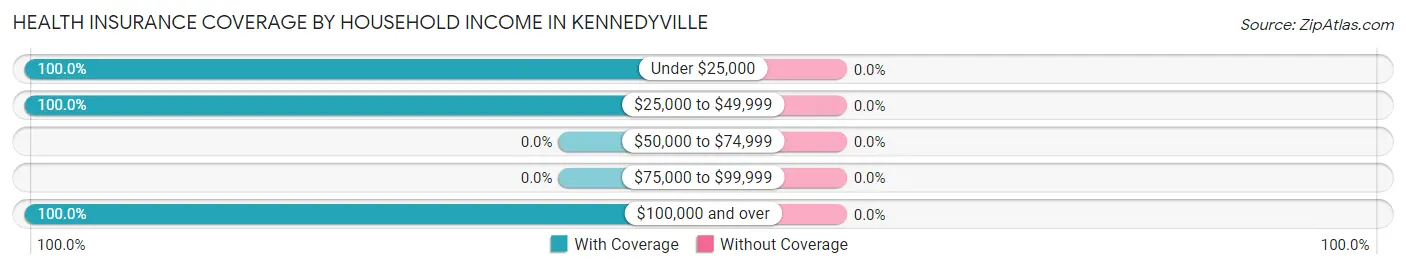
| Household Income | With Coverage | Without Coverage |
| Under $25,000 | 21 (100.0%) | 0 (0.0%) |
| $25,000 to $49,999 | 143 (100.0%) | 0 (0.0%) |
| $50,000 to $74,999 | 0 (0.0%) | 0 (0.0%) |
| $75,000 to $99,999 | 0 (0.0%) | 0 (0.0%) |
| $100,000 and over | 292 (100.0%) | 0 (0.0%) |
Public vs Private Health Insurance Coverage by Age in Kennedyville
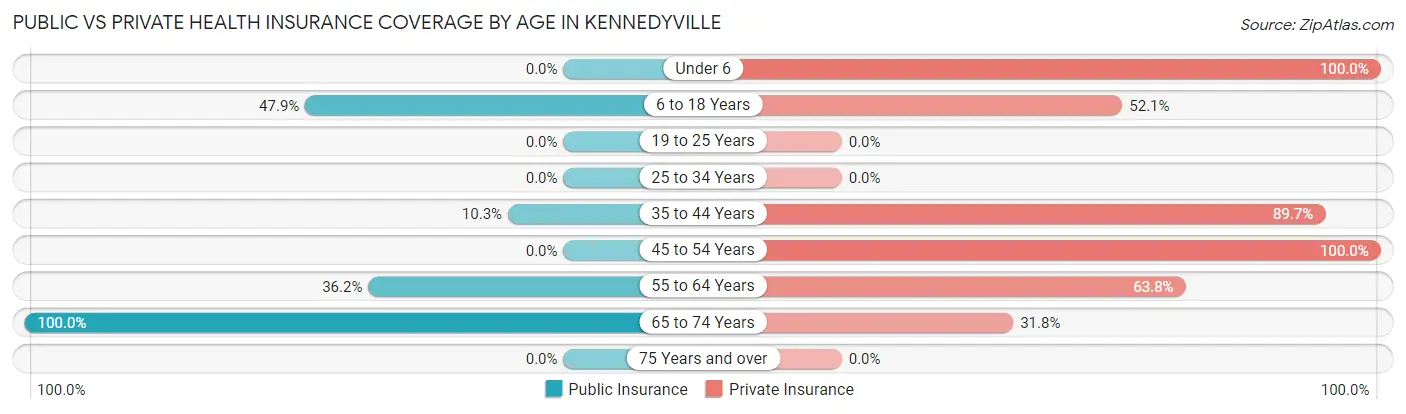
| Age Bracket | Public Insurance | Private Insurance |
| Under 6 | 0 (0.0%) | 10 (100.0%) |
| 6 to 18 Years | 46 (47.9%) | 50 (52.1%) |
| 19 to 25 Years | 0 (0.0%) | 0 (0.0%) |
| 25 to 34 Years | 0 (0.0%) | 0 (0.0%) |
| 35 to 44 Years | 14 (10.3%) | 122 (89.7%) |
| 45 to 54 Years | 0 (0.0%) | 65 (100.0%) |
| 55 to 64 Years | 46 (36.2%) | 81 (63.8%) |
| 65 to 74 Years | 22 (100.0%) | 7 (31.8%) |
| 75 Years and over | 0 (0.0%) | 0 (0.0%) |
| Total | 128 (28.1%) | 335 (73.5%) |
Disability Status by Sex by Age in Kennedyville
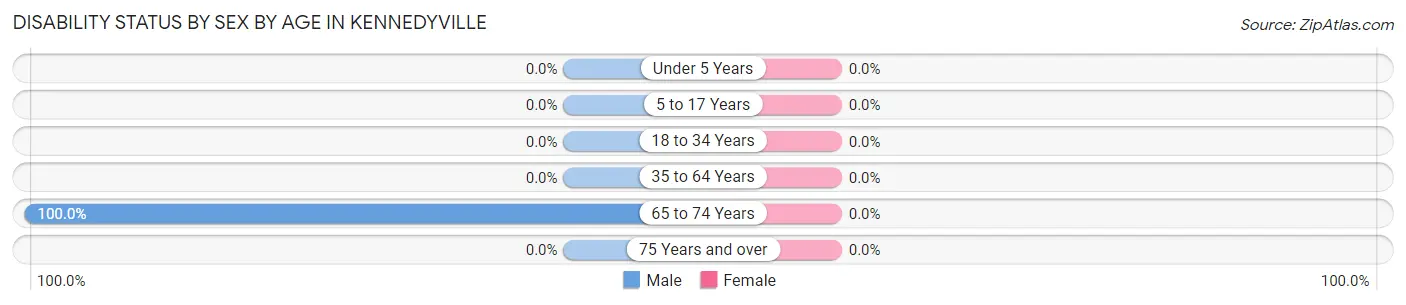
| Age Bracket | Male | Female |
| Under 5 Years | 0 (0.0%) | 0 (0.0%) |
| 5 to 17 Years | 0 (0.0%) | 0 (0.0%) |
| 18 to 34 Years | 0 (0.0%) | 0 (0.0%) |
| 35 to 64 Years | 0 (0.0%) | 0 (0.0%) |
| 65 to 74 Years | 15 (100.0%) | 0 (0.0%) |
| 75 Years and over | 0 (0.0%) | 0 (0.0%) |
Disability Class by Sex by Age in Kennedyville
Disability Class: Hearing Difficulty
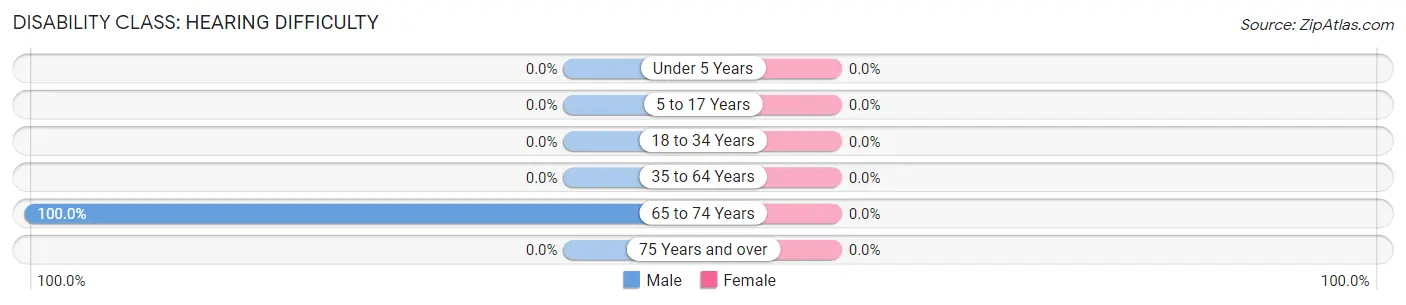
| Age Bracket | Male | Female |
| Under 5 Years | 0 (0.0%) | 0 (0.0%) |
| 5 to 17 Years | 0 (0.0%) | 0 (0.0%) |
| 18 to 34 Years | 0 (0.0%) | 0 (0.0%) |
| 35 to 64 Years | 0 (0.0%) | 0 (0.0%) |
| 65 to 74 Years | 15 (100.0%) | 0 (0.0%) |
| 75 Years and over | 0 (0.0%) | 0 (0.0%) |
Disability Class: Vision Difficulty
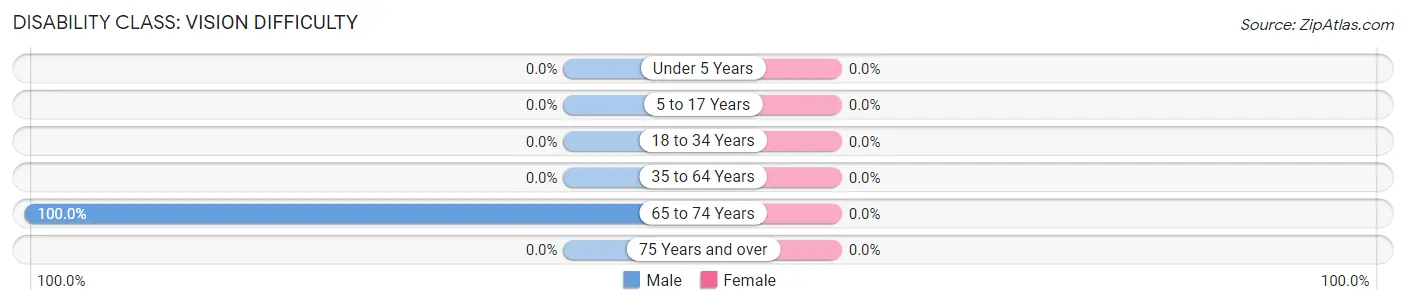
| Age Bracket | Male | Female |
| Under 5 Years | 0 (0.0%) | 0 (0.0%) |
| 5 to 17 Years | 0 (0.0%) | 0 (0.0%) |
| 18 to 34 Years | 0 (0.0%) | 0 (0.0%) |
| 35 to 64 Years | 0 (0.0%) | 0 (0.0%) |
| 65 to 74 Years | 15 (100.0%) | 0 (0.0%) |
| 75 Years and over | 0 (0.0%) | 0 (0.0%) |
Disability Class: Cognitive Difficulty
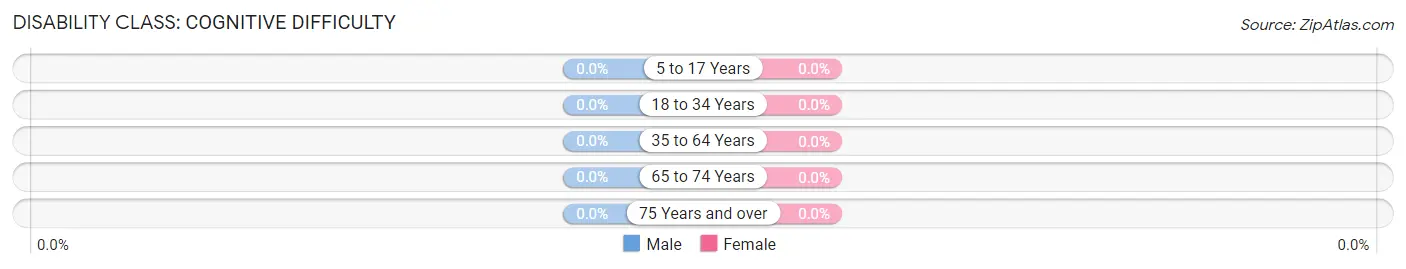
| Age Bracket | Male | Female |
| 5 to 17 Years | 0 (0.0%) | 0 (0.0%) |
| 18 to 34 Years | 0 (0.0%) | 0 (0.0%) |
| 35 to 64 Years | 0 (0.0%) | 0 (0.0%) |
| 65 to 74 Years | 0 (0.0%) | 0 (0.0%) |
| 75 Years and over | 0 (0.0%) | 0 (0.0%) |
Disability Class: Ambulatory Difficulty
| Age Bracket | Male | Female |
| 5 to 17 Years | 0 (0.0%) | 0 (0.0%) |
| 18 to 34 Years | 0 (0.0%) | 0 (0.0%) |
| 35 to 64 Years | 0 (0.0%) | 0 (0.0%) |
| 65 to 74 Years | 0 (0.0%) | 0 (0.0%) |
| 75 Years and over | 0 (0.0%) | 0 (0.0%) |
Disability Class: Self-Care Difficulty
| Age Bracket | Male | Female |
| 5 to 17 Years | 0 (0.0%) | 0 (0.0%) |
| 18 to 34 Years | 0 (0.0%) | 0 (0.0%) |
| 35 to 64 Years | 0 (0.0%) | 0 (0.0%) |
| 65 to 74 Years | 0 (0.0%) | 0 (0.0%) |
| 75 Years and over | 0 (0.0%) | 0 (0.0%) |
Technology Access in Kennedyville
Computing Device Access in Kennedyville
| Device Type | # Households | % Households |
| Desktop or Laptop | 145 | 89.0% |
| Smartphone | 130 | 79.7% |
| Tablet | 141 | 86.5% |
| No Computing Device | 7 | 4.3% |
| Total | 163 | 100.0% |
Internet Access in Kennedyville
| Internet Type | # Households | % Households |
| Dial-Up Internet | 0 | 0.0% |
| Broadband Home | 156 | 95.7% |
| Cellular Data Only | 0 | 0.0% |
| Satellite Internet | 0 | 0.0% |
| No Internet | 7 | 4.3% |
| Total | 163 | 100.0% |
Kennedyville Summary
Kennedyville is a small unincorporated community located in Kent County, Maryland. It is situated on the eastern shore of the Chesapeake Bay, approximately 25 miles south of the state capital of Annapolis. The population of Kennedyville was estimated to be around 500 people in 2000.
History
Kennedyville was founded in 1790 by William Kennedy, a Revolutionary War veteran. Kennedy purchased the land from the local Native Americans and established a small trading post. The town was named after him and grew to become a thriving port town. In the early 19th century, Kennedyville was a major center for the oyster industry, with many of the oysters being shipped to Baltimore and other cities.
In the mid-19th century, Kennedyville was a popular destination for vacationers, who would come to enjoy the area’s natural beauty and the many activities available. The town was also home to a number of businesses, including a hotel, a general store, and a post office.
Geography
Kennedyville is located in Kent County, Maryland, on the eastern shore of the Chesapeake Bay. The town is situated on a peninsula, with the Chester River to the north and the Sassafras River to the south. The town is surrounded by farmland and is bordered by the towns of Chestertown and Galena.
The climate in Kennedyville is humid subtropical, with hot, humid summers and mild winters. The average annual temperature is around 60 degrees Fahrenheit. The area receives an average of 45 inches of precipitation per year, with most of it falling in the summer months.
Economy
The economy of Kennedyville is largely based on agriculture and tourism. The town is home to several farms, which produce a variety of crops, including corn, soybeans, and wheat. The town is also home to a number of seafood processing plants, which process oysters, crabs, and other seafood for sale in local markets.
Tourism is an important part of the local economy, with many visitors coming to the area to enjoy the natural beauty of the Chesapeake Bay and the many activities available. The town is home to a number of bed and breakfasts, as well as a number of restaurants and shops.
Demographics
The population of Kennedyville was estimated to be around 500 people in 2000. The town is predominantly white, with a small African American population. The median household income in the town is around $50,000, and the median home value is around $150,000. The town has a low unemployment rate and a high rate of homeownership.
Common Questions
What is Per Capita Income in Kennedyville?
Per Capita income in Kennedyville is $30,161.
What is Inequality or Gini Index in Kennedyville?
Inequality or Gini Index in Kennedyville is 0.41.
What is the Total Population of Kennedyville?
Total Population of Kennedyville is 456.
What is the Total Male Population of Kennedyville?
Total Male Population of Kennedyville is 200.
What is the Total Female Population of Kennedyville?
Total Female Population of Kennedyville is 256.
What is the Ratio of Males per 100 Females in Kennedyville?
There are 78.12 Males per 100 Females in Kennedyville.
What is the Ratio of Females per 100 Males in Kennedyville?
There are 128.00 Females per 100 Males in Kennedyville.
What is the Median Population Age in Kennedyville?
Median Population Age in Kennedyville is 42.7 Years.
What is the Average Family Size in Kennedyville
Average Family Size in Kennedyville is 2.6 People.
What is the Average Household Size in Kennedyville
Average Household Size in Kennedyville is 2.8 People.
How Large is the Labor Force in Kennedyville?
There are 260 People in the Labor Forcein in Kennedyville.
What is the Percentage of People in the Labor Force in Kennedyville?
74.3% of People are in the Labor Force in Kennedyville.