Wolfeboro, NH Map & Demographics
Wolfeboro Map
Wolfeboro Overview
$39,283
PER CAPITA INCOME
$84,125
AVG FAMILY INCOME
$47,990
AVG HOUSEHOLD INCOME
4.6%
WAGE / INCOME GAP [ % ]
95.4¢/ $1
WAGE / INCOME GAP [ $ ]
0.49
INEQUALITY / GINI INDEX
2,813
TOTAL POPULATION
1,310
MALE POPULATION
1,503
FEMALE POPULATION
87.16
MALES / 100 FEMALES
114.73
FEMALES / 100 MALES
62.2
MEDIAN AGE
2.7
AVG FAMILY SIZE
2.0
AVG HOUSEHOLD SIZE
1,004
LABOR FORCE [ PEOPLE ]
38.9%
PERCENT IN LABOR FORCE
0.2%
UNEMPLOYMENT RATE
Wolfeboro Zip Codes
Wolfeboro Area Codes
Income in Wolfeboro
Income Overview in Wolfeboro
Per Capita Income in Wolfeboro is $39,283, while median incomes of families and households are $84,125 and $47,990 respectively.
| Characteristic | Number | Measure |
| Per Capita Income | 2,813 | $39,283 |
| Median Family Income | 765 | $84,125 |
| Mean Family Income | 765 | $102,479 |
| Median Household Income | 1,370 | $47,990 |
| Mean Household Income | 1,370 | $73,592 |
| Income Deficit | 765 | $0 |
| Wage / Income Gap (%) | 2,813 | 4.64% |
| Wage / Income Gap ($) | 2,813 | 95.36¢ per $1 |
| Gini / Inequality Index | 2,813 | 0.49 |
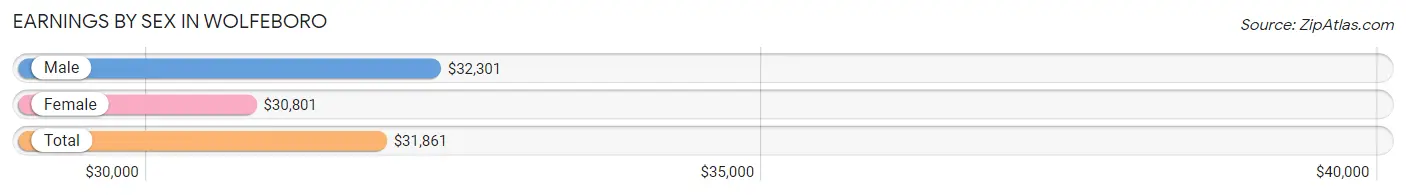
Earnings by Sex in Wolfeboro
Average Earnings in Wolfeboro are $31,861, $32,301 for men and $30,801 for women, a difference of 4.6%.
| Sex | Number | Average Earnings |
| Male | 577 (48.6%) | $32,301 |
| Female | 611 (51.4%) | $30,801 |
| Total | 1,188 (100.0%) | $31,861 |
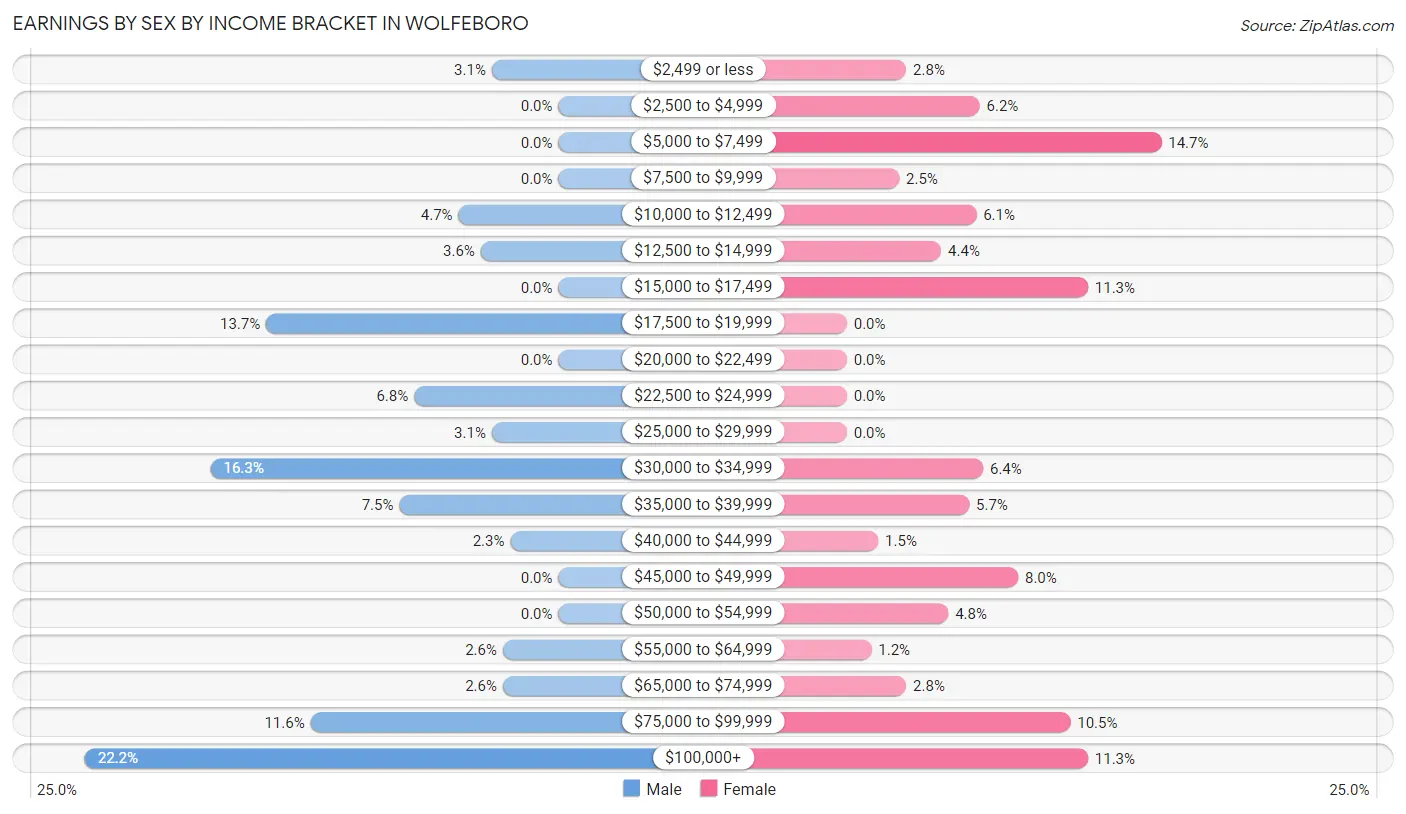
Earnings by Sex by Income Bracket in Wolfeboro
The most common earnings brackets in Wolfeboro are $100,000+ for men (128 | 22.2%) and $5,000 to $7,499 for women (90 | 14.7%).
| Income | Male | Female |
| $2,499 or less | 18 (3.1%) | 17 (2.8%) |
| $2,500 to $4,999 | 0 (0.0%) | 38 (6.2%) |
| $5,000 to $7,499 | 0 (0.0%) | 90 (14.7%) |
| $7,500 to $9,999 | 0 (0.0%) | 15 (2.5%) |
| $10,000 to $12,499 | 27 (4.7%) | 37 (6.1%) |
| $12,500 to $14,999 | 21 (3.6%) | 27 (4.4%) |
| $15,000 to $17,499 | 0 (0.0%) | 69 (11.3%) |
| $17,500 to $19,999 | 79 (13.7%) | 0 (0.0%) |
| $20,000 to $22,499 | 0 (0.0%) | 0 (0.0%) |
| $22,500 to $24,999 | 39 (6.8%) | 0 (0.0%) |
| $25,000 to $29,999 | 18 (3.1%) | 0 (0.0%) |
| $30,000 to $34,999 | 94 (16.3%) | 39 (6.4%) |
| $35,000 to $39,999 | 43 (7.4%) | 35 (5.7%) |
| $40,000 to $44,999 | 13 (2.2%) | 9 (1.5%) |
| $45,000 to $49,999 | 0 (0.0%) | 49 (8.0%) |
| $50,000 to $54,999 | 0 (0.0%) | 29 (4.8%) |
| $55,000 to $64,999 | 15 (2.6%) | 7 (1.1%) |
| $65,000 to $74,999 | 15 (2.6%) | 17 (2.8%) |
| $75,000 to $99,999 | 67 (11.6%) | 64 (10.5%) |
| $100,000+ | 128 (22.2%) | 69 (11.3%) |
| Total | 577 (100.0%) | 611 (100.0%) |
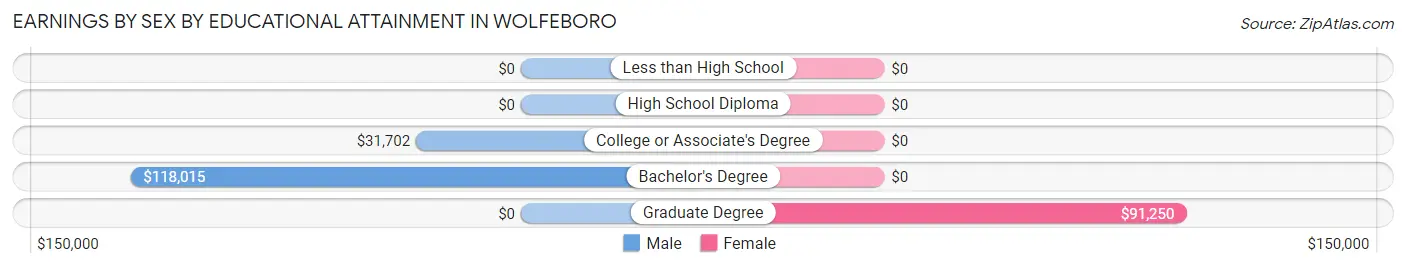
Earnings by Sex by Educational Attainment in Wolfeboro
| Educational Attainment | Male Income | Female Income |
| Less than High School | - | - |
| High School Diploma | - | - |
| College or Associate's Degree | $31,702 | $0 |
| Bachelor's Degree | $118,015 | $0 |
| Graduate Degree | - | - |
| Total | - | - |
Family Income in Wolfeboro
Family Income Brackets in Wolfeboro
According to the Wolfeboro family income data, there are 145 families falling into the $100,000 to $149,999 income range, which is the most common income bracket and makes up 19.0% of all families. Conversely, the less than $10,000 income bracket is the least frequent group with only 16 families (2.1%) belonging to this category.
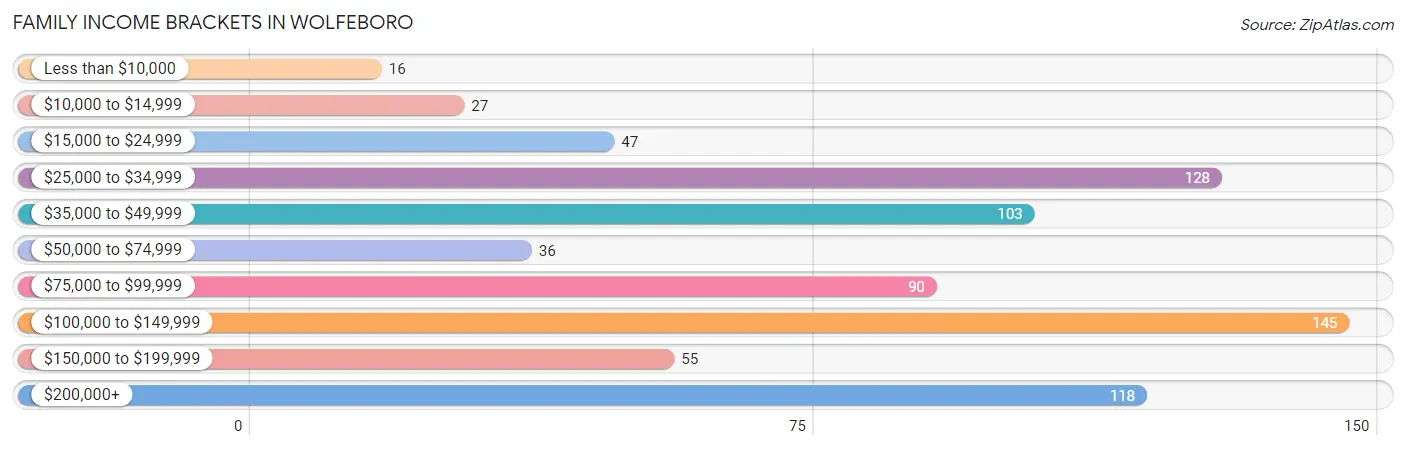
| Income Bracket | # Families | % Families |
| Less than $10,000 | 16 | 2.1% |
| $10,000 to $14,999 | 27 | 3.5% |
| $15,000 to $24,999 | 47 | 6.1% |
| $25,000 to $34,999 | 128 | 16.7% |
| $35,000 to $49,999 | 103 | 13.5% |
| $50,000 to $74,999 | 36 | 4.7% |
| $75,000 to $99,999 | 90 | 11.8% |
| $100,000 to $149,999 | 145 | 19.0% |
| $150,000 to $199,999 | 55 | 7.2% |
| $200,000+ | 118 | 15.4% |
Family Income by Famaliy Size in Wolfeboro
2-person families (534 | 69.8%) account for the highest median family income in Wolfeboro with $72,500 per family, while 2-person families (534 | 69.8%) have the highest median income of $36,250 per family member.
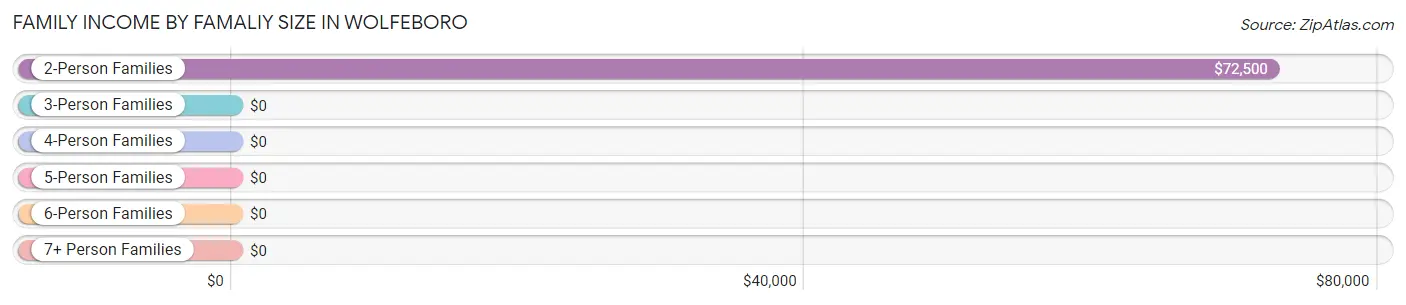
| Income Bracket | # Families | Median Income |
| 2-Person Families | 534 (69.8%) | $72,500 |
| 3-Person Families | 141 (18.4%) | $0 |
| 4-Person Families | 34 (4.4%) | $0 |
| 5-Person Families | 31 (4.1%) | $0 |
| 6-Person Families | 0 (0.0%) | $0 |
| 7+ Person Families | 25 (3.3%) | $0 |
| Total | 765 (100.0%) | $84,125 |
Family Income by Number of Earners in Wolfeboro
The median family income in Wolfeboro is $84,125, with families comprising 3+ earners (100) having the highest median family income of $182,065, while families with 1 earner (229) have the lowest median family income of $33,512, accounting for 13.1% and 29.9% of families, respectively.
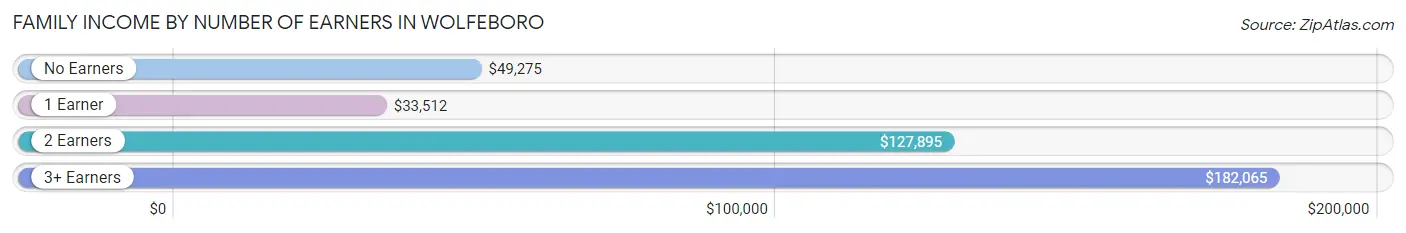
| Number of Earners | # Families | Median Income |
| No Earners | 266 (34.8%) | $49,275 |
| 1 Earner | 229 (29.9%) | $33,512 |
| 2 Earners | 170 (22.2%) | $127,895 |
| 3+ Earners | 100 (13.1%) | $182,065 |
| Total | 765 (100.0%) | $84,125 |
Household Income in Wolfeboro
Household Income Brackets in Wolfeboro
With 223 households falling in the category, the $25,000 to $34,999 income range is the most frequent in Wolfeboro, accounting for 16.3% of all households. In contrast, only 55 households (4.0%) fall into the $150,000 to $199,999 income bracket, making it the least populous group.
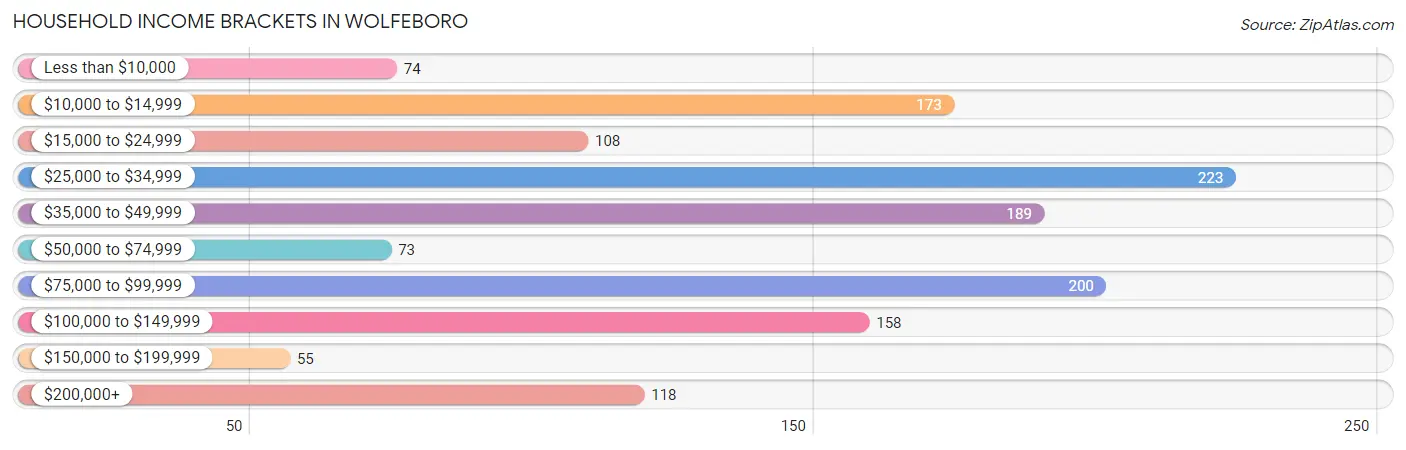
| Income Bracket | # Households | % Households |
| Less than $10,000 | 74 | 5.4% |
| $10,000 to $14,999 | 173 | 12.6% |
| $15,000 to $24,999 | 108 | 7.9% |
| $25,000 to $34,999 | 223 | 16.3% |
| $35,000 to $49,999 | 189 | 13.8% |
| $50,000 to $74,999 | 73 | 5.3% |
| $75,000 to $99,999 | 200 | 14.6% |
| $100,000 to $149,999 | 158 | 11.5% |
| $150,000 to $199,999 | 55 | 4.0% |
| $200,000+ | 118 | 8.6% |
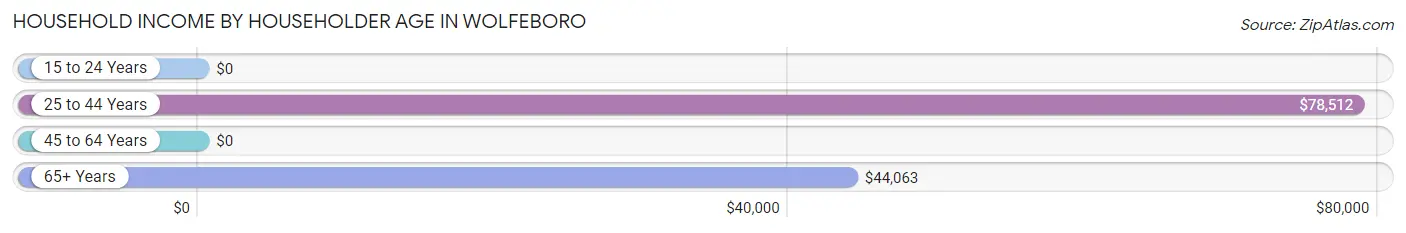
Household Income by Householder Age in Wolfeboro
The median household income in Wolfeboro is $47,990, with the highest median household income of $78,512 found in the 25 to 44 years age bracket for the primary householder. A total of 110 households (8.0%) fall into this category.
| Income Bracket | # Households | Median Income |
| 15 to 24 Years | 0 (0.0%) | $0 |
| 25 to 44 Years | 110 (8.0%) | $78,512 |
| 45 to 64 Years | 415 (30.3%) | $0 |
| 65+ Years | 845 (61.7%) | $44,063 |
| Total | 1,370 (100.0%) | $47,990 |
Poverty in Wolfeboro
Income Below Poverty by Sex and Age in Wolfeboro
With 13.2% poverty level for males and 11.6% for females among the residents of Wolfeboro, under 5 year old males and 6 to 11 year old females are the most vulnerable to poverty, with 24 males (100.0%) and 23 females (62.2%) in their respective age groups living below the poverty level.
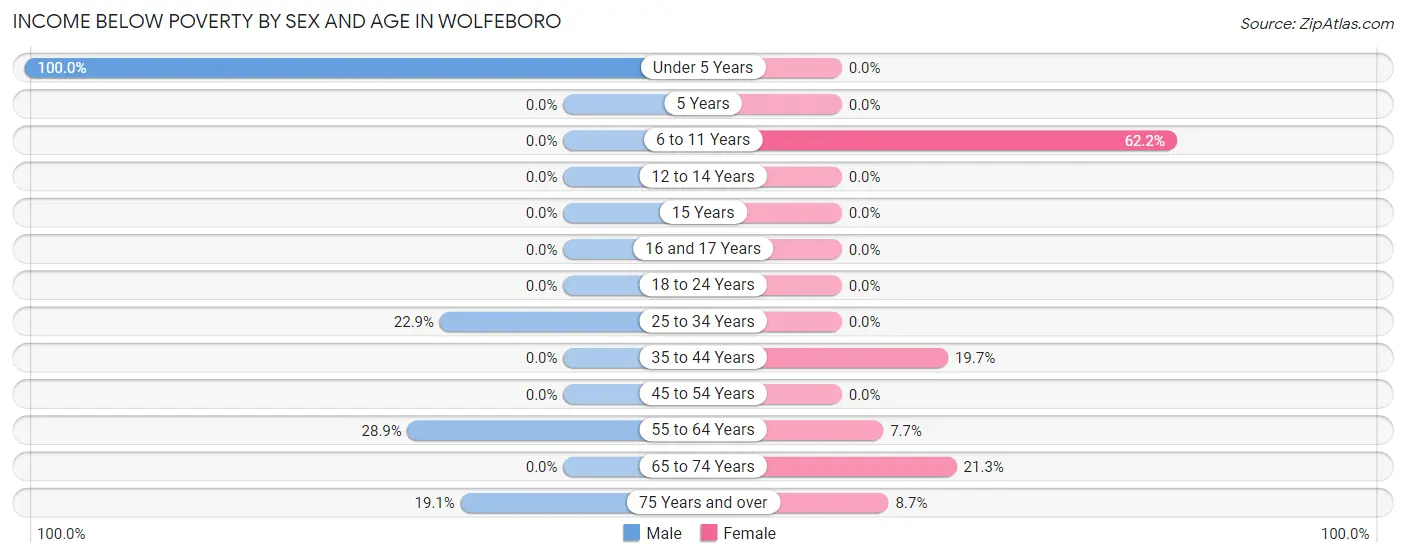
| Age Bracket | Male | Female |
| Under 5 Years | 24 (100.0%) | 0 (0.0%) |
| 5 Years | 0 (0.0%) | 0 (0.0%) |
| 6 to 11 Years | 0 (0.0%) | 23 (62.2%) |
| 12 to 14 Years | 0 (0.0%) | 0 (0.0%) |
| 15 Years | 0 (0.0%) | 0 (0.0%) |
| 16 and 17 Years | 0 (0.0%) | 0 (0.0%) |
| 18 to 24 Years | 0 (0.0%) | 0 (0.0%) |
| 25 to 34 Years | 11 (22.9%) | 0 (0.0%) |
| 35 to 44 Years | 0 (0.0%) | 27 (19.7%) |
| 45 to 54 Years | 0 (0.0%) | 0 (0.0%) |
| 55 to 64 Years | 85 (28.9%) | 16 (7.7%) |
| 65 to 74 Years | 0 (0.0%) | 58 (21.3%) |
| 75 Years and over | 50 (19.1%) | 42 (8.7%) |
| Total | 170 (13.2%) | 166 (11.6%) |
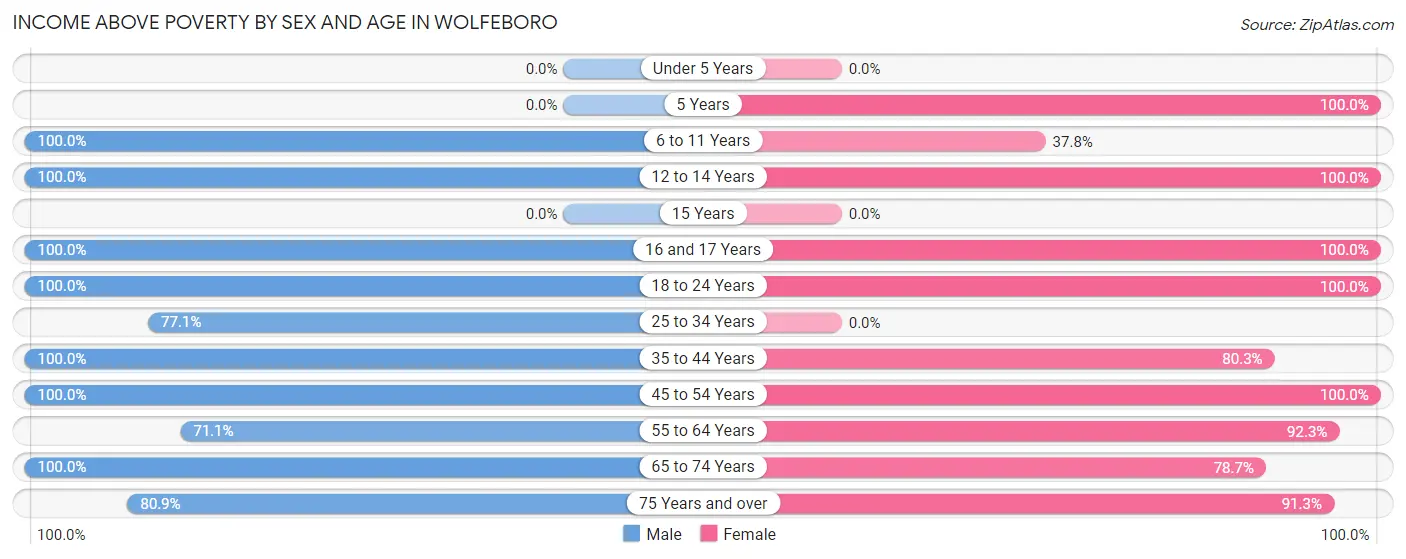
Income Above Poverty by Sex and Age in Wolfeboro
According to the poverty statistics in Wolfeboro, males aged 6 to 11 years and females aged 5 years are the age groups that are most secure financially, with 100.0% of males and 100.0% of females in these age groups living above the poverty line.
| Age Bracket | Male | Female |
| Under 5 Years | 0 (0.0%) | 0 (0.0%) |
| 5 Years | 0 (0.0%) | 12 (100.0%) |
| 6 to 11 Years | 79 (100.0%) | 14 (37.8%) |
| 12 to 14 Years | 24 (100.0%) | 56 (100.0%) |
| 15 Years | 0 (0.0%) | 0 (0.0%) |
| 16 and 17 Years | 76 (100.0%) | 26 (100.0%) |
| 18 to 24 Years | 35 (100.0%) | 59 (100.0%) |
| 25 to 34 Years | 37 (77.1%) | 0 (0.0%) |
| 35 to 44 Years | 94 (100.0%) | 110 (80.3%) |
| 45 to 54 Years | 103 (100.0%) | 137 (100.0%) |
| 55 to 64 Years | 209 (71.1%) | 192 (92.3%) |
| 65 to 74 Years | 246 (100.0%) | 214 (78.7%) |
| 75 Years and over | 212 (80.9%) | 441 (91.3%) |
| Total | 1,115 (86.8%) | 1,261 (88.4%) |
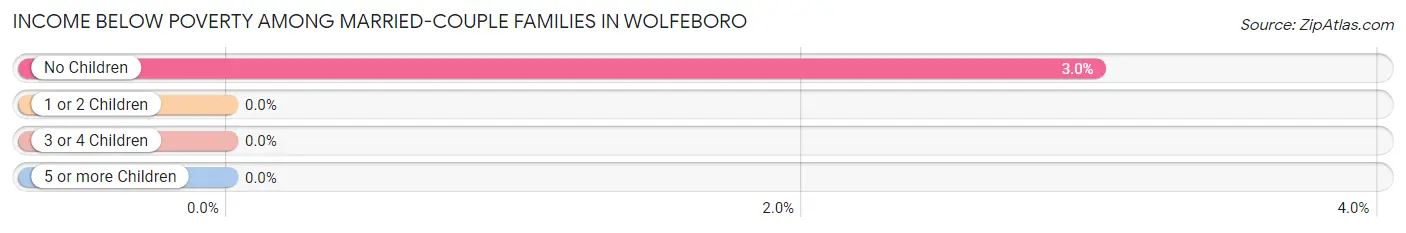
Income Below Poverty Among Married-Couple Families in Wolfeboro
The poverty statistics for married-couple families in Wolfeboro show that 2.6% or 16 of the total 619 families live below the poverty line. Families with no children have the highest poverty rate of 3.0%, comprising of 16 families. On the other hand, families with 1 or 2 children have the lowest poverty rate of 0.0%, which includes 0 families.
| Children | Above Poverty | Below Poverty |
| No Children | 513 (97.0%) | 16 (3.0%) |
| 1 or 2 Children | 65 (100.0%) | 0 (0.0%) |
| 3 or 4 Children | 0 (0.0%) | 0 (0.0%) |
| 5 or more Children | 25 (100.0%) | 0 (0.0%) |
| Total | 603 (97.4%) | 16 (2.6%) |
Income Below Poverty Among Single-Parent Households in Wolfeboro
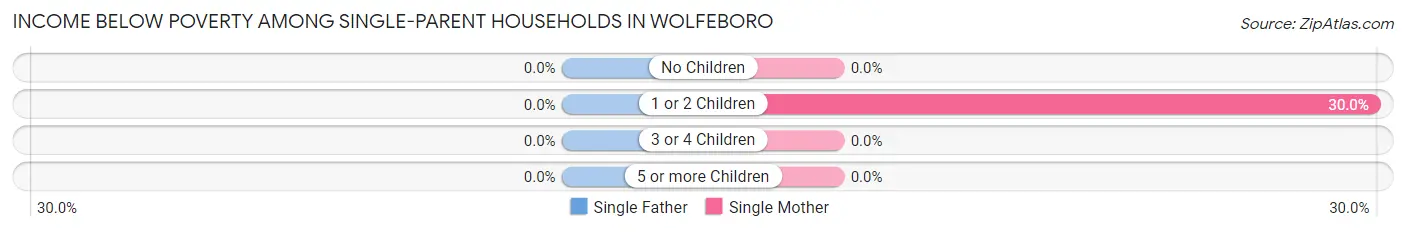
| Children | Single Father | Single Mother |
| No Children | 0 (0.0%) | 0 (0.0%) |
| 1 or 2 Children | 0 (0.0%) | 27 (30.0%) |
| 3 or 4 Children | 0 (0.0%) | 0 (0.0%) |
| 5 or more Children | 0 (0.0%) | 0 (0.0%) |
| Total | 0 (0.0%) | 27 (18.5%) |
Income Below Poverty Among Married-Couple vs Single-Parent Households in Wolfeboro
The poverty data for Wolfeboro shows that 16 of the married-couple family households (2.6%) and 27 of the single-parent households (18.5%) are living below the poverty level. Within the married-couple family households, those with no children have the highest poverty rate, with 16 households (3.0%) falling below the poverty line. Among the single-parent households, those with 1 or 2 children have the highest poverty rate, with 27 household (30.0%) living below poverty.
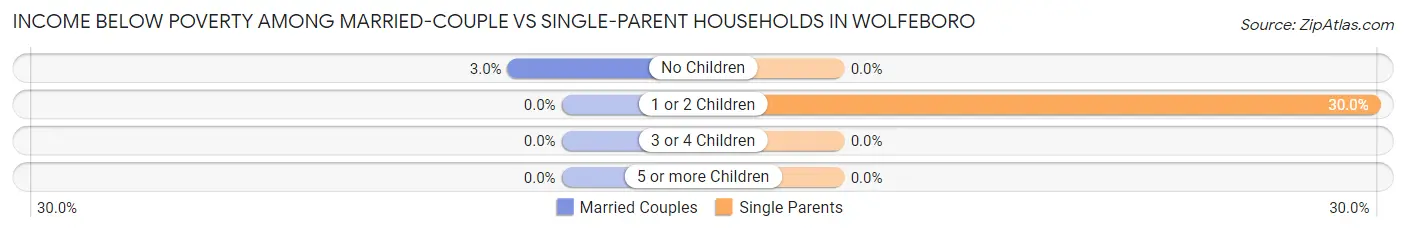
| Children | Married-Couple Families | Single-Parent Households |
| No Children | 16 (3.0%) | 0 (0.0%) |
| 1 or 2 Children | 0 (0.0%) | 27 (30.0%) |
| 3 or 4 Children | 0 (0.0%) | 0 (0.0%) |
| 5 or more Children | 0 (0.0%) | 0 (0.0%) |
| Total | 16 (2.6%) | 27 (18.5%) |
Race in Wolfeboro
The most populous races in Wolfeboro are White / Caucasian (2,703 | 96.1%), Hispanic or Latino (61 | 2.2%), and Native / Alaskan (61 | 2.2%).
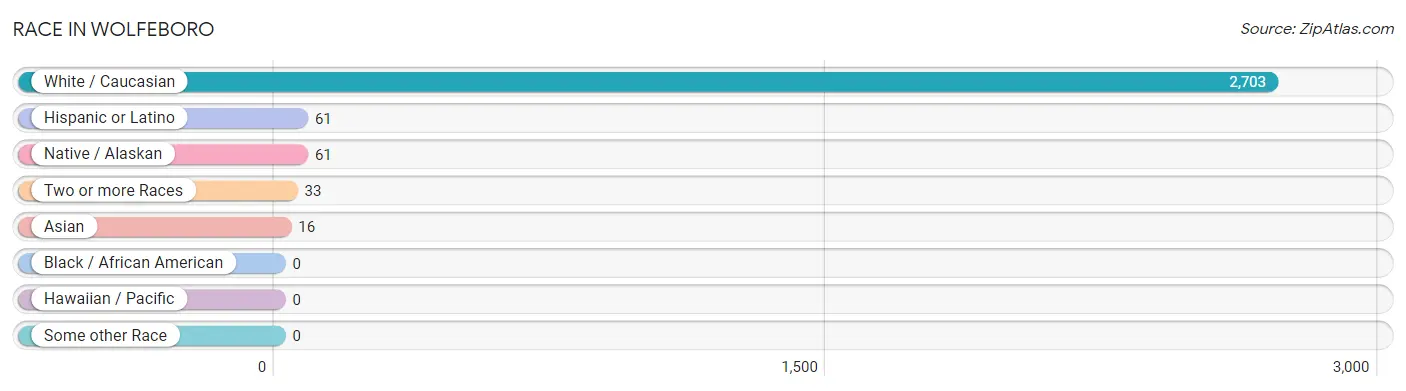
| Race | # Population | % Population |
| Asian | 16 | 0.6% |
| Black / African American | 0 | 0.0% |
| Hawaiian / Pacific | 0 | 0.0% |
| Hispanic or Latino | 61 | 2.2% |
| Native / Alaskan | 61 | 2.2% |
| White / Caucasian | 2,703 | 96.1% |
| Two or more Races | 33 | 1.2% |
| Some other Race | 0 | 0.0% |
| Total | 2,813 | 100.0% |
Ancestry in Wolfeboro
The most populous ancestries reported in Wolfeboro are English (740 | 26.3%), Irish (642 | 22.8%), German (506 | 18.0%), Scottish (450 | 16.0%), and American (209 | 7.4%), together accounting for 90.6% of all Wolfeboro residents.
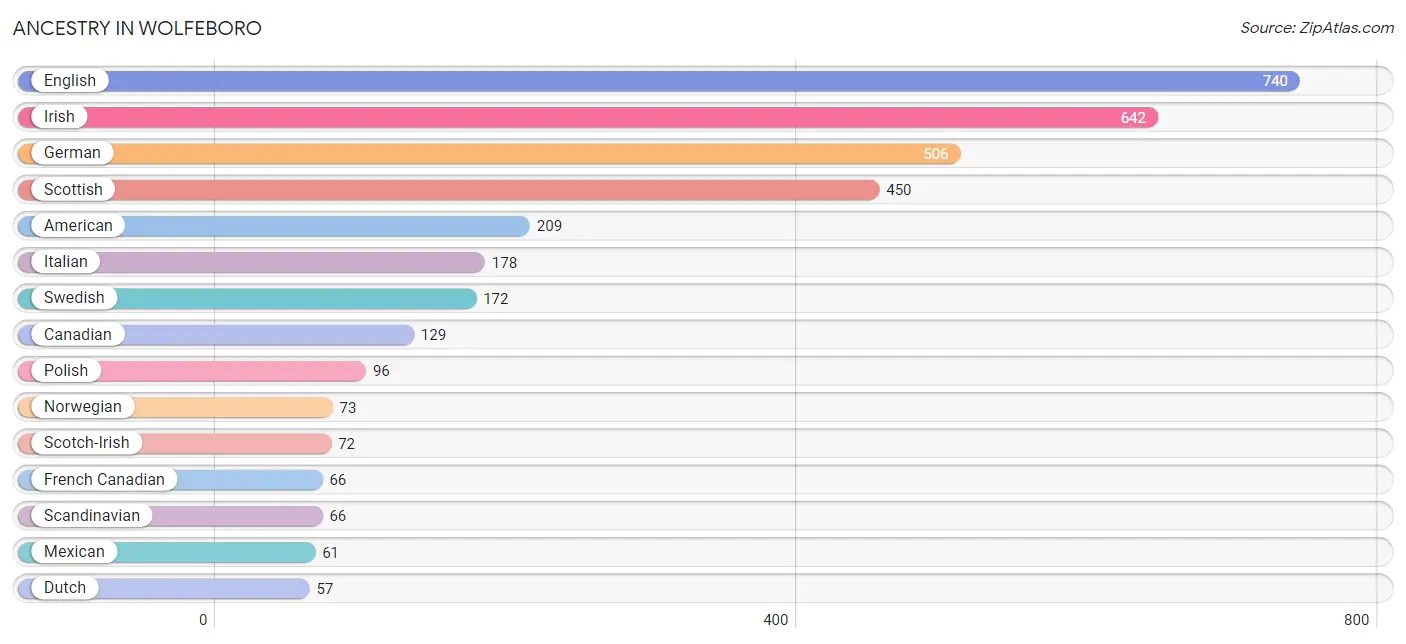
| Ancestry | # Population | % Population |
| American | 209 | 7.4% |
| Belgian | 11 | 0.4% |
| Canadian | 129 | 4.6% |
| Dutch | 57 | 2.0% |
| English | 740 | 26.3% |
| European | 38 | 1.3% |
| French | 20 | 0.7% |
| French Canadian | 66 | 2.4% |
| German | 506 | 18.0% |
| Greek | 1 | 0.0% |
| Irish | 642 | 22.8% |
| Italian | 178 | 6.3% |
| Latvian | 7 | 0.3% |
| Lithuanian | 11 | 0.4% |
| Mexican | 61 | 2.2% |
| Norwegian | 73 | 2.6% |
| Polish | 96 | 3.4% |
| Portuguese | 36 | 1.3% |
| Russian | 26 | 0.9% |
| Scandinavian | 66 | 2.4% |
| Scotch-Irish | 72 | 2.6% |
| Scottish | 450 | 16.0% |
| Swedish | 172 | 6.1% |
| Ukrainian | 18 | 0.6% |
| Vietnamese | 16 | 0.6% | View All 25 Rows |
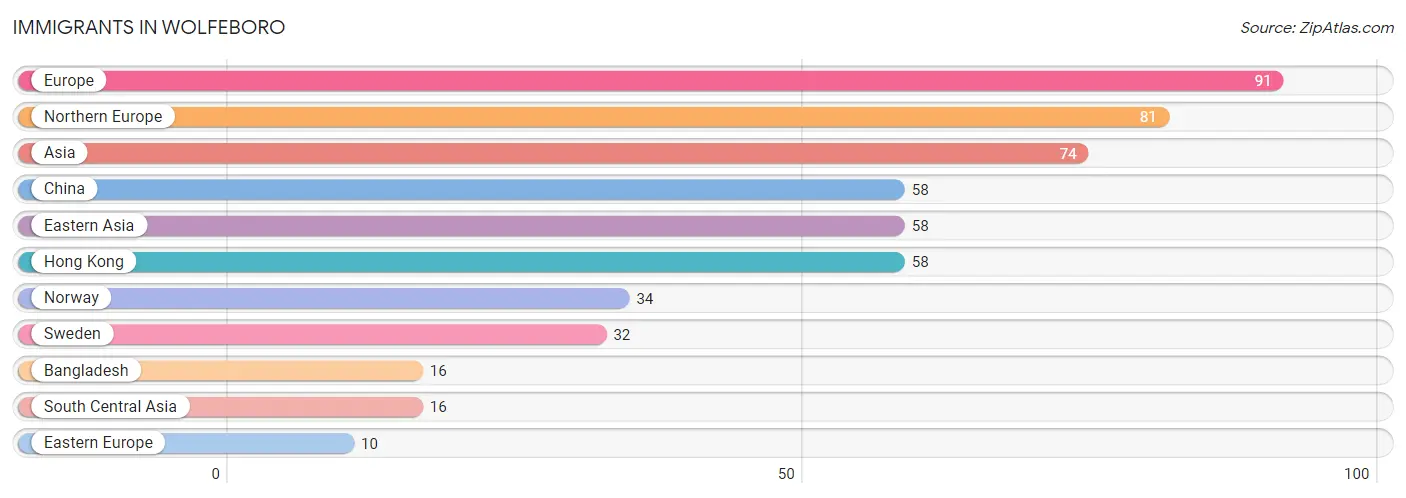
Immigrants in Wolfeboro
The most numerous immigrant groups reported in Wolfeboro came from Europe (91 | 3.2%), Northern Europe (81 | 2.9%), Asia (74 | 2.6%), China (58 | 2.1%), and Eastern Asia (58 | 2.1%), together accounting for 12.9% of all Wolfeboro residents.
| Immigration Origin | # Population | % Population |
| Asia | 74 | 2.6% |
| Bangladesh | 16 | 0.6% |
| China | 58 | 2.1% |
| Eastern Asia | 58 | 2.1% |
| Eastern Europe | 10 | 0.4% |
| Europe | 91 | 3.2% |
| Hong Kong | 58 | 2.1% |
| Northern Europe | 81 | 2.9% |
| Norway | 34 | 1.2% |
| South Central Asia | 16 | 0.6% |
| Sweden | 32 | 1.1% | View All 11 Rows |
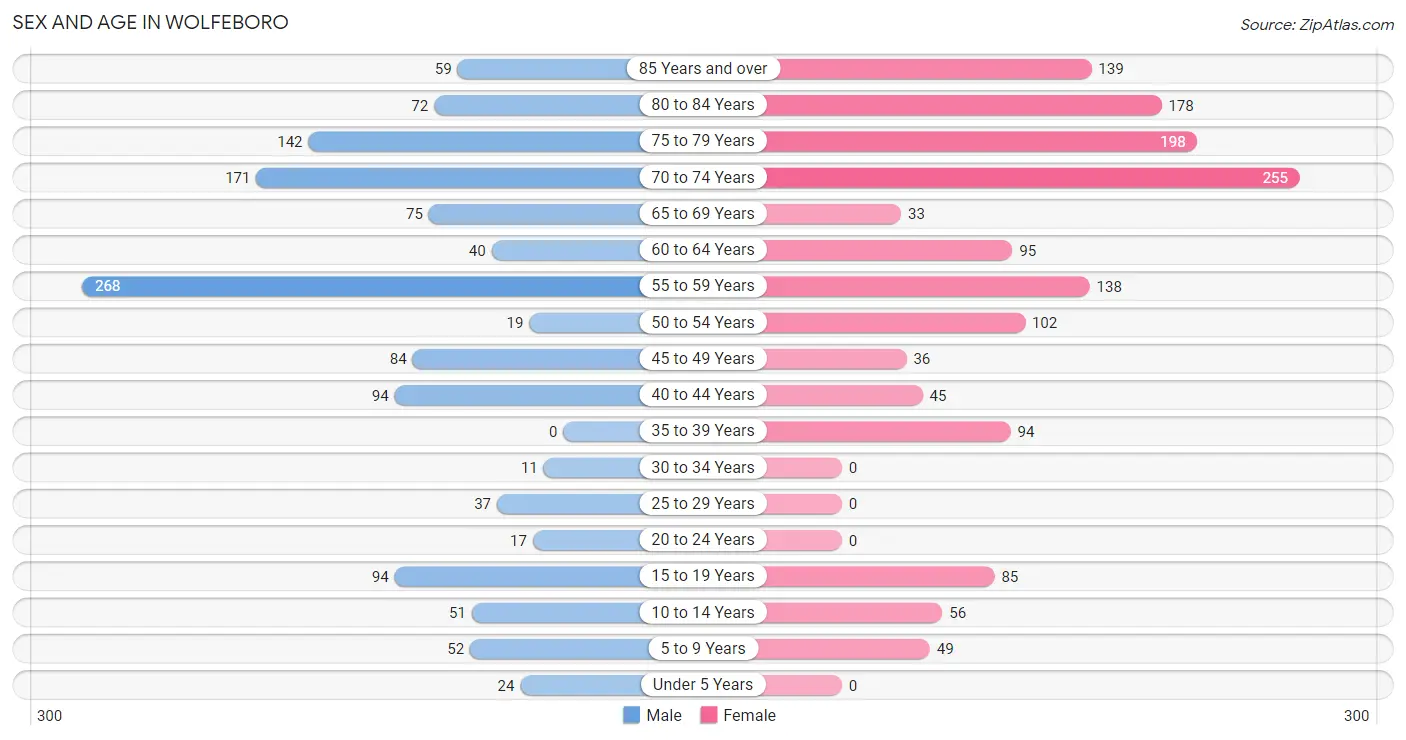
Sex and Age in Wolfeboro
Sex and Age in Wolfeboro
The most populous age groups in Wolfeboro are 55 to 59 Years (268 | 20.5%) for men and 70 to 74 Years (255 | 17.0%) for women.
| Age Bracket | Male | Female |
| Under 5 Years | 24 (1.8%) | 0 (0.0%) |
| 5 to 9 Years | 52 (4.0%) | 49 (3.3%) |
| 10 to 14 Years | 51 (3.9%) | 56 (3.7%) |
| 15 to 19 Years | 94 (7.2%) | 85 (5.7%) |
| 20 to 24 Years | 17 (1.3%) | 0 (0.0%) |
| 25 to 29 Years | 37 (2.8%) | 0 (0.0%) |
| 30 to 34 Years | 11 (0.8%) | 0 (0.0%) |
| 35 to 39 Years | 0 (0.0%) | 94 (6.2%) |
| 40 to 44 Years | 94 (7.2%) | 45 (3.0%) |
| 45 to 49 Years | 84 (6.4%) | 36 (2.4%) |
| 50 to 54 Years | 19 (1.5%) | 102 (6.8%) |
| 55 to 59 Years | 268 (20.5%) | 138 (9.2%) |
| 60 to 64 Years | 40 (3.0%) | 95 (6.3%) |
| 65 to 69 Years | 75 (5.7%) | 33 (2.2%) |
| 70 to 74 Years | 171 (13.1%) | 255 (17.0%) |
| 75 to 79 Years | 142 (10.8%) | 198 (13.2%) |
| 80 to 84 Years | 72 (5.5%) | 178 (11.8%) |
| 85 Years and over | 59 (4.5%) | 139 (9.2%) |
| Total | 1,310 (100.0%) | 1,503 (100.0%) |
Families and Households in Wolfeboro
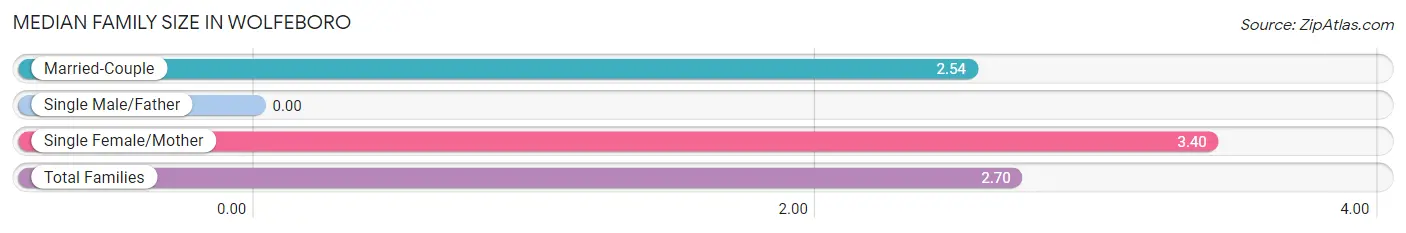
Median Family Size in Wolfeboro
| Family Type | # Families | Family Size |
| Married-Couple | 619 (80.9%) | 2.54 |
| Single Male/Father | 0 (0.0%) | - |
| Single Female/Mother | 146 (19.1%) | 3.40 |
| Total Families | 765 (100.0%) | 2.70 |
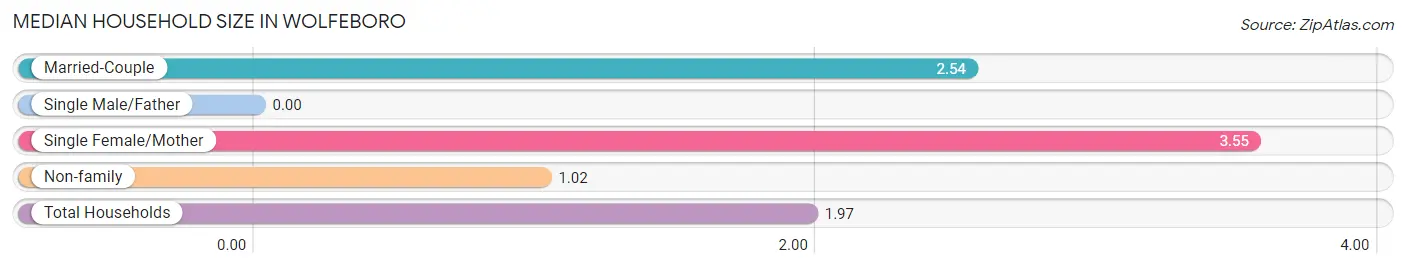
Median Household Size in Wolfeboro
| Household Type | # Households | Household Size |
| Married-Couple | 619 (45.2%) | 2.54 |
| Single Male/Father | 0 (0.0%) | - |
| Single Female/Mother | 146 (10.7%) | 3.55 |
| Non-family | 605 (44.2%) | 1.02 |
| Total Households | 1,370 (100.0%) | 1.97 |
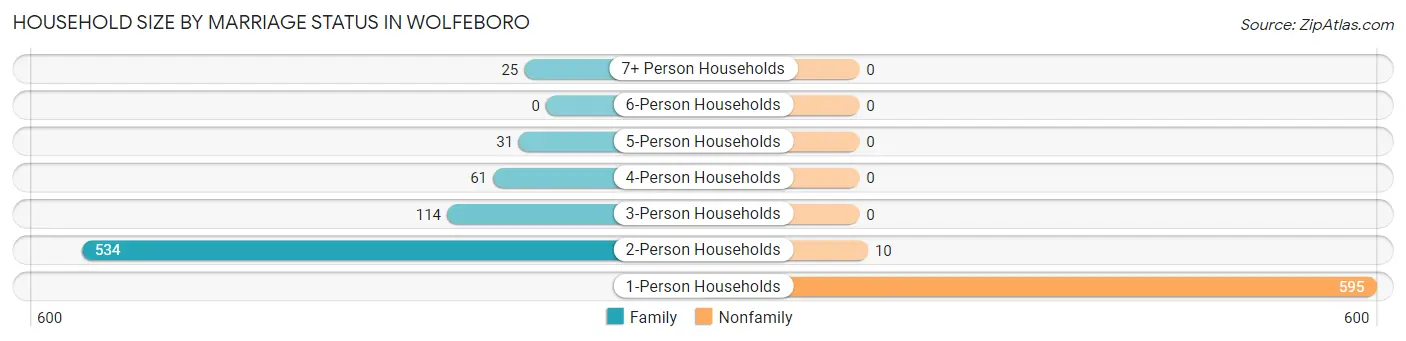
Household Size by Marriage Status in Wolfeboro
Out of a total of 1,370 households in Wolfeboro, 765 (55.8%) are family households, while 605 (44.2%) are nonfamily households. The most numerous type of family households are 2-person households, comprising 534, and the most common type of nonfamily households are 1-person households, comprising 595.
| Household Size | Family Households | Nonfamily Households |
| 1-Person Households | - | 595 (43.4%) |
| 2-Person Households | 534 (39.0%) | 10 (0.7%) |
| 3-Person Households | 114 (8.3%) | 0 (0.0%) |
| 4-Person Households | 61 (4.4%) | 0 (0.0%) |
| 5-Person Households | 31 (2.3%) | 0 (0.0%) |
| 6-Person Households | 0 (0.0%) | 0 (0.0%) |
| 7+ Person Households | 25 (1.8%) | 0 (0.0%) |
| Total | 765 (55.8%) | 605 (44.2%) |
Female Fertility in Wolfeboro
Fertility by Age in Wolfeboro
| Age Bracket | Women with Births | Births / 1,000 Women |
| 15 to 19 years | 0 (0.0%) | 0.0 |
| 20 to 34 years | 0 (0.0%) | 0.0 |
| 35 to 50 years | 0 (0.0%) | 0.0 |
| Total | 0 (0.0%) | 0.0 |
Fertility by Age by Marriage Status in Wolfeboro
| Age Bracket | Married | Unmarried |
| 15 to 19 years | 0 (0.0%) | 0 (0.0%) |
| 20 to 34 years | 0 (0.0%) | 0 (0.0%) |
| 35 to 50 years | 0 (0.0%) | 0 (0.0%) |
| Total | 0 (0.0%) | 0 (0.0%) |
Fertility by Education in Wolfeboro
| Educational Attainment | Women with Births | Births / 1,000 Women |
| Less than High School | 0 (0.0%) | 0.0 |
| High School Diploma | 0 (0.0%) | 0.0 |
| College or Associate's Degree | 0 (0.0%) | 0.0 |
| Bachelor's Degree | 0 (0.0%) | 0.0 |
| Graduate Degree | 0 (0.0%) | 0.0 |
| Total | 0 (0.0%) | 0.0 |
Fertility by Education by Marriage Status in Wolfeboro
| Educational Attainment | Married | Unmarried |
| Less than High School | 0 (0.0%) | 0 (0.0%) |
| High School Diploma | 0 (0.0%) | 0 (0.0%) |
| College or Associate's Degree | 0 (0.0%) | 0 (0.0%) |
| Bachelor's Degree | 0 (0.0%) | 0 (0.0%) |
| Graduate Degree | 0 (0.0%) | 0 (0.0%) |
| Total | 0 (0.0%) | 0 (0.0%) |
Employment Characteristics in Wolfeboro
Employment by Class of Employer in Wolfeboro
Among the 997 employed individuals in Wolfeboro, private company employees (527 | 52.9%), local government employees (168 | 16.9%), and self-employed (not incorporated) (125 | 12.5%) make up the most common classes of employment.
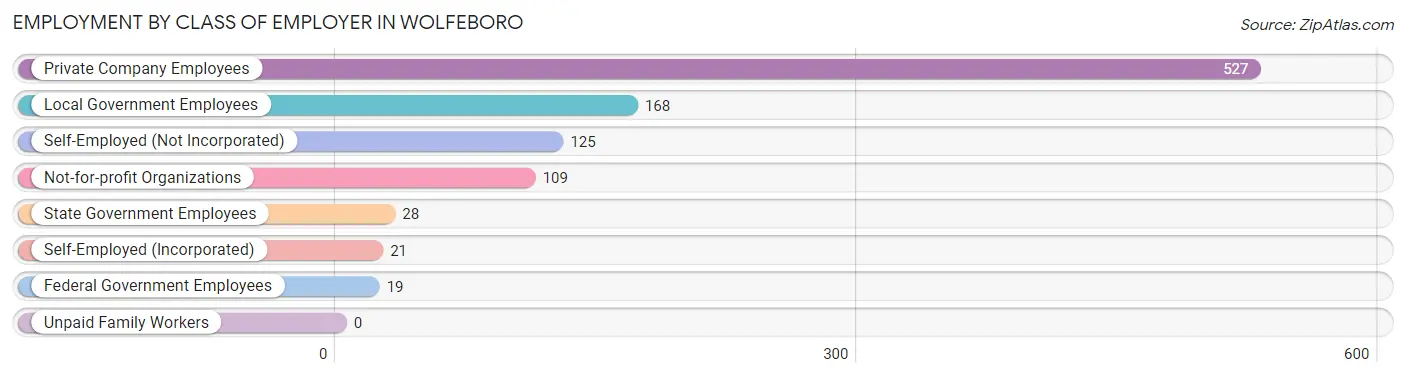
| Employer Class | # Employees | % Employees |
| Private Company Employees | 527 | 52.9% |
| Self-Employed (Incorporated) | 21 | 2.1% |
| Self-Employed (Not Incorporated) | 125 | 12.5% |
| Not-for-profit Organizations | 109 | 10.9% |
| Local Government Employees | 168 | 16.9% |
| State Government Employees | 28 | 2.8% |
| Federal Government Employees | 19 | 1.9% |
| Unpaid Family Workers | 0 | 0.0% |
| Total | 997 | 100.0% |
Employment Status by Age in Wolfeboro
According to the labor force statistics for Wolfeboro, out of the total population over 16 years of age (2,581), 38.9% or 1,004 individuals are in the labor force, with 0.2% or 2 of them unemployed. The age group with the highest labor force participation rate is 20 to 24 years, with 100.0% or 17 individuals in the labor force. Within the labor force, the 65 to 74 years age range has the highest percentage of unemployed individuals, with 1.7% or 2 of them being unemployed.
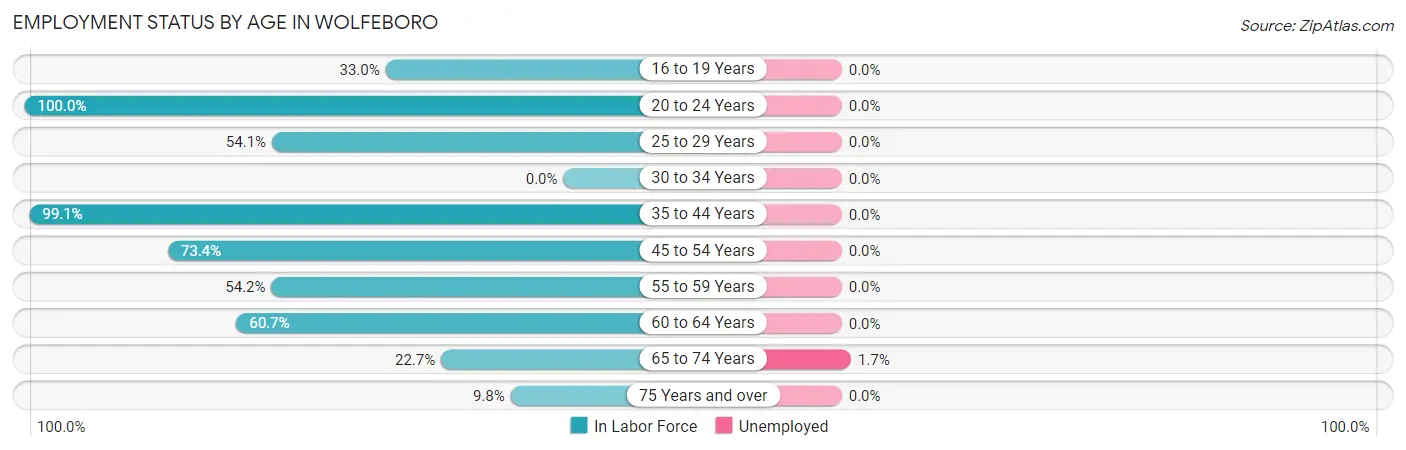
| Age Bracket | In Labor Force | Unemployed |
| 16 to 19 Years | 59 (33.0%) | 0 (0.0%) |
| 20 to 24 Years | 17 (100.0%) | 0 (0.0%) |
| 25 to 29 Years | 20 (54.1%) | 0 (0.0%) |
| 30 to 34 Years | 0 (0.0%) | 0 (0.0%) |
| 35 to 44 Years | 231 (99.1%) | 0 (0.0%) |
| 45 to 54 Years | 177 (73.4%) | 0 (0.0%) |
| 55 to 59 Years | 220 (54.2%) | 0 (0.0%) |
| 60 to 64 Years | 82 (60.7%) | 0 (0.0%) |
| 65 to 74 Years | 121 (22.7%) | 2 (1.7%) |
| 75 Years and over | 77 (9.8%) | 0 (0.0%) |
| Total | 1,004 (38.9%) | 2 (0.2%) |
Employment Status by Educational Attainment in Wolfeboro
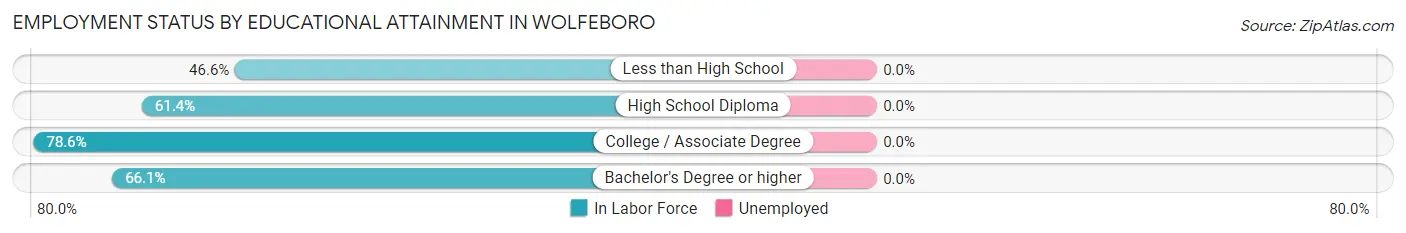
| Educational Attainment | In Labor Force | Unemployed |
| Less than High School | 61 (46.6%) | 0 (0.0%) |
| High School Diploma | 51 (61.4%) | 0 (0.0%) |
| College / Associate Degree | 359 (78.6%) | 0 (0.0%) |
| Bachelor's Degree or higher | 259 (66.1%) | 0 (0.0%) |
| Total | 730 (68.7%) | 0 (0.0%) |
Employment Occupations by Sex in Wolfeboro
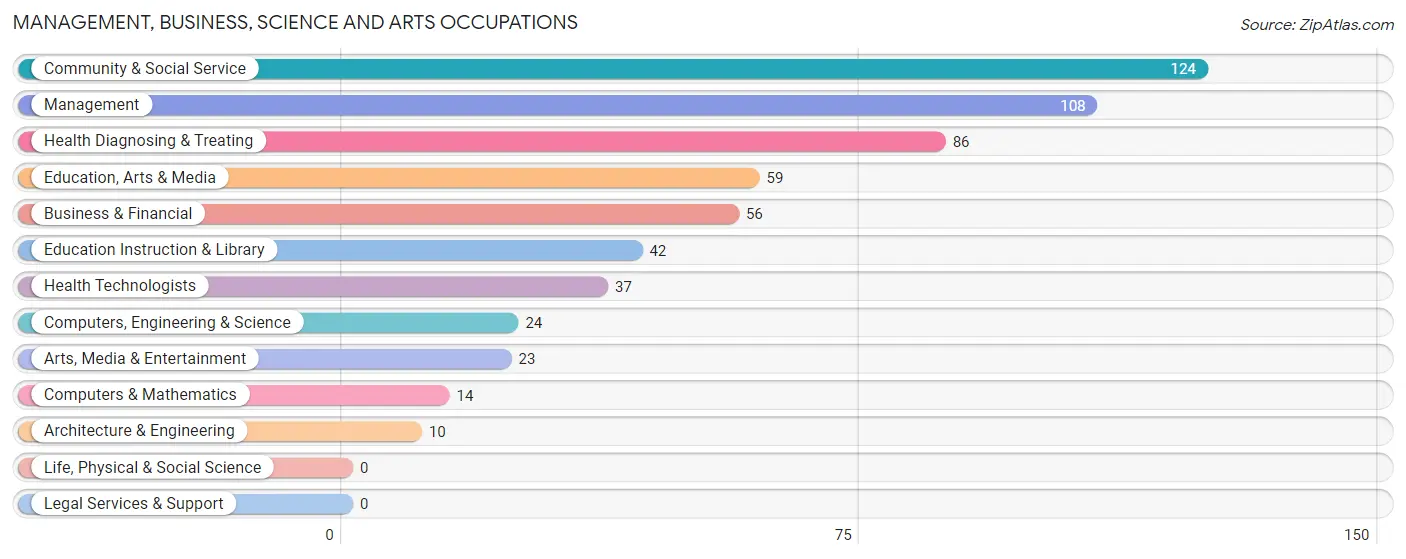
Management, Business, Science and Arts Occupations
The most common Management, Business, Science and Arts occupations in Wolfeboro are Community & Social Service (124 | 12.4%), Management (108 | 10.8%), Health Diagnosing & Treating (86 | 8.6%), Education, Arts & Media (59 | 5.9%), and Business & Financial (56 | 5.6%).
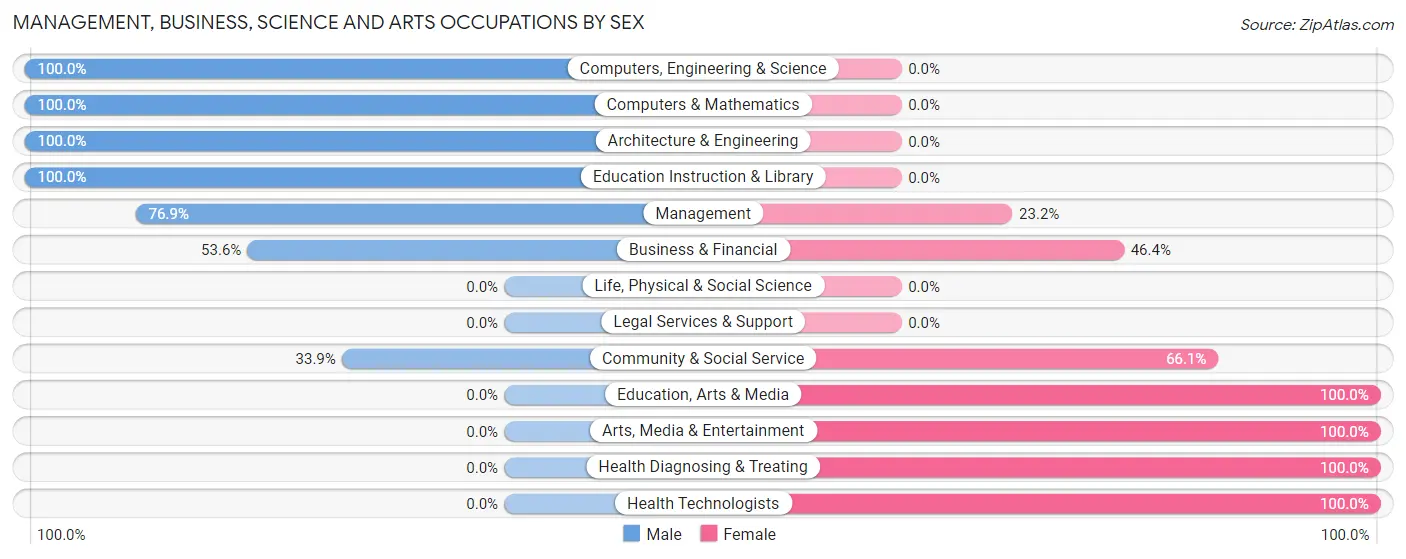
Management, Business, Science and Arts Occupations by Sex
Within the Management, Business, Science and Arts occupations in Wolfeboro, the most male-oriented occupations are Computers, Engineering & Science (100.0%), Computers & Mathematics (100.0%), and Architecture & Engineering (100.0%), while the most female-oriented occupations are Education, Arts & Media (100.0%), Arts, Media & Entertainment (100.0%), and Health Diagnosing & Treating (100.0%).
| Occupation | Male | Female |
| Management | 83 (76.8%) | 25 (23.2%) |
| Business & Financial | 30 (53.6%) | 26 (46.4%) |
| Computers, Engineering & Science | 24 (100.0%) | 0 (0.0%) |
| Computers & Mathematics | 14 (100.0%) | 0 (0.0%) |
| Architecture & Engineering | 10 (100.0%) | 0 (0.0%) |
| Life, Physical & Social Science | 0 (0.0%) | 0 (0.0%) |
| Community & Social Service | 42 (33.9%) | 82 (66.1%) |
| Education, Arts & Media | 0 (0.0%) | 59 (100.0%) |
| Legal Services & Support | 0 (0.0%) | 0 (0.0%) |
| Education Instruction & Library | 42 (100.0%) | 0 (0.0%) |
| Arts, Media & Entertainment | 0 (0.0%) | 23 (100.0%) |
| Health Diagnosing & Treating | 0 (0.0%) | 86 (100.0%) |
| Health Technologists | 0 (0.0%) | 37 (100.0%) |
| Total (Category) | 179 (45.0%) | 219 (55.0%) |
| Total (Overall) | 523 (52.2%) | 479 (47.8%) |
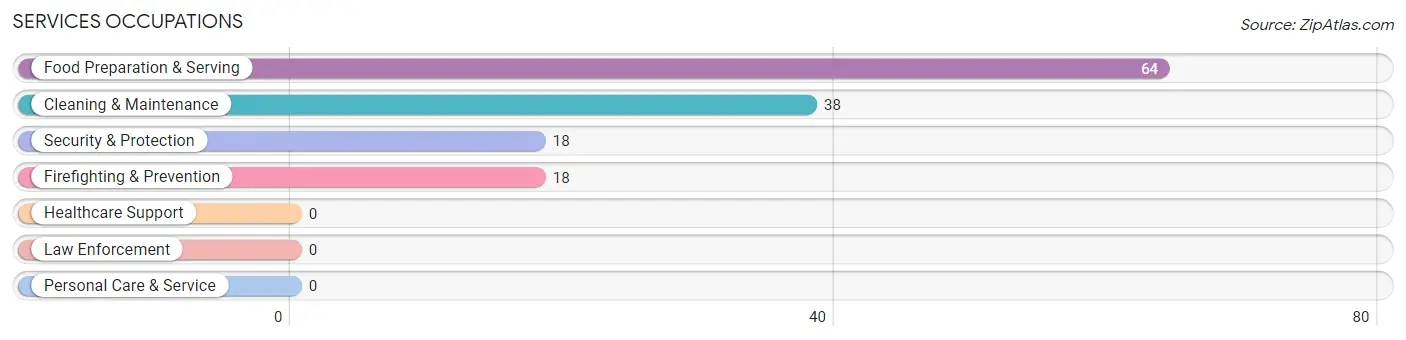
Services Occupations
The most common Services occupations in Wolfeboro are Food Preparation & Serving (64 | 6.4%), Cleaning & Maintenance (38 | 3.8%), Security & Protection (18 | 1.8%), and Firefighting & Prevention (18 | 1.8%).
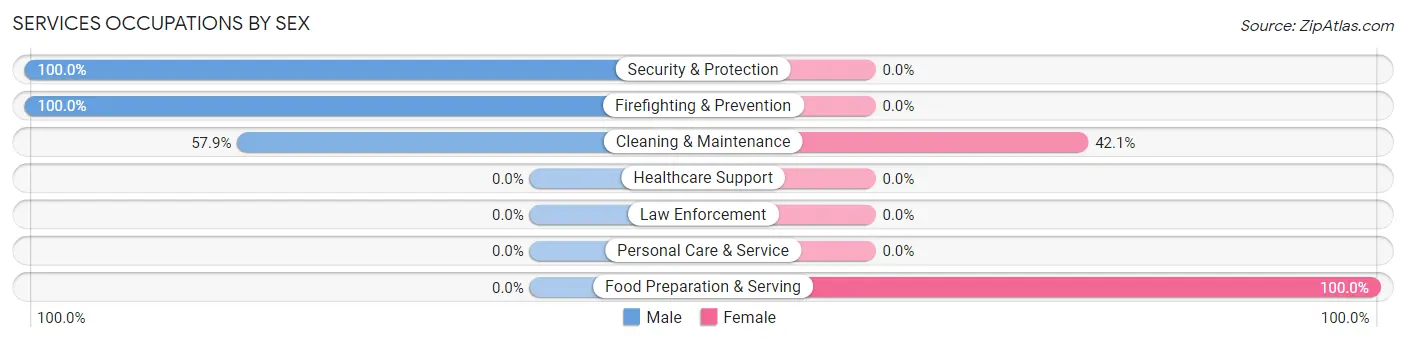
Services Occupations by Sex
Within the Services occupations in Wolfeboro, the most male-oriented occupations are Security & Protection (100.0%), Firefighting & Prevention (100.0%), and Cleaning & Maintenance (57.9%), while the most female-oriented occupations are Food Preparation & Serving (100.0%), and Cleaning & Maintenance (42.1%).
| Occupation | Male | Female |
| Healthcare Support | 0 (0.0%) | 0 (0.0%) |
| Security & Protection | 18 (100.0%) | 0 (0.0%) |
| Firefighting & Prevention | 18 (100.0%) | 0 (0.0%) |
| Law Enforcement | 0 (0.0%) | 0 (0.0%) |
| Food Preparation & Serving | 0 (0.0%) | 64 (100.0%) |
| Cleaning & Maintenance | 22 (57.9%) | 16 (42.1%) |
| Personal Care & Service | 0 (0.0%) | 0 (0.0%) |
| Total (Category) | 40 (33.3%) | 80 (66.7%) |
| Total (Overall) | 523 (52.2%) | 479 (47.8%) |
Sales and Office Occupations
The most common Sales and Office occupations in Wolfeboro are Sales & Related (119 | 11.9%), and Office & Administration (99 | 9.9%).
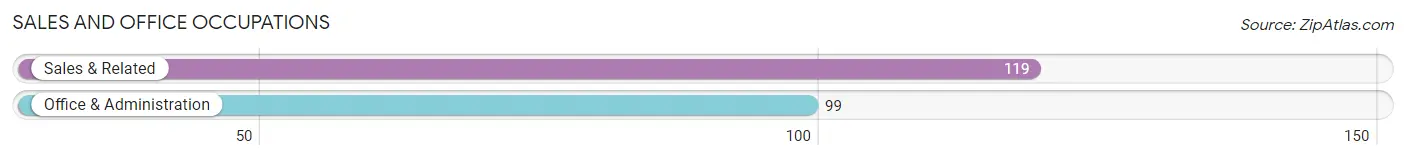
Sales and Office Occupations by Sex
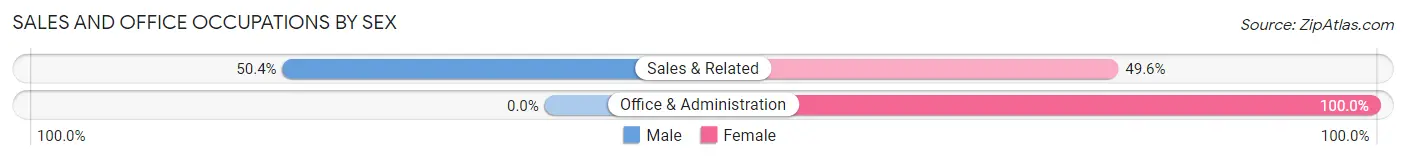
| Occupation | Male | Female |
| Sales & Related | 60 (50.4%) | 59 (49.6%) |
| Office & Administration | 0 (0.0%) | 99 (100.0%) |
| Total (Category) | 60 (27.5%) | 158 (72.5%) |
| Total (Overall) | 523 (52.2%) | 479 (47.8%) |
Natural Resources, Construction and Maintenance Occupations
The most common Natural Resources, Construction and Maintenance occupations in Wolfeboro are Construction & Extraction (122 | 12.2%), and Installation, Maintenance & Repair (23 | 2.3%).
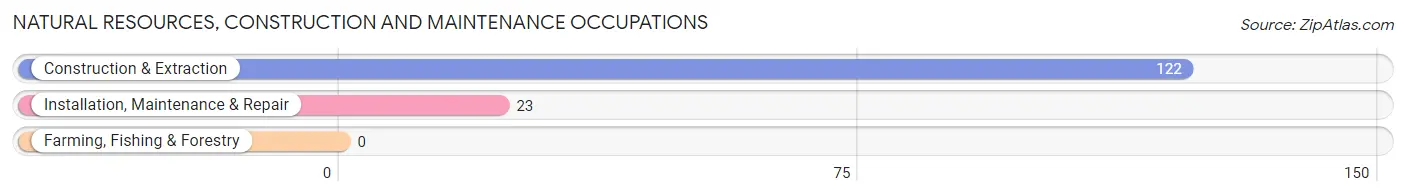
Natural Resources, Construction and Maintenance Occupations by Sex
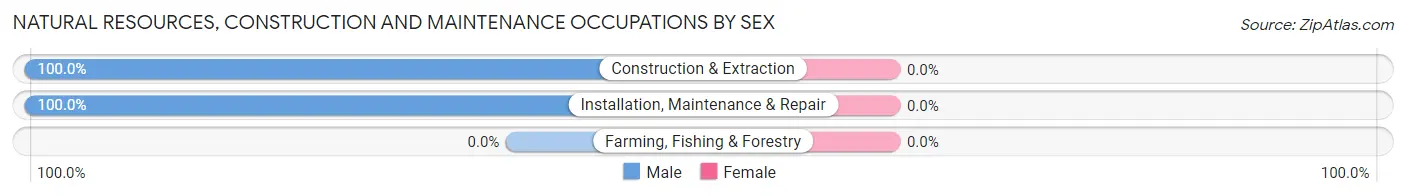
| Occupation | Male | Female |
| Farming, Fishing & Forestry | 0 (0.0%) | 0 (0.0%) |
| Construction & Extraction | 122 (100.0%) | 0 (0.0%) |
| Installation, Maintenance & Repair | 23 (100.0%) | 0 (0.0%) |
| Total (Category) | 145 (100.0%) | 0 (0.0%) |
| Total (Overall) | 523 (52.2%) | 479 (47.8%) |
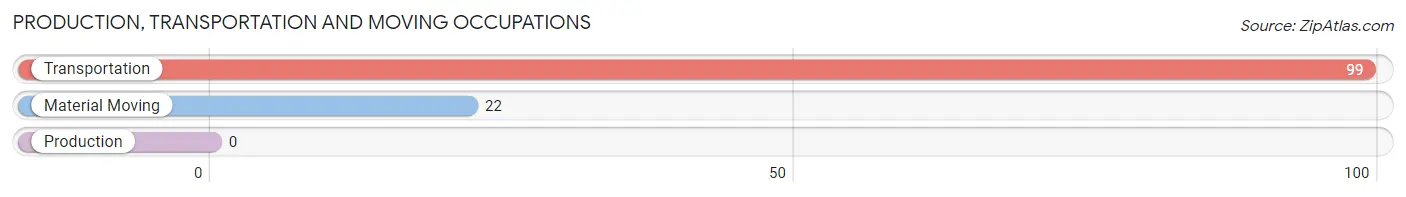
Production, Transportation and Moving Occupations
The most common Production, Transportation and Moving occupations in Wolfeboro are Transportation (99 | 9.9%), and Material Moving (22 | 2.2%).
Production, Transportation and Moving Occupations by Sex
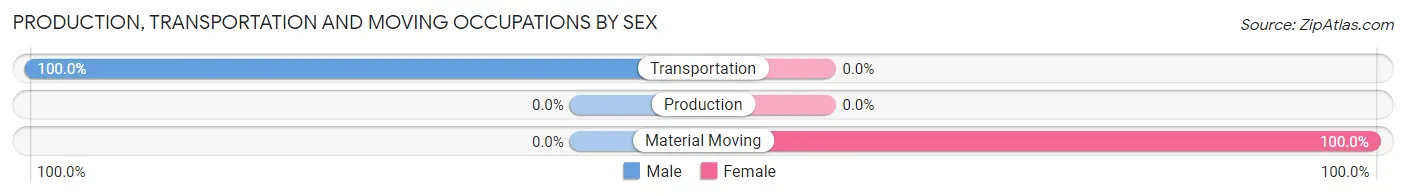
| Occupation | Male | Female |
| Production | 0 (0.0%) | 0 (0.0%) |
| Transportation | 99 (100.0%) | 0 (0.0%) |
| Material Moving | 0 (0.0%) | 22 (100.0%) |
| Total (Category) | 99 (81.8%) | 22 (18.2%) |
| Total (Overall) | 523 (52.2%) | 479 (47.8%) |
Employment Industries by Sex in Wolfeboro
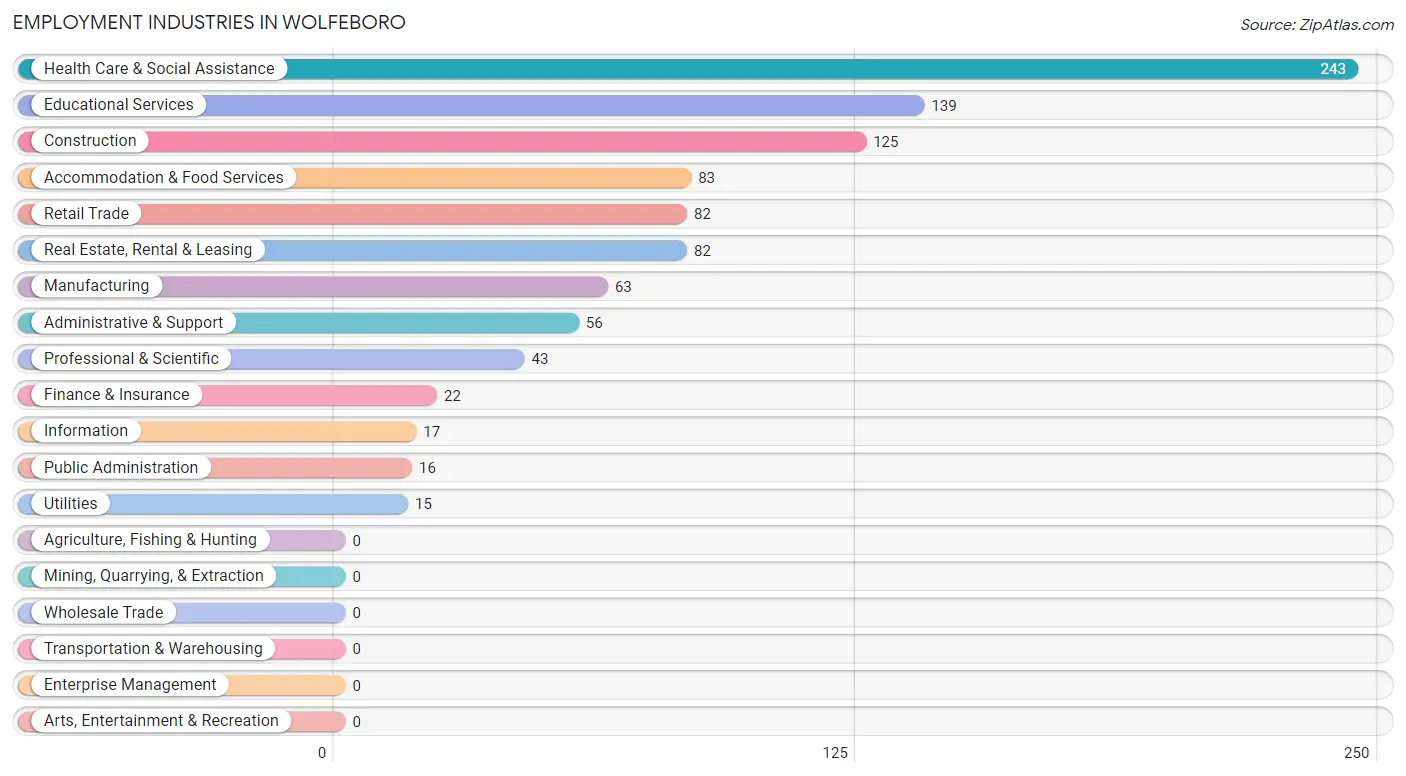
Employment Industries in Wolfeboro
The major employment industries in Wolfeboro include Health Care & Social Assistance (243 | 24.2%), Educational Services (139 | 13.9%), Construction (125 | 12.5%), Accommodation & Food Services (83 | 8.3%), and Retail Trade (82 | 8.2%).
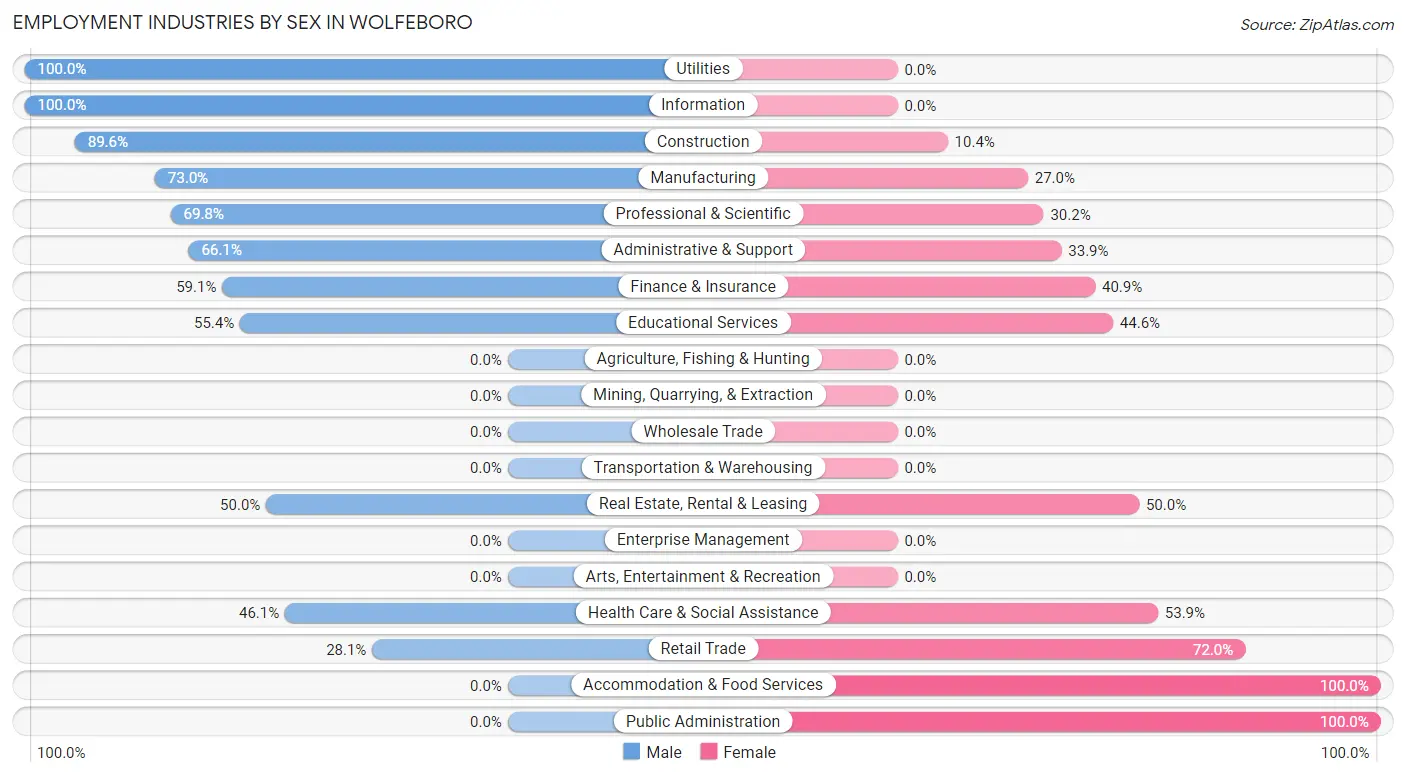
Employment Industries by Sex in Wolfeboro
The Wolfeboro industries that see more men than women are Utilities (100.0%), Information (100.0%), and Construction (89.6%), whereas the industries that tend to have a higher number of women are Accommodation & Food Services (100.0%), Public Administration (100.0%), and Retail Trade (72.0%).
| Industry | Male | Female |
| Agriculture, Fishing & Hunting | 0 (0.0%) | 0 (0.0%) |
| Mining, Quarrying, & Extraction | 0 (0.0%) | 0 (0.0%) |
| Construction | 112 (89.6%) | 13 (10.4%) |
| Manufacturing | 46 (73.0%) | 17 (27.0%) |
| Wholesale Trade | 0 (0.0%) | 0 (0.0%) |
| Retail Trade | 23 (28.1%) | 59 (72.0%) |
| Transportation & Warehousing | 0 (0.0%) | 0 (0.0%) |
| Utilities | 15 (100.0%) | 0 (0.0%) |
| Information | 17 (100.0%) | 0 (0.0%) |
| Finance & Insurance | 13 (59.1%) | 9 (40.9%) |
| Real Estate, Rental & Leasing | 41 (50.0%) | 41 (50.0%) |
| Professional & Scientific | 30 (69.8%) | 13 (30.2%) |
| Enterprise Management | 0 (0.0%) | 0 (0.0%) |
| Administrative & Support | 37 (66.1%) | 19 (33.9%) |
| Educational Services | 77 (55.4%) | 62 (44.6%) |
| Health Care & Social Assistance | 112 (46.1%) | 131 (53.9%) |
| Arts, Entertainment & Recreation | 0 (0.0%) | 0 (0.0%) |
| Accommodation & Food Services | 0 (0.0%) | 83 (100.0%) |
| Public Administration | 0 (0.0%) | 16 (100.0%) |
| Total | 523 (52.2%) | 479 (47.8%) |
Education in Wolfeboro
School Enrollment in Wolfeboro
The most common levels of schooling among the 502 students in Wolfeboro are high school (207 | 41.2%), college / undergraduate (113 | 22.5%), and elementary school (89 | 17.7%).
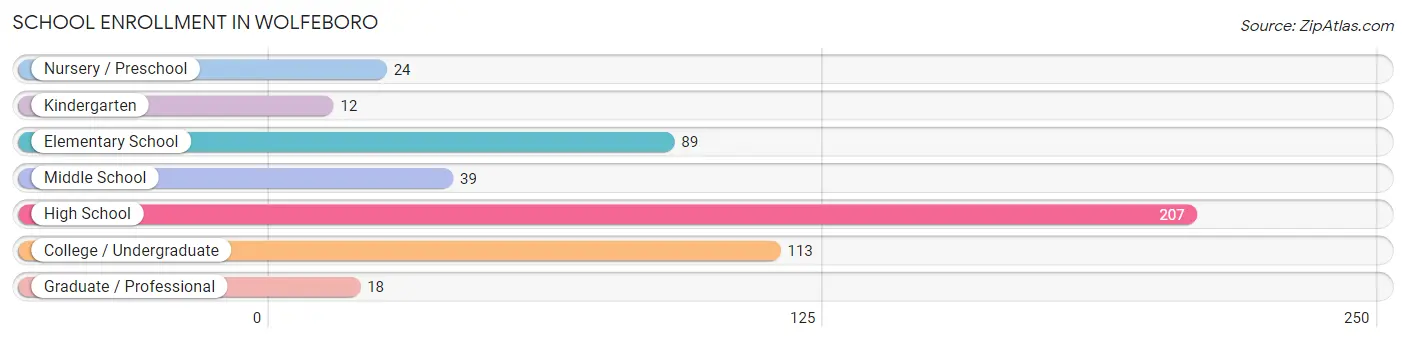
| School Level | # Students | % Students |
| Nursery / Preschool | 24 | 4.8% |
| Kindergarten | 12 | 2.4% |
| Elementary School | 89 | 17.7% |
| Middle School | 39 | 7.8% |
| High School | 207 | 41.2% |
| College / Undergraduate | 113 | 22.5% |
| Graduate / Professional | 18 | 3.6% |
| Total | 502 | 100.0% |
School Enrollment by Age by Funding Source in Wolfeboro
Out of a total of 502 students who are enrolled in schools in Wolfeboro, 115 (22.9%) attend a private institution, while the remaining 387 (77.1%) are enrolled in public schools. The age group of 3 to 4 year olds has the highest likelihood of being enrolled in private schools, with 24 (100.0% in the age bracket) enrolled. Conversely, the age group of 5 to 9 year old has the lowest likelihood of being enrolled in a private school, with 101 (100.0% in the age bracket) attending a public institution.
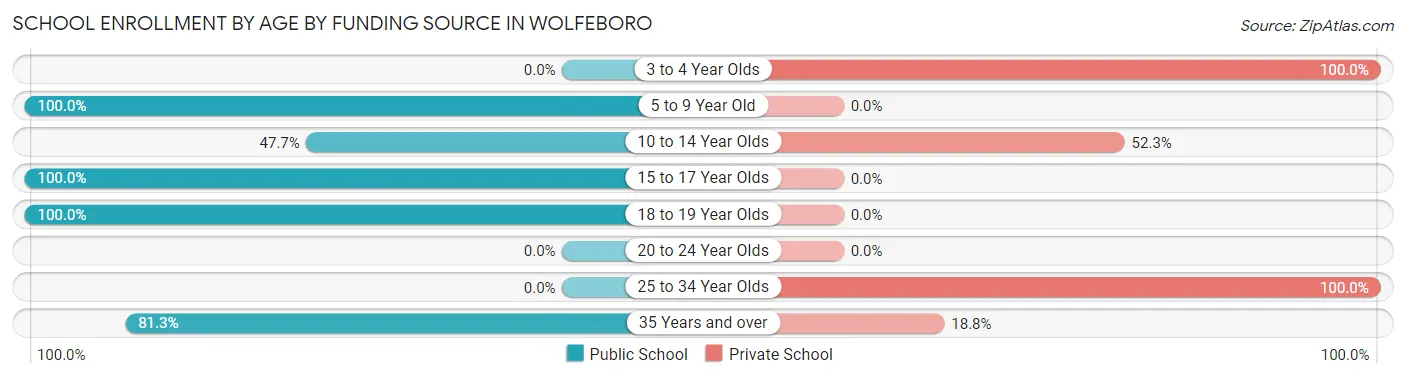
| Age Bracket | Public School | Private School |
| 3 to 4 Year Olds | 0 (0.0%) | 24 (100.0%) |
| 5 to 9 Year Old | 101 (100.0%) | 0 (0.0%) |
| 10 to 14 Year Olds | 51 (47.7%) | 56 (52.3%) |
| 15 to 17 Year Olds | 102 (100.0%) | 0 (0.0%) |
| 18 to 19 Year Olds | 55 (100.0%) | 0 (0.0%) |
| 20 to 24 Year Olds | 0 (0.0%) | 0 (0.0%) |
| 25 to 34 Year Olds | 0 (0.0%) | 17 (100.0%) |
| 35 Years and over | 78 (81.2%) | 18 (18.8%) |
| Total | 387 (77.1%) | 115 (22.9%) |
Educational Attainment by Field of Study in Wolfeboro
Literature & languages (235 | 24.3%), business (230 | 23.8%), education (129 | 13.3%), science & technology (73 | 7.5%), and visual & performing arts (65 | 6.7%) are the most common fields of study among 967 individuals in Wolfeboro who have obtained a bachelor's degree or higher.
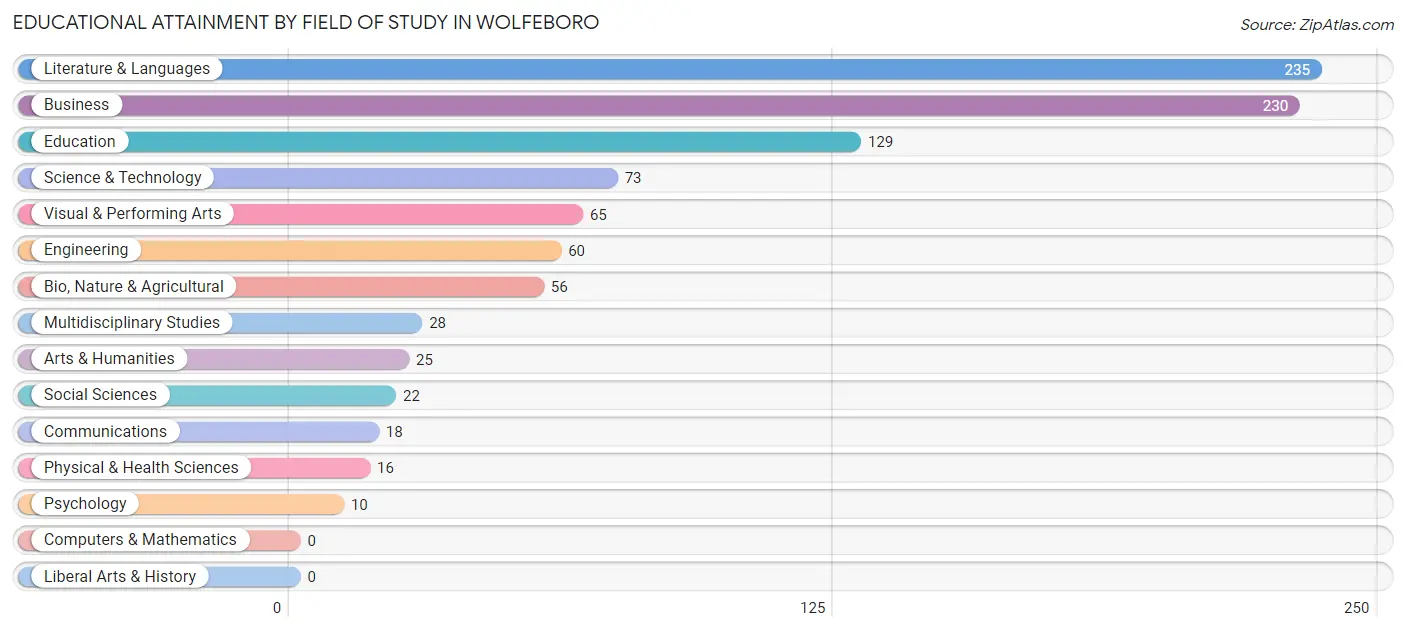
| Field of Study | # Graduates | % Graduates |
| Computers & Mathematics | 0 | 0.0% |
| Bio, Nature & Agricultural | 56 | 5.8% |
| Physical & Health Sciences | 16 | 1.7% |
| Psychology | 10 | 1.0% |
| Social Sciences | 22 | 2.3% |
| Engineering | 60 | 6.2% |
| Multidisciplinary Studies | 28 | 2.9% |
| Science & Technology | 73 | 7.5% |
| Business | 230 | 23.8% |
| Education | 129 | 13.3% |
| Literature & Languages | 235 | 24.3% |
| Liberal Arts & History | 0 | 0.0% |
| Visual & Performing Arts | 65 | 6.7% |
| Communications | 18 | 1.9% |
| Arts & Humanities | 25 | 2.6% |
| Total | 967 | 100.0% |
Transportation & Commute in Wolfeboro
Vehicle Availability by Sex in Wolfeboro
The most prevalent vehicle ownership categories in Wolfeboro are males with 2 vehicles (287, accounting for 55.4%) and females with 2 vehicles (132, making up 59.9%).
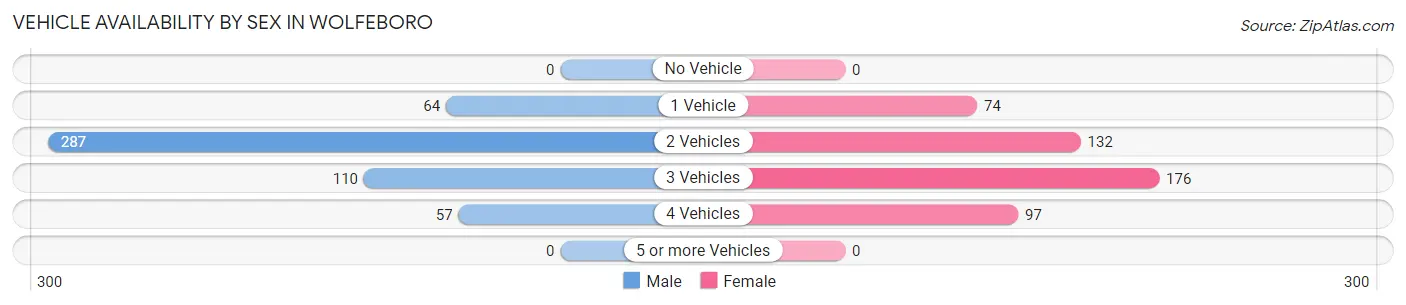
| Vehicles Available | Male | Female |
| No Vehicle | 0 (0.0%) | 0 (0.0%) |
| 1 Vehicle | 64 (12.4%) | 74 (15.4%) |
| 2 Vehicles | 287 (55.4%) | 132 (27.6%) |
| 3 Vehicles | 110 (21.2%) | 176 (36.7%) |
| 4 Vehicles | 57 (11.0%) | 97 (20.3%) |
| 5 or more Vehicles | 0 (0.0%) | 0 (0.0%) |
| Total | 518 (100.0%) | 479 (100.0%) |
Commute Time in Wolfeboro
The most frequently occuring commute durations in Wolfeboro are 60 to 89 minutes (141 commuters, 15.0%), 25 to 29 minutes (133 commuters, 14.1%), and less than 5 minutes (131 commuters, 13.9%).
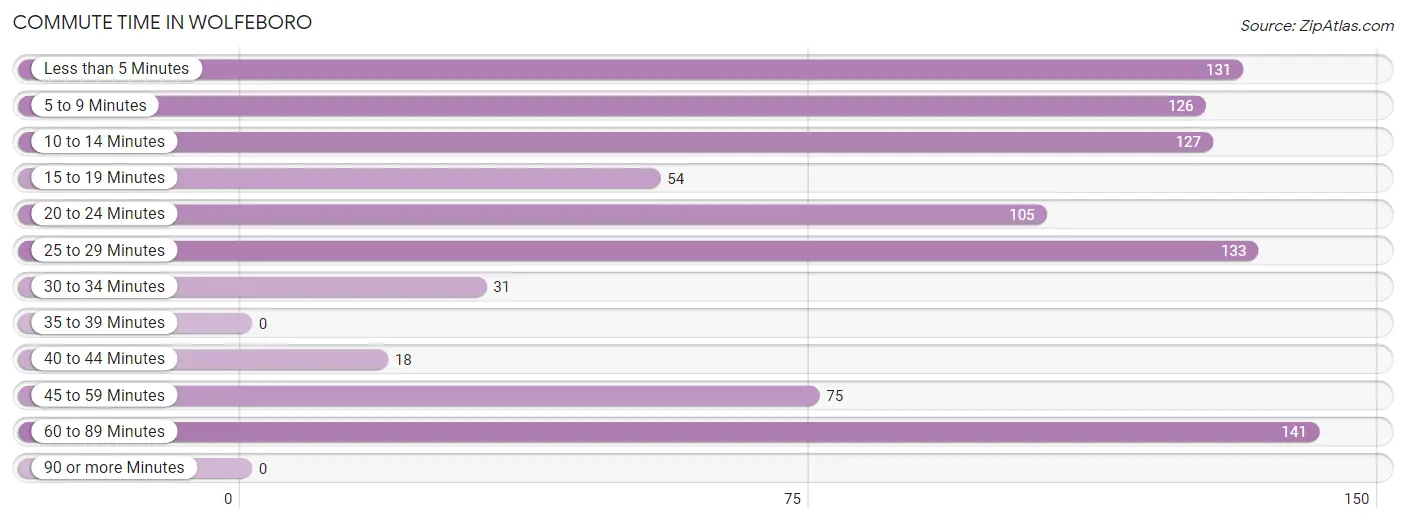
| Commute Time | # Commuters | % Commuters |
| Less than 5 Minutes | 131 | 13.9% |
| 5 to 9 Minutes | 126 | 13.4% |
| 10 to 14 Minutes | 127 | 13.5% |
| 15 to 19 Minutes | 54 | 5.7% |
| 20 to 24 Minutes | 105 | 11.2% |
| 25 to 29 Minutes | 133 | 14.1% |
| 30 to 34 Minutes | 31 | 3.3% |
| 35 to 39 Minutes | 0 | 0.0% |
| 40 to 44 Minutes | 18 | 1.9% |
| 45 to 59 Minutes | 75 | 8.0% |
| 60 to 89 Minutes | 141 | 15.0% |
| 90 or more Minutes | 0 | 0.0% |
Commute Time by Sex in Wolfeboro
The most common commute times in Wolfeboro are 10 to 14 minutes (95 commuters, 20.0%) for males and less than 5 minutes (104 commuters, 22.3%) for females.
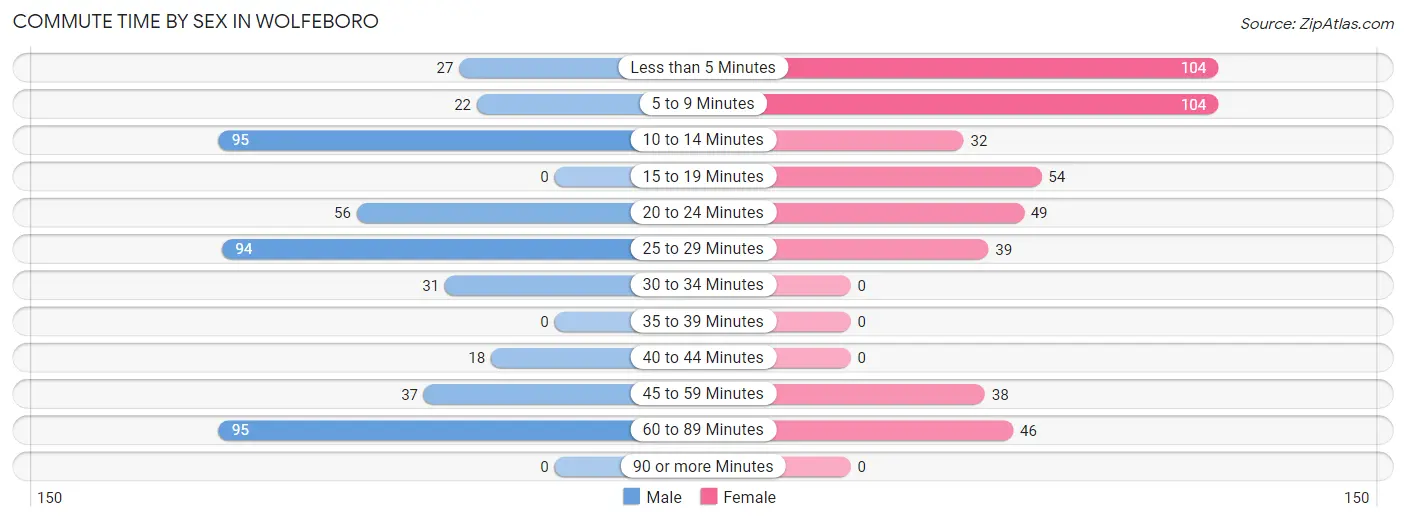
| Commute Time | Male | Female |
| Less than 5 Minutes | 27 (5.7%) | 104 (22.3%) |
| 5 to 9 Minutes | 22 (4.6%) | 104 (22.3%) |
| 10 to 14 Minutes | 95 (20.0%) | 32 (6.9%) |
| 15 to 19 Minutes | 0 (0.0%) | 54 (11.6%) |
| 20 to 24 Minutes | 56 (11.8%) | 49 (10.5%) |
| 25 to 29 Minutes | 94 (19.8%) | 39 (8.4%) |
| 30 to 34 Minutes | 31 (6.5%) | 0 (0.0%) |
| 35 to 39 Minutes | 0 (0.0%) | 0 (0.0%) |
| 40 to 44 Minutes | 18 (3.8%) | 0 (0.0%) |
| 45 to 59 Minutes | 37 (7.8%) | 38 (8.2%) |
| 60 to 89 Minutes | 95 (20.0%) | 46 (9.9%) |
| 90 or more Minutes | 0 (0.0%) | 0 (0.0%) |
Time of Departure to Work by Sex in Wolfeboro
The most frequent times of departure to work in Wolfeboro are 8:00 AM to 8:29 AM (110, 23.2%) for males and 7:30 AM to 7:59 AM (155, 33.3%) for females.
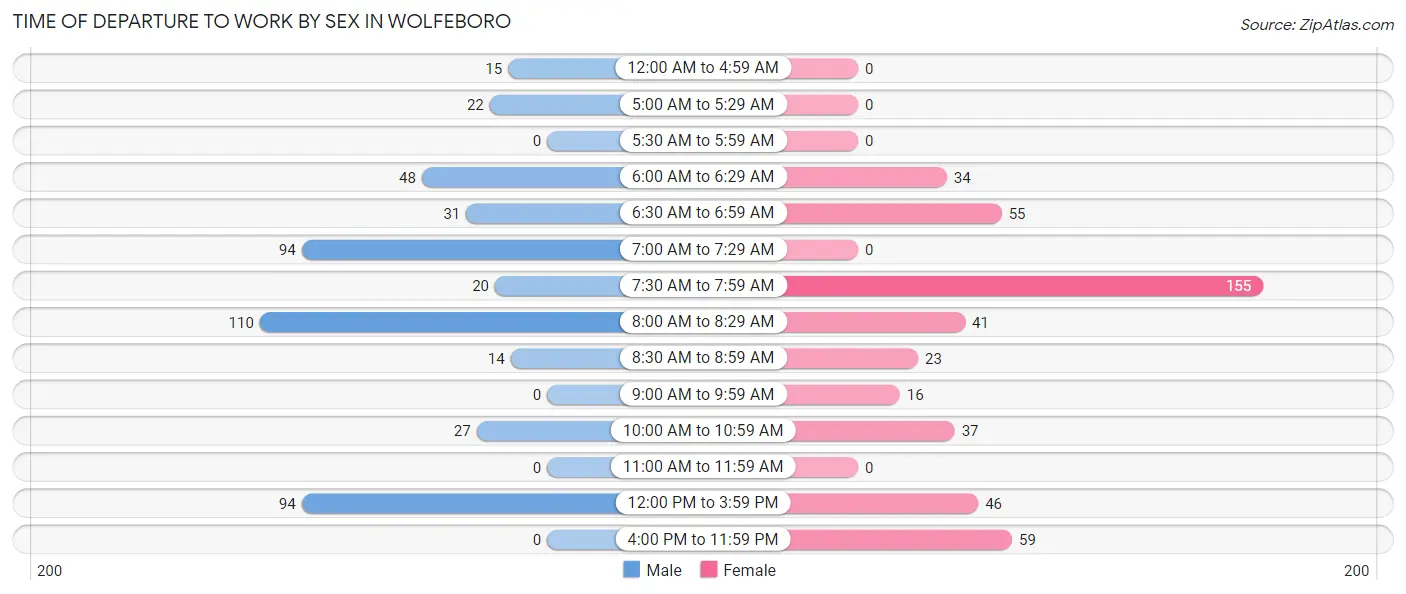
| Time of Departure | Male | Female |
| 12:00 AM to 4:59 AM | 15 (3.2%) | 0 (0.0%) |
| 5:00 AM to 5:29 AM | 22 (4.6%) | 0 (0.0%) |
| 5:30 AM to 5:59 AM | 0 (0.0%) | 0 (0.0%) |
| 6:00 AM to 6:29 AM | 48 (10.1%) | 34 (7.3%) |
| 6:30 AM to 6:59 AM | 31 (6.5%) | 55 (11.8%) |
| 7:00 AM to 7:29 AM | 94 (19.8%) | 0 (0.0%) |
| 7:30 AM to 7:59 AM | 20 (4.2%) | 155 (33.3%) |
| 8:00 AM to 8:29 AM | 110 (23.2%) | 41 (8.8%) |
| 8:30 AM to 8:59 AM | 14 (2.9%) | 23 (4.9%) |
| 9:00 AM to 9:59 AM | 0 (0.0%) | 16 (3.4%) |
| 10:00 AM to 10:59 AM | 27 (5.7%) | 37 (7.9%) |
| 11:00 AM to 11:59 AM | 0 (0.0%) | 0 (0.0%) |
| 12:00 PM to 3:59 PM | 94 (19.8%) | 46 (9.9%) |
| 4:00 PM to 11:59 PM | 0 (0.0%) | 59 (12.7%) |
| Total | 475 (100.0%) | 466 (100.0%) |
Housing Occupancy in Wolfeboro
Occupancy by Ownership in Wolfeboro
Of the total 1,370 dwellings in Wolfeboro, owner-occupied units account for 1,120 (81.8%), while renter-occupied units make up 250 (18.2%).
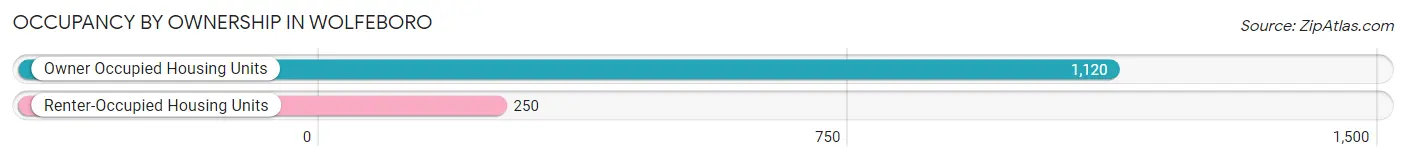
| Occupancy | # Housing Units | % Housing Units |
| Owner Occupied Housing Units | 1,120 | 81.8% |
| Renter-Occupied Housing Units | 250 | 18.2% |
| Total Occupied Housing Units | 1,370 | 100.0% |
Occupancy by Household Size in Wolfeboro
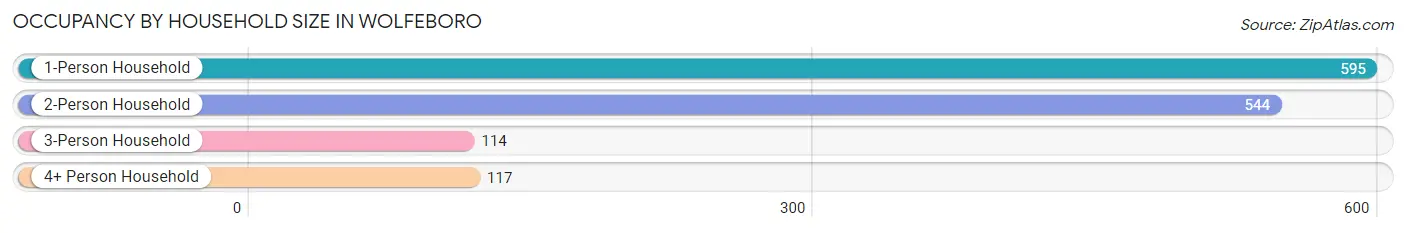
| Household Size | # Housing Units | % Housing Units |
| 1-Person Household | 595 | 43.4% |
| 2-Person Household | 544 | 39.7% |
| 3-Person Household | 114 | 8.3% |
| 4+ Person Household | 117 | 8.5% |
| Total Housing Units | 1,370 | 100.0% |
Occupancy by Ownership by Household Size in Wolfeboro
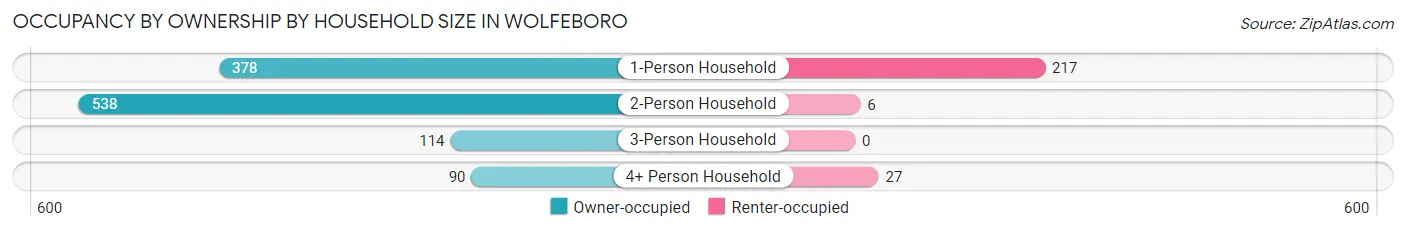
| Household Size | Owner-occupied | Renter-occupied |
| 1-Person Household | 378 (63.5%) | 217 (36.5%) |
| 2-Person Household | 538 (98.9%) | 6 (1.1%) |
| 3-Person Household | 114 (100.0%) | 0 (0.0%) |
| 4+ Person Household | 90 (76.9%) | 27 (23.1%) |
| Total Housing Units | 1,120 (81.8%) | 250 (18.2%) |
Occupancy by Educational Attainment in Wolfeboro
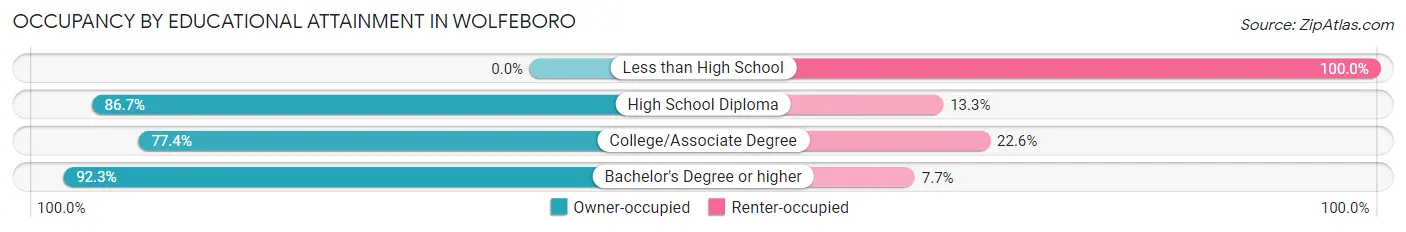
| Household Size | Owner-occupied | Renter-occupied |
| Less than High School | 0 (0.0%) | 70 (100.0%) |
| High School Diploma | 189 (86.7%) | 29 (13.3%) |
| College/Associate Degree | 353 (77.4%) | 103 (22.6%) |
| Bachelor's Degree or higher | 578 (92.3%) | 48 (7.7%) |
Occupancy by Age of Householder in Wolfeboro
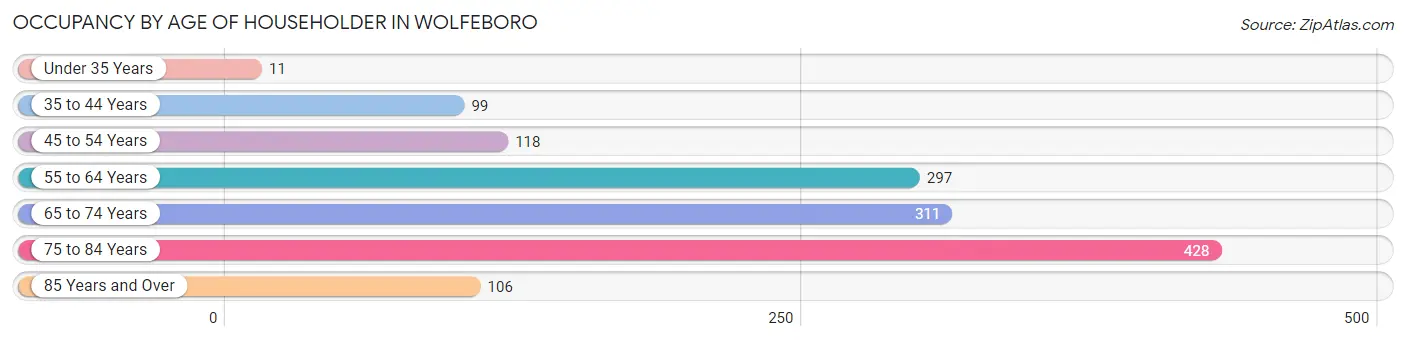
| Age Bracket | # Households | % Households |
| Under 35 Years | 11 | 0.8% |
| 35 to 44 Years | 99 | 7.2% |
| 45 to 54 Years | 118 | 8.6% |
| 55 to 64 Years | 297 | 21.7% |
| 65 to 74 Years | 311 | 22.7% |
| 75 to 84 Years | 428 | 31.2% |
| 85 Years and Over | 106 | 7.7% |
| Total | 1,370 | 100.0% |
Housing Finances in Wolfeboro
Median Income by Occupancy in Wolfeboro
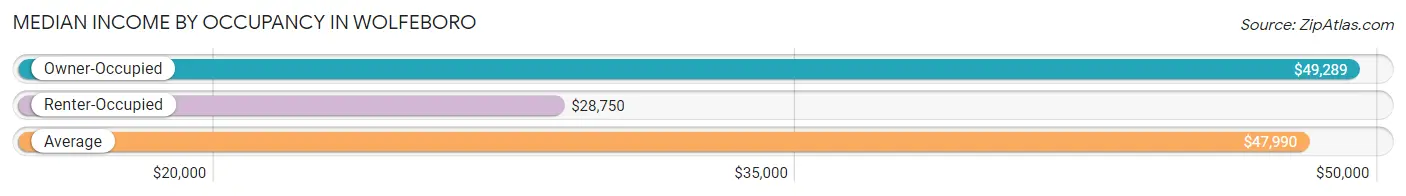
| Occupancy Type | # Households | Median Income |
| Owner-Occupied | 1,120 (81.8%) | $49,289 |
| Renter-Occupied | 250 (18.2%) | $28,750 |
| Average | 1,370 (100.0%) | $47,990 |
Occupancy by Householder Income Bracket in Wolfeboro
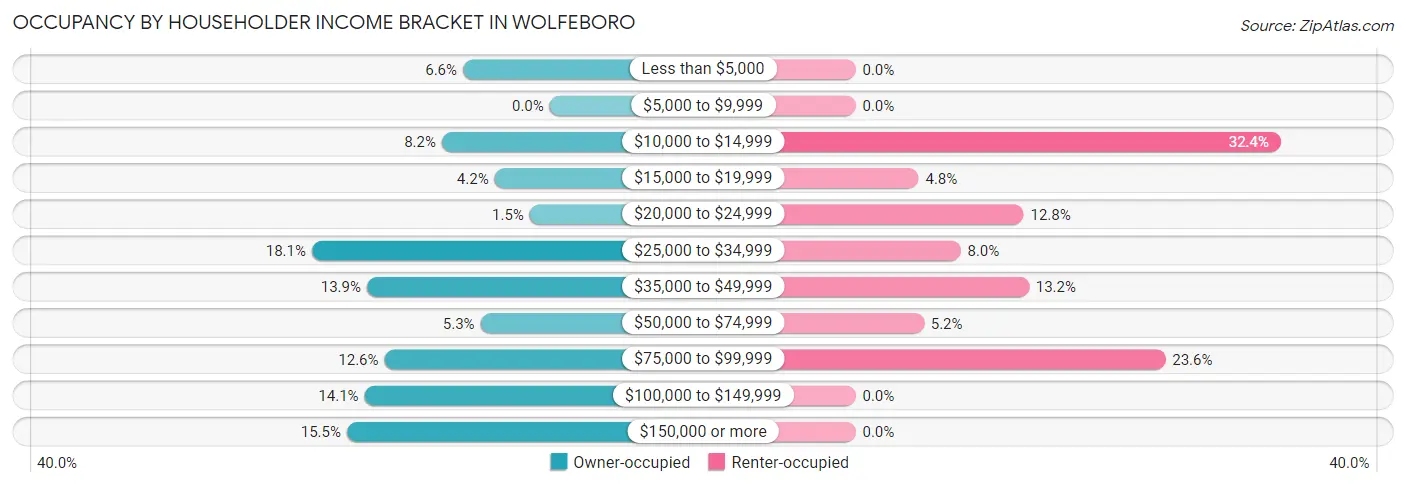
| Income Bracket | Owner-occupied | Renter-occupied |
| Less than $5,000 | 74 (6.6%) | 0 (0.0%) |
| $5,000 to $9,999 | 0 (0.0%) | 0 (0.0%) |
| $10,000 to $14,999 | 92 (8.2%) | 81 (32.4%) |
| $15,000 to $19,999 | 47 (4.2%) | 12 (4.8%) |
| $20,000 to $24,999 | 17 (1.5%) | 32 (12.8%) |
| $25,000 to $34,999 | 203 (18.1%) | 20 (8.0%) |
| $35,000 to $49,999 | 156 (13.9%) | 33 (13.2%) |
| $50,000 to $74,999 | 59 (5.3%) | 13 (5.2%) |
| $75,000 to $99,999 | 141 (12.6%) | 59 (23.6%) |
| $100,000 to $149,999 | 158 (14.1%) | 0 (0.0%) |
| $150,000 or more | 173 (15.4%) | 0 (0.0%) |
| Total | 1,120 (100.0%) | 250 (100.0%) |
Monthly Housing Cost Tiers in Wolfeboro
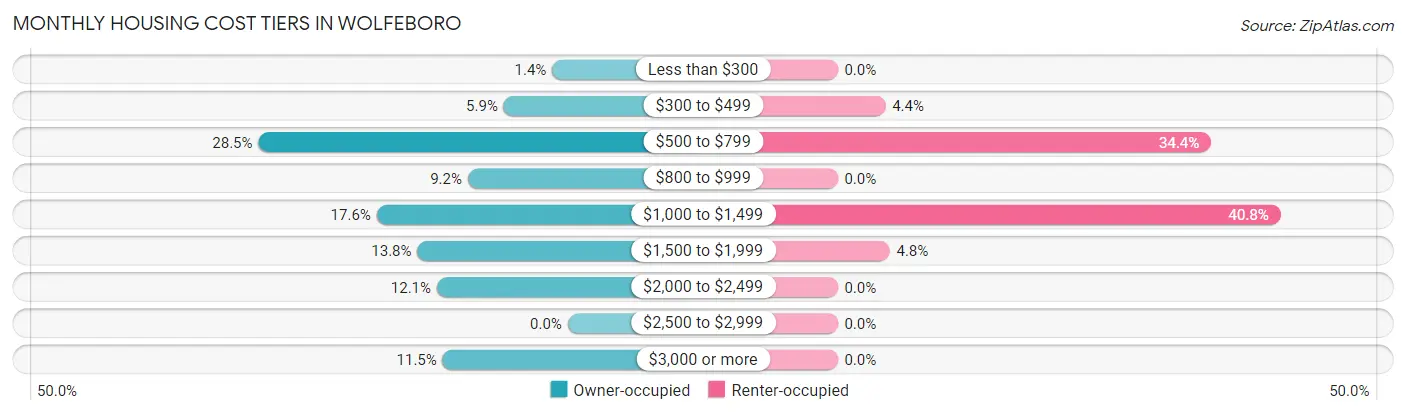
| Monthly Cost | Owner-occupied | Renter-occupied |
| Less than $300 | 16 (1.4%) | 0 (0.0%) |
| $300 to $499 | 66 (5.9%) | 11 (4.4%) |
| $500 to $799 | 319 (28.5%) | 86 (34.4%) |
| $800 to $999 | 103 (9.2%) | 0 (0.0%) |
| $1,000 to $1,499 | 197 (17.6%) | 102 (40.8%) |
| $1,500 to $1,999 | 155 (13.8%) | 12 (4.8%) |
| $2,000 to $2,499 | 135 (12.0%) | 0 (0.0%) |
| $2,500 to $2,999 | 0 (0.0%) | 0 (0.0%) |
| $3,000 or more | 129 (11.5%) | 0 (0.0%) |
| Total | 1,120 (100.0%) | 250 (100.0%) |
Physical Housing Characteristics in Wolfeboro
Housing Structures in Wolfeboro
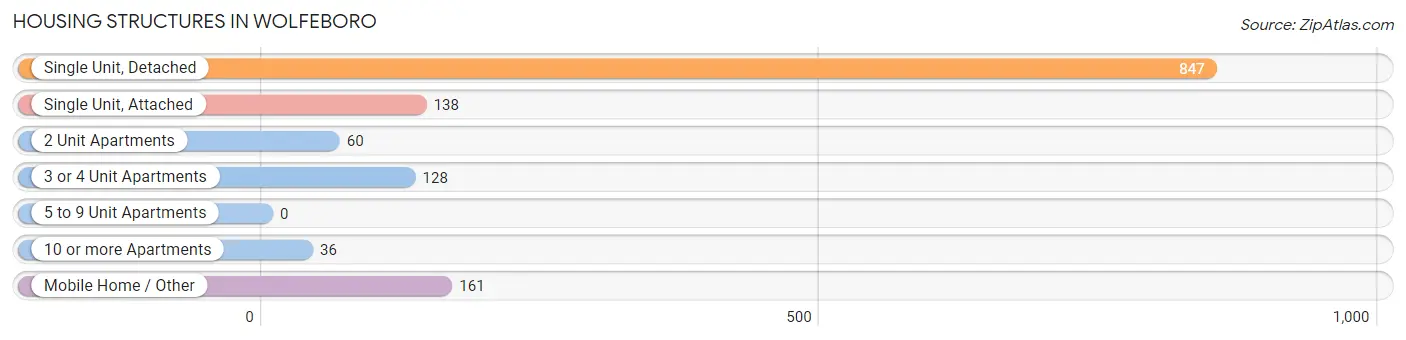
| Structure Type | # Housing Units | % Housing Units |
| Single Unit, Detached | 847 | 61.8% |
| Single Unit, Attached | 138 | 10.1% |
| 2 Unit Apartments | 60 | 4.4% |
| 3 or 4 Unit Apartments | 128 | 9.3% |
| 5 to 9 Unit Apartments | 0 | 0.0% |
| 10 or more Apartments | 36 | 2.6% |
| Mobile Home / Other | 161 | 11.7% |
| Total | 1,370 | 100.0% |
Housing Structures by Occupancy in Wolfeboro
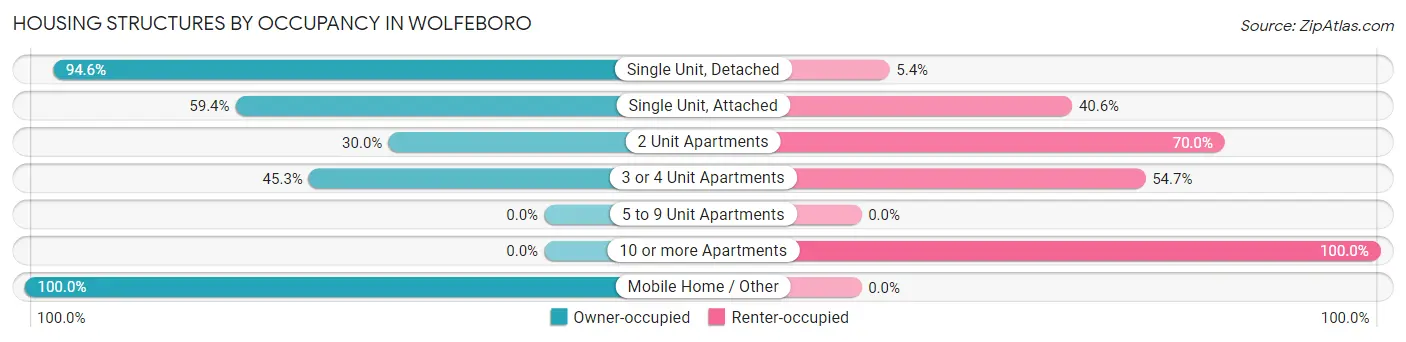
| Structure Type | Owner-occupied | Renter-occupied |
| Single Unit, Detached | 801 (94.6%) | 46 (5.4%) |
| Single Unit, Attached | 82 (59.4%) | 56 (40.6%) |
| 2 Unit Apartments | 18 (30.0%) | 42 (70.0%) |
| 3 or 4 Unit Apartments | 58 (45.3%) | 70 (54.7%) |
| 5 to 9 Unit Apartments | 0 (0.0%) | 0 (0.0%) |
| 10 or more Apartments | 0 (0.0%) | 36 (100.0%) |
| Mobile Home / Other | 161 (100.0%) | 0 (0.0%) |
| Total | 1,120 (81.8%) | 250 (18.2%) |
Housing Structures by Number of Rooms in Wolfeboro
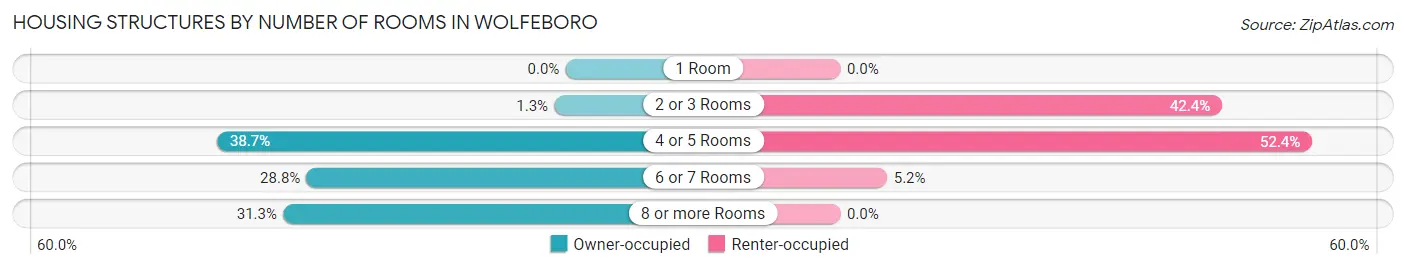
| Number of Rooms | Owner-occupied | Renter-occupied |
| 1 Room | 0 (0.0%) | 0 (0.0%) |
| 2 or 3 Rooms | 14 (1.3%) | 106 (42.4%) |
| 4 or 5 Rooms | 433 (38.7%) | 131 (52.4%) |
| 6 or 7 Rooms | 322 (28.7%) | 13 (5.2%) |
| 8 or more Rooms | 351 (31.3%) | 0 (0.0%) |
| Total | 1,120 (100.0%) | 250 (100.0%) |
Housing Structure by Heating Type in Wolfeboro
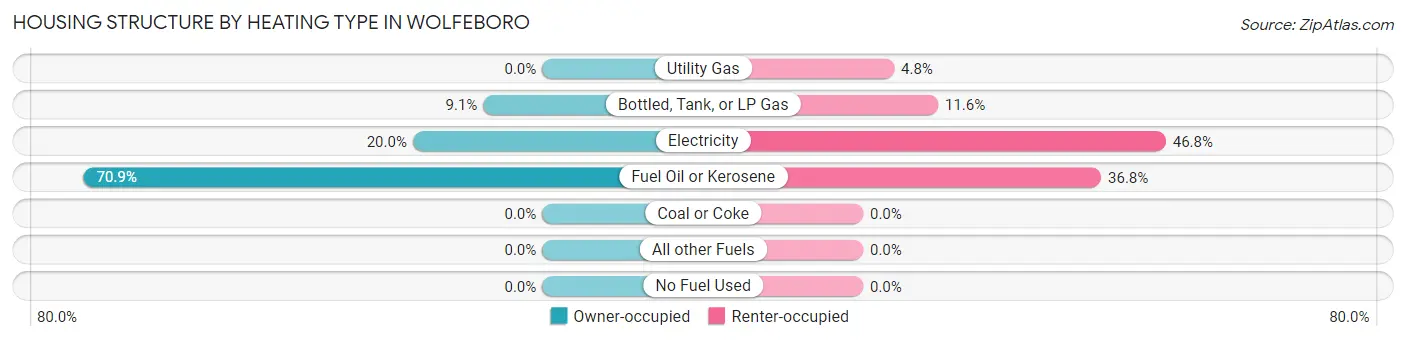
| Heating Type | Owner-occupied | Renter-occupied |
| Utility Gas | 0 (0.0%) | 12 (4.8%) |
| Bottled, Tank, or LP Gas | 102 (9.1%) | 29 (11.6%) |
| Electricity | 224 (20.0%) | 117 (46.8%) |
| Fuel Oil or Kerosene | 794 (70.9%) | 92 (36.8%) |
| Coal or Coke | 0 (0.0%) | 0 (0.0%) |
| All other Fuels | 0 (0.0%) | 0 (0.0%) |
| No Fuel Used | 0 (0.0%) | 0 (0.0%) |
| Total | 1,120 (100.0%) | 250 (100.0%) |
Household Vehicle Usage in Wolfeboro
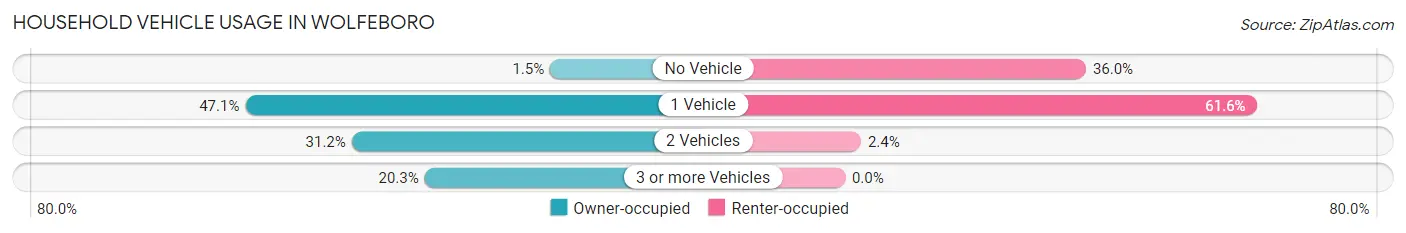
| Vehicles per Household | Owner-occupied | Renter-occupied |
| No Vehicle | 17 (1.5%) | 90 (36.0%) |
| 1 Vehicle | 527 (47.0%) | 154 (61.6%) |
| 2 Vehicles | 349 (31.2%) | 6 (2.4%) |
| 3 or more Vehicles | 227 (20.3%) | 0 (0.0%) |
| Total | 1,120 (100.0%) | 250 (100.0%) |
Real Estate & Mortgages in Wolfeboro
Real Estate and Mortgage Overview in Wolfeboro
| Characteristic | Without Mortgage | With Mortgage |
| Housing Units | 617 | 503 |
| Median Property Value | $276,900 | $449,700 |
| Median Household Income | $34,988 | $96 |
| Monthly Housing Costs | $657 | $129 |
| Real Estate Taxes | $2,691 | $0 |
Property Value by Mortgage Status in Wolfeboro
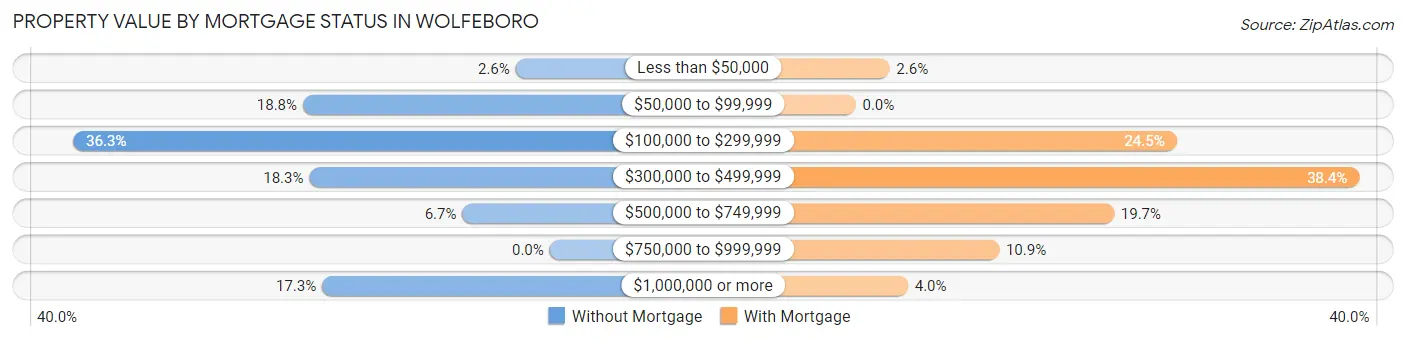
| Property Value | Without Mortgage | With Mortgage |
| Less than $50,000 | 16 (2.6%) | 13 (2.6%) |
| $50,000 to $99,999 | 116 (18.8%) | 0 (0.0%) |
| $100,000 to $299,999 | 224 (36.3%) | 123 (24.4%) |
| $300,000 to $499,999 | 113 (18.3%) | 193 (38.4%) |
| $500,000 to $749,999 | 41 (6.7%) | 99 (19.7%) |
| $750,000 to $999,999 | 0 (0.0%) | 55 (10.9%) |
| $1,000,000 or more | 107 (17.3%) | 20 (4.0%) |
| Total | 617 (100.0%) | 503 (100.0%) |
Household Income by Mortgage Status in Wolfeboro
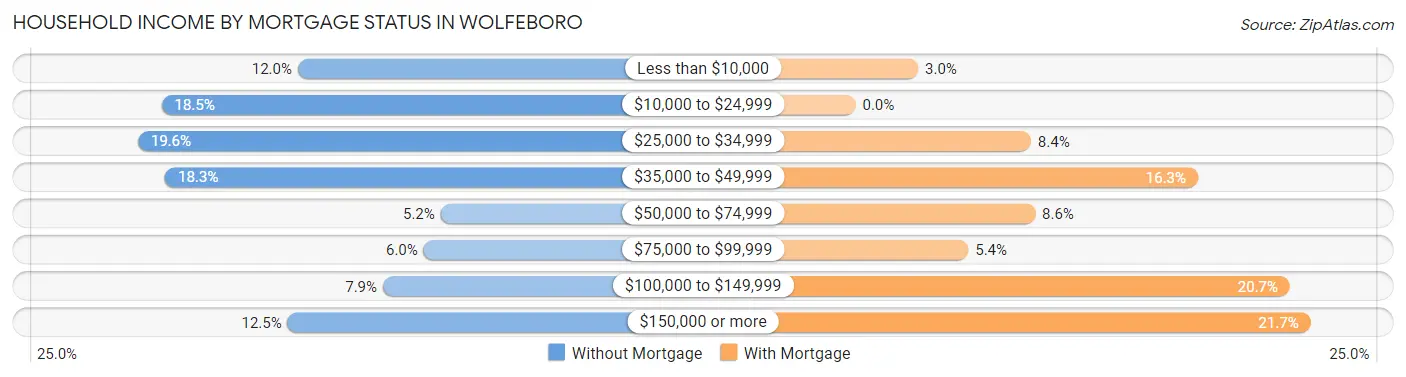
| Household Income | Without Mortgage | With Mortgage |
| Less than $10,000 | 74 (12.0%) | 15 (3.0%) |
| $10,000 to $24,999 | 114 (18.5%) | 0 (0.0%) |
| $25,000 to $34,999 | 121 (19.6%) | 42 (8.4%) |
| $35,000 to $49,999 | 113 (18.3%) | 82 (16.3%) |
| $50,000 to $74,999 | 32 (5.2%) | 43 (8.6%) |
| $75,000 to $99,999 | 37 (6.0%) | 27 (5.4%) |
| $100,000 to $149,999 | 49 (7.9%) | 104 (20.7%) |
| $150,000 or more | 77 (12.5%) | 109 (21.7%) |
| Total | 617 (100.0%) | 503 (100.0%) |
Property Value to Household Income Ratio in Wolfeboro
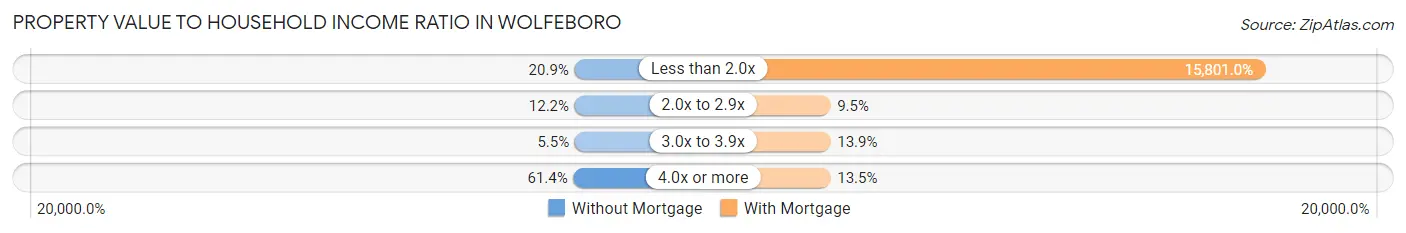
| Value-to-Income Ratio | Without Mortgage | With Mortgage |
| Less than 2.0x | 129 (20.9%) | 79,479 (15,801.0%) |
| 2.0x to 2.9x | 75 (12.2%) | 48 (9.5%) |
| 3.0x to 3.9x | 34 (5.5%) | 70 (13.9%) |
| 4.0x or more | 379 (61.4%) | 68 (13.5%) |
| Total | 617 (100.0%) | 503 (100.0%) |
Real Estate Taxes by Mortgage Status in Wolfeboro
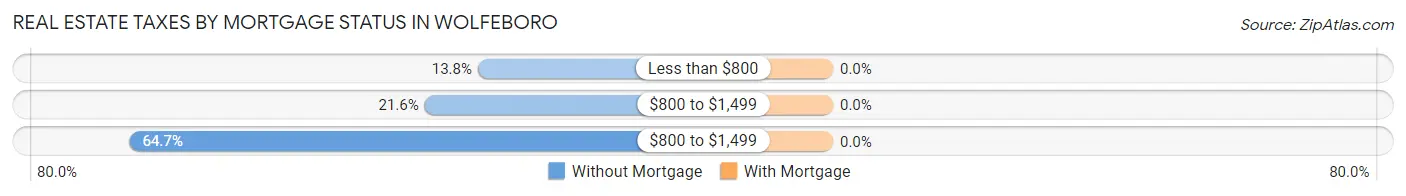
| Property Taxes | Without Mortgage | With Mortgage |
| Less than $800 | 85 (13.8%) | 0 (0.0%) |
| $800 to $1,499 | 133 (21.6%) | 0 (0.0%) |
| $800 to $1,499 | 399 (64.7%) | 0 (0.0%) |
| Total | 617 (100.0%) | 503 (100.0%) |
Health & Disability in Wolfeboro
Health Insurance Coverage by Age in Wolfeboro
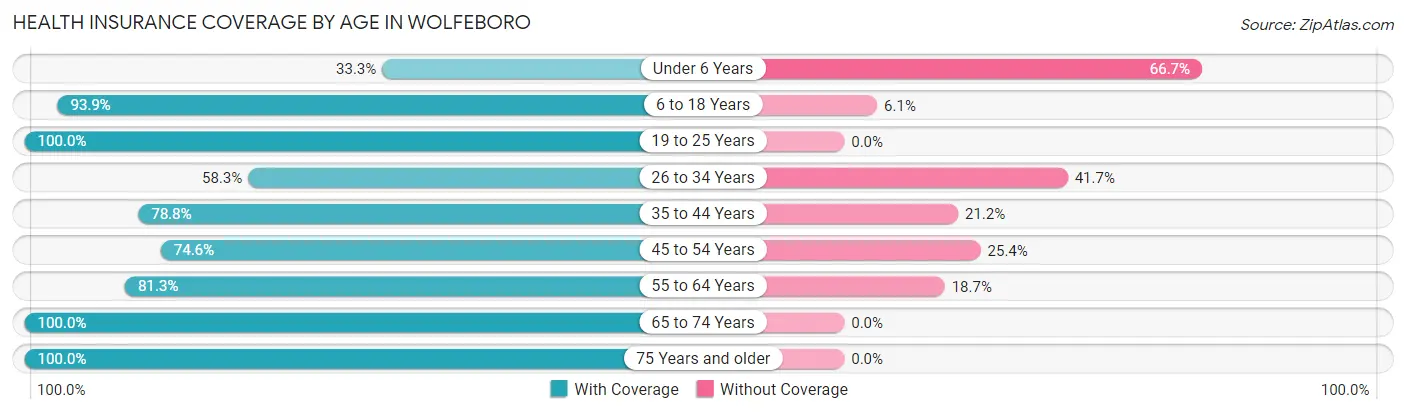
| Age Bracket | With Coverage | Without Coverage |
| Under 6 Years | 12 (33.3%) | 24 (66.7%) |
| 6 to 18 Years | 352 (93.9%) | 23 (6.1%) |
| 19 to 25 Years | 17 (100.0%) | 0 (0.0%) |
| 26 to 34 Years | 28 (58.3%) | 20 (41.7%) |
| 35 to 44 Years | 182 (78.8%) | 49 (21.2%) |
| 45 to 54 Years | 179 (74.6%) | 61 (25.4%) |
| 55 to 64 Years | 408 (81.3%) | 94 (18.7%) |
| 65 to 74 Years | 518 (100.0%) | 0 (0.0%) |
| 75 Years and older | 745 (100.0%) | 0 (0.0%) |
| Total | 2,441 (90.0%) | 271 (10.0%) |
Health Insurance Coverage by Citizenship Status in Wolfeboro
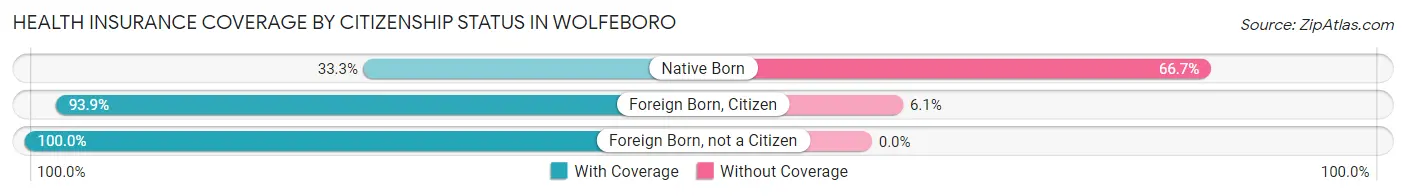
| Citizenship Status | With Coverage | Without Coverage |
| Native Born | 12 (33.3%) | 24 (66.7%) |
| Foreign Born, Citizen | 352 (93.9%) | 23 (6.1%) |
| Foreign Born, not a Citizen | 17 (100.0%) | 0 (0.0%) |
Health Insurance Coverage by Household Income in Wolfeboro
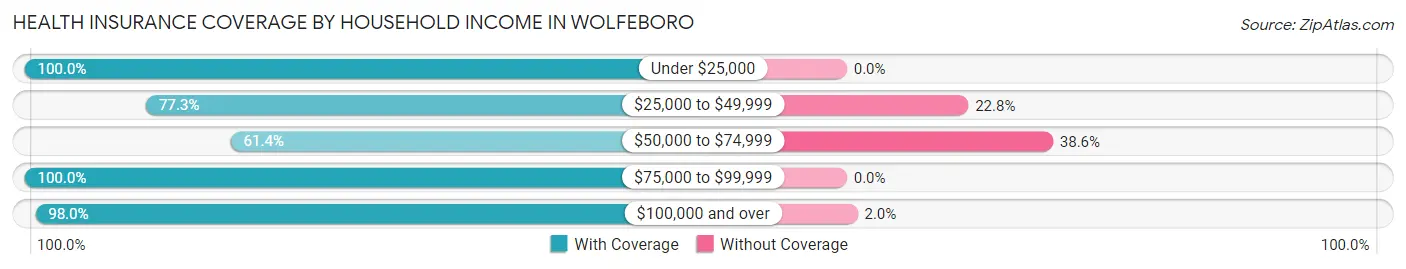
| Household Income | With Coverage | Without Coverage |
| Under $25,000 | 414 (100.0%) | 0 (0.0%) |
| $25,000 to $49,999 | 645 (77.2%) | 190 (22.8%) |
| $50,000 to $74,999 | 97 (61.4%) | 61 (38.6%) |
| $75,000 to $99,999 | 302 (100.0%) | 0 (0.0%) |
| $100,000 and over | 976 (98.0%) | 20 (2.0%) |
Public vs Private Health Insurance Coverage by Age in Wolfeboro
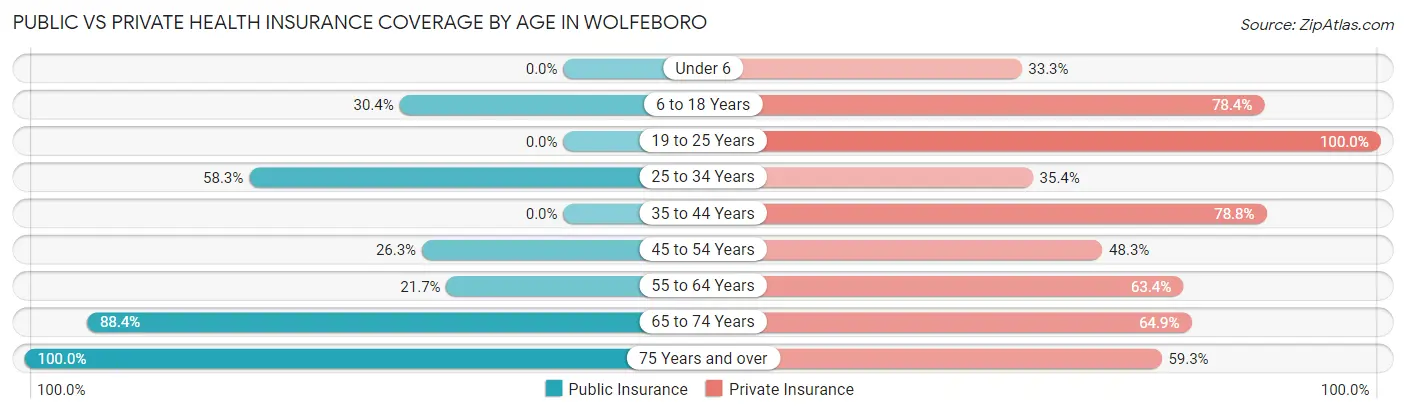
| Age Bracket | Public Insurance | Private Insurance |
| Under 6 | 0 (0.0%) | 12 (33.3%) |
| 6 to 18 Years | 114 (30.4%) | 294 (78.4%) |
| 19 to 25 Years | 0 (0.0%) | 17 (100.0%) |
| 25 to 34 Years | 28 (58.3%) | 17 (35.4%) |
| 35 to 44 Years | 0 (0.0%) | 182 (78.8%) |
| 45 to 54 Years | 63 (26.3%) | 116 (48.3%) |
| 55 to 64 Years | 109 (21.7%) | 318 (63.3%) |
| 65 to 74 Years | 458 (88.4%) | 336 (64.9%) |
| 75 Years and over | 745 (100.0%) | 442 (59.3%) |
| Total | 1,517 (55.9%) | 1,734 (63.9%) |
Disability Status by Sex by Age in Wolfeboro
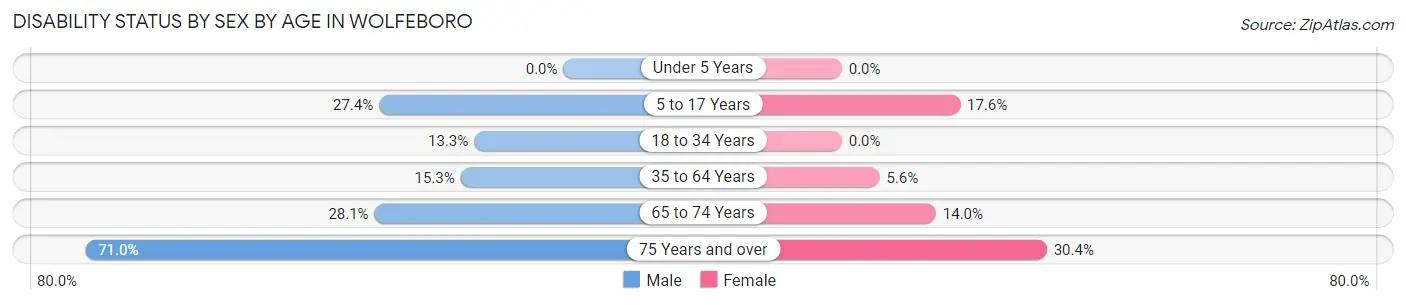
| Age Bracket | Male | Female |
| Under 5 Years | 0 (0.0%) | 0 (0.0%) |
| 5 to 17 Years | 49 (27.4%) | 23 (17.6%) |
| 18 to 34 Years | 11 (13.3%) | 0 (0.0%) |
| 35 to 64 Years | 75 (15.3%) | 27 (5.6%) |
| 65 to 74 Years | 69 (28.1%) | 38 (14.0%) |
| 75 Years and over | 186 (71.0%) | 147 (30.4%) |
Disability Class by Sex by Age in Wolfeboro
Disability Class: Hearing Difficulty
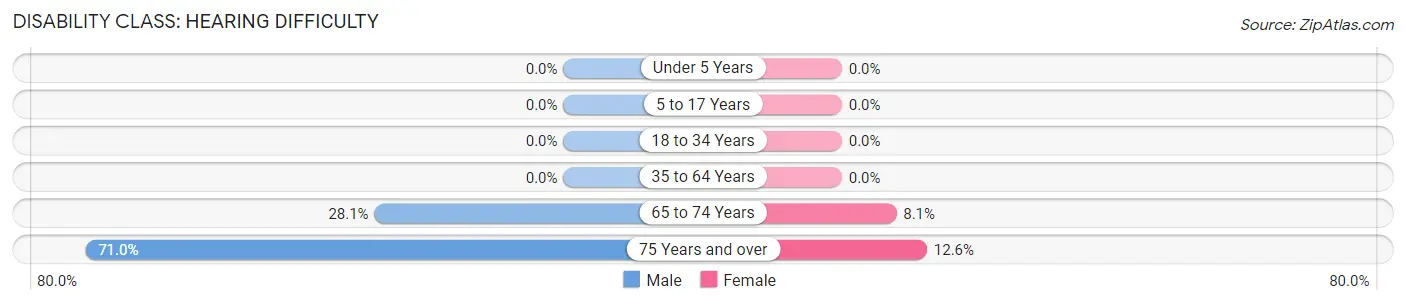
| Age Bracket | Male | Female |
| Under 5 Years | 0 (0.0%) | 0 (0.0%) |
| 5 to 17 Years | 0 (0.0%) | 0 (0.0%) |
| 18 to 34 Years | 0 (0.0%) | 0 (0.0%) |
| 35 to 64 Years | 0 (0.0%) | 0 (0.0%) |
| 65 to 74 Years | 69 (28.1%) | 22 (8.1%) |
| 75 Years and over | 186 (71.0%) | 61 (12.6%) |
Disability Class: Vision Difficulty
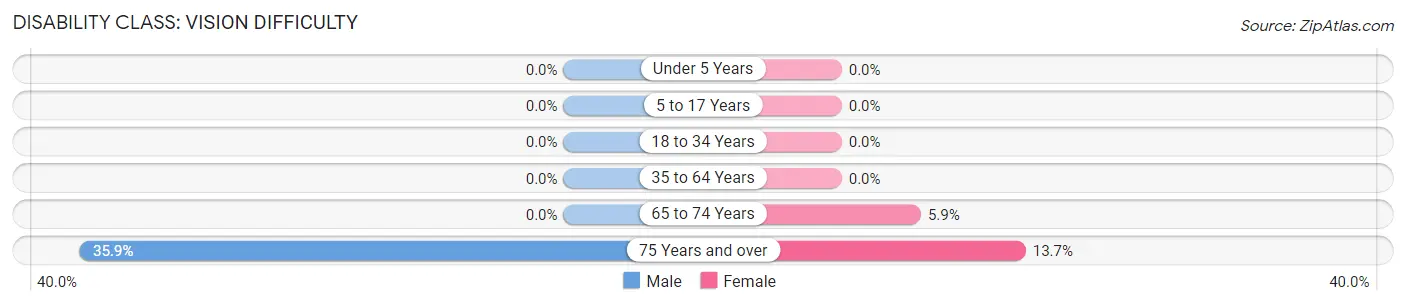
| Age Bracket | Male | Female |
| Under 5 Years | 0 (0.0%) | 0 (0.0%) |
| 5 to 17 Years | 0 (0.0%) | 0 (0.0%) |
| 18 to 34 Years | 0 (0.0%) | 0 (0.0%) |
| 35 to 64 Years | 0 (0.0%) | 0 (0.0%) |
| 65 to 74 Years | 0 (0.0%) | 16 (5.9%) |
| 75 Years and over | 94 (35.9%) | 66 (13.7%) |
Disability Class: Cognitive Difficulty
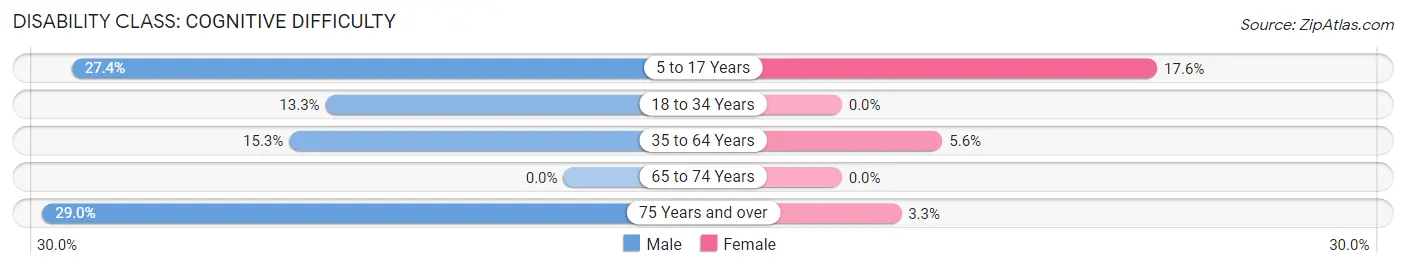
| Age Bracket | Male | Female |
| 5 to 17 Years | 49 (27.4%) | 23 (17.6%) |
| 18 to 34 Years | 11 (13.3%) | 0 (0.0%) |
| 35 to 64 Years | 75 (15.3%) | 27 (5.6%) |
| 65 to 74 Years | 0 (0.0%) | 0 (0.0%) |
| 75 Years and over | 76 (29.0%) | 16 (3.3%) |
Disability Class: Ambulatory Difficulty
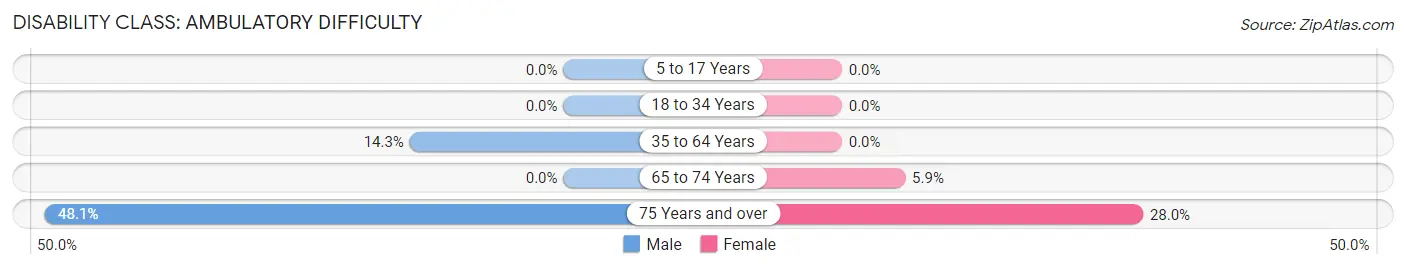
| Age Bracket | Male | Female |
| 5 to 17 Years | 0 (0.0%) | 0 (0.0%) |
| 18 to 34 Years | 0 (0.0%) | 0 (0.0%) |
| 35 to 64 Years | 70 (14.3%) | 0 (0.0%) |
| 65 to 74 Years | 0 (0.0%) | 16 (5.9%) |
| 75 Years and over | 126 (48.1%) | 135 (28.0%) |
Disability Class: Self-Care Difficulty
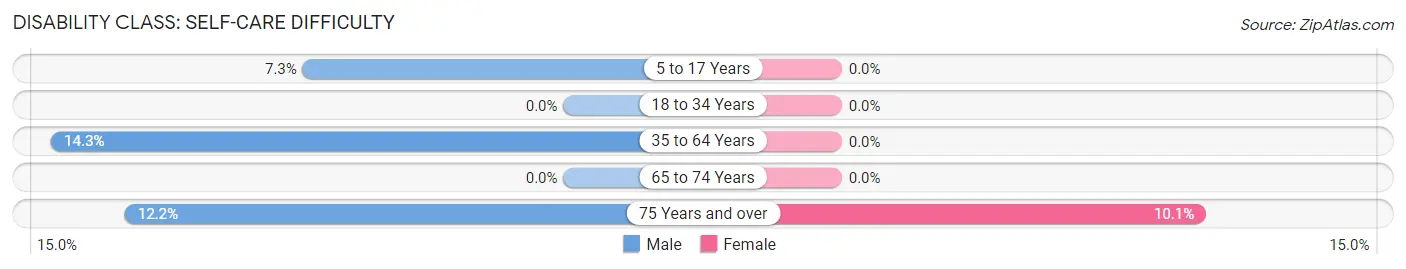
| Age Bracket | Male | Female |
| 5 to 17 Years | 13 (7.3%) | 0 (0.0%) |
| 18 to 34 Years | 0 (0.0%) | 0 (0.0%) |
| 35 to 64 Years | 70 (14.3%) | 0 (0.0%) |
| 65 to 74 Years | 0 (0.0%) | 0 (0.0%) |
| 75 Years and over | 32 (12.2%) | 49 (10.1%) |
Technology Access in Wolfeboro
Computing Device Access in Wolfeboro
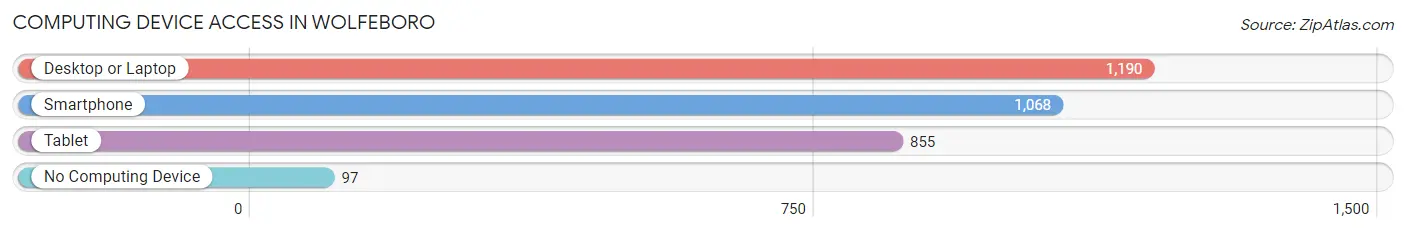
| Device Type | # Households | % Households |
| Desktop or Laptop | 1,190 | 86.9% |
| Smartphone | 1,068 | 78.0% |
| Tablet | 855 | 62.4% |
| No Computing Device | 97 | 7.1% |
| Total | 1,370 | 100.0% |
Internet Access in Wolfeboro
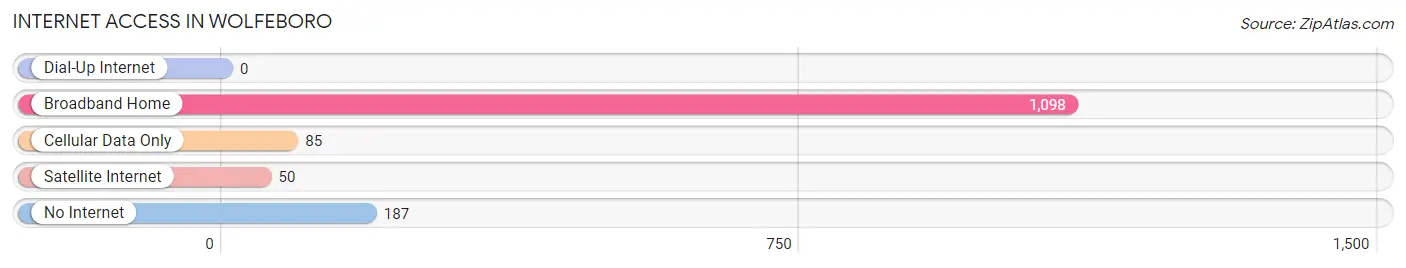
| Internet Type | # Households | % Households |
| Dial-Up Internet | 0 | 0.0% |
| Broadband Home | 1,098 | 80.1% |
| Cellular Data Only | 85 | 6.2% |
| Satellite Internet | 50 | 3.6% |
| No Internet | 187 | 13.7% |
| Total | 1,370 | 100.0% |
Wolfeboro Summary
Wolfeboro, New Hampshire is a small town located in the Lakes Region of the state. It is the oldest summer resort in the United States, and is known for its picturesque views of Lake Winnipesaukee and the surrounding mountains. The town has a population of 6,269 as of the 2010 census, and is the county seat of Carroll County.
History
Wolfeboro was first settled in 1763 by Governor John Wentworth, who named it after his friend, General James Wolfe. The town was incorporated in 1770, and was the first town in New Hampshire to be incorporated after the Revolutionary War.
Wolfeboro was an important port on Lake Winnipesaukee during the 19th century, and was a major stop on the stagecoach route between Boston and Portland, Maine. The town was also a popular summer resort destination, and was known as the “Oldest Summer Resort in America.”
Geography
Wolfeboro is located in the Lakes Region of New Hampshire, and is situated on the eastern shore of Lake Winnipesaukee. The town is bordered by the towns of Tuftonboro to the north, Wakefield to the east, Brookfield to the south, and Ossipee to the west.
The town has a total area of 28.2 square miles, of which 25.2 square miles is land and 3.0 square miles is water. The highest point in Wolfeboro is the summit of Mount Major, which has an elevation of 2,744 feet.
Economy
Wolfeboro’s economy is largely based on tourism, as the town is a popular summer resort destination. The town is home to several resorts, hotels, and restaurants, as well as a variety of shops and stores.
The town is also home to several manufacturing companies, including the Wolfeboro Boat Company, which produces wooden boats, and the Wolfeboro Chair Company, which produces wooden furniture.
Demographics
As of the 2010 census, Wolfeboro had a population of 6,269. The racial makeup of the town was 95.3% White, 0.7% African American, 0.4% Native American, 0.9% Asian, 0.1% Pacific Islander, 0.7% from other races, and 1.9% from two or more races. Hispanic or Latino of any race were 2.2% of the population.
The median income for a household in the town was $50,945, and the median income for a family was $60,917. The per capita income for the town was $27,945. About 5.2% of families and 8.2% of the population were below the poverty line, including 10.2% of those under age 18 and 5.2% of those age 65 or over.
Common Questions
What is Per Capita Income in Wolfeboro?
Per Capita income in Wolfeboro is $39,283.
What is the Median Family Income in Wolfeboro?
Median Family Income in Wolfeboro is $84,125.
What is the Median Household income in Wolfeboro?
Median Household Income in Wolfeboro is $47,990.
What is Income or Wage Gap in Wolfeboro?
Income or Wage Gap in Wolfeboro is 4.6%.
Women in Wolfeboro earn 95.4 cents for every dollar earned by a man.
What is Inequality or Gini Index in Wolfeboro?
Inequality or Gini Index in Wolfeboro is 0.49.
What is the Total Population of Wolfeboro?
Total Population of Wolfeboro is 2,813.
What is the Total Male Population of Wolfeboro?
Total Male Population of Wolfeboro is 1,310.
What is the Total Female Population of Wolfeboro?
Total Female Population of Wolfeboro is 1,503.
What is the Ratio of Males per 100 Females in Wolfeboro?
There are 87.16 Males per 100 Females in Wolfeboro.
What is the Ratio of Females per 100 Males in Wolfeboro?
There are 114.73 Females per 100 Males in Wolfeboro.
What is the Median Population Age in Wolfeboro?
Median Population Age in Wolfeboro is 62.2 Years.
What is the Average Family Size in Wolfeboro
Average Family Size in Wolfeboro is 2.7 People.
What is the Average Household Size in Wolfeboro
Average Household Size in Wolfeboro is 2.0 People.
How Large is the Labor Force in Wolfeboro?
There are 1,004 People in the Labor Forcein in Wolfeboro.
What is the Percentage of People in the Labor Force in Wolfeboro?
38.9% of People are in the Labor Force in Wolfeboro.
What is the Unemployment Rate in Wolfeboro?
Unemployment Rate in Wolfeboro is 0.2%.