Portola Valley, CA Map & Demographics
Portola Valley Map
Portola Valley Overview
$180,793
PER CAPITA INCOME
$250,001
AVG FAMILY INCOME
$250,001
AVG HOUSEHOLD INCOME
0.51
INEQUALITY / GINI INDEX
4,397
TOTAL POPULATION
1,954
MALE POPULATION
2,443
FEMALE POPULATION
79.98
MALES / 100 FEMALES
125.03
FEMALES / 100 MALES
57.8
MEDIAN AGE
3.0
AVG FAMILY SIZE
2.6
AVG HOUSEHOLD SIZE
1,537
LABOR FORCE [ PEOPLE ]
42.0%
PERCENT IN LABOR FORCE
2.7%
UNEMPLOYMENT RATE
Portola Valley Zip Codes
Income in Portola Valley
Income Overview in Portola Valley
Per Capita Income in Portola Valley is $180,793, while median incomes of families and households are $250,001 and $250,001 respectively.
| Characteristic | Number | Measure |
| Per Capita Income | 4,397 | $180,793 |
| Median Family Income | 1,179 | $250,001 |
| Mean Family Income | 1,179 | $593,652 |
| Median Household Income | 1,692 | $250,001 |
| Mean Household Income | 1,692 | $462,935 |
| Income Deficit | 1,179 | $0 |
| Wage / Income Gap (%) | 4,397 | 0.00% |
| Wage / Income Gap ($) | 4,397 | 100.00¢ per $1 |
| Gini / Inequality Index | 4,397 | 0.51 |
Earnings by Sex in Portola Valley
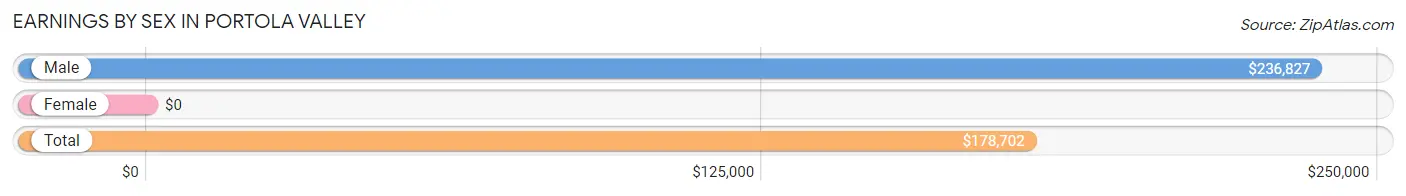
| Sex | Number | Average Earnings |
| Male | 949 (58.3%) | $236,827 |
| Female | 679 (41.7%) | $0 |
| Total | 1,628 (100.0%) | $178,702 |
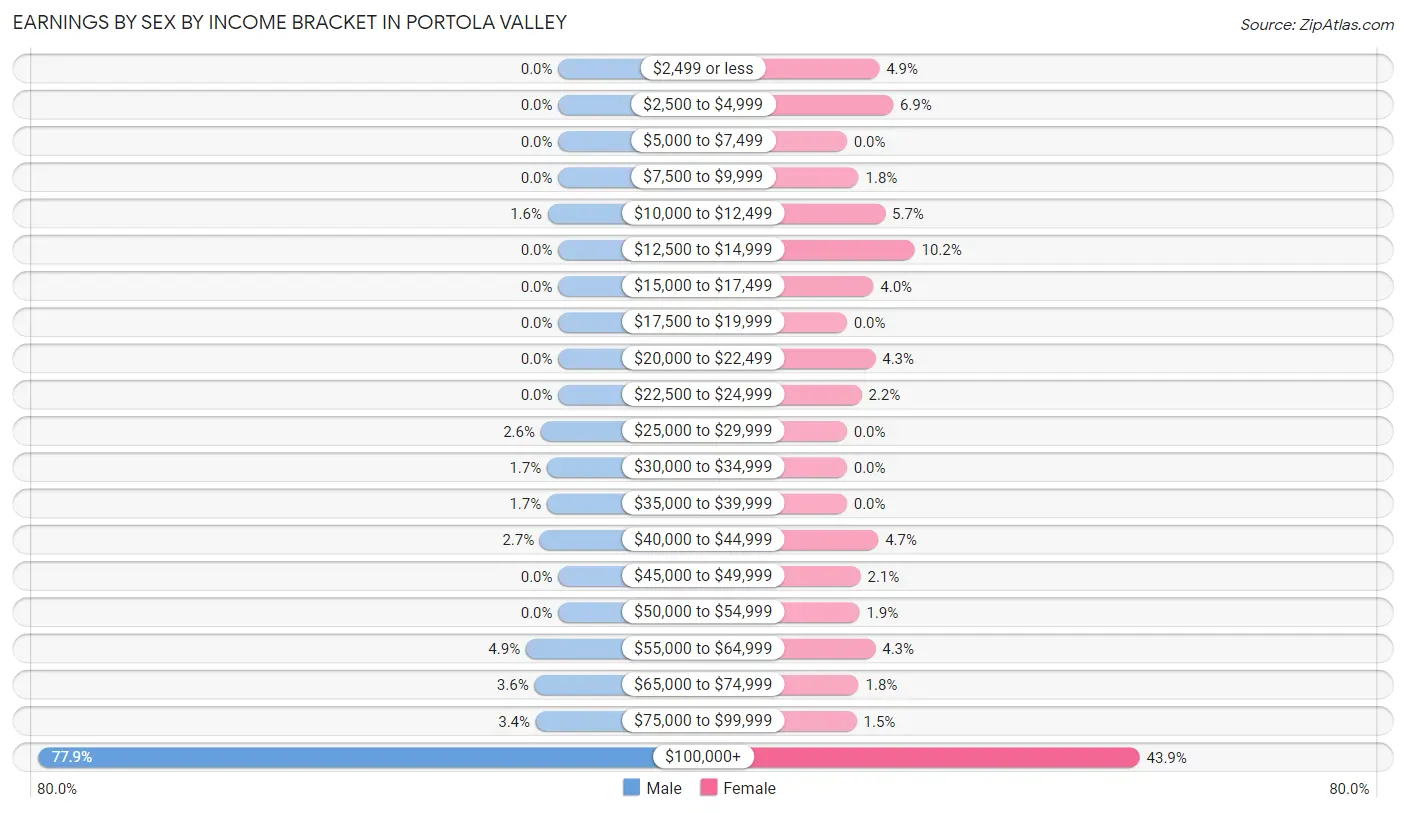
Earnings by Sex by Income Bracket in Portola Valley
The most common earnings brackets in Portola Valley are $100,000+ for men (739 | 77.9%) and $100,000+ for women (298 | 43.9%).
| Income | Male | Female |
| $2,499 or less | 0 (0.0%) | 33 (4.9%) |
| $2,500 to $4,999 | 0 (0.0%) | 47 (6.9%) |
| $5,000 to $7,499 | 0 (0.0%) | 0 (0.0%) |
| $7,500 to $9,999 | 0 (0.0%) | 12 (1.8%) |
| $10,000 to $12,499 | 15 (1.6%) | 39 (5.7%) |
| $12,500 to $14,999 | 0 (0.0%) | 69 (10.2%) |
| $15,000 to $17,499 | 0 (0.0%) | 27 (4.0%) |
| $17,500 to $19,999 | 0 (0.0%) | 0 (0.0%) |
| $20,000 to $22,499 | 0 (0.0%) | 29 (4.3%) |
| $22,500 to $24,999 | 0 (0.0%) | 15 (2.2%) |
| $25,000 to $29,999 | 25 (2.6%) | 0 (0.0%) |
| $30,000 to $34,999 | 16 (1.7%) | 0 (0.0%) |
| $35,000 to $39,999 | 16 (1.7%) | 0 (0.0%) |
| $40,000 to $44,999 | 26 (2.7%) | 32 (4.7%) |
| $45,000 to $49,999 | 0 (0.0%) | 14 (2.1%) |
| $50,000 to $54,999 | 0 (0.0%) | 13 (1.9%) |
| $55,000 to $64,999 | 46 (4.9%) | 29 (4.3%) |
| $65,000 to $74,999 | 34 (3.6%) | 12 (1.8%) |
| $75,000 to $99,999 | 32 (3.4%) | 10 (1.5%) |
| $100,000+ | 739 (77.9%) | 298 (43.9%) |
| Total | 949 (100.0%) | 679 (100.0%) |
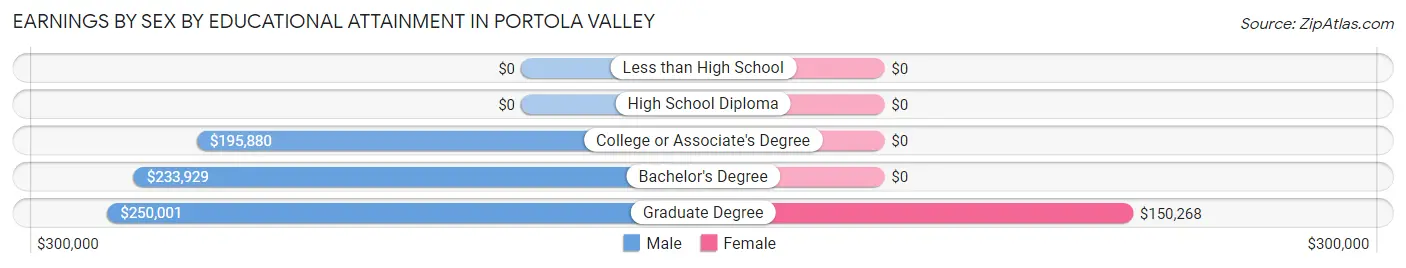
Earnings by Sex by Educational Attainment in Portola Valley
Average earnings in Portola Valley are $249,231 for men and $117,568 for women, a difference of 52.8%. Men with an educational attainment of graduate degree enjoy the highest average annual earnings of $250,001, while those with college or associate's degree education earn the least with $195,880. Women with an educational attainment of graduate degree earn the most with the average annual earnings of $150,268, while those with graduate degree education have the smallest earnings of $150,268.
| Educational Attainment | Male Income | Female Income |
| Less than High School | - | - |
| High School Diploma | - | - |
| College or Associate's Degree | $195,880 | $0 |
| Bachelor's Degree | $233,929 | $0 |
| Graduate Degree | $250,001 | $150,268 |
| Total | $249,231 | $117,568 |
Family Income in Portola Valley
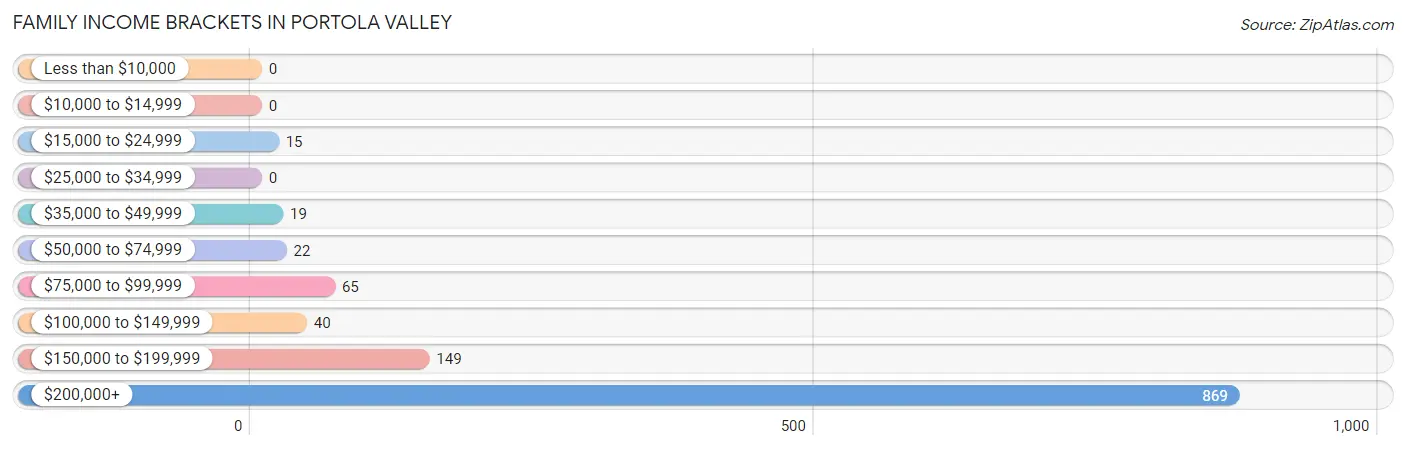
Family Income Brackets in Portola Valley
According to the Portola Valley family income data, there are 869 families falling into the $200,000+ income range, which is the most common income bracket and makes up 73.7% of all families.
| Income Bracket | # Families | % Families |
| Less than $10,000 | 0 | 0.0% |
| $10,000 to $14,999 | 0 | 0.0% |
| $15,000 to $24,999 | 15 | 1.3% |
| $25,000 to $34,999 | 0 | 0.0% |
| $35,000 to $49,999 | 19 | 1.6% |
| $50,000 to $74,999 | 22 | 1.9% |
| $75,000 to $99,999 | 65 | 5.5% |
| $100,000 to $149,999 | 40 | 3.4% |
| $150,000 to $199,999 | 149 | 12.6% |
| $200,000+ | 869 | 73.7% |
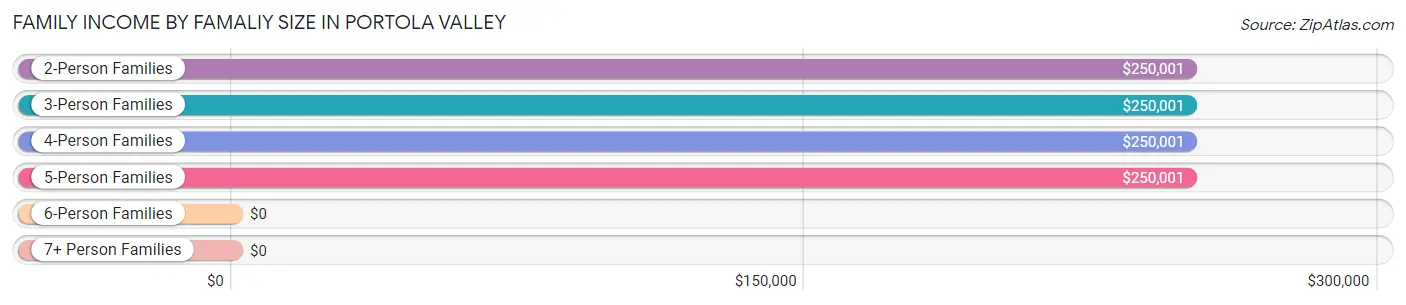
Family Income by Famaliy Size in Portola Valley
2-person families (723 | 61.3%) account for the highest median family income in Portola Valley with $250,001 per family, while 2-person families (723 | 61.3%) have the highest median income of $125,000 per family member.
| Income Bracket | # Families | Median Income |
| 2-Person Families | 723 (61.3%) | $250,001 |
| 3-Person Families | 94 (8.0%) | $250,001 |
| 4-Person Families | 247 (20.9%) | $250,001 |
| 5-Person Families | 96 (8.1%) | $250,001 |
| 6-Person Families | 19 (1.6%) | $0 |
| 7+ Person Families | 0 (0.0%) | $0 |
| Total | 1,179 (100.0%) | $250,001 |
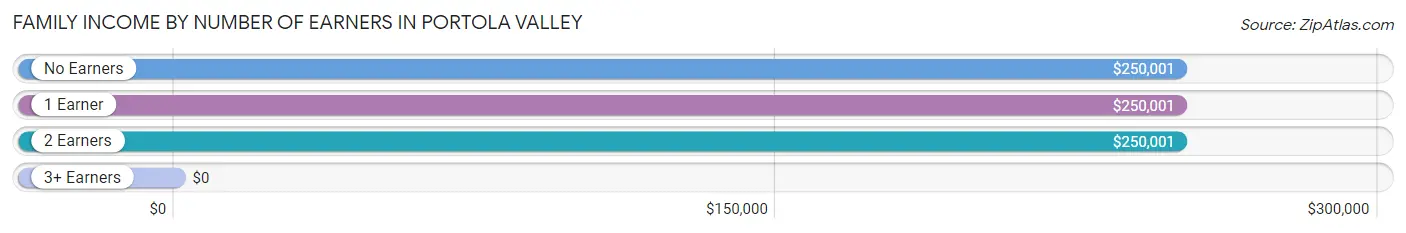
Family Income by Number of Earners in Portola Valley
| Number of Earners | # Families | Median Income |
| No Earners | 340 (28.8%) | $250,001 |
| 1 Earner | 385 (32.7%) | $250,001 |
| 2 Earners | 434 (36.8%) | $250,001 |
| 3+ Earners | 20 (1.7%) | $0 |
| Total | 1,179 (100.0%) | $250,001 |
Household Income in Portola Valley
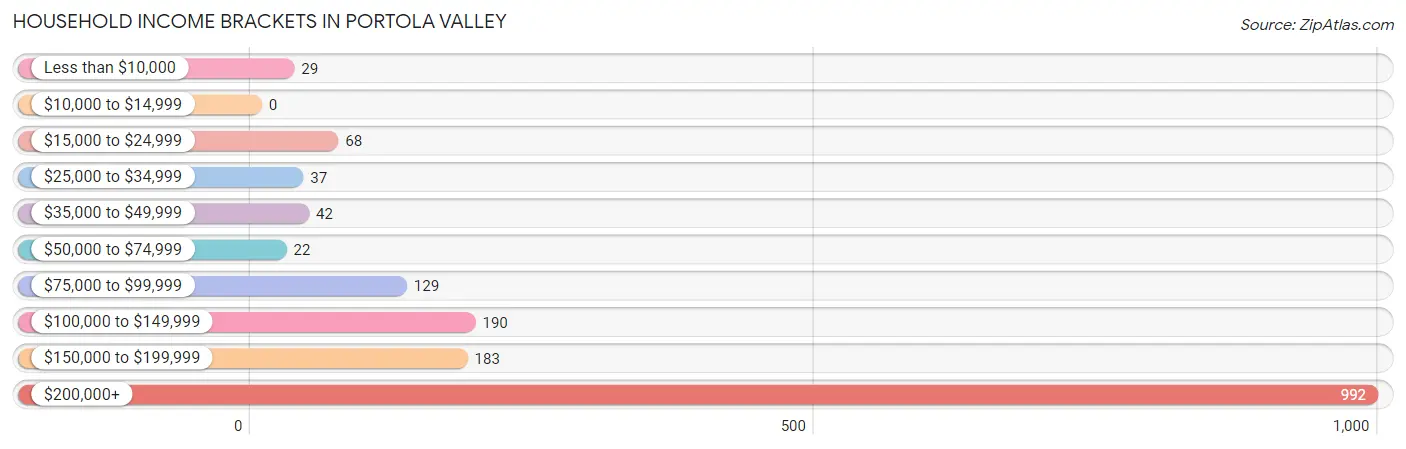
Household Income Brackets in Portola Valley
With 992 households falling in the category, the $200,000+ income range is the most frequent in Portola Valley, accounting for 58.6% of all households.
| Income Bracket | # Households | % Households |
| Less than $10,000 | 29 | 1.7% |
| $10,000 to $14,999 | 0 | 0.0% |
| $15,000 to $24,999 | 68 | 4.0% |
| $25,000 to $34,999 | 37 | 2.2% |
| $35,000 to $49,999 | 42 | 2.5% |
| $50,000 to $74,999 | 22 | 1.3% |
| $75,000 to $99,999 | 129 | 7.6% |
| $100,000 to $149,999 | 190 | 11.2% |
| $150,000 to $199,999 | 183 | 10.8% |
| $200,000+ | 992 | 58.6% |
Household Income by Householder Age in Portola Valley
The median household income in Portola Valley is $250,001, with the highest median household income of $250,001 found in the 25 to 44 years age bracket for the primary householder. A total of 134 households (7.9%) fall into this category.
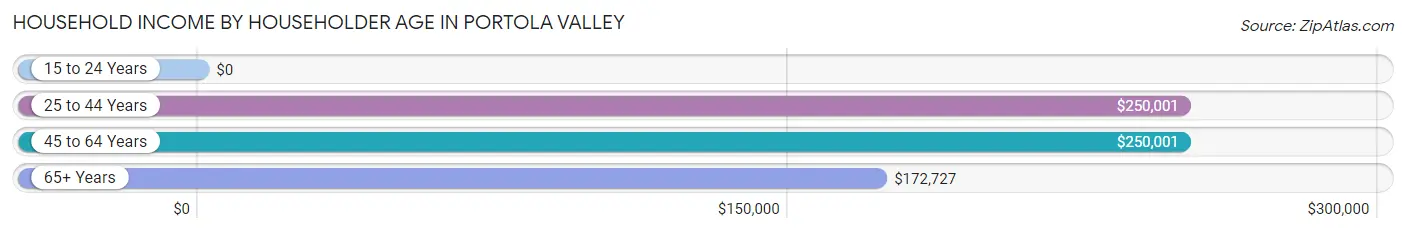
| Income Bracket | # Households | Median Income |
| 15 to 24 Years | 0 (0.0%) | $0 |
| 25 to 44 Years | 134 (7.9%) | $250,001 |
| 45 to 64 Years | 554 (32.7%) | $250,001 |
| 65+ Years | 1,004 (59.3%) | $172,727 |
| Total | 1,692 (100.0%) | $250,001 |
Poverty in Portola Valley
Income Below Poverty by Sex and Age in Portola Valley
With 1.5% poverty level for males and 6.8% for females among the residents of Portola Valley, 65 to 74 year old males and 65 to 74 year old females are the most vulnerable to poverty, with 30 males (9.5%) and 137 females (32.5%) in their respective age groups living below the poverty level.
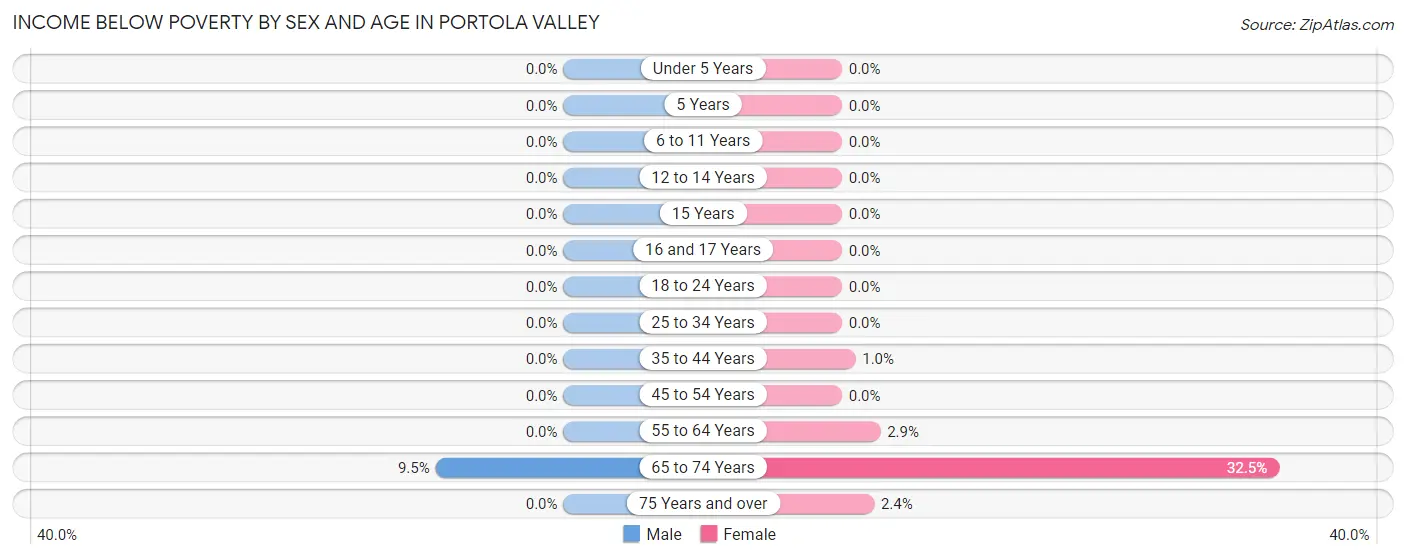
| Age Bracket | Male | Female |
| Under 5 Years | 0 (0.0%) | 0 (0.0%) |
| 5 Years | 0 (0.0%) | 0 (0.0%) |
| 6 to 11 Years | 0 (0.0%) | 0 (0.0%) |
| 12 to 14 Years | 0 (0.0%) | 0 (0.0%) |
| 15 Years | 0 (0.0%) | 0 (0.0%) |
| 16 and 17 Years | 0 (0.0%) | 0 (0.0%) |
| 18 to 24 Years | 0 (0.0%) | 0 (0.0%) |
| 25 to 34 Years | 0 (0.0%) | 0 (0.0%) |
| 35 to 44 Years | 0 (0.0%) | 2 (1.0%) |
| 45 to 54 Years | 0 (0.0%) | 0 (0.0%) |
| 55 to 64 Years | 0 (0.0%) | 10 (2.9%) |
| 65 to 74 Years | 30 (9.5%) | 137 (32.5%) |
| 75 Years and over | 0 (0.0%) | 14 (2.4%) |
| Total | 30 (1.5%) | 163 (6.8%) |
Income Above Poverty by Sex and Age in Portola Valley
According to the poverty statistics in Portola Valley, males aged under 5 years and females aged under 5 years are the age groups that are most secure financially, with 100.0% of males and 100.0% of females in these age groups living above the poverty line.
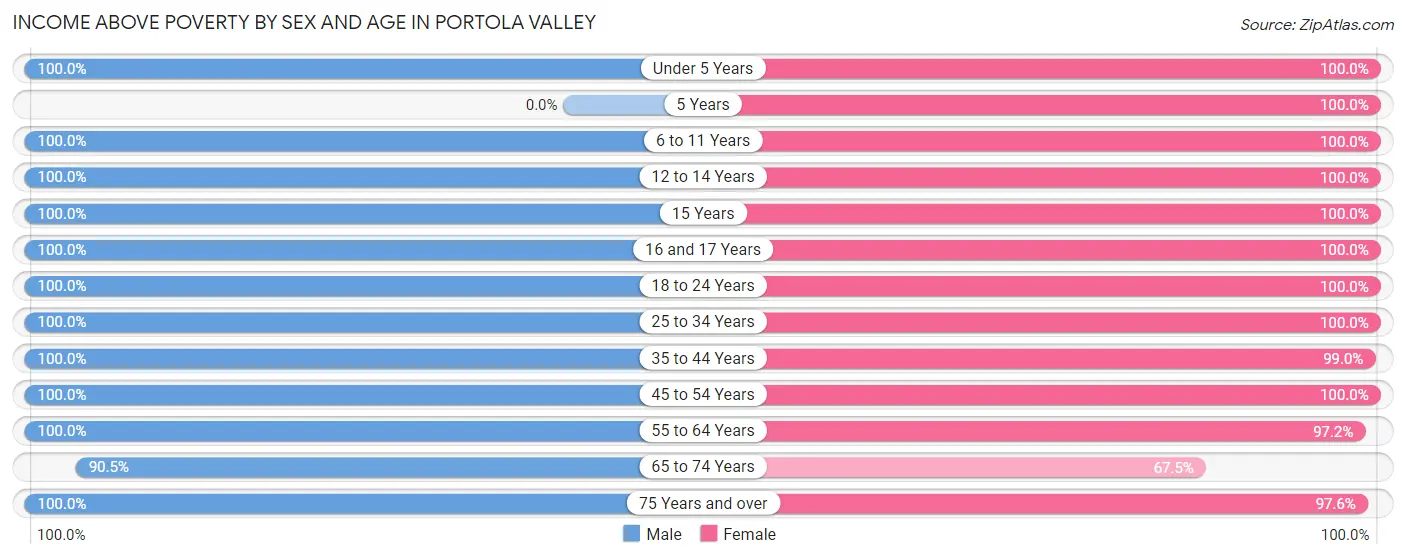
| Age Bracket | Male | Female |
| Under 5 Years | 71 (100.0%) | 169 (100.0%) |
| 5 Years | 0 (0.0%) | 74 (100.0%) |
| 6 to 11 Years | 145 (100.0%) | 80 (100.0%) |
| 12 to 14 Years | 117 (100.0%) | 12 (100.0%) |
| 15 Years | 13 (100.0%) | 47 (100.0%) |
| 16 and 17 Years | 15 (100.0%) | 61 (100.0%) |
| 18 to 24 Years | 96 (100.0%) | 159 (100.0%) |
| 25 to 34 Years | 49 (100.0%) | 10 (100.0%) |
| 35 to 44 Years | 124 (100.0%) | 199 (99.0%) |
| 45 to 54 Years | 313 (100.0%) | 232 (100.0%) |
| 55 to 64 Years | 317 (100.0%) | 341 (97.2%) |
| 65 to 74 Years | 286 (90.5%) | 285 (67.5%) |
| 75 Years and over | 371 (100.0%) | 573 (97.6%) |
| Total | 1,917 (98.5%) | 2,242 (93.2%) |
Income Below Poverty Among Married-Couple Families in Portola Valley
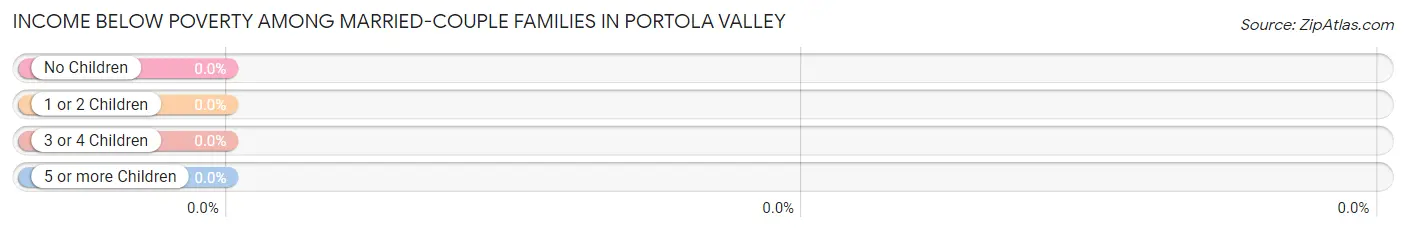
| Children | Above Poverty | Below Poverty |
| No Children | 835 (100.0%) | 0 (0.0%) |
| 1 or 2 Children | 250 (100.0%) | 0 (0.0%) |
| 3 or 4 Children | 66 (100.0%) | 0 (0.0%) |
| 5 or more Children | 0 (0.0%) | 0 (0.0%) |
| Total | 1,151 (100.0%) | 0 (0.0%) |
Income Below Poverty Among Single-Parent Households in Portola Valley
| Children | Single Father | Single Mother |
| No Children | 0 (0.0%) | 0 (0.0%) |
| 1 or 2 Children | 0 (0.0%) | 0 (0.0%) |
| 3 or 4 Children | 0 (0.0%) | 0 (0.0%) |
| 5 or more Children | 0 (0.0%) | 0 (0.0%) |
| Total | 0 (0.0%) | 0 (0.0%) |
Income Below Poverty Among Married-Couple vs Single-Parent Households in Portola Valley
| Children | Married-Couple Families | Single-Parent Households |
| No Children | 0 (0.0%) | 0 (0.0%) |
| 1 or 2 Children | 0 (0.0%) | 0 (0.0%) |
| 3 or 4 Children | 0 (0.0%) | 0 (0.0%) |
| 5 or more Children | 0 (0.0%) | 0 (0.0%) |
| Total | 0 (0.0%) | 0 (0.0%) |
Race in Portola Valley
The most populous races in Portola Valley are White / Caucasian (3,528 | 80.2%), Hispanic or Latino (527 | 12.0%), and Two or more Races (436 | 9.9%).
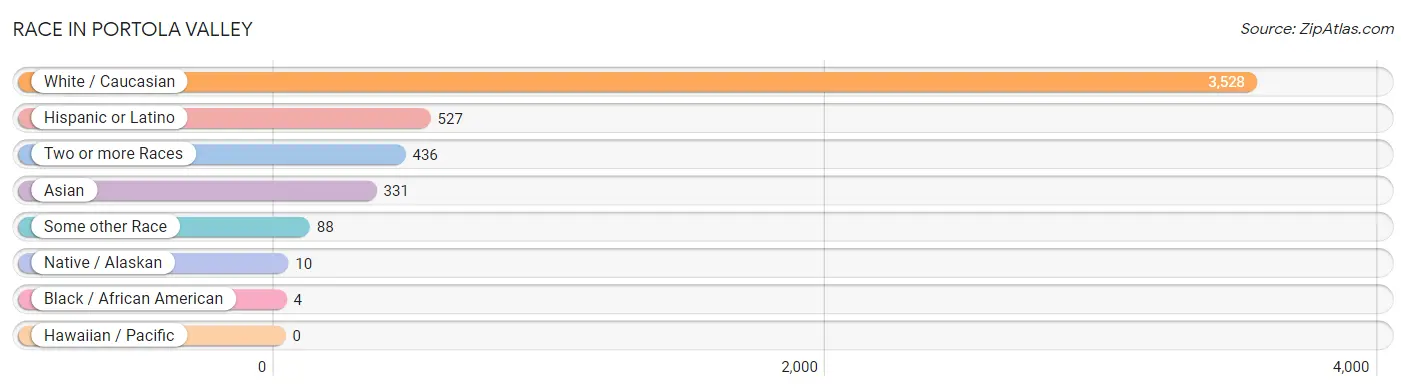
| Race | # Population | % Population |
| Asian | 331 | 7.5% |
| Black / African American | 4 | 0.1% |
| Hawaiian / Pacific | 0 | 0.0% |
| Hispanic or Latino | 527 | 12.0% |
| Native / Alaskan | 10 | 0.2% |
| White / Caucasian | 3,528 | 80.2% |
| Two or more Races | 436 | 9.9% |
| Some other Race | 88 | 2.0% |
| Total | 4,397 | 100.0% |
Ancestry in Portola Valley
The most populous ancestries reported in Portola Valley are German (844 | 19.2%), English (610 | 13.9%), Mexican (479 | 10.9%), Italian (368 | 8.4%), and Irish (351 | 8.0%), together accounting for 60.3% of all Portola Valley residents.
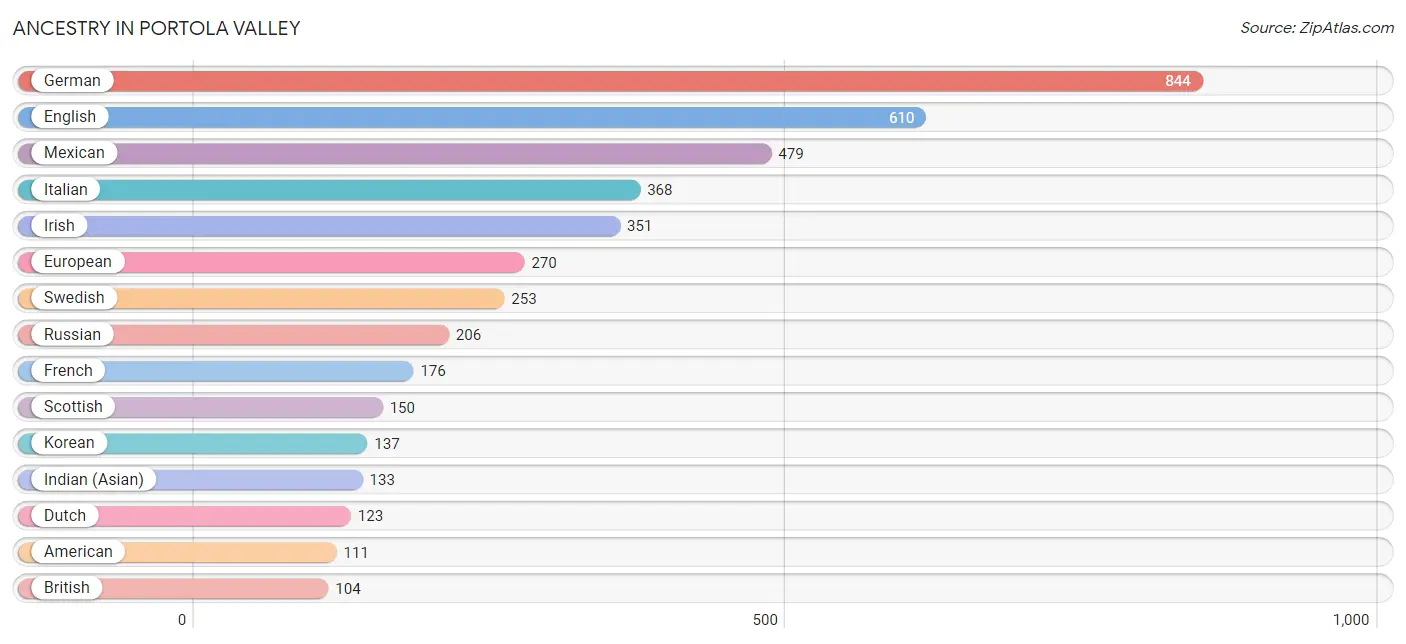
| Ancestry | # Population | % Population |
| American | 111 | 2.5% |
| Austrian | 32 | 0.7% |
| Belgian | 20 | 0.4% |
| Bhutanese | 15 | 0.3% |
| British | 104 | 2.4% |
| Burmese | 38 | 0.9% |
| Canadian | 14 | 0.3% |
| Croatian | 12 | 0.3% |
| Czech | 40 | 0.9% |
| Danish | 95 | 2.2% |
| Dutch | 123 | 2.8% |
| Eastern European | 57 | 1.3% |
| English | 610 | 13.9% |
| European | 270 | 6.1% |
| French | 176 | 4.0% |
| French Canadian | 14 | 0.3% |
| German | 844 | 19.2% |
| Greek | 26 | 0.6% |
| Hungarian | 69 | 1.6% |
| Indian (Asian) | 133 | 3.0% |
| Irish | 351 | 8.0% |
| Iroquois | 10 | 0.2% |
| Italian | 368 | 8.4% |
| Korean | 137 | 3.1% |
| Lithuanian | 56 | 1.3% |
| Mexican | 479 | 10.9% |
| Northern European | 30 | 0.7% |
| Norwegian | 63 | 1.4% |
| Polish | 71 | 1.6% |
| Portuguese | 14 | 0.3% |
| Puerto Rican | 14 | 0.3% |
| Russian | 206 | 4.7% |
| Scandinavian | 101 | 2.3% |
| Scotch-Irish | 27 | 0.6% |
| Scottish | 150 | 3.4% |
| Slovak | 13 | 0.3% |
| Spanish | 34 | 0.8% |
| Swedish | 253 | 5.8% |
| Swiss | 91 | 2.1% |
| Thai | 94 | 2.1% |
| Ukrainian | 30 | 0.7% |
| Welsh | 15 | 0.3% | View All 42 Rows |
Immigrants in Portola Valley
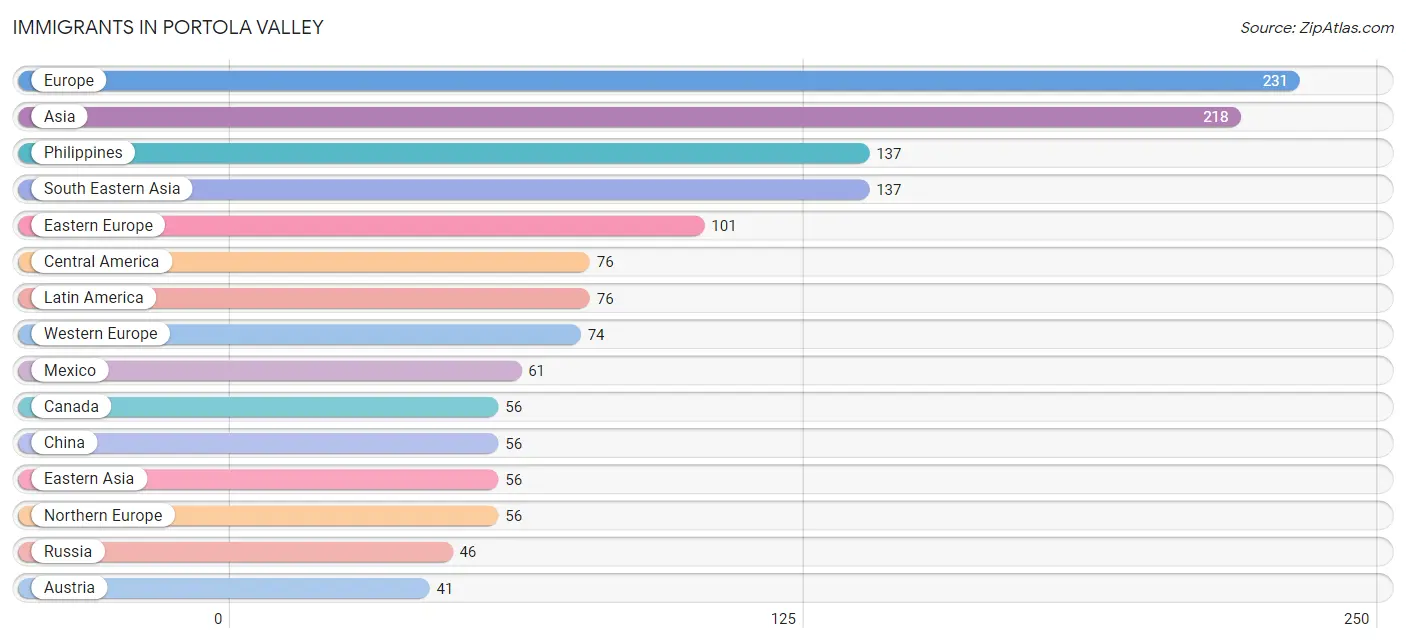
The most numerous immigrant groups reported in Portola Valley came from Europe (231 | 5.2%), Asia (218 | 5.0%), Philippines (137 | 3.1%), South Eastern Asia (137 | 3.1%), and Eastern Europe (101 | 2.3%), together accounting for 18.8% of all Portola Valley residents.
| Immigration Origin | # Population | % Population |
| Asia | 218 | 5.0% |
| Austria | 41 | 0.9% |
| Belgium | 20 | 0.4% |
| Canada | 56 | 1.3% |
| Central America | 76 | 1.7% |
| China | 56 | 1.3% |
| Eastern Asia | 56 | 1.3% |
| Eastern Europe | 101 | 2.3% |
| England | 13 | 0.3% |
| Europe | 231 | 5.2% |
| France | 13 | 0.3% |
| Hong Kong | 10 | 0.2% |
| Hungary | 25 | 0.6% |
| India | 25 | 0.6% |
| Latin America | 76 | 1.7% |
| Mexico | 61 | 1.4% |
| Northern Europe | 56 | 1.3% |
| Panama | 15 | 0.3% |
| Philippines | 137 | 3.1% |
| Poland | 30 | 0.7% |
| Russia | 46 | 1.1% |
| South Central Asia | 25 | 0.6% |
| South Eastern Asia | 137 | 3.1% |
| Sweden | 31 | 0.7% |
| Taiwan | 13 | 0.3% |
| Western Europe | 74 | 1.7% | View All 26 Rows |
Sex and Age in Portola Valley
Sex and Age in Portola Valley
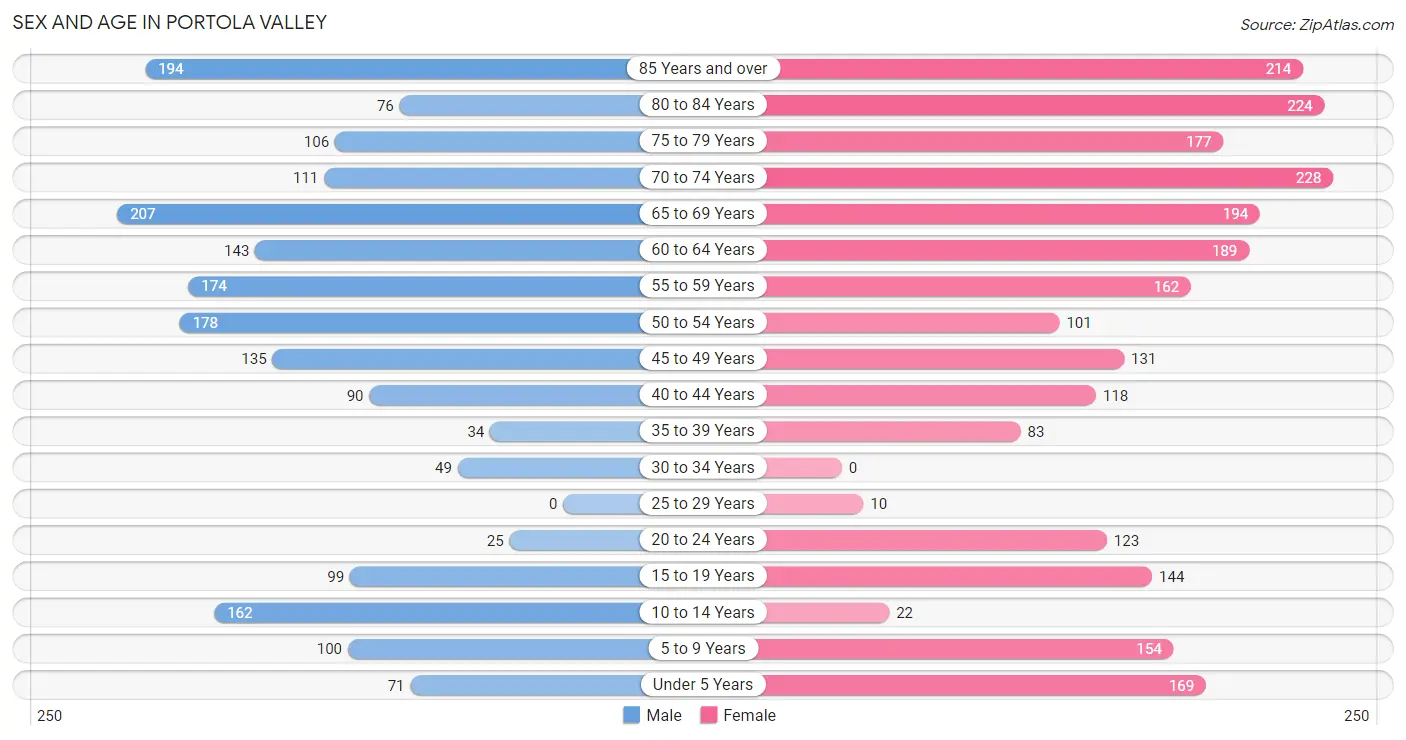
The most populous age groups in Portola Valley are 65 to 69 Years (207 | 10.6%) for men and 70 to 74 Years (228 | 9.3%) for women.
| Age Bracket | Male | Female |
| Under 5 Years | 71 (3.6%) | 169 (6.9%) |
| 5 to 9 Years | 100 (5.1%) | 154 (6.3%) |
| 10 to 14 Years | 162 (8.3%) | 22 (0.9%) |
| 15 to 19 Years | 99 (5.1%) | 144 (5.9%) |
| 20 to 24 Years | 25 (1.3%) | 123 (5.0%) |
| 25 to 29 Years | 0 (0.0%) | 10 (0.4%) |
| 30 to 34 Years | 49 (2.5%) | 0 (0.0%) |
| 35 to 39 Years | 34 (1.7%) | 83 (3.4%) |
| 40 to 44 Years | 90 (4.6%) | 118 (4.8%) |
| 45 to 49 Years | 135 (6.9%) | 131 (5.4%) |
| 50 to 54 Years | 178 (9.1%) | 101 (4.1%) |
| 55 to 59 Years | 174 (8.9%) | 162 (6.6%) |
| 60 to 64 Years | 143 (7.3%) | 189 (7.7%) |
| 65 to 69 Years | 207 (10.6%) | 194 (7.9%) |
| 70 to 74 Years | 111 (5.7%) | 228 (9.3%) |
| 75 to 79 Years | 106 (5.4%) | 177 (7.2%) |
| 80 to 84 Years | 76 (3.9%) | 224 (9.2%) |
| 85 Years and over | 194 (9.9%) | 214 (8.8%) |
| Total | 1,954 (100.0%) | 2,443 (100.0%) |
Families and Households in Portola Valley
Median Family Size in Portola Valley
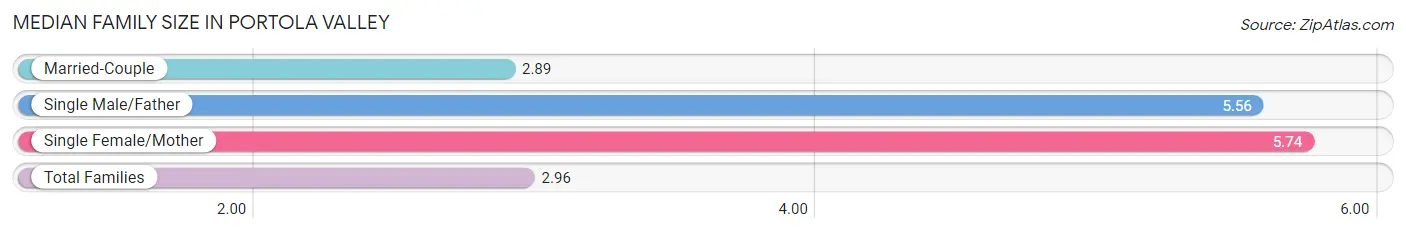
The median family size in Portola Valley is 2.96 persons per family, with single female/mother families (19 | 1.6%) accounting for the largest median family size of 5.74 persons per family. On the other hand, married-couple families (1,151 | 97.6%) represent the smallest median family size with 2.89 persons per family.
| Family Type | # Families | Family Size |
| Married-Couple | 1,151 (97.6%) | 2.89 |
| Single Male/Father | 9 (0.8%) | 5.56 |
| Single Female/Mother | 19 (1.6%) | 5.74 |
| Total Families | 1,179 (100.0%) | 2.96 |
Median Household Size in Portola Valley
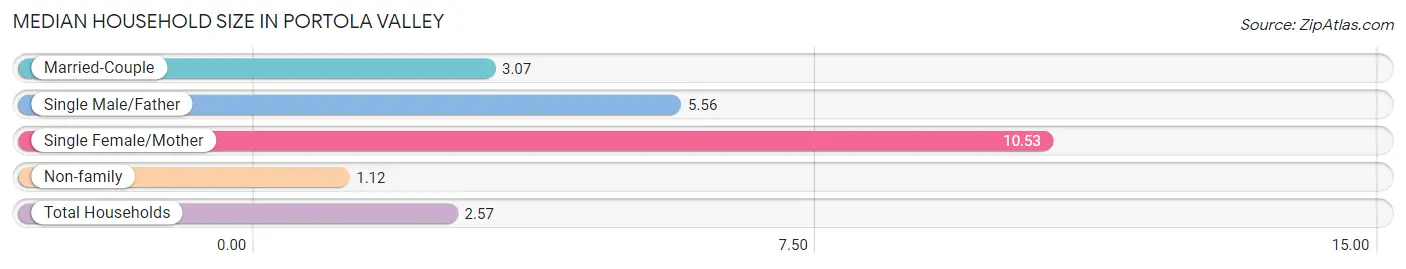
The median household size in Portola Valley is 2.57 persons per household, with single female/mother households (19 | 1.1%) accounting for the largest median household size of 10.53 persons per household. non-family households (513 | 30.3%) represent the smallest median household size with 1.12 persons per household.
| Household Type | # Households | Household Size |
| Married-Couple | 1,151 (68.0%) | 3.07 |
| Single Male/Father | 9 (0.5%) | 5.56 |
| Single Female/Mother | 19 (1.1%) | 10.53 |
| Non-family | 513 (30.3%) | 1.12 |
| Total Households | 1,692 (100.0%) | 2.57 |
Household Size by Marriage Status in Portola Valley
Out of a total of 1,692 households in Portola Valley, 1,179 (69.7%) are family households, while 513 (30.3%) are nonfamily households. The most numerous type of family households are 2-person households, comprising 603, and the most common type of nonfamily households are 1-person households, comprising 459.
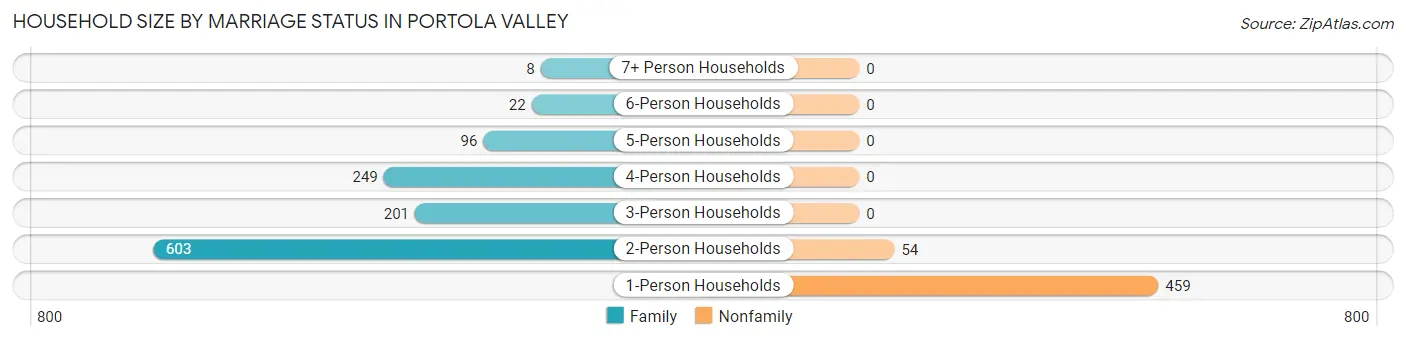
| Household Size | Family Households | Nonfamily Households |
| 1-Person Households | - | 459 (27.1%) |
| 2-Person Households | 603 (35.6%) | 54 (3.2%) |
| 3-Person Households | 201 (11.9%) | 0 (0.0%) |
| 4-Person Households | 249 (14.7%) | 0 (0.0%) |
| 5-Person Households | 96 (5.7%) | 0 (0.0%) |
| 6-Person Households | 22 (1.3%) | 0 (0.0%) |
| 7+ Person Households | 8 (0.5%) | 0 (0.0%) |
| Total | 1,179 (69.7%) | 513 (30.3%) |
Female Fertility in Portola Valley
Fertility by Age in Portola Valley
| Age Bracket | Women with Births | Births / 1,000 Women |
| 15 to 19 years | 0 (0.0%) | 0.0 |
| 20 to 34 years | 0 (0.0%) | 0.0 |
| 35 to 50 years | 0 (0.0%) | 0.0 |
| Total | 0 (0.0%) | 0.0 |
Fertility by Age by Marriage Status in Portola Valley
| Age Bracket | Married | Unmarried |
| 15 to 19 years | 0 (0.0%) | 0 (0.0%) |
| 20 to 34 years | 0 (0.0%) | 0 (0.0%) |
| 35 to 50 years | 0 (0.0%) | 0 (0.0%) |
| Total | 0 (0.0%) | 0 (0.0%) |
Fertility by Education in Portola Valley
| Educational Attainment | Women with Births | Births / 1,000 Women |
| Less than High School | 0 (0.0%) | 0.0 |
| High School Diploma | 0 (0.0%) | 0.0 |
| College or Associate's Degree | 0 (0.0%) | 0.0 |
| Bachelor's Degree | 0 (0.0%) | 0.0 |
| Graduate Degree | 0 (0.0%) | 0.0 |
| Total | 0 (0.0%) | 0.0 |
Fertility by Education by Marriage Status in Portola Valley
| Educational Attainment | Married | Unmarried |
| Less than High School | 0 (0.0%) | 0 (0.0%) |
| High School Diploma | 0 (0.0%) | 0 (0.0%) |
| College or Associate's Degree | 0 (0.0%) | 0 (0.0%) |
| Bachelor's Degree | 0 (0.0%) | 0 (0.0%) |
| Graduate Degree | 0 (0.0%) | 0 (0.0%) |
| Total | 0 (0.0%) | 0 (0.0%) |
Employment Characteristics in Portola Valley
Employment by Class of Employer in Portola Valley
Among the 1,494 employed individuals in Portola Valley, private company employees (918 | 61.5%), self-employed (not incorporated) (234 | 15.7%), and self-employed (incorporated) (165 | 11.0%) make up the most common classes of employment.
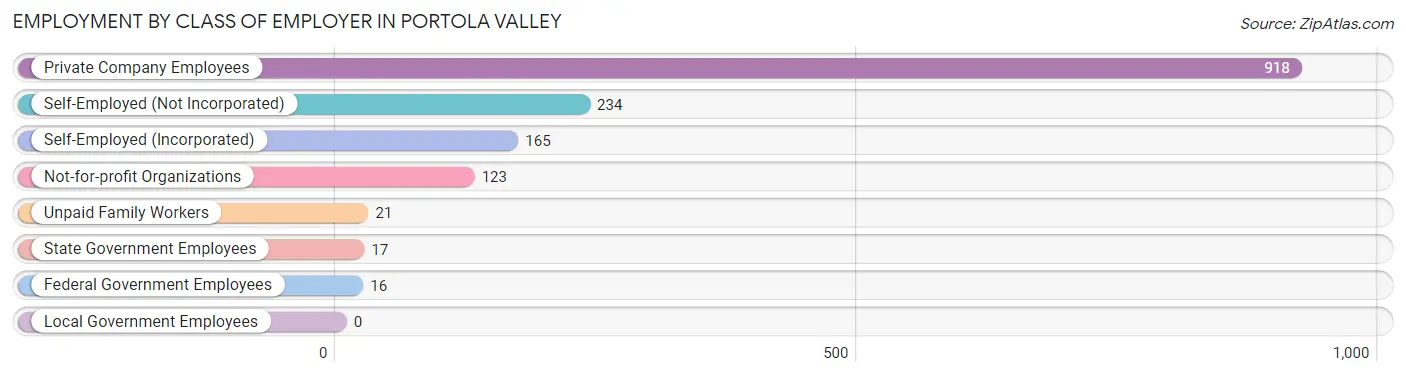
| Employer Class | # Employees | % Employees |
| Private Company Employees | 918 | 61.5% |
| Self-Employed (Incorporated) | 165 | 11.0% |
| Self-Employed (Not Incorporated) | 234 | 15.7% |
| Not-for-profit Organizations | 123 | 8.2% |
| Local Government Employees | 0 | 0.0% |
| State Government Employees | 17 | 1.1% |
| Federal Government Employees | 16 | 1.1% |
| Unpaid Family Workers | 21 | 1.4% |
| Total | 1,494 | 100.0% |
Employment Status by Age in Portola Valley
According to the labor force statistics for Portola Valley, out of the total population over 16 years of age (3,659), 42.0% or 1,537 individuals are in the labor force, with 2.7% or 41 of them unemployed. The age group with the highest labor force participation rate is 25 to 29 years, with 100.0% or 10 individuals in the labor force. Within the labor force, the 30 to 34 years age range has the highest percentage of unemployed individuals, with 32.7% or 16 of them being unemployed.
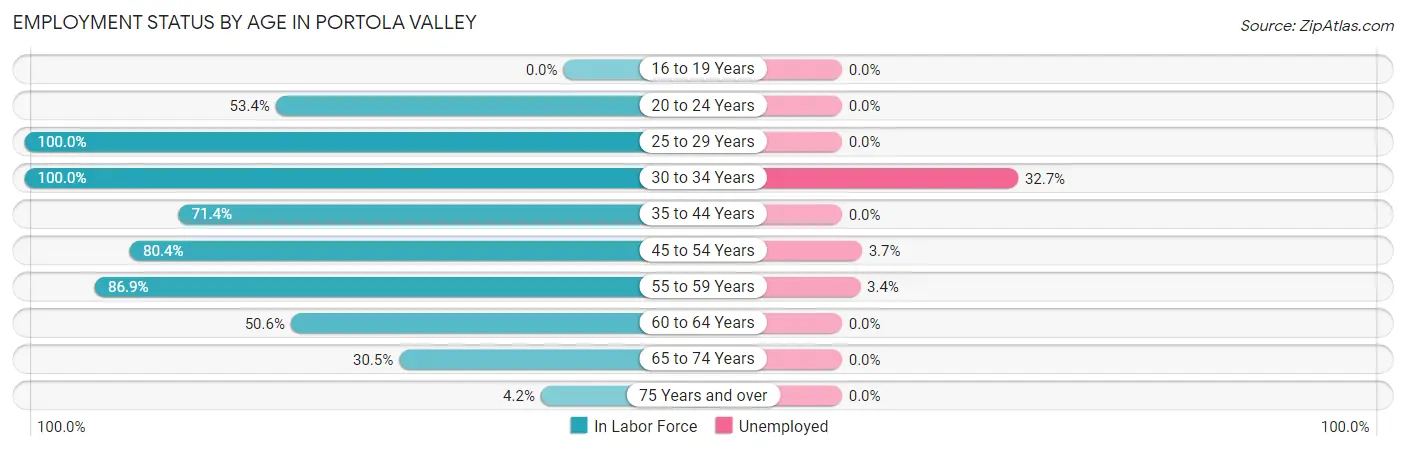
| Age Bracket | In Labor Force | Unemployed |
| 16 to 19 Years | 0 (0.0%) | 0 (0.0%) |
| 20 to 24 Years | 79 (53.4%) | 0 (0.0%) |
| 25 to 29 Years | 10 (100.0%) | 0 (0.0%) |
| 30 to 34 Years | 49 (100.0%) | 16 (32.7%) |
| 35 to 44 Years | 232 (71.4%) | 0 (0.0%) |
| 45 to 54 Years | 438 (80.4%) | 16 (3.7%) |
| 55 to 59 Years | 292 (86.9%) | 10 (3.4%) |
| 60 to 64 Years | 168 (50.6%) | 0 (0.0%) |
| 65 to 74 Years | 226 (30.5%) | 0 (0.0%) |
| 75 Years and over | 42 (4.2%) | 0 (0.0%) |
| Total | 1,537 (42.0%) | 41 (2.7%) |
Employment Status by Educational Attainment in Portola Valley
According to labor force statistics for Portola Valley, 74.5% of individuals (1,190) out of the total population between 25 and 64 years of age (1,597) are in the labor force, with 3.5% or 42 of them being unemployed. The group with the highest labor force participation rate are those with the educational attainment of bachelor's degree or higher, with 79.3% or 1,059 individuals in the labor force. Within the labor force, individuals with college / associate degree education have the highest percentage of unemployment, with 13.7% or 10 of them being unemployed.
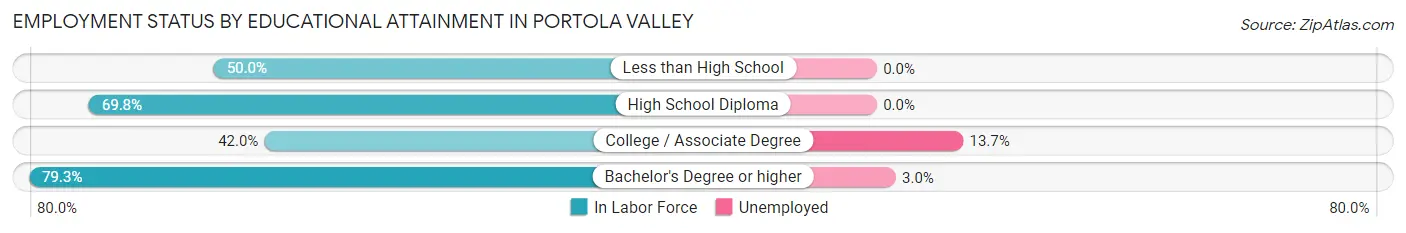
| Educational Attainment | In Labor Force | Unemployed |
| Less than High School | 12 (50.0%) | 0 (0.0%) |
| High School Diploma | 44 (69.8%) | 0 (0.0%) |
| College / Associate Degree | 73 (42.0%) | 24 (13.7%) |
| Bachelor's Degree or higher | 1,059 (79.3%) | 40 (3.0%) |
| Total | 1,190 (74.5%) | 56 (3.5%) |
Employment Occupations by Sex in Portola Valley
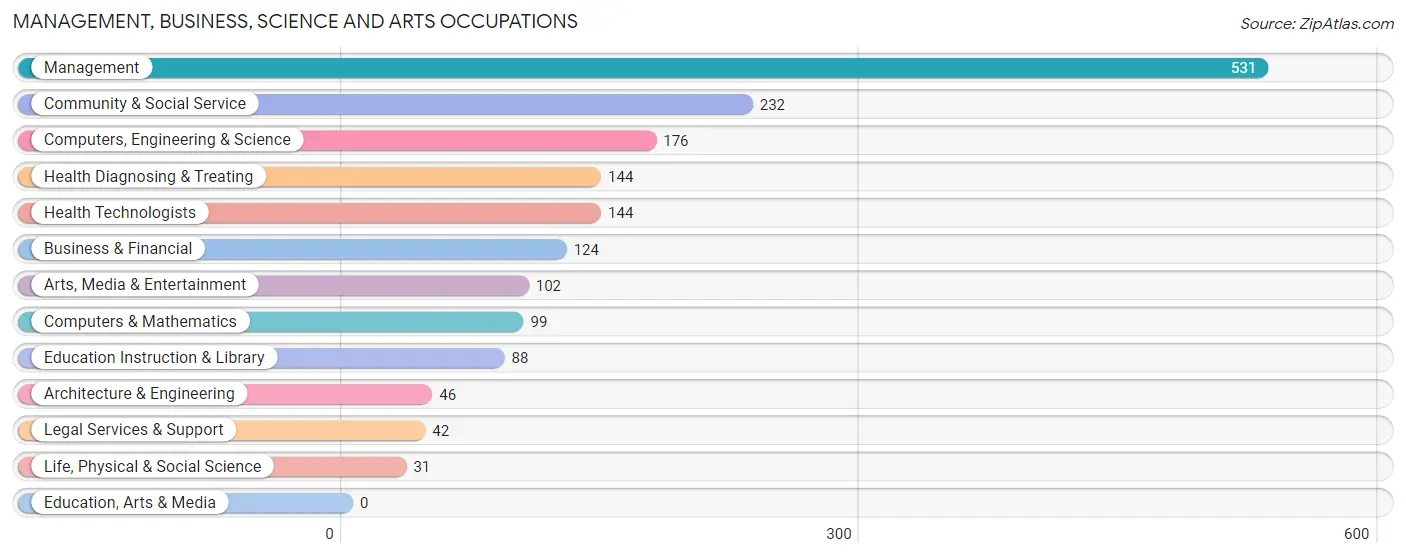
Management, Business, Science and Arts Occupations
The most common Management, Business, Science and Arts occupations in Portola Valley are Management (531 | 35.5%), Community & Social Service (232 | 15.5%), Computers, Engineering & Science (176 | 11.8%), Health Diagnosing & Treating (144 | 9.6%), and Health Technologists (144 | 9.6%).
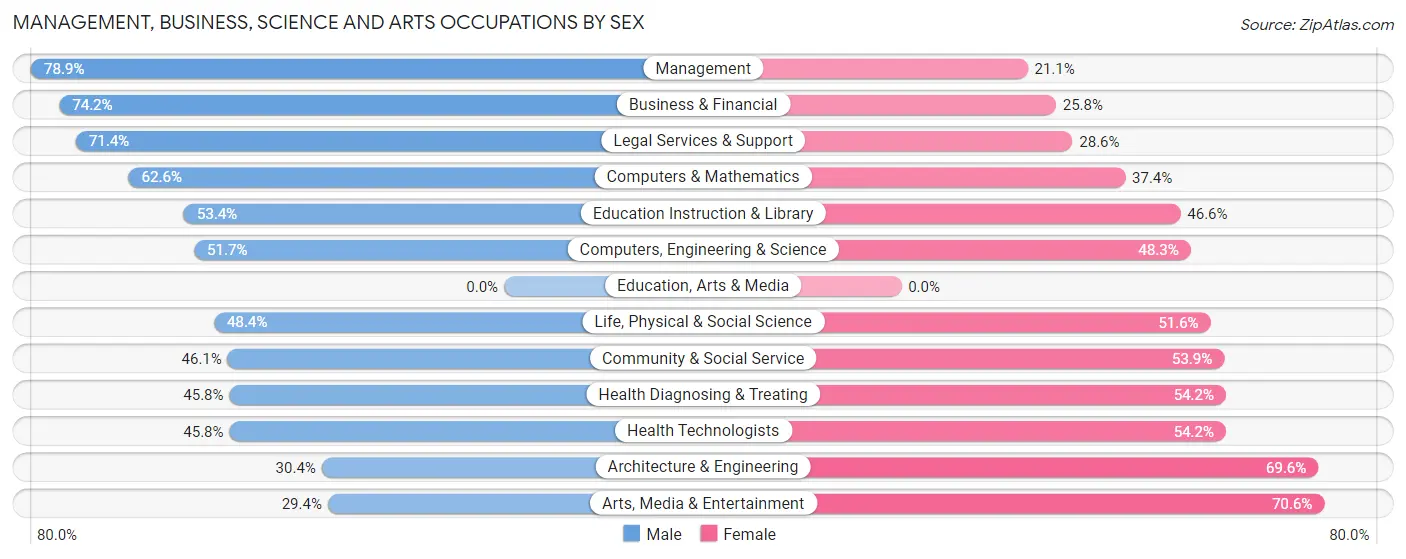
Management, Business, Science and Arts Occupations by Sex
Within the Management, Business, Science and Arts occupations in Portola Valley, the most male-oriented occupations are Management (78.9%), Business & Financial (74.2%), and Legal Services & Support (71.4%), while the most female-oriented occupations are Arts, Media & Entertainment (70.6%), Architecture & Engineering (69.6%), and Health Diagnosing & Treating (54.2%).
| Occupation | Male | Female |
| Management | 419 (78.9%) | 112 (21.1%) |
| Business & Financial | 92 (74.2%) | 32 (25.8%) |
| Computers, Engineering & Science | 91 (51.7%) | 85 (48.3%) |
| Computers & Mathematics | 62 (62.6%) | 37 (37.4%) |
| Architecture & Engineering | 14 (30.4%) | 32 (69.6%) |
| Life, Physical & Social Science | 15 (48.4%) | 16 (51.6%) |
| Community & Social Service | 107 (46.1%) | 125 (53.9%) |
| Education, Arts & Media | 0 (0.0%) | 0 (0.0%) |
| Legal Services & Support | 30 (71.4%) | 12 (28.6%) |
| Education Instruction & Library | 47 (53.4%) | 41 (46.6%) |
| Arts, Media & Entertainment | 30 (29.4%) | 72 (70.6%) |
| Health Diagnosing & Treating | 66 (45.8%) | 78 (54.2%) |
| Health Technologists | 66 (45.8%) | 78 (54.2%) |
| Total (Category) | 775 (64.2%) | 432 (35.8%) |
| Total (Overall) | 924 (61.9%) | 570 (38.2%) |
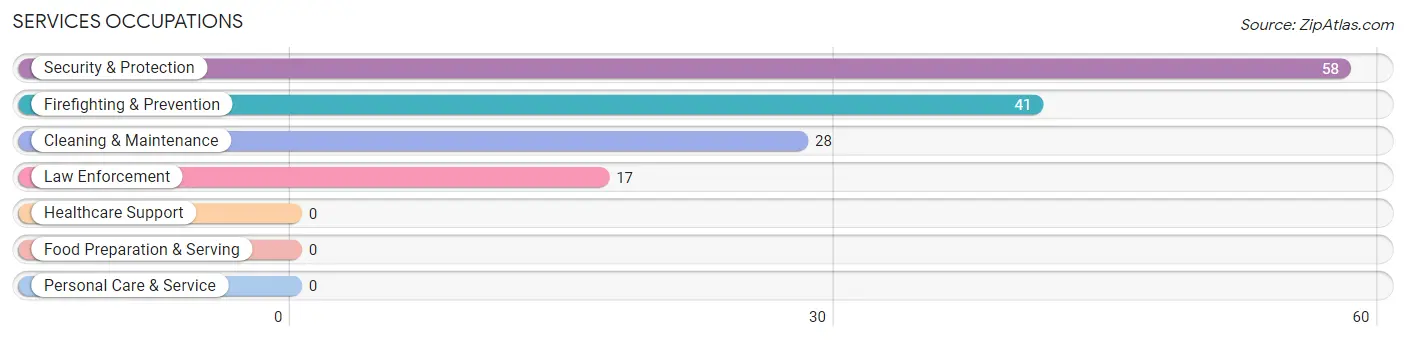
Services Occupations
The most common Services occupations in Portola Valley are Security & Protection (58 | 3.9%), Firefighting & Prevention (41 | 2.7%), Cleaning & Maintenance (28 | 1.9%), and Law Enforcement (17 | 1.1%).
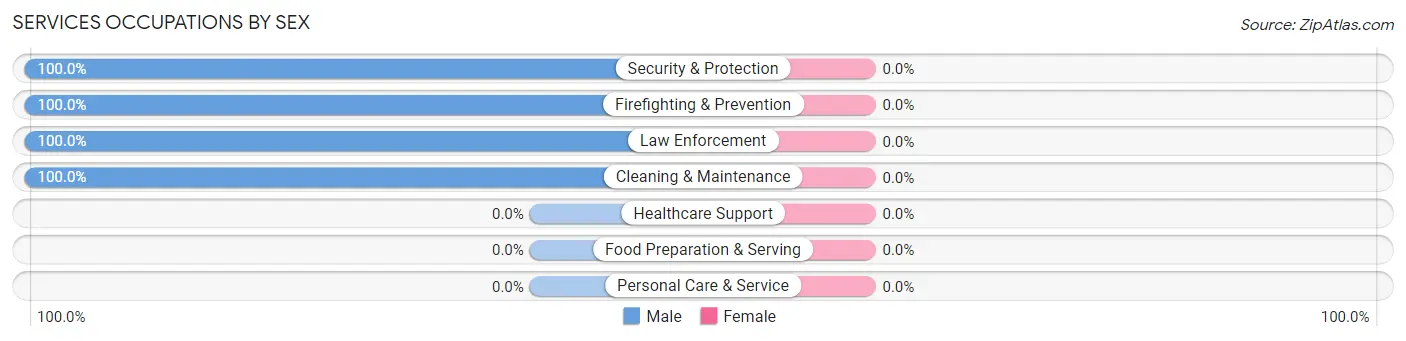
Services Occupations by Sex
| Occupation | Male | Female |
| Healthcare Support | 0 (0.0%) | 0 (0.0%) |
| Security & Protection | 58 (100.0%) | 0 (0.0%) |
| Firefighting & Prevention | 41 (100.0%) | 0 (0.0%) |
| Law Enforcement | 17 (100.0%) | 0 (0.0%) |
| Food Preparation & Serving | 0 (0.0%) | 0 (0.0%) |
| Cleaning & Maintenance | 28 (100.0%) | 0 (0.0%) |
| Personal Care & Service | 0 (0.0%) | 0 (0.0%) |
| Total (Category) | 86 (100.0%) | 0 (0.0%) |
| Total (Overall) | 924 (61.9%) | 570 (38.2%) |
Sales and Office Occupations
The most common Sales and Office occupations in Portola Valley are Sales & Related (138 | 9.2%), and Office & Administration (42 | 2.8%).
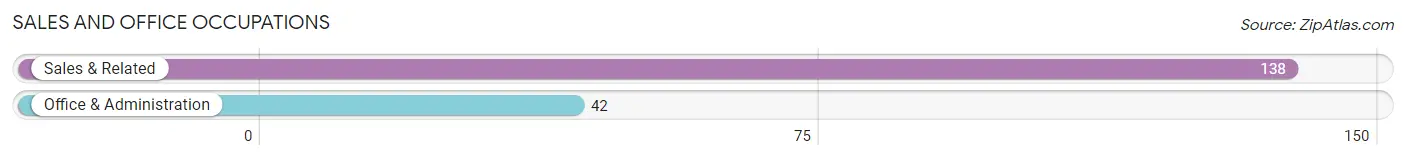
Sales and Office Occupations by Sex
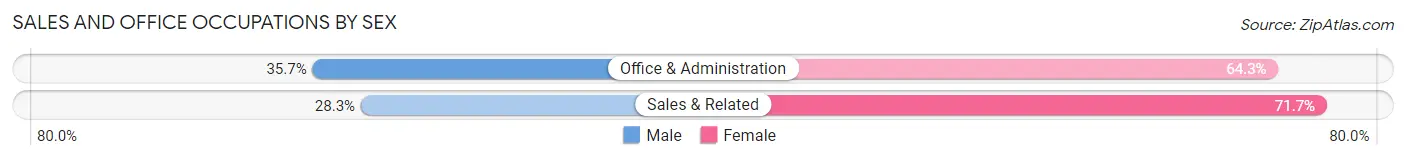
| Occupation | Male | Female |
| Sales & Related | 39 (28.3%) | 99 (71.7%) |
| Office & Administration | 15 (35.7%) | 27 (64.3%) |
| Total (Category) | 54 (30.0%) | 126 (70.0%) |
| Total (Overall) | 924 (61.9%) | 570 (38.2%) |
Natural Resources, Construction and Maintenance Occupations
The most common Natural Resources, Construction and Maintenance occupations in Portola Valley are , and Construction & Extraction (9 | 0.6%).
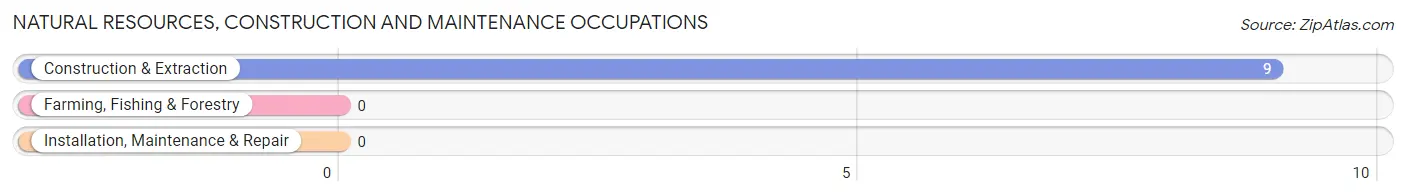
Natural Resources, Construction and Maintenance Occupations by Sex
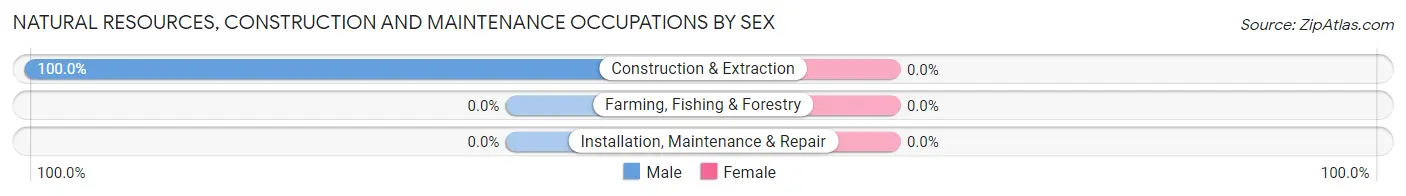
| Occupation | Male | Female |
| Farming, Fishing & Forestry | 0 (0.0%) | 0 (0.0%) |
| Construction & Extraction | 9 (100.0%) | 0 (0.0%) |
| Installation, Maintenance & Repair | 0 (0.0%) | 0 (0.0%) |
| Total (Category) | 9 (100.0%) | 0 (0.0%) |
| Total (Overall) | 924 (61.9%) | 570 (38.2%) |
Production, Transportation and Moving Occupations
The most common Production, Transportation and Moving occupations in Portola Valley are , and Transportation (12 | 0.8%).
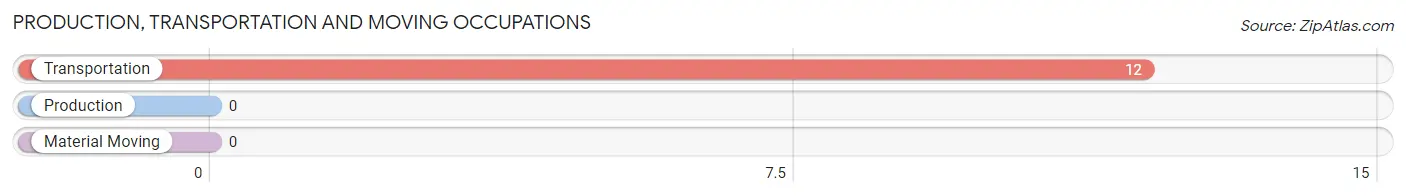
Production, Transportation and Moving Occupations by Sex
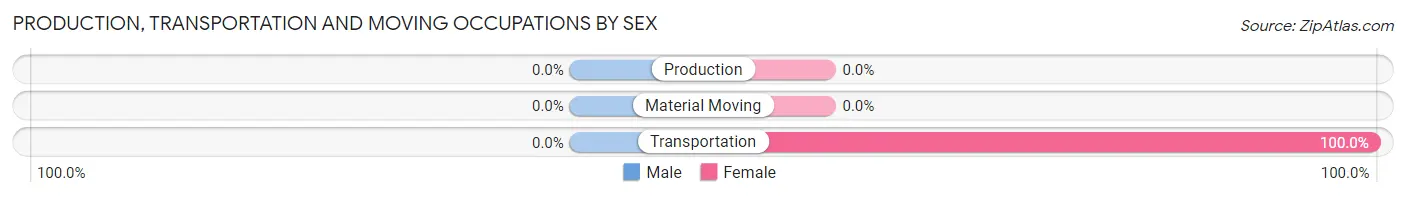
| Occupation | Male | Female |
| Production | 0 (0.0%) | 0 (0.0%) |
| Transportation | 0 (0.0%) | 12 (100.0%) |
| Material Moving | 0 (0.0%) | 0 (0.0%) |
| Total (Category) | 0 (0.0%) | 12 (100.0%) |
| Total (Overall) | 924 (61.9%) | 570 (38.2%) |
Employment Industries by Sex in Portola Valley
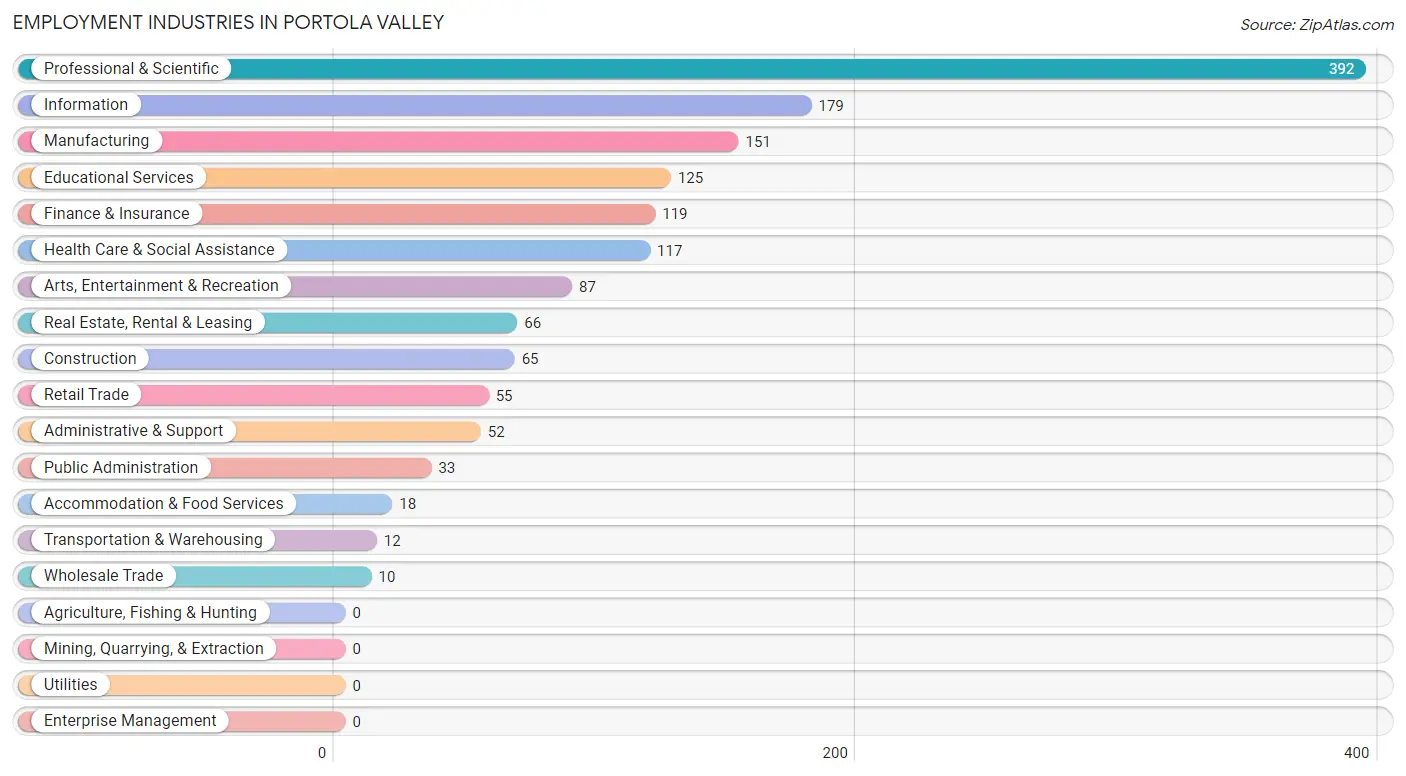
Employment Industries in Portola Valley
The major employment industries in Portola Valley include Professional & Scientific (392 | 26.2%), Information (179 | 12.0%), Manufacturing (151 | 10.1%), Educational Services (125 | 8.4%), and Finance & Insurance (119 | 8.0%).
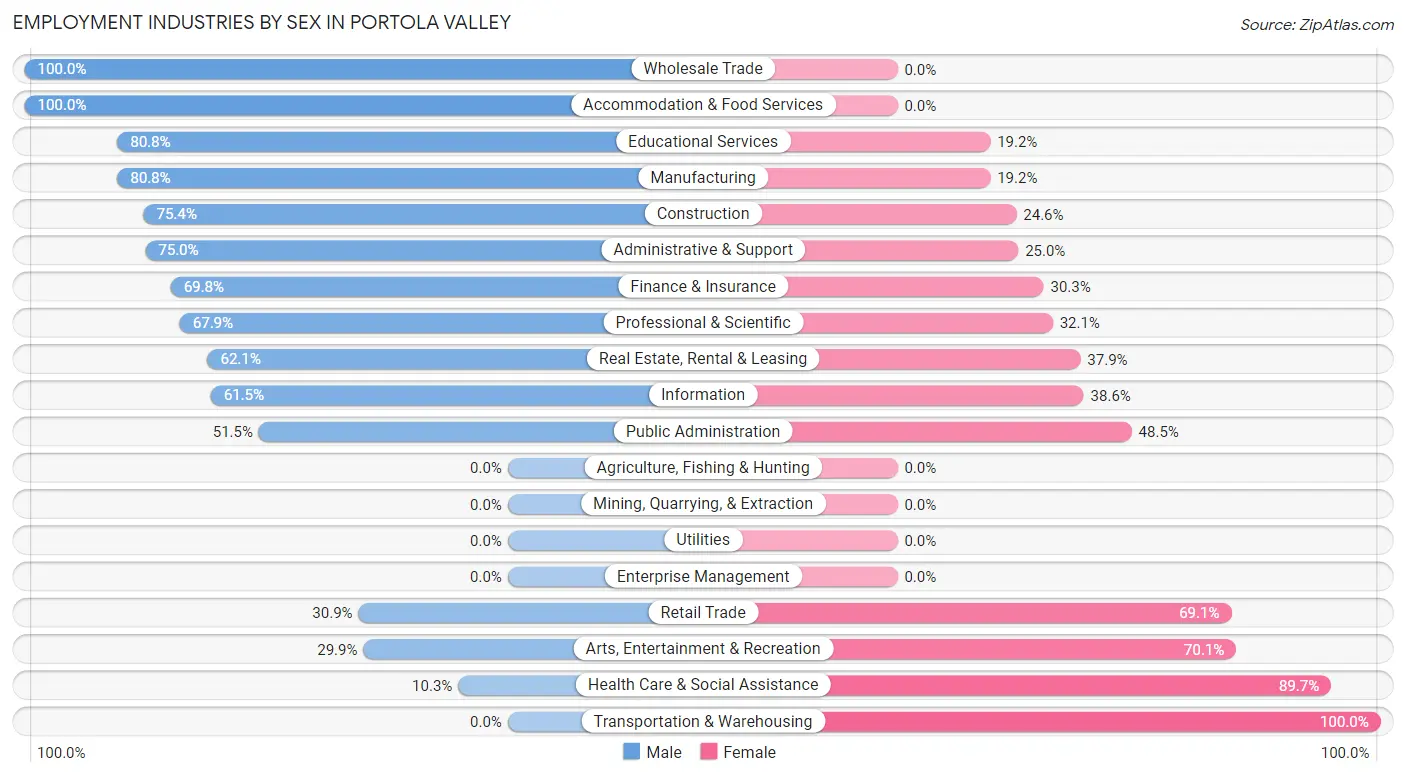
Employment Industries by Sex in Portola Valley
The Portola Valley industries that see more men than women are Wholesale Trade (100.0%), Accommodation & Food Services (100.0%), and Educational Services (80.8%), whereas the industries that tend to have a higher number of women are Transportation & Warehousing (100.0%), Health Care & Social Assistance (89.7%), and Arts, Entertainment & Recreation (70.1%).
| Industry | Male | Female |
| Agriculture, Fishing & Hunting | 0 (0.0%) | 0 (0.0%) |
| Mining, Quarrying, & Extraction | 0 (0.0%) | 0 (0.0%) |
| Construction | 49 (75.4%) | 16 (24.6%) |
| Manufacturing | 122 (80.8%) | 29 (19.2%) |
| Wholesale Trade | 10 (100.0%) | 0 (0.0%) |
| Retail Trade | 17 (30.9%) | 38 (69.1%) |
| Transportation & Warehousing | 0 (0.0%) | 12 (100.0%) |
| Utilities | 0 (0.0%) | 0 (0.0%) |
| Information | 110 (61.5%) | 69 (38.6%) |
| Finance & Insurance | 83 (69.8%) | 36 (30.2%) |
| Real Estate, Rental & Leasing | 41 (62.1%) | 25 (37.9%) |
| Professional & Scientific | 266 (67.9%) | 126 (32.1%) |
| Enterprise Management | 0 (0.0%) | 0 (0.0%) |
| Administrative & Support | 39 (75.0%) | 13 (25.0%) |
| Educational Services | 101 (80.8%) | 24 (19.2%) |
| Health Care & Social Assistance | 12 (10.3%) | 105 (89.7%) |
| Arts, Entertainment & Recreation | 26 (29.9%) | 61 (70.1%) |
| Accommodation & Food Services | 18 (100.0%) | 0 (0.0%) |
| Public Administration | 17 (51.5%) | 16 (48.5%) |
| Total | 924 (61.9%) | 570 (38.2%) |
Education in Portola Valley
School Enrollment in Portola Valley
The most common levels of schooling among the 1,001 students in Portola Valley are high school (221 | 22.1%), college / undergraduate (211 | 21.1%), and elementary school (170 | 17.0%).
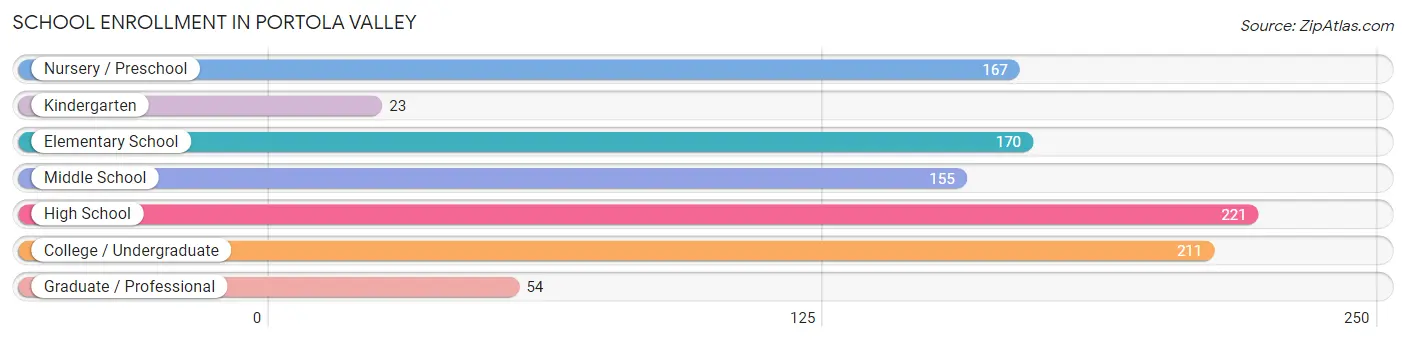
| School Level | # Students | % Students |
| Nursery / Preschool | 167 | 16.7% |
| Kindergarten | 23 | 2.3% |
| Elementary School | 170 | 17.0% |
| Middle School | 155 | 15.5% |
| High School | 221 | 22.1% |
| College / Undergraduate | 211 | 21.1% |
| Graduate / Professional | 54 | 5.4% |
| Total | 1,001 | 100.0% |
School Enrollment by Age by Funding Source in Portola Valley
Out of a total of 1,001 students who are enrolled in schools in Portola Valley, 513 (51.2%) attend a private institution, while the remaining 488 (48.8%) are enrolled in public schools. The age group of 20 to 24 year olds has the highest likelihood of being enrolled in private schools, with 96 (78.0% in the age bracket) enrolled. Conversely, the age group of 25 to 34 year olds has the lowest likelihood of being enrolled in a private school, with 15 (100.0% in the age bracket) attending a public institution.
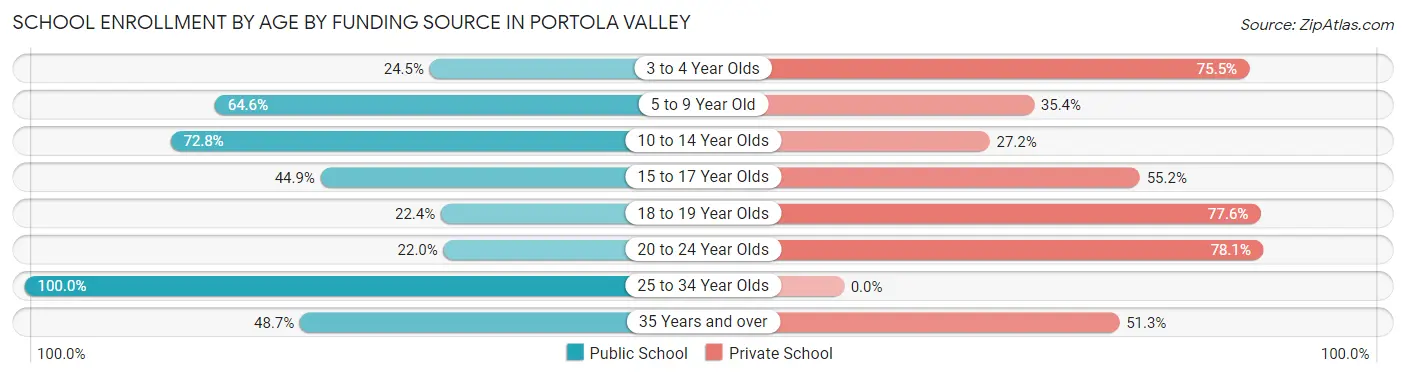
| Age Bracket | Public School | Private School |
| 3 to 4 Year Olds | 26 (24.5%) | 80 (75.5%) |
| 5 to 9 Year Old | 164 (64.6%) | 90 (35.4%) |
| 10 to 14 Year Olds | 134 (72.8%) | 50 (27.2%) |
| 15 to 17 Year Olds | 61 (44.9%) | 75 (55.1%) |
| 18 to 19 Year Olds | 24 (22.4%) | 83 (77.6%) |
| 20 to 24 Year Olds | 27 (22.0%) | 96 (78.0%) |
| 25 to 34 Year Olds | 15 (100.0%) | 0 (0.0%) |
| 35 Years and over | 37 (48.7%) | 39 (51.3%) |
| Total | 488 (48.8%) | 513 (51.2%) |
Educational Attainment by Field of Study in Portola Valley
Social sciences (499 | 16.8%), engineering (402 | 13.5%), business (304 | 10.2%), bio, nature & agricultural (292 | 9.8%), and literature & languages (280 | 9.4%) are the most common fields of study among 2,972 individuals in Portola Valley who have obtained a bachelor's degree or higher.
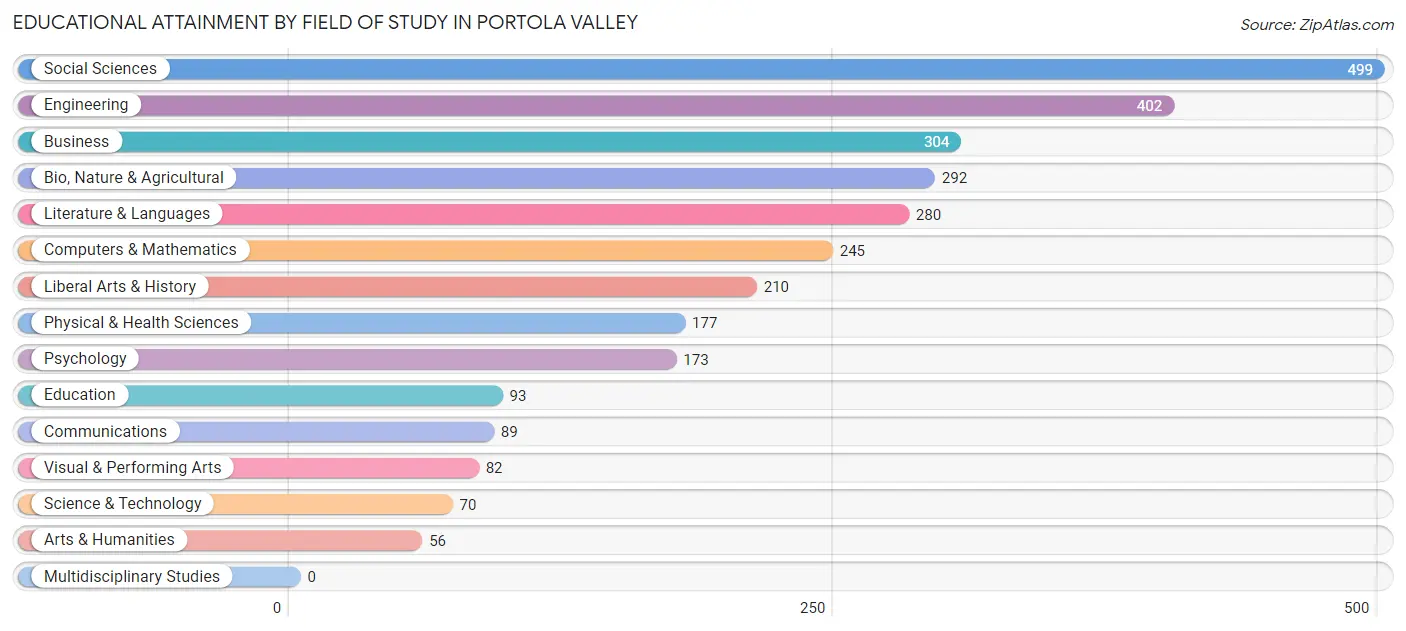
| Field of Study | # Graduates | % Graduates |
| Computers & Mathematics | 245 | 8.2% |
| Bio, Nature & Agricultural | 292 | 9.8% |
| Physical & Health Sciences | 177 | 6.0% |
| Psychology | 173 | 5.8% |
| Social Sciences | 499 | 16.8% |
| Engineering | 402 | 13.5% |
| Multidisciplinary Studies | 0 | 0.0% |
| Science & Technology | 70 | 2.4% |
| Business | 304 | 10.2% |
| Education | 93 | 3.1% |
| Literature & Languages | 280 | 9.4% |
| Liberal Arts & History | 210 | 7.1% |
| Visual & Performing Arts | 82 | 2.8% |
| Communications | 89 | 3.0% |
| Arts & Humanities | 56 | 1.9% |
| Total | 2,972 | 100.0% |
Transportation & Commute in Portola Valley
Vehicle Availability by Sex in Portola Valley
The most prevalent vehicle ownership categories in Portola Valley are males with 2 vehicles (311, accounting for 33.7%) and females with 2 vehicles (151, making up 54.6%).
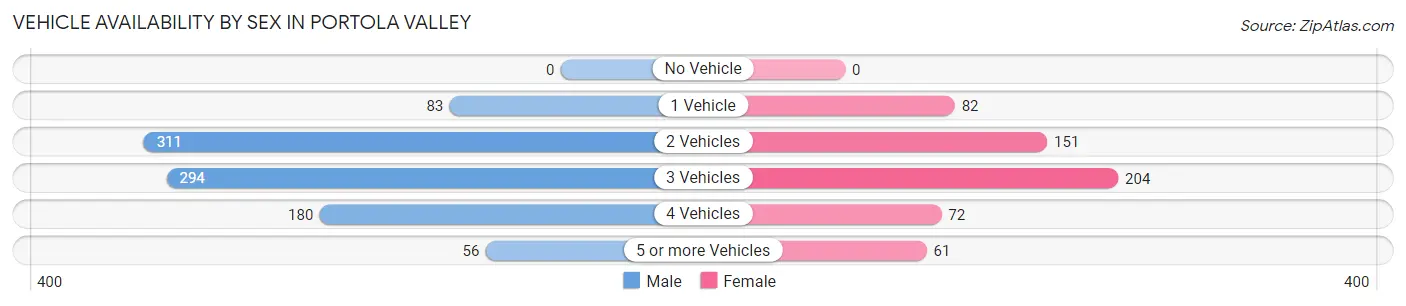
| Vehicles Available | Male | Female |
| No Vehicle | 0 (0.0%) | 0 (0.0%) |
| 1 Vehicle | 83 (9.0%) | 82 (14.4%) |
| 2 Vehicles | 311 (33.7%) | 151 (26.5%) |
| 3 Vehicles | 294 (31.8%) | 204 (35.8%) |
| 4 Vehicles | 180 (19.5%) | 72 (12.6%) |
| 5 or more Vehicles | 56 (6.1%) | 61 (10.7%) |
| Total | 924 (100.0%) | 570 (100.0%) |
Commute Time in Portola Valley
The most frequently occuring commute durations in Portola Valley are 20 to 24 minutes (194 commuters, 26.7%), 35 to 39 minutes (132 commuters, 18.1%), and 30 to 34 minutes (105 commuters, 14.4%).
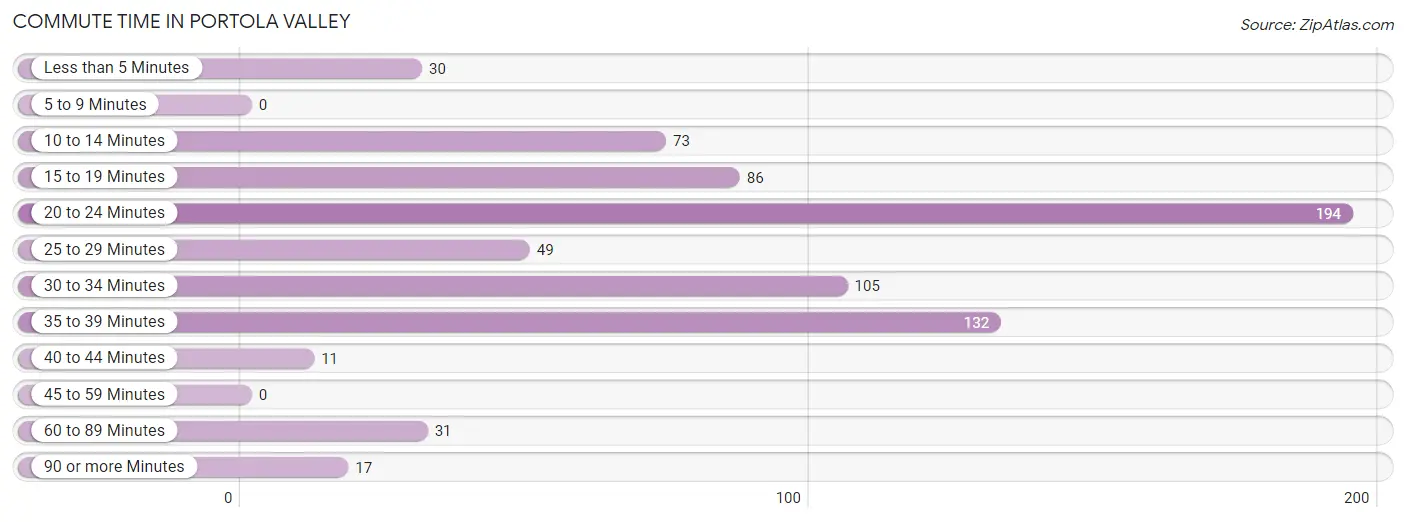
| Commute Time | # Commuters | % Commuters |
| Less than 5 Minutes | 30 | 4.1% |
| 5 to 9 Minutes | 0 | 0.0% |
| 10 to 14 Minutes | 73 | 10.0% |
| 15 to 19 Minutes | 86 | 11.8% |
| 20 to 24 Minutes | 194 | 26.7% |
| 25 to 29 Minutes | 49 | 6.7% |
| 30 to 34 Minutes | 105 | 14.4% |
| 35 to 39 Minutes | 132 | 18.1% |
| 40 to 44 Minutes | 11 | 1.5% |
| 45 to 59 Minutes | 0 | 0.0% |
| 60 to 89 Minutes | 31 | 4.3% |
| 90 or more Minutes | 17 | 2.3% |
Commute Time by Sex in Portola Valley
The most common commute times in Portola Valley are 35 to 39 minutes (119 commuters, 25.9%) for males and 20 to 24 minutes (90 commuters, 33.5%) for females.
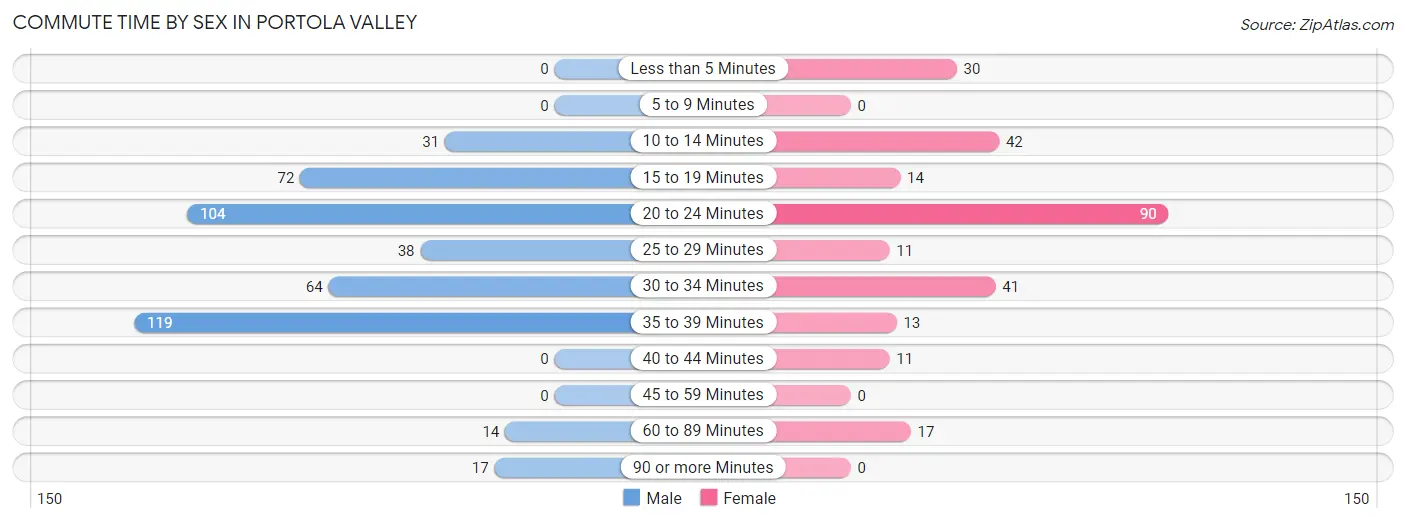
| Commute Time | Male | Female |
| Less than 5 Minutes | 0 (0.0%) | 30 (11.2%) |
| 5 to 9 Minutes | 0 (0.0%) | 0 (0.0%) |
| 10 to 14 Minutes | 31 (6.8%) | 42 (15.6%) |
| 15 to 19 Minutes | 72 (15.7%) | 14 (5.2%) |
| 20 to 24 Minutes | 104 (22.7%) | 90 (33.5%) |
| 25 to 29 Minutes | 38 (8.3%) | 11 (4.1%) |
| 30 to 34 Minutes | 64 (13.9%) | 41 (15.2%) |
| 35 to 39 Minutes | 119 (25.9%) | 13 (4.8%) |
| 40 to 44 Minutes | 0 (0.0%) | 11 (4.1%) |
| 45 to 59 Minutes | 0 (0.0%) | 0 (0.0%) |
| 60 to 89 Minutes | 14 (3.0%) | 17 (6.3%) |
| 90 or more Minutes | 17 (3.7%) | 0 (0.0%) |
Time of Departure to Work by Sex in Portola Valley
The most frequent times of departure to work in Portola Valley are 9:00 AM to 9:59 AM (92, 20.0%) for males and 8:30 AM to 8:59 AM (81, 30.1%) for females.
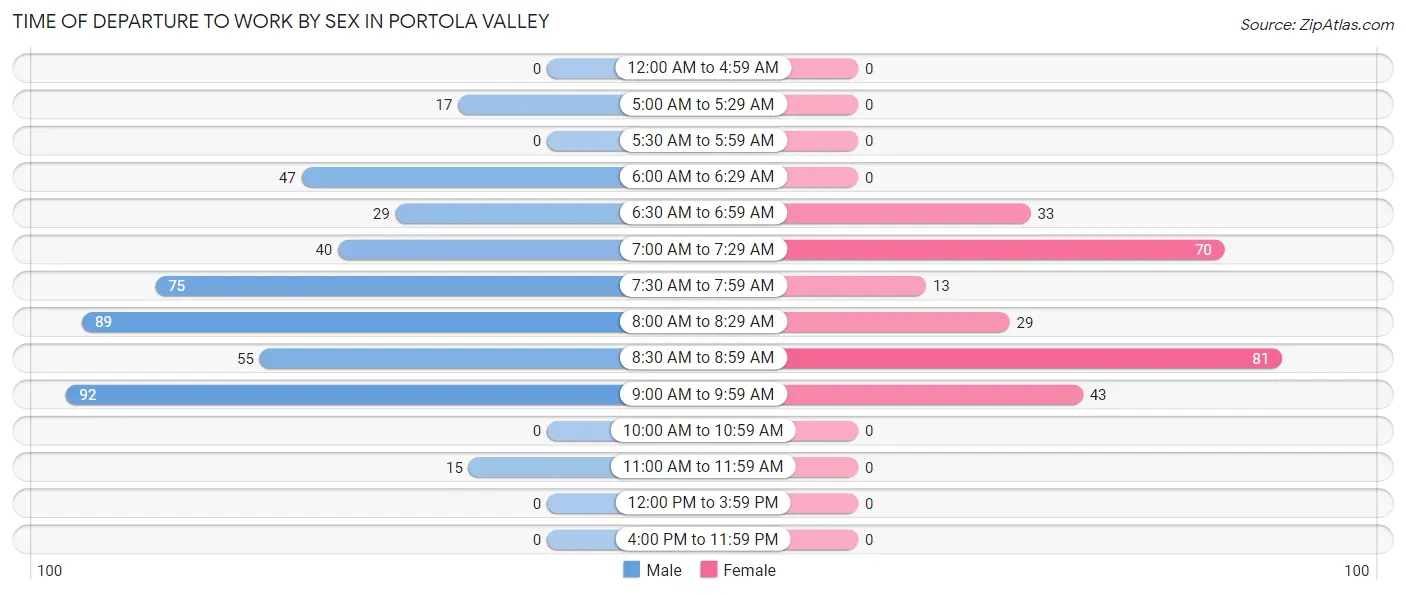
| Time of Departure | Male | Female |
| 12:00 AM to 4:59 AM | 0 (0.0%) | 0 (0.0%) |
| 5:00 AM to 5:29 AM | 17 (3.7%) | 0 (0.0%) |
| 5:30 AM to 5:59 AM | 0 (0.0%) | 0 (0.0%) |
| 6:00 AM to 6:29 AM | 47 (10.2%) | 0 (0.0%) |
| 6:30 AM to 6:59 AM | 29 (6.3%) | 33 (12.3%) |
| 7:00 AM to 7:29 AM | 40 (8.7%) | 70 (26.0%) |
| 7:30 AM to 7:59 AM | 75 (16.3%) | 13 (4.8%) |
| 8:00 AM to 8:29 AM | 89 (19.4%) | 29 (10.8%) |
| 8:30 AM to 8:59 AM | 55 (12.0%) | 81 (30.1%) |
| 9:00 AM to 9:59 AM | 92 (20.0%) | 43 (16.0%) |
| 10:00 AM to 10:59 AM | 0 (0.0%) | 0 (0.0%) |
| 11:00 AM to 11:59 AM | 15 (3.3%) | 0 (0.0%) |
| 12:00 PM to 3:59 PM | 0 (0.0%) | 0 (0.0%) |
| 4:00 PM to 11:59 PM | 0 (0.0%) | 0 (0.0%) |
| Total | 459 (100.0%) | 269 (100.0%) |
Housing Occupancy in Portola Valley
Occupancy by Ownership in Portola Valley
Of the total 1,692 dwellings in Portola Valley, owner-occupied units account for 1,385 (81.9%), while renter-occupied units make up 307 (18.1%).
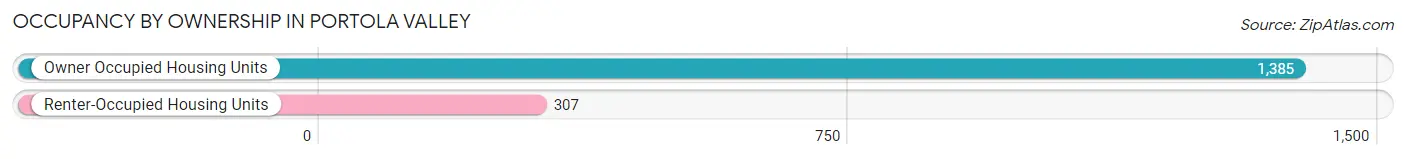
| Occupancy | # Housing Units | % Housing Units |
| Owner Occupied Housing Units | 1,385 | 81.9% |
| Renter-Occupied Housing Units | 307 | 18.1% |
| Total Occupied Housing Units | 1,692 | 100.0% |
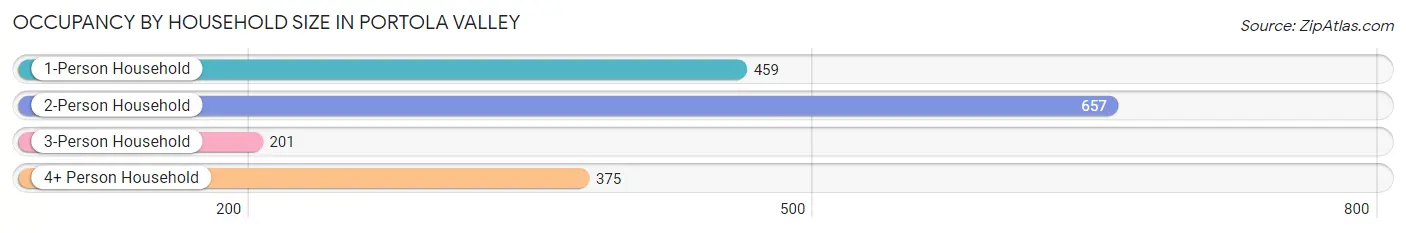
Occupancy by Household Size in Portola Valley
| Household Size | # Housing Units | % Housing Units |
| 1-Person Household | 459 | 27.1% |
| 2-Person Household | 657 | 38.8% |
| 3-Person Household | 201 | 11.9% |
| 4+ Person Household | 375 | 22.2% |
| Total Housing Units | 1,692 | 100.0% |
Occupancy by Ownership by Household Size in Portola Valley
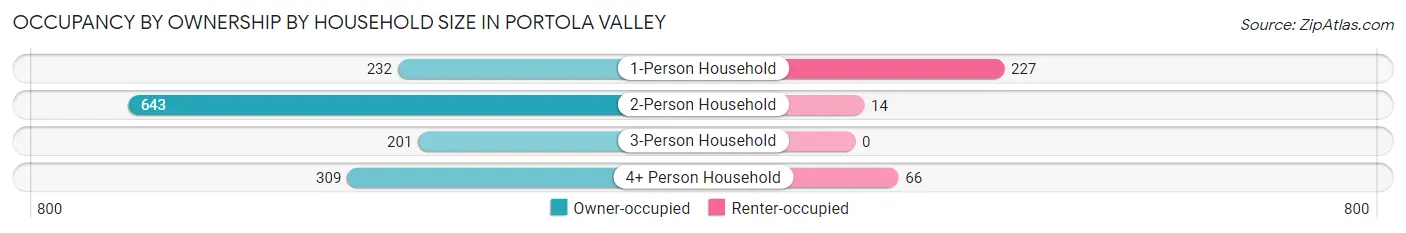
| Household Size | Owner-occupied | Renter-occupied |
| 1-Person Household | 232 (50.5%) | 227 (49.5%) |
| 2-Person Household | 643 (97.9%) | 14 (2.1%) |
| 3-Person Household | 201 (100.0%) | 0 (0.0%) |
| 4+ Person Household | 309 (82.4%) | 66 (17.6%) |
| Total Housing Units | 1,385 (81.9%) | 307 (18.1%) |
Occupancy by Educational Attainment in Portola Valley
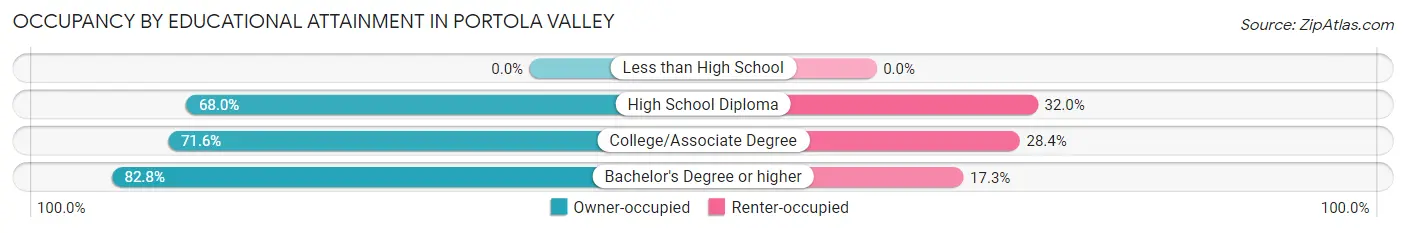
| Household Size | Owner-occupied | Renter-occupied |
| Less than High School | 0 (0.0%) | 0 (0.0%) |
| High School Diploma | 17 (68.0%) | 8 (32.0%) |
| College/Associate Degree | 73 (71.6%) | 29 (28.4%) |
| Bachelor's Degree or higher | 1,295 (82.8%) | 270 (17.2%) |
Occupancy by Age of Householder in Portola Valley
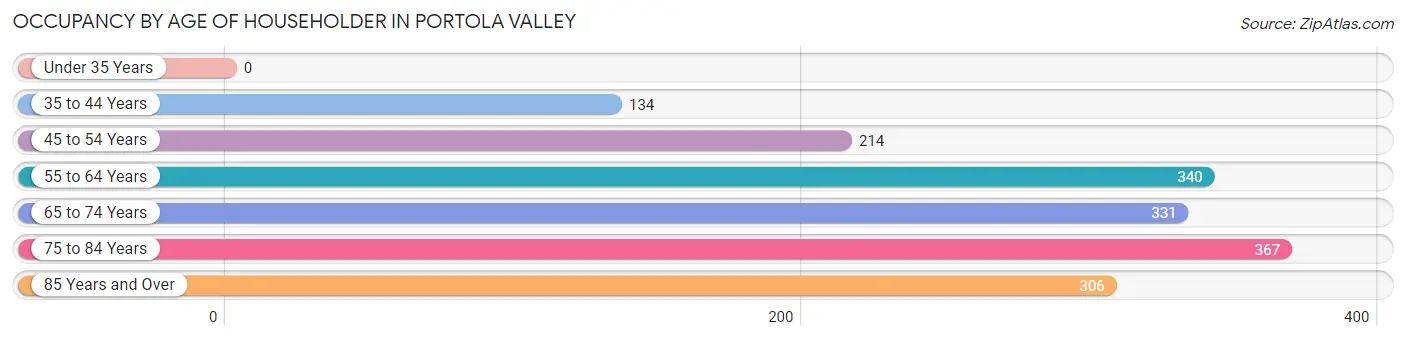
| Age Bracket | # Households | % Households |
| Under 35 Years | 0 | 0.0% |
| 35 to 44 Years | 134 | 7.9% |
| 45 to 54 Years | 214 | 12.7% |
| 55 to 64 Years | 340 | 20.1% |
| 65 to 74 Years | 331 | 19.6% |
| 75 to 84 Years | 367 | 21.7% |
| 85 Years and Over | 306 | 18.1% |
| Total | 1,692 | 100.0% |
Housing Finances in Portola Valley
Median Income by Occupancy in Portola Valley
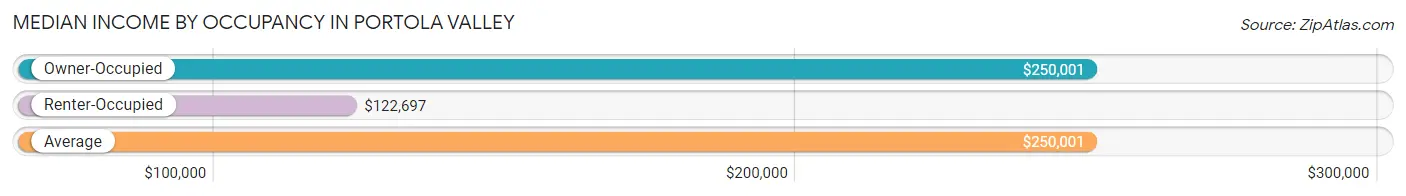
| Occupancy Type | # Households | Median Income |
| Owner-Occupied | 1,385 (81.9%) | $250,001 |
| Renter-Occupied | 307 (18.1%) | $122,697 |
| Average | 1,692 (100.0%) | $250,001 |
Occupancy by Householder Income Bracket in Portola Valley
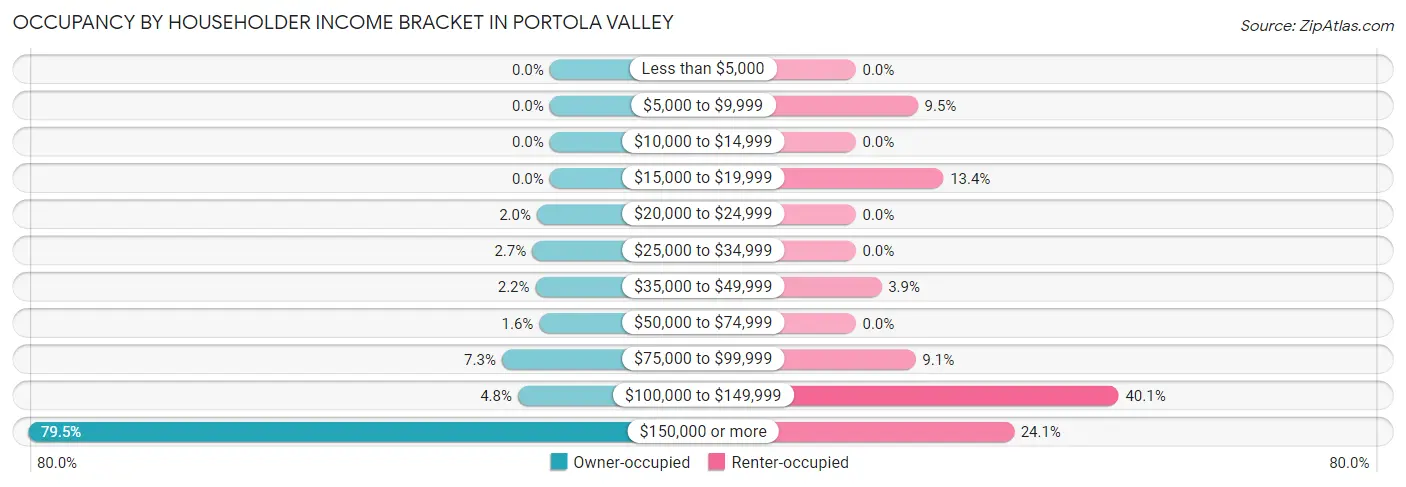
| Income Bracket | Owner-occupied | Renter-occupied |
| Less than $5,000 | 0 (0.0%) | 0 (0.0%) |
| $5,000 to $9,999 | 0 (0.0%) | 29 (9.5%) |
| $10,000 to $14,999 | 0 (0.0%) | 0 (0.0%) |
| $15,000 to $19,999 | 0 (0.0%) | 41 (13.4%) |
| $20,000 to $24,999 | 27 (1.9%) | 0 (0.0%) |
| $25,000 to $34,999 | 37 (2.7%) | 0 (0.0%) |
| $35,000 to $49,999 | 30 (2.2%) | 12 (3.9%) |
| $50,000 to $74,999 | 22 (1.6%) | 0 (0.0%) |
| $75,000 to $99,999 | 101 (7.3%) | 28 (9.1%) |
| $100,000 to $149,999 | 67 (4.8%) | 123 (40.1%) |
| $150,000 or more | 1,101 (79.5%) | 74 (24.1%) |
| Total | 1,385 (100.0%) | 307 (100.0%) |
Monthly Housing Cost Tiers in Portola Valley
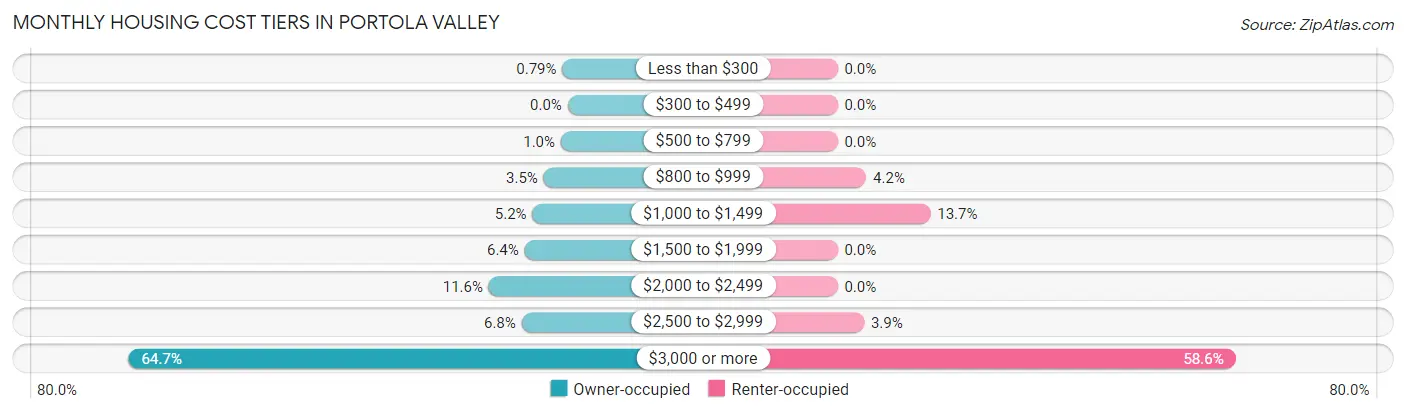
| Monthly Cost | Owner-occupied | Renter-occupied |
| Less than $300 | 11 (0.8%) | 0 (0.0%) |
| $300 to $499 | 0 (0.0%) | 0 (0.0%) |
| $500 to $799 | 14 (1.0%) | 0 (0.0%) |
| $800 to $999 | 49 (3.5%) | 13 (4.2%) |
| $1,000 to $1,499 | 72 (5.2%) | 42 (13.7%) |
| $1,500 to $1,999 | 88 (6.4%) | 0 (0.0%) |
| $2,000 to $2,499 | 161 (11.6%) | 0 (0.0%) |
| $2,500 to $2,999 | 94 (6.8%) | 12 (3.9%) |
| $3,000 or more | 896 (64.7%) | 180 (58.6%) |
| Total | 1,385 (100.0%) | 307 (100.0%) |
Physical Housing Characteristics in Portola Valley
Housing Structures in Portola Valley
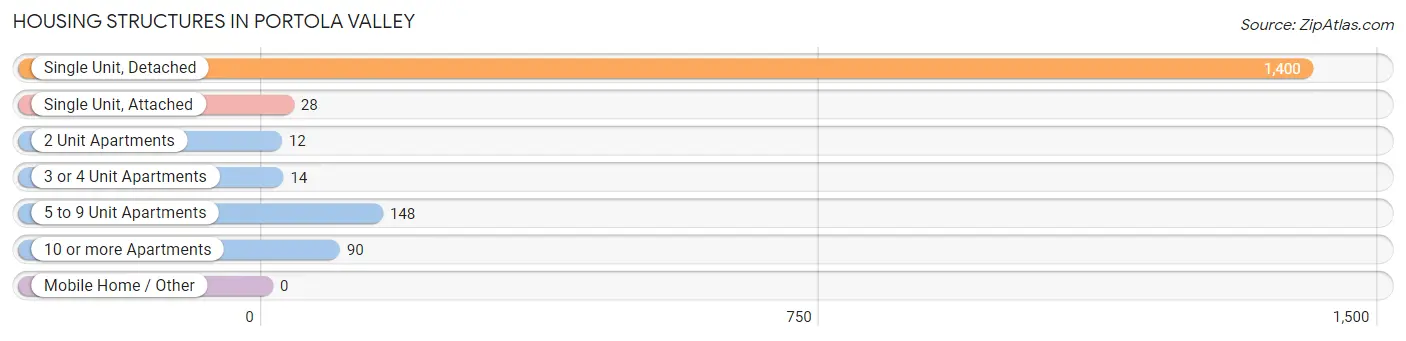
| Structure Type | # Housing Units | % Housing Units |
| Single Unit, Detached | 1,400 | 82.7% |
| Single Unit, Attached | 28 | 1.7% |
| 2 Unit Apartments | 12 | 0.7% |
| 3 or 4 Unit Apartments | 14 | 0.8% |
| 5 to 9 Unit Apartments | 148 | 8.7% |
| 10 or more Apartments | 90 | 5.3% |
| Mobile Home / Other | 0 | 0.0% |
| Total | 1,692 | 100.0% |
Housing Structures by Occupancy in Portola Valley
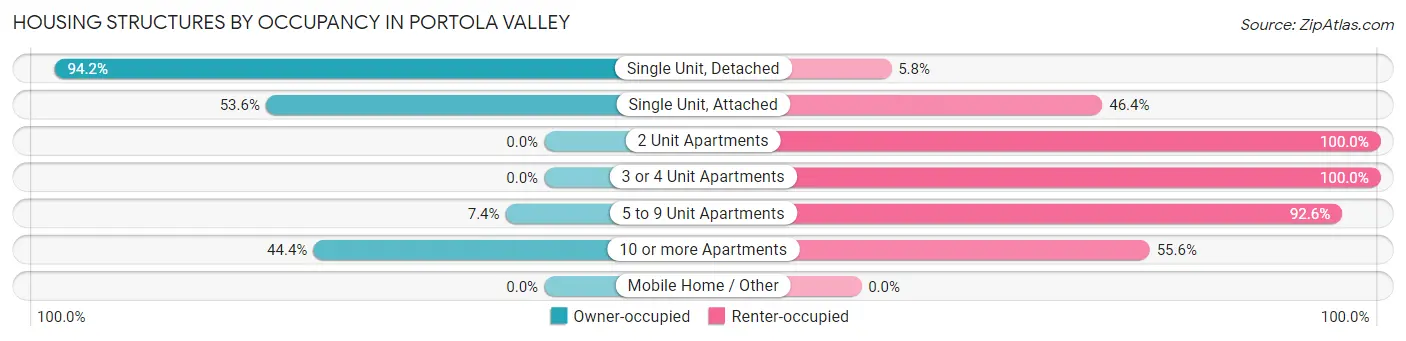
| Structure Type | Owner-occupied | Renter-occupied |
| Single Unit, Detached | 1,319 (94.2%) | 81 (5.8%) |
| Single Unit, Attached | 15 (53.6%) | 13 (46.4%) |
| 2 Unit Apartments | 0 (0.0%) | 12 (100.0%) |
| 3 or 4 Unit Apartments | 0 (0.0%) | 14 (100.0%) |
| 5 to 9 Unit Apartments | 11 (7.4%) | 137 (92.6%) |
| 10 or more Apartments | 40 (44.4%) | 50 (55.6%) |
| Mobile Home / Other | 0 (0.0%) | 0 (0.0%) |
| Total | 1,385 (81.9%) | 307 (18.1%) |
Housing Structures by Number of Rooms in Portola Valley
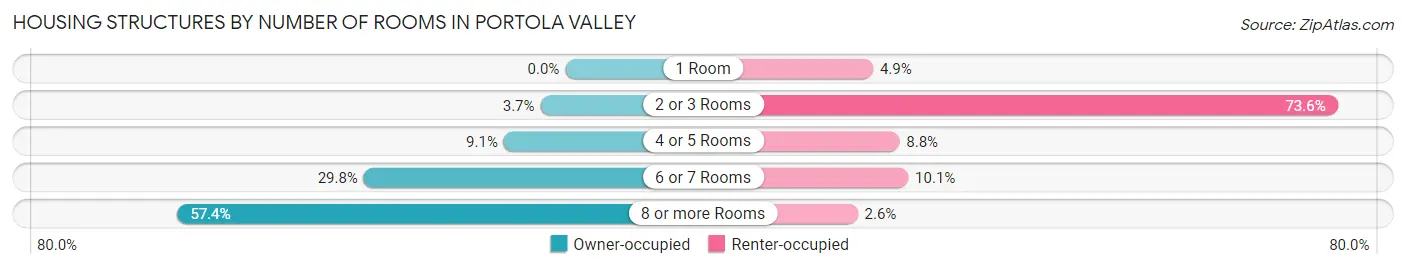
| Number of Rooms | Owner-occupied | Renter-occupied |
| 1 Room | 0 (0.0%) | 15 (4.9%) |
| 2 or 3 Rooms | 51 (3.7%) | 226 (73.6%) |
| 4 or 5 Rooms | 126 (9.1%) | 27 (8.8%) |
| 6 or 7 Rooms | 413 (29.8%) | 31 (10.1%) |
| 8 or more Rooms | 795 (57.4%) | 8 (2.6%) |
| Total | 1,385 (100.0%) | 307 (100.0%) |
Housing Structure by Heating Type in Portola Valley
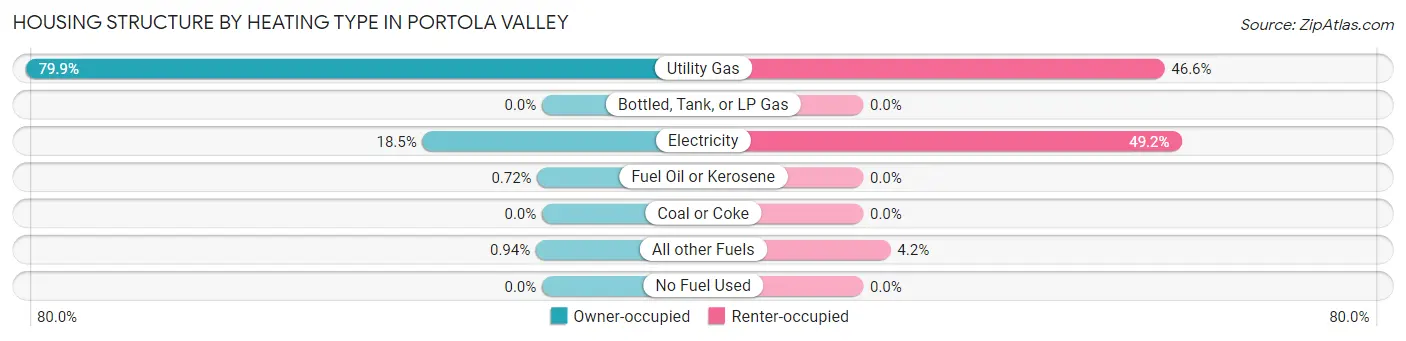
| Heating Type | Owner-occupied | Renter-occupied |
| Utility Gas | 1,106 (79.9%) | 143 (46.6%) |
| Bottled, Tank, or LP Gas | 0 (0.0%) | 0 (0.0%) |
| Electricity | 256 (18.5%) | 151 (49.2%) |
| Fuel Oil or Kerosene | 10 (0.7%) | 0 (0.0%) |
| Coal or Coke | 0 (0.0%) | 0 (0.0%) |
| All other Fuels | 13 (0.9%) | 13 (4.2%) |
| No Fuel Used | 0 (0.0%) | 0 (0.0%) |
| Total | 1,385 (100.0%) | 307 (100.0%) |
Household Vehicle Usage in Portola Valley
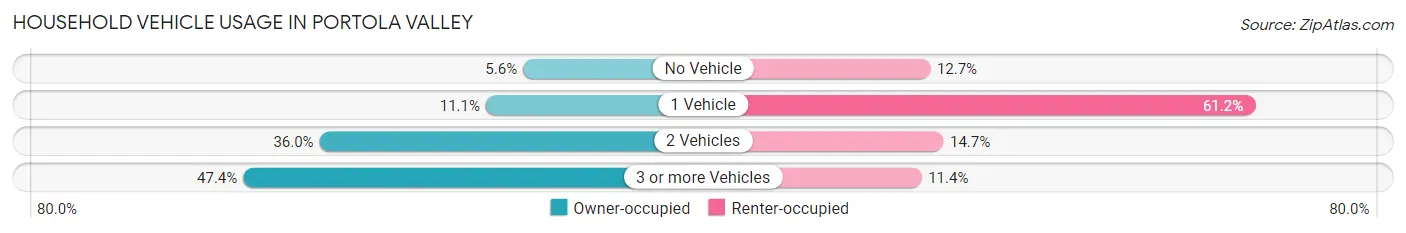
| Vehicles per Household | Owner-occupied | Renter-occupied |
| No Vehicle | 77 (5.6%) | 39 (12.7%) |
| 1 Vehicle | 154 (11.1%) | 188 (61.2%) |
| 2 Vehicles | 498 (36.0%) | 45 (14.7%) |
| 3 or more Vehicles | 656 (47.4%) | 35 (11.4%) |
| Total | 1,385 (100.0%) | 307 (100.0%) |
Real Estate & Mortgages in Portola Valley
Real Estate and Mortgage Overview in Portola Valley
| Characteristic | Without Mortgage | With Mortgage |
| Housing Units | 657 | 728 |
| Median Property Value | $2,000,001 | $2,000,001 |
| Median Household Income | $228,885 | $668 |
| Monthly Housing Costs | $1,501 | $653 |
| Real Estate Taxes | $10,001 | $0 |
Property Value by Mortgage Status in Portola Valley
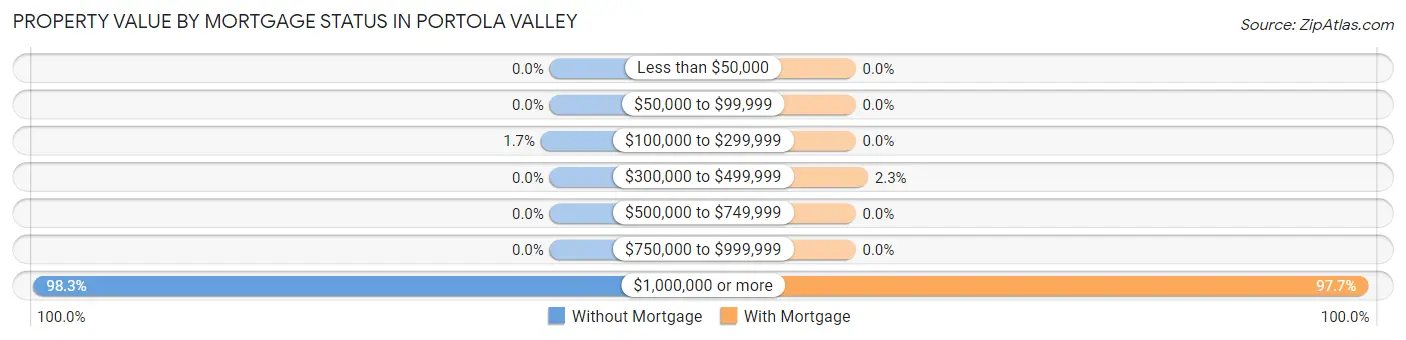
| Property Value | Without Mortgage | With Mortgage |
| Less than $50,000 | 0 (0.0%) | 0 (0.0%) |
| $50,000 to $99,999 | 0 (0.0%) | 0 (0.0%) |
| $100,000 to $299,999 | 11 (1.7%) | 0 (0.0%) |
| $300,000 to $499,999 | 0 (0.0%) | 17 (2.3%) |
| $500,000 to $749,999 | 0 (0.0%) | 0 (0.0%) |
| $750,000 to $999,999 | 0 (0.0%) | 0 (0.0%) |
| $1,000,000 or more | 646 (98.3%) | 711 (97.7%) |
| Total | 657 (100.0%) | 728 (100.0%) |
Household Income by Mortgage Status in Portola Valley
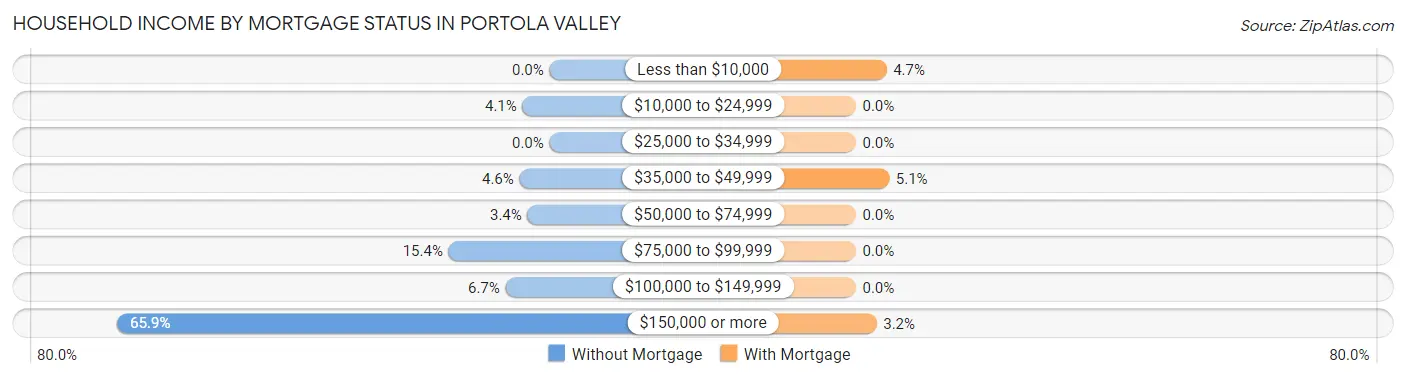
| Household Income | Without Mortgage | With Mortgage |
| Less than $10,000 | 0 (0.0%) | 34 (4.7%) |
| $10,000 to $24,999 | 27 (4.1%) | 0 (0.0%) |
| $25,000 to $34,999 | 0 (0.0%) | 0 (0.0%) |
| $35,000 to $49,999 | 30 (4.6%) | 37 (5.1%) |
| $50,000 to $74,999 | 22 (3.4%) | 0 (0.0%) |
| $75,000 to $99,999 | 101 (15.4%) | 0 (0.0%) |
| $100,000 to $149,999 | 44 (6.7%) | 0 (0.0%) |
| $150,000 or more | 433 (65.9%) | 23 (3.2%) |
| Total | 657 (100.0%) | 728 (100.0%) |
Property Value to Household Income Ratio in Portola Valley
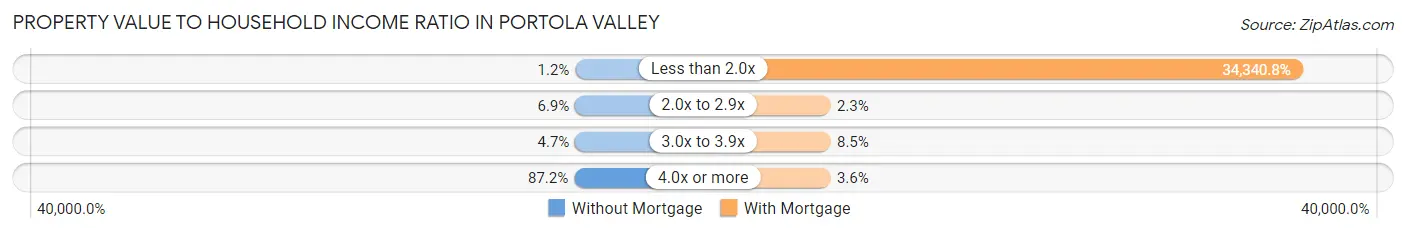
| Value-to-Income Ratio | Without Mortgage | With Mortgage |
| Less than 2.0x | 8 (1.2%) | 250,001 (34,340.8%) |
| 2.0x to 2.9x | 45 (6.9%) | 17 (2.3%) |
| 3.0x to 3.9x | 31 (4.7%) | 62 (8.5%) |
| 4.0x or more | 573 (87.2%) | 26 (3.6%) |
| Total | 657 (100.0%) | 728 (100.0%) |
Real Estate Taxes by Mortgage Status in Portola Valley
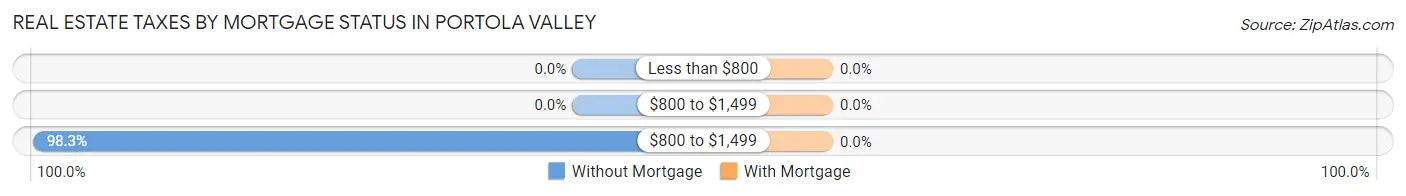
| Property Taxes | Without Mortgage | With Mortgage |
| Less than $800 | 0 (0.0%) | 0 (0.0%) |
| $800 to $1,499 | 0 (0.0%) | 0 (0.0%) |
| $800 to $1,499 | 646 (98.3%) | 0 (0.0%) |
| Total | 657 (100.0%) | 728 (100.0%) |
Health & Disability in Portola Valley
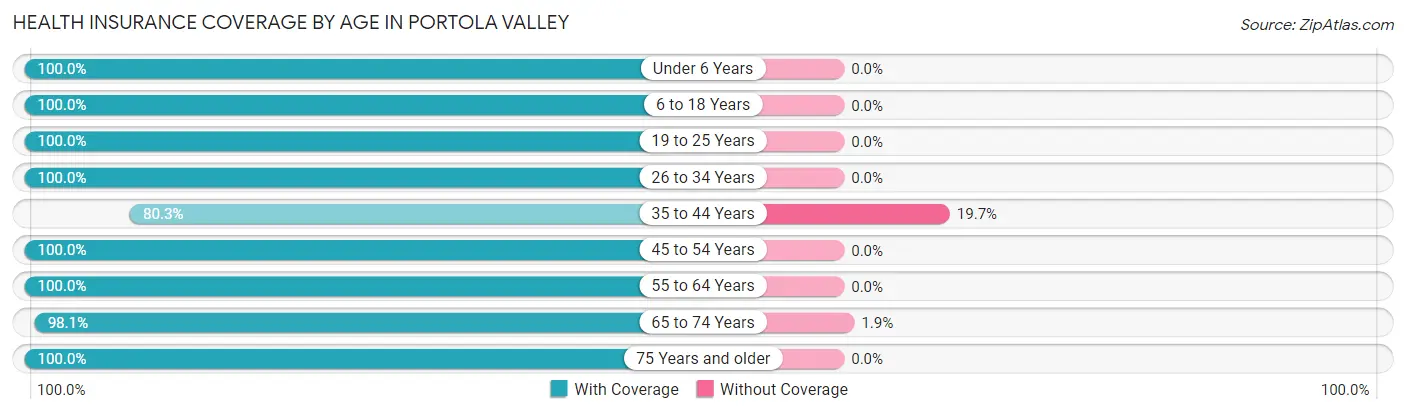
Health Insurance Coverage by Age in Portola Valley
| Age Bracket | With Coverage | Without Coverage |
| Under 6 Years | 314 (100.0%) | 0 (0.0%) |
| 6 to 18 Years | 527 (100.0%) | 0 (0.0%) |
| 19 to 25 Years | 238 (100.0%) | 0 (0.0%) |
| 26 to 34 Years | 49 (100.0%) | 0 (0.0%) |
| 35 to 44 Years | 261 (80.3%) | 64 (19.7%) |
| 45 to 54 Years | 545 (100.0%) | 0 (0.0%) |
| 55 to 64 Years | 668 (100.0%) | 0 (0.0%) |
| 65 to 74 Years | 724 (98.1%) | 14 (1.9%) |
| 75 Years and older | 958 (100.0%) | 0 (0.0%) |
| Total | 4,284 (98.2%) | 78 (1.8%) |
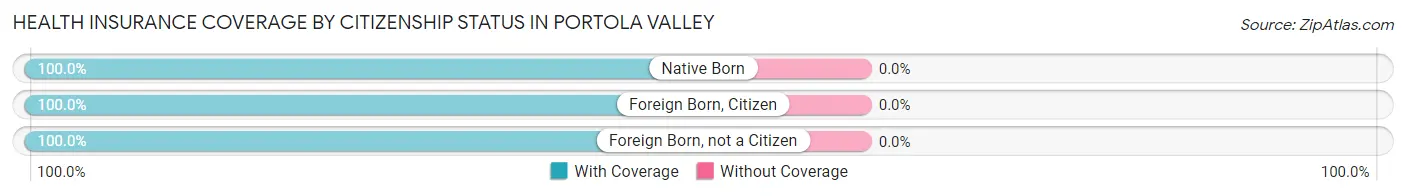
Health Insurance Coverage by Citizenship Status in Portola Valley
| Citizenship Status | With Coverage | Without Coverage |
| Native Born | 314 (100.0%) | 0 (0.0%) |
| Foreign Born, Citizen | 527 (100.0%) | 0 (0.0%) |
| Foreign Born, not a Citizen | 238 (100.0%) | 0 (0.0%) |
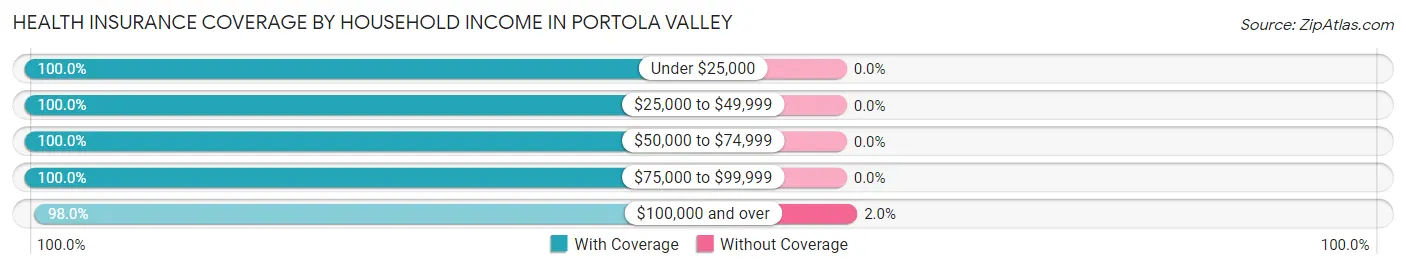
Health Insurance Coverage by Household Income in Portola Valley
| Household Income | With Coverage | Without Coverage |
| Under $25,000 | 112 (100.0%) | 0 (0.0%) |
| $25,000 to $49,999 | 97 (100.0%) | 0 (0.0%) |
| $50,000 to $74,999 | 46 (100.0%) | 0 (0.0%) |
| $75,000 to $99,999 | 214 (100.0%) | 0 (0.0%) |
| $100,000 and over | 3,805 (98.0%) | 76 (2.0%) |
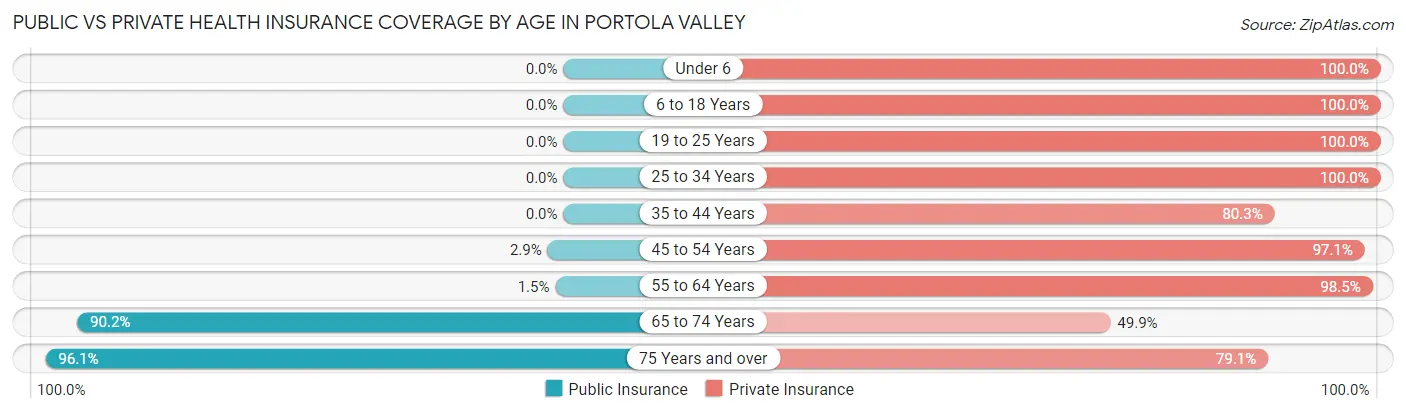
Public vs Private Health Insurance Coverage by Age in Portola Valley
| Age Bracket | Public Insurance | Private Insurance |
| Under 6 | 0 (0.0%) | 314 (100.0%) |
| 6 to 18 Years | 0 (0.0%) | 527 (100.0%) |
| 19 to 25 Years | 0 (0.0%) | 238 (100.0%) |
| 25 to 34 Years | 0 (0.0%) | 49 (100.0%) |
| 35 to 44 Years | 0 (0.0%) | 261 (80.3%) |
| 45 to 54 Years | 16 (2.9%) | 529 (97.1%) |
| 55 to 64 Years | 10 (1.5%) | 658 (98.5%) |
| 65 to 74 Years | 666 (90.2%) | 368 (49.9%) |
| 75 Years and over | 921 (96.1%) | 758 (79.1%) |
| Total | 1,613 (37.0%) | 3,702 (84.9%) |
Disability Status by Sex by Age in Portola Valley
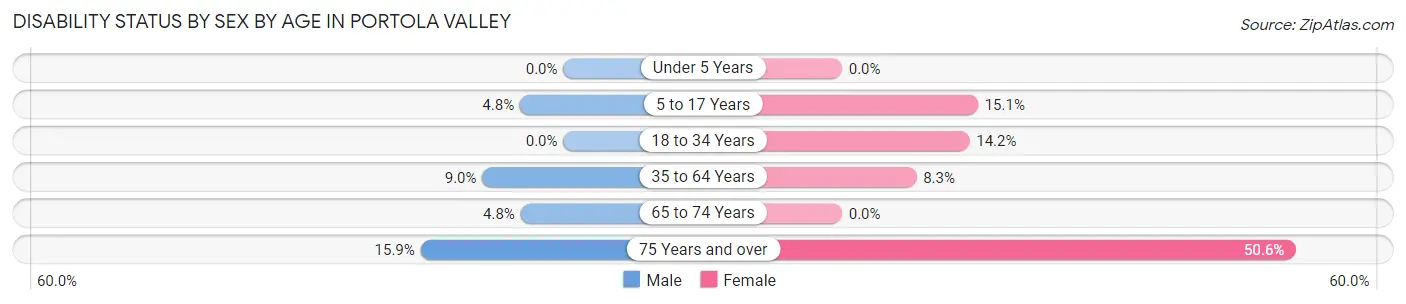
| Age Bracket | Male | Female |
| Under 5 Years | 0 (0.0%) | 0 (0.0%) |
| 5 to 17 Years | 14 (4.8%) | 43 (15.1%) |
| 18 to 34 Years | 0 (0.0%) | 24 (14.2%) |
| 35 to 64 Years | 68 (9.0%) | 65 (8.3%) |
| 65 to 74 Years | 15 (4.8%) | 0 (0.0%) |
| 75 Years and over | 59 (15.9%) | 297 (50.6%) |
Disability Class by Sex by Age in Portola Valley
Disability Class: Hearing Difficulty
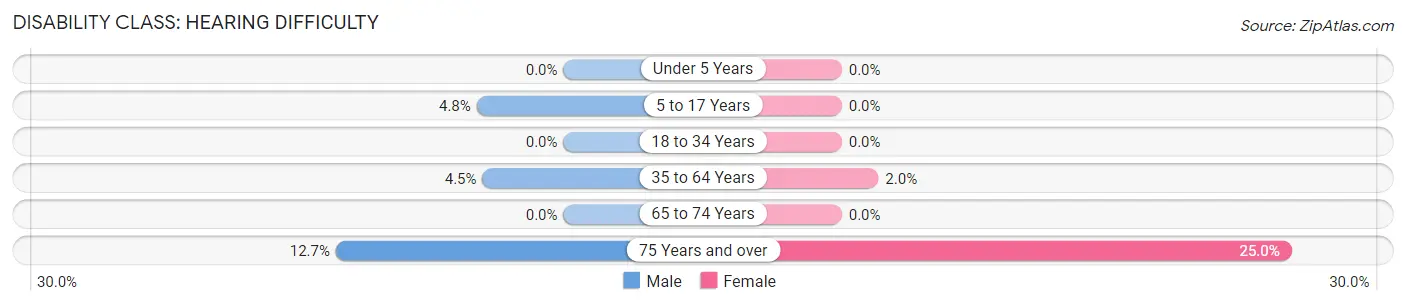
| Age Bracket | Male | Female |
| Under 5 Years | 0 (0.0%) | 0 (0.0%) |
| 5 to 17 Years | 14 (4.8%) | 0 (0.0%) |
| 18 to 34 Years | 0 (0.0%) | 0 (0.0%) |
| 35 to 64 Years | 34 (4.5%) | 16 (2.0%) |
| 65 to 74 Years | 0 (0.0%) | 0 (0.0%) |
| 75 Years and over | 47 (12.7%) | 147 (25.0%) |
Disability Class: Vision Difficulty
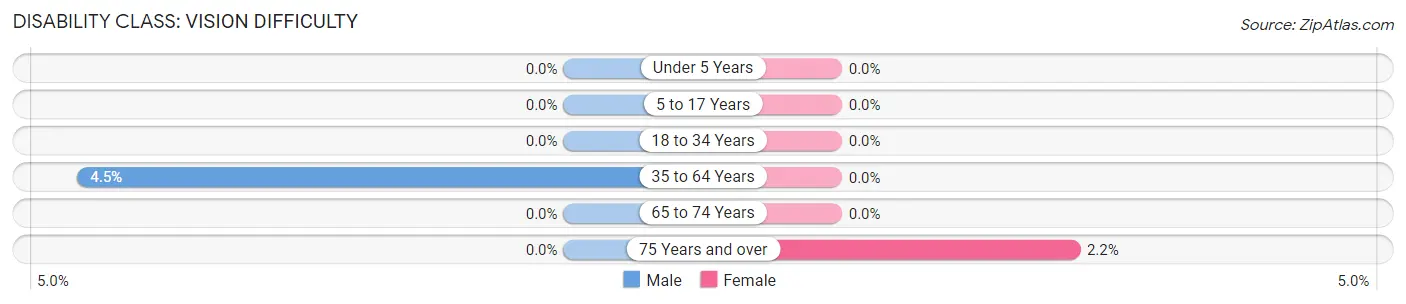
| Age Bracket | Male | Female |
| Under 5 Years | 0 (0.0%) | 0 (0.0%) |
| 5 to 17 Years | 0 (0.0%) | 0 (0.0%) |
| 18 to 34 Years | 0 (0.0%) | 0 (0.0%) |
| 35 to 64 Years | 34 (4.5%) | 0 (0.0%) |
| 65 to 74 Years | 0 (0.0%) | 0 (0.0%) |
| 75 Years and over | 0 (0.0%) | 13 (2.2%) |
Disability Class: Cognitive Difficulty
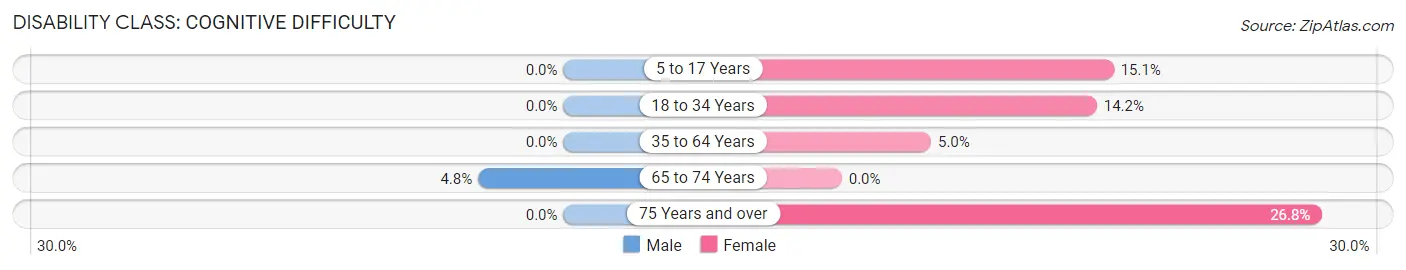
| Age Bracket | Male | Female |
| 5 to 17 Years | 0 (0.0%) | 43 (15.1%) |
| 18 to 34 Years | 0 (0.0%) | 24 (14.2%) |
| 35 to 64 Years | 0 (0.0%) | 39 (5.0%) |
| 65 to 74 Years | 15 (4.8%) | 0 (0.0%) |
| 75 Years and over | 0 (0.0%) | 157 (26.8%) |
Disability Class: Ambulatory Difficulty
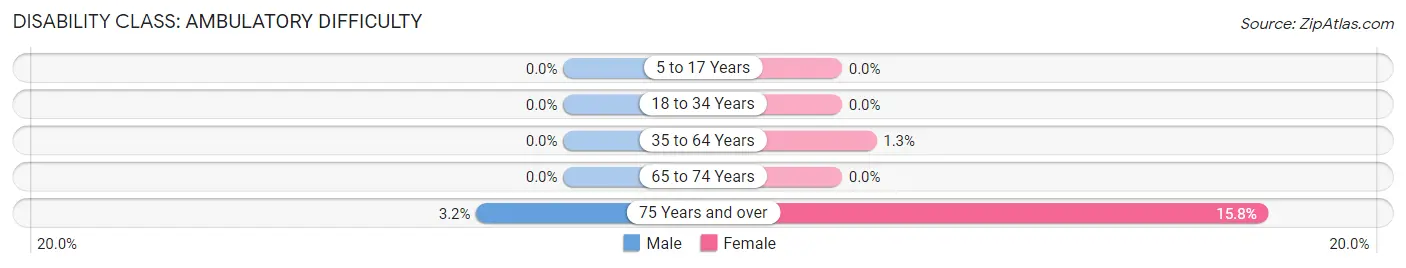
| Age Bracket | Male | Female |
| 5 to 17 Years | 0 (0.0%) | 0 (0.0%) |
| 18 to 34 Years | 0 (0.0%) | 0 (0.0%) |
| 35 to 64 Years | 0 (0.0%) | 10 (1.3%) |
| 65 to 74 Years | 0 (0.0%) | 0 (0.0%) |
| 75 Years and over | 12 (3.2%) | 93 (15.8%) |
Disability Class: Self-Care Difficulty
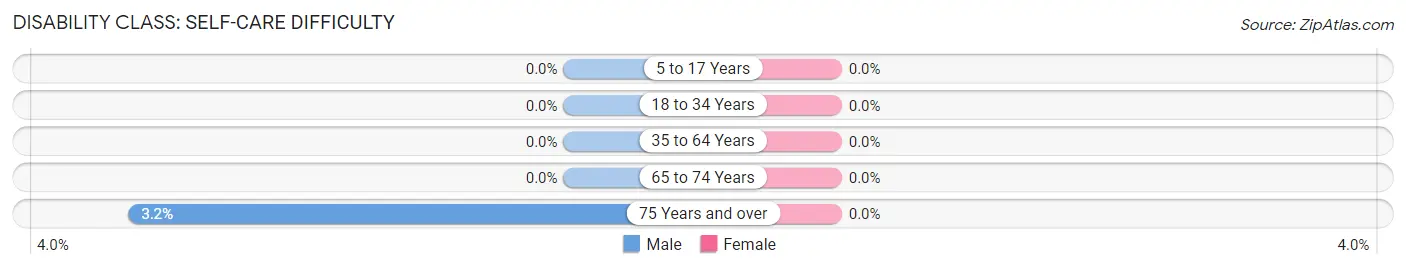
| Age Bracket | Male | Female |
| 5 to 17 Years | 0 (0.0%) | 0 (0.0%) |
| 18 to 34 Years | 0 (0.0%) | 0 (0.0%) |
| 35 to 64 Years | 0 (0.0%) | 0 (0.0%) |
| 65 to 74 Years | 0 (0.0%) | 0 (0.0%) |
| 75 Years and over | 12 (3.2%) | 0 (0.0%) |
Technology Access in Portola Valley
Computing Device Access in Portola Valley
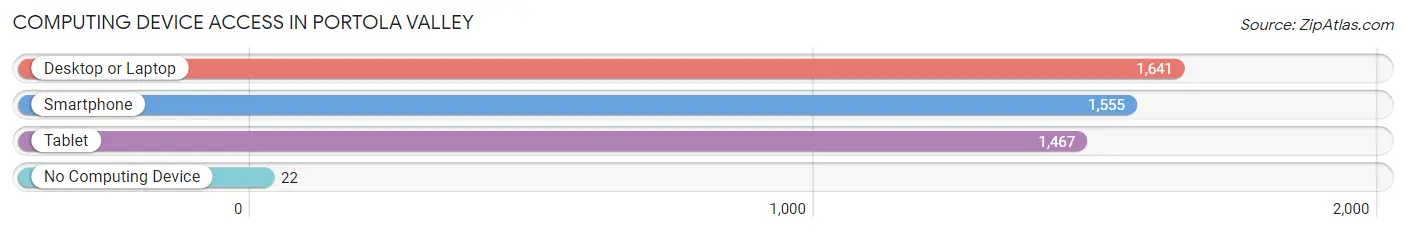
| Device Type | # Households | % Households |
| Desktop or Laptop | 1,641 | 97.0% |
| Smartphone | 1,555 | 91.9% |
| Tablet | 1,467 | 86.7% |
| No Computing Device | 22 | 1.3% |
| Total | 1,692 | 100.0% |
Internet Access in Portola Valley
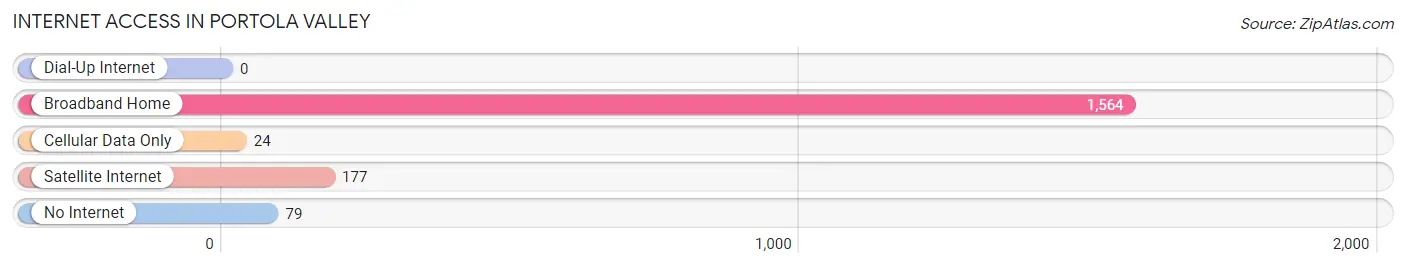
| Internet Type | # Households | % Households |
| Dial-Up Internet | 0 | 0.0% |
| Broadband Home | 1,564 | 92.4% |
| Cellular Data Only | 24 | 1.4% |
| Satellite Internet | 177 | 10.5% |
| No Internet | 79 | 4.7% |
| Total | 1,692 | 100.0% |
Portola Valley Summary
Portola Valley is a small town located in San Mateo County, California. It is situated in the foothills of the Santa Cruz Mountains, about 20 miles south of San Francisco. The town has a population of about 4,500 people and covers an area of about 9.5 square miles.
History
Portola Valley was originally inhabited by the Ohlone people, who lived in the area for thousands of years before the arrival of Europeans. The first Europeans to settle in the area were Spanish missionaries, who established a mission in nearby San Francisco in 1776. The area was later part of the Rancho San Antonio land grant, which was granted to the family of José de la Cruz Sánchez in 1839.
In the late 19th century, the area was developed as a rural retreat for wealthy San Franciscans. The town was officially incorporated in 1964, and the name “Portola Valley” was chosen to honor the Spanish explorer Gaspar de Portolá, who led the first European expedition into the area in 1769.
Geography
Portola Valley is located in the foothills of the Santa Cruz Mountains, about 20 miles south of San Francisco. The town is situated at an elevation of about 1,000 feet above sea level. The town is surrounded by open space preserves, including Windy Hill Open Space Preserve, Russian Ridge Open Space Preserve, and Coal Creek Open Space Preserve.
The town is located in a Mediterranean climate zone, with mild, wet winters and dry, warm summers. The average annual precipitation is about 24 inches, and the average annual temperature is about 60 degrees Fahrenheit.
Economy
Portola Valley is a wealthy community, with a median household income of about $200,000. The town is home to many high-tech companies, including Oracle, Hewlett-Packard, and Sun Microsystems. The town is also home to several venture capital firms, including Kleiner Perkins Caufield & Byers and Sequoia Capital.
The town is also home to several wineries, including Thomas Fogarty Winery and Vineyards and Picchetti Winery. The town is also home to several equestrian centers, including the Portola Valley Training Center and the Portola Valley Equestrian Center.
Demographics
As of the 2010 census, the population of Portola Valley was 4,353. The racial makeup of the town was 87.3% White, 0.7% African American, 0.2% Native American, 8.2% Asian, 0.1% Pacific Islander, 0.7% from other races, and 2.9% from two or more races. Hispanic or Latino of any race were 3.3% of the population.
The median age in Portola Valley was 45.2 years. About 24.3% of residents were under the age of 18, and 8.2% were 65 years of age or older. The gender makeup of the town was 49.2% male and 50.8% female.
The median income for a household in Portola Valley was $200,000, and the median income for a family was $212,500. About 2.2% of families and 3.2% of the population were below the poverty line, including 3.2% of those under age 18 and 0.0% of those age 65 or over.
Common Questions
What is Per Capita Income in Portola Valley?
Per Capita income in Portola Valley is $180,793.
What is the Median Family Income in Portola Valley?
Median Family Income in Portola Valley is $250,001.
What is the Median Household income in Portola Valley?
Median Household Income in Portola Valley is $250,001.
What is Inequality or Gini Index in Portola Valley?
Inequality or Gini Index in Portola Valley is 0.51.
What is the Total Population of Portola Valley?
Total Population of Portola Valley is 4,397.
What is the Total Male Population of Portola Valley?
Total Male Population of Portola Valley is 1,954.
What is the Total Female Population of Portola Valley?
Total Female Population of Portola Valley is 2,443.
What is the Ratio of Males per 100 Females in Portola Valley?
There are 79.98 Males per 100 Females in Portola Valley.
What is the Ratio of Females per 100 Males in Portola Valley?
There are 125.03 Females per 100 Males in Portola Valley.
What is the Median Population Age in Portola Valley?
Median Population Age in Portola Valley is 57.8 Years.
What is the Average Family Size in Portola Valley
Average Family Size in Portola Valley is 3.0 People.
What is the Average Household Size in Portola Valley
Average Household Size in Portola Valley is 2.6 People.
How Large is the Labor Force in Portola Valley?
There are 1,537 People in the Labor Forcein in Portola Valley.
What is the Percentage of People in the Labor Force in Portola Valley?
42.0% of People are in the Labor Force in Portola Valley.
What is the Unemployment Rate in Portola Valley?
Unemployment Rate in Portola Valley is 2.7%.