Oceano, CA Map & Demographics
Oceano Map
Oceano Overview
$36,143
PER CAPITA INCOME
$93,658
AVG FAMILY INCOME
$73,084
AVG HOUSEHOLD INCOME
16.5%
WAGE / INCOME GAP [ % ]
83.5¢/ $1
WAGE / INCOME GAP [ $ ]
0.46
INEQUALITY / GINI INDEX
7,287
TOTAL POPULATION
3,705
MALE POPULATION
3,582
FEMALE POPULATION
103.43
MALES / 100 FEMALES
96.68
FEMALES / 100 MALES
44.2
MEDIAN AGE
3.4
AVG FAMILY SIZE
2.4
AVG HOUSEHOLD SIZE
3,290
LABOR FORCE [ PEOPLE ]
56.2%
PERCENT IN LABOR FORCE
3.9%
UNEMPLOYMENT RATE
Oceano Zip Codes
Oceano Area Codes
Income in Oceano
Income Overview in Oceano
Per Capita Income in Oceano is $36,143, while median incomes of families and households are $93,658 and $73,084 respectively.
| Characteristic | Number | Measure |
| Per Capita Income | 7,287 | $36,143 |
| Median Family Income | 1,665 | $93,658 |
| Mean Family Income | 1,665 | $110,235 |
| Median Household Income | 2,983 | $73,084 |
| Mean Household Income | 2,983 | $86,152 |
| Income Deficit | 1,665 | $0 |
| Wage / Income Gap (%) | 7,287 | 16.45% |
| Wage / Income Gap ($) | 7,287 | 83.55¢ per $1 |
| Gini / Inequality Index | 7,287 | 0.46 |
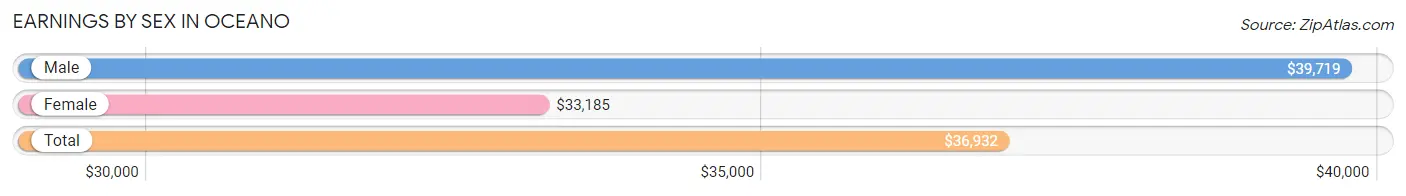
Earnings by Sex in Oceano
Average Earnings in Oceano are $36,932, $39,719 for men and $33,185 for women, a difference of 16.5%.
| Sex | Number | Average Earnings |
| Male | 1,835 (55.0%) | $39,719 |
| Female | 1,503 (45.0%) | $33,185 |
| Total | 3,338 (100.0%) | $36,932 |
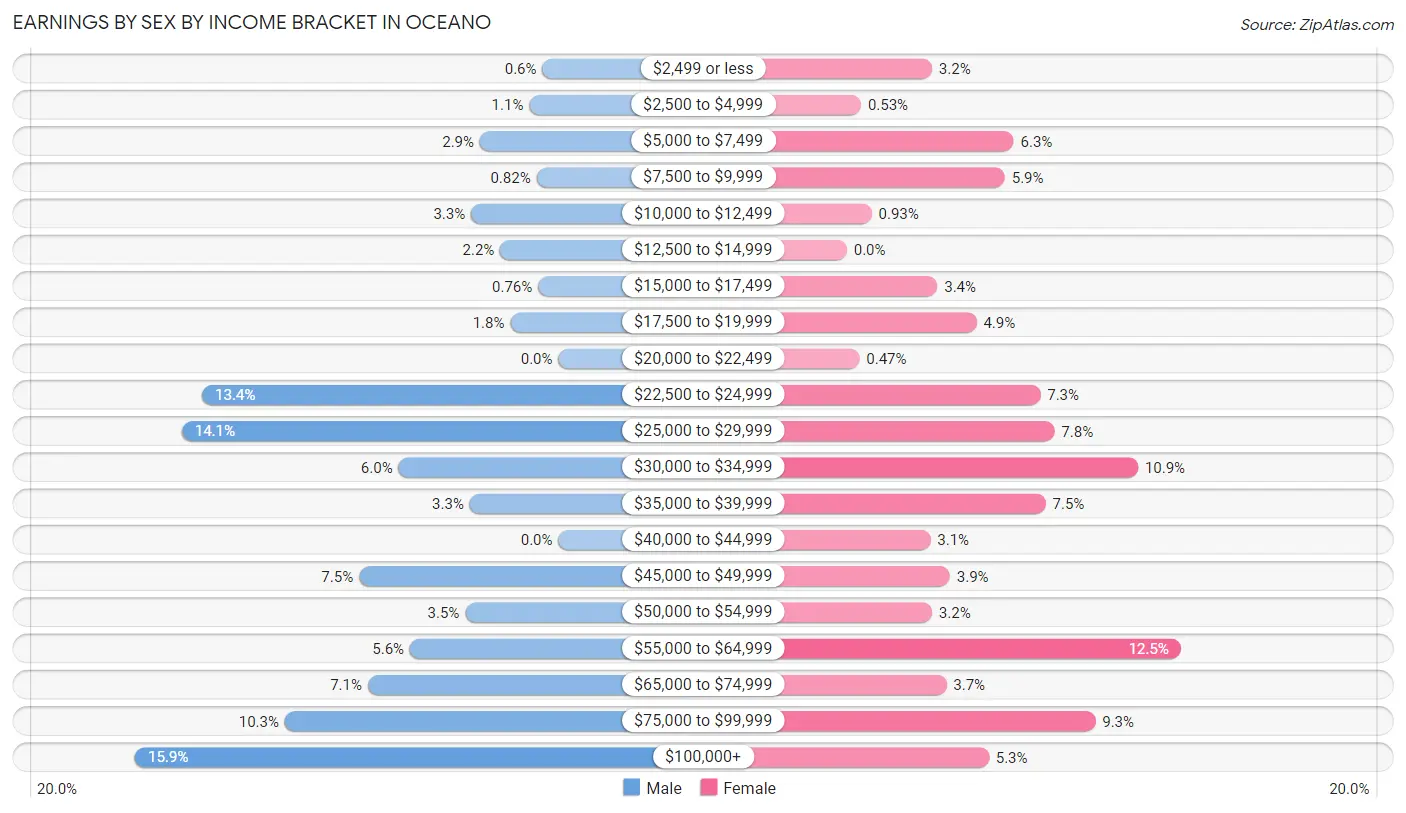
Earnings by Sex by Income Bracket in Oceano
The most common earnings brackets in Oceano are $100,000+ for men (291 | 15.9%) and $55,000 to $64,999 for women (188 | 12.5%).
| Income | Male | Female |
| $2,499 or less | 11 (0.6%) | 48 (3.2%) |
| $2,500 to $4,999 | 20 (1.1%) | 8 (0.5%) |
| $5,000 to $7,499 | 54 (2.9%) | 94 (6.2%) |
| $7,500 to $9,999 | 15 (0.8%) | 89 (5.9%) |
| $10,000 to $12,499 | 60 (3.3%) | 14 (0.9%) |
| $12,500 to $14,999 | 40 (2.2%) | 0 (0.0%) |
| $15,000 to $17,499 | 14 (0.8%) | 51 (3.4%) |
| $17,500 to $19,999 | 33 (1.8%) | 73 (4.9%) |
| $20,000 to $22,499 | 0 (0.0%) | 7 (0.5%) |
| $22,500 to $24,999 | 245 (13.4%) | 109 (7.2%) |
| $25,000 to $29,999 | 259 (14.1%) | 117 (7.8%) |
| $30,000 to $34,999 | 110 (6.0%) | 164 (10.9%) |
| $35,000 to $39,999 | 61 (3.3%) | 112 (7.4%) |
| $40,000 to $44,999 | 0 (0.0%) | 47 (3.1%) |
| $45,000 to $49,999 | 137 (7.5%) | 58 (3.9%) |
| $50,000 to $54,999 | 64 (3.5%) | 48 (3.2%) |
| $55,000 to $64,999 | 102 (5.6%) | 188 (12.5%) |
| $65,000 to $74,999 | 131 (7.1%) | 56 (3.7%) |
| $75,000 to $99,999 | 188 (10.2%) | 140 (9.3%) |
| $100,000+ | 291 (15.9%) | 80 (5.3%) |
| Total | 1,835 (100.0%) | 1,503 (100.0%) |
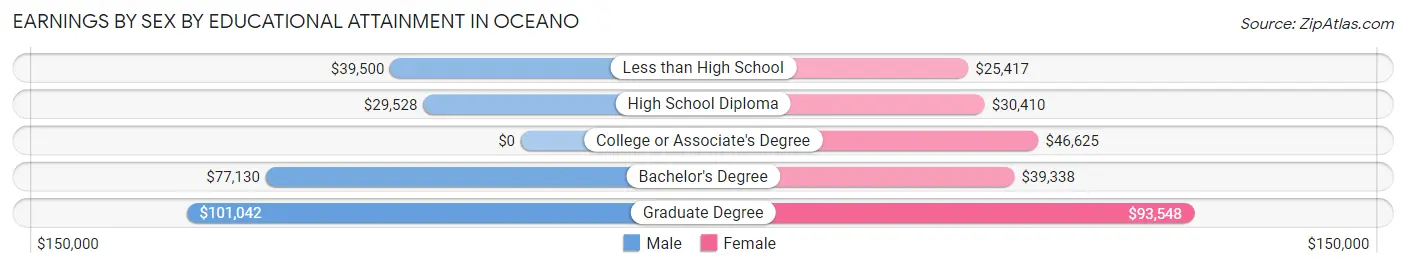
Earnings by Sex by Educational Attainment in Oceano
Average earnings in Oceano are $48,661 for men and $36,250 for women, a difference of 25.5%. Men with an educational attainment of graduate degree enjoy the highest average annual earnings of $101,042, while those with high school diploma education earn the least with $29,528. Women with an educational attainment of graduate degree earn the most with the average annual earnings of $93,548, while those with less than high school education have the smallest earnings of $25,417.
| Educational Attainment | Male Income | Female Income |
| Less than High School | $39,500 | $25,417 |
| High School Diploma | $29,528 | $30,410 |
| College or Associate's Degree | - | - |
| Bachelor's Degree | $77,130 | $39,338 |
| Graduate Degree | $101,042 | $93,548 |
| Total | $48,661 | $36,250 |
Family Income in Oceano
Family Income Brackets in Oceano
According to the Oceano family income data, there are 366 families falling into the $100,000 to $149,999 income range, which is the most common income bracket and makes up 22.0% of all families.
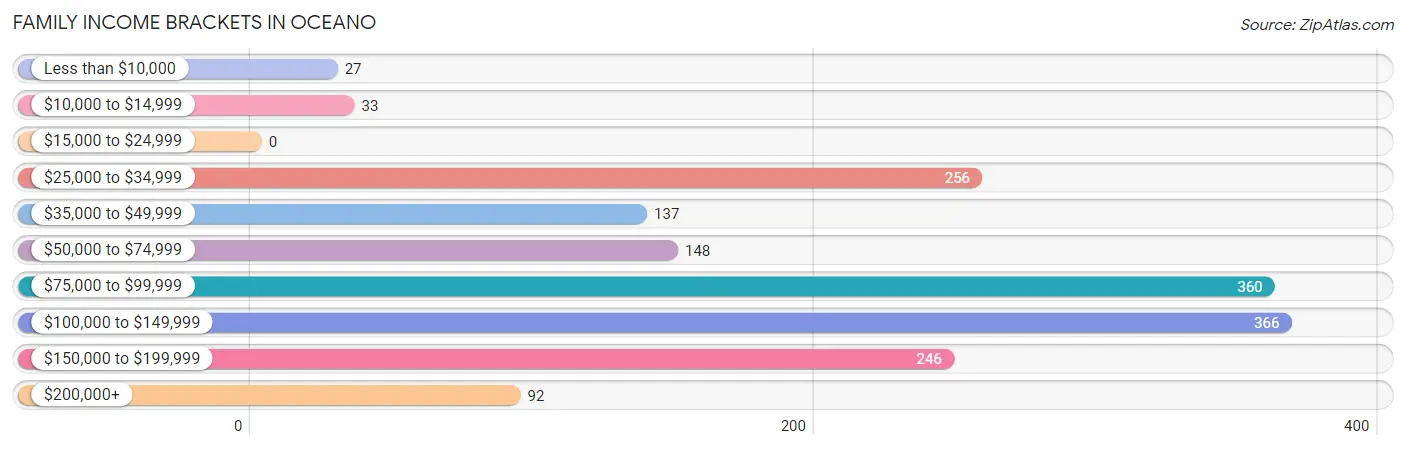
| Income Bracket | # Families | % Families |
| Less than $10,000 | 27 | 1.6% |
| $10,000 to $14,999 | 33 | 2.0% |
| $15,000 to $24,999 | 0 | 0.0% |
| $25,000 to $34,999 | 256 | 15.4% |
| $35,000 to $49,999 | 137 | 8.2% |
| $50,000 to $74,999 | 148 | 8.9% |
| $75,000 to $99,999 | 360 | 21.6% |
| $100,000 to $149,999 | 366 | 22.0% |
| $150,000 to $199,999 | 246 | 14.8% |
| $200,000+ | 92 | 5.5% |
Family Income by Famaliy Size in Oceano
6-person families (241 | 14.5%) account for the highest median family income in Oceano with $135,270 per family, while 2-person families (744 | 44.7%) have the highest median income of $41,118 per family member.
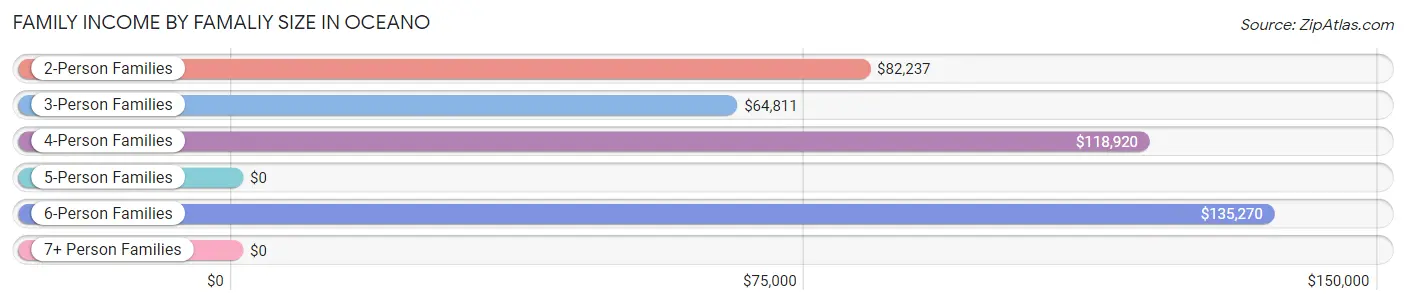
| Income Bracket | # Families | Median Income |
| 2-Person Families | 744 (44.7%) | $82,237 |
| 3-Person Families | 284 (17.1%) | $64,811 |
| 4-Person Families | 285 (17.1%) | $118,920 |
| 5-Person Families | 96 (5.8%) | $0 |
| 6-Person Families | 241 (14.5%) | $135,270 |
| 7+ Person Families | 15 (0.9%) | $0 |
| Total | 1,665 (100.0%) | $93,658 |
Family Income by Number of Earners in Oceano
The median family income in Oceano is $93,658, with families comprising 3+ earners (271) having the highest median family income of $128,281, while families with no earners (352) have the lowest median family income of $55,500, accounting for 16.3% and 21.1% of families, respectively.
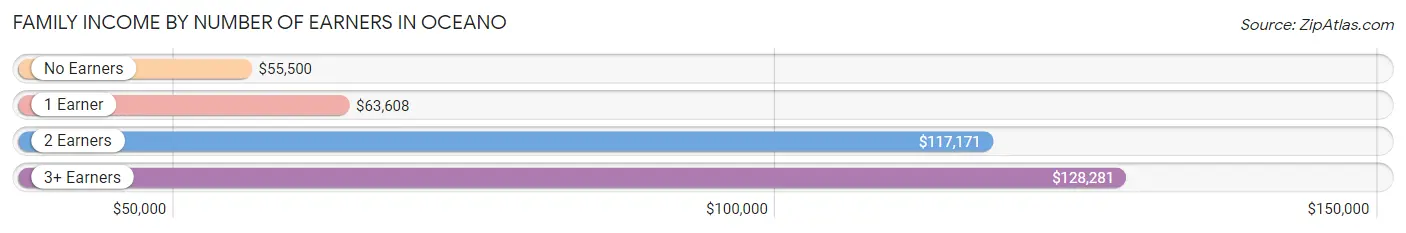
| Number of Earners | # Families | Median Income |
| No Earners | 352 (21.1%) | $55,500 |
| 1 Earner | 625 (37.5%) | $63,608 |
| 2 Earners | 417 (25.1%) | $117,171 |
| 3+ Earners | 271 (16.3%) | $128,281 |
| Total | 1,665 (100.0%) | $93,658 |
Household Income in Oceano
Household Income Brackets in Oceano
With 486 households falling in the category, the $50,000 to $74,999 income range is the most frequent in Oceano, accounting for 16.3% of all households. In contrast, only 87 households (2.9%) fall into the $10,000 to $14,999 income bracket, making it the least populous group.
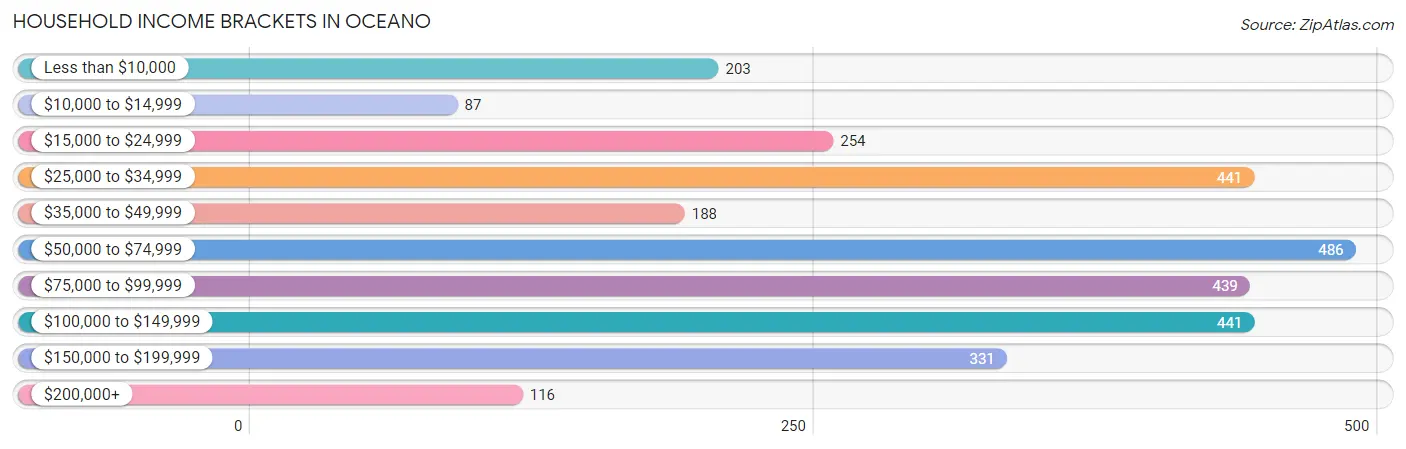
| Income Bracket | # Households | % Households |
| Less than $10,000 | 203 | 6.8% |
| $10,000 to $14,999 | 87 | 2.9% |
| $15,000 to $24,999 | 254 | 8.5% |
| $25,000 to $34,999 | 441 | 14.8% |
| $35,000 to $49,999 | 188 | 6.3% |
| $50,000 to $74,999 | 486 | 16.3% |
| $75,000 to $99,999 | 439 | 14.7% |
| $100,000 to $149,999 | 441 | 14.8% |
| $150,000 to $199,999 | 331 | 11.1% |
| $200,000+ | 116 | 3.9% |
Household Income by Householder Age in Oceano
The median household income in Oceano is $73,084, with the highest median household income of $97,083 found in the 45 to 64 years age bracket for the primary householder. A total of 860 households (28.8%) fall into this category. Meanwhile, the 15 to 24 years age bracket for the primary householder has the lowest median household income of $0, with 44 households (1.5%) in this group.
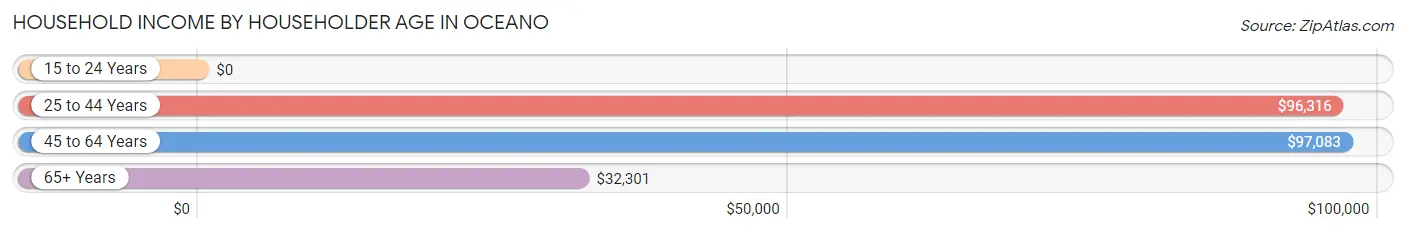
| Income Bracket | # Households | Median Income |
| 15 to 24 Years | 44 (1.5%) | $0 |
| 25 to 44 Years | 730 (24.5%) | $96,316 |
| 45 to 64 Years | 860 (28.8%) | $97,083 |
| 65+ Years | 1,349 (45.2%) | $32,301 |
| Total | 2,983 (100.0%) | $73,084 |
Poverty in Oceano
Income Below Poverty by Sex and Age in Oceano
With 13.7% poverty level for males and 13.5% for females among the residents of Oceano, 12 to 14 year old males and 15 year old females are the most vulnerable to poverty, with 137 males (85.1%) and 30 females (71.4%) in their respective age groups living below the poverty level.
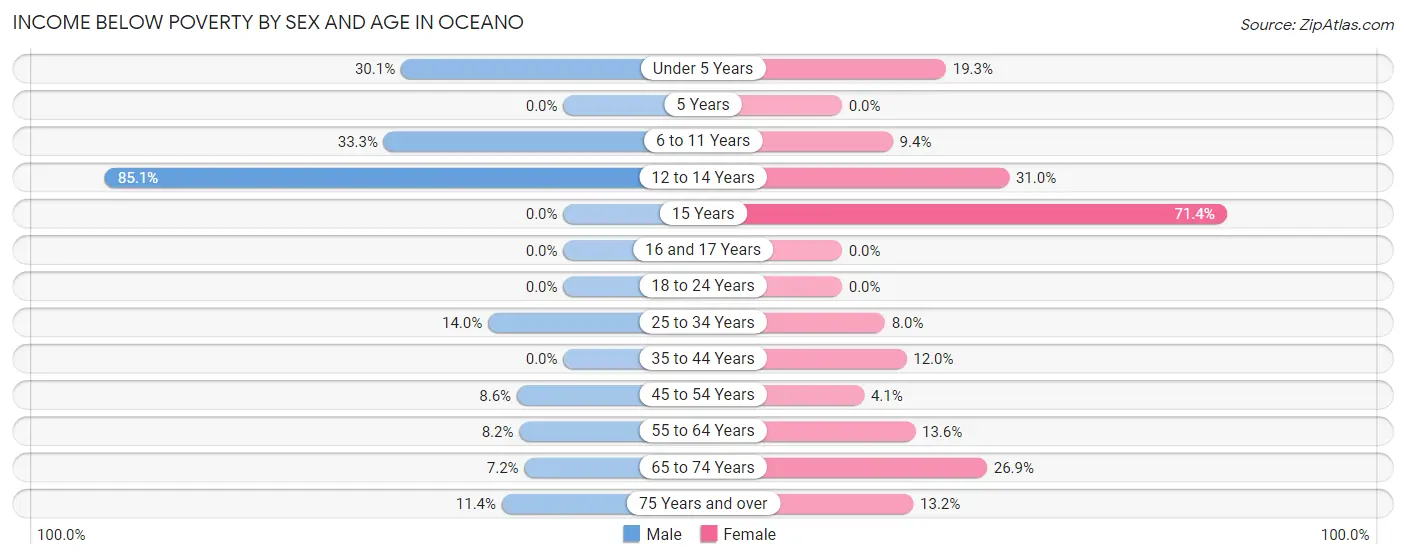
| Age Bracket | Male | Female |
| Under 5 Years | 66 (30.1%) | 56 (19.3%) |
| 5 Years | 0 (0.0%) | 0 (0.0%) |
| 6 to 11 Years | 87 (33.3%) | 22 (9.4%) |
| 12 to 14 Years | 137 (85.1%) | 18 (31.0%) |
| 15 Years | 0 (0.0%) | 30 (71.4%) |
| 16 and 17 Years | 0 (0.0%) | 0 (0.0%) |
| 18 to 24 Years | 0 (0.0%) | 0 (0.0%) |
| 25 to 34 Years | 58 (14.0%) | 33 (8.0%) |
| 35 to 44 Years | 0 (0.0%) | 65 (12.0%) |
| 45 to 54 Years | 48 (8.6%) | 17 (4.1%) |
| 55 to 64 Years | 17 (8.2%) | 53 (13.6%) |
| 65 to 74 Years | 34 (7.2%) | 126 (26.9%) |
| 75 Years and over | 59 (11.4%) | 63 (13.2%) |
| Total | 506 (13.7%) | 483 (13.5%) |
Income Above Poverty by Sex and Age in Oceano
According to the poverty statistics in Oceano, males aged 5 years and females aged 5 years are the age groups that are most secure financially, with 100.0% of males and 100.0% of females in these age groups living above the poverty line.
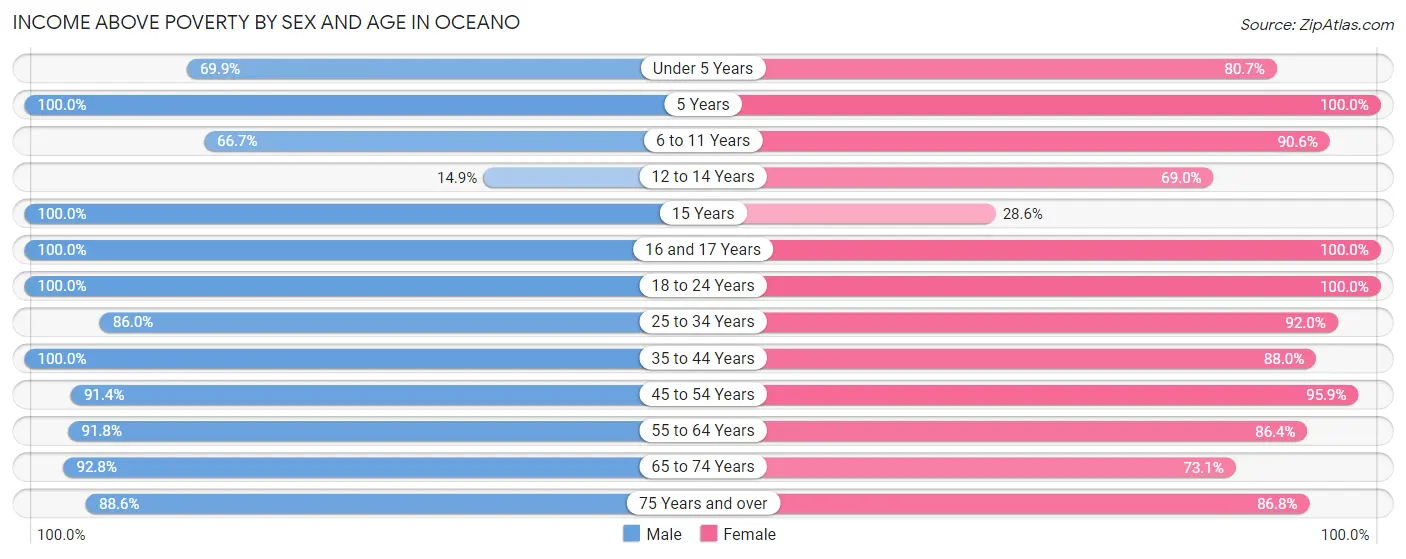
| Age Bracket | Male | Female |
| Under 5 Years | 153 (69.9%) | 234 (80.7%) |
| 5 Years | 41 (100.0%) | 40 (100.0%) |
| 6 to 11 Years | 174 (66.7%) | 211 (90.6%) |
| 12 to 14 Years | 24 (14.9%) | 40 (69.0%) |
| 15 Years | 80 (100.0%) | 12 (28.6%) |
| 16 and 17 Years | 123 (100.0%) | 50 (100.0%) |
| 18 to 24 Years | 237 (100.0%) | 165 (100.0%) |
| 25 to 34 Years | 357 (86.0%) | 381 (92.0%) |
| 35 to 44 Years | 408 (100.0%) | 478 (88.0%) |
| 45 to 54 Years | 509 (91.4%) | 396 (95.9%) |
| 55 to 64 Years | 191 (91.8%) | 337 (86.4%) |
| 65 to 74 Years | 436 (92.8%) | 342 (73.1%) |
| 75 Years and over | 458 (88.6%) | 413 (86.8%) |
| Total | 3,191 (86.3%) | 3,099 (86.5%) |
Income Below Poverty Among Married-Couple Families in Oceano
The poverty statistics for married-couple families in Oceano show that 6.4% or 74 of the total 1,155 families live below the poverty line. Families with 3 or 4 children have the highest poverty rate of 24.5%, comprising of 24 families. On the other hand, families with no children have the lowest poverty rate of 0.0%, which includes 0 families.
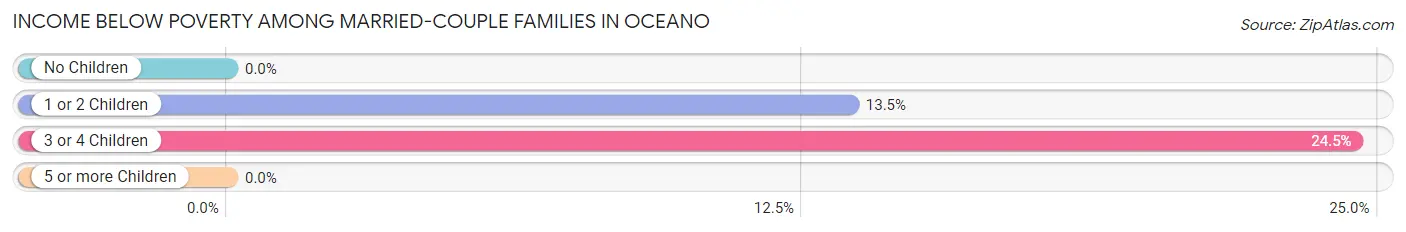
| Children | Above Poverty | Below Poverty |
| No Children | 687 (100.0%) | 0 (0.0%) |
| 1 or 2 Children | 320 (86.5%) | 50 (13.5%) |
| 3 or 4 Children | 74 (75.5%) | 24 (24.5%) |
| 5 or more Children | 0 (0.0%) | 0 (0.0%) |
| Total | 1,081 (93.6%) | 74 (6.4%) |
Income Below Poverty Among Single-Parent Households in Oceano
According to the poverty data in Oceano, 12.3% or 17 single-father households and 11.0% or 41 single-mother households are living below the poverty line. Among single-father households, those with no children have the highest poverty rate, with 17 households (43.6%) experiencing poverty. Likewise, among single-mother households, those with 5 or more children have the highest poverty rate, with 32 households (100.0%) falling below the poverty line.
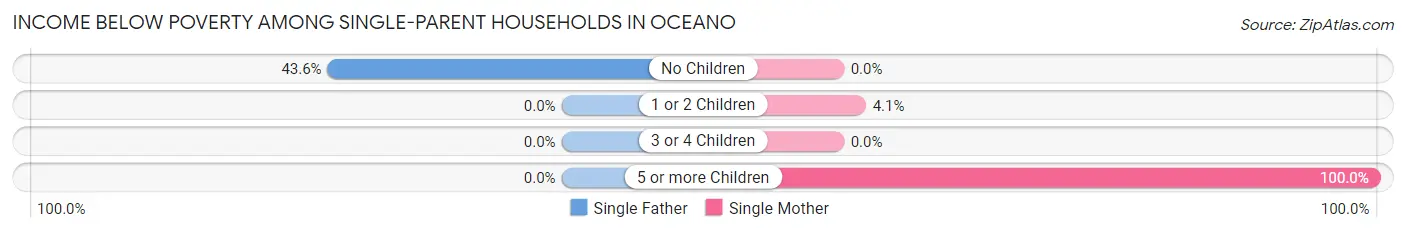
| Children | Single Father | Single Mother |
| No Children | 17 (43.6%) | 0 (0.0%) |
| 1 or 2 Children | 0 (0.0%) | 9 (4.1%) |
| 3 or 4 Children | 0 (0.0%) | 0 (0.0%) |
| 5 or more Children | 0 (0.0%) | 32 (100.0%) |
| Total | 17 (12.3%) | 41 (11.0%) |
Income Below Poverty Among Married-Couple vs Single-Parent Households in Oceano
The poverty data for Oceano shows that 74 of the married-couple family households (6.4%) and 58 of the single-parent households (11.4%) are living below the poverty level. Within the married-couple family households, those with 3 or 4 children have the highest poverty rate, with 24 households (24.5%) falling below the poverty line. Among the single-parent households, those with 5 or more children have the highest poverty rate, with 32 household (100.0%) living below poverty.
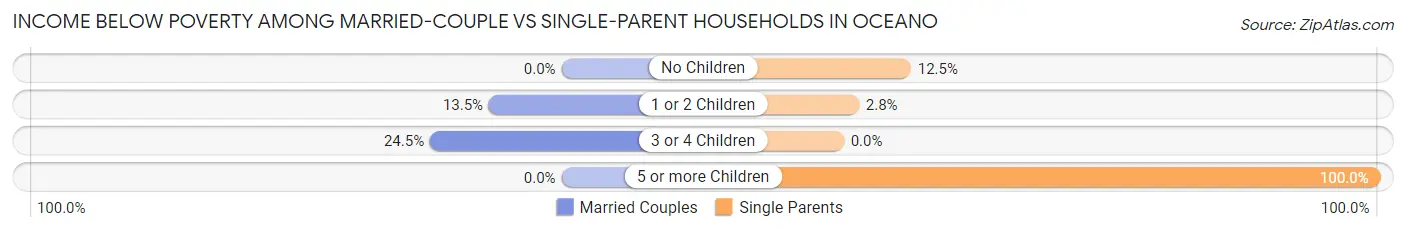
| Children | Married-Couple Families | Single-Parent Households |
| No Children | 0 (0.0%) | 17 (12.5%) |
| 1 or 2 Children | 50 (13.5%) | 9 (2.8%) |
| 3 or 4 Children | 24 (24.5%) | 0 (0.0%) |
| 5 or more Children | 0 (0.0%) | 32 (100.0%) |
| Total | 74 (6.4%) | 58 (11.4%) |
Race in Oceano
The most populous races in Oceano are White / Caucasian (4,874 | 66.9%), Hispanic or Latino (3,132 | 43.0%), and Some other Race (1,201 | 16.5%).
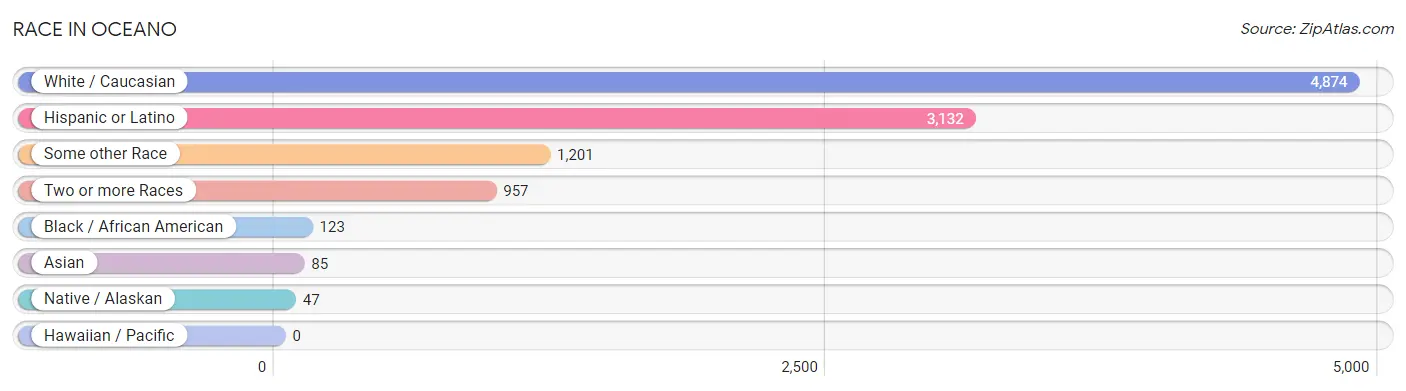
| Race | # Population | % Population |
| Asian | 85 | 1.2% |
| Black / African American | 123 | 1.7% |
| Hawaiian / Pacific | 0 | 0.0% |
| Hispanic or Latino | 3,132 | 43.0% |
| Native / Alaskan | 47 | 0.6% |
| White / Caucasian | 4,874 | 66.9% |
| Two or more Races | 957 | 13.1% |
| Some other Race | 1,201 | 16.5% |
| Total | 7,287 | 100.0% |
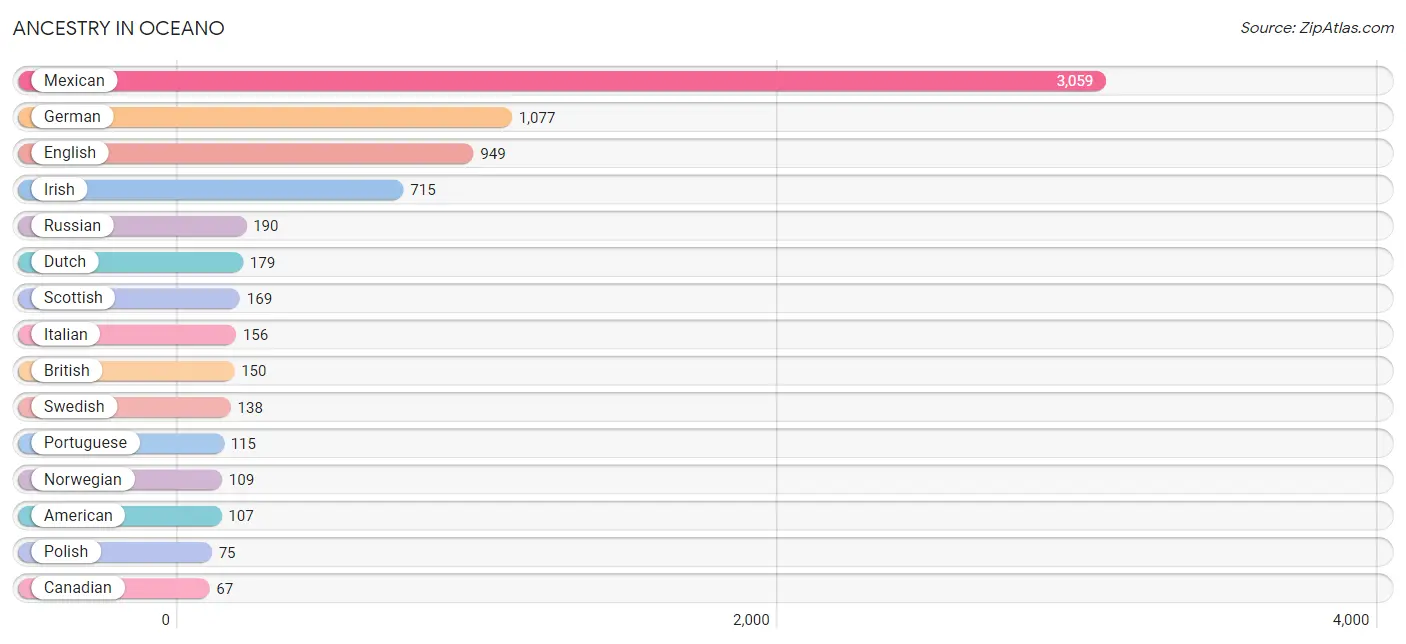
Ancestry in Oceano
The most populous ancestries reported in Oceano are Mexican (3,059 | 42.0%), German (1,077 | 14.8%), English (949 | 13.0%), Irish (715 | 9.8%), and Russian (190 | 2.6%), together accounting for 82.2% of all Oceano residents.
| Ancestry | # Population | % Population |
| American | 107 | 1.5% |
| Apache | 11 | 0.2% |
| Arab | 34 | 0.5% |
| Armenian | 11 | 0.2% |
| Basque | 17 | 0.2% |
| Brazilian | 10 | 0.1% |
| British | 150 | 2.1% |
| Burmese | 31 | 0.4% |
| Canadian | 67 | 0.9% |
| Cherokee | 25 | 0.3% |
| Chilean | 39 | 0.5% |
| Choctaw | 21 | 0.3% |
| Danish | 30 | 0.4% |
| Dutch | 179 | 2.5% |
| English | 949 | 13.0% |
| European | 45 | 0.6% |
| Finnish | 17 | 0.2% |
| French | 6 | 0.1% |
| French Canadian | 23 | 0.3% |
| German | 1,077 | 14.8% |
| Greek | 62 | 0.9% |
| Hungarian | 10 | 0.1% |
| Indian (Asian) | 49 | 0.7% |
| Irish | 715 | 9.8% |
| Italian | 156 | 2.1% |
| Korean | 63 | 0.9% |
| Lebanese | 34 | 0.5% |
| Mexican | 3,059 | 42.0% |
| Mexican American Indian | 32 | 0.4% |
| Navajo | 7 | 0.1% |
| Northern European | 45 | 0.6% |
| Norwegian | 109 | 1.5% |
| Polish | 75 | 1.0% |
| Portuguese | 115 | 1.6% |
| Pueblo | 7 | 0.1% |
| Puerto Rican | 21 | 0.3% |
| Romanian | 11 | 0.2% |
| Russian | 190 | 2.6% |
| Scotch-Irish | 53 | 0.7% |
| Scottish | 169 | 2.3% |
| South American | 39 | 0.5% |
| Spanish | 13 | 0.2% |
| Sri Lankan | 17 | 0.2% |
| Swedish | 138 | 1.9% |
| Turkish | 63 | 0.9% |
| Yaqui | 33 | 0.4% | View All 46 Rows |
Immigrants in Oceano
The most numerous immigrant groups reported in Oceano came from Central America (990 | 13.6%), Latin America (990 | 13.6%), Mexico (990 | 13.6%), Europe (221 | 3.0%), and Eastern Europe (89 | 1.2%), together accounting for 45.0% of all Oceano residents.
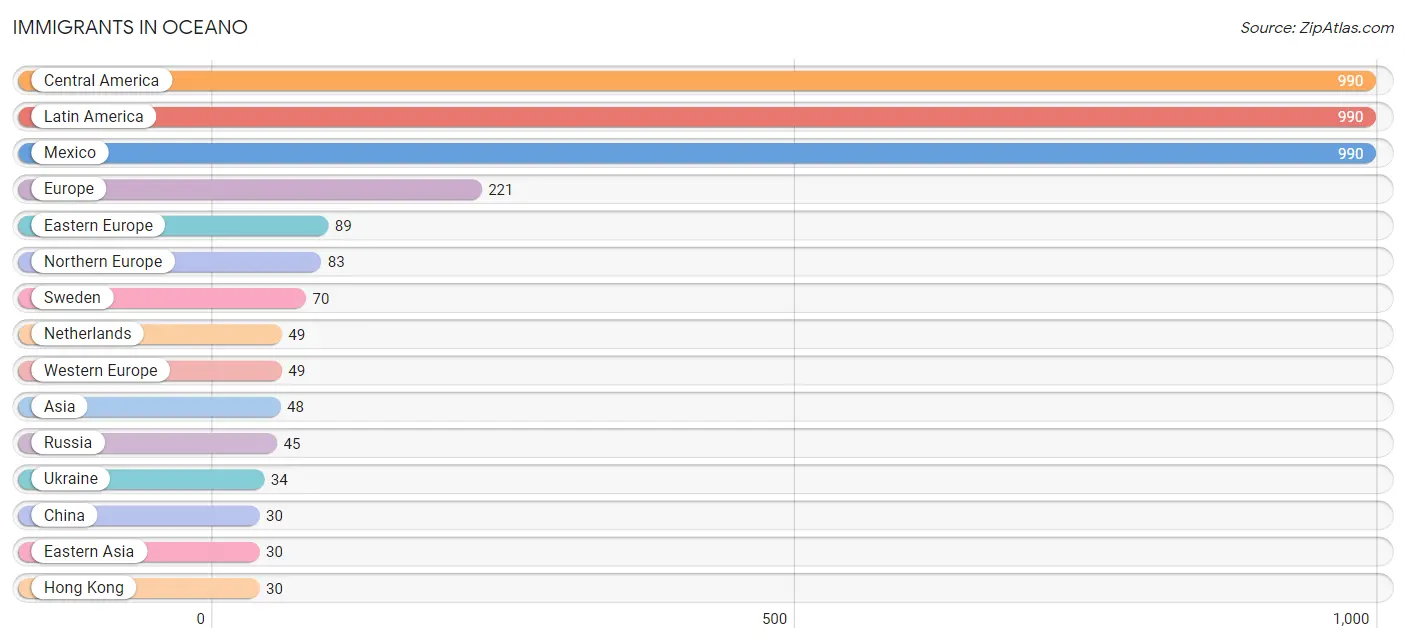
| Immigration Origin | # Population | % Population |
| Asia | 48 | 0.7% |
| Canada | 22 | 0.3% |
| Central America | 990 | 13.6% |
| China | 30 | 0.4% |
| Eastern Asia | 30 | 0.4% |
| Eastern Europe | 89 | 1.2% |
| Europe | 221 | 3.0% |
| Hong Kong | 30 | 0.4% |
| Hungary | 10 | 0.1% |
| India | 10 | 0.1% |
| Latin America | 990 | 13.6% |
| Mexico | 990 | 13.6% |
| Netherlands | 49 | 0.7% |
| Northern Europe | 83 | 1.1% |
| Philippines | 8 | 0.1% |
| Russia | 45 | 0.6% |
| South Central Asia | 10 | 0.1% |
| South Eastern Asia | 8 | 0.1% |
| Sweden | 70 | 1.0% |
| Ukraine | 34 | 0.5% |
| Western Europe | 49 | 0.7% | View All 21 Rows |
Sex and Age in Oceano
Sex and Age in Oceano
The most populous age groups in Oceano are 70 to 74 Years (336 | 9.1%) for men and 40 to 44 Years (396 | 11.1%) for women.
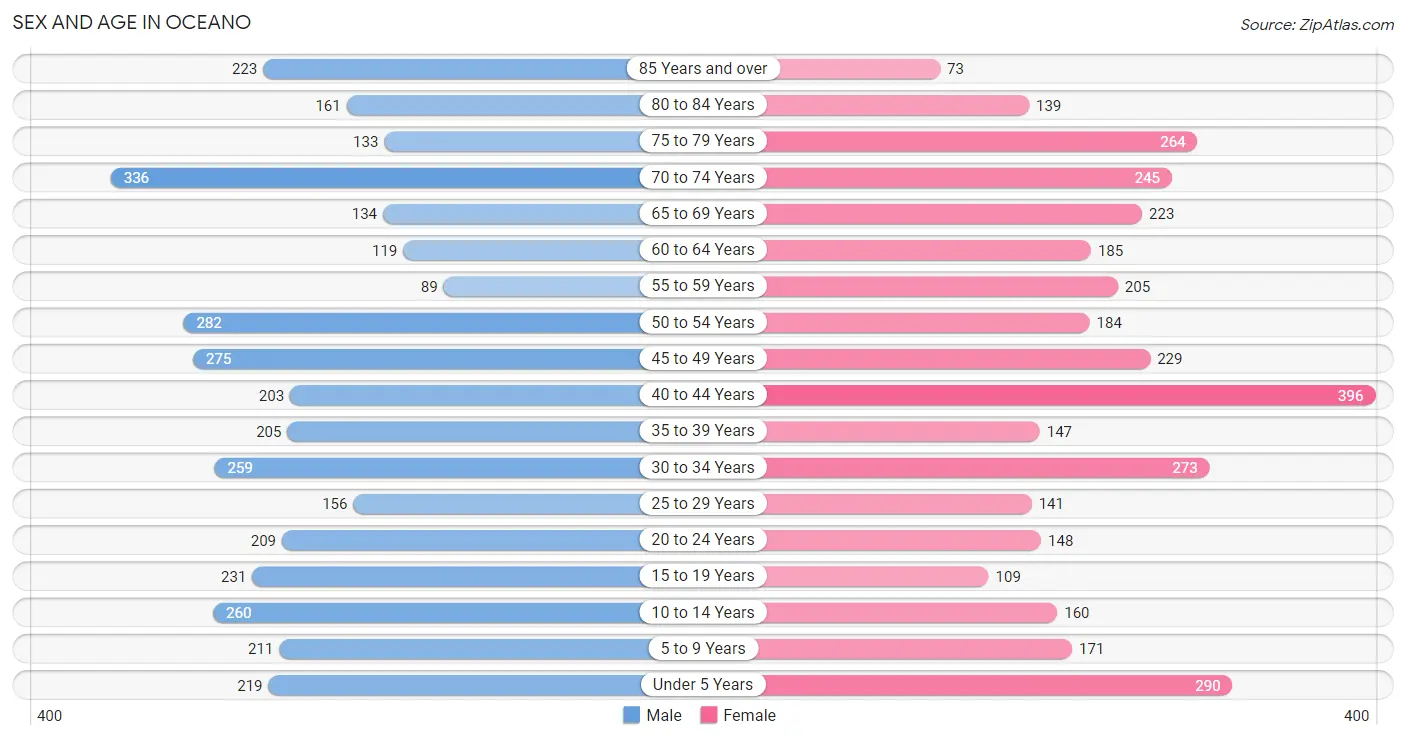
| Age Bracket | Male | Female |
| Under 5 Years | 219 (5.9%) | 290 (8.1%) |
| 5 to 9 Years | 211 (5.7%) | 171 (4.8%) |
| 10 to 14 Years | 260 (7.0%) | 160 (4.5%) |
| 15 to 19 Years | 231 (6.2%) | 109 (3.0%) |
| 20 to 24 Years | 209 (5.6%) | 148 (4.1%) |
| 25 to 29 Years | 156 (4.2%) | 141 (3.9%) |
| 30 to 34 Years | 259 (7.0%) | 273 (7.6%) |
| 35 to 39 Years | 205 (5.5%) | 147 (4.1%) |
| 40 to 44 Years | 203 (5.5%) | 396 (11.1%) |
| 45 to 49 Years | 275 (7.4%) | 229 (6.4%) |
| 50 to 54 Years | 282 (7.6%) | 184 (5.1%) |
| 55 to 59 Years | 89 (2.4%) | 205 (5.7%) |
| 60 to 64 Years | 119 (3.2%) | 185 (5.2%) |
| 65 to 69 Years | 134 (3.6%) | 223 (6.2%) |
| 70 to 74 Years | 336 (9.1%) | 245 (6.8%) |
| 75 to 79 Years | 133 (3.6%) | 264 (7.4%) |
| 80 to 84 Years | 161 (4.3%) | 139 (3.9%) |
| 85 Years and over | 223 (6.0%) | 73 (2.0%) |
| Total | 3,705 (100.0%) | 3,582 (100.0%) |
Families and Households in Oceano
Median Family Size in Oceano
The median family size in Oceano is 3.42 persons per family, with married-couple families (1,155 | 69.4%) accounting for the largest median family size of 3.52 persons per family. On the other hand, single male/father families (138 | 8.3%) represent the smallest median family size with 2.36 persons per family.
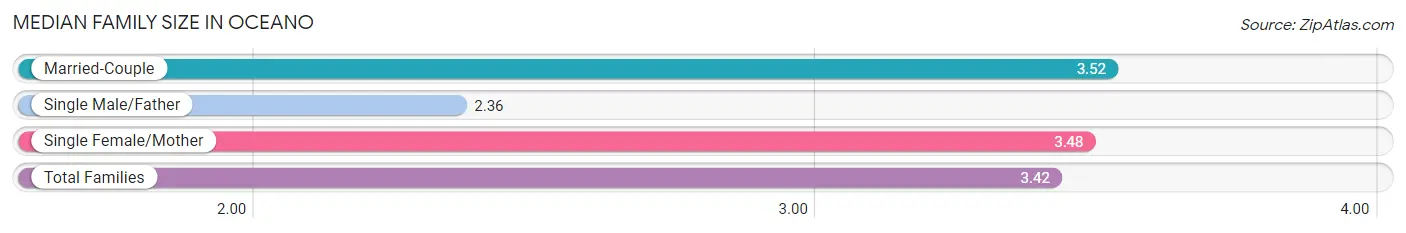
| Family Type | # Families | Family Size |
| Married-Couple | 1,155 (69.4%) | 3.52 |
| Single Male/Father | 138 (8.3%) | 2.36 |
| Single Female/Mother | 372 (22.3%) | 3.48 |
| Total Families | 1,665 (100.0%) | 3.42 |
Median Household Size in Oceano
The median household size in Oceano is 2.44 persons per household, with single female/mother households (372 | 12.5%) accounting for the largest median household size of 3.58 persons per household. non-family households (1,318 | 44.2%) represent the smallest median household size with 1.13 persons per household.
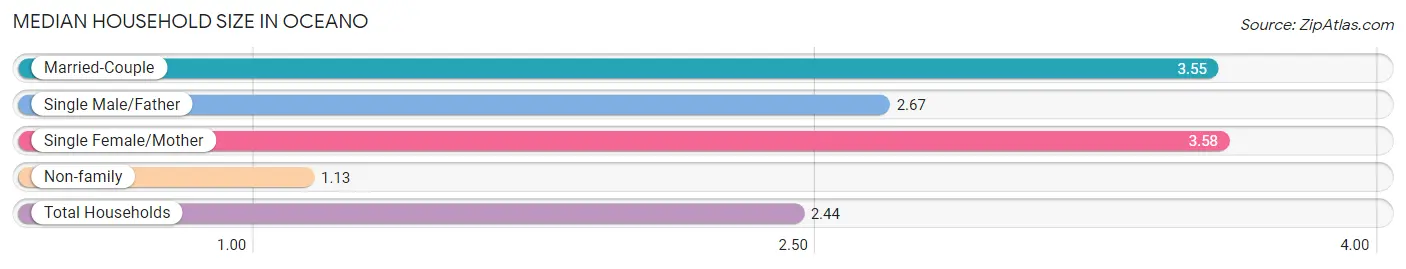
| Household Type | # Households | Household Size |
| Married-Couple | 1,155 (38.7%) | 3.55 |
| Single Male/Father | 138 (4.6%) | 2.67 |
| Single Female/Mother | 372 (12.5%) | 3.58 |
| Non-family | 1,318 (44.2%) | 1.13 |
| Total Households | 2,983 (100.0%) | 2.44 |
Household Size by Marriage Status in Oceano
Out of a total of 2,983 households in Oceano, 1,665 (55.8%) are family households, while 1,318 (44.2%) are nonfamily households. The most numerous type of family households are 2-person households, comprising 689, and the most common type of nonfamily households are 1-person households, comprising 1,178.
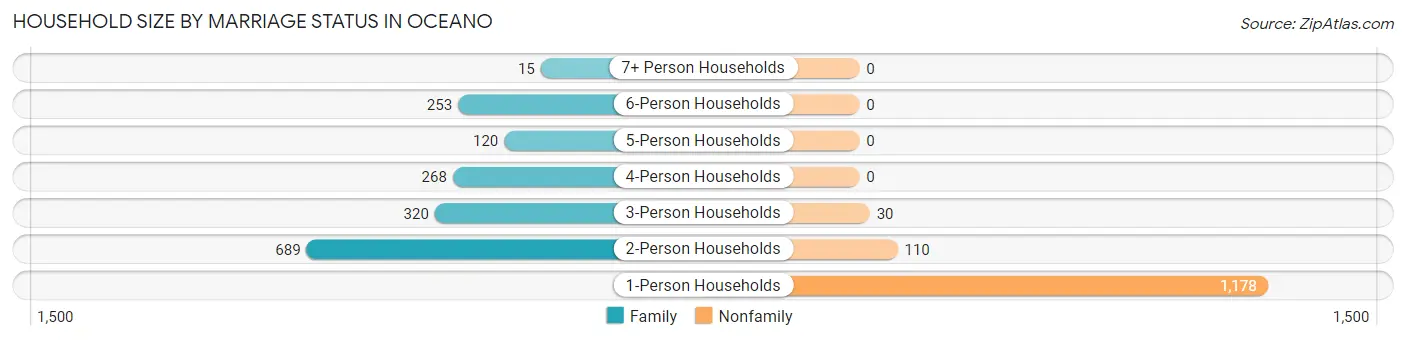
| Household Size | Family Households | Nonfamily Households |
| 1-Person Households | - | 1,178 (39.5%) |
| 2-Person Households | 689 (23.1%) | 110 (3.7%) |
| 3-Person Households | 320 (10.7%) | 30 (1.0%) |
| 4-Person Households | 268 (9.0%) | 0 (0.0%) |
| 5-Person Households | 120 (4.0%) | 0 (0.0%) |
| 6-Person Households | 253 (8.5%) | 0 (0.0%) |
| 7+ Person Households | 15 (0.5%) | 0 (0.0%) |
| Total | 1,665 (55.8%) | 1,318 (44.2%) |
Female Fertility in Oceano
Fertility by Age in Oceano
Average fertility rate in Oceano is 133.0 births per 1,000 women. Women in the age bracket of 15 to 19 years have the highest fertility rate with 275.0 births per 1,000 women. Women in the age bracket of 20 to 34 years acount for 42.9% of all women with births.
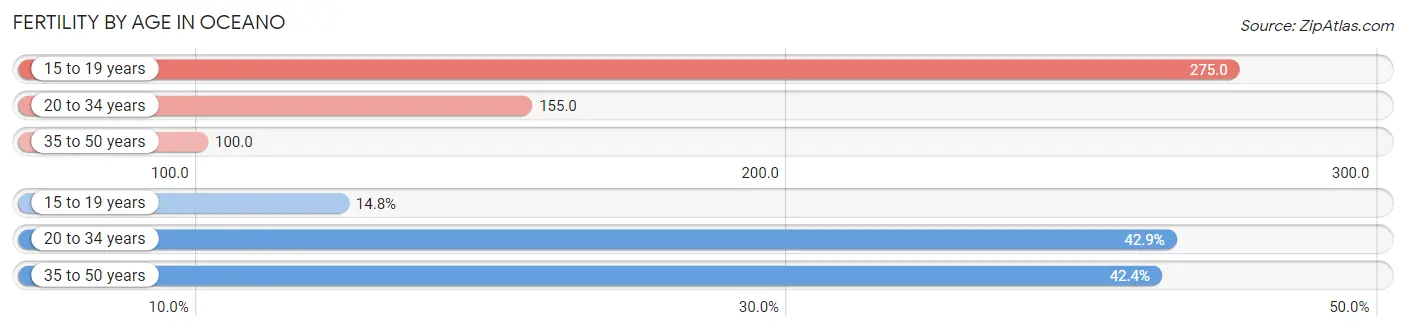
| Age Bracket | Women with Births | Births / 1,000 Women |
| 15 to 19 years | 30 (14.8%) | 275.0 |
| 20 to 34 years | 87 (42.9%) | 155.0 |
| 35 to 50 years | 86 (42.4%) | 100.0 |
| Total | 203 (100.0%) | 133.0 |
Fertility by Age by Marriage Status in Oceano
42.9% of women with births (203) in Oceano are married. The highest percentage of unmarried women with births falls into 15 to 19 years age bracket with 100.0% of them unmarried at the time of birth, while the lowest percentage of unmarried women with births belong to 20 to 34 years age bracket with 0.0% of them unmarried.
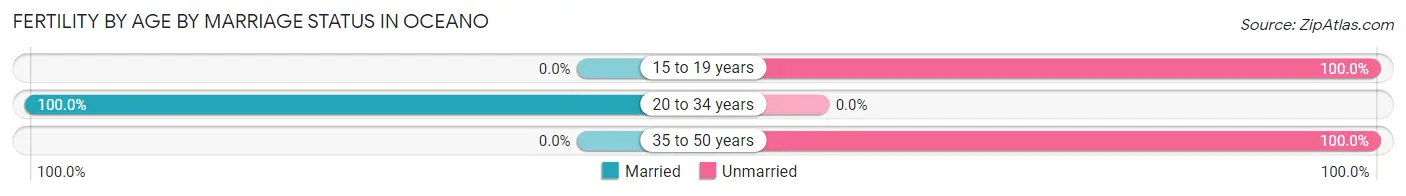
| Age Bracket | Married | Unmarried |
| 15 to 19 years | 0 (0.0%) | 30 (100.0%) |
| 20 to 34 years | 87 (100.0%) | 0 (0.0%) |
| 35 to 50 years | 0 (0.0%) | 86 (100.0%) |
| Total | 87 (42.9%) | 116 (57.1%) |
Fertility by Education in Oceano
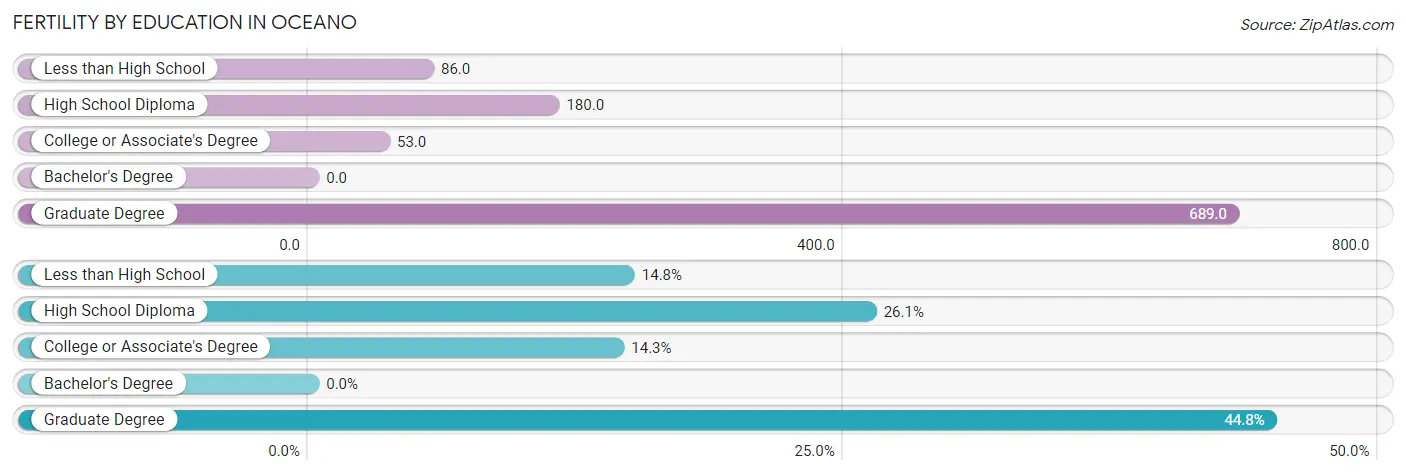
| Educational Attainment | Women with Births | Births / 1,000 Women |
| Less than High School | 30 (14.8%) | 86.0 |
| High School Diploma | 53 (26.1%) | 180.0 |
| College or Associate's Degree | 29 (14.3%) | 53.0 |
| Bachelor's Degree | 0 (0.0%) | 0.0 |
| Graduate Degree | 91 (44.8%) | 689.0 |
| Total | 203 (100.0%) | 133.0 |
Fertility by Education by Marriage Status in Oceano
57.1% of women with births in Oceano are unmarried. Women with the educational attainment of college or associate's degree are most likely to be married with 100.0% of them married at childbirth, while women with the educational attainment of less than high school are least likely to be married with 100.0% of them unmarried at childbirth.
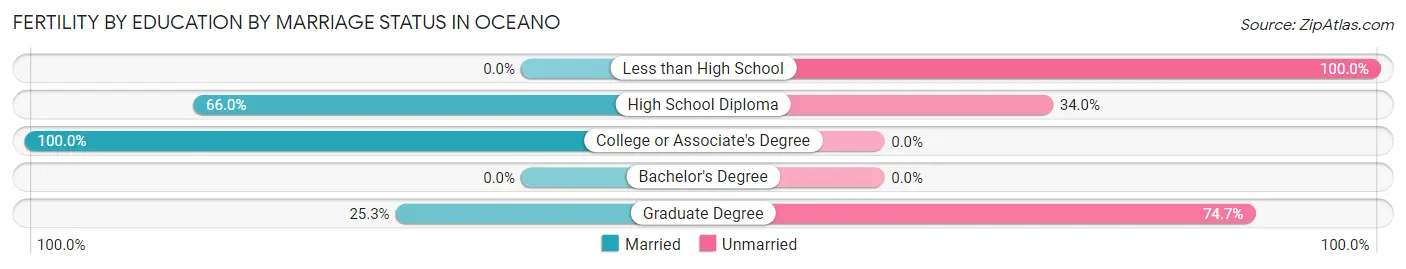
| Educational Attainment | Married | Unmarried |
| Less than High School | 0 (0.0%) | 30 (100.0%) |
| High School Diploma | 35 (66.0%) | 18 (34.0%) |
| College or Associate's Degree | 29 (100.0%) | 0 (0.0%) |
| Bachelor's Degree | 0 (0.0%) | 0 (0.0%) |
| Graduate Degree | 23 (25.3%) | 68 (74.7%) |
| Total | 87 (42.9%) | 116 (57.1%) |
Employment Characteristics in Oceano
Employment by Class of Employer in Oceano
Among the 3,122 employed individuals in Oceano, private company employees (2,023 | 64.8%), local government employees (366 | 11.7%), and self-employed (not incorporated) (352 | 11.3%) make up the most common classes of employment.
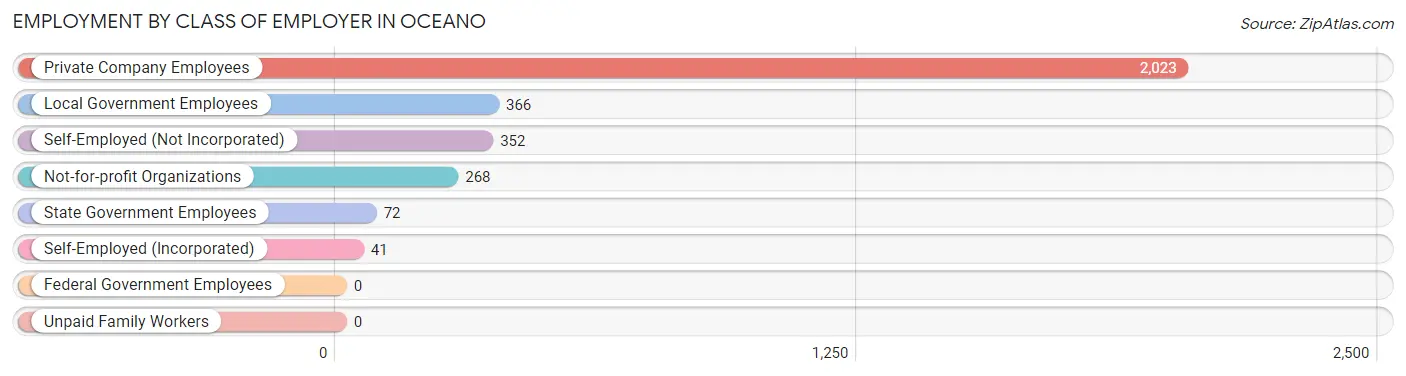
| Employer Class | # Employees | % Employees |
| Private Company Employees | 2,023 | 64.8% |
| Self-Employed (Incorporated) | 41 | 1.3% |
| Self-Employed (Not Incorporated) | 352 | 11.3% |
| Not-for-profit Organizations | 268 | 8.6% |
| Local Government Employees | 366 | 11.7% |
| State Government Employees | 72 | 2.3% |
| Federal Government Employees | 0 | 0.0% |
| Unpaid Family Workers | 0 | 0.0% |
| Total | 3,122 | 100.0% |
Employment Status by Age in Oceano
According to the labor force statistics for Oceano, out of the total population over 16 years of age (5,854), 56.2% or 3,290 individuals are in the labor force, with 3.9% or 128 of them unemployed. The age group with the highest labor force participation rate is 35 to 44 years, with 89.3% or 849 individuals in the labor force. Within the labor force, the 16 to 19 years age range has the highest percentage of unemployed individuals, with 100.0% or 11 of them being unemployed.
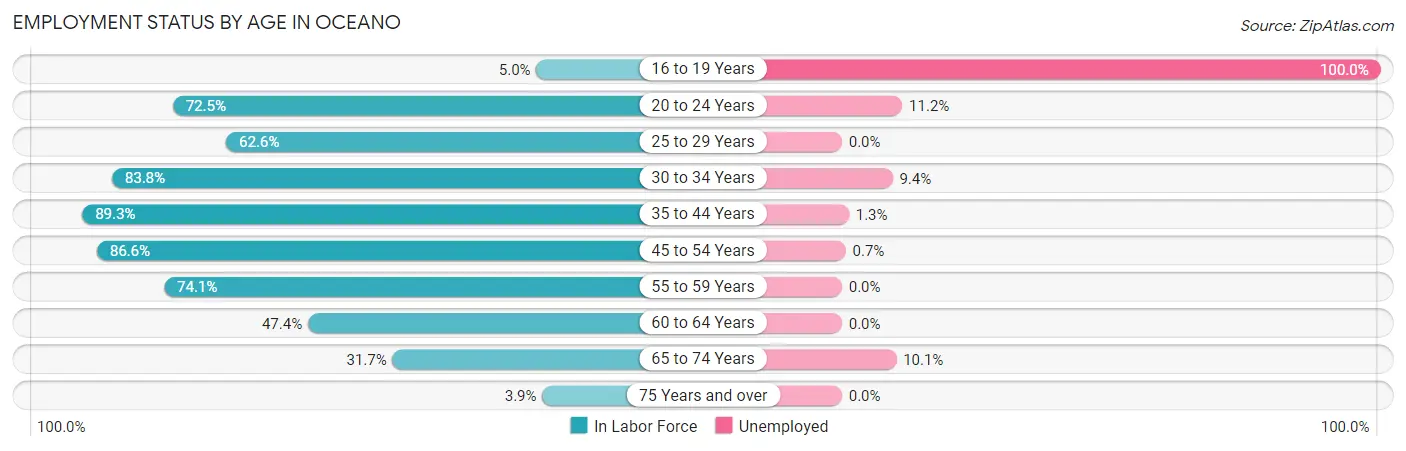
| Age Bracket | In Labor Force | Unemployed |
| 16 to 19 Years | 11 (5.0%) | 11 (100.0%) |
| 20 to 24 Years | 259 (72.5%) | 29 (11.2%) |
| 25 to 29 Years | 186 (62.6%) | 0 (0.0%) |
| 30 to 34 Years | 446 (83.8%) | 42 (9.4%) |
| 35 to 44 Years | 849 (89.3%) | 11 (1.3%) |
| 45 to 54 Years | 840 (86.6%) | 6 (0.7%) |
| 55 to 59 Years | 218 (74.1%) | 0 (0.0%) |
| 60 to 64 Years | 144 (47.4%) | 0 (0.0%) |
| 65 to 74 Years | 297 (31.7%) | 30 (10.1%) |
| 75 Years and over | 39 (3.9%) | 0 (0.0%) |
| Total | 3,290 (56.2%) | 128 (3.9%) |
Employment Status by Educational Attainment in Oceano
According to labor force statistics for Oceano, 80.1% of individuals (2,682) out of the total population between 25 and 64 years of age (3,348) are in the labor force, with 2.2% or 59 of them being unemployed. The group with the highest labor force participation rate are those with the educational attainment of less than high school, with 97.3% or 583 individuals in the labor force. Within the labor force, individuals with less than high school education have the highest percentage of unemployment, with 7.2% or 42 of them being unemployed.
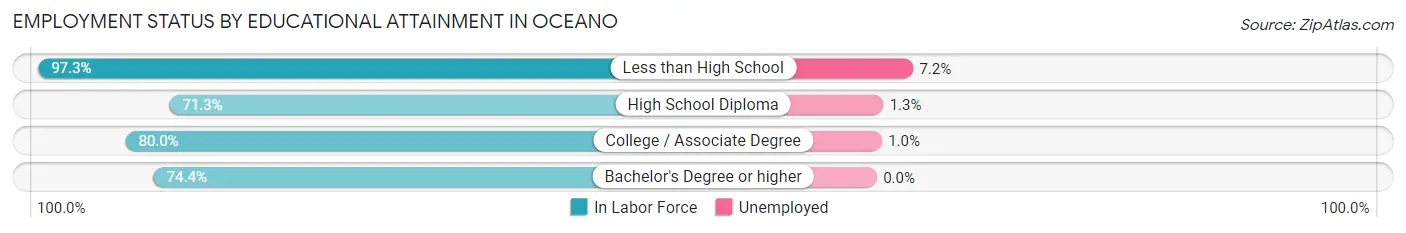
| Educational Attainment | In Labor Force | Unemployed |
| Less than High School | 583 (97.3%) | 43 (7.2%) |
| High School Diploma | 462 (71.3%) | 8 (1.3%) |
| College / Associate Degree | 1,069 (80.0%) | 13 (1.0%) |
| Bachelor's Degree or higher | 569 (74.4%) | 0 (0.0%) |
| Total | 2,682 (80.1%) | 74 (2.2%) |
Employment Occupations by Sex in Oceano
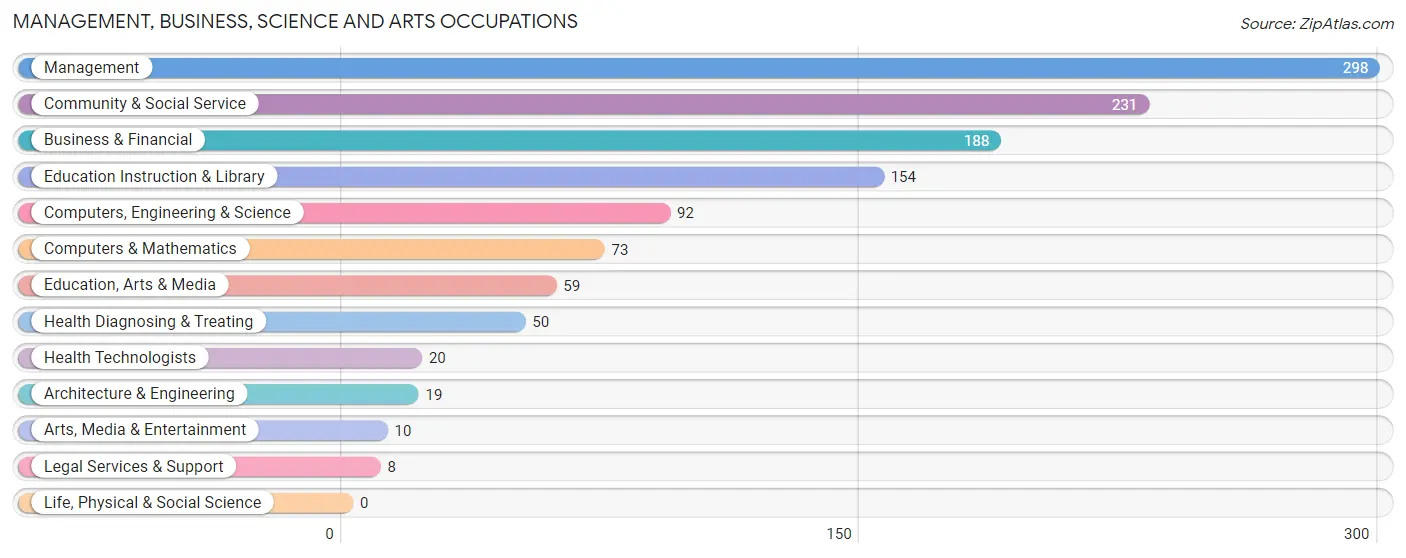
Management, Business, Science and Arts Occupations
The most common Management, Business, Science and Arts occupations in Oceano are Management (298 | 9.4%), Community & Social Service (231 | 7.3%), Business & Financial (188 | 5.9%), Education Instruction & Library (154 | 4.9%), and Computers, Engineering & Science (92 | 2.9%).
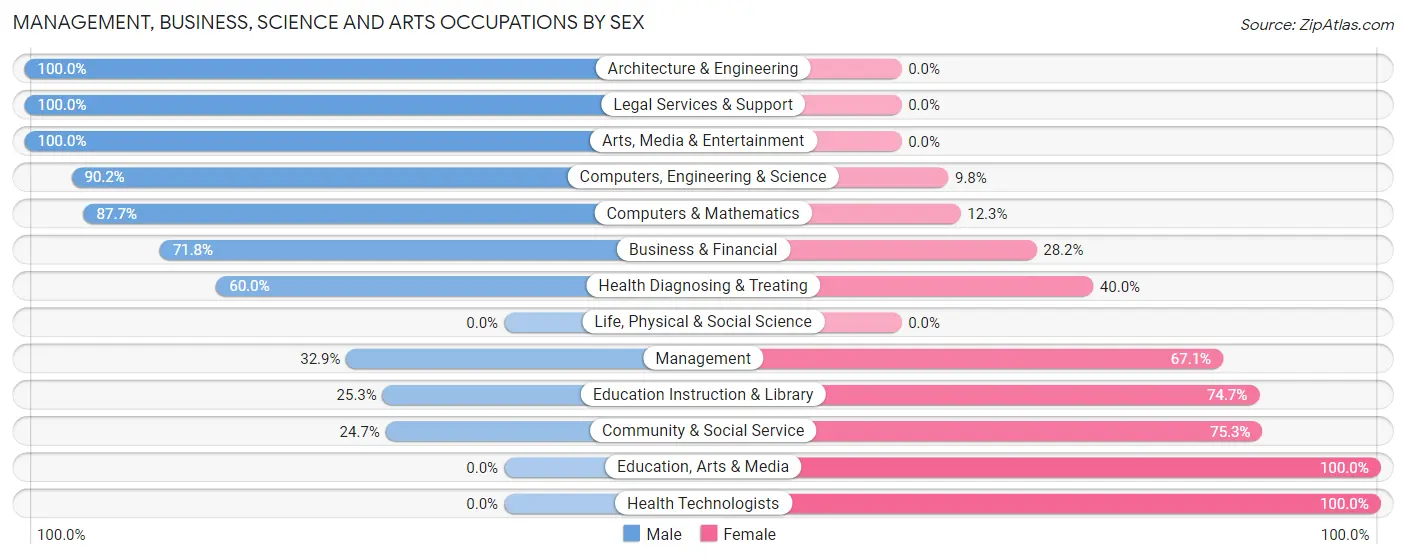
Management, Business, Science and Arts Occupations by Sex
Within the Management, Business, Science and Arts occupations in Oceano, the most male-oriented occupations are Architecture & Engineering (100.0%), Legal Services & Support (100.0%), and Arts, Media & Entertainment (100.0%), while the most female-oriented occupations are Education, Arts & Media (100.0%), Health Technologists (100.0%), and Community & Social Service (75.3%).
| Occupation | Male | Female |
| Management | 98 (32.9%) | 200 (67.1%) |
| Business & Financial | 135 (71.8%) | 53 (28.2%) |
| Computers, Engineering & Science | 83 (90.2%) | 9 (9.8%) |
| Computers & Mathematics | 64 (87.7%) | 9 (12.3%) |
| Architecture & Engineering | 19 (100.0%) | 0 (0.0%) |
| Life, Physical & Social Science | 0 (0.0%) | 0 (0.0%) |
| Community & Social Service | 57 (24.7%) | 174 (75.3%) |
| Education, Arts & Media | 0 (0.0%) | 59 (100.0%) |
| Legal Services & Support | 8 (100.0%) | 0 (0.0%) |
| Education Instruction & Library | 39 (25.3%) | 115 (74.7%) |
| Arts, Media & Entertainment | 10 (100.0%) | 0 (0.0%) |
| Health Diagnosing & Treating | 30 (60.0%) | 20 (40.0%) |
| Health Technologists | 0 (0.0%) | 20 (100.0%) |
| Total (Category) | 403 (46.9%) | 456 (53.1%) |
| Total (Overall) | 1,787 (56.6%) | 1,373 (43.4%) |
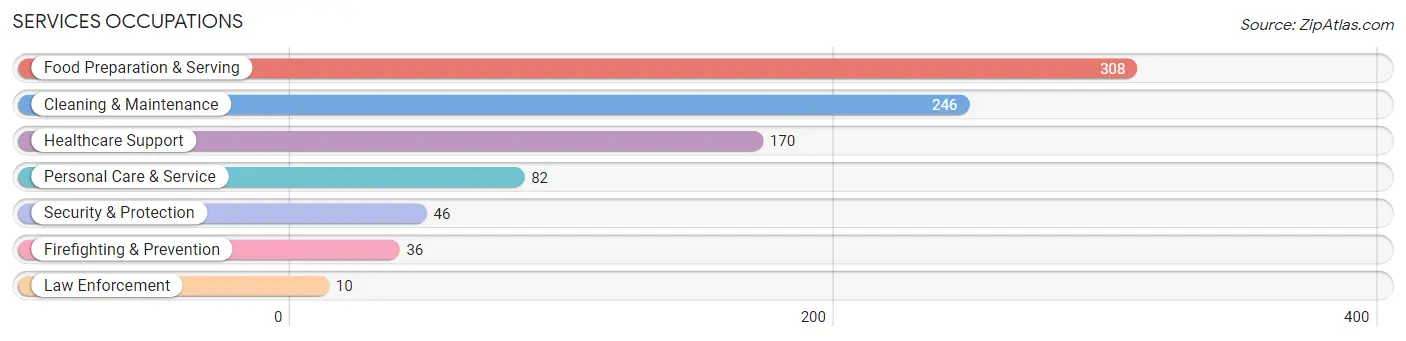
Services Occupations
The most common Services occupations in Oceano are Food Preparation & Serving (308 | 9.8%), Cleaning & Maintenance (246 | 7.8%), Healthcare Support (170 | 5.4%), Personal Care & Service (82 | 2.6%), and Security & Protection (46 | 1.5%).
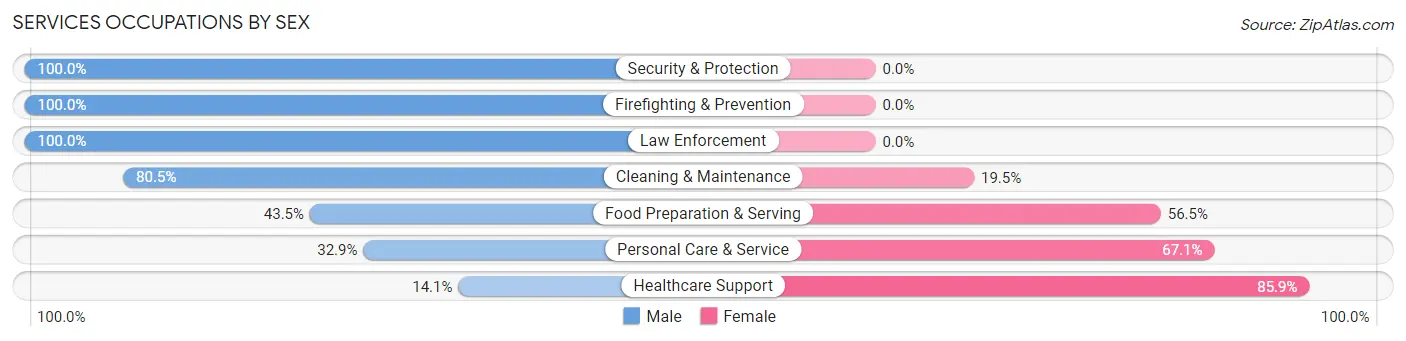
Services Occupations by Sex
Within the Services occupations in Oceano, the most male-oriented occupations are Security & Protection (100.0%), Firefighting & Prevention (100.0%), and Law Enforcement (100.0%), while the most female-oriented occupations are Healthcare Support (85.9%), Personal Care & Service (67.1%), and Food Preparation & Serving (56.5%).
| Occupation | Male | Female |
| Healthcare Support | 24 (14.1%) | 146 (85.9%) |
| Security & Protection | 46 (100.0%) | 0 (0.0%) |
| Firefighting & Prevention | 36 (100.0%) | 0 (0.0%) |
| Law Enforcement | 10 (100.0%) | 0 (0.0%) |
| Food Preparation & Serving | 134 (43.5%) | 174 (56.5%) |
| Cleaning & Maintenance | 198 (80.5%) | 48 (19.5%) |
| Personal Care & Service | 27 (32.9%) | 55 (67.1%) |
| Total (Category) | 429 (50.3%) | 423 (49.6%) |
| Total (Overall) | 1,787 (56.6%) | 1,373 (43.4%) |
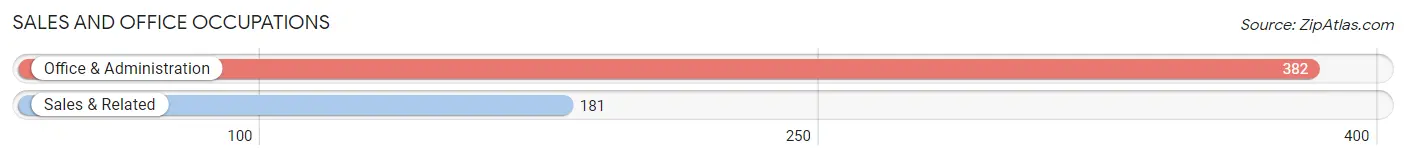
Sales and Office Occupations
The most common Sales and Office occupations in Oceano are Office & Administration (382 | 12.1%), and Sales & Related (181 | 5.7%).
Sales and Office Occupations by Sex
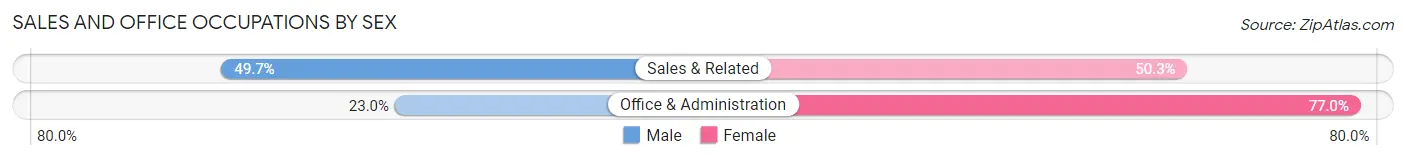
| Occupation | Male | Female |
| Sales & Related | 90 (49.7%) | 91 (50.3%) |
| Office & Administration | 88 (23.0%) | 294 (77.0%) |
| Total (Category) | 178 (31.6%) | 385 (68.4%) |
| Total (Overall) | 1,787 (56.6%) | 1,373 (43.4%) |
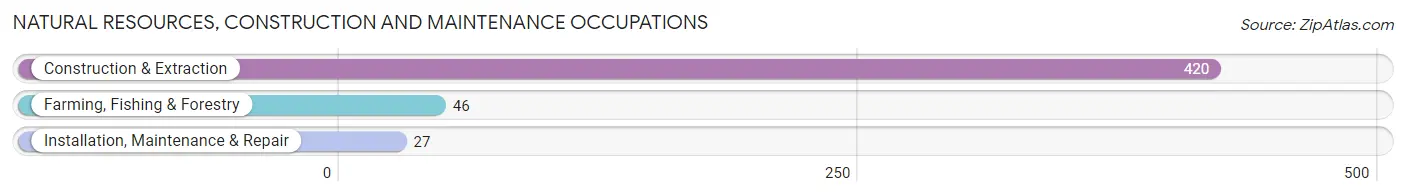
Natural Resources, Construction and Maintenance Occupations
The most common Natural Resources, Construction and Maintenance occupations in Oceano are Construction & Extraction (420 | 13.3%), Farming, Fishing & Forestry (46 | 1.5%), and Installation, Maintenance & Repair (27 | 0.9%).
Natural Resources, Construction and Maintenance Occupations by Sex
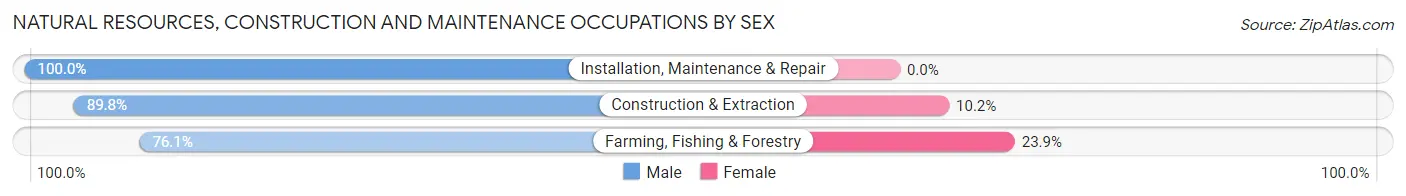
| Occupation | Male | Female |
| Farming, Fishing & Forestry | 35 (76.1%) | 11 (23.9%) |
| Construction & Extraction | 377 (89.8%) | 43 (10.2%) |
| Installation, Maintenance & Repair | 27 (100.0%) | 0 (0.0%) |
| Total (Category) | 439 (89.0%) | 54 (11.0%) |
| Total (Overall) | 1,787 (56.6%) | 1,373 (43.4%) |
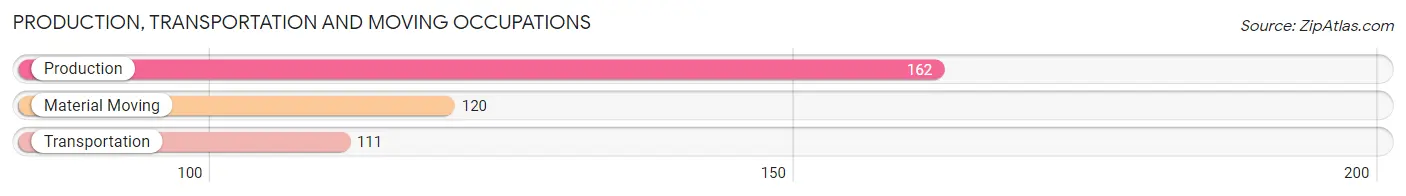
Production, Transportation and Moving Occupations
The most common Production, Transportation and Moving occupations in Oceano are Production (162 | 5.1%), Material Moving (120 | 3.8%), and Transportation (111 | 3.5%).
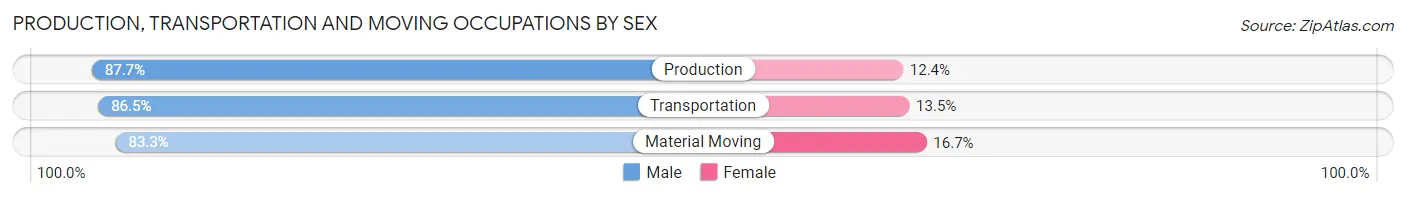
Production, Transportation and Moving Occupations by Sex
| Occupation | Male | Female |
| Production | 142 (87.6%) | 20 (12.3%) |
| Transportation | 96 (86.5%) | 15 (13.5%) |
| Material Moving | 100 (83.3%) | 20 (16.7%) |
| Total (Category) | 338 (86.0%) | 55 (14.0%) |
| Total (Overall) | 1,787 (56.6%) | 1,373 (43.4%) |
Employment Industries by Sex in Oceano
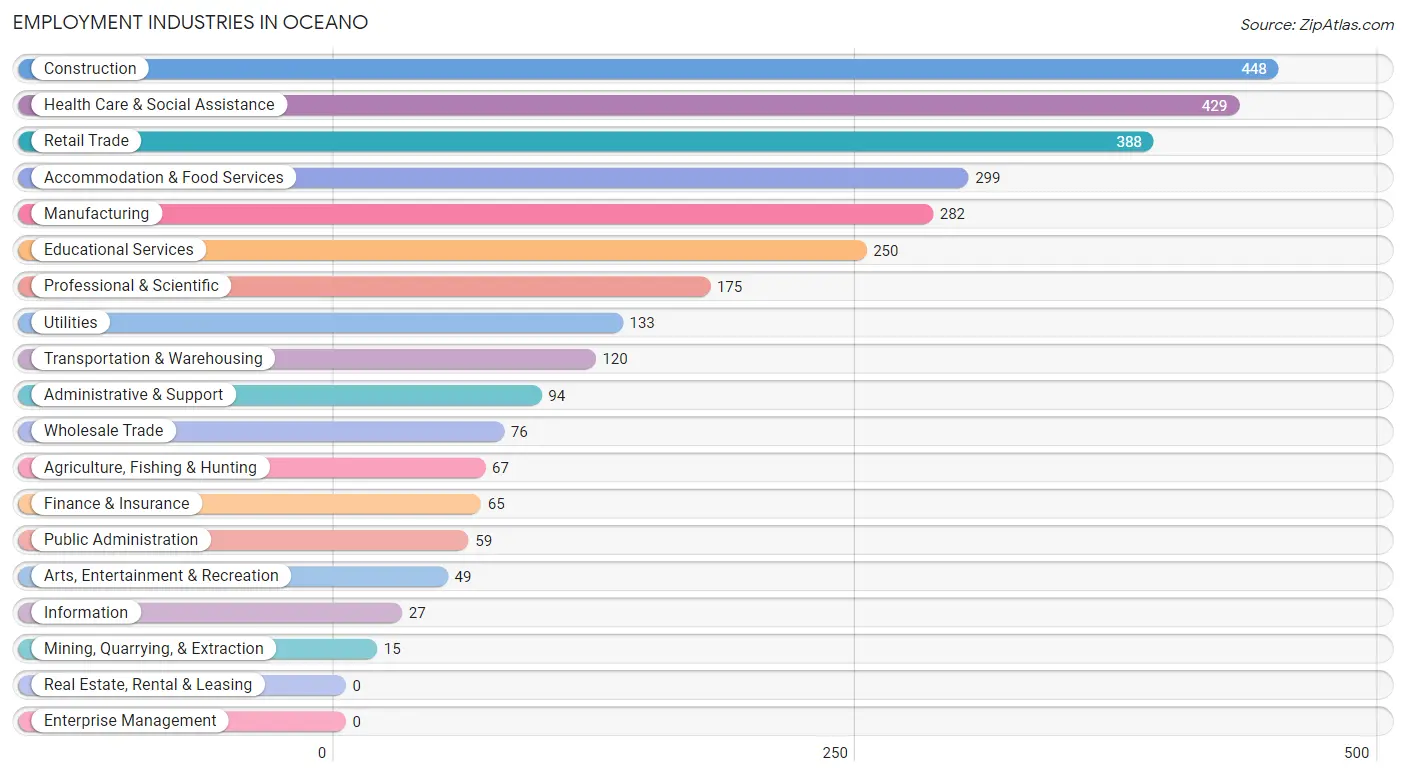
Employment Industries in Oceano
The major employment industries in Oceano include Construction (448 | 14.2%), Health Care & Social Assistance (429 | 13.6%), Retail Trade (388 | 12.3%), Accommodation & Food Services (299 | 9.5%), and Manufacturing (282 | 8.9%).
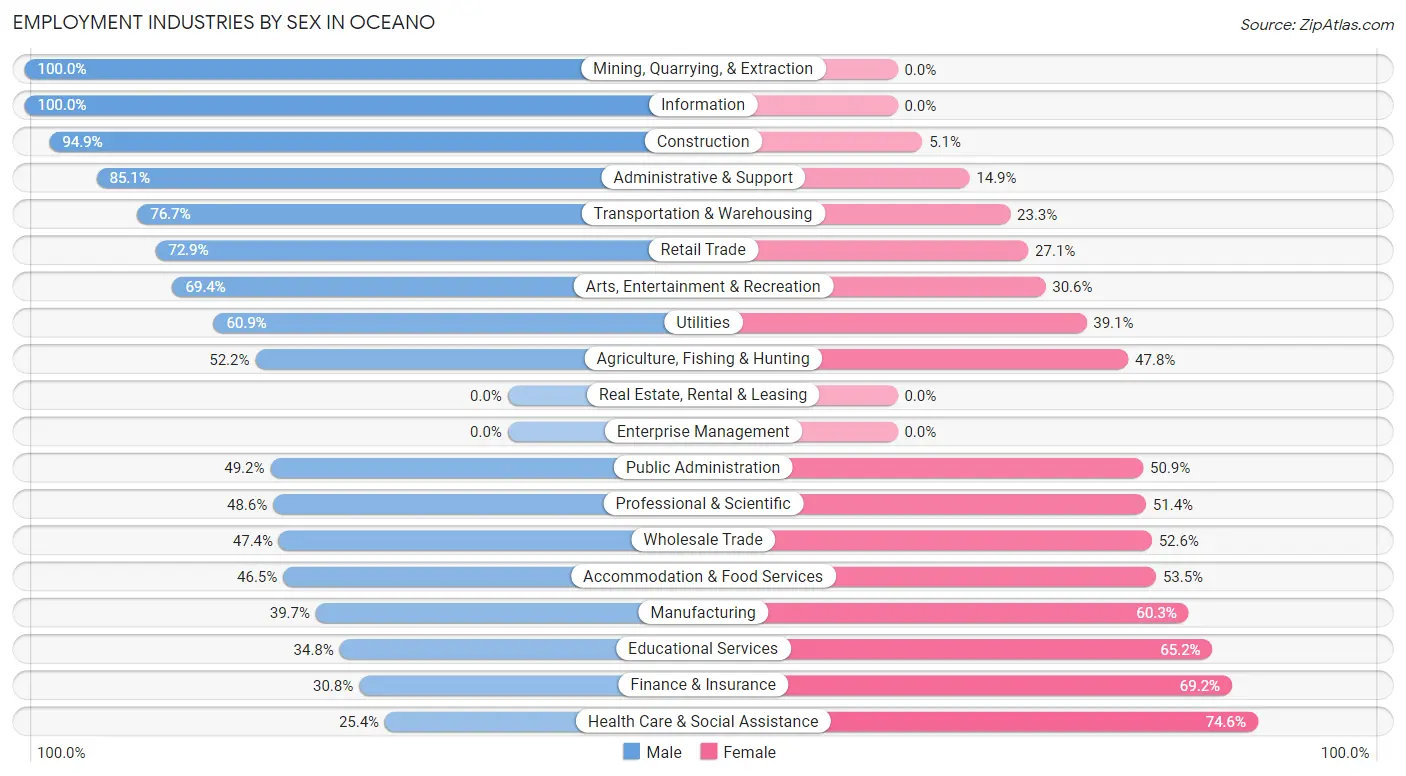
Employment Industries by Sex in Oceano
The Oceano industries that see more men than women are Mining, Quarrying, & Extraction (100.0%), Information (100.0%), and Construction (94.9%), whereas the industries that tend to have a higher number of women are Health Care & Social Assistance (74.6%), Finance & Insurance (69.2%), and Educational Services (65.2%).
| Industry | Male | Female |
| Agriculture, Fishing & Hunting | 35 (52.2%) | 32 (47.8%) |
| Mining, Quarrying, & Extraction | 15 (100.0%) | 0 (0.0%) |
| Construction | 425 (94.9%) | 23 (5.1%) |
| Manufacturing | 112 (39.7%) | 170 (60.3%) |
| Wholesale Trade | 36 (47.4%) | 40 (52.6%) |
| Retail Trade | 283 (72.9%) | 105 (27.1%) |
| Transportation & Warehousing | 92 (76.7%) | 28 (23.3%) |
| Utilities | 81 (60.9%) | 52 (39.1%) |
| Information | 27 (100.0%) | 0 (0.0%) |
| Finance & Insurance | 20 (30.8%) | 45 (69.2%) |
| Real Estate, Rental & Leasing | 0 (0.0%) | 0 (0.0%) |
| Professional & Scientific | 85 (48.6%) | 90 (51.4%) |
| Enterprise Management | 0 (0.0%) | 0 (0.0%) |
| Administrative & Support | 80 (85.1%) | 14 (14.9%) |
| Educational Services | 87 (34.8%) | 163 (65.2%) |
| Health Care & Social Assistance | 109 (25.4%) | 320 (74.6%) |
| Arts, Entertainment & Recreation | 34 (69.4%) | 15 (30.6%) |
| Accommodation & Food Services | 139 (46.5%) | 160 (53.5%) |
| Public Administration | 29 (49.1%) | 30 (50.8%) |
| Total | 1,787 (56.6%) | 1,373 (43.4%) |
Education in Oceano
School Enrollment in Oceano
The most common levels of schooling among the 1,628 students in Oceano are college / undergraduate (421 | 25.9%), middle school (340 | 20.9%), and high school (321 | 19.7%).
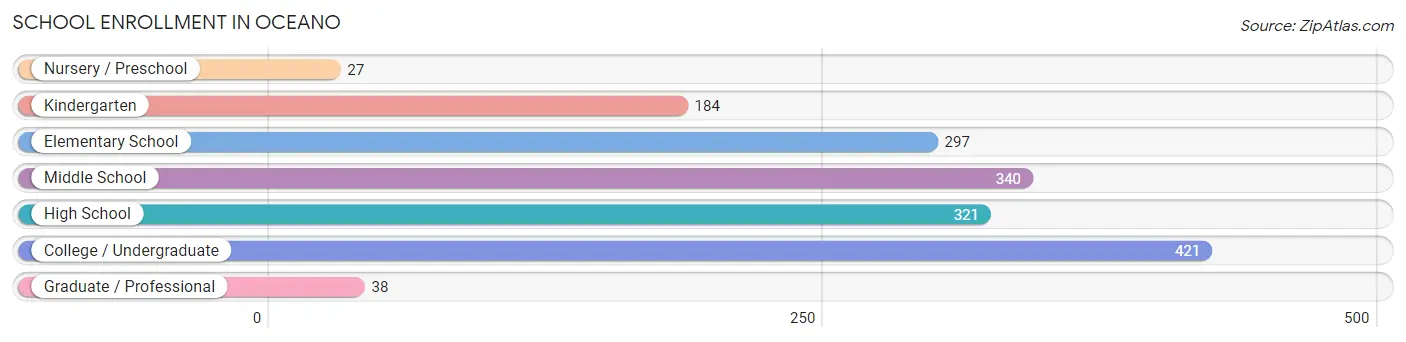
| School Level | # Students | % Students |
| Nursery / Preschool | 27 | 1.7% |
| Kindergarten | 184 | 11.3% |
| Elementary School | 297 | 18.2% |
| Middle School | 340 | 20.9% |
| High School | 321 | 19.7% |
| College / Undergraduate | 421 | 25.9% |
| Graduate / Professional | 38 | 2.3% |
| Total | 1,628 | 100.0% |
School Enrollment by Age by Funding Source in Oceano
Out of a total of 1,628 students who are enrolled in schools in Oceano, 143 (8.8%) attend a private institution, while the remaining 1,485 (91.2%) are enrolled in public schools. The age group of 5 to 9 year old has the highest likelihood of being enrolled in private schools, with 78 (21.0% in the age bracket) enrolled. Conversely, the age group of 3 to 4 year olds has the lowest likelihood of being enrolled in a private school, with 83 (100.0% in the age bracket) attending a public institution.
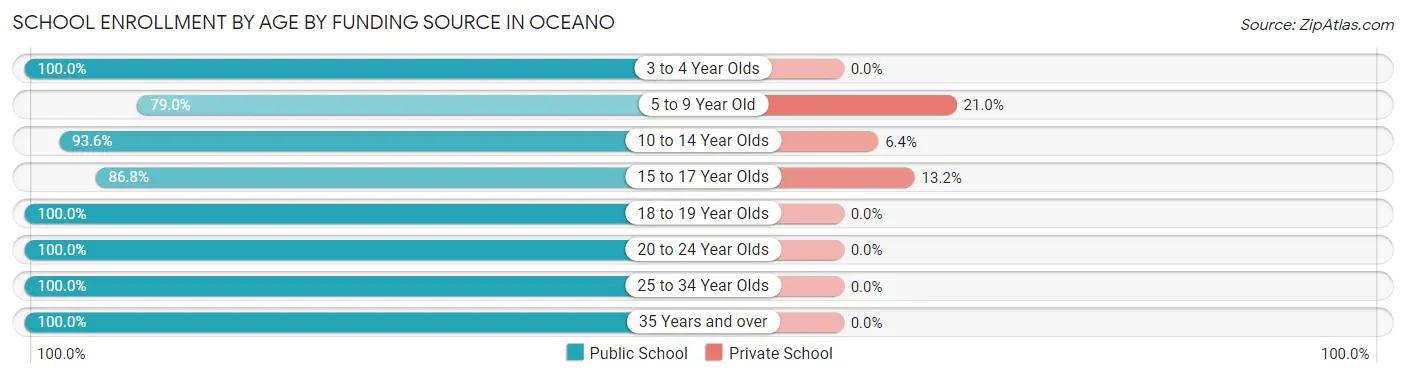
| Age Bracket | Public School | Private School |
| 3 to 4 Year Olds | 83 (100.0%) | 0 (0.0%) |
| 5 to 9 Year Old | 293 (79.0%) | 78 (21.0%) |
| 10 to 14 Year Olds | 393 (93.6%) | 27 (6.4%) |
| 15 to 17 Year Olds | 256 (86.8%) | 39 (13.2%) |
| 18 to 19 Year Olds | 34 (100.0%) | 0 (0.0%) |
| 20 to 24 Year Olds | 180 (100.0%) | 0 (0.0%) |
| 25 to 34 Year Olds | 163 (100.0%) | 0 (0.0%) |
| 35 Years and over | 82 (100.0%) | 0 (0.0%) |
| Total | 1,485 (91.2%) | 143 (8.8%) |
Educational Attainment by Field of Study in Oceano
Business (286 | 28.3%), bio, nature & agricultural (116 | 11.5%), communications (114 | 11.3%), psychology (109 | 10.8%), and social sciences (103 | 10.2%) are the most common fields of study among 1,011 individuals in Oceano who have obtained a bachelor's degree or higher.
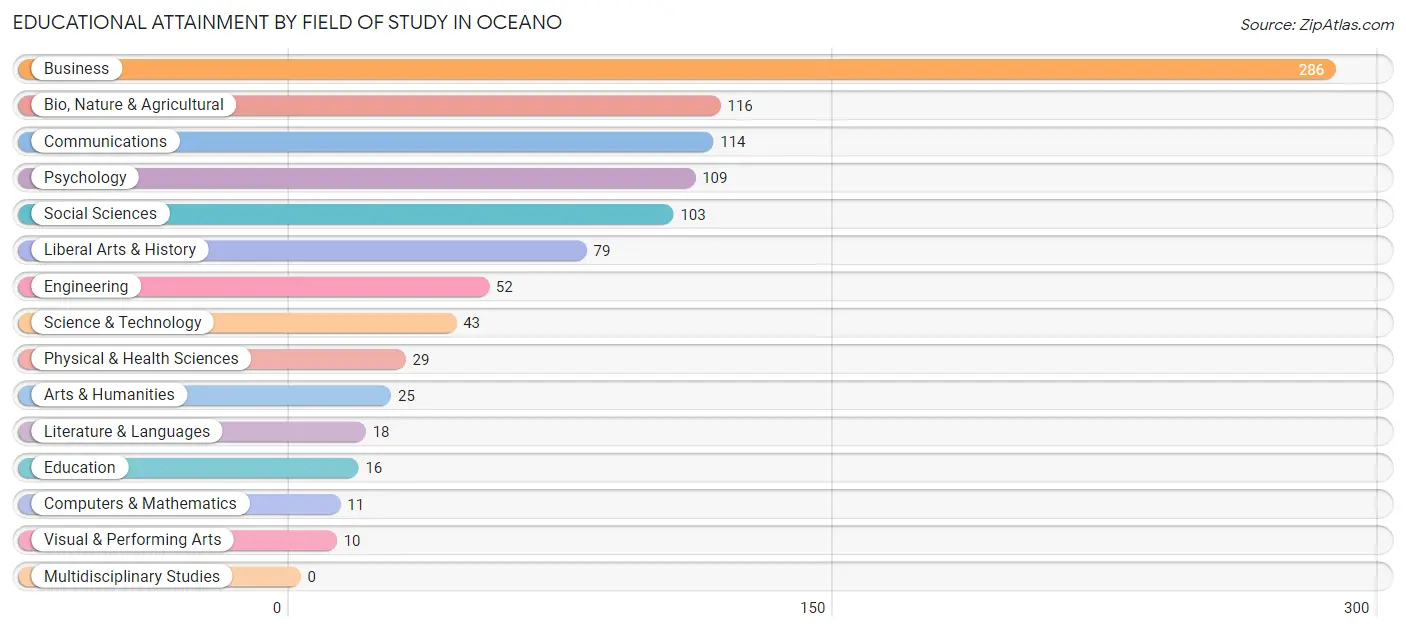
| Field of Study | # Graduates | % Graduates |
| Computers & Mathematics | 11 | 1.1% |
| Bio, Nature & Agricultural | 116 | 11.5% |
| Physical & Health Sciences | 29 | 2.9% |
| Psychology | 109 | 10.8% |
| Social Sciences | 103 | 10.2% |
| Engineering | 52 | 5.1% |
| Multidisciplinary Studies | 0 | 0.0% |
| Science & Technology | 43 | 4.3% |
| Business | 286 | 28.3% |
| Education | 16 | 1.6% |
| Literature & Languages | 18 | 1.8% |
| Liberal Arts & History | 79 | 7.8% |
| Visual & Performing Arts | 10 | 1.0% |
| Communications | 114 | 11.3% |
| Arts & Humanities | 25 | 2.5% |
| Total | 1,011 | 100.0% |
Transportation & Commute in Oceano
Vehicle Availability by Sex in Oceano
The most prevalent vehicle ownership categories in Oceano are males with 2 vehicles (522, accounting for 29.8%) and females with 2 vehicles (385, making up 38.0%).
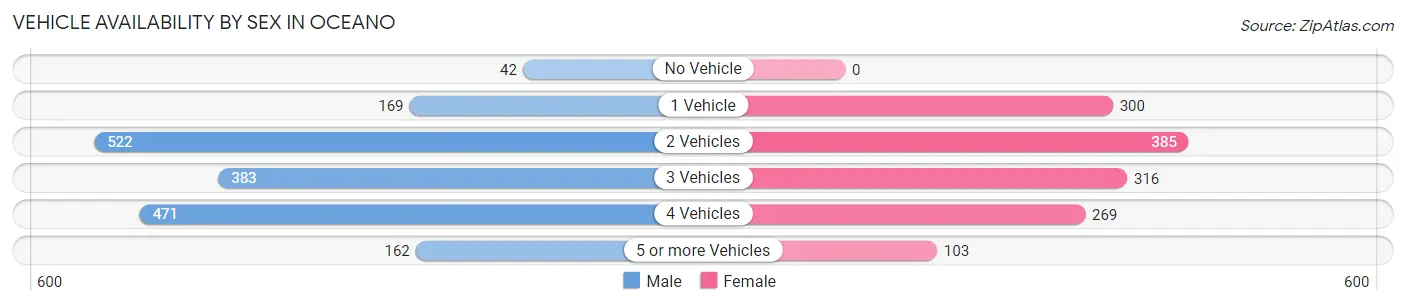
| Vehicles Available | Male | Female |
| No Vehicle | 42 (2.4%) | 0 (0.0%) |
| 1 Vehicle | 169 (9.7%) | 300 (21.8%) |
| 2 Vehicles | 522 (29.8%) | 385 (28.0%) |
| 3 Vehicles | 383 (21.9%) | 316 (23.0%) |
| 4 Vehicles | 471 (26.9%) | 269 (19.6%) |
| 5 or more Vehicles | 162 (9.3%) | 103 (7.5%) |
| Total | 1,749 (100.0%) | 1,373 (100.0%) |
Commute Time in Oceano
The most frequently occuring commute durations in Oceano are 5 to 9 minutes (832 commuters, 30.0%), 30 to 34 minutes (494 commuters, 17.8%), and 20 to 24 minutes (461 commuters, 16.6%).
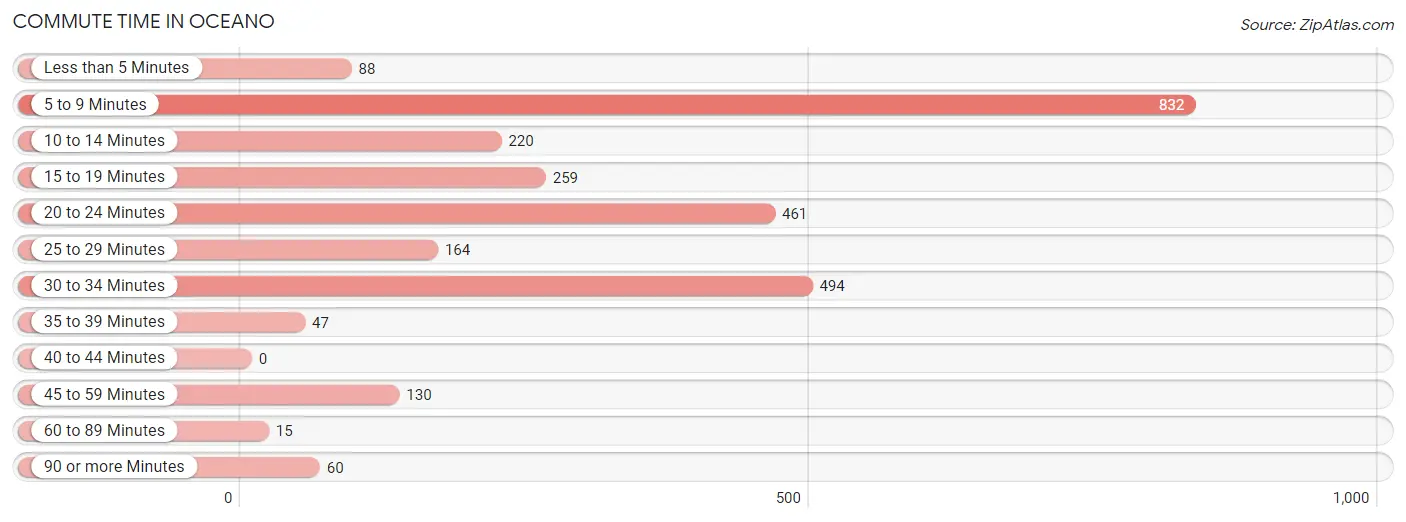
| Commute Time | # Commuters | % Commuters |
| Less than 5 Minutes | 88 | 3.2% |
| 5 to 9 Minutes | 832 | 30.0% |
| 10 to 14 Minutes | 220 | 7.9% |
| 15 to 19 Minutes | 259 | 9.3% |
| 20 to 24 Minutes | 461 | 16.6% |
| 25 to 29 Minutes | 164 | 5.9% |
| 30 to 34 Minutes | 494 | 17.8% |
| 35 to 39 Minutes | 47 | 1.7% |
| 40 to 44 Minutes | 0 | 0.0% |
| 45 to 59 Minutes | 130 | 4.7% |
| 60 to 89 Minutes | 15 | 0.5% |
| 90 or more Minutes | 60 | 2.2% |
Commute Time by Sex in Oceano
The most common commute times in Oceano are 5 to 9 minutes (345 commuters, 23.5%) for males and 5 to 9 minutes (487 commuters, 37.5%) for females.
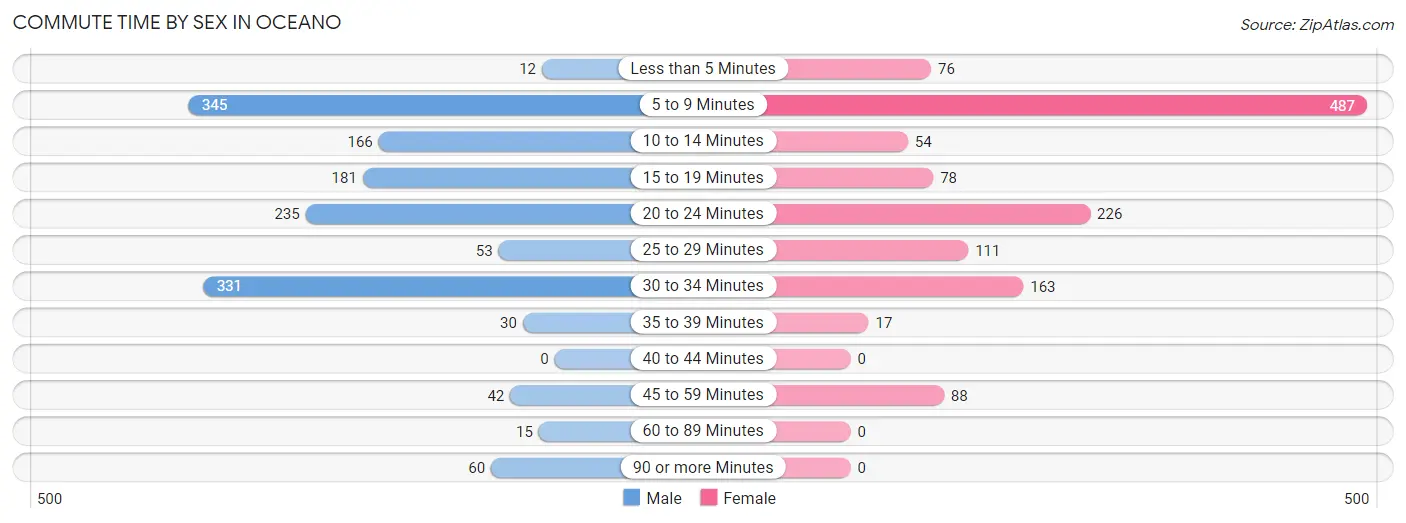
| Commute Time | Male | Female |
| Less than 5 Minutes | 12 (0.8%) | 76 (5.9%) |
| 5 to 9 Minutes | 345 (23.5%) | 487 (37.5%) |
| 10 to 14 Minutes | 166 (11.3%) | 54 (4.2%) |
| 15 to 19 Minutes | 181 (12.3%) | 78 (6.0%) |
| 20 to 24 Minutes | 235 (16.0%) | 226 (17.4%) |
| 25 to 29 Minutes | 53 (3.6%) | 111 (8.5%) |
| 30 to 34 Minutes | 331 (22.5%) | 163 (12.5%) |
| 35 to 39 Minutes | 30 (2.0%) | 17 (1.3%) |
| 40 to 44 Minutes | 0 (0.0%) | 0 (0.0%) |
| 45 to 59 Minutes | 42 (2.9%) | 88 (6.8%) |
| 60 to 89 Minutes | 15 (1.0%) | 0 (0.0%) |
| 90 or more Minutes | 60 (4.1%) | 0 (0.0%) |
Time of Departure to Work by Sex in Oceano
The most frequent times of departure to work in Oceano are 7:00 AM to 7:29 AM (267, 18.2%) for males and 8:00 AM to 8:29 AM (290, 22.3%) for females.
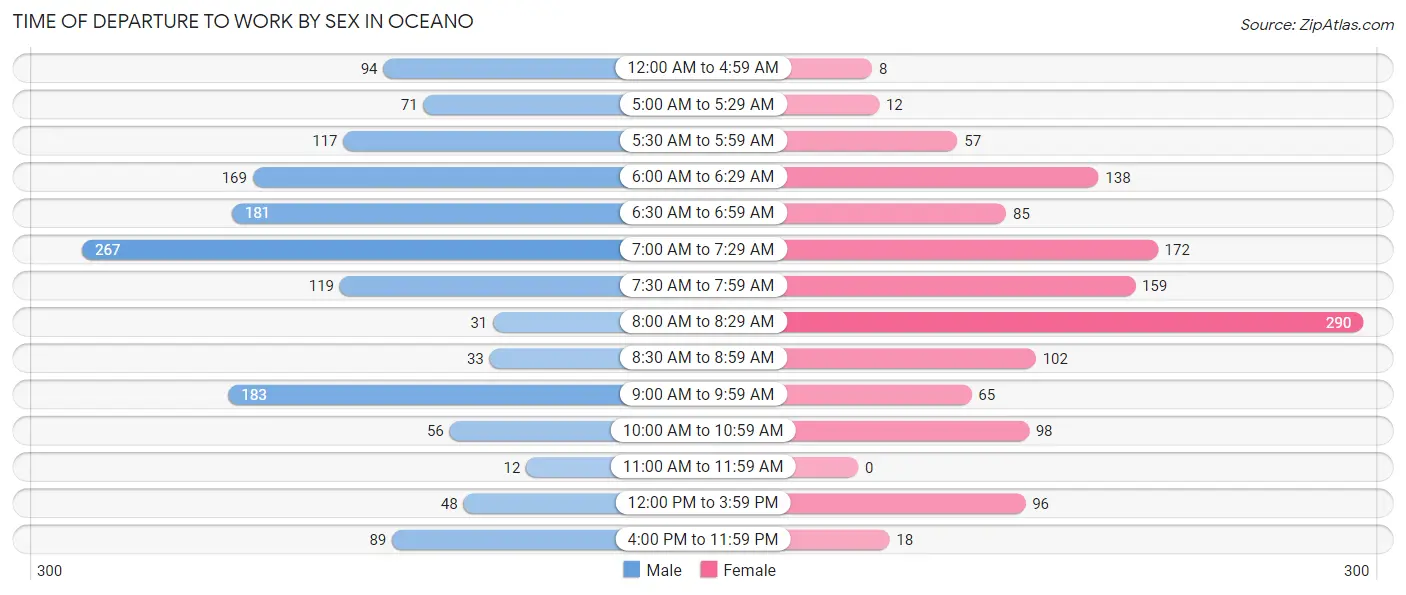
| Time of Departure | Male | Female |
| 12:00 AM to 4:59 AM | 94 (6.4%) | 8 (0.6%) |
| 5:00 AM to 5:29 AM | 71 (4.8%) | 12 (0.9%) |
| 5:30 AM to 5:59 AM | 117 (8.0%) | 57 (4.4%) |
| 6:00 AM to 6:29 AM | 169 (11.5%) | 138 (10.6%) |
| 6:30 AM to 6:59 AM | 181 (12.3%) | 85 (6.5%) |
| 7:00 AM to 7:29 AM | 267 (18.2%) | 172 (13.2%) |
| 7:30 AM to 7:59 AM | 119 (8.1%) | 159 (12.2%) |
| 8:00 AM to 8:29 AM | 31 (2.1%) | 290 (22.3%) |
| 8:30 AM to 8:59 AM | 33 (2.2%) | 102 (7.9%) |
| 9:00 AM to 9:59 AM | 183 (12.4%) | 65 (5.0%) |
| 10:00 AM to 10:59 AM | 56 (3.8%) | 98 (7.5%) |
| 11:00 AM to 11:59 AM | 12 (0.8%) | 0 (0.0%) |
| 12:00 PM to 3:59 PM | 48 (3.3%) | 96 (7.4%) |
| 4:00 PM to 11:59 PM | 89 (6.0%) | 18 (1.4%) |
| Total | 1,470 (100.0%) | 1,300 (100.0%) |
Housing Occupancy in Oceano
Occupancy by Ownership in Oceano
Of the total 2,983 dwellings in Oceano, owner-occupied units account for 1,881 (63.1%), while renter-occupied units make up 1,102 (36.9%).
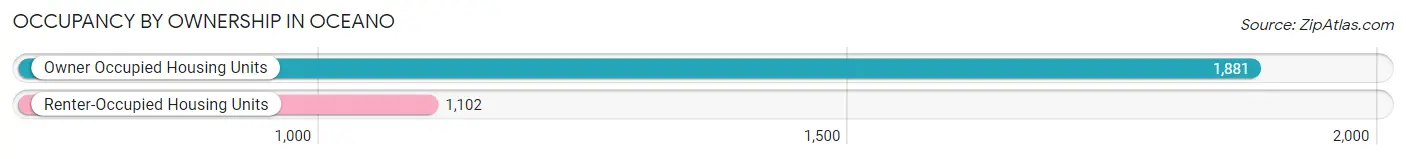
| Occupancy | # Housing Units | % Housing Units |
| Owner Occupied Housing Units | 1,881 | 63.1% |
| Renter-Occupied Housing Units | 1,102 | 36.9% |
| Total Occupied Housing Units | 2,983 | 100.0% |
Occupancy by Household Size in Oceano
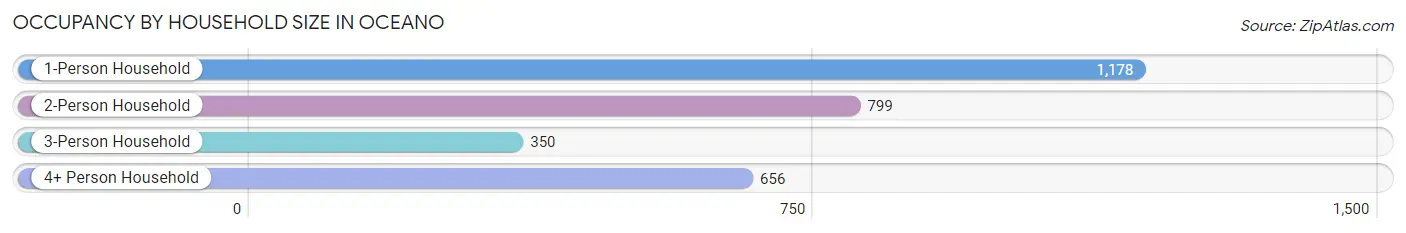
| Household Size | # Housing Units | % Housing Units |
| 1-Person Household | 1,178 | 39.5% |
| 2-Person Household | 799 | 26.8% |
| 3-Person Household | 350 | 11.7% |
| 4+ Person Household | 656 | 22.0% |
| Total Housing Units | 2,983 | 100.0% |
Occupancy by Ownership by Household Size in Oceano
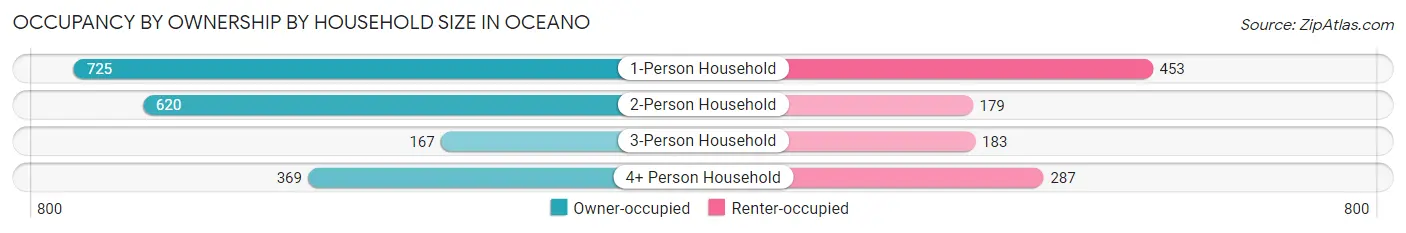
| Household Size | Owner-occupied | Renter-occupied |
| 1-Person Household | 725 (61.5%) | 453 (38.5%) |
| 2-Person Household | 620 (77.6%) | 179 (22.4%) |
| 3-Person Household | 167 (47.7%) | 183 (52.3%) |
| 4+ Person Household | 369 (56.2%) | 287 (43.8%) |
| Total Housing Units | 1,881 (63.1%) | 1,102 (36.9%) |
Occupancy by Educational Attainment in Oceano
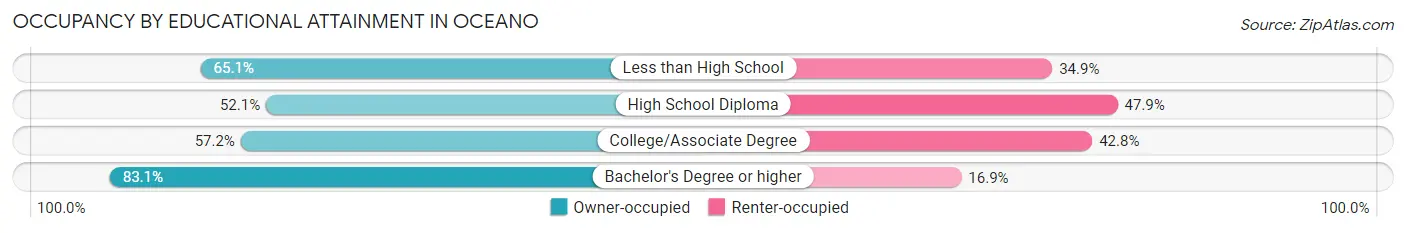
| Household Size | Owner-occupied | Renter-occupied |
| Less than High School | 276 (65.1%) | 148 (34.9%) |
| High School Diploma | 244 (52.1%) | 224 (47.9%) |
| College/Associate Degree | 830 (57.2%) | 622 (42.8%) |
| Bachelor's Degree or higher | 531 (83.1%) | 108 (16.9%) |
Occupancy by Age of Householder in Oceano
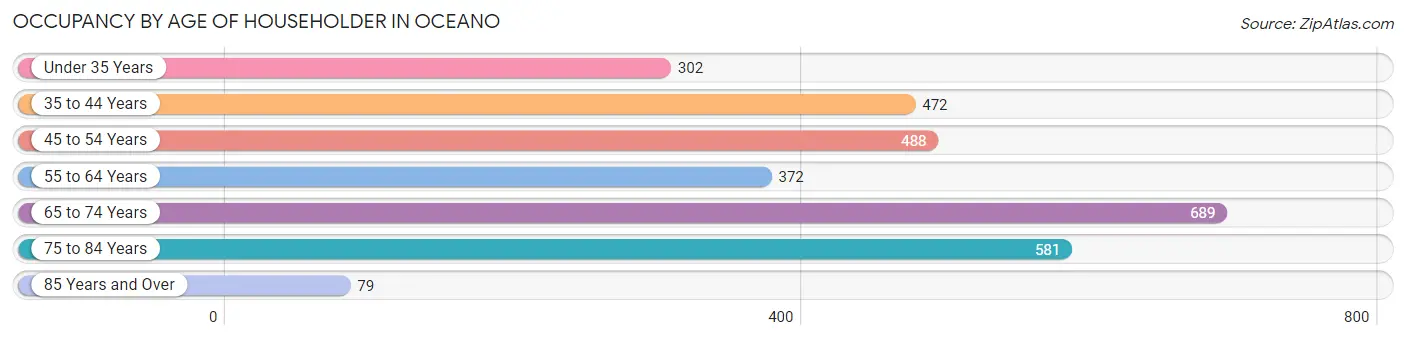
| Age Bracket | # Households | % Households |
| Under 35 Years | 302 | 10.1% |
| 35 to 44 Years | 472 | 15.8% |
| 45 to 54 Years | 488 | 16.4% |
| 55 to 64 Years | 372 | 12.5% |
| 65 to 74 Years | 689 | 23.1% |
| 75 to 84 Years | 581 | 19.5% |
| 85 Years and Over | 79 | 2.6% |
| Total | 2,983 | 100.0% |
Housing Finances in Oceano
Median Income by Occupancy in Oceano
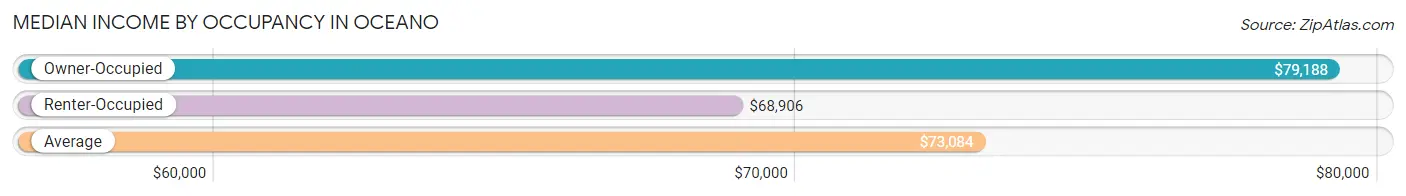
| Occupancy Type | # Households | Median Income |
| Owner-Occupied | 1,881 (63.1%) | $79,188 |
| Renter-Occupied | 1,102 (36.9%) | $68,906 |
| Average | 2,983 (100.0%) | $73,084 |
Occupancy by Householder Income Bracket in Oceano
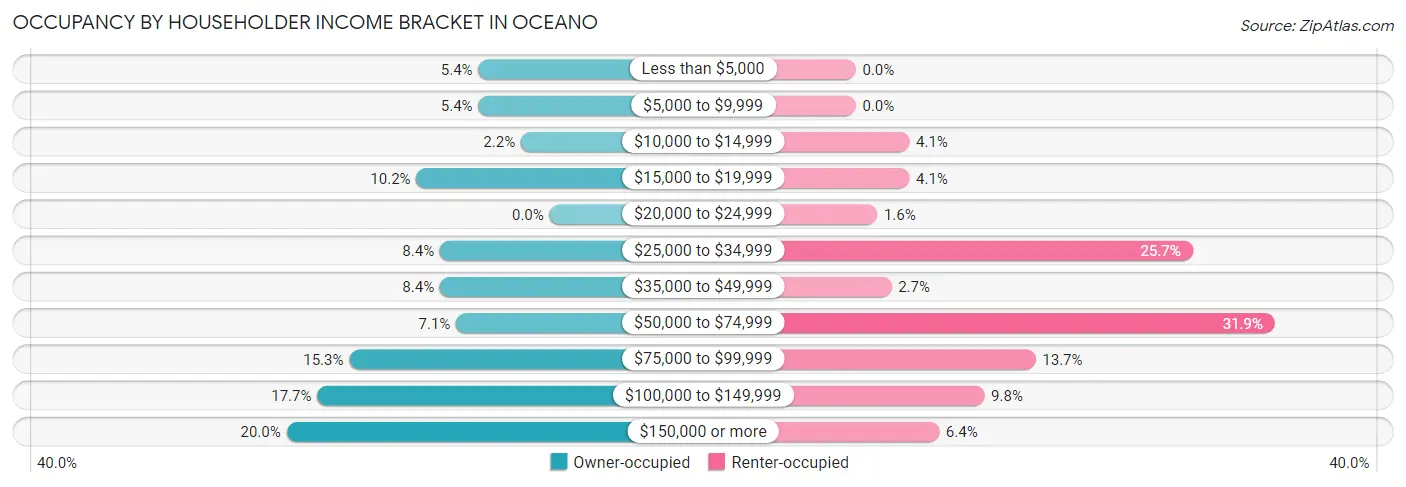
| Income Bracket | Owner-occupied | Renter-occupied |
| Less than $5,000 | 102 (5.4%) | 0 (0.0%) |
| $5,000 to $9,999 | 102 (5.4%) | 0 (0.0%) |
| $10,000 to $14,999 | 41 (2.2%) | 45 (4.1%) |
| $15,000 to $19,999 | 191 (10.2%) | 45 (4.1%) |
| $20,000 to $24,999 | 0 (0.0%) | 18 (1.6%) |
| $25,000 to $34,999 | 157 (8.4%) | 283 (25.7%) |
| $35,000 to $49,999 | 157 (8.4%) | 30 (2.7%) |
| $50,000 to $74,999 | 134 (7.1%) | 352 (31.9%) |
| $75,000 to $99,999 | 287 (15.3%) | 151 (13.7%) |
| $100,000 to $149,999 | 333 (17.7%) | 108 (9.8%) |
| $150,000 or more | 377 (20.0%) | 70 (6.4%) |
| Total | 1,881 (100.0%) | 1,102 (100.0%) |
Monthly Housing Cost Tiers in Oceano
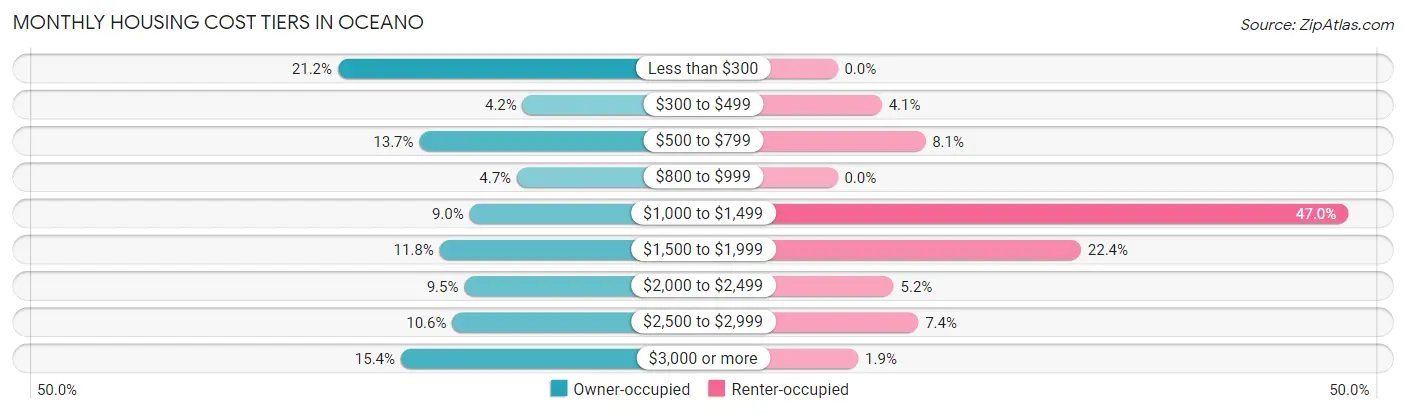
| Monthly Cost | Owner-occupied | Renter-occupied |
| Less than $300 | 398 (21.2%) | 0 (0.0%) |
| $300 to $499 | 78 (4.2%) | 45 (4.1%) |
| $500 to $799 | 257 (13.7%) | 89 (8.1%) |
| $800 to $999 | 88 (4.7%) | 0 (0.0%) |
| $1,000 to $1,499 | 170 (9.0%) | 518 (47.0%) |
| $1,500 to $1,999 | 222 (11.8%) | 247 (22.4%) |
| $2,000 to $2,499 | 179 (9.5%) | 57 (5.2%) |
| $2,500 to $2,999 | 200 (10.6%) | 82 (7.4%) |
| $3,000 or more | 289 (15.4%) | 21 (1.9%) |
| Total | 1,881 (100.0%) | 1,102 (100.0%) |
Physical Housing Characteristics in Oceano
Housing Structures in Oceano
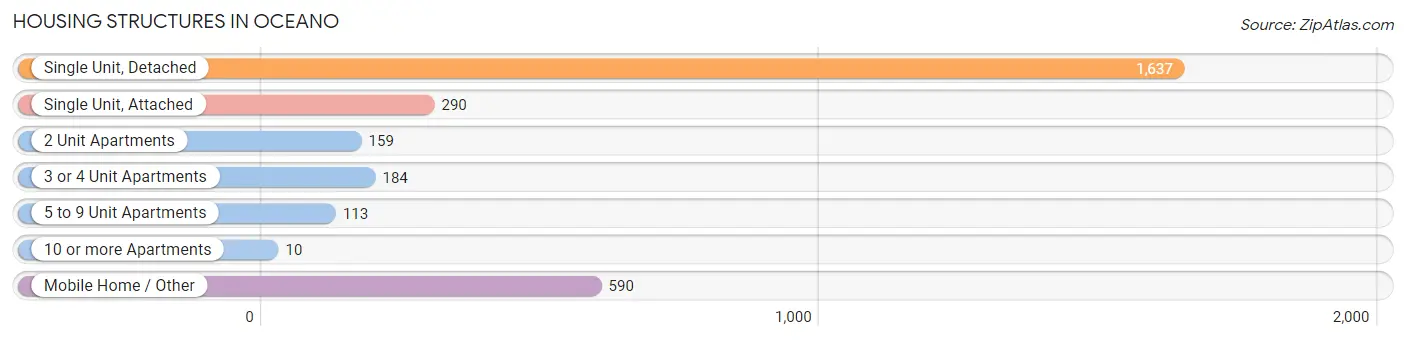
| Structure Type | # Housing Units | % Housing Units |
| Single Unit, Detached | 1,637 | 54.9% |
| Single Unit, Attached | 290 | 9.7% |
| 2 Unit Apartments | 159 | 5.3% |
| 3 or 4 Unit Apartments | 184 | 6.2% |
| 5 to 9 Unit Apartments | 113 | 3.8% |
| 10 or more Apartments | 10 | 0.3% |
| Mobile Home / Other | 590 | 19.8% |
| Total | 2,983 | 100.0% |
Housing Structures by Occupancy in Oceano
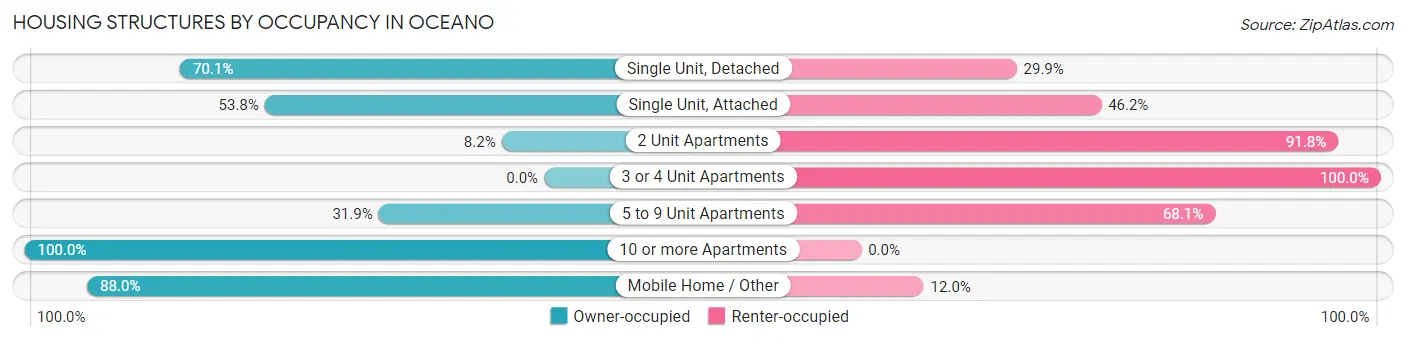
| Structure Type | Owner-occupied | Renter-occupied |
| Single Unit, Detached | 1,147 (70.1%) | 490 (29.9%) |
| Single Unit, Attached | 156 (53.8%) | 134 (46.2%) |
| 2 Unit Apartments | 13 (8.2%) | 146 (91.8%) |
| 3 or 4 Unit Apartments | 0 (0.0%) | 184 (100.0%) |
| 5 to 9 Unit Apartments | 36 (31.9%) | 77 (68.1%) |
| 10 or more Apartments | 10 (100.0%) | 0 (0.0%) |
| Mobile Home / Other | 519 (88.0%) | 71 (12.0%) |
| Total | 1,881 (63.1%) | 1,102 (36.9%) |
Housing Structures by Number of Rooms in Oceano
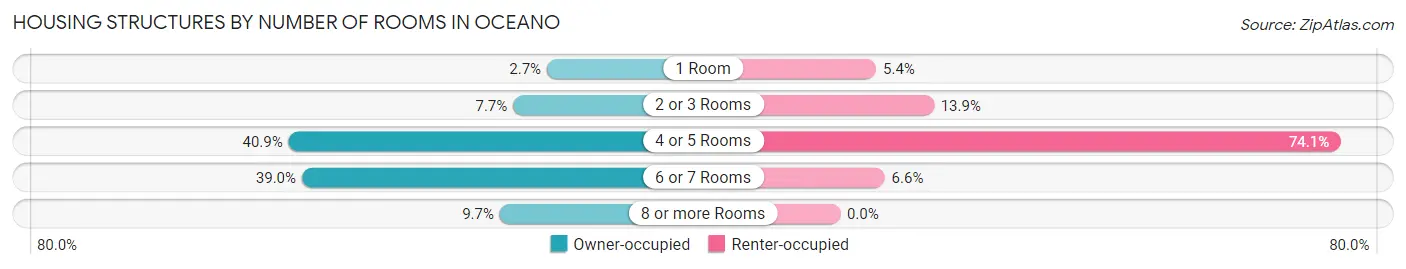
| Number of Rooms | Owner-occupied | Renter-occupied |
| 1 Room | 51 (2.7%) | 59 (5.3%) |
| 2 or 3 Rooms | 145 (7.7%) | 153 (13.9%) |
| 4 or 5 Rooms | 770 (40.9%) | 817 (74.1%) |
| 6 or 7 Rooms | 733 (39.0%) | 73 (6.6%) |
| 8 or more Rooms | 182 (9.7%) | 0 (0.0%) |
| Total | 1,881 (100.0%) | 1,102 (100.0%) |
Housing Structure by Heating Type in Oceano
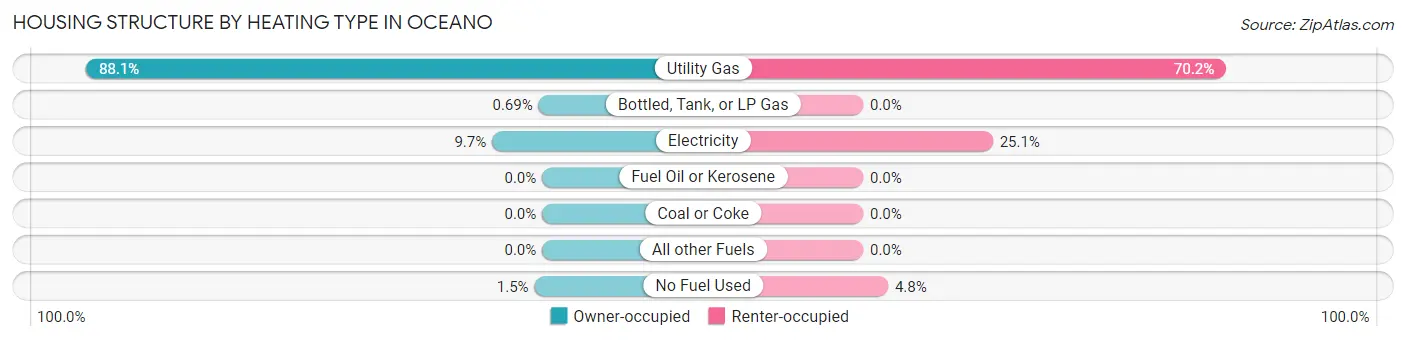
| Heating Type | Owner-occupied | Renter-occupied |
| Utility Gas | 1,658 (88.1%) | 773 (70.2%) |
| Bottled, Tank, or LP Gas | 13 (0.7%) | 0 (0.0%) |
| Electricity | 182 (9.7%) | 276 (25.1%) |
| Fuel Oil or Kerosene | 0 (0.0%) | 0 (0.0%) |
| Coal or Coke | 0 (0.0%) | 0 (0.0%) |
| All other Fuels | 0 (0.0%) | 0 (0.0%) |
| No Fuel Used | 28 (1.5%) | 53 (4.8%) |
| Total | 1,881 (100.0%) | 1,102 (100.0%) |
Household Vehicle Usage in Oceano
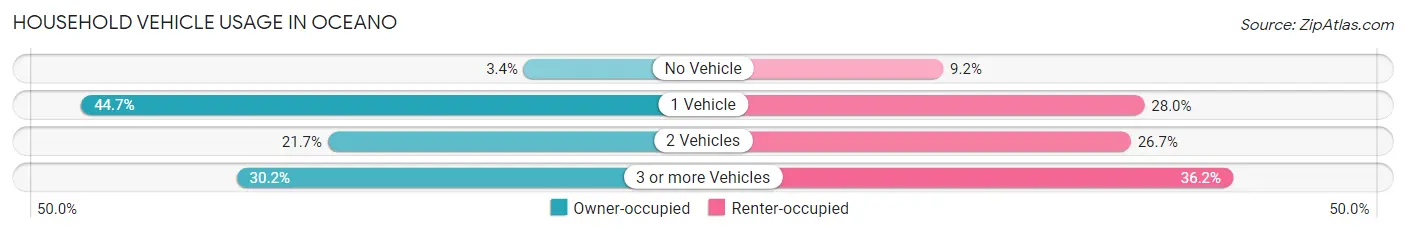
| Vehicles per Household | Owner-occupied | Renter-occupied |
| No Vehicle | 64 (3.4%) | 101 (9.2%) |
| 1 Vehicle | 841 (44.7%) | 308 (28.0%) |
| 2 Vehicles | 408 (21.7%) | 294 (26.7%) |
| 3 or more Vehicles | 568 (30.2%) | 399 (36.2%) |
| Total | 1,881 (100.0%) | 1,102 (100.0%) |
Real Estate & Mortgages in Oceano
Real Estate and Mortgage Overview in Oceano
| Characteristic | Without Mortgage | With Mortgage |
| Housing Units | 805 | 1,076 |
| Median Property Value | $333,200 | $536,700 |
| Median Household Income | $28,958 | $328 |
| Monthly Housing Costs | $314 | $289 |
| Real Estate Taxes | - | - |
Property Value by Mortgage Status in Oceano
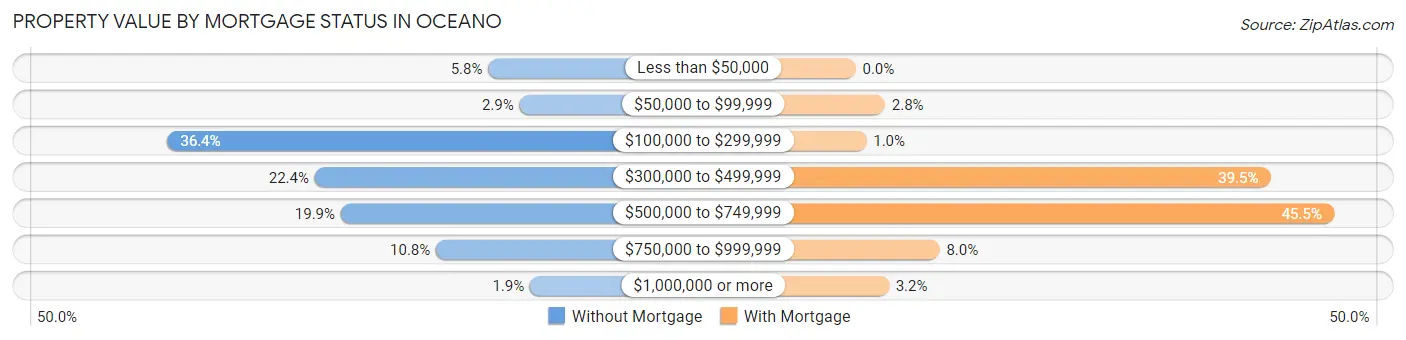
| Property Value | Without Mortgage | With Mortgage |
| Less than $50,000 | 47 (5.8%) | 0 (0.0%) |
| $50,000 to $99,999 | 23 (2.9%) | 30 (2.8%) |
| $100,000 to $299,999 | 293 (36.4%) | 11 (1.0%) |
| $300,000 to $499,999 | 180 (22.4%) | 425 (39.5%) |
| $500,000 to $749,999 | 160 (19.9%) | 490 (45.5%) |
| $750,000 to $999,999 | 87 (10.8%) | 86 (8.0%) |
| $1,000,000 or more | 15 (1.9%) | 34 (3.2%) |
| Total | 805 (100.0%) | 1,076 (100.0%) |
Household Income by Mortgage Status in Oceano
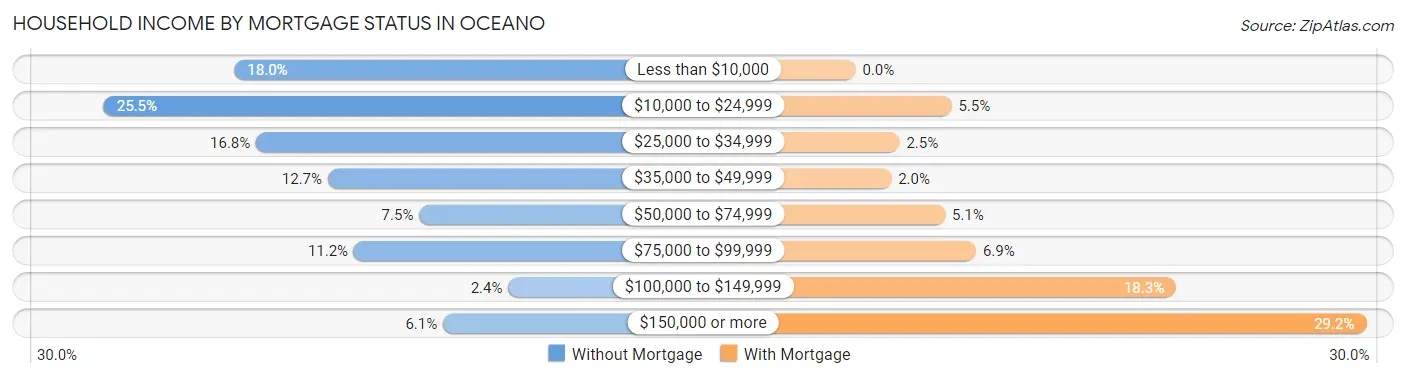
| Household Income | Without Mortgage | With Mortgage |
| Less than $10,000 | 145 (18.0%) | 0 (0.0%) |
| $10,000 to $24,999 | 205 (25.5%) | 59 (5.5%) |
| $25,000 to $34,999 | 135 (16.8%) | 27 (2.5%) |
| $35,000 to $49,999 | 102 (12.7%) | 22 (2.0%) |
| $50,000 to $74,999 | 60 (7.4%) | 55 (5.1%) |
| $75,000 to $99,999 | 90 (11.2%) | 74 (6.9%) |
| $100,000 to $149,999 | 19 (2.4%) | 197 (18.3%) |
| $150,000 or more | 49 (6.1%) | 314 (29.2%) |
| Total | 805 (100.0%) | 1,076 (100.0%) |
Property Value to Household Income Ratio in Oceano
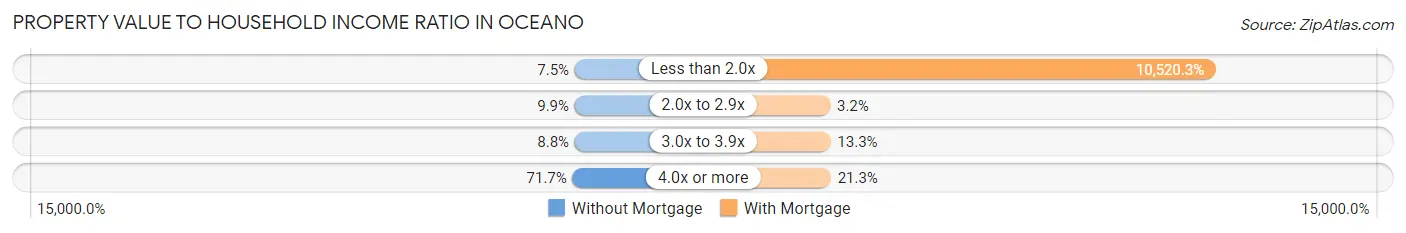
| Value-to-Income Ratio | Without Mortgage | With Mortgage |
| Less than 2.0x | 60 (7.4%) | 113,198 (10,520.3%) |
| 2.0x to 2.9x | 80 (9.9%) | 34 (3.2%) |
| 3.0x to 3.9x | 71 (8.8%) | 143 (13.3%) |
| 4.0x or more | 577 (71.7%) | 229 (21.3%) |
| Total | 805 (100.0%) | 1,076 (100.0%) |
Real Estate Taxes by Mortgage Status in Oceano
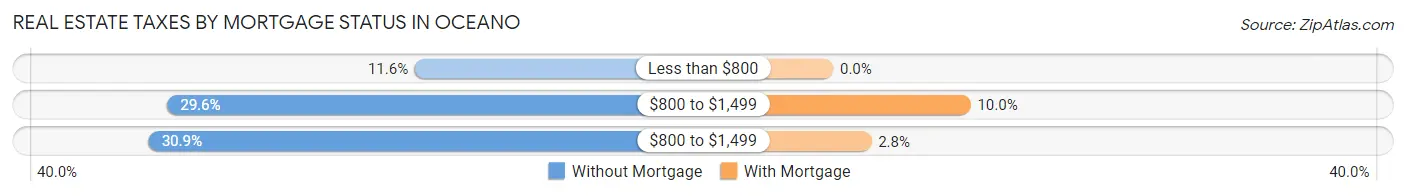
| Property Taxes | Without Mortgage | With Mortgage |
| Less than $800 | 93 (11.6%) | 0 (0.0%) |
| $800 to $1,499 | 238 (29.6%) | 108 (10.0%) |
| $800 to $1,499 | 249 (30.9%) | 30 (2.8%) |
| Total | 805 (100.0%) | 1,076 (100.0%) |
Health & Disability in Oceano
Health Insurance Coverage by Age in Oceano
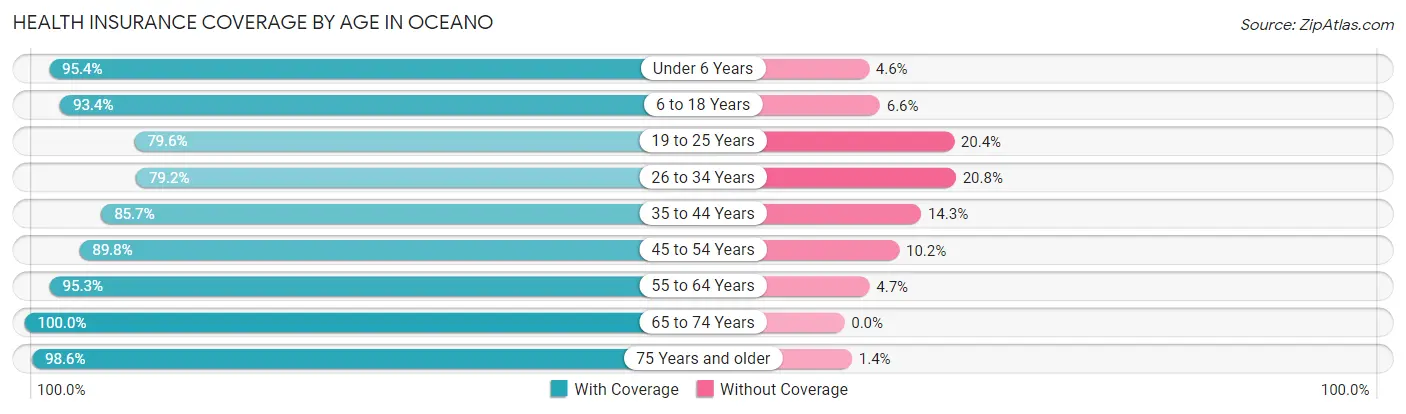
| Age Bracket | With Coverage | Without Coverage |
| Under 6 Years | 563 (95.4%) | 27 (4.6%) |
| 6 to 18 Years | 959 (93.4%) | 68 (6.6%) |
| 19 to 25 Years | 358 (79.6%) | 92 (20.4%) |
| 26 to 34 Years | 610 (79.2%) | 160 (20.8%) |
| 35 to 44 Years | 815 (85.7%) | 136 (14.3%) |
| 45 to 54 Years | 871 (89.8%) | 99 (10.2%) |
| 55 to 64 Years | 570 (95.3%) | 28 (4.7%) |
| 65 to 74 Years | 938 (100.0%) | 0 (0.0%) |
| 75 Years and older | 979 (98.6%) | 14 (1.4%) |
| Total | 6,663 (91.4%) | 624 (8.6%) |
Health Insurance Coverage by Citizenship Status in Oceano
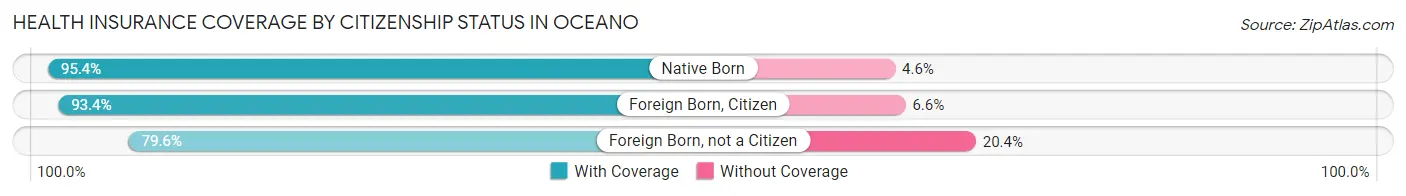
| Citizenship Status | With Coverage | Without Coverage |
| Native Born | 563 (95.4%) | 27 (4.6%) |
| Foreign Born, Citizen | 959 (93.4%) | 68 (6.6%) |
| Foreign Born, not a Citizen | 358 (79.6%) | 92 (20.4%) |
Health Insurance Coverage by Household Income in Oceano
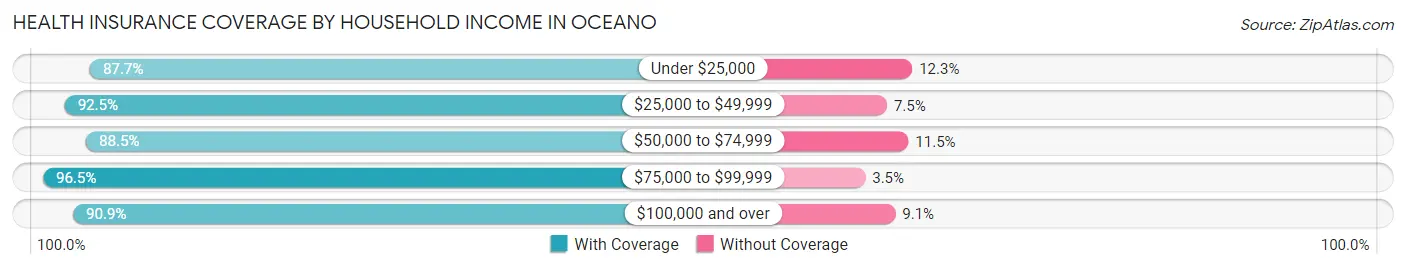
| Household Income | With Coverage | Without Coverage |
| Under $25,000 | 587 (87.7%) | 82 (12.3%) |
| $25,000 to $49,999 | 1,290 (92.5%) | 105 (7.5%) |
| $50,000 to $74,999 | 797 (88.5%) | 104 (11.5%) |
| $75,000 to $99,999 | 1,031 (96.5%) | 37 (3.5%) |
| $100,000 and over | 2,958 (90.9%) | 296 (9.1%) |
Public vs Private Health Insurance Coverage by Age in Oceano
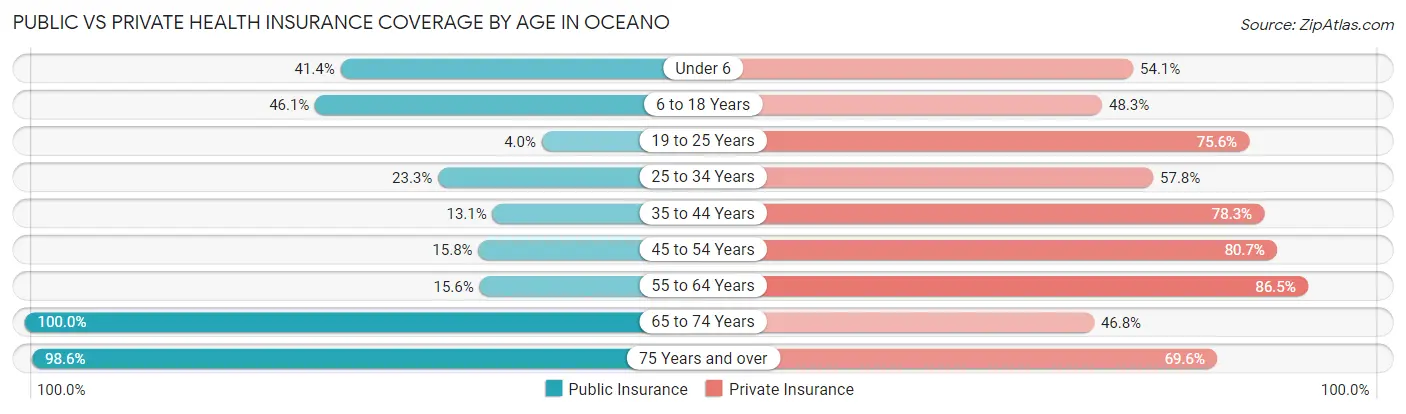
| Age Bracket | Public Insurance | Private Insurance |
| Under 6 | 244 (41.4%) | 319 (54.1%) |
| 6 to 18 Years | 473 (46.1%) | 496 (48.3%) |
| 19 to 25 Years | 18 (4.0%) | 340 (75.6%) |
| 25 to 34 Years | 179 (23.3%) | 445 (57.8%) |
| 35 to 44 Years | 125 (13.1%) | 745 (78.3%) |
| 45 to 54 Years | 153 (15.8%) | 783 (80.7%) |
| 55 to 64 Years | 93 (15.5%) | 517 (86.5%) |
| 65 to 74 Years | 938 (100.0%) | 439 (46.8%) |
| 75 Years and over | 979 (98.6%) | 691 (69.6%) |
| Total | 3,202 (43.9%) | 4,775 (65.5%) |
Disability Status by Sex by Age in Oceano
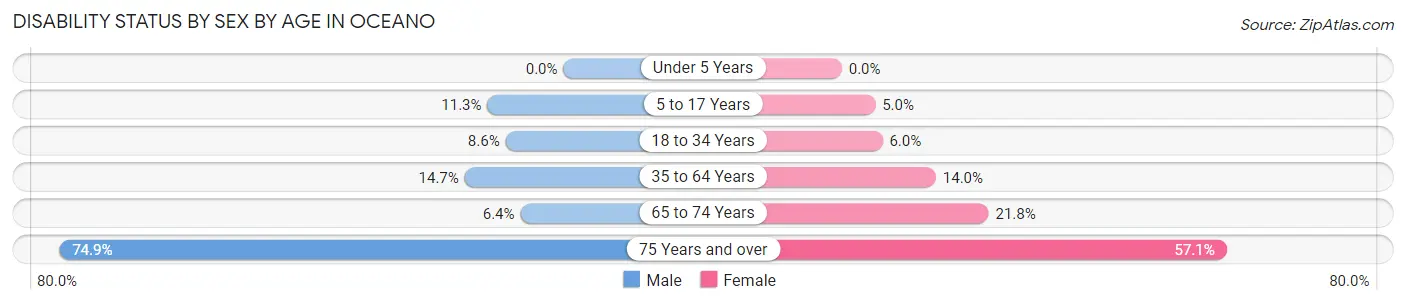
| Age Bracket | Male | Female |
| Under 5 Years | 0 (0.0%) | 0 (0.0%) |
| 5 to 17 Years | 76 (11.3%) | 21 (5.0%) |
| 18 to 34 Years | 56 (8.6%) | 35 (6.0%) |
| 35 to 64 Years | 172 (14.7%) | 188 (14.0%) |
| 65 to 74 Years | 30 (6.4%) | 102 (21.8%) |
| 75 Years and over | 387 (74.9%) | 272 (57.1%) |
Disability Class by Sex by Age in Oceano
Disability Class: Hearing Difficulty
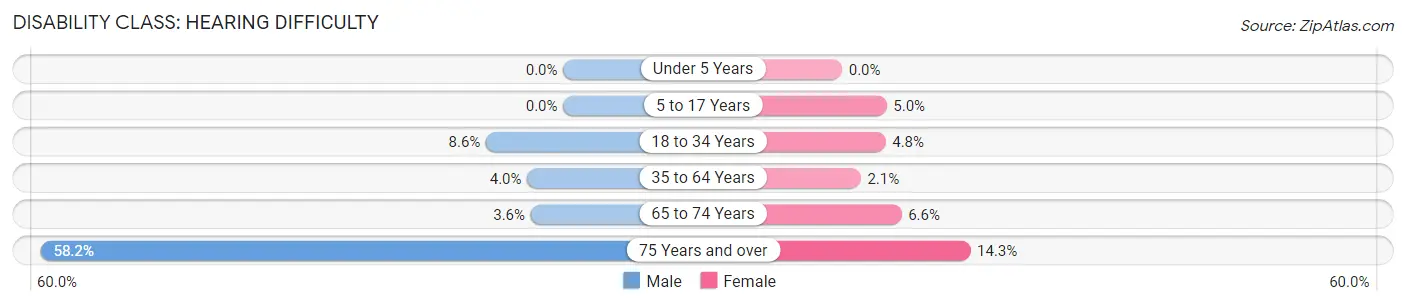
| Age Bracket | Male | Female |
| Under 5 Years | 0 (0.0%) | 0 (0.0%) |
| 5 to 17 Years | 0 (0.0%) | 21 (5.0%) |
| 18 to 34 Years | 56 (8.6%) | 28 (4.8%) |
| 35 to 64 Years | 47 (4.0%) | 28 (2.1%) |
| 65 to 74 Years | 17 (3.6%) | 31 (6.6%) |
| 75 Years and over | 301 (58.2%) | 68 (14.3%) |
Disability Class: Vision Difficulty
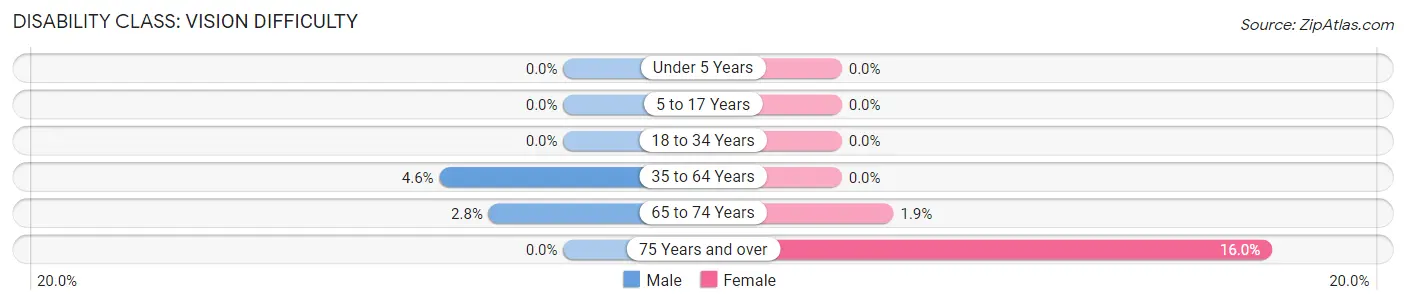
| Age Bracket | Male | Female |
| Under 5 Years | 0 (0.0%) | 0 (0.0%) |
| 5 to 17 Years | 0 (0.0%) | 0 (0.0%) |
| 18 to 34 Years | 0 (0.0%) | 0 (0.0%) |
| 35 to 64 Years | 54 (4.6%) | 0 (0.0%) |
| 65 to 74 Years | 13 (2.8%) | 9 (1.9%) |
| 75 Years and over | 0 (0.0%) | 76 (16.0%) |
Disability Class: Cognitive Difficulty
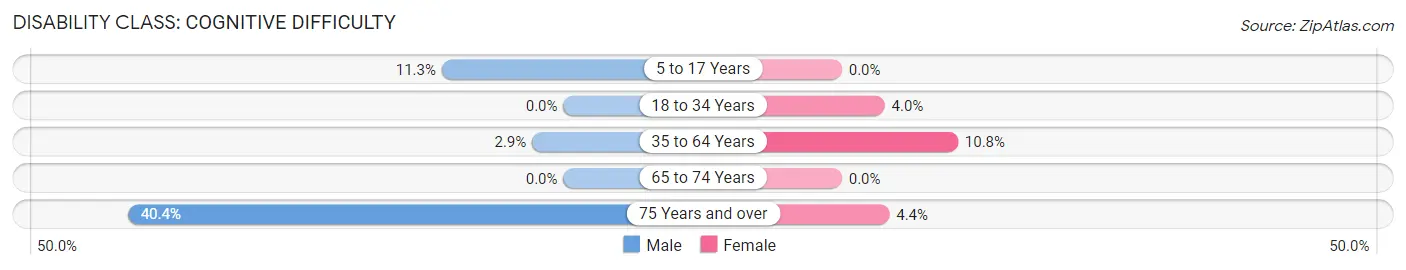
| Age Bracket | Male | Female |
| 5 to 17 Years | 76 (11.3%) | 0 (0.0%) |
| 18 to 34 Years | 0 (0.0%) | 23 (4.0%) |
| 35 to 64 Years | 34 (2.9%) | 145 (10.8%) |
| 65 to 74 Years | 0 (0.0%) | 0 (0.0%) |
| 75 Years and over | 209 (40.4%) | 21 (4.4%) |
Disability Class: Ambulatory Difficulty
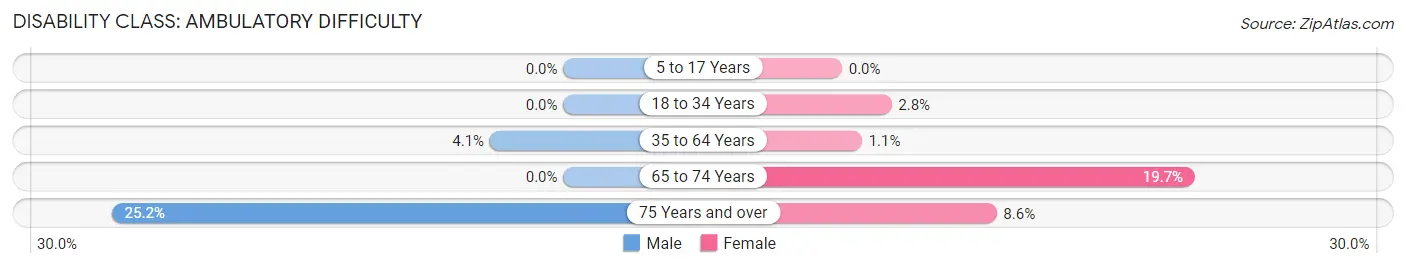
| Age Bracket | Male | Female |
| 5 to 17 Years | 0 (0.0%) | 0 (0.0%) |
| 18 to 34 Years | 0 (0.0%) | 16 (2.8%) |
| 35 to 64 Years | 48 (4.1%) | 15 (1.1%) |
| 65 to 74 Years | 0 (0.0%) | 92 (19.7%) |
| 75 Years and over | 130 (25.2%) | 41 (8.6%) |
Disability Class: Self-Care Difficulty
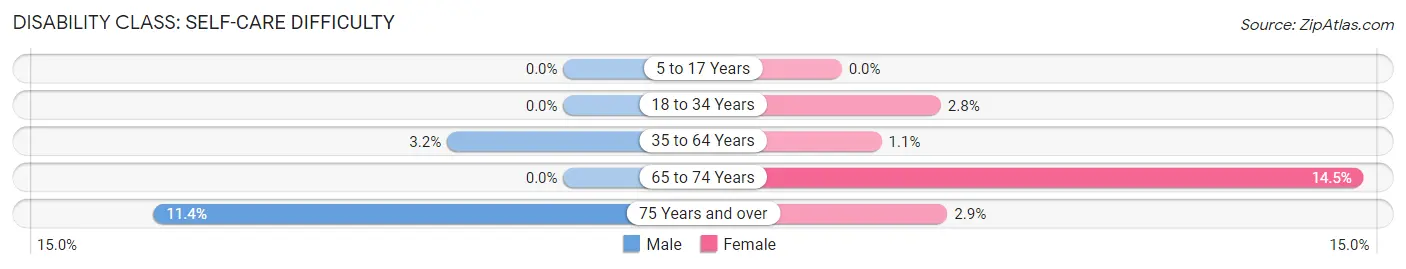
| Age Bracket | Male | Female |
| 5 to 17 Years | 0 (0.0%) | 0 (0.0%) |
| 18 to 34 Years | 0 (0.0%) | 16 (2.8%) |
| 35 to 64 Years | 38 (3.2%) | 15 (1.1%) |
| 65 to 74 Years | 0 (0.0%) | 68 (14.5%) |
| 75 Years and over | 59 (11.4%) | 14 (2.9%) |
Technology Access in Oceano
Computing Device Access in Oceano
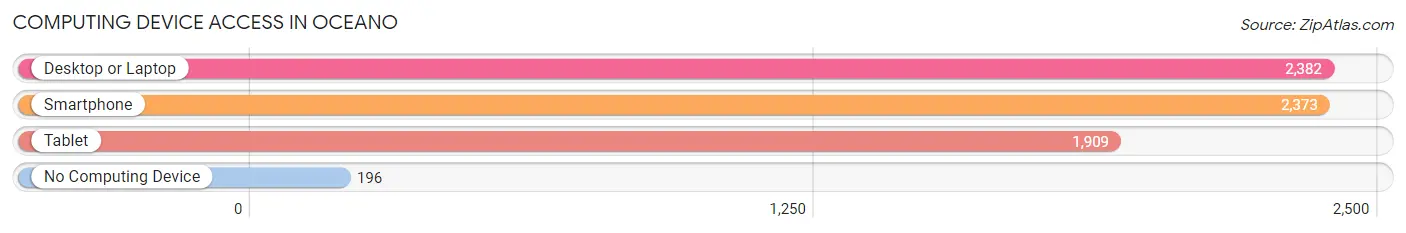
| Device Type | # Households | % Households |
| Desktop or Laptop | 2,382 | 79.8% |
| Smartphone | 2,373 | 79.5% |
| Tablet | 1,909 | 64.0% |
| No Computing Device | 196 | 6.6% |
| Total | 2,983 | 100.0% |
Internet Access in Oceano
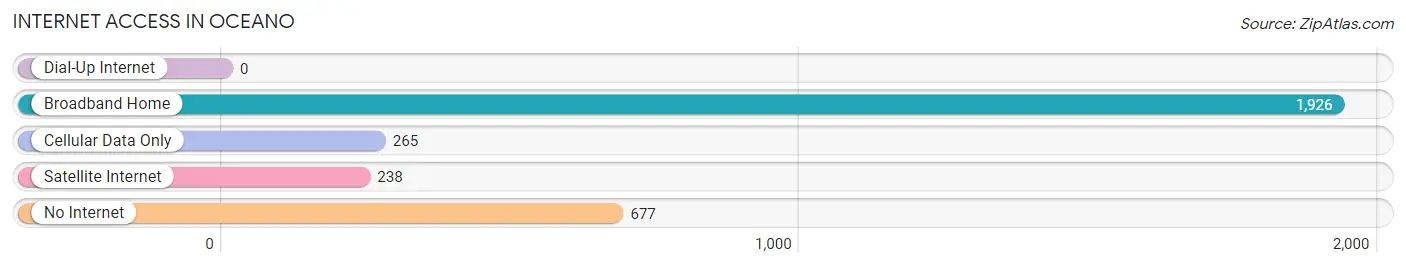
| Internet Type | # Households | % Households |
| Dial-Up Internet | 0 | 0.0% |
| Broadband Home | 1,926 | 64.6% |
| Cellular Data Only | 265 | 8.9% |
| Satellite Internet | 238 | 8.0% |
| No Internet | 677 | 22.7% |
| Total | 2,983 | 100.0% |
Oceano Summary
Oceano, California is a small unincorporated community located in San Luis Obispo County, California. It is situated on the Pacific Coast, approximately halfway between Los Angeles and San Francisco. The population of Oceano was estimated to be 5,902 in 2019.
History
Oceano was originally inhabited by the Chumash people, who lived in the area for thousands of years before the arrival of Europeans. The first Europeans to settle in the area were Spanish missionaries, who established a mission in nearby San Luis Obispo in 1772. The area was later settled by ranchers and farmers, who established the town of Oceano in 1874. The town was named after the nearby Oceano Lagoon, which was named by Spanish explorer Gaspar de Portola in 1769.
The town of Oceano was incorporated in 1891, and the first post office was established in 1892. The town grew slowly over the next several decades, and by the mid-20th century, it had become a popular tourist destination. The town was also home to a large number of military personnel, as the nearby Camp San Luis Obispo was a major training center for the United States Army.
Geography
Oceano is located in San Luis Obispo County, California, on the Pacific Coast. It is situated approximately halfway between Los Angeles and San Francisco. The town is bordered by the Oceano Lagoon to the north, the Pacific Ocean to the west, and the Santa Lucia Mountains to the east. The town covers an area of 2.3 square miles, and has a population density of 2,541 people per square mile.
Economy
The economy of Oceano is largely based on tourism and agriculture. The town is home to several popular tourist attractions, including the Oceano Dunes State Vehicular Recreation Area, which is a popular destination for off-road vehicle enthusiasts. The town is also home to several wineries, and is a popular destination for wine tasting.
Agriculture is also an important part of the local economy. The town is home to several farms, which produce a variety of crops, including strawberries, lettuce, and broccoli. The town is also home to several nurseries, which produce a variety of plants and flowers.
Demographics
As of 2019, the population of Oceano was estimated to be 5,902. The racial makeup of the town was 79.2% White, 0.7% African American, 0.7% Native American, 0.7% Asian, 0.2% Pacific Islander, and 16.3% from other races. The median household income in Oceano was $50,945, and the median age was 39.7 years. The town had a poverty rate of 16.3%, and the unemployment rate was 4.2%.
Common Questions
What is Per Capita Income in Oceano?
Per Capita income in Oceano is $36,143.
What is the Median Family Income in Oceano?
Median Family Income in Oceano is $93,658.
What is the Median Household income in Oceano?
Median Household Income in Oceano is $73,084.
What is Income or Wage Gap in Oceano?
Income or Wage Gap in Oceano is 16.5%.
Women in Oceano earn 83.5 cents for every dollar earned by a man.
What is Inequality or Gini Index in Oceano?
Inequality or Gini Index in Oceano is 0.46.
What is the Total Population of Oceano?
Total Population of Oceano is 7,287.
What is the Total Male Population of Oceano?
Total Male Population of Oceano is 3,705.
What is the Total Female Population of Oceano?
Total Female Population of Oceano is 3,582.
What is the Ratio of Males per 100 Females in Oceano?
There are 103.43 Males per 100 Females in Oceano.
What is the Ratio of Females per 100 Males in Oceano?
There are 96.68 Females per 100 Males in Oceano.
What is the Median Population Age in Oceano?
Median Population Age in Oceano is 44.2 Years.
What is the Average Family Size in Oceano
Average Family Size in Oceano is 3.4 People.
What is the Average Household Size in Oceano
Average Household Size in Oceano is 2.4 People.
How Large is the Labor Force in Oceano?
There are 3,290 People in the Labor Forcein in Oceano.
What is the Percentage of People in the Labor Force in Oceano?
56.2% of People are in the Labor Force in Oceano.
What is the Unemployment Rate in Oceano?
Unemployment Rate in Oceano is 3.9%.