Avila Beach, CA Map & Demographics
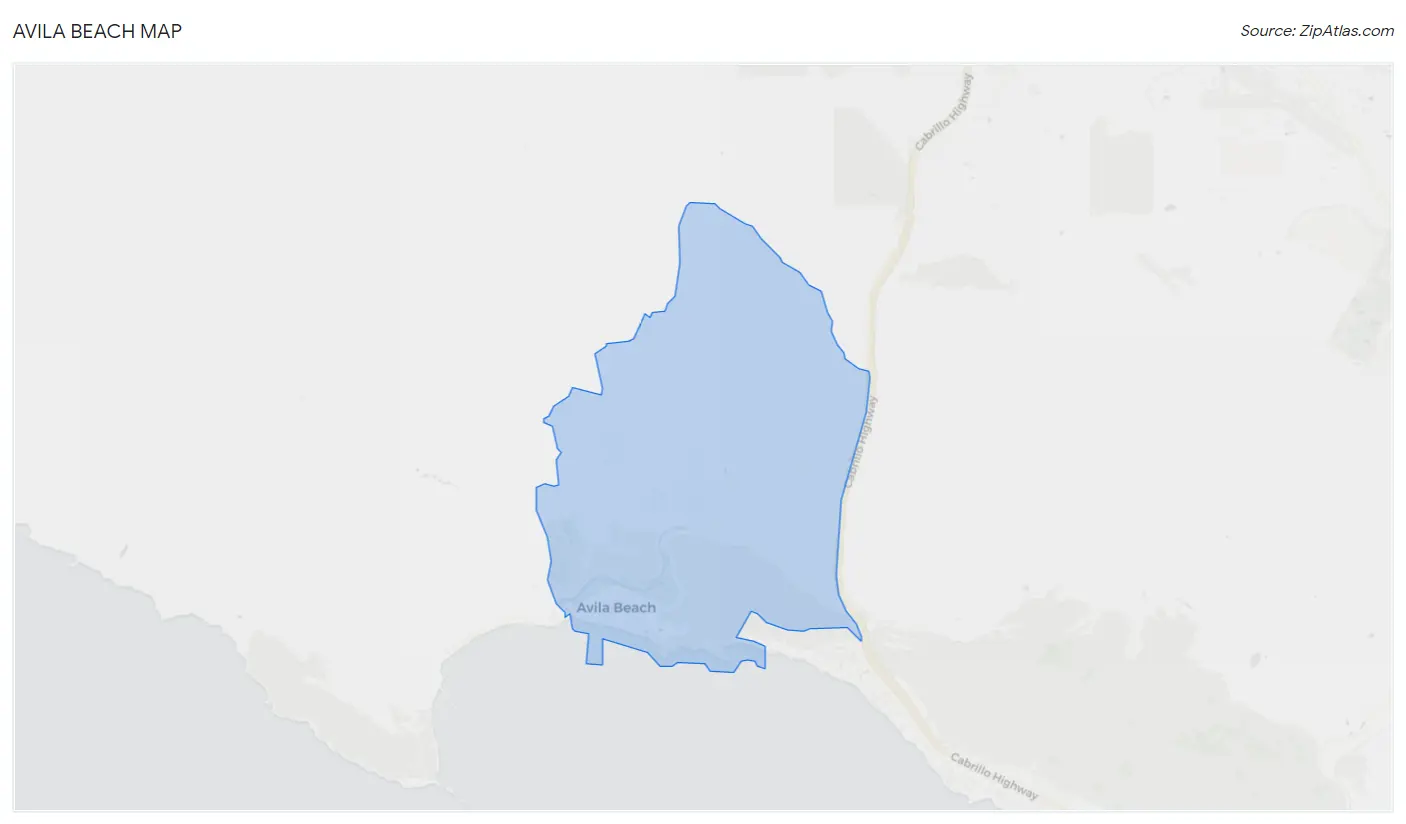
Avila Beach Map
Avila Beach Overview
$109,827
PER CAPITA INCOME
$178,125
AVG FAMILY INCOME
0.57
INEQUALITY / GINI INDEX
1,599
TOTAL POPULATION
766
MALE POPULATION
833
FEMALE POPULATION
91.96
MALES / 100 FEMALES
108.75
FEMALES / 100 MALES
57.9
MEDIAN AGE
2.6
AVG FAMILY SIZE
2.2
AVG HOUSEHOLD SIZE
612
LABOR FORCE [ PEOPLE ]
40.9%
PERCENT IN LABOR FORCE
Avila Beach Zip Codes
Income in Avila Beach
Income Overview in Avila Beach
| Characteristic | Number | Measure |
| Per Capita Income | 1,599 | $109,827 |
| Median Family Income | 532 | $178,125 |
| Mean Family Income | 532 | $292,024 |
| Median Household Income | 729 | $0 |
| Mean Household Income | 729 | $226,083 |
| Income Deficit | 532 | $0 |
| Wage / Income Gap (%) | 1,599 | 0.00% |
| Wage / Income Gap ($) | 1,599 | 100.00¢ per $1 |
| Gini / Inequality Index | 1,599 | 0.57 |
Earnings by Sex in Avila Beach
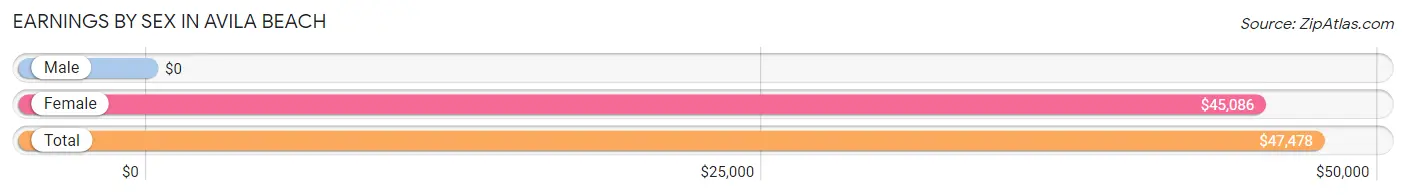
| Sex | Number | Average Earnings |
| Male | 475 (62.3%) | $0 |
| Female | 288 (37.8%) | $45,086 |
| Total | 763 (100.0%) | $47,478 |
Earnings by Sex by Income Bracket in Avila Beach
The most common earnings brackets in Avila Beach are $100,000+ for men (241 | 50.7%) and $25,000 to $29,999 for women (84 | 29.2%).
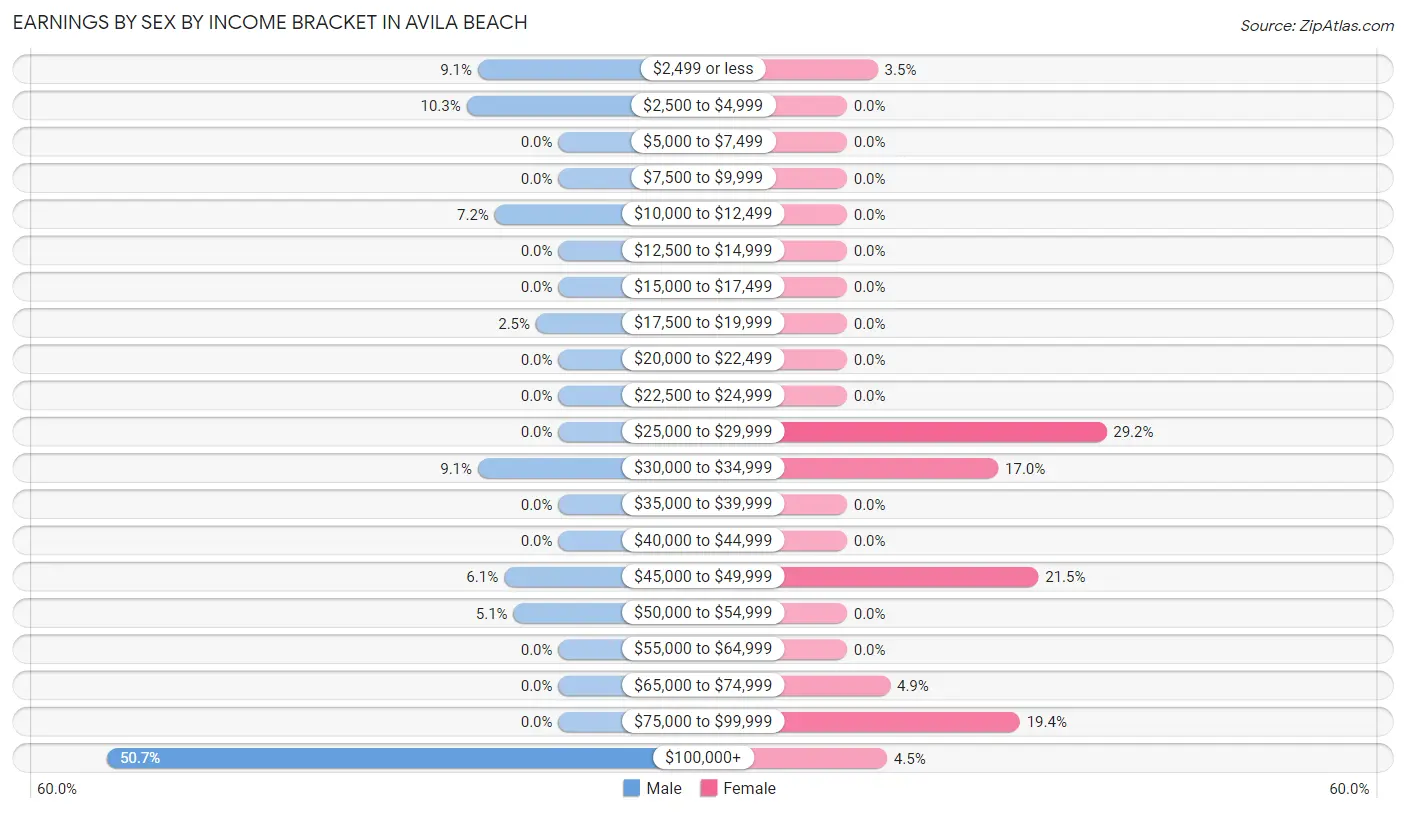
| Income | Male | Female |
| $2,499 or less | 43 (9.0%) | 10 (3.5%) |
| $2,500 to $4,999 | 49 (10.3%) | 0 (0.0%) |
| $5,000 to $7,499 | 0 (0.0%) | 0 (0.0%) |
| $7,500 to $9,999 | 0 (0.0%) | 0 (0.0%) |
| $10,000 to $12,499 | 34 (7.2%) | 0 (0.0%) |
| $12,500 to $14,999 | 0 (0.0%) | 0 (0.0%) |
| $15,000 to $17,499 | 0 (0.0%) | 0 (0.0%) |
| $17,500 to $19,999 | 12 (2.5%) | 0 (0.0%) |
| $20,000 to $22,499 | 0 (0.0%) | 0 (0.0%) |
| $22,500 to $24,999 | 0 (0.0%) | 0 (0.0%) |
| $25,000 to $29,999 | 0 (0.0%) | 84 (29.2%) |
| $30,000 to $34,999 | 43 (9.0%) | 49 (17.0%) |
| $35,000 to $39,999 | 0 (0.0%) | 0 (0.0%) |
| $40,000 to $44,999 | 0 (0.0%) | 0 (0.0%) |
| $45,000 to $49,999 | 29 (6.1%) | 62 (21.5%) |
| $50,000 to $54,999 | 24 (5.1%) | 0 (0.0%) |
| $55,000 to $64,999 | 0 (0.0%) | 0 (0.0%) |
| $65,000 to $74,999 | 0 (0.0%) | 14 (4.9%) |
| $75,000 to $99,999 | 0 (0.0%) | 56 (19.4%) |
| $100,000+ | 241 (50.7%) | 13 (4.5%) |
| Total | 475 (100.0%) | 288 (100.0%) |
Earnings by Sex by Educational Attainment in Avila Beach
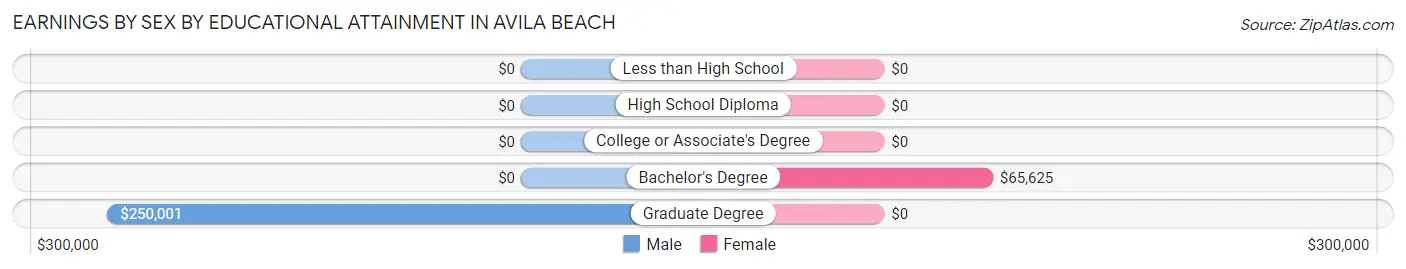
| Educational Attainment | Male Income | Female Income |
| Less than High School | - | - |
| High School Diploma | - | - |
| College or Associate's Degree | - | - |
| Bachelor's Degree | - | - |
| Graduate Degree | $250,001 | $0 |
| Total | - | - |
Family Income in Avila Beach
Family Income Brackets in Avila Beach
According to the Avila Beach family income data, there are 242 families falling into the $200,000+ income range, which is the most common income bracket and makes up 45.5% of all families.
| Income Bracket | # Families | % Families |
| Less than $10,000 | 0 | 0.0% |
| $10,000 to $14,999 | 27 | 5.1% |
| $15,000 to $24,999 | 32 | 6.0% |
| $25,000 to $34,999 | 32 | 6.0% |
| $35,000 to $49,999 | 20 | 3.8% |
| $50,000 to $74,999 | 0 | 0.0% |
| $75,000 to $99,999 | 59 | 11.1% |
| $100,000 to $149,999 | 30 | 5.6% |
| $150,000 to $199,999 | 90 | 16.9% |
| $200,000+ | 242 | 45.5% |
Family Income by Famaliy Size in Avila Beach
5-person families (80 | 15.0%) account for the highest median family income in Avila Beach with $250,001 per family, while 2-person families (431 | 81.0%) have the highest median income of $86,875 per family member.
| Income Bracket | # Families | Median Income |
| 2-Person Families | 431 (81.0%) | $173,750 |
| 3-Person Families | 0 (0.0%) | $0 |
| 4-Person Families | 21 (4.0%) | $0 |
| 5-Person Families | 80 (15.0%) | $250,001 |
| 6-Person Families | 0 (0.0%) | $0 |
| 7+ Person Families | 0 (0.0%) | $0 |
| Total | 532 (100.0%) | $178,125 |
Family Income by Number of Earners in Avila Beach
| Number of Earners | # Families | Median Income |
| No Earners | 214 (40.2%) | $0 |
| 1 Earner | 198 (37.2%) | $250,001 |
| 2 Earners | 65 (12.2%) | $0 |
| 3+ Earners | 55 (10.3%) | $0 |
| Total | 532 (100.0%) | $178,125 |
Household Income in Avila Beach
Household Income Brackets in Avila Beach
With 242 households falling in the category, the $200,000+ income range is the most frequent in Avila Beach, accounting for 33.2% of all households. In contrast, only 27 households (3.7%) fall into the $10,000 to $14,999 income bracket, making it the least populous group.
| Income Bracket | # Households | % Households |
| Less than $10,000 | 29 | 4.0% |
| $10,000 to $14,999 | 27 | 3.7% |
| $15,000 to $24,999 | 43 | 5.9% |
| $25,000 to $34,999 | 81 | 11.1% |
| $35,000 to $49,999 | 49 | 6.7% |
| $50,000 to $74,999 | 55 | 7.5% |
| $75,000 to $99,999 | 59 | 8.1% |
| $100,000 to $149,999 | 54 | 7.4% |
| $150,000 to $199,999 | 90 | 12.3% |
| $200,000+ | 242 | 33.2% |
Household Income by Householder Age in Avila Beach
The median household income in Avila Beach is $0, with the highest median household income of $250,001 found in the 45 to 64 years age bracket for the primary householder. A total of 299 households (41.0%) fall into this category. Meanwhile, the 15 to 24 years age bracket for the primary householder has the lowest median household income of $0, with 49 households (6.7%) in this group.
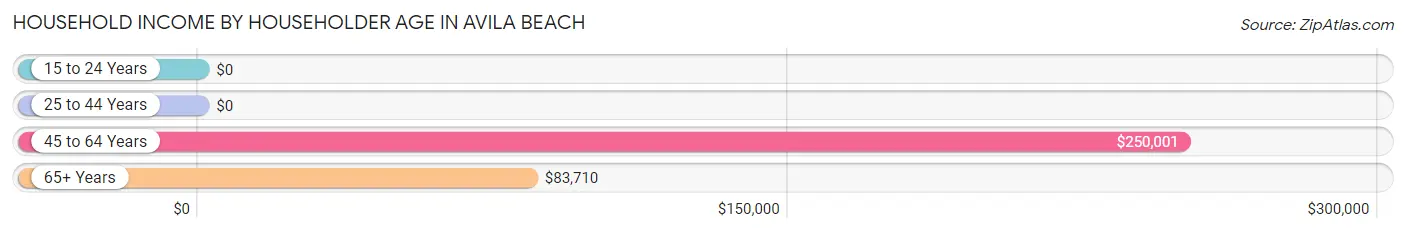
| Income Bracket | # Households | Median Income |
| 15 to 24 Years | 49 (6.7%) | $0 |
| 25 to 44 Years | 89 (12.2%) | $0 |
| 45 to 64 Years | 299 (41.0%) | $250,001 |
| 65+ Years | 292 (40.1%) | $83,710 |
| Total | 729 (100.0%) | $0 |
Poverty in Avila Beach
Income Below Poverty by Sex and Age in Avila Beach
With 13.7% poverty level for males and 7.0% for females among the residents of Avila Beach, 45 to 54 year old males and 75 year old and over females are the most vulnerable to poverty, with 29 males (100.0%) and 27 females (18.4%) in their respective age groups living below the poverty level.
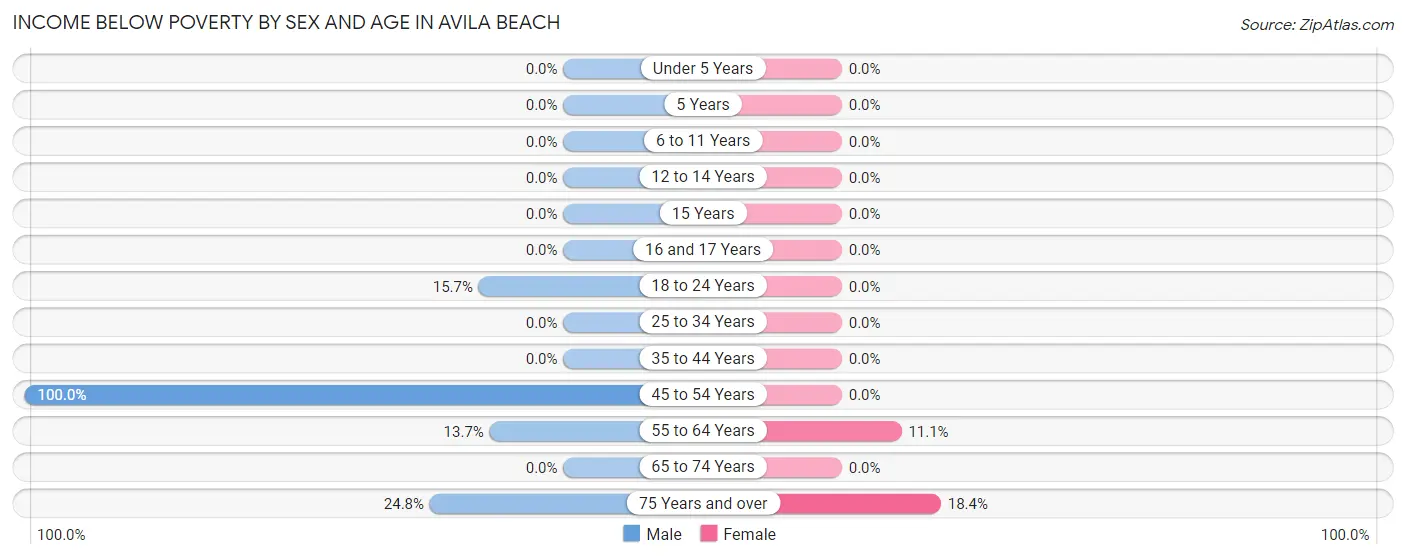
| Age Bracket | Male | Female |
| Under 5 Years | 0 (0.0%) | 0 (0.0%) |
| 5 Years | 0 (0.0%) | 0 (0.0%) |
| 6 to 11 Years | 0 (0.0%) | 0 (0.0%) |
| 12 to 14 Years | 0 (0.0%) | 0 (0.0%) |
| 15 Years | 0 (0.0%) | 0 (0.0%) |
| 16 and 17 Years | 0 (0.0%) | 0 (0.0%) |
| 18 to 24 Years | 16 (15.7%) | 0 (0.0%) |
| 25 to 34 Years | 0 (0.0%) | 0 (0.0%) |
| 35 to 44 Years | 0 (0.0%) | 0 (0.0%) |
| 45 to 54 Years | 29 (100.0%) | 0 (0.0%) |
| 55 to 64 Years | 32 (13.7%) | 31 (11.1%) |
| 65 to 74 Years | 0 (0.0%) | 0 (0.0%) |
| 75 Years and over | 28 (24.8%) | 27 (18.4%) |
| Total | 105 (13.7%) | 58 (7.0%) |
Income Above Poverty by Sex and Age in Avila Beach
According to the poverty statistics in Avila Beach, males aged under 5 years and females aged under 5 years are the age groups that are most secure financially, with 100.0% of males and 100.0% of females in these age groups living above the poverty line.
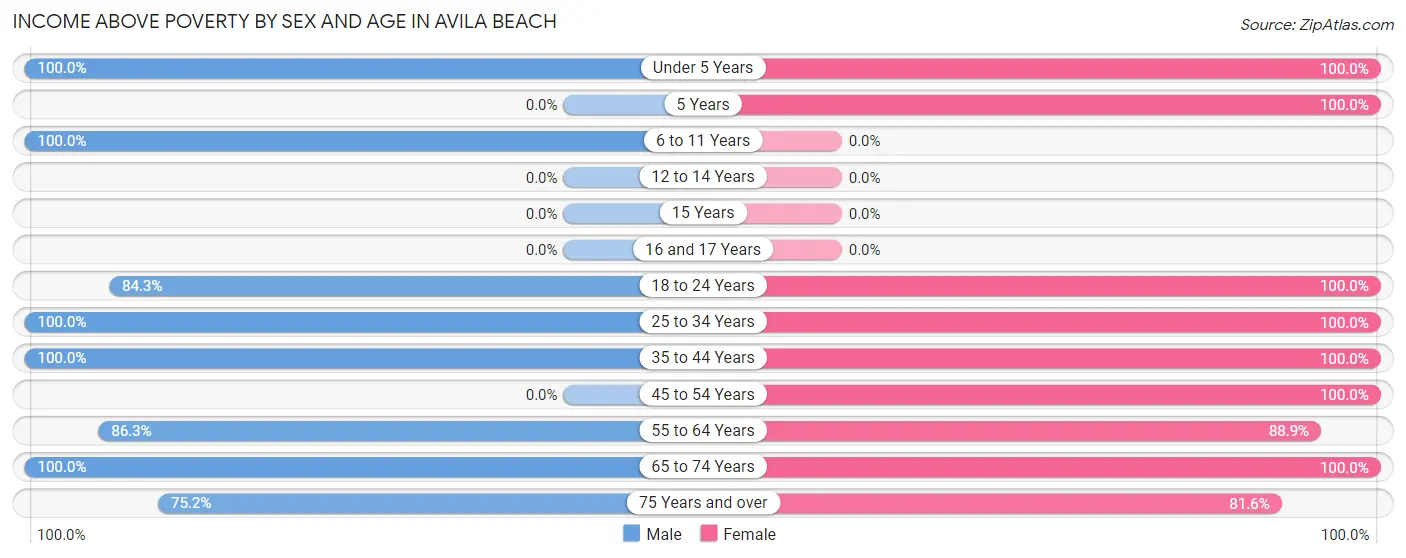
| Age Bracket | Male | Female |
| Under 5 Years | 12 (100.0%) | 14 (100.0%) |
| 5 Years | 0 (0.0%) | 31 (100.0%) |
| 6 to 11 Years | 45 (100.0%) | 0 (0.0%) |
| 12 to 14 Years | 0 (0.0%) | 0 (0.0%) |
| 15 Years | 0 (0.0%) | 0 (0.0%) |
| 16 and 17 Years | 0 (0.0%) | 0 (0.0%) |
| 18 to 24 Years | 86 (84.3%) | 104 (100.0%) |
| 25 to 34 Years | 53 (100.0%) | 43 (100.0%) |
| 35 to 44 Years | 45 (100.0%) | 46 (100.0%) |
| 45 to 54 Years | 0 (0.0%) | 29 (100.0%) |
| 55 to 64 Years | 202 (86.3%) | 249 (88.9%) |
| 65 to 74 Years | 133 (100.0%) | 139 (100.0%) |
| 75 Years and over | 85 (75.2%) | 120 (81.6%) |
| Total | 661 (86.3%) | 775 (93.0%) |
Income Below Poverty Among Married-Couple Families in Avila Beach
The poverty statistics for married-couple families in Avila Beach show that 12.6% or 59 of the total 470 families live below the poverty line. Families with no children have the highest poverty rate of 13.9%, comprising of 59 families. On the other hand, families with 1 or 2 children have the lowest poverty rate of 0.0%, which includes 0 families.
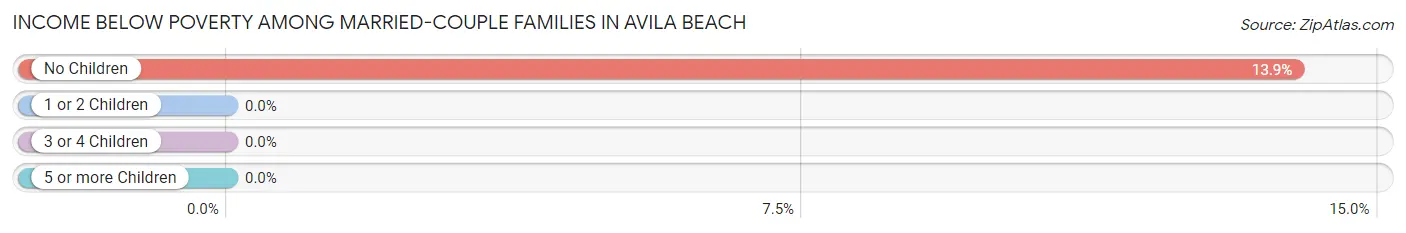
| Children | Above Poverty | Below Poverty |
| No Children | 365 (86.1%) | 59 (13.9%) |
| 1 or 2 Children | 33 (100.0%) | 0 (0.0%) |
| 3 or 4 Children | 13 (100.0%) | 0 (0.0%) |
| 5 or more Children | 0 (0.0%) | 0 (0.0%) |
| Total | 411 (87.5%) | 59 (12.6%) |
Income Below Poverty Among Single-Parent Households in Avila Beach
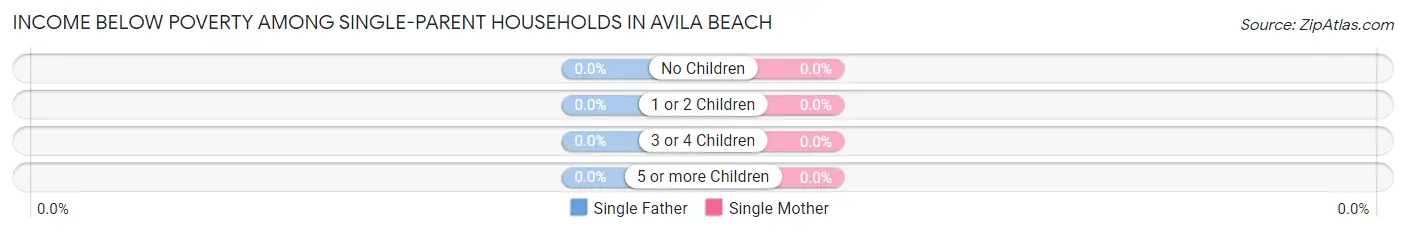
| Children | Single Father | Single Mother |
| No Children | 0 (0.0%) | 0 (0.0%) |
| 1 or 2 Children | 0 (0.0%) | 0 (0.0%) |
| 3 or 4 Children | 0 (0.0%) | 0 (0.0%) |
| 5 or more Children | 0 (0.0%) | 0 (0.0%) |
| Total | 0 (0.0%) | 0 (0.0%) |
Income Below Poverty Among Married-Couple vs Single-Parent Households in Avila Beach
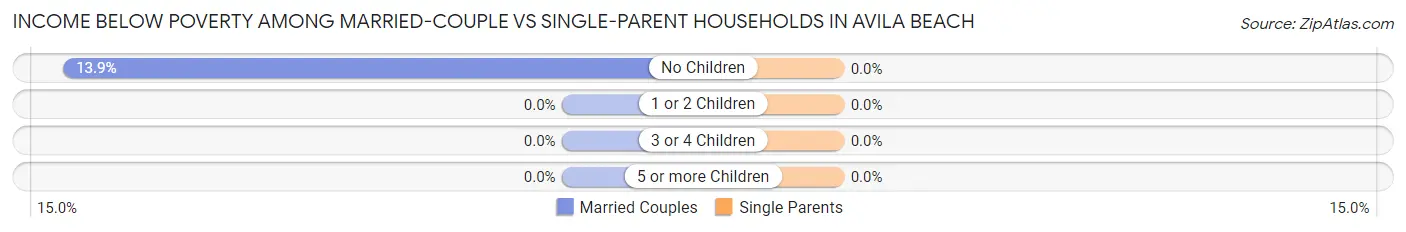
| Children | Married-Couple Families | Single-Parent Households |
| No Children | 59 (13.9%) | 0 (0.0%) |
| 1 or 2 Children | 0 (0.0%) | 0 (0.0%) |
| 3 or 4 Children | 0 (0.0%) | 0 (0.0%) |
| 5 or more Children | 0 (0.0%) | 0 (0.0%) |
| Total | 59 (12.6%) | 0 (0.0%) |
Race in Avila Beach
The most populous races in Avila Beach are White / Caucasian (1,472 | 92.1%), Hispanic or Latino (156 | 9.8%), and Two or more Races (69 | 4.3%).
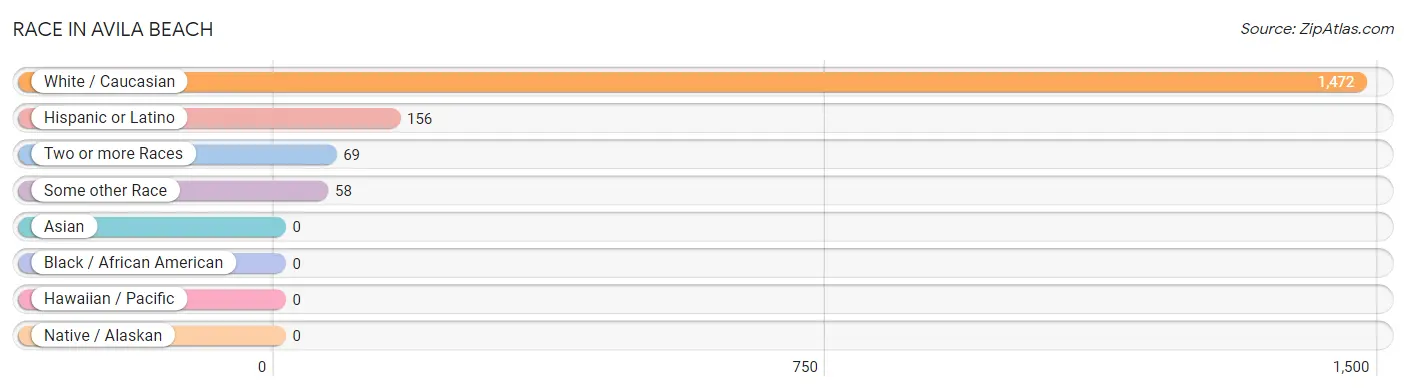
| Race | # Population | % Population |
| Asian | 0 | 0.0% |
| Black / African American | 0 | 0.0% |
| Hawaiian / Pacific | 0 | 0.0% |
| Hispanic or Latino | 156 | 9.8% |
| Native / Alaskan | 0 | 0.0% |
| White / Caucasian | 1,472 | 92.1% |
| Two or more Races | 69 | 4.3% |
| Some other Race | 58 | 3.6% |
| Total | 1,599 | 100.0% |
Ancestry in Avila Beach
The most populous ancestries reported in Avila Beach are English (348 | 21.8%), German (327 | 20.4%), Irish (265 | 16.6%), Mexican (156 | 9.8%), and French (118 | 7.4%), together accounting for 75.9% of all Avila Beach residents.
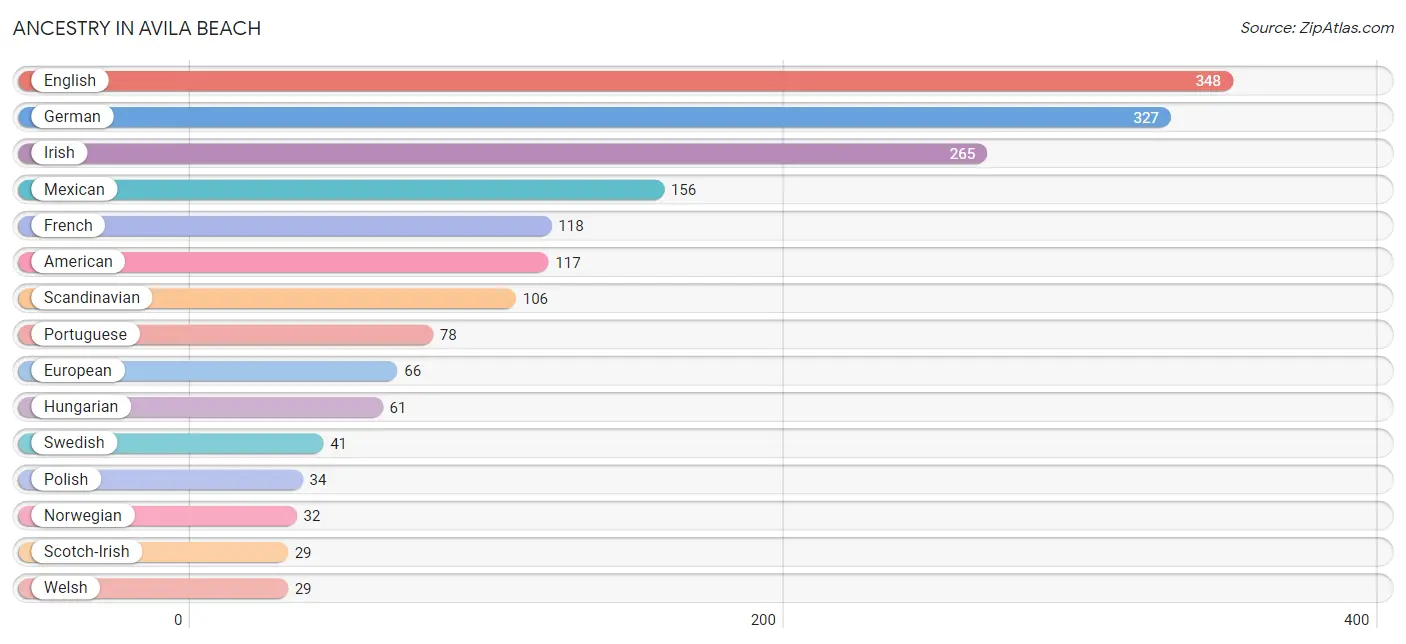
| Ancestry | # Population | % Population |
| American | 117 | 7.3% |
| Arab | 10 | 0.6% |
| Eastern European | 14 | 0.9% |
| English | 348 | 21.8% |
| European | 66 | 4.1% |
| French | 118 | 7.4% |
| French Canadian | 12 | 0.7% |
| German | 327 | 20.4% |
| Hungarian | 61 | 3.8% |
| Irish | 265 | 16.6% |
| Italian | 23 | 1.4% |
| Lebanese | 10 | 0.6% |
| Mexican | 156 | 9.8% |
| Norwegian | 32 | 2.0% |
| Polish | 34 | 2.1% |
| Portuguese | 78 | 4.9% |
| Russian | 11 | 0.7% |
| Scandinavian | 106 | 6.6% |
| Scotch-Irish | 29 | 1.8% |
| Scottish | 28 | 1.8% |
| Swedish | 41 | 2.6% |
| Welsh | 29 | 1.8% | View All 22 Rows |
Immigrants in Avila Beach
The most numerous immigrant groups reported in Avila Beach came from Europe (98 | 6.1%), Eastern Europe (61 | 3.8%), Hungary (61 | 3.8%), Latin America (29 | 1.8%), and Peru (29 | 1.8%), together accounting for 17.4% of all Avila Beach residents.
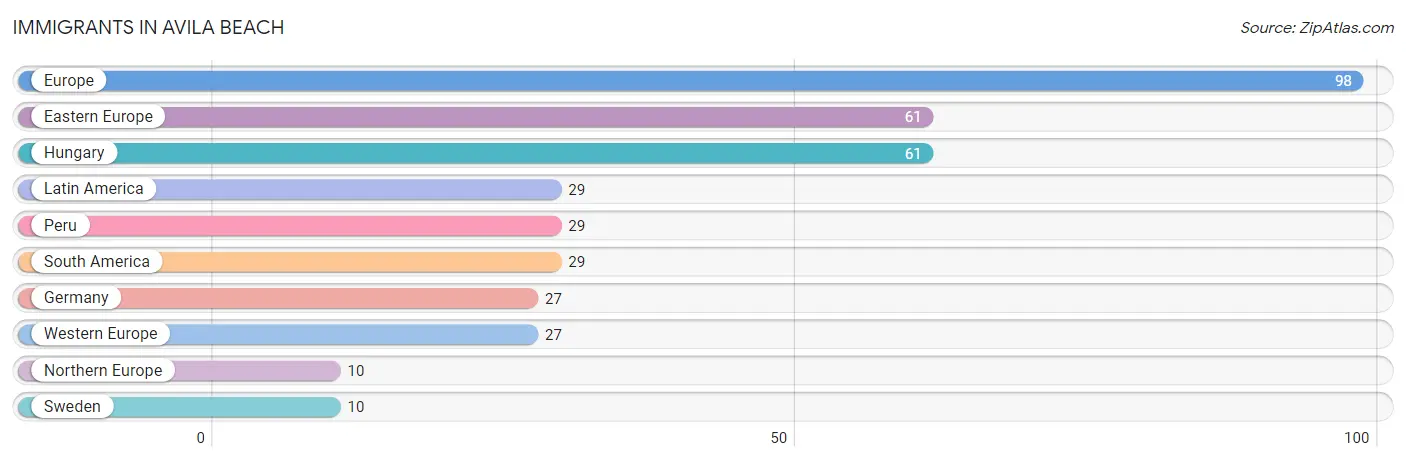
| Immigration Origin | # Population | % Population |
| Eastern Europe | 61 | 3.8% |
| Europe | 98 | 6.1% |
| Germany | 27 | 1.7% |
| Hungary | 61 | 3.8% |
| Latin America | 29 | 1.8% |
| Northern Europe | 10 | 0.6% |
| Peru | 29 | 1.8% |
| South America | 29 | 1.8% |
| Sweden | 10 | 0.6% |
| Western Europe | 27 | 1.7% | View All 10 Rows |
Sex and Age in Avila Beach
Sex and Age in Avila Beach
The most populous age groups in Avila Beach are 55 to 59 Years (195 | 25.5%) for men and 55 to 59 Years (176 | 21.1%) for women.
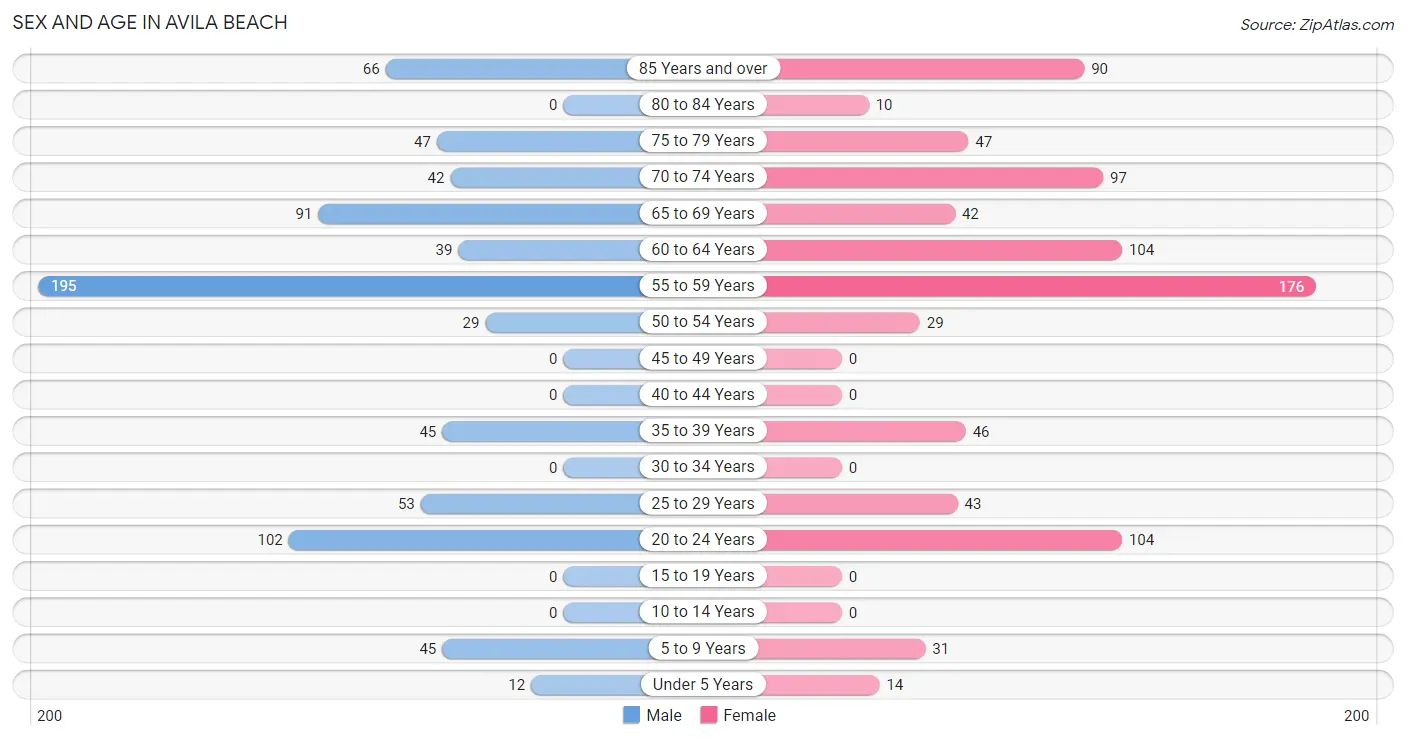
| Age Bracket | Male | Female |
| Under 5 Years | 12 (1.6%) | 14 (1.7%) |
| 5 to 9 Years | 45 (5.9%) | 31 (3.7%) |
| 10 to 14 Years | 0 (0.0%) | 0 (0.0%) |
| 15 to 19 Years | 0 (0.0%) | 0 (0.0%) |
| 20 to 24 Years | 102 (13.3%) | 104 (12.5%) |
| 25 to 29 Years | 53 (6.9%) | 43 (5.2%) |
| 30 to 34 Years | 0 (0.0%) | 0 (0.0%) |
| 35 to 39 Years | 45 (5.9%) | 46 (5.5%) |
| 40 to 44 Years | 0 (0.0%) | 0 (0.0%) |
| 45 to 49 Years | 0 (0.0%) | 0 (0.0%) |
| 50 to 54 Years | 29 (3.8%) | 29 (3.5%) |
| 55 to 59 Years | 195 (25.5%) | 176 (21.1%) |
| 60 to 64 Years | 39 (5.1%) | 104 (12.5%) |
| 65 to 69 Years | 91 (11.9%) | 42 (5.0%) |
| 70 to 74 Years | 42 (5.5%) | 97 (11.6%) |
| 75 to 79 Years | 47 (6.1%) | 47 (5.6%) |
| 80 to 84 Years | 0 (0.0%) | 10 (1.2%) |
| 85 Years and over | 66 (8.6%) | 90 (10.8%) |
| Total | 766 (100.0%) | 833 (100.0%) |
Families and Households in Avila Beach
Median Family Size in Avila Beach
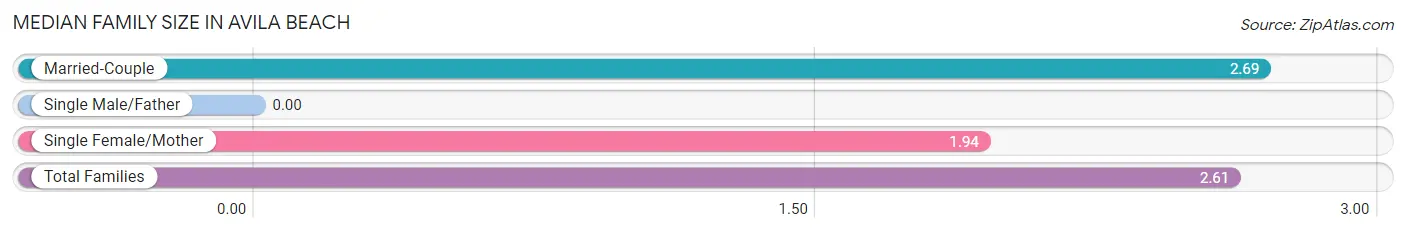
| Family Type | # Families | Family Size |
| Married-Couple | 470 (88.3%) | 2.69 |
| Single Male/Father | 0 (0.0%) | - |
| Single Female/Mother | 62 (11.7%) | 1.94 |
| Total Families | 532 (100.0%) | 2.61 |
Median Household Size in Avila Beach
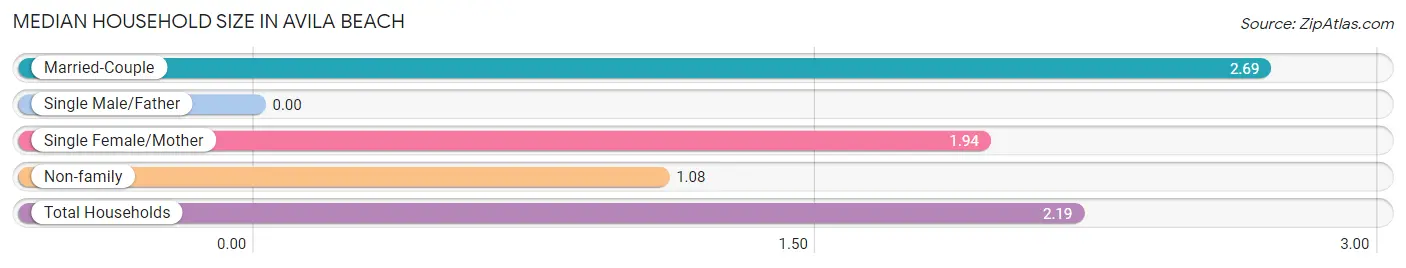
| Household Type | # Households | Household Size |
| Married-Couple | 470 (64.5%) | 2.69 |
| Single Male/Father | 0 (0.0%) | - |
| Single Female/Mother | 62 (8.5%) | 1.94 |
| Non-family | 197 (27.0%) | 1.08 |
| Total Households | 729 (100.0%) | 2.19 |
Household Size by Marriage Status in Avila Beach
Out of a total of 729 households in Avila Beach, 532 (73.0%) are family households, while 197 (27.0%) are nonfamily households. The most numerous type of family households are 2-person households, comprising 431, and the most common type of nonfamily households are 1-person households, comprising 185.
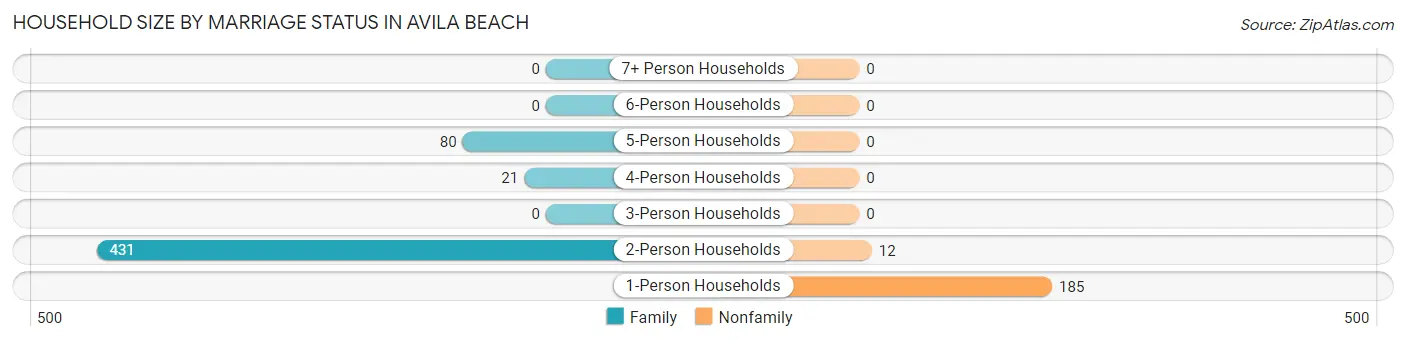
| Household Size | Family Households | Nonfamily Households |
| 1-Person Households | - | 185 (25.4%) |
| 2-Person Households | 431 (59.1%) | 12 (1.7%) |
| 3-Person Households | 0 (0.0%) | 0 (0.0%) |
| 4-Person Households | 21 (2.9%) | 0 (0.0%) |
| 5-Person Households | 80 (11.0%) | 0 (0.0%) |
| 6-Person Households | 0 (0.0%) | 0 (0.0%) |
| 7+ Person Households | 0 (0.0%) | 0 (0.0%) |
| Total | 532 (73.0%) | 197 (27.0%) |
Female Fertility in Avila Beach
Fertility by Age in Avila Beach
| Age Bracket | Women with Births | Births / 1,000 Women |
| 15 to 19 years | 0 (0.0%) | 0.0 |
| 20 to 34 years | 0 (0.0%) | 0.0 |
| 35 to 50 years | 0 (0.0%) | 0.0 |
| Total | 0 (0.0%) | 0.0 |
Fertility by Age by Marriage Status in Avila Beach
| Age Bracket | Married | Unmarried |
| 15 to 19 years | 0 (0.0%) | 0 (0.0%) |
| 20 to 34 years | 0 (0.0%) | 0 (0.0%) |
| 35 to 50 years | 0 (0.0%) | 0 (0.0%) |
| Total | 0 (0.0%) | 0 (0.0%) |
Fertility by Education in Avila Beach
| Educational Attainment | Women with Births | Births / 1,000 Women |
| Less than High School | 0 (0.0%) | 0.0 |
| High School Diploma | 0 (0.0%) | 0.0 |
| College or Associate's Degree | 0 (0.0%) | 0.0 |
| Bachelor's Degree | 0 (0.0%) | 0.0 |
| Graduate Degree | 0 (0.0%) | 0.0 |
| Total | 0 (0.0%) | 0.0 |
Fertility by Education by Marriage Status in Avila Beach
| Educational Attainment | Married | Unmarried |
| Less than High School | 0 (0.0%) | 0 (0.0%) |
| High School Diploma | 0 (0.0%) | 0 (0.0%) |
| College or Associate's Degree | 0 (0.0%) | 0 (0.0%) |
| Bachelor's Degree | 0 (0.0%) | 0 (0.0%) |
| Graduate Degree | 0 (0.0%) | 0 (0.0%) |
| Total | 0 (0.0%) | 0 (0.0%) |
Employment Characteristics in Avila Beach
Employment by Class of Employer in Avila Beach
Among the 579 employed individuals in Avila Beach, private company employees (347 | 59.9%), self-employed (incorporated) (57 | 9.8%), and not-for-profit organizations (53 | 9.1%) make up the most common classes of employment.
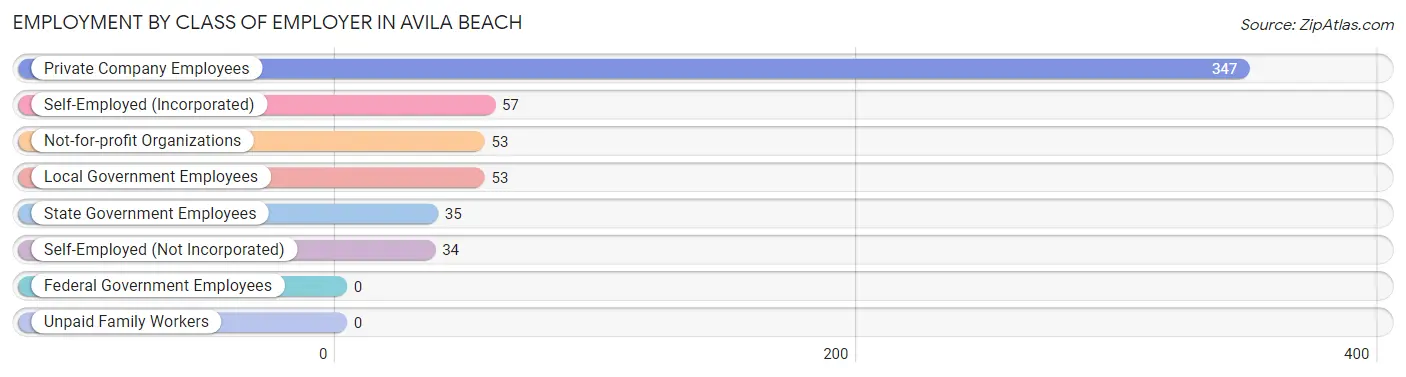
| Employer Class | # Employees | % Employees |
| Private Company Employees | 347 | 59.9% |
| Self-Employed (Incorporated) | 57 | 9.8% |
| Self-Employed (Not Incorporated) | 34 | 5.9% |
| Not-for-profit Organizations | 53 | 9.1% |
| Local Government Employees | 53 | 9.1% |
| State Government Employees | 35 | 6.0% |
| Federal Government Employees | 0 | 0.0% |
| Unpaid Family Workers | 0 | 0.0% |
| Total | 579 | 100.0% |
Employment Status by Age in Avila Beach
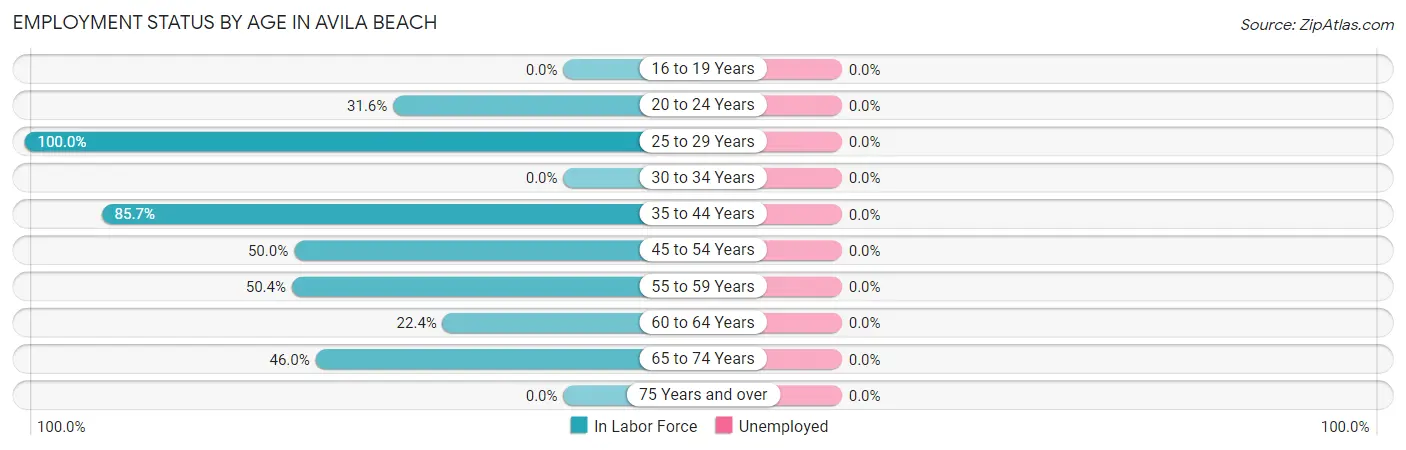
| Age Bracket | In Labor Force | Unemployed |
| 16 to 19 Years | 0 (0.0%) | 0 (0.0%) |
| 20 to 24 Years | 65 (31.6%) | 0 (0.0%) |
| 25 to 29 Years | 96 (100.0%) | 0 (0.0%) |
| 30 to 34 Years | 0 (0.0%) | 0 (0.0%) |
| 35 to 44 Years | 78 (85.7%) | 0 (0.0%) |
| 45 to 54 Years | 29 (50.0%) | 0 (0.0%) |
| 55 to 59 Years | 187 (50.4%) | 0 (0.0%) |
| 60 to 64 Years | 32 (22.4%) | 0 (0.0%) |
| 65 to 74 Years | 125 (46.0%) | 0 (0.0%) |
| 75 Years and over | 0 (0.0%) | 0 (0.0%) |
| Total | 612 (40.9%) | 0 (0.0%) |
Employment Status by Educational Attainment in Avila Beach
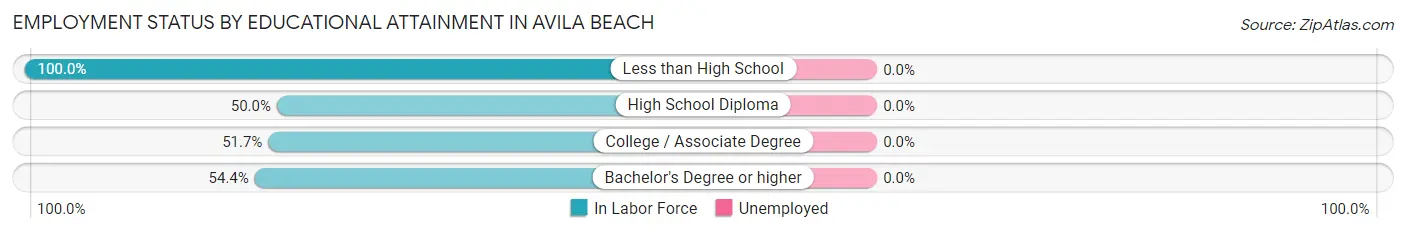
| Educational Attainment | In Labor Force | Unemployed |
| Less than High School | 29 (100.0%) | 0 (0.0%) |
| High School Diploma | 29 (50.0%) | 0 (0.0%) |
| College / Associate Degree | 31 (51.7%) | 0 (0.0%) |
| Bachelor's Degree or higher | 333 (54.4%) | 0 (0.0%) |
| Total | 422 (55.6%) | 0 (0.0%) |
Employment Occupations by Sex in Avila Beach
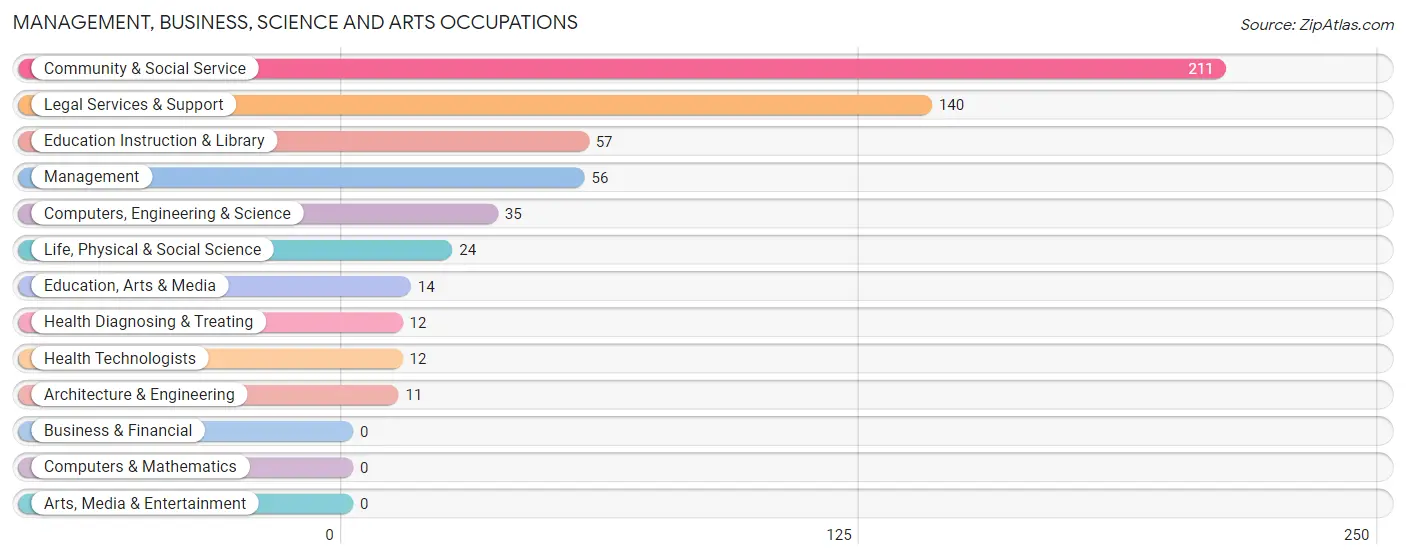
Management, Business, Science and Arts Occupations
The most common Management, Business, Science and Arts occupations in Avila Beach are Community & Social Service (211 | 34.5%), Legal Services & Support (140 | 22.9%), Education Instruction & Library (57 | 9.3%), Management (56 | 9.1%), and Computers, Engineering & Science (35 | 5.7%).
Management, Business, Science and Arts Occupations by Sex
Within the Management, Business, Science and Arts occupations in Avila Beach, the most male-oriented occupations are Architecture & Engineering (100.0%), Legal Services & Support (100.0%), and Health Diagnosing & Treating (100.0%), while the most female-oriented occupations are Life, Physical & Social Science (100.0%), Education, Arts & Media (100.0%), and Management (75.0%).
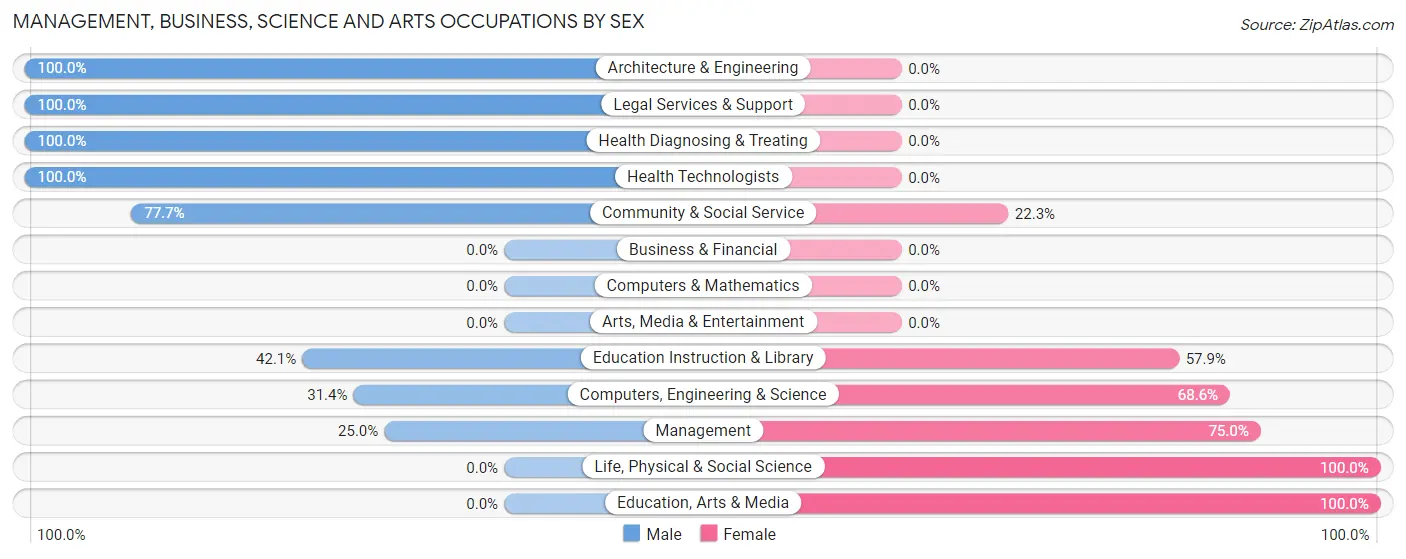
| Occupation | Male | Female |
| Management | 14 (25.0%) | 42 (75.0%) |
| Business & Financial | 0 (0.0%) | 0 (0.0%) |
| Computers, Engineering & Science | 11 (31.4%) | 24 (68.6%) |
| Computers & Mathematics | 0 (0.0%) | 0 (0.0%) |
| Architecture & Engineering | 11 (100.0%) | 0 (0.0%) |
| Life, Physical & Social Science | 0 (0.0%) | 24 (100.0%) |
| Community & Social Service | 164 (77.7%) | 47 (22.3%) |
| Education, Arts & Media | 0 (0.0%) | 14 (100.0%) |
| Legal Services & Support | 140 (100.0%) | 0 (0.0%) |
| Education Instruction & Library | 24 (42.1%) | 33 (57.9%) |
| Arts, Media & Entertainment | 0 (0.0%) | 0 (0.0%) |
| Health Diagnosing & Treating | 12 (100.0%) | 0 (0.0%) |
| Health Technologists | 12 (100.0%) | 0 (0.0%) |
| Total (Category) | 201 (64.0%) | 113 (36.0%) |
| Total (Overall) | 389 (63.6%) | 223 (36.4%) |
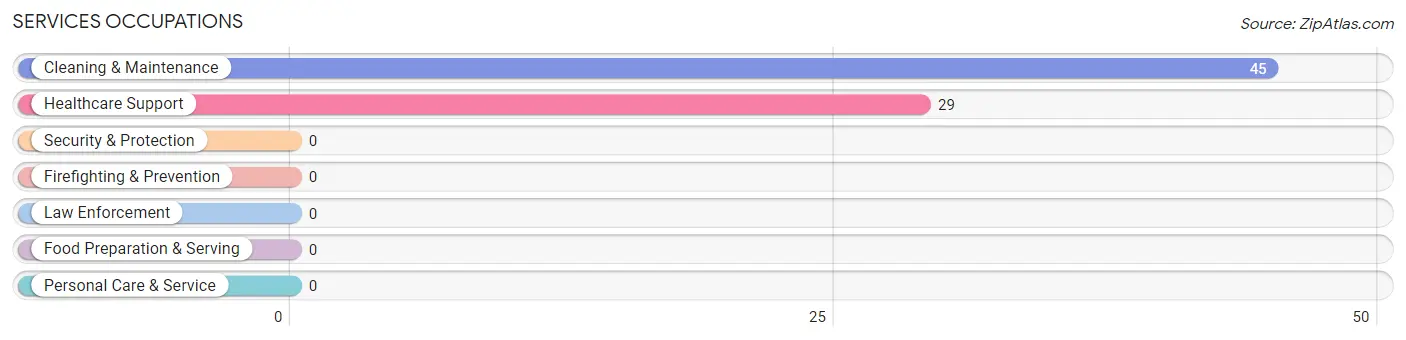
Services Occupations
The most common Services occupations in Avila Beach are Cleaning & Maintenance (45 | 7.3%), and Healthcare Support (29 | 4.7%).
Services Occupations by Sex
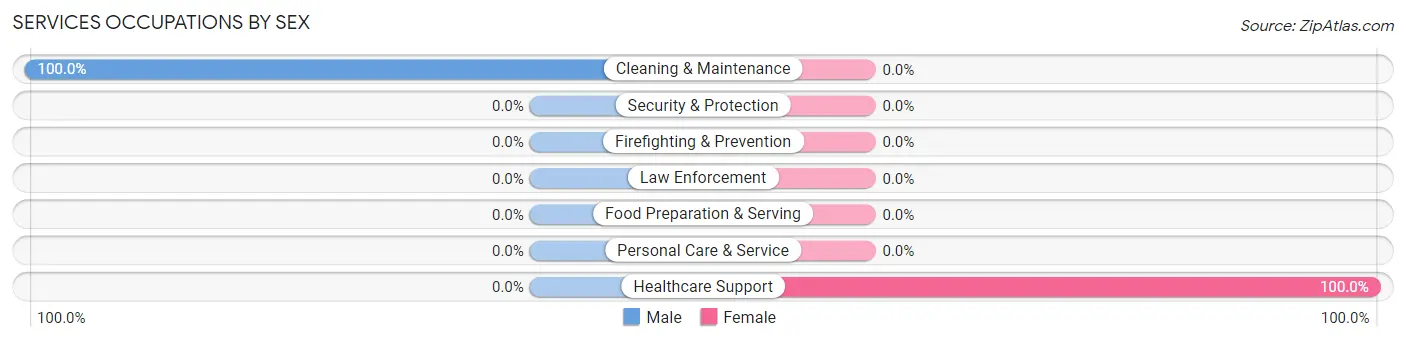
| Occupation | Male | Female |
| Healthcare Support | 0 (0.0%) | 29 (100.0%) |
| Security & Protection | 0 (0.0%) | 0 (0.0%) |
| Firefighting & Prevention | 0 (0.0%) | 0 (0.0%) |
| Law Enforcement | 0 (0.0%) | 0 (0.0%) |
| Food Preparation & Serving | 0 (0.0%) | 0 (0.0%) |
| Cleaning & Maintenance | 45 (100.0%) | 0 (0.0%) |
| Personal Care & Service | 0 (0.0%) | 0 (0.0%) |
| Total (Category) | 45 (60.8%) | 29 (39.2%) |
| Total (Overall) | 389 (63.6%) | 223 (36.4%) |
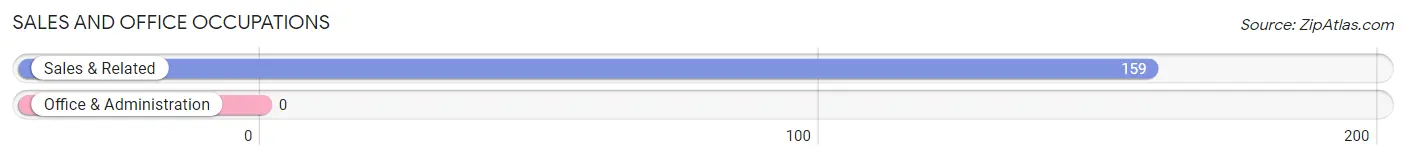
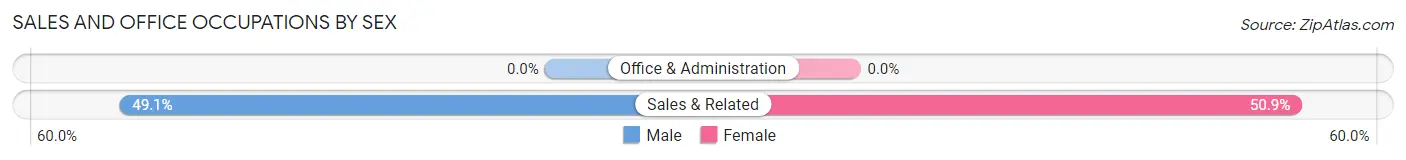
Sales and Office Occupations
The most common Sales and Office occupations in Avila Beach are , and Sales & Related (159 | 26.0%).
Sales and Office Occupations by Sex
| Occupation | Male | Female |
| Sales & Related | 78 (49.1%) | 81 (50.9%) |
| Office & Administration | 0 (0.0%) | 0 (0.0%) |
| Total (Category) | 78 (49.1%) | 81 (50.9%) |
| Total (Overall) | 389 (63.6%) | 223 (36.4%) |
Natural Resources, Construction and Maintenance Occupations
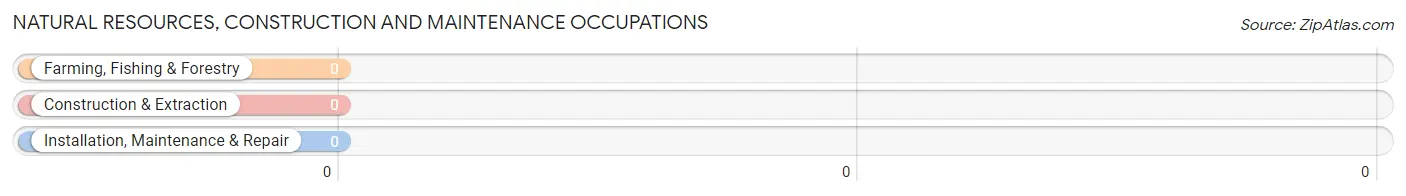
Natural Resources, Construction and Maintenance Occupations by Sex
| Occupation | Male | Female |
| Farming, Fishing & Forestry | 0 (0.0%) | 0 (0.0%) |
| Construction & Extraction | 0 (0.0%) | 0 (0.0%) |
| Installation, Maintenance & Repair | 0 (0.0%) | 0 (0.0%) |
| Total (Category) | 0 (0.0%) | 0 (0.0%) |
| Total (Overall) | 389 (63.6%) | 223 (36.4%) |
Production, Transportation and Moving Occupations
The most common Production, Transportation and Moving occupations in Avila Beach are , and Production (65 | 10.6%).
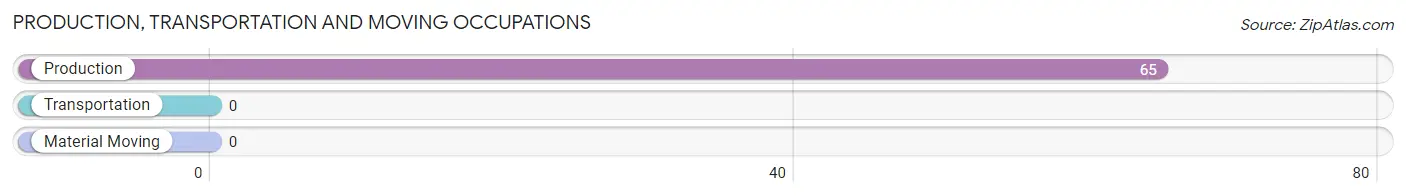
Production, Transportation and Moving Occupations by Sex
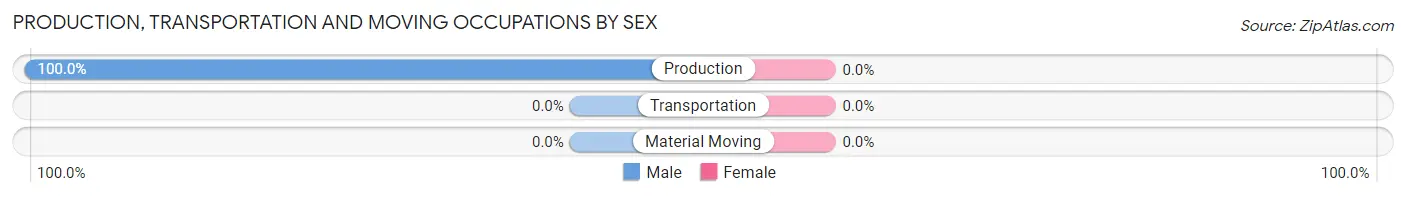
| Occupation | Male | Female |
| Production | 65 (100.0%) | 0 (0.0%) |
| Transportation | 0 (0.0%) | 0 (0.0%) |
| Material Moving | 0 (0.0%) | 0 (0.0%) |
| Total (Category) | 65 (100.0%) | 0 (0.0%) |
| Total (Overall) | 389 (63.6%) | 223 (36.4%) |
Employment Industries by Sex in Avila Beach
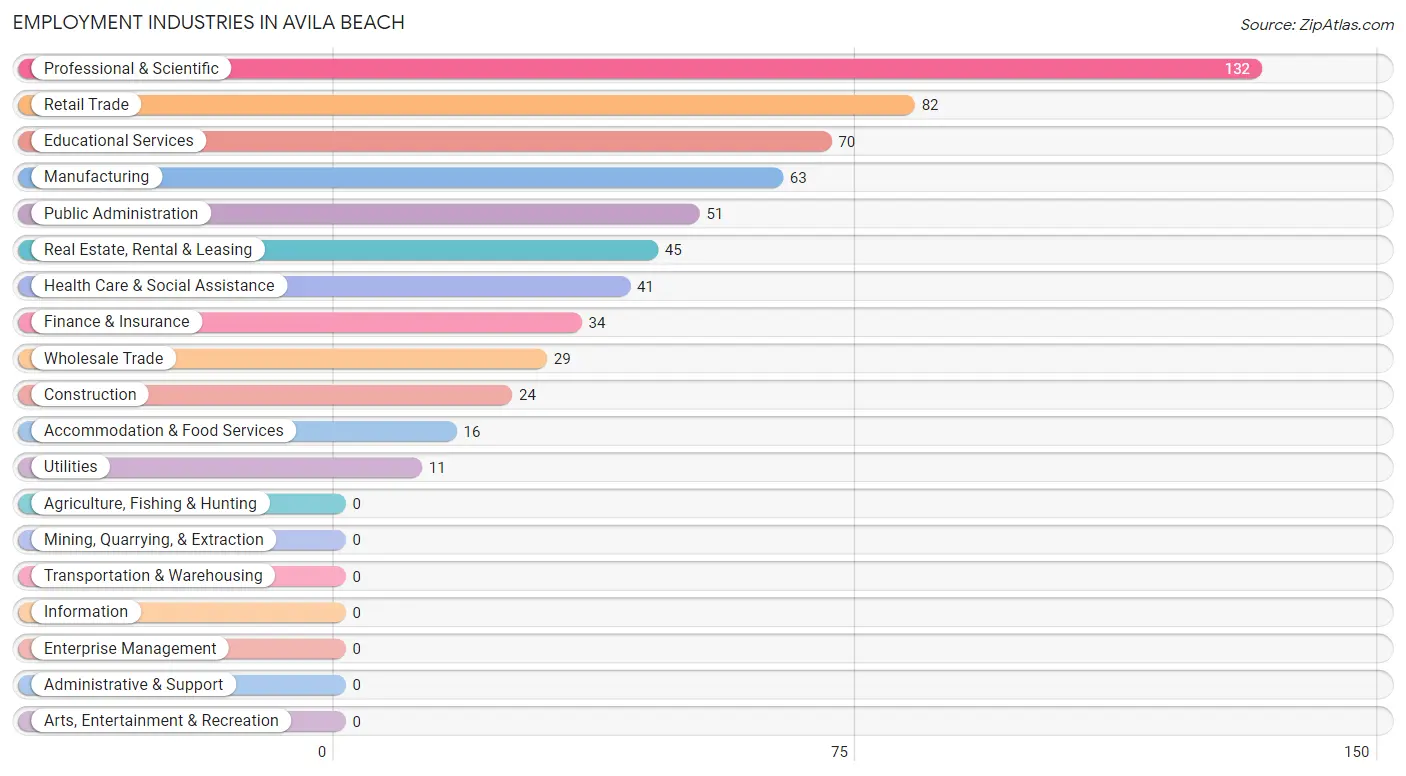
Employment Industries in Avila Beach
The major employment industries in Avila Beach include Professional & Scientific (132 | 21.6%), Retail Trade (82 | 13.4%), Educational Services (70 | 11.4%), Manufacturing (63 | 10.3%), and Public Administration (51 | 8.3%).
Employment Industries by Sex in Avila Beach
The Avila Beach industries that see more men than women are Wholesale Trade (100.0%), Utilities (100.0%), and Finance & Insurance (100.0%), whereas the industries that tend to have a higher number of women are Construction (100.0%), Health Care & Social Assistance (70.7%), and Educational Services (65.7%).
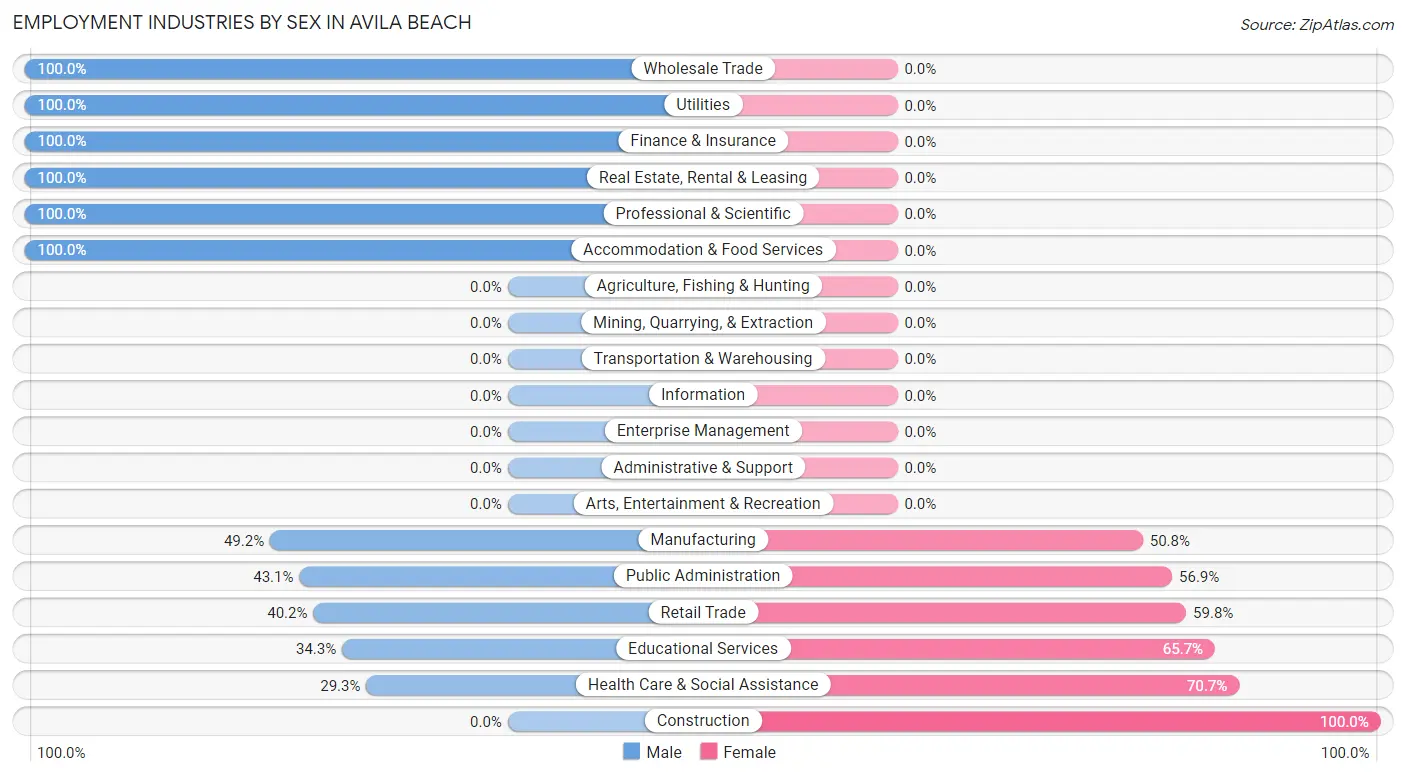
| Industry | Male | Female |
| Agriculture, Fishing & Hunting | 0 (0.0%) | 0 (0.0%) |
| Mining, Quarrying, & Extraction | 0 (0.0%) | 0 (0.0%) |
| Construction | 0 (0.0%) | 24 (100.0%) |
| Manufacturing | 31 (49.2%) | 32 (50.8%) |
| Wholesale Trade | 29 (100.0%) | 0 (0.0%) |
| Retail Trade | 33 (40.2%) | 49 (59.8%) |
| Transportation & Warehousing | 0 (0.0%) | 0 (0.0%) |
| Utilities | 11 (100.0%) | 0 (0.0%) |
| Information | 0 (0.0%) | 0 (0.0%) |
| Finance & Insurance | 34 (100.0%) | 0 (0.0%) |
| Real Estate, Rental & Leasing | 45 (100.0%) | 0 (0.0%) |
| Professional & Scientific | 132 (100.0%) | 0 (0.0%) |
| Enterprise Management | 0 (0.0%) | 0 (0.0%) |
| Administrative & Support | 0 (0.0%) | 0 (0.0%) |
| Educational Services | 24 (34.3%) | 46 (65.7%) |
| Health Care & Social Assistance | 12 (29.3%) | 29 (70.7%) |
| Arts, Entertainment & Recreation | 0 (0.0%) | 0 (0.0%) |
| Accommodation & Food Services | 16 (100.0%) | 0 (0.0%) |
| Public Administration | 22 (43.1%) | 29 (56.9%) |
| Total | 389 (63.6%) | 223 (36.4%) |
Education in Avila Beach
School Enrollment in Avila Beach
The most common levels of schooling among the 332 students in Avila Beach are college / undergraduate (206 | 62.1%), nursery / preschool (57 | 17.2%), and elementary school (45 | 13.6%).
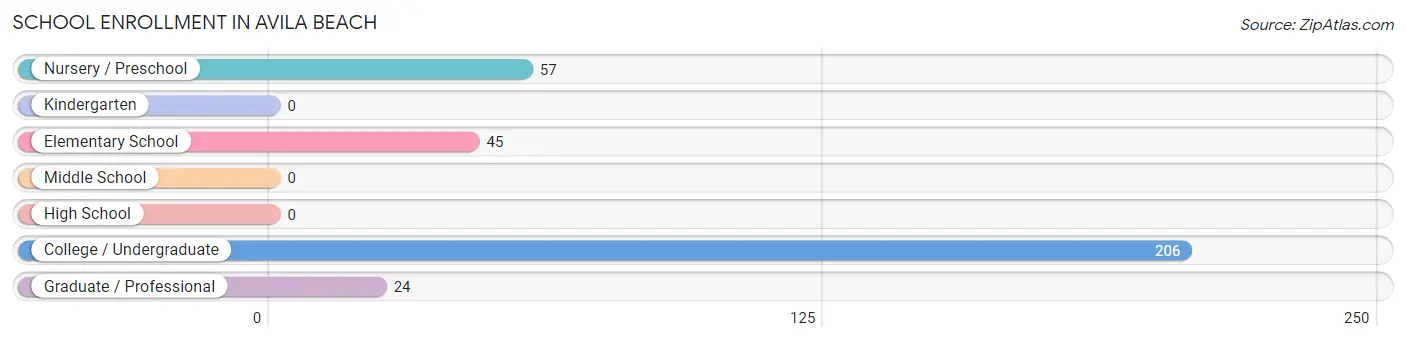
| School Level | # Students | % Students |
| Nursery / Preschool | 57 | 17.2% |
| Kindergarten | 0 | 0.0% |
| Elementary School | 45 | 13.6% |
| Middle School | 0 | 0.0% |
| High School | 0 | 0.0% |
| College / Undergraduate | 206 | 62.1% |
| Graduate / Professional | 24 | 7.2% |
| Total | 332 | 100.0% |
School Enrollment by Age by Funding Source in Avila Beach
Out of a total of 332 students who are enrolled in schools in Avila Beach, 81 (24.4%) attend a private institution, while the remaining 251 (75.6%) are enrolled in public schools. The age group of 3 to 4 year olds has the highest likelihood of being enrolled in private schools, with 26 (100.0% in the age bracket) enrolled. Conversely, the age group of 20 to 24 year olds has the lowest likelihood of being enrolled in a private school, with 206 (100.0% in the age bracket) attending a public institution.
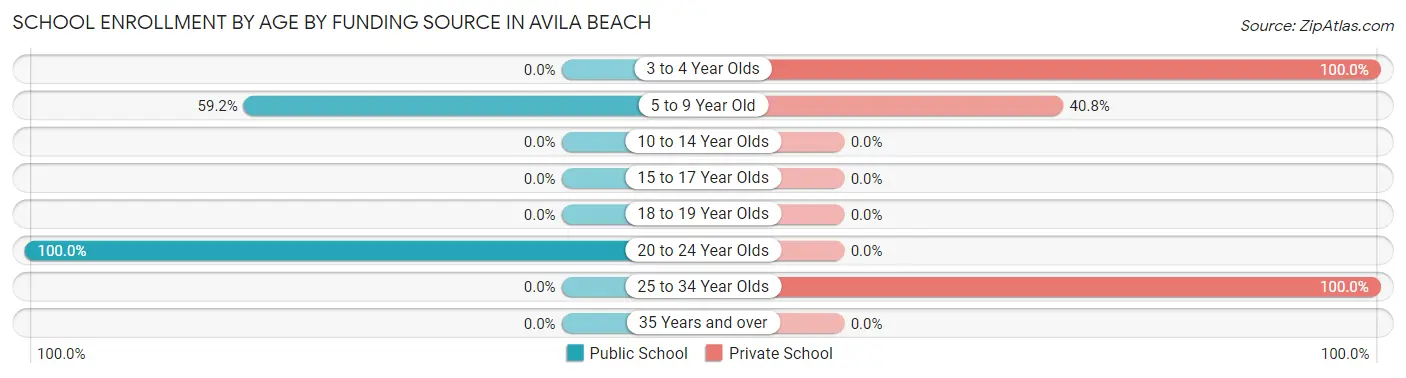
| Age Bracket | Public School | Private School |
| 3 to 4 Year Olds | 0 (0.0%) | 26 (100.0%) |
| 5 to 9 Year Old | 45 (59.2%) | 31 (40.8%) |
| 10 to 14 Year Olds | 0 (0.0%) | 0 (0.0%) |
| 15 to 17 Year Olds | 0 (0.0%) | 0 (0.0%) |
| 18 to 19 Year Olds | 0 (0.0%) | 0 (0.0%) |
| 20 to 24 Year Olds | 206 (100.0%) | 0 (0.0%) |
| 25 to 34 Year Olds | 0 (0.0%) | 24 (100.0%) |
| 35 Years and over | 0 (0.0%) | 0 (0.0%) |
| Total | 251 (75.6%) | 81 (24.4%) |
Educational Attainment by Field of Study in Avila Beach
Business (195 | 21.3%), education (191 | 20.9%), social sciences (126 | 13.8%), bio, nature & agricultural (93 | 10.2%), and computers & mathematics (63 | 6.9%) are the most common fields of study among 915 individuals in Avila Beach who have obtained a bachelor's degree or higher.
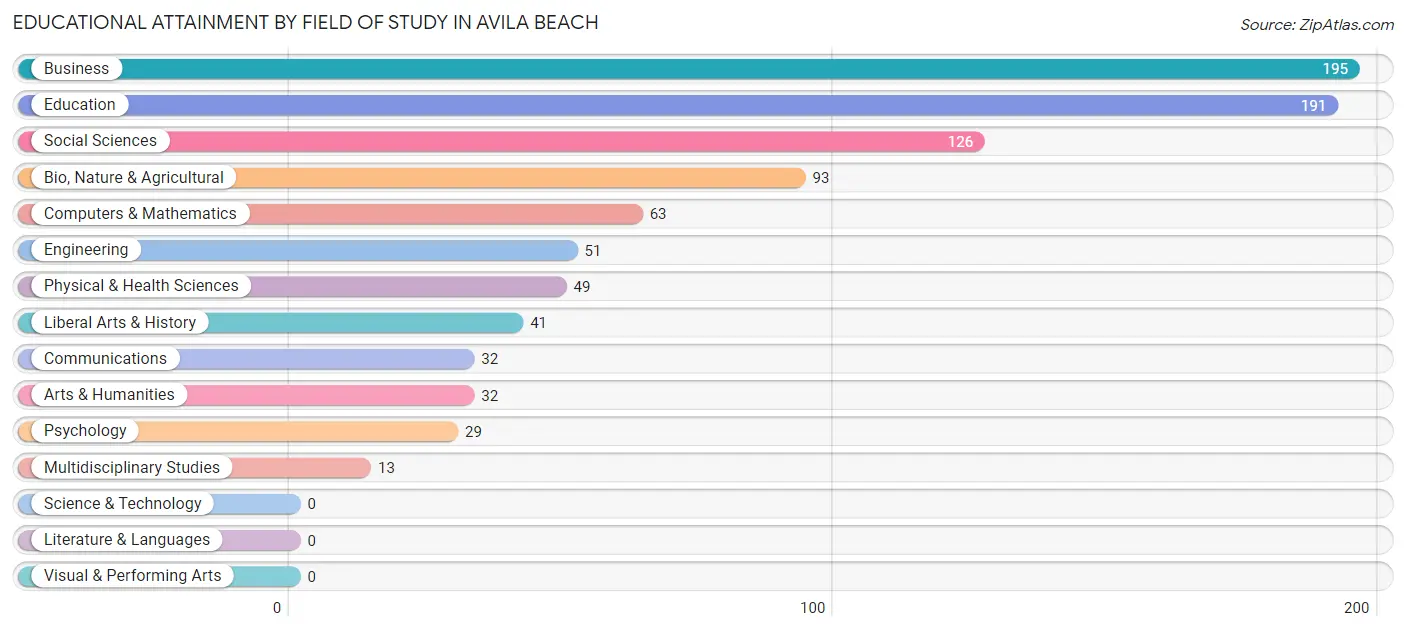
| Field of Study | # Graduates | % Graduates |
| Computers & Mathematics | 63 | 6.9% |
| Bio, Nature & Agricultural | 93 | 10.2% |
| Physical & Health Sciences | 49 | 5.4% |
| Psychology | 29 | 3.2% |
| Social Sciences | 126 | 13.8% |
| Engineering | 51 | 5.6% |
| Multidisciplinary Studies | 13 | 1.4% |
| Science & Technology | 0 | 0.0% |
| Business | 195 | 21.3% |
| Education | 191 | 20.9% |
| Literature & Languages | 0 | 0.0% |
| Liberal Arts & History | 41 | 4.5% |
| Visual & Performing Arts | 0 | 0.0% |
| Communications | 32 | 3.5% |
| Arts & Humanities | 32 | 3.5% |
| Total | 915 | 100.0% |
Transportation & Commute in Avila Beach
Vehicle Availability by Sex in Avila Beach
The most prevalent vehicle ownership categories in Avila Beach are males with 2 vehicles (162, accounting for 41.6%) and females with 2 vehicles (45, making up 85.3%).
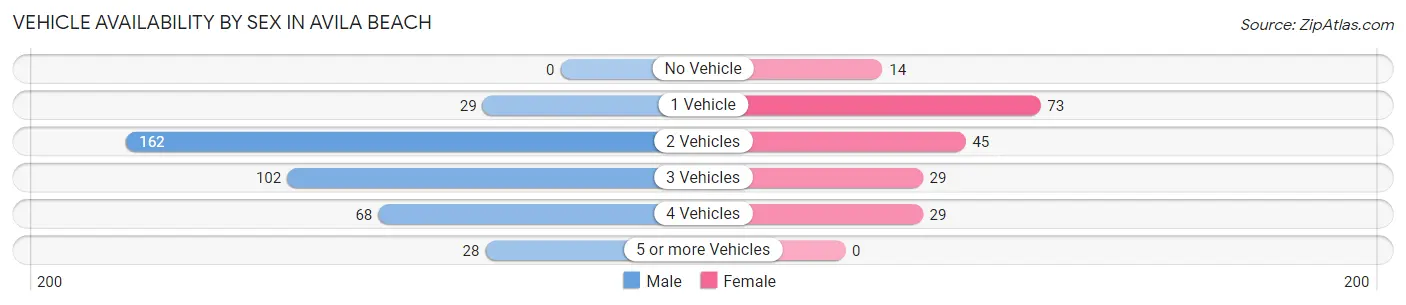
| Vehicles Available | Male | Female |
| No Vehicle | 0 (0.0%) | 14 (7.4%) |
| 1 Vehicle | 29 (7.5%) | 73 (38.4%) |
| 2 Vehicles | 162 (41.6%) | 45 (23.7%) |
| 3 Vehicles | 102 (26.2%) | 29 (15.3%) |
| 4 Vehicles | 68 (17.5%) | 29 (15.3%) |
| 5 or more Vehicles | 28 (7.2%) | 0 (0.0%) |
| Total | 389 (100.0%) | 190 (100.0%) |
Commute Time in Avila Beach
The most frequently occuring commute durations in Avila Beach are 15 to 19 minutes (91 commuters, 27.7%), 10 to 14 minutes (75 commuters, 22.8%), and 5 to 9 minutes (49 commuters, 14.9%).
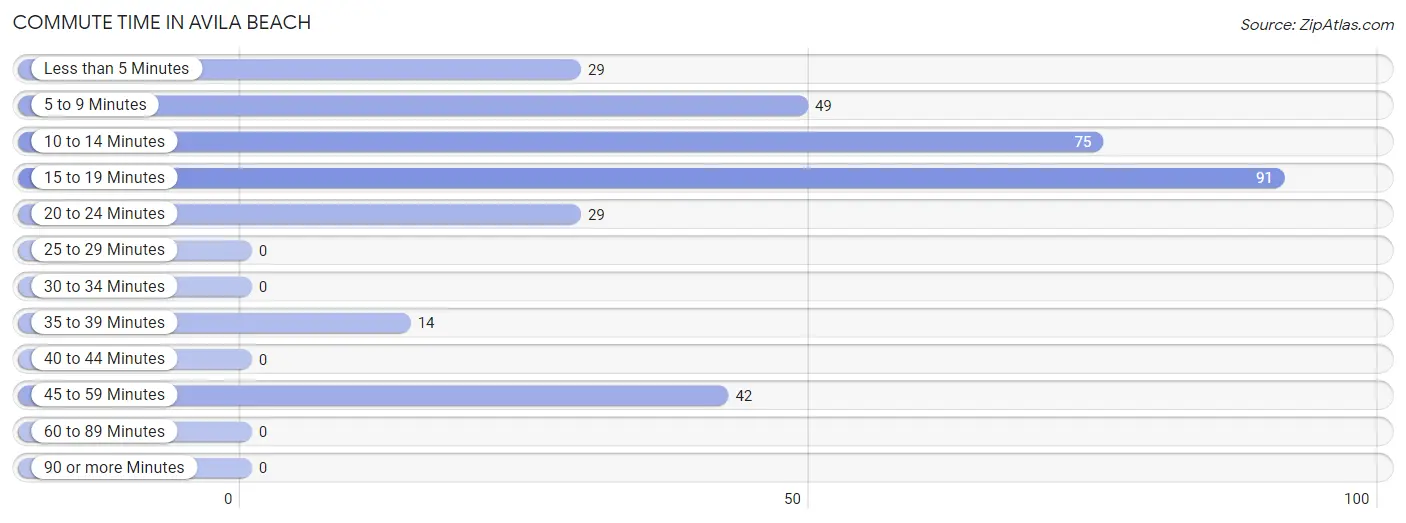
| Commute Time | # Commuters | % Commuters |
| Less than 5 Minutes | 29 | 8.8% |
| 5 to 9 Minutes | 49 | 14.9% |
| 10 to 14 Minutes | 75 | 22.8% |
| 15 to 19 Minutes | 91 | 27.7% |
| 20 to 24 Minutes | 29 | 8.8% |
| 25 to 29 Minutes | 0 | 0.0% |
| 30 to 34 Minutes | 0 | 0.0% |
| 35 to 39 Minutes | 14 | 4.3% |
| 40 to 44 Minutes | 0 | 0.0% |
| 45 to 59 Minutes | 42 | 12.8% |
| 60 to 89 Minutes | 0 | 0.0% |
| 90 or more Minutes | 0 | 0.0% |
Commute Time by Sex in Avila Beach
The most common commute times in Avila Beach are 15 to 19 minutes (67 commuters, 33.5%) for males and 5 to 9 minutes (49 commuters, 38.0%) for females.
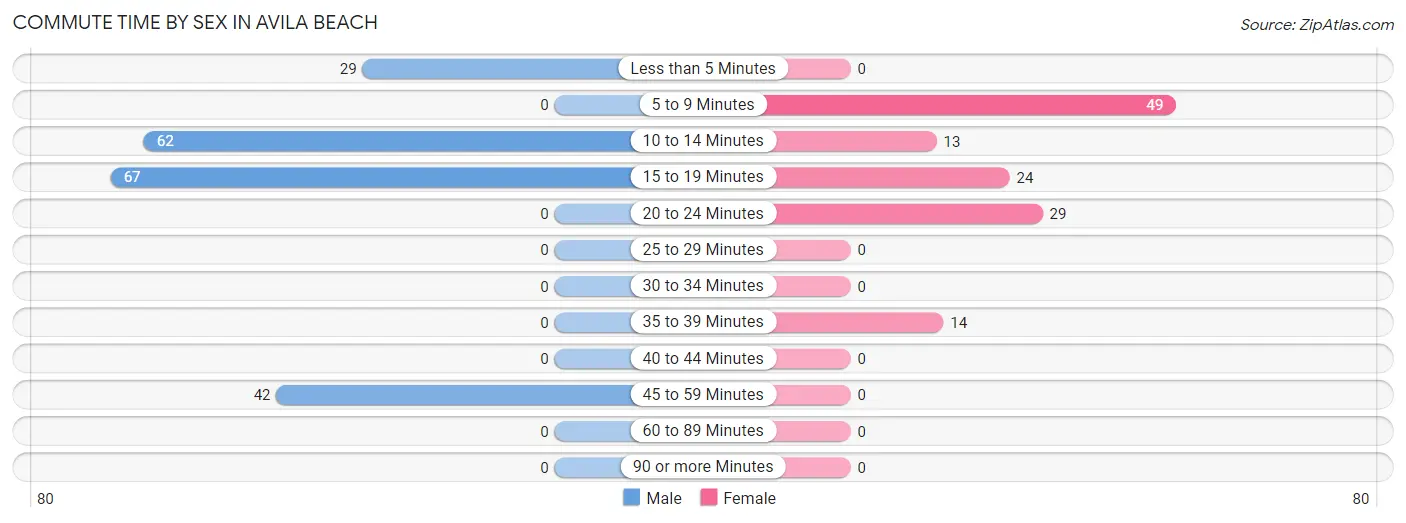
| Commute Time | Male | Female |
| Less than 5 Minutes | 29 (14.5%) | 0 (0.0%) |
| 5 to 9 Minutes | 0 (0.0%) | 49 (38.0%) |
| 10 to 14 Minutes | 62 (31.0%) | 13 (10.1%) |
| 15 to 19 Minutes | 67 (33.5%) | 24 (18.6%) |
| 20 to 24 Minutes | 0 (0.0%) | 29 (22.5%) |
| 25 to 29 Minutes | 0 (0.0%) | 0 (0.0%) |
| 30 to 34 Minutes | 0 (0.0%) | 0 (0.0%) |
| 35 to 39 Minutes | 0 (0.0%) | 14 (10.8%) |
| 40 to 44 Minutes | 0 (0.0%) | 0 (0.0%) |
| 45 to 59 Minutes | 42 (21.0%) | 0 (0.0%) |
| 60 to 89 Minutes | 0 (0.0%) | 0 (0.0%) |
| 90 or more Minutes | 0 (0.0%) | 0 (0.0%) |
Time of Departure to Work by Sex in Avila Beach
The most frequent times of departure to work in Avila Beach are 12:00 AM to 4:59 AM (38, 19.0%) for males and 7:00 AM to 7:29 AM (67, 51.9%) for females.
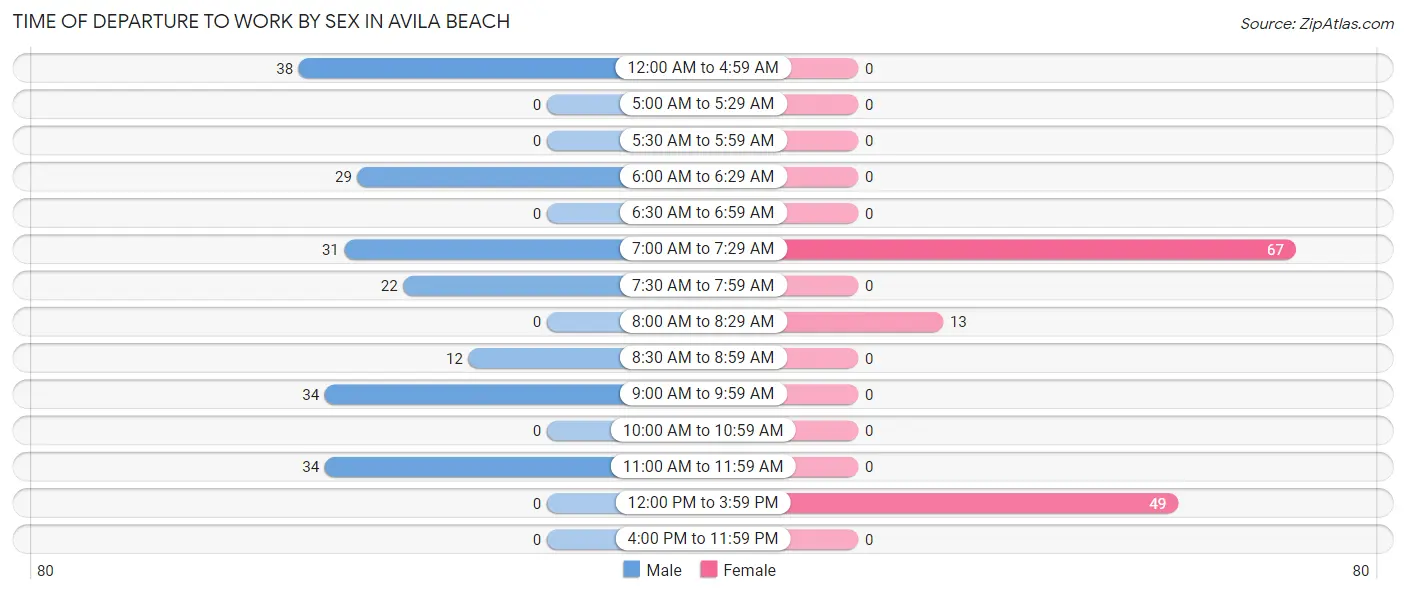
| Time of Departure | Male | Female |
| 12:00 AM to 4:59 AM | 38 (19.0%) | 0 (0.0%) |
| 5:00 AM to 5:29 AM | 0 (0.0%) | 0 (0.0%) |
| 5:30 AM to 5:59 AM | 0 (0.0%) | 0 (0.0%) |
| 6:00 AM to 6:29 AM | 29 (14.5%) | 0 (0.0%) |
| 6:30 AM to 6:59 AM | 0 (0.0%) | 0 (0.0%) |
| 7:00 AM to 7:29 AM | 31 (15.5%) | 67 (51.9%) |
| 7:30 AM to 7:59 AM | 22 (11.0%) | 0 (0.0%) |
| 8:00 AM to 8:29 AM | 0 (0.0%) | 13 (10.1%) |
| 8:30 AM to 8:59 AM | 12 (6.0%) | 0 (0.0%) |
| 9:00 AM to 9:59 AM | 34 (17.0%) | 0 (0.0%) |
| 10:00 AM to 10:59 AM | 0 (0.0%) | 0 (0.0%) |
| 11:00 AM to 11:59 AM | 34 (17.0%) | 0 (0.0%) |
| 12:00 PM to 3:59 PM | 0 (0.0%) | 49 (38.0%) |
| 4:00 PM to 11:59 PM | 0 (0.0%) | 0 (0.0%) |
| Total | 200 (100.0%) | 129 (100.0%) |
Housing Occupancy in Avila Beach
Occupancy by Ownership in Avila Beach
Of the total 729 dwellings in Avila Beach, owner-occupied units account for 512 (70.2%), while renter-occupied units make up 217 (29.8%).
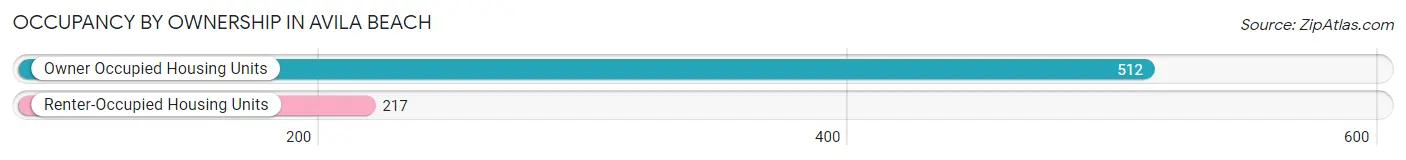
| Occupancy | # Housing Units | % Housing Units |
| Owner Occupied Housing Units | 512 | 70.2% |
| Renter-Occupied Housing Units | 217 | 29.8% |
| Total Occupied Housing Units | 729 | 100.0% |
Occupancy by Household Size in Avila Beach
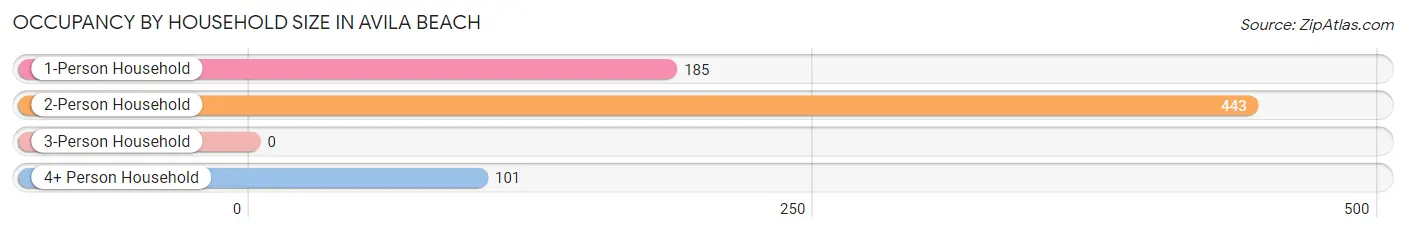
| Household Size | # Housing Units | % Housing Units |
| 1-Person Household | 185 | 25.4% |
| 2-Person Household | 443 | 60.8% |
| 3-Person Household | 0 | 0.0% |
| 4+ Person Household | 101 | 13.9% |
| Total Housing Units | 729 | 100.0% |
Occupancy by Ownership by Household Size in Avila Beach
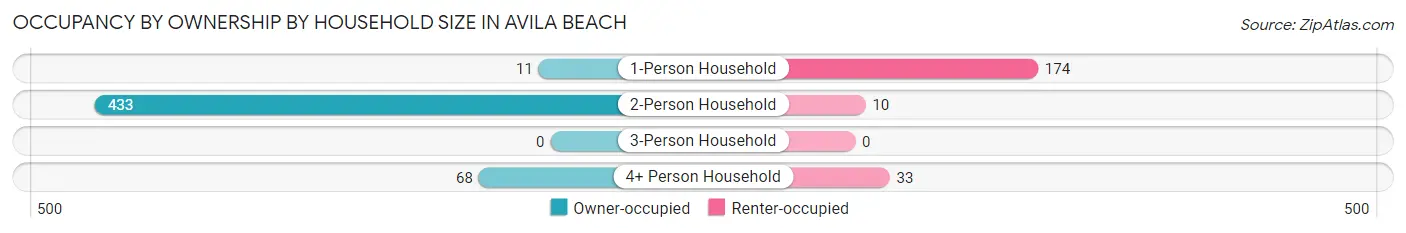
| Household Size | Owner-occupied | Renter-occupied |
| 1-Person Household | 11 (5.9%) | 174 (94.1%) |
| 2-Person Household | 433 (97.7%) | 10 (2.3%) |
| 3-Person Household | 0 (0.0%) | 0 (0.0%) |
| 4+ Person Household | 68 (67.3%) | 33 (32.7%) |
| Total Housing Units | 512 (70.2%) | 217 (29.8%) |
Occupancy by Educational Attainment in Avila Beach
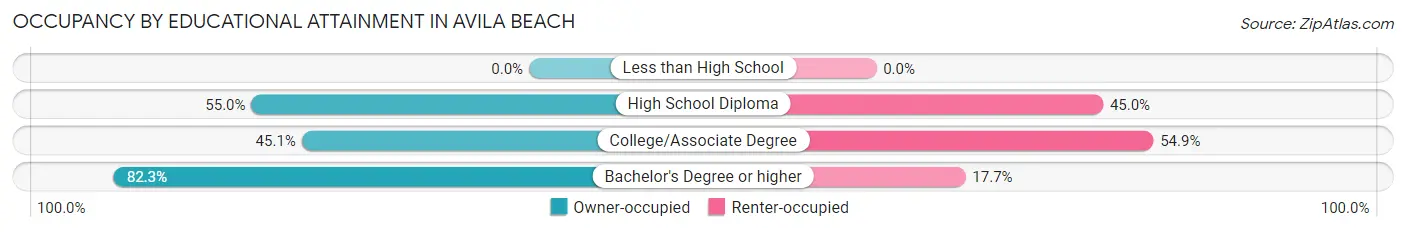
| Household Size | Owner-occupied | Renter-occupied |
| Less than High School | 0 (0.0%) | 0 (0.0%) |
| High School Diploma | 71 (55.0%) | 58 (45.0%) |
| College/Associate Degree | 64 (45.1%) | 78 (54.9%) |
| Bachelor's Degree or higher | 377 (82.3%) | 81 (17.7%) |
Occupancy by Age of Householder in Avila Beach
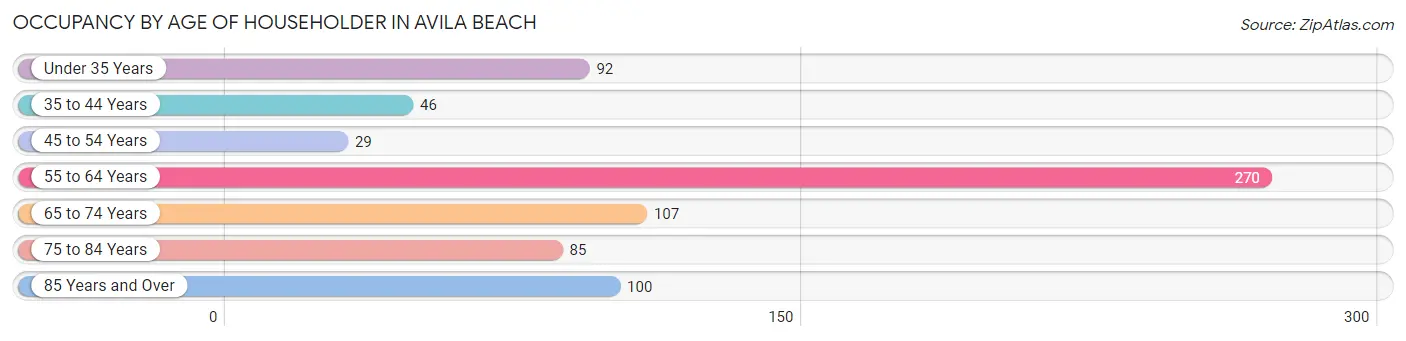
| Age Bracket | # Households | % Households |
| Under 35 Years | 92 | 12.6% |
| 35 to 44 Years | 46 | 6.3% |
| 45 to 54 Years | 29 | 4.0% |
| 55 to 64 Years | 270 | 37.0% |
| 65 to 74 Years | 107 | 14.7% |
| 75 to 84 Years | 85 | 11.7% |
| 85 Years and Over | 100 | 13.7% |
| Total | 729 | 100.0% |
Housing Finances in Avila Beach
Median Income by Occupancy in Avila Beach
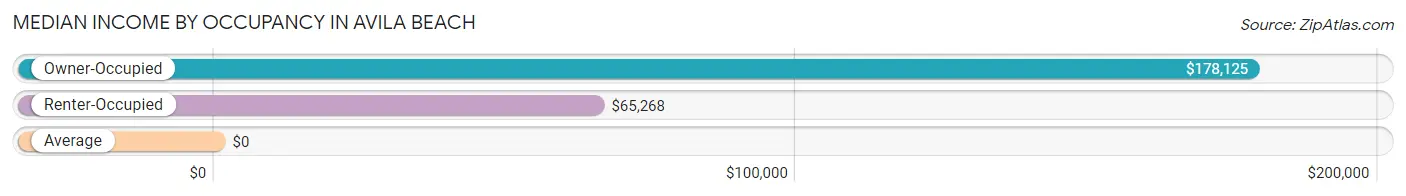
| Occupancy Type | # Households | Median Income |
| Owner-Occupied | 512 (70.2%) | $178,125 |
| Renter-Occupied | 217 (29.8%) | $65,268 |
| Average | 729 (100.0%) | $0 |
Occupancy by Householder Income Bracket in Avila Beach
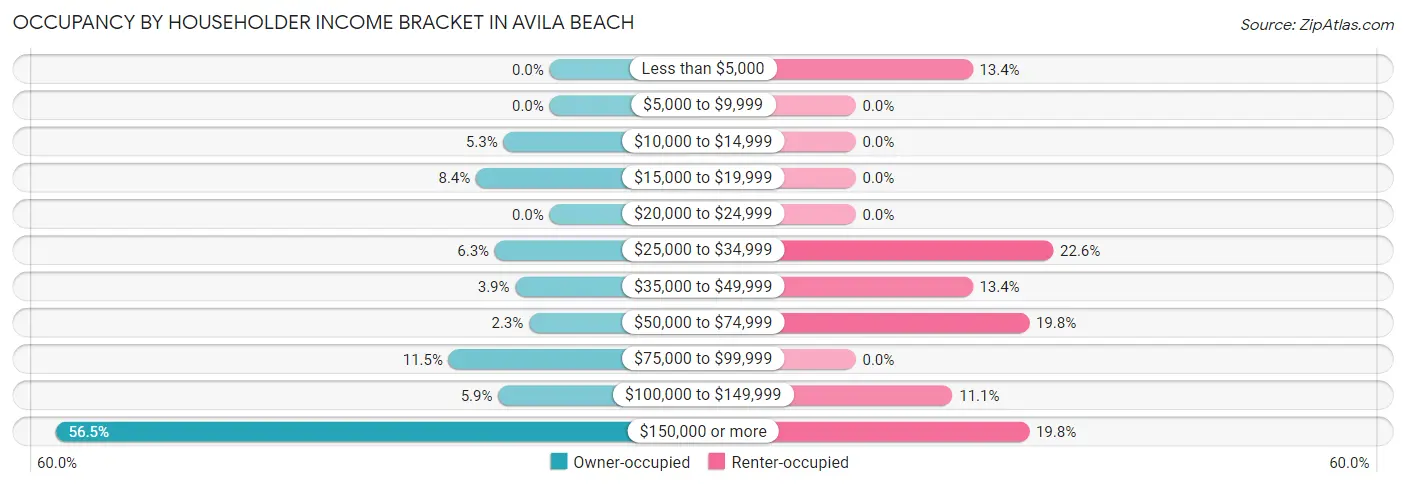
| Income Bracket | Owner-occupied | Renter-occupied |
| Less than $5,000 | 0 (0.0%) | 29 (13.4%) |
| $5,000 to $9,999 | 0 (0.0%) | 0 (0.0%) |
| $10,000 to $14,999 | 27 (5.3%) | 0 (0.0%) |
| $15,000 to $19,999 | 43 (8.4%) | 0 (0.0%) |
| $20,000 to $24,999 | 0 (0.0%) | 0 (0.0%) |
| $25,000 to $34,999 | 32 (6.2%) | 49 (22.6%) |
| $35,000 to $49,999 | 20 (3.9%) | 29 (13.4%) |
| $50,000 to $74,999 | 12 (2.3%) | 43 (19.8%) |
| $75,000 to $99,999 | 59 (11.5%) | 0 (0.0%) |
| $100,000 to $149,999 | 30 (5.9%) | 24 (11.1%) |
| $150,000 or more | 289 (56.5%) | 43 (19.8%) |
| Total | 512 (100.0%) | 217 (100.0%) |
Monthly Housing Cost Tiers in Avila Beach
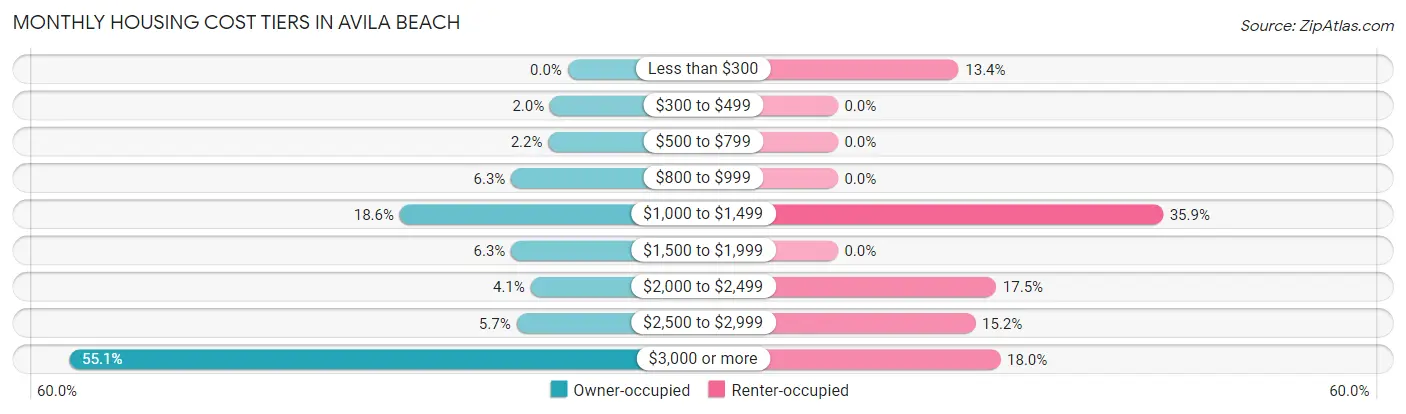
| Monthly Cost | Owner-occupied | Renter-occupied |
| Less than $300 | 0 (0.0%) | 29 (13.4%) |
| $300 to $499 | 10 (1.9%) | 0 (0.0%) |
| $500 to $799 | 11 (2.1%) | 0 (0.0%) |
| $800 to $999 | 32 (6.2%) | 0 (0.0%) |
| $1,000 to $1,499 | 95 (18.5%) | 78 (35.9%) |
| $1,500 to $1,999 | 32 (6.2%) | 0 (0.0%) |
| $2,000 to $2,499 | 21 (4.1%) | 38 (17.5%) |
| $2,500 to $2,999 | 29 (5.7%) | 33 (15.2%) |
| $3,000 or more | 282 (55.1%) | 39 (18.0%) |
| Total | 512 (100.0%) | 217 (100.0%) |
Physical Housing Characteristics in Avila Beach
Housing Structures in Avila Beach
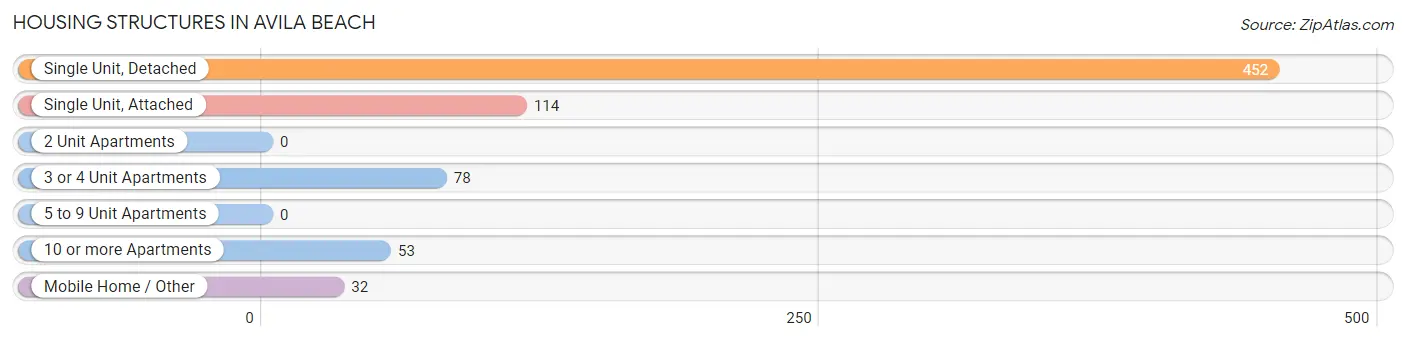
| Structure Type | # Housing Units | % Housing Units |
| Single Unit, Detached | 452 | 62.0% |
| Single Unit, Attached | 114 | 15.6% |
| 2 Unit Apartments | 0 | 0.0% |
| 3 or 4 Unit Apartments | 78 | 10.7% |
| 5 to 9 Unit Apartments | 0 | 0.0% |
| 10 or more Apartments | 53 | 7.3% |
| Mobile Home / Other | 32 | 4.4% |
| Total | 729 | 100.0% |
Housing Structures by Occupancy in Avila Beach
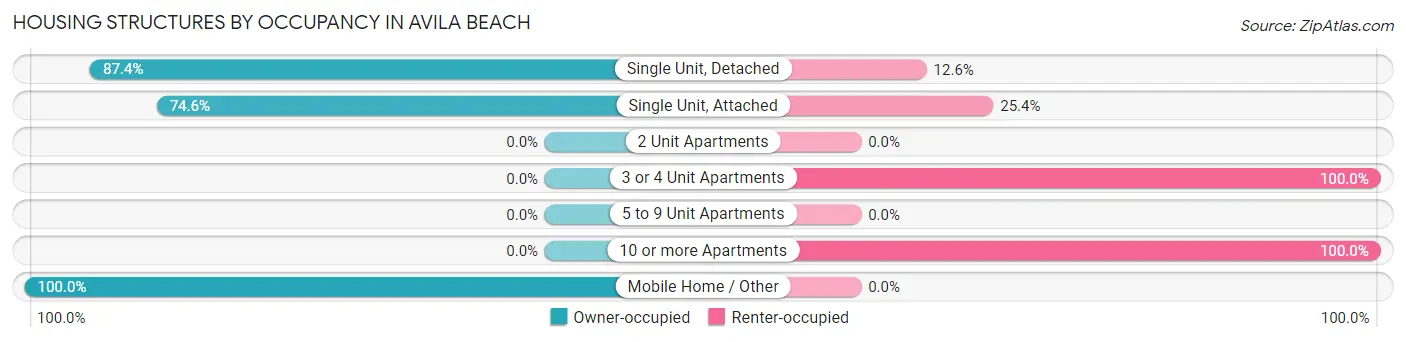
| Structure Type | Owner-occupied | Renter-occupied |
| Single Unit, Detached | 395 (87.4%) | 57 (12.6%) |
| Single Unit, Attached | 85 (74.6%) | 29 (25.4%) |
| 2 Unit Apartments | 0 (0.0%) | 0 (0.0%) |
| 3 or 4 Unit Apartments | 0 (0.0%) | 78 (100.0%) |
| 5 to 9 Unit Apartments | 0 (0.0%) | 0 (0.0%) |
| 10 or more Apartments | 0 (0.0%) | 53 (100.0%) |
| Mobile Home / Other | 32 (100.0%) | 0 (0.0%) |
| Total | 512 (70.2%) | 217 (29.8%) |
Housing Structures by Number of Rooms in Avila Beach
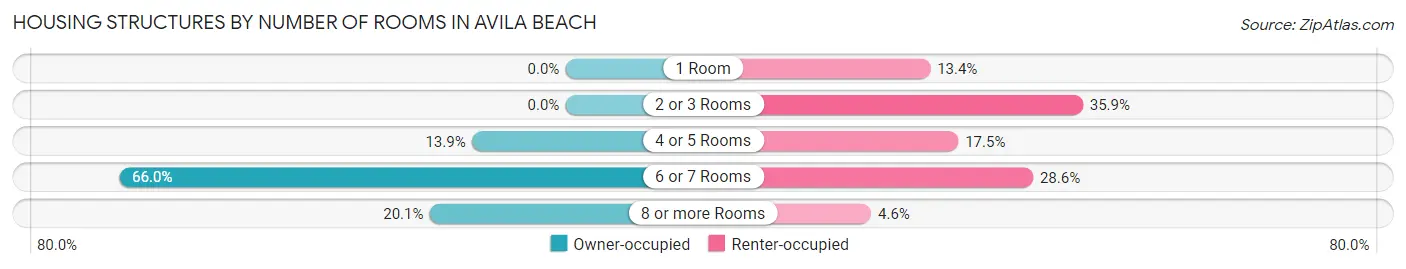
| Number of Rooms | Owner-occupied | Renter-occupied |
| 1 Room | 0 (0.0%) | 29 (13.4%) |
| 2 or 3 Rooms | 0 (0.0%) | 78 (35.9%) |
| 4 or 5 Rooms | 71 (13.9%) | 38 (17.5%) |
| 6 or 7 Rooms | 338 (66.0%) | 62 (28.6%) |
| 8 or more Rooms | 103 (20.1%) | 10 (4.6%) |
| Total | 512 (100.0%) | 217 (100.0%) |
Housing Structure by Heating Type in Avila Beach
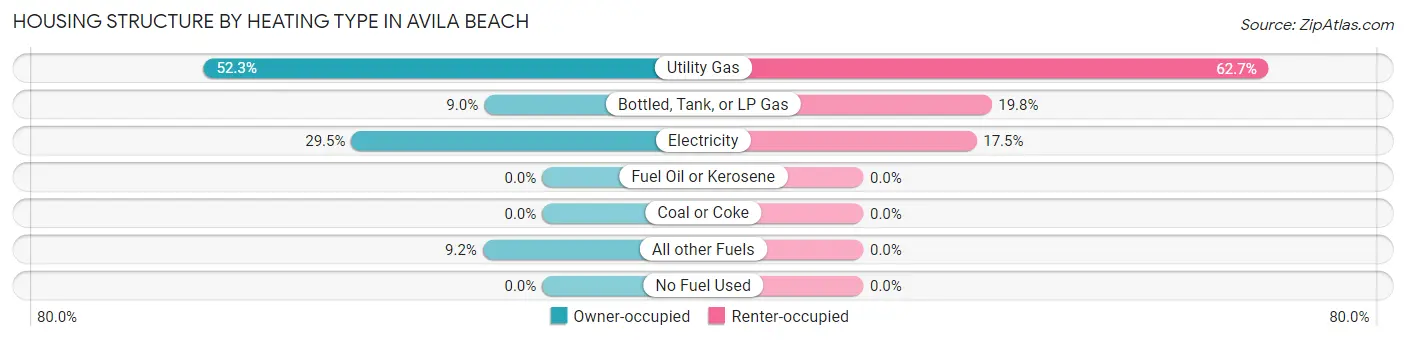
| Heating Type | Owner-occupied | Renter-occupied |
| Utility Gas | 268 (52.3%) | 136 (62.7%) |
| Bottled, Tank, or LP Gas | 46 (9.0%) | 43 (19.8%) |
| Electricity | 151 (29.5%) | 38 (17.5%) |
| Fuel Oil or Kerosene | 0 (0.0%) | 0 (0.0%) |
| Coal or Coke | 0 (0.0%) | 0 (0.0%) |
| All other Fuels | 47 (9.2%) | 0 (0.0%) |
| No Fuel Used | 0 (0.0%) | 0 (0.0%) |
| Total | 512 (100.0%) | 217 (100.0%) |
Household Vehicle Usage in Avila Beach
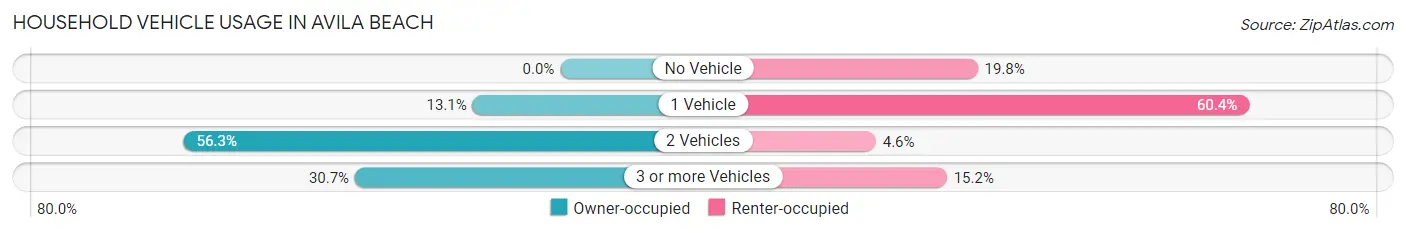
| Vehicles per Household | Owner-occupied | Renter-occupied |
| No Vehicle | 0 (0.0%) | 43 (19.8%) |
| 1 Vehicle | 67 (13.1%) | 131 (60.4%) |
| 2 Vehicles | 288 (56.2%) | 10 (4.6%) |
| 3 or more Vehicles | 157 (30.7%) | 33 (15.2%) |
| Total | 512 (100.0%) | 217 (100.0%) |
Real Estate & Mortgages in Avila Beach
Real Estate and Mortgage Overview in Avila Beach
| Characteristic | Without Mortgage | With Mortgage |
| Housing Units | 190 | 322 |
| Median Property Value | $1,160,700 | $1,211,400 |
| Median Household Income | $83,387 | $272 |
| Monthly Housing Costs | $1,143 | $282 |
| Real Estate Taxes | - | - |
Property Value by Mortgage Status in Avila Beach
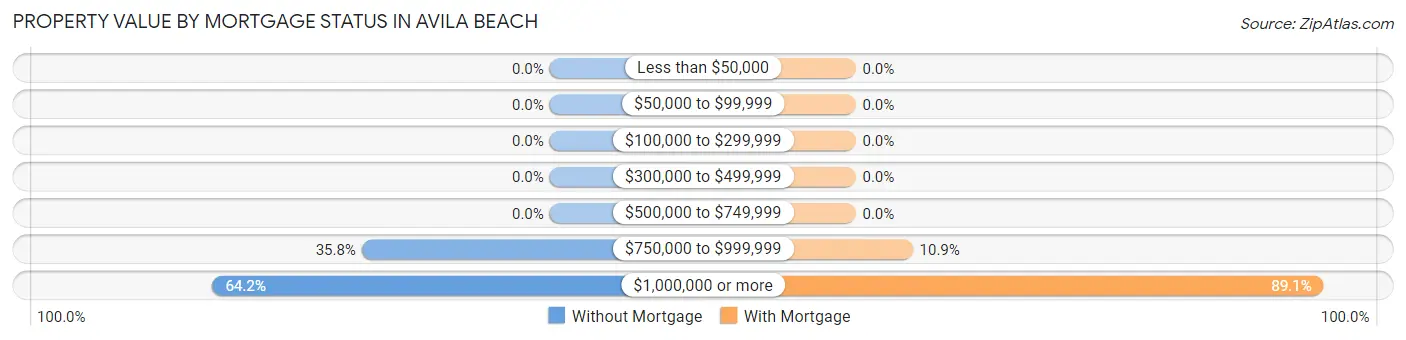
| Property Value | Without Mortgage | With Mortgage |
| Less than $50,000 | 0 (0.0%) | 0 (0.0%) |
| $50,000 to $99,999 | 0 (0.0%) | 0 (0.0%) |
| $100,000 to $299,999 | 0 (0.0%) | 0 (0.0%) |
| $300,000 to $499,999 | 0 (0.0%) | 0 (0.0%) |
| $500,000 to $749,999 | 0 (0.0%) | 0 (0.0%) |
| $750,000 to $999,999 | 68 (35.8%) | 35 (10.9%) |
| $1,000,000 or more | 122 (64.2%) | 287 (89.1%) |
| Total | 190 (100.0%) | 322 (100.0%) |
Household Income by Mortgage Status in Avila Beach
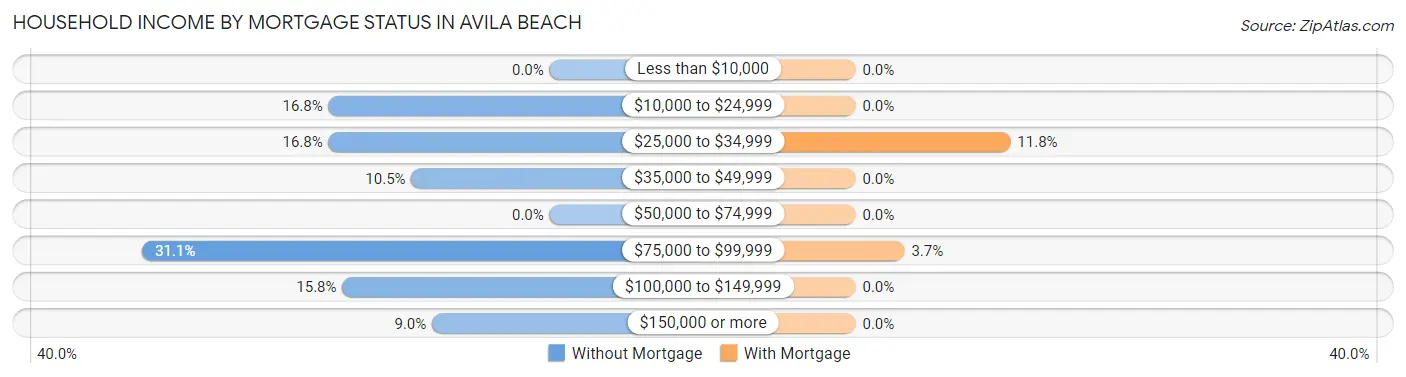
| Household Income | Without Mortgage | With Mortgage |
| Less than $10,000 | 0 (0.0%) | 0 (0.0%) |
| $10,000 to $24,999 | 32 (16.8%) | 0 (0.0%) |
| $25,000 to $34,999 | 32 (16.8%) | 38 (11.8%) |
| $35,000 to $49,999 | 20 (10.5%) | 0 (0.0%) |
| $50,000 to $74,999 | 0 (0.0%) | 0 (0.0%) |
| $75,000 to $99,999 | 59 (31.0%) | 12 (3.7%) |
| $100,000 to $149,999 | 30 (15.8%) | 0 (0.0%) |
| $150,000 or more | 17 (8.9%) | 0 (0.0%) |
| Total | 190 (100.0%) | 322 (100.0%) |
Property Value to Household Income Ratio in Avila Beach
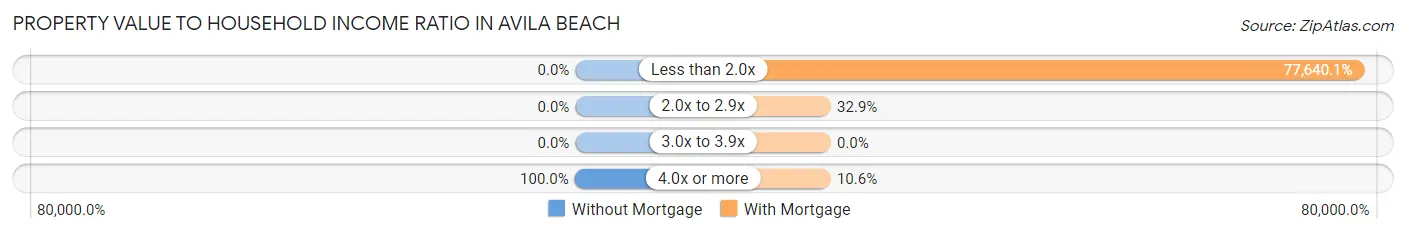
| Value-to-Income Ratio | Without Mortgage | With Mortgage |
| Less than 2.0x | 0 (0.0%) | 250,001 (77,640.1%) |
| 2.0x to 2.9x | 0 (0.0%) | 106 (32.9%) |
| 3.0x to 3.9x | 0 (0.0%) | 0 (0.0%) |
| 4.0x or more | 190 (100.0%) | 34 (10.6%) |
| Total | 190 (100.0%) | 322 (100.0%) |
Real Estate Taxes by Mortgage Status in Avila Beach
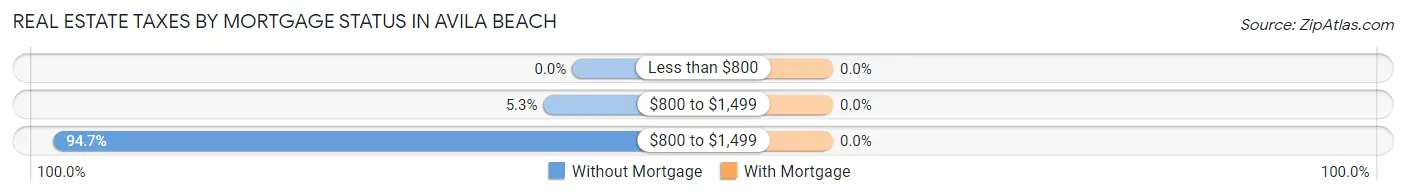
| Property Taxes | Without Mortgage | With Mortgage |
| Less than $800 | 0 (0.0%) | 0 (0.0%) |
| $800 to $1,499 | 10 (5.3%) | 0 (0.0%) |
| $800 to $1,499 | 180 (94.7%) | 0 (0.0%) |
| Total | 190 (100.0%) | 322 (100.0%) |
Health & Disability in Avila Beach
Health Insurance Coverage by Age in Avila Beach
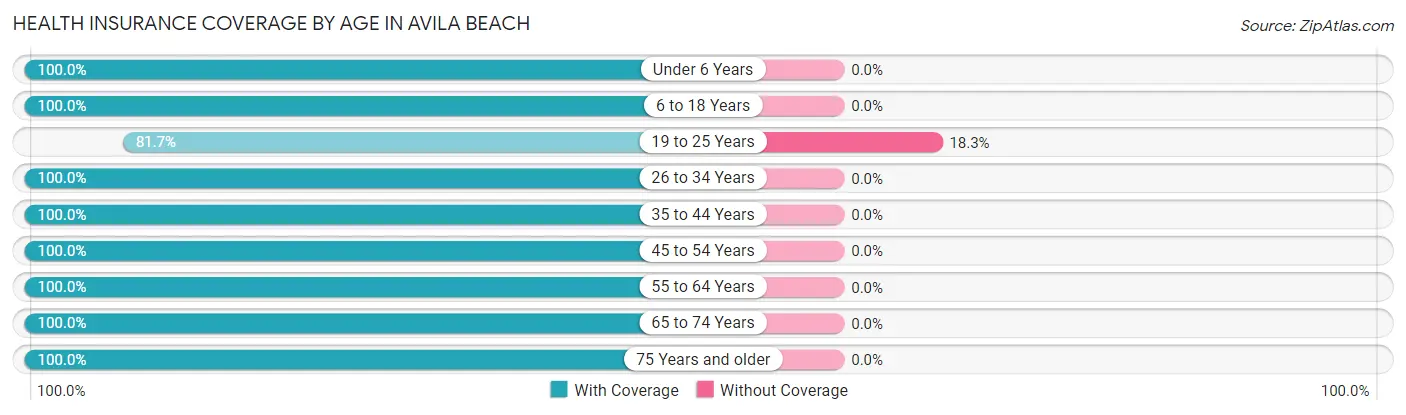
| Age Bracket | With Coverage | Without Coverage |
| Under 6 Years | 57 (100.0%) | 0 (0.0%) |
| 6 to 18 Years | 45 (100.0%) | 0 (0.0%) |
| 19 to 25 Years | 192 (81.7%) | 43 (18.3%) |
| 26 to 34 Years | 67 (100.0%) | 0 (0.0%) |
| 35 to 44 Years | 91 (100.0%) | 0 (0.0%) |
| 45 to 54 Years | 58 (100.0%) | 0 (0.0%) |
| 55 to 64 Years | 514 (100.0%) | 0 (0.0%) |
| 65 to 74 Years | 272 (100.0%) | 0 (0.0%) |
| 75 Years and older | 260 (100.0%) | 0 (0.0%) |
| Total | 1,556 (97.3%) | 43 (2.7%) |
Health Insurance Coverage by Citizenship Status in Avila Beach
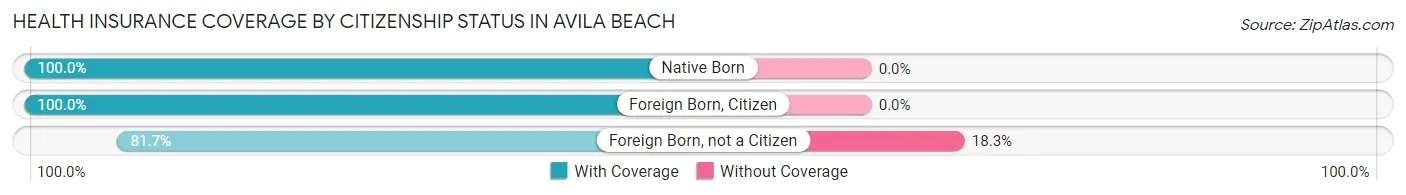
| Citizenship Status | With Coverage | Without Coverage |
| Native Born | 57 (100.0%) | 0 (0.0%) |
| Foreign Born, Citizen | 45 (100.0%) | 0 (0.0%) |
| Foreign Born, not a Citizen | 192 (81.7%) | 43 (18.3%) |
Health Insurance Coverage by Household Income in Avila Beach
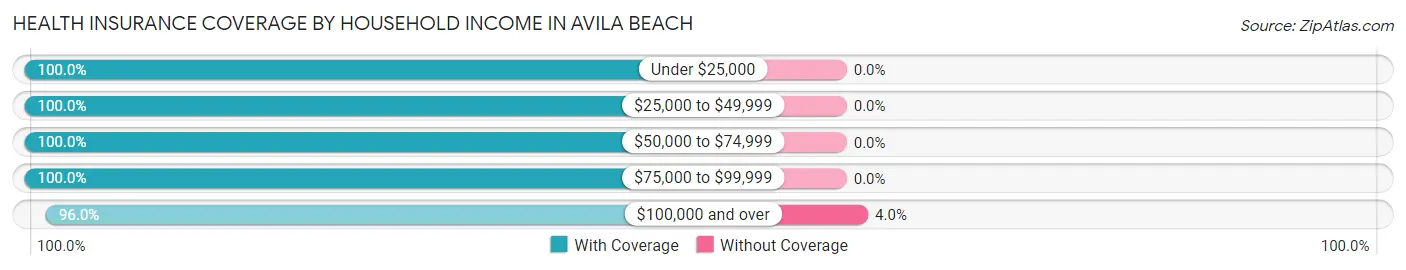
| Household Income | With Coverage | Without Coverage |
| Under $25,000 | 158 (100.0%) | 0 (0.0%) |
| $25,000 to $49,999 | 178 (100.0%) | 0 (0.0%) |
| $50,000 to $74,999 | 71 (100.0%) | 0 (0.0%) |
| $75,000 to $99,999 | 117 (100.0%) | 0 (0.0%) |
| $100,000 and over | 1,032 (96.0%) | 43 (4.0%) |
Public vs Private Health Insurance Coverage by Age in Avila Beach
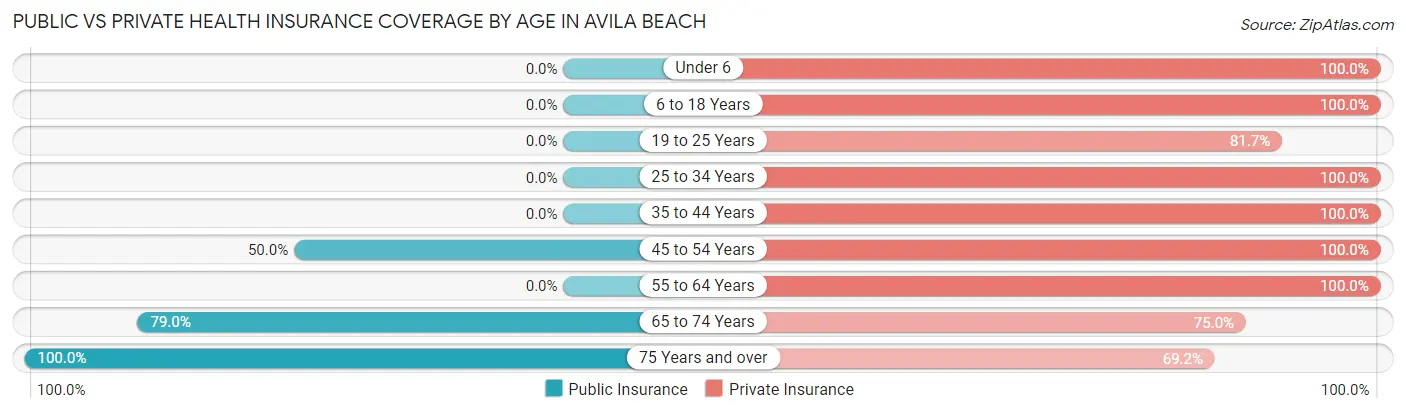
| Age Bracket | Public Insurance | Private Insurance |
| Under 6 | 0 (0.0%) | 57 (100.0%) |
| 6 to 18 Years | 0 (0.0%) | 45 (100.0%) |
| 19 to 25 Years | 0 (0.0%) | 192 (81.7%) |
| 25 to 34 Years | 0 (0.0%) | 67 (100.0%) |
| 35 to 44 Years | 0 (0.0%) | 91 (100.0%) |
| 45 to 54 Years | 29 (50.0%) | 58 (100.0%) |
| 55 to 64 Years | 0 (0.0%) | 514 (100.0%) |
| 65 to 74 Years | 215 (79.0%) | 204 (75.0%) |
| 75 Years and over | 260 (100.0%) | 180 (69.2%) |
| Total | 504 (31.5%) | 1,408 (88.1%) |
Disability Status by Sex by Age in Avila Beach
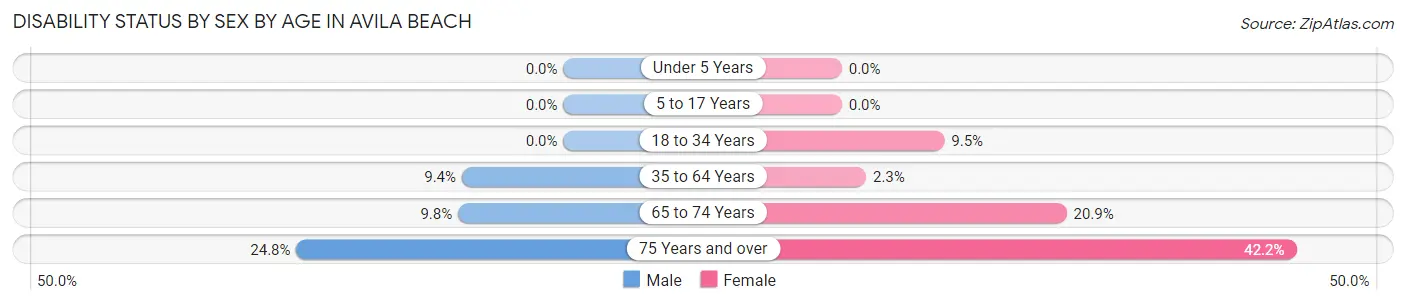
| Age Bracket | Male | Female |
| Under 5 Years | 0 (0.0%) | 0 (0.0%) |
| 5 to 17 Years | 0 (0.0%) | 0 (0.0%) |
| 18 to 34 Years | 0 (0.0%) | 14 (9.5%) |
| 35 to 64 Years | 29 (9.4%) | 8 (2.2%) |
| 65 to 74 Years | 13 (9.8%) | 29 (20.9%) |
| 75 Years and over | 28 (24.8%) | 62 (42.2%) |
Disability Class by Sex by Age in Avila Beach
Disability Class: Hearing Difficulty
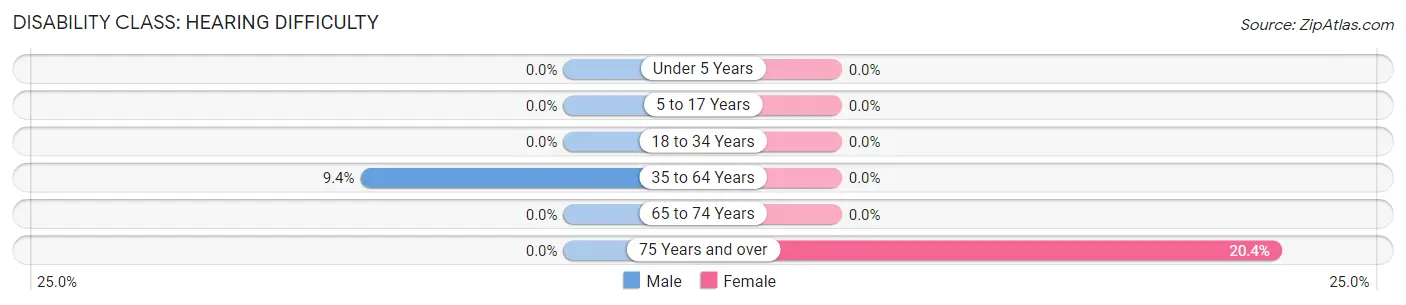
| Age Bracket | Male | Female |
| Under 5 Years | 0 (0.0%) | 0 (0.0%) |
| 5 to 17 Years | 0 (0.0%) | 0 (0.0%) |
| 18 to 34 Years | 0 (0.0%) | 0 (0.0%) |
| 35 to 64 Years | 29 (9.4%) | 0 (0.0%) |
| 65 to 74 Years | 0 (0.0%) | 0 (0.0%) |
| 75 Years and over | 0 (0.0%) | 30 (20.4%) |
Disability Class: Vision Difficulty
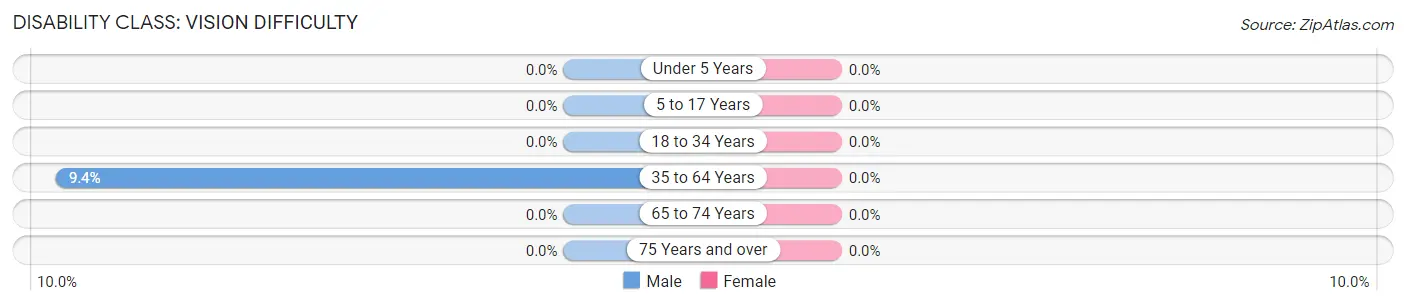
| Age Bracket | Male | Female |
| Under 5 Years | 0 (0.0%) | 0 (0.0%) |
| 5 to 17 Years | 0 (0.0%) | 0 (0.0%) |
| 18 to 34 Years | 0 (0.0%) | 0 (0.0%) |
| 35 to 64 Years | 29 (9.4%) | 0 (0.0%) |
| 65 to 74 Years | 0 (0.0%) | 0 (0.0%) |
| 75 Years and over | 0 (0.0%) | 0 (0.0%) |
Disability Class: Cognitive Difficulty
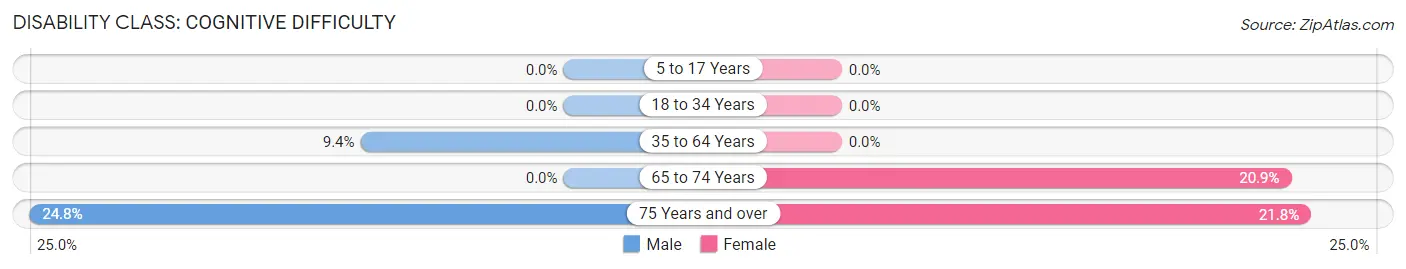
| Age Bracket | Male | Female |
| 5 to 17 Years | 0 (0.0%) | 0 (0.0%) |
| 18 to 34 Years | 0 (0.0%) | 0 (0.0%) |
| 35 to 64 Years | 29 (9.4%) | 0 (0.0%) |
| 65 to 74 Years | 0 (0.0%) | 29 (20.9%) |
| 75 Years and over | 28 (24.8%) | 32 (21.8%) |
Disability Class: Ambulatory Difficulty
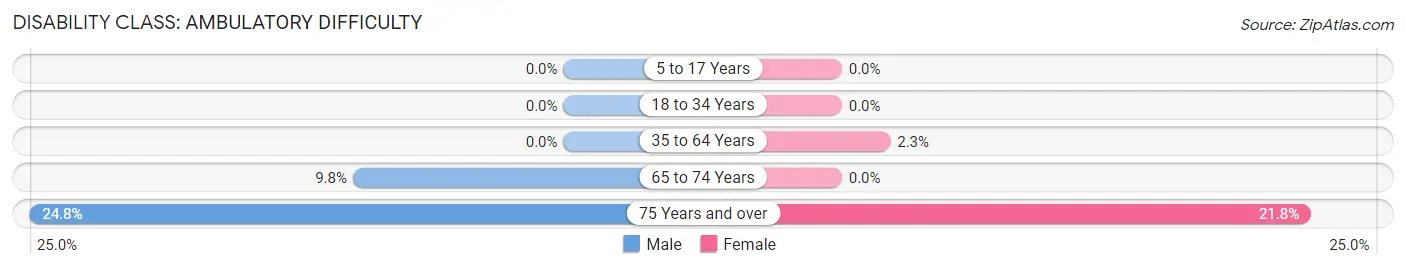
| Age Bracket | Male | Female |
| 5 to 17 Years | 0 (0.0%) | 0 (0.0%) |
| 18 to 34 Years | 0 (0.0%) | 0 (0.0%) |
| 35 to 64 Years | 0 (0.0%) | 8 (2.2%) |
| 65 to 74 Years | 13 (9.8%) | 0 (0.0%) |
| 75 Years and over | 28 (24.8%) | 32 (21.8%) |
Disability Class: Self-Care Difficulty
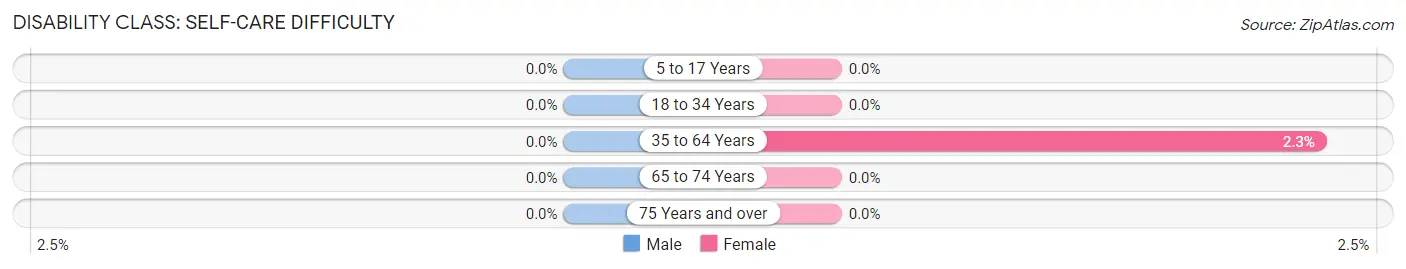
| Age Bracket | Male | Female |
| 5 to 17 Years | 0 (0.0%) | 0 (0.0%) |
| 18 to 34 Years | 0 (0.0%) | 0 (0.0%) |
| 35 to 64 Years | 0 (0.0%) | 8 (2.2%) |
| 65 to 74 Years | 0 (0.0%) | 0 (0.0%) |
| 75 Years and over | 0 (0.0%) | 0 (0.0%) |
Technology Access in Avila Beach
Computing Device Access in Avila Beach
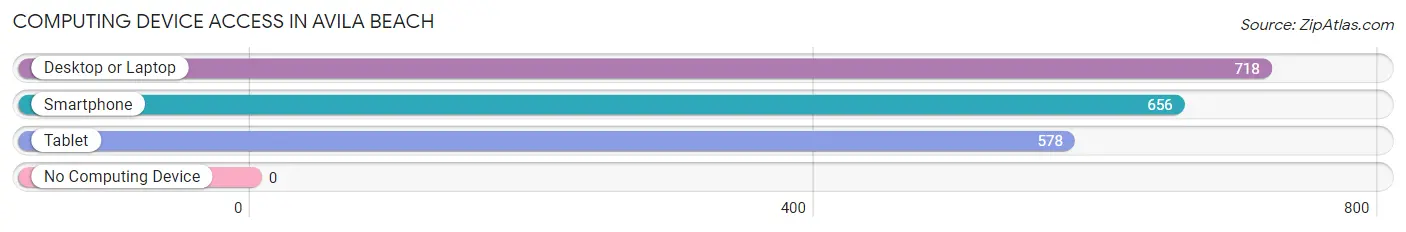
| Device Type | # Households | % Households |
| Desktop or Laptop | 718 | 98.5% |
| Smartphone | 656 | 90.0% |
| Tablet | 578 | 79.3% |
| No Computing Device | 0 | 0.0% |
| Total | 729 | 100.0% |
Internet Access in Avila Beach
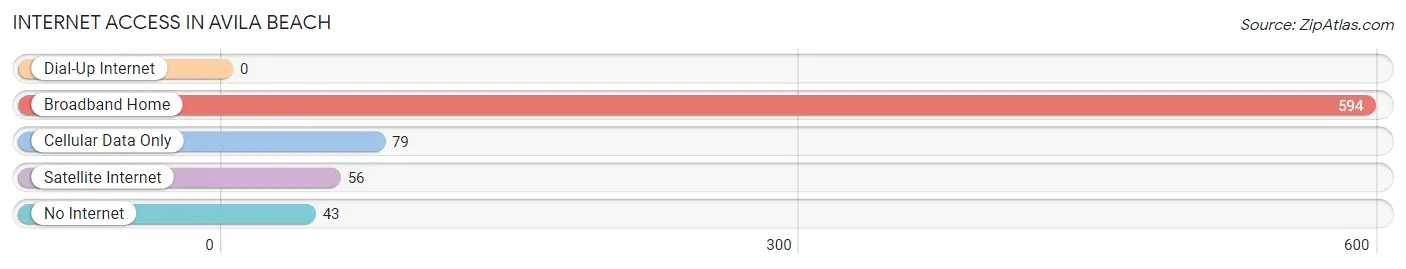
| Internet Type | # Households | % Households |
| Dial-Up Internet | 0 | 0.0% |
| Broadband Home | 594 | 81.5% |
| Cellular Data Only | 79 | 10.8% |
| Satellite Internet | 56 | 7.7% |
| No Internet | 43 | 5.9% |
| Total | 729 | 100.0% |
Avila Beach Summary
Avila Beach is a small coastal town located in San Luis Obispo County, California. It is situated on the Pacific Coast, approximately halfway between Los Angeles and San Francisco. The town is known for its beautiful beaches, stunning views, and laid-back atmosphere. Avila Beach is a popular destination for tourists and locals alike, offering a variety of activities and attractions.
History
The area now known as Avila Beach has been inhabited for thousands of years. The Chumash people were the first to settle in the area, and they lived in the area for centuries before the arrival of Europeans. The first Europeans to settle in the area were Spanish missionaries, who established a mission in the area in 1772. The mission was abandoned in 1834, and the area was later settled by ranchers and farmers.
In the late 19th century, the area began to attract tourists, and the first hotel was built in 1887. The town was officially founded in 1908, and the name “Avila” was chosen in honor of Miguel Avila, a local rancher. The town grew steadily throughout the 20th century, and by the 1950s it had become a popular tourist destination.
Geography
Avila Beach is located on the Pacific Coast, approximately halfway between Los Angeles and San Francisco. The town is situated on a small peninsula, surrounded by the Pacific Ocean to the west and San Luis Bay to the east. The town is located at an elevation of approximately 30 feet above sea level.
The climate in Avila Beach is mild and temperate, with average temperatures ranging from the mid-50s to the mid-70s. The area receives an average of 18 inches of rain per year, and the area is known for its sunny days and cool nights.
Economy
The economy of Avila Beach is largely based on tourism. The town is a popular destination for beachgoers, and it is also home to a variety of restaurants, shops, and other businesses. The town is also home to a number of wineries, and it is a popular destination for wine tasting.
The town is also home to a number of industries, including fishing, boat building, and agriculture. The area is also home to a number of technology companies, and it is a popular destination for tech workers.
Demographics
As of the 2010 census, the population of Avila Beach was 1,919. The population is predominantly white (90.2%), with smaller percentages of Hispanic (4.2%), Asian (2.2%), and African American (1.2%) residents. The median household income in the town is $63,917, and the median age is 44.
Conclusion
Avila Beach is a small coastal town located in San Luis Obispo County, California. It is known for its beautiful beaches, stunning views, and laid-back atmosphere. The town has a long history, and it has been a popular destination for tourists and locals alike for centuries. The economy of Avila Beach is largely based on tourism, and the town is also home to a number of industries. The population of Avila Beach is predominantly white, with smaller percentages of Hispanic, Asian, and African American residents.
Common Questions
What is Per Capita Income in Avila Beach?
Per Capita income in Avila Beach is $109,827.
What is the Median Family Income in Avila Beach?
Median Family Income in Avila Beach is $178,125.
What is Inequality or Gini Index in Avila Beach?
Inequality or Gini Index in Avila Beach is 0.57.
What is the Total Population of Avila Beach?
Total Population of Avila Beach is 1,599.
What is the Total Male Population of Avila Beach?
Total Male Population of Avila Beach is 766.
What is the Total Female Population of Avila Beach?
Total Female Population of Avila Beach is 833.
What is the Ratio of Males per 100 Females in Avila Beach?
There are 91.96 Males per 100 Females in Avila Beach.
What is the Ratio of Females per 100 Males in Avila Beach?
There are 108.75 Females per 100 Males in Avila Beach.
What is the Median Population Age in Avila Beach?
Median Population Age in Avila Beach is 57.9 Years.
What is the Average Family Size in Avila Beach
Average Family Size in Avila Beach is 2.6 People.
What is the Average Household Size in Avila Beach
Average Household Size in Avila Beach is 2.2 People.
How Large is the Labor Force in Avila Beach?
There are 612 People in the Labor Forcein in Avila Beach.
What is the Percentage of People in the Labor Force in Avila Beach?
40.9% of People are in the Labor Force in Avila Beach.