Lusby, MD Map & Demographics
Lusby Map
Lusby Overview
$50,075
PER CAPITA INCOME
$126,087
AVG FAMILY INCOME
$109,861
AVG HOUSEHOLD INCOME
11.3%
WAGE / INCOME GAP [ % ]
88.7¢/ $1
WAGE / INCOME GAP [ $ ]
0.41
INEQUALITY / GINI INDEX
2,350
TOTAL POPULATION
1,434
MALE POPULATION
916
FEMALE POPULATION
156.55
MALES / 100 FEMALES
63.88
FEMALES / 100 MALES
32.3
MEDIAN AGE
3.0
AVG FAMILY SIZE
2.3
AVG HOUSEHOLD SIZE
1,483
LABOR FORCE [ PEOPLE ]
73.8%
PERCENT IN LABOR FORCE
3.1%
UNEMPLOYMENT RATE
Lusby Zip Codes
Lusby Area Codes
Income in Lusby
Income Overview in Lusby
Per Capita Income in Lusby is $50,075, while median incomes of families and households are $126,087 and $109,861 respectively.
| Characteristic | Number | Measure |
| Per Capita Income | 2,350 | $50,075 |
| Median Family Income | 530 | $126,087 |
| Mean Family Income | 530 | $152,932 |
| Median Household Income | 1,017 | $109,861 |
| Mean Household Income | 1,017 | $118,618 |
| Income Deficit | 530 | $0 |
| Wage / Income Gap (%) | 2,350 | 11.32% |
| Wage / Income Gap ($) | 2,350 | 88.68¢ per $1 |
| Gini / Inequality Index | 2,350 | 0.41 |
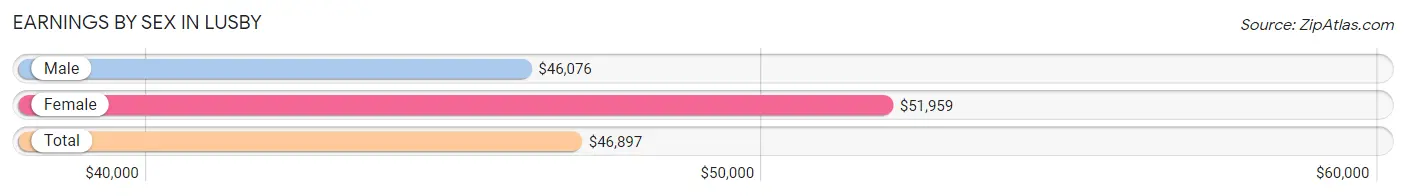
Earnings by Sex in Lusby
Average Earnings in Lusby are $46,897, $46,076 for men and $51,959 for women, a difference of 11.3%.
| Sex | Number | Average Earnings |
| Male | 1,076 (70.6%) | $46,076 |
| Female | 449 (29.4%) | $51,959 |
| Total | 1,525 (100.0%) | $46,897 |
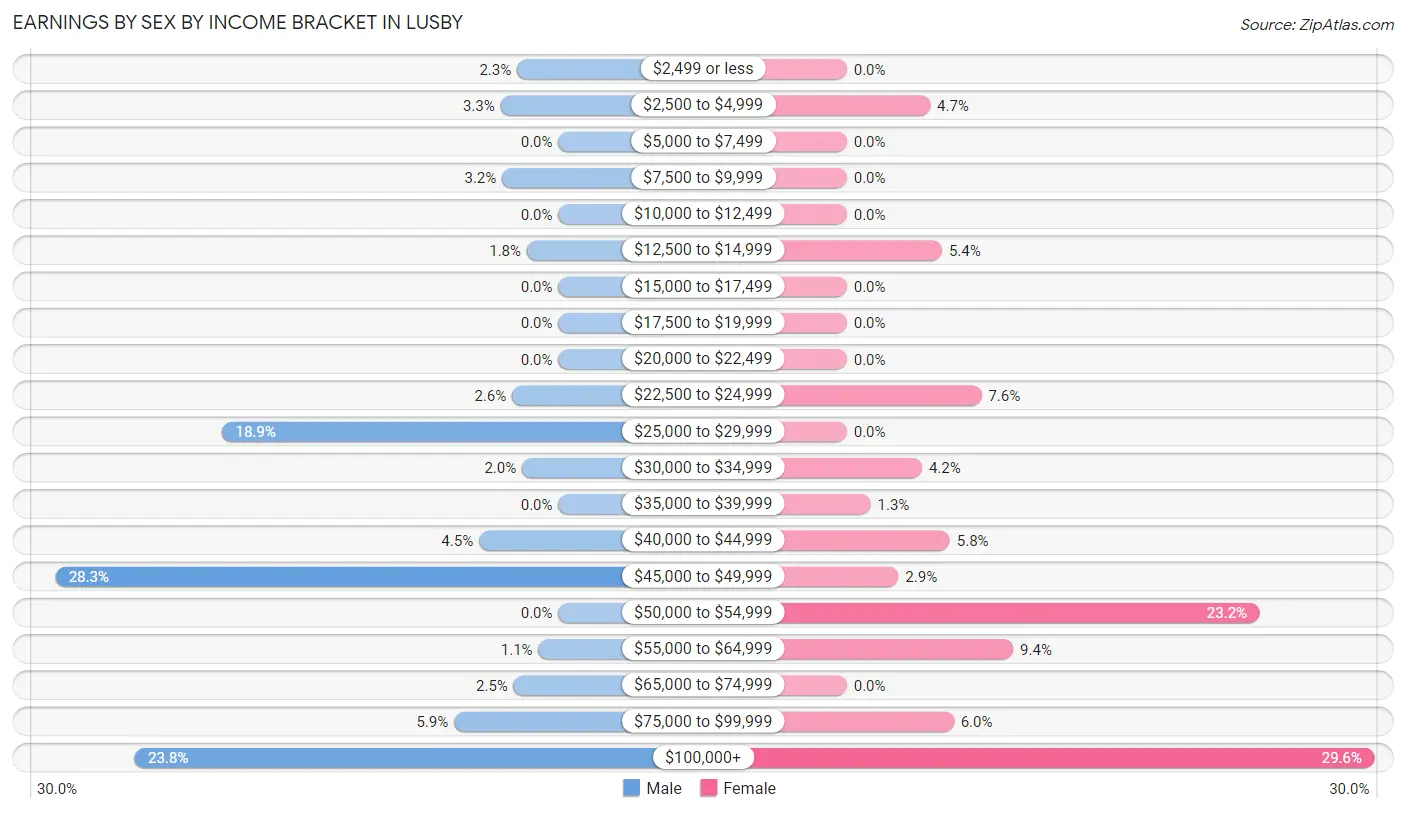
Earnings by Sex by Income Bracket in Lusby
The most common earnings brackets in Lusby are $45,000 to $49,999 for men (304 | 28.2%) and $100,000+ for women (133 | 29.6%).
| Income | Male | Female |
| $2,499 or less | 25 (2.3%) | 0 (0.0%) |
| $2,500 to $4,999 | 35 (3.3%) | 21 (4.7%) |
| $5,000 to $7,499 | 0 (0.0%) | 0 (0.0%) |
| $7,500 to $9,999 | 34 (3.2%) | 0 (0.0%) |
| $10,000 to $12,499 | 0 (0.0%) | 0 (0.0%) |
| $12,500 to $14,999 | 19 (1.8%) | 24 (5.3%) |
| $15,000 to $17,499 | 0 (0.0%) | 0 (0.0%) |
| $17,500 to $19,999 | 0 (0.0%) | 0 (0.0%) |
| $20,000 to $22,499 | 0 (0.0%) | 0 (0.0%) |
| $22,500 to $24,999 | 28 (2.6%) | 34 (7.6%) |
| $25,000 to $29,999 | 203 (18.9%) | 0 (0.0%) |
| $30,000 to $34,999 | 22 (2.0%) | 19 (4.2%) |
| $35,000 to $39,999 | 0 (0.0%) | 6 (1.3%) |
| $40,000 to $44,999 | 48 (4.5%) | 26 (5.8%) |
| $45,000 to $49,999 | 304 (28.2%) | 13 (2.9%) |
| $50,000 to $54,999 | 0 (0.0%) | 104 (23.2%) |
| $55,000 to $64,999 | 12 (1.1%) | 42 (9.3%) |
| $65,000 to $74,999 | 27 (2.5%) | 0 (0.0%) |
| $75,000 to $99,999 | 63 (5.9%) | 27 (6.0%) |
| $100,000+ | 256 (23.8%) | 133 (29.6%) |
| Total | 1,076 (100.0%) | 449 (100.0%) |
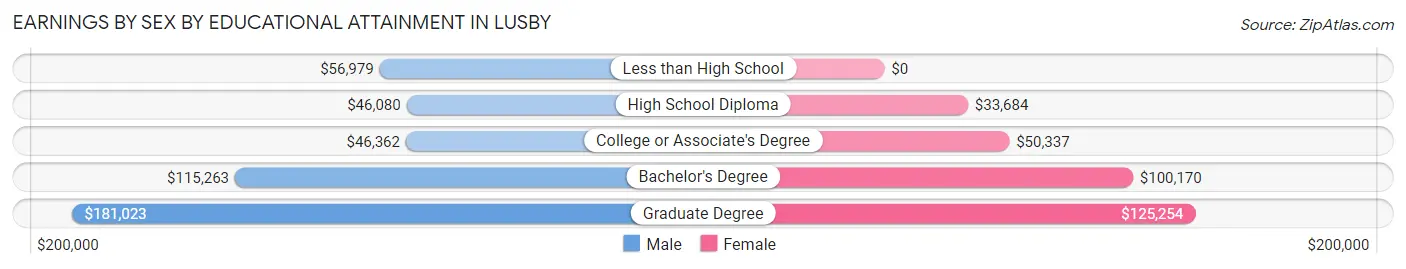
Earnings by Sex by Educational Attainment in Lusby
Average earnings in Lusby are $46,905 for men and $52,212 for women, a difference of 10.2%. Men with an educational attainment of graduate degree enjoy the highest average annual earnings of $181,023, while those with high school diploma education earn the least with $46,080. Women with an educational attainment of graduate degree earn the most with the average annual earnings of $125,254, while those with high school diploma education have the smallest earnings of $33,684.
| Educational Attainment | Male Income | Female Income |
| Less than High School | $56,979 | $0 |
| High School Diploma | $46,080 | $33,684 |
| College or Associate's Degree | $46,362 | $50,337 |
| Bachelor's Degree | $115,263 | $100,170 |
| Graduate Degree | $181,023 | $125,254 |
| Total | $46,905 | $52,212 |
Family Income in Lusby
Family Income Brackets in Lusby
According to the Lusby family income data, there are 137 families falling into the $200,000+ income range, which is the most common income bracket and makes up 25.9% of all families.
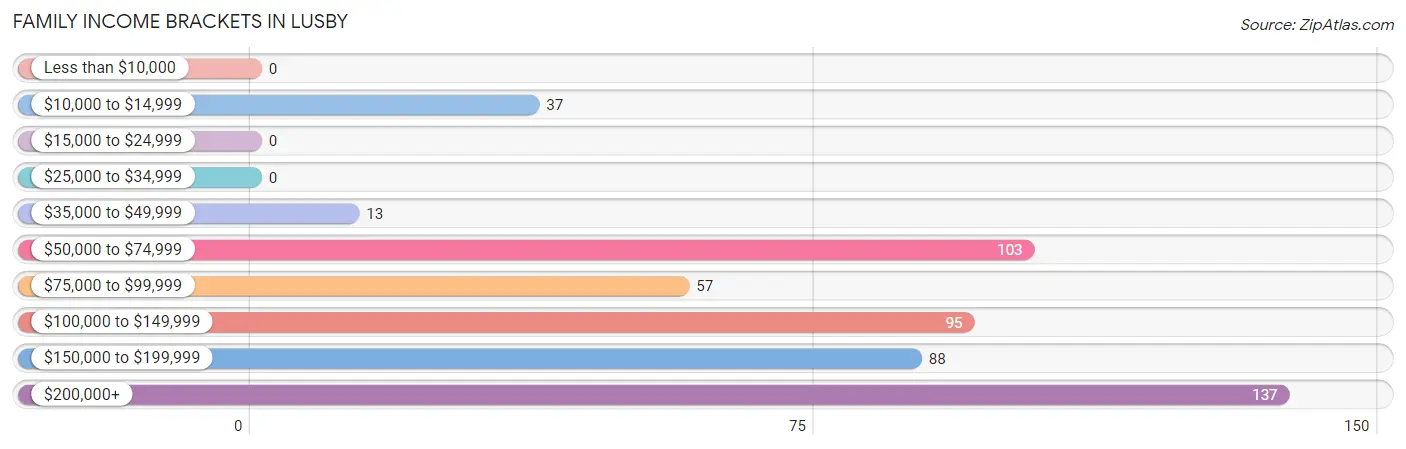
| Income Bracket | # Families | % Families |
| Less than $10,000 | 0 | 0.0% |
| $10,000 to $14,999 | 37 | 7.0% |
| $15,000 to $24,999 | 0 | 0.0% |
| $25,000 to $34,999 | 0 | 0.0% |
| $35,000 to $49,999 | 13 | 2.5% |
| $50,000 to $74,999 | 103 | 19.4% |
| $75,000 to $99,999 | 57 | 10.8% |
| $100,000 to $149,999 | 95 | 17.9% |
| $150,000 to $199,999 | 88 | 16.6% |
| $200,000+ | 137 | 25.8% |
Family Income by Famaliy Size in Lusby
4-person families (87 | 16.4%) account for the highest median family income in Lusby with $250,001 per family, while 4-person families (87 | 16.4%) have the highest median income of $62,500 per family member.
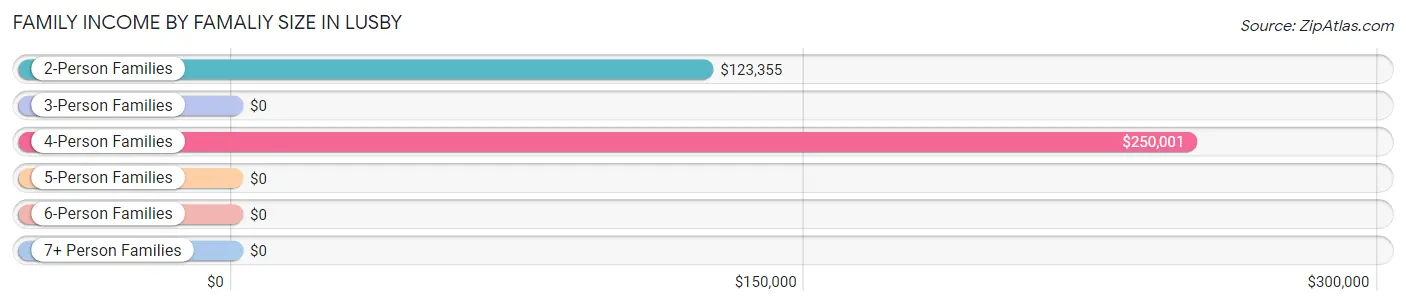
| Income Bracket | # Families | Median Income |
| 2-Person Families | 323 (60.9%) | $123,355 |
| 3-Person Families | 41 (7.7%) | $0 |
| 4-Person Families | 87 (16.4%) | $250,001 |
| 5-Person Families | 38 (7.2%) | $0 |
| 6-Person Families | 41 (7.7%) | $0 |
| 7+ Person Families | 0 (0.0%) | $0 |
| Total | 530 (100.0%) | $126,087 |
Family Income by Number of Earners in Lusby
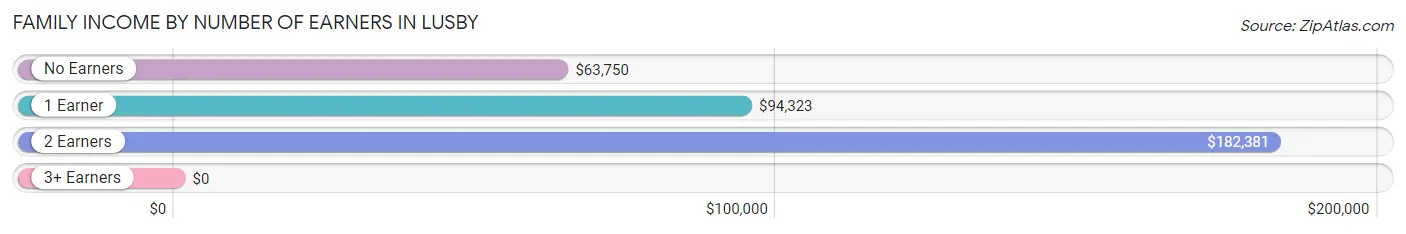
| Number of Earners | # Families | Median Income |
| No Earners | 103 (19.4%) | $63,750 |
| 1 Earner | 113 (21.3%) | $94,323 |
| 2 Earners | 254 (47.9%) | $182,381 |
| 3+ Earners | 60 (11.3%) | $0 |
| Total | 530 (100.0%) | $126,087 |
Household Income in Lusby
Household Income Brackets in Lusby
With 293 households falling in the category, the $100,000 to $149,999 income range is the most frequent in Lusby, accounting for 28.8% of all households.
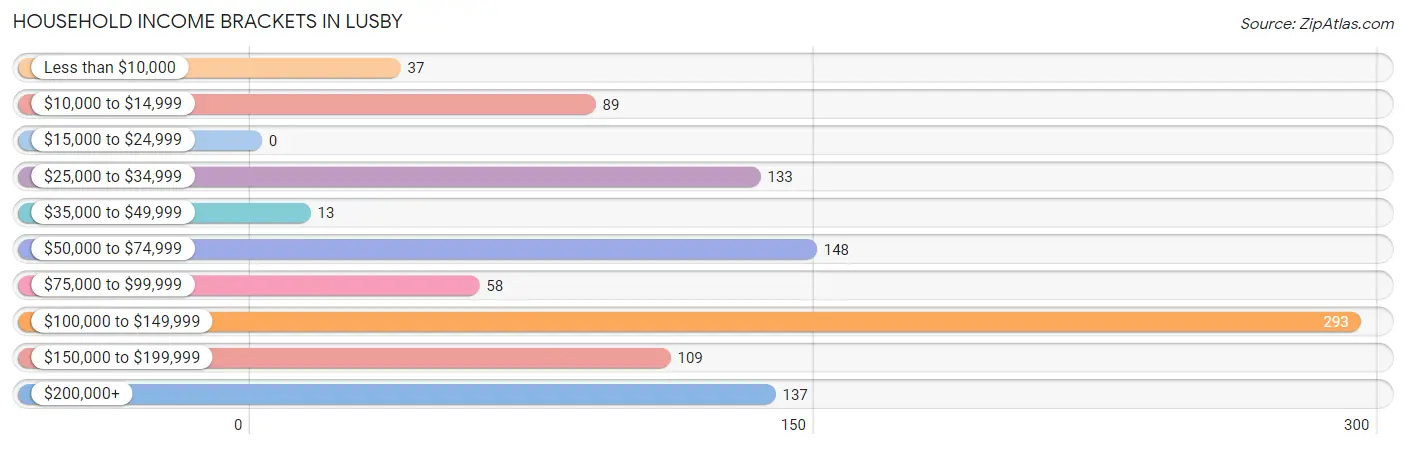
| Income Bracket | # Households | % Households |
| Less than $10,000 | 37 | 3.6% |
| $10,000 to $14,999 | 89 | 8.8% |
| $15,000 to $24,999 | 0 | 0.0% |
| $25,000 to $34,999 | 133 | 13.1% |
| $35,000 to $49,999 | 13 | 1.3% |
| $50,000 to $74,999 | 148 | 14.6% |
| $75,000 to $99,999 | 58 | 5.7% |
| $100,000 to $149,999 | 293 | 28.8% |
| $150,000 to $199,999 | 109 | 10.7% |
| $200,000+ | 137 | 13.5% |
Household Income by Householder Age in Lusby
The median household income in Lusby is $109,861, with the highest median household income of $146,250 found in the 45 to 64 years age bracket for the primary householder. A total of 293 households (28.8%) fall into this category. Meanwhile, the 15 to 24 years age bracket for the primary householder has the lowest median household income of $0, with 97 households (9.5%) in this group.
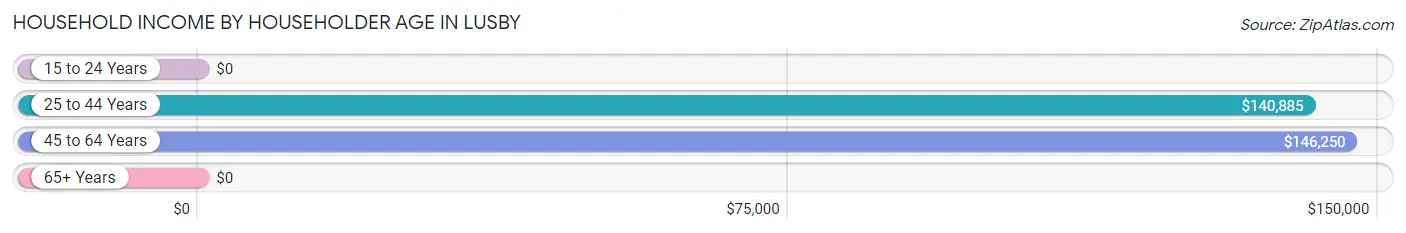
| Income Bracket | # Households | Median Income |
| 15 to 24 Years | 97 (9.5%) | $0 |
| 25 to 44 Years | 387 (38.1%) | $140,885 |
| 45 to 64 Years | 293 (28.8%) | $146,250 |
| 65+ Years | 240 (23.6%) | $0 |
| Total | 1,017 (100.0%) | $109,861 |
Poverty in Lusby
Income Below Poverty by Sex and Age in Lusby
With 8.8% poverty level for males and 7.9% for females among the residents of Lusby, 65 to 74 year old males and 65 to 74 year old females are the most vulnerable to poverty, with 56 males (41.2%) and 37 females (31.4%) in their respective age groups living below the poverty level.
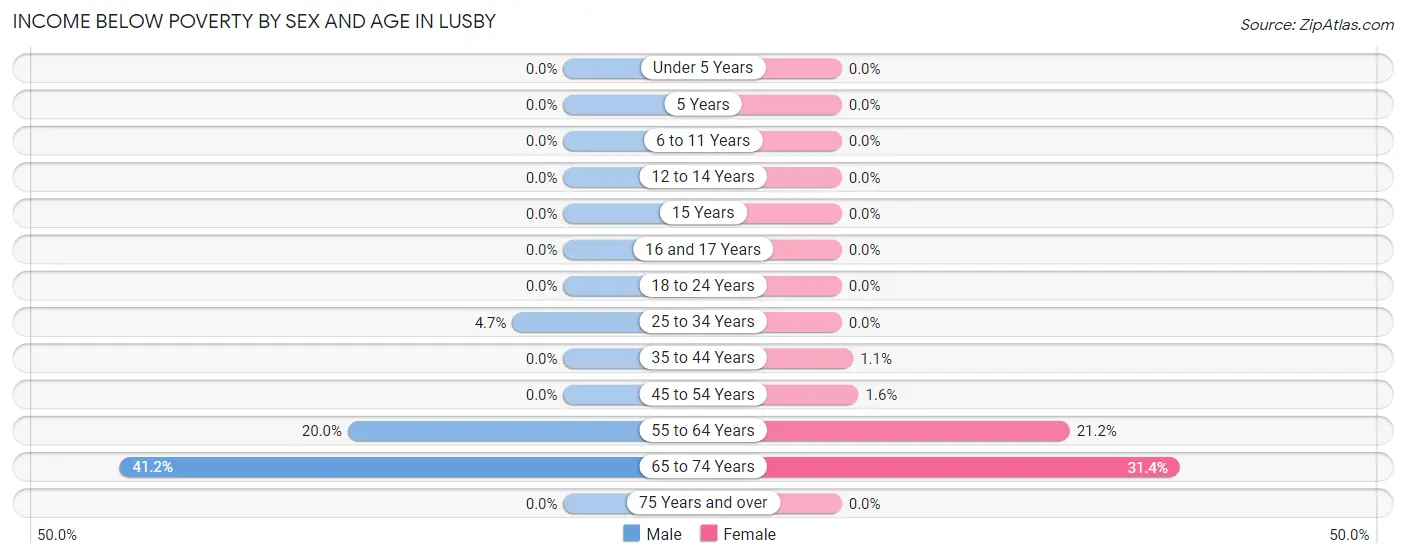
| Age Bracket | Male | Female |
| Under 5 Years | 0 (0.0%) | 0 (0.0%) |
| 5 Years | 0 (0.0%) | 0 (0.0%) |
| 6 to 11 Years | 0 (0.0%) | 0 (0.0%) |
| 12 to 14 Years | 0 (0.0%) | 0 (0.0%) |
| 15 Years | 0 (0.0%) | 0 (0.0%) |
| 16 and 17 Years | 0 (0.0%) | 0 (0.0%) |
| 18 to 24 Years | 0 (0.0%) | 0 (0.0%) |
| 25 to 34 Years | 23 (4.7%) | 0 (0.0%) |
| 35 to 44 Years | 0 (0.0%) | 1 (1.1%) |
| 45 to 54 Years | 0 (0.0%) | 1 (1.6%) |
| 55 to 64 Years | 47 (20.0%) | 33 (21.1%) |
| 65 to 74 Years | 56 (41.2%) | 37 (31.4%) |
| 75 Years and over | 0 (0.0%) | 0 (0.0%) |
| Total | 126 (8.8%) | 72 (7.9%) |
Income Above Poverty by Sex and Age in Lusby
According to the poverty statistics in Lusby, males aged under 5 years and females aged under 5 years are the age groups that are most secure financially, with 100.0% of males and 100.0% of females in these age groups living above the poverty line.
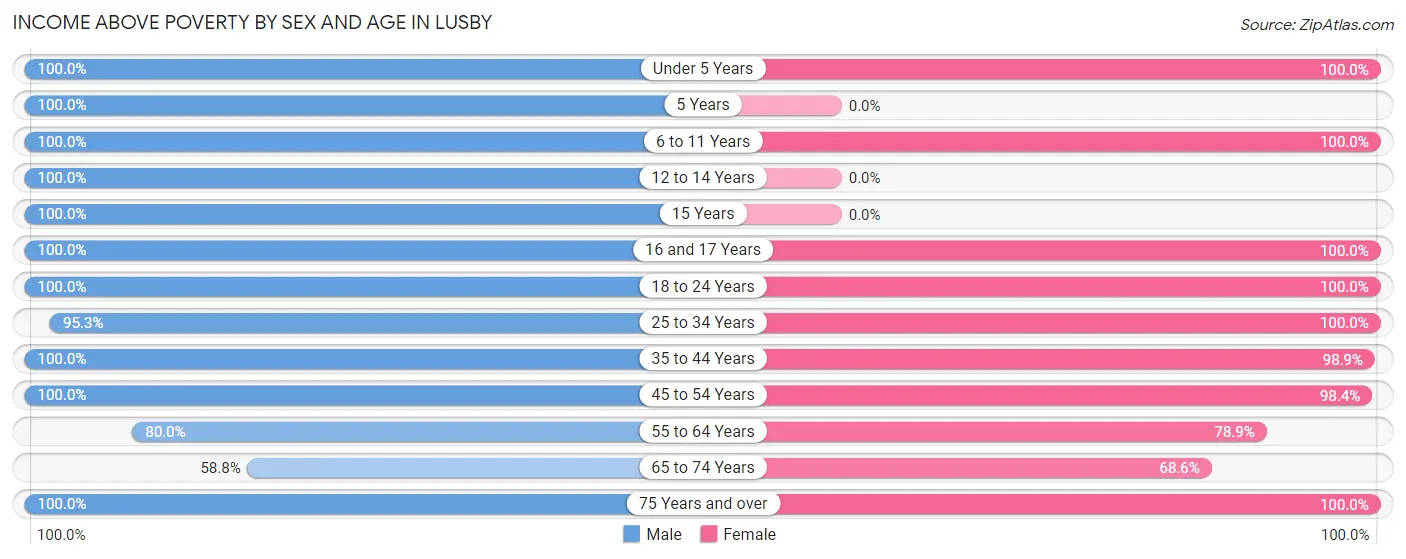
| Age Bracket | Male | Female |
| Under 5 Years | 24 (100.0%) | 84 (100.0%) |
| 5 Years | 26 (100.0%) | 0 (0.0%) |
| 6 to 11 Years | 97 (100.0%) | 64 (100.0%) |
| 12 to 14 Years | 39 (100.0%) | 0 (0.0%) |
| 15 Years | 7 (100.0%) | 0 (0.0%) |
| 16 and 17 Years | 23 (100.0%) | 29 (100.0%) |
| 18 to 24 Years | 168 (100.0%) | 24 (100.0%) |
| 25 to 34 Years | 462 (95.3%) | 211 (100.0%) |
| 35 to 44 Years | 115 (100.0%) | 93 (98.9%) |
| 45 to 54 Years | 38 (100.0%) | 63 (98.4%) |
| 55 to 64 Years | 188 (80.0%) | 123 (78.8%) |
| 65 to 74 Years | 80 (58.8%) | 81 (68.6%) |
| 75 Years and over | 41 (100.0%) | 72 (100.0%) |
| Total | 1,308 (91.2%) | 844 (92.1%) |
Income Below Poverty Among Married-Couple Families in Lusby
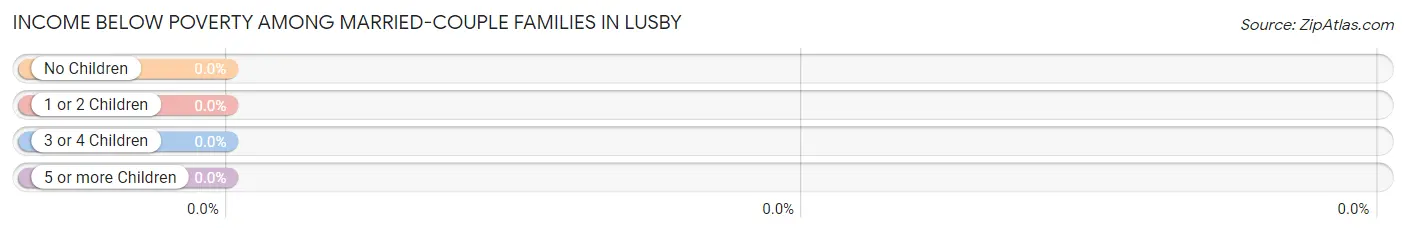
| Children | Above Poverty | Below Poverty |
| No Children | 205 (100.0%) | 0 (0.0%) |
| 1 or 2 Children | 103 (100.0%) | 0 (0.0%) |
| 3 or 4 Children | 79 (100.0%) | 0 (0.0%) |
| 5 or more Children | 0 (0.0%) | 0 (0.0%) |
| Total | 387 (100.0%) | 0 (0.0%) |
Income Below Poverty Among Single-Parent Households in Lusby
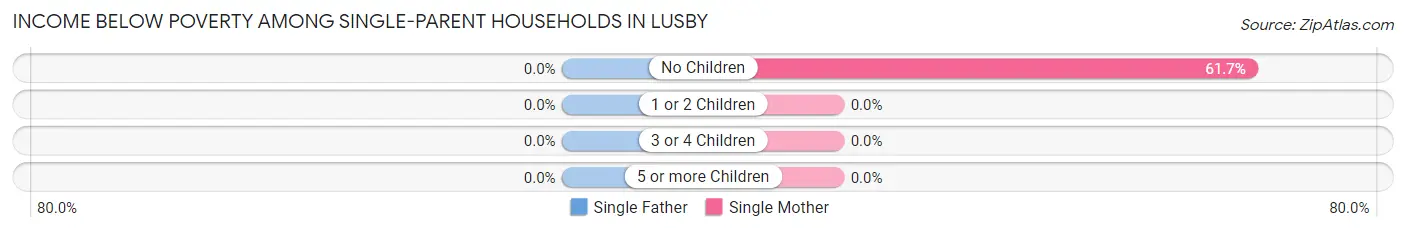
| Children | Single Father | Single Mother |
| No Children | 0 (0.0%) | 37 (61.7%) |
| 1 or 2 Children | 0 (0.0%) | 0 (0.0%) |
| 3 or 4 Children | 0 (0.0%) | 0 (0.0%) |
| 5 or more Children | 0 (0.0%) | 0 (0.0%) |
| Total | 0 (0.0%) | 37 (50.7%) |
Income Below Poverty Among Married-Couple vs Single-Parent Households in Lusby
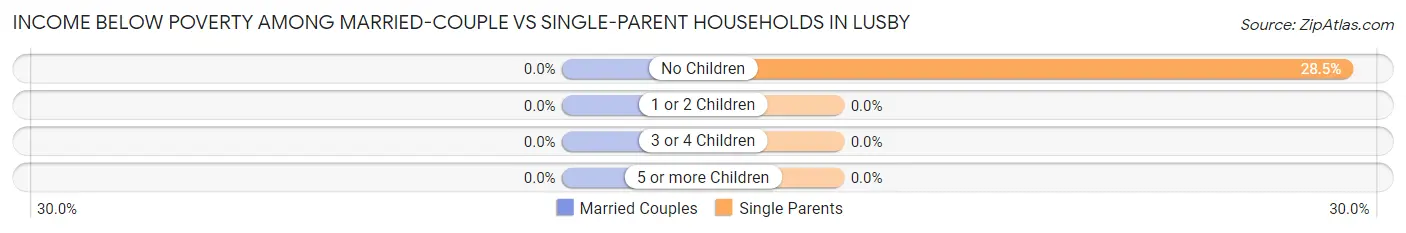
| Children | Married-Couple Families | Single-Parent Households |
| No Children | 0 (0.0%) | 37 (28.5%) |
| 1 or 2 Children | 0 (0.0%) | 0 (0.0%) |
| 3 or 4 Children | 0 (0.0%) | 0 (0.0%) |
| 5 or more Children | 0 (0.0%) | 0 (0.0%) |
| Total | 0 (0.0%) | 37 (25.9%) |
Race in Lusby
The most populous races in Lusby are White / Caucasian (1,934 | 82.3%), Black / African American (376 | 16.0%), and Hispanic or Latino (41 | 1.7%).
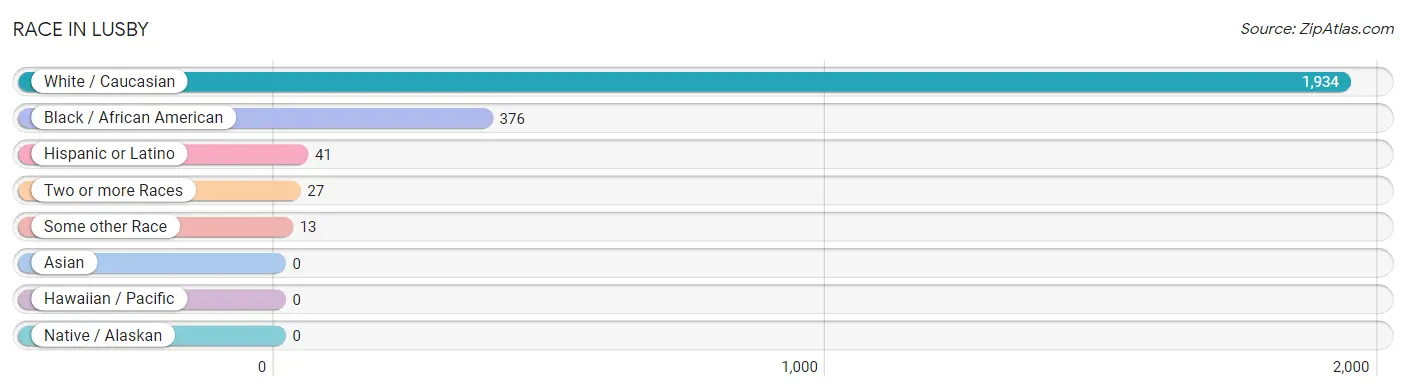
| Race | # Population | % Population |
| Asian | 0 | 0.0% |
| Black / African American | 376 | 16.0% |
| Hawaiian / Pacific | 0 | 0.0% |
| Hispanic or Latino | 41 | 1.7% |
| Native / Alaskan | 0 | 0.0% |
| White / Caucasian | 1,934 | 82.3% |
| Two or more Races | 27 | 1.1% |
| Some other Race | 13 | 0.5% |
| Total | 2,350 | 100.0% |
Ancestry in Lusby
The most populous ancestries reported in Lusby are Irish (398 | 16.9%), German (348 | 14.8%), English (161 | 6.9%), French (125 | 5.3%), and Italian (121 | 5.1%), together accounting for 49.1% of all Lusby residents.
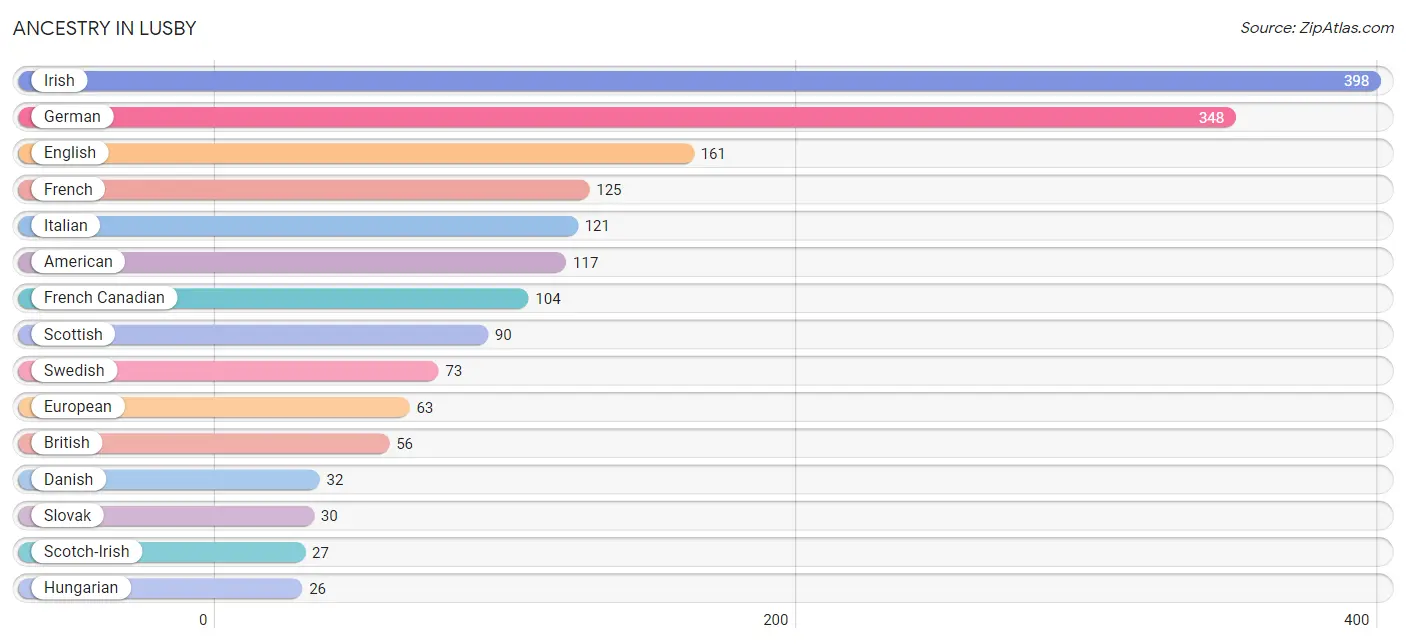
| Ancestry | # Population | % Population |
| African | 1 | 0.0% |
| American | 117 | 5.0% |
| British | 56 | 2.4% |
| Colombian | 23 | 1.0% |
| Danish | 32 | 1.4% |
| Dutch | 9 | 0.4% |
| English | 161 | 6.9% |
| European | 63 | 2.7% |
| French | 125 | 5.3% |
| French Canadian | 104 | 4.4% |
| German | 348 | 14.8% |
| Hungarian | 26 | 1.1% |
| Irish | 398 | 16.9% |
| Italian | 121 | 5.1% |
| Russian | 23 | 1.0% |
| Scotch-Irish | 27 | 1.1% |
| Scottish | 90 | 3.8% |
| Slovak | 30 | 1.3% |
| South American | 23 | 1.0% |
| Spanish | 18 | 0.8% |
| Subsaharan African | 1 | 0.0% |
| Swedish | 73 | 3.1% |
| Swiss | 16 | 0.7% | View All 23 Rows |
Immigrants in Lusby
The most numerous immigrant groups reported in Lusby came from Europe (46 | 2.0%), Eastern Europe (23 | 1.0%), Northern Europe (23 | 1.0%), Russia (23 | 1.0%), and Sweden (23 | 1.0%), together accounting for 5.9% of all Lusby residents.
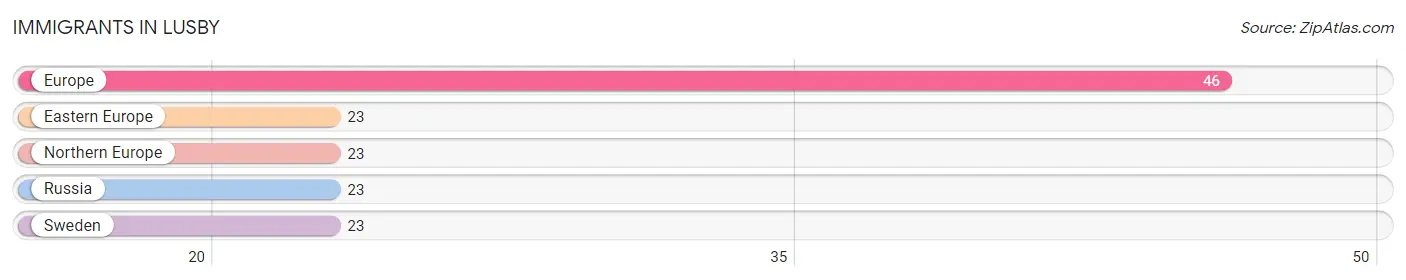
| Immigration Origin | # Population | % Population |
| Eastern Europe | 23 | 1.0% |
| Europe | 46 | 2.0% |
| Northern Europe | 23 | 1.0% |
| Russia | 23 | 1.0% |
| Sweden | 23 | 1.0% | View All 5 Rows |
Sex and Age in Lusby
Sex and Age in Lusby
The most populous age groups in Lusby are 30 to 34 Years (258 | 18.0%) for men and 25 to 29 Years (130 | 14.2%) for women.
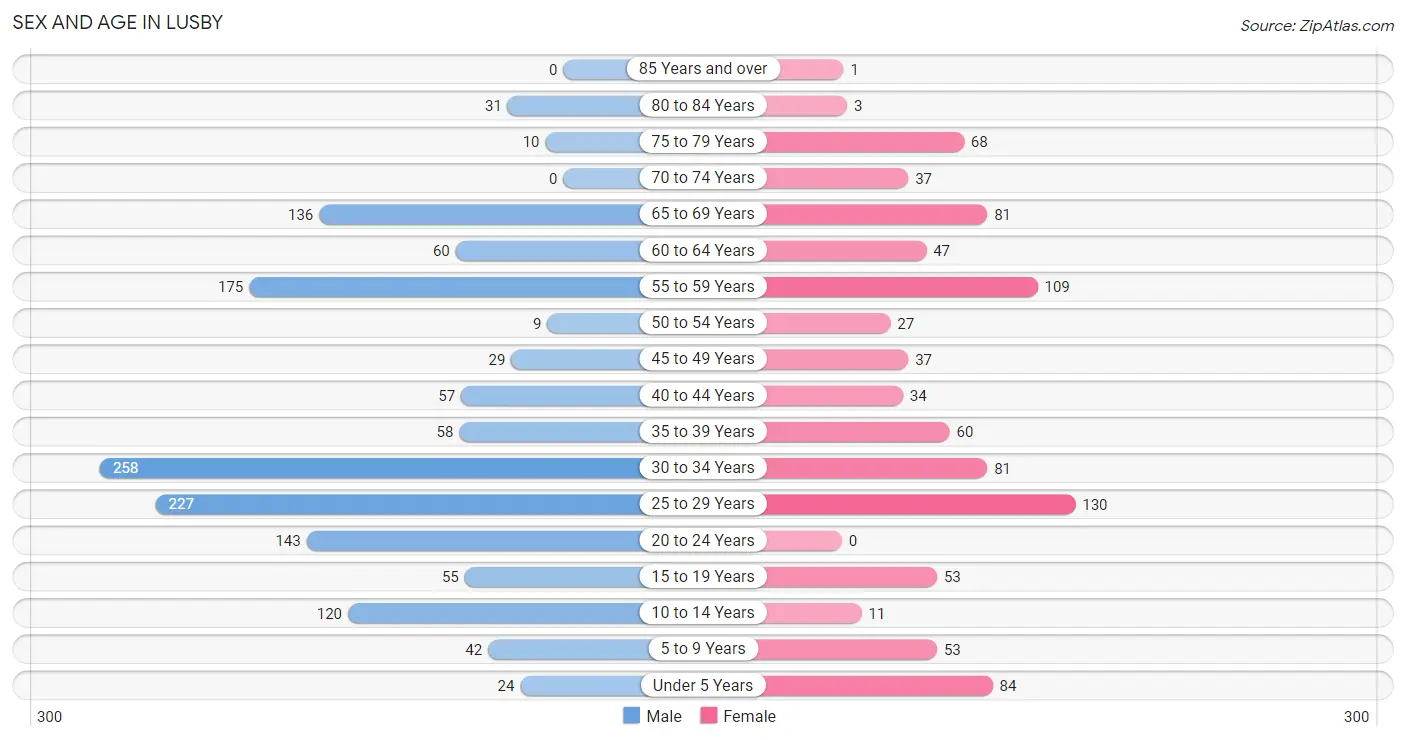
| Age Bracket | Male | Female |
| Under 5 Years | 24 (1.7%) | 84 (9.2%) |
| 5 to 9 Years | 42 (2.9%) | 53 (5.8%) |
| 10 to 14 Years | 120 (8.4%) | 11 (1.2%) |
| 15 to 19 Years | 55 (3.8%) | 53 (5.8%) |
| 20 to 24 Years | 143 (10.0%) | 0 (0.0%) |
| 25 to 29 Years | 227 (15.8%) | 130 (14.2%) |
| 30 to 34 Years | 258 (18.0%) | 81 (8.8%) |
| 35 to 39 Years | 58 (4.0%) | 60 (6.6%) |
| 40 to 44 Years | 57 (4.0%) | 34 (3.7%) |
| 45 to 49 Years | 29 (2.0%) | 37 (4.0%) |
| 50 to 54 Years | 9 (0.6%) | 27 (2.9%) |
| 55 to 59 Years | 175 (12.2%) | 109 (11.9%) |
| 60 to 64 Years | 60 (4.2%) | 47 (5.1%) |
| 65 to 69 Years | 136 (9.5%) | 81 (8.8%) |
| 70 to 74 Years | 0 (0.0%) | 37 (4.0%) |
| 75 to 79 Years | 10 (0.7%) | 68 (7.4%) |
| 80 to 84 Years | 31 (2.2%) | 3 (0.3%) |
| 85 Years and over | 0 (0.0%) | 1 (0.1%) |
| Total | 1,434 (100.0%) | 916 (100.0%) |
Families and Households in Lusby
Median Family Size in Lusby
The median family size in Lusby is 2.95 persons per family, with married-couple families (387 | 73.0%) accounting for the largest median family size of 3.11 persons per family. On the other hand, single female/mother families (73 | 13.8%) represent the smallest median family size with 2.26 persons per family.
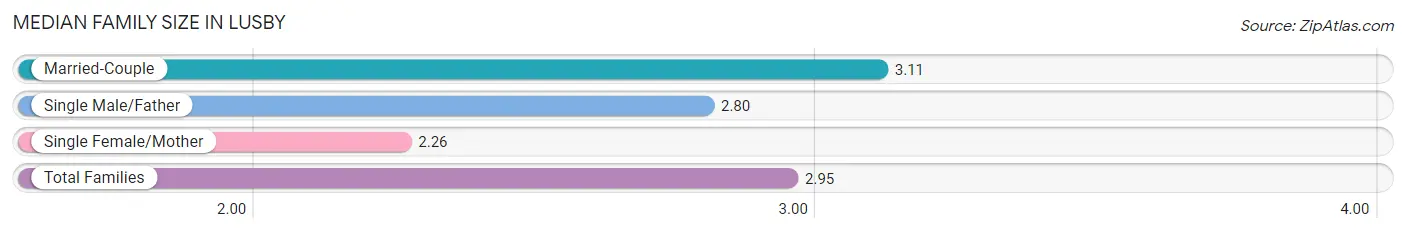
| Family Type | # Families | Family Size |
| Married-Couple | 387 (73.0%) | 3.11 |
| Single Male/Father | 70 (13.2%) | 2.80 |
| Single Female/Mother | 73 (13.8%) | 2.26 |
| Total Families | 530 (100.0%) | 2.95 |
Median Household Size in Lusby
The median household size in Lusby is 2.31 persons per household, with married-couple households (387 | 38.1%) accounting for the largest median household size of 3.11 persons per household. non-family households (487 | 47.9%) represent the smallest median household size with 1.56 persons per household.
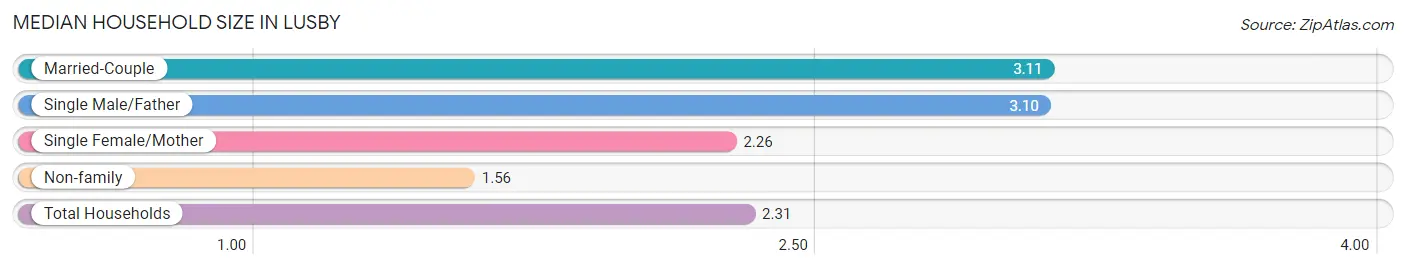
| Household Type | # Households | Household Size |
| Married-Couple | 387 (38.1%) | 3.11 |
| Single Male/Father | 70 (6.9%) | 3.10 |
| Single Female/Mother | 73 (7.2%) | 2.26 |
| Non-family | 487 (47.9%) | 1.56 |
| Total Households | 1,017 (100.0%) | 2.31 |
Household Size by Marriage Status in Lusby
Out of a total of 1,017 households in Lusby, 530 (52.1%) are family households, while 487 (47.9%) are nonfamily households. The most numerous type of family households are 2-person households, comprising 323, and the most common type of nonfamily households are 1-person households, comprising 266.
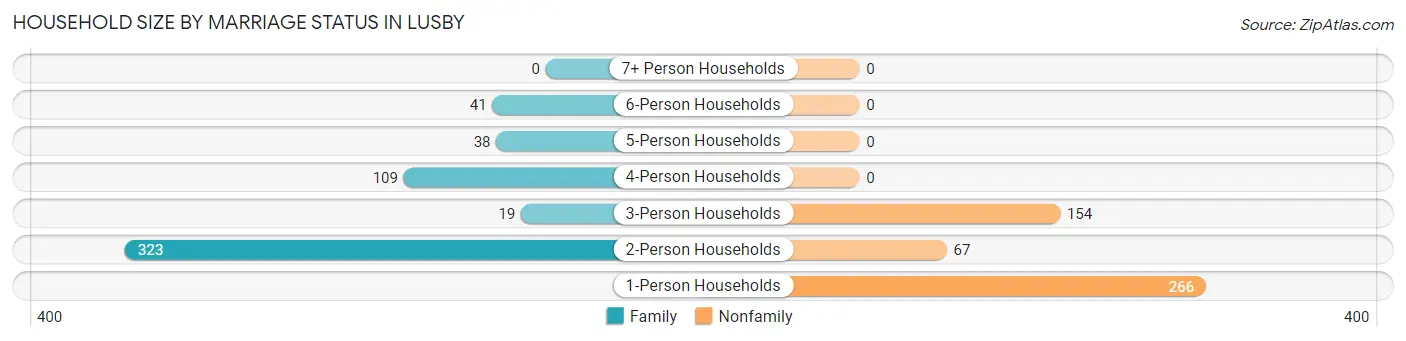
| Household Size | Family Households | Nonfamily Households |
| 1-Person Households | - | 266 (26.2%) |
| 2-Person Households | 323 (31.8%) | 67 (6.6%) |
| 3-Person Households | 19 (1.9%) | 154 (15.1%) |
| 4-Person Households | 109 (10.7%) | 0 (0.0%) |
| 5-Person Households | 38 (3.7%) | 0 (0.0%) |
| 6-Person Households | 41 (4.0%) | 0 (0.0%) |
| 7+ Person Households | 0 (0.0%) | 0 (0.0%) |
| Total | 530 (52.1%) | 487 (47.9%) |
Female Fertility in Lusby
Fertility by Age in Lusby
Average fertility rate in Lusby is 30.0 births per 1,000 women. Women in the age bracket of 20 to 34 years have the highest fertility rate with 57.0 births per 1,000 women. Women in the age bracket of 20 to 34 years acount for 100.0% of all women with births.
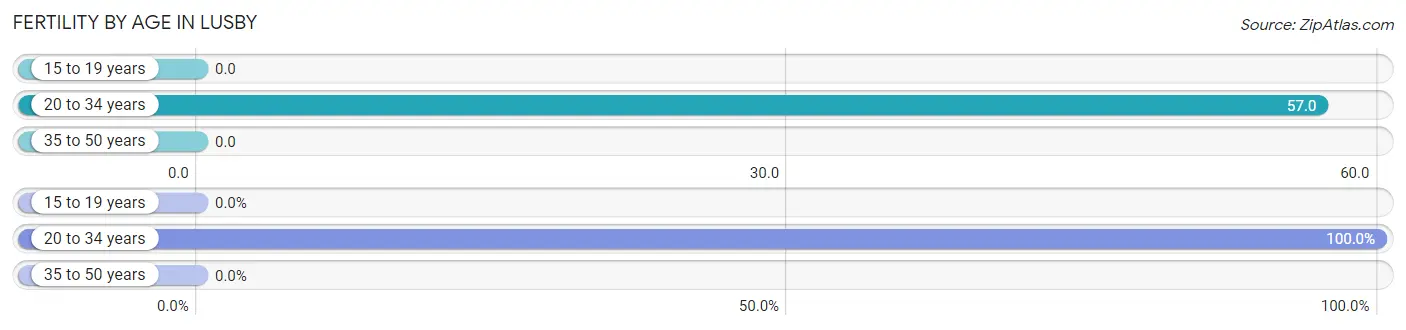
| Age Bracket | Women with Births | Births / 1,000 Women |
| 15 to 19 years | 0 (0.0%) | 0.0 |
| 20 to 34 years | 12 (100.0%) | 57.0 |
| 35 to 50 years | 0 (0.0%) | 0.0 |
| Total | 12 (100.0%) | 30.0 |
Fertility by Age by Marriage Status in Lusby
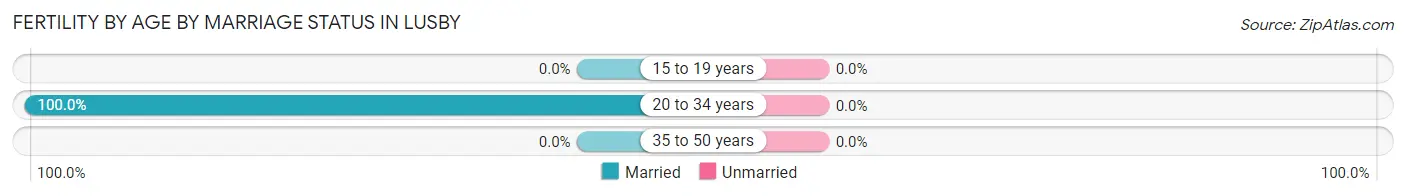
| Age Bracket | Married | Unmarried |
| 15 to 19 years | 0 (0.0%) | 0 (0.0%) |
| 20 to 34 years | 12 (100.0%) | 0 (0.0%) |
| 35 to 50 years | 0 (0.0%) | 0 (0.0%) |
| Total | 12 (100.0%) | 0 (0.0%) |
Fertility by Education in Lusby
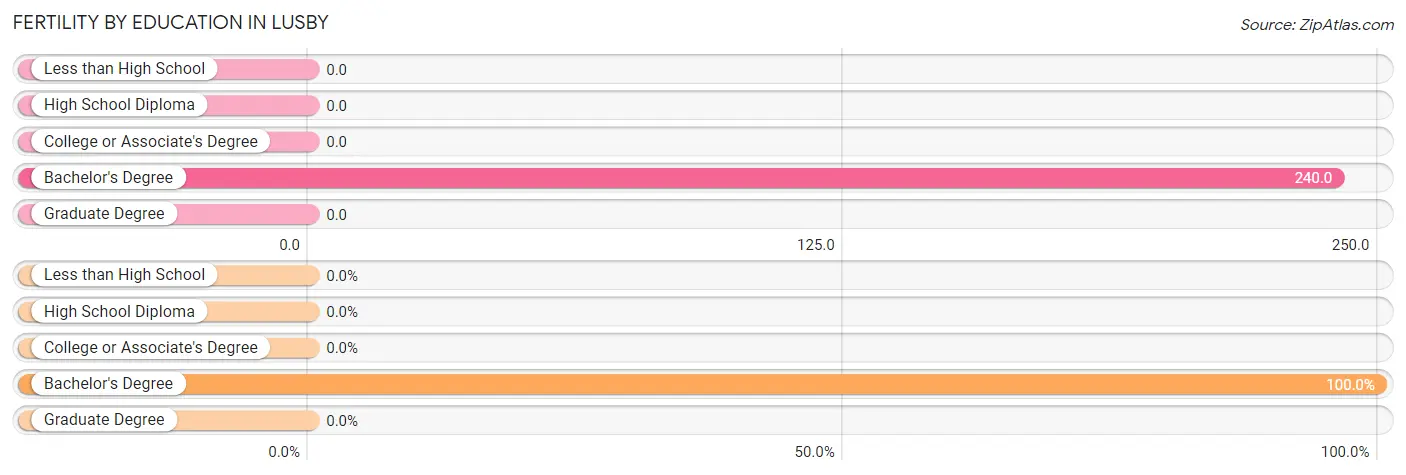
| Educational Attainment | Women with Births | Births / 1,000 Women |
| Less than High School | 0 (0.0%) | 0.0 |
| High School Diploma | 0 (0.0%) | 0.0 |
| College or Associate's Degree | 0 (0.0%) | 0.0 |
| Bachelor's Degree | 12 (100.0%) | 240.0 |
| Graduate Degree | 0 (0.0%) | 0.0 |
| Total | 12 (100.0%) | 30.0 |
Fertility by Education by Marriage Status in Lusby
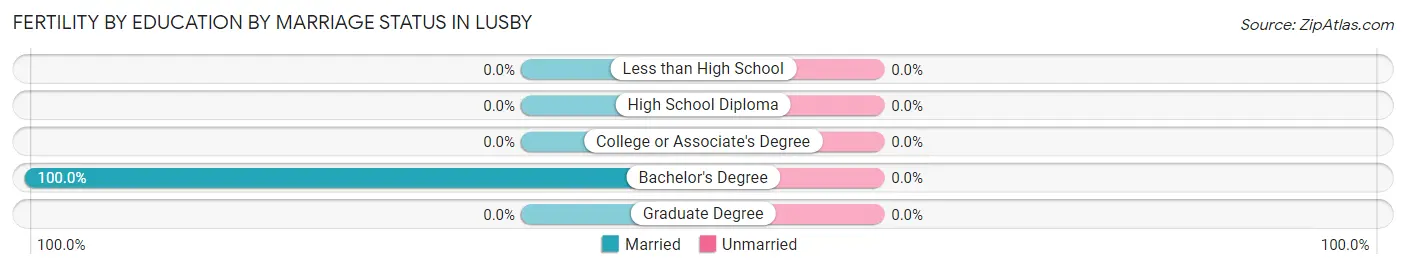
| Educational Attainment | Married | Unmarried |
| Less than High School | 0 (0.0%) | 0 (0.0%) |
| High School Diploma | 0 (0.0%) | 0 (0.0%) |
| College or Associate's Degree | 0 (0.0%) | 0 (0.0%) |
| Bachelor's Degree | 12 (100.0%) | 0 (0.0%) |
| Graduate Degree | 0 (0.0%) | 0 (0.0%) |
| Total | 12 (100.0%) | 0 (0.0%) |
Employment Characteristics in Lusby
Employment by Class of Employer in Lusby
Among the 1,436 employed individuals in Lusby, private company employees (871 | 60.7%), federal government employees (363 | 25.3%), and not-for-profit organizations (104 | 7.2%) make up the most common classes of employment.
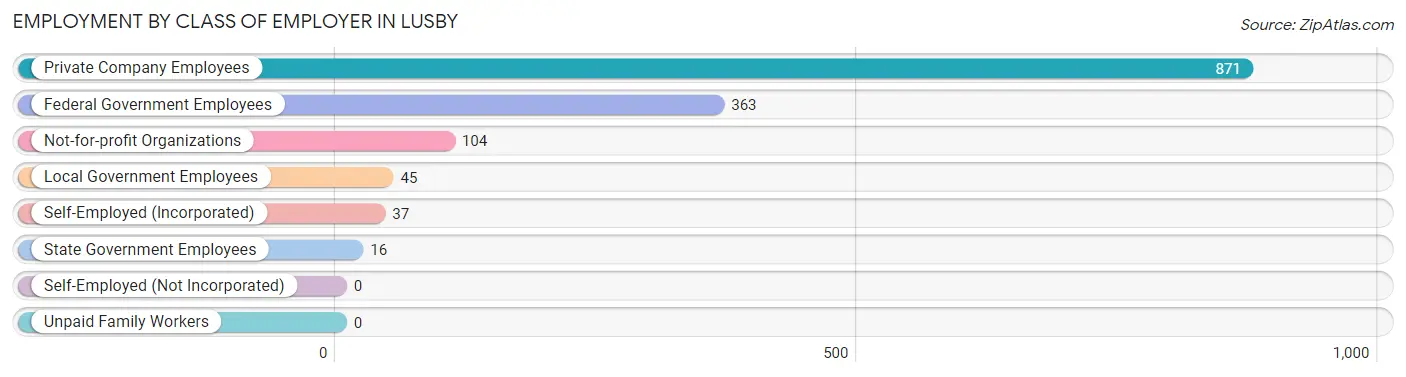
| Employer Class | # Employees | % Employees |
| Private Company Employees | 871 | 60.7% |
| Self-Employed (Incorporated) | 37 | 2.6% |
| Self-Employed (Not Incorporated) | 0 | 0.0% |
| Not-for-profit Organizations | 104 | 7.2% |
| Local Government Employees | 45 | 3.1% |
| State Government Employees | 16 | 1.1% |
| Federal Government Employees | 363 | 25.3% |
| Unpaid Family Workers | 0 | 0.0% |
| Total | 1,436 | 100.0% |
Employment Status by Age in Lusby
According to the labor force statistics for Lusby, out of the total population over 16 years of age (2,009), 73.8% or 1,483 individuals are in the labor force, with 3.1% or 46 of them unemployed. The age group with the highest labor force participation rate is 20 to 24 years, with 100.0% or 143 individuals in the labor force. Within the labor force, the 16 to 19 years age range has the highest percentage of unemployed individuals, with 49.0% or 24 of them being unemployed.
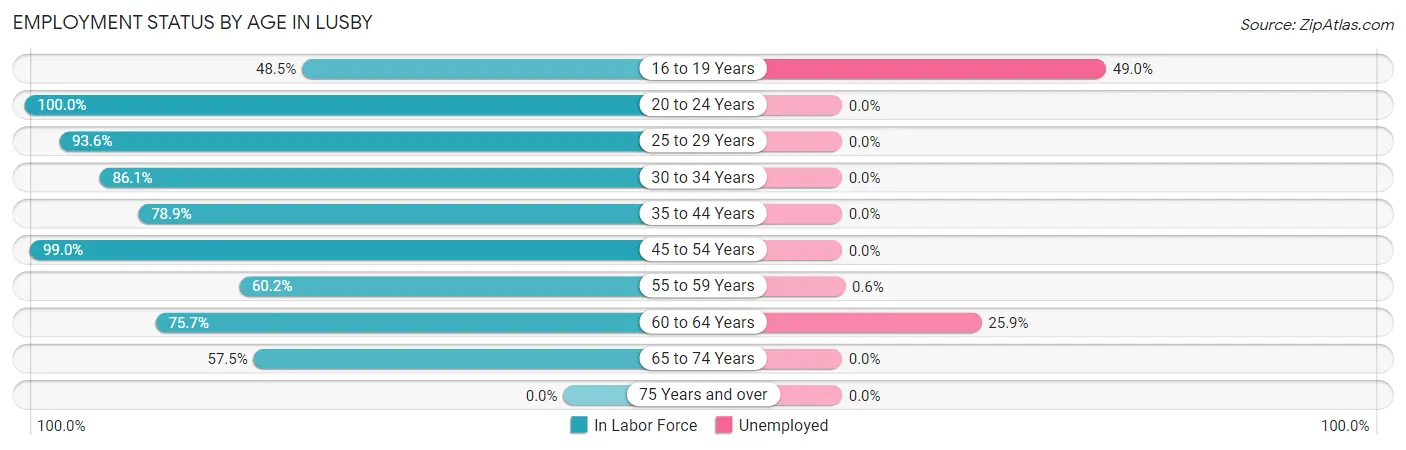
| Age Bracket | In Labor Force | Unemployed |
| 16 to 19 Years | 49 (48.5%) | 24 (49.0%) |
| 20 to 24 Years | 143 (100.0%) | 0 (0.0%) |
| 25 to 29 Years | 334 (93.6%) | 0 (0.0%) |
| 30 to 34 Years | 292 (86.1%) | 0 (0.0%) |
| 35 to 44 Years | 165 (78.9%) | 0 (0.0%) |
| 45 to 54 Years | 101 (99.0%) | 0 (0.0%) |
| 55 to 59 Years | 171 (60.2%) | 1 (0.6%) |
| 60 to 64 Years | 81 (75.7%) | 21 (25.9%) |
| 65 to 74 Years | 146 (57.5%) | 0 (0.0%) |
| 75 Years and over | 0 (0.0%) | 0 (0.0%) |
| Total | 1,483 (73.8%) | 46 (3.1%) |
Employment Status by Educational Attainment in Lusby
According to labor force statistics for Lusby, 81.8% of individuals (1,144) out of the total population between 25 and 64 years of age (1,398) are in the labor force, with 1.9% or 22 of them being unemployed. The group with the highest labor force participation rate are those with the educational attainment of bachelor's degree or higher, with 96.2% or 252 individuals in the labor force. Within the labor force, individuals with college / associate degree education have the highest percentage of unemployment, with 3.7% or 21 of them being unemployed.
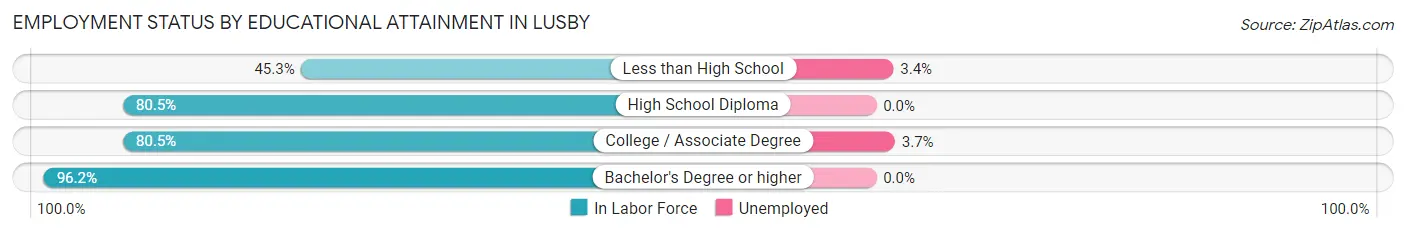
| Educational Attainment | In Labor Force | Unemployed |
| Less than High School | 29 (45.3%) | 2 (3.4%) |
| High School Diploma | 289 (80.5%) | 0 (0.0%) |
| College / Associate Degree | 574 (80.5%) | 26 (3.7%) |
| Bachelor's Degree or higher | 252 (96.2%) | 0 (0.0%) |
| Total | 1,144 (81.8%) | 27 (1.9%) |
Employment Occupations by Sex in Lusby
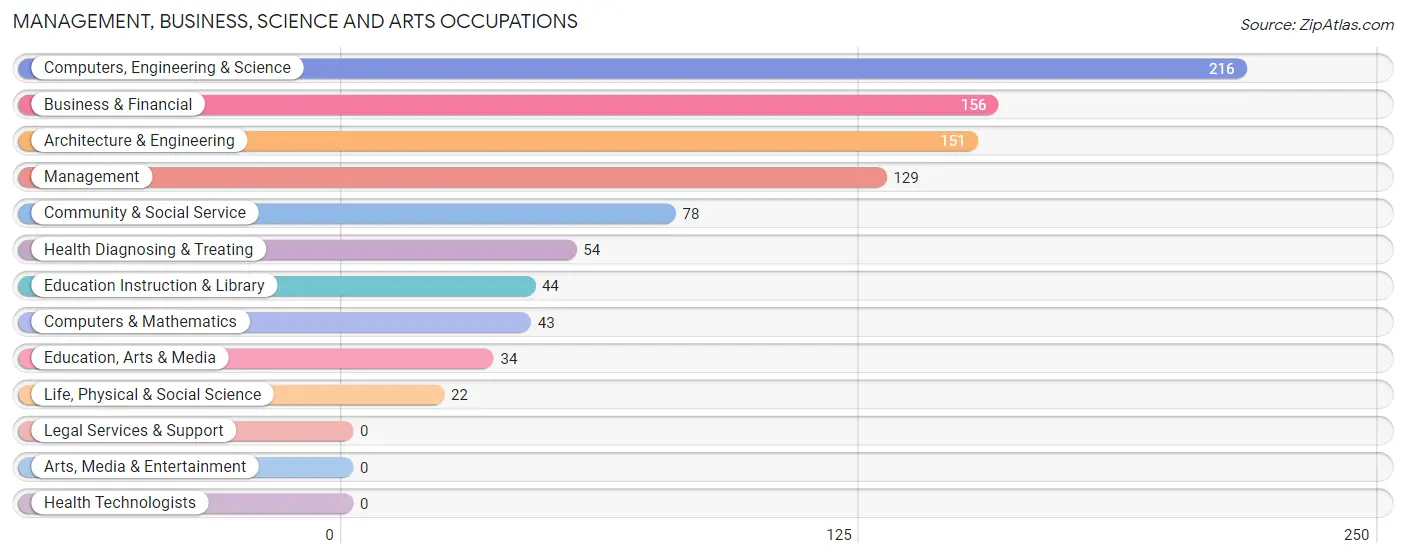
Management, Business, Science and Arts Occupations
The most common Management, Business, Science and Arts occupations in Lusby are Computers, Engineering & Science (216 | 15.0%), Business & Financial (156 | 10.9%), Architecture & Engineering (151 | 10.5%), Management (129 | 9.0%), and Community & Social Service (78 | 5.4%).
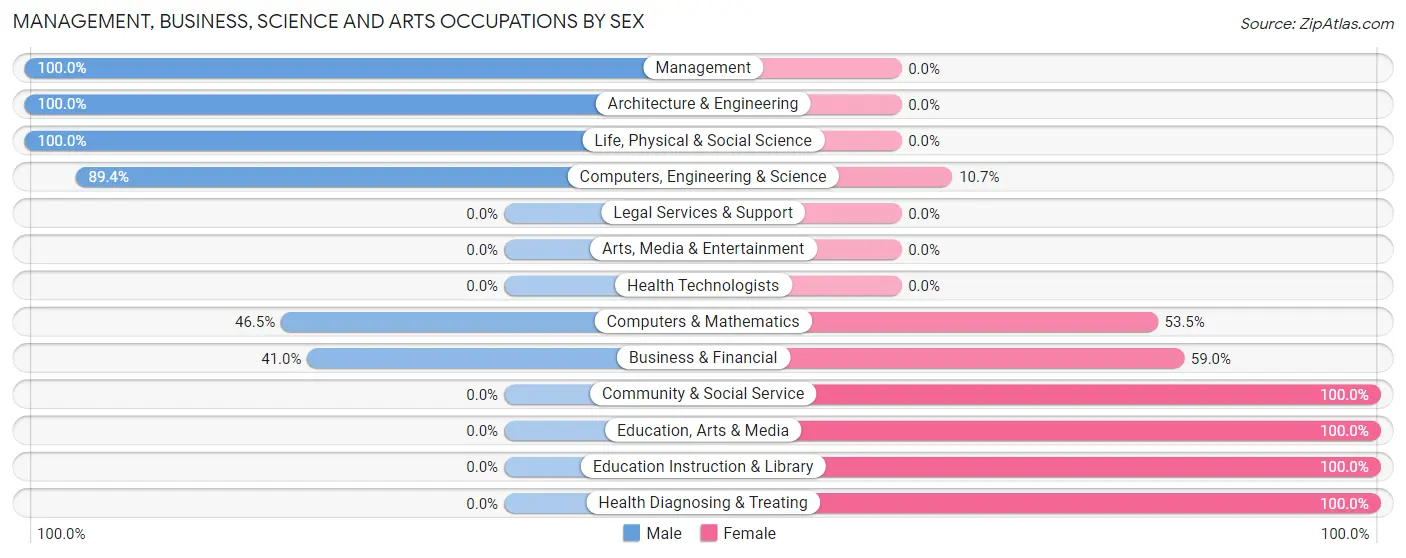
Management, Business, Science and Arts Occupations by Sex
Within the Management, Business, Science and Arts occupations in Lusby, the most male-oriented occupations are Management (100.0%), Architecture & Engineering (100.0%), and Life, Physical & Social Science (100.0%), while the most female-oriented occupations are Community & Social Service (100.0%), Education, Arts & Media (100.0%), and Education Instruction & Library (100.0%).
| Occupation | Male | Female |
| Management | 129 (100.0%) | 0 (0.0%) |
| Business & Financial | 64 (41.0%) | 92 (59.0%) |
| Computers, Engineering & Science | 193 (89.3%) | 23 (10.6%) |
| Computers & Mathematics | 20 (46.5%) | 23 (53.5%) |
| Architecture & Engineering | 151 (100.0%) | 0 (0.0%) |
| Life, Physical & Social Science | 22 (100.0%) | 0 (0.0%) |
| Community & Social Service | 0 (0.0%) | 78 (100.0%) |
| Education, Arts & Media | 0 (0.0%) | 34 (100.0%) |
| Legal Services & Support | 0 (0.0%) | 0 (0.0%) |
| Education Instruction & Library | 0 (0.0%) | 44 (100.0%) |
| Arts, Media & Entertainment | 0 (0.0%) | 0 (0.0%) |
| Health Diagnosing & Treating | 0 (0.0%) | 54 (100.0%) |
| Health Technologists | 0 (0.0%) | 0 (0.0%) |
| Total (Category) | 386 (61.0%) | 247 (39.0%) |
| Total (Overall) | 1,053 (73.3%) | 383 (26.7%) |
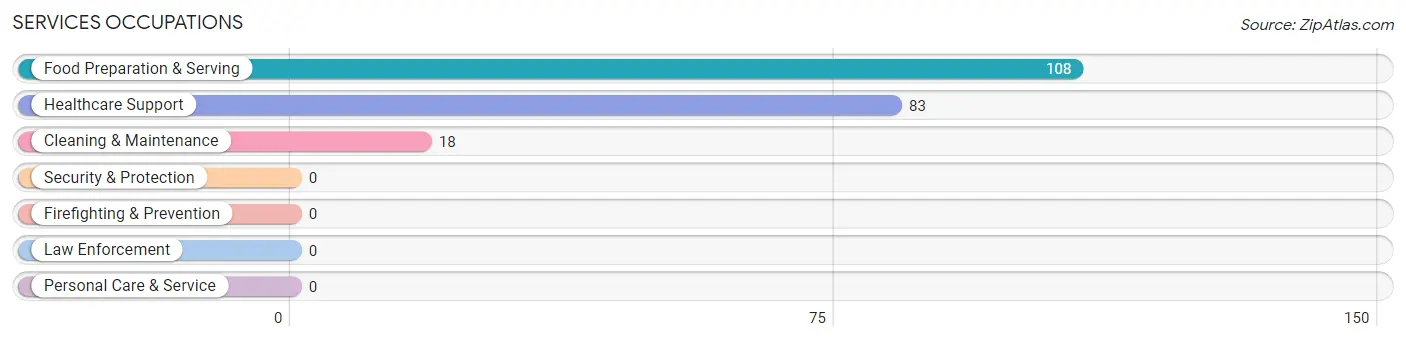
Services Occupations
The most common Services occupations in Lusby are Food Preparation & Serving (108 | 7.5%), Healthcare Support (83 | 5.8%), and Cleaning & Maintenance (18 | 1.3%).
Services Occupations by Sex
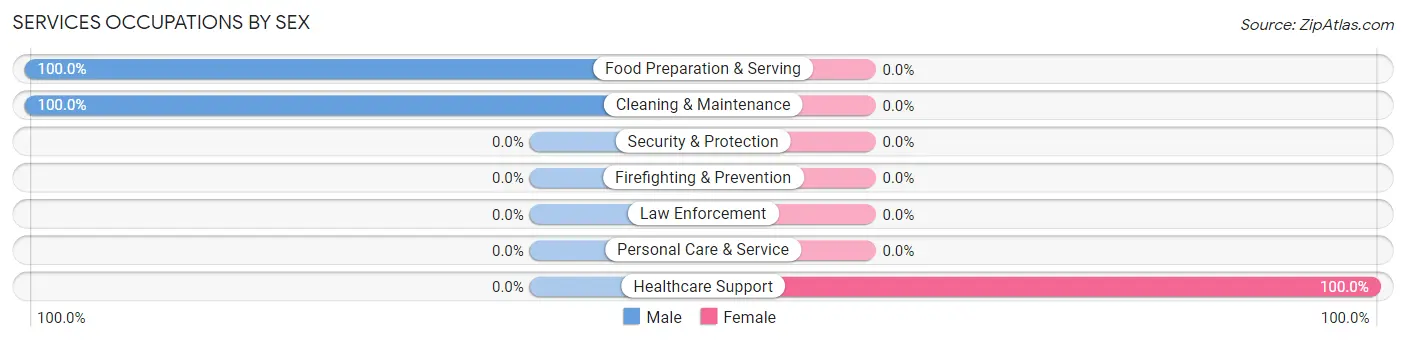
| Occupation | Male | Female |
| Healthcare Support | 0 (0.0%) | 83 (100.0%) |
| Security & Protection | 0 (0.0%) | 0 (0.0%) |
| Firefighting & Prevention | 0 (0.0%) | 0 (0.0%) |
| Law Enforcement | 0 (0.0%) | 0 (0.0%) |
| Food Preparation & Serving | 108 (100.0%) | 0 (0.0%) |
| Cleaning & Maintenance | 18 (100.0%) | 0 (0.0%) |
| Personal Care & Service | 0 (0.0%) | 0 (0.0%) |
| Total (Category) | 126 (60.3%) | 83 (39.7%) |
| Total (Overall) | 1,053 (73.3%) | 383 (26.7%) |
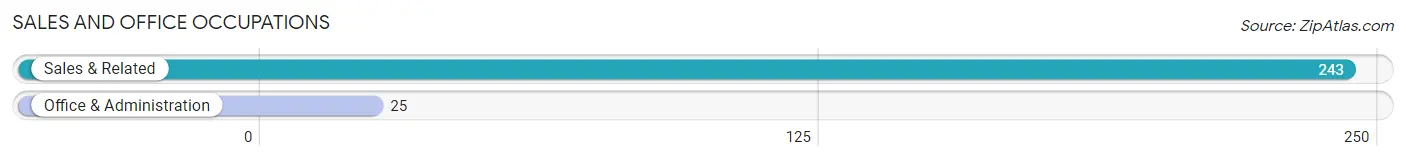
Sales and Office Occupations
The most common Sales and Office occupations in Lusby are Sales & Related (243 | 16.9%), and Office & Administration (25 | 1.7%).
Sales and Office Occupations by Sex

| Occupation | Male | Female |
| Sales & Related | 203 (83.5%) | 40 (16.5%) |
| Office & Administration | 12 (48.0%) | 13 (52.0%) |
| Total (Category) | 215 (80.2%) | 53 (19.8%) |
| Total (Overall) | 1,053 (73.3%) | 383 (26.7%) |
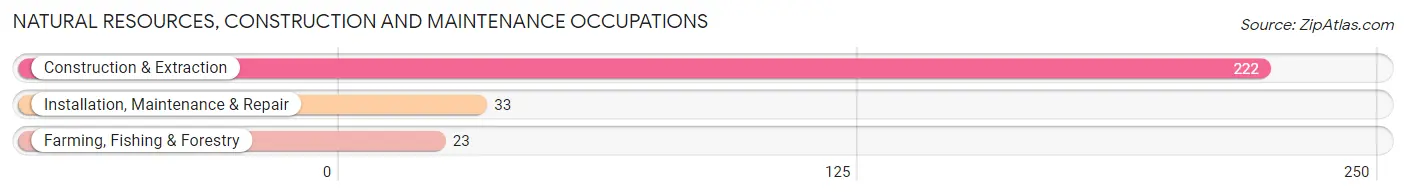
Natural Resources, Construction and Maintenance Occupations
The most common Natural Resources, Construction and Maintenance occupations in Lusby are Construction & Extraction (222 | 15.5%), Installation, Maintenance & Repair (33 | 2.3%), and Farming, Fishing & Forestry (23 | 1.6%).
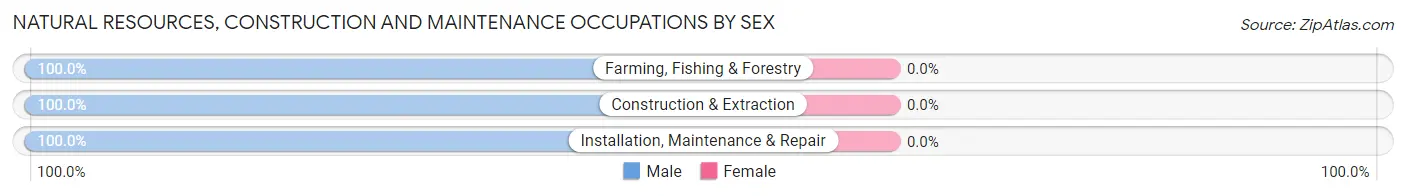
Natural Resources, Construction and Maintenance Occupations by Sex
| Occupation | Male | Female |
| Farming, Fishing & Forestry | 23 (100.0%) | 0 (0.0%) |
| Construction & Extraction | 222 (100.0%) | 0 (0.0%) |
| Installation, Maintenance & Repair | 33 (100.0%) | 0 (0.0%) |
| Total (Category) | 278 (100.0%) | 0 (0.0%) |
| Total (Overall) | 1,053 (73.3%) | 383 (26.7%) |
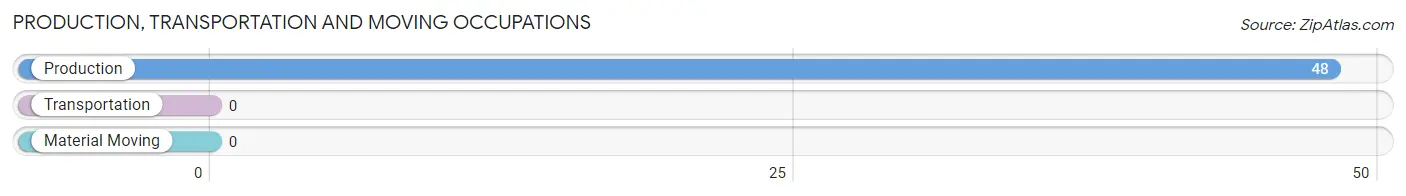
Production, Transportation and Moving Occupations
The most common Production, Transportation and Moving occupations in Lusby are , and Production (48 | 3.3%).
Production, Transportation and Moving Occupations by Sex
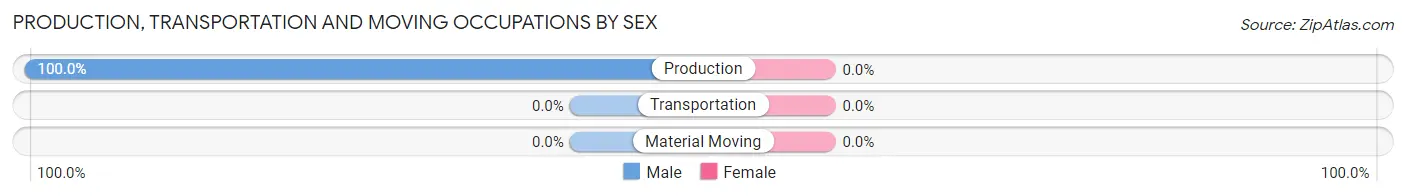
| Occupation | Male | Female |
| Production | 48 (100.0%) | 0 (0.0%) |
| Transportation | 0 (0.0%) | 0 (0.0%) |
| Material Moving | 0 (0.0%) | 0 (0.0%) |
| Total (Category) | 48 (100.0%) | 0 (0.0%) |
| Total (Overall) | 1,053 (73.3%) | 383 (26.7%) |
Employment Industries by Sex in Lusby
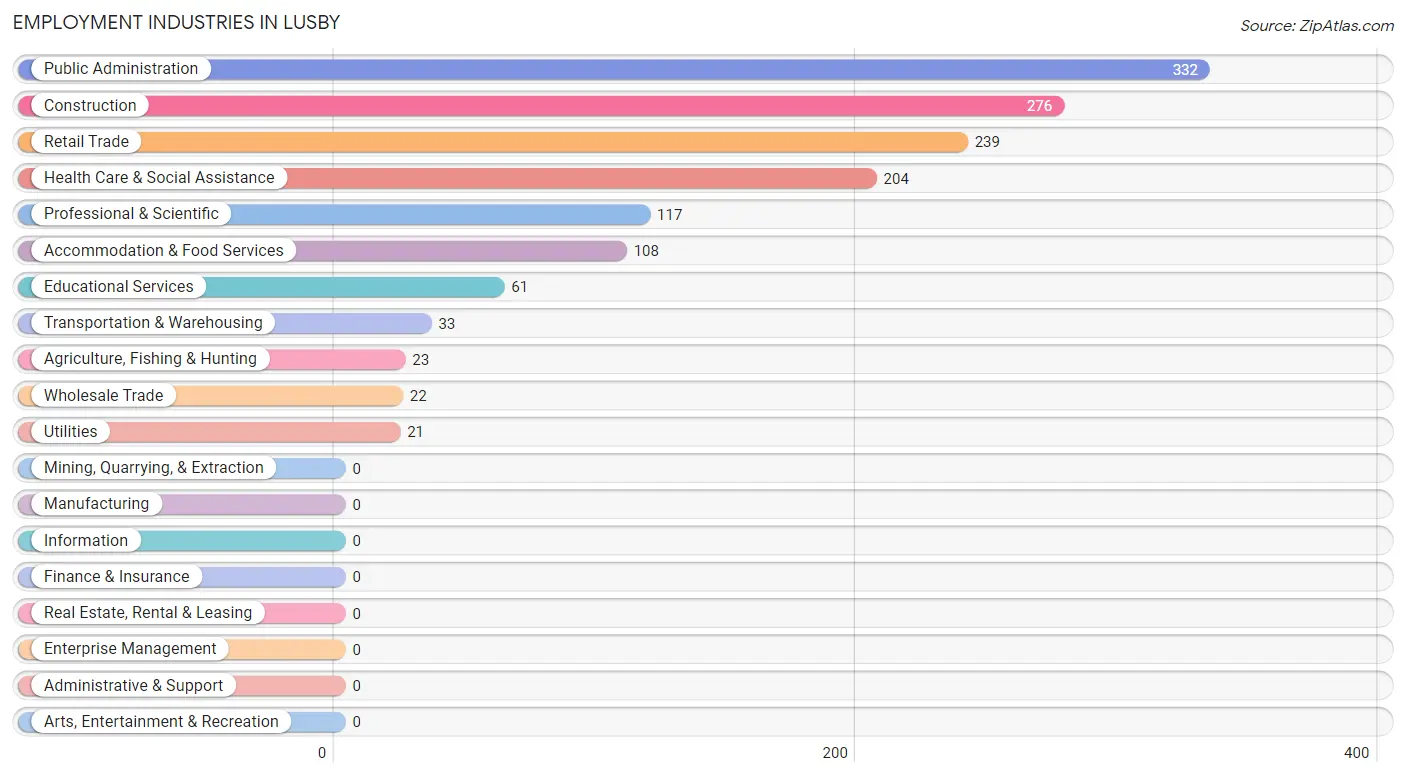
Employment Industries in Lusby
The major employment industries in Lusby include Public Administration (332 | 23.1%), Construction (276 | 19.2%), Retail Trade (239 | 16.6%), Health Care & Social Assistance (204 | 14.2%), and Professional & Scientific (117 | 8.2%).
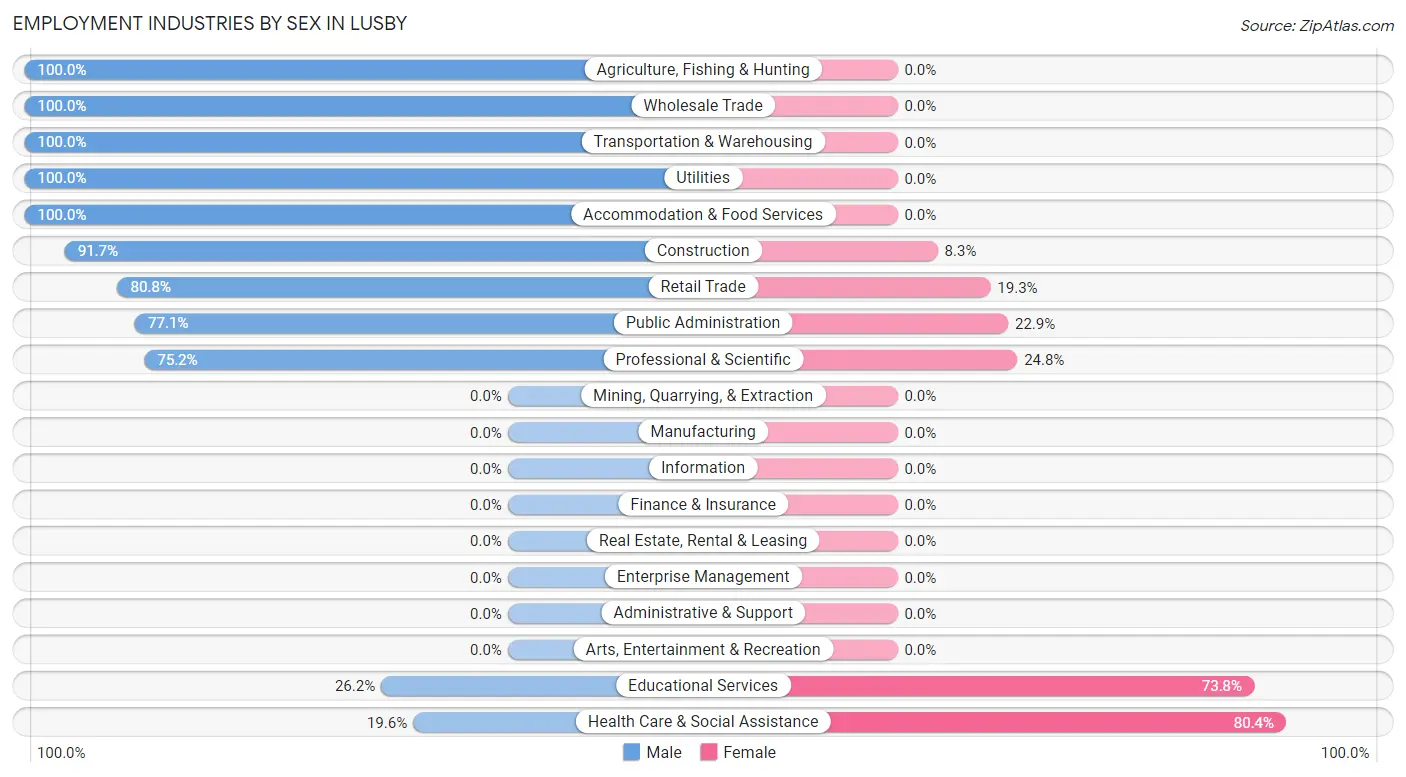
Employment Industries by Sex in Lusby
The Lusby industries that see more men than women are Agriculture, Fishing & Hunting (100.0%), Wholesale Trade (100.0%), and Transportation & Warehousing (100.0%), whereas the industries that tend to have a higher number of women are Health Care & Social Assistance (80.4%), Educational Services (73.8%), and Professional & Scientific (24.8%).
| Industry | Male | Female |
| Agriculture, Fishing & Hunting | 23 (100.0%) | 0 (0.0%) |
| Mining, Quarrying, & Extraction | 0 (0.0%) | 0 (0.0%) |
| Construction | 253 (91.7%) | 23 (8.3%) |
| Manufacturing | 0 (0.0%) | 0 (0.0%) |
| Wholesale Trade | 22 (100.0%) | 0 (0.0%) |
| Retail Trade | 193 (80.7%) | 46 (19.3%) |
| Transportation & Warehousing | 33 (100.0%) | 0 (0.0%) |
| Utilities | 21 (100.0%) | 0 (0.0%) |
| Information | 0 (0.0%) | 0 (0.0%) |
| Finance & Insurance | 0 (0.0%) | 0 (0.0%) |
| Real Estate, Rental & Leasing | 0 (0.0%) | 0 (0.0%) |
| Professional & Scientific | 88 (75.2%) | 29 (24.8%) |
| Enterprise Management | 0 (0.0%) | 0 (0.0%) |
| Administrative & Support | 0 (0.0%) | 0 (0.0%) |
| Educational Services | 16 (26.2%) | 45 (73.8%) |
| Health Care & Social Assistance | 40 (19.6%) | 164 (80.4%) |
| Arts, Entertainment & Recreation | 0 (0.0%) | 0 (0.0%) |
| Accommodation & Food Services | 108 (100.0%) | 0 (0.0%) |
| Public Administration | 256 (77.1%) | 76 (22.9%) |
| Total | 1,053 (73.3%) | 383 (26.7%) |
Education in Lusby
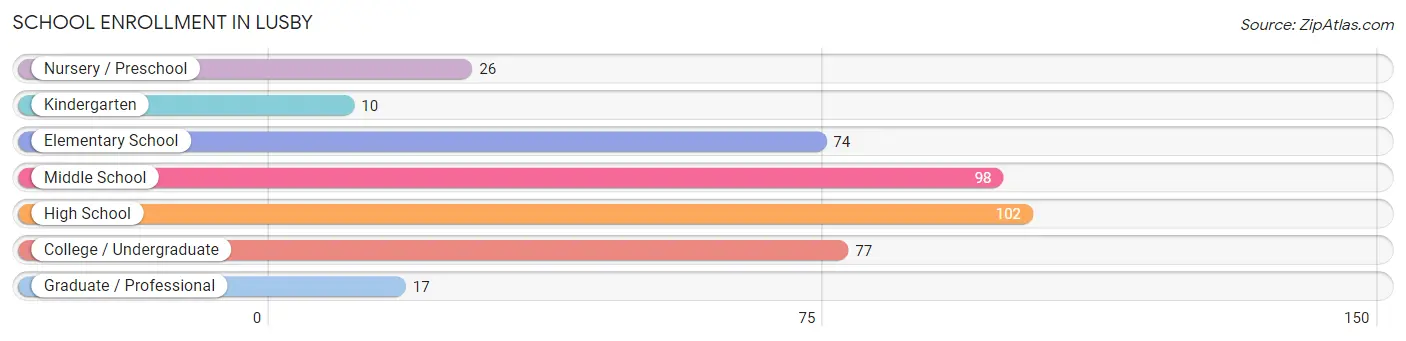
School Enrollment in Lusby
The most common levels of schooling among the 404 students in Lusby are high school (102 | 25.3%), middle school (98 | 24.3%), and college / undergraduate (77 | 19.1%).
| School Level | # Students | % Students |
| Nursery / Preschool | 26 | 6.4% |
| Kindergarten | 10 | 2.5% |
| Elementary School | 74 | 18.3% |
| Middle School | 98 | 24.3% |
| High School | 102 | 25.3% |
| College / Undergraduate | 77 | 19.1% |
| Graduate / Professional | 17 | 4.2% |
| Total | 404 | 100.0% |
School Enrollment by Age by Funding Source in Lusby
Out of a total of 404 students who are enrolled in schools in Lusby, 56 (13.9%) attend a private institution, while the remaining 348 (86.1%) are enrolled in public schools. The age group of 5 to 9 year old has the highest likelihood of being enrolled in private schools, with 38 (40.0% in the age bracket) enrolled. Conversely, the age group of 15 to 17 year olds has the lowest likelihood of being enrolled in a private school, with 59 (100.0% in the age bracket) attending a public institution.
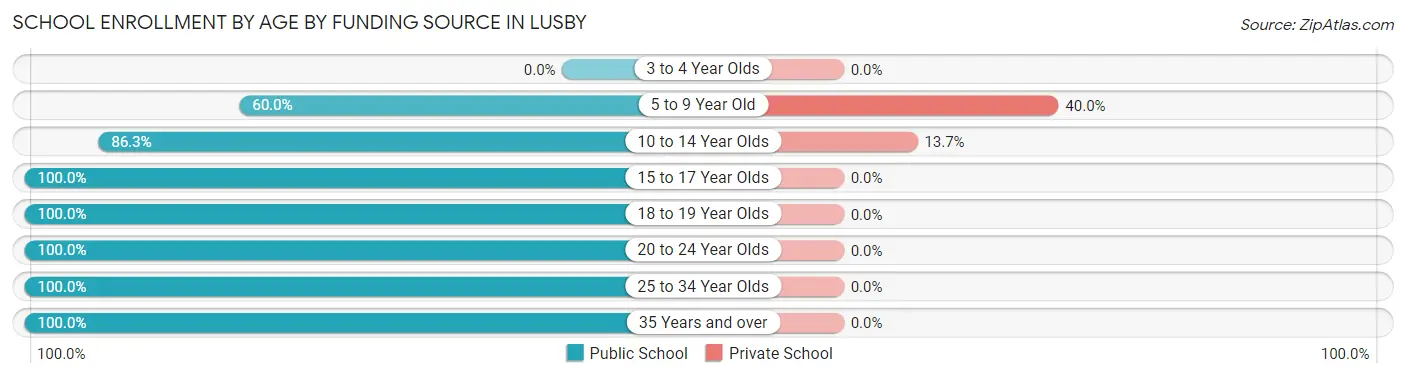
| Age Bracket | Public School | Private School |
| 3 to 4 Year Olds | 0 (0.0%) | 0 (0.0%) |
| 5 to 9 Year Old | 57 (60.0%) | 38 (40.0%) |
| 10 to 14 Year Olds | 113 (86.3%) | 18 (13.7%) |
| 15 to 17 Year Olds | 59 (100.0%) | 0 (0.0%) |
| 18 to 19 Year Olds | 49 (100.0%) | 0 (0.0%) |
| 20 to 24 Year Olds | 12 (100.0%) | 0 (0.0%) |
| 25 to 34 Year Olds | 24 (100.0%) | 0 (0.0%) |
| 35 Years and over | 34 (100.0%) | 0 (0.0%) |
| Total | 348 (86.1%) | 56 (13.9%) |
Educational Attainment by Field of Study in Lusby
Business (119 | 33.5%), social sciences (51 | 14.4%), engineering (41 | 11.6%), arts & humanities (41 | 11.6%), and computers & mathematics (34 | 9.6%) are the most common fields of study among 355 individuals in Lusby who have obtained a bachelor's degree or higher.
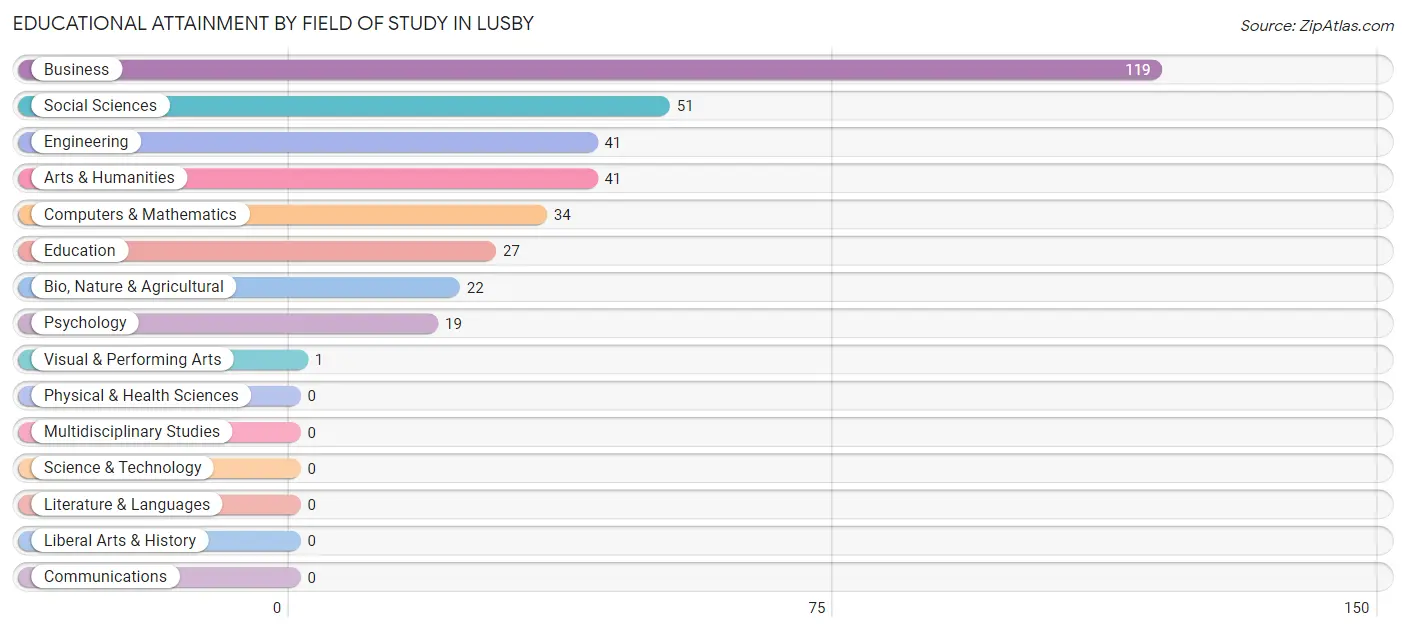
| Field of Study | # Graduates | % Graduates |
| Computers & Mathematics | 34 | 9.6% |
| Bio, Nature & Agricultural | 22 | 6.2% |
| Physical & Health Sciences | 0 | 0.0% |
| Psychology | 19 | 5.3% |
| Social Sciences | 51 | 14.4% |
| Engineering | 41 | 11.6% |
| Multidisciplinary Studies | 0 | 0.0% |
| Science & Technology | 0 | 0.0% |
| Business | 119 | 33.5% |
| Education | 27 | 7.6% |
| Literature & Languages | 0 | 0.0% |
| Liberal Arts & History | 0 | 0.0% |
| Visual & Performing Arts | 1 | 0.3% |
| Communications | 0 | 0.0% |
| Arts & Humanities | 41 | 11.6% |
| Total | 355 | 100.0% |
Transportation & Commute in Lusby
Vehicle Availability by Sex in Lusby
The most prevalent vehicle ownership categories in Lusby are males with 2 vehicles (469, accounting for 44.5%) and females with 2 vehicles (197, making up 122.4%).
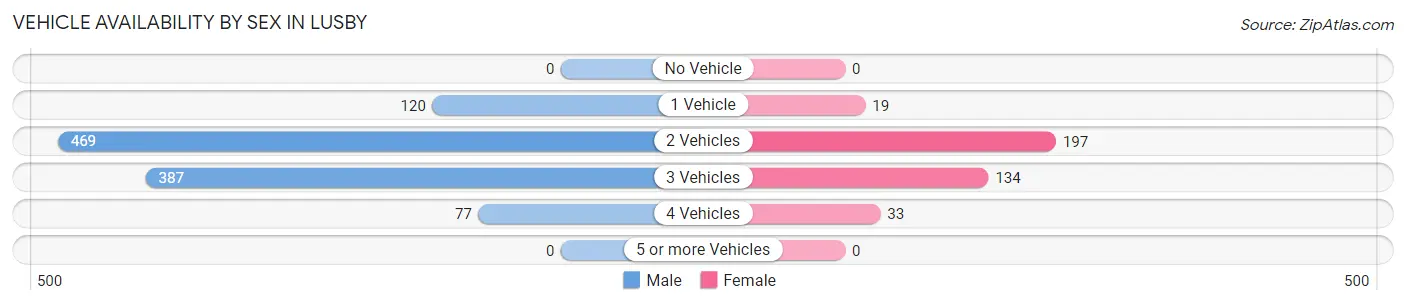
| Vehicles Available | Male | Female |
| No Vehicle | 0 (0.0%) | 0 (0.0%) |
| 1 Vehicle | 120 (11.4%) | 19 (5.0%) |
| 2 Vehicles | 469 (44.5%) | 197 (51.4%) |
| 3 Vehicles | 387 (36.7%) | 134 (35.0%) |
| 4 Vehicles | 77 (7.3%) | 33 (8.6%) |
| 5 or more Vehicles | 0 (0.0%) | 0 (0.0%) |
| Total | 1,053 (100.0%) | 383 (100.0%) |
Commute Time in Lusby
The most frequently occuring commute durations in Lusby are 25 to 29 minutes (455 commuters, 35.9%), 45 to 59 minutes (180 commuters, 14.2%), and 90 or more minutes (145 commuters, 11.5%).
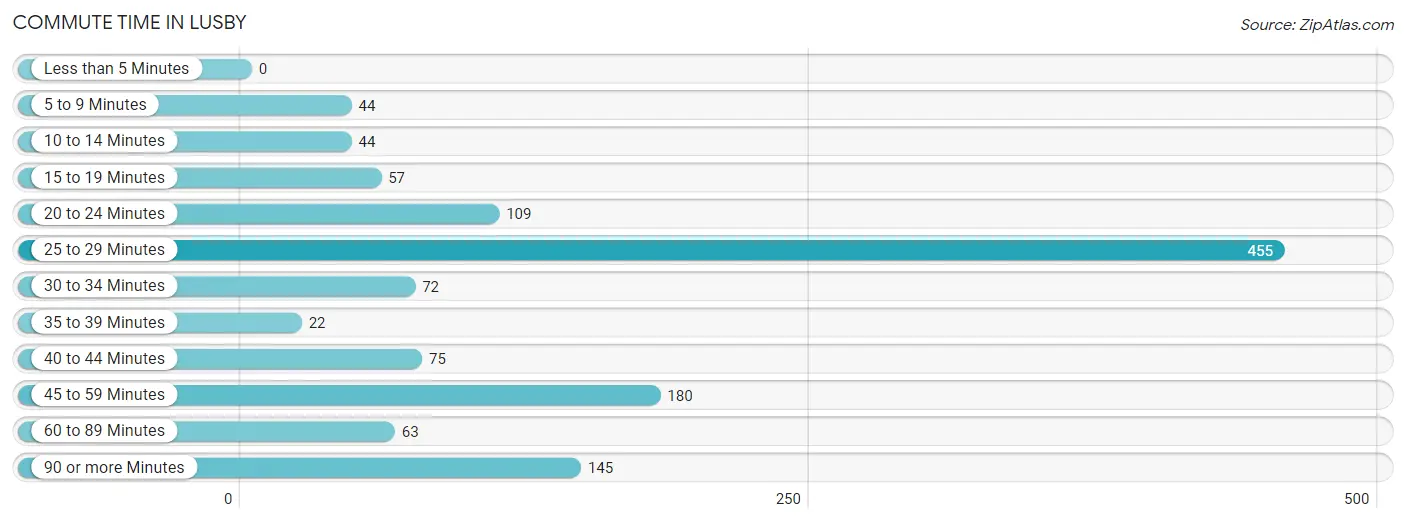
| Commute Time | # Commuters | % Commuters |
| Less than 5 Minutes | 0 | 0.0% |
| 5 to 9 Minutes | 44 | 3.5% |
| 10 to 14 Minutes | 44 | 3.5% |
| 15 to 19 Minutes | 57 | 4.5% |
| 20 to 24 Minutes | 109 | 8.6% |
| 25 to 29 Minutes | 455 | 35.9% |
| 30 to 34 Minutes | 72 | 5.7% |
| 35 to 39 Minutes | 22 | 1.7% |
| 40 to 44 Minutes | 75 | 5.9% |
| 45 to 59 Minutes | 180 | 14.2% |
| 60 to 89 Minutes | 63 | 5.0% |
| 90 or more Minutes | 145 | 11.5% |
Commute Time by Sex in Lusby
The most common commute times in Lusby are 25 to 29 minutes (327 commuters, 32.6%) for males and 25 to 29 minutes (128 commuters, 48.8%) for females.
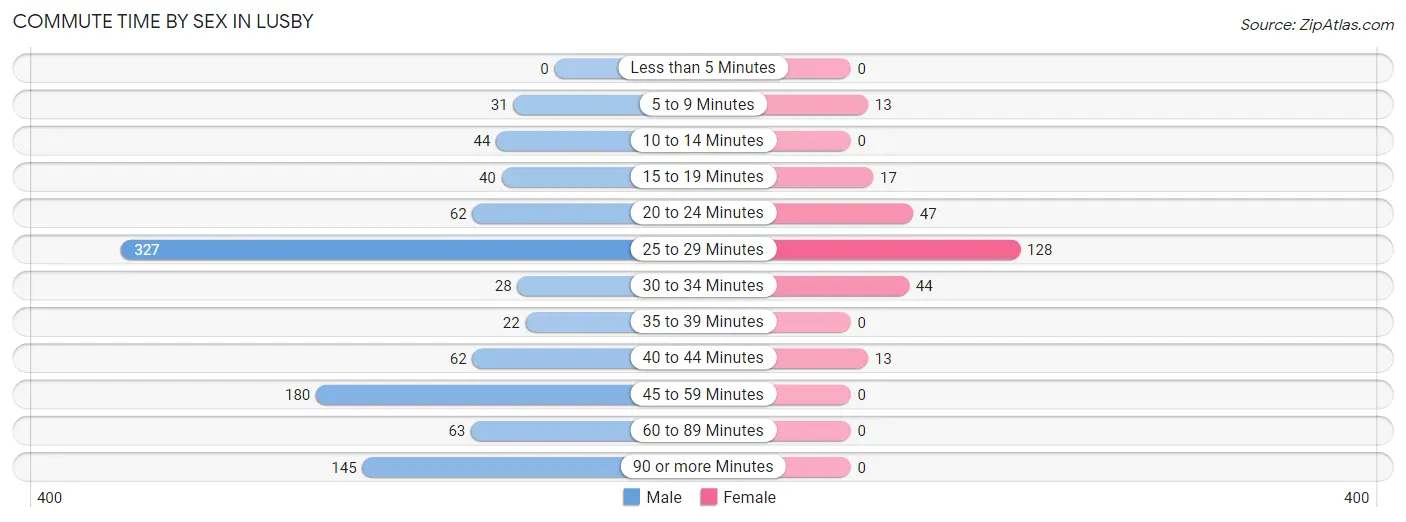
| Commute Time | Male | Female |
| Less than 5 Minutes | 0 (0.0%) | 0 (0.0%) |
| 5 to 9 Minutes | 31 (3.1%) | 13 (5.0%) |
| 10 to 14 Minutes | 44 (4.4%) | 0 (0.0%) |
| 15 to 19 Minutes | 40 (4.0%) | 17 (6.5%) |
| 20 to 24 Minutes | 62 (6.2%) | 47 (17.9%) |
| 25 to 29 Minutes | 327 (32.6%) | 128 (48.8%) |
| 30 to 34 Minutes | 28 (2.8%) | 44 (16.8%) |
| 35 to 39 Minutes | 22 (2.2%) | 0 (0.0%) |
| 40 to 44 Minutes | 62 (6.2%) | 13 (5.0%) |
| 45 to 59 Minutes | 180 (17.9%) | 0 (0.0%) |
| 60 to 89 Minutes | 63 (6.3%) | 0 (0.0%) |
| 90 or more Minutes | 145 (14.4%) | 0 (0.0%) |
Time of Departure to Work by Sex in Lusby
The most frequent times of departure to work in Lusby are 12:00 AM to 4:59 AM (236, 23.5%) for males and 6:30 AM to 6:59 AM (83, 31.7%) for females.
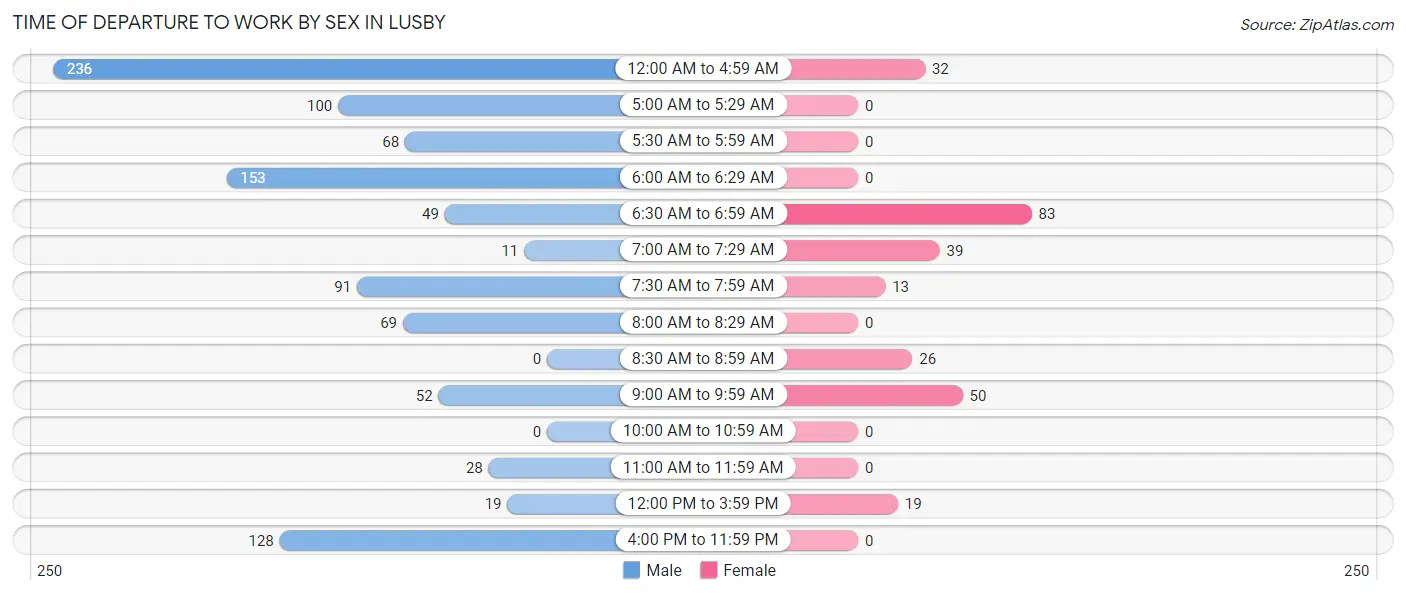
| Time of Departure | Male | Female |
| 12:00 AM to 4:59 AM | 236 (23.5%) | 32 (12.2%) |
| 5:00 AM to 5:29 AM | 100 (10.0%) | 0 (0.0%) |
| 5:30 AM to 5:59 AM | 68 (6.8%) | 0 (0.0%) |
| 6:00 AM to 6:29 AM | 153 (15.2%) | 0 (0.0%) |
| 6:30 AM to 6:59 AM | 49 (4.9%) | 83 (31.7%) |
| 7:00 AM to 7:29 AM | 11 (1.1%) | 39 (14.9%) |
| 7:30 AM to 7:59 AM | 91 (9.1%) | 13 (5.0%) |
| 8:00 AM to 8:29 AM | 69 (6.9%) | 0 (0.0%) |
| 8:30 AM to 8:59 AM | 0 (0.0%) | 26 (9.9%) |
| 9:00 AM to 9:59 AM | 52 (5.2%) | 50 (19.1%) |
| 10:00 AM to 10:59 AM | 0 (0.0%) | 0 (0.0%) |
| 11:00 AM to 11:59 AM | 28 (2.8%) | 0 (0.0%) |
| 12:00 PM to 3:59 PM | 19 (1.9%) | 19 (7.2%) |
| 4:00 PM to 11:59 PM | 128 (12.8%) | 0 (0.0%) |
| Total | 1,004 (100.0%) | 262 (100.0%) |
Housing Occupancy in Lusby
Occupancy by Ownership in Lusby
Of the total 1,017 dwellings in Lusby, owner-occupied units account for 756 (74.3%), while renter-occupied units make up 261 (25.7%).
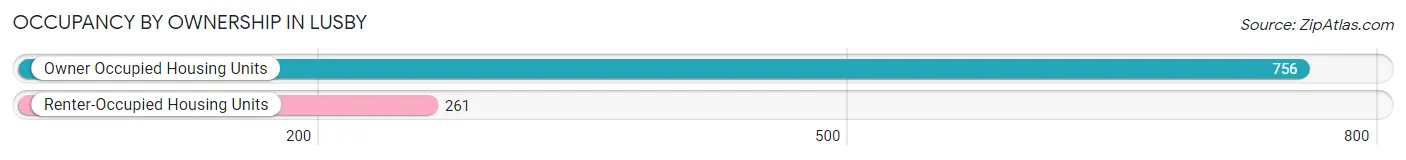
| Occupancy | # Housing Units | % Housing Units |
| Owner Occupied Housing Units | 756 | 74.3% |
| Renter-Occupied Housing Units | 261 | 25.7% |
| Total Occupied Housing Units | 1,017 | 100.0% |
Occupancy by Household Size in Lusby
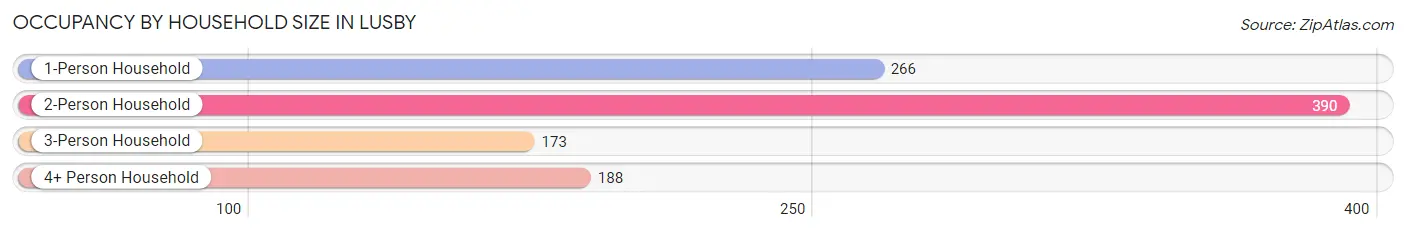
| Household Size | # Housing Units | % Housing Units |
| 1-Person Household | 266 | 26.2% |
| 2-Person Household | 390 | 38.4% |
| 3-Person Household | 173 | 17.0% |
| 4+ Person Household | 188 | 18.5% |
| Total Housing Units | 1,017 | 100.0% |
Occupancy by Ownership by Household Size in Lusby
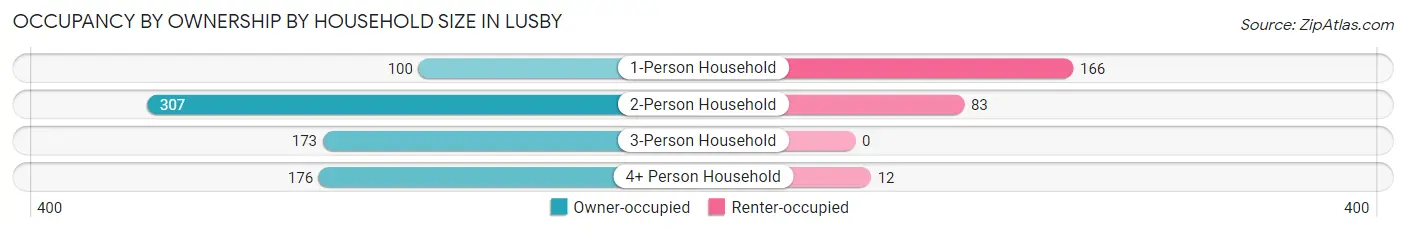
| Household Size | Owner-occupied | Renter-occupied |
| 1-Person Household | 100 (37.6%) | 166 (62.4%) |
| 2-Person Household | 307 (78.7%) | 83 (21.3%) |
| 3-Person Household | 173 (100.0%) | 0 (0.0%) |
| 4+ Person Household | 176 (93.6%) | 12 (6.4%) |
| Total Housing Units | 756 (74.3%) | 261 (25.7%) |
Occupancy by Educational Attainment in Lusby
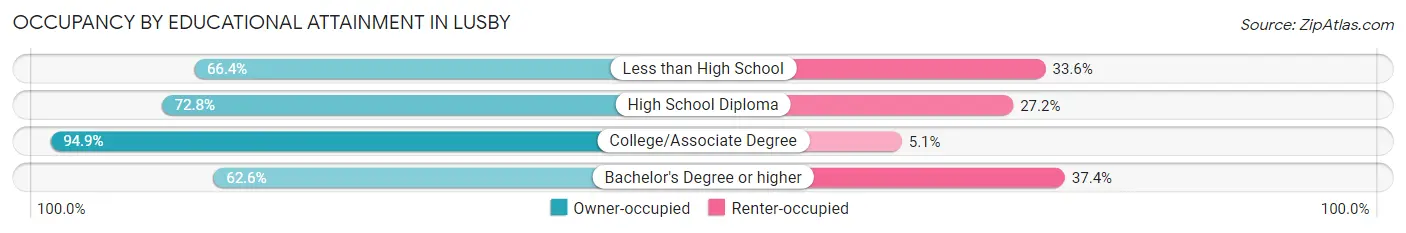
| Household Size | Owner-occupied | Renter-occupied |
| Less than High School | 89 (66.4%) | 45 (33.6%) |
| High School Diploma | 225 (72.8%) | 84 (27.2%) |
| College/Associate Degree | 243 (94.9%) | 13 (5.1%) |
| Bachelor's Degree or higher | 199 (62.6%) | 119 (37.4%) |
Occupancy by Age of Householder in Lusby
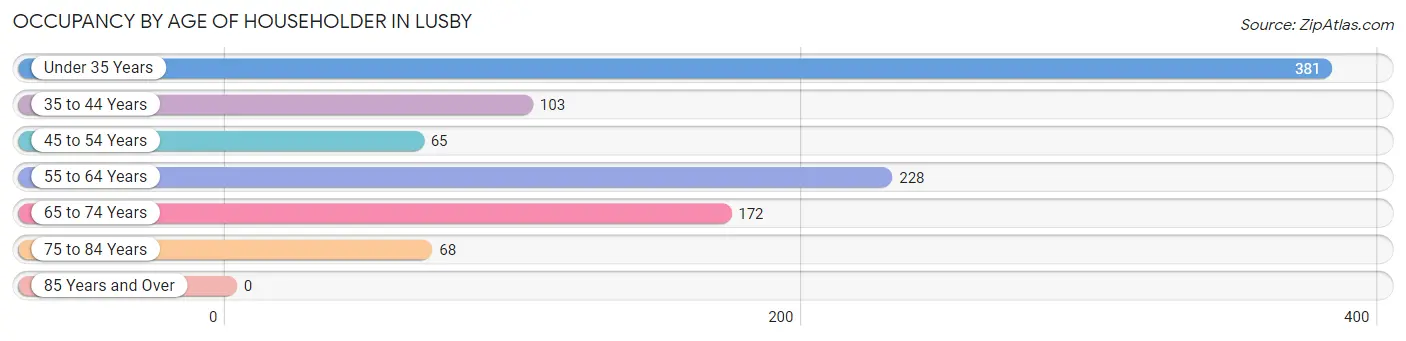
| Age Bracket | # Households | % Households |
| Under 35 Years | 381 | 37.5% |
| 35 to 44 Years | 103 | 10.1% |
| 45 to 54 Years | 65 | 6.4% |
| 55 to 64 Years | 228 | 22.4% |
| 65 to 74 Years | 172 | 16.9% |
| 75 to 84 Years | 68 | 6.7% |
| 85 Years and Over | 0 | 0.0% |
| Total | 1,017 | 100.0% |
Housing Finances in Lusby
Median Income by Occupancy in Lusby
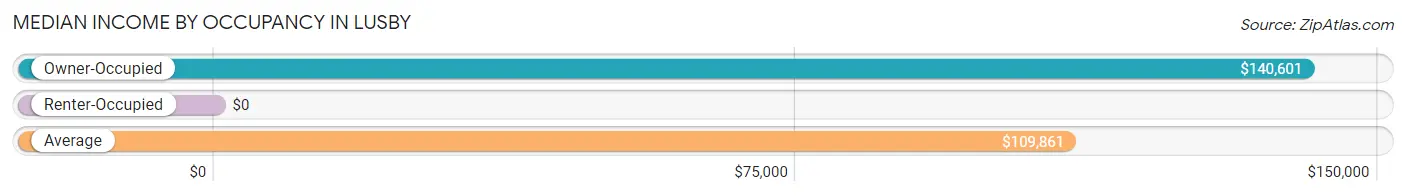
| Occupancy Type | # Households | Median Income |
| Owner-Occupied | 756 (74.3%) | $140,601 |
| Renter-Occupied | 261 (25.7%) | $0 |
| Average | 1,017 (100.0%) | $109,861 |
Occupancy by Householder Income Bracket in Lusby
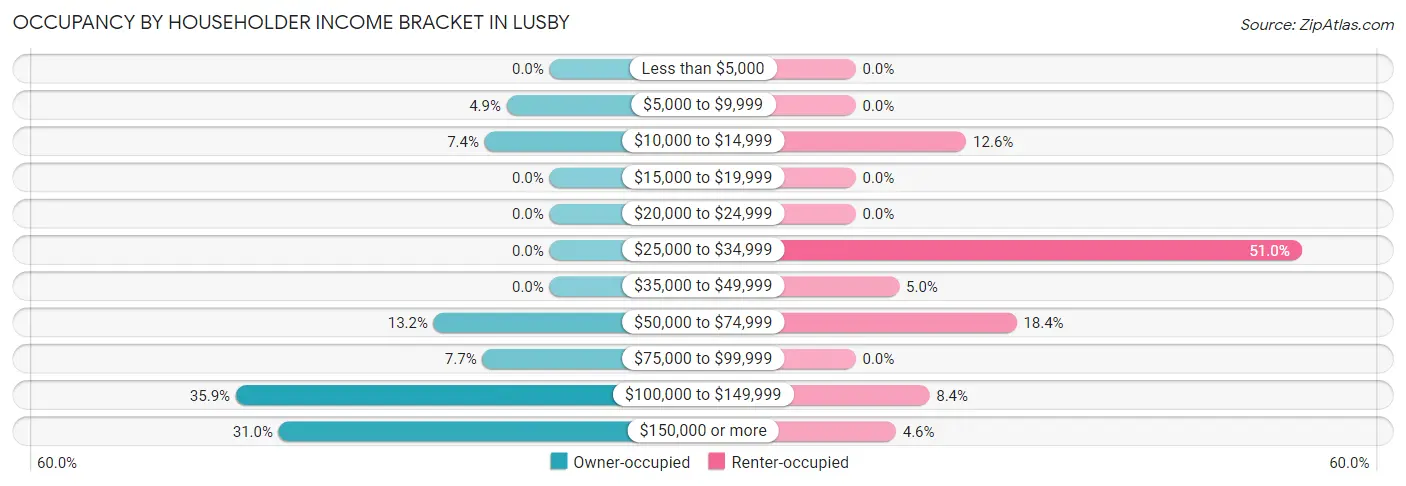
| Income Bracket | Owner-occupied | Renter-occupied |
| Less than $5,000 | 0 (0.0%) | 0 (0.0%) |
| $5,000 to $9,999 | 37 (4.9%) | 0 (0.0%) |
| $10,000 to $14,999 | 56 (7.4%) | 33 (12.6%) |
| $15,000 to $19,999 | 0 (0.0%) | 0 (0.0%) |
| $20,000 to $24,999 | 0 (0.0%) | 0 (0.0%) |
| $25,000 to $34,999 | 0 (0.0%) | 133 (51.0%) |
| $35,000 to $49,999 | 0 (0.0%) | 13 (5.0%) |
| $50,000 to $74,999 | 100 (13.2%) | 48 (18.4%) |
| $75,000 to $99,999 | 58 (7.7%) | 0 (0.0%) |
| $100,000 to $149,999 | 271 (35.8%) | 22 (8.4%) |
| $150,000 or more | 234 (30.9%) | 12 (4.6%) |
| Total | 756 (100.0%) | 261 (100.0%) |
Monthly Housing Cost Tiers in Lusby
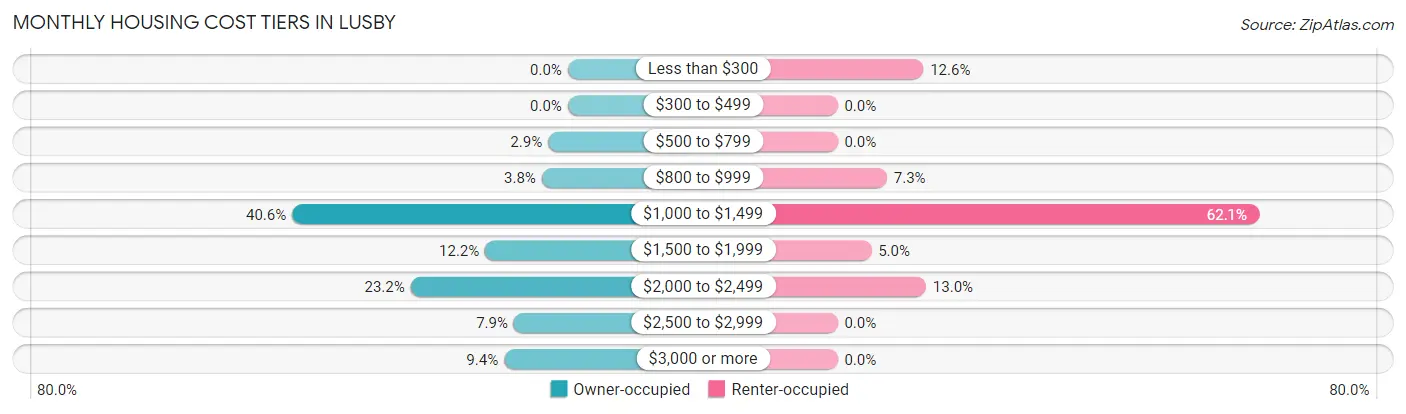
| Monthly Cost | Owner-occupied | Renter-occupied |
| Less than $300 | 0 (0.0%) | 33 (12.6%) |
| $300 to $499 | 0 (0.0%) | 0 (0.0%) |
| $500 to $799 | 22 (2.9%) | 0 (0.0%) |
| $800 to $999 | 29 (3.8%) | 19 (7.3%) |
| $1,000 to $1,499 | 307 (40.6%) | 162 (62.1%) |
| $1,500 to $1,999 | 92 (12.2%) | 13 (5.0%) |
| $2,000 to $2,499 | 175 (23.2%) | 34 (13.0%) |
| $2,500 to $2,999 | 60 (7.9%) | 0 (0.0%) |
| $3,000 or more | 71 (9.4%) | 0 (0.0%) |
| Total | 756 (100.0%) | 261 (100.0%) |
Physical Housing Characteristics in Lusby
Housing Structures in Lusby
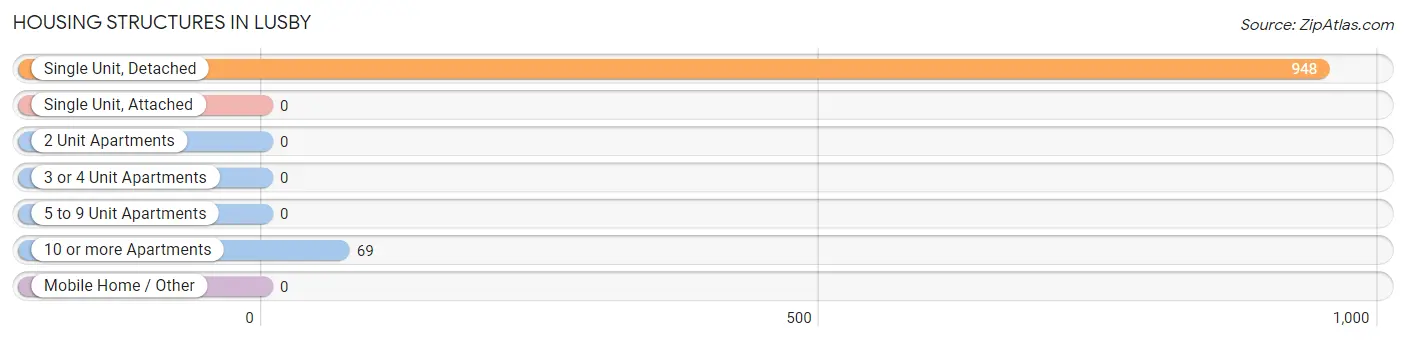
| Structure Type | # Housing Units | % Housing Units |
| Single Unit, Detached | 948 | 93.2% |
| Single Unit, Attached | 0 | 0.0% |
| 2 Unit Apartments | 0 | 0.0% |
| 3 or 4 Unit Apartments | 0 | 0.0% |
| 5 to 9 Unit Apartments | 0 | 0.0% |
| 10 or more Apartments | 69 | 6.8% |
| Mobile Home / Other | 0 | 0.0% |
| Total | 1,017 | 100.0% |
Housing Structures by Occupancy in Lusby
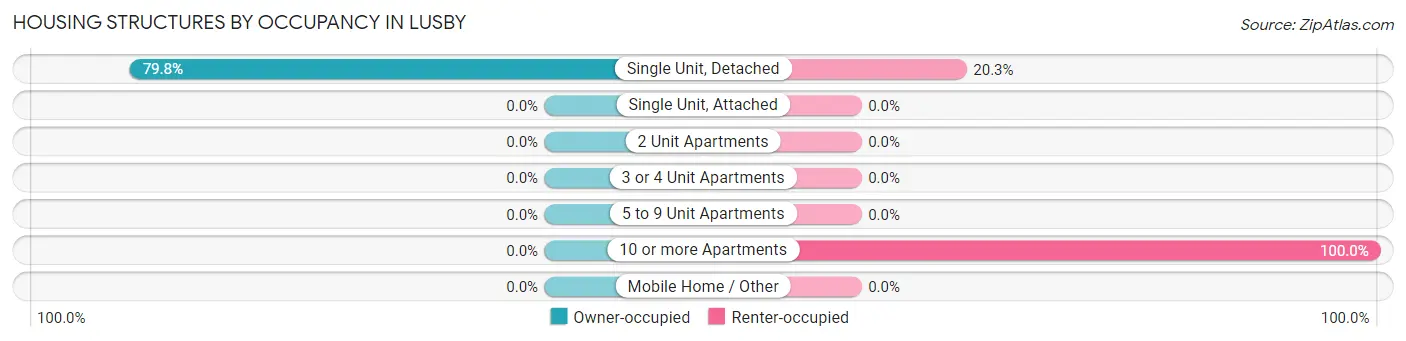
| Structure Type | Owner-occupied | Renter-occupied |
| Single Unit, Detached | 756 (79.7%) | 192 (20.3%) |
| Single Unit, Attached | 0 (0.0%) | 0 (0.0%) |
| 2 Unit Apartments | 0 (0.0%) | 0 (0.0%) |
| 3 or 4 Unit Apartments | 0 (0.0%) | 0 (0.0%) |
| 5 to 9 Unit Apartments | 0 (0.0%) | 0 (0.0%) |
| 10 or more Apartments | 0 (0.0%) | 69 (100.0%) |
| Mobile Home / Other | 0 (0.0%) | 0 (0.0%) |
| Total | 756 (74.3%) | 261 (25.7%) |
Housing Structures by Number of Rooms in Lusby
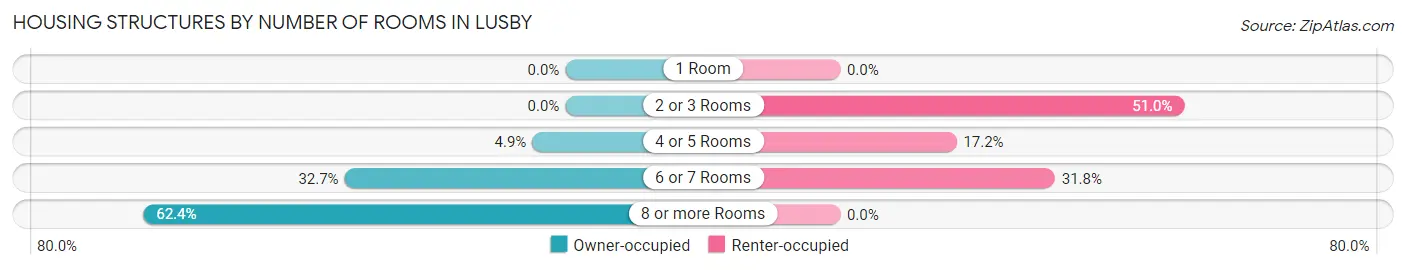
| Number of Rooms | Owner-occupied | Renter-occupied |
| 1 Room | 0 (0.0%) | 0 (0.0%) |
| 2 or 3 Rooms | 0 (0.0%) | 133 (51.0%) |
| 4 or 5 Rooms | 37 (4.9%) | 45 (17.2%) |
| 6 or 7 Rooms | 247 (32.7%) | 83 (31.8%) |
| 8 or more Rooms | 472 (62.4%) | 0 (0.0%) |
| Total | 756 (100.0%) | 261 (100.0%) |
Housing Structure by Heating Type in Lusby
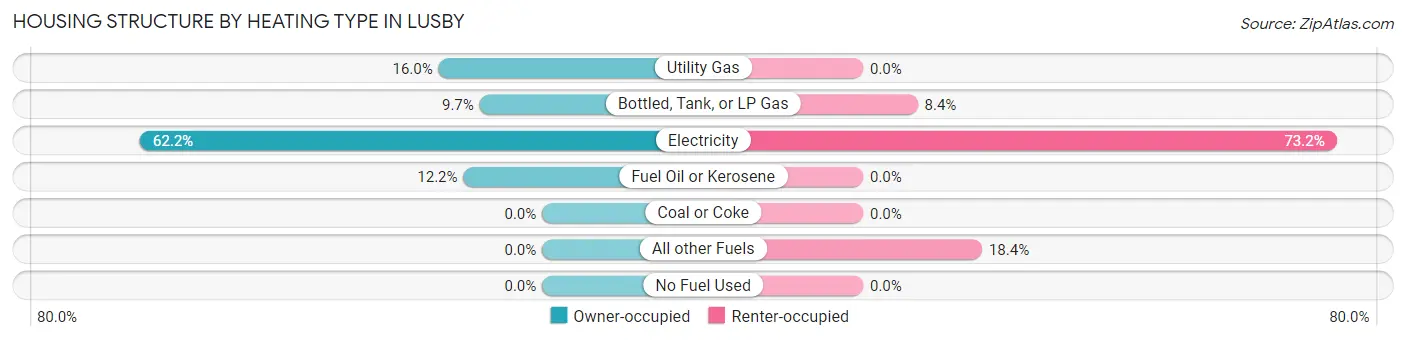
| Heating Type | Owner-occupied | Renter-occupied |
| Utility Gas | 121 (16.0%) | 0 (0.0%) |
| Bottled, Tank, or LP Gas | 73 (9.7%) | 22 (8.4%) |
| Electricity | 470 (62.2%) | 191 (73.2%) |
| Fuel Oil or Kerosene | 92 (12.2%) | 0 (0.0%) |
| Coal or Coke | 0 (0.0%) | 0 (0.0%) |
| All other Fuels | 0 (0.0%) | 48 (18.4%) |
| No Fuel Used | 0 (0.0%) | 0 (0.0%) |
| Total | 756 (100.0%) | 261 (100.0%) |
Household Vehicle Usage in Lusby
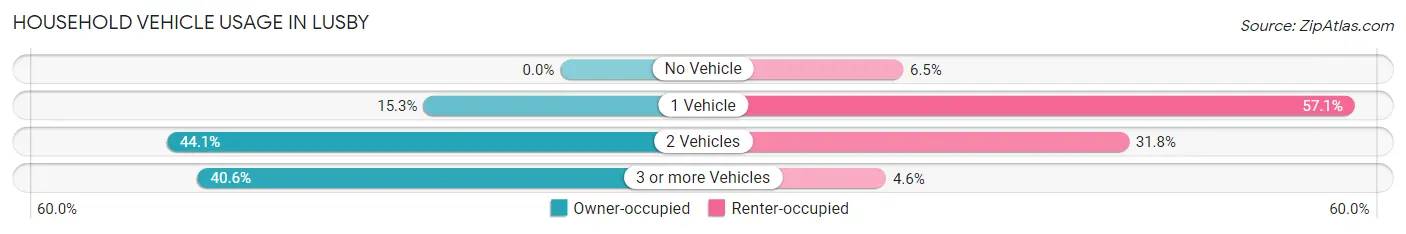
| Vehicles per Household | Owner-occupied | Renter-occupied |
| No Vehicle | 0 (0.0%) | 17 (6.5%) |
| 1 Vehicle | 116 (15.3%) | 149 (57.1%) |
| 2 Vehicles | 333 (44.1%) | 83 (31.8%) |
| 3 or more Vehicles | 307 (40.6%) | 12 (4.6%) |
| Total | 756 (100.0%) | 261 (100.0%) |
Real Estate & Mortgages in Lusby
Real Estate and Mortgage Overview in Lusby
| Characteristic | Without Mortgage | With Mortgage |
| Housing Units | 60 | 696 |
| Median Property Value | $569,000 | $294,300 |
| Median Household Income | - | - |
| Monthly Housing Costs | $828 | $71 |
| Real Estate Taxes | $3,588 | $9 |
Property Value by Mortgage Status in Lusby
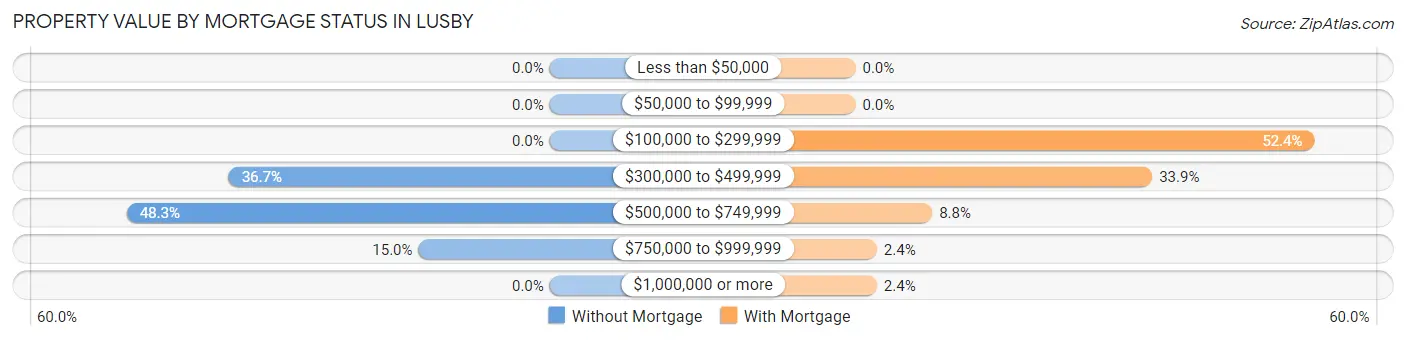
| Property Value | Without Mortgage | With Mortgage |
| Less than $50,000 | 0 (0.0%) | 0 (0.0%) |
| $50,000 to $99,999 | 0 (0.0%) | 0 (0.0%) |
| $100,000 to $299,999 | 0 (0.0%) | 365 (52.4%) |
| $300,000 to $499,999 | 22 (36.7%) | 236 (33.9%) |
| $500,000 to $749,999 | 29 (48.3%) | 61 (8.8%) |
| $750,000 to $999,999 | 9 (15.0%) | 17 (2.4%) |
| $1,000,000 or more | 0 (0.0%) | 17 (2.4%) |
| Total | 60 (100.0%) | 696 (100.0%) |
Household Income by Mortgage Status in Lusby
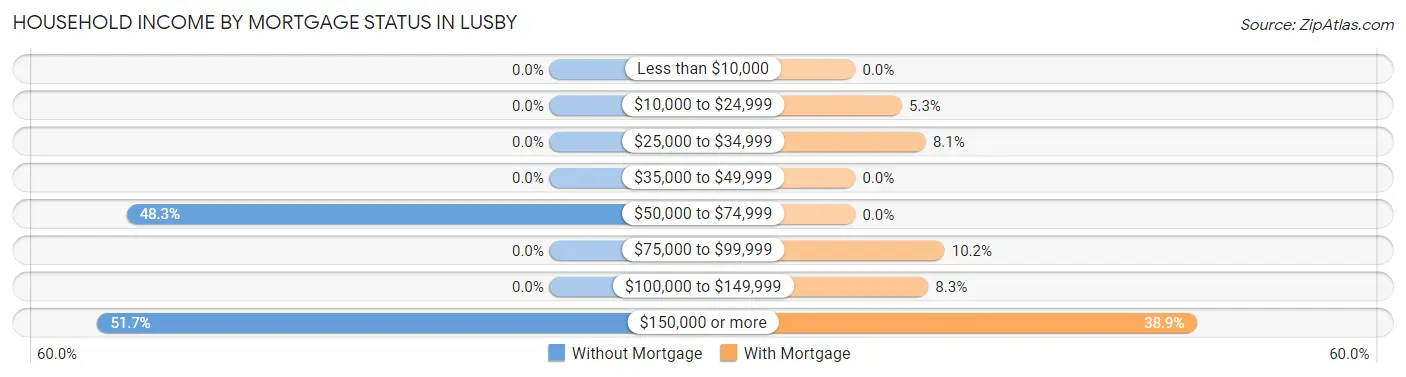
| Household Income | Without Mortgage | With Mortgage |
| Less than $10,000 | 0 (0.0%) | 0 (0.0%) |
| $10,000 to $24,999 | 0 (0.0%) | 37 (5.3%) |
| $25,000 to $34,999 | 0 (0.0%) | 56 (8.1%) |
| $35,000 to $49,999 | 0 (0.0%) | 0 (0.0%) |
| $50,000 to $74,999 | 29 (48.3%) | 0 (0.0%) |
| $75,000 to $99,999 | 0 (0.0%) | 71 (10.2%) |
| $100,000 to $149,999 | 0 (0.0%) | 58 (8.3%) |
| $150,000 or more | 31 (51.7%) | 271 (38.9%) |
| Total | 60 (100.0%) | 696 (100.0%) |
Property Value to Household Income Ratio in Lusby
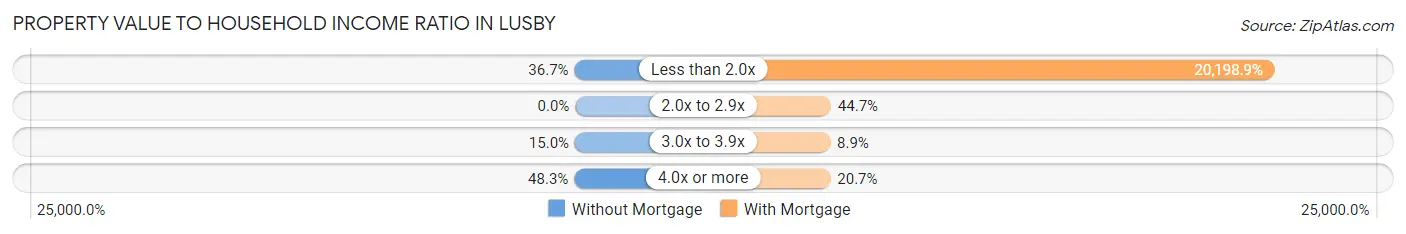
| Value-to-Income Ratio | Without Mortgage | With Mortgage |
| Less than 2.0x | 22 (36.7%) | 140,584 (20,198.8%) |
| 2.0x to 2.9x | 0 (0.0%) | 311 (44.7%) |
| 3.0x to 3.9x | 9 (15.0%) | 62 (8.9%) |
| 4.0x or more | 29 (48.3%) | 144 (20.7%) |
| Total | 60 (100.0%) | 696 (100.0%) |
Real Estate Taxes by Mortgage Status in Lusby
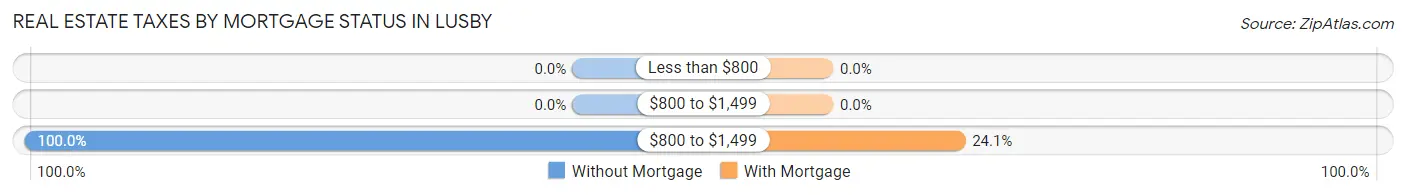
| Property Taxes | Without Mortgage | With Mortgage |
| Less than $800 | 0 (0.0%) | 0 (0.0%) |
| $800 to $1,499 | 0 (0.0%) | 0 (0.0%) |
| $800 to $1,499 | 60 (100.0%) | 168 (24.1%) |
| Total | 60 (100.0%) | 696 (100.0%) |
Health & Disability in Lusby
Health Insurance Coverage by Age in Lusby
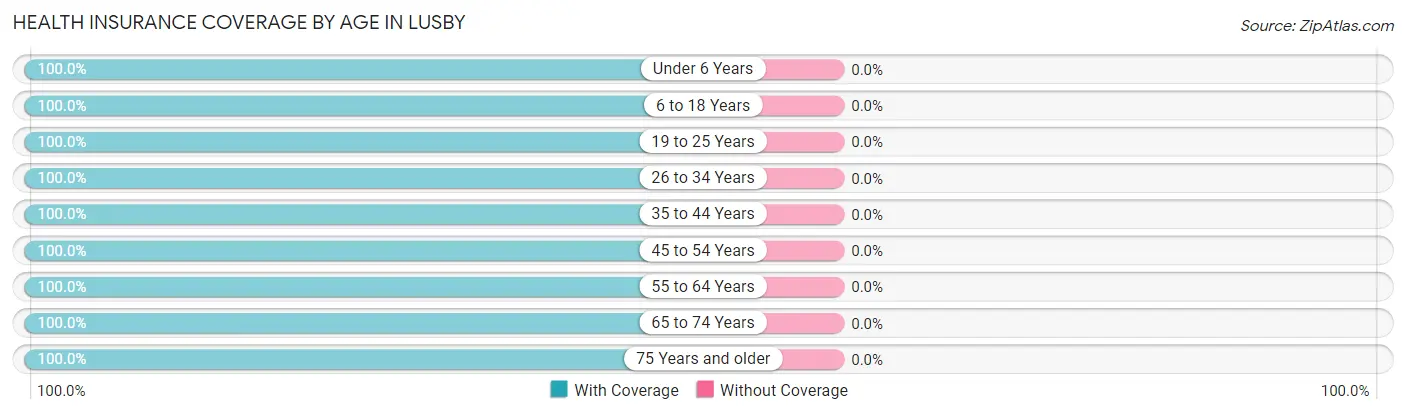
| Age Bracket | With Coverage | Without Coverage |
| Under 6 Years | 134 (100.0%) | 0 (0.0%) |
| 6 to 18 Years | 284 (100.0%) | 0 (0.0%) |
| 19 to 25 Years | 188 (100.0%) | 0 (0.0%) |
| 26 to 34 Years | 675 (100.0%) | 0 (0.0%) |
| 35 to 44 Years | 209 (100.0%) | 0 (0.0%) |
| 45 to 54 Years | 102 (100.0%) | 0 (0.0%) |
| 55 to 64 Years | 391 (100.0%) | 0 (0.0%) |
| 65 to 74 Years | 254 (100.0%) | 0 (0.0%) |
| 75 Years and older | 113 (100.0%) | 0 (0.0%) |
| Total | 2,350 (100.0%) | 0 (0.0%) |
Health Insurance Coverage by Citizenship Status in Lusby
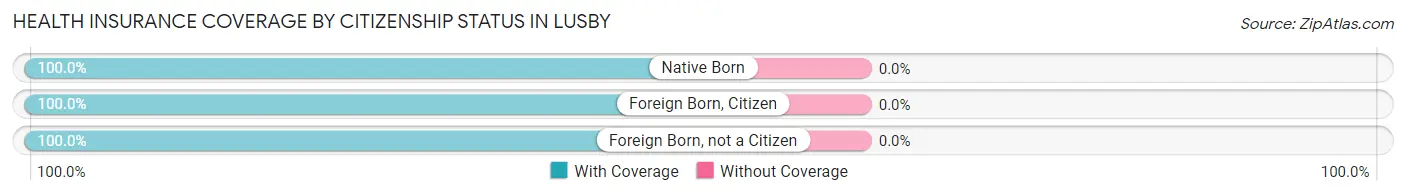
| Citizenship Status | With Coverage | Without Coverage |
| Native Born | 134 (100.0%) | 0 (0.0%) |
| Foreign Born, Citizen | 284 (100.0%) | 0 (0.0%) |
| Foreign Born, not a Citizen | 188 (100.0%) | 0 (0.0%) |
Health Insurance Coverage by Household Income in Lusby
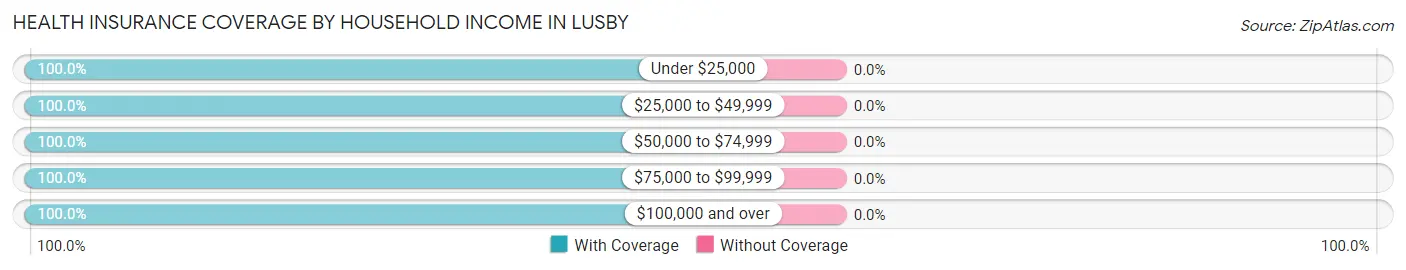
| Household Income | With Coverage | Without Coverage |
| Under $25,000 | 173 (100.0%) | 0 (0.0%) |
| $25,000 to $49,999 | 157 (100.0%) | 0 (0.0%) |
| $50,000 to $74,999 | 369 (100.0%) | 0 (0.0%) |
| $75,000 to $99,999 | 141 (100.0%) | 0 (0.0%) |
| $100,000 and over | 1,506 (100.0%) | 0 (0.0%) |
Public vs Private Health Insurance Coverage by Age in Lusby
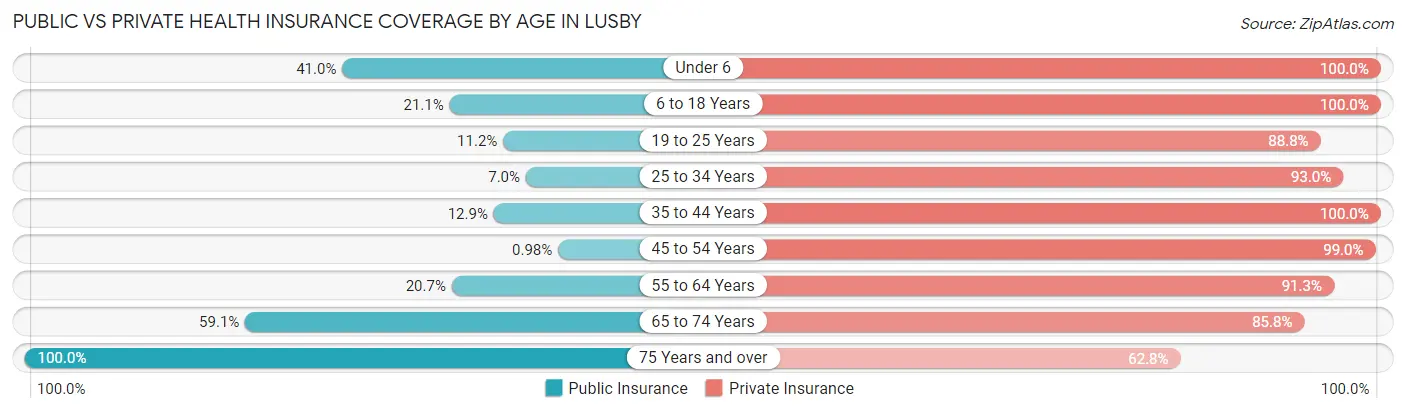
| Age Bracket | Public Insurance | Private Insurance |
| Under 6 | 55 (41.0%) | 134 (100.0%) |
| 6 to 18 Years | 60 (21.1%) | 284 (100.0%) |
| 19 to 25 Years | 21 (11.2%) | 167 (88.8%) |
| 25 to 34 Years | 47 (7.0%) | 628 (93.0%) |
| 35 to 44 Years | 27 (12.9%) | 209 (100.0%) |
| 45 to 54 Years | 1 (1.0%) | 101 (99.0%) |
| 55 to 64 Years | 81 (20.7%) | 357 (91.3%) |
| 65 to 74 Years | 150 (59.1%) | 218 (85.8%) |
| 75 Years and over | 113 (100.0%) | 71 (62.8%) |
| Total | 555 (23.6%) | 2,169 (92.3%) |
Disability Status by Sex by Age in Lusby
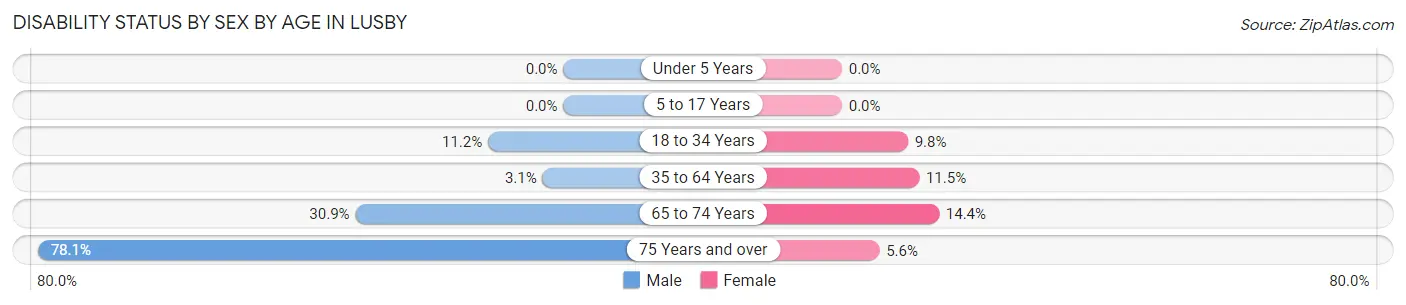
| Age Bracket | Male | Female |
| Under 5 Years | 0 (0.0%) | 0 (0.0%) |
| 5 to 17 Years | 0 (0.0%) | 0 (0.0%) |
| 18 to 34 Years | 73 (11.2%) | 23 (9.8%) |
| 35 to 64 Years | 12 (3.1%) | 36 (11.5%) |
| 65 to 74 Years | 42 (30.9%) | 17 (14.4%) |
| 75 Years and over | 32 (78.0%) | 4 (5.6%) |
Disability Class by Sex by Age in Lusby
Disability Class: Hearing Difficulty
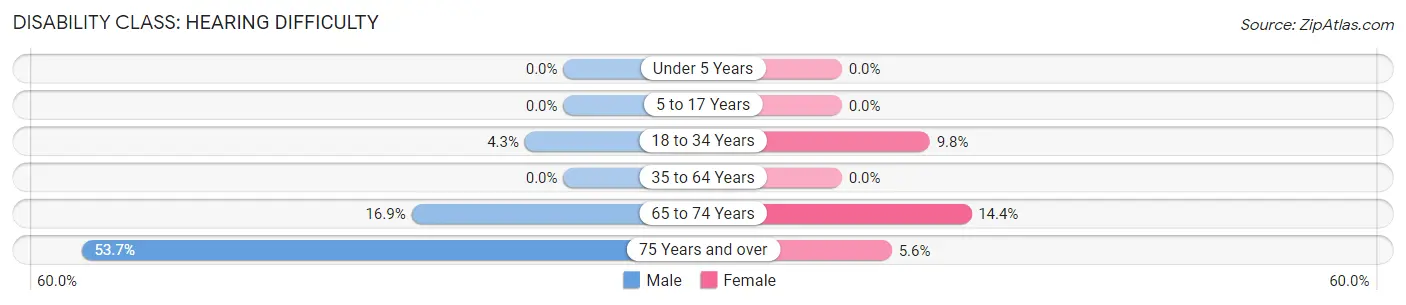
| Age Bracket | Male | Female |
| Under 5 Years | 0 (0.0%) | 0 (0.0%) |
| 5 to 17 Years | 0 (0.0%) | 0 (0.0%) |
| 18 to 34 Years | 28 (4.3%) | 23 (9.8%) |
| 35 to 64 Years | 0 (0.0%) | 0 (0.0%) |
| 65 to 74 Years | 23 (16.9%) | 17 (14.4%) |
| 75 Years and over | 22 (53.7%) | 4 (5.6%) |
Disability Class: Vision Difficulty
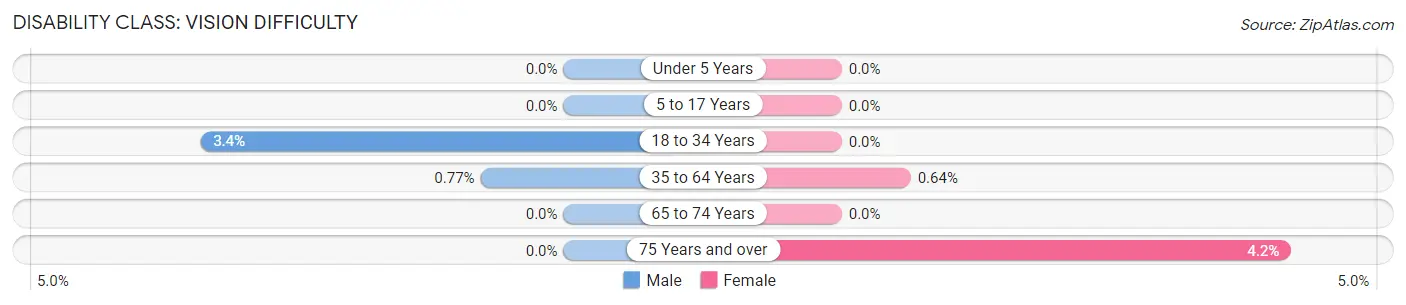
| Age Bracket | Male | Female |
| Under 5 Years | 0 (0.0%) | 0 (0.0%) |
| 5 to 17 Years | 0 (0.0%) | 0 (0.0%) |
| 18 to 34 Years | 22 (3.4%) | 0 (0.0%) |
| 35 to 64 Years | 3 (0.8%) | 2 (0.6%) |
| 65 to 74 Years | 0 (0.0%) | 0 (0.0%) |
| 75 Years and over | 0 (0.0%) | 3 (4.2%) |
Disability Class: Cognitive Difficulty
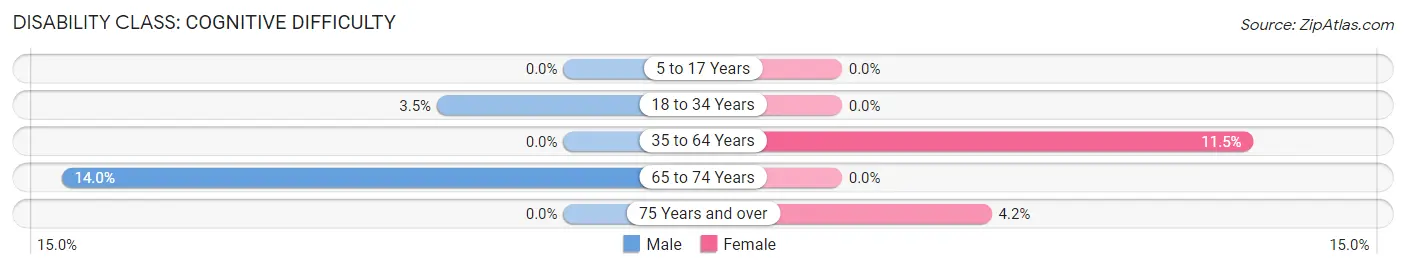
| Age Bracket | Male | Female |
| 5 to 17 Years | 0 (0.0%) | 0 (0.0%) |
| 18 to 34 Years | 23 (3.5%) | 0 (0.0%) |
| 35 to 64 Years | 0 (0.0%) | 36 (11.5%) |
| 65 to 74 Years | 19 (14.0%) | 0 (0.0%) |
| 75 Years and over | 0 (0.0%) | 3 (4.2%) |
Disability Class: Ambulatory Difficulty
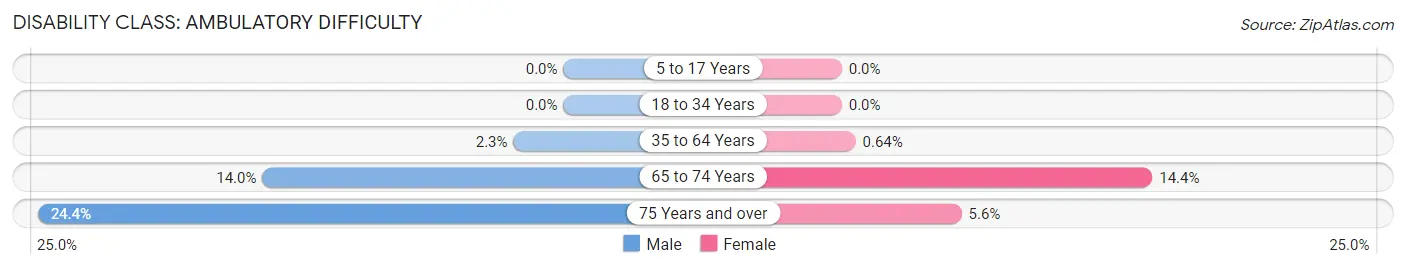
| Age Bracket | Male | Female |
| 5 to 17 Years | 0 (0.0%) | 0 (0.0%) |
| 18 to 34 Years | 0 (0.0%) | 0 (0.0%) |
| 35 to 64 Years | 9 (2.3%) | 2 (0.6%) |
| 65 to 74 Years | 19 (14.0%) | 17 (14.4%) |
| 75 Years and over | 10 (24.4%) | 4 (5.6%) |
Disability Class: Self-Care Difficulty
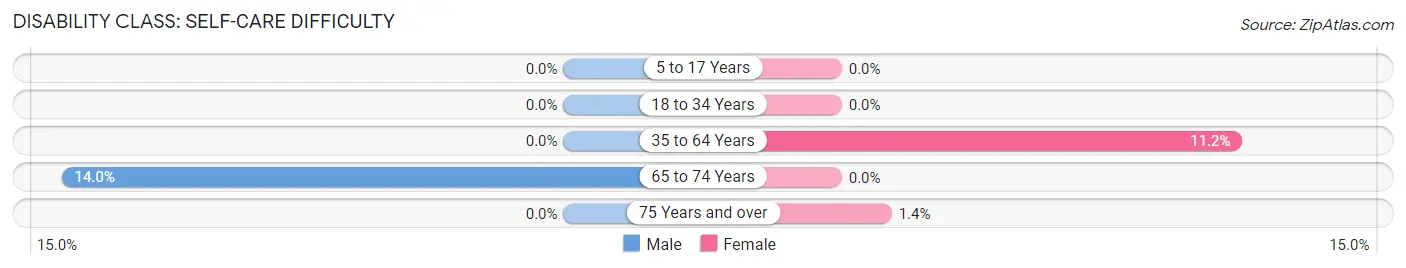
| Age Bracket | Male | Female |
| 5 to 17 Years | 0 (0.0%) | 0 (0.0%) |
| 18 to 34 Years | 0 (0.0%) | 0 (0.0%) |
| 35 to 64 Years | 0 (0.0%) | 35 (11.2%) |
| 65 to 74 Years | 19 (14.0%) | 0 (0.0%) |
| 75 Years and over | 0 (0.0%) | 1 (1.4%) |
Technology Access in Lusby
Computing Device Access in Lusby
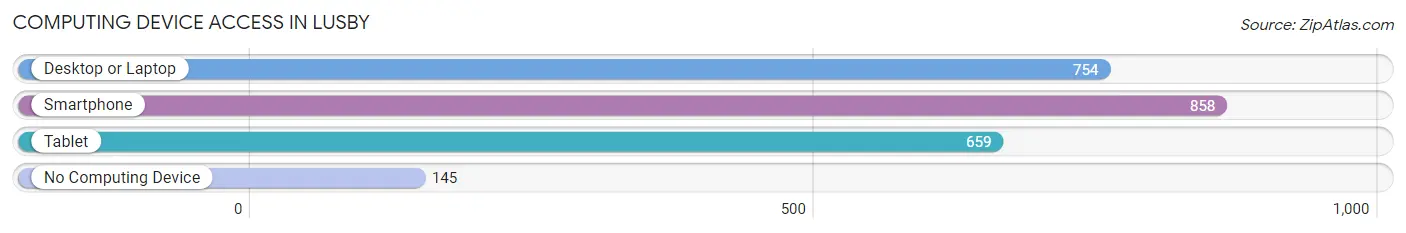
| Device Type | # Households | % Households |
| Desktop or Laptop | 754 | 74.1% |
| Smartphone | 858 | 84.4% |
| Tablet | 659 | 64.8% |
| No Computing Device | 145 | 14.3% |
| Total | 1,017 | 100.0% |
Internet Access in Lusby
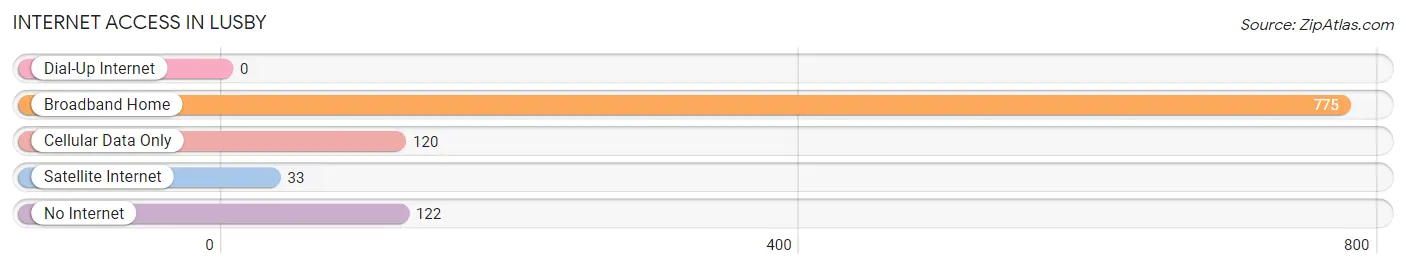
| Internet Type | # Households | % Households |
| Dial-Up Internet | 0 | 0.0% |
| Broadband Home | 775 | 76.2% |
| Cellular Data Only | 120 | 11.8% |
| Satellite Internet | 33 | 3.2% |
| No Internet | 122 | 12.0% |
| Total | 1,017 | 100.0% |
Lusby Summary
Lusby is an unincorporated community located in Calvert County, Maryland. It is situated on the western shore of the Chesapeake Bay, approximately 25 miles south of Annapolis and 40 miles southeast of Washington, D.C. The community is part of the Washington-Arlington-Alexandria metropolitan area.
History
Lusby was first settled in the early 1700s by the Lusby family, who were among the first settlers in the area. The family owned a large tract of land that stretched from the Chesapeake Bay to the Patuxent River. The Lusby family built a large plantation house on the property, which is now known as the Lusby-Tayloe House.
The area was originally known as Lusby's Neck, and the community was officially established in 1872. The town was named after the Lusby family, who were prominent landowners in the area.
Geography
Lusby is located in Calvert County, Maryland, on the western shore of the Chesapeake Bay. It is situated approximately 25 miles south of Annapolis and 40 miles southeast of Washington, D.C. The community is part of the Washington-Arlington-Alexandria metropolitan area.
The town is bordered by the Patuxent River to the north, the Chesapeake Bay to the east, and the town of Solomons to the south. The town is located on a peninsula, with the Patuxent River to the north and the Chesapeake Bay to the east.
Economy
Lusby is primarily a residential community, with a small commercial district located along Maryland Route 2/4. The town is home to several small businesses, including restaurants, convenience stores, and a marina.
The town is also home to the Calvert Cliffs Nuclear Power Plant, which is located on the western shore of the Chesapeake Bay. The plant is owned and operated by Exelon Corporation and provides electricity to the region.
Demographics
As of the 2010 census, the population of Lusby was 8,837. The racial makeup of the town was 87.3% White, 8.2% African American, 0.7% Native American, 0.9% Asian, 0.1% Pacific Islander, and 2.8% from other races. Hispanic or Latino of any race were 3.3% of the population.
The median household income in Lusby was $76,944, and the median family income was $86,944. The per capita income for the town was $32,944. About 5.3% of families and 6.7% of the population were below the poverty line, including 8.2% of those under age 18 and 4.2% of those age 65 or over.
Common Questions
What is Per Capita Income in Lusby?
Per Capita income in Lusby is $50,075.
What is the Median Family Income in Lusby?
Median Family Income in Lusby is $126,087.
What is the Median Household income in Lusby?
Median Household Income in Lusby is $109,861.
What is Income or Wage Gap in Lusby?
Income or Wage Gap in Lusby is 11.3%.
Women in Lusby earn 88.7 cents for every dollar earned by a man.
What is Inequality or Gini Index in Lusby?
Inequality or Gini Index in Lusby is 0.41.
What is the Total Population of Lusby?
Total Population of Lusby is 2,350.
What is the Total Male Population of Lusby?
Total Male Population of Lusby is 1,434.
What is the Total Female Population of Lusby?
Total Female Population of Lusby is 916.
What is the Ratio of Males per 100 Females in Lusby?
There are 156.55 Males per 100 Females in Lusby.
What is the Ratio of Females per 100 Males in Lusby?
There are 63.88 Females per 100 Males in Lusby.
What is the Median Population Age in Lusby?
Median Population Age in Lusby is 32.3 Years.
What is the Average Family Size in Lusby
Average Family Size in Lusby is 3.0 People.
What is the Average Household Size in Lusby
Average Household Size in Lusby is 2.3 People.
How Large is the Labor Force in Lusby?
There are 1,483 People in the Labor Forcein in Lusby.
What is the Percentage of People in the Labor Force in Lusby?
73.8% of People are in the Labor Force in Lusby.
What is the Unemployment Rate in Lusby?
Unemployment Rate in Lusby is 3.1%.