Mount Crested Butte, CO Map & Demographics
Mount Crested Butte Map
Mount Crested Butte Overview
$61,454
PER CAPITA INCOME
$127,422
AVG FAMILY INCOME
$93,194
AVG HOUSEHOLD INCOME
0.7%
WAGE / INCOME GAP [ % ]
99.3¢/ $1
WAGE / INCOME GAP [ $ ]
0.41
INEQUALITY / GINI INDEX
869
TOTAL POPULATION
459
MALE POPULATION
410
FEMALE POPULATION
111.95
MALES / 100 FEMALES
89.32
FEMALES / 100 MALES
43.7
MEDIAN AGE
2.2
AVG FAMILY SIZE
1.9
AVG HOUSEHOLD SIZE
649
LABOR FORCE [ PEOPLE ]
77.3%
PERCENT IN LABOR FORCE
Income in Mount Crested Butte
Income Overview in Mount Crested Butte
Per Capita Income in Mount Crested Butte is $61,454, while median incomes of families and households are $127,422 and $93,194 respectively.
| Characteristic | Number | Measure |
| Per Capita Income | 869 | $61,454 |
| Median Family Income | 251 | $127,422 |
| Mean Family Income | 251 | $159,660 |
| Median Household Income | 447 | $93,194 |
| Mean Household Income | 447 | $115,440 |
| Income Deficit | 251 | $0 |
| Wage / Income Gap (%) | 869 | 0.65% |
| Wage / Income Gap ($) | 869 | 99.35¢ per $1 |
| Gini / Inequality Index | 869 | 0.41 |
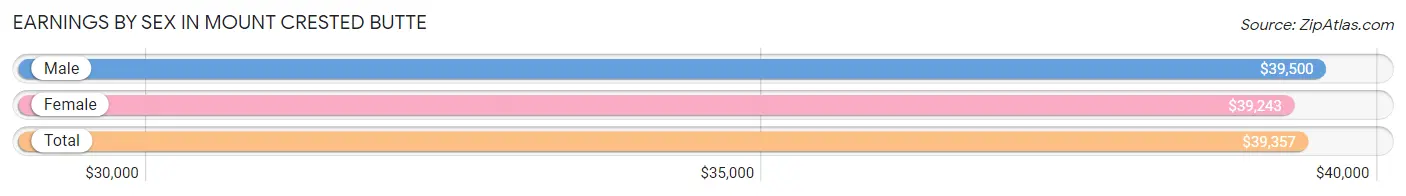
Earnings by Sex in Mount Crested Butte
Average Earnings in Mount Crested Butte are $39,357, $39,500 for men and $39,243 for women, a difference of 0.6%.
| Sex | Number | Average Earnings |
| Male | 366 (52.7%) | $39,500 |
| Female | 329 (47.3%) | $39,243 |
| Total | 695 (100.0%) | $39,357 |
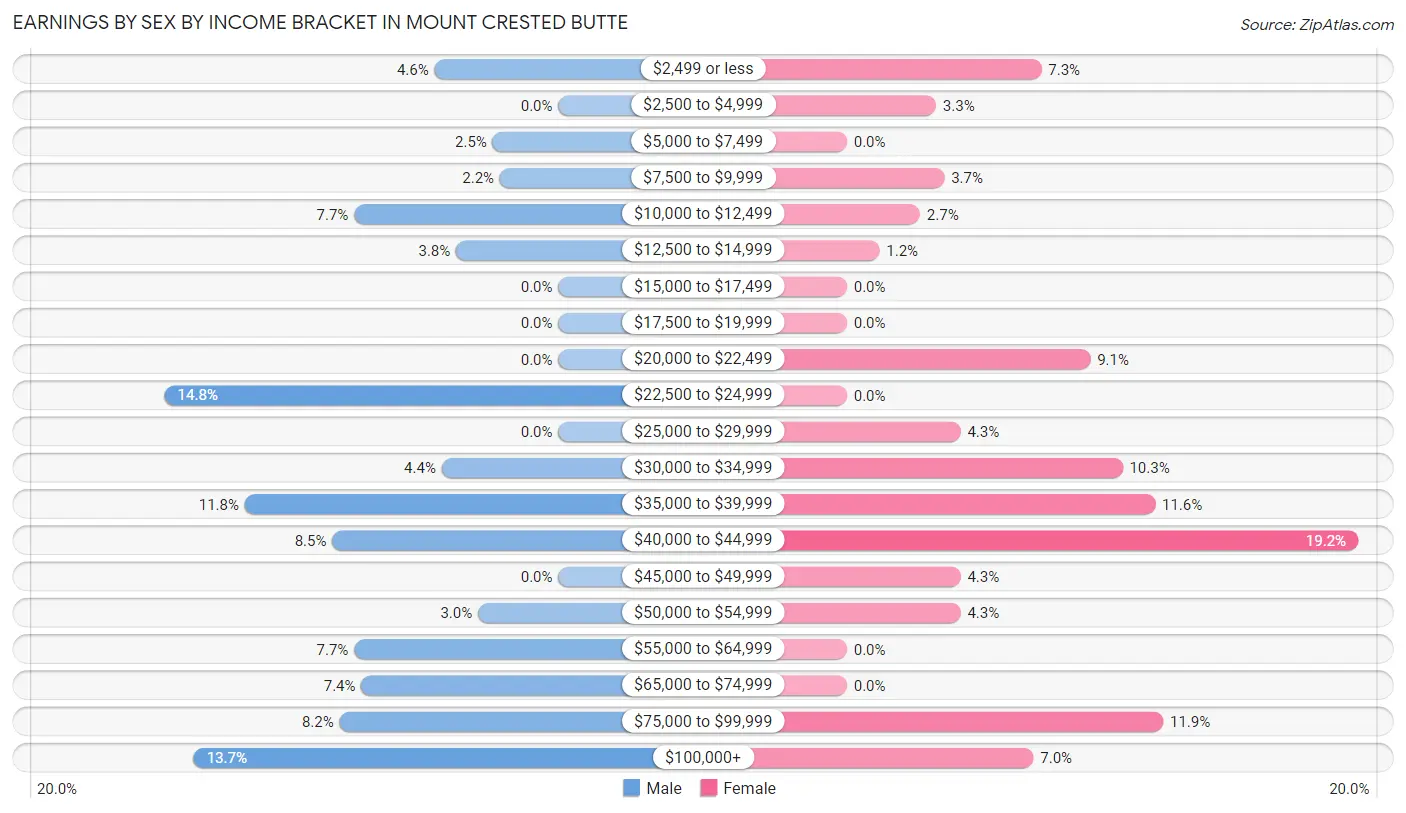
Earnings by Sex by Income Bracket in Mount Crested Butte
The most common earnings brackets in Mount Crested Butte are $22,500 to $24,999 for men (54 | 14.7%) and $40,000 to $44,999 for women (63 | 19.2%).
| Income | Male | Female |
| $2,499 or less | 17 (4.6%) | 24 (7.3%) |
| $2,500 to $4,999 | 0 (0.0%) | 11 (3.3%) |
| $5,000 to $7,499 | 9 (2.5%) | 0 (0.0%) |
| $7,500 to $9,999 | 8 (2.2%) | 12 (3.6%) |
| $10,000 to $12,499 | 28 (7.6%) | 9 (2.7%) |
| $12,500 to $14,999 | 14 (3.8%) | 4 (1.2%) |
| $15,000 to $17,499 | 0 (0.0%) | 0 (0.0%) |
| $17,500 to $19,999 | 0 (0.0%) | 0 (0.0%) |
| $20,000 to $22,499 | 0 (0.0%) | 30 (9.1%) |
| $22,500 to $24,999 | 54 (14.7%) | 0 (0.0%) |
| $25,000 to $29,999 | 0 (0.0%) | 14 (4.3%) |
| $30,000 to $34,999 | 16 (4.4%) | 34 (10.3%) |
| $35,000 to $39,999 | 43 (11.7%) | 38 (11.6%) |
| $40,000 to $44,999 | 31 (8.5%) | 63 (19.2%) |
| $45,000 to $49,999 | 0 (0.0%) | 14 (4.3%) |
| $50,000 to $54,999 | 11 (3.0%) | 14 (4.3%) |
| $55,000 to $64,999 | 28 (7.6%) | 0 (0.0%) |
| $65,000 to $74,999 | 27 (7.4%) | 0 (0.0%) |
| $75,000 to $99,999 | 30 (8.2%) | 39 (11.8%) |
| $100,000+ | 50 (13.7%) | 23 (7.0%) |
| Total | 366 (100.0%) | 329 (100.0%) |
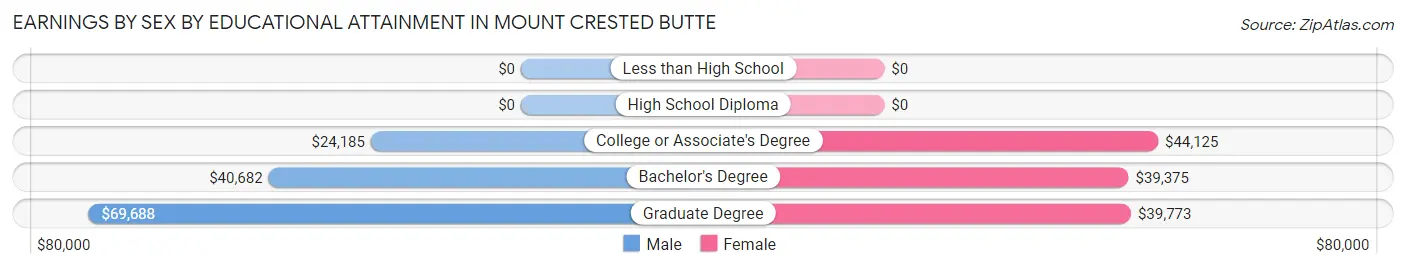
Earnings by Sex by Educational Attainment in Mount Crested Butte
Average earnings in Mount Crested Butte are $41,023 for men and $40,050 for women, a difference of 2.4%. Men with an educational attainment of graduate degree enjoy the highest average annual earnings of $69,688, while those with college or associate's degree education earn the least with $24,185. Women with an educational attainment of college or associate's degree earn the most with the average annual earnings of $44,125, while those with bachelor's degree education have the smallest earnings of $39,375.
| Educational Attainment | Male Income | Female Income |
| Less than High School | - | - |
| High School Diploma | - | - |
| College or Associate's Degree | $24,185 | $44,125 |
| Bachelor's Degree | $40,682 | $39,375 |
| Graduate Degree | $69,688 | $39,773 |
| Total | $41,023 | $40,050 |
Family Income in Mount Crested Butte
Family Income Brackets in Mount Crested Butte
According to the Mount Crested Butte family income data, there are 95 families falling into the $200,000+ income range, which is the most common income bracket and makes up 37.9% of all families.
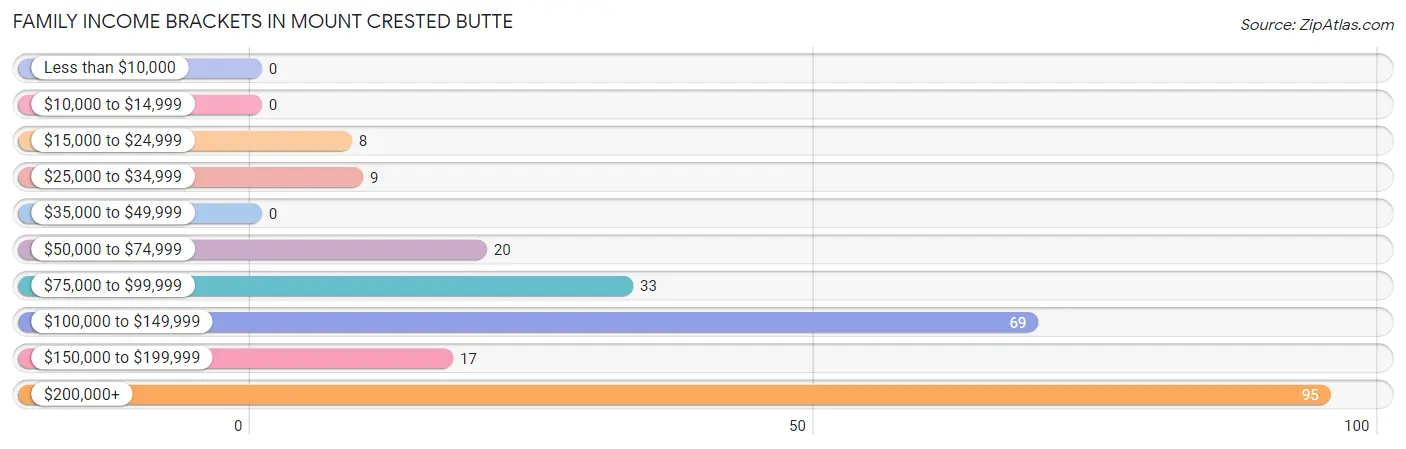
| Income Bracket | # Families | % Families |
| Less than $10,000 | 0 | 0.0% |
| $10,000 to $14,999 | 0 | 0.0% |
| $15,000 to $24,999 | 8 | 3.2% |
| $25,000 to $34,999 | 9 | 3.6% |
| $35,000 to $49,999 | 0 | 0.0% |
| $50,000 to $74,999 | 20 | 8.0% |
| $75,000 to $99,999 | 33 | 13.1% |
| $100,000 to $149,999 | 69 | 27.5% |
| $150,000 to $199,999 | 17 | 6.8% |
| $200,000+ | 95 | 37.8% |
Family Income by Famaliy Size in Mount Crested Butte
2-person families (222 | 88.4%) account for the highest median family income in Mount Crested Butte with $127,344 per family, while 2-person families (222 | 88.4%) have the highest median income of $63,672 per family member.
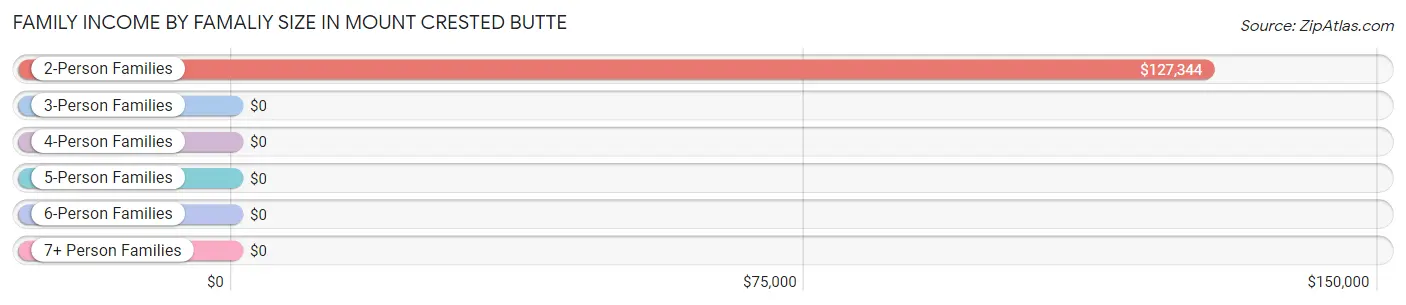
| Income Bracket | # Families | Median Income |
| 2-Person Families | 222 (88.4%) | $127,344 |
| 3-Person Families | 15 (6.0%) | $0 |
| 4-Person Families | 14 (5.6%) | $0 |
| 5-Person Families | 0 (0.0%) | $0 |
| 6-Person Families | 0 (0.0%) | $0 |
| 7+ Person Families | 0 (0.0%) | $0 |
| Total | 251 (100.0%) | $127,422 |
Family Income by Number of Earners in Mount Crested Butte
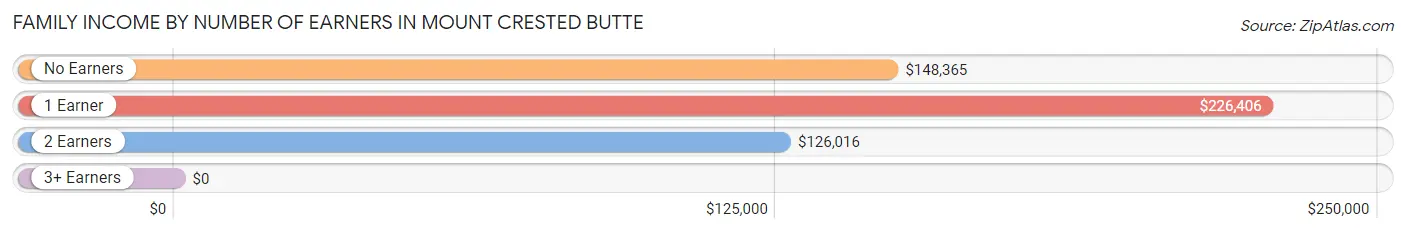
| Number of Earners | # Families | Median Income |
| No Earners | 47 (18.7%) | $148,365 |
| 1 Earner | 37 (14.7%) | $226,406 |
| 2 Earners | 167 (66.5%) | $126,016 |
| 3+ Earners | 0 (0.0%) | $0 |
| Total | 251 (100.0%) | $127,422 |
Household Income in Mount Crested Butte
Household Income Brackets in Mount Crested Butte
With 105 households falling in the category, the $100,000 to $149,999 income range is the most frequent in Mount Crested Butte, accounting for 23.5% of all households.
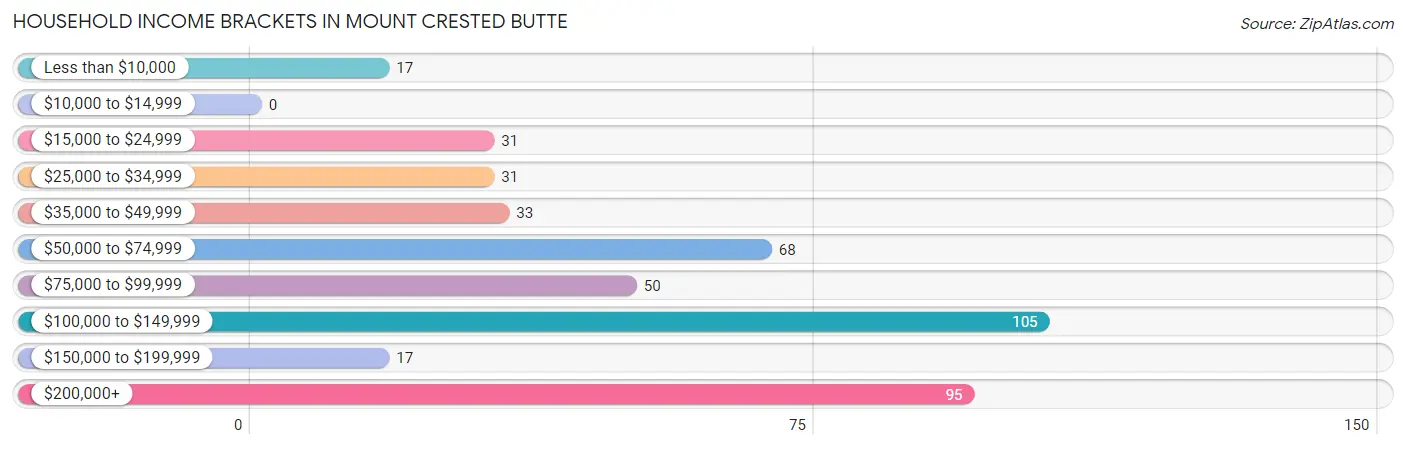
| Income Bracket | # Households | % Households |
| Less than $10,000 | 17 | 3.8% |
| $10,000 to $14,999 | 0 | 0.0% |
| $15,000 to $24,999 | 31 | 6.9% |
| $25,000 to $34,999 | 31 | 6.9% |
| $35,000 to $49,999 | 33 | 7.4% |
| $50,000 to $74,999 | 68 | 15.2% |
| $75,000 to $99,999 | 50 | 11.2% |
| $100,000 to $149,999 | 105 | 23.5% |
| $150,000 to $199,999 | 17 | 3.8% |
| $200,000+ | 95 | 21.3% |
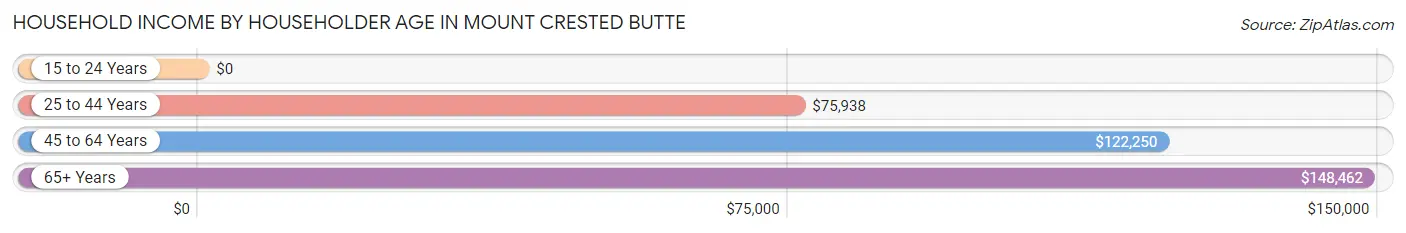
Household Income by Householder Age in Mount Crested Butte
The median household income in Mount Crested Butte is $93,194, with the highest median household income of $148,462 found in the 65+ years age bracket for the primary householder. A total of 64 households (14.3%) fall into this category.
| Income Bracket | # Households | Median Income |
| 15 to 24 Years | 0 (0.0%) | $0 |
| 25 to 44 Years | 218 (48.8%) | $75,938 |
| 45 to 64 Years | 165 (36.9%) | $122,250 |
| 65+ Years | 64 (14.3%) | $148,462 |
| Total | 447 (100.0%) | $93,194 |
Poverty in Mount Crested Butte
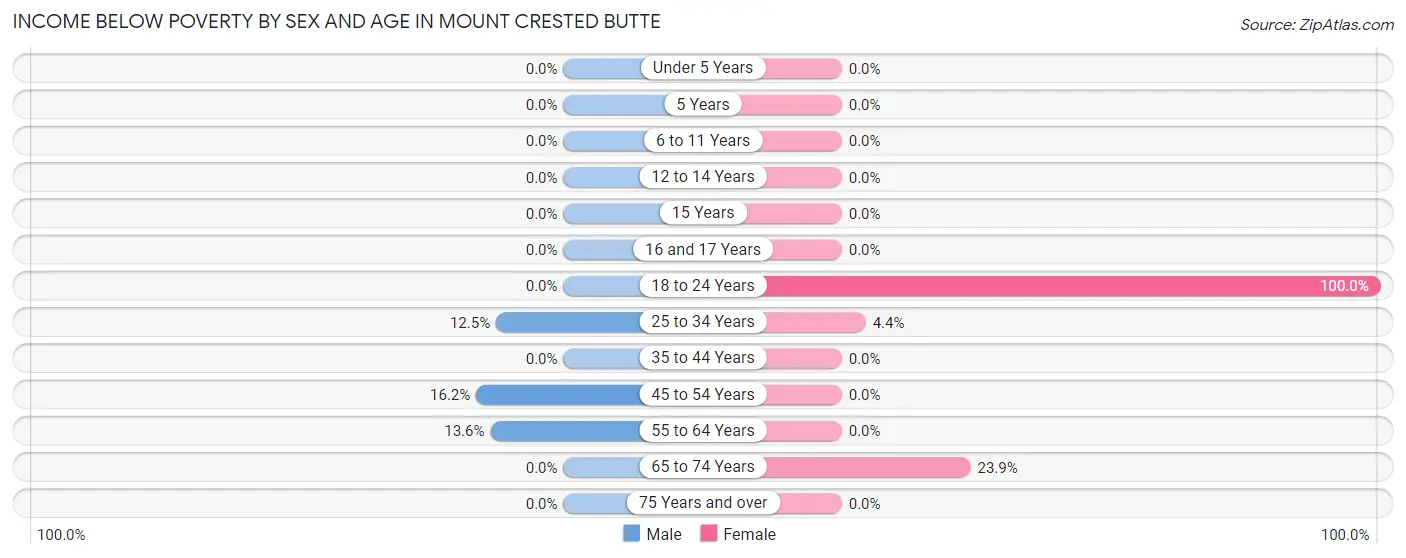
Income Below Poverty by Sex and Age in Mount Crested Butte
With 8.5% poverty level for males and 9.5% for females among the residents of Mount Crested Butte, 45 to 54 year old males and 18 to 24 year old females are the most vulnerable to poverty, with 17 males (16.2%) and 24 females (100.0%) in their respective age groups living below the poverty level.
| Age Bracket | Male | Female |
| Under 5 Years | 0 (0.0%) | 0 (0.0%) |
| 5 Years | 0 (0.0%) | 0 (0.0%) |
| 6 to 11 Years | 0 (0.0%) | 0 (0.0%) |
| 12 to 14 Years | 0 (0.0%) | 0 (0.0%) |
| 15 Years | 0 (0.0%) | 0 (0.0%) |
| 16 and 17 Years | 0 (0.0%) | 0 (0.0%) |
| 18 to 24 Years | 0 (0.0%) | 24 (100.0%) |
| 25 to 34 Years | 14 (12.5%) | 4 (4.4%) |
| 35 to 44 Years | 0 (0.0%) | 0 (0.0%) |
| 45 to 54 Years | 17 (16.2%) | 0 (0.0%) |
| 55 to 64 Years | 8 (13.6%) | 0 (0.0%) |
| 65 to 74 Years | 0 (0.0%) | 11 (23.9%) |
| 75 Years and over | 0 (0.0%) | 0 (0.0%) |
| Total | 39 (8.5%) | 39 (9.5%) |
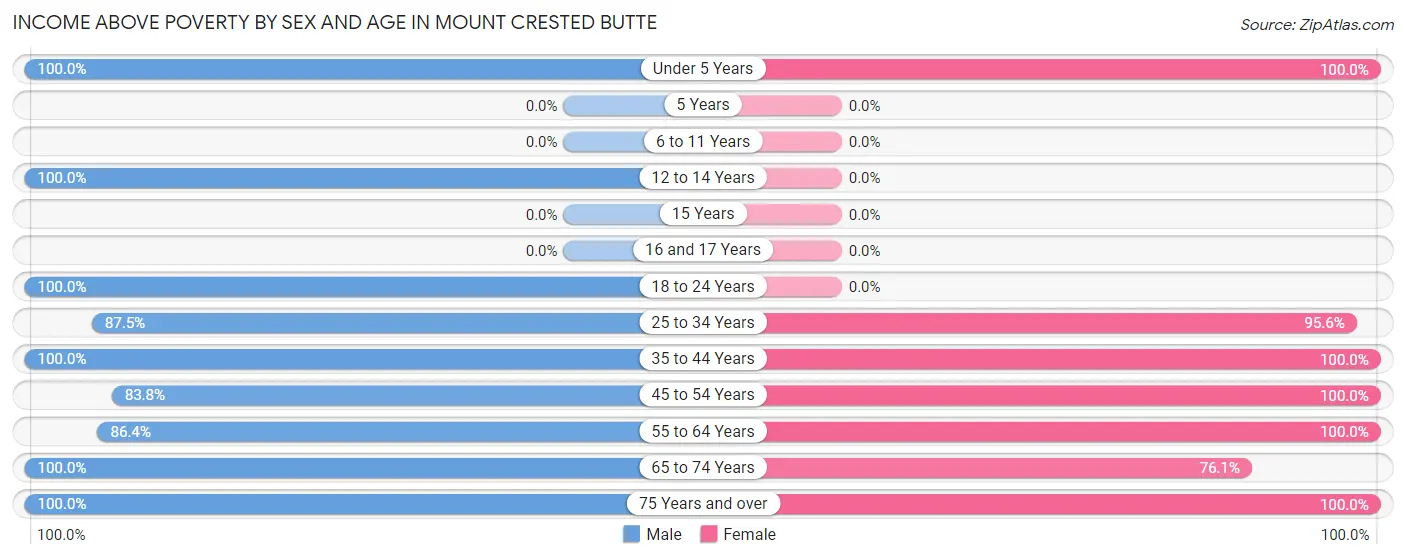
Income Above Poverty by Sex and Age in Mount Crested Butte
According to the poverty statistics in Mount Crested Butte, males aged under 5 years and females aged under 5 years are the age groups that are most secure financially, with 100.0% of males and 100.0% of females in these age groups living above the poverty line.
| Age Bracket | Male | Female |
| Under 5 Years | 12 (100.0%) | 6 (100.0%) |
| 5 Years | 0 (0.0%) | 0 (0.0%) |
| 6 to 11 Years | 0 (0.0%) | 0 (0.0%) |
| 12 to 14 Years | 11 (100.0%) | 0 (0.0%) |
| 15 Years | 0 (0.0%) | 0 (0.0%) |
| 16 and 17 Years | 0 (0.0%) | 0 (0.0%) |
| 18 to 24 Years | 21 (100.0%) | 0 (0.0%) |
| 25 to 34 Years | 98 (87.5%) | 86 (95.6%) |
| 35 to 44 Years | 93 (100.0%) | 95 (100.0%) |
| 45 to 54 Years | 88 (83.8%) | 68 (100.0%) |
| 55 to 64 Years | 51 (86.4%) | 59 (100.0%) |
| 65 to 74 Years | 26 (100.0%) | 35 (76.1%) |
| 75 Years and over | 20 (100.0%) | 22 (100.0%) |
| Total | 420 (91.5%) | 371 (90.5%) |
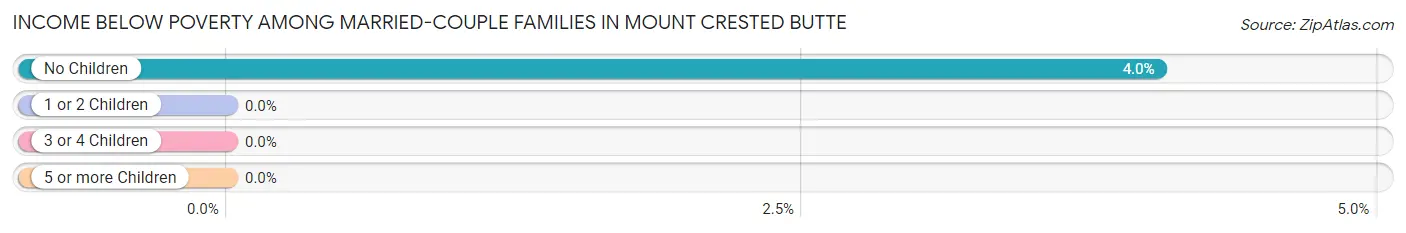
Income Below Poverty Among Married-Couple Families in Mount Crested Butte
The poverty statistics for married-couple families in Mount Crested Butte show that 3.5% or 8 of the total 227 families live below the poverty line. Families with no children have the highest poverty rate of 4.0%, comprising of 8 families. On the other hand, families with 1 or 2 children have the lowest poverty rate of 0.0%, which includes 0 families.
| Children | Above Poverty | Below Poverty |
| No Children | 190 (96.0%) | 8 (4.0%) |
| 1 or 2 Children | 29 (100.0%) | 0 (0.0%) |
| 3 or 4 Children | 0 (0.0%) | 0 (0.0%) |
| 5 or more Children | 0 (0.0%) | 0 (0.0%) |
| Total | 219 (96.5%) | 8 (3.5%) |
Income Below Poverty Among Single-Parent Households in Mount Crested Butte
| Children | Single Father | Single Mother |
| No Children | 0 (0.0%) | 0 (0.0%) |
| 1 or 2 Children | 0 (0.0%) | 0 (0.0%) |
| 3 or 4 Children | 0 (0.0%) | 0 (0.0%) |
| 5 or more Children | 0 (0.0%) | 0 (0.0%) |
| Total | 0 (0.0%) | 0 (0.0%) |
Income Below Poverty Among Married-Couple vs Single-Parent Households in Mount Crested Butte
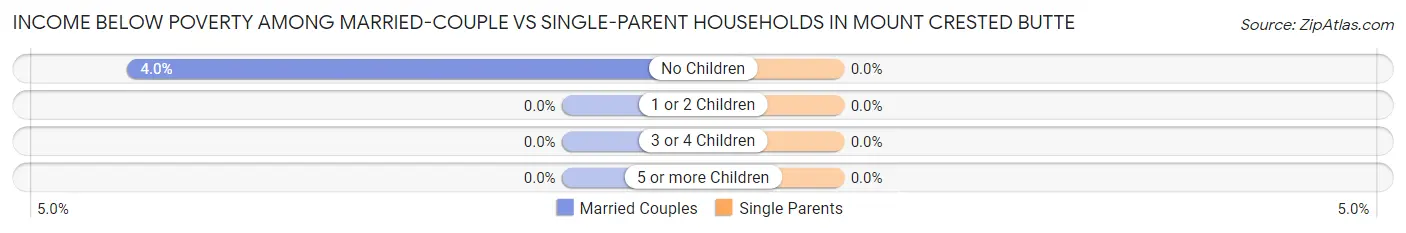
| Children | Married-Couple Families | Single-Parent Households |
| No Children | 8 (4.0%) | 0 (0.0%) |
| 1 or 2 Children | 0 (0.0%) | 0 (0.0%) |
| 3 or 4 Children | 0 (0.0%) | 0 (0.0%) |
| 5 or more Children | 0 (0.0%) | 0 (0.0%) |
| Total | 8 (3.5%) | 0 (0.0%) |
Race in Mount Crested Butte
The most populous races in Mount Crested Butte are White / Caucasian (841 | 96.8%), Two or more Races (28 | 3.2%), and Hispanic or Latino (15 | 1.7%).
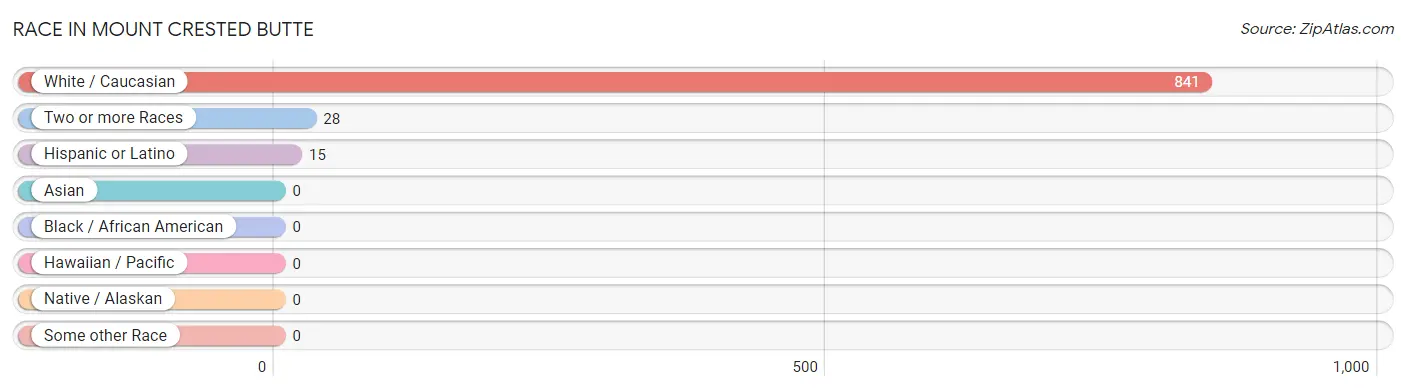
| Race | # Population | % Population |
| Asian | 0 | 0.0% |
| Black / African American | 0 | 0.0% |
| Hawaiian / Pacific | 0 | 0.0% |
| Hispanic or Latino | 15 | 1.7% |
| Native / Alaskan | 0 | 0.0% |
| White / Caucasian | 841 | 96.8% |
| Two or more Races | 28 | 3.2% |
| Some other Race | 0 | 0.0% |
| Total | 869 | 100.0% |
Ancestry in Mount Crested Butte
The most populous ancestries reported in Mount Crested Butte are German (291 | 33.5%), English (228 | 26.2%), Irish (162 | 18.6%), Italian (69 | 7.9%), and Swedish (55 | 6.3%), together accounting for 92.6% of all Mount Crested Butte residents.
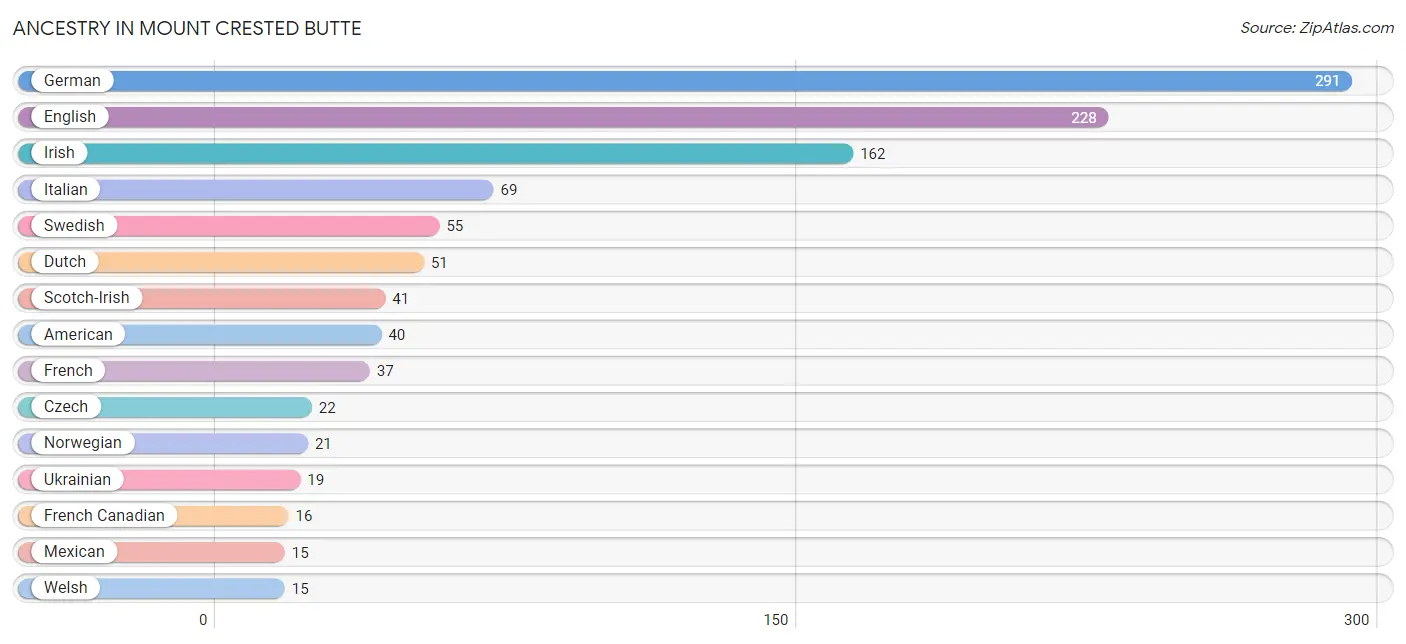
| Ancestry | # Population | % Population |
| American | 40 | 4.6% |
| British | 10 | 1.1% |
| Czech | 22 | 2.5% |
| Danish | 9 | 1.0% |
| Dutch | 51 | 5.9% |
| English | 228 | 26.2% |
| European | 13 | 1.5% |
| French | 37 | 4.3% |
| French Canadian | 16 | 1.8% |
| German | 291 | 33.5% |
| Irish | 162 | 18.6% |
| Italian | 69 | 7.9% |
| Lithuanian | 11 | 1.3% |
| Mexican | 15 | 1.7% |
| Norwegian | 21 | 2.4% |
| Russian | 5 | 0.6% |
| Scotch-Irish | 41 | 4.7% |
| Swedish | 55 | 6.3% |
| Swiss | 11 | 1.3% |
| Ukrainian | 19 | 2.2% |
| Welsh | 15 | 1.7% | View All 21 Rows |
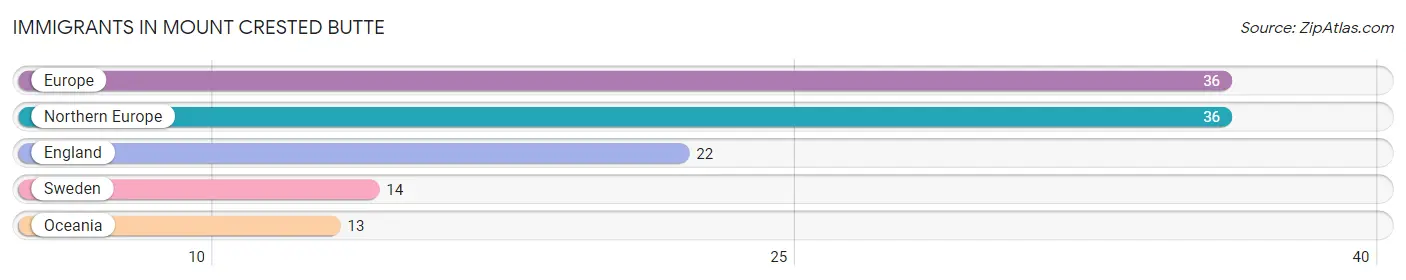
Immigrants in Mount Crested Butte
The most numerous immigrant groups reported in Mount Crested Butte came from Europe (36 | 4.1%), Northern Europe (36 | 4.1%), England (22 | 2.5%), Sweden (14 | 1.6%), and Oceania (13 | 1.5%), together accounting for 13.9% of all Mount Crested Butte residents.
| Immigration Origin | # Population | % Population |
| England | 22 | 2.5% |
| Europe | 36 | 4.1% |
| Northern Europe | 36 | 4.1% |
| Oceania | 13 | 1.5% |
| Sweden | 14 | 1.6% | View All 5 Rows |
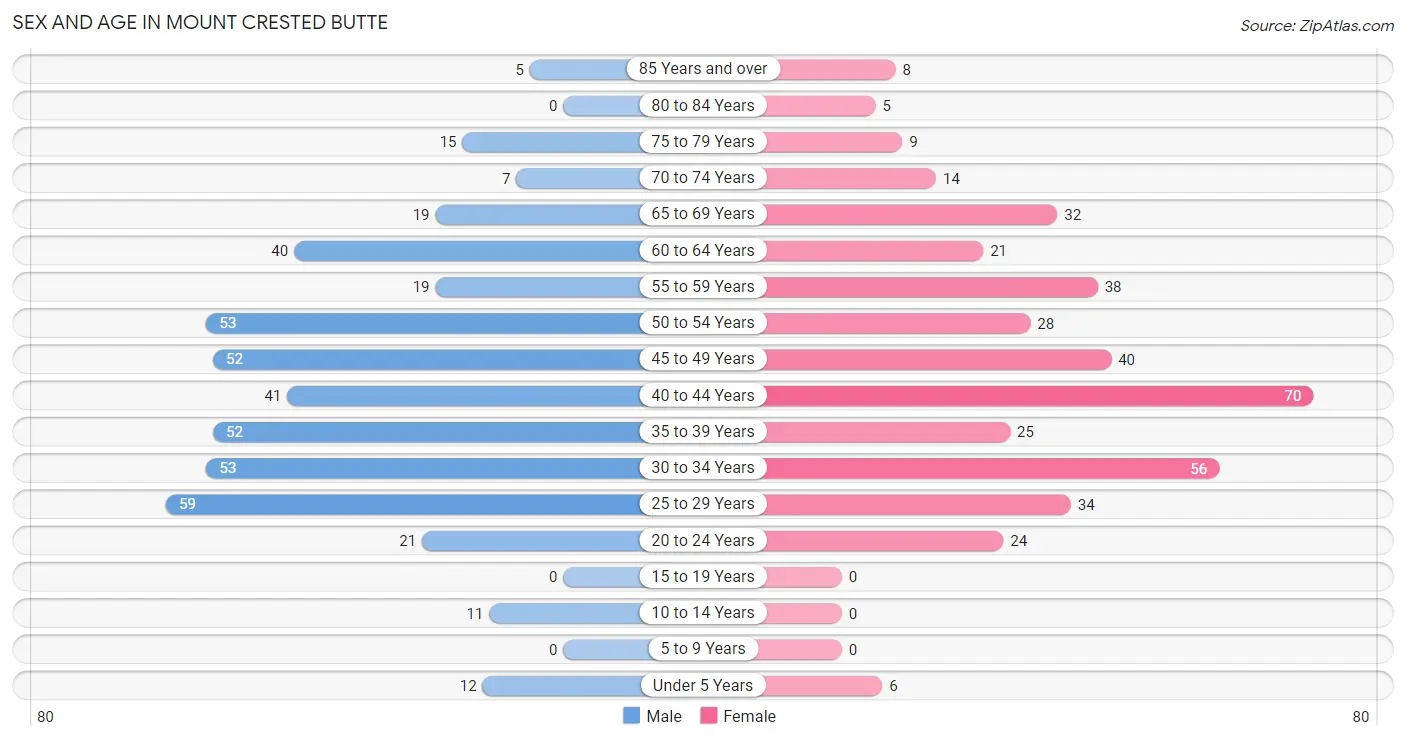
Sex and Age in Mount Crested Butte
Sex and Age in Mount Crested Butte
The most populous age groups in Mount Crested Butte are 25 to 29 Years (59 | 12.9%) for men and 40 to 44 Years (70 | 17.1%) for women.
| Age Bracket | Male | Female |
| Under 5 Years | 12 (2.6%) | 6 (1.5%) |
| 5 to 9 Years | 0 (0.0%) | 0 (0.0%) |
| 10 to 14 Years | 11 (2.4%) | 0 (0.0%) |
| 15 to 19 Years | 0 (0.0%) | 0 (0.0%) |
| 20 to 24 Years | 21 (4.6%) | 24 (5.9%) |
| 25 to 29 Years | 59 (12.9%) | 34 (8.3%) |
| 30 to 34 Years | 53 (11.6%) | 56 (13.7%) |
| 35 to 39 Years | 52 (11.3%) | 25 (6.1%) |
| 40 to 44 Years | 41 (8.9%) | 70 (17.1%) |
| 45 to 49 Years | 52 (11.3%) | 40 (9.8%) |
| 50 to 54 Years | 53 (11.6%) | 28 (6.8%) |
| 55 to 59 Years | 19 (4.1%) | 38 (9.3%) |
| 60 to 64 Years | 40 (8.7%) | 21 (5.1%) |
| 65 to 69 Years | 19 (4.1%) | 32 (7.8%) |
| 70 to 74 Years | 7 (1.5%) | 14 (3.4%) |
| 75 to 79 Years | 15 (3.3%) | 9 (2.2%) |
| 80 to 84 Years | 0 (0.0%) | 5 (1.2%) |
| 85 Years and over | 5 (1.1%) | 8 (1.9%) |
| Total | 459 (100.0%) | 410 (100.0%) |
Families and Households in Mount Crested Butte
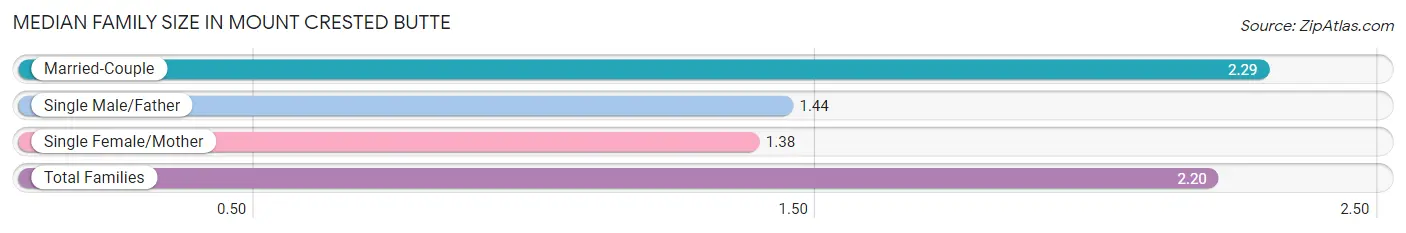
Median Family Size in Mount Crested Butte
The median family size in Mount Crested Butte is 2.20 persons per family, with married-couple families (227 | 90.4%) accounting for the largest median family size of 2.29 persons per family. On the other hand, single female/mother families (8 | 3.2%) represent the smallest median family size with 1.38 persons per family.
| Family Type | # Families | Family Size |
| Married-Couple | 227 (90.4%) | 2.29 |
| Single Male/Father | 16 (6.4%) | 1.44 |
| Single Female/Mother | 8 (3.2%) | 1.38 |
| Total Families | 251 (100.0%) | 2.20 |
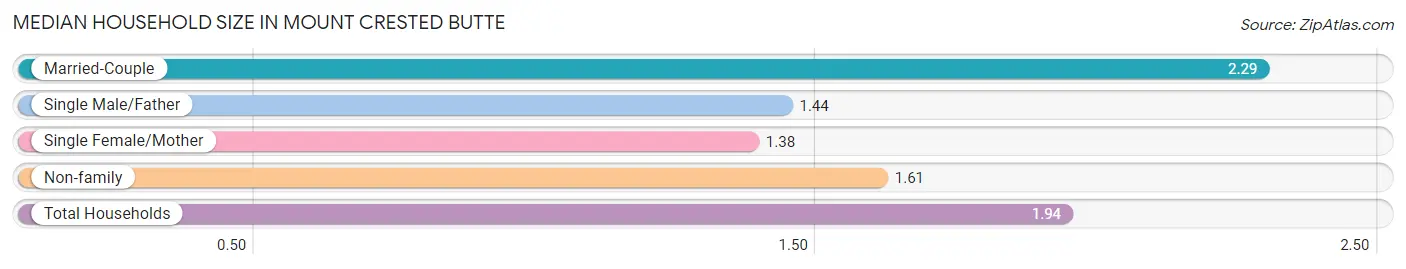
Median Household Size in Mount Crested Butte
The median household size in Mount Crested Butte is 1.94 persons per household, with married-couple households (227 | 50.8%) accounting for the largest median household size of 2.29 persons per household. single female/mother households (8 | 1.8%) represent the smallest median household size with 1.38 persons per household.
| Household Type | # Households | Household Size |
| Married-Couple | 227 (50.8%) | 2.29 |
| Single Male/Father | 16 (3.6%) | 1.44 |
| Single Female/Mother | 8 (1.8%) | 1.38 |
| Non-family | 196 (43.9%) | 1.61 |
| Total Households | 447 (100.0%) | 1.94 |
Household Size by Marriage Status in Mount Crested Butte
Out of a total of 447 households in Mount Crested Butte, 251 (56.1%) are family households, while 196 (43.9%) are nonfamily households. The most numerous type of family households are 2-person households, comprising 222, and the most common type of nonfamily households are 1-person households, comprising 126.
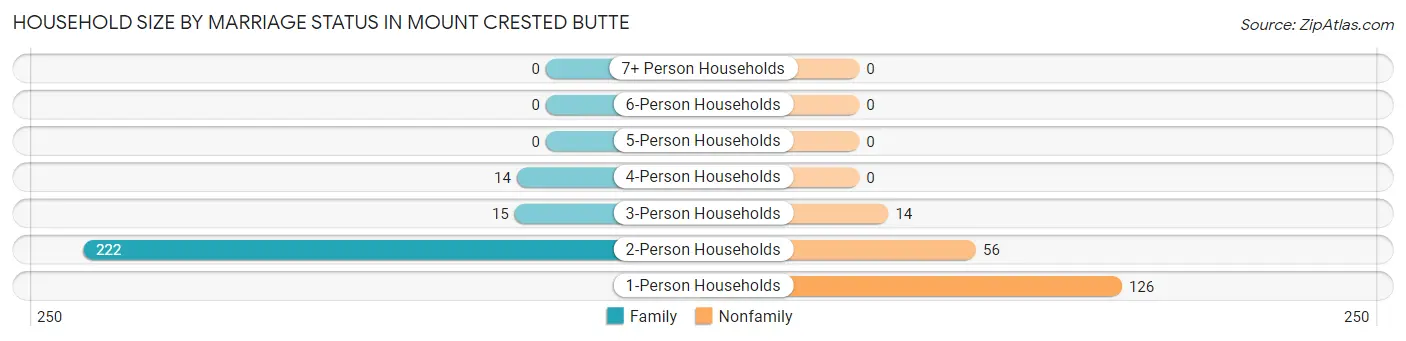
| Household Size | Family Households | Nonfamily Households |
| 1-Person Households | - | 126 (28.2%) |
| 2-Person Households | 222 (49.7%) | 56 (12.5%) |
| 3-Person Households | 15 (3.4%) | 14 (3.1%) |
| 4-Person Households | 14 (3.1%) | 0 (0.0%) |
| 5-Person Households | 0 (0.0%) | 0 (0.0%) |
| 6-Person Households | 0 (0.0%) | 0 (0.0%) |
| 7+ Person Households | 0 (0.0%) | 0 (0.0%) |
| Total | 251 (56.1%) | 196 (43.9%) |
Female Fertility in Mount Crested Butte
Fertility by Age in Mount Crested Butte
| Age Bracket | Women with Births | Births / 1,000 Women |
| 15 to 19 years | 0 (0.0%) | 0.0 |
| 20 to 34 years | 0 (0.0%) | 0.0 |
| 35 to 50 years | 0 (0.0%) | 0.0 |
| Total | 0 (0.0%) | 0.0 |
Fertility by Age by Marriage Status in Mount Crested Butte
| Age Bracket | Married | Unmarried |
| 15 to 19 years | 0 (0.0%) | 0 (0.0%) |
| 20 to 34 years | 0 (0.0%) | 0 (0.0%) |
| 35 to 50 years | 0 (0.0%) | 0 (0.0%) |
| Total | 0 (0.0%) | 0 (0.0%) |
Fertility by Education in Mount Crested Butte
| Educational Attainment | Women with Births | Births / 1,000 Women |
| Less than High School | 0 (0.0%) | 0.0 |
| High School Diploma | 0 (0.0%) | 0.0 |
| College or Associate's Degree | 0 (0.0%) | 0.0 |
| Bachelor's Degree | 0 (0.0%) | 0.0 |
| Graduate Degree | 0 (0.0%) | 0.0 |
| Total | 0 (0.0%) | 0.0 |
Fertility by Education by Marriage Status in Mount Crested Butte
| Educational Attainment | Married | Unmarried |
| Less than High School | 0 (0.0%) | 0 (0.0%) |
| High School Diploma | 0 (0.0%) | 0 (0.0%) |
| College or Associate's Degree | 0 (0.0%) | 0 (0.0%) |
| Bachelor's Degree | 0 (0.0%) | 0 (0.0%) |
| Graduate Degree | 0 (0.0%) | 0 (0.0%) |
| Total | 0 (0.0%) | 0 (0.0%) |
Employment Characteristics in Mount Crested Butte
Employment by Class of Employer in Mount Crested Butte
Among the 639 employed individuals in Mount Crested Butte, private company employees (439 | 68.7%), self-employed (incorporated) (114 | 17.8%), and not-for-profit organizations (49 | 7.7%) make up the most common classes of employment.
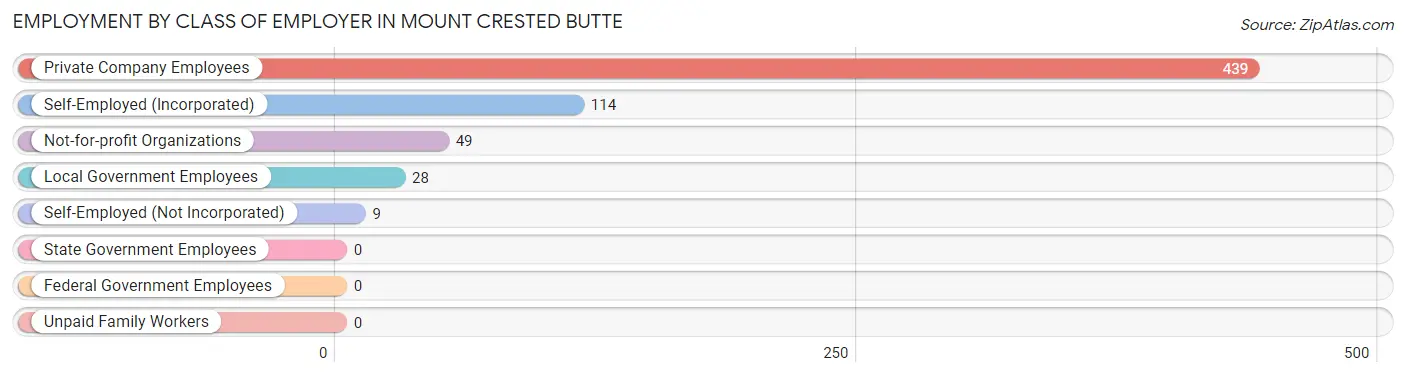
| Employer Class | # Employees | % Employees |
| Private Company Employees | 439 | 68.7% |
| Self-Employed (Incorporated) | 114 | 17.8% |
| Self-Employed (Not Incorporated) | 9 | 1.4% |
| Not-for-profit Organizations | 49 | 7.7% |
| Local Government Employees | 28 | 4.4% |
| State Government Employees | 0 | 0.0% |
| Federal Government Employees | 0 | 0.0% |
| Unpaid Family Workers | 0 | 0.0% |
| Total | 639 | 100.0% |
Employment Status by Age in Mount Crested Butte
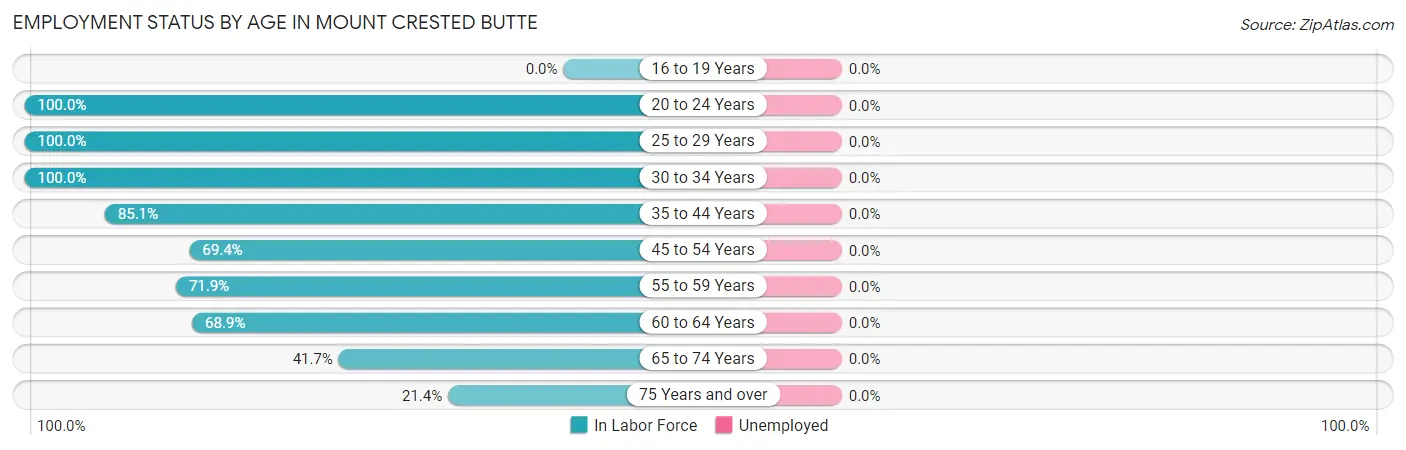
| Age Bracket | In Labor Force | Unemployed |
| 16 to 19 Years | 0 (0.0%) | 0 (0.0%) |
| 20 to 24 Years | 45 (100.0%) | 0 (0.0%) |
| 25 to 29 Years | 93 (100.0%) | 0 (0.0%) |
| 30 to 34 Years | 109 (100.0%) | 0 (0.0%) |
| 35 to 44 Years | 160 (85.1%) | 0 (0.0%) |
| 45 to 54 Years | 120 (69.4%) | 0 (0.0%) |
| 55 to 59 Years | 41 (71.9%) | 0 (0.0%) |
| 60 to 64 Years | 42 (68.9%) | 0 (0.0%) |
| 65 to 74 Years | 30 (41.7%) | 0 (0.0%) |
| 75 Years and over | 9 (21.4%) | 0 (0.0%) |
| Total | 649 (77.3%) | 0 (0.0%) |
Employment Status by Educational Attainment in Mount Crested Butte

| Educational Attainment | In Labor Force | Unemployed |
| Less than High School | 0 (0.0%) | 0 (0.0%) |
| High School Diploma | 0 (0.0%) | 0 (0.0%) |
| College / Associate Degree | 93 (82.3%) | 0 (0.0%) |
| Bachelor's Degree or higher | 472 (83.1%) | 0 (0.0%) |
| Total | 565 (83.0%) | 0 (0.0%) |
Employment Occupations by Sex in Mount Crested Butte
Management, Business, Science and Arts Occupations
The most common Management, Business, Science and Arts occupations in Mount Crested Butte are Management (145 | 22.3%), Community & Social Service (33 | 5.1%), Business & Financial (26 | 4.0%), Arts, Media & Entertainment (24 | 3.7%), and Computers, Engineering & Science (17 | 2.6%).
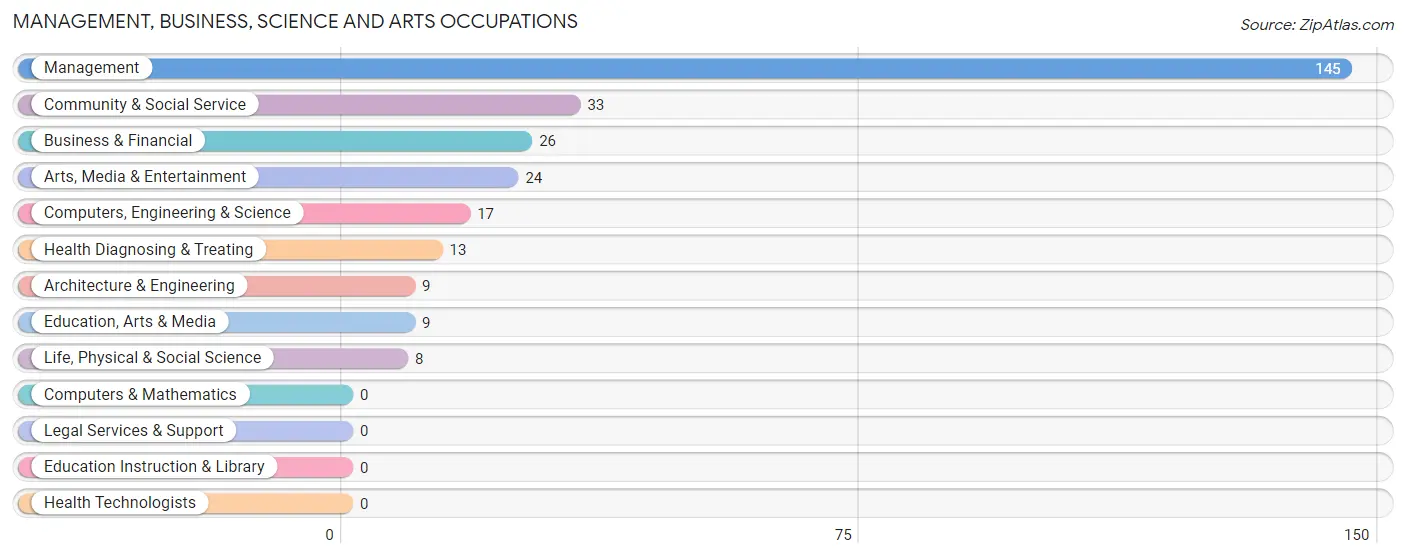
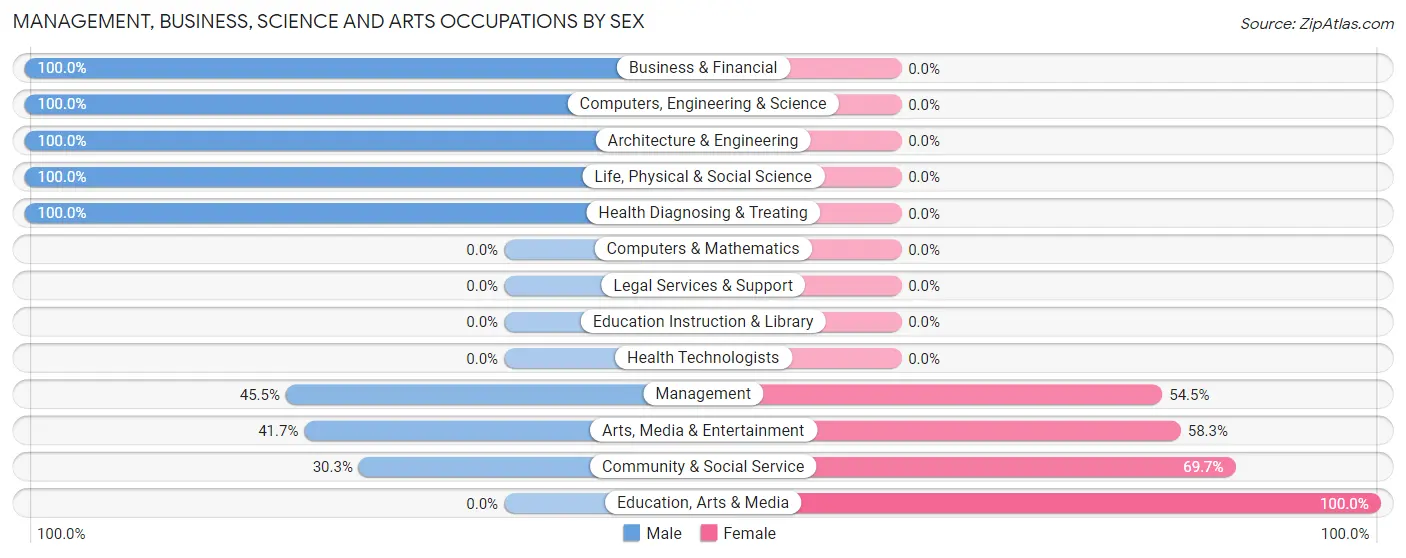
Management, Business, Science and Arts Occupations by Sex
Within the Management, Business, Science and Arts occupations in Mount Crested Butte, the most male-oriented occupations are Business & Financial (100.0%), Computers, Engineering & Science (100.0%), and Architecture & Engineering (100.0%), while the most female-oriented occupations are Education, Arts & Media (100.0%), Community & Social Service (69.7%), and Arts, Media & Entertainment (58.3%).
| Occupation | Male | Female |
| Management | 66 (45.5%) | 79 (54.5%) |
| Business & Financial | 26 (100.0%) | 0 (0.0%) |
| Computers, Engineering & Science | 17 (100.0%) | 0 (0.0%) |
| Computers & Mathematics | 0 (0.0%) | 0 (0.0%) |
| Architecture & Engineering | 9 (100.0%) | 0 (0.0%) |
| Life, Physical & Social Science | 8 (100.0%) | 0 (0.0%) |
| Community & Social Service | 10 (30.3%) | 23 (69.7%) |
| Education, Arts & Media | 0 (0.0%) | 9 (100.0%) |
| Legal Services & Support | 0 (0.0%) | 0 (0.0%) |
| Education Instruction & Library | 0 (0.0%) | 0 (0.0%) |
| Arts, Media & Entertainment | 10 (41.7%) | 14 (58.3%) |
| Health Diagnosing & Treating | 13 (100.0%) | 0 (0.0%) |
| Health Technologists | 0 (0.0%) | 0 (0.0%) |
| Total (Category) | 132 (56.4%) | 102 (43.6%) |
| Total (Overall) | 320 (49.3%) | 329 (50.7%) |
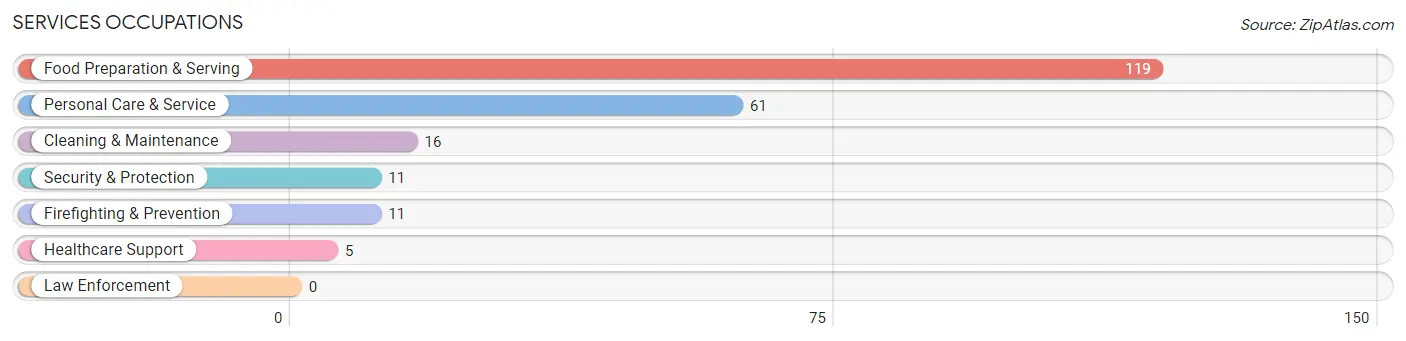
Services Occupations
The most common Services occupations in Mount Crested Butte are Food Preparation & Serving (119 | 18.3%), Personal Care & Service (61 | 9.4%), Cleaning & Maintenance (16 | 2.5%), Security & Protection (11 | 1.7%), and Firefighting & Prevention (11 | 1.7%).
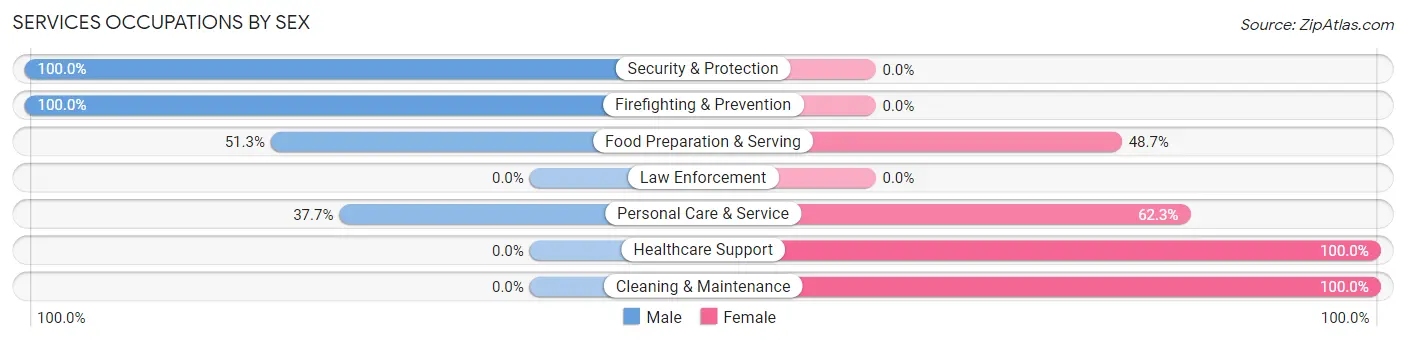
Services Occupations by Sex
Within the Services occupations in Mount Crested Butte, the most male-oriented occupations are Security & Protection (100.0%), Firefighting & Prevention (100.0%), and Food Preparation & Serving (51.3%), while the most female-oriented occupations are Healthcare Support (100.0%), Cleaning & Maintenance (100.0%), and Personal Care & Service (62.3%).
| Occupation | Male | Female |
| Healthcare Support | 0 (0.0%) | 5 (100.0%) |
| Security & Protection | 11 (100.0%) | 0 (0.0%) |
| Firefighting & Prevention | 11 (100.0%) | 0 (0.0%) |
| Law Enforcement | 0 (0.0%) | 0 (0.0%) |
| Food Preparation & Serving | 61 (51.3%) | 58 (48.7%) |
| Cleaning & Maintenance | 0 (0.0%) | 16 (100.0%) |
| Personal Care & Service | 23 (37.7%) | 38 (62.3%) |
| Total (Category) | 95 (44.8%) | 117 (55.2%) |
| Total (Overall) | 320 (49.3%) | 329 (50.7%) |
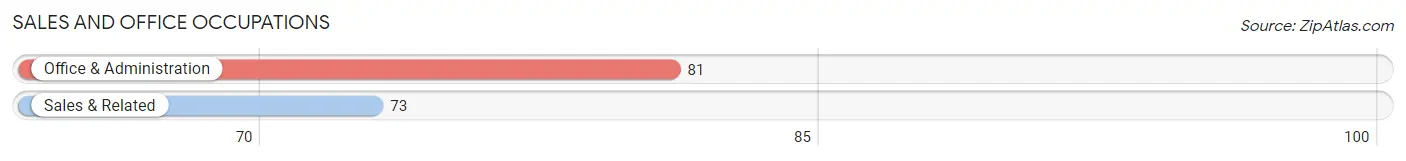
Sales and Office Occupations
The most common Sales and Office occupations in Mount Crested Butte are Office & Administration (81 | 12.5%), and Sales & Related (73 | 11.3%).
Sales and Office Occupations by Sex
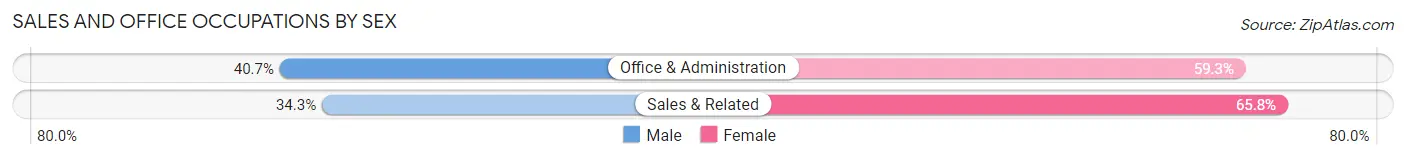
| Occupation | Male | Female |
| Sales & Related | 25 (34.3%) | 48 (65.7%) |
| Office & Administration | 33 (40.7%) | 48 (59.3%) |
| Total (Category) | 58 (37.7%) | 96 (62.3%) |
| Total (Overall) | 320 (49.3%) | 329 (50.7%) |
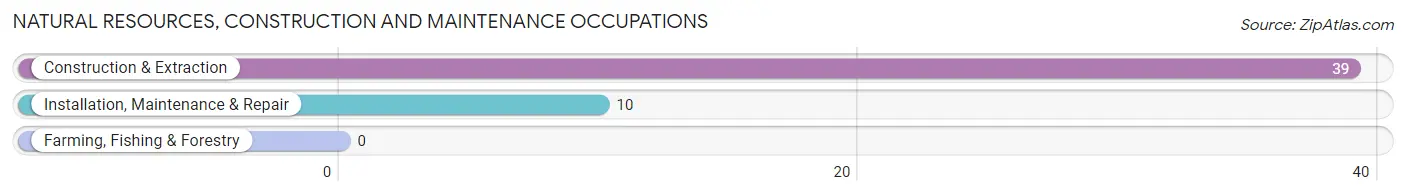
Natural Resources, Construction and Maintenance Occupations
The most common Natural Resources, Construction and Maintenance occupations in Mount Crested Butte are Construction & Extraction (39 | 6.0%), and Installation, Maintenance & Repair (10 | 1.5%).
Natural Resources, Construction and Maintenance Occupations by Sex
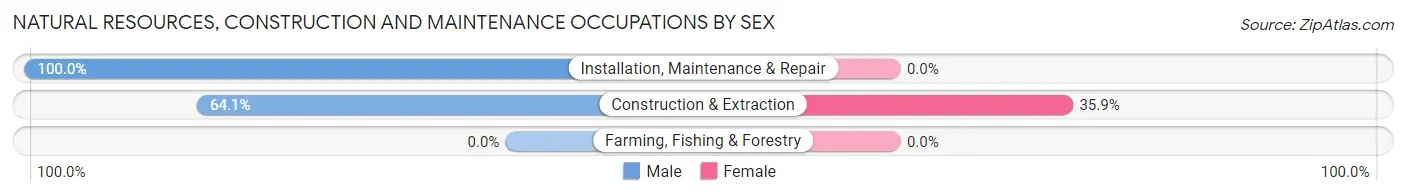
| Occupation | Male | Female |
| Farming, Fishing & Forestry | 0 (0.0%) | 0 (0.0%) |
| Construction & Extraction | 25 (64.1%) | 14 (35.9%) |
| Installation, Maintenance & Repair | 10 (100.0%) | 0 (0.0%) |
| Total (Category) | 35 (71.4%) | 14 (28.6%) |
| Total (Overall) | 320 (49.3%) | 329 (50.7%) |
Production, Transportation and Moving Occupations
Production, Transportation and Moving Occupations by Sex
| Occupation | Male | Female |
| Production | 0 (0.0%) | 0 (0.0%) |
| Transportation | 0 (0.0%) | 0 (0.0%) |
| Material Moving | 0 (0.0%) | 0 (0.0%) |
| Total (Category) | 0 (0.0%) | 0 (0.0%) |
| Total (Overall) | 320 (49.3%) | 329 (50.7%) |
Employment Industries by Sex in Mount Crested Butte
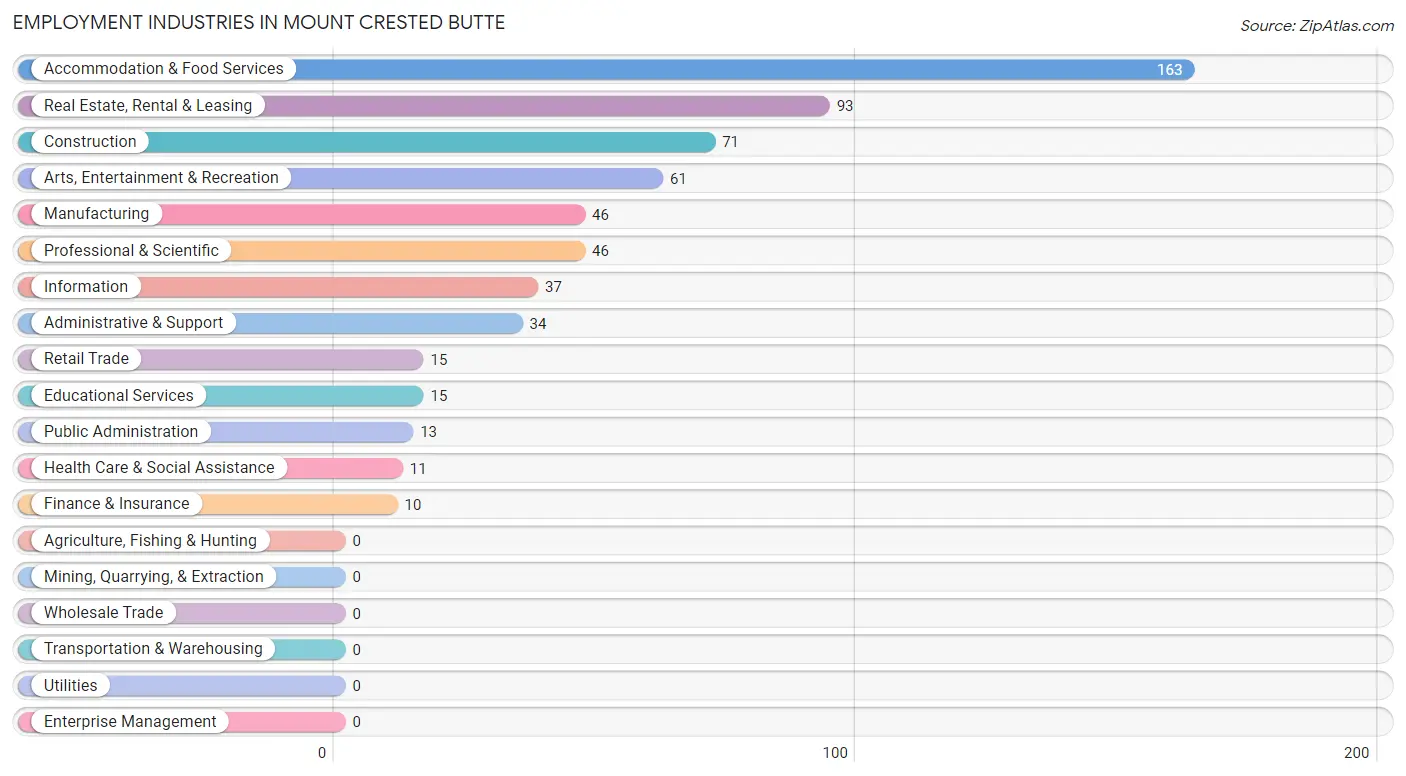
Employment Industries in Mount Crested Butte
The major employment industries in Mount Crested Butte include Accommodation & Food Services (163 | 25.1%), Real Estate, Rental & Leasing (93 | 14.3%), Construction (71 | 10.9%), Arts, Entertainment & Recreation (61 | 9.4%), and Manufacturing (46 | 7.1%).
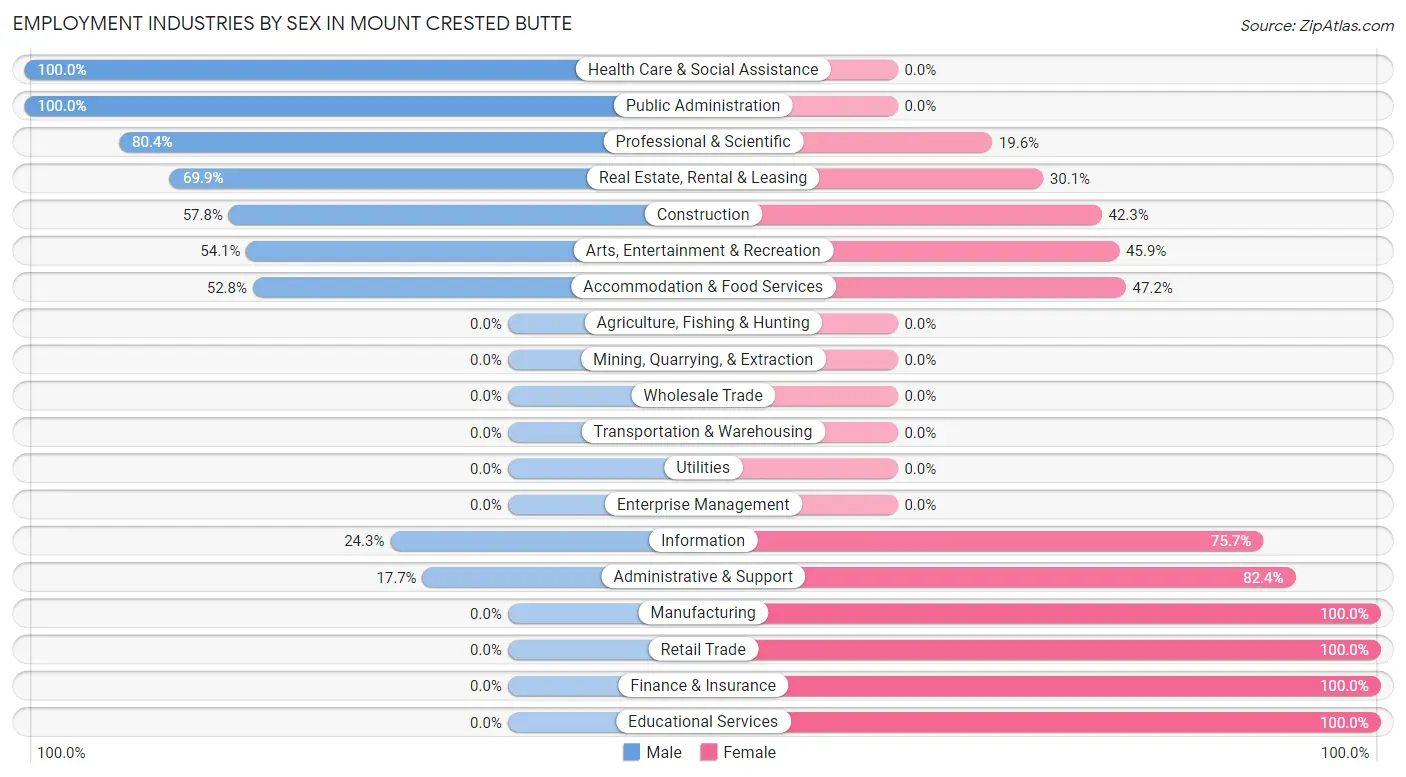
Employment Industries by Sex in Mount Crested Butte
The Mount Crested Butte industries that see more men than women are Health Care & Social Assistance (100.0%), Public Administration (100.0%), and Professional & Scientific (80.4%), whereas the industries that tend to have a higher number of women are Manufacturing (100.0%), Retail Trade (100.0%), and Finance & Insurance (100.0%).
| Industry | Male | Female |
| Agriculture, Fishing & Hunting | 0 (0.0%) | 0 (0.0%) |
| Mining, Quarrying, & Extraction | 0 (0.0%) | 0 (0.0%) |
| Construction | 41 (57.8%) | 30 (42.2%) |
| Manufacturing | 0 (0.0%) | 46 (100.0%) |
| Wholesale Trade | 0 (0.0%) | 0 (0.0%) |
| Retail Trade | 0 (0.0%) | 15 (100.0%) |
| Transportation & Warehousing | 0 (0.0%) | 0 (0.0%) |
| Utilities | 0 (0.0%) | 0 (0.0%) |
| Information | 9 (24.3%) | 28 (75.7%) |
| Finance & Insurance | 0 (0.0%) | 10 (100.0%) |
| Real Estate, Rental & Leasing | 65 (69.9%) | 28 (30.1%) |
| Professional & Scientific | 37 (80.4%) | 9 (19.6%) |
| Enterprise Management | 0 (0.0%) | 0 (0.0%) |
| Administrative & Support | 6 (17.6%) | 28 (82.4%) |
| Educational Services | 0 (0.0%) | 15 (100.0%) |
| Health Care & Social Assistance | 11 (100.0%) | 0 (0.0%) |
| Arts, Entertainment & Recreation | 33 (54.1%) | 28 (45.9%) |
| Accommodation & Food Services | 86 (52.8%) | 77 (47.2%) |
| Public Administration | 13 (100.0%) | 0 (0.0%) |
| Total | 320 (49.3%) | 329 (50.7%) |
Education in Mount Crested Butte
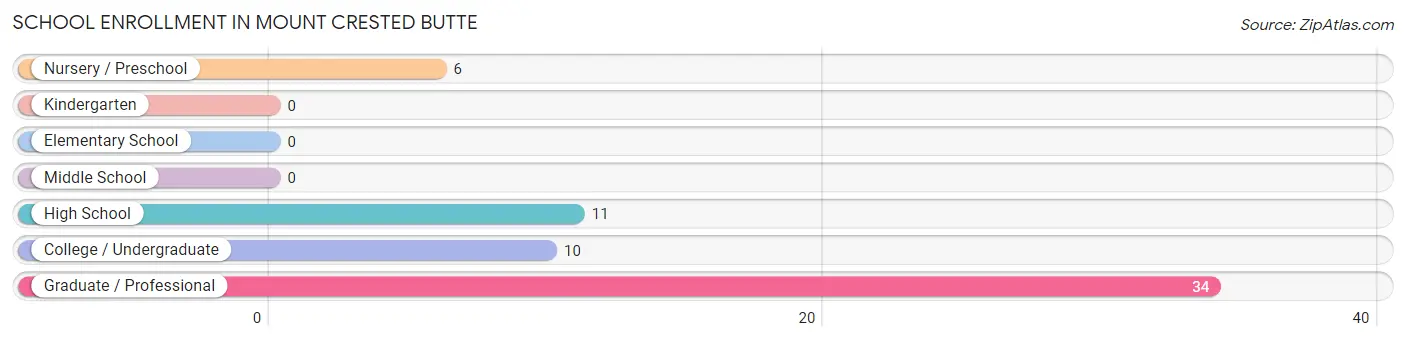
School Enrollment in Mount Crested Butte
The most common levels of schooling among the 61 students in Mount Crested Butte are graduate / professional (34 | 55.7%), high school (11 | 18.0%), and college / undergraduate (10 | 16.4%).
| School Level | # Students | % Students |
| Nursery / Preschool | 6 | 9.8% |
| Kindergarten | 0 | 0.0% |
| Elementary School | 0 | 0.0% |
| Middle School | 0 | 0.0% |
| High School | 11 | 18.0% |
| College / Undergraduate | 10 | 16.4% |
| Graduate / Professional | 34 | 55.7% |
| Total | 61 | 100.0% |
School Enrollment by Age by Funding Source in Mount Crested Butte
Out of a total of 61 students who are enrolled in schools in Mount Crested Butte, 24 (39.3%) attend a private institution, while the remaining 37 (60.7%) are enrolled in public schools. The age group of 3 to 4 year olds has the highest likelihood of being enrolled in private schools, with 6 (100.0% in the age bracket) enrolled. Conversely, the age group of 10 to 14 year olds has the lowest likelihood of being enrolled in a private school, with 11 (100.0% in the age bracket) attending a public institution.
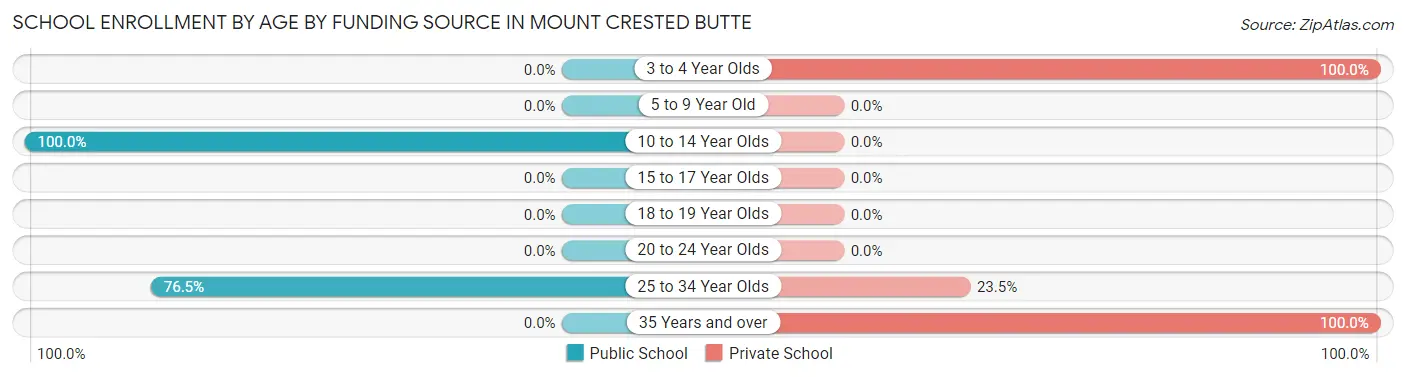
| Age Bracket | Public School | Private School |
| 3 to 4 Year Olds | 0 (0.0%) | 6 (100.0%) |
| 5 to 9 Year Old | 0 (0.0%) | 0 (0.0%) |
| 10 to 14 Year Olds | 11 (100.0%) | 0 (0.0%) |
| 15 to 17 Year Olds | 0 (0.0%) | 0 (0.0%) |
| 18 to 19 Year Olds | 0 (0.0%) | 0 (0.0%) |
| 20 to 24 Year Olds | 0 (0.0%) | 0 (0.0%) |
| 25 to 34 Year Olds | 26 (76.5%) | 8 (23.5%) |
| 35 Years and over | 0 (0.0%) | 10 (100.0%) |
| Total | 37 (60.7%) | 24 (39.3%) |
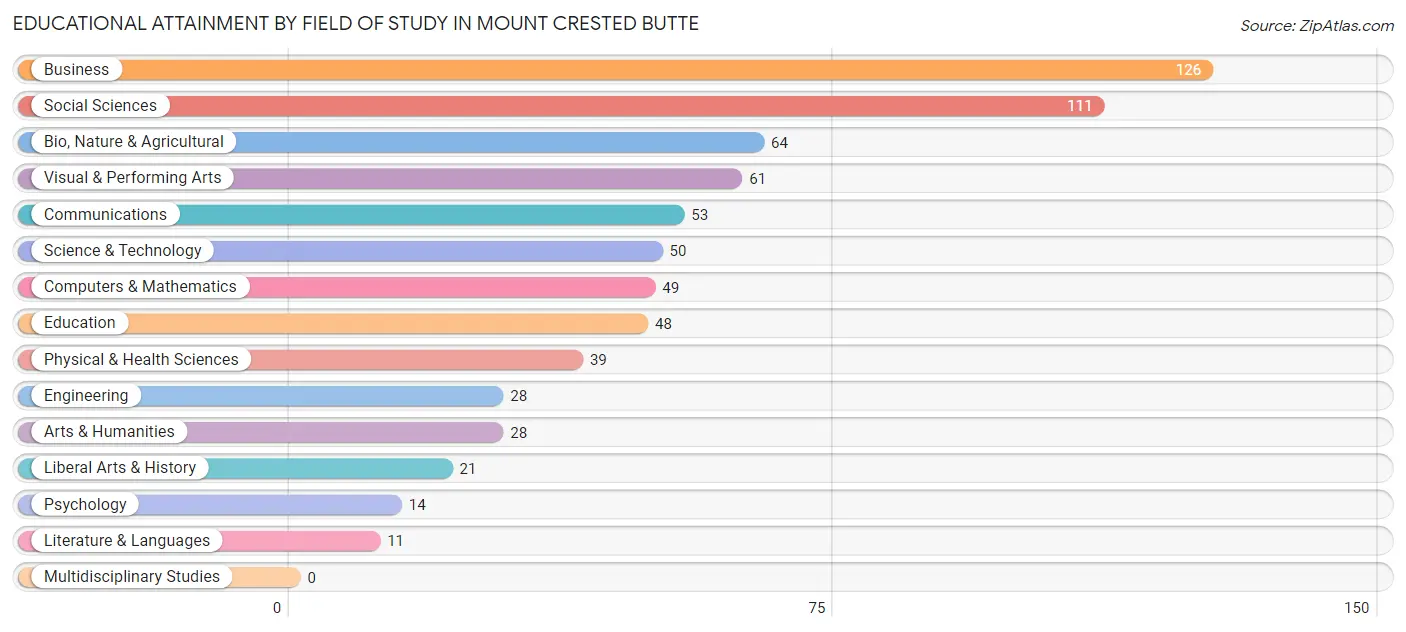
Educational Attainment by Field of Study in Mount Crested Butte
Business (126 | 17.9%), social sciences (111 | 15.8%), bio, nature & agricultural (64 | 9.1%), visual & performing arts (61 | 8.7%), and communications (53 | 7.5%) are the most common fields of study among 703 individuals in Mount Crested Butte who have obtained a bachelor's degree or higher.
| Field of Study | # Graduates | % Graduates |
| Computers & Mathematics | 49 | 7.0% |
| Bio, Nature & Agricultural | 64 | 9.1% |
| Physical & Health Sciences | 39 | 5.6% |
| Psychology | 14 | 2.0% |
| Social Sciences | 111 | 15.8% |
| Engineering | 28 | 4.0% |
| Multidisciplinary Studies | 0 | 0.0% |
| Science & Technology | 50 | 7.1% |
| Business | 126 | 17.9% |
| Education | 48 | 6.8% |
| Literature & Languages | 11 | 1.6% |
| Liberal Arts & History | 21 | 3.0% |
| Visual & Performing Arts | 61 | 8.7% |
| Communications | 53 | 7.5% |
| Arts & Humanities | 28 | 4.0% |
| Total | 703 | 100.0% |
Transportation & Commute in Mount Crested Butte
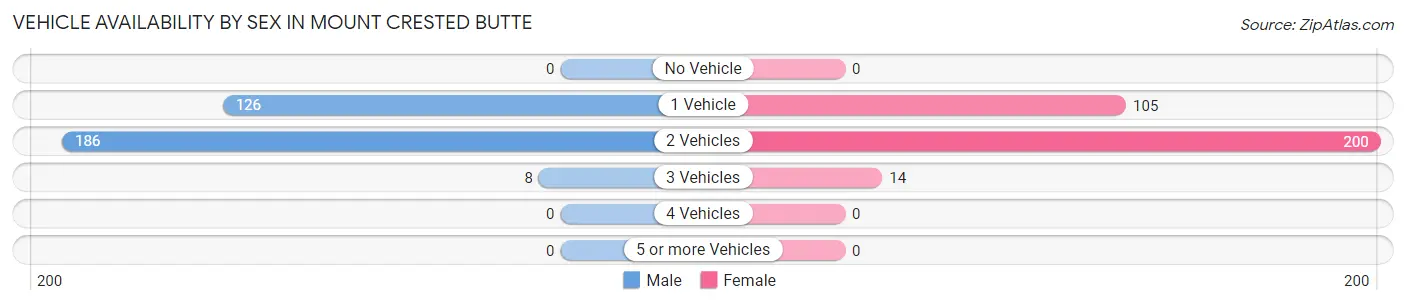
Vehicle Availability by Sex in Mount Crested Butte
The most prevalent vehicle ownership categories in Mount Crested Butte are males with 2 vehicles (186, accounting for 58.1%) and females with 2 vehicles (200, making up 58.3%).
| Vehicles Available | Male | Female |
| No Vehicle | 0 (0.0%) | 0 (0.0%) |
| 1 Vehicle | 126 (39.4%) | 105 (32.9%) |
| 2 Vehicles | 186 (58.1%) | 200 (62.7%) |
| 3 Vehicles | 8 (2.5%) | 14 (4.4%) |
| 4 Vehicles | 0 (0.0%) | 0 (0.0%) |
| 5 or more Vehicles | 0 (0.0%) | 0 (0.0%) |
| Total | 320 (100.0%) | 319 (100.0%) |
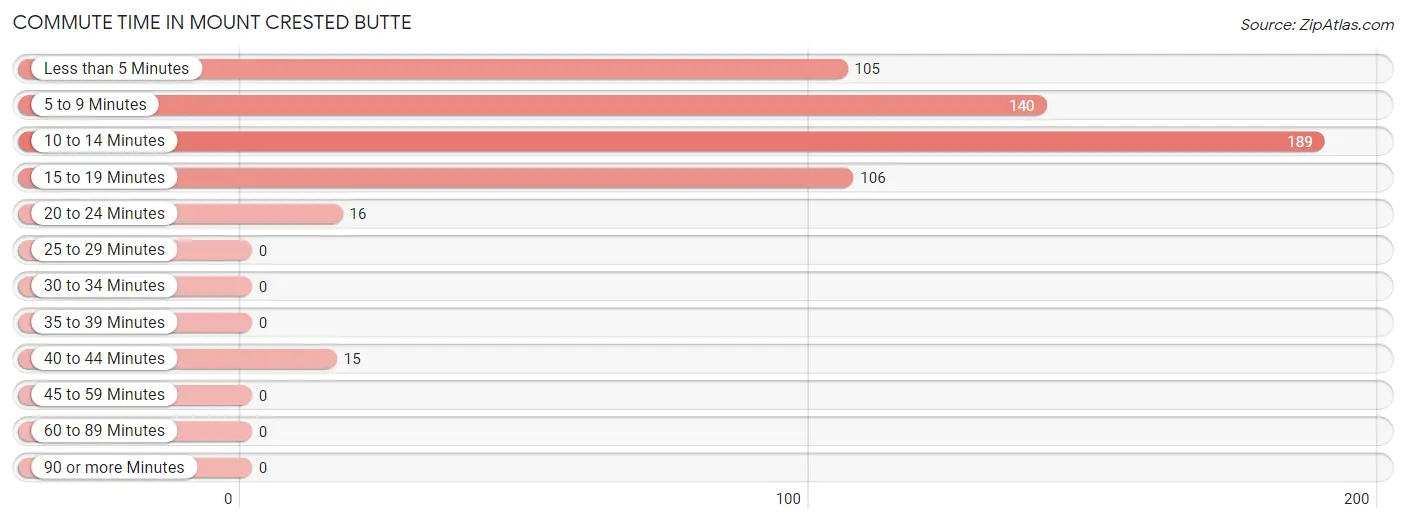
Commute Time in Mount Crested Butte
The most frequently occuring commute durations in Mount Crested Butte are 10 to 14 minutes (189 commuters, 33.1%), 5 to 9 minutes (140 commuters, 24.5%), and 15 to 19 minutes (106 commuters, 18.6%).
| Commute Time | # Commuters | % Commuters |
| Less than 5 Minutes | 105 | 18.4% |
| 5 to 9 Minutes | 140 | 24.5% |
| 10 to 14 Minutes | 189 | 33.1% |
| 15 to 19 Minutes | 106 | 18.6% |
| 20 to 24 Minutes | 16 | 2.8% |
| 25 to 29 Minutes | 0 | 0.0% |
| 30 to 34 Minutes | 0 | 0.0% |
| 35 to 39 Minutes | 0 | 0.0% |
| 40 to 44 Minutes | 15 | 2.6% |
| 45 to 59 Minutes | 0 | 0.0% |
| 60 to 89 Minutes | 0 | 0.0% |
| 90 or more Minutes | 0 | 0.0% |
Commute Time by Sex in Mount Crested Butte
The most common commute times in Mount Crested Butte are 10 to 14 minutes (96 commuters, 35.6%) for males and 10 to 14 minutes (93 commuters, 30.9%) for females.
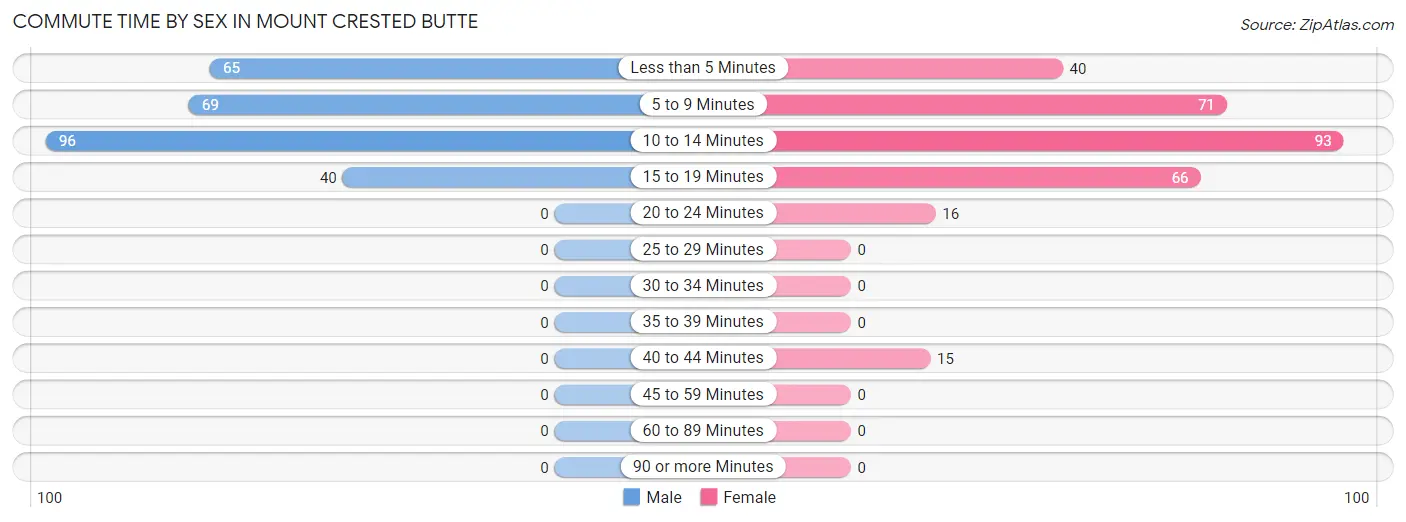
| Commute Time | Male | Female |
| Less than 5 Minutes | 65 (24.1%) | 40 (13.3%) |
| 5 to 9 Minutes | 69 (25.6%) | 71 (23.6%) |
| 10 to 14 Minutes | 96 (35.6%) | 93 (30.9%) |
| 15 to 19 Minutes | 40 (14.8%) | 66 (21.9%) |
| 20 to 24 Minutes | 0 (0.0%) | 16 (5.3%) |
| 25 to 29 Minutes | 0 (0.0%) | 0 (0.0%) |
| 30 to 34 Minutes | 0 (0.0%) | 0 (0.0%) |
| 35 to 39 Minutes | 0 (0.0%) | 0 (0.0%) |
| 40 to 44 Minutes | 0 (0.0%) | 15 (5.0%) |
| 45 to 59 Minutes | 0 (0.0%) | 0 (0.0%) |
| 60 to 89 Minutes | 0 (0.0%) | 0 (0.0%) |
| 90 or more Minutes | 0 (0.0%) | 0 (0.0%) |
Time of Departure to Work by Sex in Mount Crested Butte
The most frequent times of departure to work in Mount Crested Butte are 6:30 AM to 6:59 AM (51, 18.9%) for males and 9:00 AM to 9:59 AM (92, 30.6%) for females.
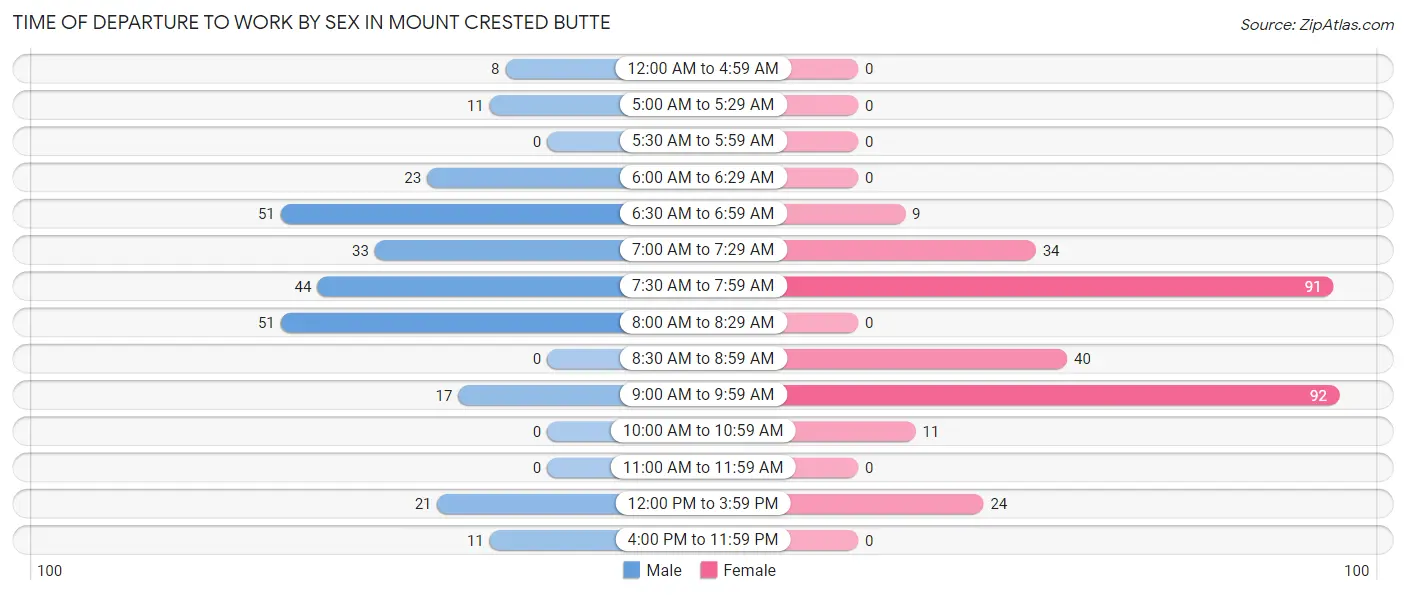
| Time of Departure | Male | Female |
| 12:00 AM to 4:59 AM | 8 (3.0%) | 0 (0.0%) |
| 5:00 AM to 5:29 AM | 11 (4.1%) | 0 (0.0%) |
| 5:30 AM to 5:59 AM | 0 (0.0%) | 0 (0.0%) |
| 6:00 AM to 6:29 AM | 23 (8.5%) | 0 (0.0%) |
| 6:30 AM to 6:59 AM | 51 (18.9%) | 9 (3.0%) |
| 7:00 AM to 7:29 AM | 33 (12.2%) | 34 (11.3%) |
| 7:30 AM to 7:59 AM | 44 (16.3%) | 91 (30.2%) |
| 8:00 AM to 8:29 AM | 51 (18.9%) | 0 (0.0%) |
| 8:30 AM to 8:59 AM | 0 (0.0%) | 40 (13.3%) |
| 9:00 AM to 9:59 AM | 17 (6.3%) | 92 (30.6%) |
| 10:00 AM to 10:59 AM | 0 (0.0%) | 11 (3.6%) |
| 11:00 AM to 11:59 AM | 0 (0.0%) | 0 (0.0%) |
| 12:00 PM to 3:59 PM | 21 (7.8%) | 24 (8.0%) |
| 4:00 PM to 11:59 PM | 11 (4.1%) | 0 (0.0%) |
| Total | 270 (100.0%) | 301 (100.0%) |
Housing Occupancy in Mount Crested Butte
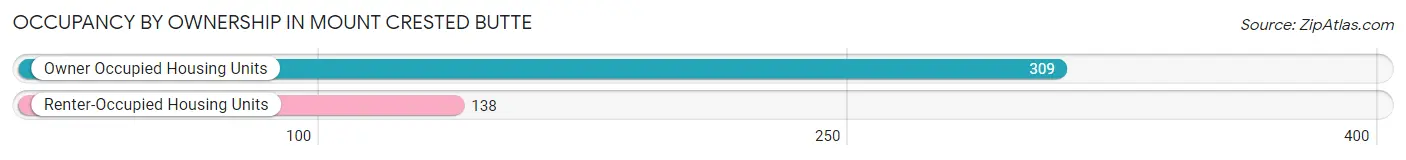
Occupancy by Ownership in Mount Crested Butte
Of the total 447 dwellings in Mount Crested Butte, owner-occupied units account for 309 (69.1%), while renter-occupied units make up 138 (30.9%).
| Occupancy | # Housing Units | % Housing Units |
| Owner Occupied Housing Units | 309 | 69.1% |
| Renter-Occupied Housing Units | 138 | 30.9% |
| Total Occupied Housing Units | 447 | 100.0% |
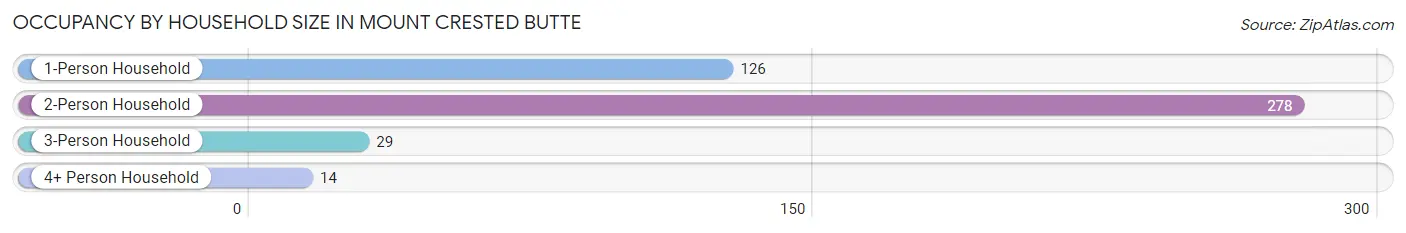
Occupancy by Household Size in Mount Crested Butte
| Household Size | # Housing Units | % Housing Units |
| 1-Person Household | 126 | 28.2% |
| 2-Person Household | 278 | 62.2% |
| 3-Person Household | 29 | 6.5% |
| 4+ Person Household | 14 | 3.1% |
| Total Housing Units | 447 | 100.0% |
Occupancy by Ownership by Household Size in Mount Crested Butte
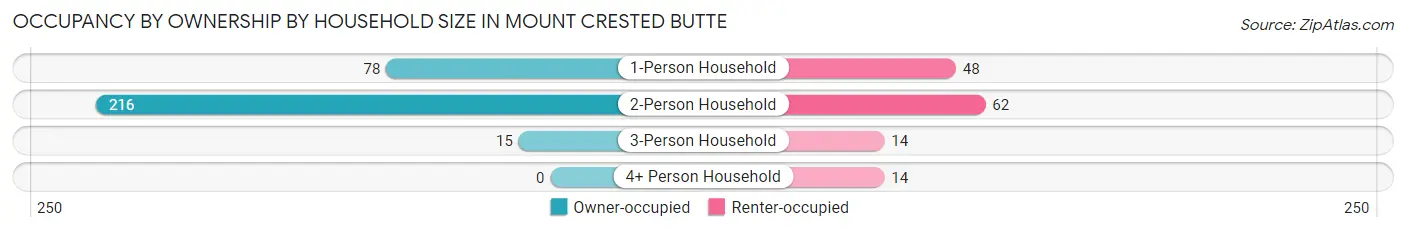
| Household Size | Owner-occupied | Renter-occupied |
| 1-Person Household | 78 (61.9%) | 48 (38.1%) |
| 2-Person Household | 216 (77.7%) | 62 (22.3%) |
| 3-Person Household | 15 (51.7%) | 14 (48.3%) |
| 4+ Person Household | 0 (0.0%) | 14 (100.0%) |
| Total Housing Units | 309 (69.1%) | 138 (30.9%) |
Occupancy by Educational Attainment in Mount Crested Butte
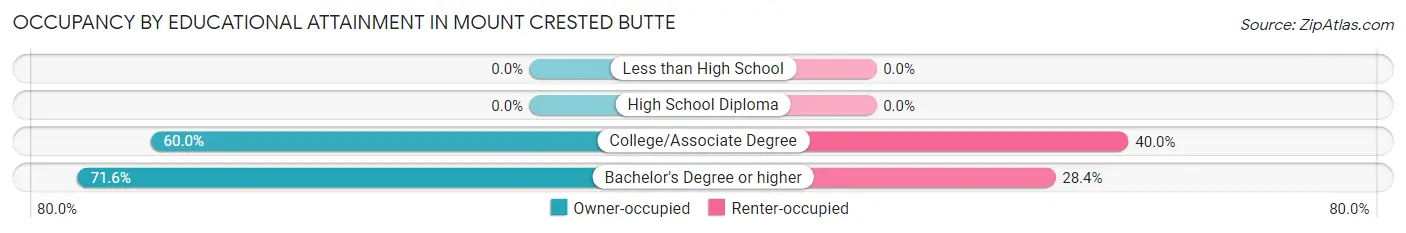
| Household Size | Owner-occupied | Renter-occupied |
| Less than High School | 0 (0.0%) | 0 (0.0%) |
| High School Diploma | 0 (0.0%) | 0 (0.0%) |
| College/Associate Degree | 57 (60.0%) | 38 (40.0%) |
| Bachelor's Degree or higher | 252 (71.6%) | 100 (28.4%) |
Occupancy by Age of Householder in Mount Crested Butte
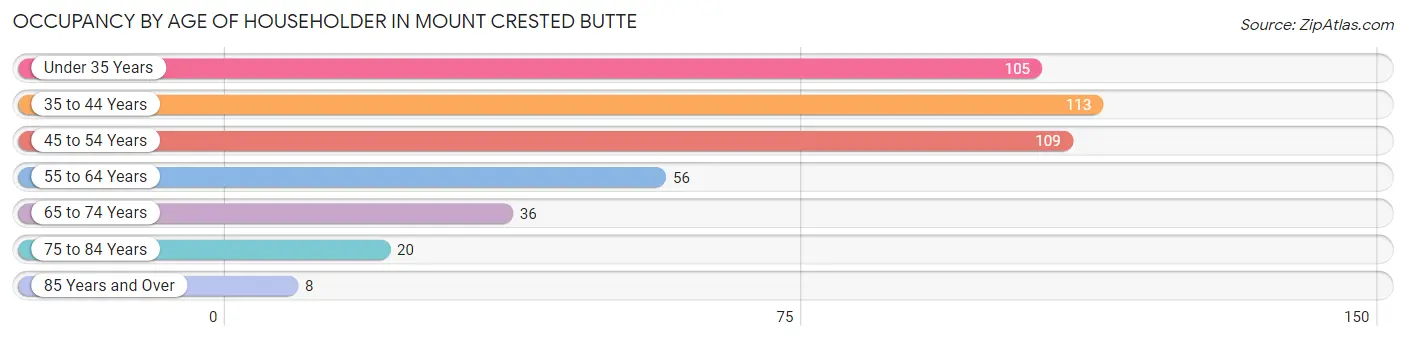
| Age Bracket | # Households | % Households |
| Under 35 Years | 105 | 23.5% |
| 35 to 44 Years | 113 | 25.3% |
| 45 to 54 Years | 109 | 24.4% |
| 55 to 64 Years | 56 | 12.5% |
| 65 to 74 Years | 36 | 8.1% |
| 75 to 84 Years | 20 | 4.5% |
| 85 Years and Over | 8 | 1.8% |
| Total | 447 | 100.0% |
Housing Finances in Mount Crested Butte
Median Income by Occupancy in Mount Crested Butte
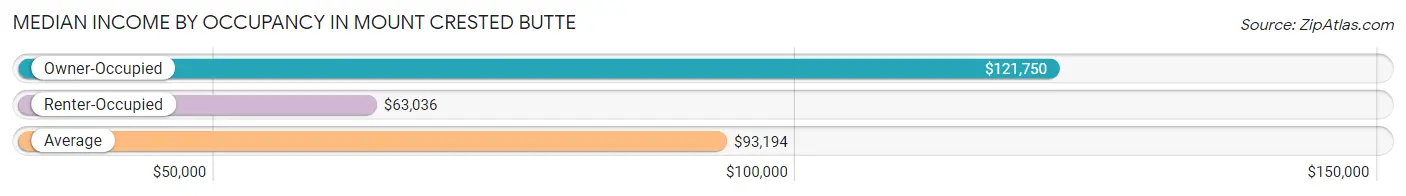
| Occupancy Type | # Households | Median Income |
| Owner-Occupied | 309 (69.1%) | $121,750 |
| Renter-Occupied | 138 (30.9%) | $63,036 |
| Average | 447 (100.0%) | $93,194 |
Occupancy by Householder Income Bracket in Mount Crested Butte
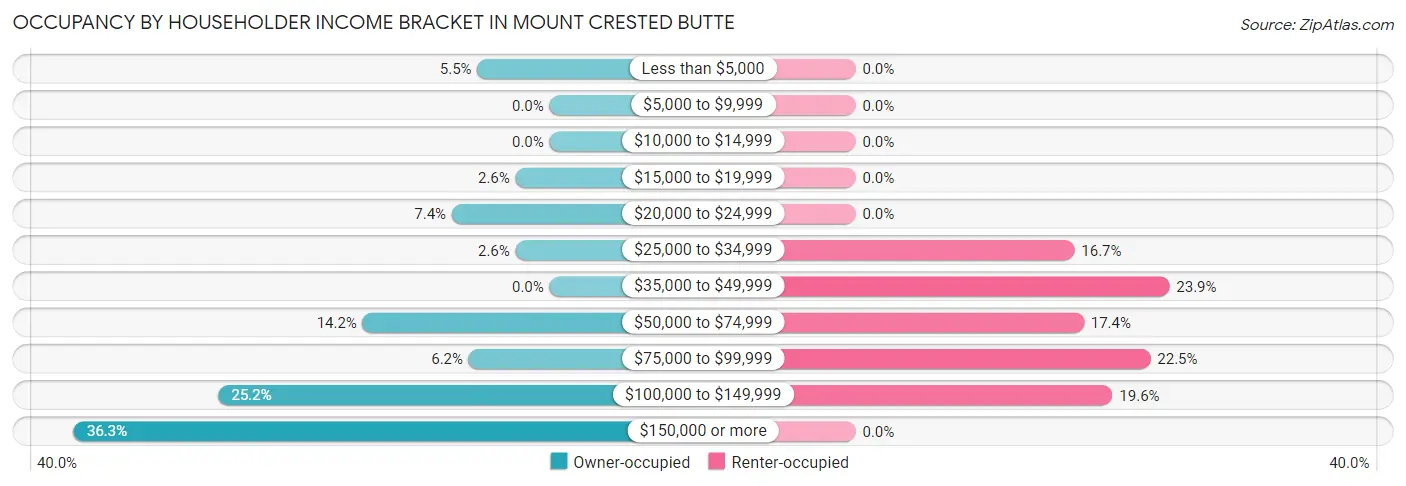
| Income Bracket | Owner-occupied | Renter-occupied |
| Less than $5,000 | 17 (5.5%) | 0 (0.0%) |
| $5,000 to $9,999 | 0 (0.0%) | 0 (0.0%) |
| $10,000 to $14,999 | 0 (0.0%) | 0 (0.0%) |
| $15,000 to $19,999 | 8 (2.6%) | 0 (0.0%) |
| $20,000 to $24,999 | 23 (7.4%) | 0 (0.0%) |
| $25,000 to $34,999 | 8 (2.6%) | 23 (16.7%) |
| $35,000 to $49,999 | 0 (0.0%) | 33 (23.9%) |
| $50,000 to $74,999 | 44 (14.2%) | 24 (17.4%) |
| $75,000 to $99,999 | 19 (6.1%) | 31 (22.5%) |
| $100,000 to $149,999 | 78 (25.2%) | 27 (19.6%) |
| $150,000 or more | 112 (36.2%) | 0 (0.0%) |
| Total | 309 (100.0%) | 138 (100.0%) |
Monthly Housing Cost Tiers in Mount Crested Butte
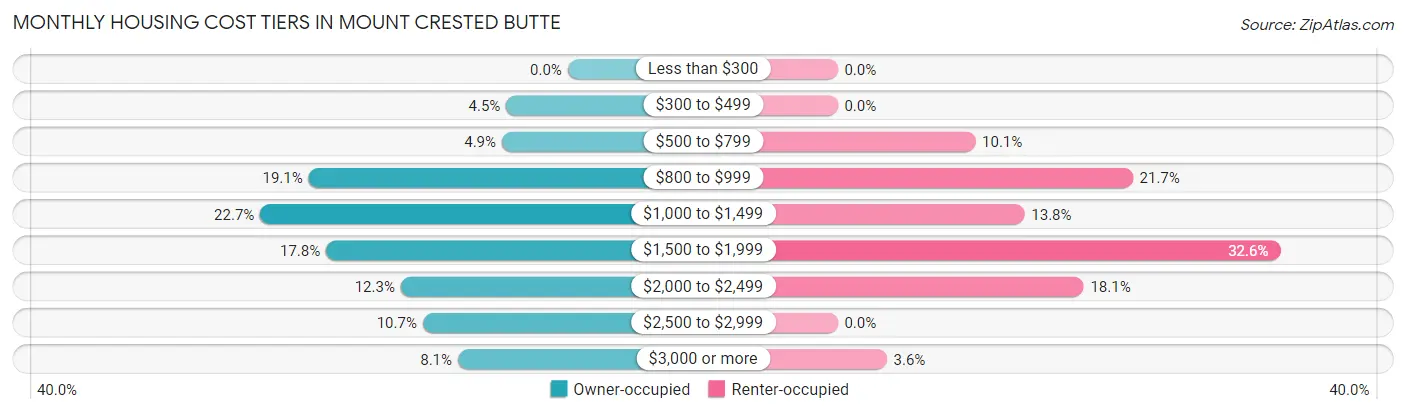
| Monthly Cost | Owner-occupied | Renter-occupied |
| Less than $300 | 0 (0.0%) | 0 (0.0%) |
| $300 to $499 | 14 (4.5%) | 0 (0.0%) |
| $500 to $799 | 15 (4.9%) | 14 (10.1%) |
| $800 to $999 | 59 (19.1%) | 30 (21.7%) |
| $1,000 to $1,499 | 70 (22.7%) | 19 (13.8%) |
| $1,500 to $1,999 | 55 (17.8%) | 45 (32.6%) |
| $2,000 to $2,499 | 38 (12.3%) | 25 (18.1%) |
| $2,500 to $2,999 | 33 (10.7%) | 0 (0.0%) |
| $3,000 or more | 25 (8.1%) | 5 (3.6%) |
| Total | 309 (100.0%) | 138 (100.0%) |
Physical Housing Characteristics in Mount Crested Butte
Housing Structures in Mount Crested Butte
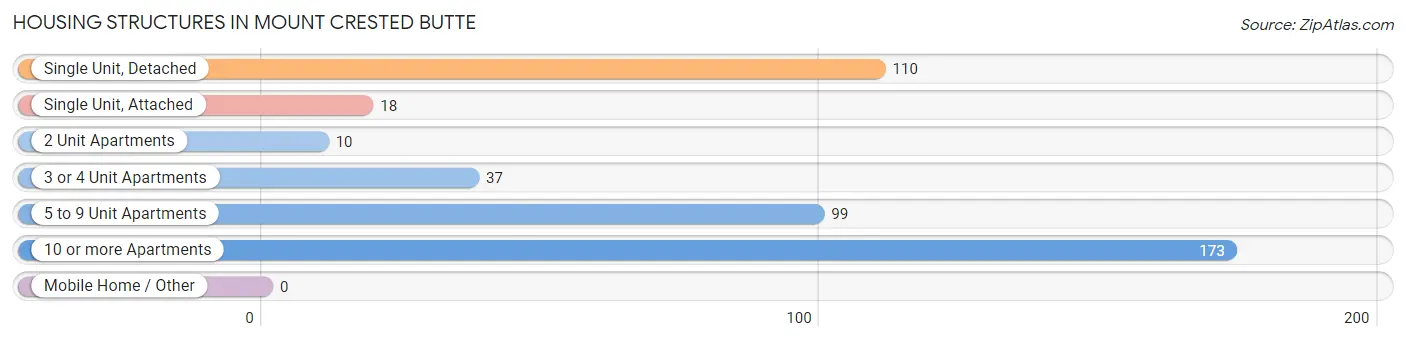
| Structure Type | # Housing Units | % Housing Units |
| Single Unit, Detached | 110 | 24.6% |
| Single Unit, Attached | 18 | 4.0% |
| 2 Unit Apartments | 10 | 2.2% |
| 3 or 4 Unit Apartments | 37 | 8.3% |
| 5 to 9 Unit Apartments | 99 | 22.2% |
| 10 or more Apartments | 173 | 38.7% |
| Mobile Home / Other | 0 | 0.0% |
| Total | 447 | 100.0% |
Housing Structures by Occupancy in Mount Crested Butte
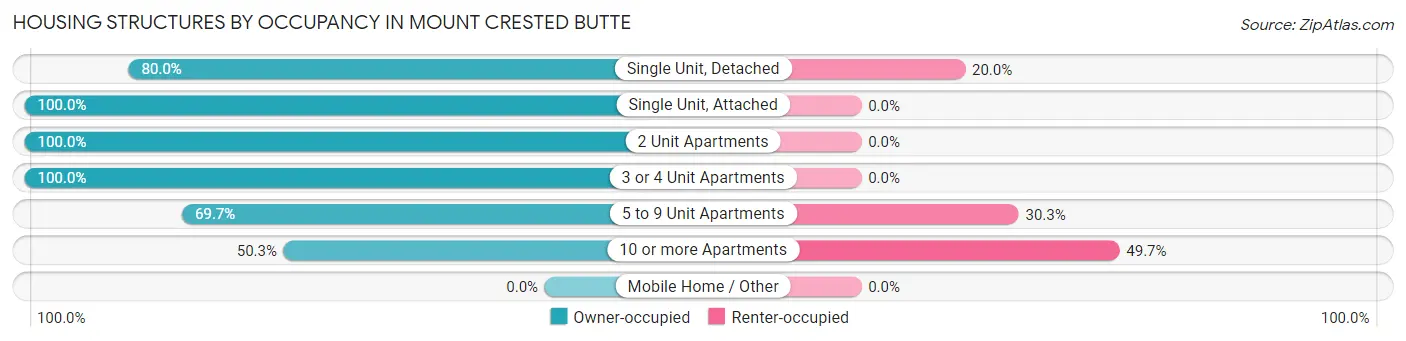
| Structure Type | Owner-occupied | Renter-occupied |
| Single Unit, Detached | 88 (80.0%) | 22 (20.0%) |
| Single Unit, Attached | 18 (100.0%) | 0 (0.0%) |
| 2 Unit Apartments | 10 (100.0%) | 0 (0.0%) |
| 3 or 4 Unit Apartments | 37 (100.0%) | 0 (0.0%) |
| 5 to 9 Unit Apartments | 69 (69.7%) | 30 (30.3%) |
| 10 or more Apartments | 87 (50.3%) | 86 (49.7%) |
| Mobile Home / Other | 0 (0.0%) | 0 (0.0%) |
| Total | 309 (69.1%) | 138 (30.9%) |
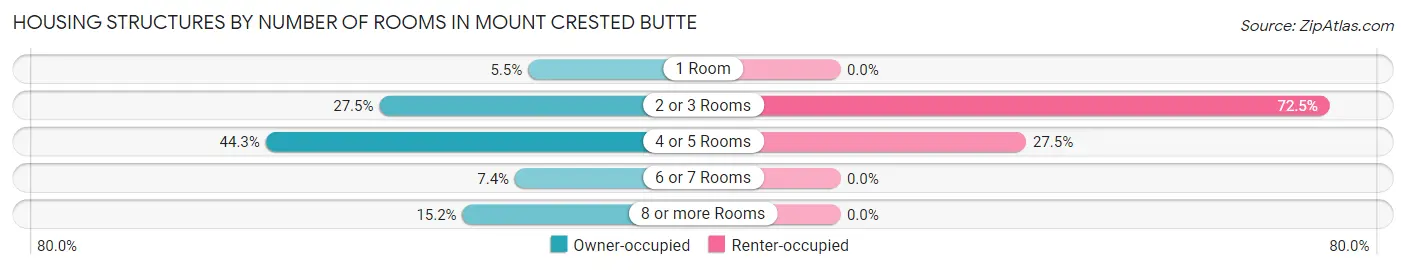
Housing Structures by Number of Rooms in Mount Crested Butte
| Number of Rooms | Owner-occupied | Renter-occupied |
| 1 Room | 17 (5.5%) | 0 (0.0%) |
| 2 or 3 Rooms | 85 (27.5%) | 100 (72.5%) |
| 4 or 5 Rooms | 137 (44.3%) | 38 (27.5%) |
| 6 or 7 Rooms | 23 (7.4%) | 0 (0.0%) |
| 8 or more Rooms | 47 (15.2%) | 0 (0.0%) |
| Total | 309 (100.0%) | 138 (100.0%) |
Housing Structure by Heating Type in Mount Crested Butte
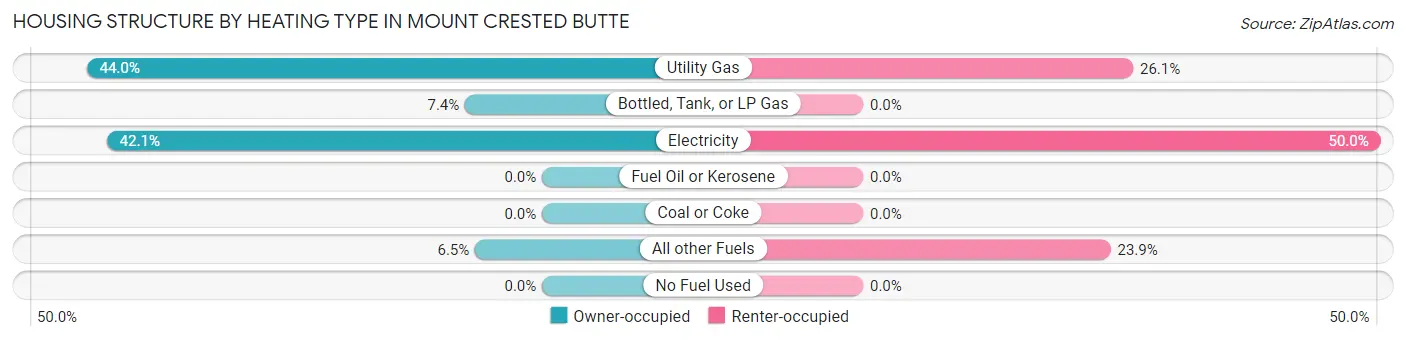
| Heating Type | Owner-occupied | Renter-occupied |
| Utility Gas | 136 (44.0%) | 36 (26.1%) |
| Bottled, Tank, or LP Gas | 23 (7.4%) | 0 (0.0%) |
| Electricity | 130 (42.1%) | 69 (50.0%) |
| Fuel Oil or Kerosene | 0 (0.0%) | 0 (0.0%) |
| Coal or Coke | 0 (0.0%) | 0 (0.0%) |
| All other Fuels | 20 (6.5%) | 33 (23.9%) |
| No Fuel Used | 0 (0.0%) | 0 (0.0%) |
| Total | 309 (100.0%) | 138 (100.0%) |
Household Vehicle Usage in Mount Crested Butte
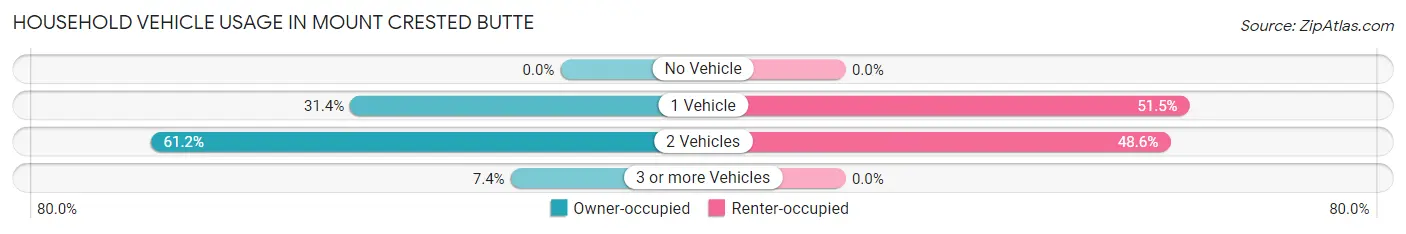
| Vehicles per Household | Owner-occupied | Renter-occupied |
| No Vehicle | 0 (0.0%) | 0 (0.0%) |
| 1 Vehicle | 97 (31.4%) | 71 (51.4%) |
| 2 Vehicles | 189 (61.2%) | 67 (48.5%) |
| 3 or more Vehicles | 23 (7.4%) | 0 (0.0%) |
| Total | 309 (100.0%) | 138 (100.0%) |
Real Estate & Mortgages in Mount Crested Butte
Real Estate and Mortgage Overview in Mount Crested Butte
| Characteristic | Without Mortgage | With Mortgage |
| Housing Units | 127 | 182 |
| Median Property Value | $681,600 | $471,900 |
| Median Household Income | $88,750 | $65 |
| Monthly Housing Costs | $955 | $25 |
| Real Estate Taxes | $2,430 | $0 |
Property Value by Mortgage Status in Mount Crested Butte
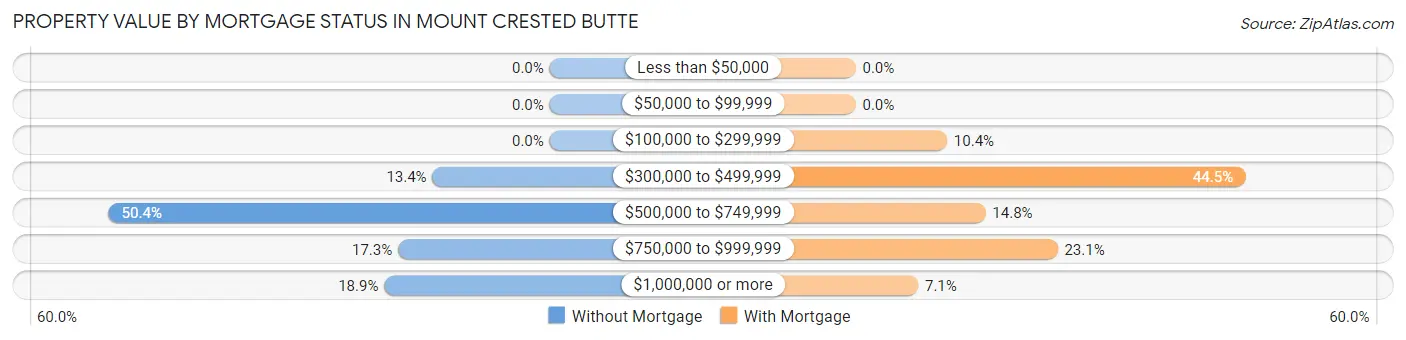
| Property Value | Without Mortgage | With Mortgage |
| Less than $50,000 | 0 (0.0%) | 0 (0.0%) |
| $50,000 to $99,999 | 0 (0.0%) | 0 (0.0%) |
| $100,000 to $299,999 | 0 (0.0%) | 19 (10.4%) |
| $300,000 to $499,999 | 17 (13.4%) | 81 (44.5%) |
| $500,000 to $749,999 | 64 (50.4%) | 27 (14.8%) |
| $750,000 to $999,999 | 22 (17.3%) | 42 (23.1%) |
| $1,000,000 or more | 24 (18.9%) | 13 (7.1%) |
| Total | 127 (100.0%) | 182 (100.0%) |
Household Income by Mortgage Status in Mount Crested Butte
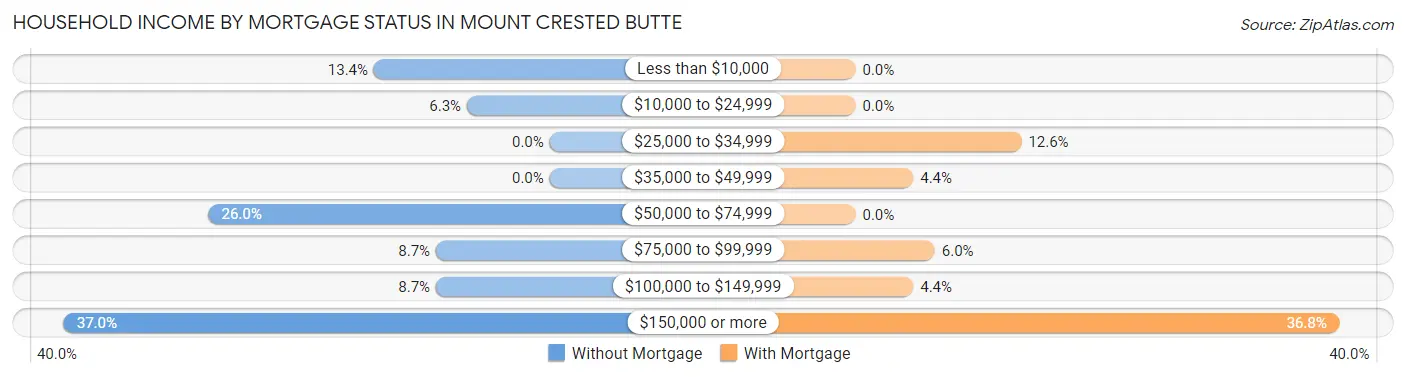
| Household Income | Without Mortgage | With Mortgage |
| Less than $10,000 | 17 (13.4%) | 0 (0.0%) |
| $10,000 to $24,999 | 8 (6.3%) | 0 (0.0%) |
| $25,000 to $34,999 | 0 (0.0%) | 23 (12.6%) |
| $35,000 to $49,999 | 0 (0.0%) | 8 (4.4%) |
| $50,000 to $74,999 | 33 (26.0%) | 0 (0.0%) |
| $75,000 to $99,999 | 11 (8.7%) | 11 (6.0%) |
| $100,000 to $149,999 | 11 (8.7%) | 8 (4.4%) |
| $150,000 or more | 47 (37.0%) | 67 (36.8%) |
| Total | 127 (100.0%) | 182 (100.0%) |
Property Value to Household Income Ratio in Mount Crested Butte
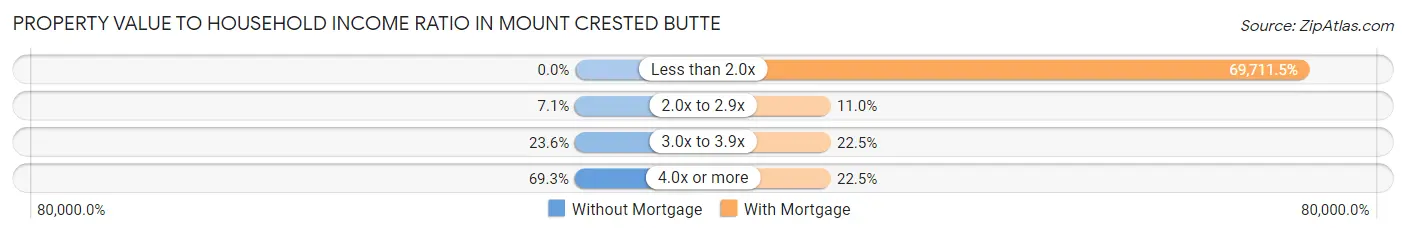
| Value-to-Income Ratio | Without Mortgage | With Mortgage |
| Less than 2.0x | 0 (0.0%) | 126,875 (69,711.5%) |
| 2.0x to 2.9x | 9 (7.1%) | 20 (11.0%) |
| 3.0x to 3.9x | 30 (23.6%) | 41 (22.5%) |
| 4.0x or more | 88 (69.3%) | 41 (22.5%) |
| Total | 127 (100.0%) | 182 (100.0%) |
Real Estate Taxes by Mortgage Status in Mount Crested Butte
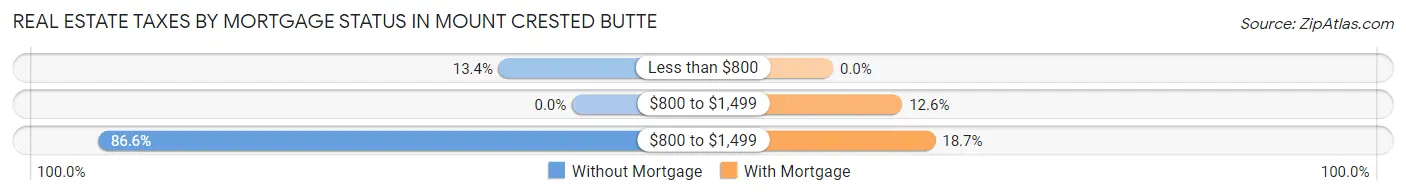
| Property Taxes | Without Mortgage | With Mortgage |
| Less than $800 | 17 (13.4%) | 0 (0.0%) |
| $800 to $1,499 | 0 (0.0%) | 23 (12.6%) |
| $800 to $1,499 | 110 (86.6%) | 34 (18.7%) |
| Total | 127 (100.0%) | 182 (100.0%) |
Health & Disability in Mount Crested Butte
Health Insurance Coverage by Age in Mount Crested Butte
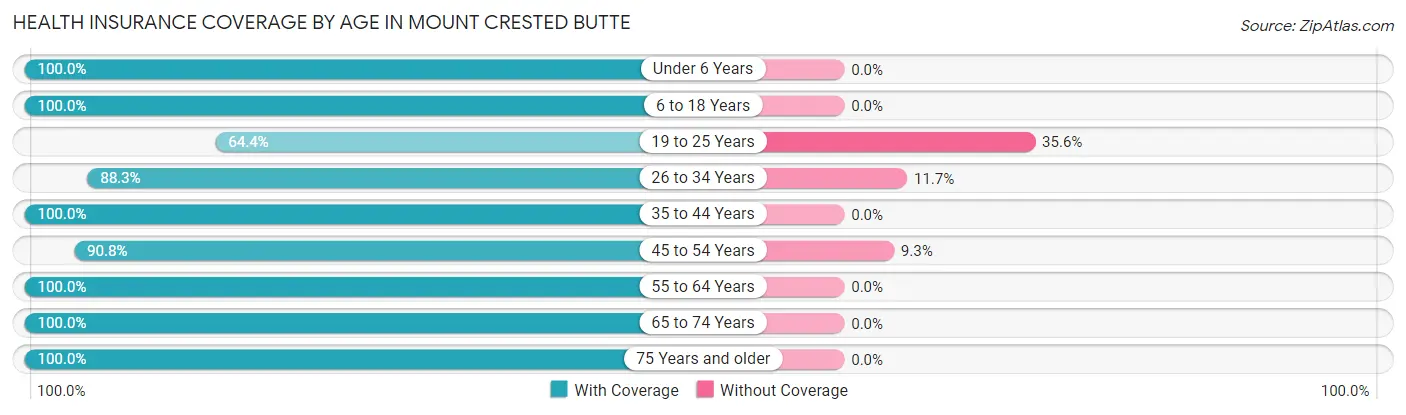
| Age Bracket | With Coverage | Without Coverage |
| Under 6 Years | 18 (100.0%) | 0 (0.0%) |
| 6 to 18 Years | 11 (100.0%) | 0 (0.0%) |
| 19 to 25 Years | 38 (64.4%) | 21 (35.6%) |
| 26 to 34 Years | 166 (88.3%) | 22 (11.7%) |
| 35 to 44 Years | 188 (100.0%) | 0 (0.0%) |
| 45 to 54 Years | 157 (90.7%) | 16 (9.2%) |
| 55 to 64 Years | 118 (100.0%) | 0 (0.0%) |
| 65 to 74 Years | 72 (100.0%) | 0 (0.0%) |
| 75 Years and older | 42 (100.0%) | 0 (0.0%) |
| Total | 810 (93.2%) | 59 (6.8%) |
Health Insurance Coverage by Citizenship Status in Mount Crested Butte
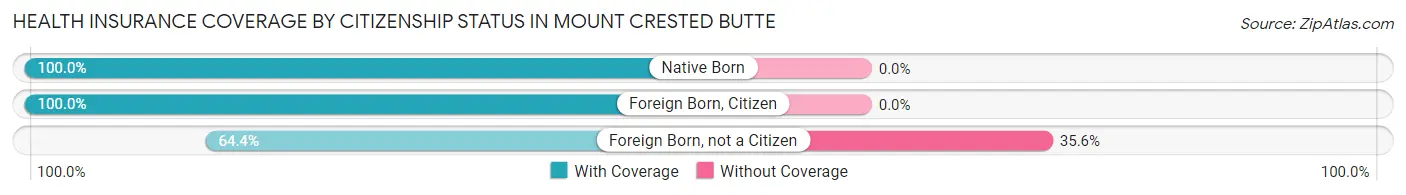
| Citizenship Status | With Coverage | Without Coverage |
| Native Born | 18 (100.0%) | 0 (0.0%) |
| Foreign Born, Citizen | 11 (100.0%) | 0 (0.0%) |
| Foreign Born, not a Citizen | 38 (64.4%) | 21 (35.6%) |
Health Insurance Coverage by Household Income in Mount Crested Butte
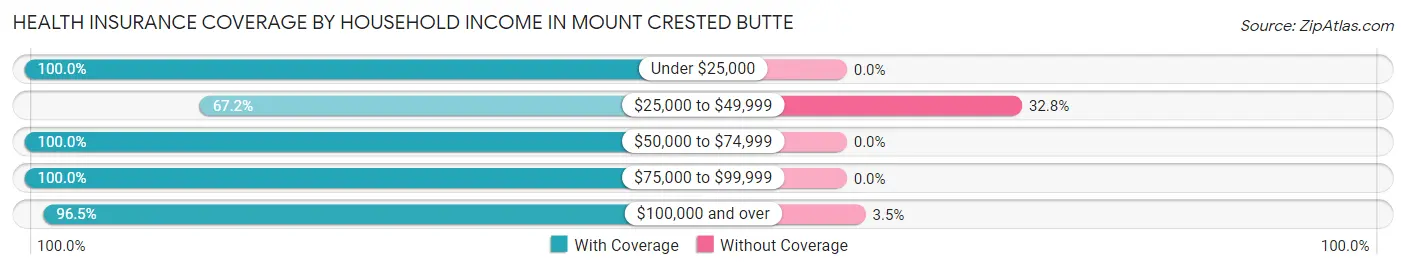
| Household Income | With Coverage | Without Coverage |
| Under $25,000 | 59 (100.0%) | 0 (0.0%) |
| $25,000 to $49,999 | 88 (67.2%) | 43 (32.8%) |
| $50,000 to $74,999 | 131 (100.0%) | 0 (0.0%) |
| $75,000 to $99,999 | 93 (100.0%) | 0 (0.0%) |
| $100,000 and over | 439 (96.5%) | 16 (3.5%) |
Public vs Private Health Insurance Coverage by Age in Mount Crested Butte
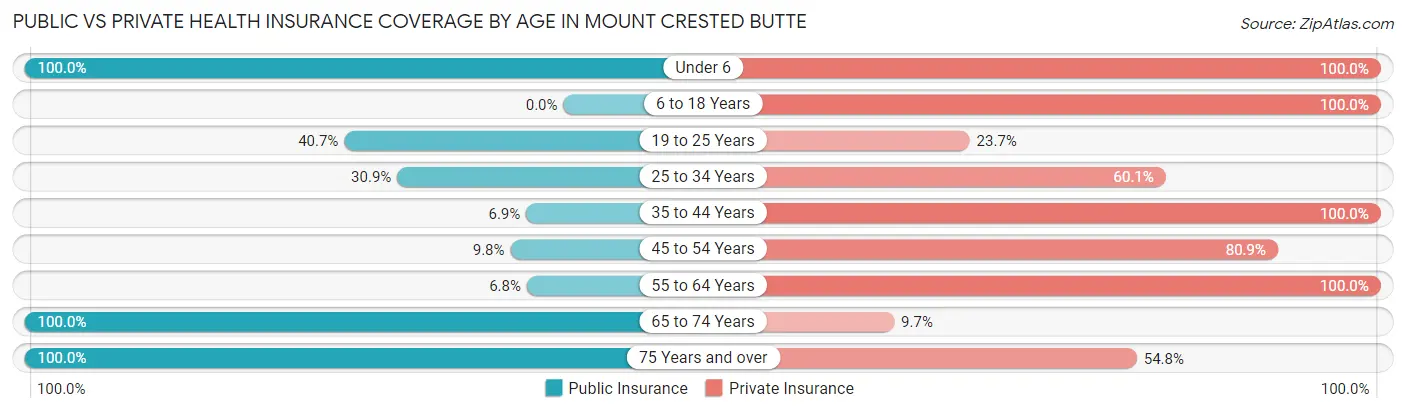
| Age Bracket | Public Insurance | Private Insurance |
| Under 6 | 18 (100.0%) | 18 (100.0%) |
| 6 to 18 Years | 0 (0.0%) | 11 (100.0%) |
| 19 to 25 Years | 24 (40.7%) | 14 (23.7%) |
| 25 to 34 Years | 58 (30.8%) | 113 (60.1%) |
| 35 to 44 Years | 13 (6.9%) | 188 (100.0%) |
| 45 to 54 Years | 17 (9.8%) | 140 (80.9%) |
| 55 to 64 Years | 8 (6.8%) | 118 (100.0%) |
| 65 to 74 Years | 72 (100.0%) | 7 (9.7%) |
| 75 Years and over | 42 (100.0%) | 23 (54.8%) |
| Total | 252 (29.0%) | 632 (72.7%) |
Disability Status by Sex by Age in Mount Crested Butte
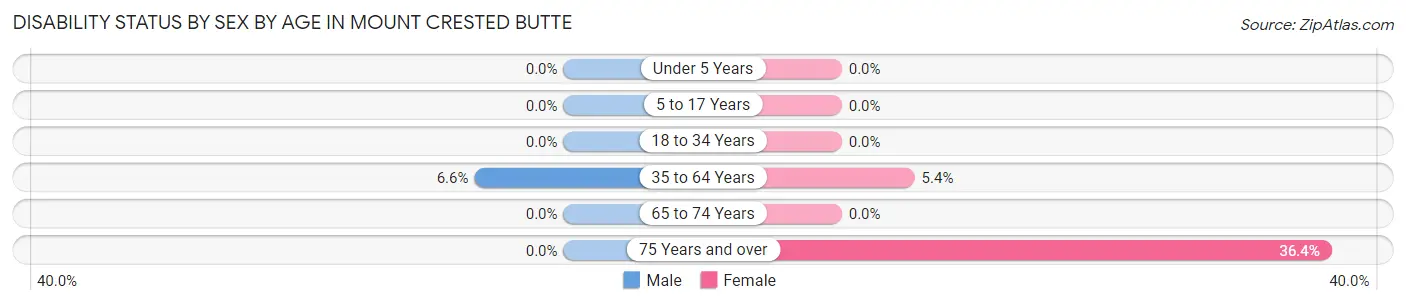
| Age Bracket | Male | Female |
| Under 5 Years | 0 (0.0%) | 0 (0.0%) |
| 5 to 17 Years | 0 (0.0%) | 0 (0.0%) |
| 18 to 34 Years | 0 (0.0%) | 0 (0.0%) |
| 35 to 64 Years | 17 (6.6%) | 12 (5.4%) |
| 65 to 74 Years | 0 (0.0%) | 0 (0.0%) |
| 75 Years and over | 0 (0.0%) | 8 (36.4%) |
Disability Class by Sex by Age in Mount Crested Butte
Disability Class: Hearing Difficulty
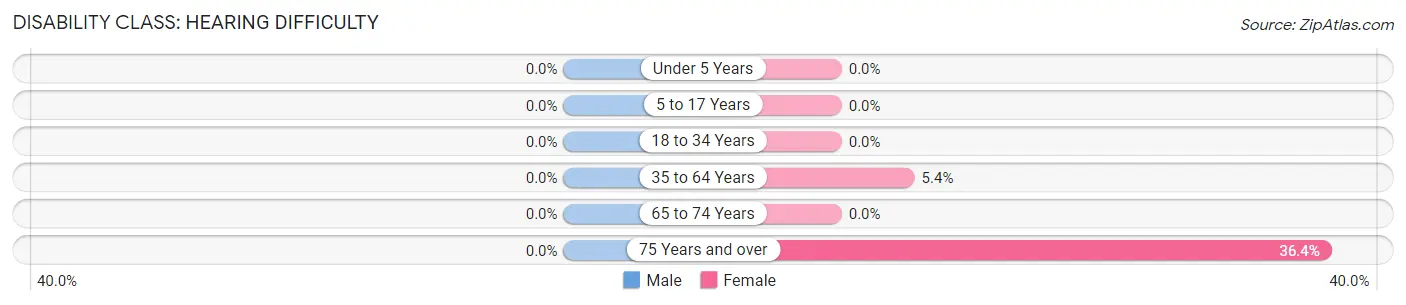
| Age Bracket | Male | Female |
| Under 5 Years | 0 (0.0%) | 0 (0.0%) |
| 5 to 17 Years | 0 (0.0%) | 0 (0.0%) |
| 18 to 34 Years | 0 (0.0%) | 0 (0.0%) |
| 35 to 64 Years | 0 (0.0%) | 12 (5.4%) |
| 65 to 74 Years | 0 (0.0%) | 0 (0.0%) |
| 75 Years and over | 0 (0.0%) | 8 (36.4%) |
Disability Class: Vision Difficulty
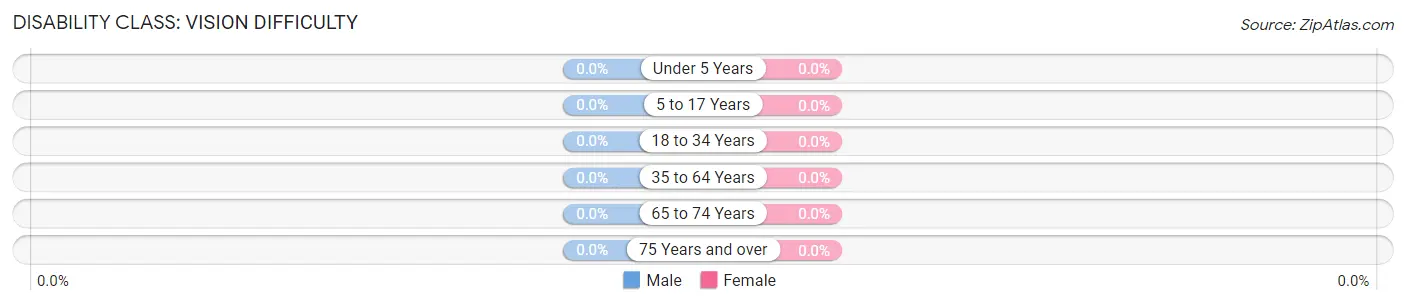
| Age Bracket | Male | Female |
| Under 5 Years | 0 (0.0%) | 0 (0.0%) |
| 5 to 17 Years | 0 (0.0%) | 0 (0.0%) |
| 18 to 34 Years | 0 (0.0%) | 0 (0.0%) |
| 35 to 64 Years | 0 (0.0%) | 0 (0.0%) |
| 65 to 74 Years | 0 (0.0%) | 0 (0.0%) |
| 75 Years and over | 0 (0.0%) | 0 (0.0%) |
Disability Class: Cognitive Difficulty
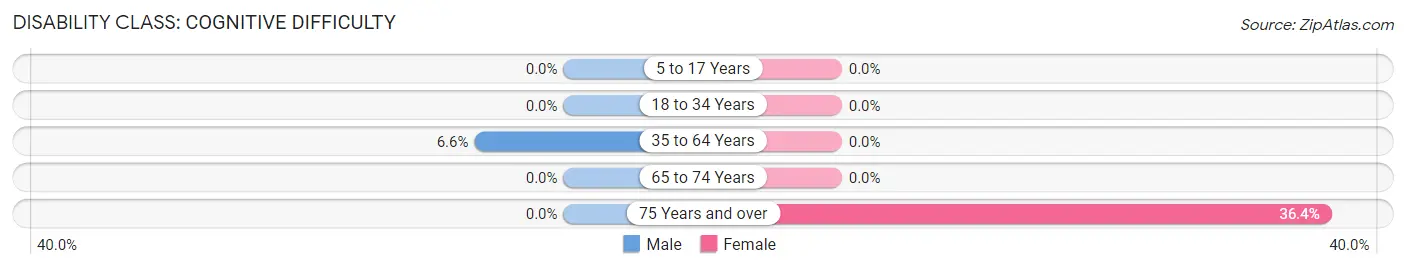
| Age Bracket | Male | Female |
| 5 to 17 Years | 0 (0.0%) | 0 (0.0%) |
| 18 to 34 Years | 0 (0.0%) | 0 (0.0%) |
| 35 to 64 Years | 17 (6.6%) | 0 (0.0%) |
| 65 to 74 Years | 0 (0.0%) | 0 (0.0%) |
| 75 Years and over | 0 (0.0%) | 8 (36.4%) |
Disability Class: Ambulatory Difficulty
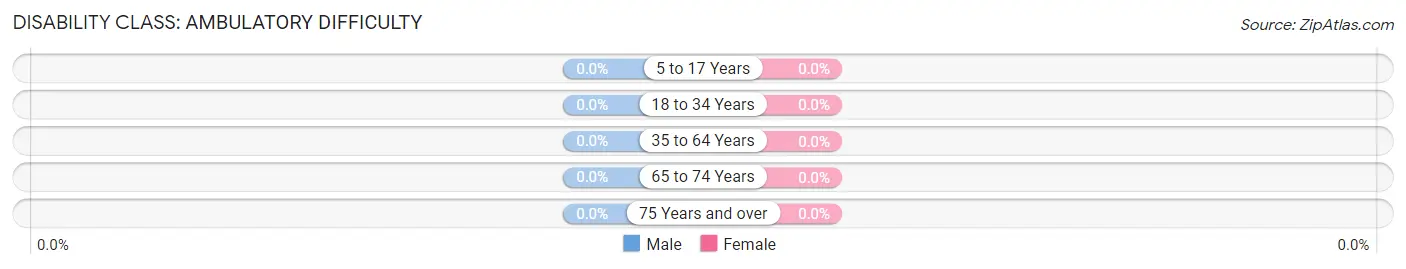
| Age Bracket | Male | Female |
| 5 to 17 Years | 0 (0.0%) | 0 (0.0%) |
| 18 to 34 Years | 0 (0.0%) | 0 (0.0%) |
| 35 to 64 Years | 0 (0.0%) | 0 (0.0%) |
| 65 to 74 Years | 0 (0.0%) | 0 (0.0%) |
| 75 Years and over | 0 (0.0%) | 0 (0.0%) |
Disability Class: Self-Care Difficulty
| Age Bracket | Male | Female |
| 5 to 17 Years | 0 (0.0%) | 0 (0.0%) |
| 18 to 34 Years | 0 (0.0%) | 0 (0.0%) |
| 35 to 64 Years | 0 (0.0%) | 0 (0.0%) |
| 65 to 74 Years | 0 (0.0%) | 0 (0.0%) |
| 75 Years and over | 0 (0.0%) | 0 (0.0%) |
Technology Access in Mount Crested Butte
Computing Device Access in Mount Crested Butte
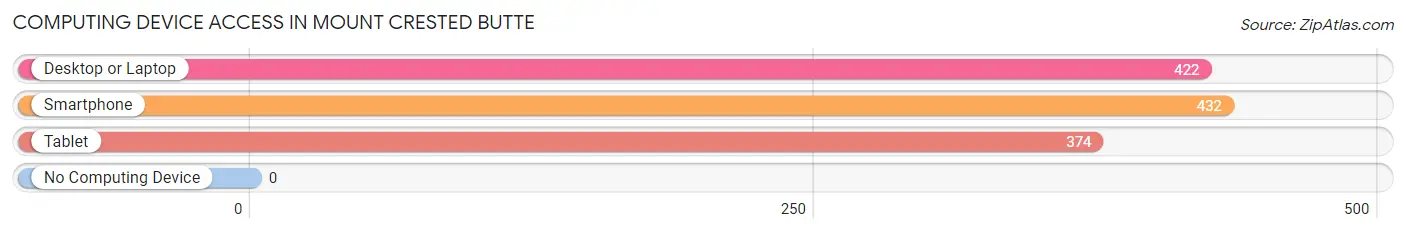
| Device Type | # Households | % Households |
| Desktop or Laptop | 422 | 94.4% |
| Smartphone | 432 | 96.6% |
| Tablet | 374 | 83.7% |
| No Computing Device | 0 | 0.0% |
| Total | 447 | 100.0% |
Internet Access in Mount Crested Butte
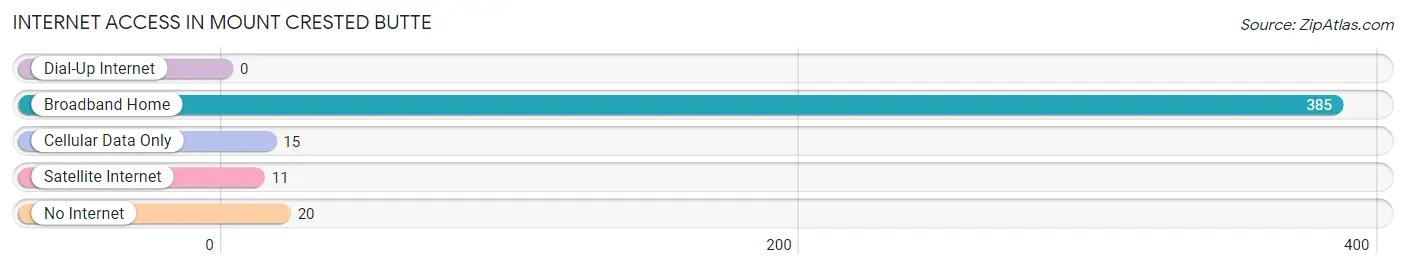
| Internet Type | # Households | % Households |
| Dial-Up Internet | 0 | 0.0% |
| Broadband Home | 385 | 86.1% |
| Cellular Data Only | 15 | 3.4% |
| Satellite Internet | 11 | 2.5% |
| No Internet | 20 | 4.5% |
| Total | 447 | 100.0% |
Mount Crested Butte Summary
Crested Butte, Colorado is a small mountain town located in Gunnison County in the Rocky Mountains of Colorado. It is situated at an elevation of 8,885 feet and is surrounded by the Elk Mountains and the West Elk Wilderness. The town is known for its outdoor recreation opportunities, including skiing, snowboarding, mountain biking, hiking, and camping.
History
The area that is now Crested Butte was first inhabited by the Ute Indians, who used the area for hunting and gathering. The first European settlers arrived in the area in the late 1800s, and the town of Crested Butte was officially founded in 1880. The town was named after the nearby mountain peak, which was named for its resemblance to a cresting wave.
The town quickly grew as miners and prospectors flocked to the area in search of gold and silver. The town was also a popular destination for tourists, who came to enjoy the scenery and outdoor activities. In the early 1900s, the town was home to several ski resorts, which helped to make Crested Butte a popular winter destination.
Geography
Crested Butte is located in the Rocky Mountains of Colorado, in Gunnison County. The town is situated at an elevation of 8,885 feet and is surrounded by the Elk Mountains and the West Elk Wilderness. The town is located near the headwaters of the Gunnison River, which flows through the town and is a popular destination for whitewater rafting and kayaking.
The town is located in a valley surrounded by mountains, and is known for its spectacular views of the surrounding peaks. The town is also known for its abundance of outdoor recreation opportunities, including skiing, snowboarding, mountain biking, hiking, and camping.
Economy
Crested Butte is a popular tourist destination, and the town’s economy is largely based on tourism. The town is home to several ski resorts, which attract visitors from around the world. The town is also home to several restaurants, bars, and shops, which cater to tourists and locals alike.
The town is also home to several businesses that provide services to the local community, such as construction companies, real estate agencies, and medical offices. The town is also home to several art galleries, which showcase the work of local artists.
Demographics
As of the 2010 census, the population of Crested Butte was 1,487. The town is predominantly white, with 91.3% of the population identifying as white. The town also has a small Hispanic population, with 4.3% of the population identifying as Hispanic or Latino. The median household income in the town is $50,977, and the median home value is $521,400.
Conclusion
Crested Butte, Colorado is a small mountain town located in Gunnison County in the Rocky Mountains of Colorado. The town is known for its outdoor recreation opportunities, including skiing, snowboarding, mountain biking, hiking, and camping. The town’s economy is largely based on tourism, and the town is home to several ski resorts, restaurants, bars, and shops. The town is predominantly white, with 91.3% of the population identifying as white. The median household income in the town is $50,977, and the median home value is $521,400.
Common Questions
What is Per Capita Income in Mount Crested Butte?
Per Capita income in Mount Crested Butte is $61,454.
What is the Median Family Income in Mount Crested Butte?
Median Family Income in Mount Crested Butte is $127,422.
What is the Median Household income in Mount Crested Butte?
Median Household Income in Mount Crested Butte is $93,194.
What is Income or Wage Gap in Mount Crested Butte?
Income or Wage Gap in Mount Crested Butte is 0.7%.
Women in Mount Crested Butte earn 99.3 cents for every dollar earned by a man.
What is Inequality or Gini Index in Mount Crested Butte?
Inequality or Gini Index in Mount Crested Butte is 0.41.
What is the Total Population of Mount Crested Butte?
Total Population of Mount Crested Butte is 869.
What is the Total Male Population of Mount Crested Butte?
Total Male Population of Mount Crested Butte is 459.
What is the Total Female Population of Mount Crested Butte?
Total Female Population of Mount Crested Butte is 410.
What is the Ratio of Males per 100 Females in Mount Crested Butte?
There are 111.95 Males per 100 Females in Mount Crested Butte.
What is the Ratio of Females per 100 Males in Mount Crested Butte?
There are 89.32 Females per 100 Males in Mount Crested Butte.
What is the Median Population Age in Mount Crested Butte?
Median Population Age in Mount Crested Butte is 43.7 Years.
What is the Average Family Size in Mount Crested Butte
Average Family Size in Mount Crested Butte is 2.2 People.
What is the Average Household Size in Mount Crested Butte
Average Household Size in Mount Crested Butte is 1.9 People.
How Large is the Labor Force in Mount Crested Butte?
There are 649 People in the Labor Forcein in Mount Crested Butte.
What is the Percentage of People in the Labor Force in Mount Crested Butte?
77.3% of People are in the Labor Force in Mount Crested Butte.