Cornwall On Hudson, NY Map & Demographics
Cornwall On Hudson Map
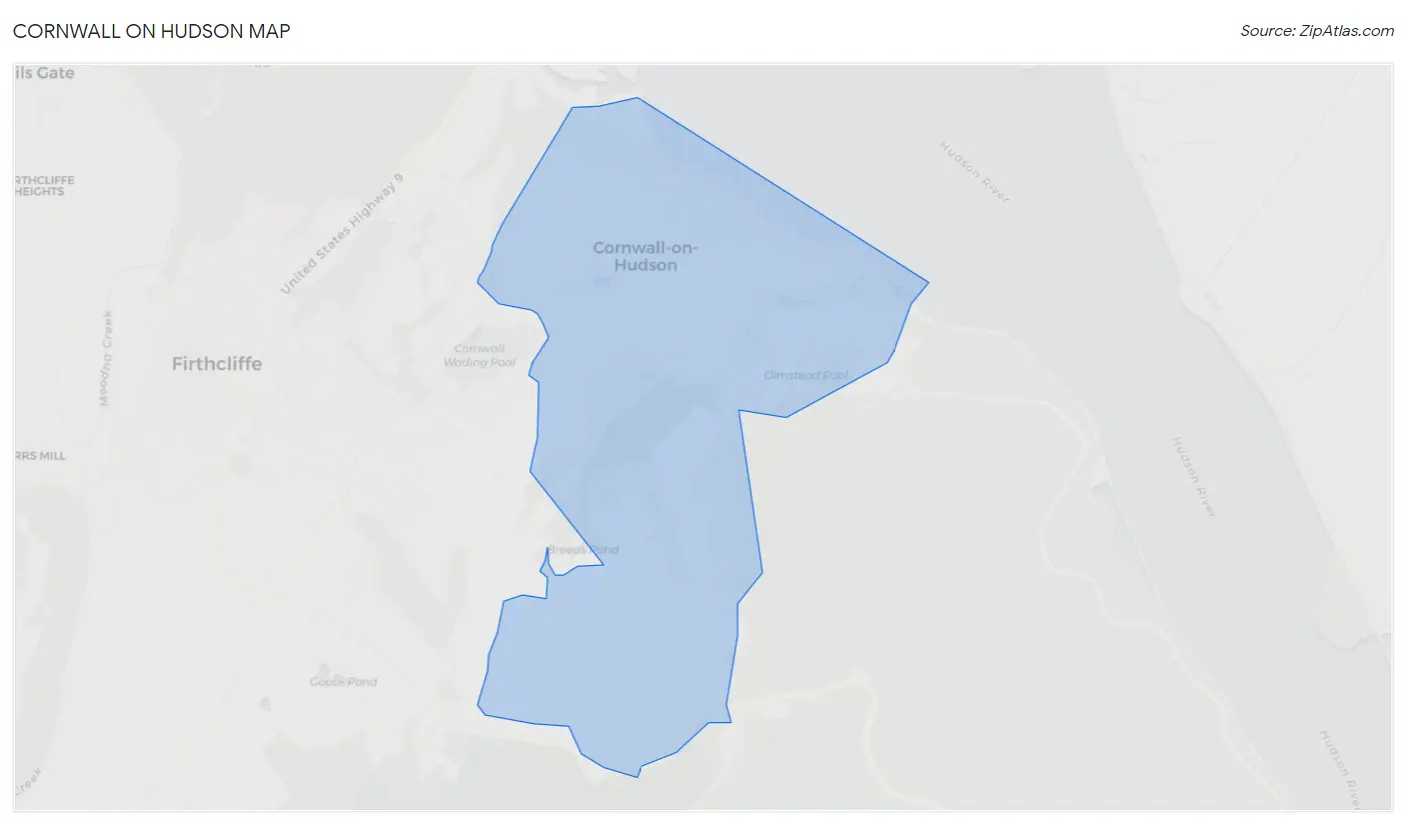
Cornwall On Hudson Overview
$59,859
PER CAPITA INCOME
$139,659
AVG FAMILY INCOME
$117,708
AVG HOUSEHOLD INCOME
47.8%
WAGE / INCOME GAP [ % ]
52.2¢/ $1
WAGE / INCOME GAP [ $ ]
0.38
INEQUALITY / GINI INDEX
3,044
TOTAL POPULATION
1,429
MALE POPULATION
1,615
FEMALE POPULATION
88.48
MALES / 100 FEMALES
113.02
FEMALES / 100 MALES
46.7
MEDIAN AGE
2.8
AVG FAMILY SIZE
2.4
AVG HOUSEHOLD SIZE
1,686
LABOR FORCE [ PEOPLE ]
64.4%
PERCENT IN LABOR FORCE
0.7%
UNEMPLOYMENT RATE
Cornwall On Hudson Zip Codes
Cornwall On Hudson Area Codes
Income in Cornwall On Hudson
Income Overview in Cornwall On Hudson
Per Capita Income in Cornwall On Hudson is $59,859, while median incomes of families and households are $139,659 and $117,708 respectively.
| Characteristic | Number | Measure |
| Per Capita Income | 3,044 | $59,859 |
| Median Family Income | 867 | $139,659 |
| Mean Family Income | 867 | $164,955 |
| Median Household Income | 1,211 | $117,708 |
| Mean Household Income | 1,211 | $149,663 |
| Income Deficit | 867 | $0 |
| Wage / Income Gap (%) | 3,044 | 47.84% |
| Wage / Income Gap ($) | 3,044 | 52.16¢ per $1 |
| Gini / Inequality Index | 3,044 | 0.38 |
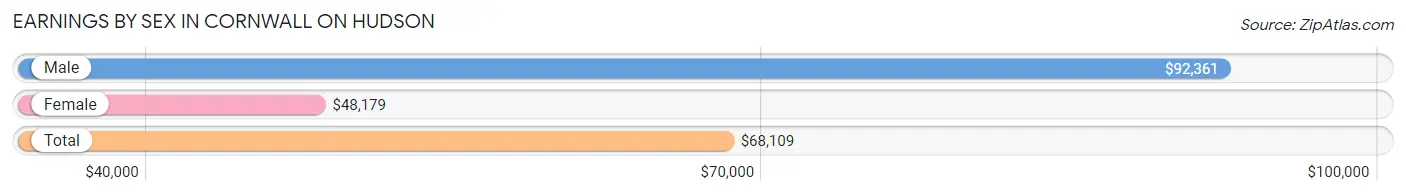
Earnings by Sex in Cornwall On Hudson
Average Earnings in Cornwall On Hudson are $68,109, $92,361 for men and $48,179 for women, a difference of 47.8%.
| Sex | Number | Average Earnings |
| Male | 924 (50.4%) | $92,361 |
| Female | 909 (49.6%) | $48,179 |
| Total | 1,833 (100.0%) | $68,109 |
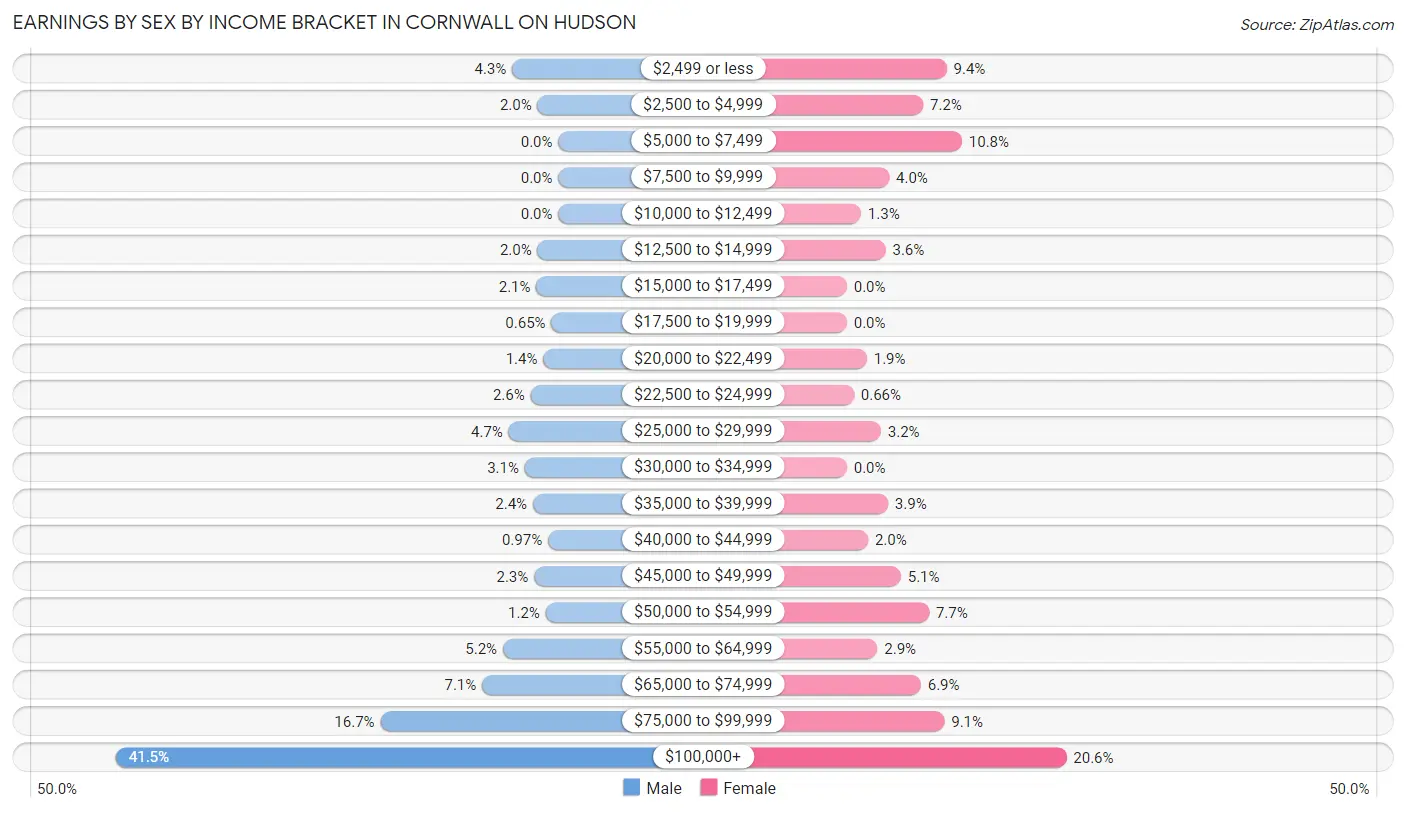
Earnings by Sex by Income Bracket in Cornwall On Hudson
The most common earnings brackets in Cornwall On Hudson are $100,000+ for men (383 | 41.4%) and $100,000+ for women (187 | 20.6%).
| Income | Male | Female |
| $2,499 or less | 40 (4.3%) | 85 (9.3%) |
| $2,500 to $4,999 | 18 (1.9%) | 65 (7.1%) |
| $5,000 to $7,499 | 0 (0.0%) | 98 (10.8%) |
| $7,500 to $9,999 | 0 (0.0%) | 36 (4.0%) |
| $10,000 to $12,499 | 0 (0.0%) | 12 (1.3%) |
| $12,500 to $14,999 | 18 (1.9%) | 33 (3.6%) |
| $15,000 to $17,499 | 19 (2.1%) | 0 (0.0%) |
| $17,500 to $19,999 | 6 (0.6%) | 0 (0.0%) |
| $20,000 to $22,499 | 13 (1.4%) | 17 (1.9%) |
| $22,500 to $24,999 | 24 (2.6%) | 6 (0.7%) |
| $25,000 to $29,999 | 43 (4.6%) | 29 (3.2%) |
| $30,000 to $34,999 | 29 (3.1%) | 0 (0.0%) |
| $35,000 to $39,999 | 22 (2.4%) | 35 (3.8%) |
| $40,000 to $44,999 | 9 (1.0%) | 18 (2.0%) |
| $45,000 to $49,999 | 21 (2.3%) | 46 (5.1%) |
| $50,000 to $54,999 | 11 (1.2%) | 70 (7.7%) |
| $55,000 to $64,999 | 48 (5.2%) | 26 (2.9%) |
| $65,000 to $74,999 | 66 (7.1%) | 63 (6.9%) |
| $75,000 to $99,999 | 154 (16.7%) | 83 (9.1%) |
| $100,000+ | 383 (41.4%) | 187 (20.6%) |
| Total | 924 (100.0%) | 909 (100.0%) |
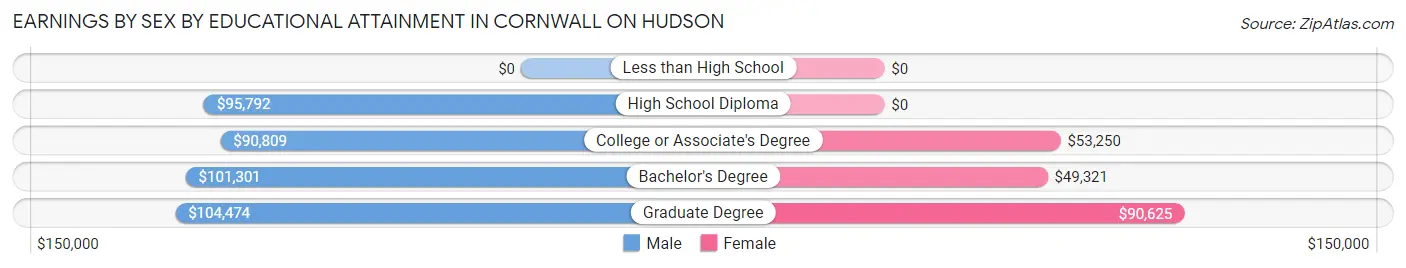
Earnings by Sex by Educational Attainment in Cornwall On Hudson
Average earnings in Cornwall On Hudson are $98,457 for men and $54,667 for women, a difference of 44.5%. Men with an educational attainment of graduate degree enjoy the highest average annual earnings of $104,474, while those with college or associate's degree education earn the least with $90,809. Women with an educational attainment of graduate degree earn the most with the average annual earnings of $90,625, while those with bachelor's degree education have the smallest earnings of $49,321.
| Educational Attainment | Male Income | Female Income |
| Less than High School | - | - |
| High School Diploma | $95,792 | $0 |
| College or Associate's Degree | $90,809 | $53,250 |
| Bachelor's Degree | $101,301 | $49,321 |
| Graduate Degree | $104,474 | $90,625 |
| Total | $98,457 | $54,667 |
Family Income in Cornwall On Hudson
Family Income Brackets in Cornwall On Hudson
According to the Cornwall On Hudson family income data, there are 250 families falling into the $200,000+ income range, which is the most common income bracket and makes up 28.8% of all families.
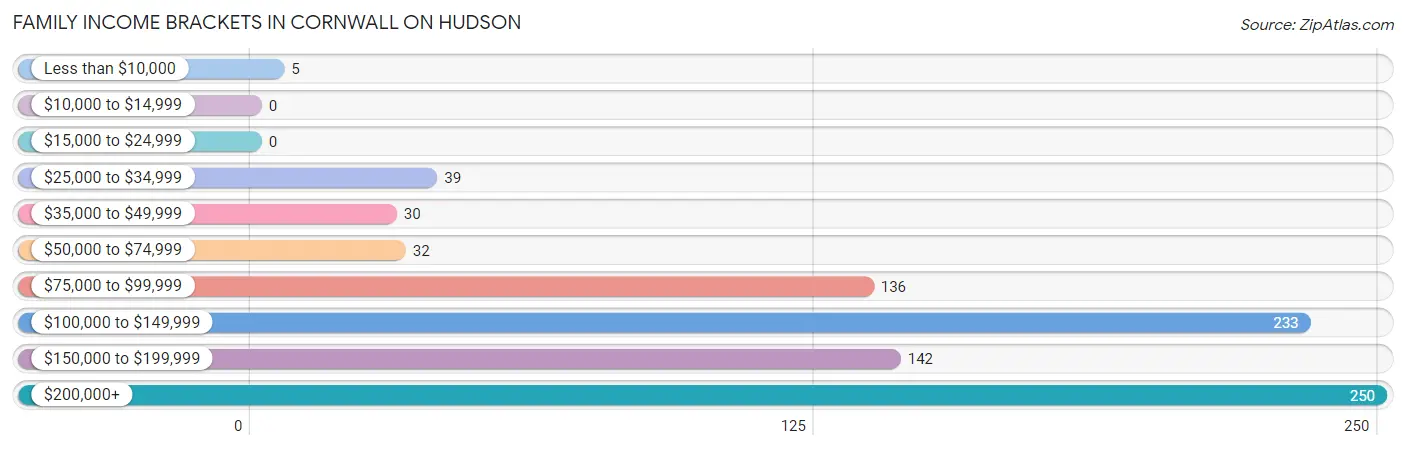
| Income Bracket | # Families | % Families |
| Less than $10,000 | 5 | 0.6% |
| $10,000 to $14,999 | 0 | 0.0% |
| $15,000 to $24,999 | 0 | 0.0% |
| $25,000 to $34,999 | 39 | 4.5% |
| $35,000 to $49,999 | 30 | 3.5% |
| $50,000 to $74,999 | 32 | 3.7% |
| $75,000 to $99,999 | 136 | 15.7% |
| $100,000 to $149,999 | 233 | 26.9% |
| $150,000 to $199,999 | 142 | 16.4% |
| $200,000+ | 250 | 28.8% |
Family Income by Famaliy Size in Cornwall On Hudson
4-person families (120 | 13.8%) account for the highest median family income in Cornwall On Hudson with $243,333 per family, while 2-person families (466 | 53.7%) have the highest median income of $71,750 per family member.
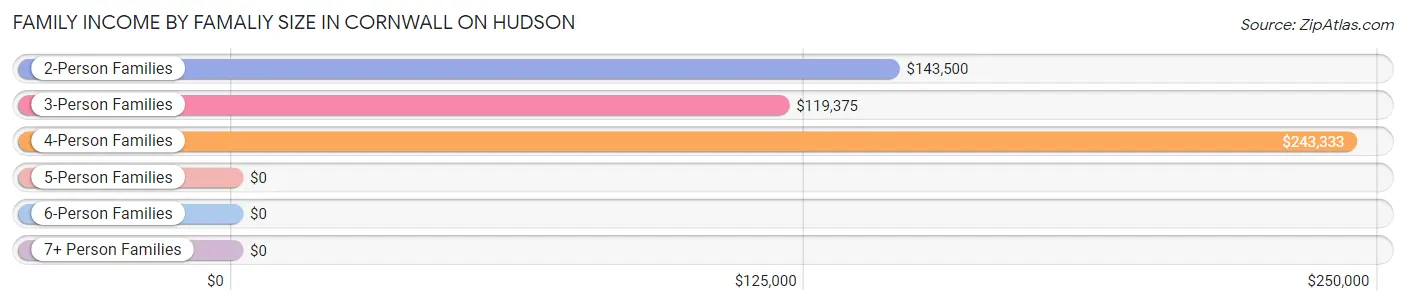
| Income Bracket | # Families | Median Income |
| 2-Person Families | 466 (53.7%) | $143,500 |
| 3-Person Families | 227 (26.2%) | $119,375 |
| 4-Person Families | 120 (13.8%) | $243,333 |
| 5-Person Families | 41 (4.7%) | $0 |
| 6-Person Families | 13 (1.5%) | $0 |
| 7+ Person Families | 0 (0.0%) | $0 |
| Total | 867 (100.0%) | $139,659 |
Family Income by Number of Earners in Cornwall On Hudson
The median family income in Cornwall On Hudson is $139,659, with families comprising 3+ earners (116) having the highest median family income of $244,583, while families with no earners (133) have the lowest median family income of $92,841, accounting for 13.4% and 15.3% of families, respectively.
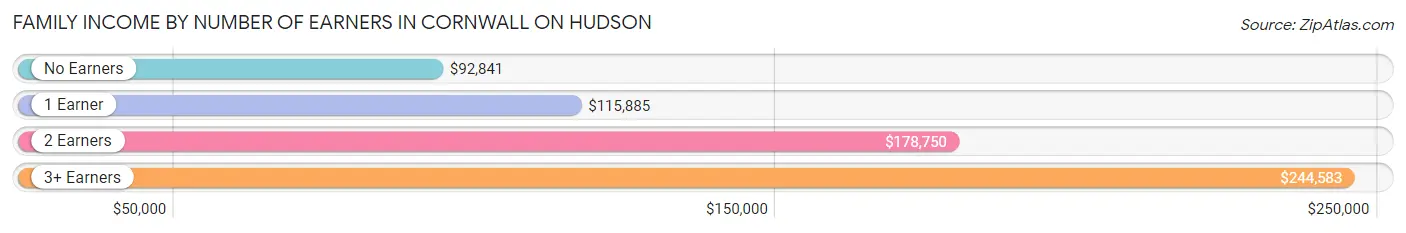
| Number of Earners | # Families | Median Income |
| No Earners | 133 (15.3%) | $92,841 |
| 1 Earner | 262 (30.2%) | $115,885 |
| 2 Earners | 356 (41.1%) | $178,750 |
| 3+ Earners | 116 (13.4%) | $244,583 |
| Total | 867 (100.0%) | $139,659 |
Household Income in Cornwall On Hudson
Household Income Brackets in Cornwall On Hudson
With 276 households falling in the category, the $100,000 to $149,999 income range is the most frequent in Cornwall On Hudson, accounting for 22.8% of all households.
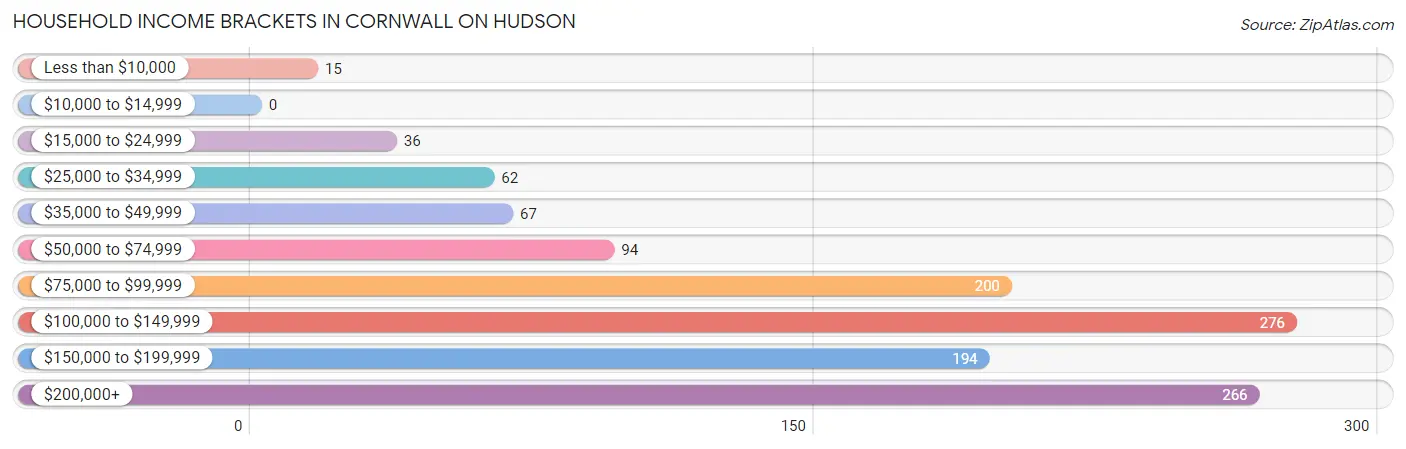
| Income Bracket | # Households | % Households |
| Less than $10,000 | 15 | 1.2% |
| $10,000 to $14,999 | 0 | 0.0% |
| $15,000 to $24,999 | 36 | 3.0% |
| $25,000 to $34,999 | 62 | 5.1% |
| $35,000 to $49,999 | 67 | 5.5% |
| $50,000 to $74,999 | 94 | 7.8% |
| $75,000 to $99,999 | 200 | 16.5% |
| $100,000 to $149,999 | 276 | 22.8% |
| $150,000 to $199,999 | 194 | 16.0% |
| $200,000+ | 266 | 22.0% |
Household Income by Householder Age in Cornwall On Hudson
The median household income in Cornwall On Hudson is $117,708, with the highest median household income of $150,694 found in the 25 to 44 years age bracket for the primary householder. A total of 219 households (18.1%) fall into this category. Meanwhile, the 15 to 24 years age bracket for the primary householder has the lowest median household income of $0, with 37 households (3.1%) in this group.
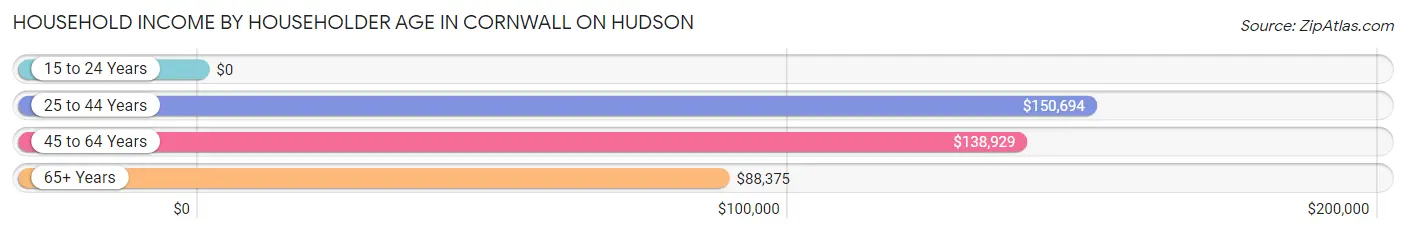
| Income Bracket | # Households | Median Income |
| 15 to 24 Years | 37 (3.1%) | $0 |
| 25 to 44 Years | 219 (18.1%) | $150,694 |
| 45 to 64 Years | 584 (48.2%) | $138,929 |
| 65+ Years | 371 (30.6%) | $88,375 |
| Total | 1,211 (100.0%) | $117,708 |
Poverty in Cornwall On Hudson
Income Below Poverty by Sex and Age in Cornwall On Hudson
With 1.9% poverty level for males and 4.2% for females among the residents of Cornwall On Hudson, 15 year old males and 18 to 24 year old females are the most vulnerable to poverty, with 4 males (44.4%) and 21 females (17.1%) in their respective age groups living below the poverty level.
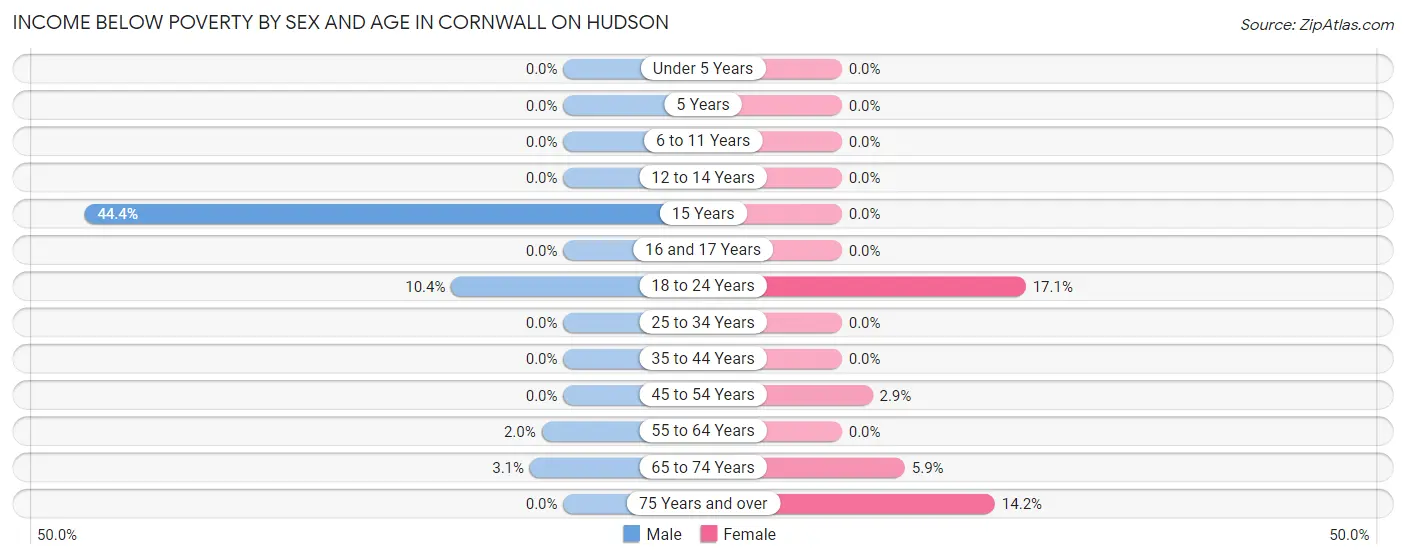
| Age Bracket | Male | Female |
| Under 5 Years | 0 (0.0%) | 0 (0.0%) |
| 5 Years | 0 (0.0%) | 0 (0.0%) |
| 6 to 11 Years | 0 (0.0%) | 0 (0.0%) |
| 12 to 14 Years | 0 (0.0%) | 0 (0.0%) |
| 15 Years | 4 (44.4%) | 0 (0.0%) |
| 16 and 17 Years | 0 (0.0%) | 0 (0.0%) |
| 18 to 24 Years | 13 (10.4%) | 21 (17.1%) |
| 25 to 34 Years | 0 (0.0%) | 0 (0.0%) |
| 35 to 44 Years | 0 (0.0%) | 0 (0.0%) |
| 45 to 54 Years | 0 (0.0%) | 8 (2.9%) |
| 55 to 64 Years | 5 (2.0%) | 0 (0.0%) |
| 65 to 74 Years | 5 (3.1%) | 10 (5.9%) |
| 75 Years and over | 0 (0.0%) | 27 (14.2%) |
| Total | 27 (1.9%) | 66 (4.2%) |
Income Above Poverty by Sex and Age in Cornwall On Hudson
According to the poverty statistics in Cornwall On Hudson, males aged under 5 years and females aged under 5 years are the age groups that are most secure financially, with 100.0% of males and 100.0% of females in these age groups living above the poverty line.
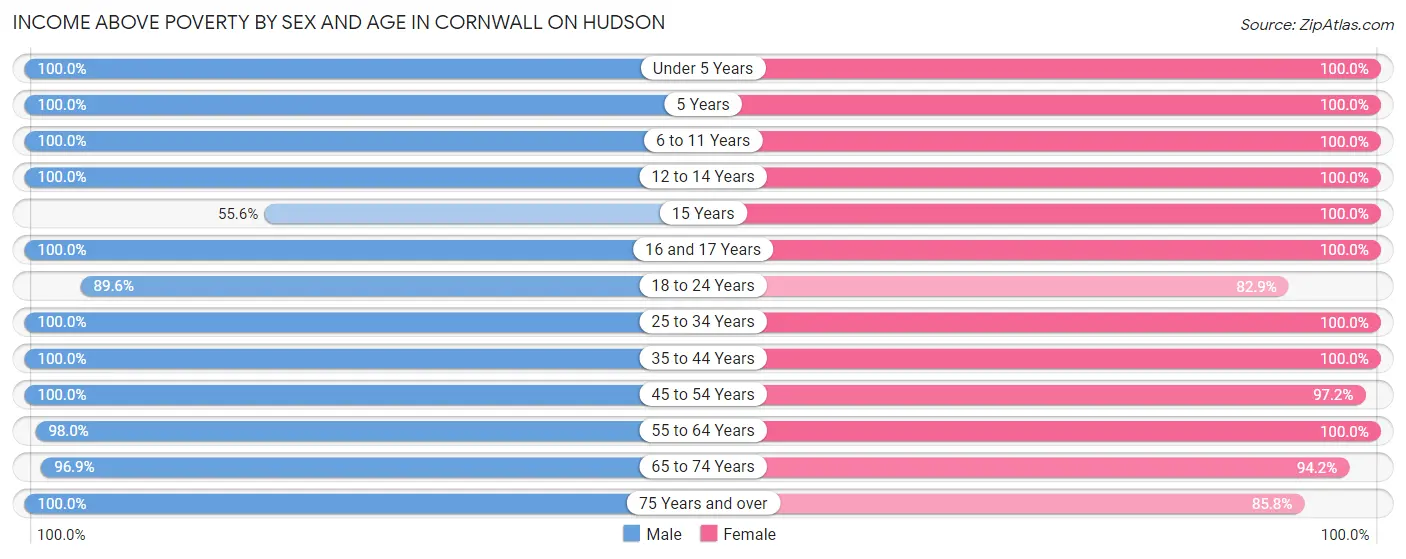
| Age Bracket | Male | Female |
| Under 5 Years | 20 (100.0%) | 40 (100.0%) |
| 5 Years | 12 (100.0%) | 5 (100.0%) |
| 6 to 11 Years | 82 (100.0%) | 77 (100.0%) |
| 12 to 14 Years | 62 (100.0%) | 75 (100.0%) |
| 15 Years | 5 (55.6%) | 14 (100.0%) |
| 16 and 17 Years | 31 (100.0%) | 133 (100.0%) |
| 18 to 24 Years | 112 (89.6%) | 102 (82.9%) |
| 25 to 34 Years | 82 (100.0%) | 58 (100.0%) |
| 35 to 44 Years | 140 (100.0%) | 242 (100.0%) |
| 45 to 54 Years | 333 (100.0%) | 273 (97.2%) |
| 55 to 64 Years | 242 (98.0%) | 175 (100.0%) |
| 65 to 74 Years | 156 (96.9%) | 161 (94.2%) |
| 75 Years and over | 105 (100.0%) | 163 (85.8%) |
| Total | 1,382 (98.1%) | 1,518 (95.8%) |
Income Below Poverty Among Married-Couple Families in Cornwall On Hudson
The poverty statistics for married-couple families in Cornwall On Hudson show that 0.7% or 5 of the total 694 families live below the poverty line. Families with no children have the highest poverty rate of 1.3%, comprising of 5 families. On the other hand, families with 1 or 2 children have the lowest poverty rate of 0.0%, which includes 0 families.
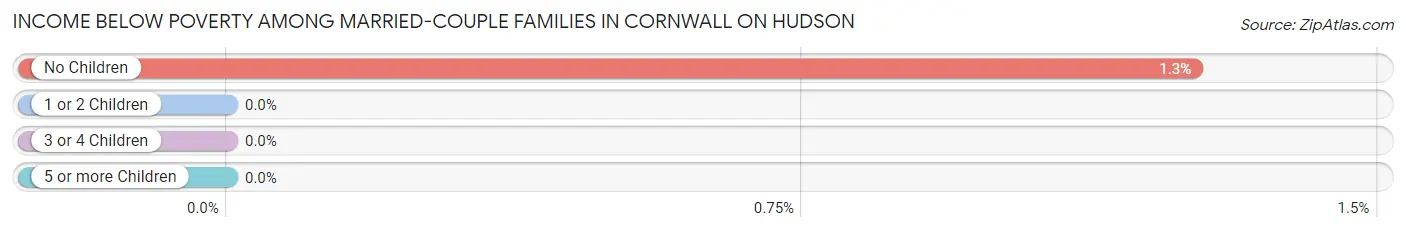
| Children | Above Poverty | Below Poverty |
| No Children | 393 (98.7%) | 5 (1.3%) |
| 1 or 2 Children | 254 (100.0%) | 0 (0.0%) |
| 3 or 4 Children | 42 (100.0%) | 0 (0.0%) |
| 5 or more Children | 0 (0.0%) | 0 (0.0%) |
| Total | 689 (99.3%) | 5 (0.7%) |
Income Below Poverty Among Single-Parent Households in Cornwall On Hudson
| Children | Single Father | Single Mother |
| No Children | 0 (0.0%) | 0 (0.0%) |
| 1 or 2 Children | 0 (0.0%) | 0 (0.0%) |
| 3 or 4 Children | 0 (0.0%) | 0 (0.0%) |
| 5 or more Children | 0 (0.0%) | 0 (0.0%) |
| Total | 0 (0.0%) | 0 (0.0%) |
Income Below Poverty Among Married-Couple vs Single-Parent Households in Cornwall On Hudson
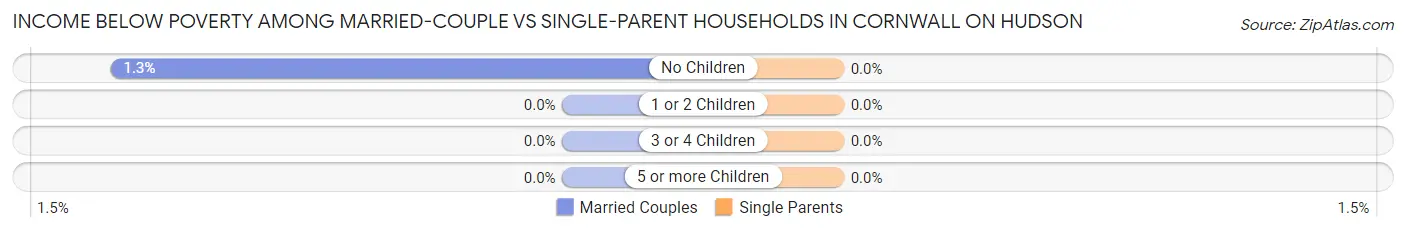
| Children | Married-Couple Families | Single-Parent Households |
| No Children | 5 (1.3%) | 0 (0.0%) |
| 1 or 2 Children | 0 (0.0%) | 0 (0.0%) |
| 3 or 4 Children | 0 (0.0%) | 0 (0.0%) |
| 5 or more Children | 0 (0.0%) | 0 (0.0%) |
| Total | 5 (0.7%) | 0 (0.0%) |
Race in Cornwall On Hudson
The most populous races in Cornwall On Hudson are White / Caucasian (2,724 | 89.5%), Hispanic or Latino (266 | 8.7%), and Two or more Races (111 | 3.6%).
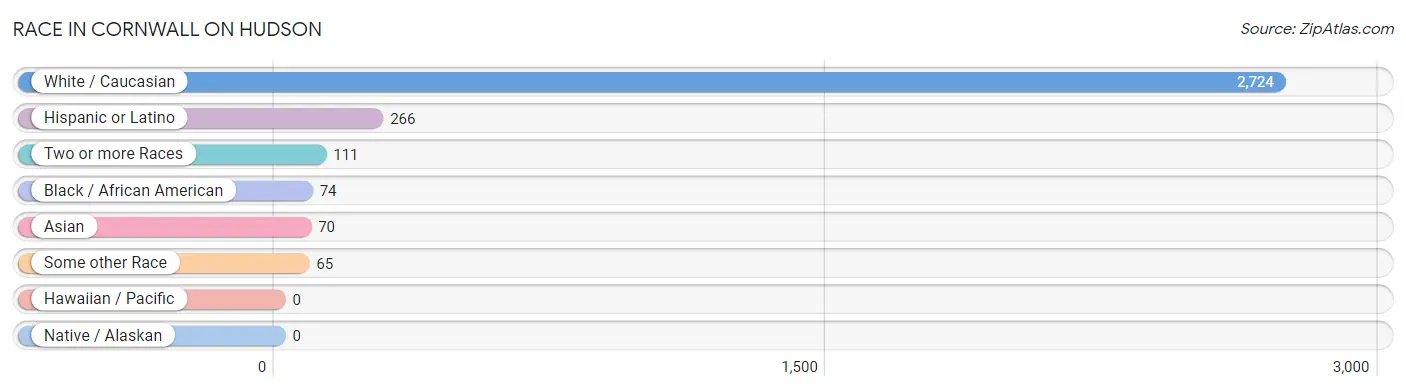
| Race | # Population | % Population |
| Asian | 70 | 2.3% |
| Black / African American | 74 | 2.4% |
| Hawaiian / Pacific | 0 | 0.0% |
| Hispanic or Latino | 266 | 8.7% |
| Native / Alaskan | 0 | 0.0% |
| White / Caucasian | 2,724 | 89.5% |
| Two or more Races | 111 | 3.6% |
| Some other Race | 65 | 2.1% |
| Total | 3,044 | 100.0% |
Ancestry in Cornwall On Hudson
The most populous ancestries reported in Cornwall On Hudson are Irish (727 | 23.9%), English (448 | 14.7%), Italian (426 | 14.0%), German (385 | 12.7%), and American (265 | 8.7%), together accounting for 74.0% of all Cornwall On Hudson residents.
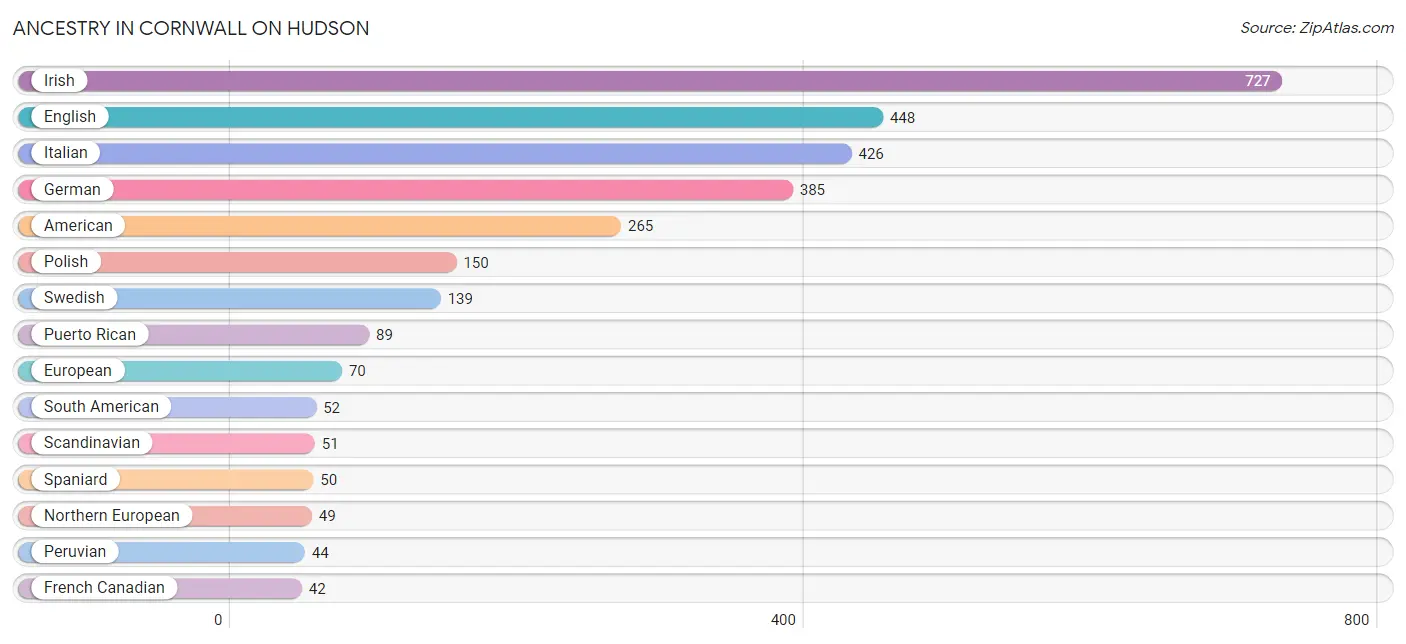
| Ancestry | # Population | % Population |
| African | 7 | 0.2% |
| American | 265 | 8.7% |
| Argentinean | 8 | 0.3% |
| Austrian | 5 | 0.2% |
| Bhutanese | 10 | 0.3% |
| British | 23 | 0.8% |
| Burmese | 40 | 1.3% |
| Cherokee | 7 | 0.2% |
| Czechoslovakian | 12 | 0.4% |
| Danish | 28 | 0.9% |
| Dominican | 39 | 1.3% |
| Dutch | 35 | 1.1% |
| Eastern European | 35 | 1.1% |
| English | 448 | 14.7% |
| European | 70 | 2.3% |
| Filipino | 13 | 0.4% |
| Finnish | 6 | 0.2% |
| French | 29 | 0.9% |
| French Canadian | 42 | 1.4% |
| German | 385 | 12.7% |
| Greek | 12 | 0.4% |
| Hungarian | 7 | 0.2% |
| Icelander | 5 | 0.2% |
| Irish | 727 | 23.9% |
| Iroquois | 12 | 0.4% |
| Italian | 426 | 14.0% |
| Latvian | 10 | 0.3% |
| Mexican | 36 | 1.2% |
| Northern European | 49 | 1.6% |
| Norwegian | 14 | 0.5% |
| Peruvian | 44 | 1.5% |
| Polish | 150 | 4.9% |
| Portuguese | 5 | 0.2% |
| Puerto Rican | 89 | 2.9% |
| Russian | 11 | 0.4% |
| Scandinavian | 51 | 1.7% |
| Scotch-Irish | 13 | 0.4% |
| Scottish | 39 | 1.3% |
| Slovak | 31 | 1.0% |
| South American | 52 | 1.7% |
| Spaniard | 50 | 1.6% |
| Subsaharan African | 7 | 0.2% |
| Swedish | 139 | 4.6% |
| Thai | 12 | 0.4% |
| Ukrainian | 17 | 0.6% |
| Welsh | 39 | 1.3% |
| Yaqui | 11 | 0.4% | View All 47 Rows |
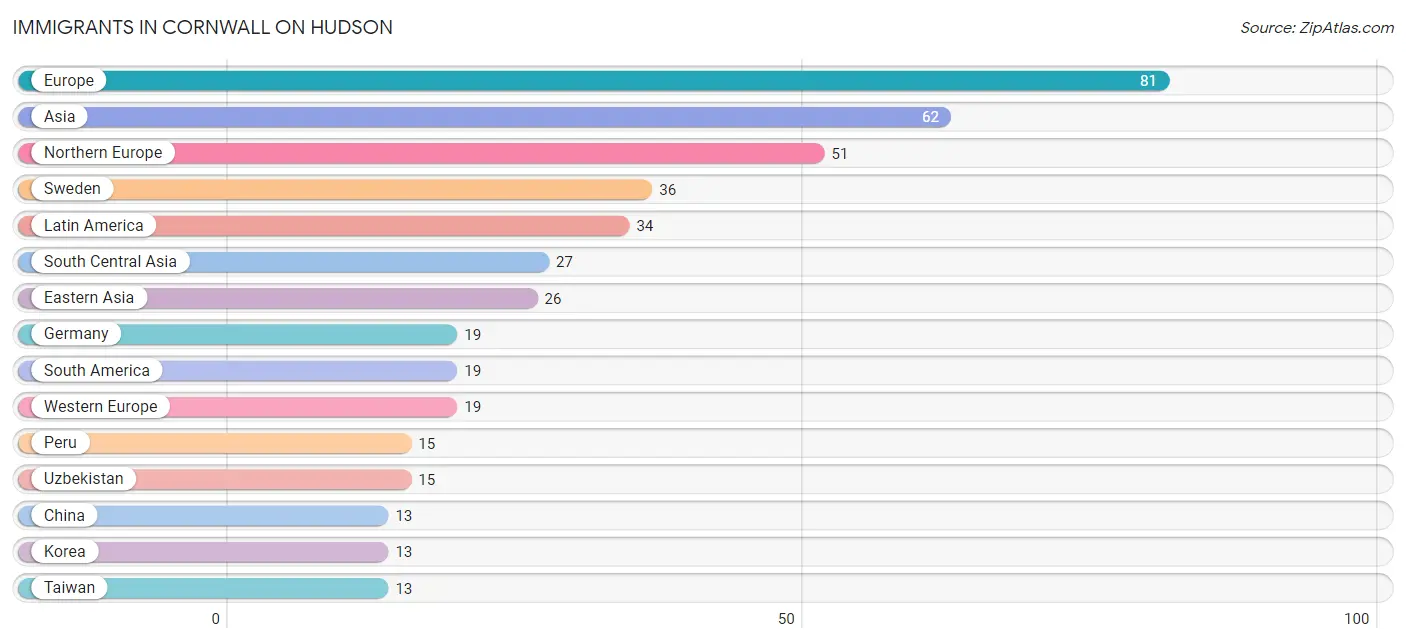
Immigrants in Cornwall On Hudson
The most numerous immigrant groups reported in Cornwall On Hudson came from Europe (81 | 2.7%), Asia (62 | 2.0%), Northern Europe (51 | 1.7%), Sweden (36 | 1.2%), and Latin America (34 | 1.1%), together accounting for 8.7% of all Cornwall On Hudson residents.
| Immigration Origin | # Population | % Population |
| Africa | 7 | 0.2% |
| Argentina | 4 | 0.1% |
| Asia | 62 | 2.0% |
| Caribbean | 4 | 0.1% |
| Central America | 11 | 0.4% |
| China | 13 | 0.4% |
| Dominican Republic | 4 | 0.1% |
| Eastern Asia | 26 | 0.9% |
| Eastern Europe | 5 | 0.2% |
| Europe | 81 | 2.7% |
| Germany | 19 | 0.6% |
| Ghana | 7 | 0.2% |
| Honduras | 11 | 0.4% |
| India | 12 | 0.4% |
| Italy | 6 | 0.2% |
| Korea | 13 | 0.4% |
| Latin America | 34 | 1.1% |
| Northern Europe | 51 | 1.7% |
| Peru | 15 | 0.5% |
| Russia | 5 | 0.2% |
| Scotland | 10 | 0.3% |
| South America | 19 | 0.6% |
| South Central Asia | 27 | 0.9% |
| South Eastern Asia | 9 | 0.3% |
| Southern Europe | 6 | 0.2% |
| Sweden | 36 | 1.2% |
| Taiwan | 13 | 0.4% |
| Uzbekistan | 15 | 0.5% |
| Vietnam | 9 | 0.3% |
| Western Africa | 7 | 0.2% |
| Western Europe | 19 | 0.6% | View All 31 Rows |
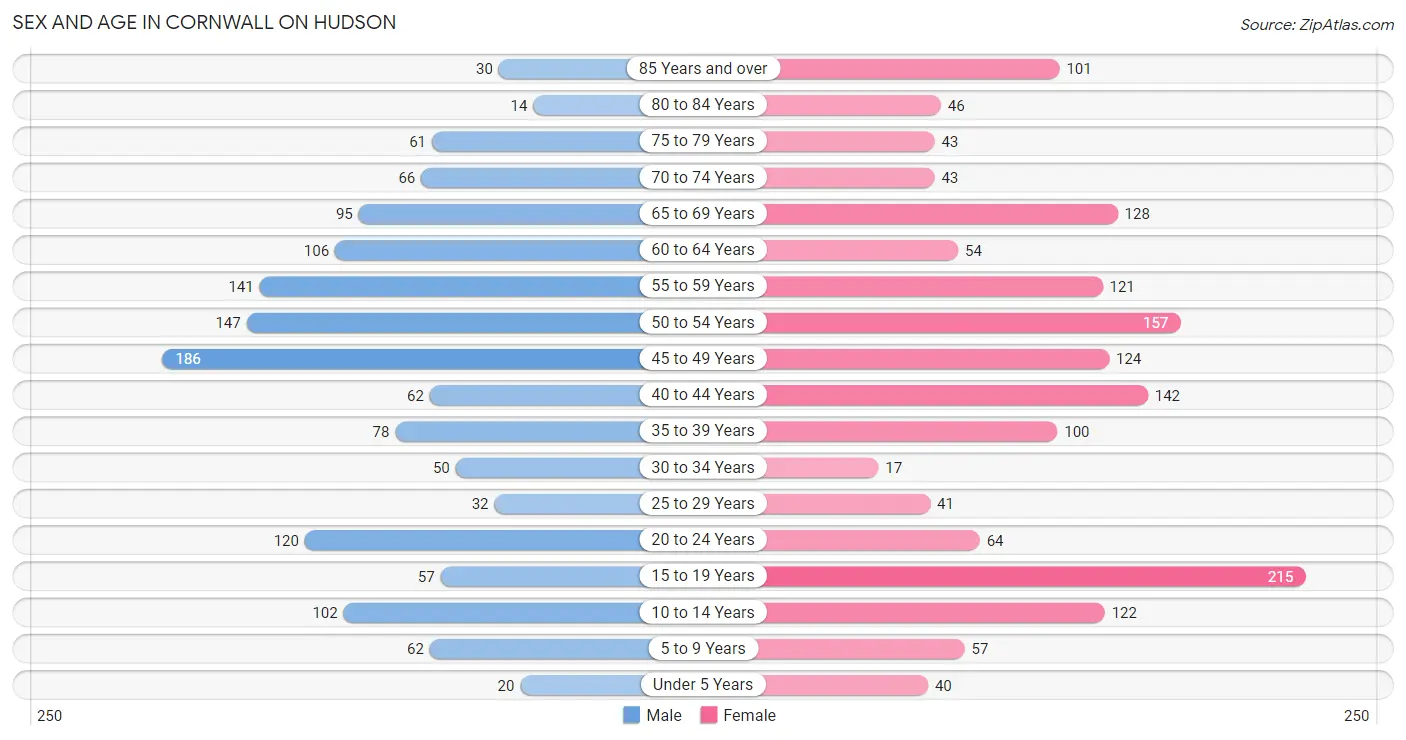
Sex and Age in Cornwall On Hudson
Sex and Age in Cornwall On Hudson
The most populous age groups in Cornwall On Hudson are 45 to 49 Years (186 | 13.0%) for men and 15 to 19 Years (215 | 13.3%) for women.
| Age Bracket | Male | Female |
| Under 5 Years | 20 (1.4%) | 40 (2.5%) |
| 5 to 9 Years | 62 (4.3%) | 57 (3.5%) |
| 10 to 14 Years | 102 (7.1%) | 122 (7.5%) |
| 15 to 19 Years | 57 (4.0%) | 215 (13.3%) |
| 20 to 24 Years | 120 (8.4%) | 64 (4.0%) |
| 25 to 29 Years | 32 (2.2%) | 41 (2.5%) |
| 30 to 34 Years | 50 (3.5%) | 17 (1.1%) |
| 35 to 39 Years | 78 (5.5%) | 100 (6.2%) |
| 40 to 44 Years | 62 (4.3%) | 142 (8.8%) |
| 45 to 49 Years | 186 (13.0%) | 124 (7.7%) |
| 50 to 54 Years | 147 (10.3%) | 157 (9.7%) |
| 55 to 59 Years | 141 (9.9%) | 121 (7.5%) |
| 60 to 64 Years | 106 (7.4%) | 54 (3.3%) |
| 65 to 69 Years | 95 (6.7%) | 128 (7.9%) |
| 70 to 74 Years | 66 (4.6%) | 43 (2.7%) |
| 75 to 79 Years | 61 (4.3%) | 43 (2.7%) |
| 80 to 84 Years | 14 (1.0%) | 46 (2.9%) |
| 85 Years and over | 30 (2.1%) | 101 (6.2%) |
| Total | 1,429 (100.0%) | 1,615 (100.0%) |
Families and Households in Cornwall On Hudson
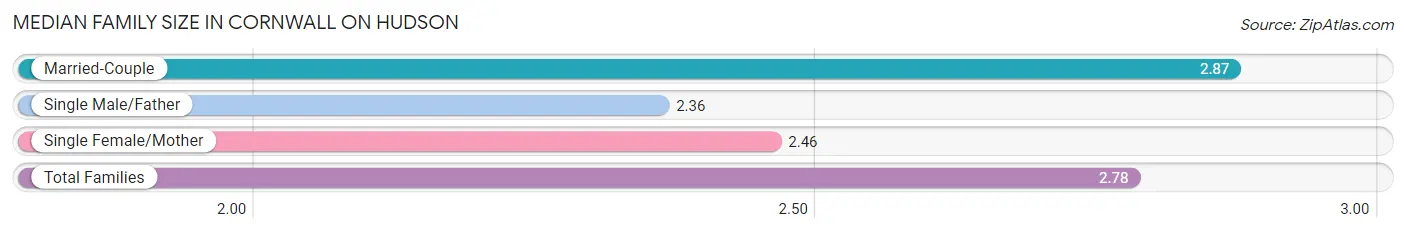
Median Family Size in Cornwall On Hudson
The median family size in Cornwall On Hudson is 2.78 persons per family, with married-couple families (694 | 80.0%) accounting for the largest median family size of 2.87 persons per family. On the other hand, single male/father families (112 | 12.9%) represent the smallest median family size with 2.36 persons per family.
| Family Type | # Families | Family Size |
| Married-Couple | 694 (80.0%) | 2.87 |
| Single Male/Father | 112 (12.9%) | 2.36 |
| Single Female/Mother | 61 (7.0%) | 2.46 |
| Total Families | 867 (100.0%) | 2.78 |
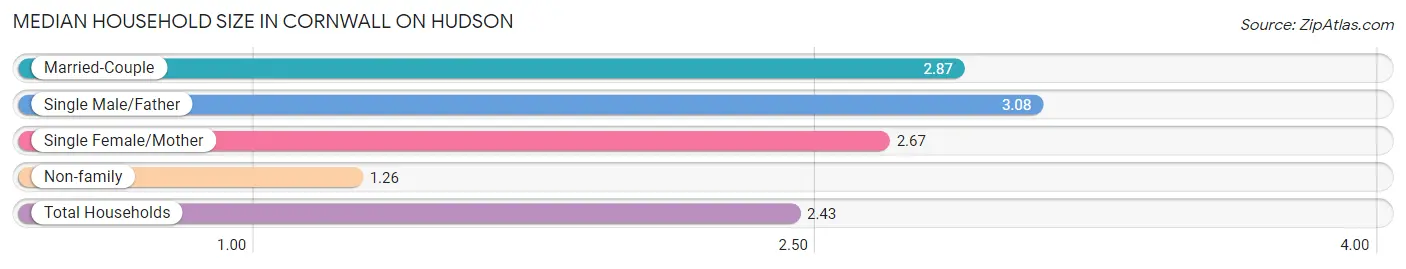
Median Household Size in Cornwall On Hudson
The median household size in Cornwall On Hudson is 2.43 persons per household, with single male/father households (112 | 9.2%) accounting for the largest median household size of 3.08 persons per household. non-family households (344 | 28.4%) represent the smallest median household size with 1.26 persons per household.
| Household Type | # Households | Household Size |
| Married-Couple | 694 (57.3%) | 2.87 |
| Single Male/Father | 112 (9.2%) | 3.08 |
| Single Female/Mother | 61 (5.0%) | 2.67 |
| Non-family | 344 (28.4%) | 1.26 |
| Total Households | 1,211 (100.0%) | 2.43 |
Household Size by Marriage Status in Cornwall On Hudson
Out of a total of 1,211 households in Cornwall On Hudson, 867 (71.6%) are family households, while 344 (28.4%) are nonfamily households. The most numerous type of family households are 2-person households, comprising 386, and the most common type of nonfamily households are 1-person households, comprising 288.
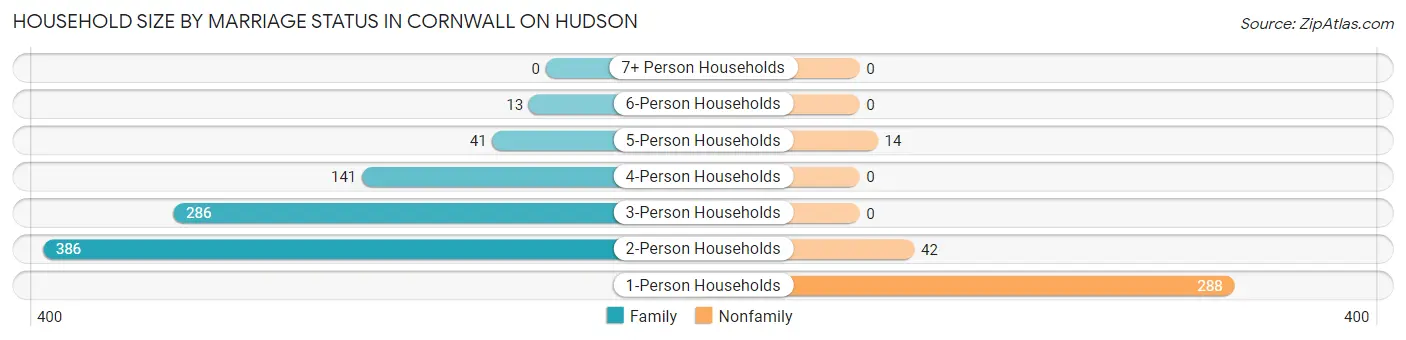
| Household Size | Family Households | Nonfamily Households |
| 1-Person Households | - | 288 (23.8%) |
| 2-Person Households | 386 (31.9%) | 42 (3.5%) |
| 3-Person Households | 286 (23.6%) | 0 (0.0%) |
| 4-Person Households | 141 (11.6%) | 0 (0.0%) |
| 5-Person Households | 41 (3.4%) | 14 (1.2%) |
| 6-Person Households | 13 (1.1%) | 0 (0.0%) |
| 7+ Person Households | 0 (0.0%) | 0 (0.0%) |
| Total | 867 (71.6%) | 344 (28.4%) |
Female Fertility in Cornwall On Hudson
Fertility by Age in Cornwall On Hudson
| Age Bracket | Women with Births | Births / 1,000 Women |
| 15 to 19 years | 0 (0.0%) | 0.0 |
| 20 to 34 years | 0 (0.0%) | 0.0 |
| 35 to 50 years | 0 (0.0%) | 0.0 |
| Total | 0 (0.0%) | 0.0 |
Fertility by Age by Marriage Status in Cornwall On Hudson
| Age Bracket | Married | Unmarried |
| 15 to 19 years | 0 (0.0%) | 0 (0.0%) |
| 20 to 34 years | 0 (0.0%) | 0 (0.0%) |
| 35 to 50 years | 0 (0.0%) | 0 (0.0%) |
| Total | 0 (0.0%) | 0 (0.0%) |
Fertility by Education in Cornwall On Hudson
| Educational Attainment | Women with Births | Births / 1,000 Women |
| Less than High School | 0 (0.0%) | 0.0 |
| High School Diploma | 0 (0.0%) | 0.0 |
| College or Associate's Degree | 0 (0.0%) | 0.0 |
| Bachelor's Degree | 0 (0.0%) | 0.0 |
| Graduate Degree | 0 (0.0%) | 0.0 |
| Total | 0 (0.0%) | 0.0 |
Fertility by Education by Marriage Status in Cornwall On Hudson
| Educational Attainment | Married | Unmarried |
| Less than High School | 0 (0.0%) | 0 (0.0%) |
| High School Diploma | 0 (0.0%) | 0 (0.0%) |
| College or Associate's Degree | 0 (0.0%) | 0 (0.0%) |
| Bachelor's Degree | 0 (0.0%) | 0 (0.0%) |
| Graduate Degree | 0 (0.0%) | 0 (0.0%) |
| Total | 0 (0.0%) | 0 (0.0%) |
Employment Characteristics in Cornwall On Hudson
Employment by Class of Employer in Cornwall On Hudson
Among the 1,664 employed individuals in Cornwall On Hudson, private company employees (815 | 49.0%), federal government employees (245 | 14.7%), and local government employees (173 | 10.4%) make up the most common classes of employment.
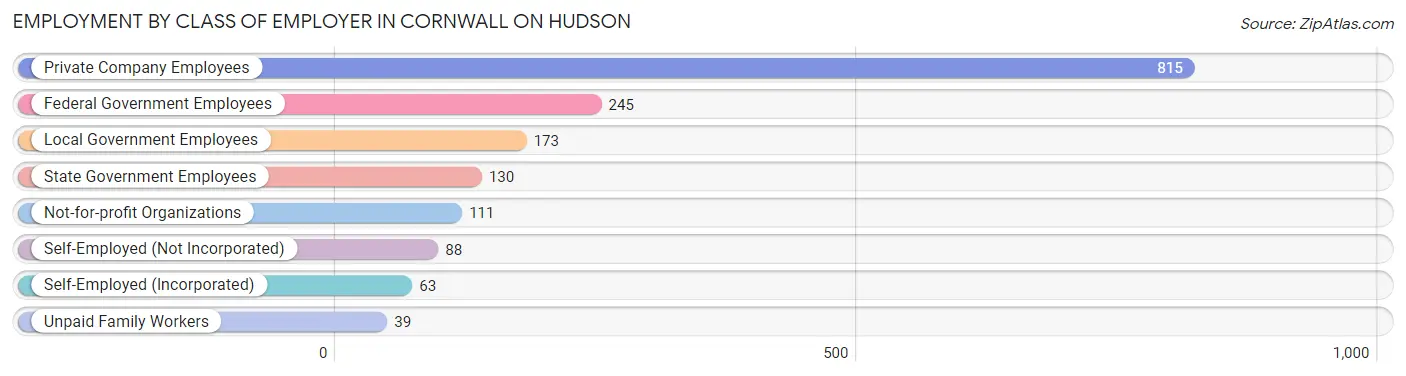
| Employer Class | # Employees | % Employees |
| Private Company Employees | 815 | 49.0% |
| Self-Employed (Incorporated) | 63 | 3.8% |
| Self-Employed (Not Incorporated) | 88 | 5.3% |
| Not-for-profit Organizations | 111 | 6.7% |
| Local Government Employees | 173 | 10.4% |
| State Government Employees | 130 | 7.8% |
| Federal Government Employees | 245 | 14.7% |
| Unpaid Family Workers | 39 | 2.3% |
| Total | 1,664 | 100.0% |
Employment Status by Age in Cornwall On Hudson
According to the labor force statistics for Cornwall On Hudson, out of the total population over 16 years of age (2,618), 64.4% or 1,686 individuals are in the labor force, with 0.7% or 12 of them unemployed. The age group with the highest labor force participation rate is 25 to 29 years, with 100.0% or 73 individuals in the labor force. Within the labor force, the 55 to 59 years age range has the highest percentage of unemployed individuals, with 3.5% or 7 of them being unemployed.
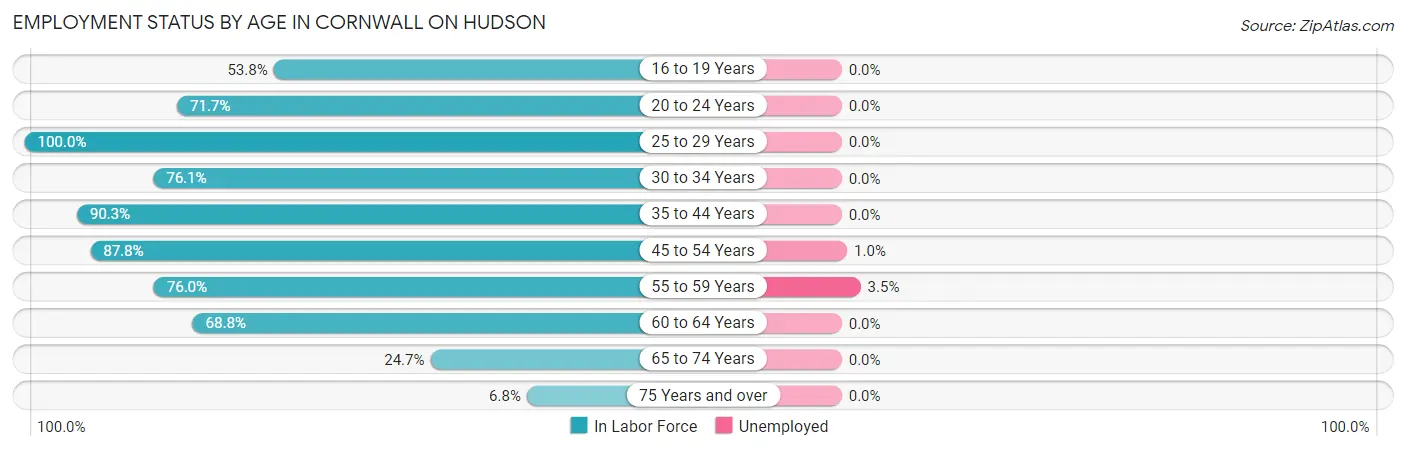
| Age Bracket | In Labor Force | Unemployed |
| 16 to 19 Years | 134 (53.8%) | 0 (0.0%) |
| 20 to 24 Years | 132 (71.7%) | 0 (0.0%) |
| 25 to 29 Years | 73 (100.0%) | 0 (0.0%) |
| 30 to 34 Years | 51 (76.1%) | 0 (0.0%) |
| 35 to 44 Years | 345 (90.3%) | 0 (0.0%) |
| 45 to 54 Years | 539 (87.8%) | 5 (1.0%) |
| 55 to 59 Years | 199 (76.0%) | 7 (3.5%) |
| 60 to 64 Years | 110 (68.8%) | 0 (0.0%) |
| 65 to 74 Years | 82 (24.7%) | 0 (0.0%) |
| 75 Years and over | 20 (6.8%) | 0 (0.0%) |
| Total | 1,686 (64.4%) | 12 (0.7%) |
Employment Status by Educational Attainment in Cornwall On Hudson
According to labor force statistics for Cornwall On Hudson, 84.5% of individuals (1,317) out of the total population between 25 and 64 years of age (1,558) are in the labor force, with 0.9% or 12 of them being unemployed. The group with the highest labor force participation rate are those with the educational attainment of less than high school, with 100.0% or 21 individuals in the labor force. Within the labor force, individuals with college / associate degree education have the highest percentage of unemployment, with 1.3% or 5 of them being unemployed.
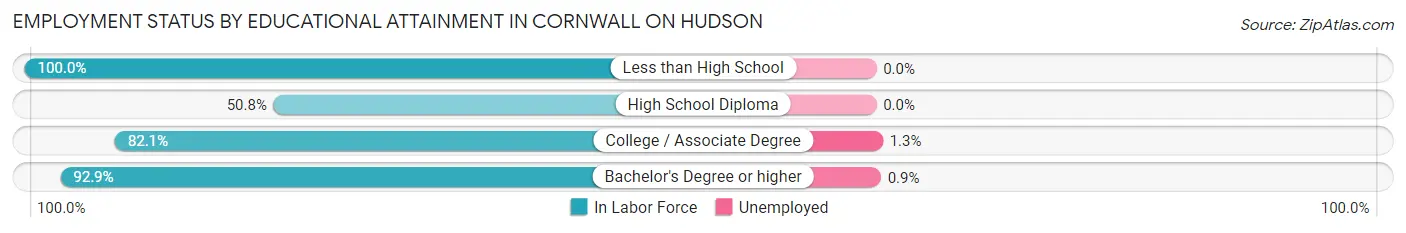
| Educational Attainment | In Labor Force | Unemployed |
| Less than High School | 21 (100.0%) | 0 (0.0%) |
| High School Diploma | 97 (50.8%) | 0 (0.0%) |
| College / Associate Degree | 389 (82.1%) | 6 (1.3%) |
| Bachelor's Degree or higher | 810 (92.9%) | 8 (0.9%) |
| Total | 1,317 (84.5%) | 14 (0.9%) |
Employment Occupations by Sex in Cornwall On Hudson
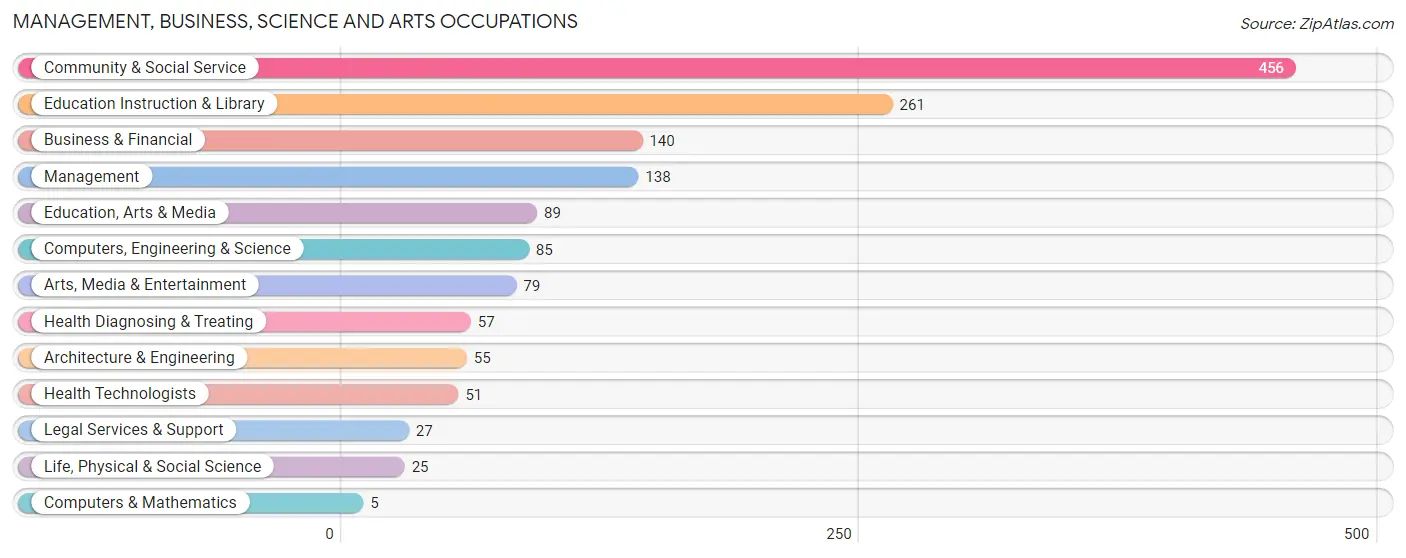
Management, Business, Science and Arts Occupations
The most common Management, Business, Science and Arts occupations in Cornwall On Hudson are Community & Social Service (456 | 28.1%), Education Instruction & Library (261 | 16.1%), Business & Financial (140 | 8.6%), Management (138 | 8.5%), and Education, Arts & Media (89 | 5.5%).
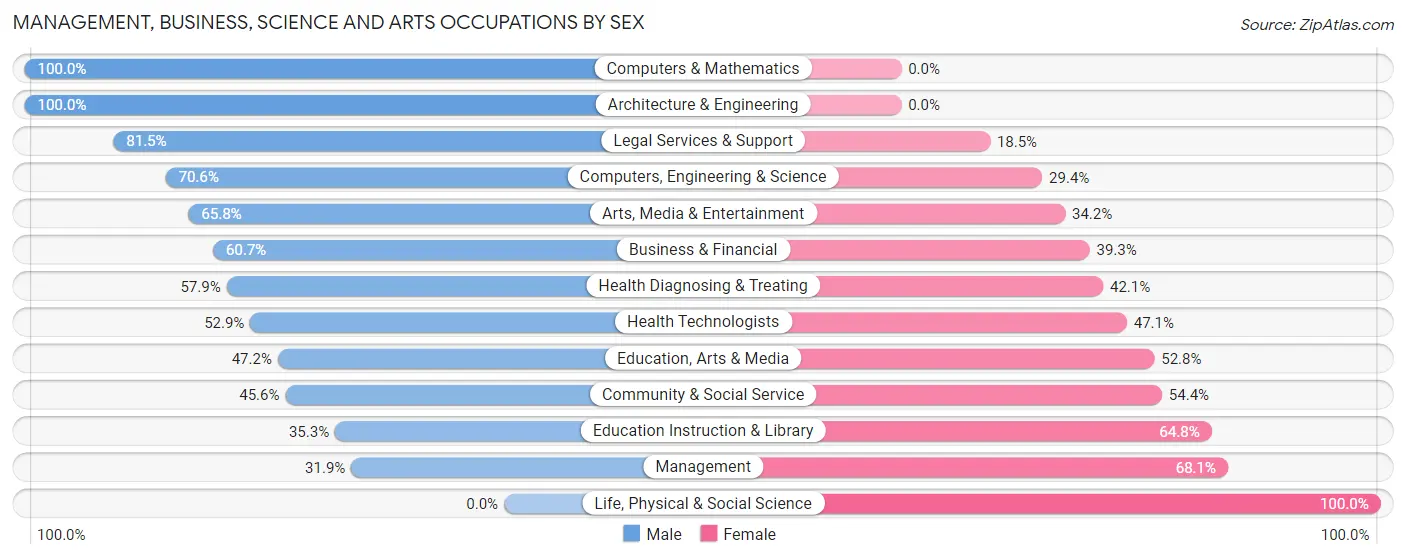
Management, Business, Science and Arts Occupations by Sex
Within the Management, Business, Science and Arts occupations in Cornwall On Hudson, the most male-oriented occupations are Computers & Mathematics (100.0%), Architecture & Engineering (100.0%), and Legal Services & Support (81.5%), while the most female-oriented occupations are Life, Physical & Social Science (100.0%), Management (68.1%), and Education Instruction & Library (64.7%).
| Occupation | Male | Female |
| Management | 44 (31.9%) | 94 (68.1%) |
| Business & Financial | 85 (60.7%) | 55 (39.3%) |
| Computers, Engineering & Science | 60 (70.6%) | 25 (29.4%) |
| Computers & Mathematics | 5 (100.0%) | 0 (0.0%) |
| Architecture & Engineering | 55 (100.0%) | 0 (0.0%) |
| Life, Physical & Social Science | 0 (0.0%) | 25 (100.0%) |
| Community & Social Service | 208 (45.6%) | 248 (54.4%) |
| Education, Arts & Media | 42 (47.2%) | 47 (52.8%) |
| Legal Services & Support | 22 (81.5%) | 5 (18.5%) |
| Education Instruction & Library | 92 (35.2%) | 169 (64.7%) |
| Arts, Media & Entertainment | 52 (65.8%) | 27 (34.2%) |
| Health Diagnosing & Treating | 33 (57.9%) | 24 (42.1%) |
| Health Technologists | 27 (52.9%) | 24 (47.1%) |
| Total (Category) | 430 (49.1%) | 446 (50.9%) |
| Total (Overall) | 806 (49.7%) | 814 (50.2%) |
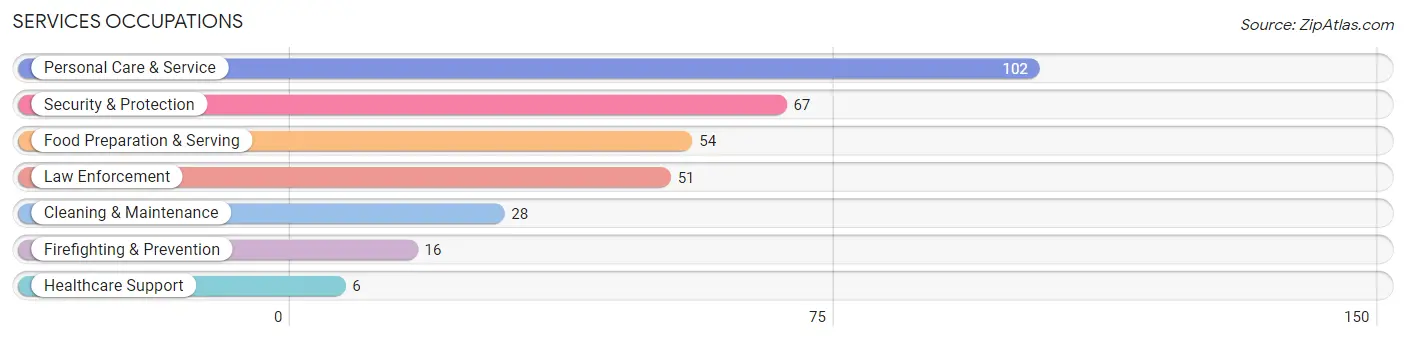
Services Occupations
The most common Services occupations in Cornwall On Hudson are Personal Care & Service (102 | 6.3%), Security & Protection (67 | 4.1%), Food Preparation & Serving (54 | 3.3%), Law Enforcement (51 | 3.2%), and Cleaning & Maintenance (28 | 1.7%).
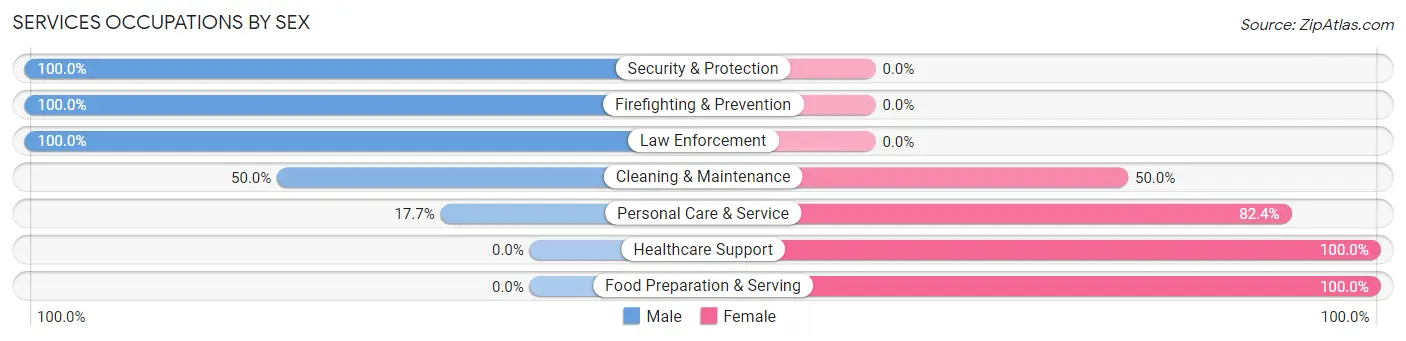
Services Occupations by Sex
Within the Services occupations in Cornwall On Hudson, the most male-oriented occupations are Security & Protection (100.0%), Firefighting & Prevention (100.0%), and Law Enforcement (100.0%), while the most female-oriented occupations are Healthcare Support (100.0%), Food Preparation & Serving (100.0%), and Personal Care & Service (82.4%).
| Occupation | Male | Female |
| Healthcare Support | 0 (0.0%) | 6 (100.0%) |
| Security & Protection | 67 (100.0%) | 0 (0.0%) |
| Firefighting & Prevention | 16 (100.0%) | 0 (0.0%) |
| Law Enforcement | 51 (100.0%) | 0 (0.0%) |
| Food Preparation & Serving | 0 (0.0%) | 54 (100.0%) |
| Cleaning & Maintenance | 14 (50.0%) | 14 (50.0%) |
| Personal Care & Service | 18 (17.6%) | 84 (82.4%) |
| Total (Category) | 99 (38.5%) | 158 (61.5%) |
| Total (Overall) | 806 (49.7%) | 814 (50.2%) |
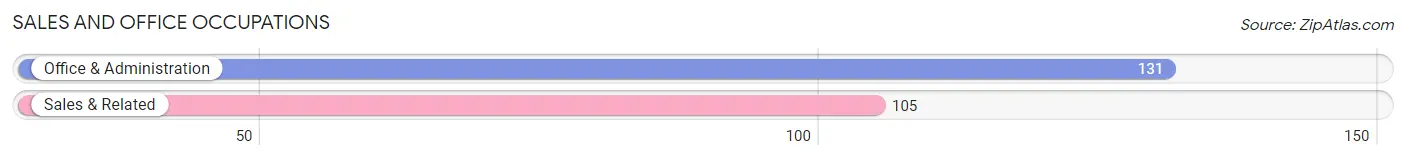
Sales and Office Occupations
The most common Sales and Office occupations in Cornwall On Hudson are Office & Administration (131 | 8.1%), and Sales & Related (105 | 6.5%).
Sales and Office Occupations by Sex

| Occupation | Male | Female |
| Sales & Related | 63 (60.0%) | 42 (40.0%) |
| Office & Administration | 6 (4.6%) | 125 (95.4%) |
| Total (Category) | 69 (29.2%) | 167 (70.8%) |
| Total (Overall) | 806 (49.7%) | 814 (50.2%) |
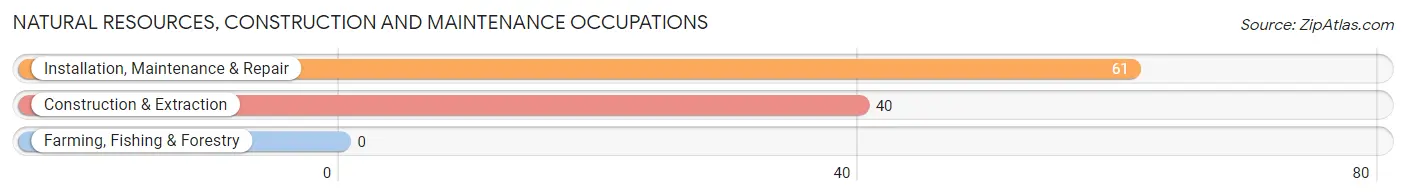
Natural Resources, Construction and Maintenance Occupations
The most common Natural Resources, Construction and Maintenance occupations in Cornwall On Hudson are Installation, Maintenance & Repair (61 | 3.8%), and Construction & Extraction (40 | 2.5%).
Natural Resources, Construction and Maintenance Occupations by Sex
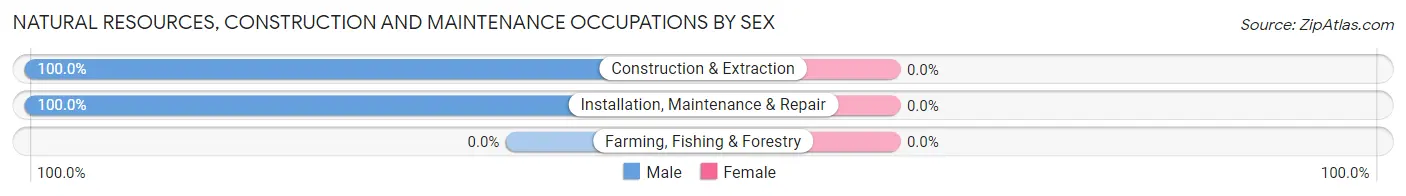
| Occupation | Male | Female |
| Farming, Fishing & Forestry | 0 (0.0%) | 0 (0.0%) |
| Construction & Extraction | 40 (100.0%) | 0 (0.0%) |
| Installation, Maintenance & Repair | 61 (100.0%) | 0 (0.0%) |
| Total (Category) | 101 (100.0%) | 0 (0.0%) |
| Total (Overall) | 806 (49.7%) | 814 (50.2%) |
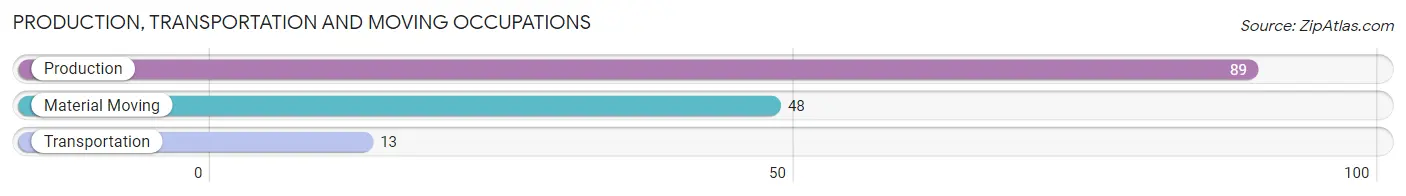
Production, Transportation and Moving Occupations
The most common Production, Transportation and Moving occupations in Cornwall On Hudson are Production (89 | 5.5%), Material Moving (48 | 3.0%), and Transportation (13 | 0.8%).
Production, Transportation and Moving Occupations by Sex
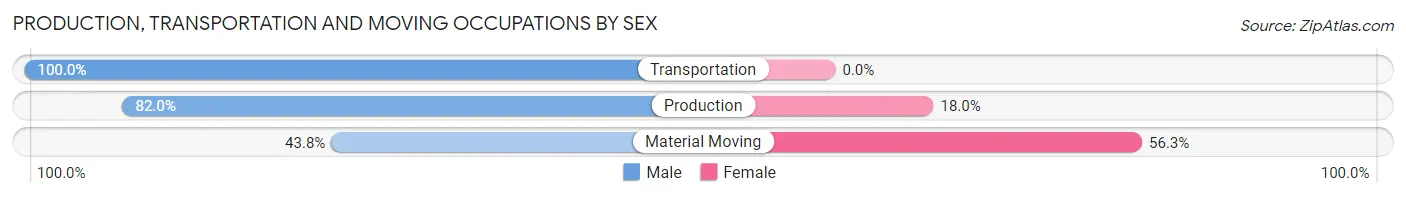
| Occupation | Male | Female |
| Production | 73 (82.0%) | 16 (18.0%) |
| Transportation | 13 (100.0%) | 0 (0.0%) |
| Material Moving | 21 (43.8%) | 27 (56.2%) |
| Total (Category) | 107 (71.3%) | 43 (28.7%) |
| Total (Overall) | 806 (49.7%) | 814 (50.2%) |
Employment Industries by Sex in Cornwall On Hudson
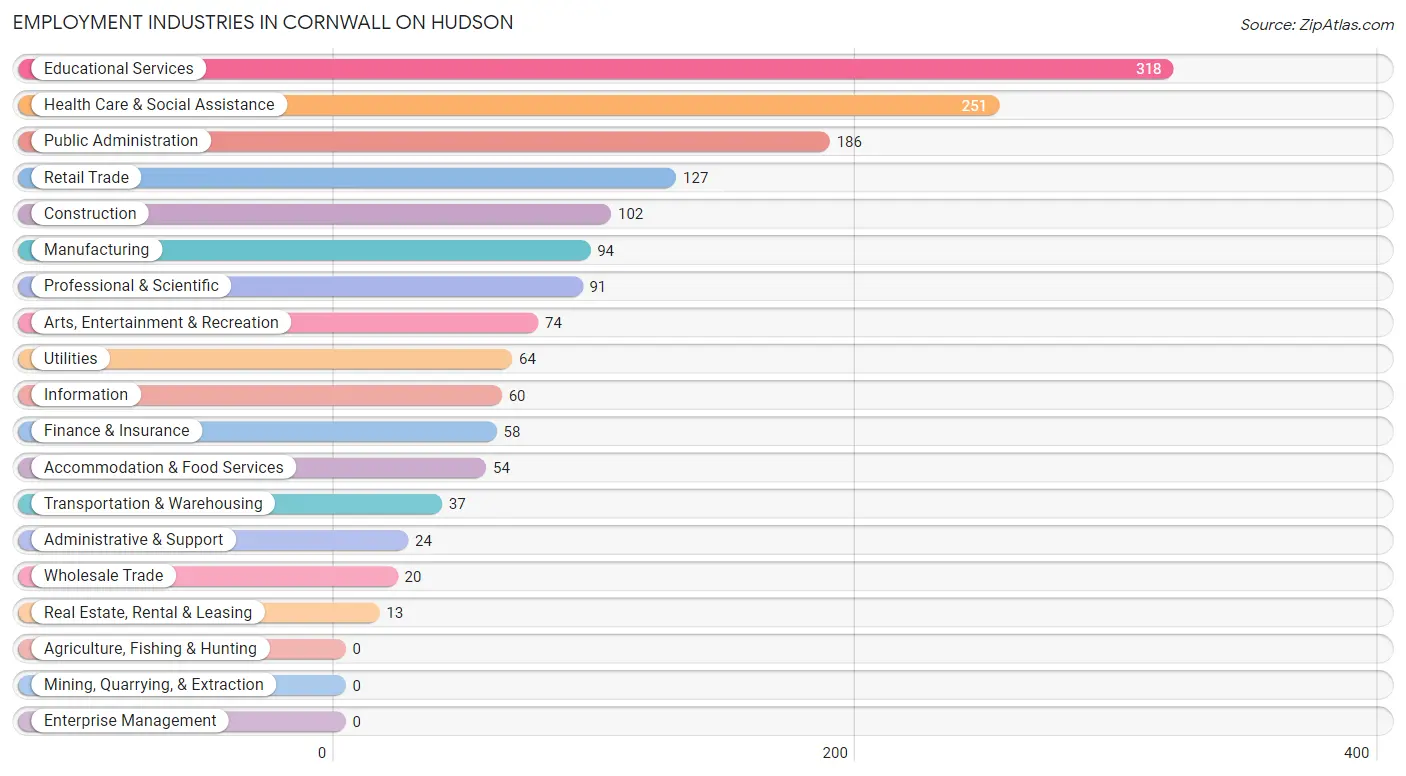
Employment Industries in Cornwall On Hudson
The major employment industries in Cornwall On Hudson include Educational Services (318 | 19.6%), Health Care & Social Assistance (251 | 15.5%), Public Administration (186 | 11.5%), Retail Trade (127 | 7.8%), and Construction (102 | 6.3%).
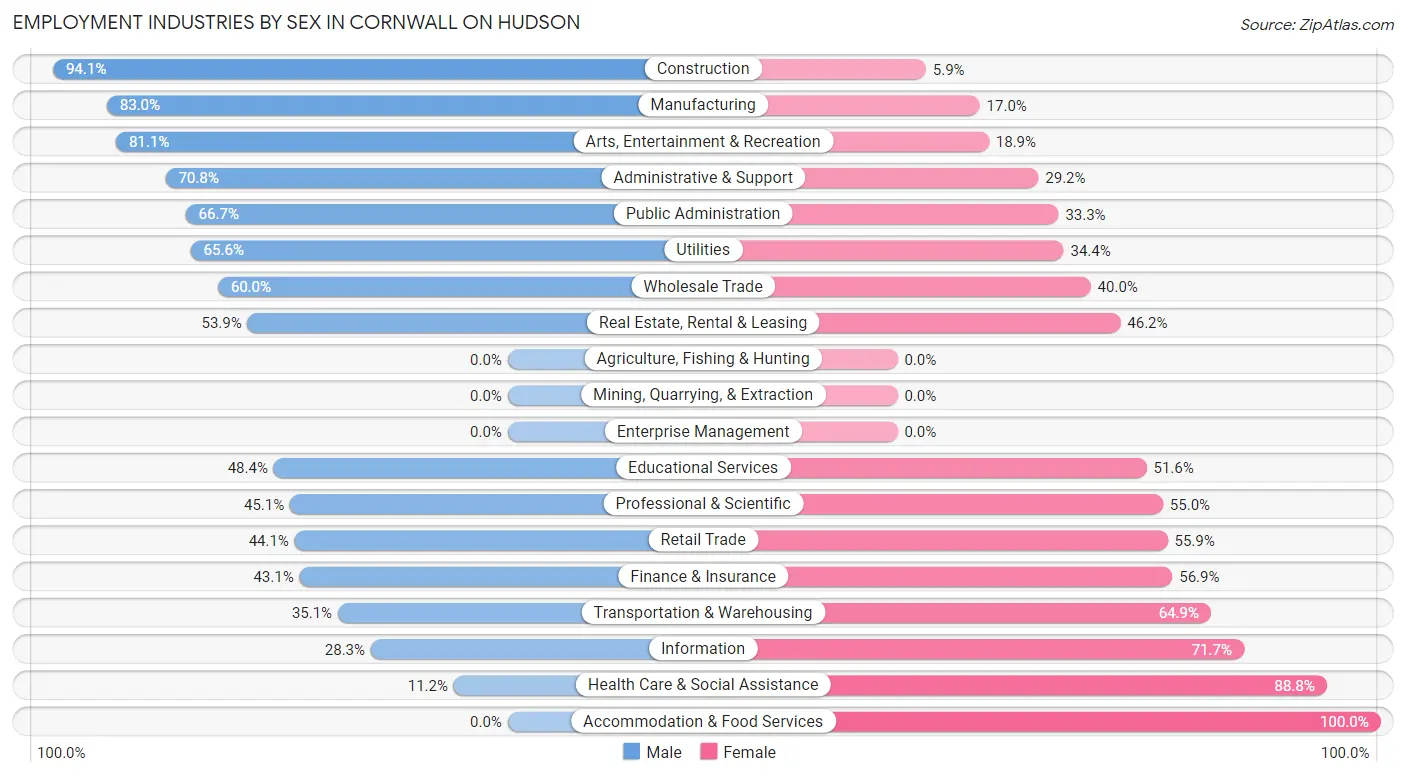
Employment Industries by Sex in Cornwall On Hudson
The Cornwall On Hudson industries that see more men than women are Construction (94.1%), Manufacturing (83.0%), and Arts, Entertainment & Recreation (81.1%), whereas the industries that tend to have a higher number of women are Accommodation & Food Services (100.0%), Health Care & Social Assistance (88.8%), and Information (71.7%).
| Industry | Male | Female |
| Agriculture, Fishing & Hunting | 0 (0.0%) | 0 (0.0%) |
| Mining, Quarrying, & Extraction | 0 (0.0%) | 0 (0.0%) |
| Construction | 96 (94.1%) | 6 (5.9%) |
| Manufacturing | 78 (83.0%) | 16 (17.0%) |
| Wholesale Trade | 12 (60.0%) | 8 (40.0%) |
| Retail Trade | 56 (44.1%) | 71 (55.9%) |
| Transportation & Warehousing | 13 (35.1%) | 24 (64.9%) |
| Utilities | 42 (65.6%) | 22 (34.4%) |
| Information | 17 (28.3%) | 43 (71.7%) |
| Finance & Insurance | 25 (43.1%) | 33 (56.9%) |
| Real Estate, Rental & Leasing | 7 (53.8%) | 6 (46.2%) |
| Professional & Scientific | 41 (45.1%) | 50 (54.9%) |
| Enterprise Management | 0 (0.0%) | 0 (0.0%) |
| Administrative & Support | 17 (70.8%) | 7 (29.2%) |
| Educational Services | 154 (48.4%) | 164 (51.6%) |
| Health Care & Social Assistance | 28 (11.2%) | 223 (88.8%) |
| Arts, Entertainment & Recreation | 60 (81.1%) | 14 (18.9%) |
| Accommodation & Food Services | 0 (0.0%) | 54 (100.0%) |
| Public Administration | 124 (66.7%) | 62 (33.3%) |
| Total | 806 (49.7%) | 814 (50.2%) |
Education in Cornwall On Hudson
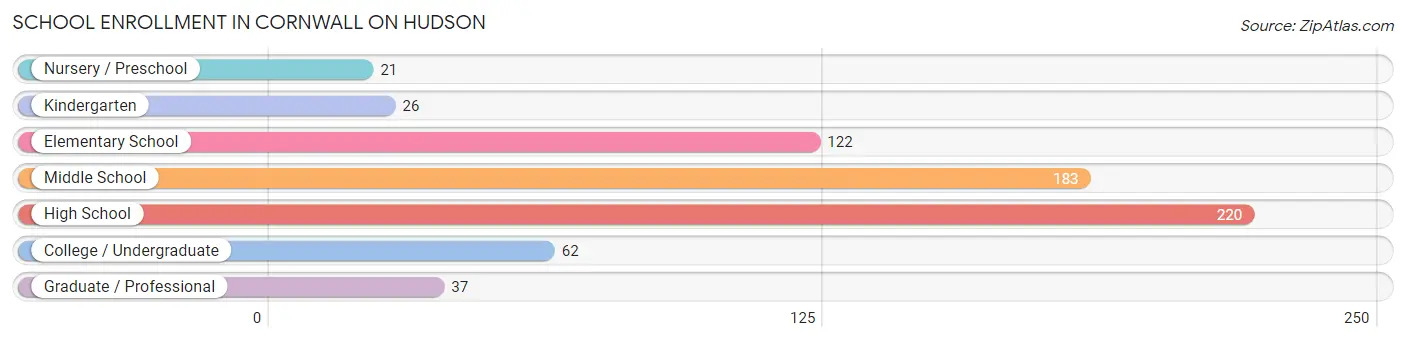
School Enrollment in Cornwall On Hudson
The most common levels of schooling among the 671 students in Cornwall On Hudson are high school (220 | 32.8%), middle school (183 | 27.3%), and elementary school (122 | 18.2%).
| School Level | # Students | % Students |
| Nursery / Preschool | 21 | 3.1% |
| Kindergarten | 26 | 3.9% |
| Elementary School | 122 | 18.2% |
| Middle School | 183 | 27.3% |
| High School | 220 | 32.8% |
| College / Undergraduate | 62 | 9.2% |
| Graduate / Professional | 37 | 5.5% |
| Total | 671 | 100.0% |
School Enrollment by Age by Funding Source in Cornwall On Hudson
Out of a total of 671 students who are enrolled in schools in Cornwall On Hudson, 107 (15.9%) attend a private institution, while the remaining 564 (84.1%) are enrolled in public schools. The age group of 3 to 4 year olds has the highest likelihood of being enrolled in private schools, with 16 (76.2% in the age bracket) enrolled. Conversely, the age group of 15 to 17 year olds has the lowest likelihood of being enrolled in a private school, with 187 (100.0% in the age bracket) attending a public institution.
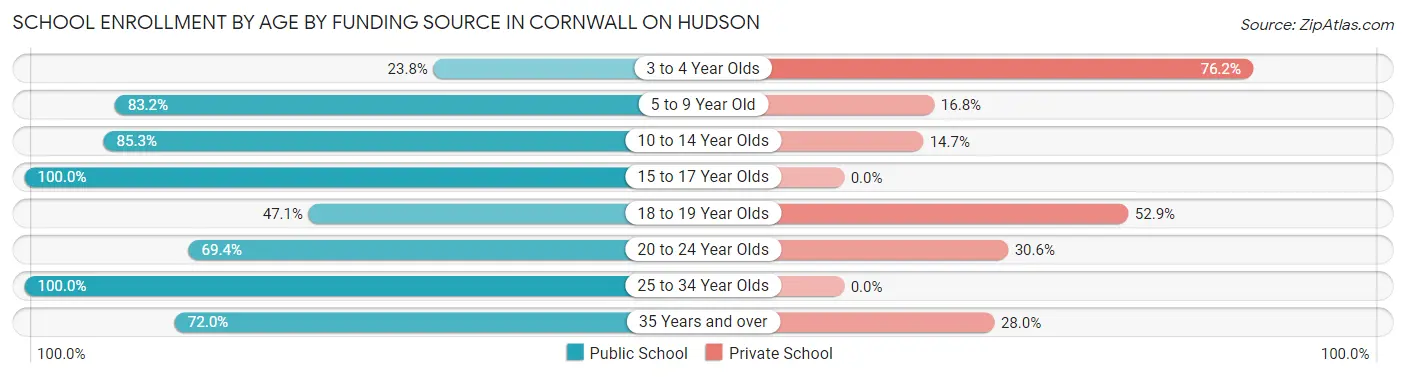
| Age Bracket | Public School | Private School |
| 3 to 4 Year Olds | 5 (23.8%) | 16 (76.2%) |
| 5 to 9 Year Old | 99 (83.2%) | 20 (16.8%) |
| 10 to 14 Year Olds | 191 (85.3%) | 33 (14.7%) |
| 15 to 17 Year Olds | 187 (100.0%) | 0 (0.0%) |
| 18 to 19 Year Olds | 8 (47.1%) | 9 (52.9%) |
| 20 to 24 Year Olds | 50 (69.4%) | 22 (30.6%) |
| 25 to 34 Year Olds | 6 (100.0%) | 0 (0.0%) |
| 35 Years and over | 18 (72.0%) | 7 (28.0%) |
| Total | 564 (84.1%) | 107 (15.9%) |
Educational Attainment by Field of Study in Cornwall On Hudson
Education (219 | 16.3%), social sciences (183 | 13.6%), business (161 | 12.0%), literature & languages (146 | 10.9%), and visual & performing arts (140 | 10.4%) are the most common fields of study among 1,344 individuals in Cornwall On Hudson who have obtained a bachelor's degree or higher.
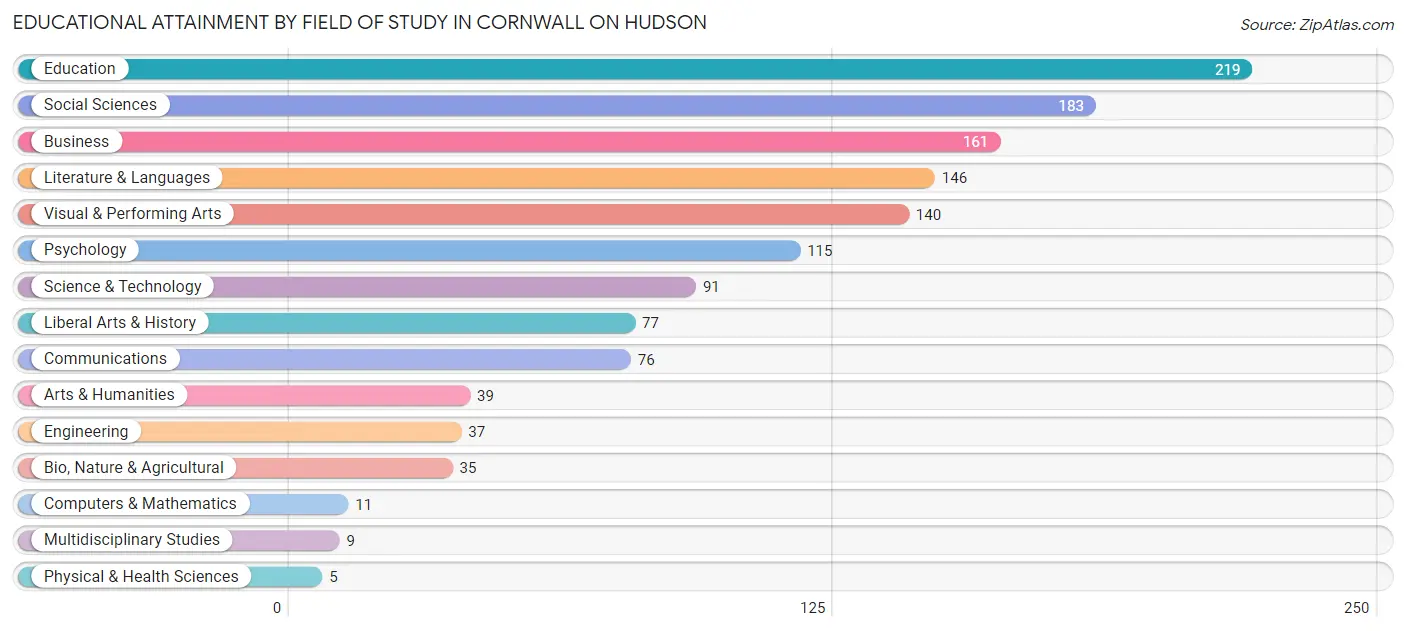
| Field of Study | # Graduates | % Graduates |
| Computers & Mathematics | 11 | 0.8% |
| Bio, Nature & Agricultural | 35 | 2.6% |
| Physical & Health Sciences | 5 | 0.4% |
| Psychology | 115 | 8.6% |
| Social Sciences | 183 | 13.6% |
| Engineering | 37 | 2.8% |
| Multidisciplinary Studies | 9 | 0.7% |
| Science & Technology | 91 | 6.8% |
| Business | 161 | 12.0% |
| Education | 219 | 16.3% |
| Literature & Languages | 146 | 10.9% |
| Liberal Arts & History | 77 | 5.7% |
| Visual & Performing Arts | 140 | 10.4% |
| Communications | 76 | 5.7% |
| Arts & Humanities | 39 | 2.9% |
| Total | 1,344 | 100.0% |
Transportation & Commute in Cornwall On Hudson
Vehicle Availability by Sex in Cornwall On Hudson
The most prevalent vehicle ownership categories in Cornwall On Hudson are males with 2 vehicles (460, accounting for 54.9%) and females with 2 vehicles (342, making up 58.7%).
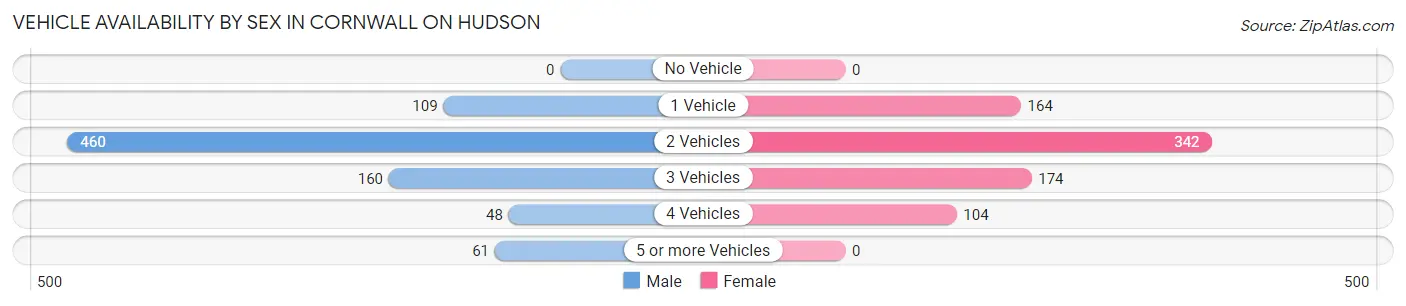
| Vehicles Available | Male | Female |
| No Vehicle | 0 (0.0%) | 0 (0.0%) |
| 1 Vehicle | 109 (13.0%) | 164 (20.9%) |
| 2 Vehicles | 460 (54.9%) | 342 (43.6%) |
| 3 Vehicles | 160 (19.1%) | 174 (22.2%) |
| 4 Vehicles | 48 (5.7%) | 104 (13.3%) |
| 5 or more Vehicles | 61 (7.3%) | 0 (0.0%) |
| Total | 838 (100.0%) | 784 (100.0%) |
Commute Time in Cornwall On Hudson
The most frequently occuring commute durations in Cornwall On Hudson are 15 to 19 minutes (341 commuters, 23.4%), 90 or more minutes (184 commuters, 12.6%), and 20 to 24 minutes (180 commuters, 12.3%).
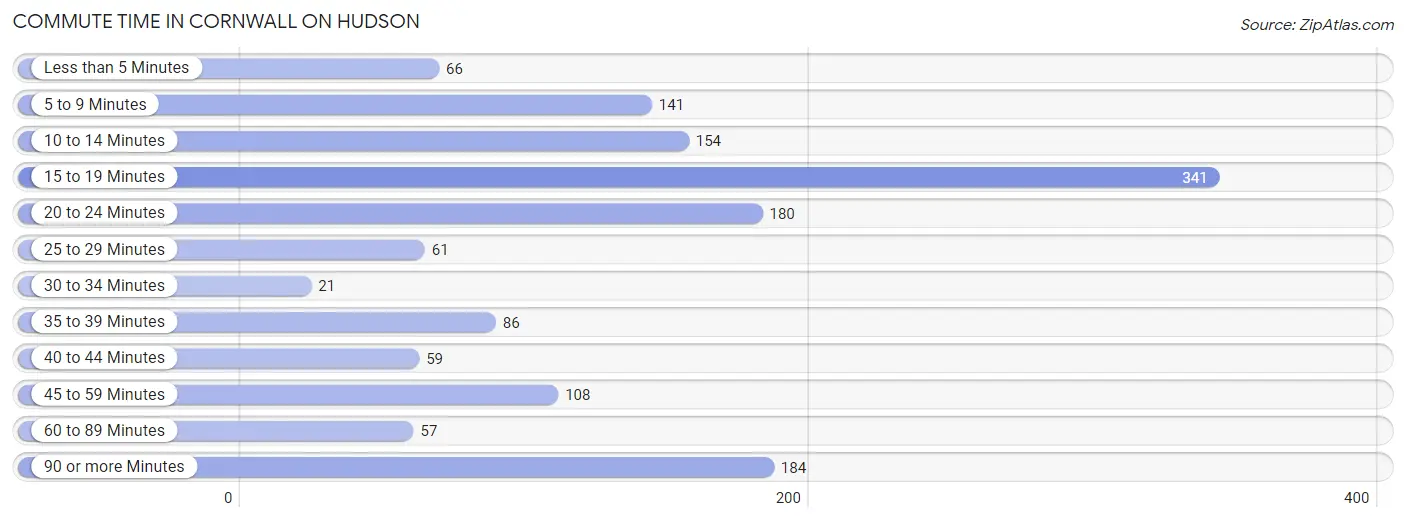
| Commute Time | # Commuters | % Commuters |
| Less than 5 Minutes | 66 | 4.5% |
| 5 to 9 Minutes | 141 | 9.7% |
| 10 to 14 Minutes | 154 | 10.6% |
| 15 to 19 Minutes | 341 | 23.4% |
| 20 to 24 Minutes | 180 | 12.3% |
| 25 to 29 Minutes | 61 | 4.2% |
| 30 to 34 Minutes | 21 | 1.4% |
| 35 to 39 Minutes | 86 | 5.9% |
| 40 to 44 Minutes | 59 | 4.1% |
| 45 to 59 Minutes | 108 | 7.4% |
| 60 to 89 Minutes | 57 | 3.9% |
| 90 or more Minutes | 184 | 12.6% |
Commute Time by Sex in Cornwall On Hudson
The most common commute times in Cornwall On Hudson are 90 or more minutes (162 commuters, 21.4%) for males and 15 to 19 minutes (207 commuters, 29.6%) for females.
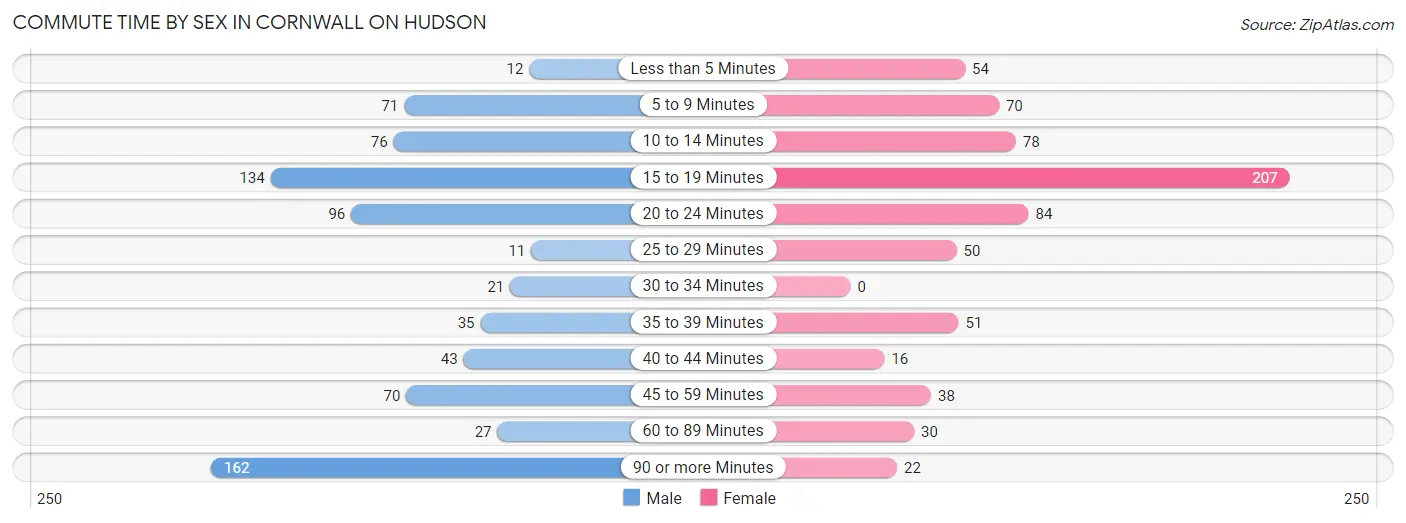
| Commute Time | Male | Female |
| Less than 5 Minutes | 12 (1.6%) | 54 (7.7%) |
| 5 to 9 Minutes | 71 (9.4%) | 70 (10.0%) |
| 10 to 14 Minutes | 76 (10.0%) | 78 (11.1%) |
| 15 to 19 Minutes | 134 (17.7%) | 207 (29.6%) |
| 20 to 24 Minutes | 96 (12.7%) | 84 (12.0%) |
| 25 to 29 Minutes | 11 (1.5%) | 50 (7.1%) |
| 30 to 34 Minutes | 21 (2.8%) | 0 (0.0%) |
| 35 to 39 Minutes | 35 (4.6%) | 51 (7.3%) |
| 40 to 44 Minutes | 43 (5.7%) | 16 (2.3%) |
| 45 to 59 Minutes | 70 (9.2%) | 38 (5.4%) |
| 60 to 89 Minutes | 27 (3.6%) | 30 (4.3%) |
| 90 or more Minutes | 162 (21.4%) | 22 (3.1%) |
Time of Departure to Work by Sex in Cornwall On Hudson
The most frequent times of departure to work in Cornwall On Hudson are 6:00 AM to 6:29 AM (122, 16.1%) for males and 8:00 AM to 8:29 AM (184, 26.3%) for females.
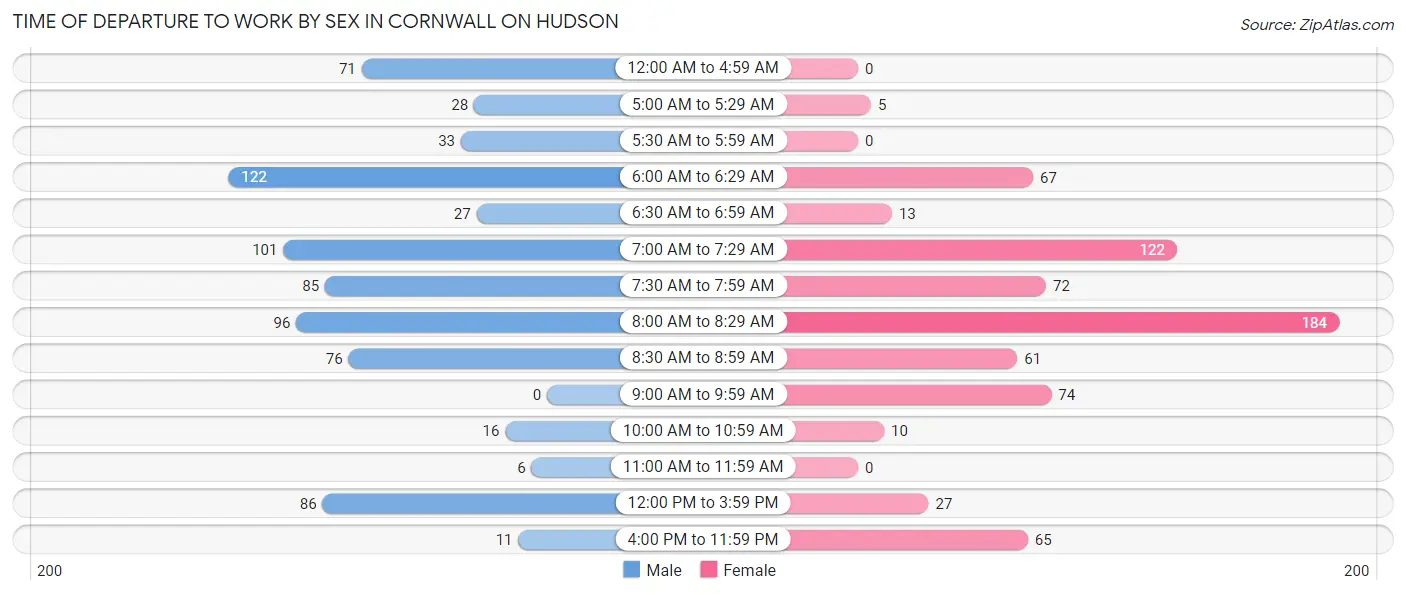
| Time of Departure | Male | Female |
| 12:00 AM to 4:59 AM | 71 (9.4%) | 0 (0.0%) |
| 5:00 AM to 5:29 AM | 28 (3.7%) | 5 (0.7%) |
| 5:30 AM to 5:59 AM | 33 (4.3%) | 0 (0.0%) |
| 6:00 AM to 6:29 AM | 122 (16.1%) | 67 (9.6%) |
| 6:30 AM to 6:59 AM | 27 (3.6%) | 13 (1.9%) |
| 7:00 AM to 7:29 AM | 101 (13.3%) | 122 (17.4%) |
| 7:30 AM to 7:59 AM | 85 (11.2%) | 72 (10.3%) |
| 8:00 AM to 8:29 AM | 96 (12.7%) | 184 (26.3%) |
| 8:30 AM to 8:59 AM | 76 (10.0%) | 61 (8.7%) |
| 9:00 AM to 9:59 AM | 0 (0.0%) | 74 (10.6%) |
| 10:00 AM to 10:59 AM | 16 (2.1%) | 10 (1.4%) |
| 11:00 AM to 11:59 AM | 6 (0.8%) | 0 (0.0%) |
| 12:00 PM to 3:59 PM | 86 (11.4%) | 27 (3.9%) |
| 4:00 PM to 11:59 PM | 11 (1.5%) | 65 (9.3%) |
| Total | 758 (100.0%) | 700 (100.0%) |
Housing Occupancy in Cornwall On Hudson
Occupancy by Ownership in Cornwall On Hudson
Of the total 1,211 dwellings in Cornwall On Hudson, owner-occupied units account for 872 (72.0%), while renter-occupied units make up 339 (28.0%).
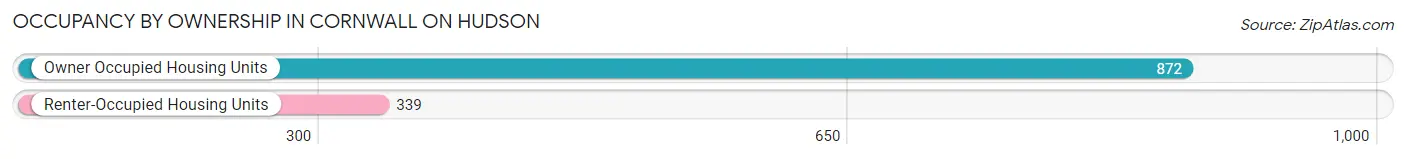
| Occupancy | # Housing Units | % Housing Units |
| Owner Occupied Housing Units | 872 | 72.0% |
| Renter-Occupied Housing Units | 339 | 28.0% |
| Total Occupied Housing Units | 1,211 | 100.0% |
Occupancy by Household Size in Cornwall On Hudson
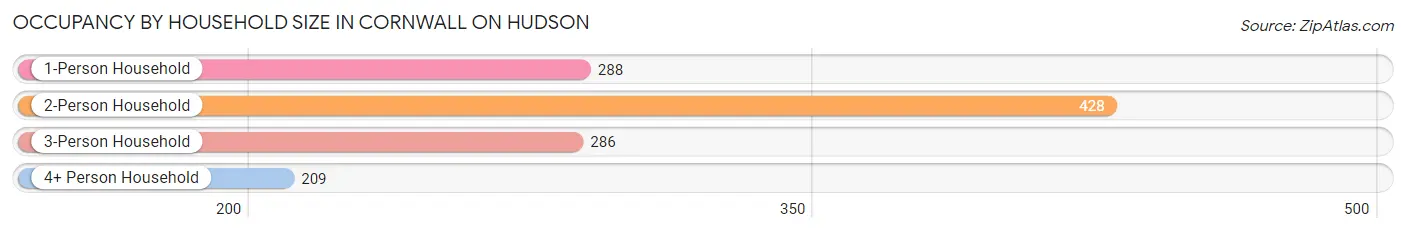
| Household Size | # Housing Units | % Housing Units |
| 1-Person Household | 288 | 23.8% |
| 2-Person Household | 428 | 35.3% |
| 3-Person Household | 286 | 23.6% |
| 4+ Person Household | 209 | 17.3% |
| Total Housing Units | 1,211 | 100.0% |
Occupancy by Ownership by Household Size in Cornwall On Hudson
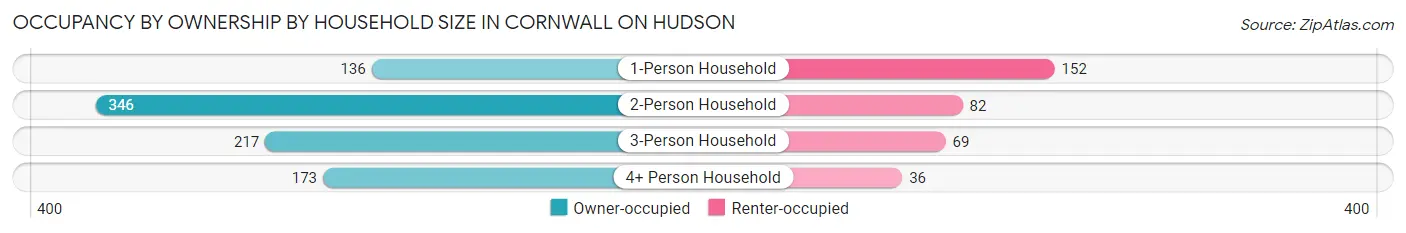
| Household Size | Owner-occupied | Renter-occupied |
| 1-Person Household | 136 (47.2%) | 152 (52.8%) |
| 2-Person Household | 346 (80.8%) | 82 (19.2%) |
| 3-Person Household | 217 (75.9%) | 69 (24.1%) |
| 4+ Person Household | 173 (82.8%) | 36 (17.2%) |
| Total Housing Units | 872 (72.0%) | 339 (28.0%) |
Occupancy by Educational Attainment in Cornwall On Hudson
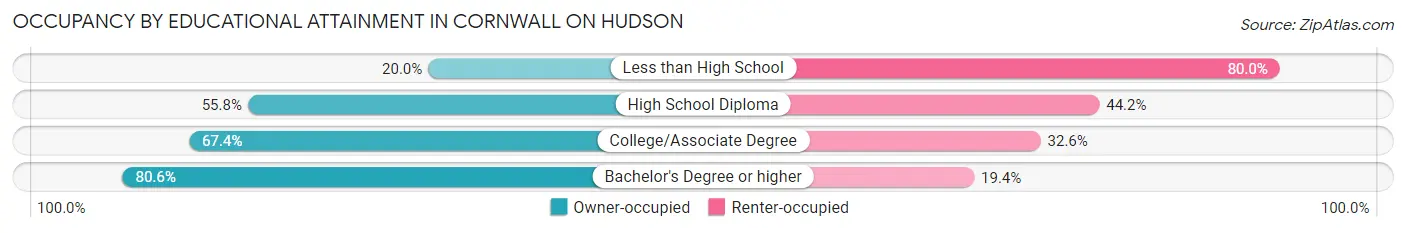
| Household Size | Owner-occupied | Renter-occupied |
| Less than High School | 5 (20.0%) | 20 (80.0%) |
| High School Diploma | 92 (55.8%) | 73 (44.2%) |
| College/Associate Degree | 244 (67.4%) | 118 (32.6%) |
| Bachelor's Degree or higher | 531 (80.6%) | 128 (19.4%) |
Occupancy by Age of Householder in Cornwall On Hudson
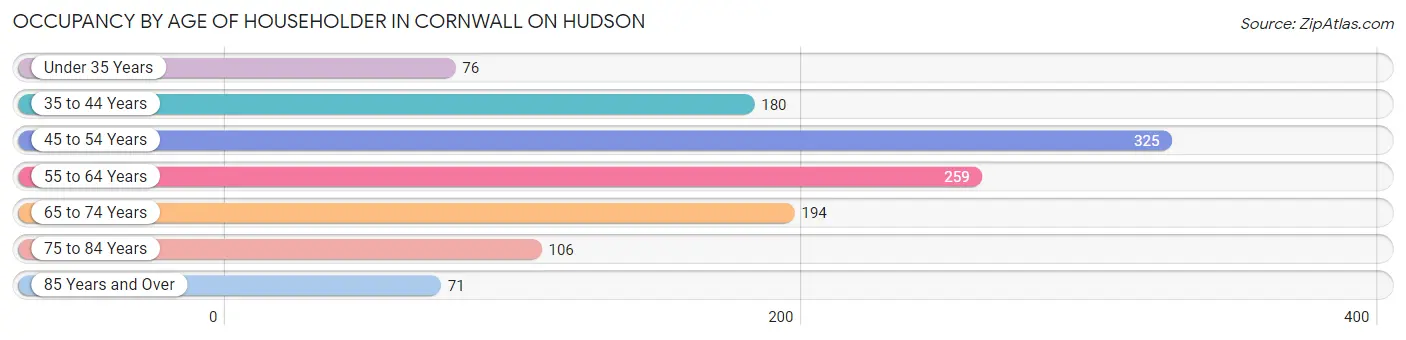
| Age Bracket | # Households | % Households |
| Under 35 Years | 76 | 6.3% |
| 35 to 44 Years | 180 | 14.9% |
| 45 to 54 Years | 325 | 26.8% |
| 55 to 64 Years | 259 | 21.4% |
| 65 to 74 Years | 194 | 16.0% |
| 75 to 84 Years | 106 | 8.7% |
| 85 Years and Over | 71 | 5.9% |
| Total | 1,211 | 100.0% |
Housing Finances in Cornwall On Hudson
Median Income by Occupancy in Cornwall On Hudson
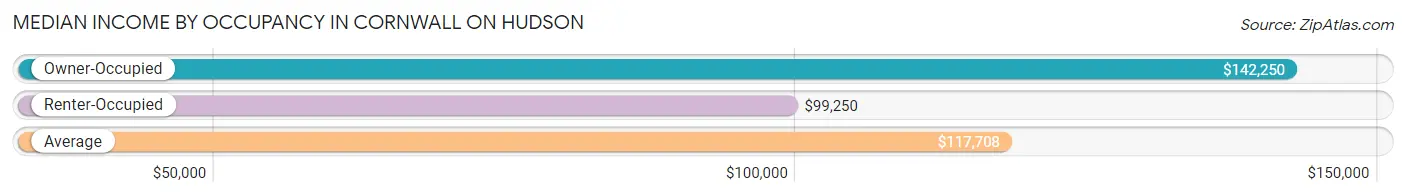
| Occupancy Type | # Households | Median Income |
| Owner-Occupied | 872 (72.0%) | $142,250 |
| Renter-Occupied | 339 (28.0%) | $99,250 |
| Average | 1,211 (100.0%) | $117,708 |
Occupancy by Householder Income Bracket in Cornwall On Hudson
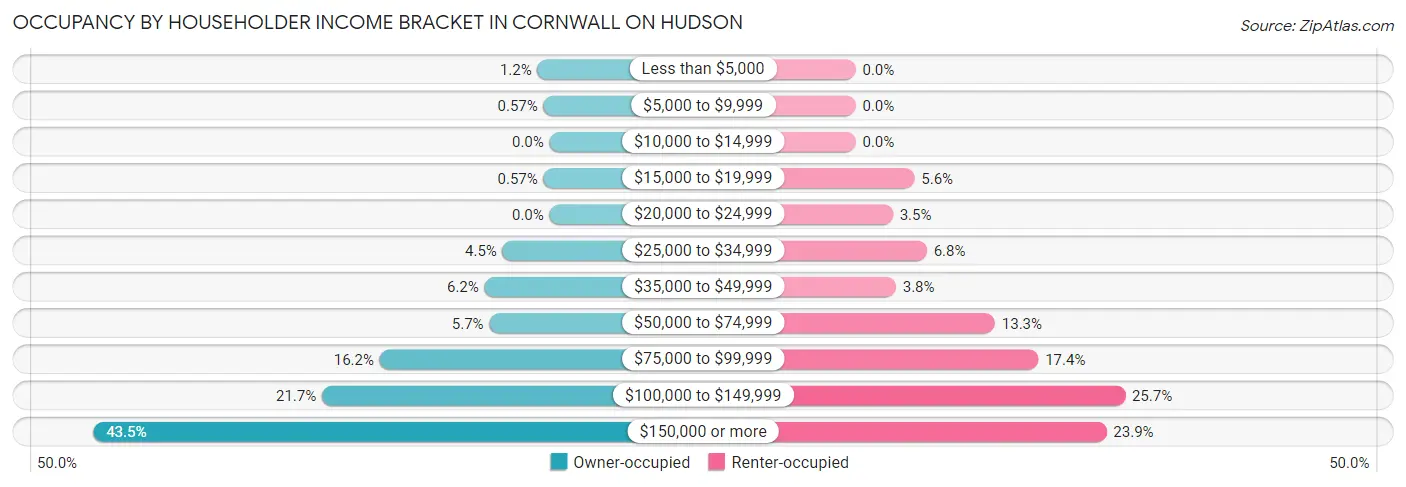
| Income Bracket | Owner-occupied | Renter-occupied |
| Less than $5,000 | 10 (1.1%) | 0 (0.0%) |
| $5,000 to $9,999 | 5 (0.6%) | 0 (0.0%) |
| $10,000 to $14,999 | 0 (0.0%) | 0 (0.0%) |
| $15,000 to $19,999 | 5 (0.6%) | 19 (5.6%) |
| $20,000 to $24,999 | 0 (0.0%) | 12 (3.5%) |
| $25,000 to $34,999 | 39 (4.5%) | 23 (6.8%) |
| $35,000 to $49,999 | 54 (6.2%) | 13 (3.8%) |
| $50,000 to $74,999 | 50 (5.7%) | 45 (13.3%) |
| $75,000 to $99,999 | 141 (16.2%) | 59 (17.4%) |
| $100,000 to $149,999 | 189 (21.7%) | 87 (25.7%) |
| $150,000 or more | 379 (43.5%) | 81 (23.9%) |
| Total | 872 (100.0%) | 339 (100.0%) |
Monthly Housing Cost Tiers in Cornwall On Hudson
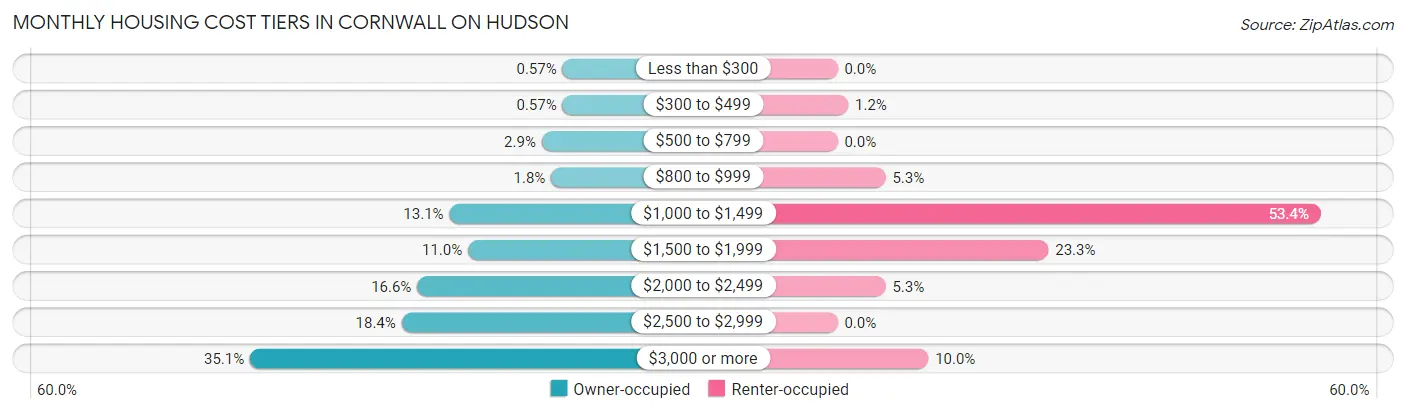
| Monthly Cost | Owner-occupied | Renter-occupied |
| Less than $300 | 5 (0.6%) | 0 (0.0%) |
| $300 to $499 | 5 (0.6%) | 4 (1.2%) |
| $500 to $799 | 25 (2.9%) | 0 (0.0%) |
| $800 to $999 | 16 (1.8%) | 18 (5.3%) |
| $1,000 to $1,499 | 114 (13.1%) | 181 (53.4%) |
| $1,500 to $1,999 | 96 (11.0%) | 79 (23.3%) |
| $2,000 to $2,499 | 145 (16.6%) | 18 (5.3%) |
| $2,500 to $2,999 | 160 (18.3%) | 0 (0.0%) |
| $3,000 or more | 306 (35.1%) | 34 (10.0%) |
| Total | 872 (100.0%) | 339 (100.0%) |
Physical Housing Characteristics in Cornwall On Hudson
Housing Structures in Cornwall On Hudson
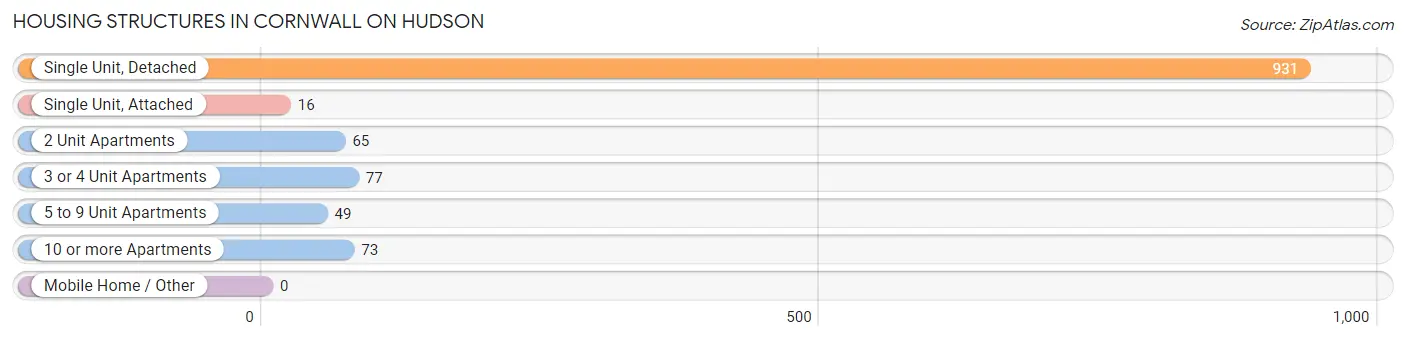
| Structure Type | # Housing Units | % Housing Units |
| Single Unit, Detached | 931 | 76.9% |
| Single Unit, Attached | 16 | 1.3% |
| 2 Unit Apartments | 65 | 5.4% |
| 3 or 4 Unit Apartments | 77 | 6.4% |
| 5 to 9 Unit Apartments | 49 | 4.1% |
| 10 or more Apartments | 73 | 6.0% |
| Mobile Home / Other | 0 | 0.0% |
| Total | 1,211 | 100.0% |
Housing Structures by Occupancy in Cornwall On Hudson
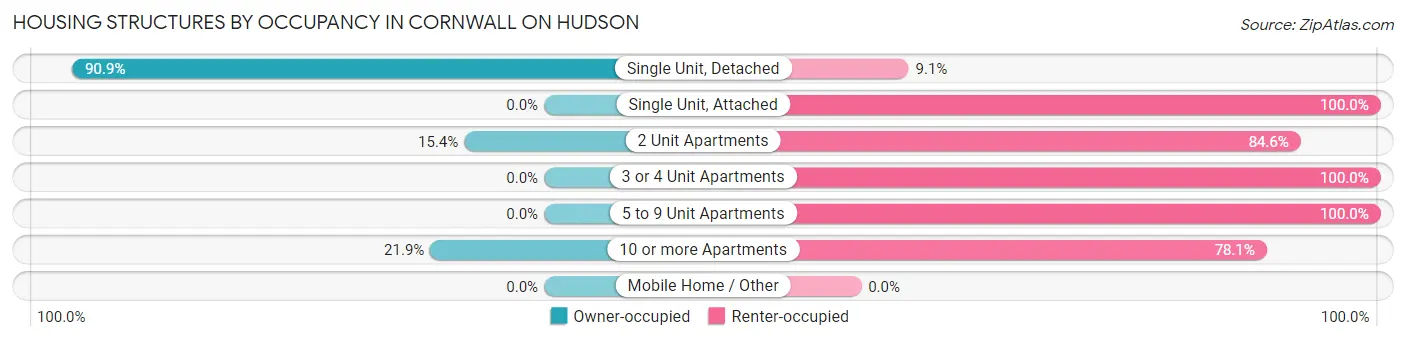
| Structure Type | Owner-occupied | Renter-occupied |
| Single Unit, Detached | 846 (90.9%) | 85 (9.1%) |
| Single Unit, Attached | 0 (0.0%) | 16 (100.0%) |
| 2 Unit Apartments | 10 (15.4%) | 55 (84.6%) |
| 3 or 4 Unit Apartments | 0 (0.0%) | 77 (100.0%) |
| 5 to 9 Unit Apartments | 0 (0.0%) | 49 (100.0%) |
| 10 or more Apartments | 16 (21.9%) | 57 (78.1%) |
| Mobile Home / Other | 0 (0.0%) | 0 (0.0%) |
| Total | 872 (72.0%) | 339 (28.0%) |
Housing Structures by Number of Rooms in Cornwall On Hudson
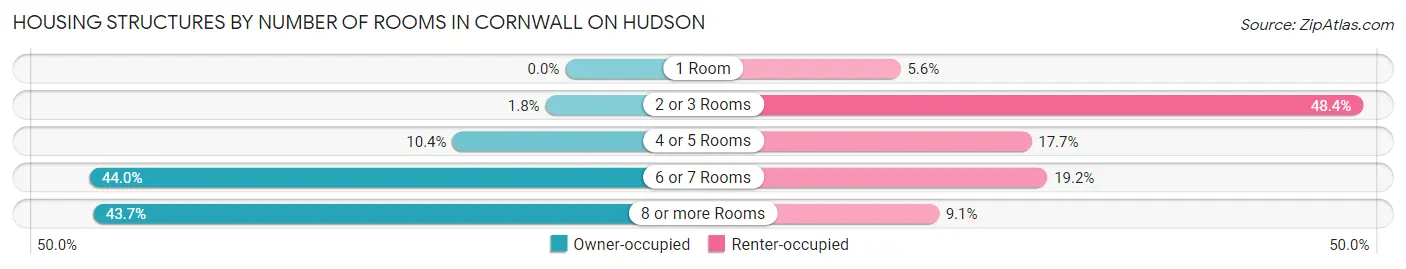
| Number of Rooms | Owner-occupied | Renter-occupied |
| 1 Room | 0 (0.0%) | 19 (5.6%) |
| 2 or 3 Rooms | 16 (1.8%) | 164 (48.4%) |
| 4 or 5 Rooms | 91 (10.4%) | 60 (17.7%) |
| 6 or 7 Rooms | 384 (44.0%) | 65 (19.2%) |
| 8 or more Rooms | 381 (43.7%) | 31 (9.1%) |
| Total | 872 (100.0%) | 339 (100.0%) |
Housing Structure by Heating Type in Cornwall On Hudson
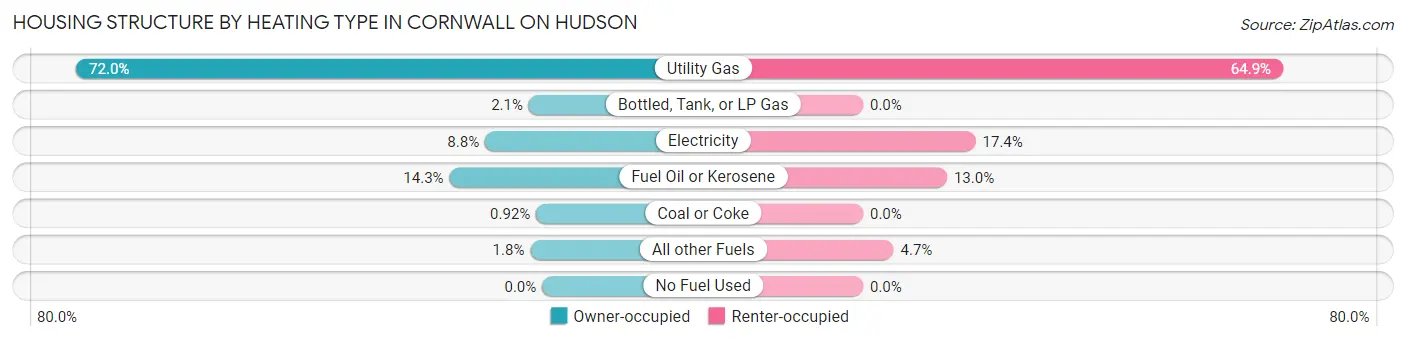
| Heating Type | Owner-occupied | Renter-occupied |
| Utility Gas | 628 (72.0%) | 220 (64.9%) |
| Bottled, Tank, or LP Gas | 18 (2.1%) | 0 (0.0%) |
| Electricity | 77 (8.8%) | 59 (17.4%) |
| Fuel Oil or Kerosene | 125 (14.3%) | 44 (13.0%) |
| Coal or Coke | 8 (0.9%) | 0 (0.0%) |
| All other Fuels | 16 (1.8%) | 16 (4.7%) |
| No Fuel Used | 0 (0.0%) | 0 (0.0%) |
| Total | 872 (100.0%) | 339 (100.0%) |
Household Vehicle Usage in Cornwall On Hudson
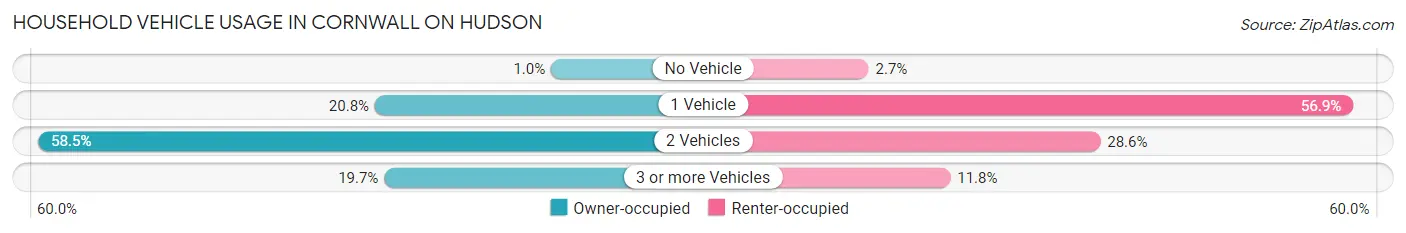
| Vehicles per Household | Owner-occupied | Renter-occupied |
| No Vehicle | 9 (1.0%) | 9 (2.6%) |
| 1 Vehicle | 181 (20.8%) | 193 (56.9%) |
| 2 Vehicles | 510 (58.5%) | 97 (28.6%) |
| 3 or more Vehicles | 172 (19.7%) | 40 (11.8%) |
| Total | 872 (100.0%) | 339 (100.0%) |
Real Estate & Mortgages in Cornwall On Hudson
Real Estate and Mortgage Overview in Cornwall On Hudson
| Characteristic | Without Mortgage | With Mortgage |
| Housing Units | 278 | 594 |
| Median Property Value | $386,500 | $432,200 |
| Median Household Income | $83,750 | $292 |
| Monthly Housing Costs | $1,435 | $306 |
| Real Estate Taxes | $10,001 | $16 |
Property Value by Mortgage Status in Cornwall On Hudson
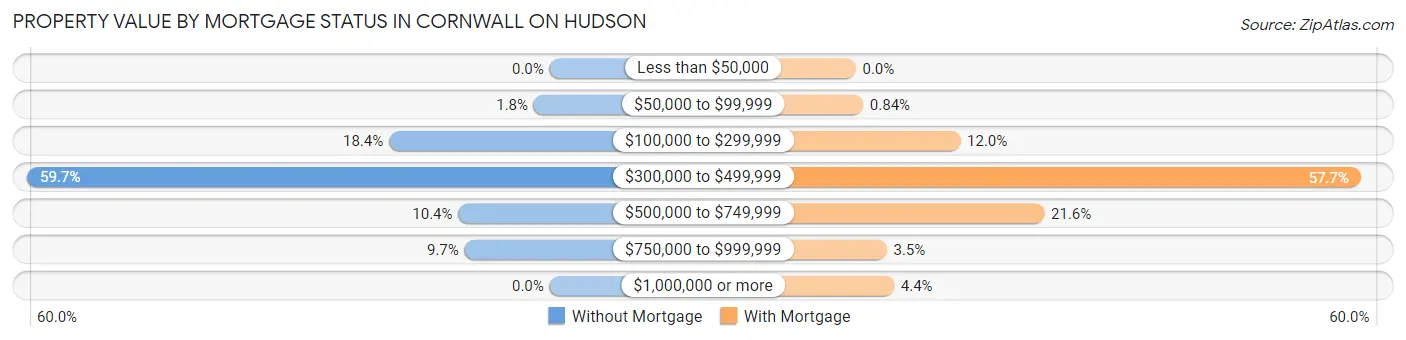
| Property Value | Without Mortgage | With Mortgage |
| Less than $50,000 | 0 (0.0%) | 0 (0.0%) |
| $50,000 to $99,999 | 5 (1.8%) | 5 (0.8%) |
| $100,000 to $299,999 | 51 (18.3%) | 71 (11.9%) |
| $300,000 to $499,999 | 166 (59.7%) | 343 (57.7%) |
| $500,000 to $749,999 | 29 (10.4%) | 128 (21.5%) |
| $750,000 to $999,999 | 27 (9.7%) | 21 (3.5%) |
| $1,000,000 or more | 0 (0.0%) | 26 (4.4%) |
| Total | 278 (100.0%) | 594 (100.0%) |
Household Income by Mortgage Status in Cornwall On Hudson
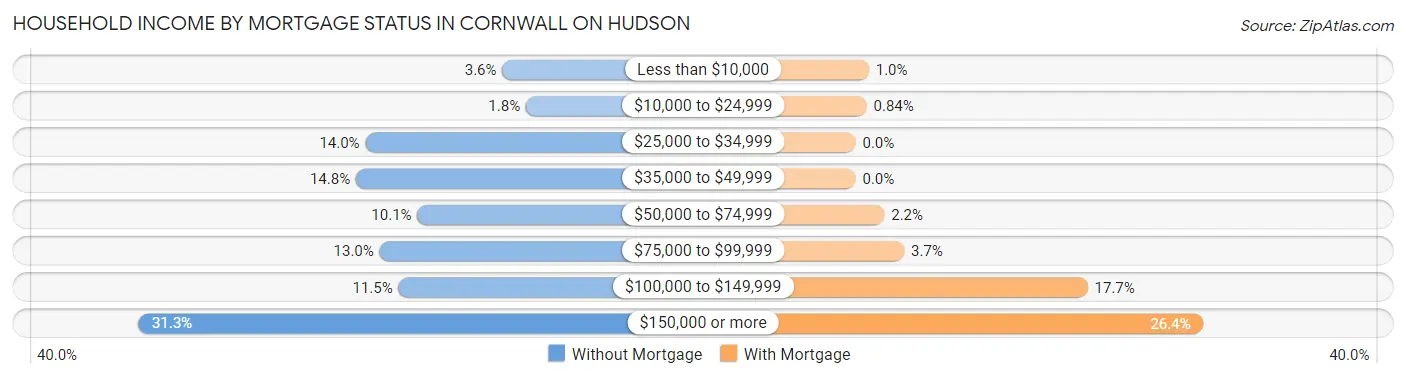
| Household Income | Without Mortgage | With Mortgage |
| Less than $10,000 | 10 (3.6%) | 6 (1.0%) |
| $10,000 to $24,999 | 5 (1.8%) | 5 (0.8%) |
| $25,000 to $34,999 | 39 (14.0%) | 0 (0.0%) |
| $35,000 to $49,999 | 41 (14.7%) | 0 (0.0%) |
| $50,000 to $74,999 | 28 (10.1%) | 13 (2.2%) |
| $75,000 to $99,999 | 36 (13.0%) | 22 (3.7%) |
| $100,000 to $149,999 | 32 (11.5%) | 105 (17.7%) |
| $150,000 or more | 87 (31.3%) | 157 (26.4%) |
| Total | 278 (100.0%) | 594 (100.0%) |
Property Value to Household Income Ratio in Cornwall On Hudson
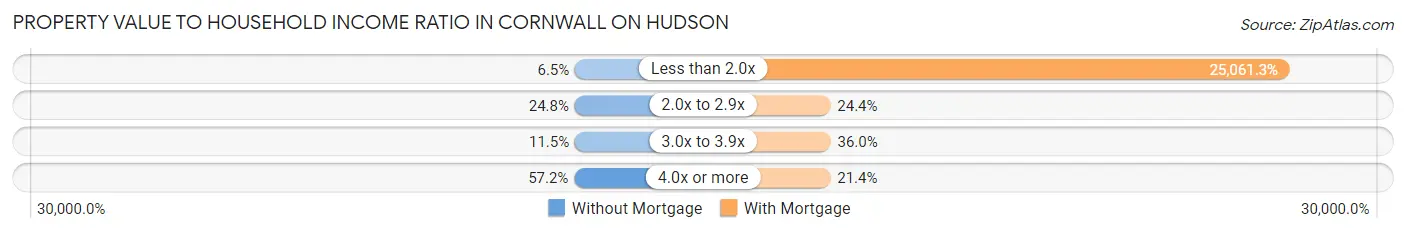
| Value-to-Income Ratio | Without Mortgage | With Mortgage |
| Less than 2.0x | 18 (6.5%) | 148,864 (25,061.3%) |
| 2.0x to 2.9x | 69 (24.8%) | 145 (24.4%) |
| 3.0x to 3.9x | 32 (11.5%) | 214 (36.0%) |
| 4.0x or more | 159 (57.2%) | 127 (21.4%) |
| Total | 278 (100.0%) | 594 (100.0%) |
Real Estate Taxes by Mortgage Status in Cornwall On Hudson
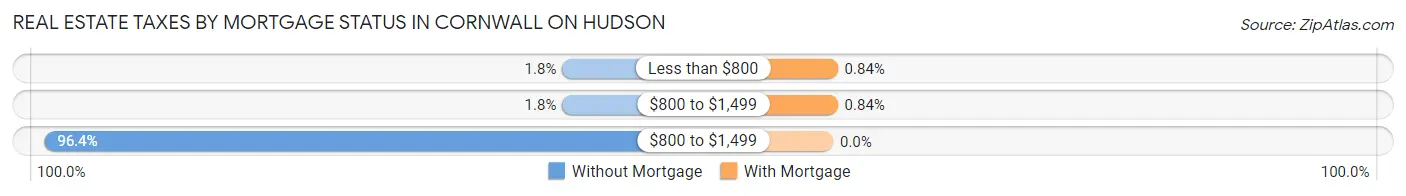
| Property Taxes | Without Mortgage | With Mortgage |
| Less than $800 | 5 (1.8%) | 5 (0.8%) |
| $800 to $1,499 | 5 (1.8%) | 5 (0.8%) |
| $800 to $1,499 | 268 (96.4%) | 0 (0.0%) |
| Total | 278 (100.0%) | 594 (100.0%) |
Health & Disability in Cornwall On Hudson
Health Insurance Coverage by Age in Cornwall On Hudson
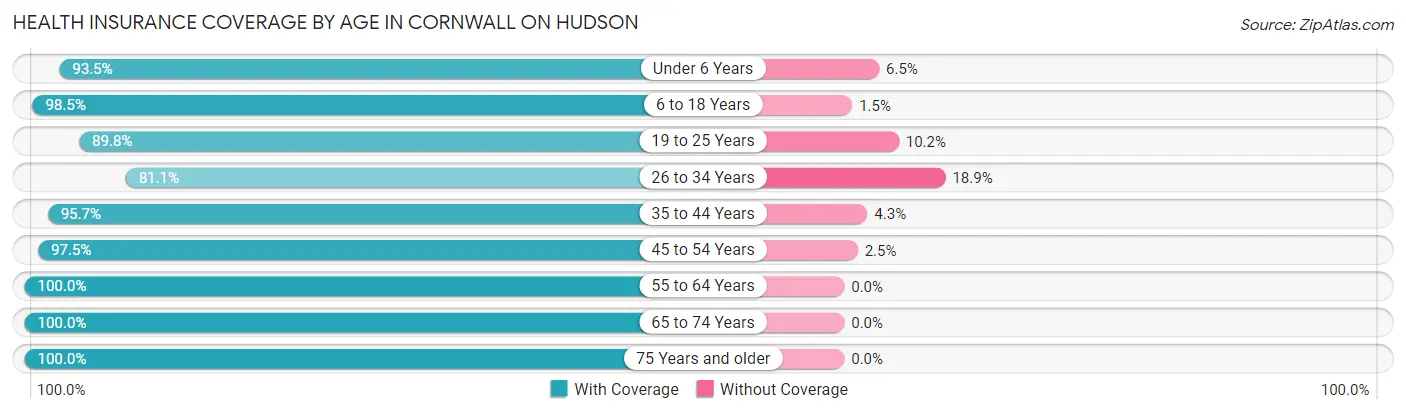
| Age Bracket | With Coverage | Without Coverage |
| Under 6 Years | 72 (93.5%) | 5 (6.5%) |
| 6 to 18 Years | 534 (98.5%) | 8 (1.5%) |
| 19 to 25 Years | 221 (89.8%) | 25 (10.2%) |
| 26 to 34 Years | 86 (81.1%) | 20 (18.9%) |
| 35 to 44 Years | 355 (95.7%) | 16 (4.3%) |
| 45 to 54 Years | 585 (97.5%) | 15 (2.5%) |
| 55 to 64 Years | 422 (100.0%) | 0 (0.0%) |
| 65 to 74 Years | 332 (100.0%) | 0 (0.0%) |
| 75 Years and older | 295 (100.0%) | 0 (0.0%) |
| Total | 2,902 (97.0%) | 89 (3.0%) |
Health Insurance Coverage by Citizenship Status in Cornwall On Hudson
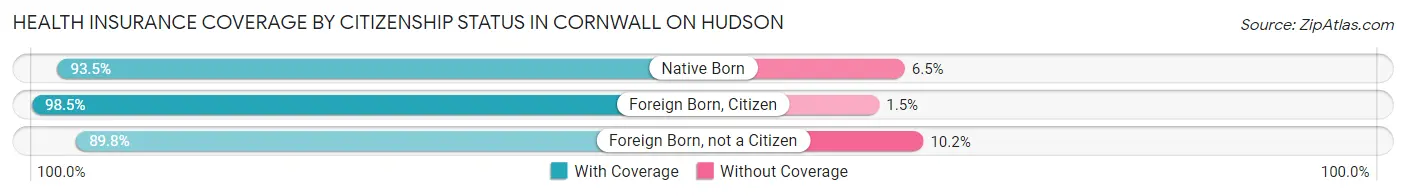
| Citizenship Status | With Coverage | Without Coverage |
| Native Born | 72 (93.5%) | 5 (6.5%) |
| Foreign Born, Citizen | 534 (98.5%) | 8 (1.5%) |
| Foreign Born, not a Citizen | 221 (89.8%) | 25 (10.2%) |
Health Insurance Coverage by Household Income in Cornwall On Hudson
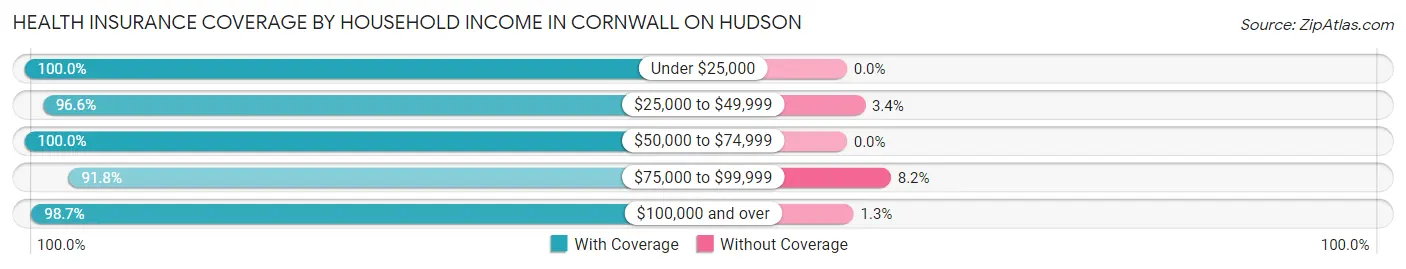
| Household Income | With Coverage | Without Coverage |
| Under $25,000 | 56 (100.0%) | 0 (0.0%) |
| $25,000 to $49,999 | 199 (96.6%) | 7 (3.4%) |
| $50,000 to $74,999 | 124 (100.0%) | 0 (0.0%) |
| $75,000 to $99,999 | 557 (91.8%) | 50 (8.2%) |
| $100,000 and over | 1,867 (98.7%) | 24 (1.3%) |
Public vs Private Health Insurance Coverage by Age in Cornwall On Hudson
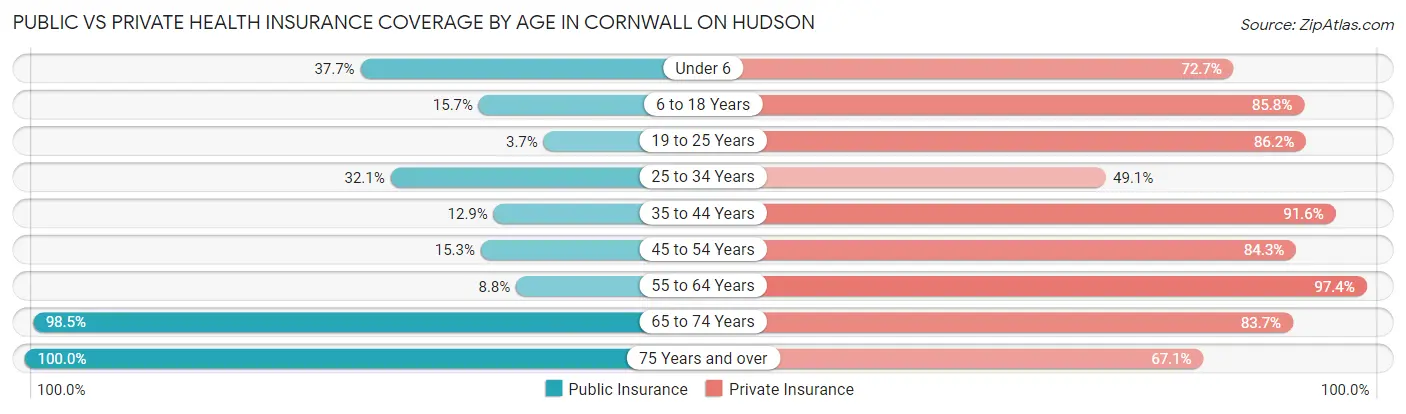
| Age Bracket | Public Insurance | Private Insurance |
| Under 6 | 29 (37.7%) | 56 (72.7%) |
| 6 to 18 Years | 85 (15.7%) | 465 (85.8%) |
| 19 to 25 Years | 9 (3.7%) | 212 (86.2%) |
| 25 to 34 Years | 34 (32.1%) | 52 (49.1%) |
| 35 to 44 Years | 48 (12.9%) | 340 (91.6%) |
| 45 to 54 Years | 92 (15.3%) | 506 (84.3%) |
| 55 to 64 Years | 37 (8.8%) | 411 (97.4%) |
| 65 to 74 Years | 327 (98.5%) | 278 (83.7%) |
| 75 Years and over | 295 (100.0%) | 198 (67.1%) |
| Total | 956 (32.0%) | 2,518 (84.2%) |
Disability Status by Sex by Age in Cornwall On Hudson
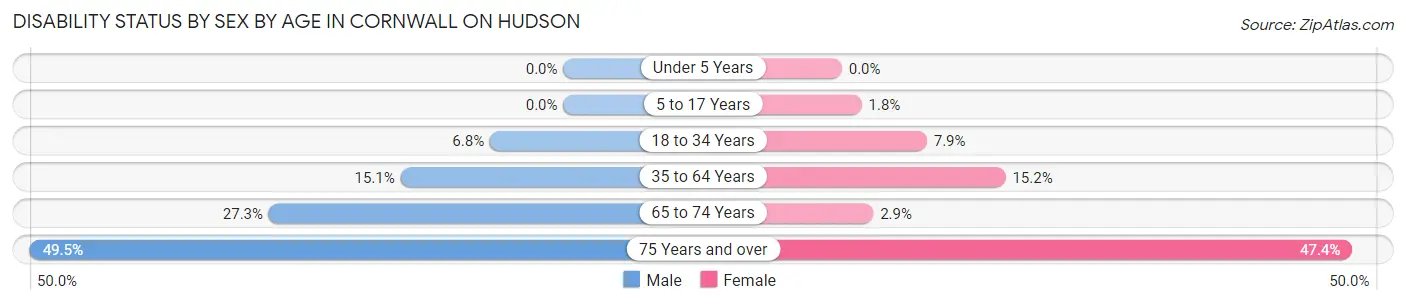
| Age Bracket | Male | Female |
| Under 5 Years | 0 (0.0%) | 0 (0.0%) |
| 5 to 17 Years | 0 (0.0%) | 6 (1.8%) |
| 18 to 34 Years | 13 (6.8%) | 15 (7.9%) |
| 35 to 64 Years | 105 (15.1%) | 106 (15.2%) |
| 65 to 74 Years | 44 (27.3%) | 5 (2.9%) |
| 75 Years and over | 52 (49.5%) | 90 (47.4%) |
Disability Class by Sex by Age in Cornwall On Hudson
Disability Class: Hearing Difficulty
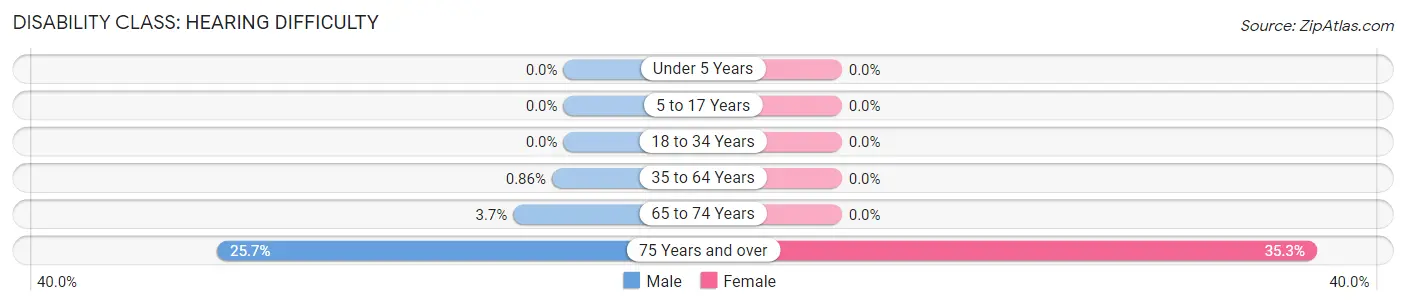
| Age Bracket | Male | Female |
| Under 5 Years | 0 (0.0%) | 0 (0.0%) |
| 5 to 17 Years | 0 (0.0%) | 0 (0.0%) |
| 18 to 34 Years | 0 (0.0%) | 0 (0.0%) |
| 35 to 64 Years | 6 (0.9%) | 0 (0.0%) |
| 65 to 74 Years | 6 (3.7%) | 0 (0.0%) |
| 75 Years and over | 27 (25.7%) | 67 (35.3%) |
Disability Class: Vision Difficulty
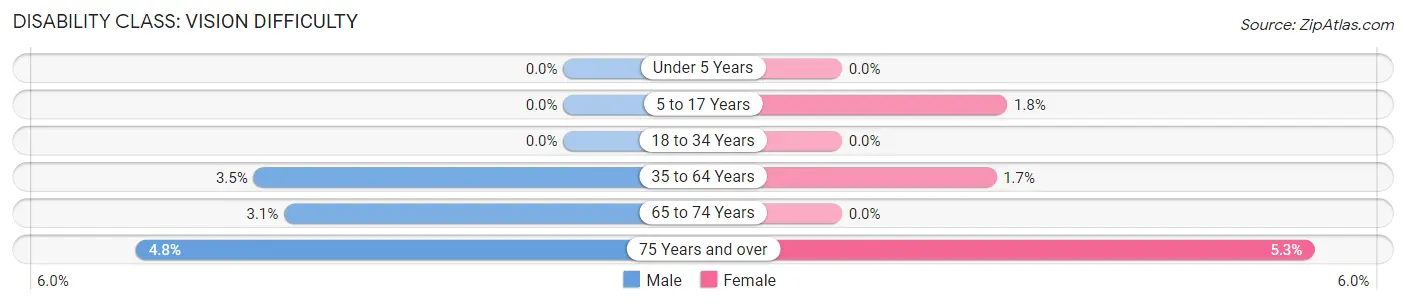
| Age Bracket | Male | Female |
| Under 5 Years | 0 (0.0%) | 0 (0.0%) |
| 5 to 17 Years | 0 (0.0%) | 6 (1.8%) |
| 18 to 34 Years | 0 (0.0%) | 0 (0.0%) |
| 35 to 64 Years | 24 (3.5%) | 12 (1.7%) |
| 65 to 74 Years | 5 (3.1%) | 0 (0.0%) |
| 75 Years and over | 5 (4.8%) | 10 (5.3%) |
Disability Class: Cognitive Difficulty
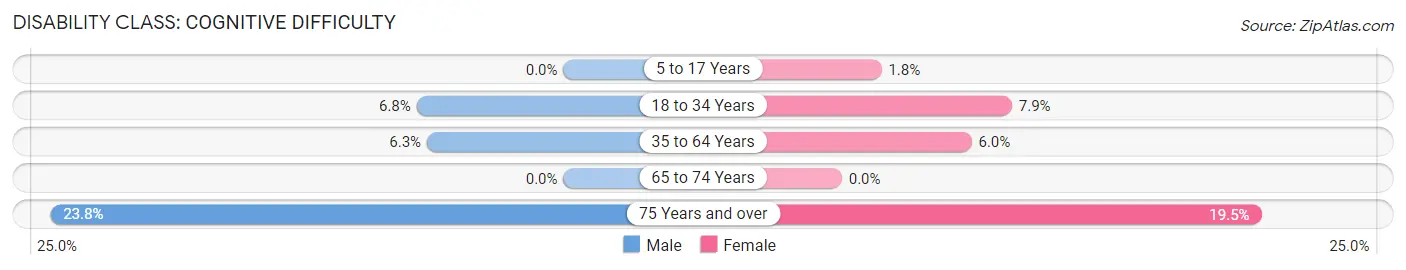
| Age Bracket | Male | Female |
| 5 to 17 Years | 0 (0.0%) | 6 (1.8%) |
| 18 to 34 Years | 13 (6.8%) | 15 (7.9%) |
| 35 to 64 Years | 44 (6.3%) | 42 (6.0%) |
| 65 to 74 Years | 0 (0.0%) | 0 (0.0%) |
| 75 Years and over | 25 (23.8%) | 37 (19.5%) |
Disability Class: Ambulatory Difficulty
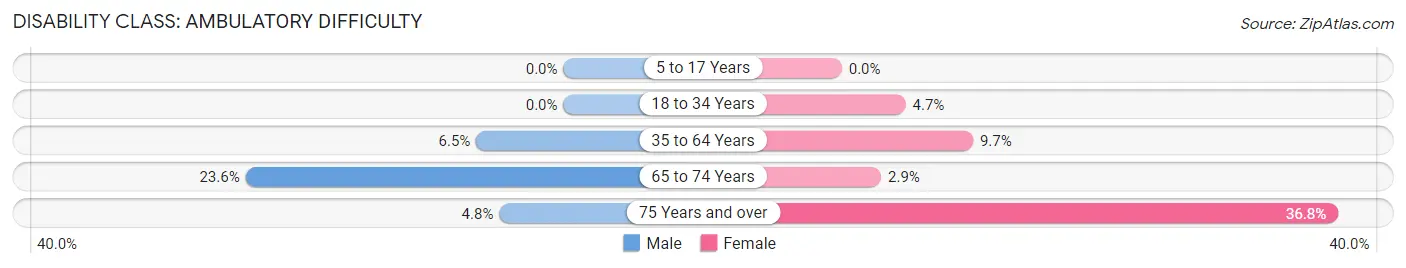
| Age Bracket | Male | Female |
| 5 to 17 Years | 0 (0.0%) | 0 (0.0%) |
| 18 to 34 Years | 0 (0.0%) | 9 (4.7%) |
| 35 to 64 Years | 45 (6.5%) | 68 (9.7%) |
| 65 to 74 Years | 38 (23.6%) | 5 (2.9%) |
| 75 Years and over | 5 (4.8%) | 70 (36.8%) |
Disability Class: Self-Care Difficulty
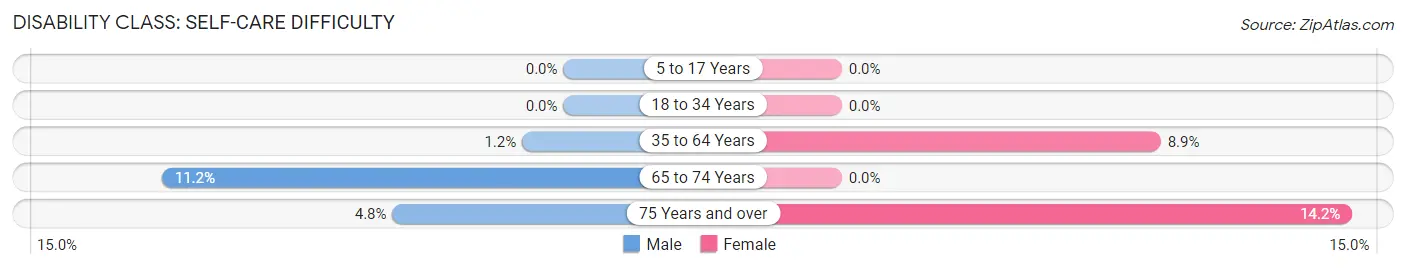
| Age Bracket | Male | Female |
| 5 to 17 Years | 0 (0.0%) | 0 (0.0%) |
| 18 to 34 Years | 0 (0.0%) | 0 (0.0%) |
| 35 to 64 Years | 8 (1.1%) | 62 (8.9%) |
| 65 to 74 Years | 18 (11.2%) | 0 (0.0%) |
| 75 Years and over | 5 (4.8%) | 27 (14.2%) |
Technology Access in Cornwall On Hudson
Computing Device Access in Cornwall On Hudson
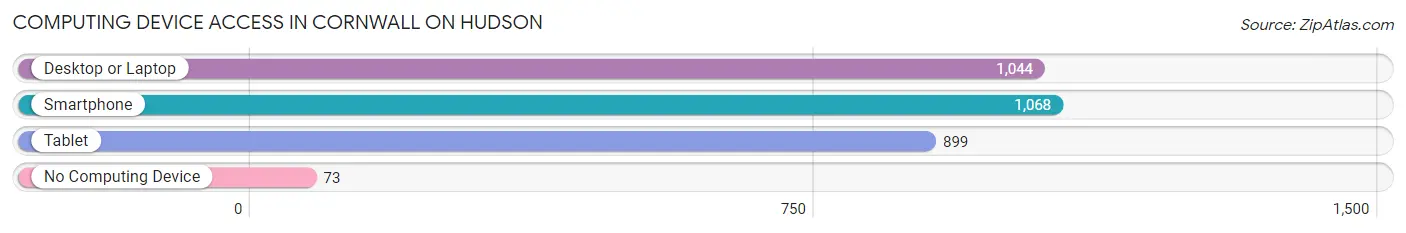
| Device Type | # Households | % Households |
| Desktop or Laptop | 1,044 | 86.2% |
| Smartphone | 1,068 | 88.2% |
| Tablet | 899 | 74.2% |
| No Computing Device | 73 | 6.0% |
| Total | 1,211 | 100.0% |
Internet Access in Cornwall On Hudson
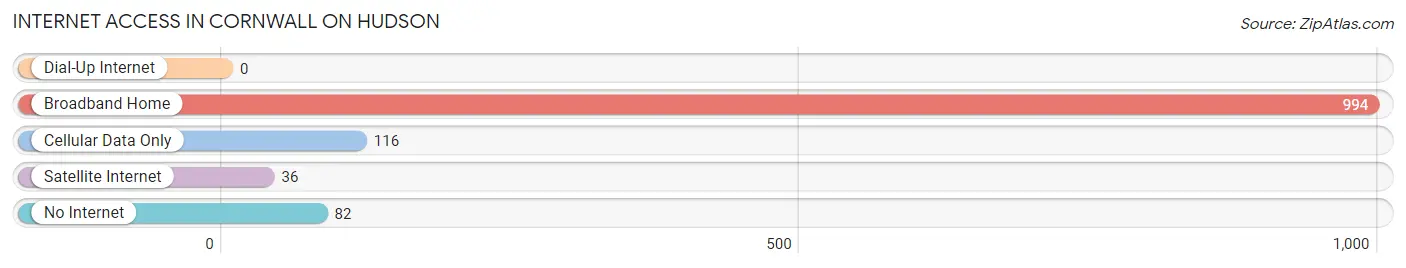
| Internet Type | # Households | % Households |
| Dial-Up Internet | 0 | 0.0% |
| Broadband Home | 994 | 82.1% |
| Cellular Data Only | 116 | 9.6% |
| Satellite Internet | 36 | 3.0% |
| No Internet | 82 | 6.8% |
| Total | 1,211 | 100.0% |
Cornwall On Hudson Summary
Cornwall on Hudson is a village located in Orange County, New York, United States. It is situated on the west bank of the Hudson River, approximately 50 miles north of New York City. The village is part of the Town of Cornwall and is part of the Hudson Valley region. As of the 2010 census, the village had a population of 1,420.
History
The area that is now Cornwall on Hudson was originally inhabited by the Munsee people, a branch of the Lenape. The first European settlers arrived in the area in the late 17th century. The village was originally known as "New Cornwall" and was part of the Town of Cornwall. The village was incorporated in 1871.
In the 19th century, Cornwall on Hudson was a popular summer resort for wealthy New Yorkers. The village was home to several grand hotels, including the Cornwall House, which was built in 1845 and was one of the largest hotels in the Hudson Valley. The village was also home to several large estates, including the estate of William Henry Vanderbilt, which was built in 1883.
Geography
Cornwall on Hudson is located at 41°25'25" North, 74°00'45" West (41.423, -74.013). The village is situated on the west bank of the Hudson River, approximately 50 miles north of New York City. The village is part of the Town of Cornwall and is part of the Hudson Valley region.
The village has a total area of 1.2 square miles, all of which is land. The village is located in a hilly area and is surrounded by forests. The highest point in the village is the summit of Storm King Mountain, which has an elevation of 1,340 feet.
Economy
The economy of Cornwall on Hudson is largely based on tourism. The village is home to several popular attractions, including Storm King Art Center, a 500-acre outdoor sculpture park, and the Hudson Highlands State Park, which offers hiking, camping, and other outdoor activities. The village is also home to several restaurants, shops, and other businesses.
Demographics
As of the 2010 census, there were 1,420 people, 590 households, and 393 families residing in the village. The population density was 1,179.2 people per square mile. The racial makeup of the village was 94.2% White, 1.7% African American, 0.2% Native American, 1.2% Asian, 0.1% Pacific Islander, 1.2% from other races, and 1.6% from two or more races. Hispanic or Latino of any race were 4.2% of the population.
There were 590 households, out of which 28.3% had children under the age of 18 living with them, 51.9% were married couples living together, 10.2% had a female householder with no husband present, and 33.9% were non-families. 28.3% of all households were made up of individuals, and 11.9% had someone living alone who was 65 years of age or older. The average household size was 2.41 and the average family size was 2.94.
The median age in the village was 44.2 years. 22.2% of residents were under the age of 18; 6.2% were between the ages of 18 and 24; 22.2% were from 25 to 44; 33.2% were from 45 to 64; and 16.2% were 65 years of age or older. The gender makeup of the village was 48.3% male and 51.7% female.
Conclusion
Cornwall on Hudson is a village located in Orange County, New York, United States. It is situated on the west bank of the Hudson River, approximately 50 miles north of New York City. The village is part of the Town of Cornwall and is part of the Hudson Valley region. As of the 2010 census, the village had a population of 1,420. The economy of Cornwall on Hudson is largely based on tourism, and the village is home to several popular attractions, including Storm King Art Center and the Hudson Highlands State Park. The village has a diverse population, with 94.2% of residents being White, 1.7% African American, 0.2% Native American, 1.2% Asian, 0.1% Pacific Islander, 1.2% from other races, and 1.6% from two or more races.
Common Questions
What is Per Capita Income in Cornwall On Hudson?
Per Capita income in Cornwall On Hudson is $59,859.
What is the Median Family Income in Cornwall On Hudson?
Median Family Income in Cornwall On Hudson is $139,659.
What is the Median Household income in Cornwall On Hudson?
Median Household Income in Cornwall On Hudson is $117,708.
What is Income or Wage Gap in Cornwall On Hudson?
Income or Wage Gap in Cornwall On Hudson is 47.8%.
Women in Cornwall On Hudson earn 52.2 cents for every dollar earned by a man.
What is Inequality or Gini Index in Cornwall On Hudson?
Inequality or Gini Index in Cornwall On Hudson is 0.38.
What is the Total Population of Cornwall On Hudson?
Total Population of Cornwall On Hudson is 3,044.
What is the Total Male Population of Cornwall On Hudson?
Total Male Population of Cornwall On Hudson is 1,429.
What is the Total Female Population of Cornwall On Hudson?
Total Female Population of Cornwall On Hudson is 1,615.
What is the Ratio of Males per 100 Females in Cornwall On Hudson?
There are 88.48 Males per 100 Females in Cornwall On Hudson.
What is the Ratio of Females per 100 Males in Cornwall On Hudson?
There are 113.02 Females per 100 Males in Cornwall On Hudson.
What is the Median Population Age in Cornwall On Hudson?
Median Population Age in Cornwall On Hudson is 46.7 Years.
What is the Average Family Size in Cornwall On Hudson
Average Family Size in Cornwall On Hudson is 2.8 People.
What is the Average Household Size in Cornwall On Hudson
Average Household Size in Cornwall On Hudson is 2.4 People.
How Large is the Labor Force in Cornwall On Hudson?
There are 1,686 People in the Labor Forcein in Cornwall On Hudson.
What is the Percentage of People in the Labor Force in Cornwall On Hudson?
64.4% of People are in the Labor Force in Cornwall On Hudson.
What is the Unemployment Rate in Cornwall On Hudson?
Unemployment Rate in Cornwall On Hudson is 0.7%.