Garrett Park, MD Map & Demographics
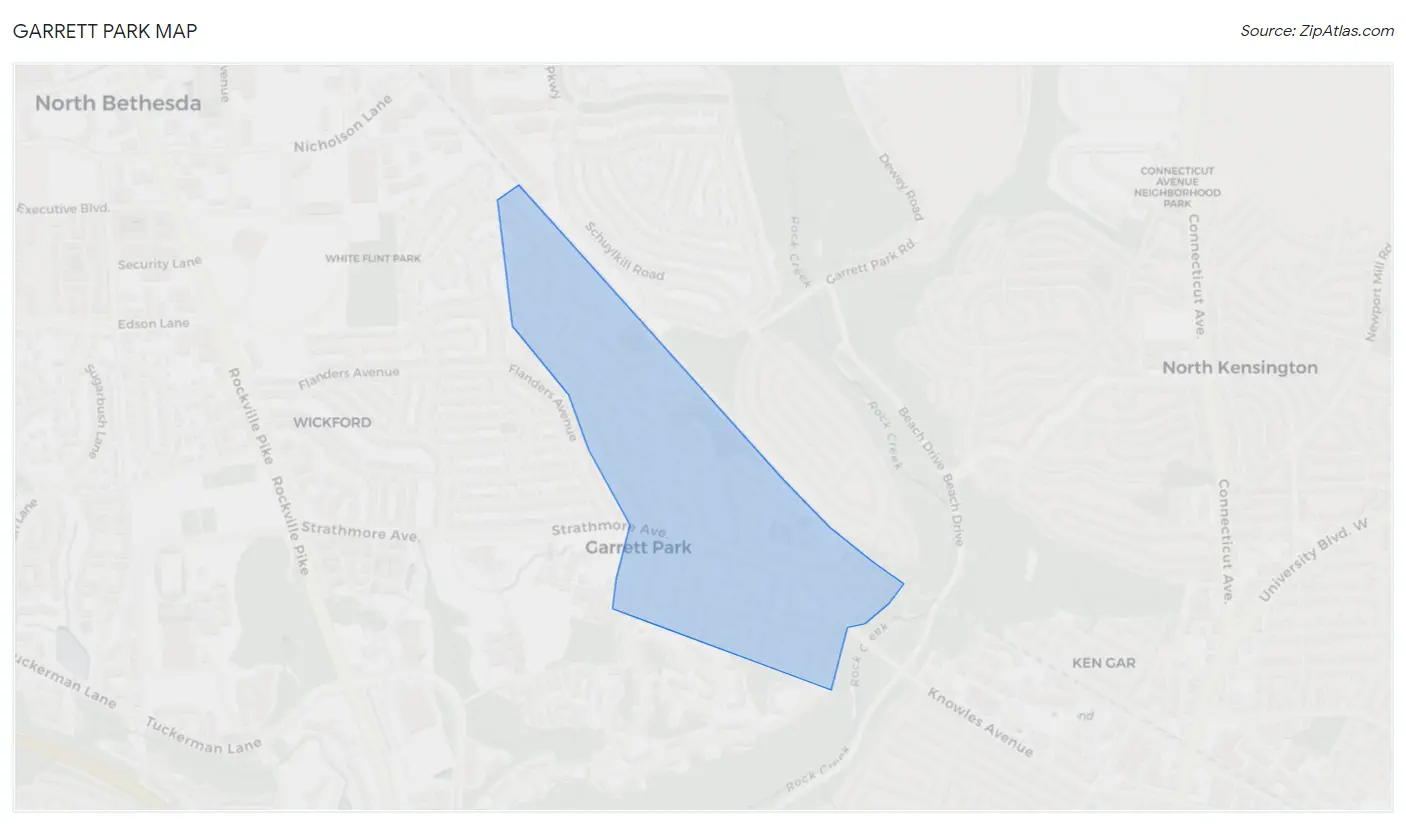
Garrett Park Map
Garrett Park Overview
$111,732
PER CAPITA INCOME
$250,001
AVG FAMILY INCOME
$250,001
AVG HOUSEHOLD INCOME
29.3%
WAGE / INCOME GAP [ % ]
70.7¢/ $1
WAGE / INCOME GAP [ $ ]
0.35
INEQUALITY / GINI INDEX
816
TOTAL POPULATION
422
MALE POPULATION
394
FEMALE POPULATION
107.11
MALES / 100 FEMALES
93.36
FEMALES / 100 MALES
52.3
MEDIAN AGE
2.9
AVG FAMILY SIZE
2.5
AVG HOUSEHOLD SIZE
427
LABOR FORCE [ PEOPLE ]
62.1%
PERCENT IN LABOR FORCE
3.3%
UNEMPLOYMENT RATE
Garrett Park Zip Codes
Garrett Park Area Codes
Income in Garrett Park
Income Overview in Garrett Park
Per Capita Income in Garrett Park is $111,732, while median incomes of families and households are $250,001 and $250,001 respectively.
| Characteristic | Number | Measure |
| Per Capita Income | 816 | $111,732 |
| Median Family Income | 247 | $250,001 |
| Mean Family Income | 247 | $302,890 |
| Median Household Income | 324 | $250,001 |
| Mean Household Income | 324 | $275,936 |
| Income Deficit | 247 | $0 |
| Wage / Income Gap (%) | 816 | 29.33% |
| Wage / Income Gap ($) | 816 | 70.67¢ per $1 |
| Gini / Inequality Index | 816 | 0.35 |
Earnings by Sex in Garrett Park
Average Earnings in Garrett Park are $101,667, $130,000 for men and $91,875 for women, a difference of 29.3%.
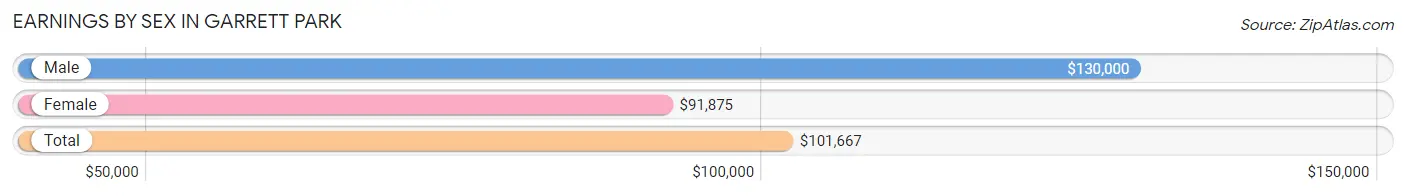
| Sex | Number | Average Earnings |
| Male | 262 (55.3%) | $130,000 |
| Female | 212 (44.7%) | $91,875 |
| Total | 474 (100.0%) | $101,667 |
Earnings by Sex by Income Bracket in Garrett Park
The most common earnings brackets in Garrett Park are $100,000+ for men (143 | 54.6%) and $100,000+ for women (102 | 48.1%).
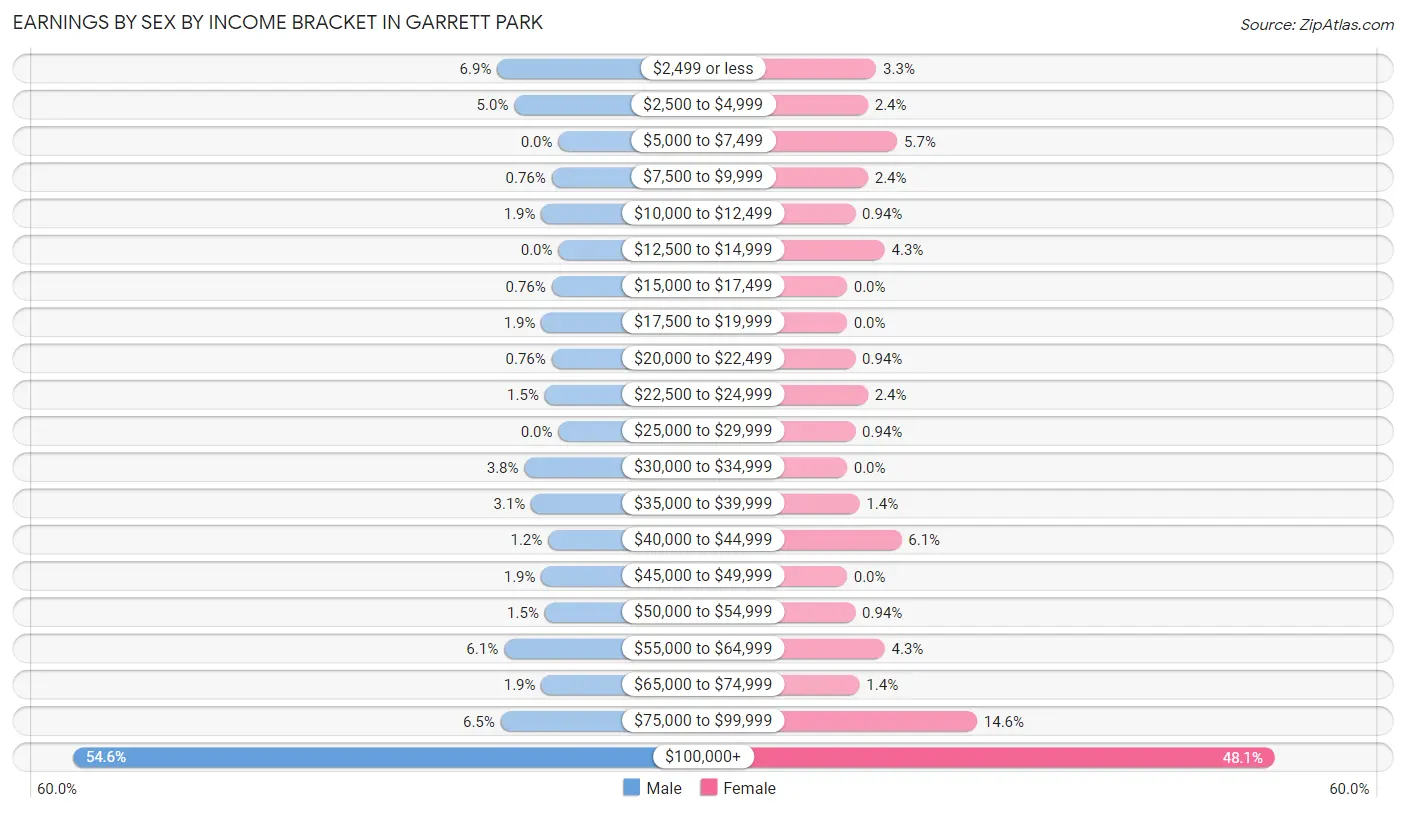
| Income | Male | Female |
| $2,499 or less | 18 (6.9%) | 7 (3.3%) |
| $2,500 to $4,999 | 13 (5.0%) | 5 (2.4%) |
| $5,000 to $7,499 | 0 (0.0%) | 12 (5.7%) |
| $7,500 to $9,999 | 2 (0.8%) | 5 (2.4%) |
| $10,000 to $12,499 | 5 (1.9%) | 2 (0.9%) |
| $12,500 to $14,999 | 0 (0.0%) | 9 (4.3%) |
| $15,000 to $17,499 | 2 (0.8%) | 0 (0.0%) |
| $17,500 to $19,999 | 5 (1.9%) | 0 (0.0%) |
| $20,000 to $22,499 | 2 (0.8%) | 2 (0.9%) |
| $22,500 to $24,999 | 4 (1.5%) | 5 (2.4%) |
| $25,000 to $29,999 | 0 (0.0%) | 2 (0.9%) |
| $30,000 to $34,999 | 10 (3.8%) | 0 (0.0%) |
| $35,000 to $39,999 | 8 (3.0%) | 3 (1.4%) |
| $40,000 to $44,999 | 3 (1.1%) | 13 (6.1%) |
| $45,000 to $49,999 | 5 (1.9%) | 0 (0.0%) |
| $50,000 to $54,999 | 4 (1.5%) | 2 (0.9%) |
| $55,000 to $64,999 | 16 (6.1%) | 9 (4.3%) |
| $65,000 to $74,999 | 5 (1.9%) | 3 (1.4%) |
| $75,000 to $99,999 | 17 (6.5%) | 31 (14.6%) |
| $100,000+ | 143 (54.6%) | 102 (48.1%) |
| Total | 262 (100.0%) | 212 (100.0%) |
Earnings by Sex by Educational Attainment in Garrett Park
Average earnings in Garrett Park are $160,875 for men and $101,250 for women, a difference of 37.1%. Men with an educational attainment of graduate degree enjoy the highest average annual earnings of $185,625, while those with college or associate's degree education earn the least with $34,875. Women with an educational attainment of graduate degree earn the most with the average annual earnings of $124,750, while those with college or associate's degree education have the smallest earnings of $55,000.
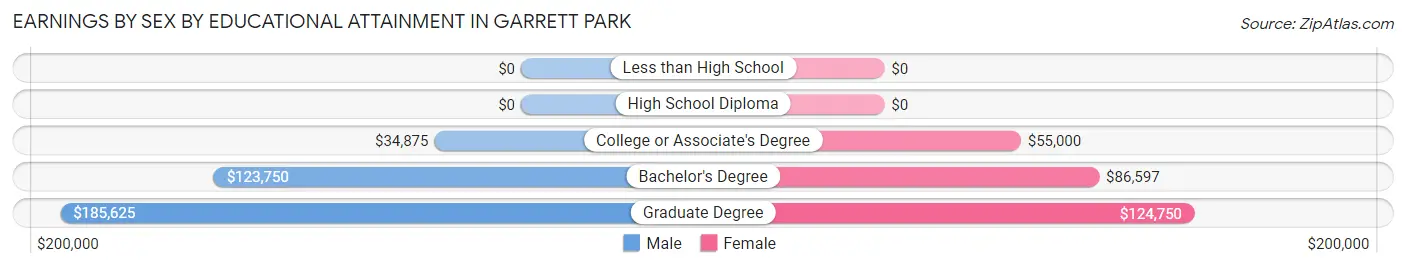
| Educational Attainment | Male Income | Female Income |
| Less than High School | - | - |
| High School Diploma | - | - |
| College or Associate's Degree | $34,875 | $55,000 |
| Bachelor's Degree | $123,750 | $86,597 |
| Graduate Degree | $185,625 | $124,750 |
| Total | $160,875 | $101,250 |
Family Income in Garrett Park
Family Income Brackets in Garrett Park
According to the Garrett Park family income data, there are 167 families falling into the $200,000+ income range, which is the most common income bracket and makes up 67.6% of all families.
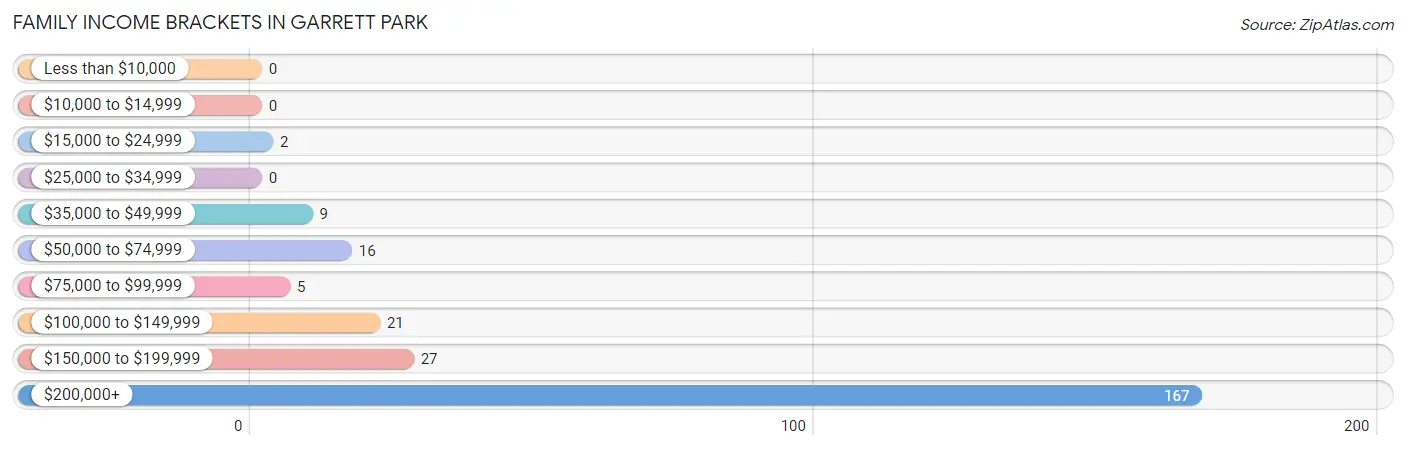
| Income Bracket | # Families | % Families |
| Less than $10,000 | 0 | 0.0% |
| $10,000 to $14,999 | 0 | 0.0% |
| $15,000 to $24,999 | 2 | 0.8% |
| $25,000 to $34,999 | 0 | 0.0% |
| $35,000 to $49,999 | 9 | 3.6% |
| $50,000 to $74,999 | 16 | 6.5% |
| $75,000 to $99,999 | 5 | 2.0% |
| $100,000 to $149,999 | 21 | 8.5% |
| $150,000 to $199,999 | 27 | 10.9% |
| $200,000+ | 167 | 67.6% |
Family Income by Famaliy Size in Garrett Park
3-person families (62 | 25.1%) account for the highest median family income in Garrett Park with $250,001 per family, while 2-person families (127 | 51.4%) have the highest median income of $108,438 per family member.
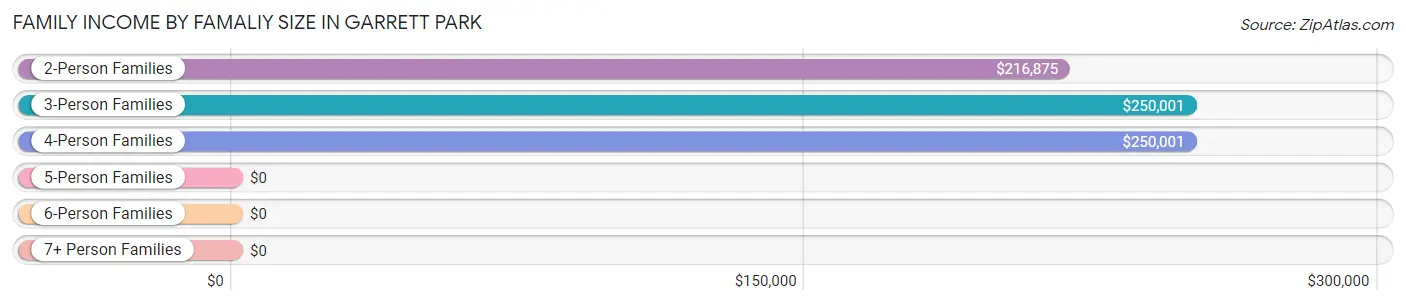
| Income Bracket | # Families | Median Income |
| 2-Person Families | 127 (51.4%) | $216,875 |
| 3-Person Families | 62 (25.1%) | $250,001 |
| 4-Person Families | 52 (21.0%) | $250,001 |
| 5-Person Families | 3 (1.2%) | $0 |
| 6-Person Families | 3 (1.2%) | $0 |
| 7+ Person Families | 0 (0.0%) | $0 |
| Total | 247 (100.0%) | $250,001 |
Family Income by Number of Earners in Garrett Park
The median family income in Garrett Park is $250,001, with families comprising 2 earners (108) having the highest median family income of $250,001, while families with no earners (32) have the lowest median family income of $163,750, accounting for 43.7% and 13.0% of families, respectively.
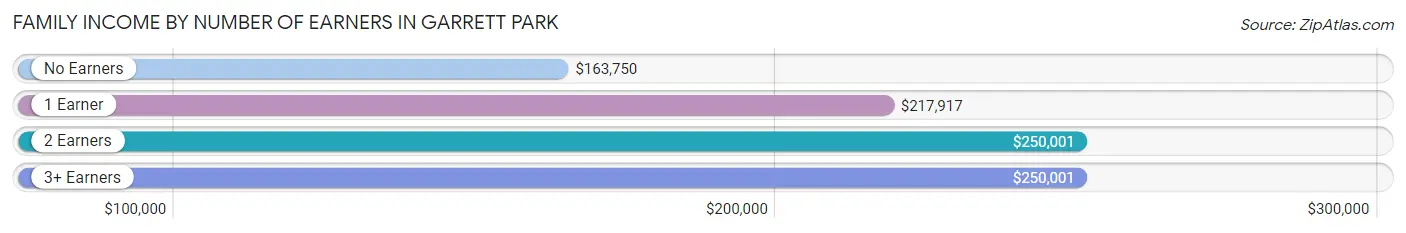
| Number of Earners | # Families | Median Income |
| No Earners | 32 (13.0%) | $163,750 |
| 1 Earner | 75 (30.4%) | $217,917 |
| 2 Earners | 108 (43.7%) | $250,001 |
| 3+ Earners | 32 (13.0%) | $250,001 |
| Total | 247 (100.0%) | $250,001 |
Household Income in Garrett Park
Household Income Brackets in Garrett Park
With 200 households falling in the category, the $200,000+ income range is the most frequent in Garrett Park, accounting for 61.7% of all households.
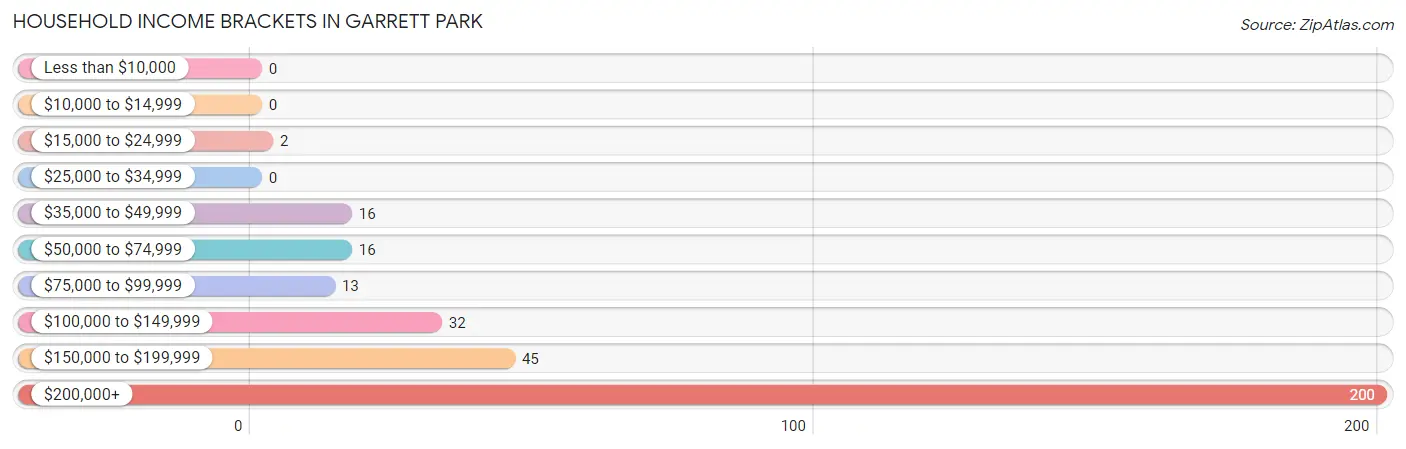
| Income Bracket | # Households | % Households |
| Less than $10,000 | 0 | 0.0% |
| $10,000 to $14,999 | 0 | 0.0% |
| $15,000 to $24,999 | 2 | 0.6% |
| $25,000 to $34,999 | 0 | 0.0% |
| $35,000 to $49,999 | 16 | 4.9% |
| $50,000 to $74,999 | 16 | 4.9% |
| $75,000 to $99,999 | 13 | 4.0% |
| $100,000 to $149,999 | 32 | 9.9% |
| $150,000 to $199,999 | 45 | 13.9% |
| $200,000+ | 200 | 61.7% |
Household Income by Householder Age in Garrett Park
The median household income in Garrett Park is $250,001, with the highest median household income of $250,001 found in the 25 to 44 years age bracket for the primary householder. A total of 61 households (18.8%) fall into this category.
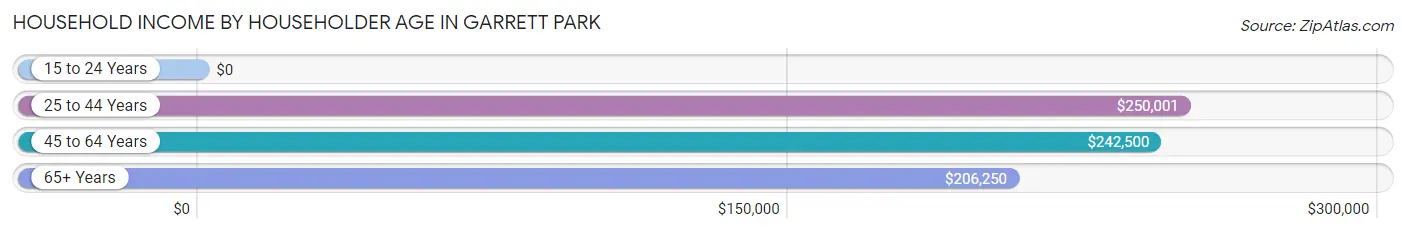
| Income Bracket | # Households | Median Income |
| 15 to 24 Years | 0 (0.0%) | $0 |
| 25 to 44 Years | 61 (18.8%) | $250,001 |
| 45 to 64 Years | 140 (43.2%) | $242,500 |
| 65+ Years | 123 (38.0%) | $206,250 |
| Total | 324 (100.0%) | $250,001 |
Poverty in Garrett Park
Income Below Poverty by Sex and Age in Garrett Park
With 1.2% poverty level for males and 0.8% for females among the residents of Garrett Park, 15 year old males and 75 year old and over females are the most vulnerable to poverty, with 3 males (37.5%) and 3 females (6.8%) in their respective age groups living below the poverty level.
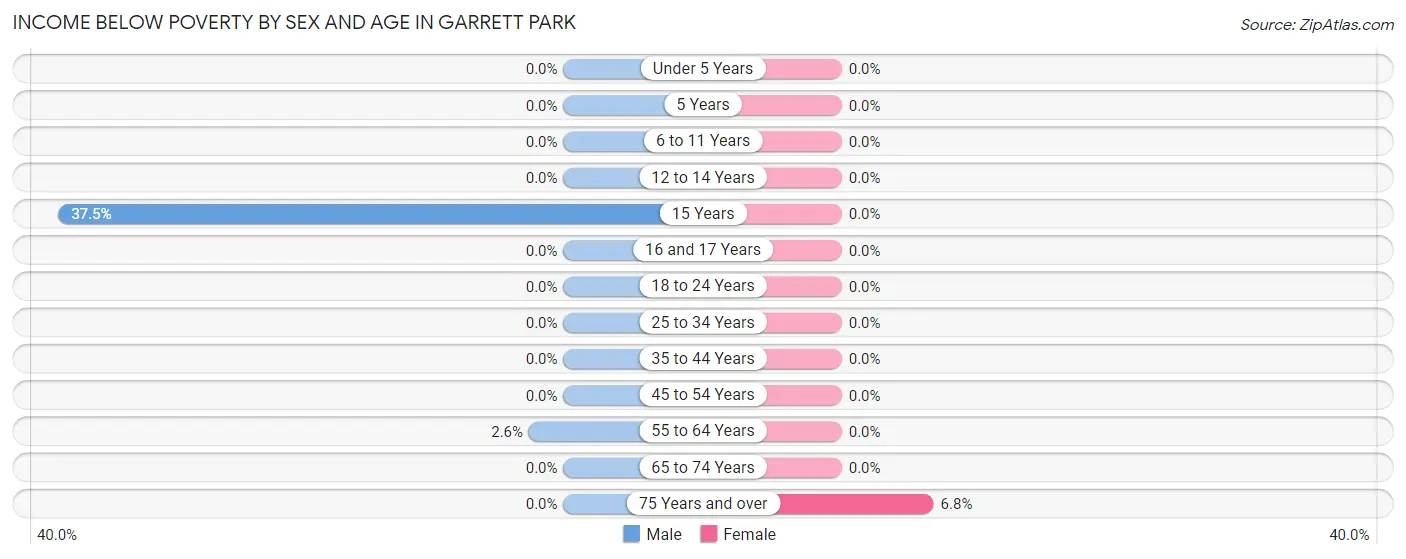
| Age Bracket | Male | Female |
| Under 5 Years | 0 (0.0%) | 0 (0.0%) |
| 5 Years | 0 (0.0%) | 0 (0.0%) |
| 6 to 11 Years | 0 (0.0%) | 0 (0.0%) |
| 12 to 14 Years | 0 (0.0%) | 0 (0.0%) |
| 15 Years | 3 (37.5%) | 0 (0.0%) |
| 16 and 17 Years | 0 (0.0%) | 0 (0.0%) |
| 18 to 24 Years | 0 (0.0%) | 0 (0.0%) |
| 25 to 34 Years | 0 (0.0%) | 0 (0.0%) |
| 35 to 44 Years | 0 (0.0%) | 0 (0.0%) |
| 45 to 54 Years | 0 (0.0%) | 0 (0.0%) |
| 55 to 64 Years | 2 (2.6%) | 0 (0.0%) |
| 65 to 74 Years | 0 (0.0%) | 0 (0.0%) |
| 75 Years and over | 0 (0.0%) | 3 (6.8%) |
| Total | 5 (1.2%) | 3 (0.8%) |
Income Above Poverty by Sex and Age in Garrett Park
According to the poverty statistics in Garrett Park, males aged under 5 years and females aged under 5 years are the age groups that are most secure financially, with 100.0% of males and 100.0% of females in these age groups living above the poverty line.
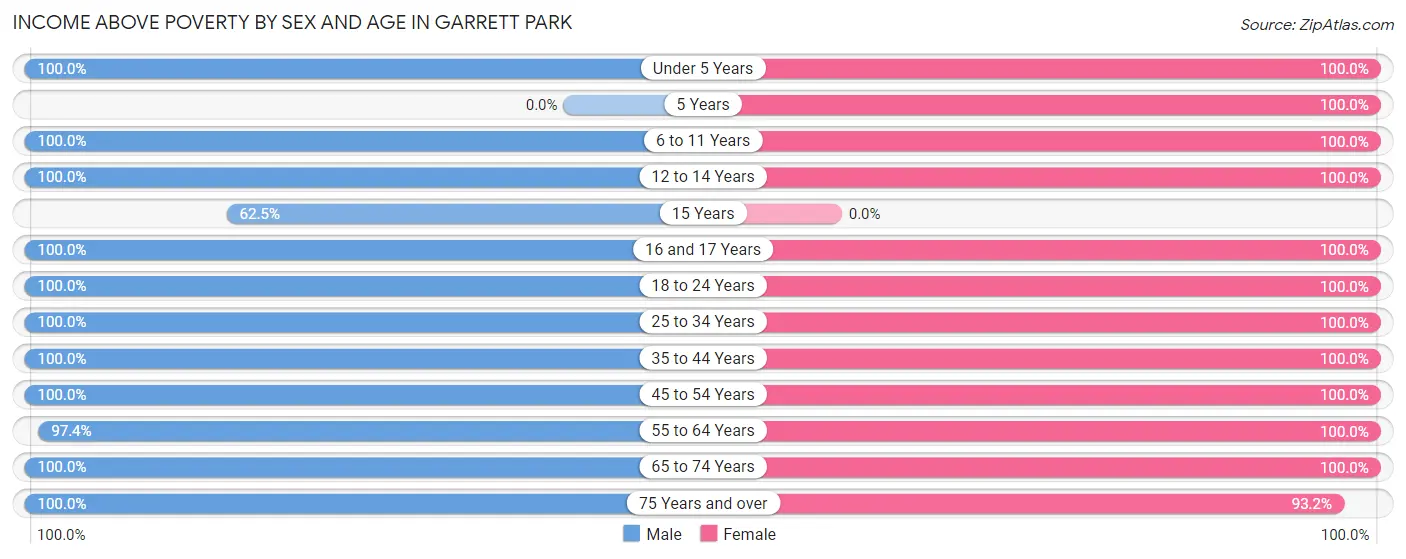
| Age Bracket | Male | Female |
| Under 5 Years | 12 (100.0%) | 23 (100.0%) |
| 5 Years | 0 (0.0%) | 7 (100.0%) |
| 6 to 11 Years | 29 (100.0%) | 26 (100.0%) |
| 12 to 14 Years | 16 (100.0%) | 7 (100.0%) |
| 15 Years | 5 (62.5%) | 0 (0.0%) |
| 16 and 17 Years | 11 (100.0%) | 10 (100.0%) |
| 18 to 24 Years | 61 (100.0%) | 16 (100.0%) |
| 25 to 34 Years | 22 (100.0%) | 7 (100.0%) |
| 35 to 44 Years | 51 (100.0%) | 56 (100.0%) |
| 45 to 54 Years | 32 (100.0%) | 56 (100.0%) |
| 55 to 64 Years | 76 (97.4%) | 75 (100.0%) |
| 65 to 74 Years | 56 (100.0%) | 67 (100.0%) |
| 75 Years and over | 46 (100.0%) | 41 (93.2%) |
| Total | 417 (98.8%) | 391 (99.2%) |
Income Below Poverty Among Married-Couple Families in Garrett Park
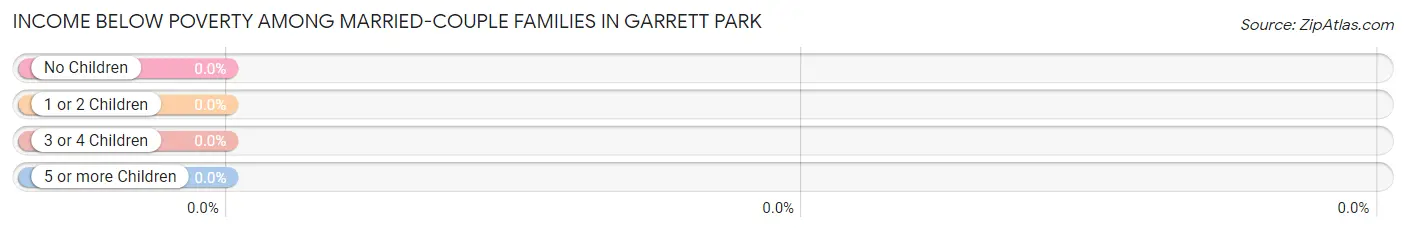
| Children | Above Poverty | Below Poverty |
| No Children | 134 (100.0%) | 0 (0.0%) |
| 1 or 2 Children | 71 (100.0%) | 0 (0.0%) |
| 3 or 4 Children | 2 (100.0%) | 0 (0.0%) |
| 5 or more Children | 0 (0.0%) | 0 (0.0%) |
| Total | 207 (100.0%) | 0 (0.0%) |
Income Below Poverty Among Single-Parent Households in Garrett Park
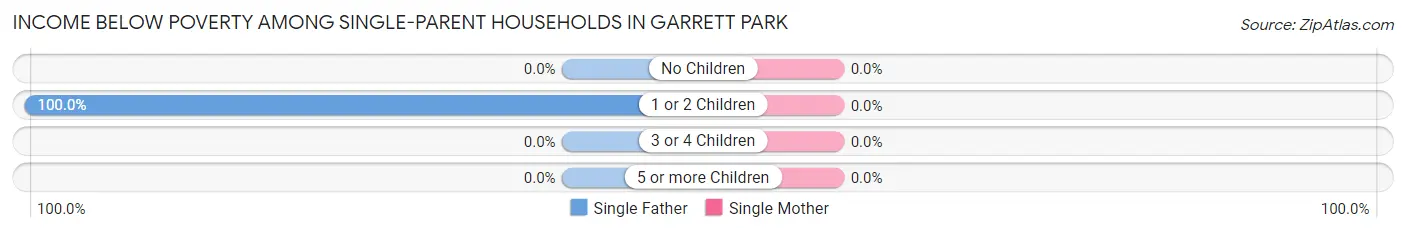
| Children | Single Father | Single Mother |
| No Children | 0 (0.0%) | 0 (0.0%) |
| 1 or 2 Children | 2 (100.0%) | 0 (0.0%) |
| 3 or 4 Children | 0 (0.0%) | 0 (0.0%) |
| 5 or more Children | 0 (0.0%) | 0 (0.0%) |
| Total | 2 (28.6%) | 0 (0.0%) |
Income Below Poverty Among Married-Couple vs Single-Parent Households in Garrett Park
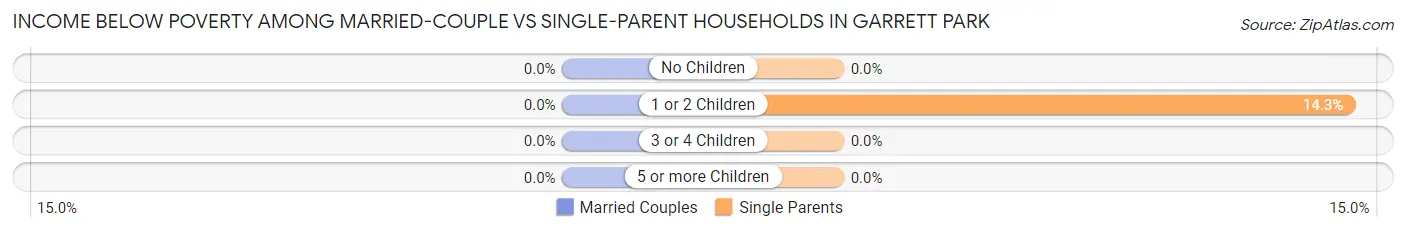
| Children | Married-Couple Families | Single-Parent Households |
| No Children | 0 (0.0%) | 0 (0.0%) |
| 1 or 2 Children | 0 (0.0%) | 2 (14.3%) |
| 3 or 4 Children | 0 (0.0%) | 0 (0.0%) |
| 5 or more Children | 0 (0.0%) | 0 (0.0%) |
| Total | 0 (0.0%) | 2 (5.0%) |
Race in Garrett Park
The most populous races in Garrett Park are White / Caucasian (696 | 85.3%), Two or more Races (70 | 8.6%), and Hispanic or Latino (58 | 7.1%).
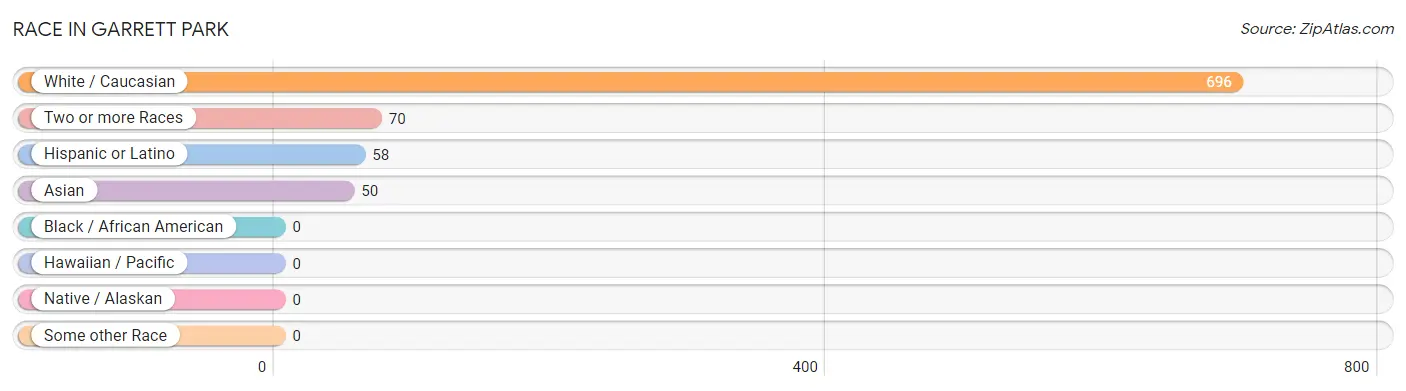
| Race | # Population | % Population |
| Asian | 50 | 6.1% |
| Black / African American | 0 | 0.0% |
| Hawaiian / Pacific | 0 | 0.0% |
| Hispanic or Latino | 58 | 7.1% |
| Native / Alaskan | 0 | 0.0% |
| White / Caucasian | 696 | 85.3% |
| Two or more Races | 70 | 8.6% |
| Some other Race | 0 | 0.0% |
| Total | 816 | 100.0% |
Ancestry in Garrett Park
The most populous ancestries reported in Garrett Park are Irish (141 | 17.3%), English (113 | 13.9%), German (103 | 12.6%), Polish (56 | 6.9%), and Russian (50 | 6.1%), together accounting for 56.7% of all Garrett Park residents.
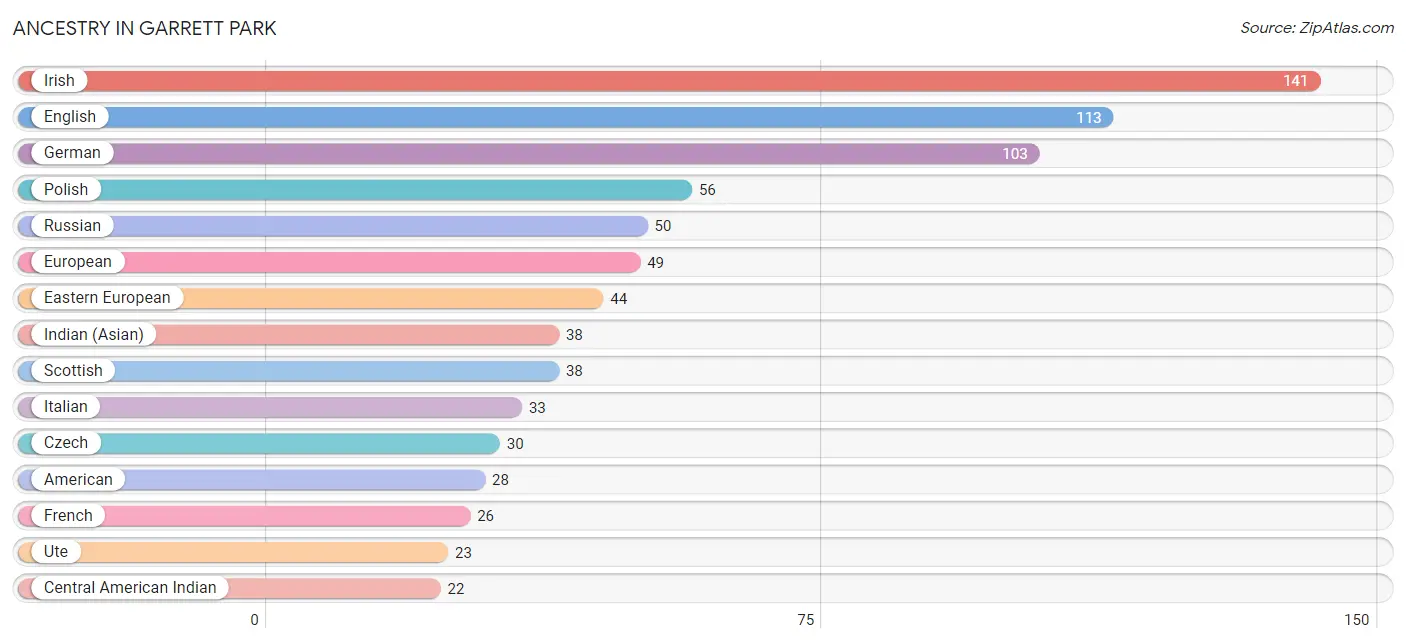
| Ancestry | # Population | % Population |
| American | 28 | 3.4% |
| Arab | 3 | 0.4% |
| Argentinean | 2 | 0.3% |
| Austrian | 11 | 1.3% |
| Belgian | 4 | 0.5% |
| Bhutanese | 1 | 0.1% |
| British | 6 | 0.7% |
| Cajun | 2 | 0.3% |
| Central American Indian | 22 | 2.7% |
| Colombian | 7 | 0.9% |
| Czech | 30 | 3.7% |
| Danish | 2 | 0.3% |
| Dominican | 22 | 2.7% |
| Dutch | 9 | 1.1% |
| Eastern European | 44 | 5.4% |
| English | 113 | 13.9% |
| European | 49 | 6.0% |
| Finnish | 5 | 0.6% |
| French | 26 | 3.2% |
| German | 103 | 12.6% |
| Hungarian | 9 | 1.1% |
| Indian (Asian) | 38 | 4.7% |
| Iranian | 4 | 0.5% |
| Irish | 141 | 17.3% |
| Israeli | 3 | 0.4% |
| Italian | 33 | 4.0% |
| Lebanese | 1 | 0.1% |
| Mexican | 7 | 0.9% |
| Northern European | 3 | 0.4% |
| Norwegian | 15 | 1.8% |
| Polish | 56 | 6.9% |
| Portuguese | 2 | 0.3% |
| Puerto Rican | 10 | 1.2% |
| Russian | 50 | 6.1% |
| Scotch-Irish | 12 | 1.5% |
| Scottish | 38 | 4.7% |
| Slovak | 4 | 0.5% |
| South American | 9 | 1.1% |
| Spaniard | 10 | 1.2% |
| Sri Lankan | 8 | 1.0% |
| Swedish | 15 | 1.8% |
| Swiss | 3 | 0.4% |
| Syrian | 2 | 0.3% |
| Thai | 14 | 1.7% |
| Ukrainian | 9 | 1.1% |
| Ute | 23 | 2.8% |
| Welsh | 5 | 0.6% | View All 47 Rows |
Immigrants in Garrett Park
The most numerous immigrant groups reported in Garrett Park came from Asia (32 | 3.9%), Eastern Asia (19 | 2.3%), China (18 | 2.2%), Europe (18 | 2.2%), and Latin America (14 | 1.7%), together accounting for 12.4% of all Garrett Park residents.
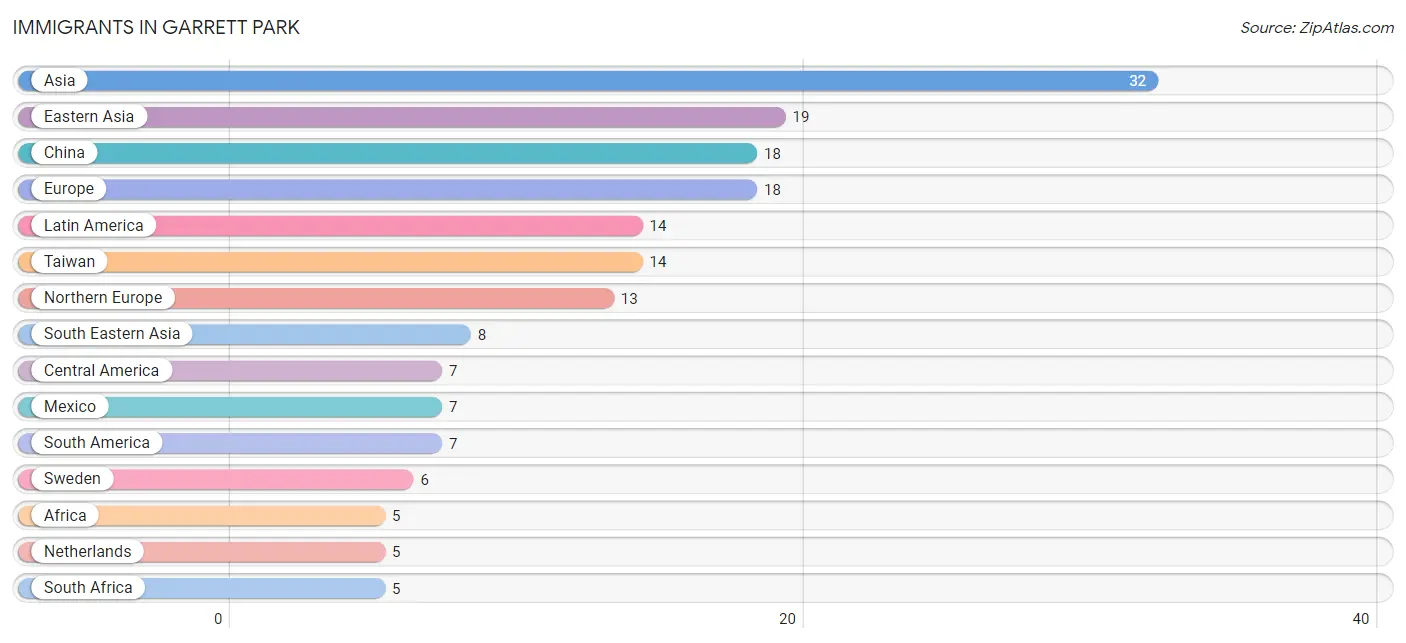
| Immigration Origin | # Population | % Population |
| Africa | 5 | 0.6% |
| Asia | 32 | 3.9% |
| Cambodia | 3 | 0.4% |
| Canada | 2 | 0.3% |
| Central America | 7 | 0.9% |
| China | 18 | 2.2% |
| Colombia | 3 | 0.4% |
| Eastern Asia | 19 | 2.3% |
| England | 4 | 0.5% |
| Europe | 18 | 2.2% |
| Iran | 2 | 0.3% |
| Israel | 3 | 0.4% |
| Japan | 1 | 0.1% |
| Latin America | 14 | 1.7% |
| Mexico | 7 | 0.9% |
| Netherlands | 5 | 0.6% |
| Northern Europe | 13 | 1.6% |
| Scotland | 1 | 0.1% |
| South Africa | 5 | 0.6% |
| South America | 7 | 0.9% |
| South Central Asia | 2 | 0.3% |
| South Eastern Asia | 8 | 1.0% |
| Sweden | 6 | 0.7% |
| Taiwan | 14 | 1.7% |
| Vietnam | 5 | 0.6% |
| Western Asia | 3 | 0.4% |
| Western Europe | 5 | 0.6% | View All 27 Rows |
Sex and Age in Garrett Park
Sex and Age in Garrett Park
The most populous age groups in Garrett Park are 20 to 24 Years (51 | 12.1%) for men and 55 to 59 Years (45 | 11.4%) for women.
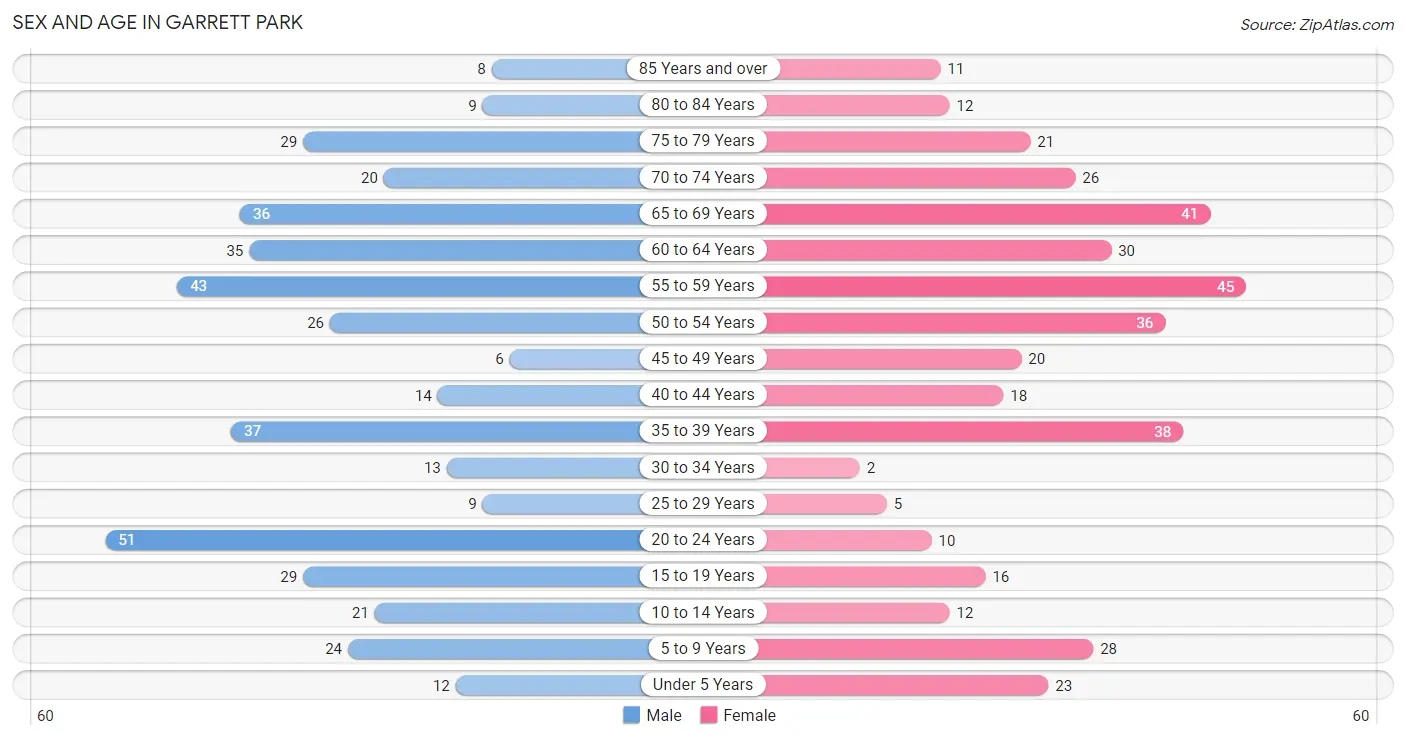
| Age Bracket | Male | Female |
| Under 5 Years | 12 (2.8%) | 23 (5.8%) |
| 5 to 9 Years | 24 (5.7%) | 28 (7.1%) |
| 10 to 14 Years | 21 (5.0%) | 12 (3.0%) |
| 15 to 19 Years | 29 (6.9%) | 16 (4.1%) |
| 20 to 24 Years | 51 (12.1%) | 10 (2.5%) |
| 25 to 29 Years | 9 (2.1%) | 5 (1.3%) |
| 30 to 34 Years | 13 (3.1%) | 2 (0.5%) |
| 35 to 39 Years | 37 (8.8%) | 38 (9.6%) |
| 40 to 44 Years | 14 (3.3%) | 18 (4.6%) |
| 45 to 49 Years | 6 (1.4%) | 20 (5.1%) |
| 50 to 54 Years | 26 (6.2%) | 36 (9.1%) |
| 55 to 59 Years | 43 (10.2%) | 45 (11.4%) |
| 60 to 64 Years | 35 (8.3%) | 30 (7.6%) |
| 65 to 69 Years | 36 (8.5%) | 41 (10.4%) |
| 70 to 74 Years | 20 (4.7%) | 26 (6.6%) |
| 75 to 79 Years | 29 (6.9%) | 21 (5.3%) |
| 80 to 84 Years | 9 (2.1%) | 12 (3.0%) |
| 85 Years and over | 8 (1.9%) | 11 (2.8%) |
| Total | 422 (100.0%) | 394 (100.0%) |
Families and Households in Garrett Park
Median Family Size in Garrett Park
The median family size in Garrett Park is 2.87 persons per family, with married-couple families (207 | 83.8%) accounting for the largest median family size of 2.91 persons per family. On the other hand, single male/father families (7 | 2.8%) represent the smallest median family size with 2.29 persons per family.
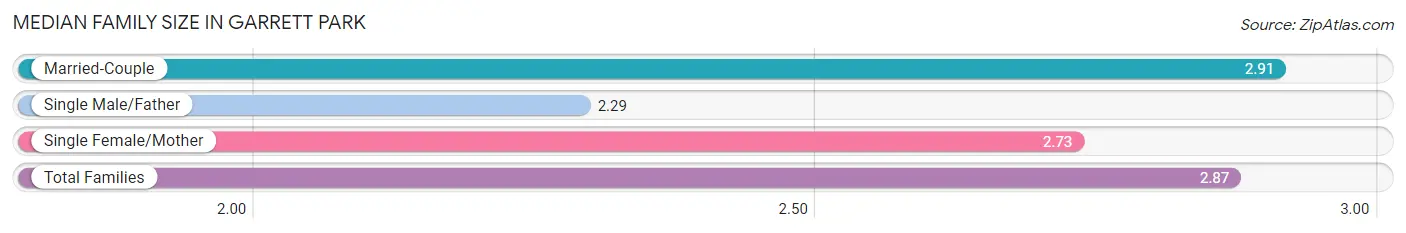
| Family Type | # Families | Family Size |
| Married-Couple | 207 (83.8%) | 2.91 |
| Single Male/Father | 7 (2.8%) | 2.29 |
| Single Female/Mother | 33 (13.4%) | 2.73 |
| Total Families | 247 (100.0%) | 2.87 |
Median Household Size in Garrett Park
The median household size in Garrett Park is 2.52 persons per household, with married-couple households (207 | 63.9%) accounting for the largest median household size of 2.94 persons per household. non-family households (77 | 23.8%) represent the smallest median household size with 1.27 persons per household.
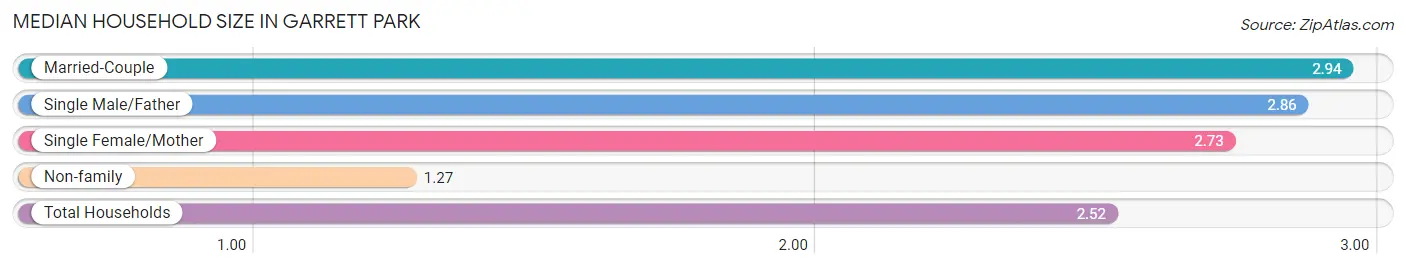
| Household Type | # Households | Household Size |
| Married-Couple | 207 (63.9%) | 2.94 |
| Single Male/Father | 7 (2.2%) | 2.86 |
| Single Female/Mother | 33 (10.2%) | 2.73 |
| Non-family | 77 (23.8%) | 1.27 |
| Total Households | 324 (100.0%) | 2.52 |
Household Size by Marriage Status in Garrett Park
Out of a total of 324 households in Garrett Park, 247 (76.2%) are family households, while 77 (23.8%) are nonfamily households. The most numerous type of family households are 2-person households, comprising 122, and the most common type of nonfamily households are 1-person households, comprising 53.
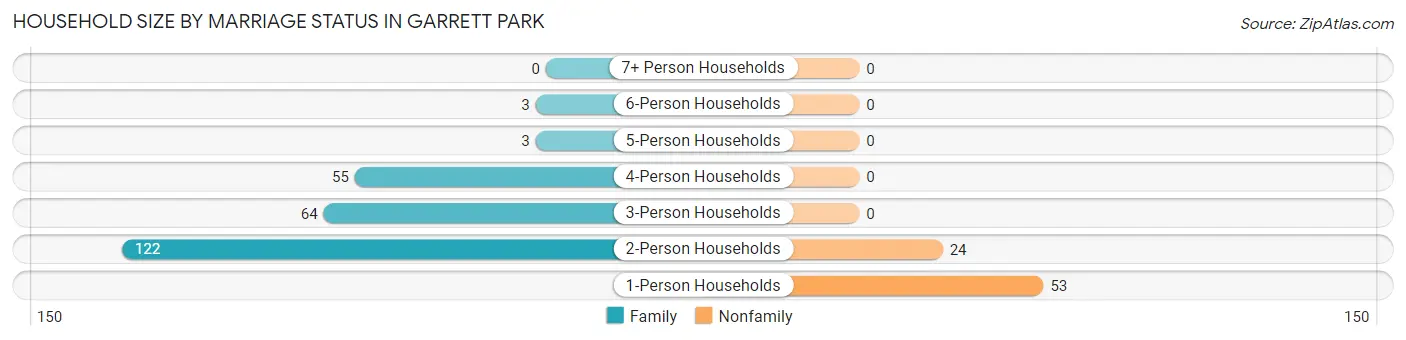
| Household Size | Family Households | Nonfamily Households |
| 1-Person Households | - | 53 (16.4%) |
| 2-Person Households | 122 (37.7%) | 24 (7.4%) |
| 3-Person Households | 64 (19.8%) | 0 (0.0%) |
| 4-Person Households | 55 (17.0%) | 0 (0.0%) |
| 5-Person Households | 3 (0.9%) | 0 (0.0%) |
| 6-Person Households | 3 (0.9%) | 0 (0.0%) |
| 7+ Person Households | 0 (0.0%) | 0 (0.0%) |
| Total | 247 (76.2%) | 77 (23.8%) |
Female Fertility in Garrett Park
Fertility by Age in Garrett Park
Average fertility rate in Garrett Park is 116.0 births per 1,000 women. Women in the age bracket of 35 to 50 years have the highest fertility rate with 165.0 births per 1,000 women. Women in the age bracket of 35 to 50 years acount for 100.0% of all women with births.
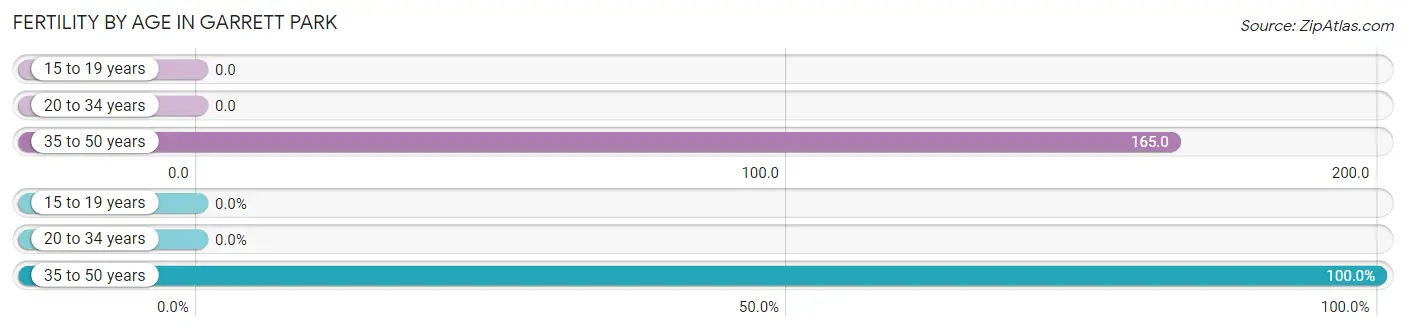
| Age Bracket | Women with Births | Births / 1,000 Women |
| 15 to 19 years | 0 (0.0%) | 0.0 |
| 20 to 34 years | 0 (0.0%) | 0.0 |
| 35 to 50 years | 13 (100.0%) | 165.0 |
| Total | 13 (100.0%) | 116.0 |
Fertility by Age by Marriage Status in Garrett Park
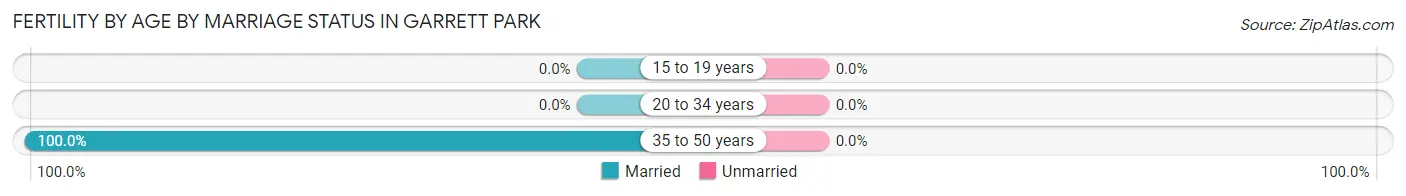
| Age Bracket | Married | Unmarried |
| 15 to 19 years | 0 (0.0%) | 0 (0.0%) |
| 20 to 34 years | 0 (0.0%) | 0 (0.0%) |
| 35 to 50 years | 13 (100.0%) | 0 (0.0%) |
| Total | 13 (100.0%) | 0 (0.0%) |
Fertility by Education in Garrett Park
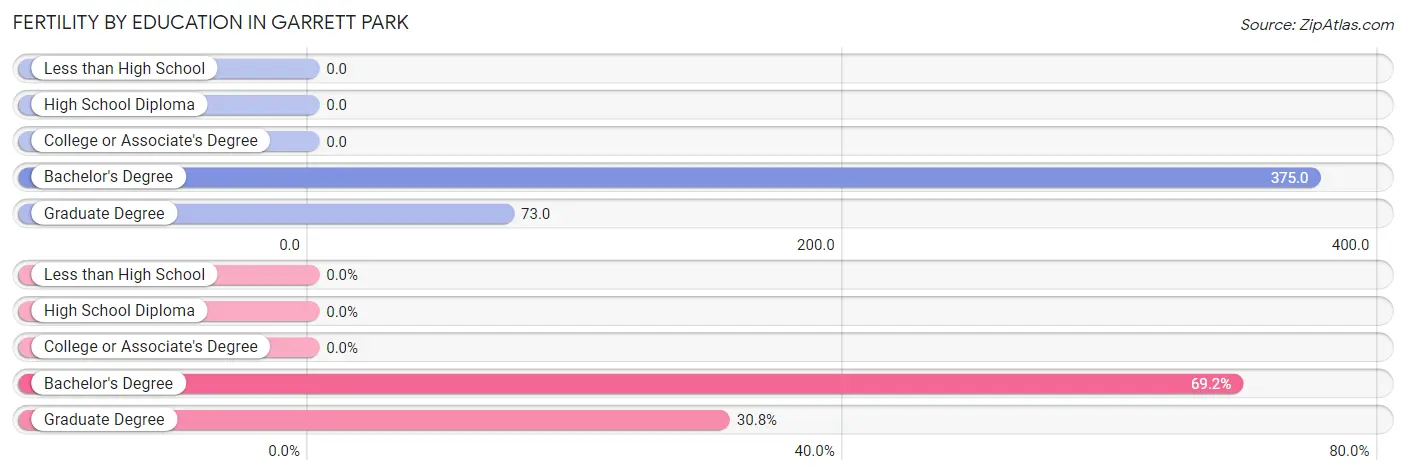
| Educational Attainment | Women with Births | Births / 1,000 Women |
| Less than High School | 0 (0.0%) | 0.0 |
| High School Diploma | 0 (0.0%) | 0.0 |
| College or Associate's Degree | 0 (0.0%) | 0.0 |
| Bachelor's Degree | 9 (69.2%) | 375.0 |
| Graduate Degree | 4 (30.8%) | 73.0 |
| Total | 13 (100.0%) | 116.0 |
Fertility by Education by Marriage Status in Garrett Park
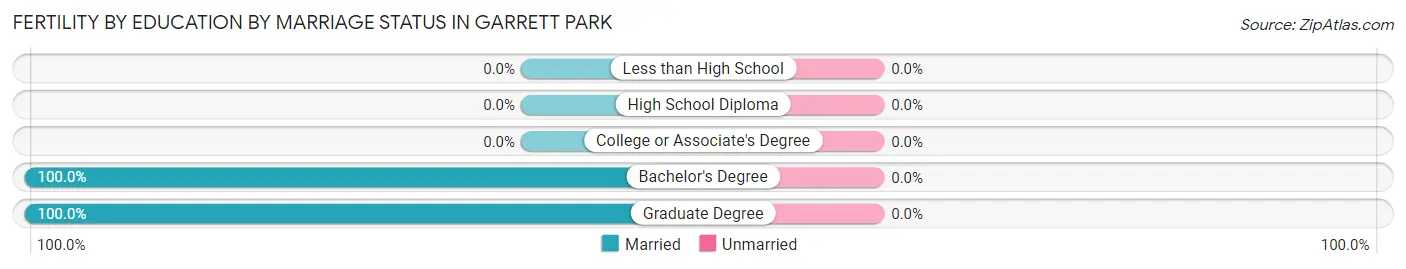
| Educational Attainment | Married | Unmarried |
| Less than High School | 0 (0.0%) | 0 (0.0%) |
| High School Diploma | 0 (0.0%) | 0 (0.0%) |
| College or Associate's Degree | 0 (0.0%) | 0 (0.0%) |
| Bachelor's Degree | 9 (100.0%) | 0 (0.0%) |
| Graduate Degree | 4 (100.0%) | 0 (0.0%) |
| Total | 13 (100.0%) | 0 (0.0%) |
Employment Characteristics in Garrett Park
Employment by Class of Employer in Garrett Park
Among the 404 employed individuals in Garrett Park, private company employees (197 | 48.8%), not-for-profit organizations (78 | 19.3%), and federal government employees (66 | 16.3%) make up the most common classes of employment.
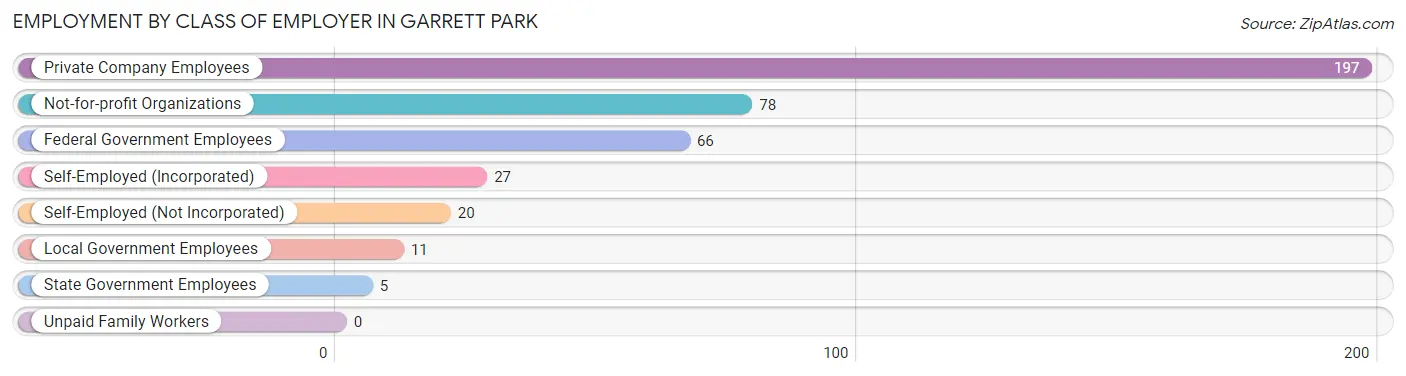
| Employer Class | # Employees | % Employees |
| Private Company Employees | 197 | 48.8% |
| Self-Employed (Incorporated) | 27 | 6.7% |
| Self-Employed (Not Incorporated) | 20 | 5.0% |
| Not-for-profit Organizations | 78 | 19.3% |
| Local Government Employees | 11 | 2.7% |
| State Government Employees | 5 | 1.2% |
| Federal Government Employees | 66 | 16.3% |
| Unpaid Family Workers | 0 | 0.0% |
| Total | 404 | 100.0% |
Employment Status by Age in Garrett Park
According to the labor force statistics for Garrett Park, out of the total population over 16 years of age (688), 62.1% or 427 individuals are in the labor force, with 3.3% or 14 of them unemployed. The age group with the highest labor force participation rate is 25 to 29 years, with 100.0% or 14 individuals in the labor force. Within the labor force, the 60 to 64 years age range has the highest percentage of unemployed individuals, with 25.0% or 12 of them being unemployed.
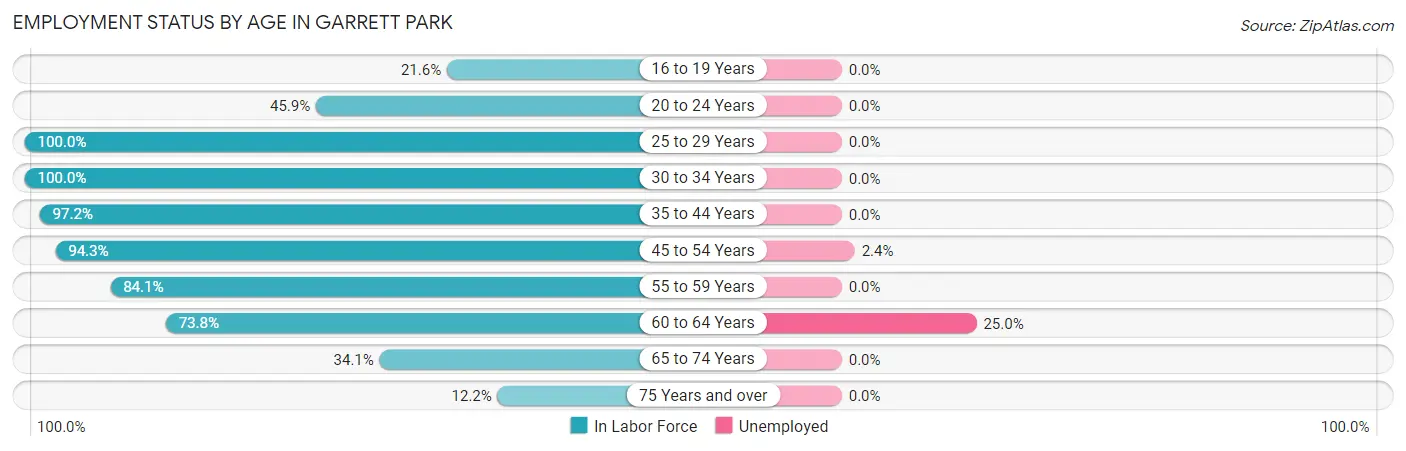
| Age Bracket | In Labor Force | Unemployed |
| 16 to 19 Years | 8 (21.6%) | 0 (0.0%) |
| 20 to 24 Years | 28 (45.9%) | 0 (0.0%) |
| 25 to 29 Years | 14 (100.0%) | 0 (0.0%) |
| 30 to 34 Years | 15 (100.0%) | 0 (0.0%) |
| 35 to 44 Years | 104 (97.2%) | 0 (0.0%) |
| 45 to 54 Years | 83 (94.3%) | 2 (2.4%) |
| 55 to 59 Years | 74 (84.1%) | 0 (0.0%) |
| 60 to 64 Years | 48 (73.8%) | 12 (25.0%) |
| 65 to 74 Years | 42 (34.1%) | 0 (0.0%) |
| 75 Years and over | 11 (12.2%) | 0 (0.0%) |
| Total | 427 (62.1%) | 14 (3.3%) |
Employment Status by Educational Attainment in Garrett Park
According to labor force statistics for Garrett Park, 89.7% of individuals (338) out of the total population between 25 and 64 years of age (377) are in the labor force, with 4.1% or 14 of them being unemployed. The group with the highest labor force participation rate are those with the educational attainment of college / associate degree, with 97.3% or 36 individuals in the labor force. Within the labor force, individuals with college / associate degree education have the highest percentage of unemployment, with 27.8% or 10 of them being unemployed.
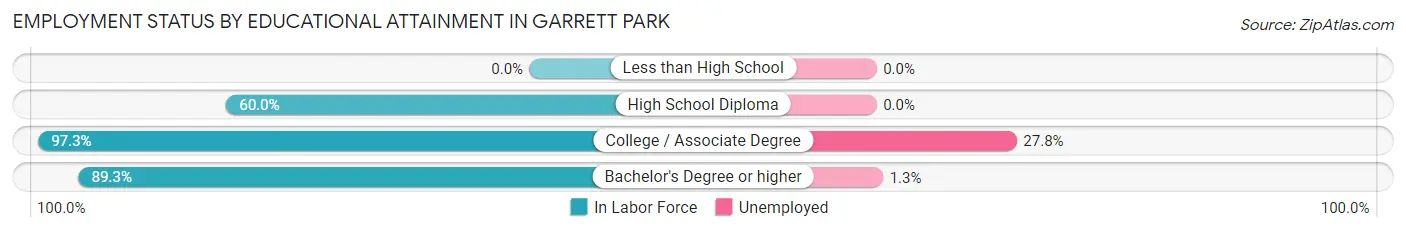
| Educational Attainment | In Labor Force | Unemployed |
| Less than High School | 0 (0.0%) | 0 (0.0%) |
| High School Diploma | 3 (60.0%) | 0 (0.0%) |
| College / Associate Degree | 36 (97.3%) | 10 (27.8%) |
| Bachelor's Degree or higher | 299 (89.3%) | 4 (1.3%) |
| Total | 338 (89.7%) | 15 (4.1%) |
Employment Occupations by Sex in Garrett Park
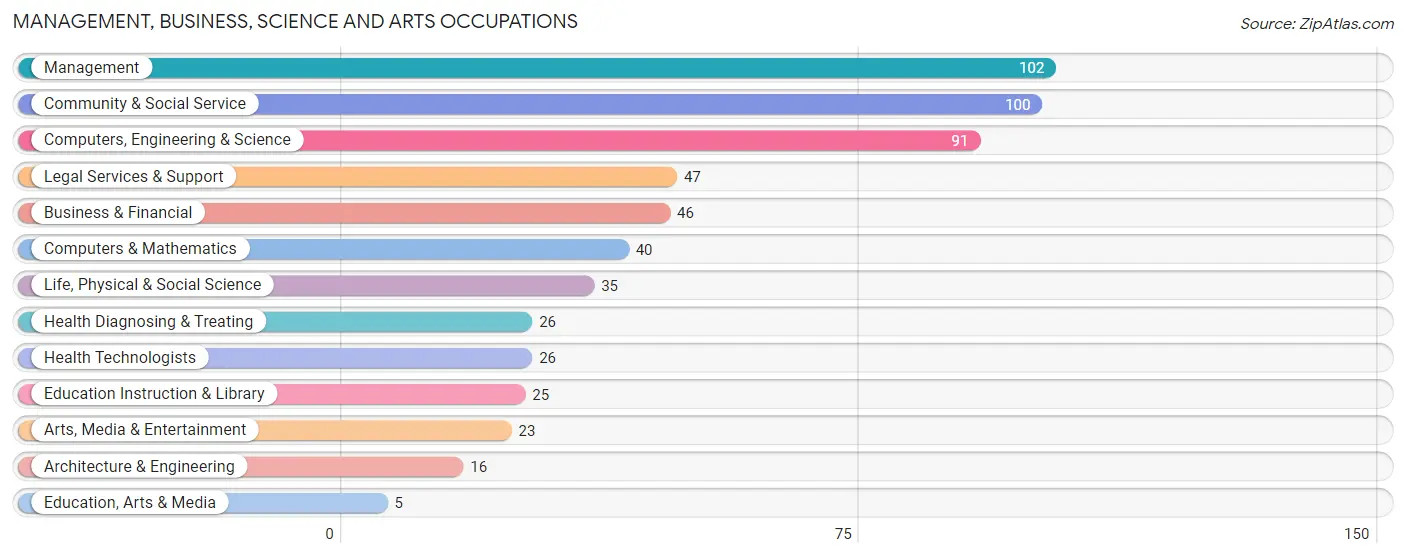
Management, Business, Science and Arts Occupations
The most common Management, Business, Science and Arts occupations in Garrett Park are Management (102 | 24.7%), Community & Social Service (100 | 24.2%), Computers, Engineering & Science (91 | 22.0%), Legal Services & Support (47 | 11.4%), and Business & Financial (46 | 11.1%).
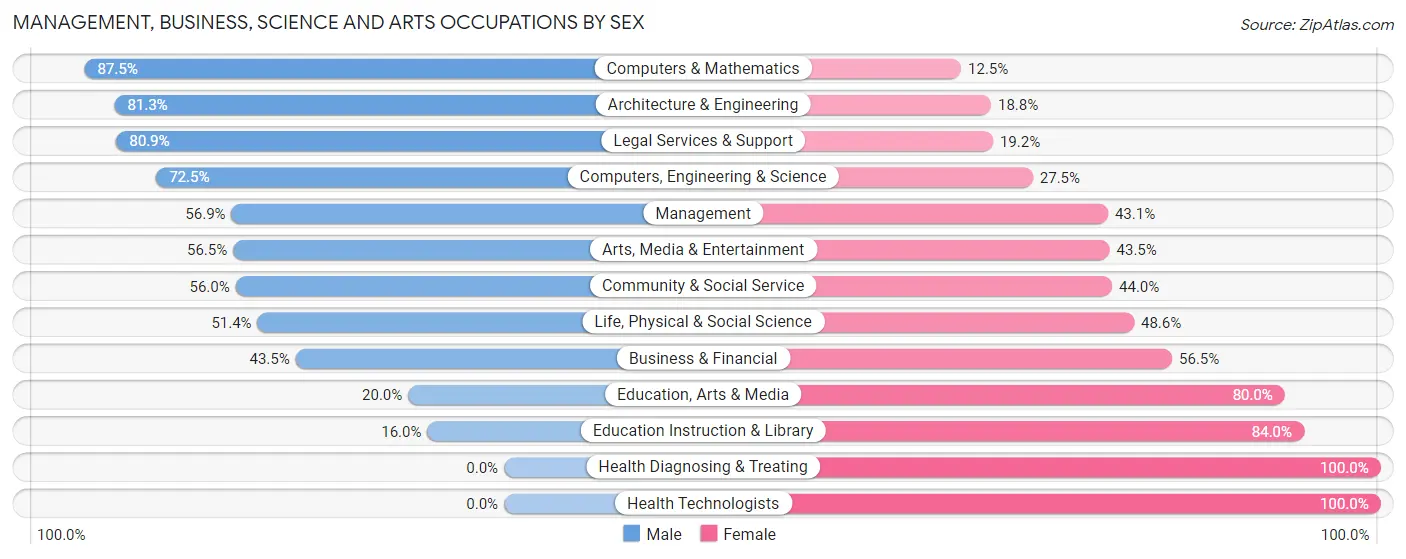
Management, Business, Science and Arts Occupations by Sex
Within the Management, Business, Science and Arts occupations in Garrett Park, the most male-oriented occupations are Computers & Mathematics (87.5%), Architecture & Engineering (81.2%), and Legal Services & Support (80.8%), while the most female-oriented occupations are Health Diagnosing & Treating (100.0%), Health Technologists (100.0%), and Education Instruction & Library (84.0%).
| Occupation | Male | Female |
| Management | 58 (56.9%) | 44 (43.1%) |
| Business & Financial | 20 (43.5%) | 26 (56.5%) |
| Computers, Engineering & Science | 66 (72.5%) | 25 (27.5%) |
| Computers & Mathematics | 35 (87.5%) | 5 (12.5%) |
| Architecture & Engineering | 13 (81.2%) | 3 (18.8%) |
| Life, Physical & Social Science | 18 (51.4%) | 17 (48.6%) |
| Community & Social Service | 56 (56.0%) | 44 (44.0%) |
| Education, Arts & Media | 1 (20.0%) | 4 (80.0%) |
| Legal Services & Support | 38 (80.8%) | 9 (19.2%) |
| Education Instruction & Library | 4 (16.0%) | 21 (84.0%) |
| Arts, Media & Entertainment | 13 (56.5%) | 10 (43.5%) |
| Health Diagnosing & Treating | 0 (0.0%) | 26 (100.0%) |
| Health Technologists | 0 (0.0%) | 26 (100.0%) |
| Total (Category) | 200 (54.8%) | 165 (45.2%) |
| Total (Overall) | 219 (53.0%) | 194 (47.0%) |
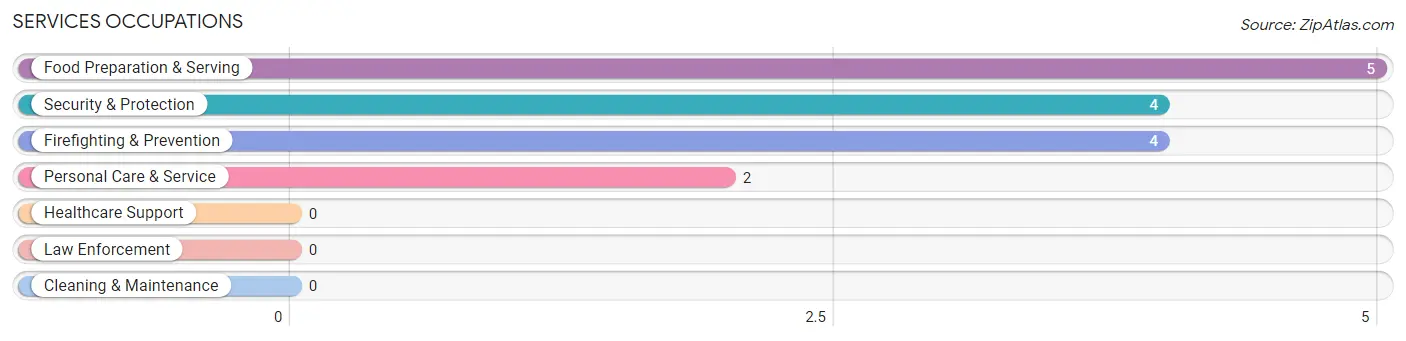
Services Occupations
The most common Services occupations in Garrett Park are Food Preparation & Serving (5 | 1.2%), Security & Protection (4 | 1.0%), Firefighting & Prevention (4 | 1.0%), and Personal Care & Service (2 | 0.5%).
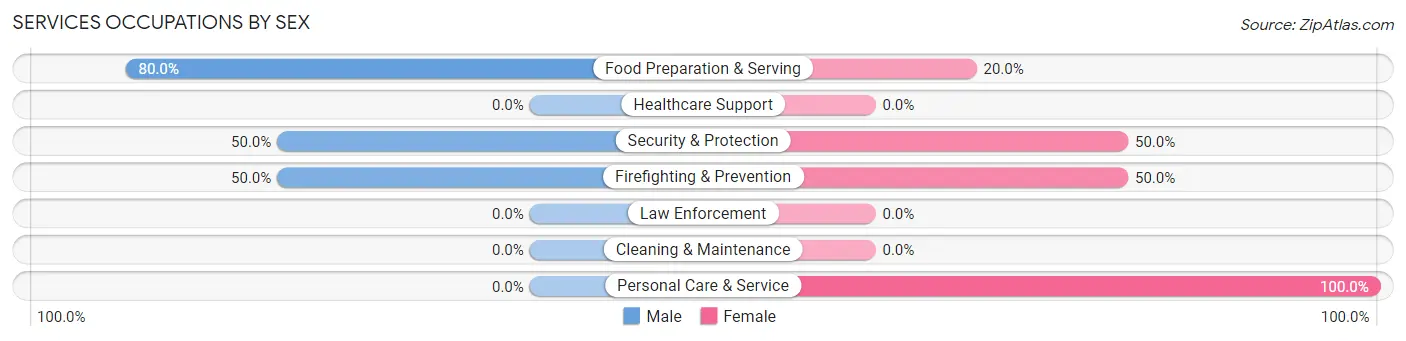
Services Occupations by Sex
Within the Services occupations in Garrett Park, the most male-oriented occupations are Food Preparation & Serving (80.0%), Security & Protection (50.0%), and Firefighting & Prevention (50.0%), while the most female-oriented occupations are Personal Care & Service (100.0%), Security & Protection (50.0%), and Firefighting & Prevention (50.0%).
| Occupation | Male | Female |
| Healthcare Support | 0 (0.0%) | 0 (0.0%) |
| Security & Protection | 2 (50.0%) | 2 (50.0%) |
| Firefighting & Prevention | 2 (50.0%) | 2 (50.0%) |
| Law Enforcement | 0 (0.0%) | 0 (0.0%) |
| Food Preparation & Serving | 4 (80.0%) | 1 (20.0%) |
| Cleaning & Maintenance | 0 (0.0%) | 0 (0.0%) |
| Personal Care & Service | 0 (0.0%) | 2 (100.0%) |
| Total (Category) | 6 (54.5%) | 5 (45.5%) |
| Total (Overall) | 219 (53.0%) | 194 (47.0%) |
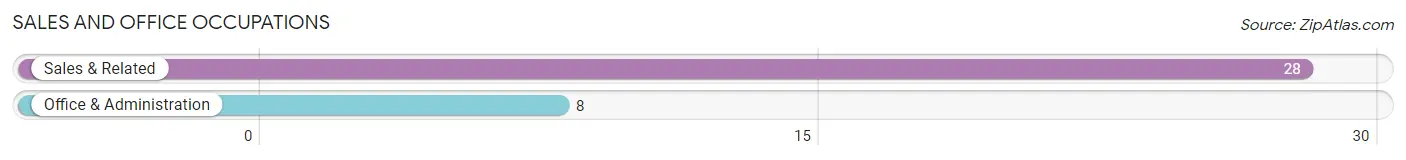
Sales and Office Occupations
The most common Sales and Office occupations in Garrett Park are Sales & Related (28 | 6.8%), and Office & Administration (8 | 1.9%).
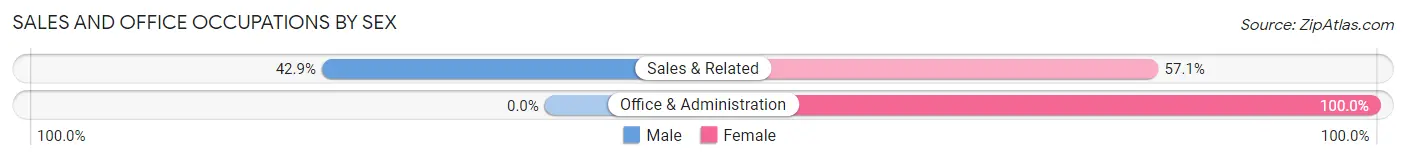
Sales and Office Occupations by Sex
| Occupation | Male | Female |
| Sales & Related | 12 (42.9%) | 16 (57.1%) |
| Office & Administration | 0 (0.0%) | 8 (100.0%) |
| Total (Category) | 12 (33.3%) | 24 (66.7%) |
| Total (Overall) | 219 (53.0%) | 194 (47.0%) |
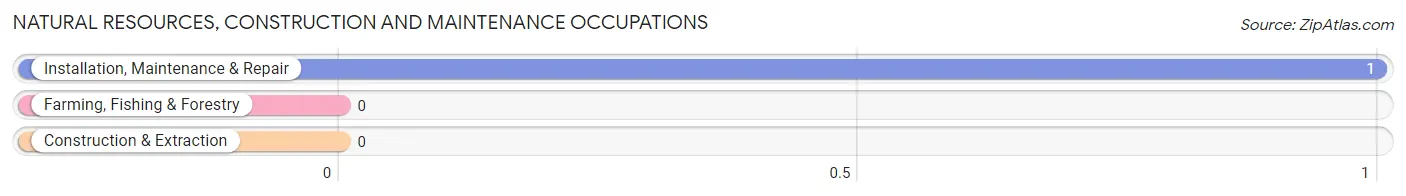
Natural Resources, Construction and Maintenance Occupations
The most common Natural Resources, Construction and Maintenance occupations in Garrett Park are , and Installation, Maintenance & Repair (1 | 0.2%).
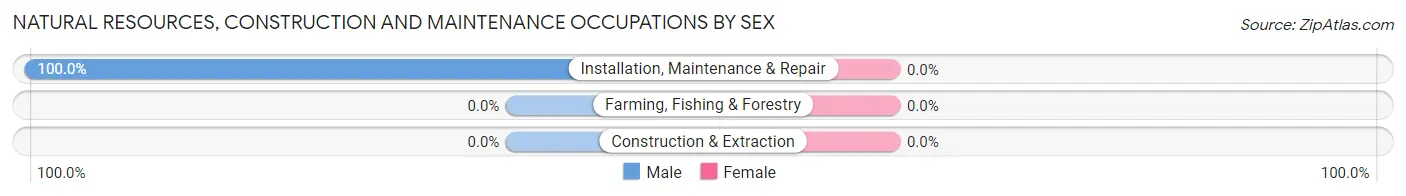
Natural Resources, Construction and Maintenance Occupations by Sex
| Occupation | Male | Female |
| Farming, Fishing & Forestry | 0 (0.0%) | 0 (0.0%) |
| Construction & Extraction | 0 (0.0%) | 0 (0.0%) |
| Installation, Maintenance & Repair | 1 (100.0%) | 0 (0.0%) |
| Total (Category) | 1 (100.0%) | 0 (0.0%) |
| Total (Overall) | 219 (53.0%) | 194 (47.0%) |
Production, Transportation and Moving Occupations
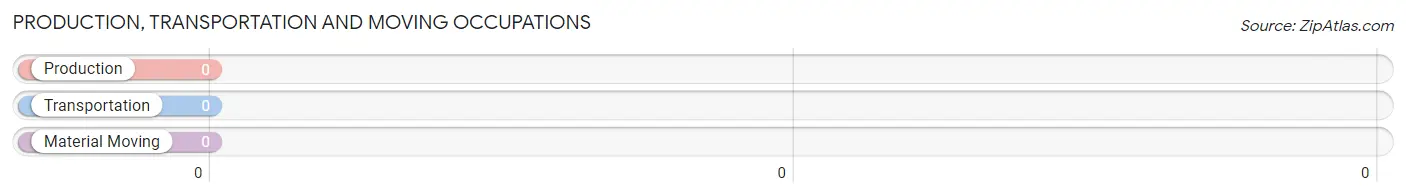
Production, Transportation and Moving Occupations by Sex
| Occupation | Male | Female |
| Production | 0 (0.0%) | 0 (0.0%) |
| Transportation | 0 (0.0%) | 0 (0.0%) |
| Material Moving | 0 (0.0%) | 0 (0.0%) |
| Total (Category) | 0 (0.0%) | 0 (0.0%) |
| Total (Overall) | 219 (53.0%) | 194 (47.0%) |
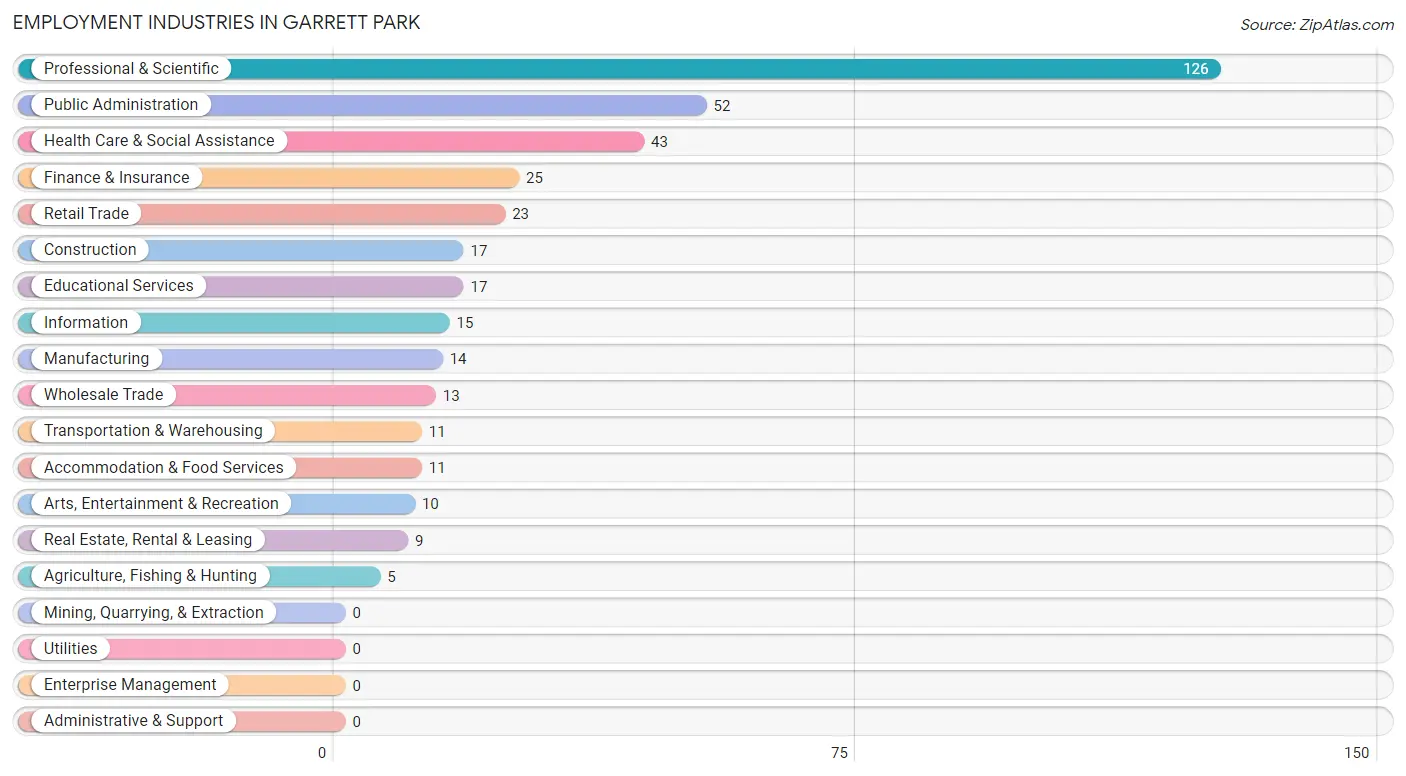
Employment Industries by Sex in Garrett Park
Employment Industries in Garrett Park
The major employment industries in Garrett Park include Professional & Scientific (126 | 30.5%), Public Administration (52 | 12.6%), Health Care & Social Assistance (43 | 10.4%), Finance & Insurance (25 | 6.0%), and Retail Trade (23 | 5.6%).
Employment Industries by Sex in Garrett Park
The Garrett Park industries that see more men than women are Construction (100.0%), Finance & Insurance (92.0%), and Accommodation & Food Services (72.7%), whereas the industries that tend to have a higher number of women are Agriculture, Fishing & Hunting (100.0%), Real Estate, Rental & Leasing (100.0%), and Retail Trade (91.3%).
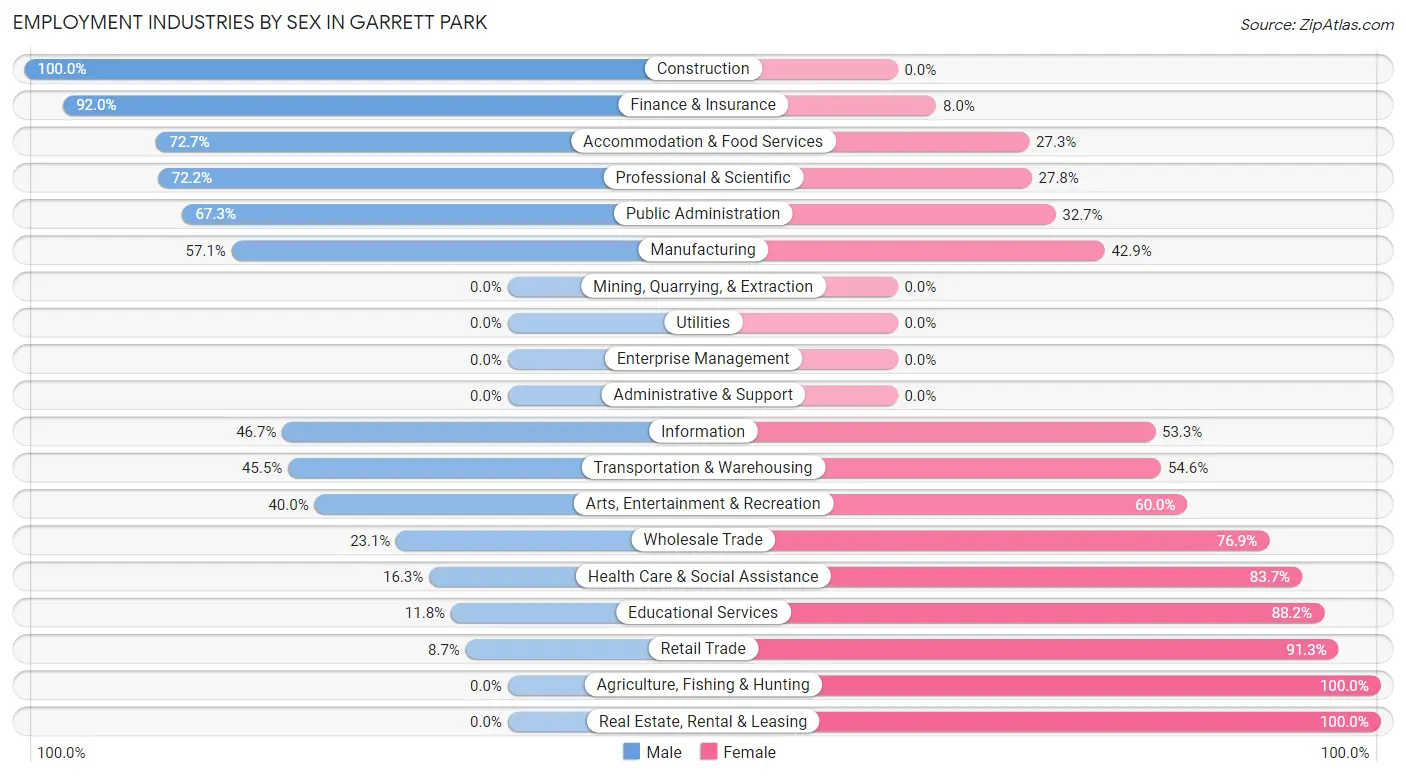
| Industry | Male | Female |
| Agriculture, Fishing & Hunting | 0 (0.0%) | 5 (100.0%) |
| Mining, Quarrying, & Extraction | 0 (0.0%) | 0 (0.0%) |
| Construction | 17 (100.0%) | 0 (0.0%) |
| Manufacturing | 8 (57.1%) | 6 (42.9%) |
| Wholesale Trade | 3 (23.1%) | 10 (76.9%) |
| Retail Trade | 2 (8.7%) | 21 (91.3%) |
| Transportation & Warehousing | 5 (45.5%) | 6 (54.5%) |
| Utilities | 0 (0.0%) | 0 (0.0%) |
| Information | 7 (46.7%) | 8 (53.3%) |
| Finance & Insurance | 23 (92.0%) | 2 (8.0%) |
| Real Estate, Rental & Leasing | 0 (0.0%) | 9 (100.0%) |
| Professional & Scientific | 91 (72.2%) | 35 (27.8%) |
| Enterprise Management | 0 (0.0%) | 0 (0.0%) |
| Administrative & Support | 0 (0.0%) | 0 (0.0%) |
| Educational Services | 2 (11.8%) | 15 (88.2%) |
| Health Care & Social Assistance | 7 (16.3%) | 36 (83.7%) |
| Arts, Entertainment & Recreation | 4 (40.0%) | 6 (60.0%) |
| Accommodation & Food Services | 8 (72.7%) | 3 (27.3%) |
| Public Administration | 35 (67.3%) | 17 (32.7%) |
| Total | 219 (53.0%) | 194 (47.0%) |
Education in Garrett Park
School Enrollment in Garrett Park
The most common levels of schooling among the 189 students in Garrett Park are college / undergraduate (45 | 23.8%), high school (37 | 19.6%), and middle school (31 | 16.4%).
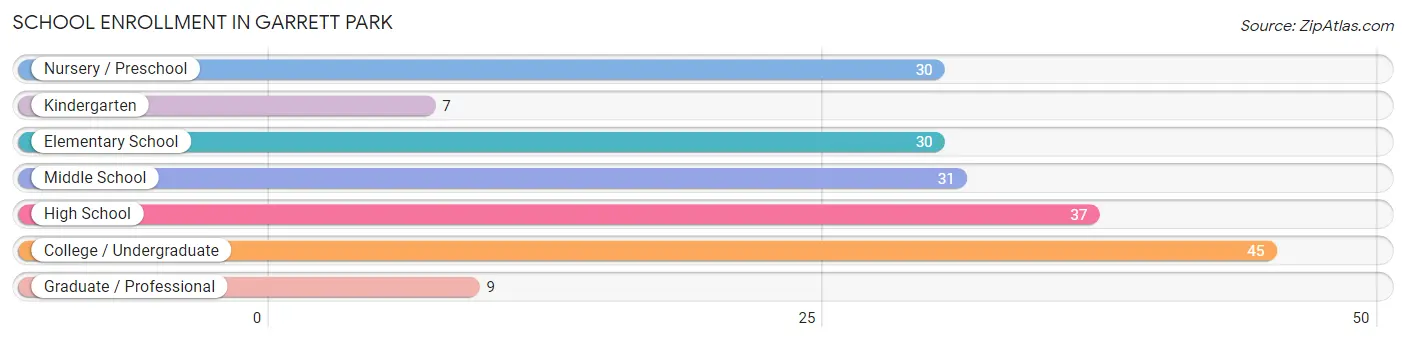
| School Level | # Students | % Students |
| Nursery / Preschool | 30 | 15.9% |
| Kindergarten | 7 | 3.7% |
| Elementary School | 30 | 15.9% |
| Middle School | 31 | 16.4% |
| High School | 37 | 19.6% |
| College / Undergraduate | 45 | 23.8% |
| Graduate / Professional | 9 | 4.8% |
| Total | 189 | 100.0% |
School Enrollment by Age by Funding Source in Garrett Park
Out of a total of 189 students who are enrolled in schools in Garrett Park, 55 (29.1%) attend a private institution, while the remaining 134 (70.9%) are enrolled in public schools. The age group of 3 to 4 year olds has the highest likelihood of being enrolled in private schools, with 11 (84.6% in the age bracket) enrolled. Conversely, the age group of 35 years and over has the lowest likelihood of being enrolled in a private school, with 14 (100.0% in the age bracket) attending a public institution.
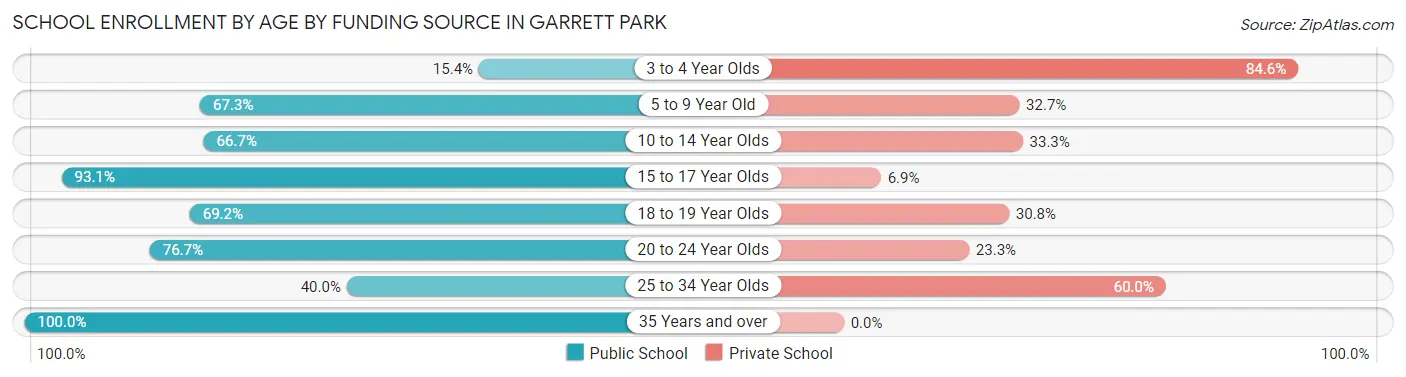
| Age Bracket | Public School | Private School |
| 3 to 4 Year Olds | 2 (15.4%) | 11 (84.6%) |
| 5 to 9 Year Old | 35 (67.3%) | 17 (32.7%) |
| 10 to 14 Year Olds | 22 (66.7%) | 11 (33.3%) |
| 15 to 17 Year Olds | 27 (93.1%) | 2 (6.9%) |
| 18 to 19 Year Olds | 9 (69.2%) | 4 (30.8%) |
| 20 to 24 Year Olds | 23 (76.7%) | 7 (23.3%) |
| 25 to 34 Year Olds | 2 (40.0%) | 3 (60.0%) |
| 35 Years and over | 14 (100.0%) | 0 (0.0%) |
| Total | 134 (70.9%) | 55 (29.1%) |
Educational Attainment by Field of Study in Garrett Park
Social sciences (108 | 17.9%), literature & languages (77 | 12.8%), liberal arts & history (66 | 10.9%), physical & health sciences (55 | 9.1%), and business (47 | 7.8%) are the most common fields of study among 604 individuals in Garrett Park who have obtained a bachelor's degree or higher.
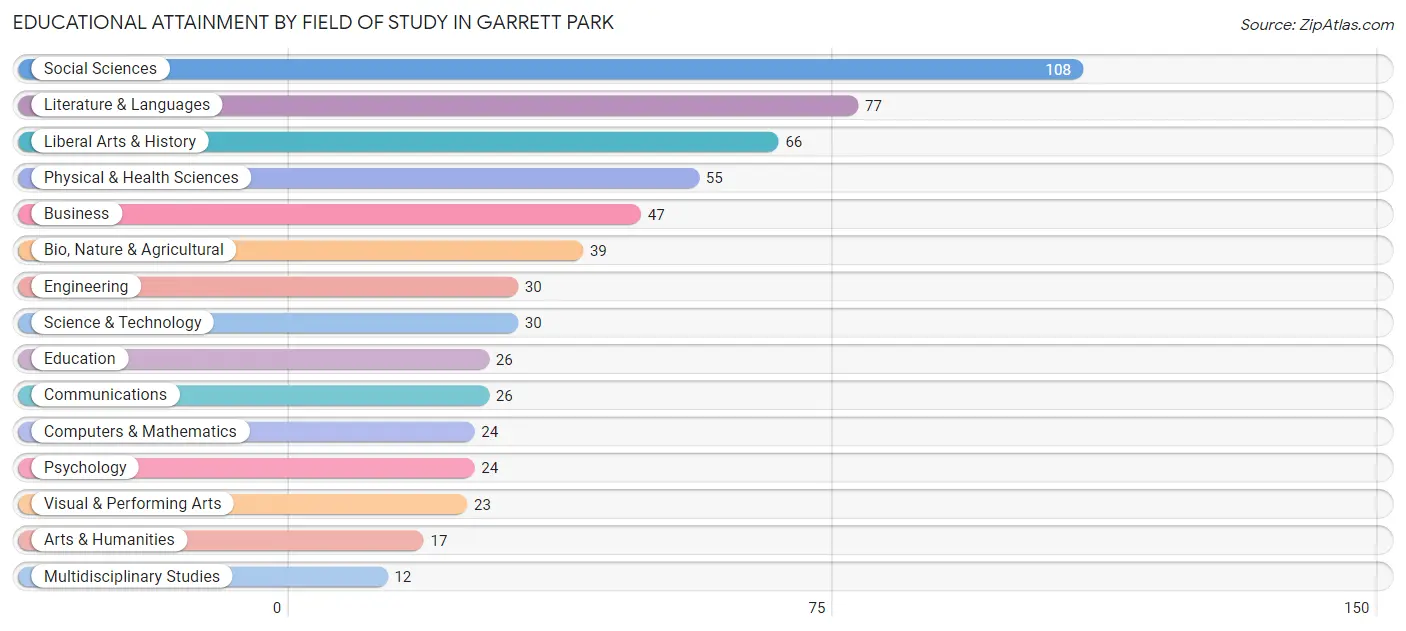
| Field of Study | # Graduates | % Graduates |
| Computers & Mathematics | 24 | 4.0% |
| Bio, Nature & Agricultural | 39 | 6.5% |
| Physical & Health Sciences | 55 | 9.1% |
| Psychology | 24 | 4.0% |
| Social Sciences | 108 | 17.9% |
| Engineering | 30 | 5.0% |
| Multidisciplinary Studies | 12 | 2.0% |
| Science & Technology | 30 | 5.0% |
| Business | 47 | 7.8% |
| Education | 26 | 4.3% |
| Literature & Languages | 77 | 12.8% |
| Liberal Arts & History | 66 | 10.9% |
| Visual & Performing Arts | 23 | 3.8% |
| Communications | 26 | 4.3% |
| Arts & Humanities | 17 | 2.8% |
| Total | 604 | 100.0% |
Transportation & Commute in Garrett Park
Vehicle Availability by Sex in Garrett Park
The most prevalent vehicle ownership categories in Garrett Park are males with 2 vehicles (118, accounting for 53.9%) and females with 2 vehicles (75, making up 63.8%).
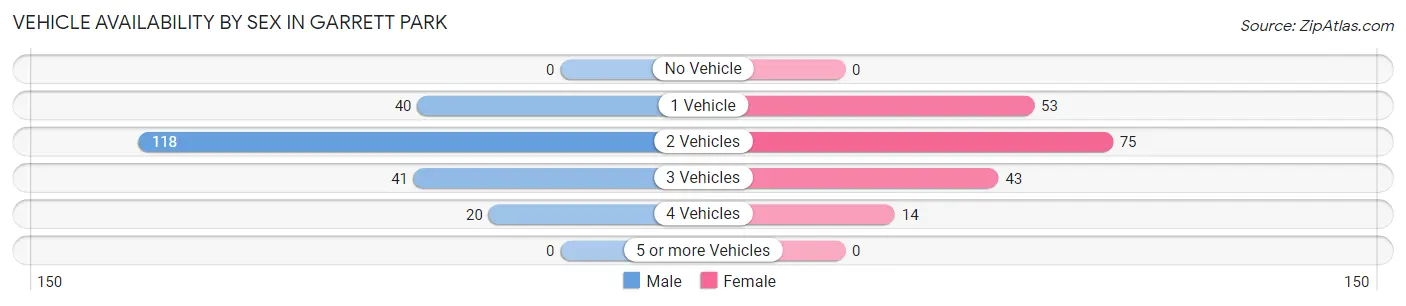
| Vehicles Available | Male | Female |
| No Vehicle | 0 (0.0%) | 0 (0.0%) |
| 1 Vehicle | 40 (18.3%) | 53 (28.6%) |
| 2 Vehicles | 118 (53.9%) | 75 (40.5%) |
| 3 Vehicles | 41 (18.7%) | 43 (23.2%) |
| 4 Vehicles | 20 (9.1%) | 14 (7.6%) |
| 5 or more Vehicles | 0 (0.0%) | 0 (0.0%) |
| Total | 219 (100.0%) | 185 (100.0%) |
Commute Time in Garrett Park
The most frequently occuring commute durations in Garrett Park are 15 to 19 minutes (33 commuters, 17.2%), 45 to 59 minutes (29 commuters, 15.1%), and 30 to 34 minutes (26 commuters, 13.5%).
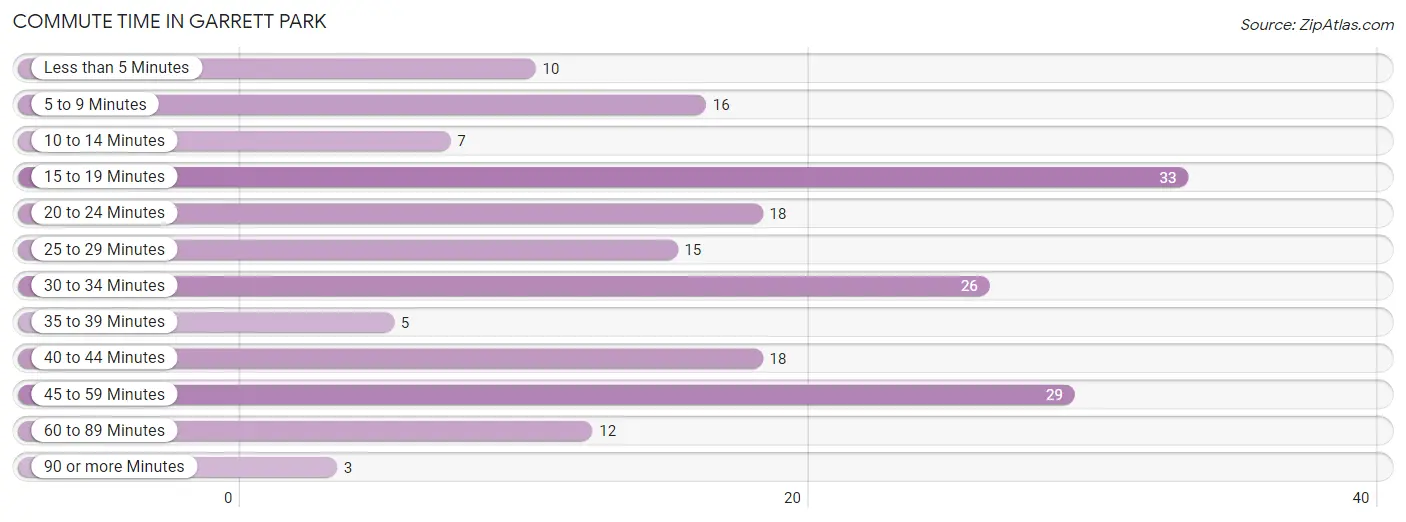
| Commute Time | # Commuters | % Commuters |
| Less than 5 Minutes | 10 | 5.2% |
| 5 to 9 Minutes | 16 | 8.3% |
| 10 to 14 Minutes | 7 | 3.6% |
| 15 to 19 Minutes | 33 | 17.2% |
| 20 to 24 Minutes | 18 | 9.4% |
| 25 to 29 Minutes | 15 | 7.8% |
| 30 to 34 Minutes | 26 | 13.5% |
| 35 to 39 Minutes | 5 | 2.6% |
| 40 to 44 Minutes | 18 | 9.4% |
| 45 to 59 Minutes | 29 | 15.1% |
| 60 to 89 Minutes | 12 | 6.2% |
| 90 or more Minutes | 3 | 1.6% |
Commute Time by Sex in Garrett Park
The most common commute times in Garrett Park are 15 to 19 minutes (16 commuters, 16.3%) for males and 30 to 34 minutes (26 commuters, 27.7%) for females.
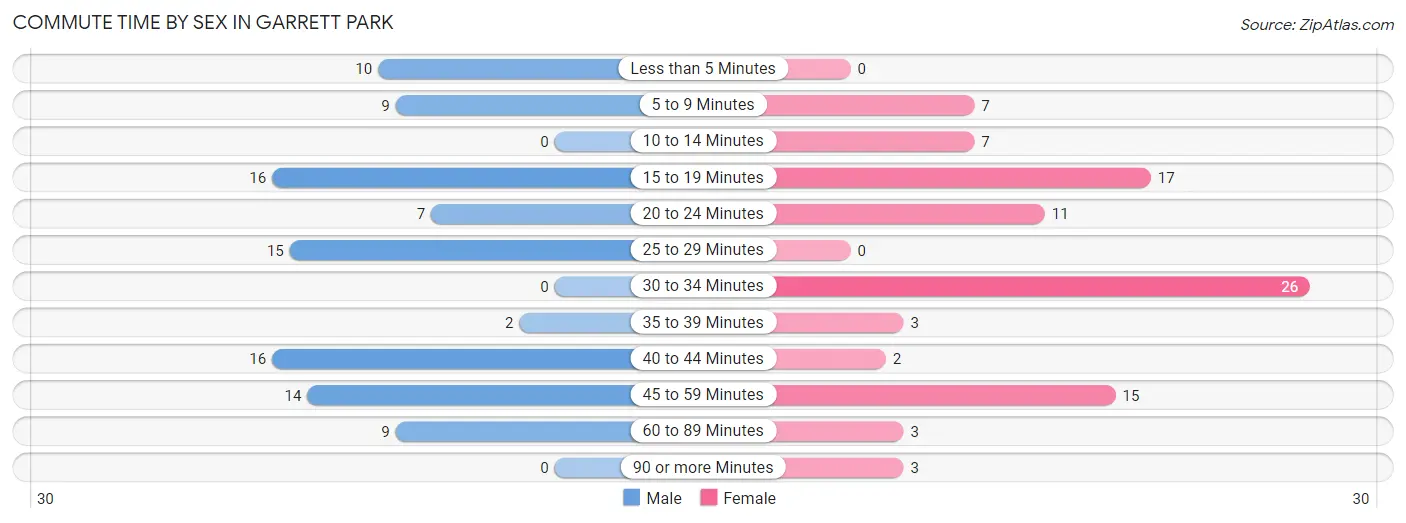
| Commute Time | Male | Female |
| Less than 5 Minutes | 10 (10.2%) | 0 (0.0%) |
| 5 to 9 Minutes | 9 (9.2%) | 7 (7.4%) |
| 10 to 14 Minutes | 0 (0.0%) | 7 (7.4%) |
| 15 to 19 Minutes | 16 (16.3%) | 17 (18.1%) |
| 20 to 24 Minutes | 7 (7.1%) | 11 (11.7%) |
| 25 to 29 Minutes | 15 (15.3%) | 0 (0.0%) |
| 30 to 34 Minutes | 0 (0.0%) | 26 (27.7%) |
| 35 to 39 Minutes | 2 (2.0%) | 3 (3.2%) |
| 40 to 44 Minutes | 16 (16.3%) | 2 (2.1%) |
| 45 to 59 Minutes | 14 (14.3%) | 15 (16.0%) |
| 60 to 89 Minutes | 9 (9.2%) | 3 (3.2%) |
| 90 or more Minutes | 0 (0.0%) | 3 (3.2%) |
Time of Departure to Work by Sex in Garrett Park
The most frequent times of departure to work in Garrett Park are 7:00 AM to 7:29 AM (26, 26.5%) for males and 9:00 AM to 9:59 AM (34, 36.2%) for females.
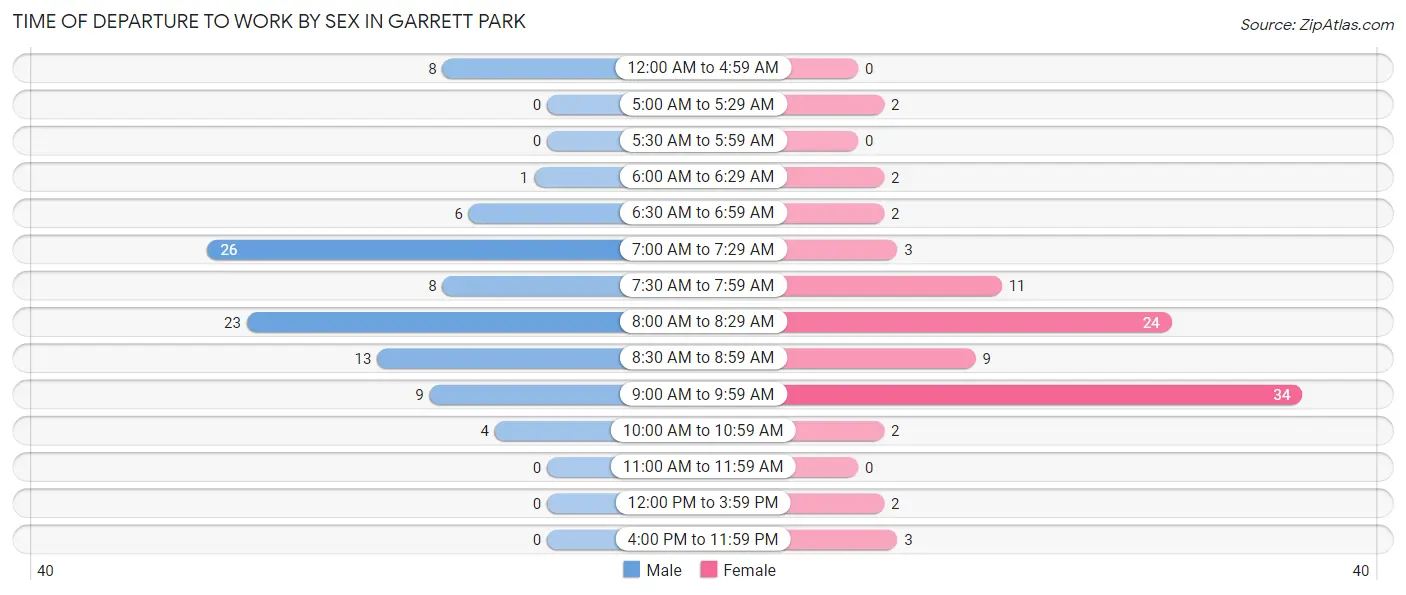
| Time of Departure | Male | Female |
| 12:00 AM to 4:59 AM | 8 (8.2%) | 0 (0.0%) |
| 5:00 AM to 5:29 AM | 0 (0.0%) | 2 (2.1%) |
| 5:30 AM to 5:59 AM | 0 (0.0%) | 0 (0.0%) |
| 6:00 AM to 6:29 AM | 1 (1.0%) | 2 (2.1%) |
| 6:30 AM to 6:59 AM | 6 (6.1%) | 2 (2.1%) |
| 7:00 AM to 7:29 AM | 26 (26.5%) | 3 (3.2%) |
| 7:30 AM to 7:59 AM | 8 (8.2%) | 11 (11.7%) |
| 8:00 AM to 8:29 AM | 23 (23.5%) | 24 (25.5%) |
| 8:30 AM to 8:59 AM | 13 (13.3%) | 9 (9.6%) |
| 9:00 AM to 9:59 AM | 9 (9.2%) | 34 (36.2%) |
| 10:00 AM to 10:59 AM | 4 (4.1%) | 2 (2.1%) |
| 11:00 AM to 11:59 AM | 0 (0.0%) | 0 (0.0%) |
| 12:00 PM to 3:59 PM | 0 (0.0%) | 2 (2.1%) |
| 4:00 PM to 11:59 PM | 0 (0.0%) | 3 (3.2%) |
| Total | 98 (100.0%) | 94 (100.0%) |
Housing Occupancy in Garrett Park
Occupancy by Ownership in Garrett Park
Of the total 324 dwellings in Garrett Park, owner-occupied units account for 307 (94.8%), while renter-occupied units make up 17 (5.2%).
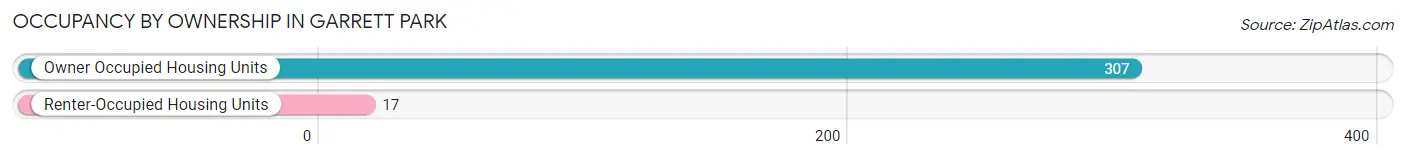
| Occupancy | # Housing Units | % Housing Units |
| Owner Occupied Housing Units | 307 | 94.8% |
| Renter-Occupied Housing Units | 17 | 5.2% |
| Total Occupied Housing Units | 324 | 100.0% |
Occupancy by Household Size in Garrett Park
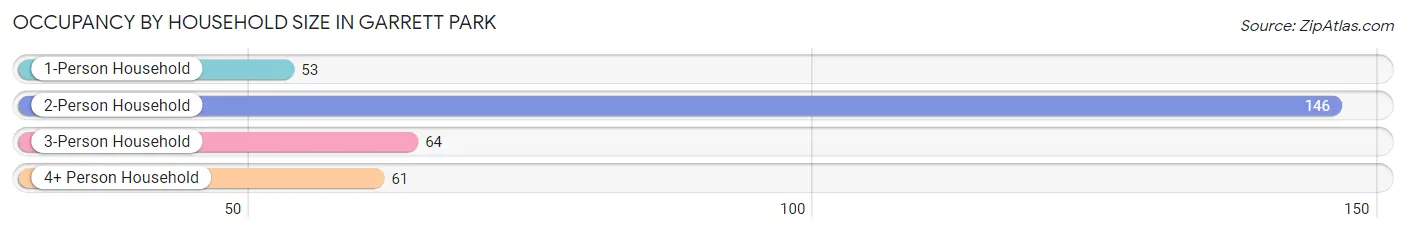
| Household Size | # Housing Units | % Housing Units |
| 1-Person Household | 53 | 16.4% |
| 2-Person Household | 146 | 45.1% |
| 3-Person Household | 64 | 19.8% |
| 4+ Person Household | 61 | 18.8% |
| Total Housing Units | 324 | 100.0% |
Occupancy by Ownership by Household Size in Garrett Park
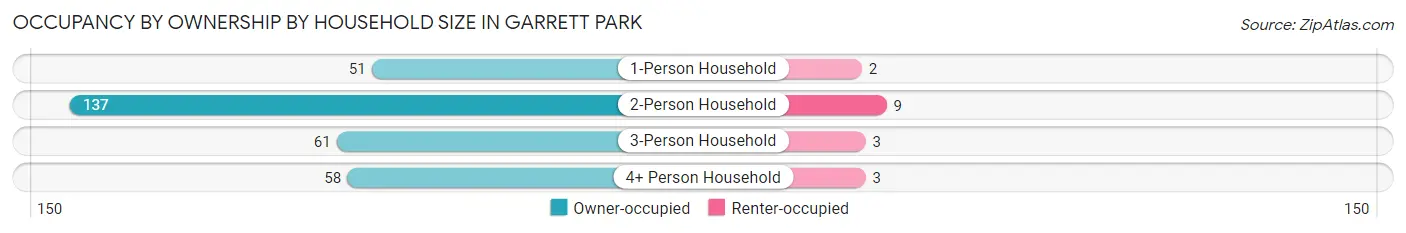
| Household Size | Owner-occupied | Renter-occupied |
| 1-Person Household | 51 (96.2%) | 2 (3.8%) |
| 2-Person Household | 137 (93.8%) | 9 (6.2%) |
| 3-Person Household | 61 (95.3%) | 3 (4.7%) |
| 4+ Person Household | 58 (95.1%) | 3 (4.9%) |
| Total Housing Units | 307 (94.8%) | 17 (5.2%) |
Occupancy by Educational Attainment in Garrett Park
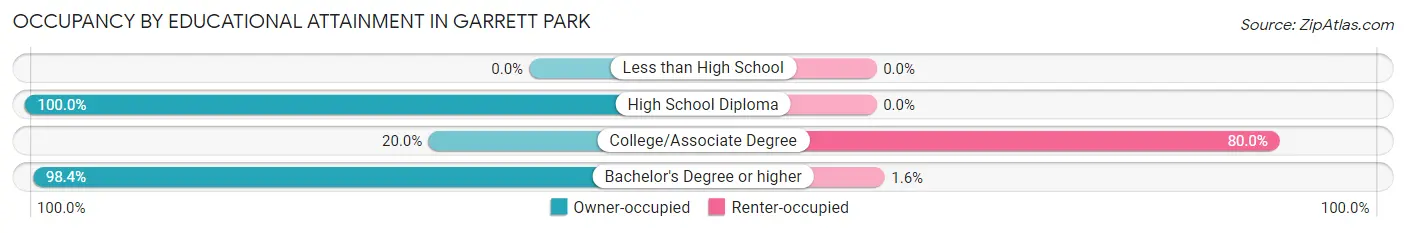
| Household Size | Owner-occupied | Renter-occupied |
| Less than High School | 0 (0.0%) | 0 (0.0%) |
| High School Diploma | 2 (100.0%) | 0 (0.0%) |
| College/Associate Degree | 3 (20.0%) | 12 (80.0%) |
| Bachelor's Degree or higher | 302 (98.4%) | 5 (1.6%) |
Occupancy by Age of Householder in Garrett Park
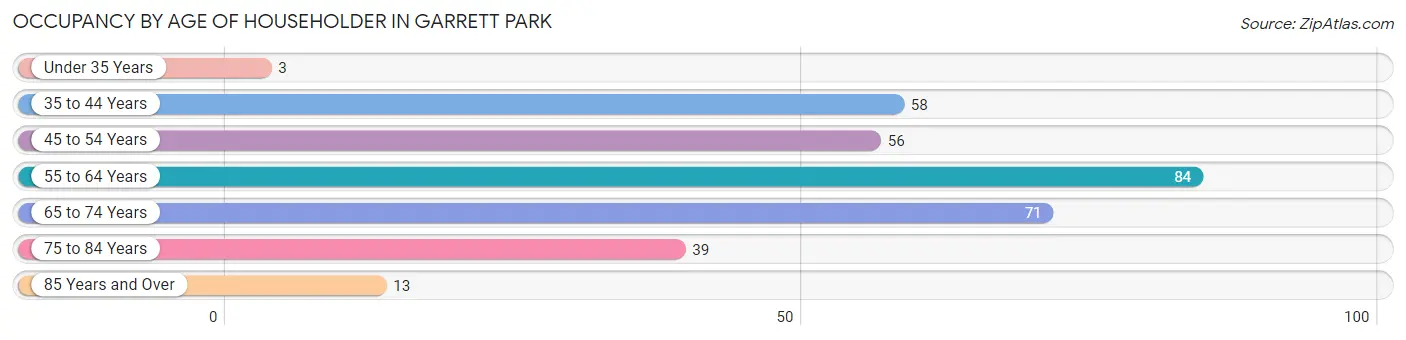
| Age Bracket | # Households | % Households |
| Under 35 Years | 3 | 0.9% |
| 35 to 44 Years | 58 | 17.9% |
| 45 to 54 Years | 56 | 17.3% |
| 55 to 64 Years | 84 | 25.9% |
| 65 to 74 Years | 71 | 21.9% |
| 75 to 84 Years | 39 | 12.0% |
| 85 Years and Over | 13 | 4.0% |
| Total | 324 | 100.0% |
Housing Finances in Garrett Park
Median Income by Occupancy in Garrett Park
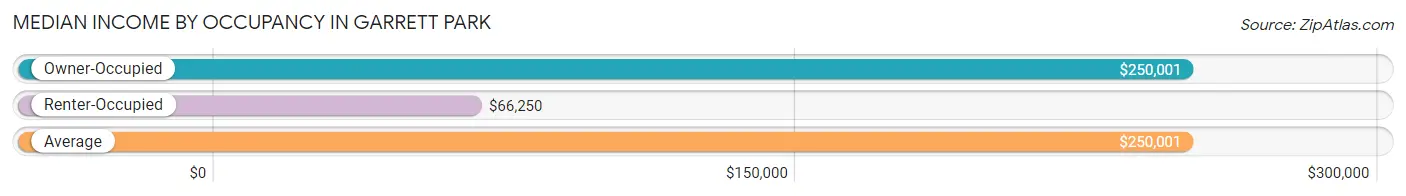
| Occupancy Type | # Households | Median Income |
| Owner-Occupied | 307 (94.8%) | $250,001 |
| Renter-Occupied | 17 (5.2%) | $66,250 |
| Average | 324 (100.0%) | $250,001 |
Occupancy by Householder Income Bracket in Garrett Park
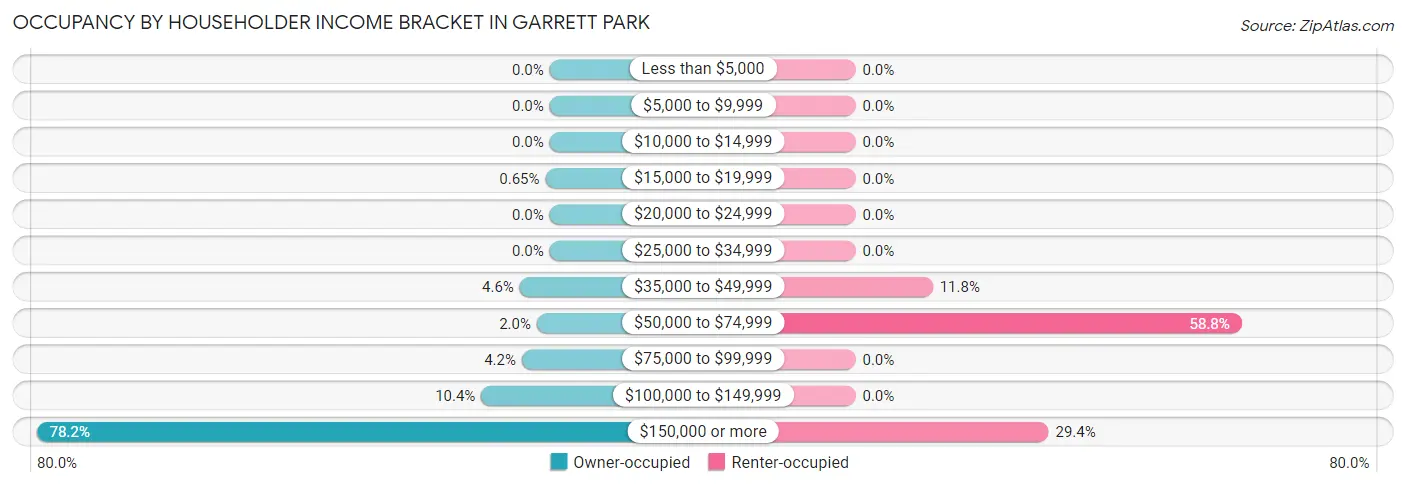
| Income Bracket | Owner-occupied | Renter-occupied |
| Less than $5,000 | 0 (0.0%) | 0 (0.0%) |
| $5,000 to $9,999 | 0 (0.0%) | 0 (0.0%) |
| $10,000 to $14,999 | 0 (0.0%) | 0 (0.0%) |
| $15,000 to $19,999 | 2 (0.6%) | 0 (0.0%) |
| $20,000 to $24,999 | 0 (0.0%) | 0 (0.0%) |
| $25,000 to $34,999 | 0 (0.0%) | 0 (0.0%) |
| $35,000 to $49,999 | 14 (4.6%) | 2 (11.8%) |
| $50,000 to $74,999 | 6 (1.9%) | 10 (58.8%) |
| $75,000 to $99,999 | 13 (4.2%) | 0 (0.0%) |
| $100,000 to $149,999 | 32 (10.4%) | 0 (0.0%) |
| $150,000 or more | 240 (78.2%) | 5 (29.4%) |
| Total | 307 (100.0%) | 17 (100.0%) |
Monthly Housing Cost Tiers in Garrett Park
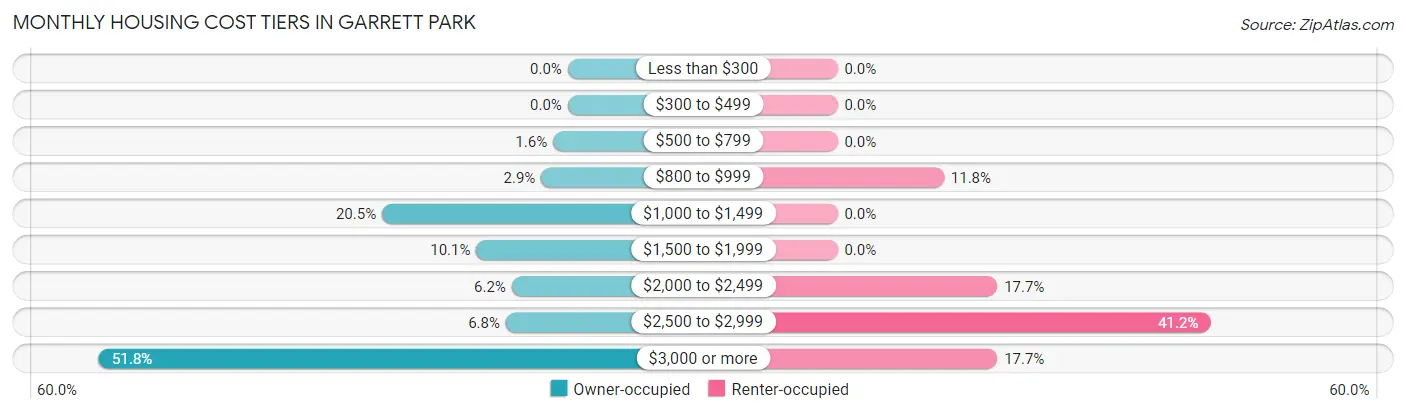
| Monthly Cost | Owner-occupied | Renter-occupied |
| Less than $300 | 0 (0.0%) | 0 (0.0%) |
| $300 to $499 | 0 (0.0%) | 0 (0.0%) |
| $500 to $799 | 5 (1.6%) | 0 (0.0%) |
| $800 to $999 | 9 (2.9%) | 2 (11.8%) |
| $1,000 to $1,499 | 63 (20.5%) | 0 (0.0%) |
| $1,500 to $1,999 | 31 (10.1%) | 0 (0.0%) |
| $2,000 to $2,499 | 19 (6.2%) | 3 (17.6%) |
| $2,500 to $2,999 | 21 (6.8%) | 7 (41.2%) |
| $3,000 or more | 159 (51.8%) | 3 (17.6%) |
| Total | 307 (100.0%) | 17 (100.0%) |
Physical Housing Characteristics in Garrett Park
Housing Structures in Garrett Park
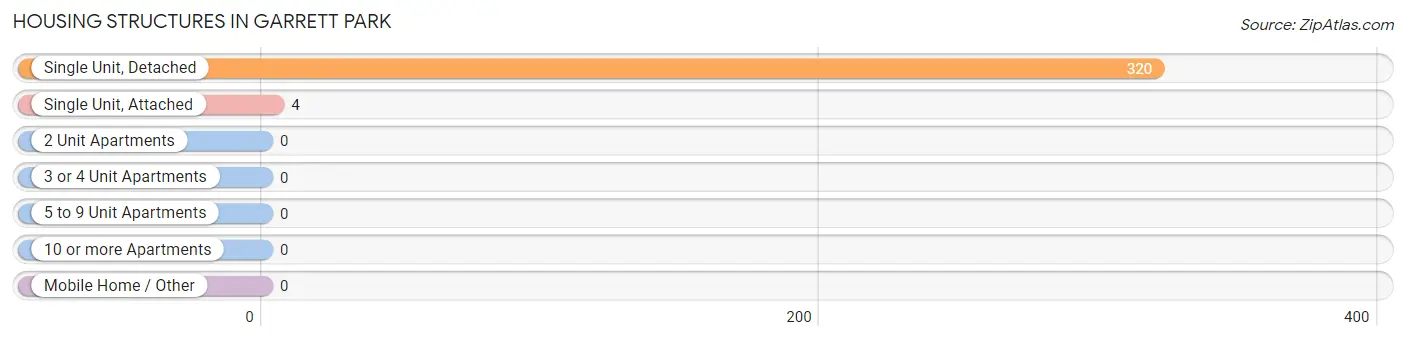
| Structure Type | # Housing Units | % Housing Units |
| Single Unit, Detached | 320 | 98.8% |
| Single Unit, Attached | 4 | 1.2% |
| 2 Unit Apartments | 0 | 0.0% |
| 3 or 4 Unit Apartments | 0 | 0.0% |
| 5 to 9 Unit Apartments | 0 | 0.0% |
| 10 or more Apartments | 0 | 0.0% |
| Mobile Home / Other | 0 | 0.0% |
| Total | 324 | 100.0% |
Housing Structures by Occupancy in Garrett Park
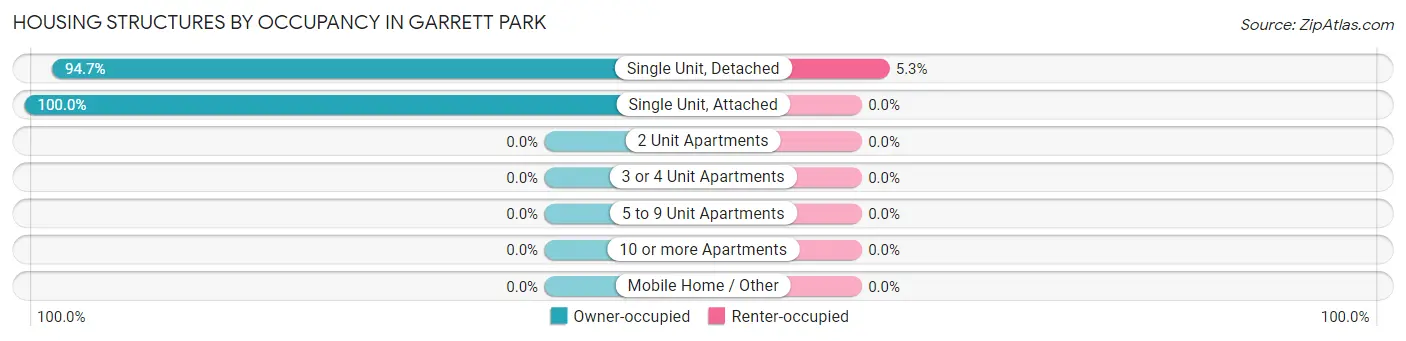
| Structure Type | Owner-occupied | Renter-occupied |
| Single Unit, Detached | 303 (94.7%) | 17 (5.3%) |
| Single Unit, Attached | 4 (100.0%) | 0 (0.0%) |
| 2 Unit Apartments | 0 (0.0%) | 0 (0.0%) |
| 3 or 4 Unit Apartments | 0 (0.0%) | 0 (0.0%) |
| 5 to 9 Unit Apartments | 0 (0.0%) | 0 (0.0%) |
| 10 or more Apartments | 0 (0.0%) | 0 (0.0%) |
| Mobile Home / Other | 0 (0.0%) | 0 (0.0%) |
| Total | 307 (94.8%) | 17 (5.2%) |
Housing Structures by Number of Rooms in Garrett Park
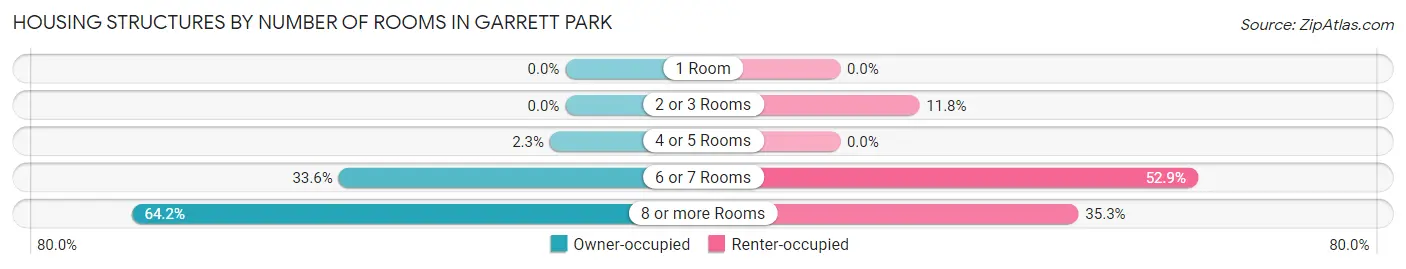
| Number of Rooms | Owner-occupied | Renter-occupied |
| 1 Room | 0 (0.0%) | 0 (0.0%) |
| 2 or 3 Rooms | 0 (0.0%) | 2 (11.8%) |
| 4 or 5 Rooms | 7 (2.3%) | 0 (0.0%) |
| 6 or 7 Rooms | 103 (33.6%) | 9 (52.9%) |
| 8 or more Rooms | 197 (64.2%) | 6 (35.3%) |
| Total | 307 (100.0%) | 17 (100.0%) |
Housing Structure by Heating Type in Garrett Park
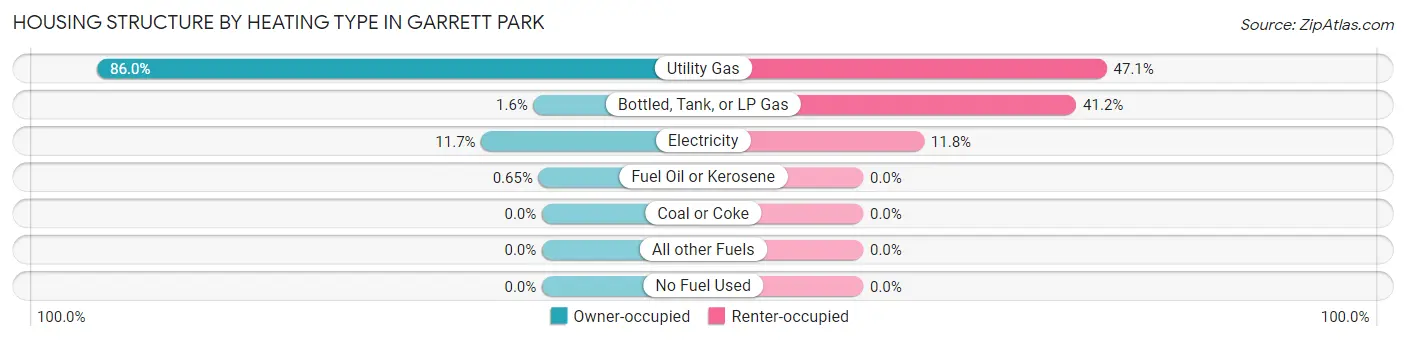
| Heating Type | Owner-occupied | Renter-occupied |
| Utility Gas | 264 (86.0%) | 8 (47.1%) |
| Bottled, Tank, or LP Gas | 5 (1.6%) | 7 (41.2%) |
| Electricity | 36 (11.7%) | 2 (11.8%) |
| Fuel Oil or Kerosene | 2 (0.6%) | 0 (0.0%) |
| Coal or Coke | 0 (0.0%) | 0 (0.0%) |
| All other Fuels | 0 (0.0%) | 0 (0.0%) |
| No Fuel Used | 0 (0.0%) | 0 (0.0%) |
| Total | 307 (100.0%) | 17 (100.0%) |
Household Vehicle Usage in Garrett Park
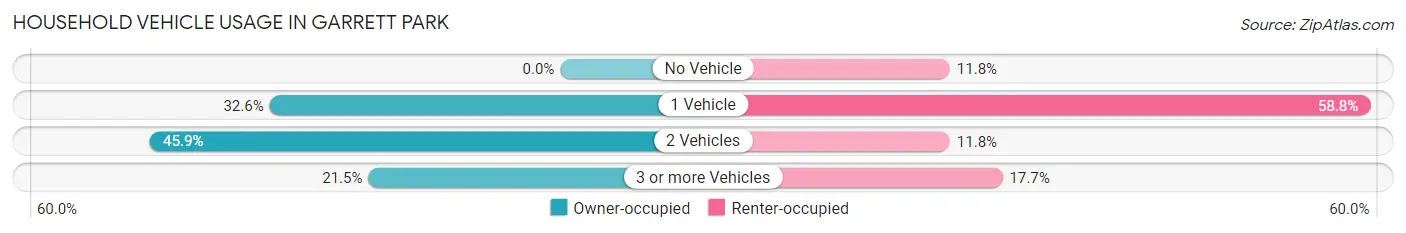
| Vehicles per Household | Owner-occupied | Renter-occupied |
| No Vehicle | 0 (0.0%) | 2 (11.8%) |
| 1 Vehicle | 100 (32.6%) | 10 (58.8%) |
| 2 Vehicles | 141 (45.9%) | 2 (11.8%) |
| 3 or more Vehicles | 66 (21.5%) | 3 (17.6%) |
| Total | 307 (100.0%) | 17 (100.0%) |
Real Estate & Mortgages in Garrett Park
Real Estate and Mortgage Overview in Garrett Park
| Characteristic | Without Mortgage | With Mortgage |
| Housing Units | 93 | 214 |
| Median Property Value | $930,900 | $902,800 |
| Median Household Income | $212,917 | $172 |
| Monthly Housing Costs | $1,358 | $159 |
| Real Estate Taxes | $10,001 | $0 |
Property Value by Mortgage Status in Garrett Park
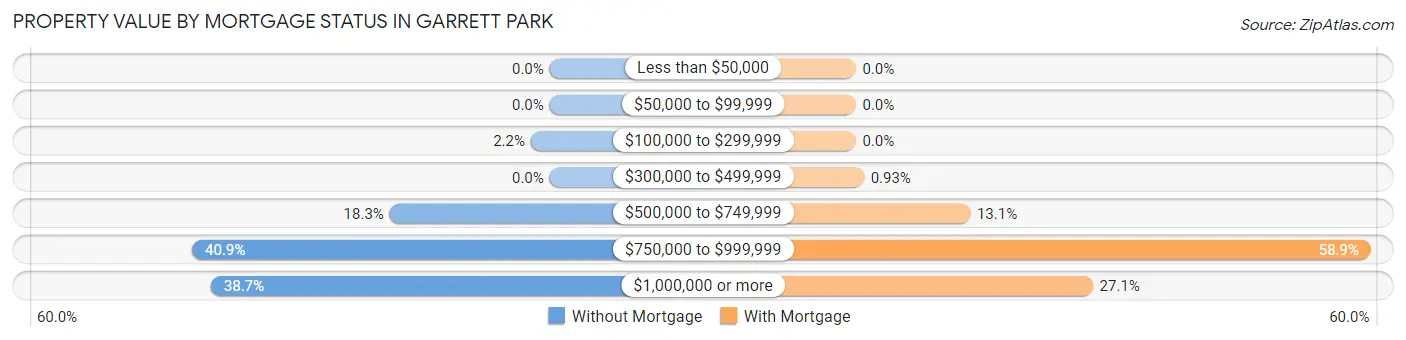
| Property Value | Without Mortgage | With Mortgage |
| Less than $50,000 | 0 (0.0%) | 0 (0.0%) |
| $50,000 to $99,999 | 0 (0.0%) | 0 (0.0%) |
| $100,000 to $299,999 | 2 (2.1%) | 0 (0.0%) |
| $300,000 to $499,999 | 0 (0.0%) | 2 (0.9%) |
| $500,000 to $749,999 | 17 (18.3%) | 28 (13.1%) |
| $750,000 to $999,999 | 38 (40.9%) | 126 (58.9%) |
| $1,000,000 or more | 36 (38.7%) | 58 (27.1%) |
| Total | 93 (100.0%) | 214 (100.0%) |
Household Income by Mortgage Status in Garrett Park
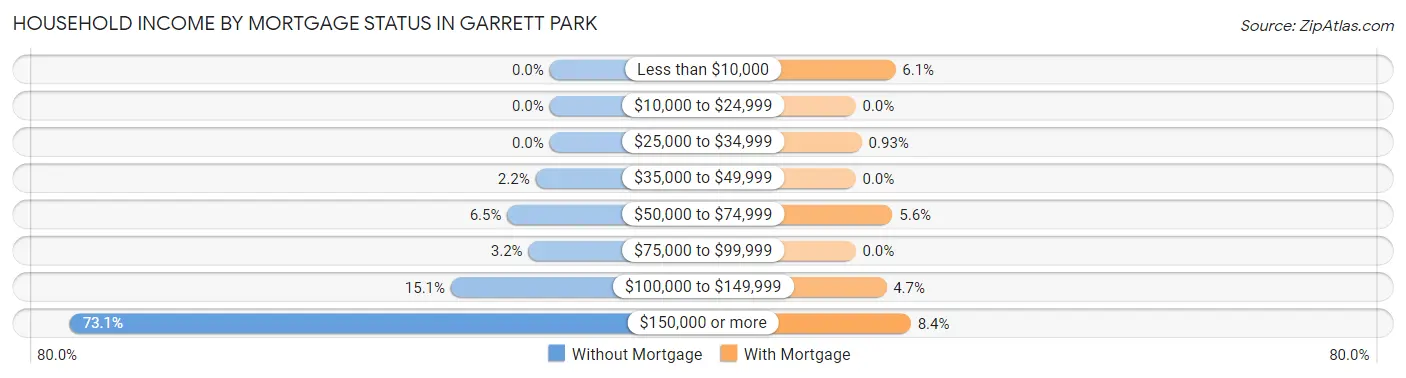
| Household Income | Without Mortgage | With Mortgage |
| Less than $10,000 | 0 (0.0%) | 13 (6.1%) |
| $10,000 to $24,999 | 0 (0.0%) | 0 (0.0%) |
| $25,000 to $34,999 | 0 (0.0%) | 2 (0.9%) |
| $35,000 to $49,999 | 2 (2.1%) | 0 (0.0%) |
| $50,000 to $74,999 | 6 (6.5%) | 12 (5.6%) |
| $75,000 to $99,999 | 3 (3.2%) | 0 (0.0%) |
| $100,000 to $149,999 | 14 (15.0%) | 10 (4.7%) |
| $150,000 or more | 68 (73.1%) | 18 (8.4%) |
| Total | 93 (100.0%) | 214 (100.0%) |
Property Value to Household Income Ratio in Garrett Park
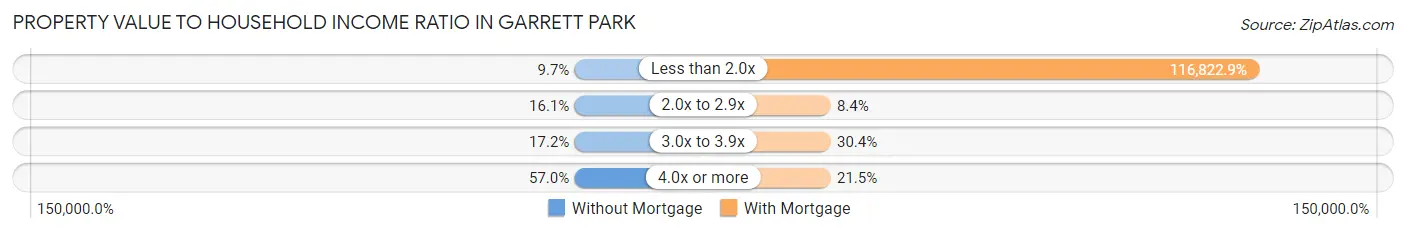
| Value-to-Income Ratio | Without Mortgage | With Mortgage |
| Less than 2.0x | 9 (9.7%) | 250,001 (116,822.9%) |
| 2.0x to 2.9x | 15 (16.1%) | 18 (8.4%) |
| 3.0x to 3.9x | 16 (17.2%) | 65 (30.4%) |
| 4.0x or more | 53 (57.0%) | 46 (21.5%) |
| Total | 93 (100.0%) | 214 (100.0%) |
Real Estate Taxes by Mortgage Status in Garrett Park
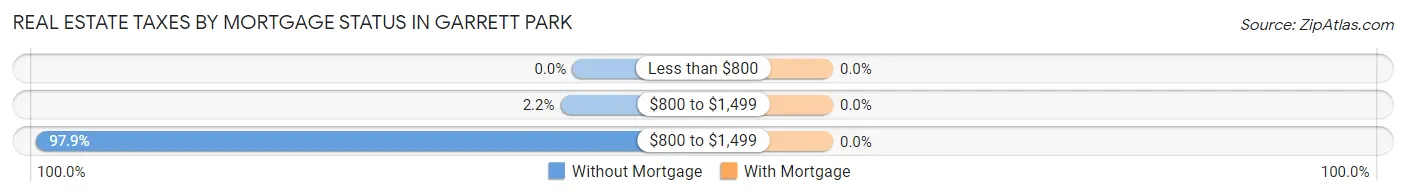
| Property Taxes | Without Mortgage | With Mortgage |
| Less than $800 | 0 (0.0%) | 0 (0.0%) |
| $800 to $1,499 | 2 (2.1%) | 0 (0.0%) |
| $800 to $1,499 | 91 (97.9%) | 0 (0.0%) |
| Total | 93 (100.0%) | 214 (100.0%) |
Health & Disability in Garrett Park
Health Insurance Coverage by Age in Garrett Park
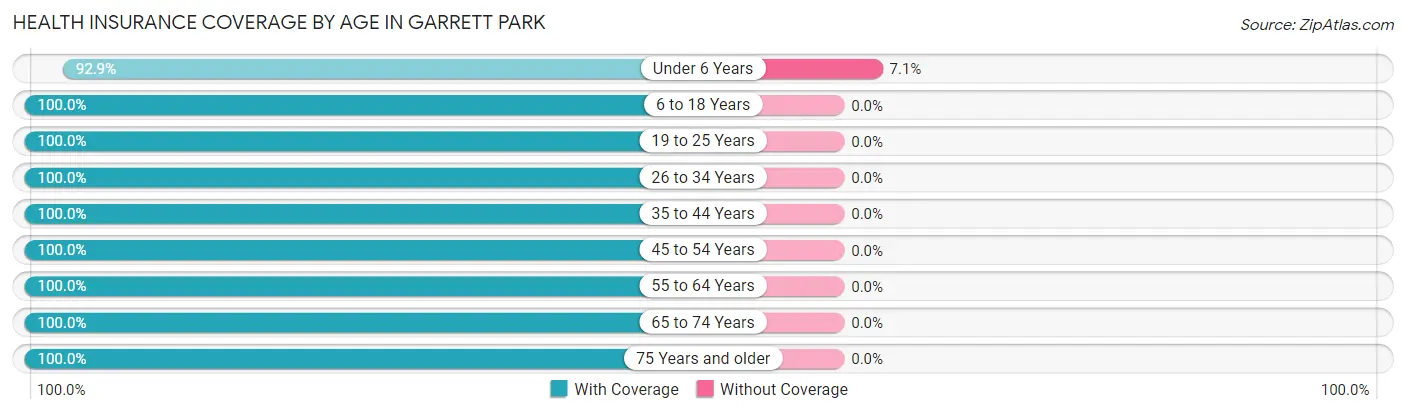
| Age Bracket | With Coverage | Without Coverage |
| Under 6 Years | 39 (92.9%) | 3 (7.1%) |
| 6 to 18 Years | 112 (100.0%) | 0 (0.0%) |
| 19 to 25 Years | 72 (100.0%) | 0 (0.0%) |
| 26 to 34 Years | 29 (100.0%) | 0 (0.0%) |
| 35 to 44 Years | 107 (100.0%) | 0 (0.0%) |
| 45 to 54 Years | 88 (100.0%) | 0 (0.0%) |
| 55 to 64 Years | 153 (100.0%) | 0 (0.0%) |
| 65 to 74 Years | 123 (100.0%) | 0 (0.0%) |
| 75 Years and older | 90 (100.0%) | 0 (0.0%) |
| Total | 813 (99.6%) | 3 (0.4%) |
Health Insurance Coverage by Citizenship Status in Garrett Park
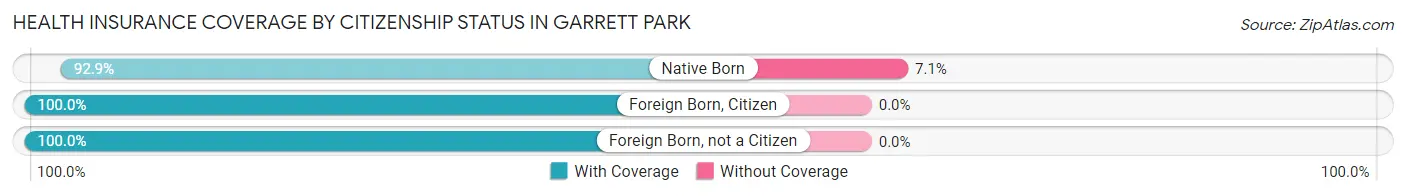
| Citizenship Status | With Coverage | Without Coverage |
| Native Born | 39 (92.9%) | 3 (7.1%) |
| Foreign Born, Citizen | 112 (100.0%) | 0 (0.0%) |
| Foreign Born, not a Citizen | 72 (100.0%) | 0 (0.0%) |
Health Insurance Coverage by Household Income in Garrett Park
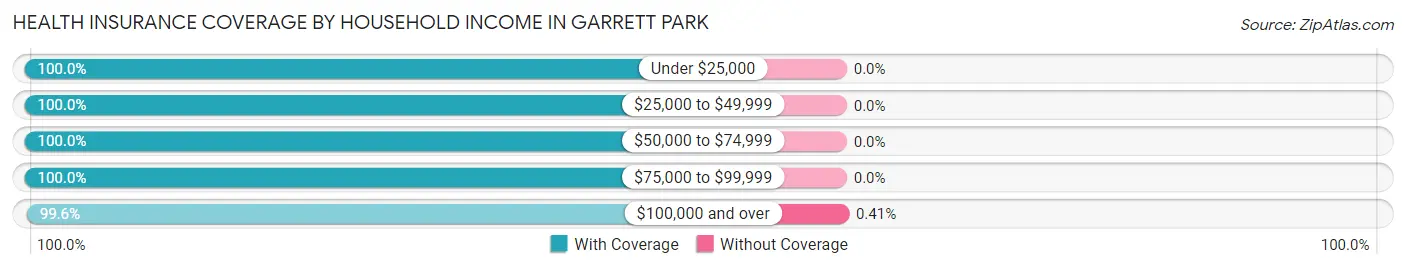
| Household Income | With Coverage | Without Coverage |
| Under $25,000 | 5 (100.0%) | 0 (0.0%) |
| $25,000 to $49,999 | 29 (100.0%) | 0 (0.0%) |
| $50,000 to $74,999 | 39 (100.0%) | 0 (0.0%) |
| $75,000 to $99,999 | 18 (100.0%) | 0 (0.0%) |
| $100,000 and over | 722 (99.6%) | 3 (0.4%) |
Public vs Private Health Insurance Coverage by Age in Garrett Park
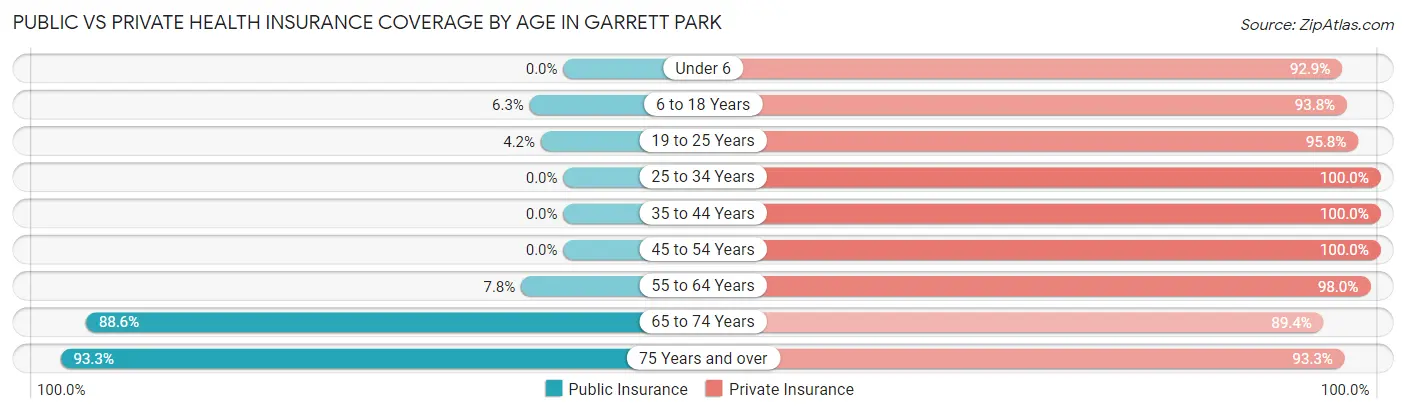
| Age Bracket | Public Insurance | Private Insurance |
| Under 6 | 0 (0.0%) | 39 (92.9%) |
| 6 to 18 Years | 7 (6.2%) | 105 (93.8%) |
| 19 to 25 Years | 3 (4.2%) | 69 (95.8%) |
| 25 to 34 Years | 0 (0.0%) | 29 (100.0%) |
| 35 to 44 Years | 0 (0.0%) | 107 (100.0%) |
| 45 to 54 Years | 0 (0.0%) | 88 (100.0%) |
| 55 to 64 Years | 12 (7.8%) | 150 (98.0%) |
| 65 to 74 Years | 109 (88.6%) | 110 (89.4%) |
| 75 Years and over | 84 (93.3%) | 84 (93.3%) |
| Total | 215 (26.4%) | 781 (95.7%) |
Disability Status by Sex by Age in Garrett Park
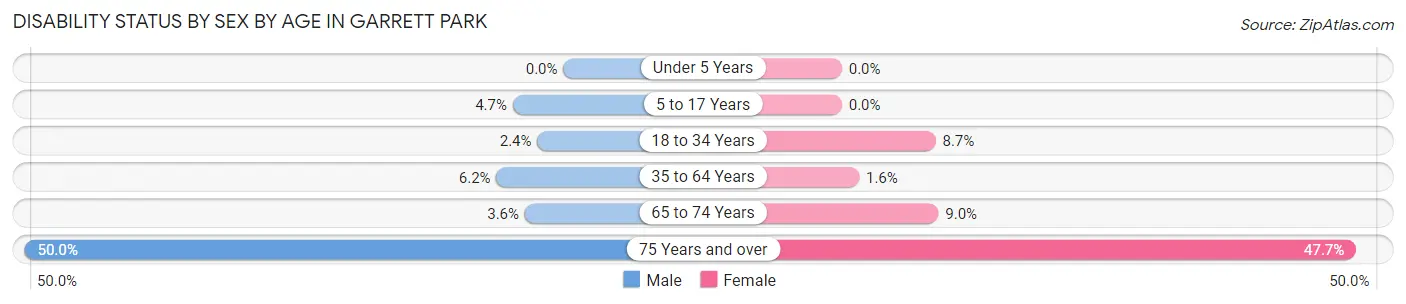
| Age Bracket | Male | Female |
| Under 5 Years | 0 (0.0%) | 0 (0.0%) |
| 5 to 17 Years | 3 (4.7%) | 0 (0.0%) |
| 18 to 34 Years | 2 (2.4%) | 2 (8.7%) |
| 35 to 64 Years | 10 (6.2%) | 3 (1.6%) |
| 65 to 74 Years | 2 (3.6%) | 6 (9.0%) |
| 75 Years and over | 23 (50.0%) | 21 (47.7%) |
Disability Class by Sex by Age in Garrett Park
Disability Class: Hearing Difficulty
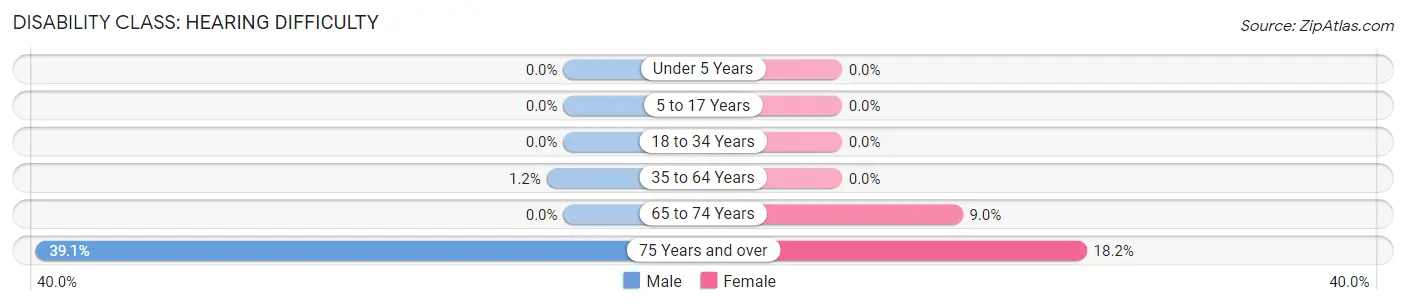
| Age Bracket | Male | Female |
| Under 5 Years | 0 (0.0%) | 0 (0.0%) |
| 5 to 17 Years | 0 (0.0%) | 0 (0.0%) |
| 18 to 34 Years | 0 (0.0%) | 0 (0.0%) |
| 35 to 64 Years | 2 (1.2%) | 0 (0.0%) |
| 65 to 74 Years | 0 (0.0%) | 6 (9.0%) |
| 75 Years and over | 18 (39.1%) | 8 (18.2%) |
Disability Class: Vision Difficulty
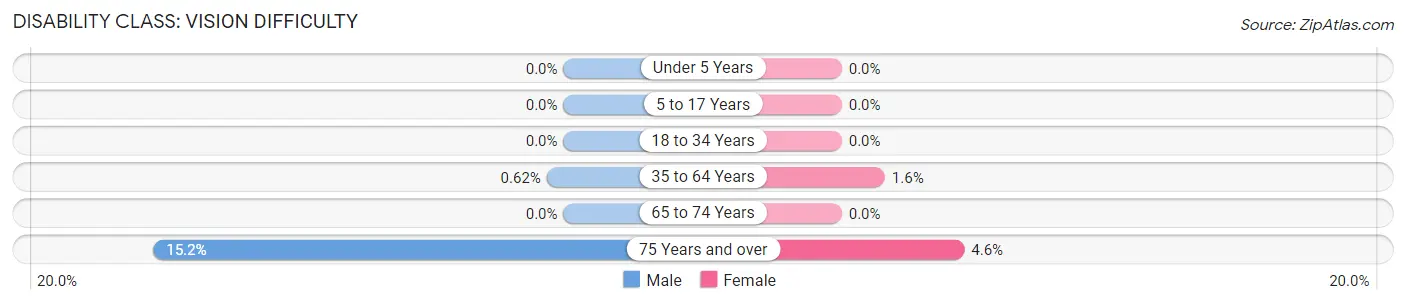
| Age Bracket | Male | Female |
| Under 5 Years | 0 (0.0%) | 0 (0.0%) |
| 5 to 17 Years | 0 (0.0%) | 0 (0.0%) |
| 18 to 34 Years | 0 (0.0%) | 0 (0.0%) |
| 35 to 64 Years | 1 (0.6%) | 3 (1.6%) |
| 65 to 74 Years | 0 (0.0%) | 0 (0.0%) |
| 75 Years and over | 7 (15.2%) | 2 (4.5%) |
Disability Class: Cognitive Difficulty
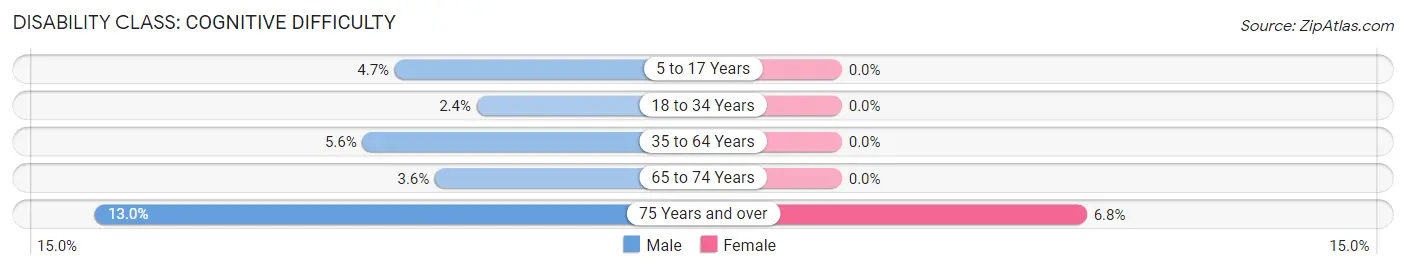
| Age Bracket | Male | Female |
| 5 to 17 Years | 3 (4.7%) | 0 (0.0%) |
| 18 to 34 Years | 2 (2.4%) | 0 (0.0%) |
| 35 to 64 Years | 9 (5.6%) | 0 (0.0%) |
| 65 to 74 Years | 2 (3.6%) | 0 (0.0%) |
| 75 Years and over | 6 (13.0%) | 3 (6.8%) |
Disability Class: Ambulatory Difficulty
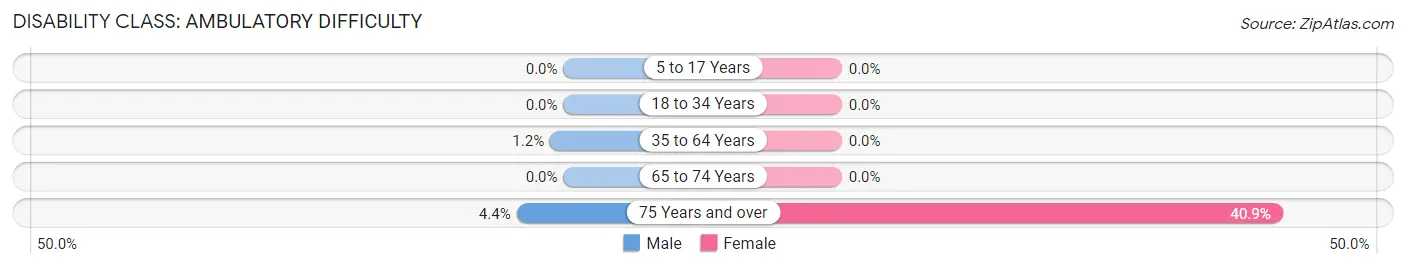
| Age Bracket | Male | Female |
| 5 to 17 Years | 0 (0.0%) | 0 (0.0%) |
| 18 to 34 Years | 0 (0.0%) | 0 (0.0%) |
| 35 to 64 Years | 2 (1.2%) | 0 (0.0%) |
| 65 to 74 Years | 0 (0.0%) | 0 (0.0%) |
| 75 Years and over | 2 (4.3%) | 18 (40.9%) |
Disability Class: Self-Care Difficulty
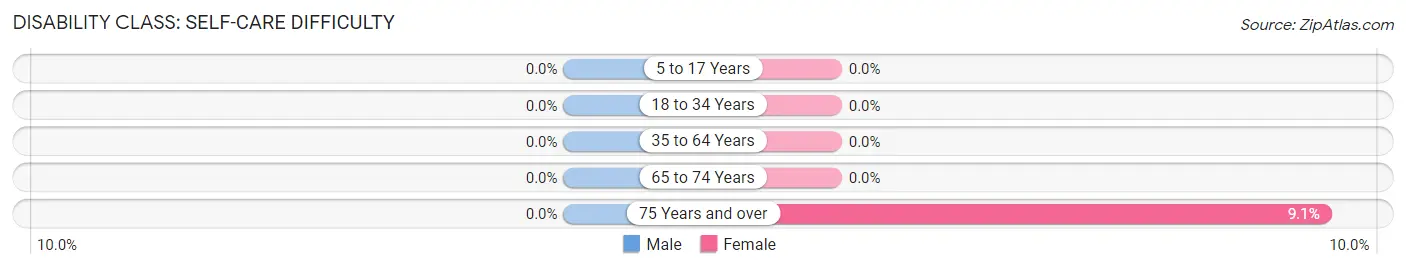
| Age Bracket | Male | Female |
| 5 to 17 Years | 0 (0.0%) | 0 (0.0%) |
| 18 to 34 Years | 0 (0.0%) | 0 (0.0%) |
| 35 to 64 Years | 0 (0.0%) | 0 (0.0%) |
| 65 to 74 Years | 0 (0.0%) | 0 (0.0%) |
| 75 Years and over | 0 (0.0%) | 4 (9.1%) |
Technology Access in Garrett Park
Computing Device Access in Garrett Park
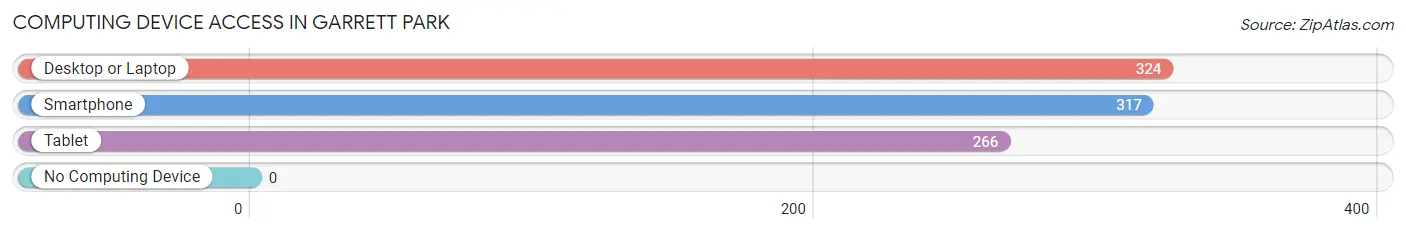
| Device Type | # Households | % Households |
| Desktop or Laptop | 324 | 100.0% |
| Smartphone | 317 | 97.8% |
| Tablet | 266 | 82.1% |
| No Computing Device | 0 | 0.0% |
| Total | 324 | 100.0% |
Internet Access in Garrett Park
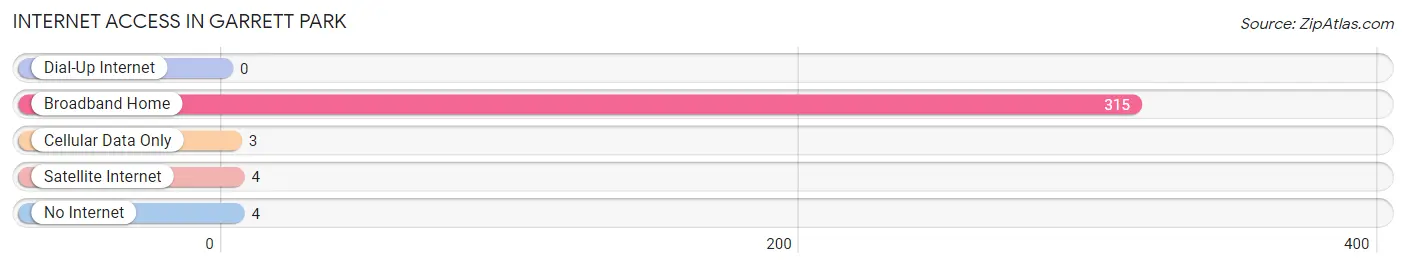
| Internet Type | # Households | % Households |
| Dial-Up Internet | 0 | 0.0% |
| Broadband Home | 315 | 97.2% |
| Cellular Data Only | 3 | 0.9% |
| Satellite Internet | 4 | 1.2% |
| No Internet | 4 | 1.2% |
| Total | 324 | 100.0% |
Garrett Park Summary
Garrett Park is a small town located in Montgomery County, Maryland, United States. It is situated approximately 10 miles north of Washington, D.C. and is part of the Washington Metropolitan Area. The town was incorporated in 1898 and has a population of 1,521 as of the 2010 census.
History
Garrett Park was founded in 1887 by a group of investors led by John Garrett, a prominent Baltimore businessman. The town was named after Garrett, who purchased the land from the estate of a local farmer. The town was originally intended to be a summer resort for wealthy Washingtonians, and the investors built a hotel, a post office, and a railroad station.
In 1898, the town was officially incorporated as a municipality. The town was designed to be a quiet, residential community, and the investors sought to keep it that way by prohibiting the sale of alcohol and restricting the number of businesses that could operate in the town.
Geography
Garrett Park is located in Montgomery County, Maryland, approximately 10 miles north of Washington, D.C. The town is situated on a plateau, with an elevation of approximately 400 feet above sea level. The town is bordered by the towns of Kensington to the north, Rockville to the east, and Bethesda to the south.
The town covers an area of 0.6 square miles, all of which is land. The town is located in the Piedmont region of Maryland, and is characterized by rolling hills and wooded areas. The town is located in the Chesapeake Bay watershed, and is drained by Rock Creek and its tributaries.
Economy
Garrett Park is a primarily residential community, and the town’s economy is largely based on the service industry. The town is home to a number of small businesses, including restaurants, retail stores, and professional services. The town is also home to a number of government contractors, including the National Institutes of Health and the National Security Agency.
Demographics
As of the 2010 census, Garrett Park had a population of 1,521. The racial makeup of the town was 94.2% White, 1.3% African American, 0.2% Native American, 1.7% Asian, 0.1% Pacific Islander, 0.7% from other races, and 1.8% from two or more races. Hispanic or Latino of any race were 3.2% of the population.
The median household income in Garrett Park was $118,958, and the median family income was $133,958. The per capita income for the town was $58,958. About 4.2% of families and 5.2% of the population were below the poverty line, including 6.2% of those under age 18 and 4.2% of those age 65 or over.
Garrett Park is a small, affluent town with a strong sense of community. The town is known for its quiet, residential atmosphere and its proximity to Washington, D.C. The town’s economy is largely based on the service industry, and the town is home to a number of government contractors. The town has a diverse population, with a median household income that is significantly higher than the national average.
Common Questions
What is Per Capita Income in Garrett Park?
Per Capita income in Garrett Park is $111,732.
What is the Median Family Income in Garrett Park?
Median Family Income in Garrett Park is $250,001.
What is the Median Household income in Garrett Park?
Median Household Income in Garrett Park is $250,001.
What is Income or Wage Gap in Garrett Park?
Income or Wage Gap in Garrett Park is 29.3%.
Women in Garrett Park earn 70.7 cents for every dollar earned by a man.
What is Inequality or Gini Index in Garrett Park?
Inequality or Gini Index in Garrett Park is 0.35.
What is the Total Population of Garrett Park?
Total Population of Garrett Park is 816.
What is the Total Male Population of Garrett Park?
Total Male Population of Garrett Park is 422.
What is the Total Female Population of Garrett Park?
Total Female Population of Garrett Park is 394.
What is the Ratio of Males per 100 Females in Garrett Park?
There are 107.11 Males per 100 Females in Garrett Park.
What is the Ratio of Females per 100 Males in Garrett Park?
There are 93.36 Females per 100 Males in Garrett Park.
What is the Median Population Age in Garrett Park?
Median Population Age in Garrett Park is 52.3 Years.
What is the Average Family Size in Garrett Park
Average Family Size in Garrett Park is 2.9 People.
What is the Average Household Size in Garrett Park
Average Household Size in Garrett Park is 2.5 People.
How Large is the Labor Force in Garrett Park?
There are 427 People in the Labor Forcein in Garrett Park.
What is the Percentage of People in the Labor Force in Garrett Park?
62.1% of People are in the Labor Force in Garrett Park.
What is the Unemployment Rate in Garrett Park?
Unemployment Rate in Garrett Park is 3.3%.