Fraser, CO Map & Demographics
Fraser Map
Fraser Overview
$43,764
PER CAPITA INCOME
$101,875
AVG FAMILY INCOME
$75,893
AVG HOUSEHOLD INCOME
17.2%
WAGE / INCOME GAP [ % ]
82.8¢/ $1
WAGE / INCOME GAP [ $ ]
0.42
INEQUALITY / GINI INDEX
1,220
TOTAL POPULATION
716
MALE POPULATION
504
FEMALE POPULATION
142.06
MALES / 100 FEMALES
70.39
FEMALES / 100 MALES
32.5
MEDIAN AGE
3.2
AVG FAMILY SIZE
2.6
AVG HOUSEHOLD SIZE
883
LABOR FORCE [ PEOPLE ]
89.3%
PERCENT IN LABOR FORCE
10.1%
UNEMPLOYMENT RATE
Fraser Zip Codes
Fraser Area Codes
Income in Fraser
Income Overview in Fraser
Per Capita Income in Fraser is $43,764, while median incomes of families and households are $101,875 and $75,893 respectively.
| Characteristic | Number | Measure |
| Per Capita Income | 1,220 | $43,764 |
| Median Family Income | 201 | $101,875 |
| Mean Family Income | 201 | $110,122 |
| Median Household Income | 457 | $75,893 |
| Mean Household Income | 457 | $90,446 |
| Income Deficit | 201 | $0 |
| Wage / Income Gap (%) | 1,220 | 17.25% |
| Wage / Income Gap ($) | 1,220 | 82.75¢ per $1 |
| Gini / Inequality Index | 1,220 | 0.42 |
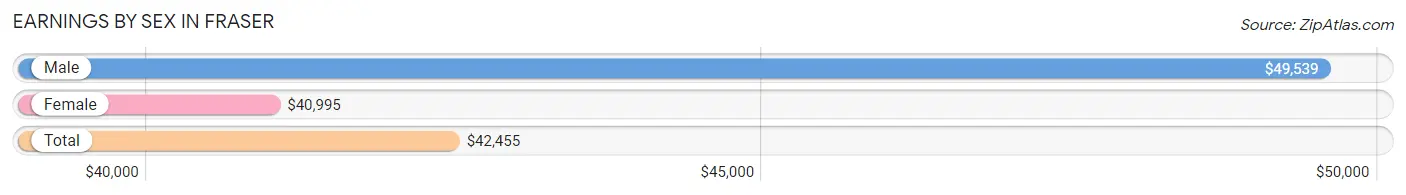
Earnings by Sex in Fraser
Average Earnings in Fraser are $42,455, $49,539 for men and $40,995 for women, a difference of 17.2%.
| Sex | Number | Average Earnings |
| Male | 561 (65.1%) | $49,539 |
| Female | 301 (34.9%) | $40,995 |
| Total | 862 (100.0%) | $42,455 |
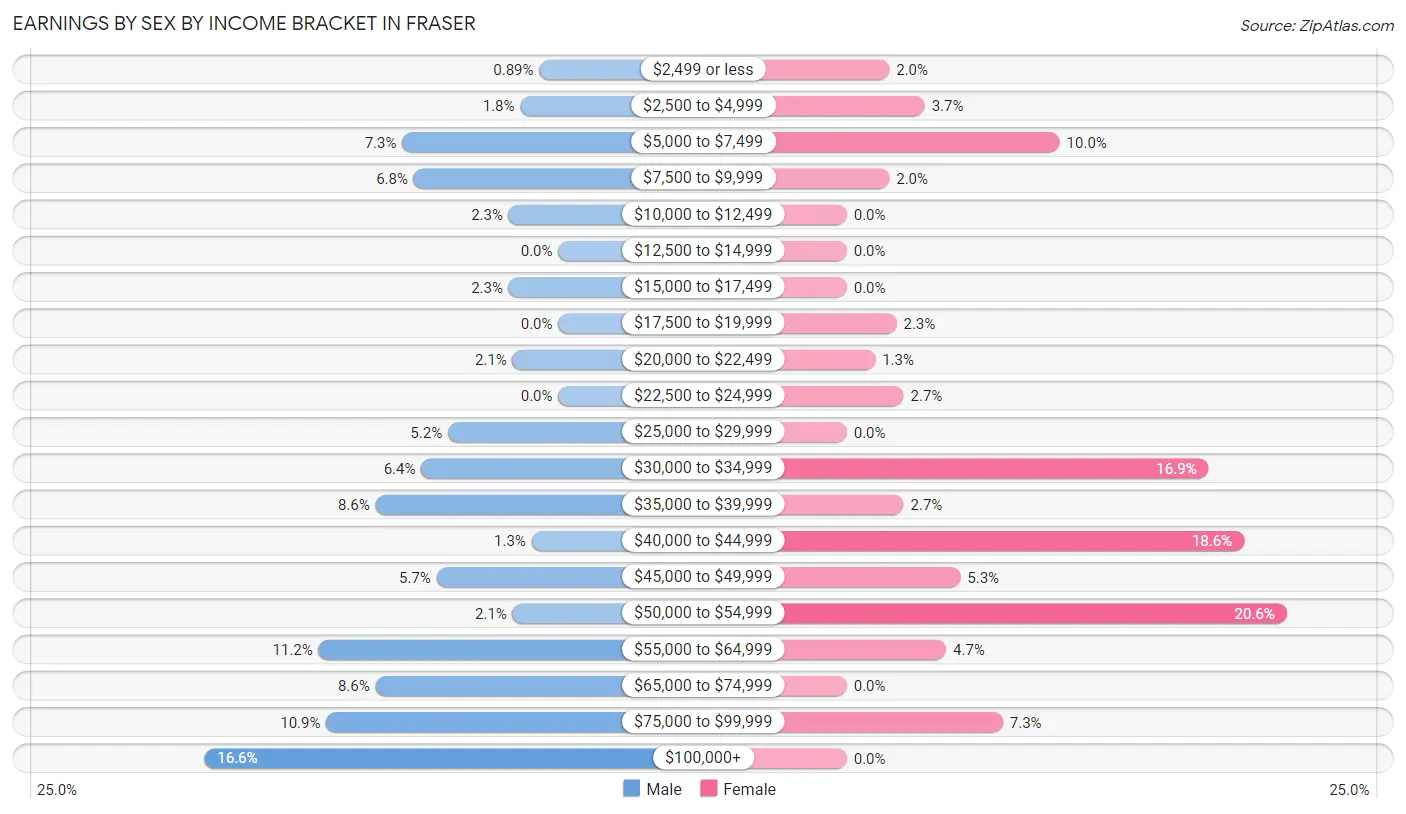
Earnings by Sex by Income Bracket in Fraser
The most common earnings brackets in Fraser are $100,000+ for men (93 | 16.6%) and $50,000 to $54,999 for women (62 | 20.6%).
| Income | Male | Female |
| $2,499 or less | 5 (0.9%) | 6 (2.0%) |
| $2,500 to $4,999 | 10 (1.8%) | 11 (3.6%) |
| $5,000 to $7,499 | 41 (7.3%) | 30 (10.0%) |
| $7,500 to $9,999 | 38 (6.8%) | 6 (2.0%) |
| $10,000 to $12,499 | 13 (2.3%) | 0 (0.0%) |
| $12,500 to $14,999 | 0 (0.0%) | 0 (0.0%) |
| $15,000 to $17,499 | 13 (2.3%) | 0 (0.0%) |
| $17,500 to $19,999 | 0 (0.0%) | 7 (2.3%) |
| $20,000 to $22,499 | 12 (2.1%) | 4 (1.3%) |
| $22,500 to $24,999 | 0 (0.0%) | 8 (2.7%) |
| $25,000 to $29,999 | 29 (5.2%) | 0 (0.0%) |
| $30,000 to $34,999 | 36 (6.4%) | 51 (16.9%) |
| $35,000 to $39,999 | 48 (8.6%) | 8 (2.7%) |
| $40,000 to $44,999 | 7 (1.3%) | 56 (18.6%) |
| $45,000 to $49,999 | 32 (5.7%) | 16 (5.3%) |
| $50,000 to $54,999 | 12 (2.1%) | 62 (20.6%) |
| $55,000 to $64,999 | 63 (11.2%) | 14 (4.6%) |
| $65,000 to $74,999 | 48 (8.6%) | 0 (0.0%) |
| $75,000 to $99,999 | 61 (10.9%) | 22 (7.3%) |
| $100,000+ | 93 (16.6%) | 0 (0.0%) |
| Total | 561 (100.0%) | 301 (100.0%) |
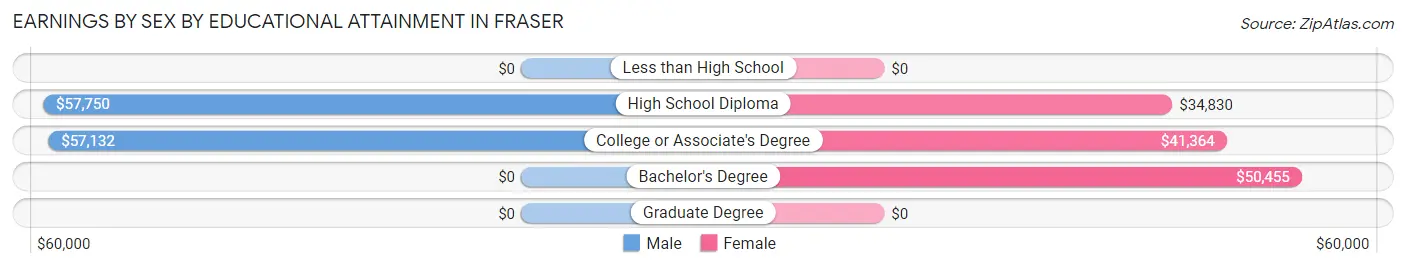
Earnings by Sex by Educational Attainment in Fraser
Average earnings in Fraser are $57,206 for men and $41,454 for women, a difference of 27.5%. Men with an educational attainment of high school diploma enjoy the highest average annual earnings of $57,750, while those with college or associate's degree education earn the least with $57,132. Women with an educational attainment of bachelor's degree earn the most with the average annual earnings of $50,455, while those with high school diploma education have the smallest earnings of $34,830.
| Educational Attainment | Male Income | Female Income |
| Less than High School | - | - |
| High School Diploma | $57,750 | $34,830 |
| College or Associate's Degree | $57,132 | $41,364 |
| Bachelor's Degree | - | - |
| Graduate Degree | - | - |
| Total | $57,206 | $41,454 |
Family Income in Fraser
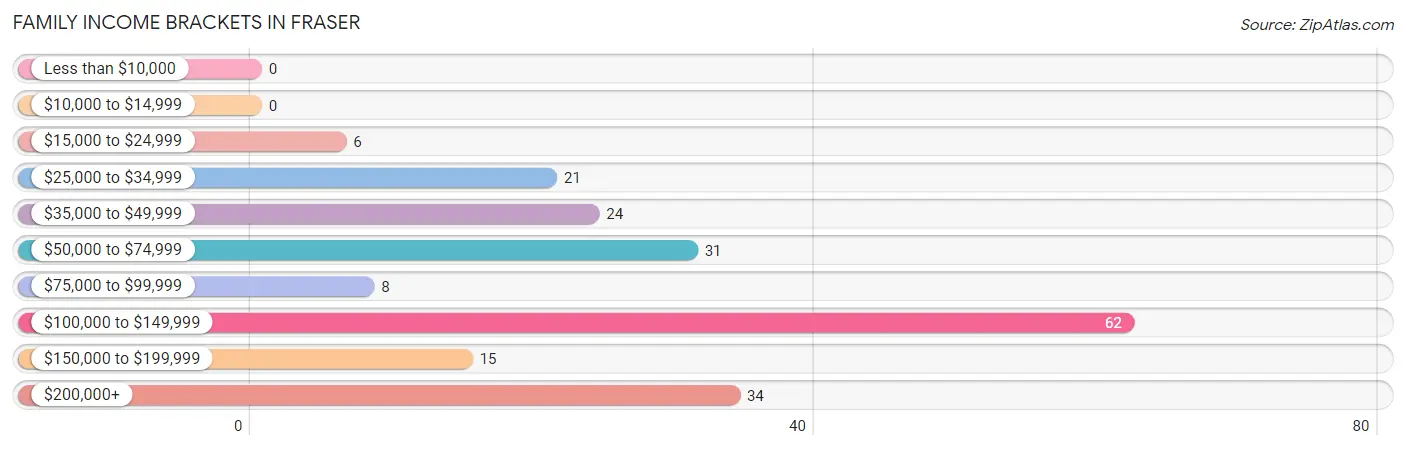
Family Income Brackets in Fraser
According to the Fraser family income data, there are 62 families falling into the $100,000 to $149,999 income range, which is the most common income bracket and makes up 30.8% of all families.
| Income Bracket | # Families | % Families |
| Less than $10,000 | 0 | 0.0% |
| $10,000 to $14,999 | 0 | 0.0% |
| $15,000 to $24,999 | 6 | 3.0% |
| $25,000 to $34,999 | 21 | 10.4% |
| $35,000 to $49,999 | 24 | 11.9% |
| $50,000 to $74,999 | 31 | 15.4% |
| $75,000 to $99,999 | 8 | 4.0% |
| $100,000 to $149,999 | 62 | 30.8% |
| $150,000 to $199,999 | 15 | 7.5% |
| $200,000+ | 34 | 16.9% |
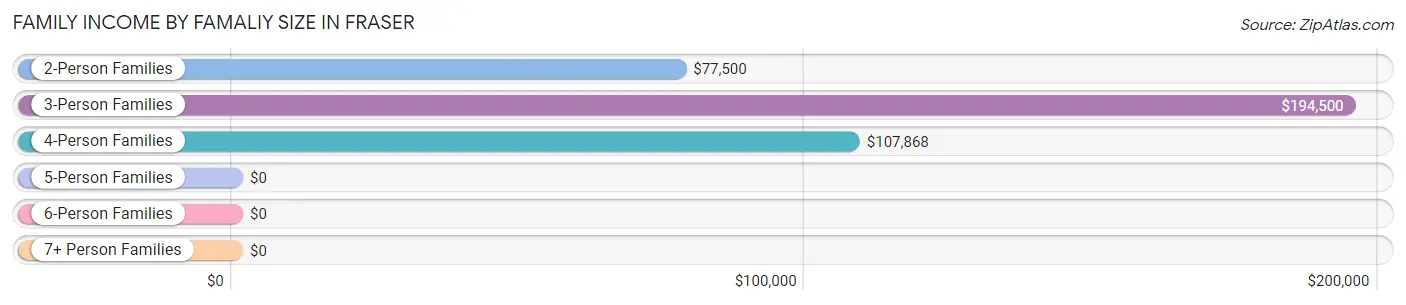
Family Income by Famaliy Size in Fraser
3-person families (54 | 26.9%) account for the highest median family income in Fraser with $194,500 per family, while 3-person families (54 | 26.9%) have the highest median income of $64,833 per family member.
| Income Bracket | # Families | Median Income |
| 2-Person Families | 118 (58.7%) | $77,500 |
| 3-Person Families | 54 (26.9%) | $194,500 |
| 4-Person Families | 29 (14.4%) | $107,868 |
| 5-Person Families | 0 (0.0%) | $0 |
| 6-Person Families | 0 (0.0%) | $0 |
| 7+ Person Families | 0 (0.0%) | $0 |
| Total | 201 (100.0%) | $101,875 |
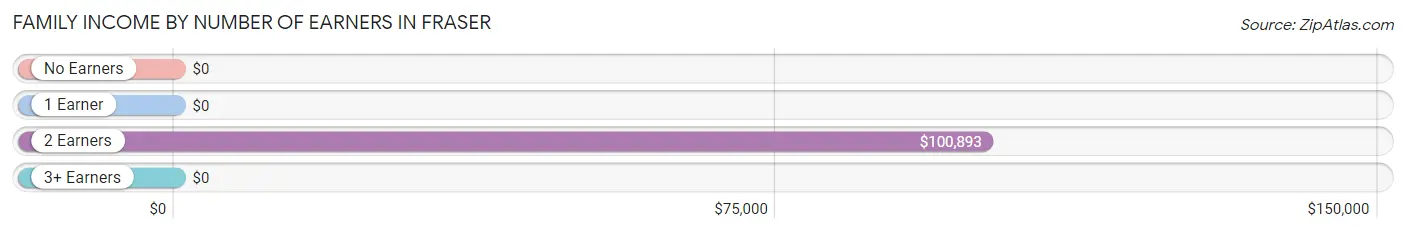
Family Income by Number of Earners in Fraser
| Number of Earners | # Families | Median Income |
| No Earners | 10 (5.0%) | $0 |
| 1 Earner | 64 (31.8%) | $0 |
| 2 Earners | 110 (54.7%) | $100,893 |
| 3+ Earners | 17 (8.5%) | $0 |
| Total | 201 (100.0%) | $101,875 |
Household Income in Fraser
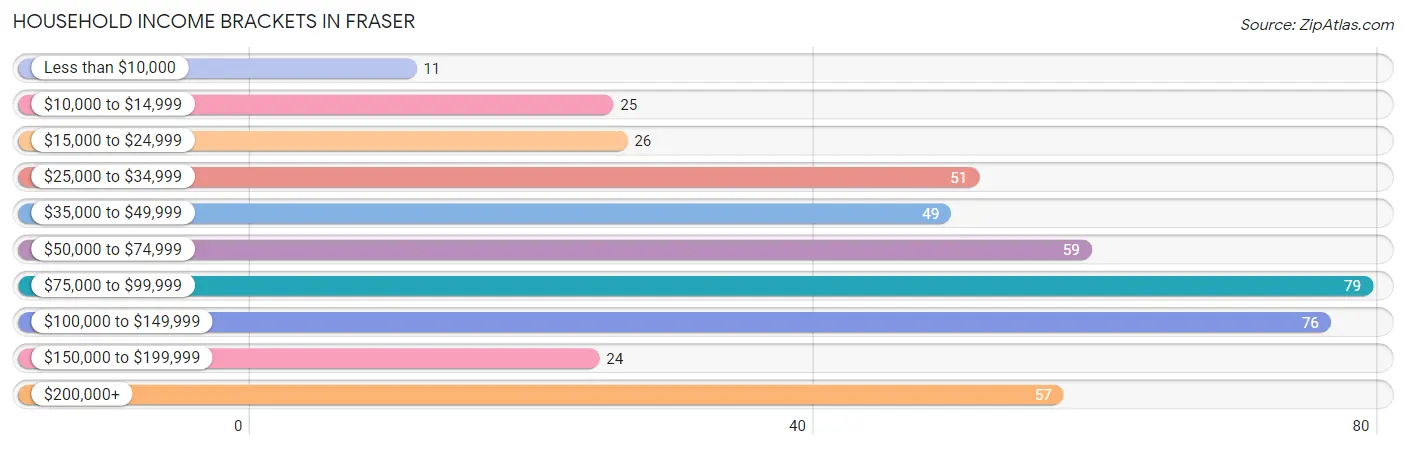
Household Income Brackets in Fraser
With 79 households falling in the category, the $75,000 to $99,999 income range is the most frequent in Fraser, accounting for 17.3% of all households. In contrast, only 11 households (2.4%) fall into the less than $10,000 income bracket, making it the least populous group.
| Income Bracket | # Households | % Households |
| Less than $10,000 | 11 | 2.4% |
| $10,000 to $14,999 | 25 | 5.5% |
| $15,000 to $24,999 | 26 | 5.7% |
| $25,000 to $34,999 | 51 | 11.2% |
| $35,000 to $49,999 | 49 | 10.7% |
| $50,000 to $74,999 | 59 | 12.9% |
| $75,000 to $99,999 | 79 | 17.3% |
| $100,000 to $149,999 | 76 | 16.6% |
| $150,000 to $199,999 | 24 | 5.3% |
| $200,000+ | 57 | 12.5% |
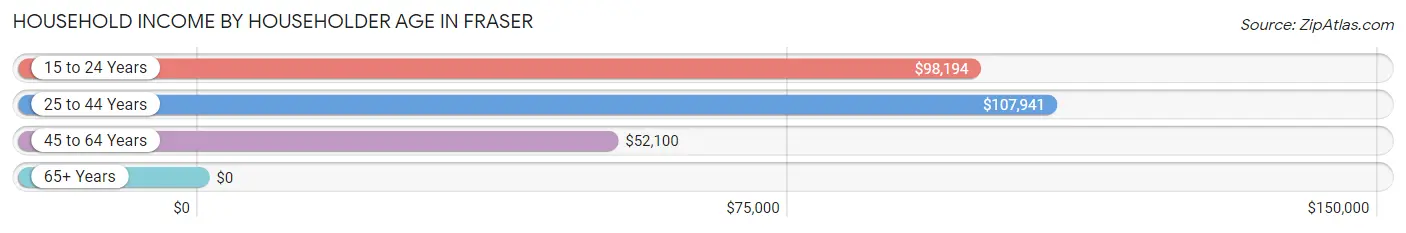
Household Income by Householder Age in Fraser
The median household income in Fraser is $75,893, with the highest median household income of $107,941 found in the 25 to 44 years age bracket for the primary householder. A total of 190 households (41.6%) fall into this category. Meanwhile, the 65+ years age bracket for the primary householder has the lowest median household income of $0, with 34 households (7.4%) in this group.
| Income Bracket | # Households | Median Income |
| 15 to 24 Years | 35 (7.7%) | $98,194 |
| 25 to 44 Years | 190 (41.6%) | $107,941 |
| 45 to 64 Years | 198 (43.3%) | $52,100 |
| 65+ Years | 34 (7.4%) | $0 |
| Total | 457 (100.0%) | $75,893 |
Poverty in Fraser
Income Below Poverty by Sex and Age in Fraser
With 13.0% poverty level for males and 11.9% for females among the residents of Fraser, 18 to 24 year old males and 65 to 74 year old females are the most vulnerable to poverty, with 36 males (36.0%) and 11 females (52.4%) in their respective age groups living below the poverty level.
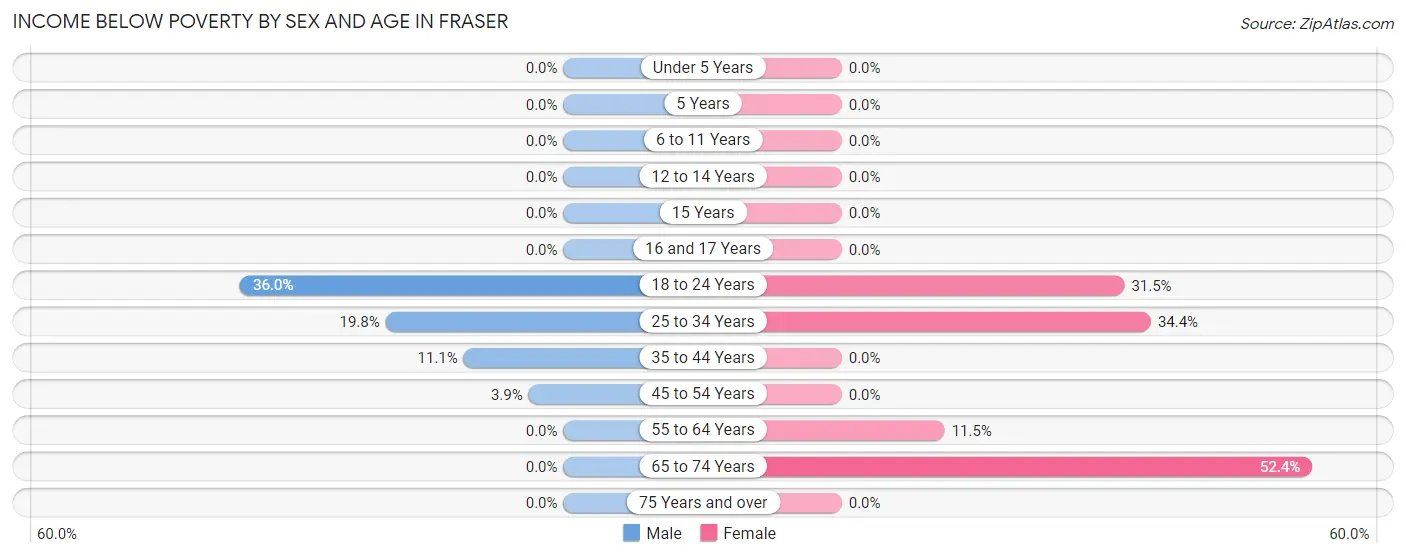
| Age Bracket | Male | Female |
| Under 5 Years | 0 (0.0%) | 0 (0.0%) |
| 5 Years | 0 (0.0%) | 0 (0.0%) |
| 6 to 11 Years | 0 (0.0%) | 0 (0.0%) |
| 12 to 14 Years | 0 (0.0%) | 0 (0.0%) |
| 15 Years | 0 (0.0%) | 0 (0.0%) |
| 16 and 17 Years | 0 (0.0%) | 0 (0.0%) |
| 18 to 24 Years | 36 (36.0%) | 17 (31.5%) |
| 25 to 34 Years | 39 (19.8%) | 21 (34.4%) |
| 35 to 44 Years | 13 (11.1%) | 0 (0.0%) |
| 45 to 54 Years | 5 (3.9%) | 0 (0.0%) |
| 55 to 64 Years | 0 (0.0%) | 11 (11.5%) |
| 65 to 74 Years | 0 (0.0%) | 11 (52.4%) |
| 75 Years and over | 0 (0.0%) | 0 (0.0%) |
| Total | 93 (13.0%) | 60 (11.9%) |
Income Above Poverty by Sex and Age in Fraser
According to the poverty statistics in Fraser, males aged under 5 years and females aged under 5 years are the age groups that are most secure financially, with 100.0% of males and 100.0% of females in these age groups living above the poverty line.
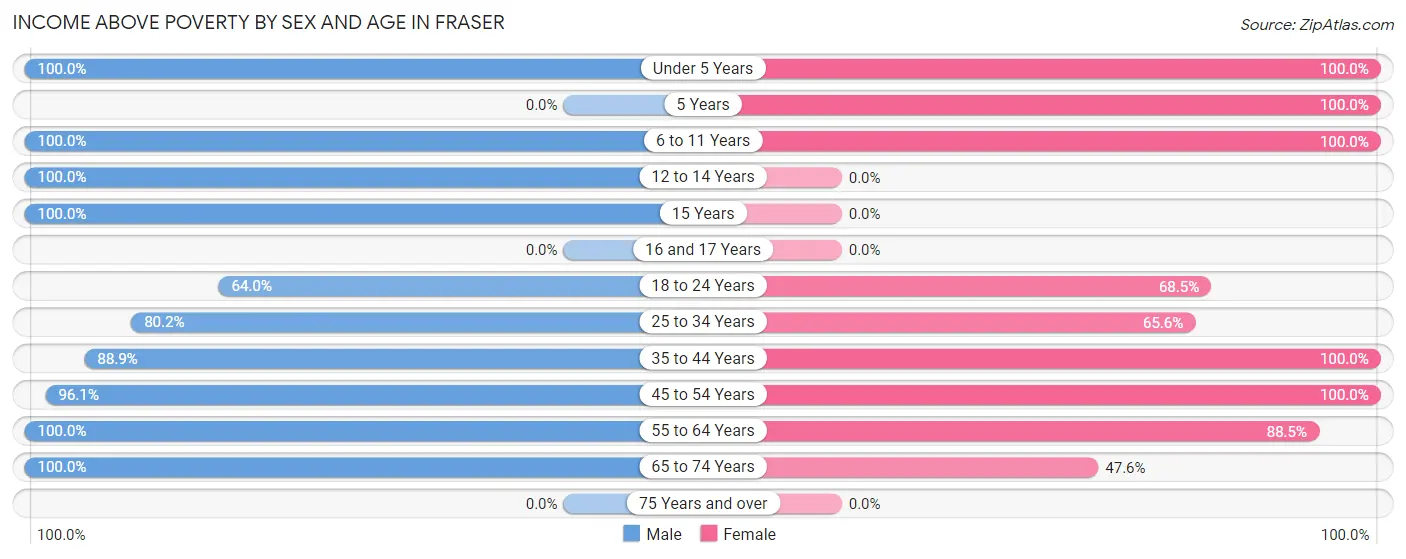
| Age Bracket | Male | Female |
| Under 5 Years | 9 (100.0%) | 70 (100.0%) |
| 5 Years | 0 (0.0%) | 18 (100.0%) |
| 6 to 11 Years | 30 (100.0%) | 44 (100.0%) |
| 12 to 14 Years | 29 (100.0%) | 0 (0.0%) |
| 15 Years | 31 (100.0%) | 0 (0.0%) |
| 16 and 17 Years | 0 (0.0%) | 0 (0.0%) |
| 18 to 24 Years | 64 (64.0%) | 37 (68.5%) |
| 25 to 34 Years | 158 (80.2%) | 40 (65.6%) |
| 35 to 44 Years | 104 (88.9%) | 89 (100.0%) |
| 45 to 54 Years | 124 (96.1%) | 51 (100.0%) |
| 55 to 64 Years | 51 (100.0%) | 85 (88.5%) |
| 65 to 74 Years | 23 (100.0%) | 10 (47.6%) |
| 75 Years and over | 0 (0.0%) | 0 (0.0%) |
| Total | 623 (87.0%) | 444 (88.1%) |
Income Below Poverty Among Married-Couple Families in Fraser
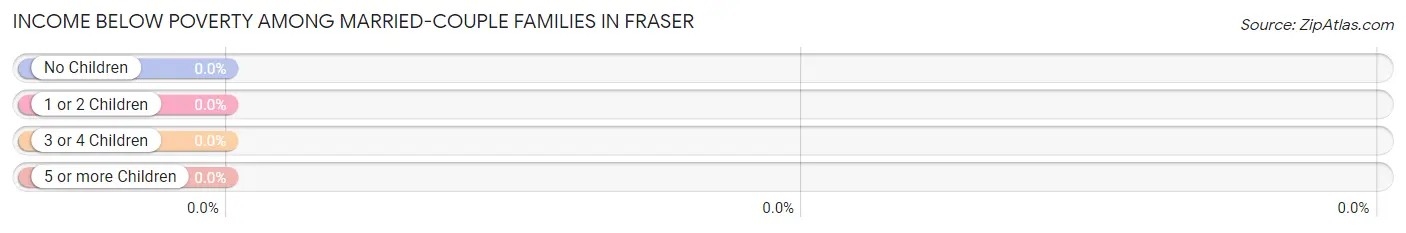
| Children | Above Poverty | Below Poverty |
| No Children | 102 (100.0%) | 0 (0.0%) |
| 1 or 2 Children | 66 (100.0%) | 0 (0.0%) |
| 3 or 4 Children | 0 (0.0%) | 0 (0.0%) |
| 5 or more Children | 0 (0.0%) | 0 (0.0%) |
| Total | 168 (100.0%) | 0 (0.0%) |
Income Below Poverty Among Single-Parent Households in Fraser
| Children | Single Father | Single Mother |
| No Children | 0 (0.0%) | 0 (0.0%) |
| 1 or 2 Children | 0 (0.0%) | 0 (0.0%) |
| 3 or 4 Children | 0 (0.0%) | 0 (0.0%) |
| 5 or more Children | 0 (0.0%) | 0 (0.0%) |
| Total | 0 (0.0%) | 0 (0.0%) |
Income Below Poverty Among Married-Couple vs Single-Parent Households in Fraser
| Children | Married-Couple Families | Single-Parent Households |
| No Children | 0 (0.0%) | 0 (0.0%) |
| 1 or 2 Children | 0 (0.0%) | 0 (0.0%) |
| 3 or 4 Children | 0 (0.0%) | 0 (0.0%) |
| 5 or more Children | 0 (0.0%) | 0 (0.0%) |
| Total | 0 (0.0%) | 0 (0.0%) |
Race in Fraser
The most populous races in Fraser are White / Caucasian (912 | 74.8%), Hispanic or Latino (222 | 18.2%), and Two or more Races (215 | 17.6%).
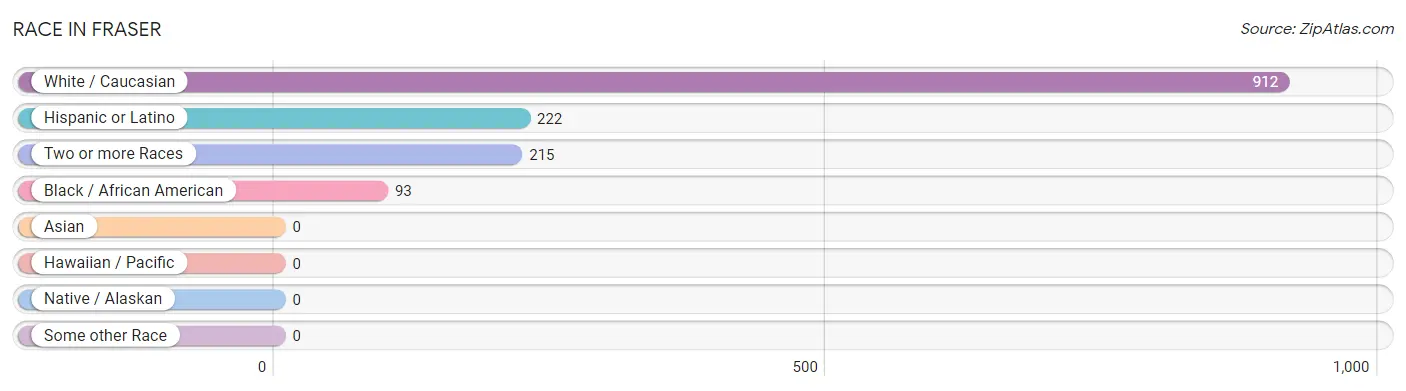
| Race | # Population | % Population |
| Asian | 0 | 0.0% |
| Black / African American | 93 | 7.6% |
| Hawaiian / Pacific | 0 | 0.0% |
| Hispanic or Latino | 222 | 18.2% |
| Native / Alaskan | 0 | 0.0% |
| White / Caucasian | 912 | 74.8% |
| Two or more Races | 215 | 17.6% |
| Some other Race | 0 | 0.0% |
| Total | 1,220 | 100.0% |
Ancestry in Fraser
The most populous ancestries reported in Fraser are Mexican (217 | 17.8%), German (163 | 13.4%), African (71 | 5.8%), Subsaharan African (71 | 5.8%), and Irish (61 | 5.0%), together accounting for 47.8% of all Fraser residents.
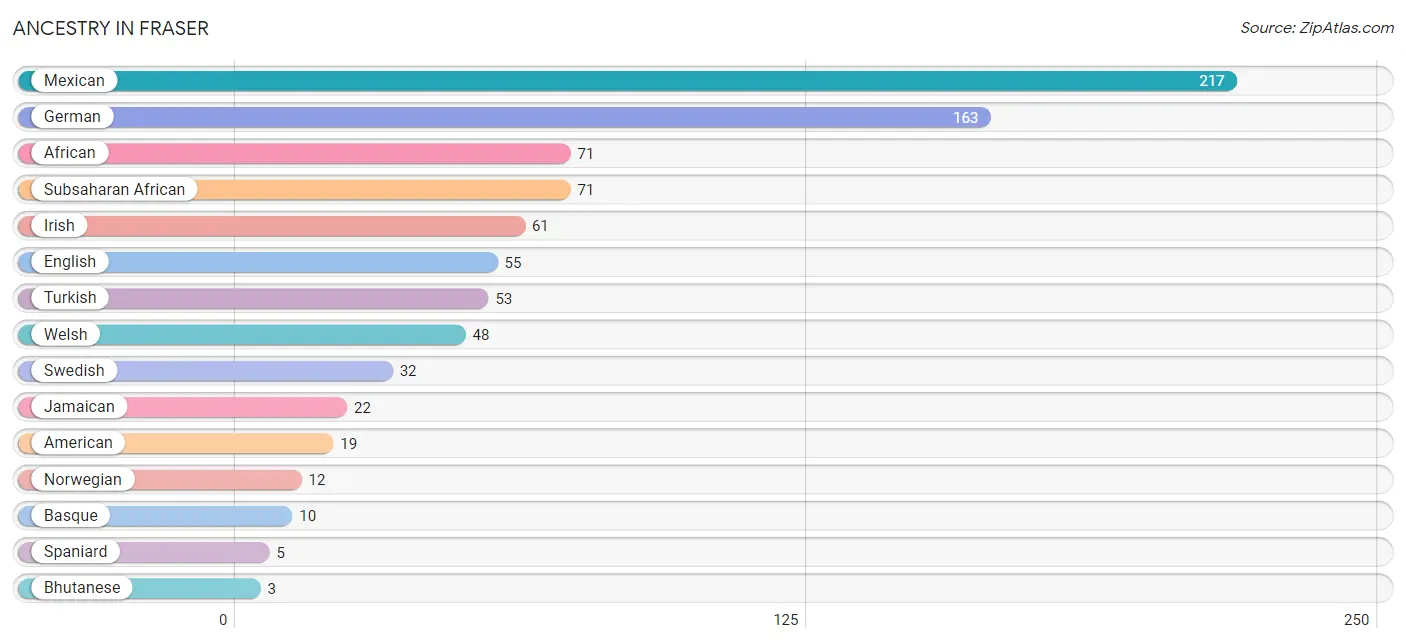
| Ancestry | # Population | % Population |
| African | 71 | 5.8% |
| American | 19 | 1.6% |
| Basque | 10 | 0.8% |
| Bhutanese | 3 | 0.3% |
| English | 55 | 4.5% |
| German | 163 | 13.4% |
| Irish | 61 | 5.0% |
| Jamaican | 22 | 1.8% |
| Mexican | 217 | 17.8% |
| Native Hawaiian | 3 | 0.3% |
| Norwegian | 12 | 1.0% |
| Spaniard | 5 | 0.4% |
| Subsaharan African | 71 | 5.8% |
| Swedish | 32 | 2.6% |
| Turkish | 53 | 4.3% |
| Welsh | 48 | 3.9% | View All 16 Rows |
Immigrants in Fraser
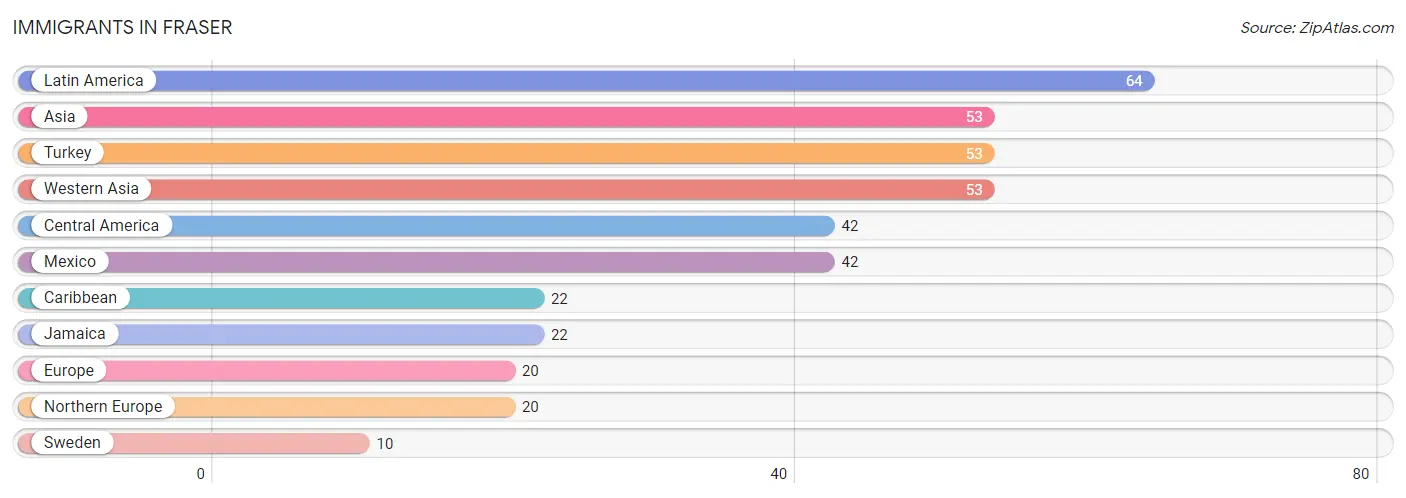
The most numerous immigrant groups reported in Fraser came from Latin America (64 | 5.2%), Asia (53 | 4.3%), Turkey (53 | 4.3%), Western Asia (53 | 4.3%), and Central America (42 | 3.4%), together accounting for 21.7% of all Fraser residents.
| Immigration Origin | # Population | % Population |
| Asia | 53 | 4.3% |
| Caribbean | 22 | 1.8% |
| Central America | 42 | 3.4% |
| Europe | 20 | 1.6% |
| Jamaica | 22 | 1.8% |
| Latin America | 64 | 5.2% |
| Mexico | 42 | 3.4% |
| Northern Europe | 20 | 1.6% |
| Sweden | 10 | 0.8% |
| Turkey | 53 | 4.3% |
| Western Asia | 53 | 4.3% | View All 11 Rows |
Sex and Age in Fraser
Sex and Age in Fraser
The most populous age groups in Fraser are 25 to 29 Years (113 | 15.8%) for men and Under 5 Years (70 | 13.9%) for women.
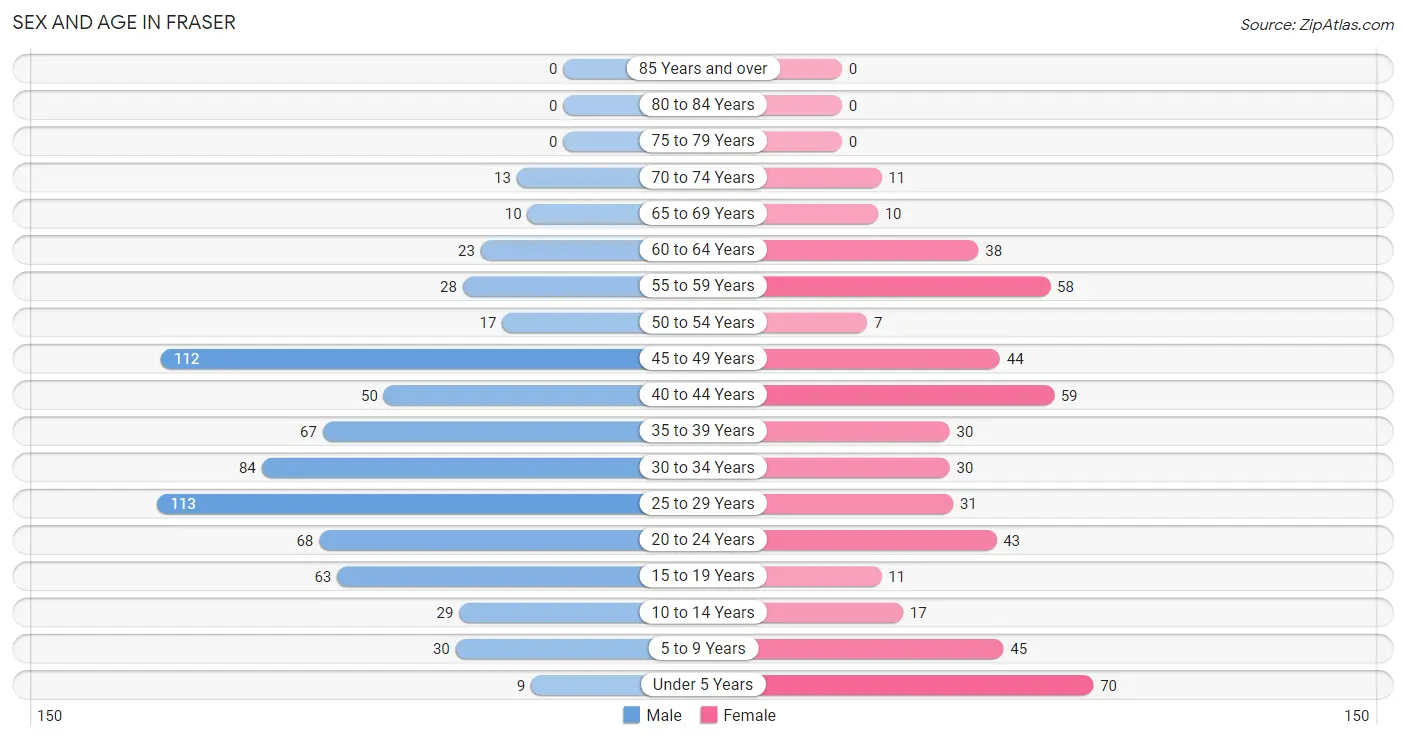
| Age Bracket | Male | Female |
| Under 5 Years | 9 (1.3%) | 70 (13.9%) |
| 5 to 9 Years | 30 (4.2%) | 45 (8.9%) |
| 10 to 14 Years | 29 (4.1%) | 17 (3.4%) |
| 15 to 19 Years | 63 (8.8%) | 11 (2.2%) |
| 20 to 24 Years | 68 (9.5%) | 43 (8.5%) |
| 25 to 29 Years | 113 (15.8%) | 31 (6.1%) |
| 30 to 34 Years | 84 (11.7%) | 30 (5.9%) |
| 35 to 39 Years | 67 (9.4%) | 30 (5.9%) |
| 40 to 44 Years | 50 (7.0%) | 59 (11.7%) |
| 45 to 49 Years | 112 (15.6%) | 44 (8.7%) |
| 50 to 54 Years | 17 (2.4%) | 7 (1.4%) |
| 55 to 59 Years | 28 (3.9%) | 58 (11.5%) |
| 60 to 64 Years | 23 (3.2%) | 38 (7.5%) |
| 65 to 69 Years | 10 (1.4%) | 10 (2.0%) |
| 70 to 74 Years | 13 (1.8%) | 11 (2.2%) |
| 75 to 79 Years | 0 (0.0%) | 0 (0.0%) |
| 80 to 84 Years | 0 (0.0%) | 0 (0.0%) |
| 85 Years and over | 0 (0.0%) | 0 (0.0%) |
| Total | 716 (100.0%) | 504 (100.0%) |
Families and Households in Fraser
Median Family Size in Fraser
The median family size in Fraser is 3.25 persons per family, with single male/father families (10 | 5.0%) accounting for the largest median family size of 3.6 persons per family. On the other hand, single female/mother families (23 | 11.4%) represent the smallest median family size with 2.83 persons per family.
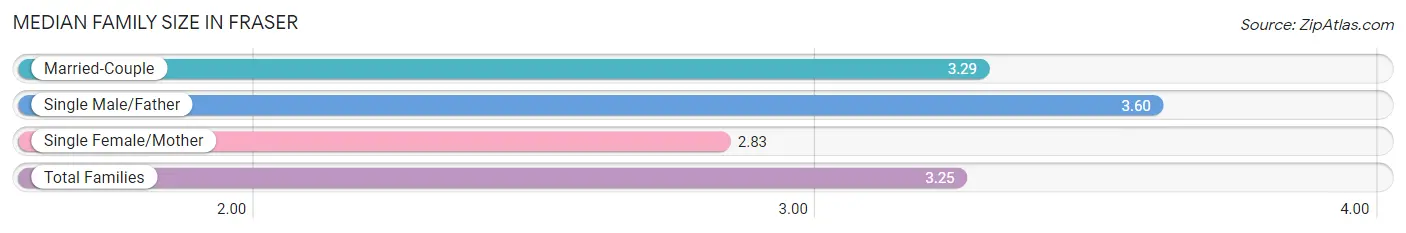
| Family Type | # Families | Family Size |
| Married-Couple | 168 (83.6%) | 3.29 |
| Single Male/Father | 10 (5.0%) | 3.60 |
| Single Female/Mother | 23 (11.4%) | 2.83 |
| Total Families | 201 (100.0%) | 3.25 |
Median Household Size in Fraser
The median household size in Fraser is 2.64 persons per household, with single male/father households (10 | 2.2%) accounting for the largest median household size of 3.6 persons per household. non-family households (256 | 56.0%) represent the smallest median household size with 1.96 persons per household.
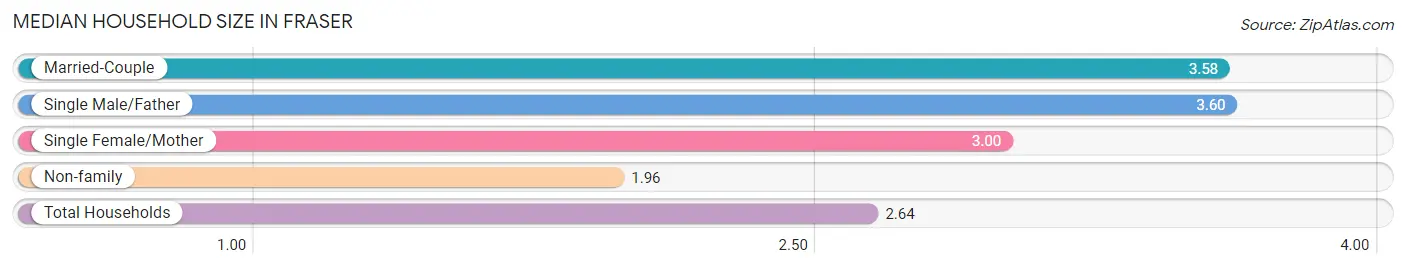
| Household Type | # Households | Household Size |
| Married-Couple | 168 (36.8%) | 3.58 |
| Single Male/Father | 10 (2.2%) | 3.60 |
| Single Female/Mother | 23 (5.0%) | 3.00 |
| Non-family | 256 (56.0%) | 1.96 |
| Total Households | 457 (100.0%) | 2.64 |
Household Size by Marriage Status in Fraser
Out of a total of 457 households in Fraser, 201 (44.0%) are family households, while 256 (56.0%) are nonfamily households. The most numerous type of family households are 2-person households, comprising 101, and the most common type of nonfamily households are 1-person households, comprising 192.
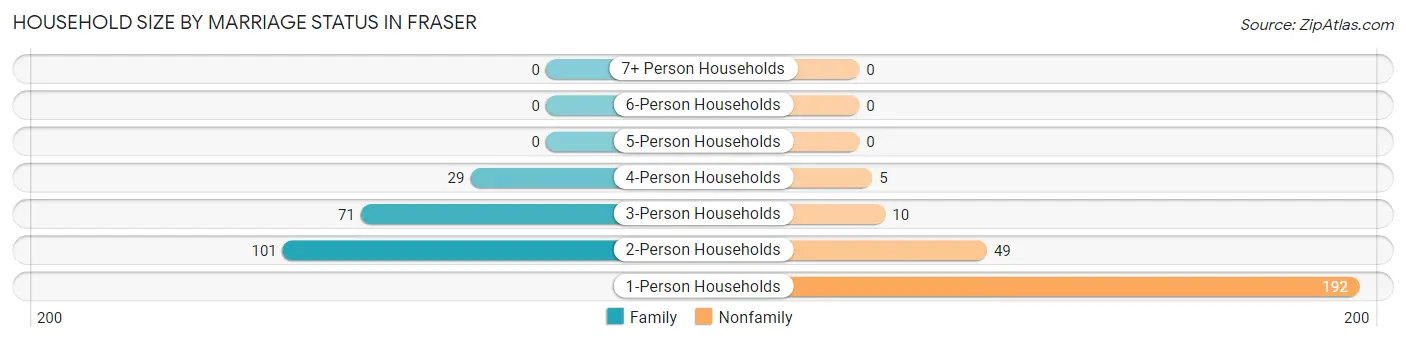
| Household Size | Family Households | Nonfamily Households |
| 1-Person Households | - | 192 (42.0%) |
| 2-Person Households | 101 (22.1%) | 49 (10.7%) |
| 3-Person Households | 71 (15.5%) | 10 (2.2%) |
| 4-Person Households | 29 (6.4%) | 5 (1.1%) |
| 5-Person Households | 0 (0.0%) | 0 (0.0%) |
| 6-Person Households | 0 (0.0%) | 0 (0.0%) |
| 7+ Person Households | 0 (0.0%) | 0 (0.0%) |
| Total | 201 (44.0%) | 256 (56.0%) |
Female Fertility in Fraser
Fertility by Age in Fraser
Average fertility rate in Fraser is 35.0 births per 1,000 women. Women in the age bracket of 20 to 34 years have the highest fertility rate with 87.0 births per 1,000 women. Women in the age bracket of 20 to 34 years acount for 100.0% of all women with births.
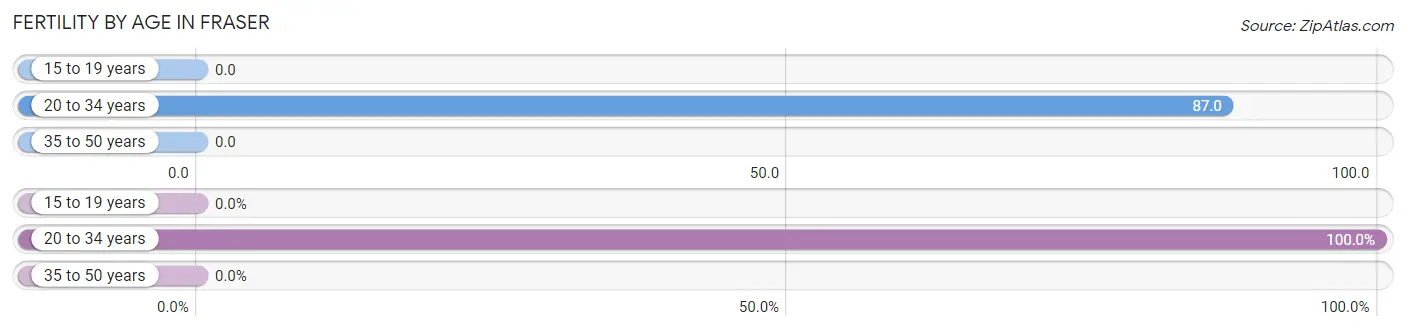
| Age Bracket | Women with Births | Births / 1,000 Women |
| 15 to 19 years | 0 (0.0%) | 0.0 |
| 20 to 34 years | 9 (100.0%) | 87.0 |
| 35 to 50 years | 0 (0.0%) | 0.0 |
| Total | 9 (100.0%) | 35.0 |
Fertility by Age by Marriage Status in Fraser
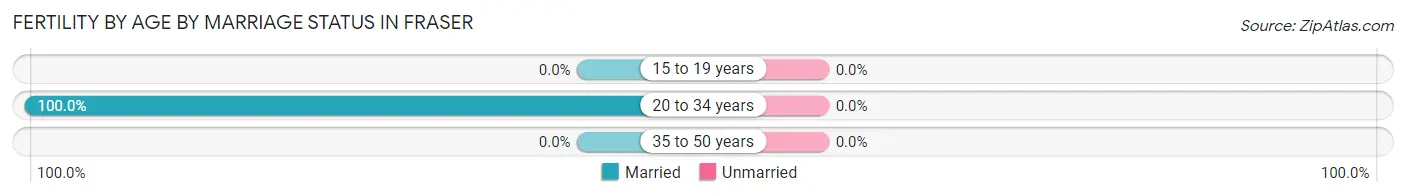
| Age Bracket | Married | Unmarried |
| 15 to 19 years | 0 (0.0%) | 0 (0.0%) |
| 20 to 34 years | 9 (100.0%) | 0 (0.0%) |
| 35 to 50 years | 0 (0.0%) | 0 (0.0%) |
| Total | 9 (100.0%) | 0 (0.0%) |
Fertility by Education in Fraser
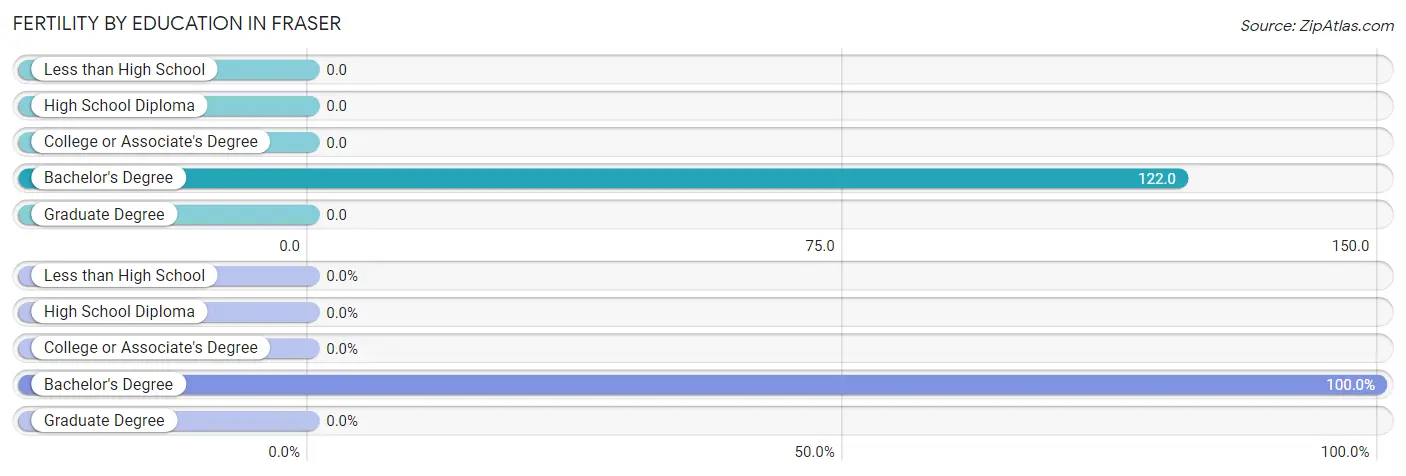
| Educational Attainment | Women with Births | Births / 1,000 Women |
| Less than High School | 0 (0.0%) | 0.0 |
| High School Diploma | 0 (0.0%) | 0.0 |
| College or Associate's Degree | 0 (0.0%) | 0.0 |
| Bachelor's Degree | 9 (100.0%) | 122.0 |
| Graduate Degree | 0 (0.0%) | 0.0 |
| Total | 9 (100.0%) | 35.0 |
Fertility by Education by Marriage Status in Fraser
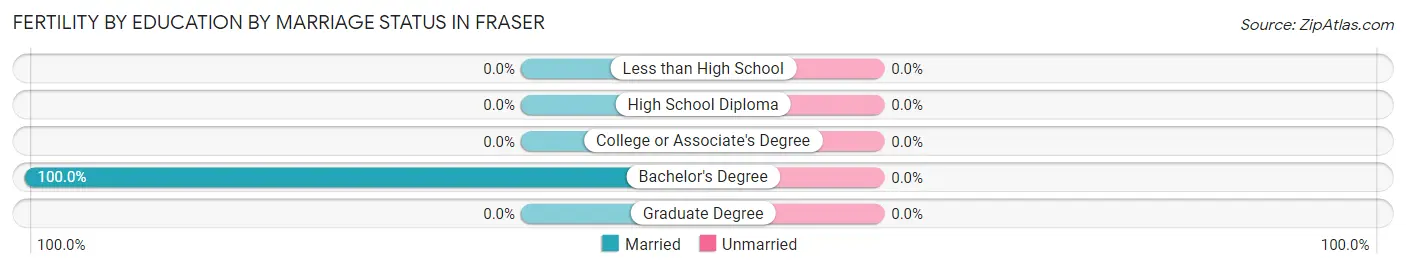
| Educational Attainment | Married | Unmarried |
| Less than High School | 0 (0.0%) | 0 (0.0%) |
| High School Diploma | 0 (0.0%) | 0 (0.0%) |
| College or Associate's Degree | 0 (0.0%) | 0 (0.0%) |
| Bachelor's Degree | 9 (100.0%) | 0 (0.0%) |
| Graduate Degree | 0 (0.0%) | 0 (0.0%) |
| Total | 9 (100.0%) | 0 (0.0%) |
Employment Characteristics in Fraser
Employment by Class of Employer in Fraser
Among the 794 employed individuals in Fraser, private company employees (721 | 90.8%), not-for-profit organizations (23 | 2.9%), and self-employed (not incorporated) (19 | 2.4%) make up the most common classes of employment.
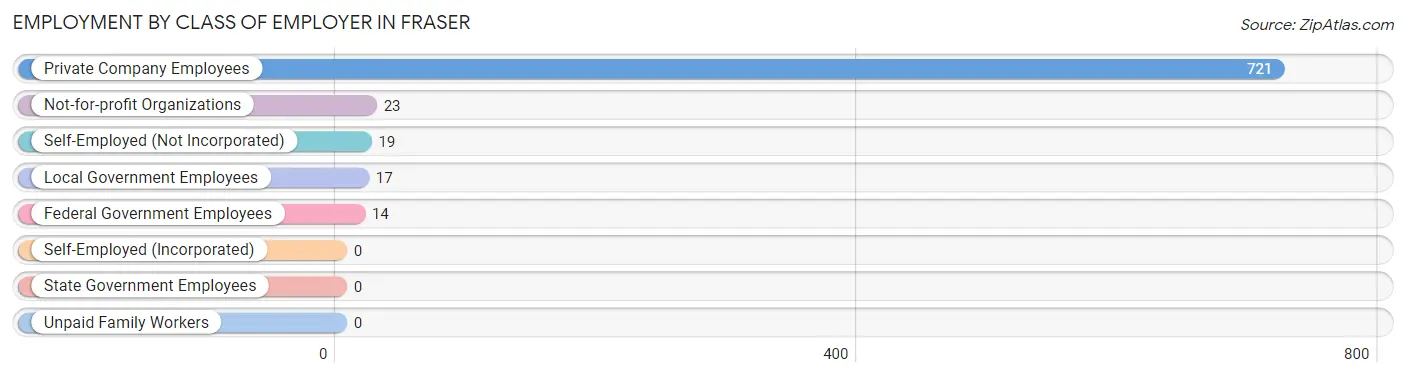
| Employer Class | # Employees | % Employees |
| Private Company Employees | 721 | 90.8% |
| Self-Employed (Incorporated) | 0 | 0.0% |
| Self-Employed (Not Incorporated) | 19 | 2.4% |
| Not-for-profit Organizations | 23 | 2.9% |
| Local Government Employees | 17 | 2.1% |
| State Government Employees | 0 | 0.0% |
| Federal Government Employees | 14 | 1.8% |
| Unpaid Family Workers | 0 | 0.0% |
| Total | 794 | 100.0% |
Employment Status by Age in Fraser
According to the labor force statistics for Fraser, out of the total population over 16 years of age (989), 89.3% or 883 individuals are in the labor force, with 10.1% or 89 of them unemployed. The age group with the highest labor force participation rate is 35 to 44 years, with 100.0% or 206 individuals in the labor force. Within the labor force, the 25 to 29 years age range has the highest percentage of unemployed individuals, with 50.4% or 59 of them being unemployed.
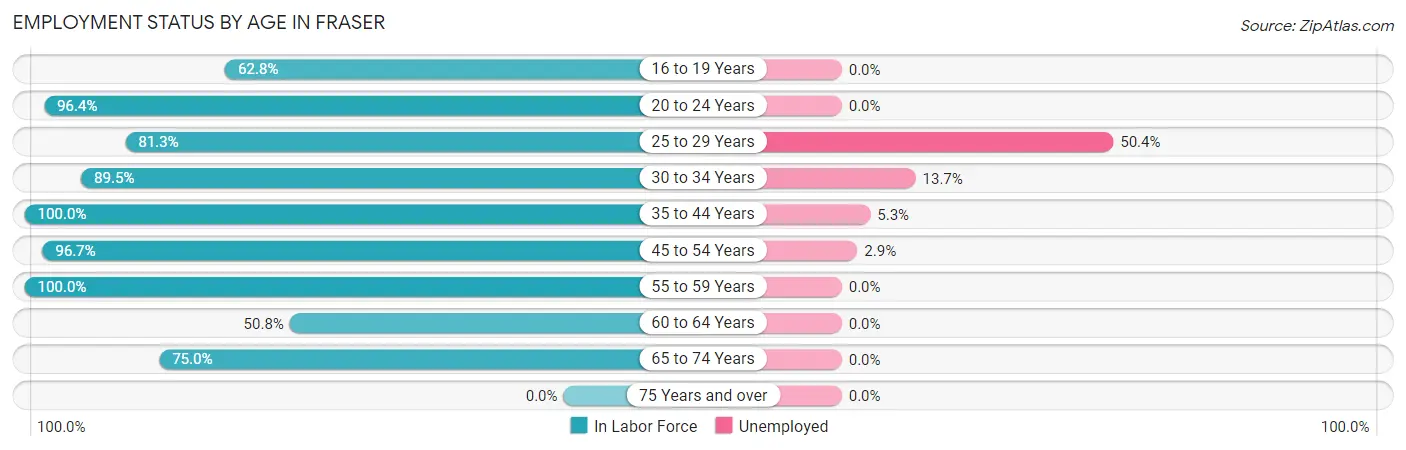
| Age Bracket | In Labor Force | Unemployed |
| 16 to 19 Years | 27 (62.8%) | 0 (0.0%) |
| 20 to 24 Years | 107 (96.4%) | 0 (0.0%) |
| 25 to 29 Years | 117 (81.3%) | 59 (50.4%) |
| 30 to 34 Years | 102 (89.5%) | 14 (13.7%) |
| 35 to 44 Years | 206 (100.0%) | 11 (5.3%) |
| 45 to 54 Years | 174 (96.7%) | 5 (2.9%) |
| 55 to 59 Years | 86 (100.0%) | 0 (0.0%) |
| 60 to 64 Years | 31 (50.8%) | 0 (0.0%) |
| 65 to 74 Years | 33 (75.0%) | 0 (0.0%) |
| 75 Years and over | 0 (0.0%) | 0 (0.0%) |
| Total | 883 (89.3%) | 89 (10.1%) |
Employment Status by Educational Attainment in Fraser
According to labor force statistics for Fraser, 90.5% of individuals (716) out of the total population between 25 and 64 years of age (791) are in the labor force, with 12.4% or 89 of them being unemployed. The group with the highest labor force participation rate are those with the educational attainment of college / associate degree, with 97.0% or 289 individuals in the labor force. Within the labor force, individuals with less than high school education have the highest percentage of unemployment, with 85.2% or 46 of them being unemployed.
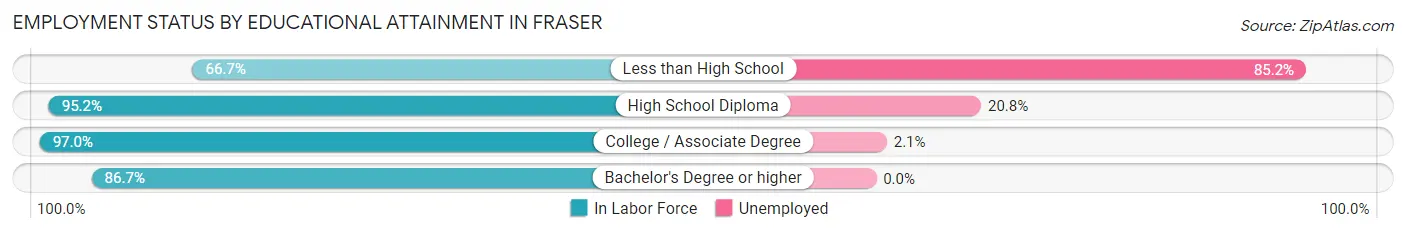
| Educational Attainment | In Labor Force | Unemployed |
| Less than High School | 54 (66.7%) | 69 (85.2%) |
| High School Diploma | 178 (95.2%) | 39 (20.8%) |
| College / Associate Degree | 289 (97.0%) | 6 (2.1%) |
| Bachelor's Degree or higher | 195 (86.7%) | 0 (0.0%) |
| Total | 716 (90.5%) | 98 (12.4%) |
Employment Occupations by Sex in Fraser
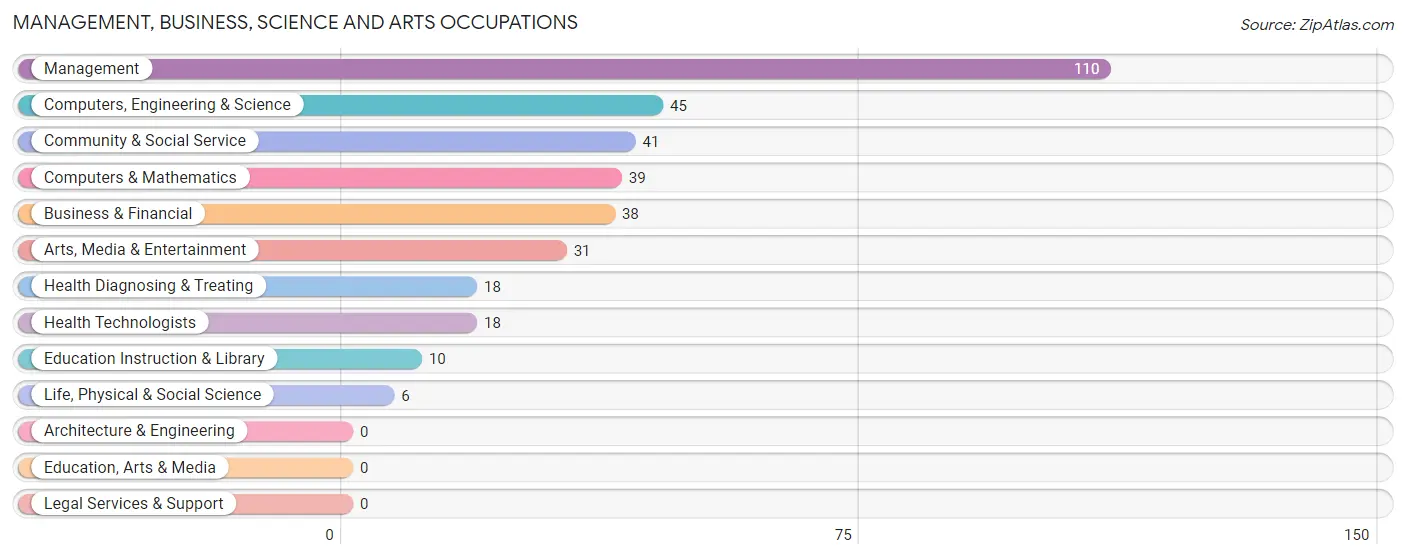
Management, Business, Science and Arts Occupations
The most common Management, Business, Science and Arts occupations in Fraser are Management (110 | 13.9%), Computers, Engineering & Science (45 | 5.7%), Community & Social Service (41 | 5.2%), Computers & Mathematics (39 | 4.9%), and Business & Financial (38 | 4.8%).
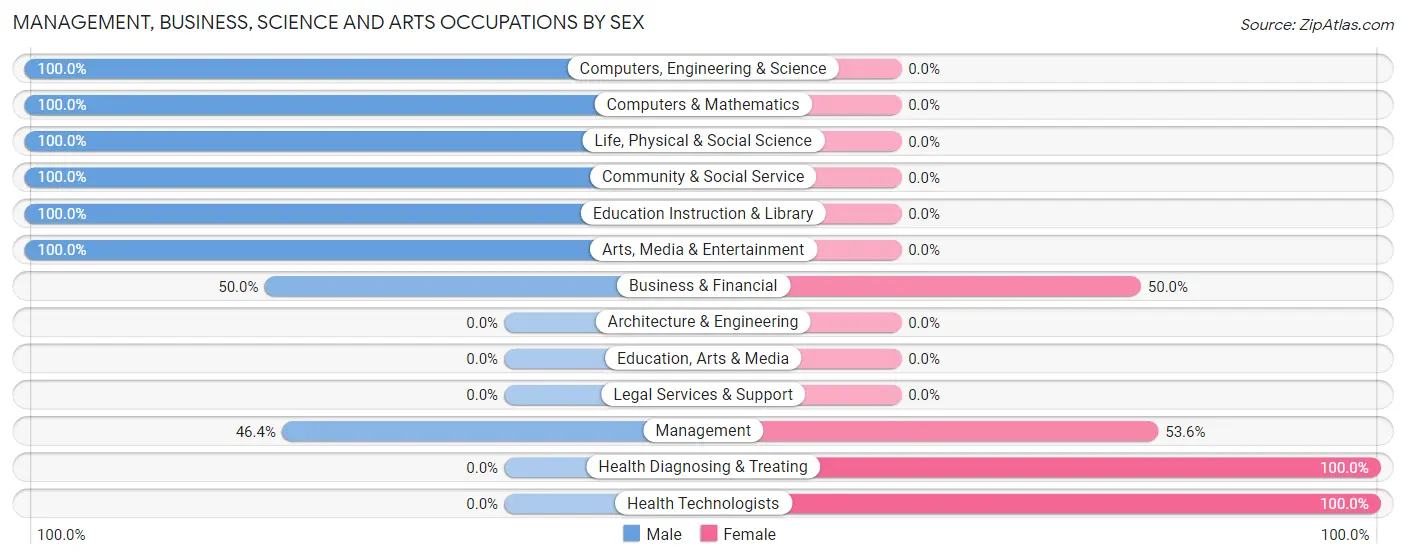
Management, Business, Science and Arts Occupations by Sex
Within the Management, Business, Science and Arts occupations in Fraser, the most male-oriented occupations are Computers, Engineering & Science (100.0%), Computers & Mathematics (100.0%), and Life, Physical & Social Science (100.0%), while the most female-oriented occupations are Health Diagnosing & Treating (100.0%), Health Technologists (100.0%), and Management (53.6%).
| Occupation | Male | Female |
| Management | 51 (46.4%) | 59 (53.6%) |
| Business & Financial | 19 (50.0%) | 19 (50.0%) |
| Computers, Engineering & Science | 45 (100.0%) | 0 (0.0%) |
| Computers & Mathematics | 39 (100.0%) | 0 (0.0%) |
| Architecture & Engineering | 0 (0.0%) | 0 (0.0%) |
| Life, Physical & Social Science | 6 (100.0%) | 0 (0.0%) |
| Community & Social Service | 41 (100.0%) | 0 (0.0%) |
| Education, Arts & Media | 0 (0.0%) | 0 (0.0%) |
| Legal Services & Support | 0 (0.0%) | 0 (0.0%) |
| Education Instruction & Library | 10 (100.0%) | 0 (0.0%) |
| Arts, Media & Entertainment | 31 (100.0%) | 0 (0.0%) |
| Health Diagnosing & Treating | 0 (0.0%) | 18 (100.0%) |
| Health Technologists | 0 (0.0%) | 18 (100.0%) |
| Total (Category) | 156 (61.9%) | 96 (38.1%) |
| Total (Overall) | 519 (65.4%) | 275 (34.6%) |
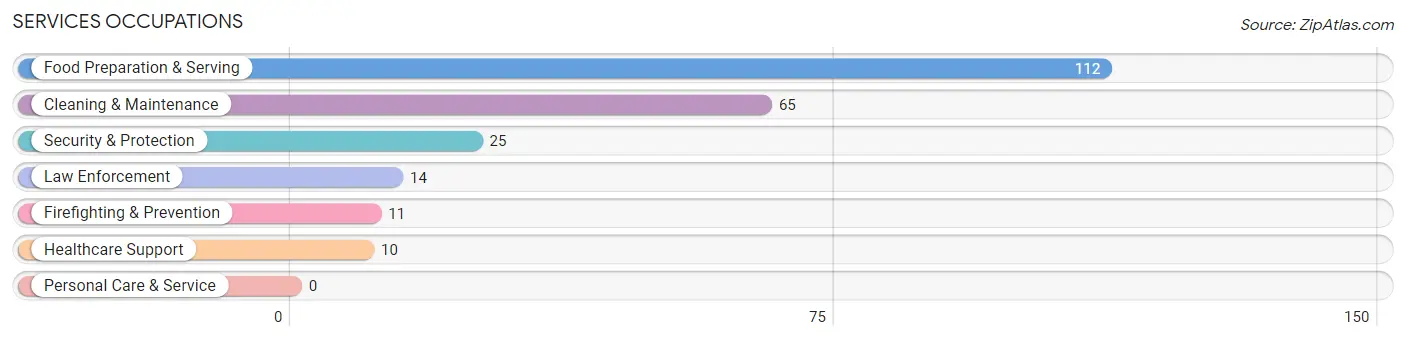
Services Occupations
The most common Services occupations in Fraser are Food Preparation & Serving (112 | 14.1%), Cleaning & Maintenance (65 | 8.2%), Security & Protection (25 | 3.2%), Law Enforcement (14 | 1.8%), and Firefighting & Prevention (11 | 1.4%).
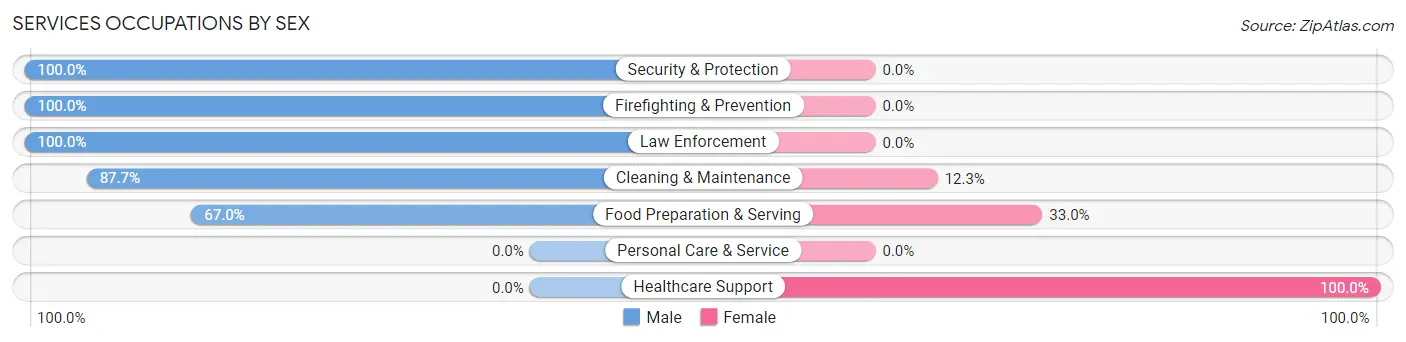
Services Occupations by Sex
Within the Services occupations in Fraser, the most male-oriented occupations are Security & Protection (100.0%), Firefighting & Prevention (100.0%), and Law Enforcement (100.0%), while the most female-oriented occupations are Healthcare Support (100.0%), Food Preparation & Serving (33.0%), and Cleaning & Maintenance (12.3%).
| Occupation | Male | Female |
| Healthcare Support | 0 (0.0%) | 10 (100.0%) |
| Security & Protection | 25 (100.0%) | 0 (0.0%) |
| Firefighting & Prevention | 11 (100.0%) | 0 (0.0%) |
| Law Enforcement | 14 (100.0%) | 0 (0.0%) |
| Food Preparation & Serving | 75 (67.0%) | 37 (33.0%) |
| Cleaning & Maintenance | 57 (87.7%) | 8 (12.3%) |
| Personal Care & Service | 0 (0.0%) | 0 (0.0%) |
| Total (Category) | 157 (74.1%) | 55 (25.9%) |
| Total (Overall) | 519 (65.4%) | 275 (34.6%) |
Sales and Office Occupations
The most common Sales and Office occupations in Fraser are Sales & Related (93 | 11.7%), and Office & Administration (26 | 3.3%).
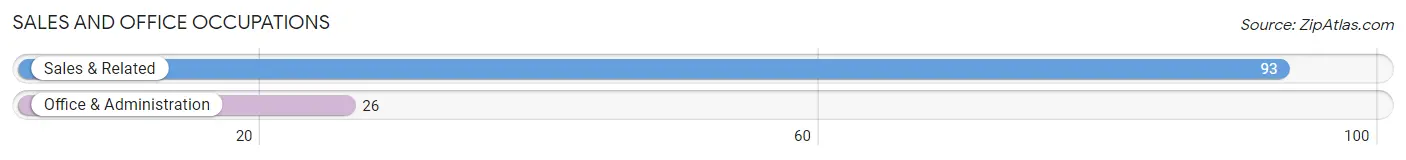
Sales and Office Occupations by Sex
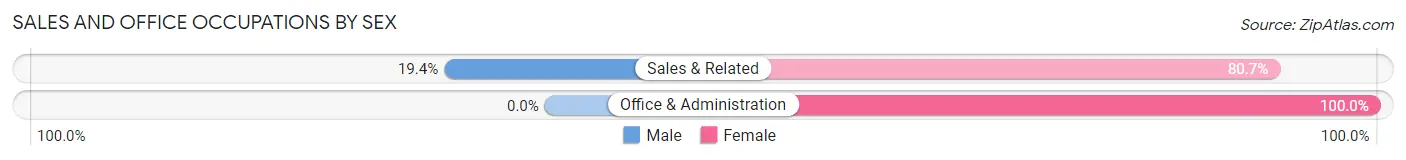
| Occupation | Male | Female |
| Sales & Related | 18 (19.4%) | 75 (80.6%) |
| Office & Administration | 0 (0.0%) | 26 (100.0%) |
| Total (Category) | 18 (15.1%) | 101 (84.9%) |
| Total (Overall) | 519 (65.4%) | 275 (34.6%) |
Natural Resources, Construction and Maintenance Occupations
The most common Natural Resources, Construction and Maintenance occupations in Fraser are Construction & Extraction (55 | 6.9%), Installation, Maintenance & Repair (31 | 3.9%), and Farming, Fishing & Forestry (13 | 1.6%).
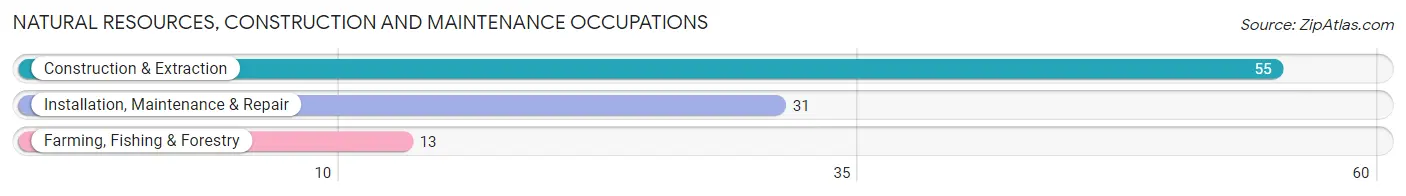
Natural Resources, Construction and Maintenance Occupations by Sex
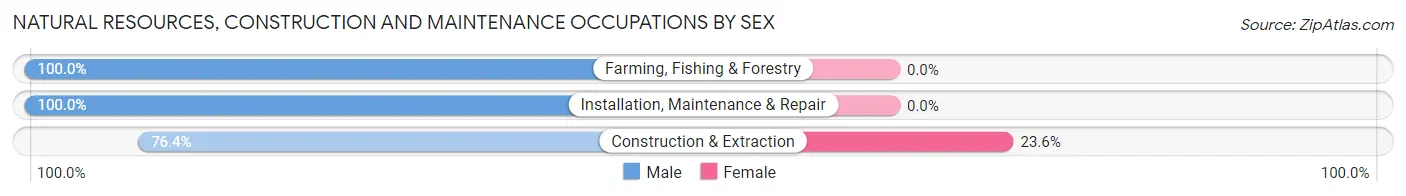
| Occupation | Male | Female |
| Farming, Fishing & Forestry | 13 (100.0%) | 0 (0.0%) |
| Construction & Extraction | 42 (76.4%) | 13 (23.6%) |
| Installation, Maintenance & Repair | 31 (100.0%) | 0 (0.0%) |
| Total (Category) | 86 (86.9%) | 13 (13.1%) |
| Total (Overall) | 519 (65.4%) | 275 (34.6%) |
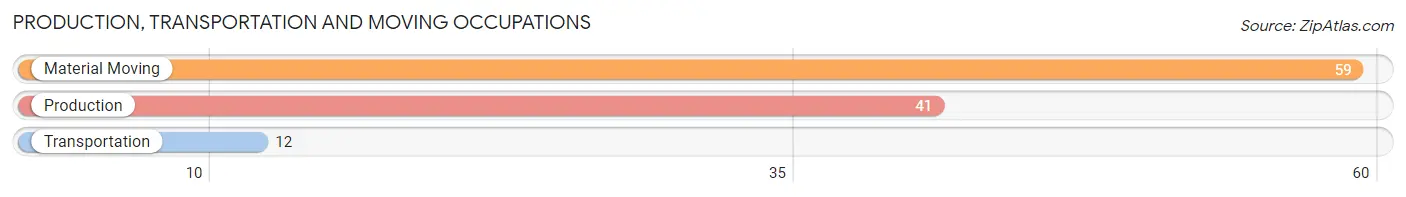
Production, Transportation and Moving Occupations
The most common Production, Transportation and Moving occupations in Fraser are Material Moving (59 | 7.4%), Production (41 | 5.2%), and Transportation (12 | 1.5%).
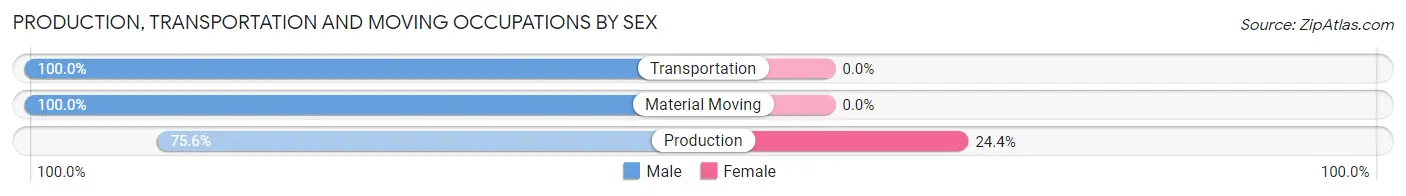
Production, Transportation and Moving Occupations by Sex
| Occupation | Male | Female |
| Production | 31 (75.6%) | 10 (24.4%) |
| Transportation | 12 (100.0%) | 0 (0.0%) |
| Material Moving | 59 (100.0%) | 0 (0.0%) |
| Total (Category) | 102 (91.1%) | 10 (8.9%) |
| Total (Overall) | 519 (65.4%) | 275 (34.6%) |
Employment Industries by Sex in Fraser
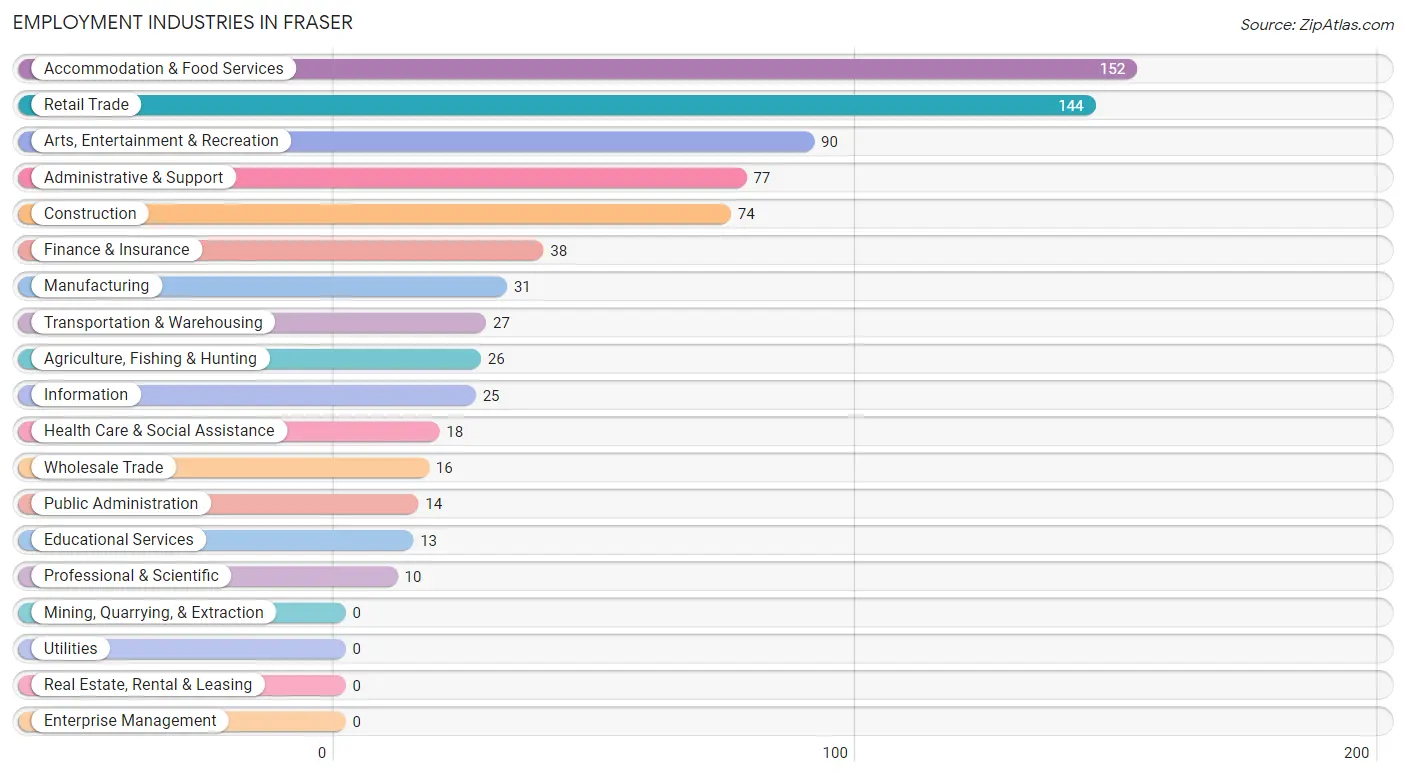
Employment Industries in Fraser
The major employment industries in Fraser include Accommodation & Food Services (152 | 19.1%), Retail Trade (144 | 18.1%), Arts, Entertainment & Recreation (90 | 11.3%), Administrative & Support (77 | 9.7%), and Construction (74 | 9.3%).
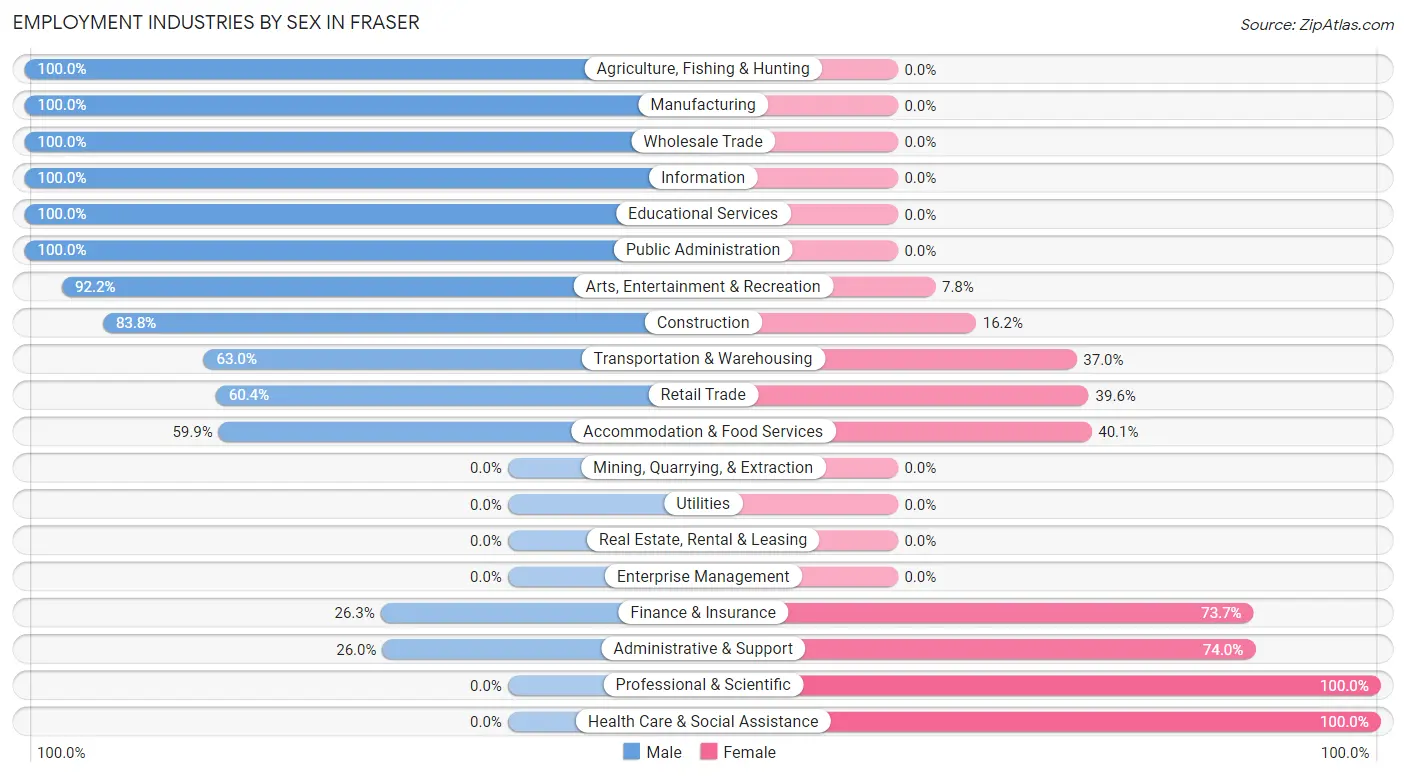
Employment Industries by Sex in Fraser
The Fraser industries that see more men than women are Agriculture, Fishing & Hunting (100.0%), Manufacturing (100.0%), and Wholesale Trade (100.0%), whereas the industries that tend to have a higher number of women are Professional & Scientific (100.0%), Health Care & Social Assistance (100.0%), and Administrative & Support (74.0%).
| Industry | Male | Female |
| Agriculture, Fishing & Hunting | 26 (100.0%) | 0 (0.0%) |
| Mining, Quarrying, & Extraction | 0 (0.0%) | 0 (0.0%) |
| Construction | 62 (83.8%) | 12 (16.2%) |
| Manufacturing | 31 (100.0%) | 0 (0.0%) |
| Wholesale Trade | 16 (100.0%) | 0 (0.0%) |
| Retail Trade | 87 (60.4%) | 57 (39.6%) |
| Transportation & Warehousing | 17 (63.0%) | 10 (37.0%) |
| Utilities | 0 (0.0%) | 0 (0.0%) |
| Information | 25 (100.0%) | 0 (0.0%) |
| Finance & Insurance | 10 (26.3%) | 28 (73.7%) |
| Real Estate, Rental & Leasing | 0 (0.0%) | 0 (0.0%) |
| Professional & Scientific | 0 (0.0%) | 10 (100.0%) |
| Enterprise Management | 0 (0.0%) | 0 (0.0%) |
| Administrative & Support | 20 (26.0%) | 57 (74.0%) |
| Educational Services | 13 (100.0%) | 0 (0.0%) |
| Health Care & Social Assistance | 0 (0.0%) | 18 (100.0%) |
| Arts, Entertainment & Recreation | 83 (92.2%) | 7 (7.8%) |
| Accommodation & Food Services | 91 (59.9%) | 61 (40.1%) |
| Public Administration | 14 (100.0%) | 0 (0.0%) |
| Total | 519 (65.4%) | 275 (34.6%) |
Education in Fraser
School Enrollment in Fraser
The most common levels of schooling among the 211 students in Fraser are college / undergraduate (58 | 27.5%), elementary school (57 | 27.0%), and middle school (38 | 18.0%).
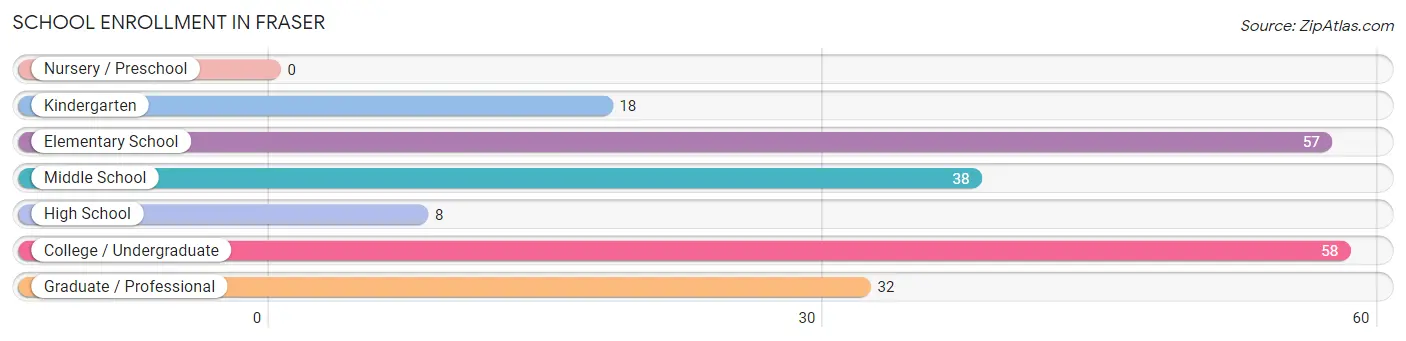
| School Level | # Students | % Students |
| Nursery / Preschool | 0 | 0.0% |
| Kindergarten | 18 | 8.5% |
| Elementary School | 57 | 27.0% |
| Middle School | 38 | 18.0% |
| High School | 8 | 3.8% |
| College / Undergraduate | 58 | 27.5% |
| Graduate / Professional | 32 | 15.2% |
| Total | 211 | 100.0% |
School Enrollment by Age by Funding Source in Fraser
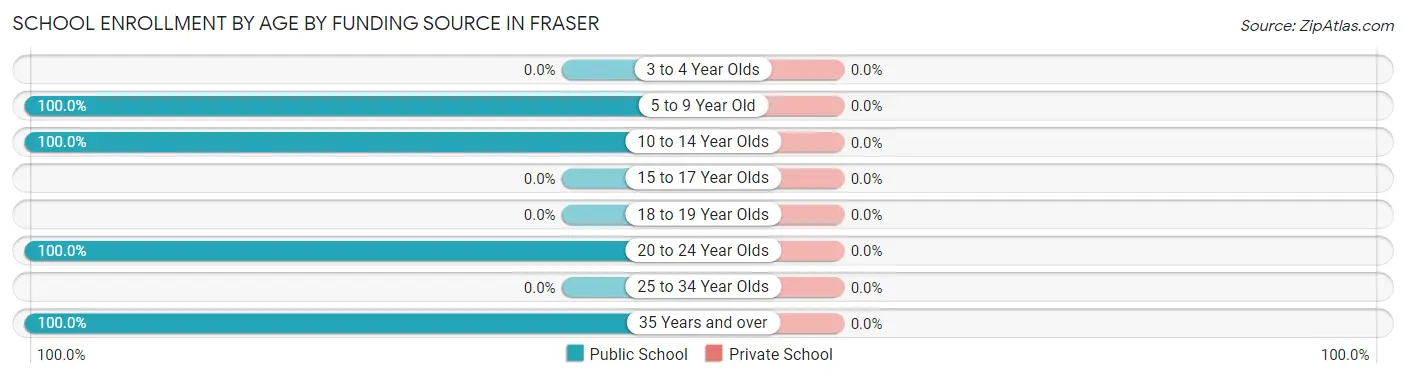
| Age Bracket | Public School | Private School |
| 3 to 4 Year Olds | 0 (0.0%) | 0 (0.0%) |
| 5 to 9 Year Old | 75 (100.0%) | 0 (0.0%) |
| 10 to 14 Year Olds | 46 (100.0%) | 0 (0.0%) |
| 15 to 17 Year Olds | 0 (0.0%) | 0 (0.0%) |
| 18 to 19 Year Olds | 0 (0.0%) | 0 (0.0%) |
| 20 to 24 Year Olds | 64 (100.0%) | 0 (0.0%) |
| 25 to 34 Year Olds | 0 (0.0%) | 0 (0.0%) |
| 35 Years and over | 26 (100.0%) | 0 (0.0%) |
| Total | 211 (100.0%) | 0 (0.0%) |
Educational Attainment by Field of Study in Fraser
Liberal arts & history (55 | 22.5%), business (35 | 14.3%), computers & mathematics (26 | 10.7%), bio, nature & agricultural (24 | 9.8%), and arts & humanities (21 | 8.6%) are the most common fields of study among 244 individuals in Fraser who have obtained a bachelor's degree or higher.
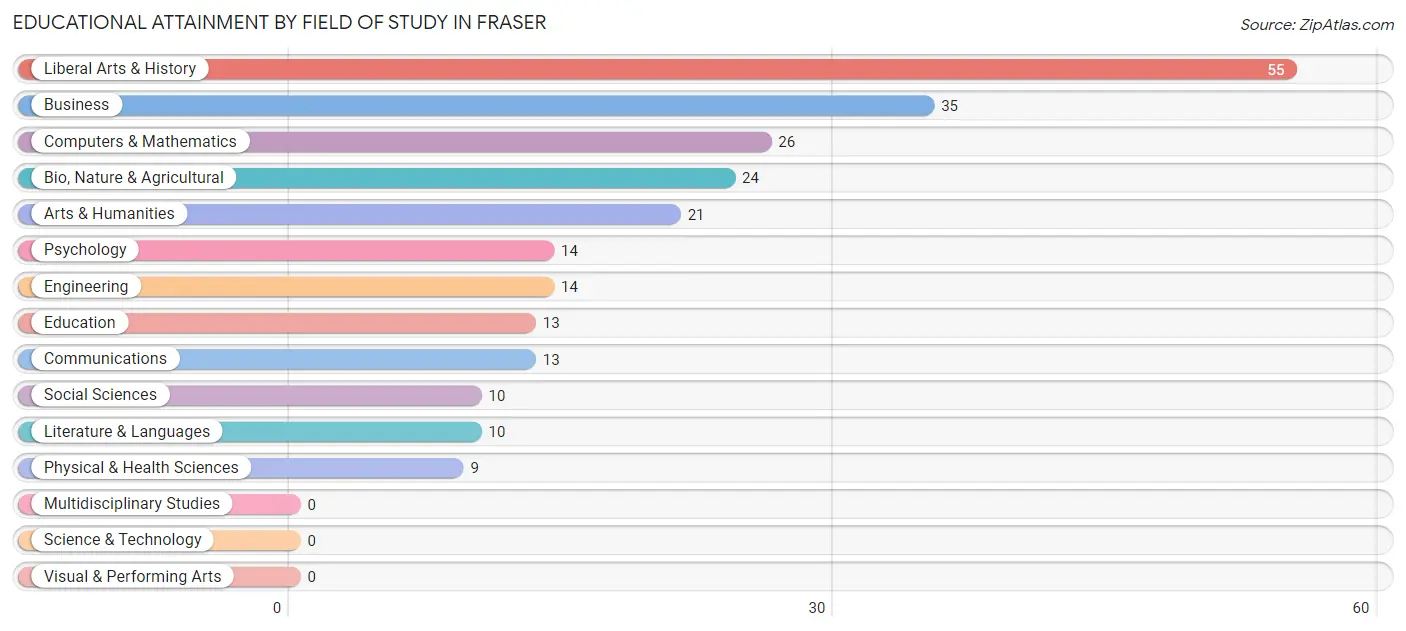
| Field of Study | # Graduates | % Graduates |
| Computers & Mathematics | 26 | 10.7% |
| Bio, Nature & Agricultural | 24 | 9.8% |
| Physical & Health Sciences | 9 | 3.7% |
| Psychology | 14 | 5.7% |
| Social Sciences | 10 | 4.1% |
| Engineering | 14 | 5.7% |
| Multidisciplinary Studies | 0 | 0.0% |
| Science & Technology | 0 | 0.0% |
| Business | 35 | 14.3% |
| Education | 13 | 5.3% |
| Literature & Languages | 10 | 4.1% |
| Liberal Arts & History | 55 | 22.5% |
| Visual & Performing Arts | 0 | 0.0% |
| Communications | 13 | 5.3% |
| Arts & Humanities | 21 | 8.6% |
| Total | 244 | 100.0% |
Transportation & Commute in Fraser
Vehicle Availability by Sex in Fraser
The most prevalent vehicle ownership categories in Fraser are males with 2 vehicles (233, accounting for 45.2%) and females with 2 vehicles (94, making up 84.7%).
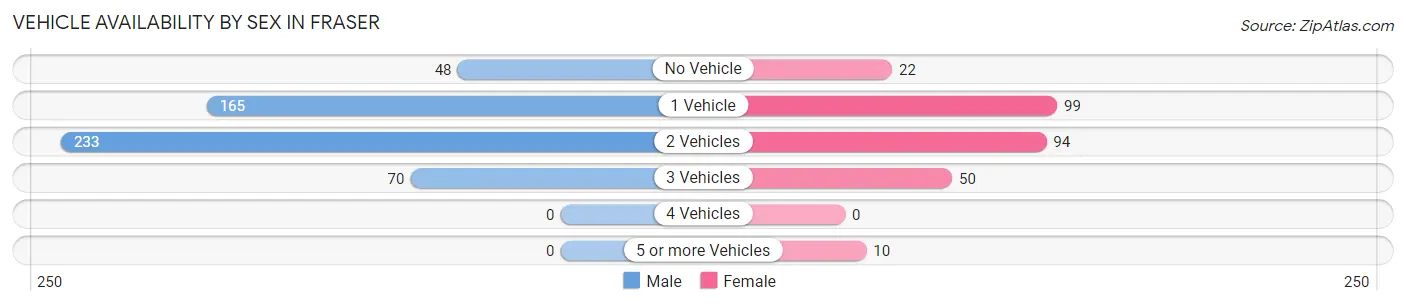
| Vehicles Available | Male | Female |
| No Vehicle | 48 (9.3%) | 22 (8.0%) |
| 1 Vehicle | 165 (32.0%) | 99 (36.0%) |
| 2 Vehicles | 233 (45.2%) | 94 (34.2%) |
| 3 Vehicles | 70 (13.6%) | 50 (18.2%) |
| 4 Vehicles | 0 (0.0%) | 0 (0.0%) |
| 5 or more Vehicles | 0 (0.0%) | 10 (3.6%) |
| Total | 516 (100.0%) | 275 (100.0%) |
Commute Time in Fraser
The most frequently occuring commute durations in Fraser are 20 to 24 minutes (200 commuters, 27.3%), 10 to 14 minutes (168 commuters, 22.9%), and 5 to 9 minutes (67 commuters, 9.1%).
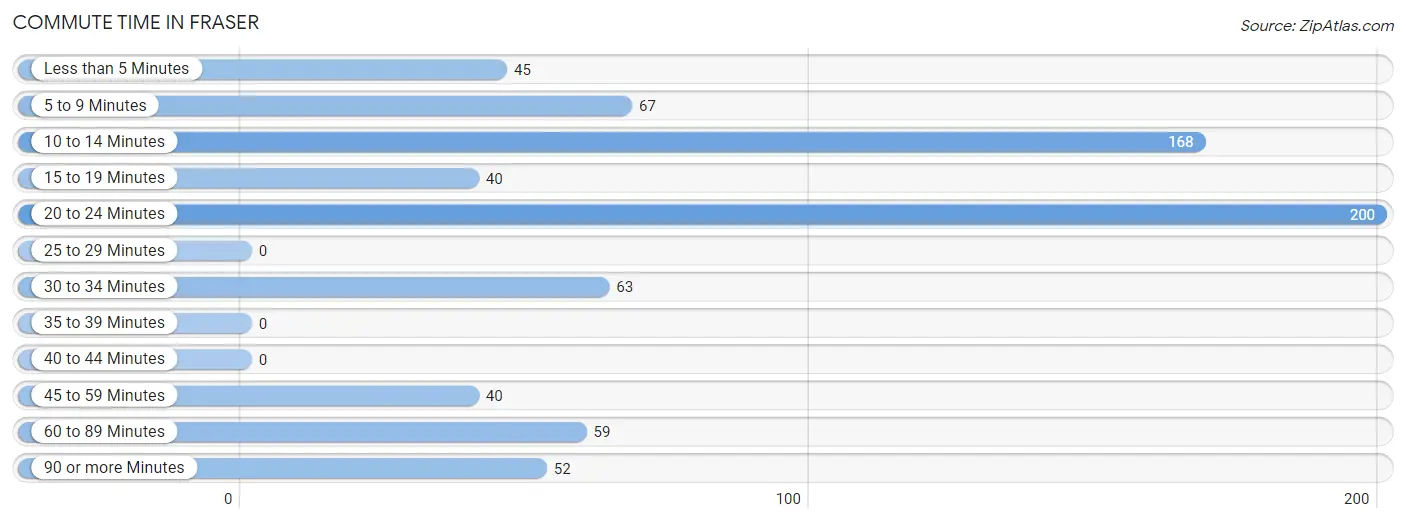
| Commute Time | # Commuters | % Commuters |
| Less than 5 Minutes | 45 | 6.1% |
| 5 to 9 Minutes | 67 | 9.1% |
| 10 to 14 Minutes | 168 | 22.9% |
| 15 to 19 Minutes | 40 | 5.4% |
| 20 to 24 Minutes | 200 | 27.3% |
| 25 to 29 Minutes | 0 | 0.0% |
| 30 to 34 Minutes | 63 | 8.6% |
| 35 to 39 Minutes | 0 | 0.0% |
| 40 to 44 Minutes | 0 | 0.0% |
| 45 to 59 Minutes | 40 | 5.4% |
| 60 to 89 Minutes | 59 | 8.0% |
| 90 or more Minutes | 52 | 7.1% |
Commute Time by Sex in Fraser
The most common commute times in Fraser are 20 to 24 minutes (137 commuters, 28.2%) for males and 10 to 14 minutes (81 commuters, 32.5%) for females.
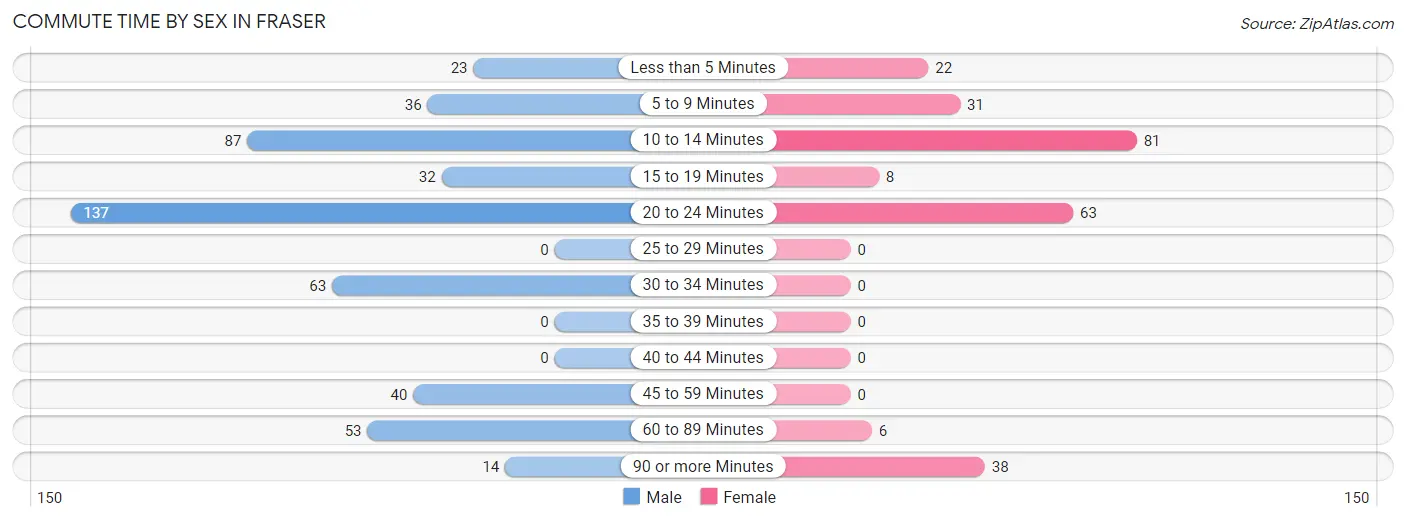
| Commute Time | Male | Female |
| Less than 5 Minutes | 23 (4.7%) | 22 (8.8%) |
| 5 to 9 Minutes | 36 (7.4%) | 31 (12.4%) |
| 10 to 14 Minutes | 87 (17.9%) | 81 (32.5%) |
| 15 to 19 Minutes | 32 (6.6%) | 8 (3.2%) |
| 20 to 24 Minutes | 137 (28.2%) | 63 (25.3%) |
| 25 to 29 Minutes | 0 (0.0%) | 0 (0.0%) |
| 30 to 34 Minutes | 63 (13.0%) | 0 (0.0%) |
| 35 to 39 Minutes | 0 (0.0%) | 0 (0.0%) |
| 40 to 44 Minutes | 0 (0.0%) | 0 (0.0%) |
| 45 to 59 Minutes | 40 (8.3%) | 0 (0.0%) |
| 60 to 89 Minutes | 53 (10.9%) | 6 (2.4%) |
| 90 or more Minutes | 14 (2.9%) | 38 (15.3%) |
Time of Departure to Work by Sex in Fraser
The most frequent times of departure to work in Fraser are 7:00 AM to 7:29 AM (97, 20.0%) for males and 7:00 AM to 7:29 AM (94, 37.8%) for females.
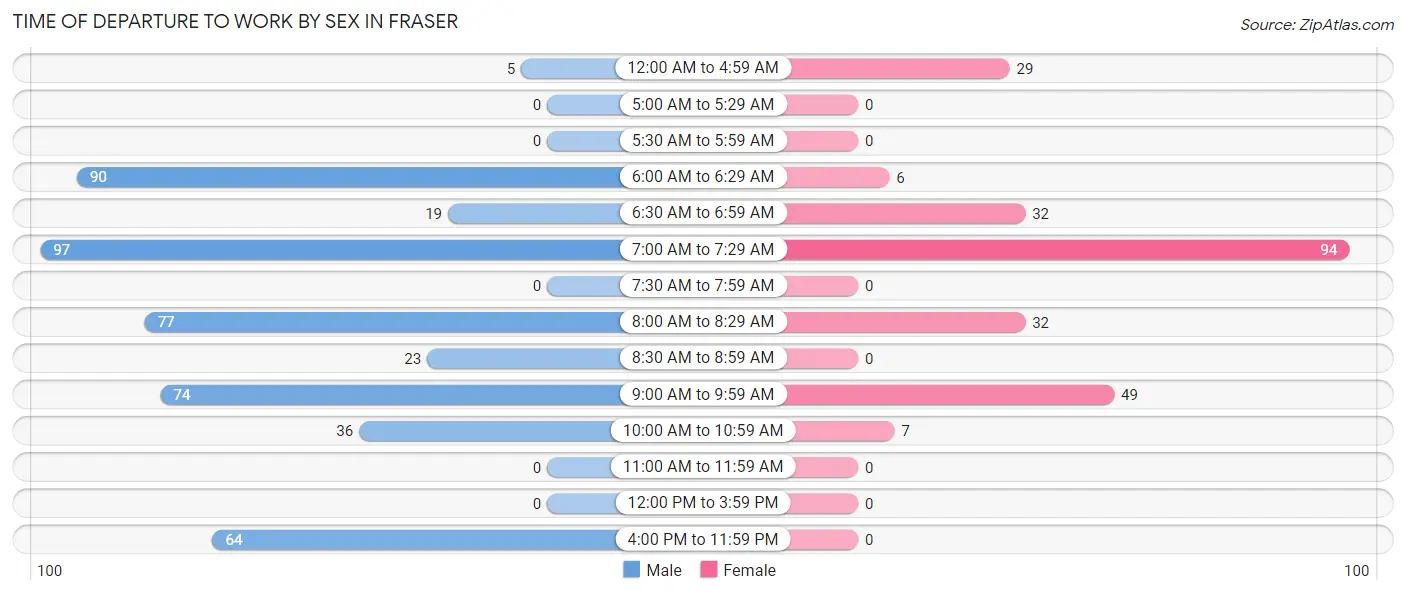
| Time of Departure | Male | Female |
| 12:00 AM to 4:59 AM | 5 (1.0%) | 29 (11.7%) |
| 5:00 AM to 5:29 AM | 0 (0.0%) | 0 (0.0%) |
| 5:30 AM to 5:59 AM | 0 (0.0%) | 0 (0.0%) |
| 6:00 AM to 6:29 AM | 90 (18.6%) | 6 (2.4%) |
| 6:30 AM to 6:59 AM | 19 (3.9%) | 32 (12.9%) |
| 7:00 AM to 7:29 AM | 97 (20.0%) | 94 (37.8%) |
| 7:30 AM to 7:59 AM | 0 (0.0%) | 0 (0.0%) |
| 8:00 AM to 8:29 AM | 77 (15.9%) | 32 (12.9%) |
| 8:30 AM to 8:59 AM | 23 (4.7%) | 0 (0.0%) |
| 9:00 AM to 9:59 AM | 74 (15.3%) | 49 (19.7%) |
| 10:00 AM to 10:59 AM | 36 (7.4%) | 7 (2.8%) |
| 11:00 AM to 11:59 AM | 0 (0.0%) | 0 (0.0%) |
| 12:00 PM to 3:59 PM | 0 (0.0%) | 0 (0.0%) |
| 4:00 PM to 11:59 PM | 64 (13.2%) | 0 (0.0%) |
| Total | 485 (100.0%) | 249 (100.0%) |
Housing Occupancy in Fraser
Occupancy by Ownership in Fraser
Of the total 457 dwellings in Fraser, owner-occupied units account for 219 (47.9%), while renter-occupied units make up 238 (52.1%).
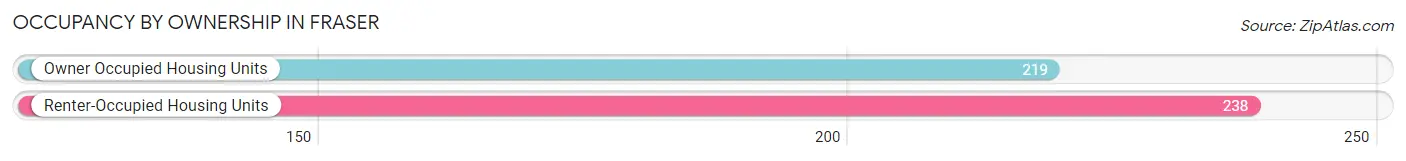
| Occupancy | # Housing Units | % Housing Units |
| Owner Occupied Housing Units | 219 | 47.9% |
| Renter-Occupied Housing Units | 238 | 52.1% |
| Total Occupied Housing Units | 457 | 100.0% |
Occupancy by Household Size in Fraser
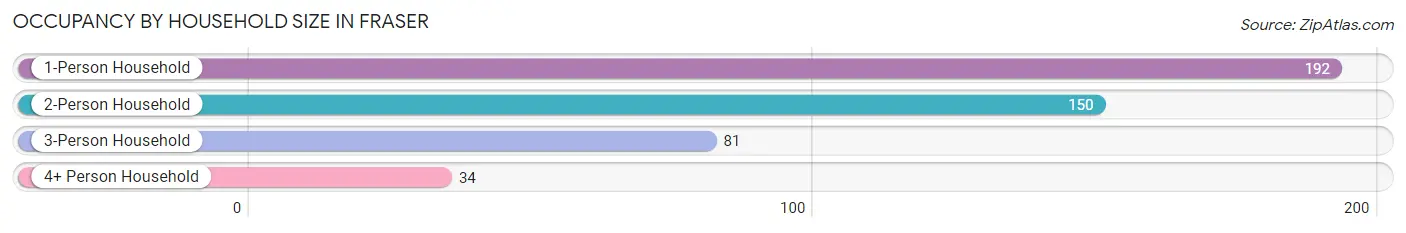
| Household Size | # Housing Units | % Housing Units |
| 1-Person Household | 192 | 42.0% |
| 2-Person Household | 150 | 32.8% |
| 3-Person Household | 81 | 17.7% |
| 4+ Person Household | 34 | 7.4% |
| Total Housing Units | 457 | 100.0% |
Occupancy by Ownership by Household Size in Fraser
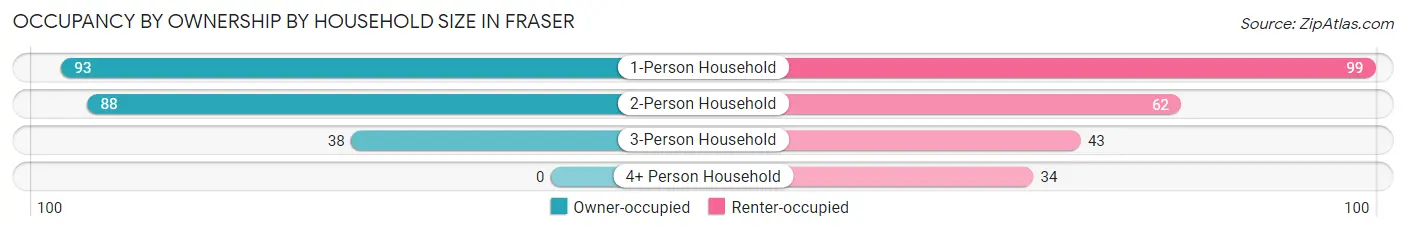
| Household Size | Owner-occupied | Renter-occupied |
| 1-Person Household | 93 (48.4%) | 99 (51.6%) |
| 2-Person Household | 88 (58.7%) | 62 (41.3%) |
| 3-Person Household | 38 (46.9%) | 43 (53.1%) |
| 4+ Person Household | 0 (0.0%) | 34 (100.0%) |
| Total Housing Units | 219 (47.9%) | 238 (52.1%) |
Occupancy by Educational Attainment in Fraser
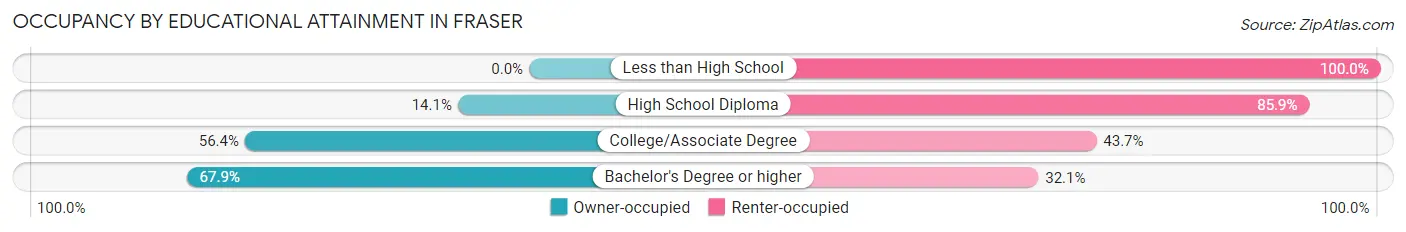
| Household Size | Owner-occupied | Renter-occupied |
| Less than High School | 0 (0.0%) | 28 (100.0%) |
| High School Diploma | 13 (14.1%) | 79 (85.9%) |
| College/Associate Degree | 111 (56.4%) | 86 (43.6%) |
| Bachelor's Degree or higher | 95 (67.9%) | 45 (32.1%) |
Occupancy by Age of Householder in Fraser
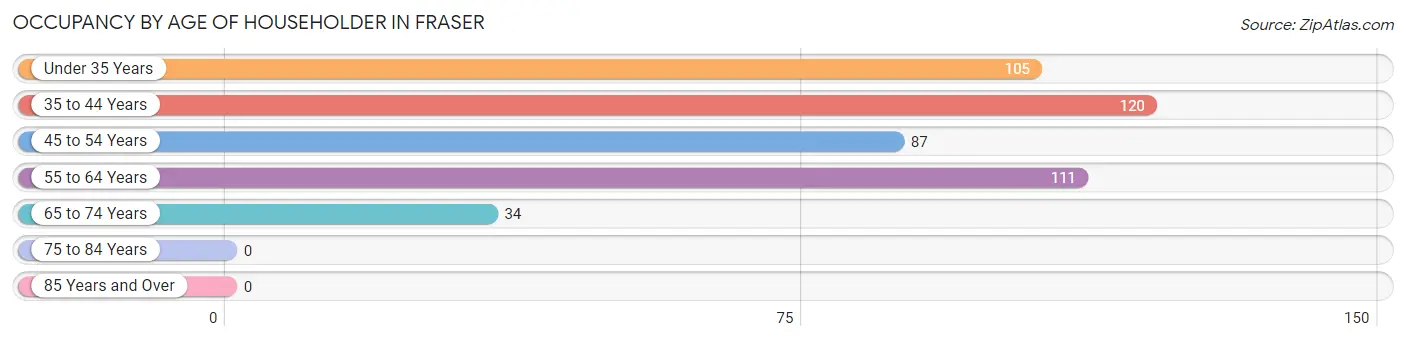
| Age Bracket | # Households | % Households |
| Under 35 Years | 105 | 23.0% |
| 35 to 44 Years | 120 | 26.3% |
| 45 to 54 Years | 87 | 19.0% |
| 55 to 64 Years | 111 | 24.3% |
| 65 to 74 Years | 34 | 7.4% |
| 75 to 84 Years | 0 | 0.0% |
| 85 Years and Over | 0 | 0.0% |
| Total | 457 | 100.0% |
Housing Finances in Fraser
Median Income by Occupancy in Fraser
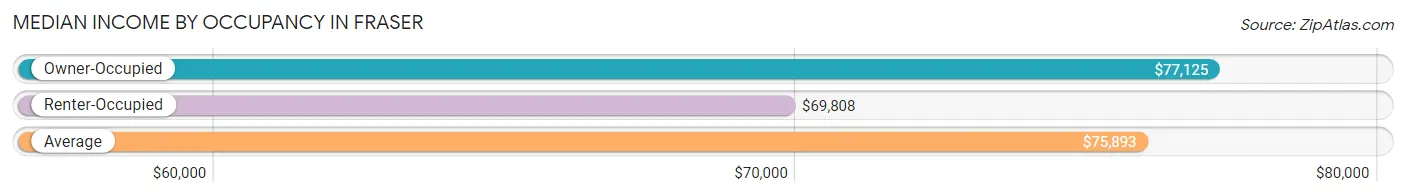
| Occupancy Type | # Households | Median Income |
| Owner-Occupied | 219 (47.9%) | $77,125 |
| Renter-Occupied | 238 (52.1%) | $69,808 |
| Average | 457 (100.0%) | $75,893 |
Occupancy by Householder Income Bracket in Fraser
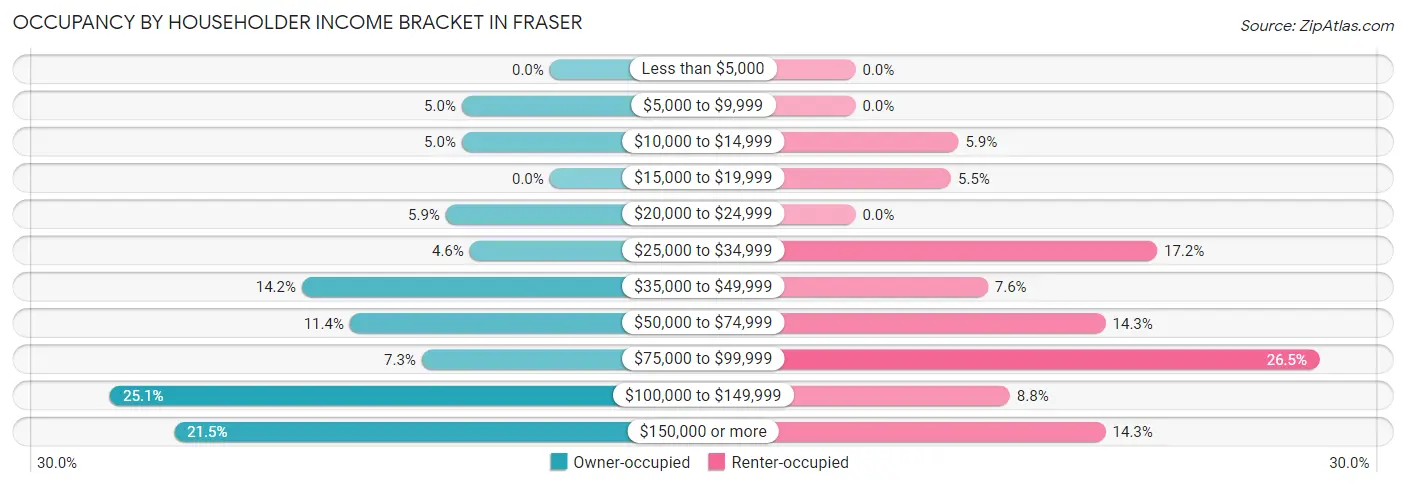
| Income Bracket | Owner-occupied | Renter-occupied |
| Less than $5,000 | 0 (0.0%) | 0 (0.0%) |
| $5,000 to $9,999 | 11 (5.0%) | 0 (0.0%) |
| $10,000 to $14,999 | 11 (5.0%) | 14 (5.9%) |
| $15,000 to $19,999 | 0 (0.0%) | 13 (5.5%) |
| $20,000 to $24,999 | 13 (5.9%) | 0 (0.0%) |
| $25,000 to $34,999 | 10 (4.6%) | 41 (17.2%) |
| $35,000 to $49,999 | 31 (14.2%) | 18 (7.6%) |
| $50,000 to $74,999 | 25 (11.4%) | 34 (14.3%) |
| $75,000 to $99,999 | 16 (7.3%) | 63 (26.5%) |
| $100,000 to $149,999 | 55 (25.1%) | 21 (8.8%) |
| $150,000 or more | 47 (21.5%) | 34 (14.3%) |
| Total | 219 (100.0%) | 238 (100.0%) |
Monthly Housing Cost Tiers in Fraser
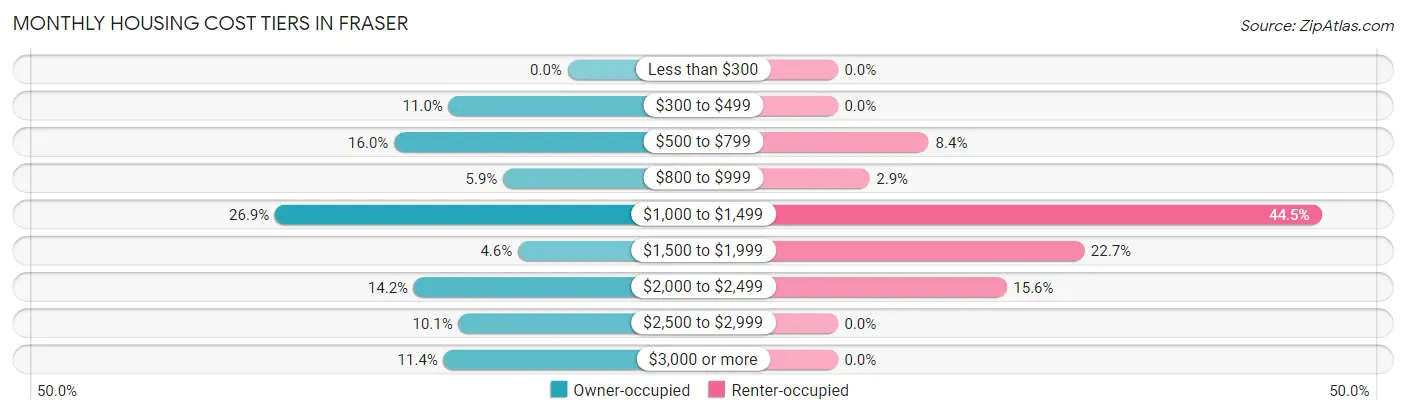
| Monthly Cost | Owner-occupied | Renter-occupied |
| Less than $300 | 0 (0.0%) | 0 (0.0%) |
| $300 to $499 | 24 (11.0%) | 0 (0.0%) |
| $500 to $799 | 35 (16.0%) | 20 (8.4%) |
| $800 to $999 | 13 (5.9%) | 7 (2.9%) |
| $1,000 to $1,499 | 59 (26.9%) | 106 (44.5%) |
| $1,500 to $1,999 | 10 (4.6%) | 54 (22.7%) |
| $2,000 to $2,499 | 31 (14.2%) | 37 (15.5%) |
| $2,500 to $2,999 | 22 (10.1%) | 0 (0.0%) |
| $3,000 or more | 25 (11.4%) | 0 (0.0%) |
| Total | 219 (100.0%) | 238 (100.0%) |
Physical Housing Characteristics in Fraser
Housing Structures in Fraser
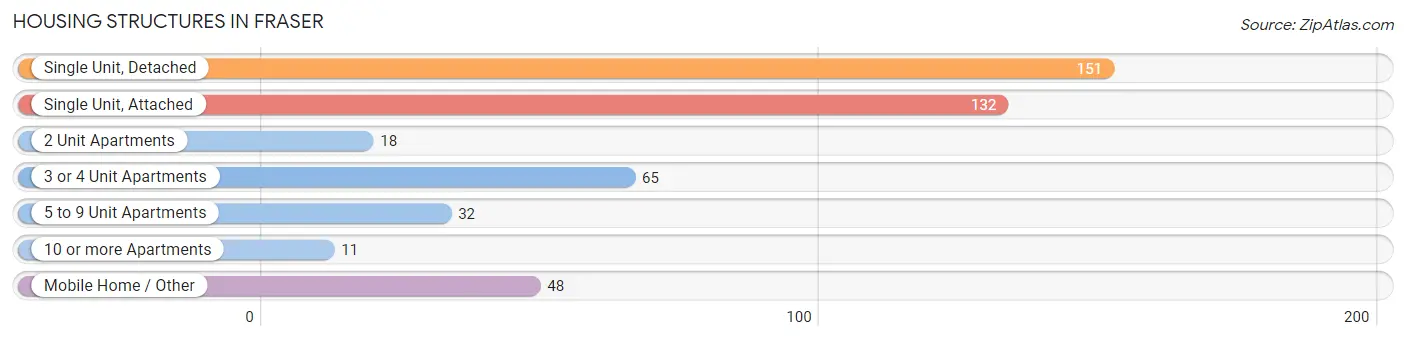
| Structure Type | # Housing Units | % Housing Units |
| Single Unit, Detached | 151 | 33.0% |
| Single Unit, Attached | 132 | 28.9% |
| 2 Unit Apartments | 18 | 3.9% |
| 3 or 4 Unit Apartments | 65 | 14.2% |
| 5 to 9 Unit Apartments | 32 | 7.0% |
| 10 or more Apartments | 11 | 2.4% |
| Mobile Home / Other | 48 | 10.5% |
| Total | 457 | 100.0% |
Housing Structures by Occupancy in Fraser
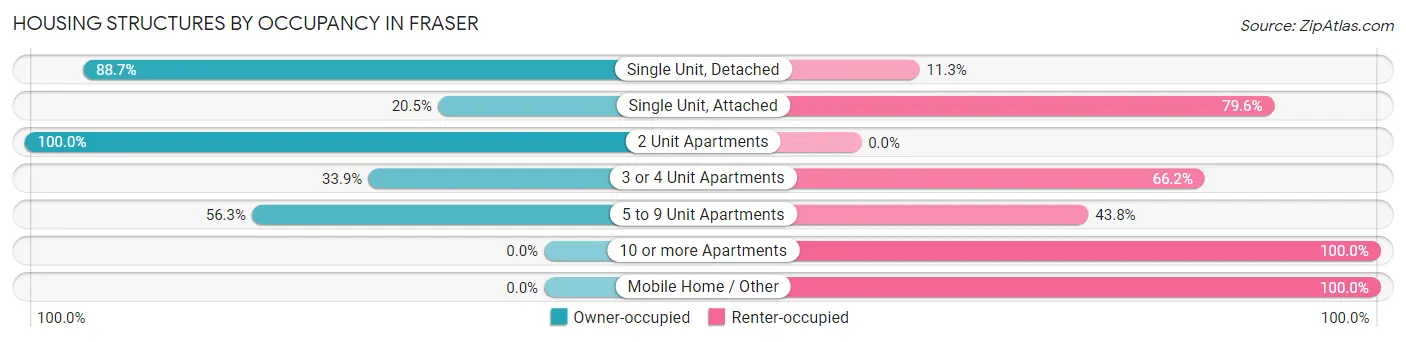
| Structure Type | Owner-occupied | Renter-occupied |
| Single Unit, Detached | 134 (88.7%) | 17 (11.3%) |
| Single Unit, Attached | 27 (20.4%) | 105 (79.5%) |
| 2 Unit Apartments | 18 (100.0%) | 0 (0.0%) |
| 3 or 4 Unit Apartments | 22 (33.9%) | 43 (66.1%) |
| 5 to 9 Unit Apartments | 18 (56.2%) | 14 (43.8%) |
| 10 or more Apartments | 0 (0.0%) | 11 (100.0%) |
| Mobile Home / Other | 0 (0.0%) | 48 (100.0%) |
| Total | 219 (47.9%) | 238 (52.1%) |
Housing Structures by Number of Rooms in Fraser
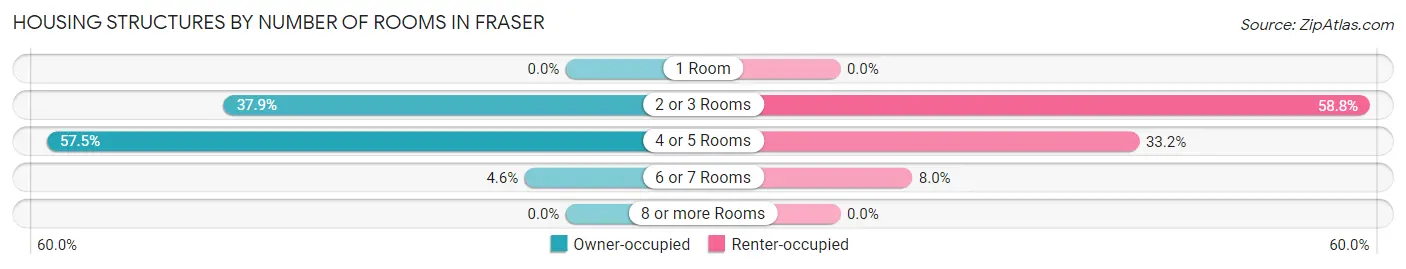
| Number of Rooms | Owner-occupied | Renter-occupied |
| 1 Room | 0 (0.0%) | 0 (0.0%) |
| 2 or 3 Rooms | 83 (37.9%) | 140 (58.8%) |
| 4 or 5 Rooms | 126 (57.5%) | 79 (33.2%) |
| 6 or 7 Rooms | 10 (4.6%) | 19 (8.0%) |
| 8 or more Rooms | 0 (0.0%) | 0 (0.0%) |
| Total | 219 (100.0%) | 238 (100.0%) |
Housing Structure by Heating Type in Fraser
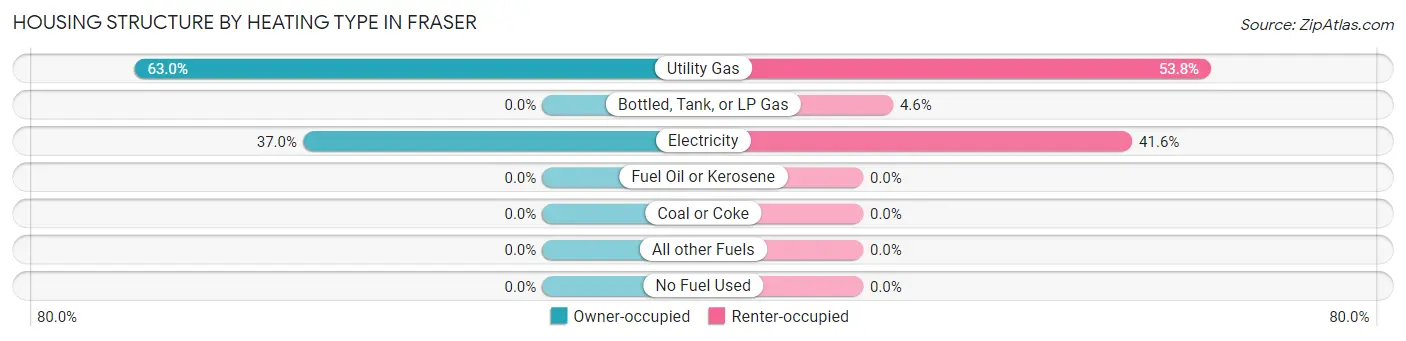
| Heating Type | Owner-occupied | Renter-occupied |
| Utility Gas | 138 (63.0%) | 128 (53.8%) |
| Bottled, Tank, or LP Gas | 0 (0.0%) | 11 (4.6%) |
| Electricity | 81 (37.0%) | 99 (41.6%) |
| Fuel Oil or Kerosene | 0 (0.0%) | 0 (0.0%) |
| Coal or Coke | 0 (0.0%) | 0 (0.0%) |
| All other Fuels | 0 (0.0%) | 0 (0.0%) |
| No Fuel Used | 0 (0.0%) | 0 (0.0%) |
| Total | 219 (100.0%) | 238 (100.0%) |
Household Vehicle Usage in Fraser
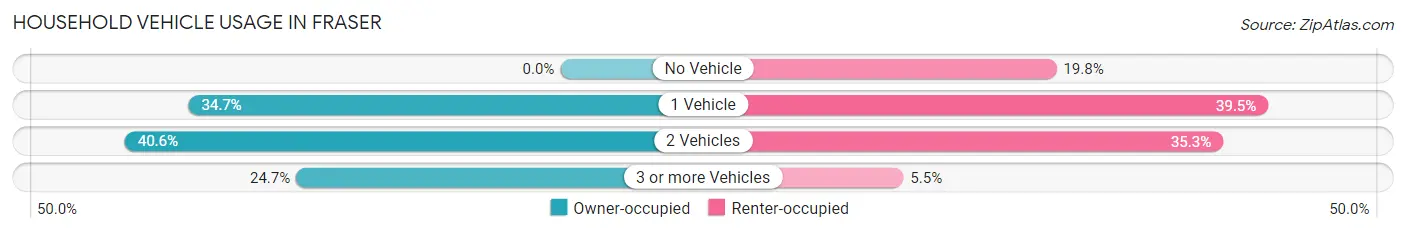
| Vehicles per Household | Owner-occupied | Renter-occupied |
| No Vehicle | 0 (0.0%) | 47 (19.8%) |
| 1 Vehicle | 76 (34.7%) | 94 (39.5%) |
| 2 Vehicles | 89 (40.6%) | 84 (35.3%) |
| 3 or more Vehicles | 54 (24.7%) | 13 (5.5%) |
| Total | 219 (100.0%) | 238 (100.0%) |
Real Estate & Mortgages in Fraser
Real Estate and Mortgage Overview in Fraser
| Characteristic | Without Mortgage | With Mortgage |
| Housing Units | 72 | 147 |
| Median Property Value | $485,700 | $507,500 |
| Median Household Income | - | - |
| Monthly Housing Costs | $586 | $25 |
| Real Estate Taxes | $1,698 | $0 |
Property Value by Mortgage Status in Fraser
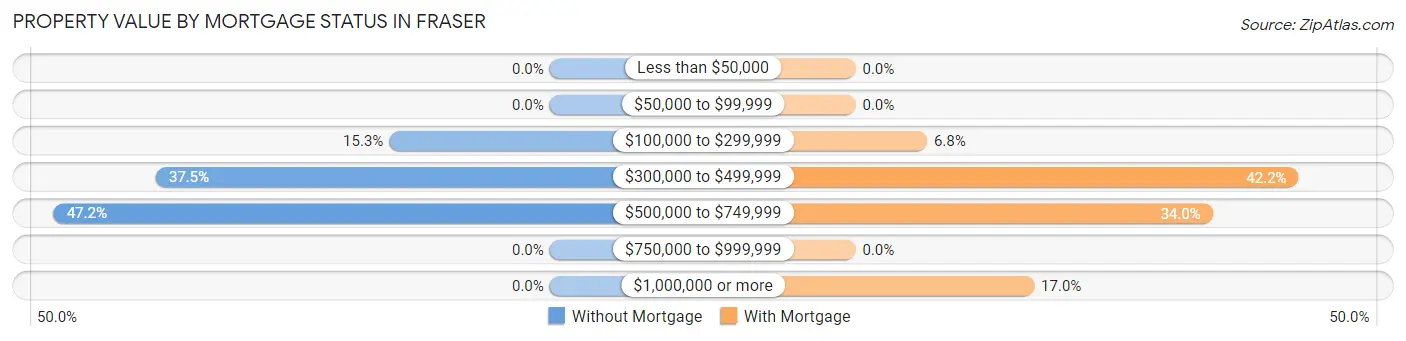
| Property Value | Without Mortgage | With Mortgage |
| Less than $50,000 | 0 (0.0%) | 0 (0.0%) |
| $50,000 to $99,999 | 0 (0.0%) | 0 (0.0%) |
| $100,000 to $299,999 | 11 (15.3%) | 10 (6.8%) |
| $300,000 to $499,999 | 27 (37.5%) | 62 (42.2%) |
| $500,000 to $749,999 | 34 (47.2%) | 50 (34.0%) |
| $750,000 to $999,999 | 0 (0.0%) | 0 (0.0%) |
| $1,000,000 or more | 0 (0.0%) | 25 (17.0%) |
| Total | 72 (100.0%) | 147 (100.0%) |
Household Income by Mortgage Status in Fraser
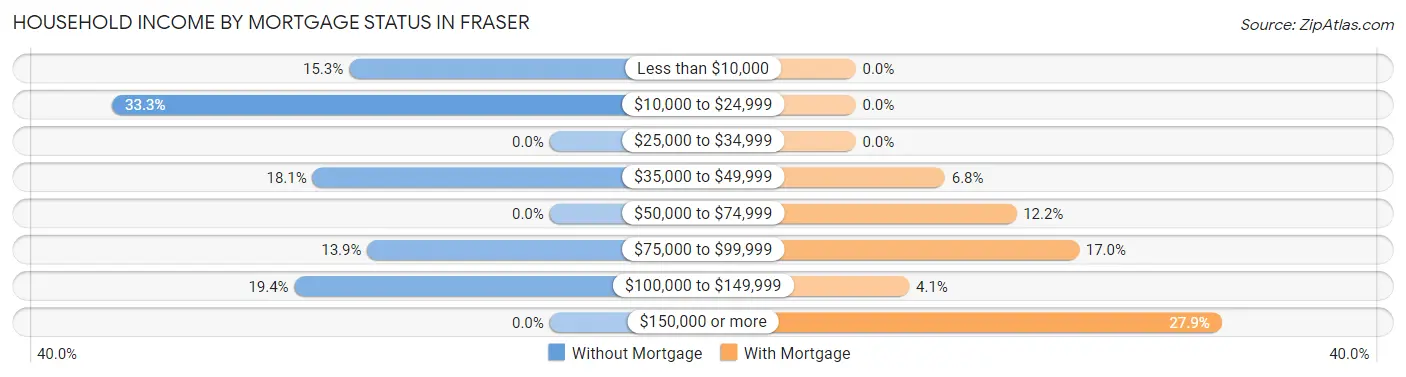
| Household Income | Without Mortgage | With Mortgage |
| Less than $10,000 | 11 (15.3%) | 0 (0.0%) |
| $10,000 to $24,999 | 24 (33.3%) | 0 (0.0%) |
| $25,000 to $34,999 | 0 (0.0%) | 0 (0.0%) |
| $35,000 to $49,999 | 13 (18.1%) | 10 (6.8%) |
| $50,000 to $74,999 | 0 (0.0%) | 18 (12.2%) |
| $75,000 to $99,999 | 10 (13.9%) | 25 (17.0%) |
| $100,000 to $149,999 | 14 (19.4%) | 6 (4.1%) |
| $150,000 or more | 0 (0.0%) | 41 (27.9%) |
| Total | 72 (100.0%) | 147 (100.0%) |
Property Value to Household Income Ratio in Fraser
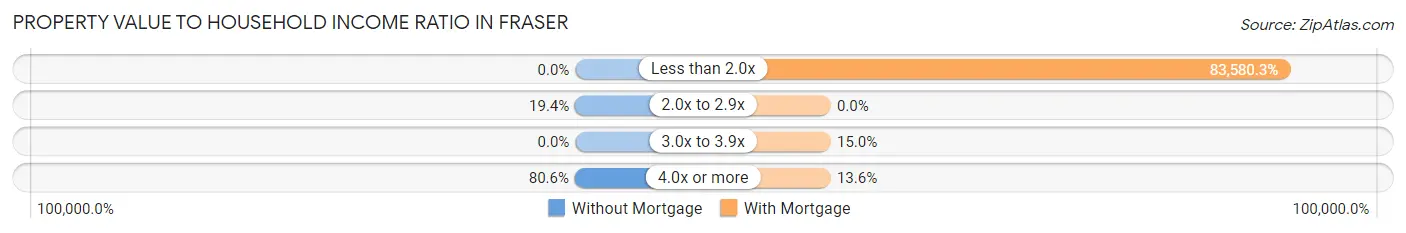
| Value-to-Income Ratio | Without Mortgage | With Mortgage |
| Less than 2.0x | 0 (0.0%) | 122,863 (83,580.3%) |
| 2.0x to 2.9x | 14 (19.4%) | 0 (0.0%) |
| 3.0x to 3.9x | 0 (0.0%) | 22 (15.0%) |
| 4.0x or more | 58 (80.6%) | 20 (13.6%) |
| Total | 72 (100.0%) | 147 (100.0%) |
Real Estate Taxes by Mortgage Status in Fraser
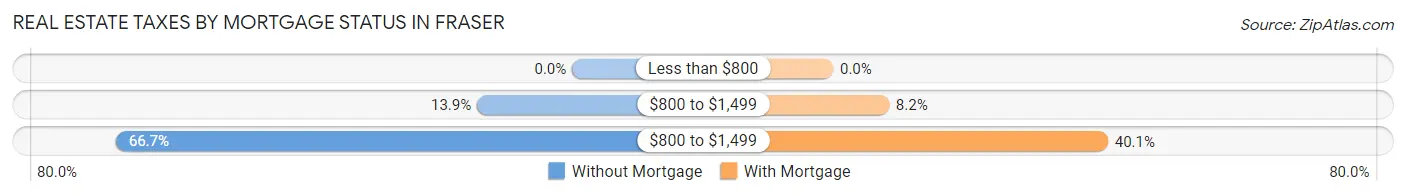
| Property Taxes | Without Mortgage | With Mortgage |
| Less than $800 | 0 (0.0%) | 0 (0.0%) |
| $800 to $1,499 | 10 (13.9%) | 12 (8.2%) |
| $800 to $1,499 | 48 (66.7%) | 59 (40.1%) |
| Total | 72 (100.0%) | 147 (100.0%) |
Health & Disability in Fraser
Health Insurance Coverage by Age in Fraser
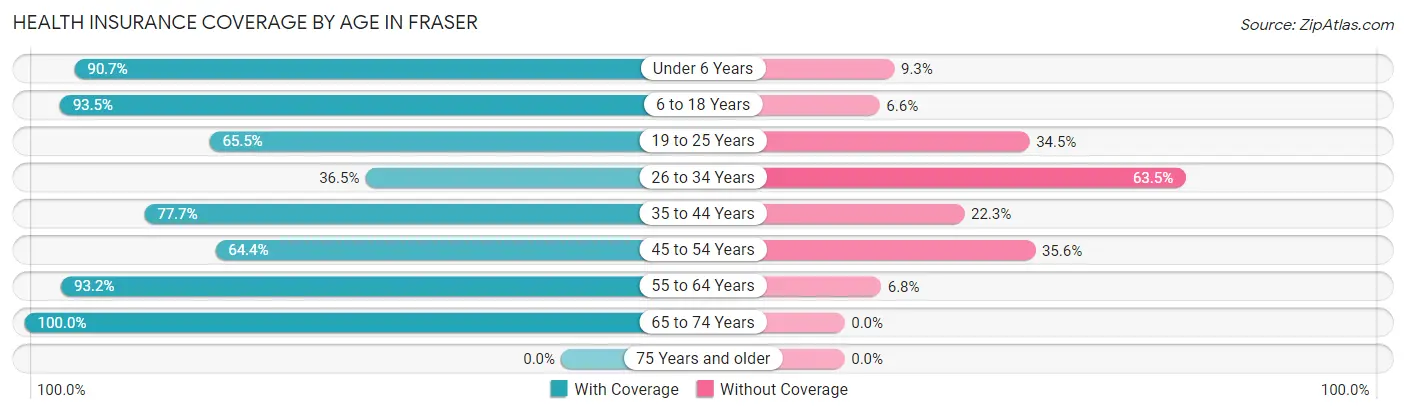
| Age Bracket | With Coverage | Without Coverage |
| Under 6 Years | 88 (90.7%) | 9 (9.3%) |
| 6 to 18 Years | 157 (93.4%) | 11 (6.6%) |
| 19 to 25 Years | 95 (65.5%) | 50 (34.5%) |
| 26 to 34 Years | 85 (36.5%) | 148 (63.5%) |
| 35 to 44 Years | 160 (77.7%) | 46 (22.3%) |
| 45 to 54 Years | 116 (64.4%) | 64 (35.6%) |
| 55 to 64 Years | 137 (93.2%) | 10 (6.8%) |
| 65 to 74 Years | 44 (100.0%) | 0 (0.0%) |
| 75 Years and older | 0 (0.0%) | 0 (0.0%) |
| Total | 882 (72.3%) | 338 (27.7%) |
Health Insurance Coverage by Citizenship Status in Fraser
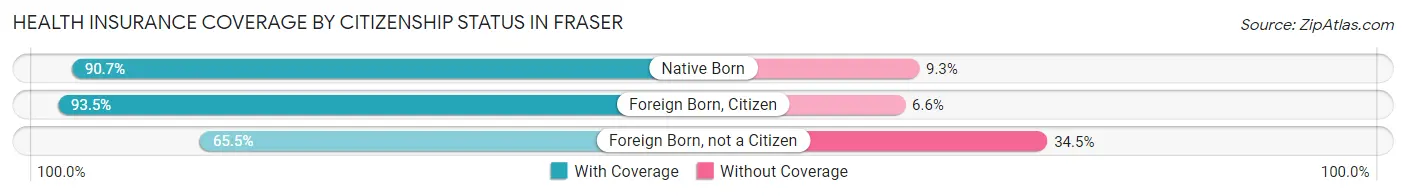
| Citizenship Status | With Coverage | Without Coverage |
| Native Born | 88 (90.7%) | 9 (9.3%) |
| Foreign Born, Citizen | 157 (93.4%) | 11 (6.6%) |
| Foreign Born, not a Citizen | 95 (65.5%) | 50 (34.5%) |
Health Insurance Coverage by Household Income in Fraser
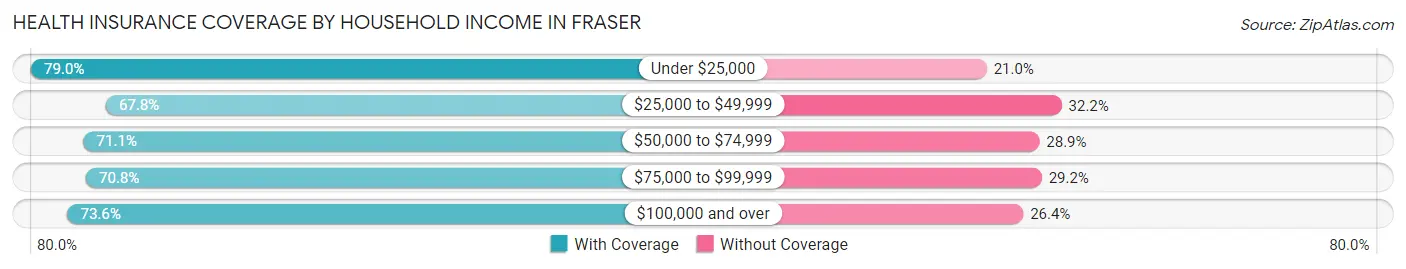
| Household Income | With Coverage | Without Coverage |
| Under $25,000 | 49 (79.0%) | 13 (21.0%) |
| $25,000 to $49,999 | 139 (67.8%) | 66 (32.2%) |
| $50,000 to $74,999 | 143 (71.1%) | 58 (28.9%) |
| $75,000 to $99,999 | 143 (70.8%) | 59 (29.2%) |
| $100,000 and over | 395 (73.6%) | 142 (26.4%) |
Public vs Private Health Insurance Coverage by Age in Fraser
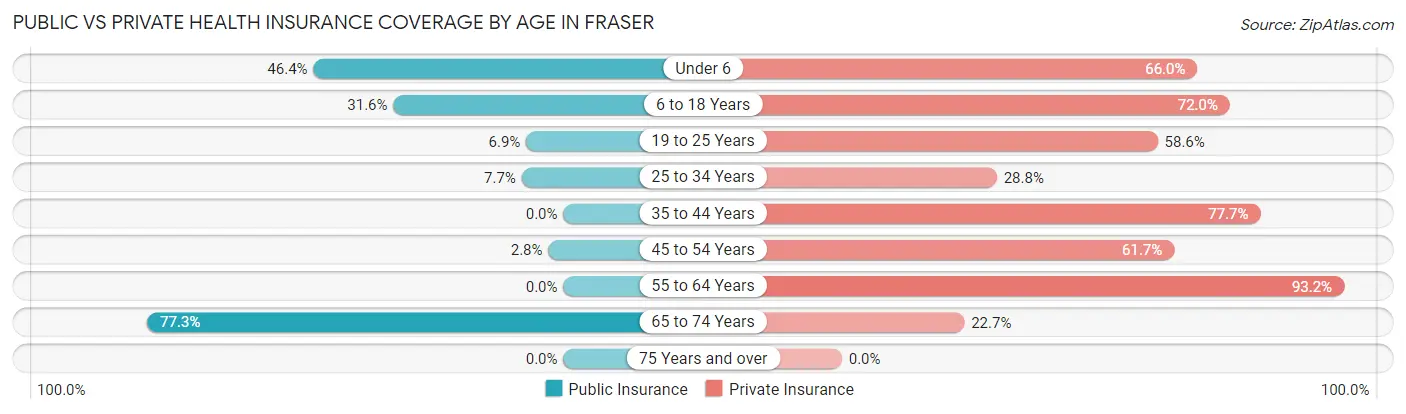
| Age Bracket | Public Insurance | Private Insurance |
| Under 6 | 45 (46.4%) | 64 (66.0%) |
| 6 to 18 Years | 53 (31.6%) | 121 (72.0%) |
| 19 to 25 Years | 10 (6.9%) | 85 (58.6%) |
| 25 to 34 Years | 18 (7.7%) | 67 (28.8%) |
| 35 to 44 Years | 0 (0.0%) | 160 (77.7%) |
| 45 to 54 Years | 5 (2.8%) | 111 (61.7%) |
| 55 to 64 Years | 0 (0.0%) | 137 (93.2%) |
| 65 to 74 Years | 34 (77.3%) | 10 (22.7%) |
| 75 Years and over | 0 (0.0%) | 0 (0.0%) |
| Total | 165 (13.5%) | 755 (61.9%) |
Disability Status by Sex by Age in Fraser
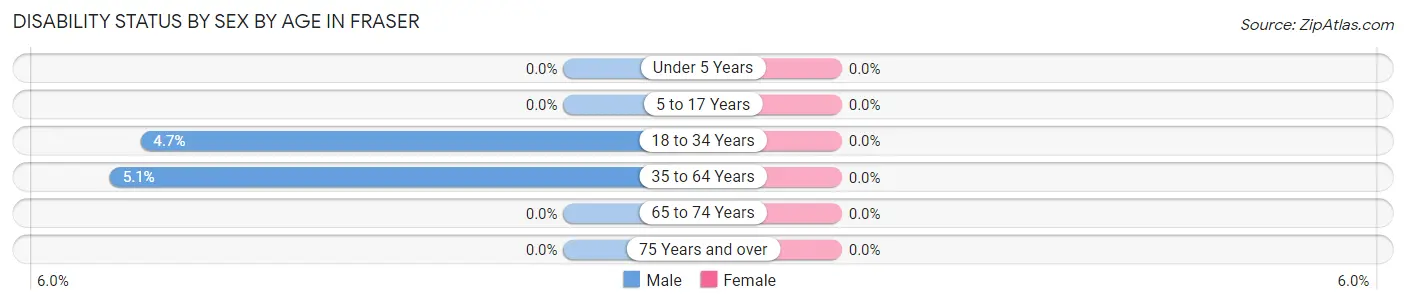
| Age Bracket | Male | Female |
| Under 5 Years | 0 (0.0%) | 0 (0.0%) |
| 5 to 17 Years | 0 (0.0%) | 0 (0.0%) |
| 18 to 34 Years | 14 (4.7%) | 0 (0.0%) |
| 35 to 64 Years | 15 (5.1%) | 0 (0.0%) |
| 65 to 74 Years | 0 (0.0%) | 0 (0.0%) |
| 75 Years and over | 0 (0.0%) | 0 (0.0%) |
Disability Class by Sex by Age in Fraser
Disability Class: Hearing Difficulty
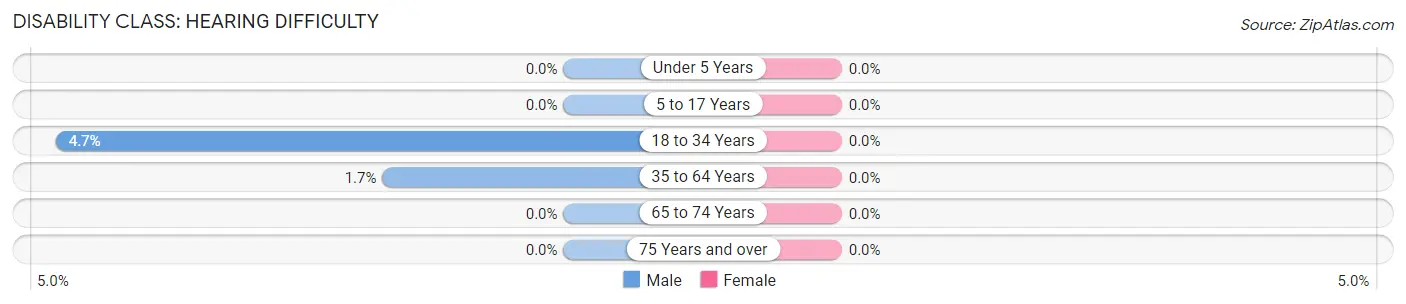
| Age Bracket | Male | Female |
| Under 5 Years | 0 (0.0%) | 0 (0.0%) |
| 5 to 17 Years | 0 (0.0%) | 0 (0.0%) |
| 18 to 34 Years | 14 (4.7%) | 0 (0.0%) |
| 35 to 64 Years | 5 (1.7%) | 0 (0.0%) |
| 65 to 74 Years | 0 (0.0%) | 0 (0.0%) |
| 75 Years and over | 0 (0.0%) | 0 (0.0%) |
Disability Class: Vision Difficulty
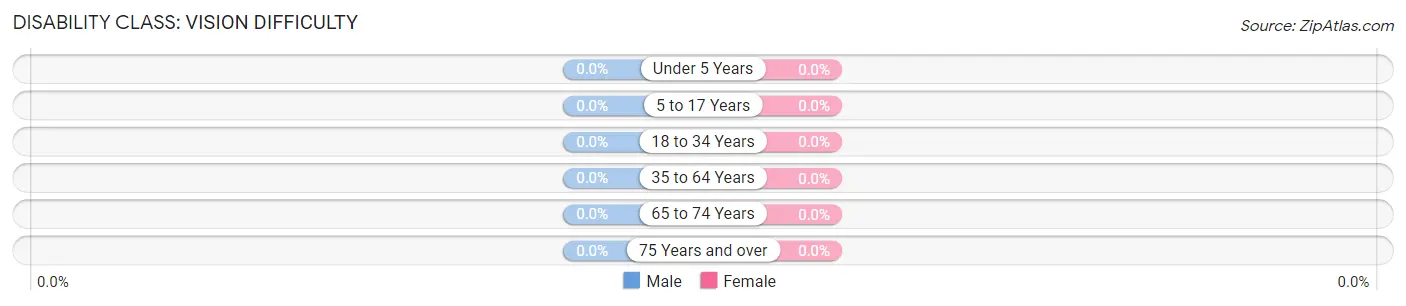
| Age Bracket | Male | Female |
| Under 5 Years | 0 (0.0%) | 0 (0.0%) |
| 5 to 17 Years | 0 (0.0%) | 0 (0.0%) |
| 18 to 34 Years | 0 (0.0%) | 0 (0.0%) |
| 35 to 64 Years | 0 (0.0%) | 0 (0.0%) |
| 65 to 74 Years | 0 (0.0%) | 0 (0.0%) |
| 75 Years and over | 0 (0.0%) | 0 (0.0%) |
Disability Class: Cognitive Difficulty
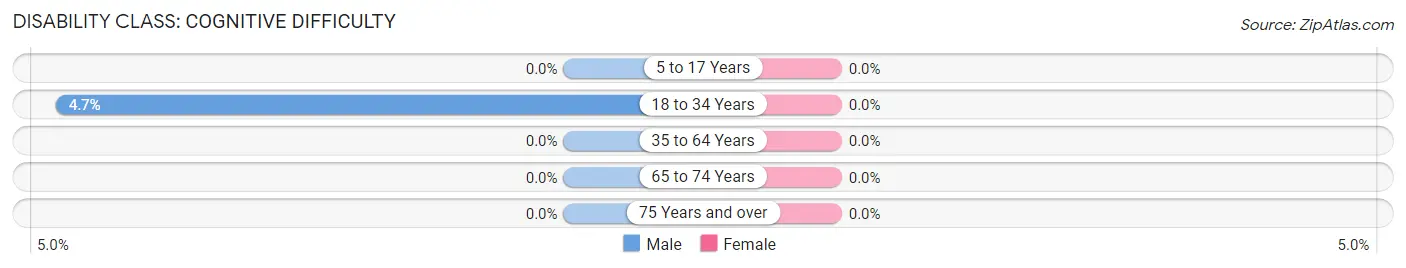
| Age Bracket | Male | Female |
| 5 to 17 Years | 0 (0.0%) | 0 (0.0%) |
| 18 to 34 Years | 14 (4.7%) | 0 (0.0%) |
| 35 to 64 Years | 0 (0.0%) | 0 (0.0%) |
| 65 to 74 Years | 0 (0.0%) | 0 (0.0%) |
| 75 Years and over | 0 (0.0%) | 0 (0.0%) |
Disability Class: Ambulatory Difficulty
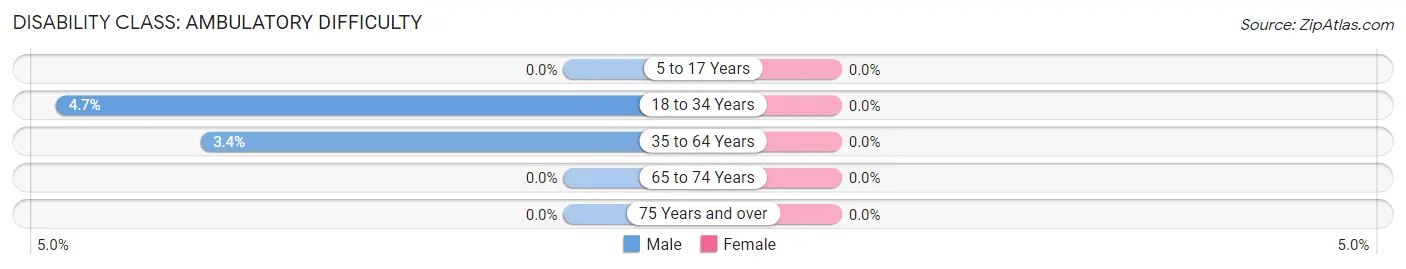
| Age Bracket | Male | Female |
| 5 to 17 Years | 0 (0.0%) | 0 (0.0%) |
| 18 to 34 Years | 14 (4.7%) | 0 (0.0%) |
| 35 to 64 Years | 10 (3.4%) | 0 (0.0%) |
| 65 to 74 Years | 0 (0.0%) | 0 (0.0%) |
| 75 Years and over | 0 (0.0%) | 0 (0.0%) |
Disability Class: Self-Care Difficulty
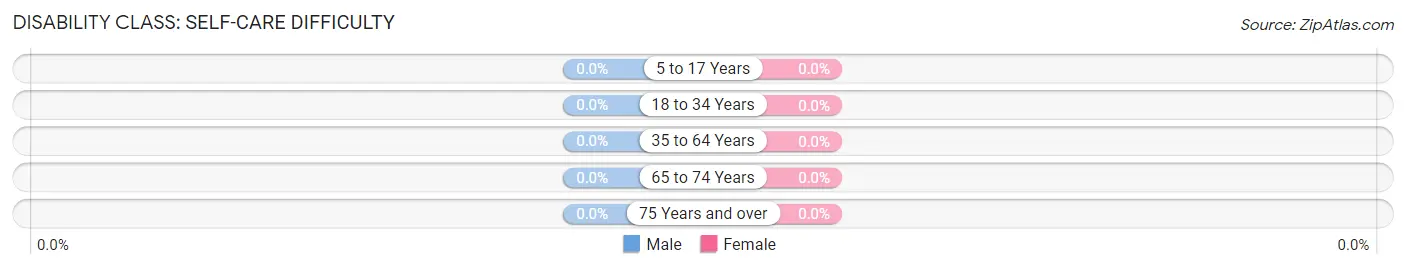
| Age Bracket | Male | Female |
| 5 to 17 Years | 0 (0.0%) | 0 (0.0%) |
| 18 to 34 Years | 0 (0.0%) | 0 (0.0%) |
| 35 to 64 Years | 0 (0.0%) | 0 (0.0%) |
| 65 to 74 Years | 0 (0.0%) | 0 (0.0%) |
| 75 Years and over | 0 (0.0%) | 0 (0.0%) |
Technology Access in Fraser
Computing Device Access in Fraser
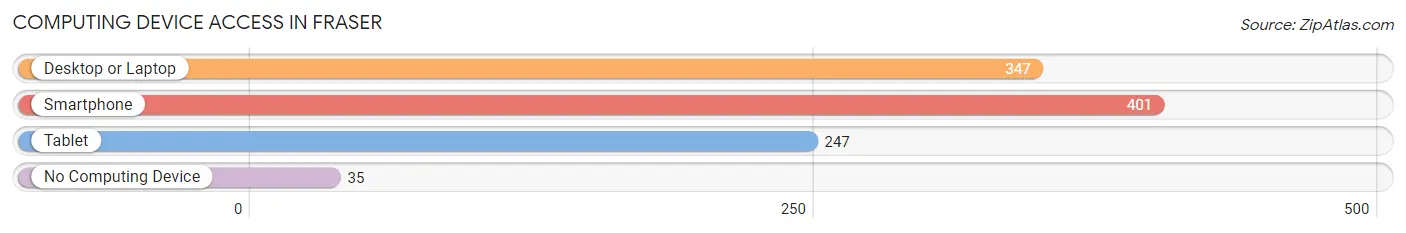
| Device Type | # Households | % Households |
| Desktop or Laptop | 347 | 75.9% |
| Smartphone | 401 | 87.7% |
| Tablet | 247 | 54.0% |
| No Computing Device | 35 | 7.7% |
| Total | 457 | 100.0% |
Internet Access in Fraser
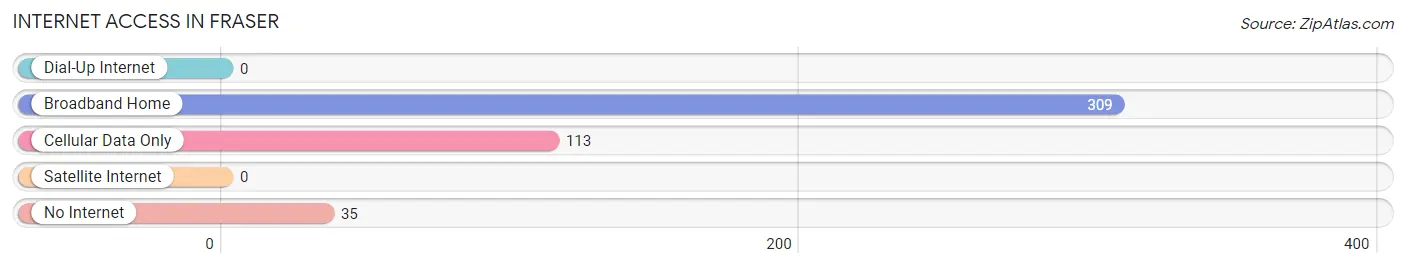
| Internet Type | # Households | % Households |
| Dial-Up Internet | 0 | 0.0% |
| Broadband Home | 309 | 67.6% |
| Cellular Data Only | 113 | 24.7% |
| Satellite Internet | 0 | 0.0% |
| No Internet | 35 | 7.7% |
| Total | 457 | 100.0% |
Fraser Summary
Fraser, Colorado is a small mountain town located in Grand County, Colorado. It is situated in the heart of the Rocky Mountains, just west of the Continental Divide and the Arapaho National Forest. Fraser is a popular destination for outdoor enthusiasts, offering a variety of activities such as skiing, snowmobiling, hiking, fishing, and camping.
History
The town of Fraser was founded in 1874 by a group of settlers from the Midwest. The settlers were looking for a place to settle and raise their families, and they found the perfect spot in the Fraser Valley. The town was named after a local rancher, John Fraser, who owned a large ranch in the area.
The town grew slowly over the years, and by the early 1900s, it had become a popular destination for tourists. The town was known for its beautiful scenery and outdoor activities, and it was also home to a number of businesses, including a hotel, a general store, and a post office.
In the 1950s, Fraser began to experience a population boom as more people moved to the area. This growth was largely due to the construction of the nearby ski resort, Winter Park. The resort brought in a large number of tourists and new residents, and the town began to grow rapidly.
Geography
Fraser is located in the Fraser Valley, which is part of the Rocky Mountains. The town is situated at an elevation of 8,500 feet, and it is surrounded by mountains on all sides. The Fraser River runs through the town, and it is a popular spot for fishing and rafting.
The town is located in a temperate climate, with warm summers and cold winters. The average temperature in the summer is around 70 degrees Fahrenheit, and the average temperature in the winter is around 20 degrees Fahrenheit.
Economy
The economy of Fraser is largely based on tourism. The town is home to a number of ski resorts, including Winter Park, which is one of the most popular ski resorts in the country. The town also has a number of restaurants, bars, and shops, which cater to tourists and locals alike.
In addition to tourism, Fraser is also home to a number of businesses, including a lumber mill, a brewery, and a number of small businesses. The town is also home to a number of small farms, which produce a variety of crops, including hay, potatoes, and apples.
Demographics
As of the 2010 census, the population of Fraser was 1,224. The town is predominantly white, with 92.3% of the population identifying as white. The median age of the population is 43.7 years, and the median household income is $50,945.
Conclusion
Fraser, Colorado is a small mountain town located in Grand County, Colorado. It is situated in the heart of the Rocky Mountains, just west of the Continental Divide and the Arapaho National Forest. The town is known for its beautiful scenery and outdoor activities, and it is also home to a number of businesses, including a hotel, a general store, and a post office. The economy of Fraser is largely based on tourism, and the town is home to a number of ski resorts, restaurants, bars, and shops. The population of Fraser is predominantly white, with a median age of 43.7 years and a median household income of $50,945.
Common Questions
What is Per Capita Income in Fraser?
Per Capita income in Fraser is $43,764.
What is the Median Family Income in Fraser?
Median Family Income in Fraser is $101,875.
What is the Median Household income in Fraser?
Median Household Income in Fraser is $75,893.
What is Income or Wage Gap in Fraser?
Income or Wage Gap in Fraser is 17.2%.
Women in Fraser earn 82.8 cents for every dollar earned by a man.
What is Inequality or Gini Index in Fraser?
Inequality or Gini Index in Fraser is 0.42.
What is the Total Population of Fraser?
Total Population of Fraser is 1,220.
What is the Total Male Population of Fraser?
Total Male Population of Fraser is 716.
What is the Total Female Population of Fraser?
Total Female Population of Fraser is 504.
What is the Ratio of Males per 100 Females in Fraser?
There are 142.06 Males per 100 Females in Fraser.
What is the Ratio of Females per 100 Males in Fraser?
There are 70.39 Females per 100 Males in Fraser.
What is the Median Population Age in Fraser?
Median Population Age in Fraser is 32.5 Years.
What is the Average Family Size in Fraser
Average Family Size in Fraser is 3.2 People.
What is the Average Household Size in Fraser
Average Household Size in Fraser is 2.6 People.
How Large is the Labor Force in Fraser?
There are 883 People in the Labor Forcein in Fraser.
What is the Percentage of People in the Labor Force in Fraser?
89.3% of People are in the Labor Force in Fraser.
What is the Unemployment Rate in Fraser?
Unemployment Rate in Fraser is 10.1%.