Jamesport, NY Map & Demographics
Jamesport Map
Jamesport Overview
$71,847
PER CAPITA INCOME
$111,875
AVG FAMILY INCOME
$110,208
AVG HOUSEHOLD INCOME
17.3%
WAGE / INCOME GAP [ % ]
82.7¢/ $1
WAGE / INCOME GAP [ $ ]
0.50
INEQUALITY / GINI INDEX
1,634
TOTAL POPULATION
940
MALE POPULATION
694
FEMALE POPULATION
135.45
MALES / 100 FEMALES
73.83
FEMALES / 100 MALES
59.6
MEDIAN AGE
2.2
AVG FAMILY SIZE
2.1
AVG HOUSEHOLD SIZE
784
LABOR FORCE [ PEOPLE ]
50.1%
PERCENT IN LABOR FORCE
4.8%
UNEMPLOYMENT RATE
Jamesport Zip Codes
Jamesport Area Codes
Income in Jamesport
Income Overview in Jamesport
Per Capita Income in Jamesport is $71,847, while median incomes of families and households are $111,875 and $110,208 respectively.
| Characteristic | Number | Measure |
| Per Capita Income | 1,634 | $71,847 |
| Median Family Income | 584 | $111,875 |
| Mean Family Income | 584 | $180,620 |
| Median Household Income | 754 | $110,208 |
| Mean Household Income | 754 | $164,189 |
| Income Deficit | 584 | $0 |
| Wage / Income Gap (%) | 1,634 | 17.30% |
| Wage / Income Gap ($) | 1,634 | 82.70¢ per $1 |
| Gini / Inequality Index | 1,634 | 0.50 |
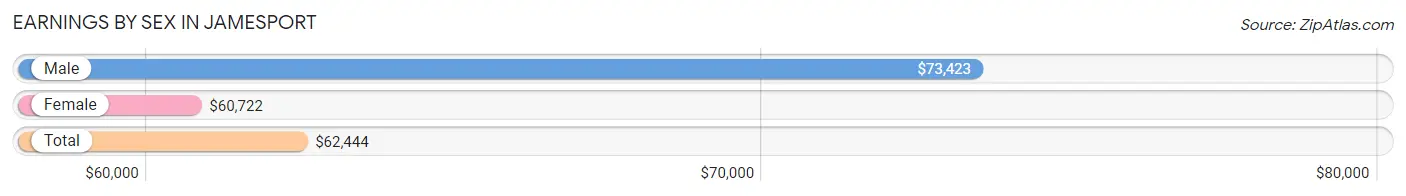
Earnings by Sex in Jamesport
Average Earnings in Jamesport are $62,444, $73,423 for men and $60,722 for women, a difference of 17.3%.
| Sex | Number | Average Earnings |
| Male | 424 (49.5%) | $73,423 |
| Female | 432 (50.5%) | $60,722 |
| Total | 856 (100.0%) | $62,444 |
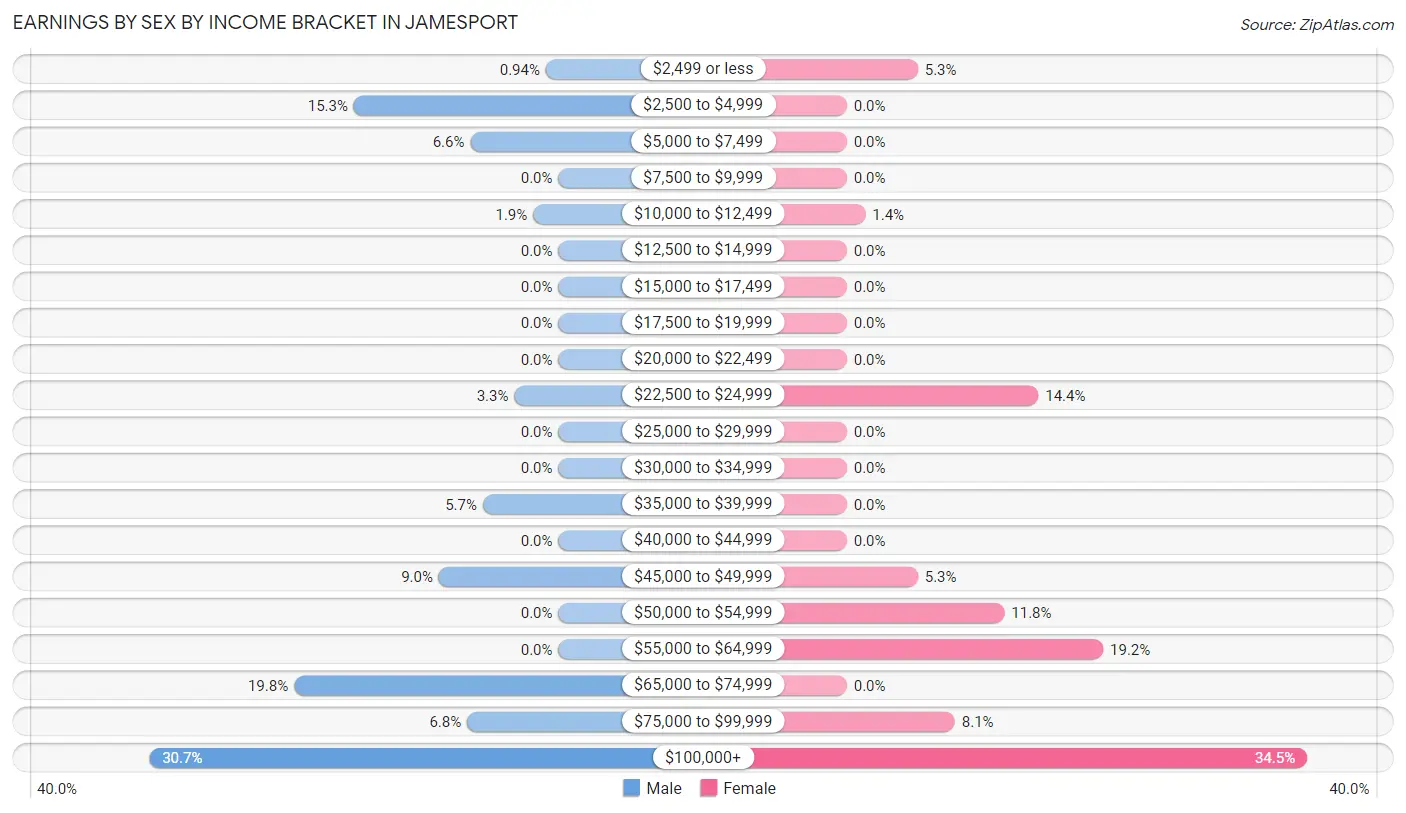
Earnings by Sex by Income Bracket in Jamesport
The most common earnings brackets in Jamesport are $100,000+ for men (130 | 30.7%) and $100,000+ for women (149 | 34.5%).
| Income | Male | Female |
| $2,499 or less | 4 (0.9%) | 23 (5.3%) |
| $2,500 to $4,999 | 65 (15.3%) | 0 (0.0%) |
| $5,000 to $7,499 | 28 (6.6%) | 0 (0.0%) |
| $7,500 to $9,999 | 0 (0.0%) | 0 (0.0%) |
| $10,000 to $12,499 | 8 (1.9%) | 6 (1.4%) |
| $12,500 to $14,999 | 0 (0.0%) | 0 (0.0%) |
| $15,000 to $17,499 | 0 (0.0%) | 0 (0.0%) |
| $17,500 to $19,999 | 0 (0.0%) | 0 (0.0%) |
| $20,000 to $22,499 | 0 (0.0%) | 0 (0.0%) |
| $22,500 to $24,999 | 14 (3.3%) | 62 (14.3%) |
| $25,000 to $29,999 | 0 (0.0%) | 0 (0.0%) |
| $30,000 to $34,999 | 0 (0.0%) | 0 (0.0%) |
| $35,000 to $39,999 | 24 (5.7%) | 0 (0.0%) |
| $40,000 to $44,999 | 0 (0.0%) | 0 (0.0%) |
| $45,000 to $49,999 | 38 (9.0%) | 23 (5.3%) |
| $50,000 to $54,999 | 0 (0.0%) | 51 (11.8%) |
| $55,000 to $64,999 | 0 (0.0%) | 83 (19.2%) |
| $65,000 to $74,999 | 84 (19.8%) | 0 (0.0%) |
| $75,000 to $99,999 | 29 (6.8%) | 35 (8.1%) |
| $100,000+ | 130 (30.7%) | 149 (34.5%) |
| Total | 424 (100.0%) | 432 (100.0%) |
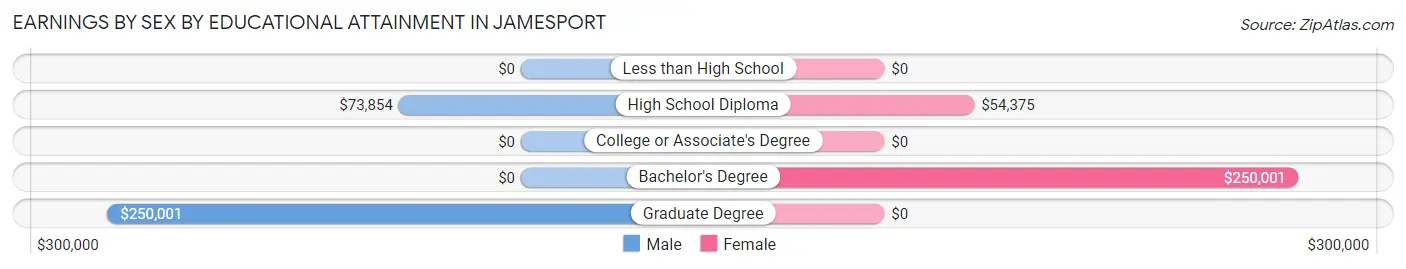
Earnings by Sex by Educational Attainment in Jamesport
Average earnings in Jamesport are $74,390 for men and $60,722 for women, a difference of 18.4%. Men with an educational attainment of graduate degree enjoy the highest average annual earnings of $250,001, while those with high school diploma education earn the least with $73,854. Women with an educational attainment of bachelor's degree earn the most with the average annual earnings of $250,001, while those with high school diploma education have the smallest earnings of $54,375.
| Educational Attainment | Male Income | Female Income |
| Less than High School | - | - |
| High School Diploma | $73,854 | $54,375 |
| College or Associate's Degree | - | - |
| Bachelor's Degree | - | - |
| Graduate Degree | $250,001 | $0 |
| Total | $74,390 | $60,722 |
Family Income in Jamesport
Family Income Brackets in Jamesport
According to the Jamesport family income data, there are 146 families falling into the $75,000 to $99,999 income range, which is the most common income bracket and makes up 25.0% of all families.
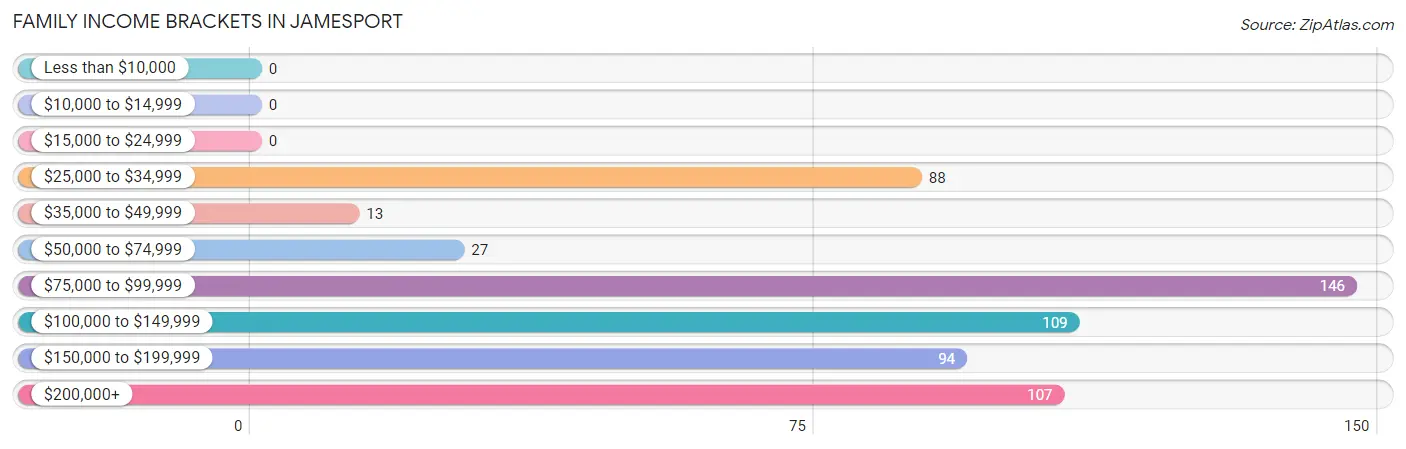
| Income Bracket | # Families | % Families |
| Less than $10,000 | 0 | 0.0% |
| $10,000 to $14,999 | 0 | 0.0% |
| $15,000 to $24,999 | 0 | 0.0% |
| $25,000 to $34,999 | 88 | 15.1% |
| $35,000 to $49,999 | 13 | 2.2% |
| $50,000 to $74,999 | 27 | 4.6% |
| $75,000 to $99,999 | 146 | 25.0% |
| $100,000 to $149,999 | 109 | 18.7% |
| $150,000 to $199,999 | 94 | 16.1% |
| $200,000+ | 107 | 18.3% |
Family Income by Famaliy Size in Jamesport
2-person families (375 | 64.2%) account for the highest median family income in Jamesport with $130,099 per family, while 2-person families (375 | 64.2%) have the highest median income of $65,050 per family member.
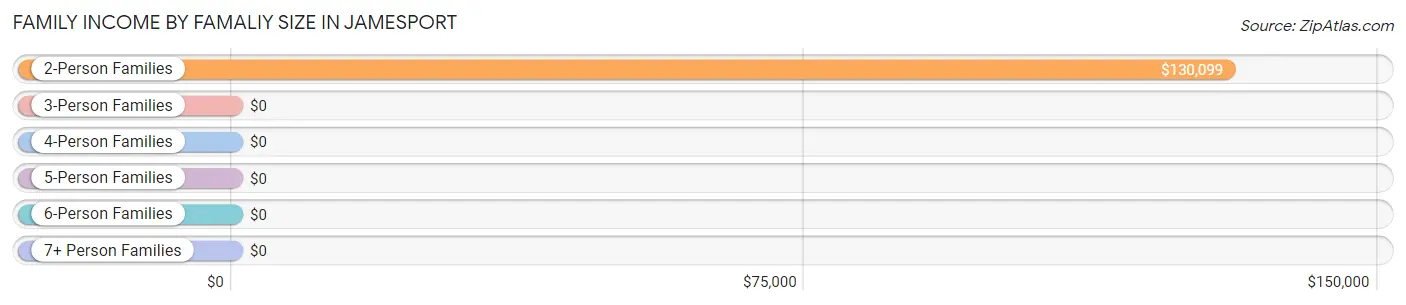
| Income Bracket | # Families | Median Income |
| 2-Person Families | 375 (64.2%) | $130,099 |
| 3-Person Families | 159 (27.2%) | $0 |
| 4-Person Families | 8 (1.4%) | $0 |
| 5-Person Families | 42 (7.2%) | $0 |
| 6-Person Families | 0 (0.0%) | $0 |
| 7+ Person Families | 0 (0.0%) | $0 |
| Total | 584 (100.0%) | $111,875 |
Family Income by Number of Earners in Jamesport
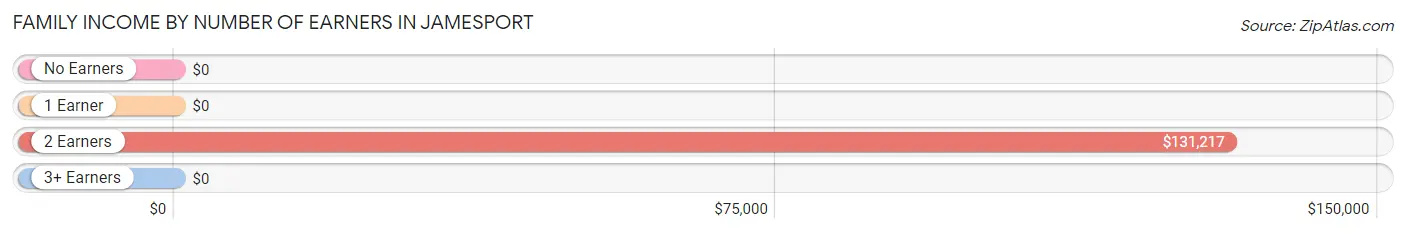
| Number of Earners | # Families | Median Income |
| No Earners | 132 (22.6%) | $0 |
| 1 Earner | 67 (11.5%) | $0 |
| 2 Earners | 385 (65.9%) | $131,217 |
| 3+ Earners | 0 (0.0%) | $0 |
| Total | 584 (100.0%) | $111,875 |
Household Income in Jamesport
Household Income Brackets in Jamesport
With 176 households falling in the category, the $200,000+ income range is the most frequent in Jamesport, accounting for 23.3% of all households.
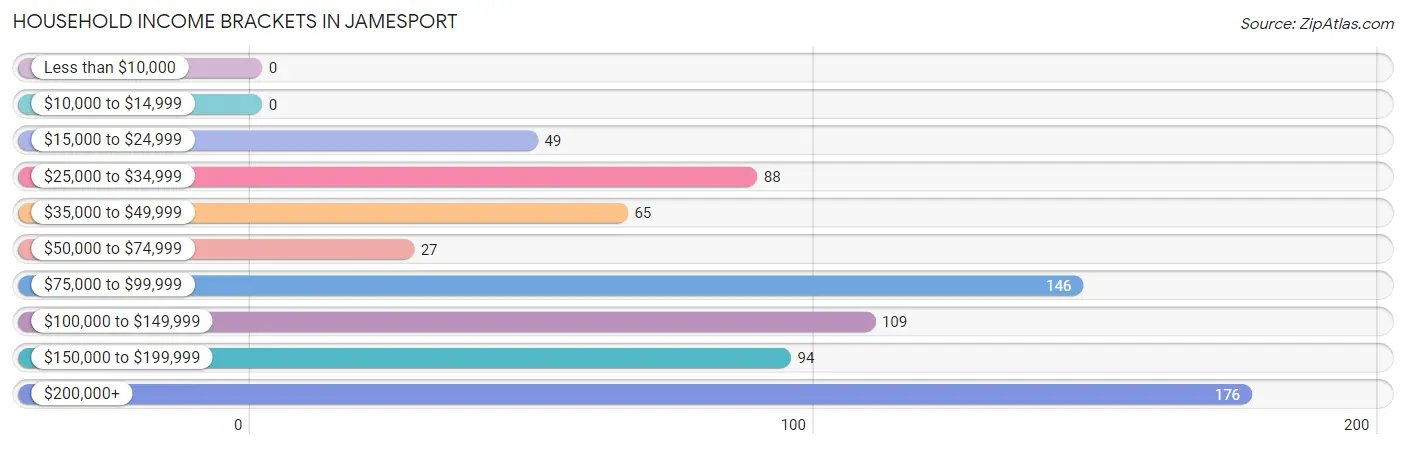
| Income Bracket | # Households | % Households |
| Less than $10,000 | 0 | 0.0% |
| $10,000 to $14,999 | 0 | 0.0% |
| $15,000 to $24,999 | 49 | 6.5% |
| $25,000 to $34,999 | 88 | 11.7% |
| $35,000 to $49,999 | 65 | 8.6% |
| $50,000 to $74,999 | 27 | 3.6% |
| $75,000 to $99,999 | 146 | 19.4% |
| $100,000 to $149,999 | 109 | 14.5% |
| $150,000 to $199,999 | 94 | 12.5% |
| $200,000+ | 176 | 23.3% |
Household Income by Householder Age in Jamesport
The median household income in Jamesport is $110,208, with the highest median household income of $250,001 found in the 25 to 44 years age bracket for the primary householder. A total of 77 households (10.2%) fall into this category.
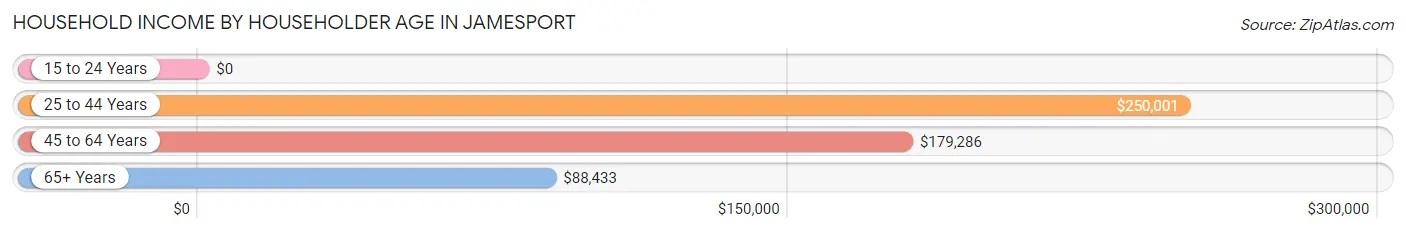
| Income Bracket | # Households | Median Income |
| 15 to 24 Years | 0 (0.0%) | $0 |
| 25 to 44 Years | 77 (10.2%) | $250,001 |
| 45 to 64 Years | 248 (32.9%) | $179,286 |
| 65+ Years | 429 (56.9%) | $88,433 |
| Total | 754 (100.0%) | $110,208 |
Poverty in Jamesport
Income Below Poverty by Sex and Age in Jamesport
With 5.2% poverty level for males and 2.3% for females among the residents of Jamesport, 65 to 74 year old males and 35 to 44 year old females are the most vulnerable to poverty, with 49 males (17.6%) and 10 females (32.3%) in their respective age groups living below the poverty level.
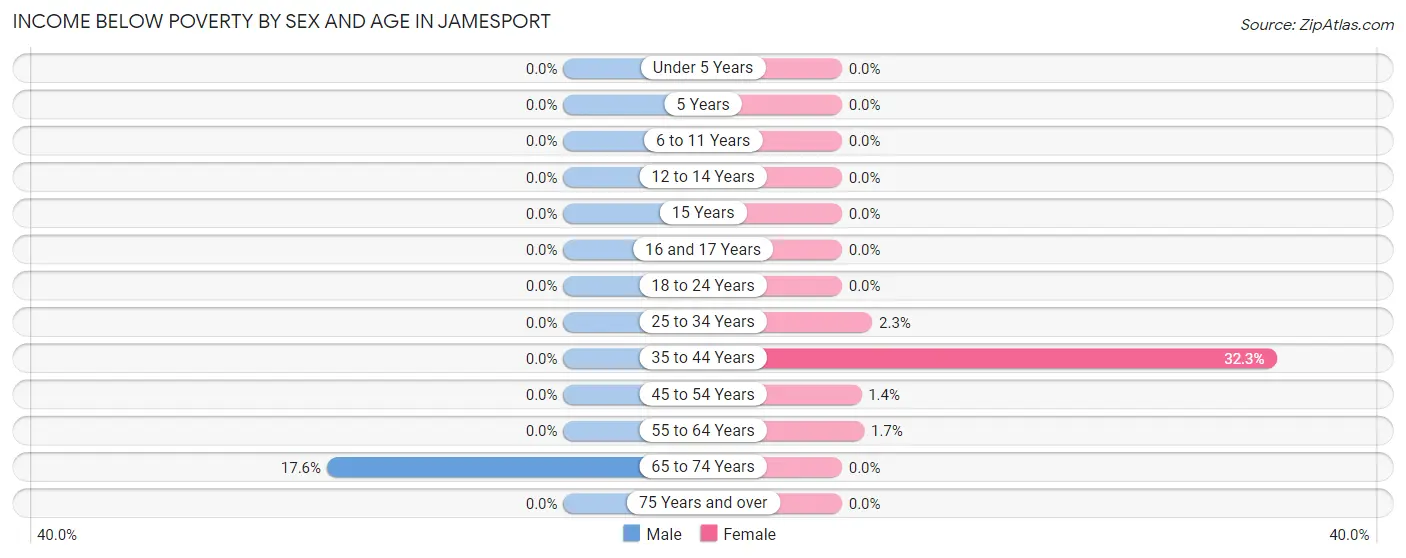
| Age Bracket | Male | Female |
| Under 5 Years | 0 (0.0%) | 0 (0.0%) |
| 5 Years | 0 (0.0%) | 0 (0.0%) |
| 6 to 11 Years | 0 (0.0%) | 0 (0.0%) |
| 12 to 14 Years | 0 (0.0%) | 0 (0.0%) |
| 15 Years | 0 (0.0%) | 0 (0.0%) |
| 16 and 17 Years | 0 (0.0%) | 0 (0.0%) |
| 18 to 24 Years | 0 (0.0%) | 0 (0.0%) |
| 25 to 34 Years | 0 (0.0%) | 2 (2.2%) |
| 35 to 44 Years | 0 (0.0%) | 10 (32.3%) |
| 45 to 54 Years | 0 (0.0%) | 2 (1.4%) |
| 55 to 64 Years | 0 (0.0%) | 2 (1.7%) |
| 65 to 74 Years | 49 (17.6%) | 0 (0.0%) |
| 75 Years and over | 0 (0.0%) | 0 (0.0%) |
| Total | 49 (5.2%) | 16 (2.3%) |
Income Above Poverty by Sex and Age in Jamesport
According to the poverty statistics in Jamesport, males aged under 5 years and females aged under 5 years are the age groups that are most secure financially, with 100.0% of males and 100.0% of females in these age groups living above the poverty line.
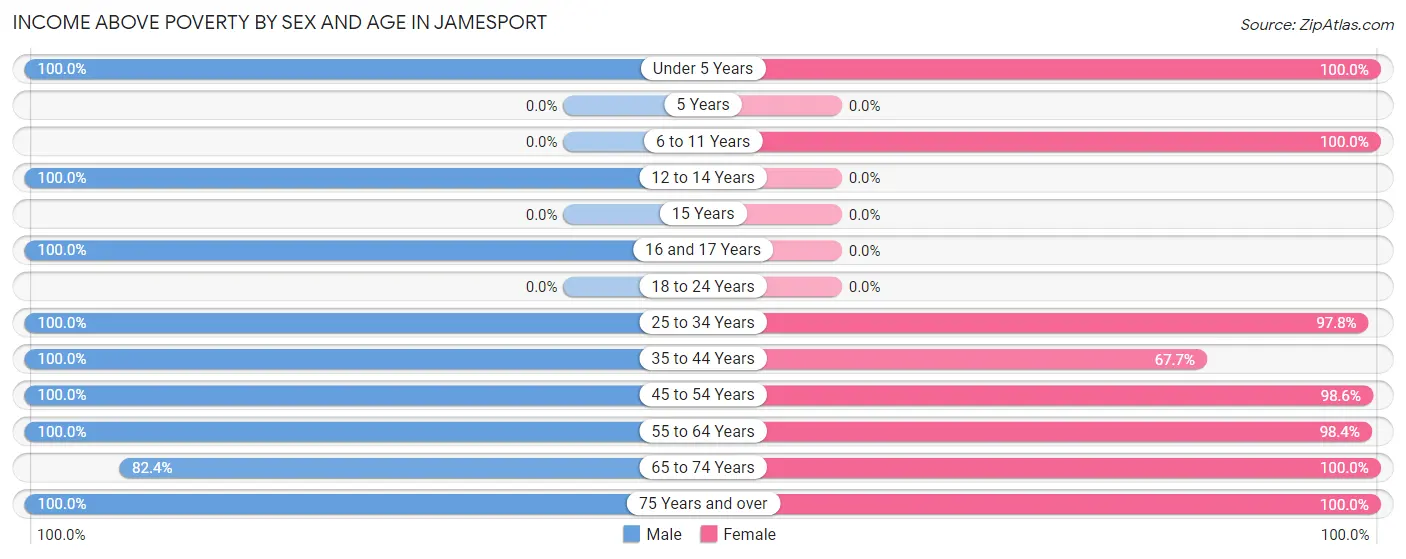
| Age Bracket | Male | Female |
| Under 5 Years | 14 (100.0%) | 8 (100.0%) |
| 5 Years | 0 (0.0%) | 0 (0.0%) |
| 6 to 11 Years | 0 (0.0%) | 8 (100.0%) |
| 12 to 14 Years | 40 (100.0%) | 0 (0.0%) |
| 15 Years | 0 (0.0%) | 0 (0.0%) |
| 16 and 17 Years | 65 (100.0%) | 0 (0.0%) |
| 18 to 24 Years | 0 (0.0%) | 0 (0.0%) |
| 25 to 34 Years | 152 (100.0%) | 87 (97.8%) |
| 35 to 44 Years | 22 (100.0%) | 21 (67.7%) |
| 45 to 54 Years | 112 (100.0%) | 137 (98.6%) |
| 55 to 64 Years | 105 (100.0%) | 119 (98.4%) |
| 65 to 74 Years | 230 (82.4%) | 189 (100.0%) |
| 75 Years and over | 151 (100.0%) | 109 (100.0%) |
| Total | 891 (94.8%) | 678 (97.7%) |
Income Below Poverty Among Married-Couple Families in Jamesport
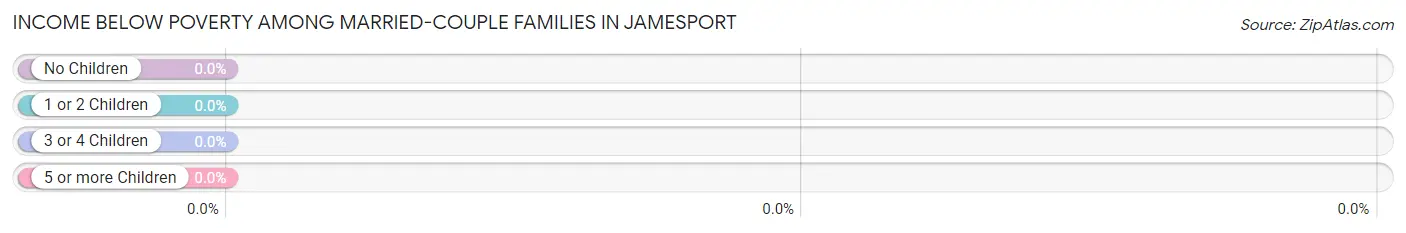
| Children | Above Poverty | Below Poverty |
| No Children | 375 (100.0%) | 0 (0.0%) |
| 1 or 2 Children | 209 (100.0%) | 0 (0.0%) |
| 3 or 4 Children | 0 (0.0%) | 0 (0.0%) |
| 5 or more Children | 0 (0.0%) | 0 (0.0%) |
| Total | 584 (100.0%) | 0 (0.0%) |
Income Below Poverty Among Single-Parent Households in Jamesport
| Children | Single Father | Single Mother |
| No Children | 0 (0.0%) | 0 (0.0%) |
| 1 or 2 Children | 0 (0.0%) | 0 (0.0%) |
| 3 or 4 Children | 0 (0.0%) | 0 (0.0%) |
| 5 or more Children | 0 (0.0%) | 0 (0.0%) |
| Total | 0 (0.0%) | 0 (0.0%) |
Income Below Poverty Among Married-Couple vs Single-Parent Households in Jamesport
| Children | Married-Couple Families | Single-Parent Households |
| No Children | 0 (0.0%) | 0 (0.0%) |
| 1 or 2 Children | 0 (0.0%) | 0 (0.0%) |
| 3 or 4 Children | 0 (0.0%) | 0 (0.0%) |
| 5 or more Children | 0 (0.0%) | 0 (0.0%) |
| Total | 0 (0.0%) | 0 (0.0%) |
Race in Jamesport
The most populous races in Jamesport are White / Caucasian (1,433 | 87.7%), Asian (187 | 11.4%), and Hispanic or Latino (60 | 3.7%).
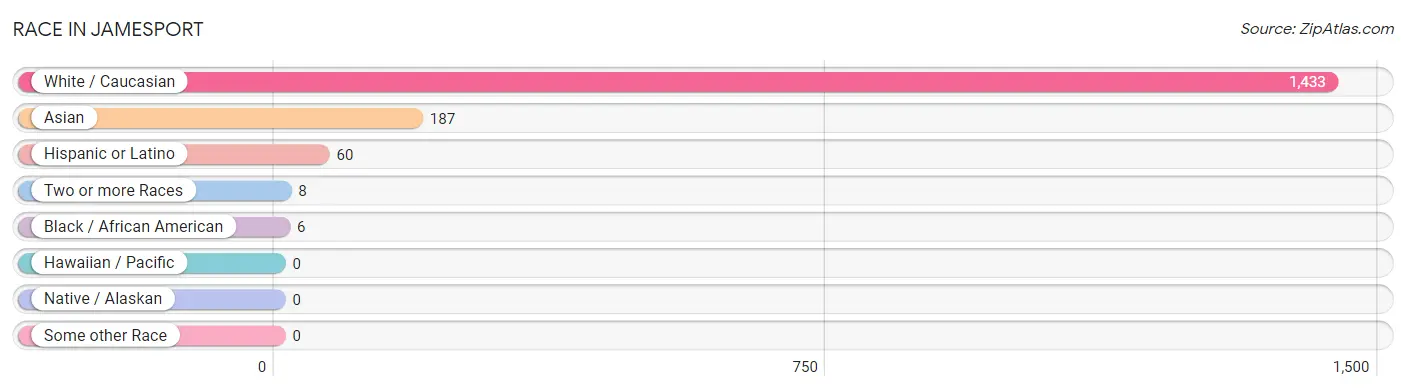
| Race | # Population | % Population |
| Asian | 187 | 11.4% |
| Black / African American | 6 | 0.4% |
| Hawaiian / Pacific | 0 | 0.0% |
| Hispanic or Latino | 60 | 3.7% |
| Native / Alaskan | 0 | 0.0% |
| White / Caucasian | 1,433 | 87.7% |
| Two or more Races | 8 | 0.5% |
| Some other Race | 0 | 0.0% |
| Total | 1,634 | 100.0% |
Ancestry in Jamesport
The most populous ancestries reported in Jamesport are American (334 | 20.4%), Irish (248 | 15.2%), German (222 | 13.6%), Italian (203 | 12.4%), and Laotian (146 | 8.9%), together accounting for 70.6% of all Jamesport residents.
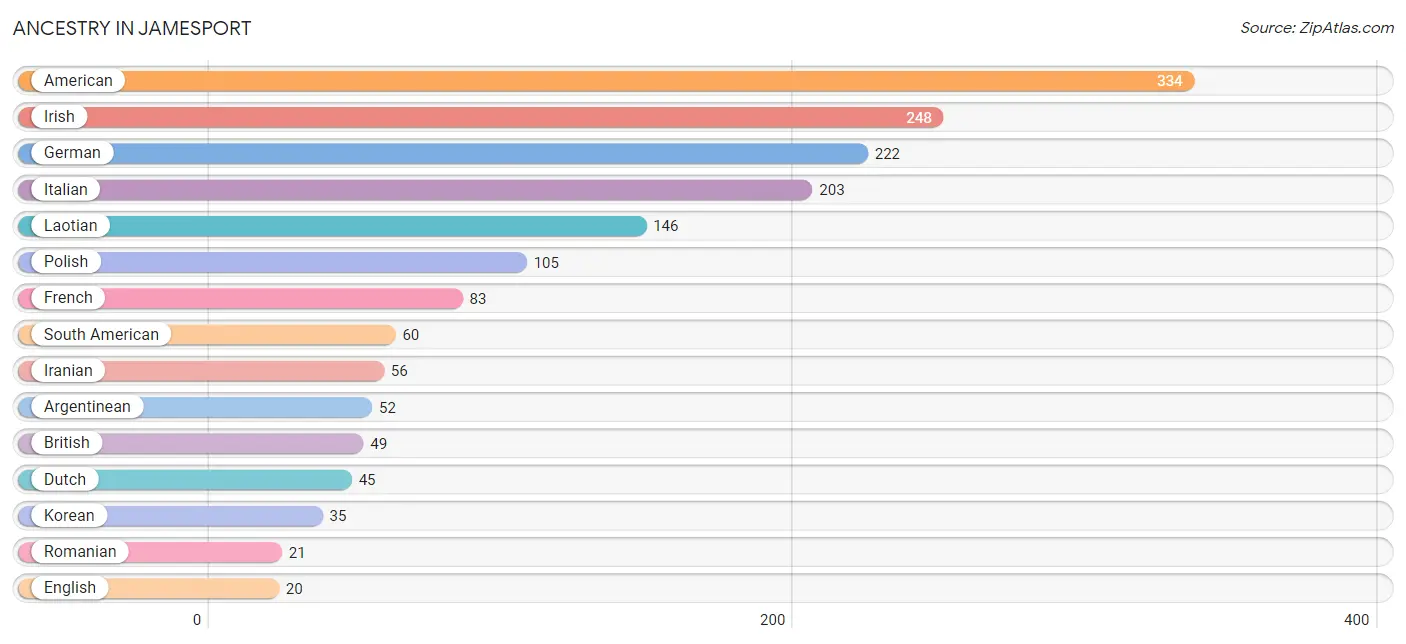
| Ancestry | # Population | % Population |
| American | 334 | 20.4% |
| Argentinean | 52 | 3.2% |
| British | 49 | 3.0% |
| Burmese | 6 | 0.4% |
| Colombian | 8 | 0.5% |
| Dutch | 45 | 2.8% |
| English | 20 | 1.2% |
| French | 83 | 5.1% |
| German | 222 | 13.6% |
| Iranian | 56 | 3.4% |
| Irish | 248 | 15.2% |
| Italian | 203 | 12.4% |
| Korean | 35 | 2.1% |
| Laotian | 146 | 8.9% |
| Polish | 105 | 6.4% |
| Romanian | 21 | 1.3% |
| South American | 60 | 3.7% | View All 17 Rows |
Immigrants in Jamesport
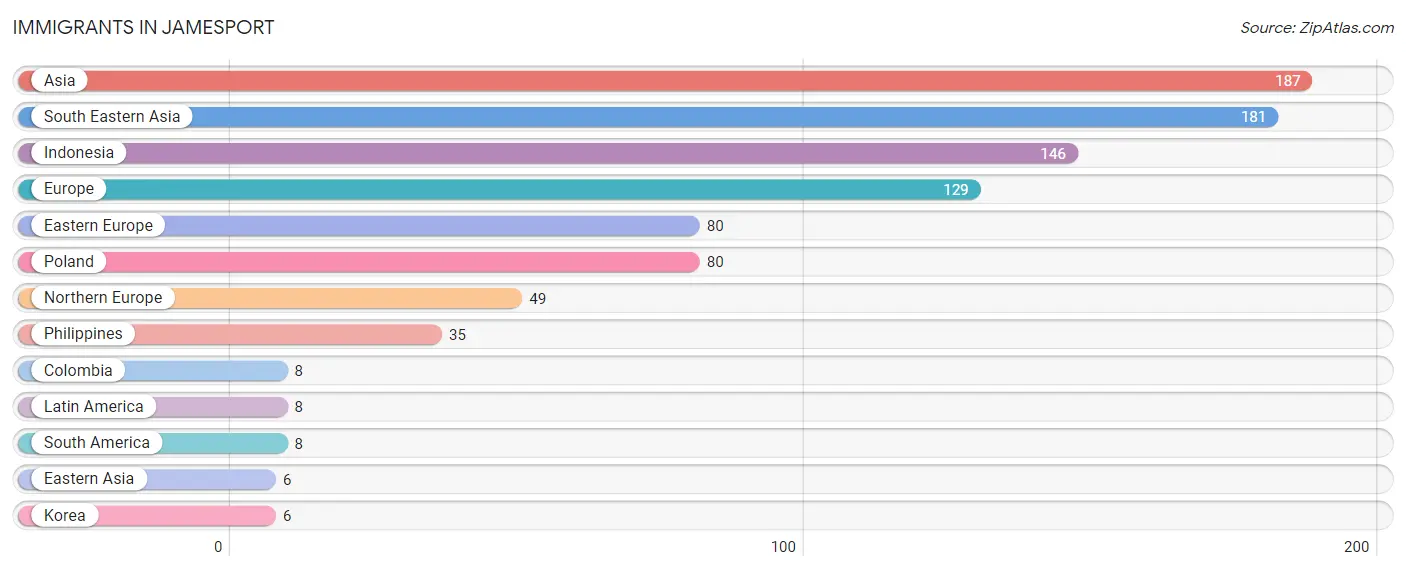
The most numerous immigrant groups reported in Jamesport came from Asia (187 | 11.4%), South Eastern Asia (181 | 11.1%), Indonesia (146 | 8.9%), Europe (129 | 7.9%), and Eastern Europe (80 | 4.9%), together accounting for 44.2% of all Jamesport residents.
| Immigration Origin | # Population | % Population |
| Asia | 187 | 11.4% |
| Colombia | 8 | 0.5% |
| Eastern Asia | 6 | 0.4% |
| Eastern Europe | 80 | 4.9% |
| Europe | 129 | 7.9% |
| Indonesia | 146 | 8.9% |
| Korea | 6 | 0.4% |
| Latin America | 8 | 0.5% |
| Northern Europe | 49 | 3.0% |
| Philippines | 35 | 2.1% |
| Poland | 80 | 4.9% |
| South America | 8 | 0.5% |
| South Eastern Asia | 181 | 11.1% | View All 13 Rows |
Sex and Age in Jamesport
Sex and Age in Jamesport
The most populous age groups in Jamesport are 65 to 69 Years (255 | 27.1%) for men and 65 to 69 Years (146 | 21.0%) for women.
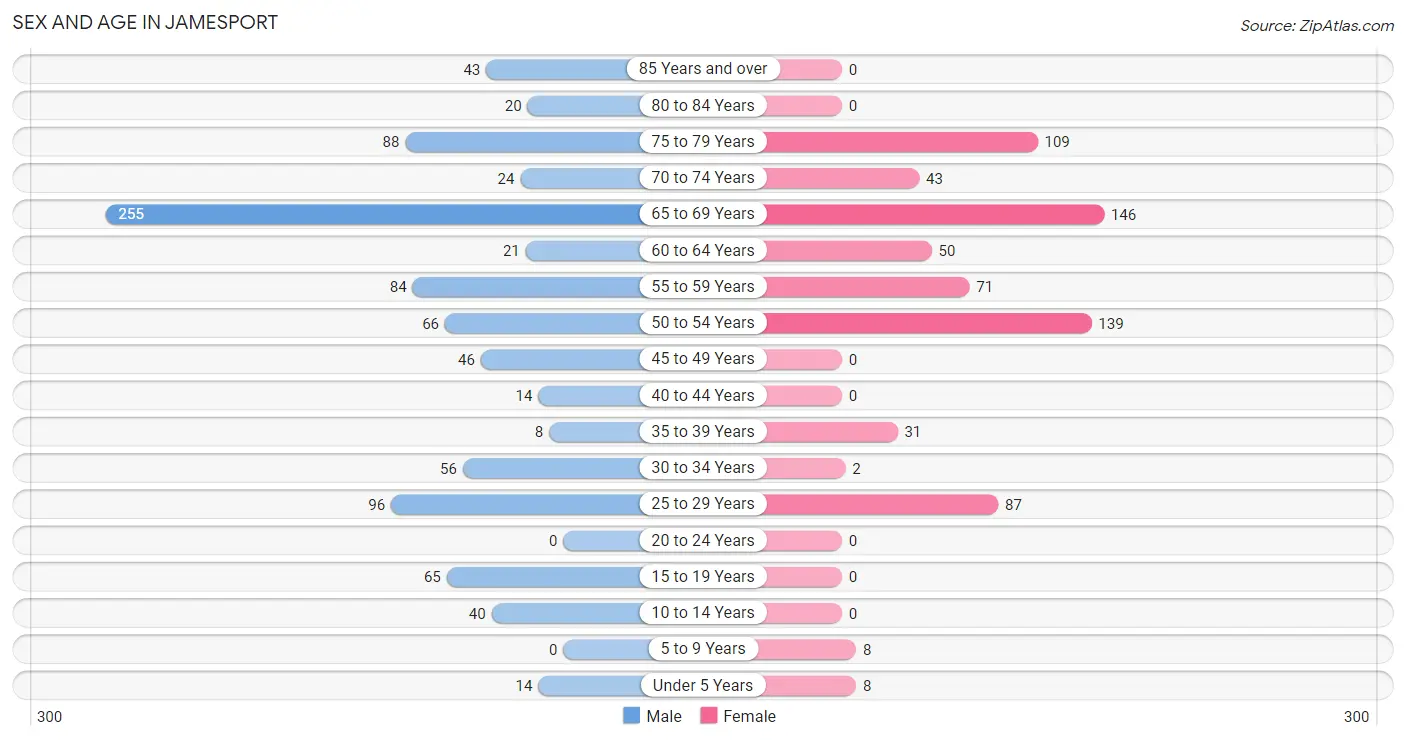
| Age Bracket | Male | Female |
| Under 5 Years | 14 (1.5%) | 8 (1.1%) |
| 5 to 9 Years | 0 (0.0%) | 8 (1.1%) |
| 10 to 14 Years | 40 (4.3%) | 0 (0.0%) |
| 15 to 19 Years | 65 (6.9%) | 0 (0.0%) |
| 20 to 24 Years | 0 (0.0%) | 0 (0.0%) |
| 25 to 29 Years | 96 (10.2%) | 87 (12.5%) |
| 30 to 34 Years | 56 (6.0%) | 2 (0.3%) |
| 35 to 39 Years | 8 (0.9%) | 31 (4.5%) |
| 40 to 44 Years | 14 (1.5%) | 0 (0.0%) |
| 45 to 49 Years | 46 (4.9%) | 0 (0.0%) |
| 50 to 54 Years | 66 (7.0%) | 139 (20.0%) |
| 55 to 59 Years | 84 (8.9%) | 71 (10.2%) |
| 60 to 64 Years | 21 (2.2%) | 50 (7.2%) |
| 65 to 69 Years | 255 (27.1%) | 146 (21.0%) |
| 70 to 74 Years | 24 (2.5%) | 43 (6.2%) |
| 75 to 79 Years | 88 (9.4%) | 109 (15.7%) |
| 80 to 84 Years | 20 (2.1%) | 0 (0.0%) |
| 85 Years and over | 43 (4.6%) | 0 (0.0%) |
| Total | 940 (100.0%) | 694 (100.0%) |
Families and Households in Jamesport
Median Family Size in Jamesport
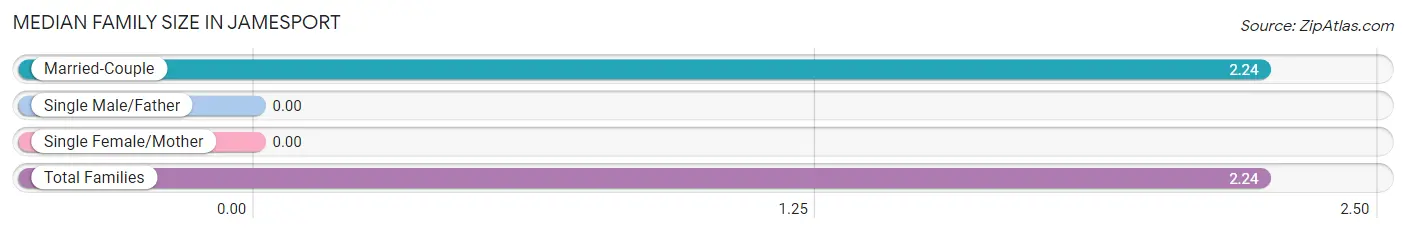
| Family Type | # Families | Family Size |
| Married-Couple | 584 (100.0%) | 2.24 |
| Single Male/Father | 0 (0.0%) | - |
| Single Female/Mother | 0 (0.0%) | - |
| Total Families | 584 (100.0%) | 2.24 |
Median Household Size in Jamesport
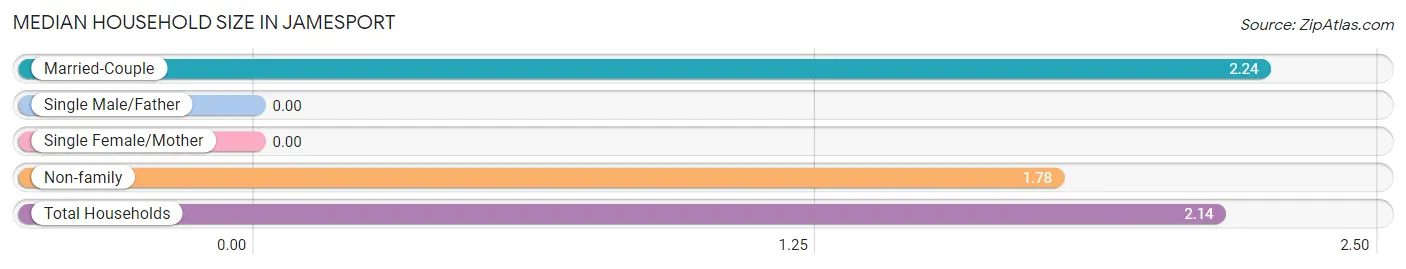
| Household Type | # Households | Household Size |
| Married-Couple | 584 (77.4%) | 2.24 |
| Single Male/Father | 0 (0.0%) | - |
| Single Female/Mother | 0 (0.0%) | - |
| Non-family | 170 (22.6%) | 1.78 |
| Total Households | 754 (100.0%) | 2.14 |
Household Size by Marriage Status in Jamesport
Out of a total of 754 households in Jamesport, 584 (77.4%) are family households, while 170 (22.6%) are nonfamily households. The most numerous type of family households are 2-person households, comprising 375, and the most common type of nonfamily households are 2-person households, comprising 118.
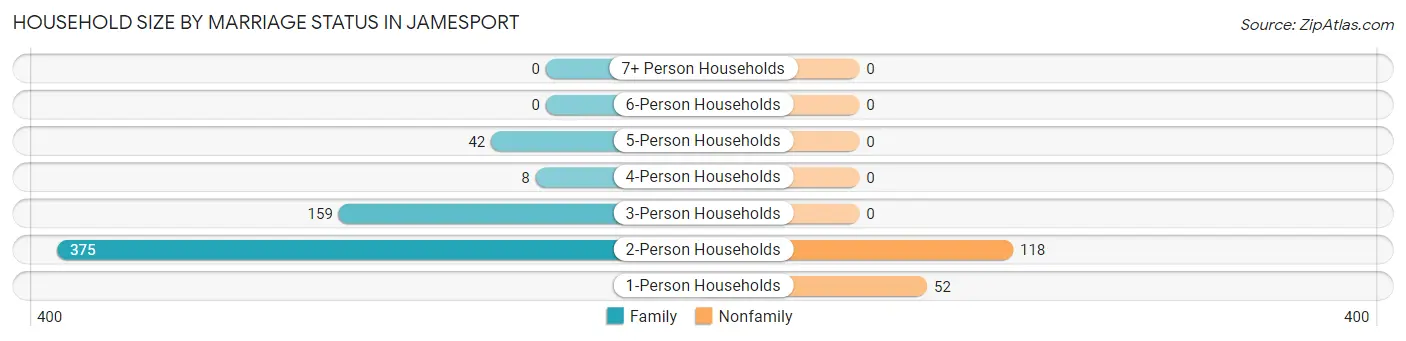
| Household Size | Family Households | Nonfamily Households |
| 1-Person Households | - | 52 (6.9%) |
| 2-Person Households | 375 (49.7%) | 118 (15.7%) |
| 3-Person Households | 159 (21.1%) | 0 (0.0%) |
| 4-Person Households | 8 (1.1%) | 0 (0.0%) |
| 5-Person Households | 42 (5.6%) | 0 (0.0%) |
| 6-Person Households | 0 (0.0%) | 0 (0.0%) |
| 7+ Person Households | 0 (0.0%) | 0 (0.0%) |
| Total | 584 (77.4%) | 170 (22.6%) |
Female Fertility in Jamesport
Fertility by Age in Jamesport
| Age Bracket | Women with Births | Births / 1,000 Women |
| 15 to 19 years | 0 (0.0%) | 0.0 |
| 20 to 34 years | 0 (0.0%) | 0.0 |
| 35 to 50 years | 0 (0.0%) | 0.0 |
| Total | 0 (0.0%) | 0.0 |
Fertility by Age by Marriage Status in Jamesport
| Age Bracket | Married | Unmarried |
| 15 to 19 years | 0 (0.0%) | 0 (0.0%) |
| 20 to 34 years | 0 (0.0%) | 0 (0.0%) |
| 35 to 50 years | 0 (0.0%) | 0 (0.0%) |
| Total | 0 (0.0%) | 0 (0.0%) |
Fertility by Education in Jamesport
| Educational Attainment | Women with Births | Births / 1,000 Women |
| Less than High School | 0 (0.0%) | 0.0 |
| High School Diploma | 0 (0.0%) | 0.0 |
| College or Associate's Degree | 0 (0.0%) | 0.0 |
| Bachelor's Degree | 0 (0.0%) | 0.0 |
| Graduate Degree | 0 (0.0%) | 0.0 |
| Total | 0 (0.0%) | 0.0 |
Fertility by Education by Marriage Status in Jamesport
| Educational Attainment | Married | Unmarried |
| Less than High School | 0 (0.0%) | 0 (0.0%) |
| High School Diploma | 0 (0.0%) | 0 (0.0%) |
| College or Associate's Degree | 0 (0.0%) | 0 (0.0%) |
| Bachelor's Degree | 0 (0.0%) | 0 (0.0%) |
| Graduate Degree | 0 (0.0%) | 0 (0.0%) |
| Total | 0 (0.0%) | 0 (0.0%) |
Employment Characteristics in Jamesport
Employment by Class of Employer in Jamesport
Among the 746 employed individuals in Jamesport, private company employees (620 | 83.1%), self-employed (incorporated) (80 | 10.7%), and not-for-profit organizations (40 | 5.4%) make up the most common classes of employment.
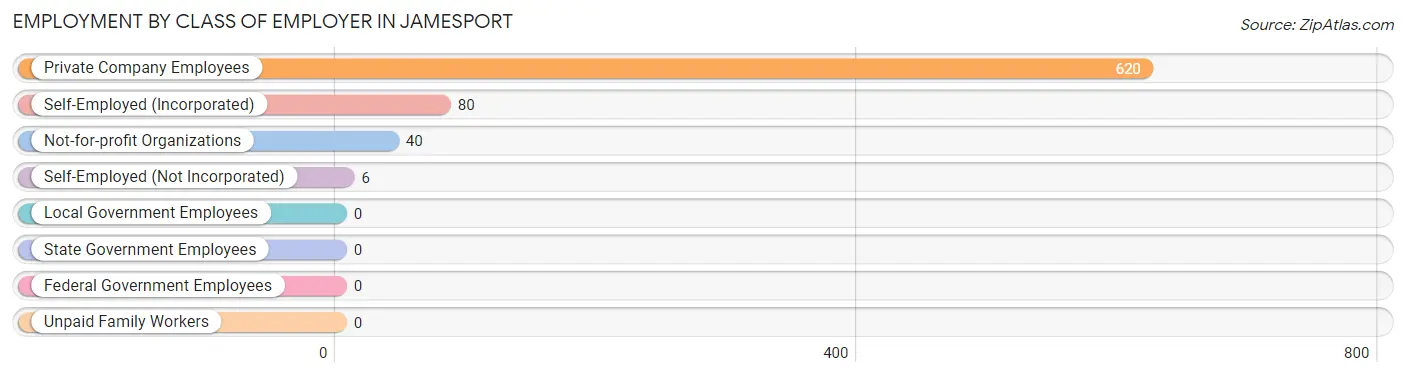
| Employer Class | # Employees | % Employees |
| Private Company Employees | 620 | 83.1% |
| Self-Employed (Incorporated) | 80 | 10.7% |
| Self-Employed (Not Incorporated) | 6 | 0.8% |
| Not-for-profit Organizations | 40 | 5.4% |
| Local Government Employees | 0 | 0.0% |
| State Government Employees | 0 | 0.0% |
| Federal Government Employees | 0 | 0.0% |
| Unpaid Family Workers | 0 | 0.0% |
| Total | 746 | 100.0% |
Employment Status by Age in Jamesport
According to the labor force statistics for Jamesport, out of the total population over 16 years of age (1,564), 50.1% or 784 individuals are in the labor force, with 4.8% or 38 of them unemployed. The age group with the highest labor force participation rate is 16 to 19 years, with 100.0% or 65 individuals in the labor force. Within the labor force, the 45 to 54 years age range has the highest percentage of unemployed individuals, with 15.8% or 38 of them being unemployed.
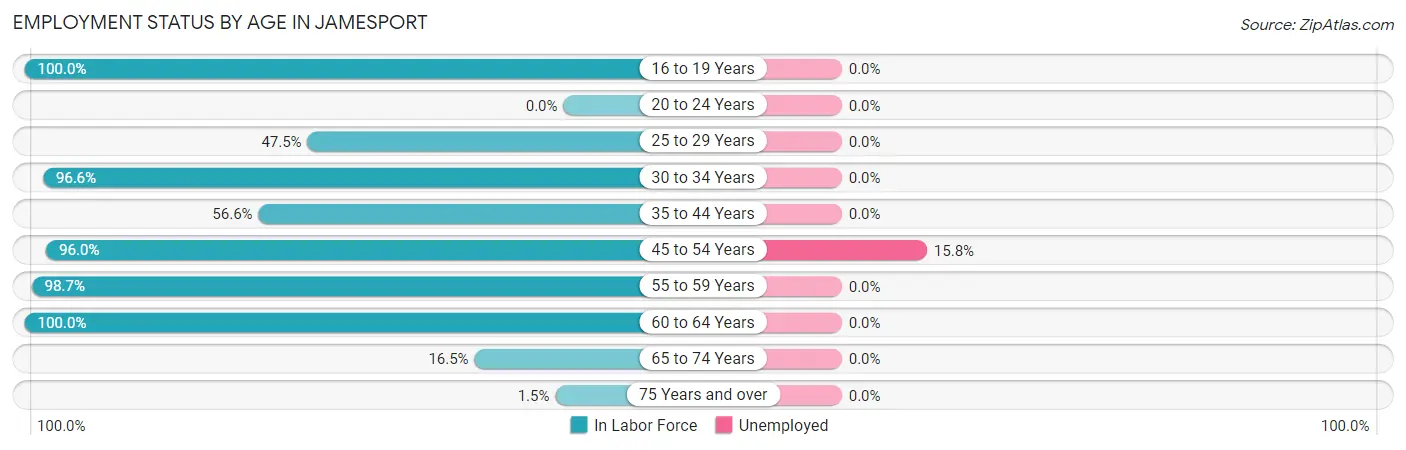
| Age Bracket | In Labor Force | Unemployed |
| 16 to 19 Years | 65 (100.0%) | 0 (0.0%) |
| 20 to 24 Years | 0 (0.0%) | 0 (0.0%) |
| 25 to 29 Years | 87 (47.5%) | 0 (0.0%) |
| 30 to 34 Years | 56 (96.6%) | 0 (0.0%) |
| 35 to 44 Years | 30 (56.6%) | 0 (0.0%) |
| 45 to 54 Years | 241 (96.0%) | 38 (15.8%) |
| 55 to 59 Years | 153 (98.7%) | 0 (0.0%) |
| 60 to 64 Years | 71 (100.0%) | 0 (0.0%) |
| 65 to 74 Years | 77 (16.5%) | 0 (0.0%) |
| 75 Years and over | 4 (1.5%) | 0 (0.0%) |
| Total | 784 (50.1%) | 38 (4.8%) |
Employment Status by Educational Attainment in Jamesport
According to labor force statistics for Jamesport, 82.7% of individuals (638) out of the total population between 25 and 64 years of age (771) are in the labor force, with 6.0% or 38 of them being unemployed. The group with the highest labor force participation rate are those with the educational attainment of bachelor's degree or higher, with 100.0% or 229 individuals in the labor force. Within the labor force, individuals with high school diploma education have the highest percentage of unemployment, with 15.4% or 38 of them being unemployed.
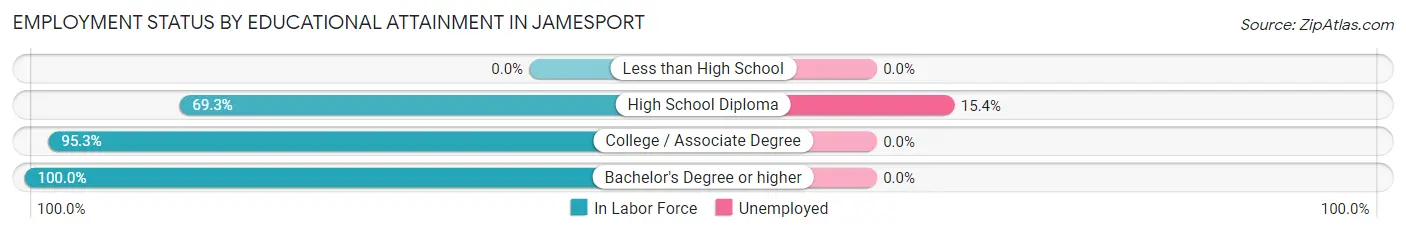
| Educational Attainment | In Labor Force | Unemployed |
| Less than High School | 0 (0.0%) | 0 (0.0%) |
| High School Diploma | 246 (69.3%) | 55 (15.4%) |
| College / Associate Degree | 163 (95.3%) | 0 (0.0%) |
| Bachelor's Degree or higher | 229 (100.0%) | 0 (0.0%) |
| Total | 638 (82.7%) | 46 (6.0%) |
Employment Occupations by Sex in Jamesport
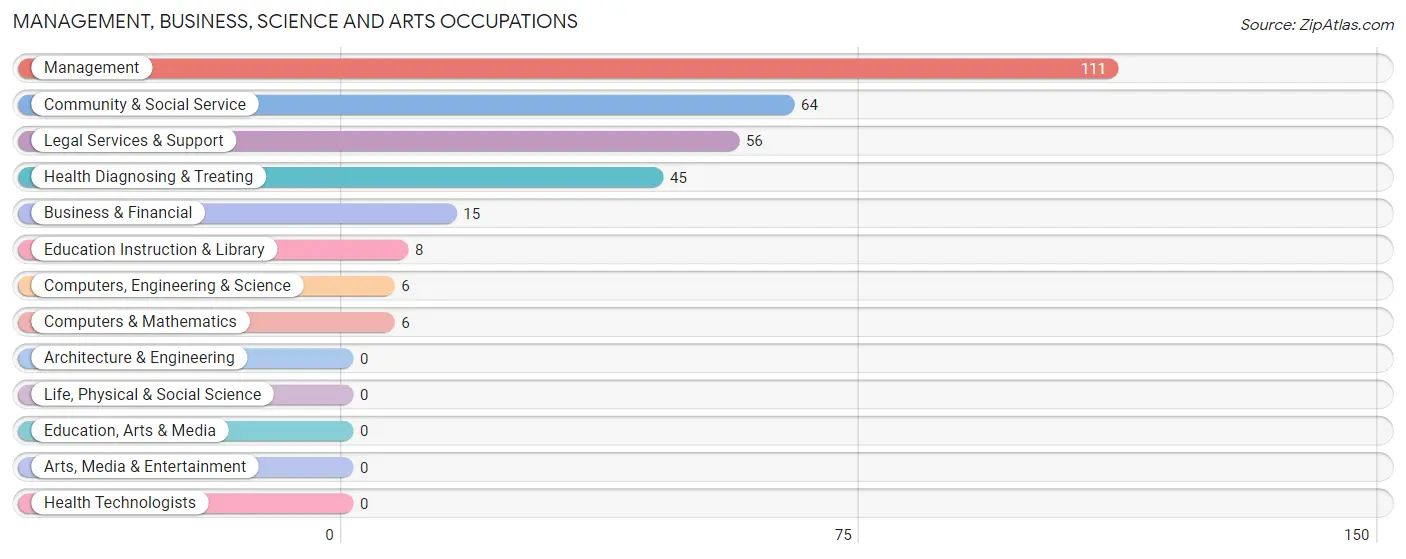
Management, Business, Science and Arts Occupations
The most common Management, Business, Science and Arts occupations in Jamesport are Management (111 | 14.9%), Community & Social Service (64 | 8.6%), Legal Services & Support (56 | 7.5%), Health Diagnosing & Treating (45 | 6.0%), and Business & Financial (15 | 2.0%).
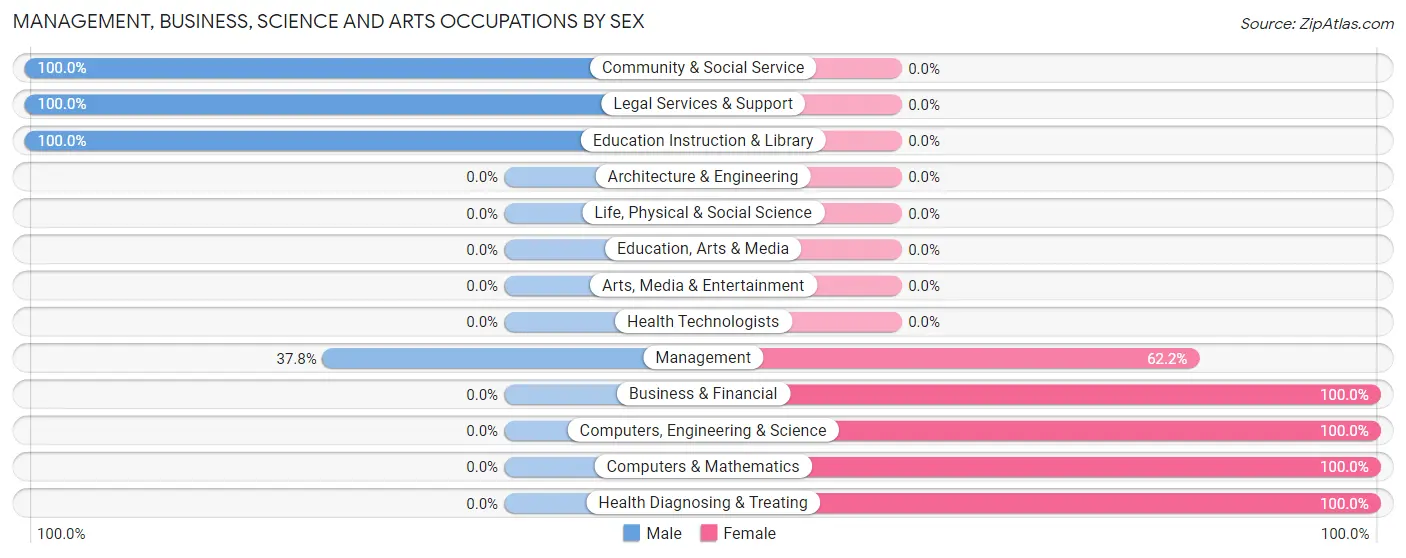
Management, Business, Science and Arts Occupations by Sex
Within the Management, Business, Science and Arts occupations in Jamesport, the most male-oriented occupations are Community & Social Service (100.0%), Legal Services & Support (100.0%), and Education Instruction & Library (100.0%), while the most female-oriented occupations are Business & Financial (100.0%), Computers, Engineering & Science (100.0%), and Computers & Mathematics (100.0%).
| Occupation | Male | Female |
| Management | 42 (37.8%) | 69 (62.2%) |
| Business & Financial | 0 (0.0%) | 15 (100.0%) |
| Computers, Engineering & Science | 0 (0.0%) | 6 (100.0%) |
| Computers & Mathematics | 0 (0.0%) | 6 (100.0%) |
| Architecture & Engineering | 0 (0.0%) | 0 (0.0%) |
| Life, Physical & Social Science | 0 (0.0%) | 0 (0.0%) |
| Community & Social Service | 64 (100.0%) | 0 (0.0%) |
| Education, Arts & Media | 0 (0.0%) | 0 (0.0%) |
| Legal Services & Support | 56 (100.0%) | 0 (0.0%) |
| Education Instruction & Library | 8 (100.0%) | 0 (0.0%) |
| Arts, Media & Entertainment | 0 (0.0%) | 0 (0.0%) |
| Health Diagnosing & Treating | 0 (0.0%) | 45 (100.0%) |
| Health Technologists | 0 (0.0%) | 0 (0.0%) |
| Total (Category) | 106 (44.0%) | 135 (56.0%) |
| Total (Overall) | 350 (46.9%) | 396 (53.1%) |
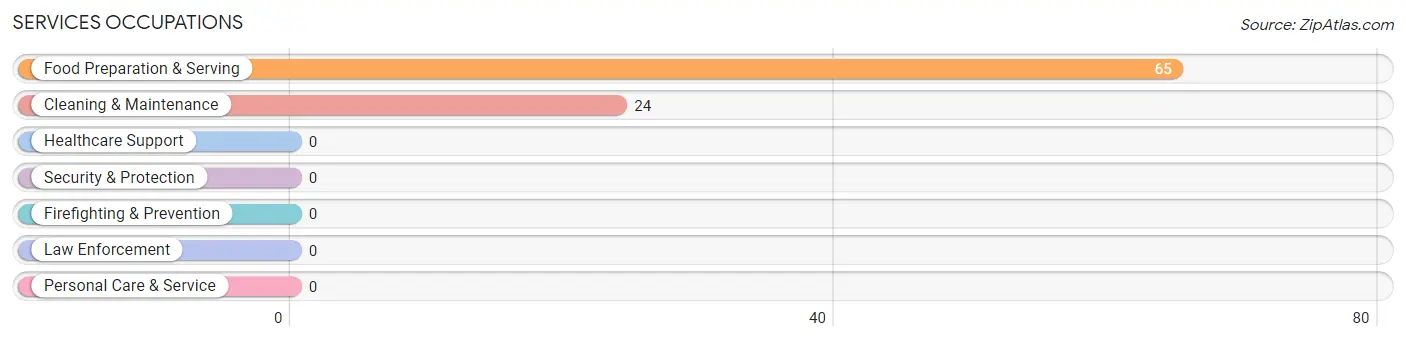
Services Occupations
The most common Services occupations in Jamesport are Food Preparation & Serving (65 | 8.7%), and Cleaning & Maintenance (24 | 3.2%).
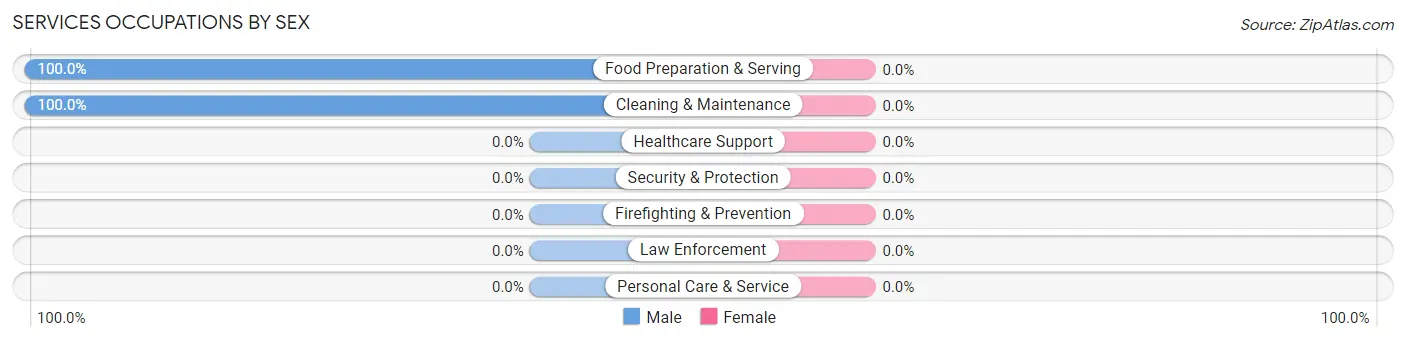
Services Occupations by Sex
| Occupation | Male | Female |
| Healthcare Support | 0 (0.0%) | 0 (0.0%) |
| Security & Protection | 0 (0.0%) | 0 (0.0%) |
| Firefighting & Prevention | 0 (0.0%) | 0 (0.0%) |
| Law Enforcement | 0 (0.0%) | 0 (0.0%) |
| Food Preparation & Serving | 65 (100.0%) | 0 (0.0%) |
| Cleaning & Maintenance | 24 (100.0%) | 0 (0.0%) |
| Personal Care & Service | 0 (0.0%) | 0 (0.0%) |
| Total (Category) | 89 (100.0%) | 0 (0.0%) |
| Total (Overall) | 350 (46.9%) | 396 (53.1%) |
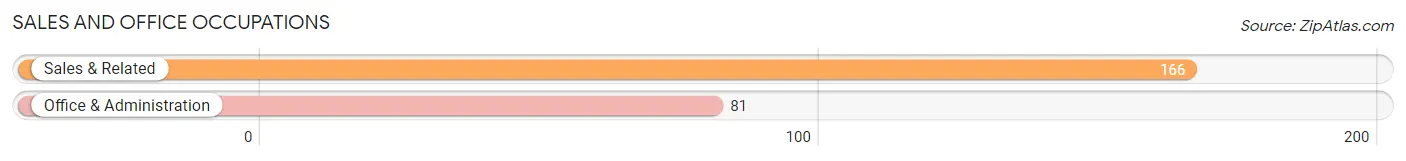
Sales and Office Occupations
The most common Sales and Office occupations in Jamesport are Sales & Related (166 | 22.3%), and Office & Administration (81 | 10.9%).
Sales and Office Occupations by Sex
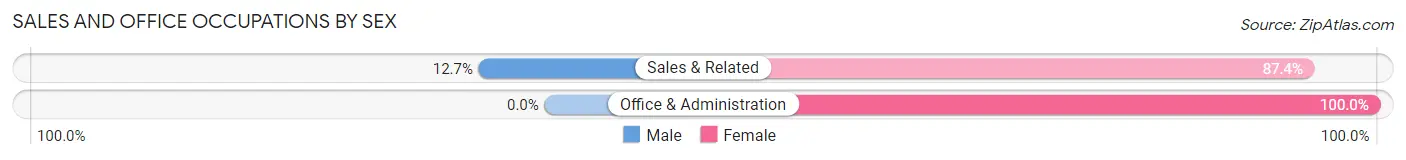
| Occupation | Male | Female |
| Sales & Related | 21 (12.7%) | 145 (87.4%) |
| Office & Administration | 0 (0.0%) | 81 (100.0%) |
| Total (Category) | 21 (8.5%) | 226 (91.5%) |
| Total (Overall) | 350 (46.9%) | 396 (53.1%) |
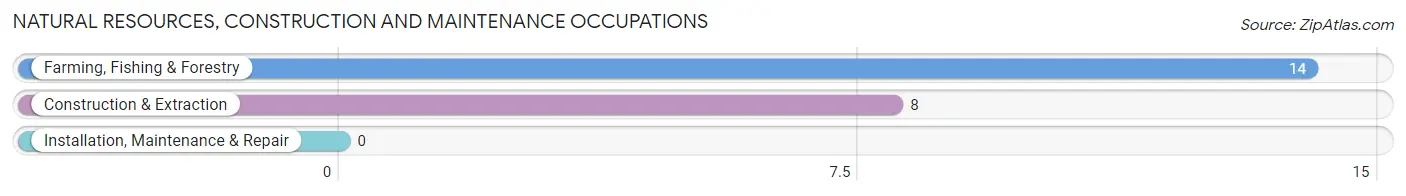
Natural Resources, Construction and Maintenance Occupations
The most common Natural Resources, Construction and Maintenance occupations in Jamesport are Farming, Fishing & Forestry (14 | 1.9%), and Construction & Extraction (8 | 1.1%).
Natural Resources, Construction and Maintenance Occupations by Sex
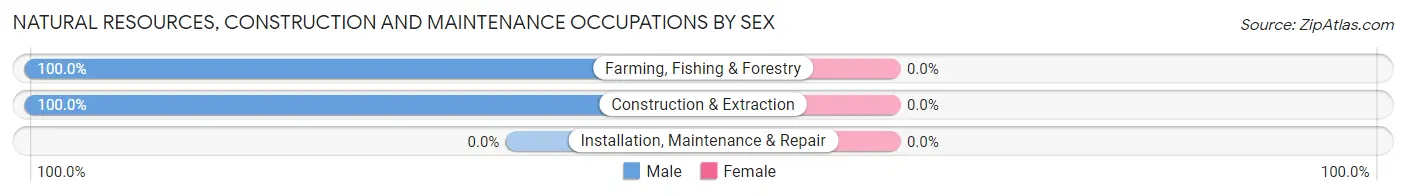
| Occupation | Male | Female |
| Farming, Fishing & Forestry | 14 (100.0%) | 0 (0.0%) |
| Construction & Extraction | 8 (100.0%) | 0 (0.0%) |
| Installation, Maintenance & Repair | 0 (0.0%) | 0 (0.0%) |
| Total (Category) | 22 (100.0%) | 0 (0.0%) |
| Total (Overall) | 350 (46.9%) | 396 (53.1%) |
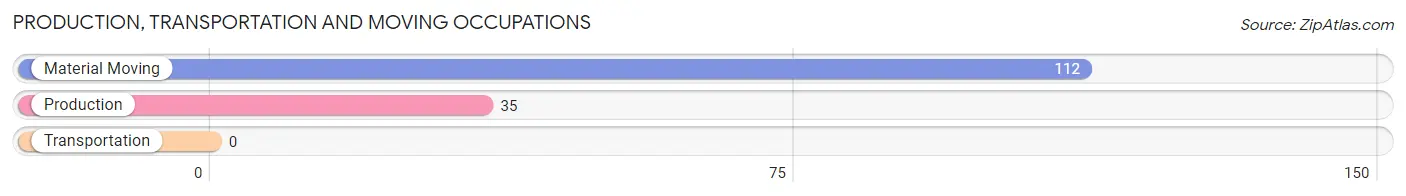
Production, Transportation and Moving Occupations
The most common Production, Transportation and Moving occupations in Jamesport are Material Moving (112 | 15.0%), and Production (35 | 4.7%).
Production, Transportation and Moving Occupations by Sex
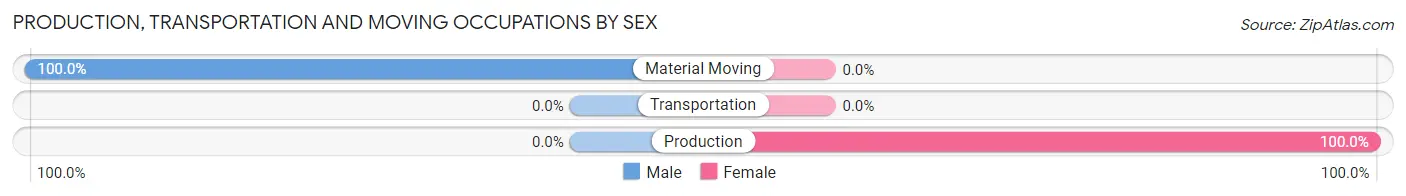
| Occupation | Male | Female |
| Production | 0 (0.0%) | 35 (100.0%) |
| Transportation | 0 (0.0%) | 0 (0.0%) |
| Material Moving | 112 (100.0%) | 0 (0.0%) |
| Total (Category) | 112 (76.2%) | 35 (23.8%) |
| Total (Overall) | 350 (46.9%) | 396 (53.1%) |
Employment Industries by Sex in Jamesport
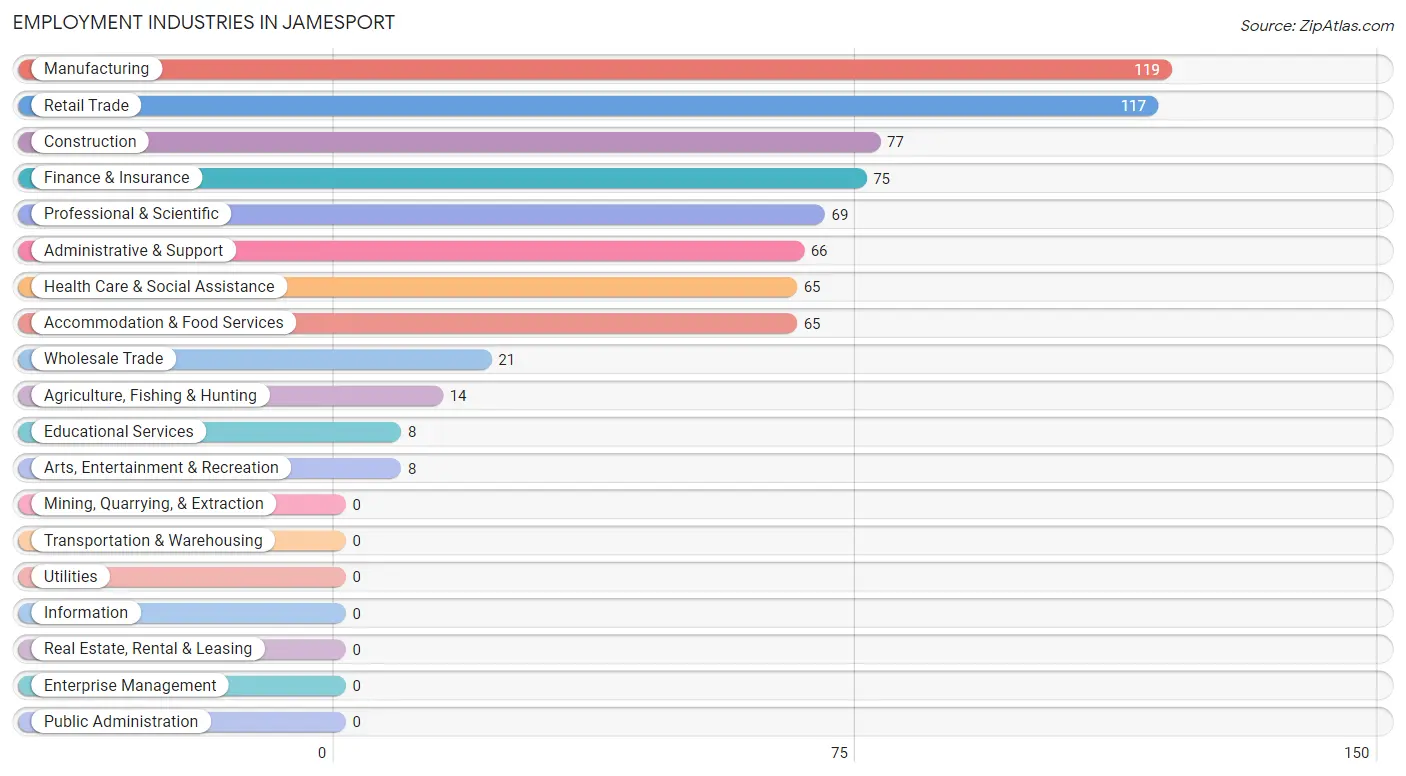
Employment Industries in Jamesport
The major employment industries in Jamesport include Manufacturing (119 | 16.0%), Retail Trade (117 | 15.7%), Construction (77 | 10.3%), Finance & Insurance (75 | 10.1%), and Professional & Scientific (69 | 9.2%).
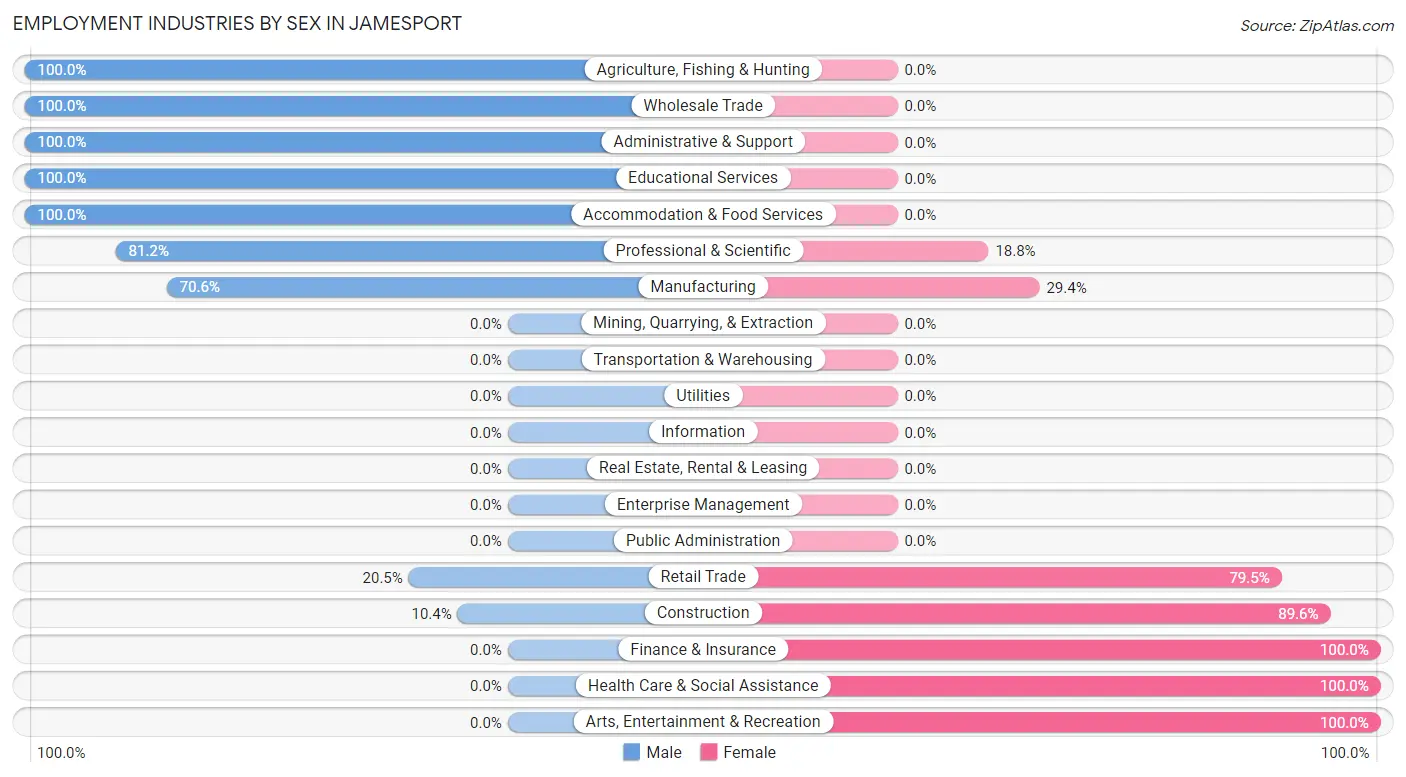
Employment Industries by Sex in Jamesport
The Jamesport industries that see more men than women are Agriculture, Fishing & Hunting (100.0%), Wholesale Trade (100.0%), and Administrative & Support (100.0%), whereas the industries that tend to have a higher number of women are Finance & Insurance (100.0%), Health Care & Social Assistance (100.0%), and Arts, Entertainment & Recreation (100.0%).
| Industry | Male | Female |
| Agriculture, Fishing & Hunting | 14 (100.0%) | 0 (0.0%) |
| Mining, Quarrying, & Extraction | 0 (0.0%) | 0 (0.0%) |
| Construction | 8 (10.4%) | 69 (89.6%) |
| Manufacturing | 84 (70.6%) | 35 (29.4%) |
| Wholesale Trade | 21 (100.0%) | 0 (0.0%) |
| Retail Trade | 24 (20.5%) | 93 (79.5%) |
| Transportation & Warehousing | 0 (0.0%) | 0 (0.0%) |
| Utilities | 0 (0.0%) | 0 (0.0%) |
| Information | 0 (0.0%) | 0 (0.0%) |
| Finance & Insurance | 0 (0.0%) | 75 (100.0%) |
| Real Estate, Rental & Leasing | 0 (0.0%) | 0 (0.0%) |
| Professional & Scientific | 56 (81.2%) | 13 (18.8%) |
| Enterprise Management | 0 (0.0%) | 0 (0.0%) |
| Administrative & Support | 66 (100.0%) | 0 (0.0%) |
| Educational Services | 8 (100.0%) | 0 (0.0%) |
| Health Care & Social Assistance | 0 (0.0%) | 65 (100.0%) |
| Arts, Entertainment & Recreation | 0 (0.0%) | 8 (100.0%) |
| Accommodation & Food Services | 65 (100.0%) | 0 (0.0%) |
| Public Administration | 0 (0.0%) | 0 (0.0%) |
| Total | 350 (46.9%) | 396 (53.1%) |
Education in Jamesport
School Enrollment in Jamesport
The most common levels of schooling among the 127 students in Jamesport are high school (65 | 51.2%), middle school (40 | 31.5%), and nursery / preschool (22 | 17.3%).
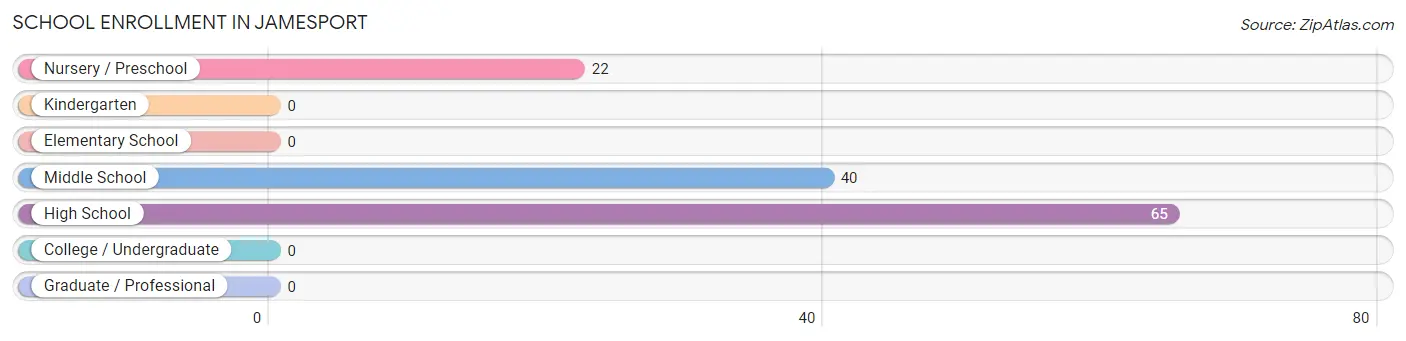
| School Level | # Students | % Students |
| Nursery / Preschool | 22 | 17.3% |
| Kindergarten | 0 | 0.0% |
| Elementary School | 0 | 0.0% |
| Middle School | 40 | 31.5% |
| High School | 65 | 51.2% |
| College / Undergraduate | 0 | 0.0% |
| Graduate / Professional | 0 | 0.0% |
| Total | 127 | 100.0% |
School Enrollment by Age by Funding Source in Jamesport
Out of a total of 127 students who are enrolled in schools in Jamesport, 8 (6.3%) attend a private institution, while the remaining 119 (93.7%) are enrolled in public schools. The age group of 3 to 4 year olds has the highest likelihood of being enrolled in private schools, with 8 (36.4% in the age bracket) enrolled. Conversely, the age group of 10 to 14 year olds has the lowest likelihood of being enrolled in a private school, with 40 (100.0% in the age bracket) attending a public institution.
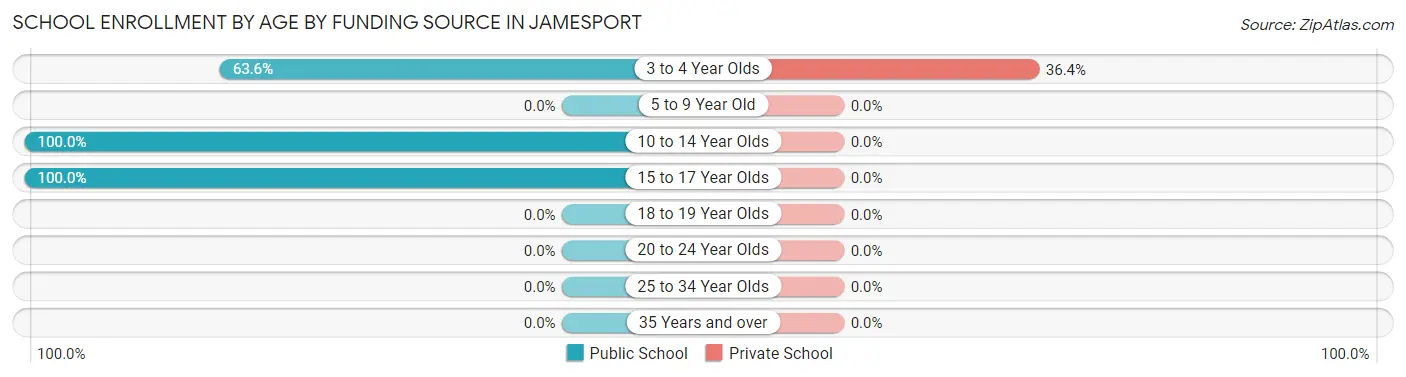
| Age Bracket | Public School | Private School |
| 3 to 4 Year Olds | 14 (63.6%) | 8 (36.4%) |
| 5 to 9 Year Old | 0 (0.0%) | 0 (0.0%) |
| 10 to 14 Year Olds | 40 (100.0%) | 0 (0.0%) |
| 15 to 17 Year Olds | 65 (100.0%) | 0 (0.0%) |
| 18 to 19 Year Olds | 0 (0.0%) | 0 (0.0%) |
| 20 to 24 Year Olds | 0 (0.0%) | 0 (0.0%) |
| 25 to 34 Year Olds | 0 (0.0%) | 0 (0.0%) |
| 35 Years and over | 0 (0.0%) | 0 (0.0%) |
| Total | 119 (93.7%) | 8 (6.3%) |
Educational Attainment by Field of Study in Jamesport
Business (223 | 42.9%), science & technology (81 | 15.6%), education (52 | 10.0%), engineering (49 | 9.4%), and visual & performing arts (38 | 7.3%) are the most common fields of study among 520 individuals in Jamesport who have obtained a bachelor's degree or higher.
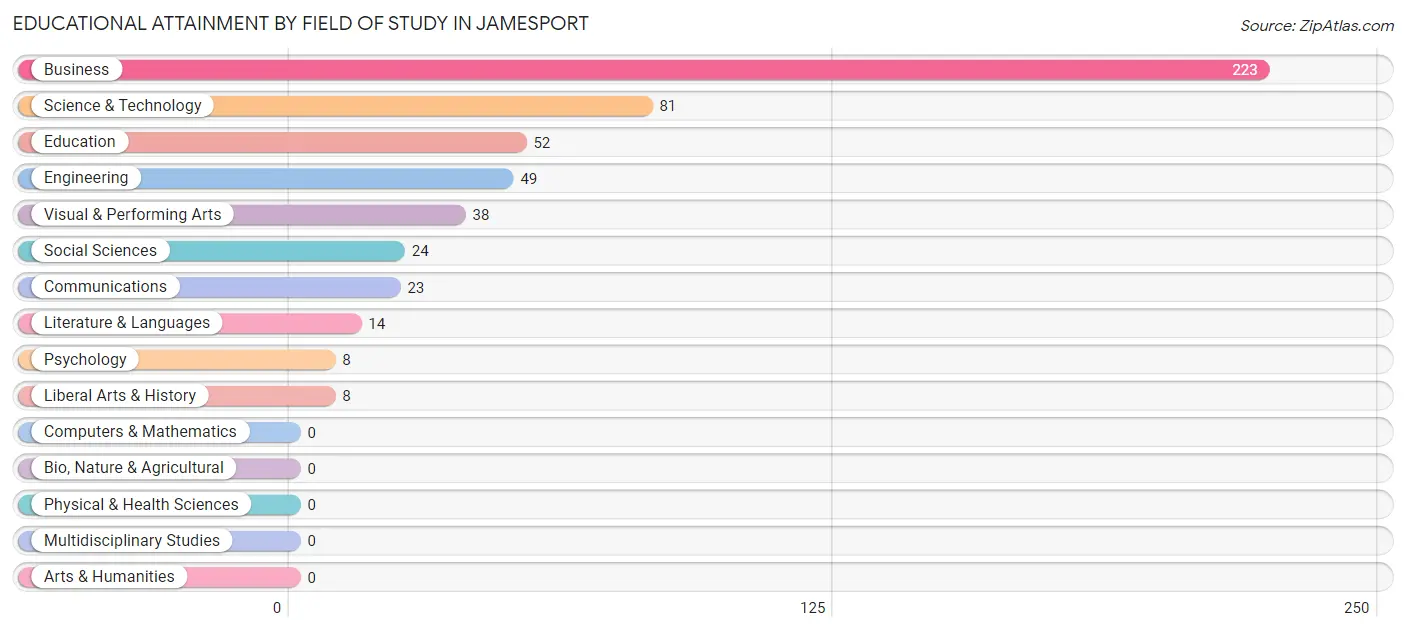
| Field of Study | # Graduates | % Graduates |
| Computers & Mathematics | 0 | 0.0% |
| Bio, Nature & Agricultural | 0 | 0.0% |
| Physical & Health Sciences | 0 | 0.0% |
| Psychology | 8 | 1.5% |
| Social Sciences | 24 | 4.6% |
| Engineering | 49 | 9.4% |
| Multidisciplinary Studies | 0 | 0.0% |
| Science & Technology | 81 | 15.6% |
| Business | 223 | 42.9% |
| Education | 52 | 10.0% |
| Literature & Languages | 14 | 2.7% |
| Liberal Arts & History | 8 | 1.5% |
| Visual & Performing Arts | 38 | 7.3% |
| Communications | 23 | 4.4% |
| Arts & Humanities | 0 | 0.0% |
| Total | 520 | 100.0% |
Transportation & Commute in Jamesport
Vehicle Availability by Sex in Jamesport
The most prevalent vehicle ownership categories in Jamesport are males with 3 vehicles (150, accounting for 43.3%) and females with 3 vehicles (165, making up 37.9%).
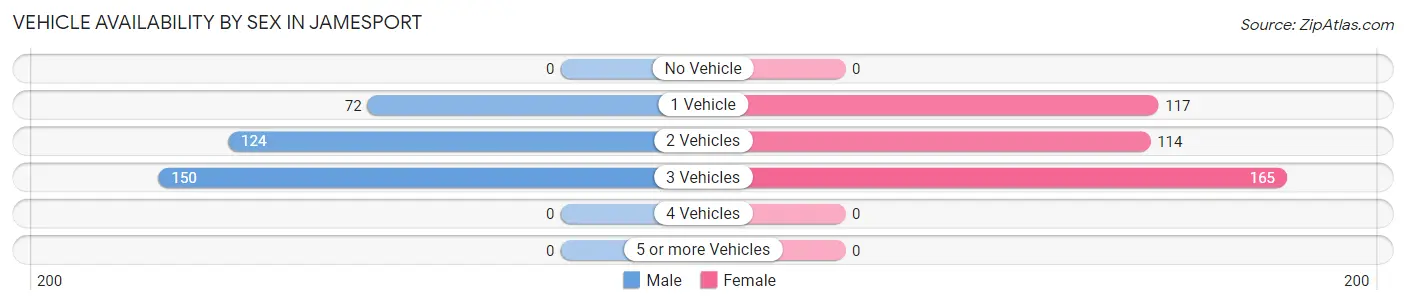
| Vehicles Available | Male | Female |
| No Vehicle | 0 (0.0%) | 0 (0.0%) |
| 1 Vehicle | 72 (20.8%) | 117 (29.5%) |
| 2 Vehicles | 124 (35.8%) | 114 (28.8%) |
| 3 Vehicles | 150 (43.3%) | 165 (41.7%) |
| 4 Vehicles | 0 (0.0%) | 0 (0.0%) |
| 5 or more Vehicles | 0 (0.0%) | 0 (0.0%) |
| Total | 346 (100.0%) | 396 (100.0%) |
Commute Time in Jamesport
The most frequently occuring commute durations in Jamesport are 15 to 19 minutes (138 commuters, 23.2%), 10 to 14 minutes (104 commuters, 17.4%), and 20 to 24 minutes (92 commuters, 15.4%).
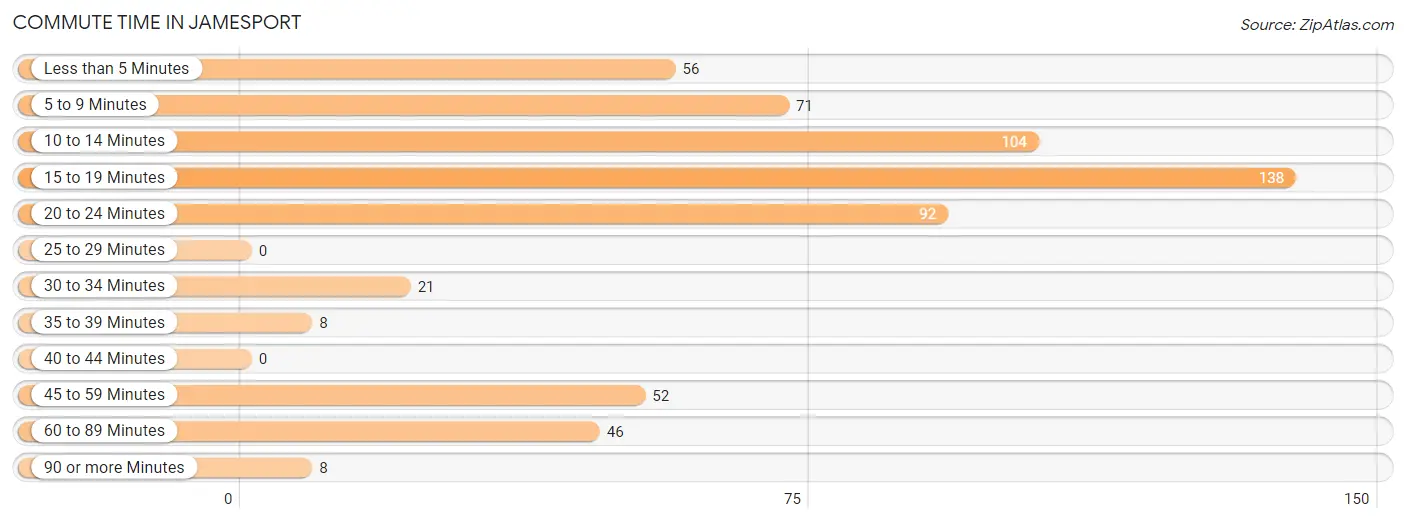
| Commute Time | # Commuters | % Commuters |
| Less than 5 Minutes | 56 | 9.4% |
| 5 to 9 Minutes | 71 | 11.9% |
| 10 to 14 Minutes | 104 | 17.4% |
| 15 to 19 Minutes | 138 | 23.2% |
| 20 to 24 Minutes | 92 | 15.4% |
| 25 to 29 Minutes | 0 | 0.0% |
| 30 to 34 Minutes | 21 | 3.5% |
| 35 to 39 Minutes | 8 | 1.3% |
| 40 to 44 Minutes | 0 | 0.0% |
| 45 to 59 Minutes | 52 | 8.7% |
| 60 to 89 Minutes | 46 | 7.7% |
| 90 or more Minutes | 8 | 1.3% |
Commute Time by Sex in Jamesport
The most common commute times in Jamesport are 10 to 14 minutes (84 commuters, 28.6%) for males and 15 to 19 minutes (138 commuters, 45.7%) for females.
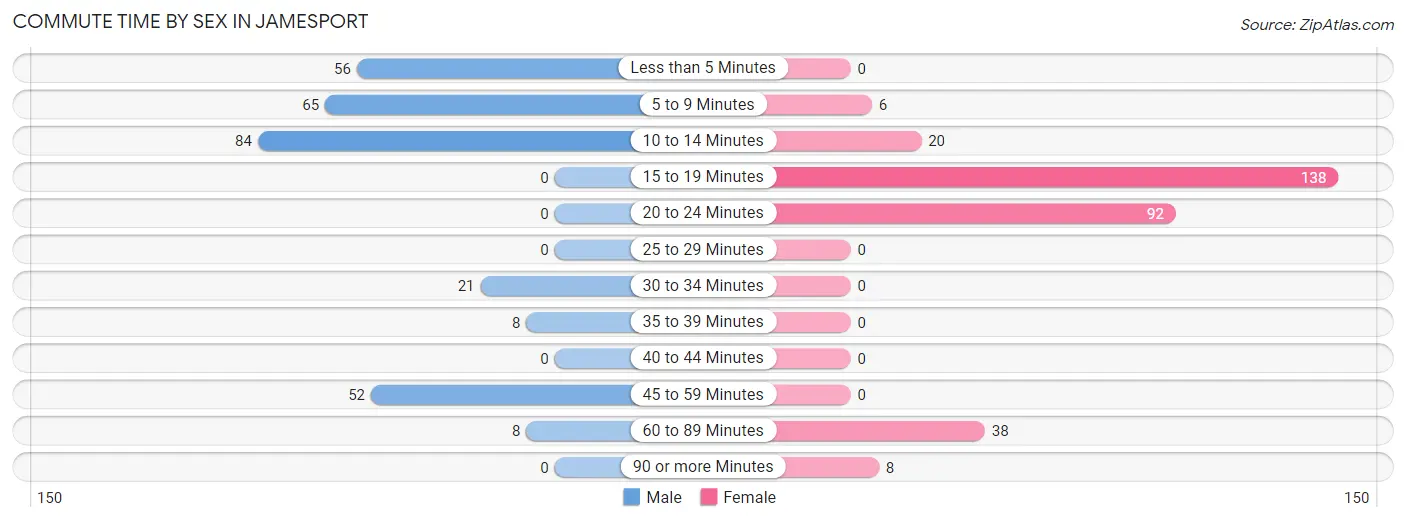
| Commute Time | Male | Female |
| Less than 5 Minutes | 56 (19.1%) | 0 (0.0%) |
| 5 to 9 Minutes | 65 (22.1%) | 6 (2.0%) |
| 10 to 14 Minutes | 84 (28.6%) | 20 (6.6%) |
| 15 to 19 Minutes | 0 (0.0%) | 138 (45.7%) |
| 20 to 24 Minutes | 0 (0.0%) | 92 (30.5%) |
| 25 to 29 Minutes | 0 (0.0%) | 0 (0.0%) |
| 30 to 34 Minutes | 21 (7.1%) | 0 (0.0%) |
| 35 to 39 Minutes | 8 (2.7%) | 0 (0.0%) |
| 40 to 44 Minutes | 0 (0.0%) | 0 (0.0%) |
| 45 to 59 Minutes | 52 (17.7%) | 0 (0.0%) |
| 60 to 89 Minutes | 8 (2.7%) | 38 (12.6%) |
| 90 or more Minutes | 0 (0.0%) | 8 (2.6%) |
Time of Departure to Work by Sex in Jamesport
The most frequent times of departure to work in Jamesport are 5:00 AM to 5:29 AM (90, 30.6%) for males and 8:00 AM to 8:29 AM (162, 53.6%) for females.
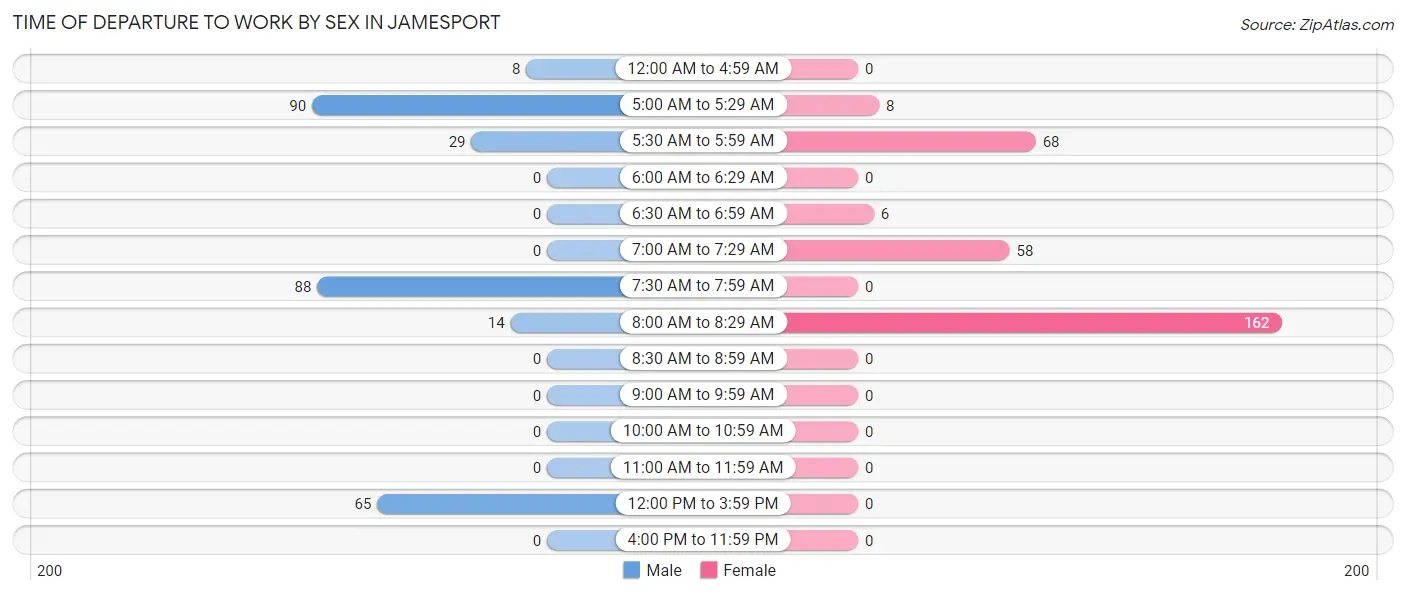
| Time of Departure | Male | Female |
| 12:00 AM to 4:59 AM | 8 (2.7%) | 0 (0.0%) |
| 5:00 AM to 5:29 AM | 90 (30.6%) | 8 (2.6%) |
| 5:30 AM to 5:59 AM | 29 (9.9%) | 68 (22.5%) |
| 6:00 AM to 6:29 AM | 0 (0.0%) | 0 (0.0%) |
| 6:30 AM to 6:59 AM | 0 (0.0%) | 6 (2.0%) |
| 7:00 AM to 7:29 AM | 0 (0.0%) | 58 (19.2%) |
| 7:30 AM to 7:59 AM | 88 (29.9%) | 0 (0.0%) |
| 8:00 AM to 8:29 AM | 14 (4.8%) | 162 (53.6%) |
| 8:30 AM to 8:59 AM | 0 (0.0%) | 0 (0.0%) |
| 9:00 AM to 9:59 AM | 0 (0.0%) | 0 (0.0%) |
| 10:00 AM to 10:59 AM | 0 (0.0%) | 0 (0.0%) |
| 11:00 AM to 11:59 AM | 0 (0.0%) | 0 (0.0%) |
| 12:00 PM to 3:59 PM | 65 (22.1%) | 0 (0.0%) |
| 4:00 PM to 11:59 PM | 0 (0.0%) | 0 (0.0%) |
| Total | 294 (100.0%) | 302 (100.0%) |
Housing Occupancy in Jamesport
Occupancy by Ownership in Jamesport
Of the total 754 dwellings in Jamesport, owner-occupied units account for 754 (100.0%), while renter-occupied units make up 0 (0.0%).

| Occupancy | # Housing Units | % Housing Units |
| Owner Occupied Housing Units | 754 | 100.0% |
| Renter-Occupied Housing Units | 0 | 0.0% |
| Total Occupied Housing Units | 754 | 100.0% |
Occupancy by Household Size in Jamesport
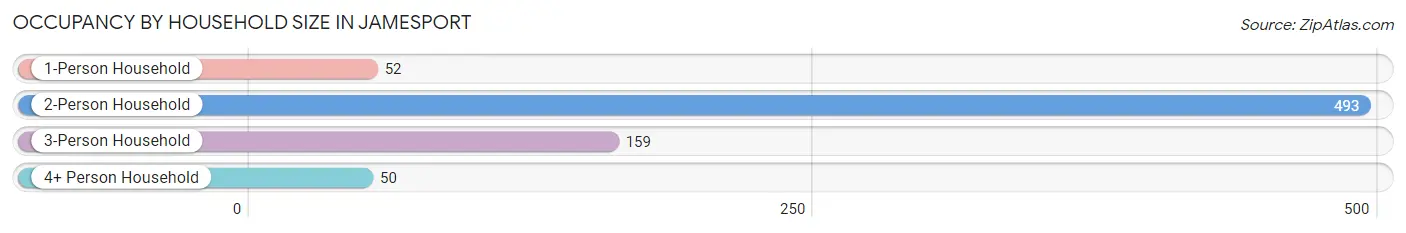
| Household Size | # Housing Units | % Housing Units |
| 1-Person Household | 52 | 6.9% |
| 2-Person Household | 493 | 65.4% |
| 3-Person Household | 159 | 21.1% |
| 4+ Person Household | 50 | 6.6% |
| Total Housing Units | 754 | 100.0% |
Occupancy by Ownership by Household Size in Jamesport
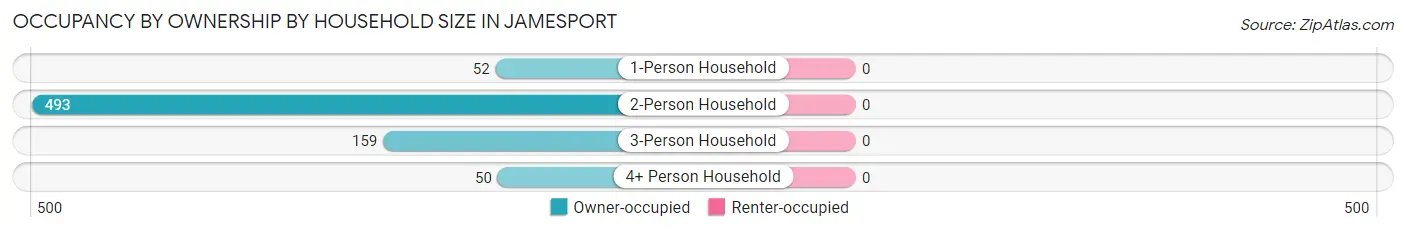
| Household Size | Owner-occupied | Renter-occupied |
| 1-Person Household | 52 (100.0%) | 0 (0.0%) |
| 2-Person Household | 493 (100.0%) | 0 (0.0%) |
| 3-Person Household | 159 (100.0%) | 0 (0.0%) |
| 4+ Person Household | 50 (100.0%) | 0 (0.0%) |
| Total Housing Units | 754 (100.0%) | 0 (0.0%) |
Occupancy by Educational Attainment in Jamesport
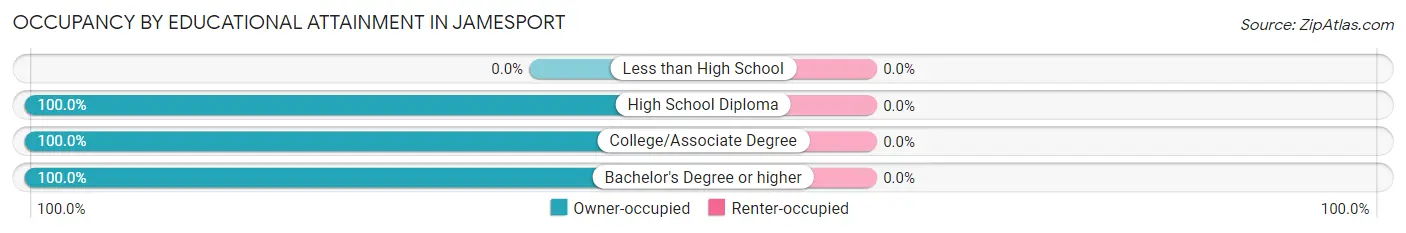
| Household Size | Owner-occupied | Renter-occupied |
| Less than High School | 0 (0.0%) | 0 (0.0%) |
| High School Diploma | 71 (100.0%) | 0 (0.0%) |
| College/Associate Degree | 339 (100.0%) | 0 (0.0%) |
| Bachelor's Degree or higher | 344 (100.0%) | 0 (0.0%) |
Occupancy by Age of Householder in Jamesport
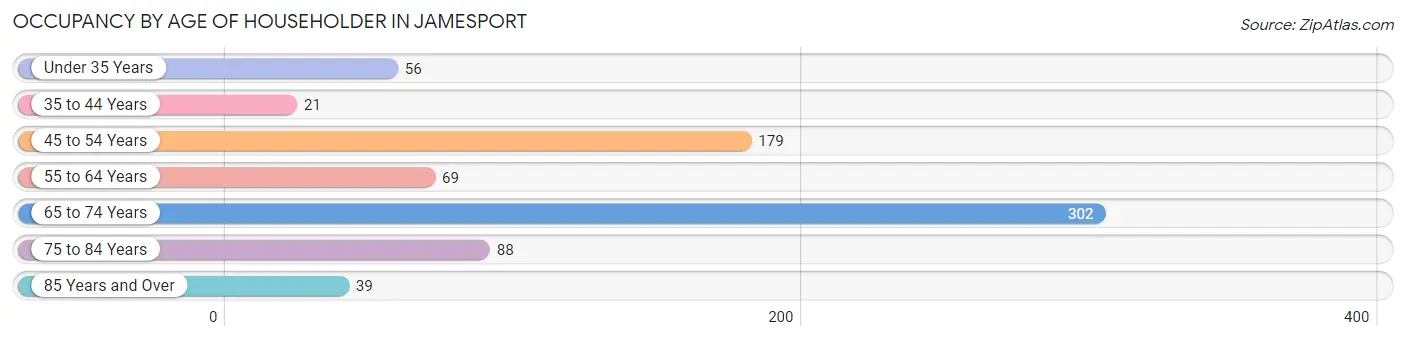
| Age Bracket | # Households | % Households |
| Under 35 Years | 56 | 7.4% |
| 35 to 44 Years | 21 | 2.8% |
| 45 to 54 Years | 179 | 23.7% |
| 55 to 64 Years | 69 | 9.1% |
| 65 to 74 Years | 302 | 40.1% |
| 75 to 84 Years | 88 | 11.7% |
| 85 Years and Over | 39 | 5.2% |
| Total | 754 | 100.0% |
Housing Finances in Jamesport
Median Income by Occupancy in Jamesport
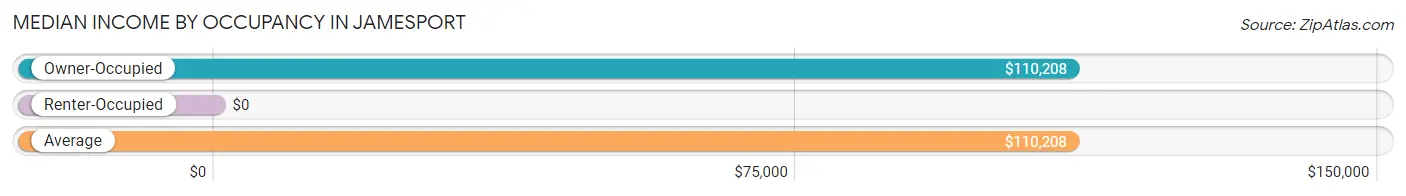
| Occupancy Type | # Households | Median Income |
| Owner-Occupied | 754 (100.0%) | $110,208 |
| Renter-Occupied | 0 (0.0%) | $0 |
| Average | 754 (100.0%) | $110,208 |
Occupancy by Householder Income Bracket in Jamesport
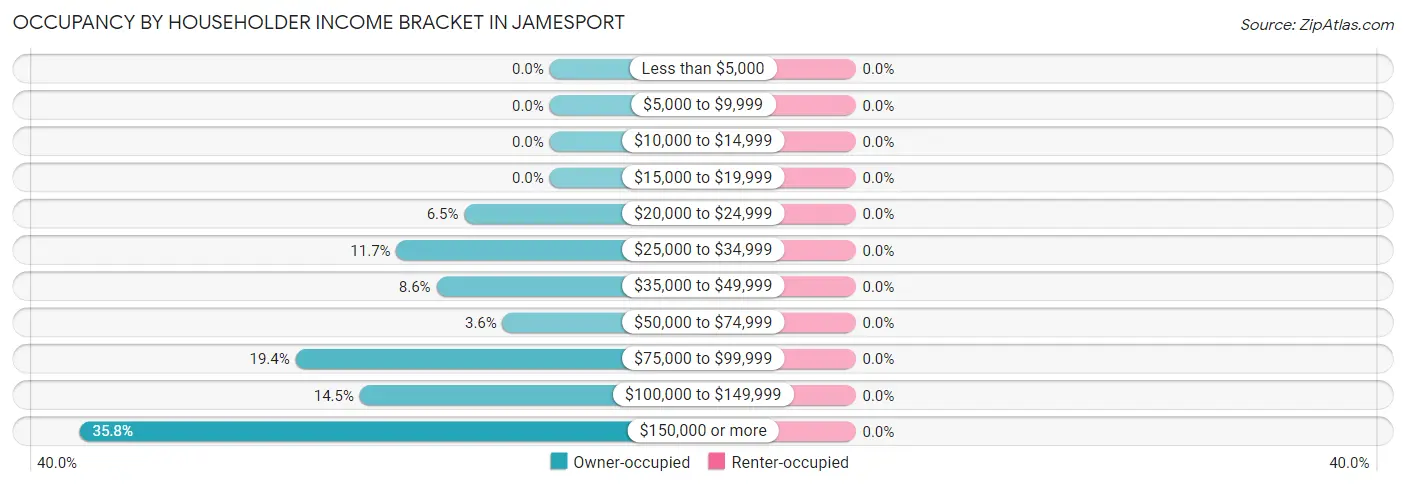
| Income Bracket | Owner-occupied | Renter-occupied |
| Less than $5,000 | 0 (0.0%) | 0 (0.0%) |
| $5,000 to $9,999 | 0 (0.0%) | 0 (0.0%) |
| $10,000 to $14,999 | 0 (0.0%) | 0 (0.0%) |
| $15,000 to $19,999 | 0 (0.0%) | 0 (0.0%) |
| $20,000 to $24,999 | 49 (6.5%) | 0 (0.0%) |
| $25,000 to $34,999 | 88 (11.7%) | 0 (0.0%) |
| $35,000 to $49,999 | 65 (8.6%) | 0 (0.0%) |
| $50,000 to $74,999 | 27 (3.6%) | 0 (0.0%) |
| $75,000 to $99,999 | 146 (19.4%) | 0 (0.0%) |
| $100,000 to $149,999 | 109 (14.5%) | 0 (0.0%) |
| $150,000 or more | 270 (35.8%) | 0 (0.0%) |
| Total | 754 (100.0%) | 0 (0.0%) |
Monthly Housing Cost Tiers in Jamesport
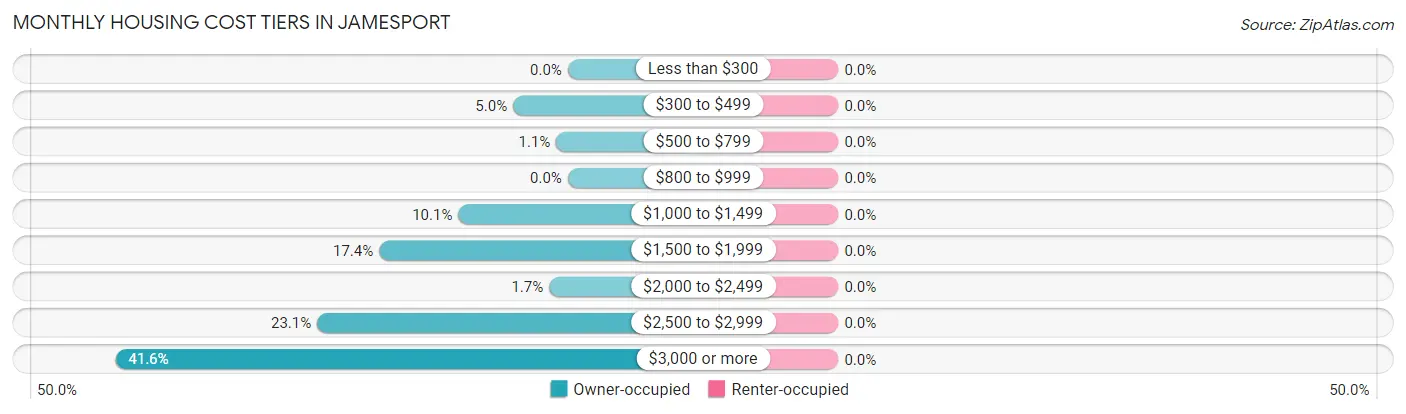
| Monthly Cost | Owner-occupied | Renter-occupied |
| Less than $300 | 0 (0.0%) | 0 (0.0%) |
| $300 to $499 | 38 (5.0%) | 0 (0.0%) |
| $500 to $799 | 8 (1.1%) | 0 (0.0%) |
| $800 to $999 | 0 (0.0%) | 0 (0.0%) |
| $1,000 to $1,499 | 76 (10.1%) | 0 (0.0%) |
| $1,500 to $1,999 | 131 (17.4%) | 0 (0.0%) |
| $2,000 to $2,499 | 13 (1.7%) | 0 (0.0%) |
| $2,500 to $2,999 | 174 (23.1%) | 0 (0.0%) |
| $3,000 or more | 314 (41.6%) | 0 (0.0%) |
| Total | 754 (100.0%) | 0 (0.0%) |
Physical Housing Characteristics in Jamesport
Housing Structures in Jamesport
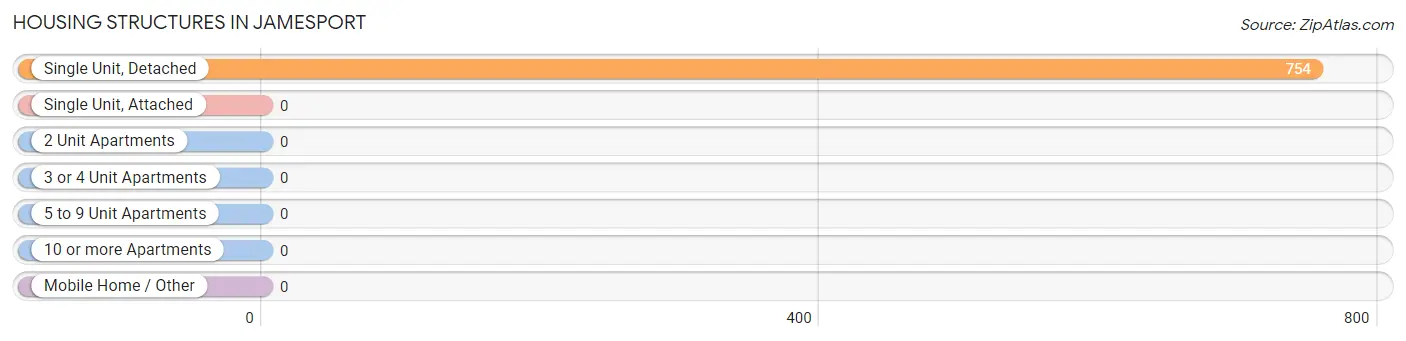
| Structure Type | # Housing Units | % Housing Units |
| Single Unit, Detached | 754 | 100.0% |
| Single Unit, Attached | 0 | 0.0% |
| 2 Unit Apartments | 0 | 0.0% |
| 3 or 4 Unit Apartments | 0 | 0.0% |
| 5 to 9 Unit Apartments | 0 | 0.0% |
| 10 or more Apartments | 0 | 0.0% |
| Mobile Home / Other | 0 | 0.0% |
| Total | 754 | 100.0% |
Housing Structures by Occupancy in Jamesport
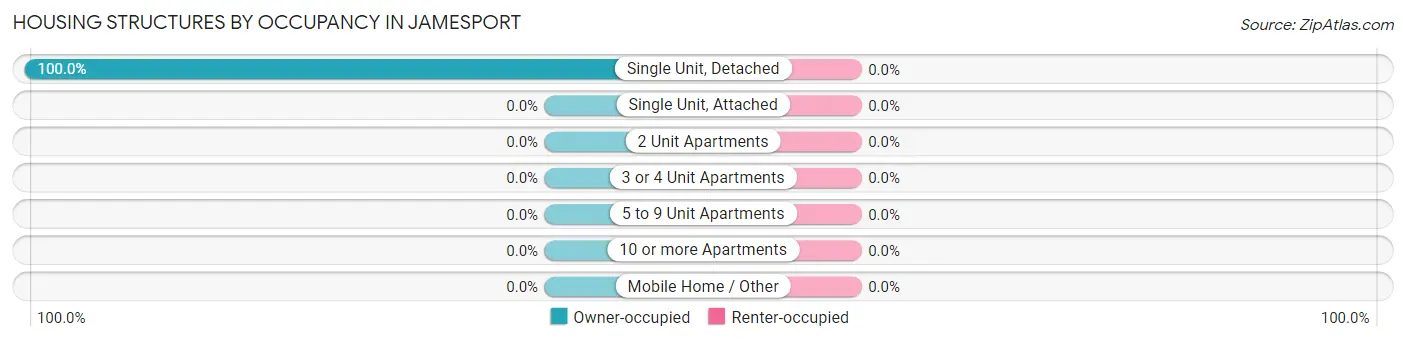
| Structure Type | Owner-occupied | Renter-occupied |
| Single Unit, Detached | 754 (100.0%) | 0 (0.0%) |
| Single Unit, Attached | 0 (0.0%) | 0 (0.0%) |
| 2 Unit Apartments | 0 (0.0%) | 0 (0.0%) |
| 3 or 4 Unit Apartments | 0 (0.0%) | 0 (0.0%) |
| 5 to 9 Unit Apartments | 0 (0.0%) | 0 (0.0%) |
| 10 or more Apartments | 0 (0.0%) | 0 (0.0%) |
| Mobile Home / Other | 0 (0.0%) | 0 (0.0%) |
| Total | 754 (100.0%) | 0 (0.0%) |
Housing Structures by Number of Rooms in Jamesport
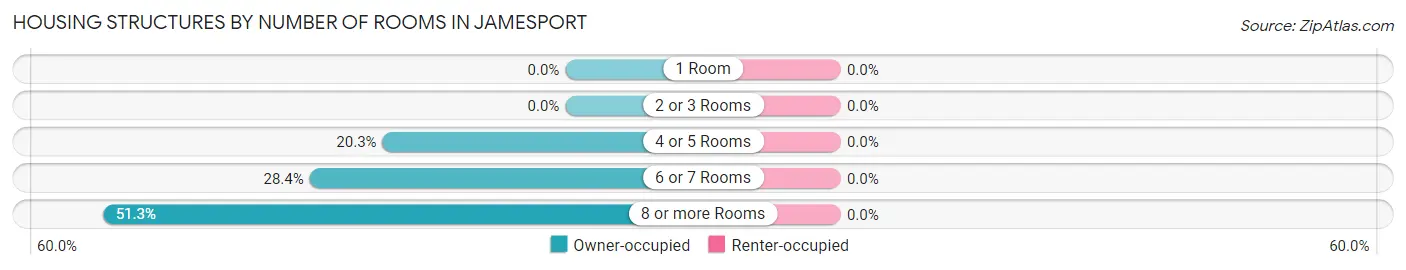
| Number of Rooms | Owner-occupied | Renter-occupied |
| 1 Room | 0 (0.0%) | 0 (0.0%) |
| 2 or 3 Rooms | 0 (0.0%) | 0 (0.0%) |
| 4 or 5 Rooms | 153 (20.3%) | 0 (0.0%) |
| 6 or 7 Rooms | 214 (28.4%) | 0 (0.0%) |
| 8 or more Rooms | 387 (51.3%) | 0 (0.0%) |
| Total | 754 (100.0%) | 0 (0.0%) |
Housing Structure by Heating Type in Jamesport
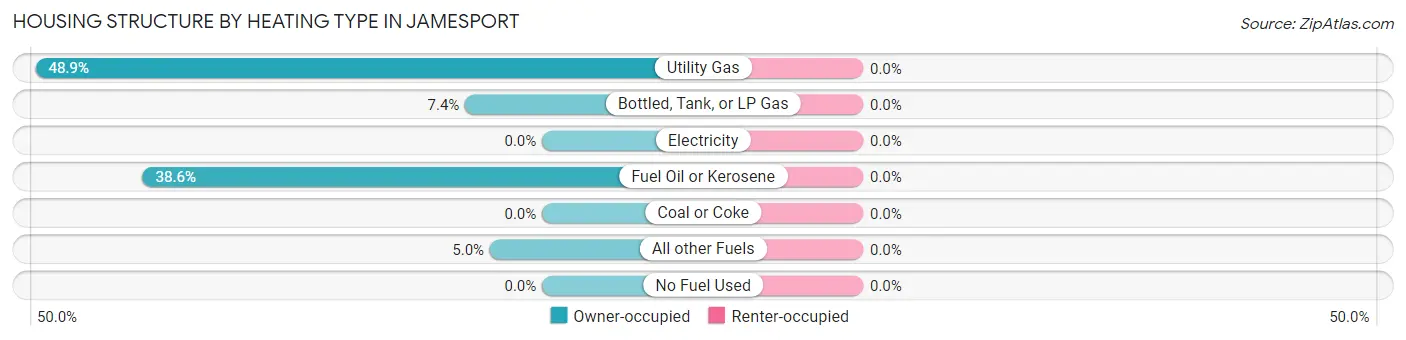
| Heating Type | Owner-occupied | Renter-occupied |
| Utility Gas | 369 (48.9%) | 0 (0.0%) |
| Bottled, Tank, or LP Gas | 56 (7.4%) | 0 (0.0%) |
| Electricity | 0 (0.0%) | 0 (0.0%) |
| Fuel Oil or Kerosene | 291 (38.6%) | 0 (0.0%) |
| Coal or Coke | 0 (0.0%) | 0 (0.0%) |
| All other Fuels | 38 (5.0%) | 0 (0.0%) |
| No Fuel Used | 0 (0.0%) | 0 (0.0%) |
| Total | 754 (100.0%) | 0 (0.0%) |
Household Vehicle Usage in Jamesport
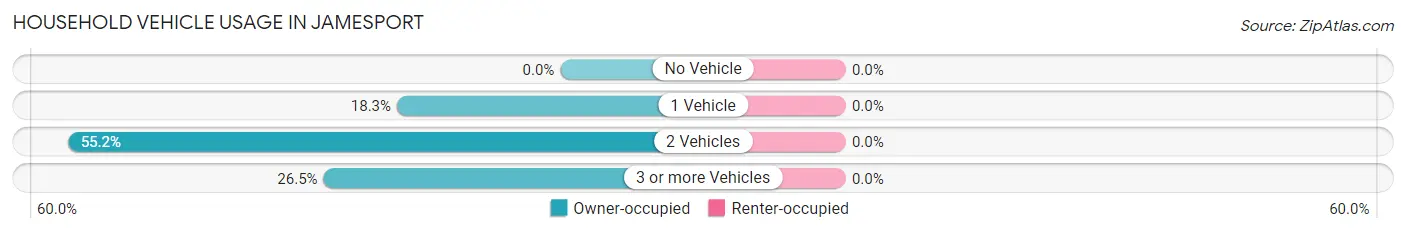
| Vehicles per Household | Owner-occupied | Renter-occupied |
| No Vehicle | 0 (0.0%) | 0 (0.0%) |
| 1 Vehicle | 138 (18.3%) | 0 (0.0%) |
| 2 Vehicles | 416 (55.2%) | 0 (0.0%) |
| 3 or more Vehicles | 200 (26.5%) | 0 (0.0%) |
| Total | 754 (100.0%) | 0 (0.0%) |
Real Estate & Mortgages in Jamesport
Real Estate and Mortgage Overview in Jamesport
| Characteristic | Without Mortgage | With Mortgage |
| Housing Units | 309 | 445 |
| Median Property Value | $837,200 | $523,300 |
| Median Household Income | $131,678 | $128 |
| Monthly Housing Costs | $1,501 | $258 |
| Real Estate Taxes | $10,001 | $0 |
Property Value by Mortgage Status in Jamesport
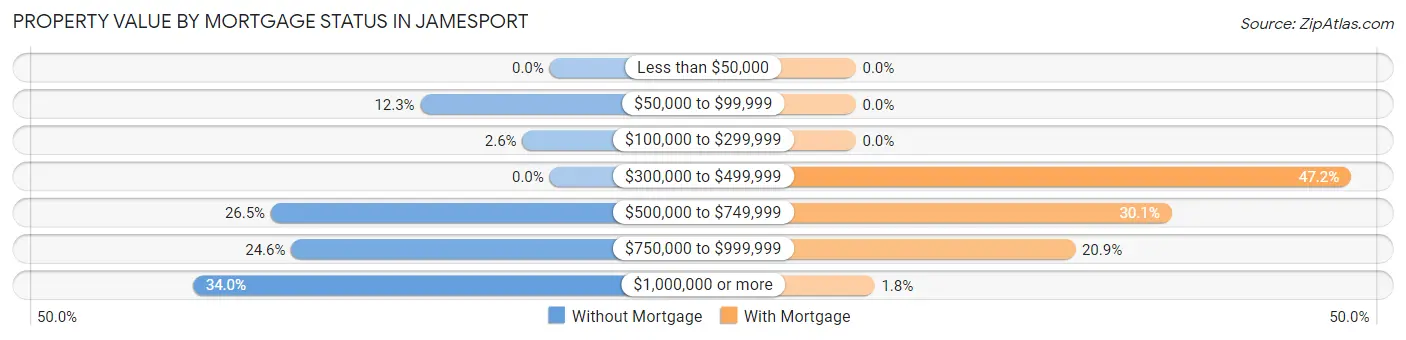
| Property Value | Without Mortgage | With Mortgage |
| Less than $50,000 | 0 (0.0%) | 0 (0.0%) |
| $50,000 to $99,999 | 38 (12.3%) | 0 (0.0%) |
| $100,000 to $299,999 | 8 (2.6%) | 0 (0.0%) |
| $300,000 to $499,999 | 0 (0.0%) | 210 (47.2%) |
| $500,000 to $749,999 | 82 (26.5%) | 134 (30.1%) |
| $750,000 to $999,999 | 76 (24.6%) | 93 (20.9%) |
| $1,000,000 or more | 105 (34.0%) | 8 (1.8%) |
| Total | 309 (100.0%) | 445 (100.0%) |
Household Income by Mortgage Status in Jamesport
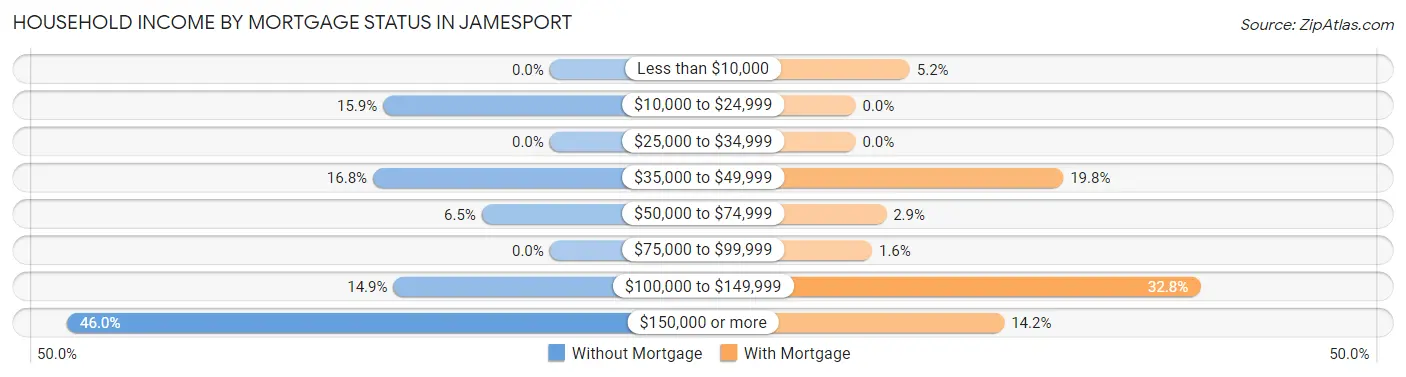
| Household Income | Without Mortgage | With Mortgage |
| Less than $10,000 | 0 (0.0%) | 23 (5.2%) |
| $10,000 to $24,999 | 49 (15.9%) | 0 (0.0%) |
| $25,000 to $34,999 | 0 (0.0%) | 0 (0.0%) |
| $35,000 to $49,999 | 52 (16.8%) | 88 (19.8%) |
| $50,000 to $74,999 | 20 (6.5%) | 13 (2.9%) |
| $75,000 to $99,999 | 0 (0.0%) | 7 (1.6%) |
| $100,000 to $149,999 | 46 (14.9%) | 146 (32.8%) |
| $150,000 or more | 142 (46.0%) | 63 (14.2%) |
| Total | 309 (100.0%) | 445 (100.0%) |
Property Value to Household Income Ratio in Jamesport
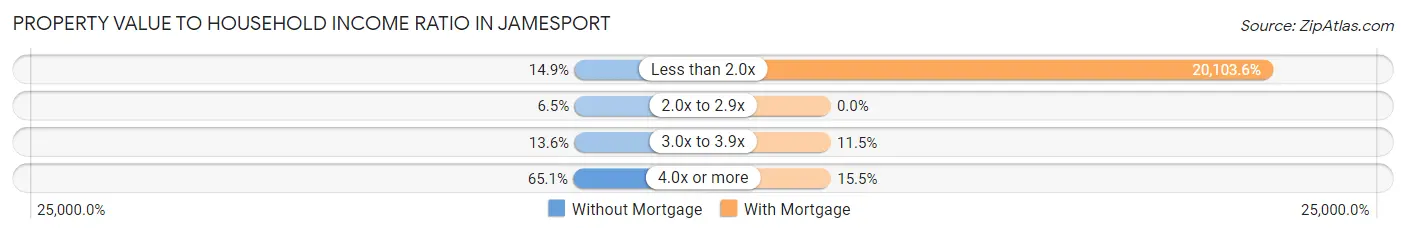
| Value-to-Income Ratio | Without Mortgage | With Mortgage |
| Less than 2.0x | 46 (14.9%) | 89,461 (20,103.6%) |
| 2.0x to 2.9x | 20 (6.5%) | 0 (0.0%) |
| 3.0x to 3.9x | 42 (13.6%) | 51 (11.5%) |
| 4.0x or more | 201 (65.0%) | 69 (15.5%) |
| Total | 309 (100.0%) | 445 (100.0%) |
Real Estate Taxes by Mortgage Status in Jamesport
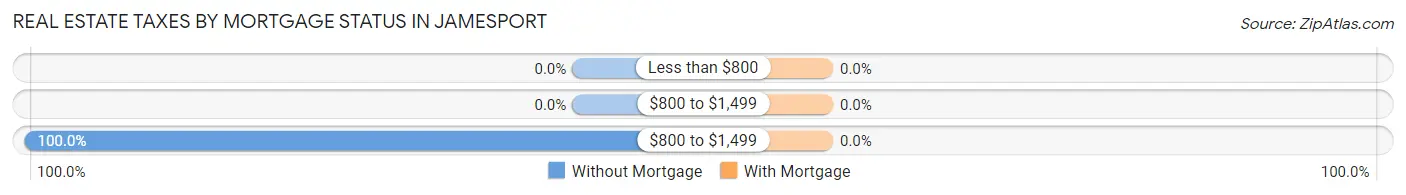
| Property Taxes | Without Mortgage | With Mortgage |
| Less than $800 | 0 (0.0%) | 0 (0.0%) |
| $800 to $1,499 | 0 (0.0%) | 0 (0.0%) |
| $800 to $1,499 | 309 (100.0%) | 0 (0.0%) |
| Total | 309 (100.0%) | 445 (100.0%) |
Health & Disability in Jamesport
Health Insurance Coverage by Age in Jamesport
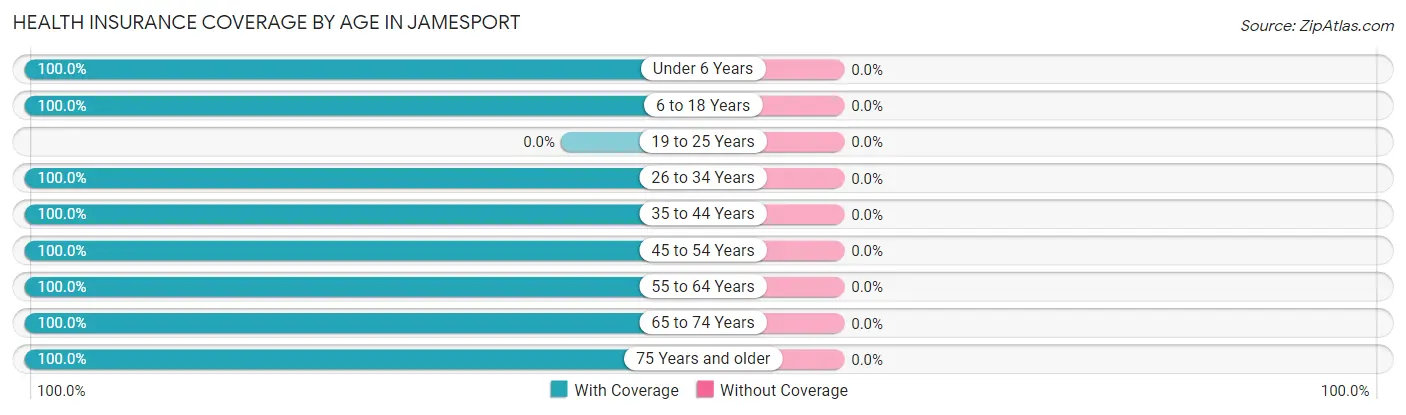
| Age Bracket | With Coverage | Without Coverage |
| Under 6 Years | 22 (100.0%) | 0 (0.0%) |
| 6 to 18 Years | 113 (100.0%) | 0 (0.0%) |
| 19 to 25 Years | 0 (0.0%) | 0 (0.0%) |
| 26 to 34 Years | 241 (100.0%) | 0 (0.0%) |
| 35 to 44 Years | 53 (100.0%) | 0 (0.0%) |
| 45 to 54 Years | 251 (100.0%) | 0 (0.0%) |
| 55 to 64 Years | 226 (100.0%) | 0 (0.0%) |
| 65 to 74 Years | 468 (100.0%) | 0 (0.0%) |
| 75 Years and older | 260 (100.0%) | 0 (0.0%) |
| Total | 1,634 (100.0%) | 0 (0.0%) |
Health Insurance Coverage by Citizenship Status in Jamesport
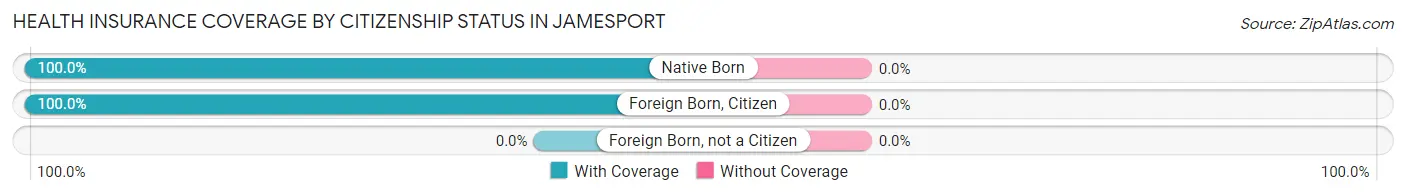
| Citizenship Status | With Coverage | Without Coverage |
| Native Born | 22 (100.0%) | 0 (0.0%) |
| Foreign Born, Citizen | 113 (100.0%) | 0 (0.0%) |
| Foreign Born, not a Citizen | 0 (0.0%) | 0 (0.0%) |
Health Insurance Coverage by Household Income in Jamesport
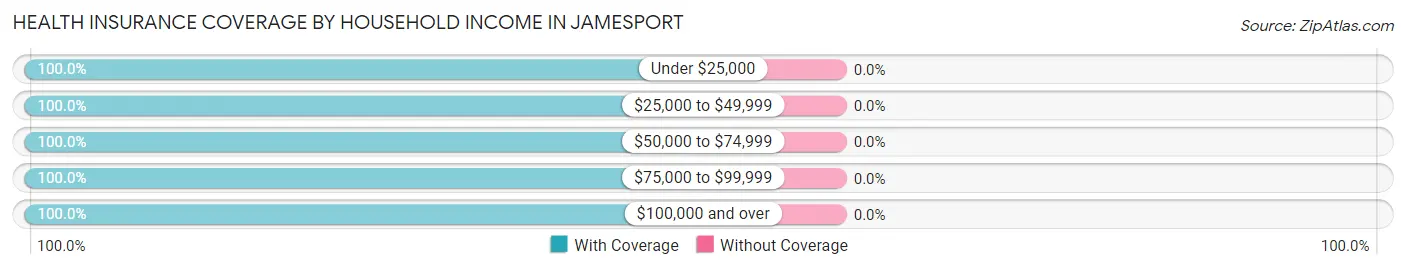
| Household Income | With Coverage | Without Coverage |
| Under $25,000 | 98 (100.0%) | 0 (0.0%) |
| $25,000 to $49,999 | 290 (100.0%) | 0 (0.0%) |
| $50,000 to $74,999 | 55 (100.0%) | 0 (0.0%) |
| $75,000 to $99,999 | 256 (100.0%) | 0 (0.0%) |
| $100,000 and over | 915 (100.0%) | 0 (0.0%) |
Public vs Private Health Insurance Coverage by Age in Jamesport
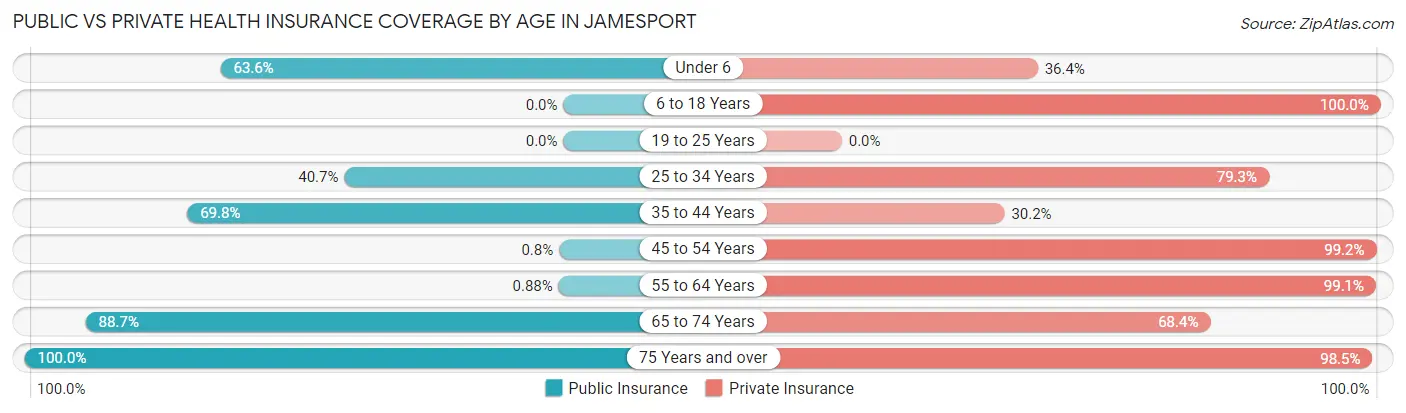
| Age Bracket | Public Insurance | Private Insurance |
| Under 6 | 14 (63.6%) | 8 (36.4%) |
| 6 to 18 Years | 0 (0.0%) | 113 (100.0%) |
| 19 to 25 Years | 0 (0.0%) | 0 (0.0%) |
| 25 to 34 Years | 98 (40.7%) | 191 (79.2%) |
| 35 to 44 Years | 37 (69.8%) | 16 (30.2%) |
| 45 to 54 Years | 2 (0.8%) | 249 (99.2%) |
| 55 to 64 Years | 2 (0.9%) | 224 (99.1%) |
| 65 to 74 Years | 415 (88.7%) | 320 (68.4%) |
| 75 Years and over | 260 (100.0%) | 256 (98.5%) |
| Total | 828 (50.7%) | 1,377 (84.3%) |
Disability Status by Sex by Age in Jamesport
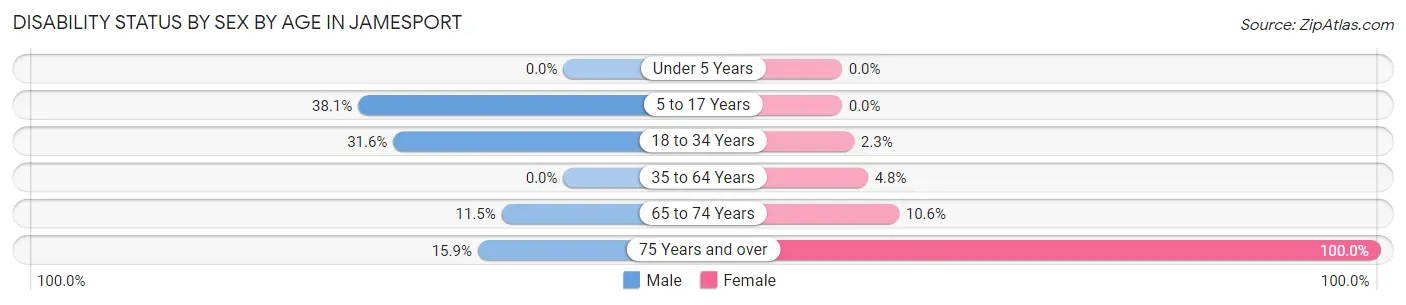
| Age Bracket | Male | Female |
| Under 5 Years | 0 (0.0%) | 0 (0.0%) |
| 5 to 17 Years | 40 (38.1%) | 0 (0.0%) |
| 18 to 34 Years | 48 (31.6%) | 2 (2.2%) |
| 35 to 64 Years | 0 (0.0%) | 14 (4.8%) |
| 65 to 74 Years | 32 (11.5%) | 20 (10.6%) |
| 75 Years and over | 24 (15.9%) | 109 (100.0%) |
Disability Class by Sex by Age in Jamesport
Disability Class: Hearing Difficulty
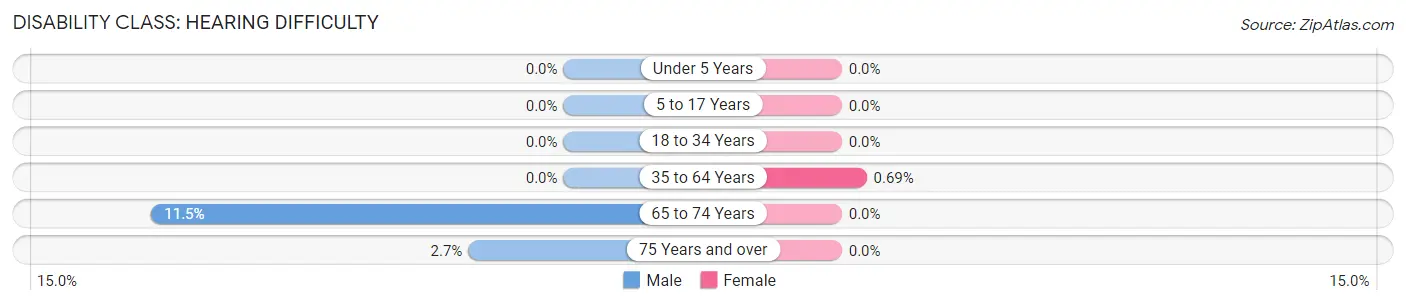
| Age Bracket | Male | Female |
| Under 5 Years | 0 (0.0%) | 0 (0.0%) |
| 5 to 17 Years | 0 (0.0%) | 0 (0.0%) |
| 18 to 34 Years | 0 (0.0%) | 0 (0.0%) |
| 35 to 64 Years | 0 (0.0%) | 2 (0.7%) |
| 65 to 74 Years | 32 (11.5%) | 0 (0.0%) |
| 75 Years and over | 4 (2.6%) | 0 (0.0%) |
Disability Class: Vision Difficulty
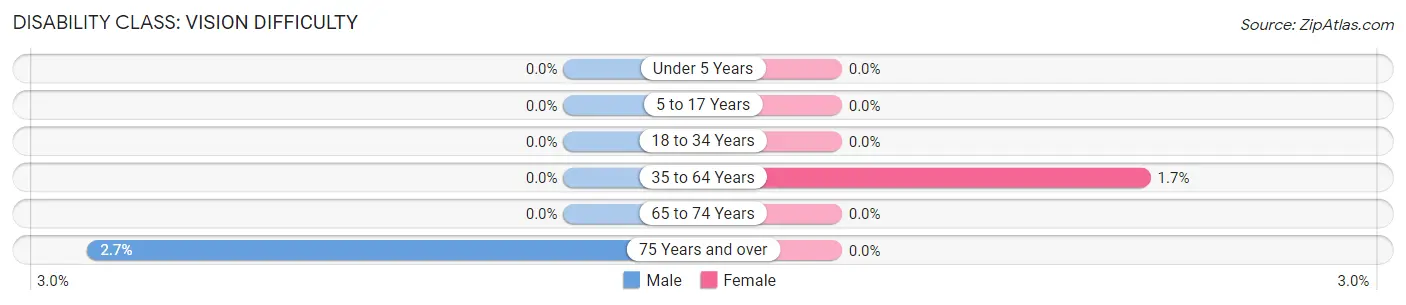
| Age Bracket | Male | Female |
| Under 5 Years | 0 (0.0%) | 0 (0.0%) |
| 5 to 17 Years | 0 (0.0%) | 0 (0.0%) |
| 18 to 34 Years | 0 (0.0%) | 0 (0.0%) |
| 35 to 64 Years | 0 (0.0%) | 5 (1.7%) |
| 65 to 74 Years | 0 (0.0%) | 0 (0.0%) |
| 75 Years and over | 4 (2.6%) | 0 (0.0%) |
Disability Class: Cognitive Difficulty
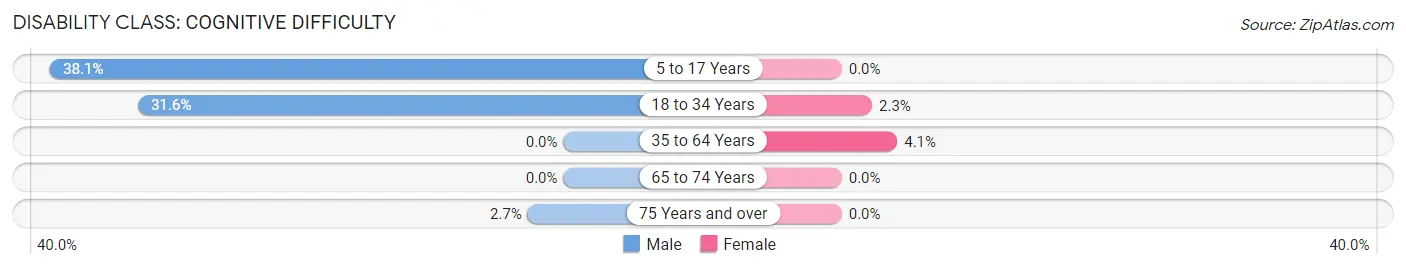
| Age Bracket | Male | Female |
| 5 to 17 Years | 40 (38.1%) | 0 (0.0%) |
| 18 to 34 Years | 48 (31.6%) | 2 (2.2%) |
| 35 to 64 Years | 0 (0.0%) | 12 (4.1%) |
| 65 to 74 Years | 0 (0.0%) | 0 (0.0%) |
| 75 Years and over | 4 (2.6%) | 0 (0.0%) |
Disability Class: Ambulatory Difficulty

| Age Bracket | Male | Female |
| 5 to 17 Years | 0 (0.0%) | 0 (0.0%) |
| 18 to 34 Years | 0 (0.0%) | 2 (2.2%) |
| 35 to 64 Years | 0 (0.0%) | 8 (2.8%) |
| 65 to 74 Years | 0 (0.0%) | 20 (10.6%) |
| 75 Years and over | 24 (15.9%) | 109 (100.0%) |
Disability Class: Self-Care Difficulty
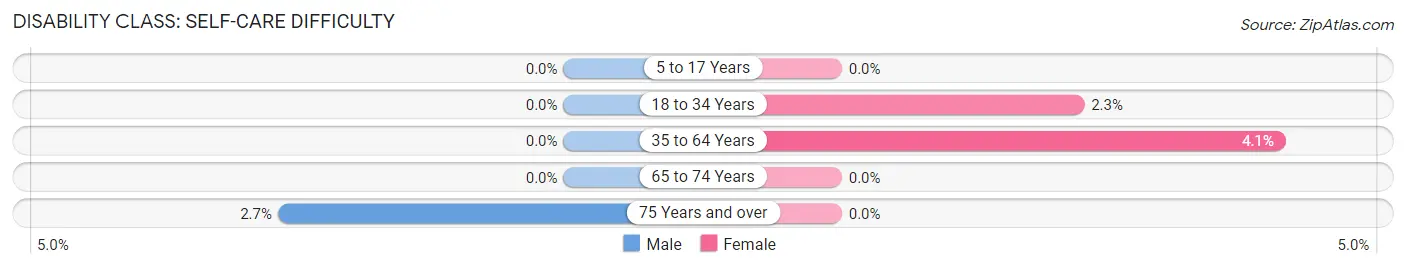
| Age Bracket | Male | Female |
| 5 to 17 Years | 0 (0.0%) | 0 (0.0%) |
| 18 to 34 Years | 0 (0.0%) | 2 (2.2%) |
| 35 to 64 Years | 0 (0.0%) | 12 (4.1%) |
| 65 to 74 Years | 0 (0.0%) | 0 (0.0%) |
| 75 Years and over | 4 (2.6%) | 0 (0.0%) |
Technology Access in Jamesport
Computing Device Access in Jamesport
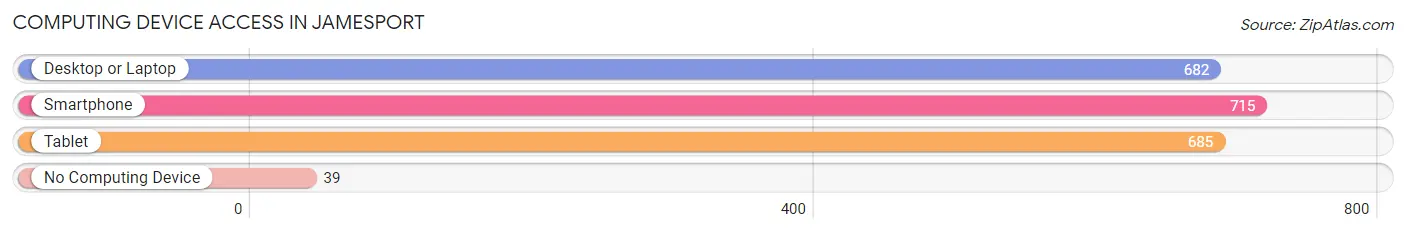
| Device Type | # Households | % Households |
| Desktop or Laptop | 682 | 90.4% |
| Smartphone | 715 | 94.8% |
| Tablet | 685 | 90.8% |
| No Computing Device | 39 | 5.2% |
| Total | 754 | 100.0% |
Internet Access in Jamesport
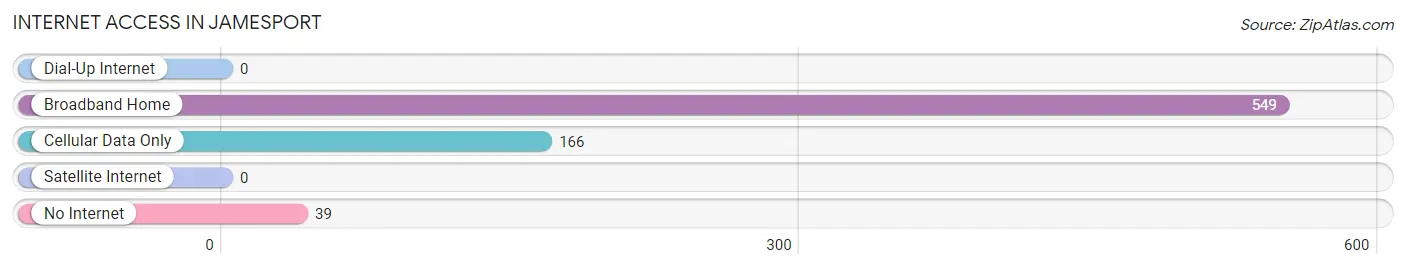
| Internet Type | # Households | % Households |
| Dial-Up Internet | 0 | 0.0% |
| Broadband Home | 549 | 72.8% |
| Cellular Data Only | 166 | 22.0% |
| Satellite Internet | 0 | 0.0% |
| No Internet | 39 | 5.2% |
| Total | 754 | 100.0% |
Jamesport Summary
Introduction
Jamesport is a hamlet located in the Town of Riverhead in Suffolk County, New York. It is situated on the North Fork of Long Island and is part of the East End of Long Island. The hamlet is known for its wineries, farm stands, and seafood restaurants. It is a popular tourist destination and is home to a variety of businesses, including a brewery, a distillery, and a cidery.
History
Jamesport was first settled in the late 1600s by English settlers. The hamlet was originally known as Aquebogue, which is derived from the Algonquin word for “place of many coves.” The hamlet was renamed Jamesport in 1844, after James Tuthill, who was a prominent local landowner.
In the late 1800s, Jamesport was a thriving agricultural community. The hamlet was home to a variety of farms, including potato farms, fruit farms, and dairy farms. The hamlet was also home to a number of businesses, including a blacksmith shop, a general store, and a post office.
In the early 1900s, Jamesport began to experience a decline in its agricultural industry. This was due to the increasing popularity of the automobile, which allowed people to travel further distances and shop in larger cities. As a result, many of the local businesses closed and the population of the hamlet began to decline.
In the late 1900s, Jamesport began to experience a resurgence in its economy. This was due to the increasing popularity of the North Fork of Long Island as a tourist destination. The hamlet is now home to a variety of businesses, including wineries, farm stands, and seafood restaurants.
Geography
Jamesport is located in the Town of Riverhead in Suffolk County, New York. It is situated on the North Fork of Long Island and is part of the East End of Long Island. The hamlet is bordered by the hamlets of Aquebogue to the west, Laurel to the north, and South Jamesport to the east.
The hamlet is located on the Peconic Bay, which is part of the Atlantic Ocean. The bay is home to a variety of wildlife, including ospreys, herons, and seals. The hamlet is also home to a variety of parks, including Jamesport County Park and Iron Pier Beach.
Economy
Jamesport is a popular tourist destination and is home to a variety of businesses, including wineries, farm stands, and seafood restaurants. The hamlet is also home to a brewery, a distillery, and a cidery.
The hamlet is home to a number of agricultural businesses, including farms, nurseries, and greenhouses. The hamlet is also home to a variety of retail businesses, including antique stores, gift shops, and art galleries.
Demographics
As of the 2010 census, the population of Jamesport was 1,717. The median age of the population was 48.7 years old. The median household income was $68,750. The median home value was $521,000.
Conclusion
Jamesport is a hamlet located in the Town of Riverhead in Suffolk County, New York. It is situated on the North Fork of Long Island and is part of the East End of Long Island. The hamlet is known for its wineries, farm stands, and seafood restaurants. It is a popular tourist destination and is home to a variety of businesses, including a brewery, a distillery, and a cidery. The population of Jamesport was 1,717 as of the 2010 census, with a median age of 48.7 years old and a median household income of $68,750. The hamlet is home to a variety of businesses, including wineries, farm stands, and seafood restaurants, as well as a number of agricultural businesses and retail businesses.
Common Questions
What is Per Capita Income in Jamesport?
Per Capita income in Jamesport is $71,847.
What is the Median Family Income in Jamesport?
Median Family Income in Jamesport is $111,875.
What is the Median Household income in Jamesport?
Median Household Income in Jamesport is $110,208.
What is Income or Wage Gap in Jamesport?
Income or Wage Gap in Jamesport is 17.3%.
Women in Jamesport earn 82.7 cents for every dollar earned by a man.
What is Inequality or Gini Index in Jamesport?
Inequality or Gini Index in Jamesport is 0.50.
What is the Total Population of Jamesport?
Total Population of Jamesport is 1,634.
What is the Total Male Population of Jamesport?
Total Male Population of Jamesport is 940.
What is the Total Female Population of Jamesport?
Total Female Population of Jamesport is 694.
What is the Ratio of Males per 100 Females in Jamesport?
There are 135.45 Males per 100 Females in Jamesport.
What is the Ratio of Females per 100 Males in Jamesport?
There are 73.83 Females per 100 Males in Jamesport.
What is the Median Population Age in Jamesport?
Median Population Age in Jamesport is 59.6 Years.
What is the Average Family Size in Jamesport
Average Family Size in Jamesport is 2.2 People.
What is the Average Household Size in Jamesport
Average Household Size in Jamesport is 2.1 People.
How Large is the Labor Force in Jamesport?
There are 784 People in the Labor Forcein in Jamesport.
What is the Percentage of People in the Labor Force in Jamesport?
50.1% of People are in the Labor Force in Jamesport.
What is the Unemployment Rate in Jamesport?
Unemployment Rate in Jamesport is 4.8%.