Bloomingdale, IL Map & Demographics
Bloomingdale Map
Bloomingdale Overview
$55,073
PER CAPITA INCOME
$115,906
AVG FAMILY INCOME
$96,779
AVG HOUSEHOLD INCOME
34.2%
WAGE / INCOME GAP [ % ]
65.8¢/ $1
WAGE / INCOME GAP [ $ ]
0.47
INEQUALITY / GINI INDEX
22,435
TOTAL POPULATION
10,896
MALE POPULATION
11,539
FEMALE POPULATION
94.43
MALES / 100 FEMALES
105.90
FEMALES / 100 MALES
43.2
MEDIAN AGE
3.0
AVG FAMILY SIZE
2.4
AVG HOUSEHOLD SIZE
11,980
LABOR FORCE [ PEOPLE ]
65.1%
PERCENT IN LABOR FORCE
3.9%
UNEMPLOYMENT RATE
Bloomingdale Zip Codes
Bloomingdale Area Codes
Income in Bloomingdale
Income Overview in Bloomingdale
Per Capita Income in Bloomingdale is $55,073, while median incomes of families and households are $115,906 and $96,779 respectively.
| Characteristic | Number | Measure |
| Per Capita Income | 22,435 | $55,073 |
| Median Family Income | 5,856 | $115,906 |
| Mean Family Income | 5,856 | $152,985 |
| Median Household Income | 8,961 | $96,779 |
| Mean Household Income | 8,961 | $134,643 |
| Income Deficit | 5,856 | $0 |
| Wage / Income Gap (%) | 22,435 | 34.20% |
| Wage / Income Gap ($) | 22,435 | 65.80¢ per $1 |
| Gini / Inequality Index | 22,435 | 0.47 |
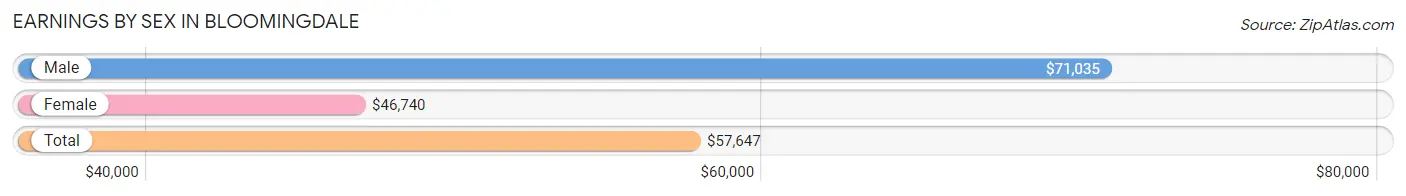
Earnings by Sex in Bloomingdale
Average Earnings in Bloomingdale are $57,647, $71,035 for men and $46,740 for women, a difference of 34.2%.
| Sex | Number | Average Earnings |
| Male | 6,355 (52.7%) | $71,035 |
| Female | 5,695 (47.3%) | $46,740 |
| Total | 12,050 (100.0%) | $57,647 |
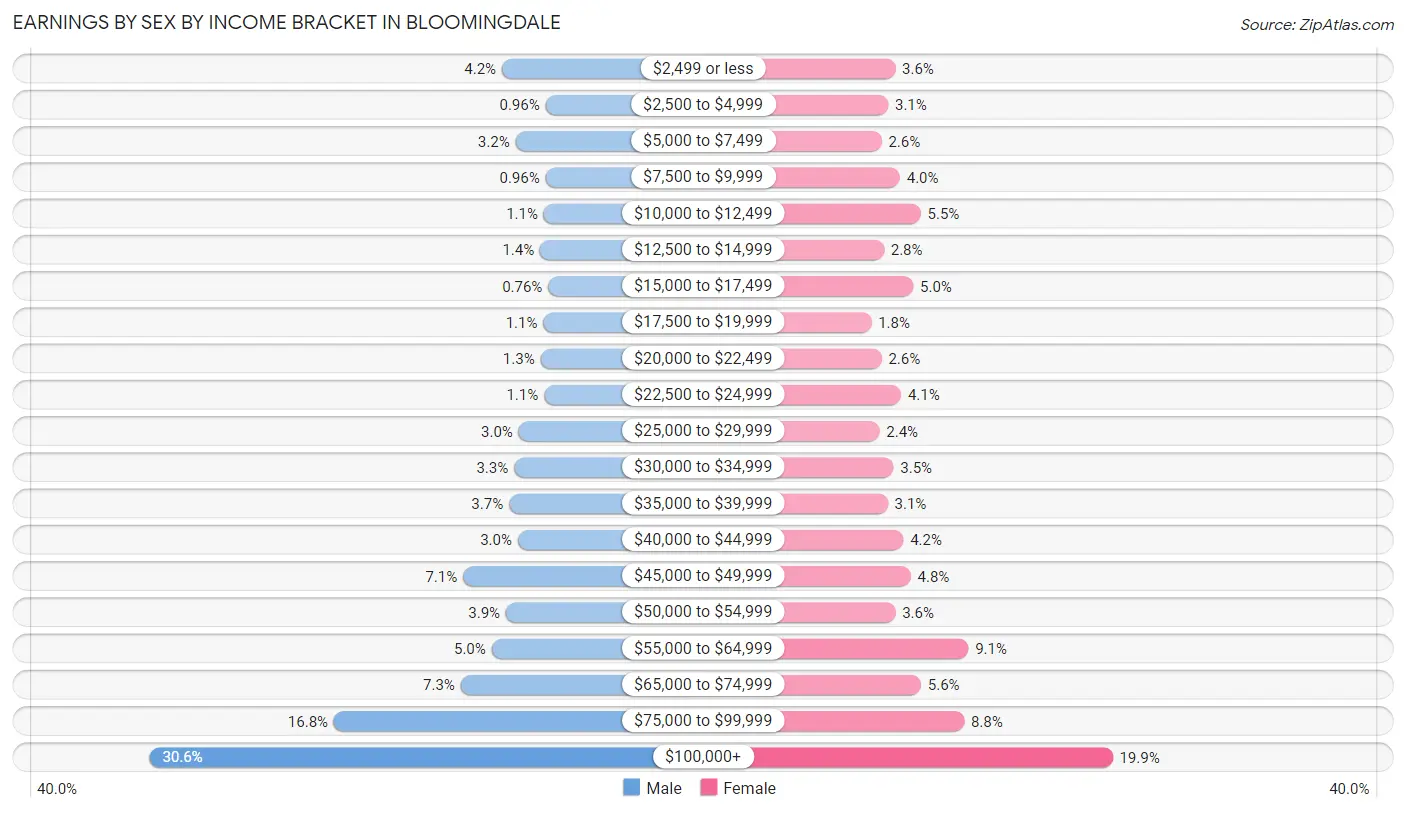
Earnings by Sex by Income Bracket in Bloomingdale
The most common earnings brackets in Bloomingdale are $100,000+ for men (1,947 | 30.6%) and $100,000+ for women (1,134 | 19.9%).
| Income | Male | Female |
| $2,499 or less | 269 (4.2%) | 206 (3.6%) |
| $2,500 to $4,999 | 61 (1.0%) | 176 (3.1%) |
| $5,000 to $7,499 | 204 (3.2%) | 148 (2.6%) |
| $7,500 to $9,999 | 61 (1.0%) | 226 (4.0%) |
| $10,000 to $12,499 | 69 (1.1%) | 315 (5.5%) |
| $12,500 to $14,999 | 87 (1.4%) | 158 (2.8%) |
| $15,000 to $17,499 | 48 (0.8%) | 283 (5.0%) |
| $17,500 to $19,999 | 72 (1.1%) | 104 (1.8%) |
| $20,000 to $22,499 | 85 (1.3%) | 148 (2.6%) |
| $22,500 to $24,999 | 68 (1.1%) | 231 (4.1%) |
| $25,000 to $29,999 | 189 (3.0%) | 139 (2.4%) |
| $30,000 to $34,999 | 211 (3.3%) | 199 (3.5%) |
| $35,000 to $39,999 | 235 (3.7%) | 174 (3.1%) |
| $40,000 to $44,999 | 193 (3.0%) | 241 (4.2%) |
| $45,000 to $49,999 | 454 (7.1%) | 272 (4.8%) |
| $50,000 to $54,999 | 250 (3.9%) | 207 (3.6%) |
| $55,000 to $64,999 | 318 (5.0%) | 518 (9.1%) |
| $65,000 to $74,999 | 465 (7.3%) | 316 (5.6%) |
| $75,000 to $99,999 | 1,069 (16.8%) | 500 (8.8%) |
| $100,000+ | 1,947 (30.6%) | 1,134 (19.9%) |
| Total | 6,355 (100.0%) | 5,695 (100.0%) |
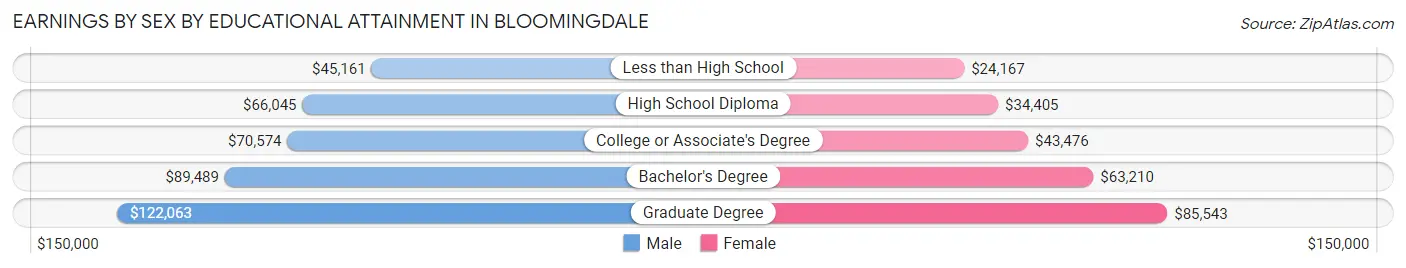
Earnings by Sex by Educational Attainment in Bloomingdale
Average earnings in Bloomingdale are $77,736 for men and $54,414 for women, a difference of 30.0%. Men with an educational attainment of graduate degree enjoy the highest average annual earnings of $122,063, while those with less than high school education earn the least with $45,161. Women with an educational attainment of graduate degree earn the most with the average annual earnings of $85,543, while those with less than high school education have the smallest earnings of $24,167.
| Educational Attainment | Male Income | Female Income |
| Less than High School | $45,161 | $24,167 |
| High School Diploma | $66,045 | $34,405 |
| College or Associate's Degree | $70,574 | $43,476 |
| Bachelor's Degree | $89,489 | $63,210 |
| Graduate Degree | $122,063 | $85,543 |
| Total | $77,736 | $54,414 |
Family Income in Bloomingdale
Family Income Brackets in Bloomingdale
According to the Bloomingdale family income data, there are 1,271 families falling into the $100,000 to $149,999 income range, which is the most common income bracket and makes up 21.7% of all families. Conversely, the $10,000 to $14,999 income bracket is the least frequent group with only 23 families (0.4%) belonging to this category.
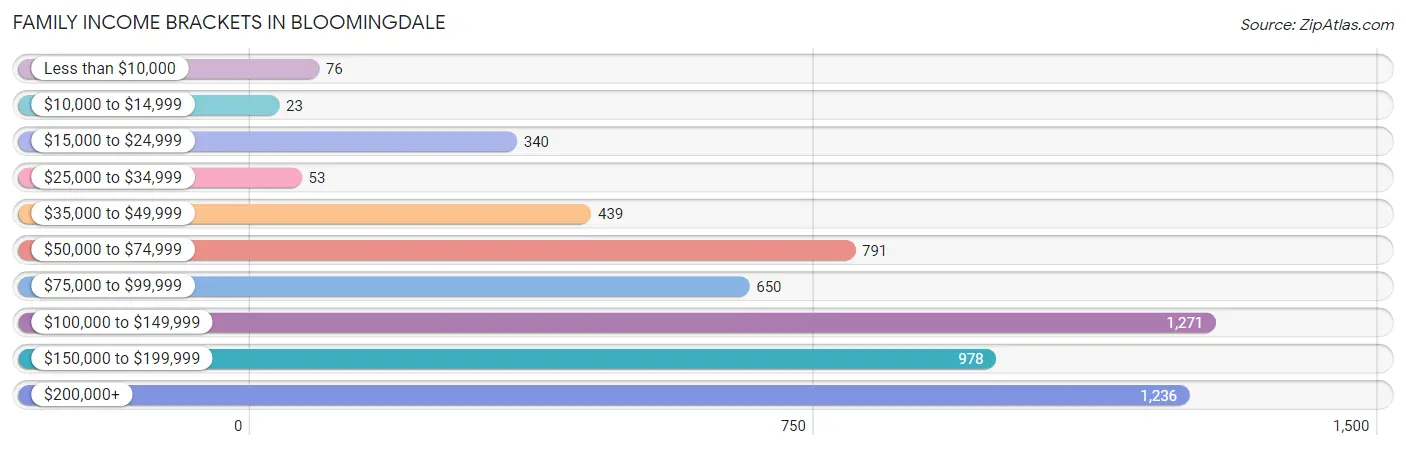
| Income Bracket | # Families | % Families |
| Less than $10,000 | 76 | 1.3% |
| $10,000 to $14,999 | 23 | 0.4% |
| $15,000 to $24,999 | 340 | 5.8% |
| $25,000 to $34,999 | 53 | 0.9% |
| $35,000 to $49,999 | 439 | 7.5% |
| $50,000 to $74,999 | 791 | 13.5% |
| $75,000 to $99,999 | 650 | 11.1% |
| $100,000 to $149,999 | 1,271 | 21.7% |
| $150,000 to $199,999 | 978 | 16.7% |
| $200,000+ | 1,236 | 21.1% |
Family Income by Famaliy Size in Bloomingdale
6-person families (143 | 2.4%) account for the highest median family income in Bloomingdale with $220,529 per family, while 2-person families (2,767 | 47.2%) have the highest median income of $47,205 per family member.
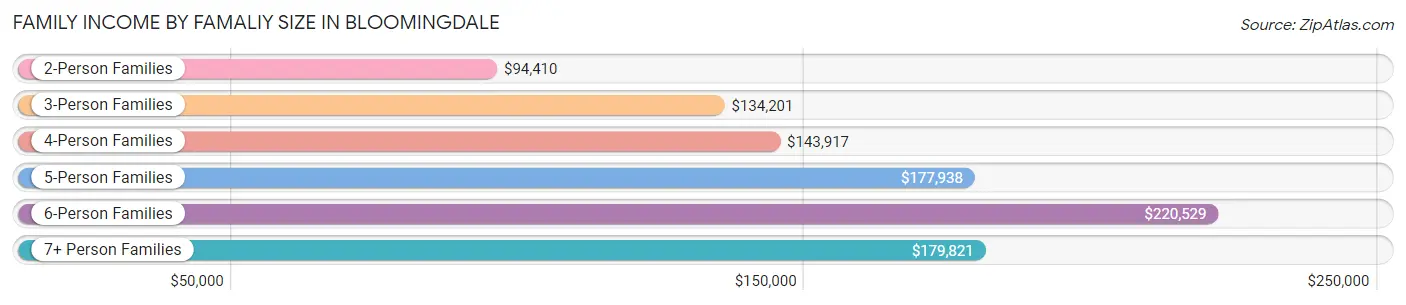
| Income Bracket | # Families | Median Income |
| 2-Person Families | 2,767 (47.2%) | $94,410 |
| 3-Person Families | 1,441 (24.6%) | $134,201 |
| 4-Person Families | 1,079 (18.4%) | $143,917 |
| 5-Person Families | 363 (6.2%) | $177,938 |
| 6-Person Families | 143 (2.4%) | $220,529 |
| 7+ Person Families | 63 (1.1%) | $179,821 |
| Total | 5,856 (100.0%) | $115,906 |
Family Income by Number of Earners in Bloomingdale
The median family income in Bloomingdale is $115,906, with families comprising 3+ earners (717) having the highest median family income of $177,969, while families with no earners (972) have the lowest median family income of $59,470, accounting for 12.2% and 16.6% of families, respectively.
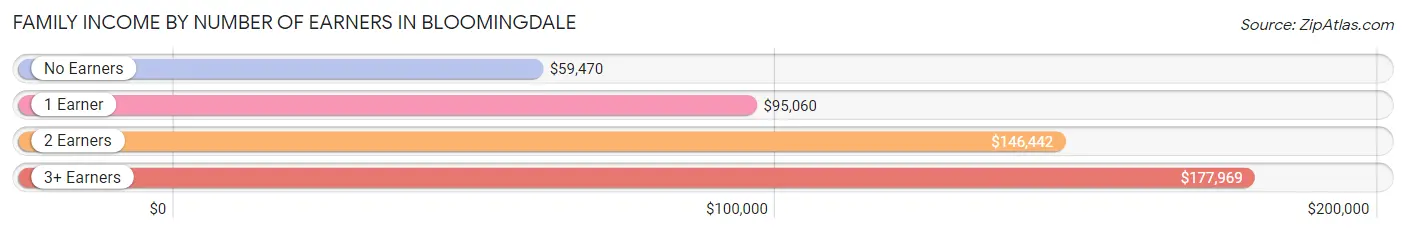
| Number of Earners | # Families | Median Income |
| No Earners | 972 (16.6%) | $59,470 |
| 1 Earner | 1,571 (26.8%) | $95,060 |
| 2 Earners | 2,596 (44.3%) | $146,442 |
| 3+ Earners | 717 (12.2%) | $177,969 |
| Total | 5,856 (100.0%) | $115,906 |
Household Income in Bloomingdale
Household Income Brackets in Bloomingdale
With 1,712 households falling in the category, the $100,000 to $149,999 income range is the most frequent in Bloomingdale, accounting for 19.1% of all households. In contrast, only 81 households (0.9%) fall into the $10,000 to $14,999 income bracket, making it the least populous group.
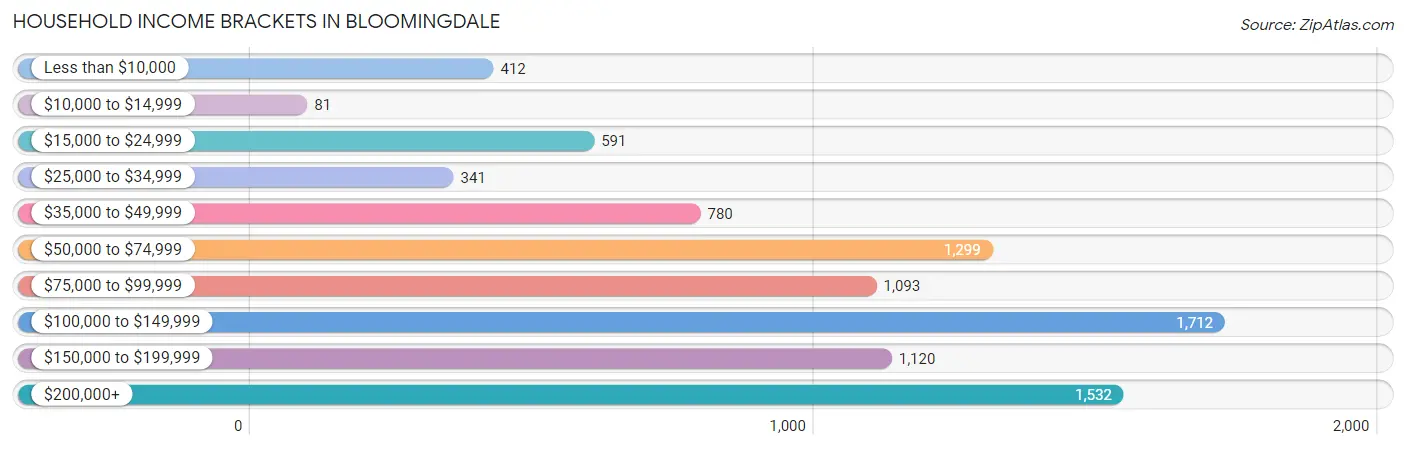
| Income Bracket | # Households | % Households |
| Less than $10,000 | 412 | 4.6% |
| $10,000 to $14,999 | 81 | 0.9% |
| $15,000 to $24,999 | 591 | 6.6% |
| $25,000 to $34,999 | 341 | 3.8% |
| $35,000 to $49,999 | 780 | 8.7% |
| $50,000 to $74,999 | 1,299 | 14.5% |
| $75,000 to $99,999 | 1,093 | 12.2% |
| $100,000 to $149,999 | 1,712 | 19.1% |
| $150,000 to $199,999 | 1,120 | 12.5% |
| $200,000+ | 1,532 | 17.1% |
Household Income by Householder Age in Bloomingdale
The median household income in Bloomingdale is $96,779, with the highest median household income of $120,385 found in the 45 to 64 years age bracket for the primary householder. A total of 2,940 households (32.8%) fall into this category. Meanwhile, the 15 to 24 years age bracket for the primary householder has the lowest median household income of $0, with 166 households (1.8%) in this group.
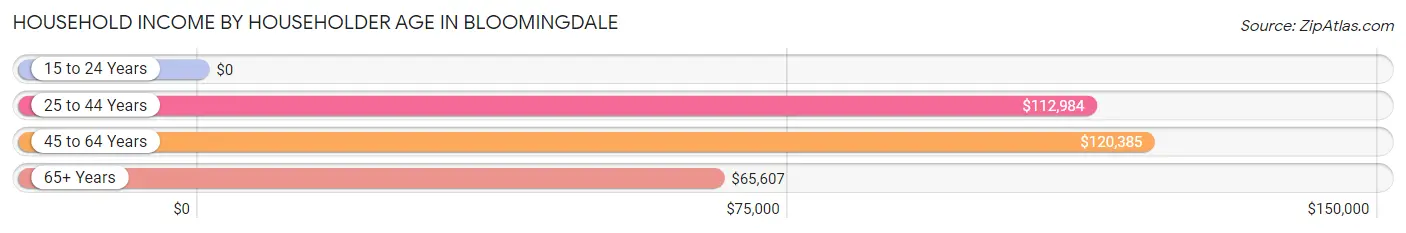
| Income Bracket | # Households | Median Income |
| 15 to 24 Years | 166 (1.8%) | $0 |
| 25 to 44 Years | 2,845 (31.8%) | $112,984 |
| 45 to 64 Years | 2,940 (32.8%) | $120,385 |
| 65+ Years | 3,010 (33.6%) | $65,607 |
| Total | 8,961 (100.0%) | $96,779 |
Poverty in Bloomingdale
Income Below Poverty by Sex and Age in Bloomingdale
With 6.4% poverty level for males and 7.8% for females among the residents of Bloomingdale, 18 to 24 year old males and 18 to 24 year old females are the most vulnerable to poverty, with 86 males (17.9%) and 120 females (16.3%) in their respective age groups living below the poverty level.
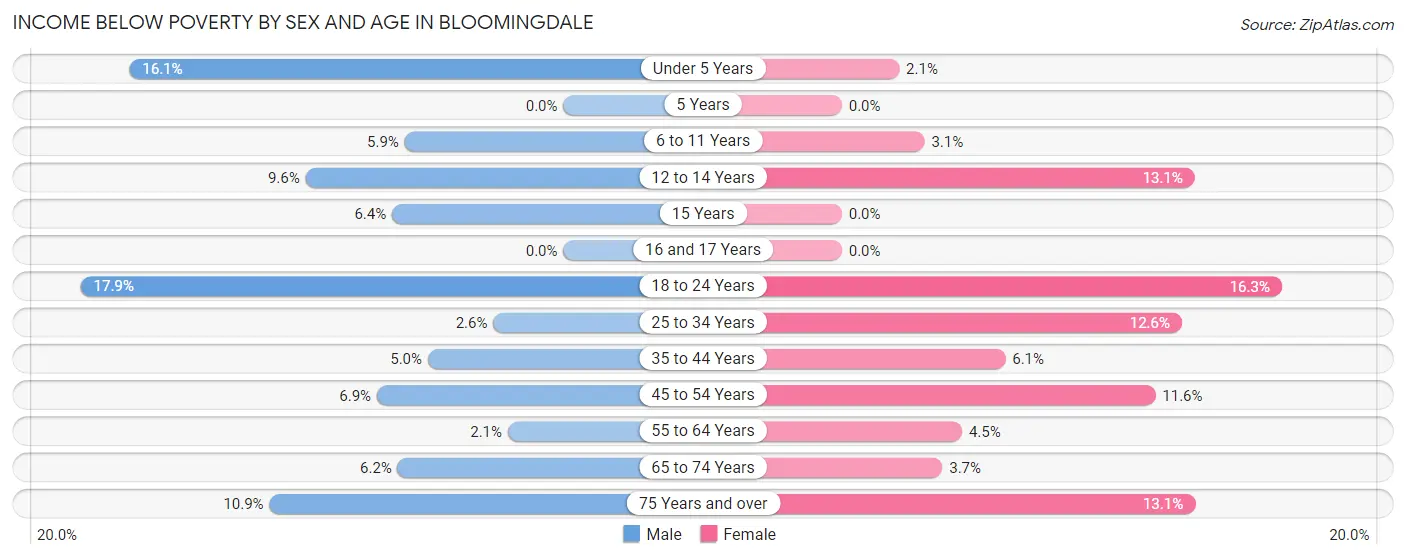
| Age Bracket | Male | Female |
| Under 5 Years | 92 (16.1%) | 13 (2.1%) |
| 5 Years | 0 (0.0%) | 0 (0.0%) |
| 6 to 11 Years | 60 (5.9%) | 23 (3.1%) |
| 12 to 14 Years | 27 (9.6%) | 38 (13.1%) |
| 15 Years | 7 (6.4%) | 0 (0.0%) |
| 16 and 17 Years | 0 (0.0%) | 0 (0.0%) |
| 18 to 24 Years | 86 (17.9%) | 120 (16.3%) |
| 25 to 34 Years | 35 (2.6%) | 154 (12.6%) |
| 35 to 44 Years | 92 (5.0%) | 95 (6.1%) |
| 45 to 54 Years | 78 (6.9%) | 159 (11.6%) |
| 55 to 64 Years | 29 (2.1%) | 63 (4.5%) |
| 65 to 74 Years | 76 (6.1%) | 63 (3.7%) |
| 75 Years and over | 96 (10.9%) | 146 (13.1%) |
| Total | 678 (6.4%) | 874 (7.8%) |
Income Above Poverty by Sex and Age in Bloomingdale
According to the poverty statistics in Bloomingdale, males aged 5 years and females aged 5 years are the age groups that are most secure financially, with 100.0% of males and 100.0% of females in these age groups living above the poverty line.
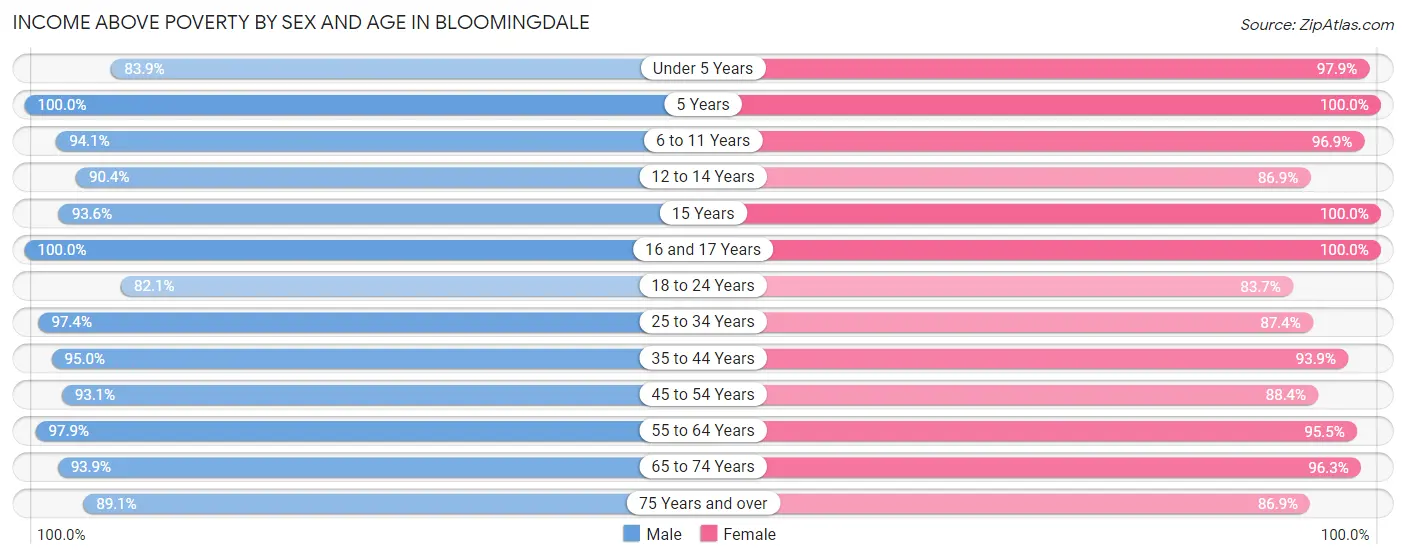
| Age Bracket | Male | Female |
| Under 5 Years | 479 (83.9%) | 597 (97.9%) |
| 5 Years | 140 (100.0%) | 80 (100.0%) |
| 6 to 11 Years | 958 (94.1%) | 727 (96.9%) |
| 12 to 14 Years | 255 (90.4%) | 252 (86.9%) |
| 15 Years | 103 (93.6%) | 147 (100.0%) |
| 16 and 17 Years | 156 (100.0%) | 167 (100.0%) |
| 18 to 24 Years | 394 (82.1%) | 615 (83.7%) |
| 25 to 34 Years | 1,309 (97.4%) | 1,066 (87.4%) |
| 35 to 44 Years | 1,738 (95.0%) | 1,470 (93.9%) |
| 45 to 54 Years | 1,049 (93.1%) | 1,207 (88.4%) |
| 55 to 64 Years | 1,376 (97.9%) | 1,348 (95.5%) |
| 65 to 74 Years | 1,160 (93.9%) | 1,628 (96.3%) |
| 75 Years and over | 784 (89.1%) | 968 (86.9%) |
| Total | 9,901 (93.6%) | 10,272 (92.2%) |
Income Below Poverty Among Married-Couple Families in Bloomingdale
The poverty statistics for married-couple families in Bloomingdale show that 3.5% or 168 of the total 4,836 families live below the poverty line. Families with 1 or 2 children have the highest poverty rate of 6.7%, comprising of 108 families. On the other hand, families with 3 or 4 children have the lowest poverty rate of 0.0%, which includes 0 families.
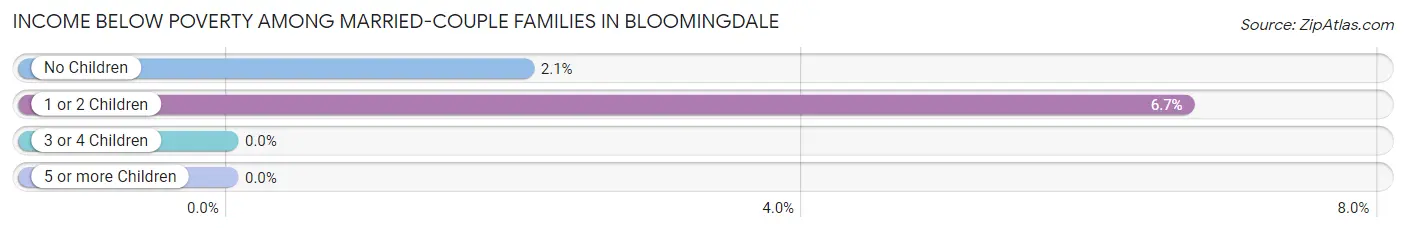
| Children | Above Poverty | Below Poverty |
| No Children | 2,846 (97.9%) | 60 (2.1%) |
| 1 or 2 Children | 1,514 (93.3%) | 108 (6.7%) |
| 3 or 4 Children | 281 (100.0%) | 0 (0.0%) |
| 5 or more Children | 27 (100.0%) | 0 (0.0%) |
| Total | 4,668 (96.5%) | 168 (3.5%) |
Income Below Poverty Among Single-Parent Households in Bloomingdale
According to the poverty data in Bloomingdale, 2.9% or 11 single-father households and 10.0% or 64 single-mother households are living below the poverty line. Among single-father households, those with no children have the highest poverty rate, with 11 households (4.7%) experiencing poverty. Likewise, among single-mother households, those with 3 or 4 children have the highest poverty rate, with 11 households (50.0%) falling below the poverty line.
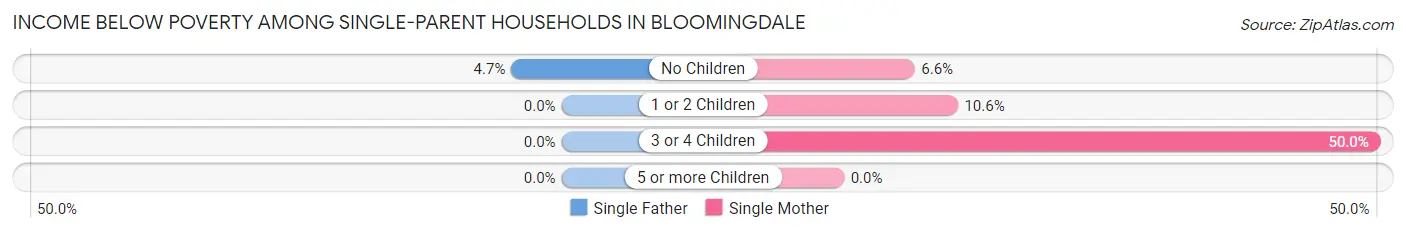
| Children | Single Father | Single Mother |
| No Children | 11 (4.7%) | 21 (6.6%) |
| 1 or 2 Children | 0 (0.0%) | 32 (10.6%) |
| 3 or 4 Children | 0 (0.0%) | 11 (50.0%) |
| 5 or more Children | 0 (0.0%) | 0 (0.0%) |
| Total | 11 (2.9%) | 64 (10.0%) |
Income Below Poverty Among Married-Couple vs Single-Parent Households in Bloomingdale
The poverty data for Bloomingdale shows that 168 of the married-couple family households (3.5%) and 75 of the single-parent households (7.3%) are living below the poverty level. Within the married-couple family households, those with 1 or 2 children have the highest poverty rate, with 108 households (6.7%) falling below the poverty line. Among the single-parent households, those with 3 or 4 children have the highest poverty rate, with 11 household (37.9%) living below poverty.
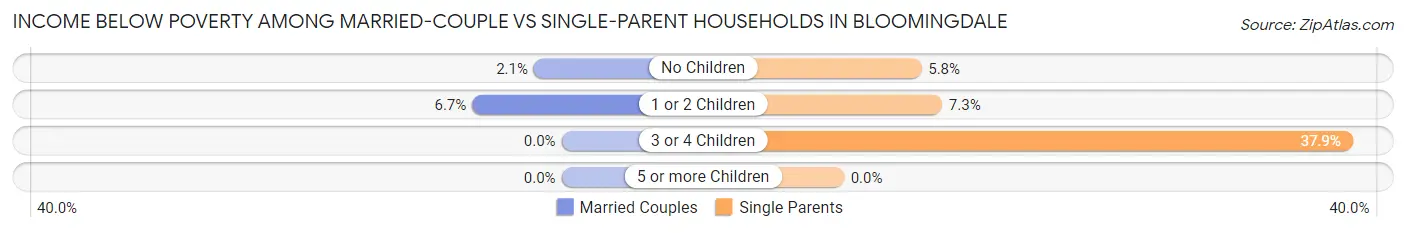
| Children | Married-Couple Families | Single-Parent Households |
| No Children | 60 (2.1%) | 32 (5.8%) |
| 1 or 2 Children | 108 (6.7%) | 32 (7.3%) |
| 3 or 4 Children | 0 (0.0%) | 11 (37.9%) |
| 5 or more Children | 0 (0.0%) | 0 (0.0%) |
| Total | 168 (3.5%) | 75 (7.3%) |
Race in Bloomingdale
The most populous races in Bloomingdale are White / Caucasian (16,036 | 71.5%), Asian (3,305 | 14.7%), and Hispanic or Latino (2,582 | 11.5%).
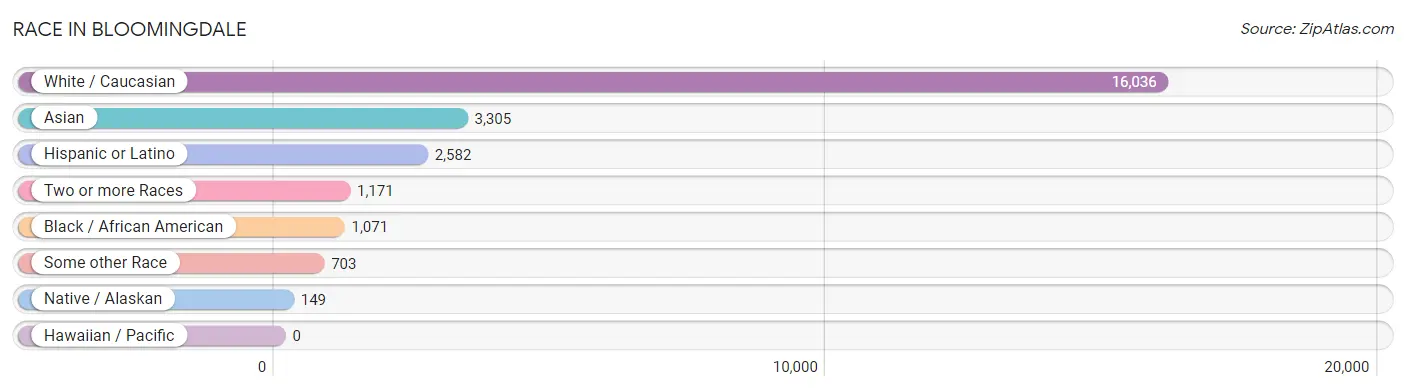
| Race | # Population | % Population |
| Asian | 3,305 | 14.7% |
| Black / African American | 1,071 | 4.8% |
| Hawaiian / Pacific | 0 | 0.0% |
| Hispanic or Latino | 2,582 | 11.5% |
| Native / Alaskan | 149 | 0.7% |
| White / Caucasian | 16,036 | 71.5% |
| Two or more Races | 1,171 | 5.2% |
| Some other Race | 703 | 3.1% |
| Total | 22,435 | 100.0% |
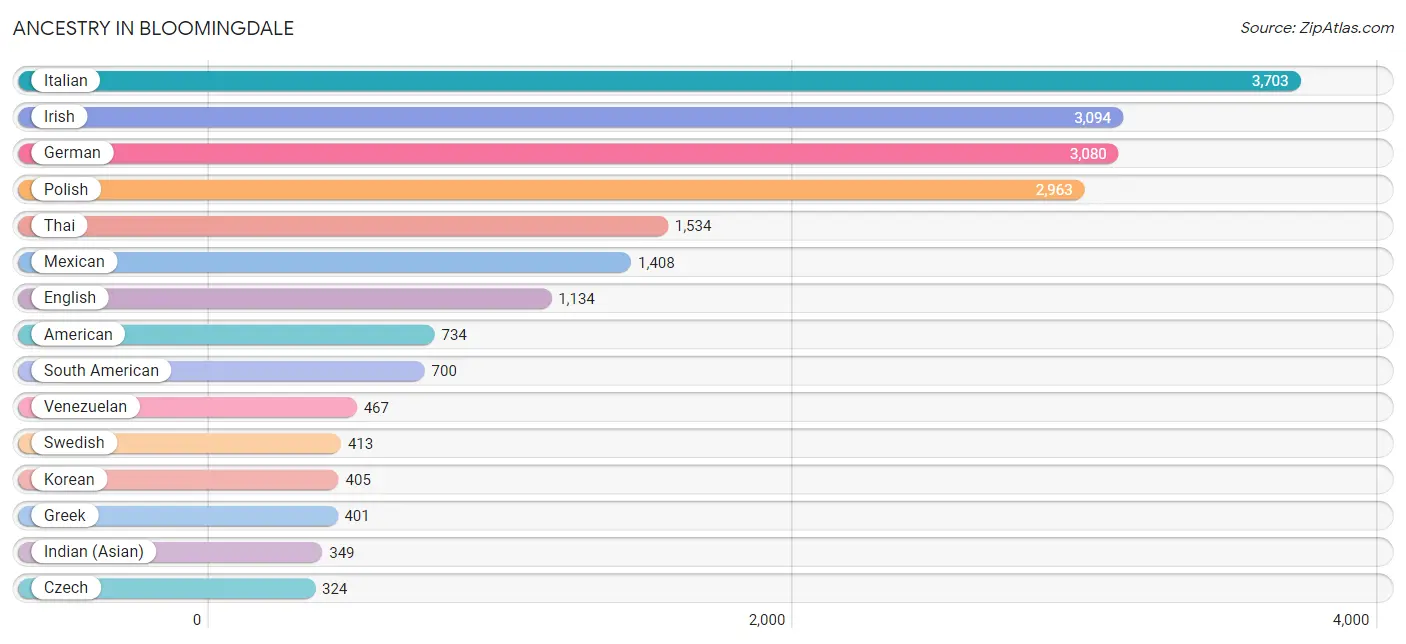
Ancestry in Bloomingdale
The most populous ancestries reported in Bloomingdale are Italian (3,703 | 16.5%), Irish (3,094 | 13.8%), German (3,080 | 13.7%), Polish (2,963 | 13.2%), and Thai (1,534 | 6.8%), together accounting for 64.1% of all Bloomingdale residents.
| Ancestry | # Population | % Population |
| African | 10 | 0.0% |
| Albanian | 86 | 0.4% |
| American | 734 | 3.3% |
| Apache | 10 | 0.0% |
| Arab | 201 | 0.9% |
| Argentinean | 46 | 0.2% |
| Armenian | 15 | 0.1% |
| Assyrian / Chaldean / Syriac | 49 | 0.2% |
| Austrian | 138 | 0.6% |
| Belizean | 93 | 0.4% |
| Bhutanese | 117 | 0.5% |
| Bolivian | 12 | 0.1% |
| Brazilian | 11 | 0.1% |
| British | 109 | 0.5% |
| Bulgarian | 72 | 0.3% |
| Burmese | 172 | 0.8% |
| Cajun | 26 | 0.1% |
| Canadian | 14 | 0.1% |
| Central American | 79 | 0.4% |
| Cherokee | 8 | 0.0% |
| Chilean | 3 | 0.0% |
| Colombian | 95 | 0.4% |
| Croatian | 20 | 0.1% |
| Cuban | 92 | 0.4% |
| Czech | 324 | 1.4% |
| Danish | 171 | 0.8% |
| Dutch | 168 | 0.7% |
| Eastern European | 12 | 0.1% |
| Ecuadorian | 55 | 0.3% |
| English | 1,134 | 5.1% |
| Estonian | 12 | 0.1% |
| European | 219 | 1.0% |
| Filipino | 27 | 0.1% |
| Finnish | 40 | 0.2% |
| French | 234 | 1.0% |
| French Canadian | 59 | 0.3% |
| German | 3,080 | 13.7% |
| Greek | 401 | 1.8% |
| Guatemalan | 63 | 0.3% |
| Hungarian | 87 | 0.4% |
| Indian (Asian) | 349 | 1.6% |
| Iranian | 35 | 0.2% |
| Iraqi | 85 | 0.4% |
| Irish | 3,094 | 13.8% |
| Italian | 3,703 | 16.5% |
| Jamaican | 30 | 0.1% |
| Japanese | 122 | 0.5% |
| Korean | 405 | 1.8% |
| Latvian | 69 | 0.3% |
| Lebanese | 98 | 0.4% |
| Lithuanian | 108 | 0.5% |
| Macedonian | 98 | 0.4% |
| Mexican | 1,408 | 6.3% |
| Mexican American Indian | 143 | 0.6% |
| Northern European | 14 | 0.1% |
| Norwegian | 258 | 1.1% |
| Palestinian | 18 | 0.1% |
| Pennsylvania German | 8 | 0.0% |
| Peruvian | 22 | 0.1% |
| Polish | 2,963 | 13.2% |
| Portuguese | 11 | 0.1% |
| Puerto Rican | 267 | 1.2% |
| Romanian | 37 | 0.2% |
| Russian | 126 | 0.6% |
| Salvadoran | 16 | 0.1% |
| Scandinavian | 25 | 0.1% |
| Scotch-Irish | 84 | 0.4% |
| Scottish | 235 | 1.1% |
| Serbian | 68 | 0.3% |
| Slovak | 18 | 0.1% |
| Slovene | 30 | 0.1% |
| Somali | 82 | 0.4% |
| South American | 700 | 3.1% |
| South American Indian | 12 | 0.1% |
| Spaniard | 8 | 0.0% |
| Spanish | 15 | 0.1% |
| Sri Lankan | 105 | 0.5% |
| Subsaharan African | 92 | 0.4% |
| Swedish | 413 | 1.8% |
| Swiss | 22 | 0.1% |
| Thai | 1,534 | 6.8% |
| Ukrainian | 176 | 0.8% |
| Venezuelan | 467 | 2.1% |
| Welsh | 77 | 0.3% |
| Yugoslavian | 44 | 0.2% | View All 85 Rows |
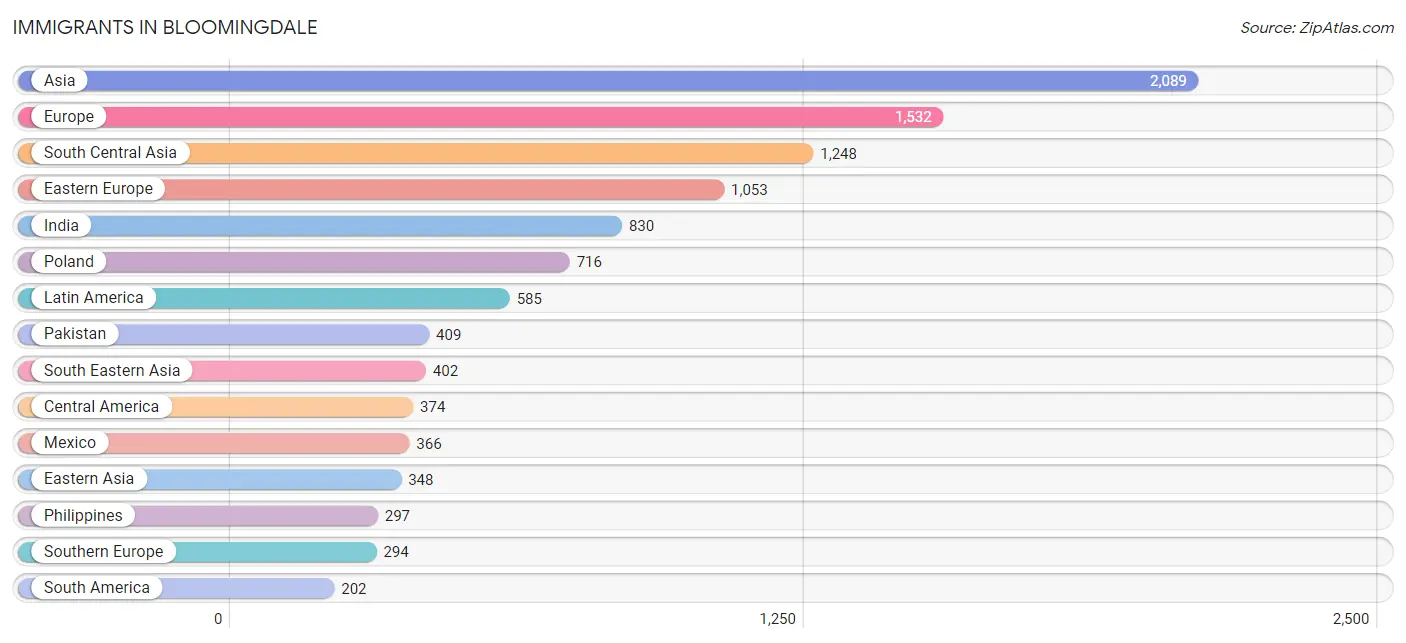
Immigrants in Bloomingdale
The most numerous immigrant groups reported in Bloomingdale came from Asia (2,089 | 9.3%), Europe (1,532 | 6.8%), South Central Asia (1,248 | 5.6%), Eastern Europe (1,053 | 4.7%), and India (830 | 3.7%), together accounting for 30.1% of all Bloomingdale residents.
| Immigration Origin | # Population | % Population |
| Africa | 73 | 0.3% |
| Albania | 22 | 0.1% |
| Argentina | 35 | 0.2% |
| Asia | 2,089 | 9.3% |
| Brazil | 22 | 0.1% |
| Bulgaria | 72 | 0.3% |
| Cambodia | 60 | 0.3% |
| Canada | 35 | 0.2% |
| Caribbean | 9 | 0.0% |
| Central America | 374 | 1.7% |
| China | 170 | 0.8% |
| Colombia | 36 | 0.2% |
| Croatia | 14 | 0.1% |
| Cuba | 9 | 0.0% |
| Eastern Africa | 65 | 0.3% |
| Eastern Asia | 348 | 1.5% |
| Eastern Europe | 1,053 | 4.7% |
| Ecuador | 65 | 0.3% |
| El Salvador | 8 | 0.0% |
| England | 81 | 0.4% |
| Europe | 1,532 | 6.8% |
| France | 29 | 0.1% |
| Germany | 54 | 0.2% |
| Greece | 118 | 0.5% |
| Hong Kong | 10 | 0.0% |
| India | 830 | 3.7% |
| Iraq | 35 | 0.2% |
| Ireland | 7 | 0.0% |
| Italy | 176 | 0.8% |
| Japan | 77 | 0.3% |
| Kazakhstan | 9 | 0.0% |
| Kenya | 13 | 0.1% |
| Korea | 101 | 0.4% |
| Kuwait | 9 | 0.0% |
| Latin America | 585 | 2.6% |
| Latvia | 35 | 0.2% |
| Lebanon | 30 | 0.1% |
| Lithuania | 9 | 0.0% |
| Mexico | 366 | 1.6% |
| Morocco | 8 | 0.0% |
| North Macedonia | 35 | 0.2% |
| Northern Africa | 8 | 0.0% |
| Northern Europe | 102 | 0.4% |
| Pakistan | 409 | 1.8% |
| Peru | 12 | 0.1% |
| Philippines | 297 | 1.3% |
| Poland | 716 | 3.2% |
| Russia | 51 | 0.2% |
| Saudi Arabia | 17 | 0.1% |
| Serbia | 27 | 0.1% |
| Somalia | 52 | 0.2% |
| South America | 202 | 0.9% |
| South Central Asia | 1,248 | 5.6% |
| South Eastern Asia | 402 | 1.8% |
| Southern Europe | 294 | 1.3% |
| Taiwan | 68 | 0.3% |
| Ukraine | 61 | 0.3% |
| Venezuela | 32 | 0.1% |
| Vietnam | 45 | 0.2% |
| Western Asia | 91 | 0.4% |
| Western Europe | 83 | 0.4% | View All 61 Rows |
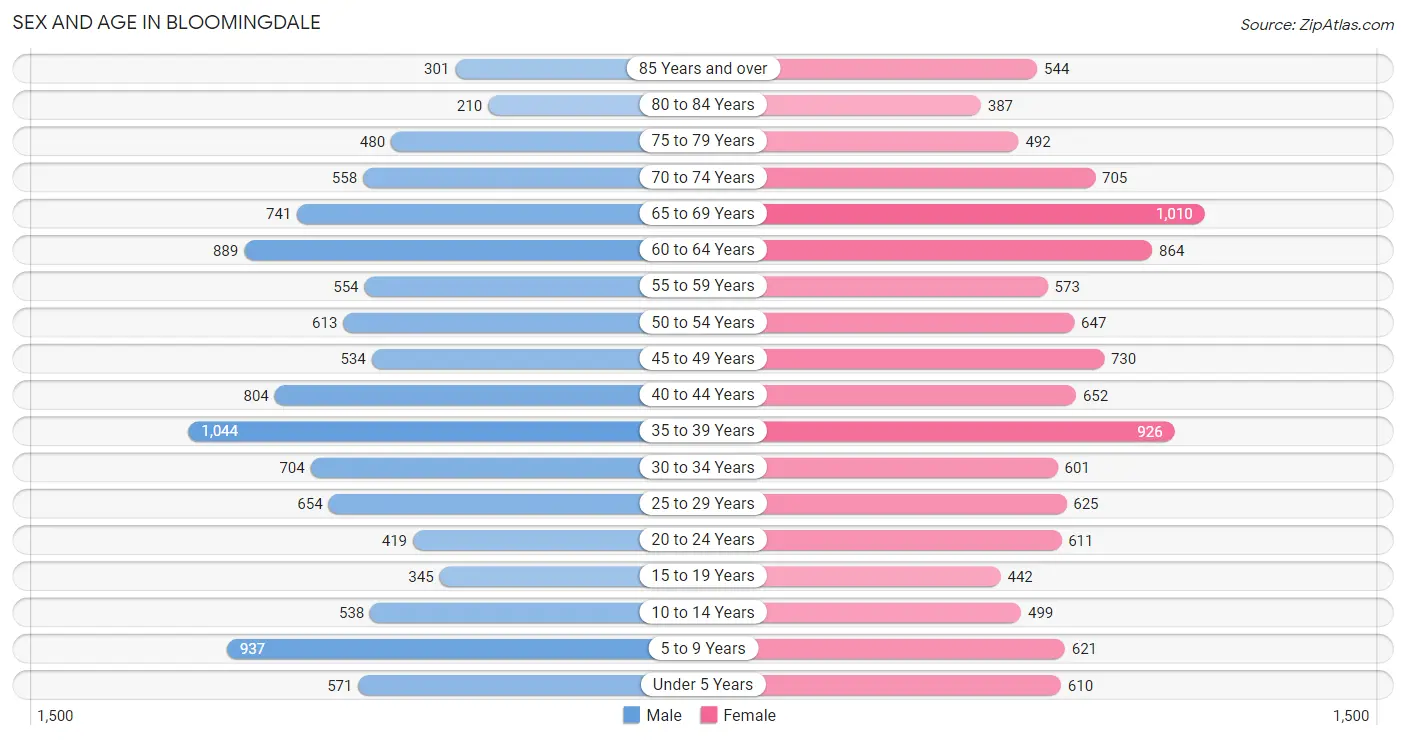
Sex and Age in Bloomingdale
Sex and Age in Bloomingdale
The most populous age groups in Bloomingdale are 35 to 39 Years (1,044 | 9.6%) for men and 65 to 69 Years (1,010 | 8.7%) for women.
| Age Bracket | Male | Female |
| Under 5 Years | 571 (5.2%) | 610 (5.3%) |
| 5 to 9 Years | 937 (8.6%) | 621 (5.4%) |
| 10 to 14 Years | 538 (4.9%) | 499 (4.3%) |
| 15 to 19 Years | 345 (3.2%) | 442 (3.8%) |
| 20 to 24 Years | 419 (3.8%) | 611 (5.3%) |
| 25 to 29 Years | 654 (6.0%) | 625 (5.4%) |
| 30 to 34 Years | 704 (6.5%) | 601 (5.2%) |
| 35 to 39 Years | 1,044 (9.6%) | 926 (8.0%) |
| 40 to 44 Years | 804 (7.4%) | 652 (5.7%) |
| 45 to 49 Years | 534 (4.9%) | 730 (6.3%) |
| 50 to 54 Years | 613 (5.6%) | 647 (5.6%) |
| 55 to 59 Years | 554 (5.1%) | 573 (5.0%) |
| 60 to 64 Years | 889 (8.2%) | 864 (7.5%) |
| 65 to 69 Years | 741 (6.8%) | 1,010 (8.7%) |
| 70 to 74 Years | 558 (5.1%) | 705 (6.1%) |
| 75 to 79 Years | 480 (4.4%) | 492 (4.3%) |
| 80 to 84 Years | 210 (1.9%) | 387 (3.4%) |
| 85 Years and over | 301 (2.8%) | 544 (4.7%) |
| Total | 10,896 (100.0%) | 11,539 (100.0%) |
Families and Households in Bloomingdale
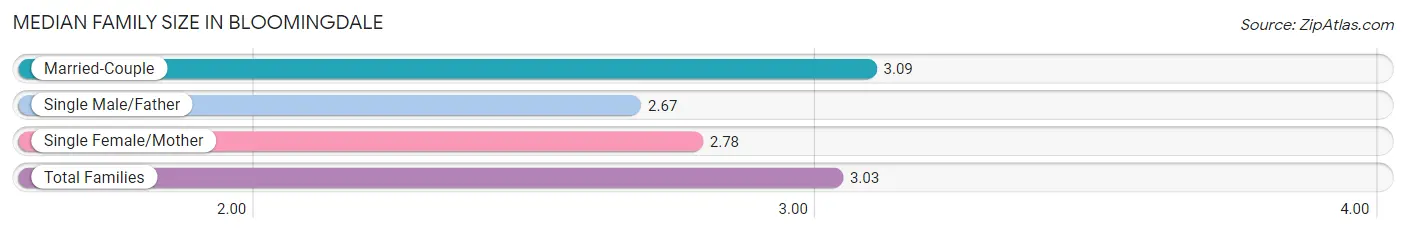
Median Family Size in Bloomingdale
The median family size in Bloomingdale is 3.03 persons per family, with married-couple families (4,836 | 82.6%) accounting for the largest median family size of 3.09 persons per family. On the other hand, single male/father families (377 | 6.4%) represent the smallest median family size with 2.67 persons per family.
| Family Type | # Families | Family Size |
| Married-Couple | 4,836 (82.6%) | 3.09 |
| Single Male/Father | 377 (6.4%) | 2.67 |
| Single Female/Mother | 643 (11.0%) | 2.78 |
| Total Families | 5,856 (100.0%) | 3.03 |
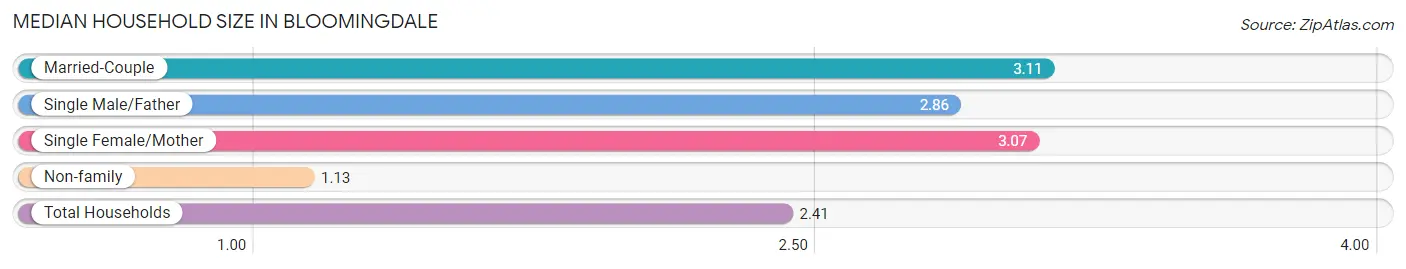
Median Household Size in Bloomingdale
The median household size in Bloomingdale is 2.41 persons per household, with married-couple households (4,836 | 54.0%) accounting for the largest median household size of 3.11 persons per household. non-family households (3,105 | 34.6%) represent the smallest median household size with 1.13 persons per household.
| Household Type | # Households | Household Size |
| Married-Couple | 4,836 (54.0%) | 3.11 |
| Single Male/Father | 377 (4.2%) | 2.86 |
| Single Female/Mother | 643 (7.2%) | 3.07 |
| Non-family | 3,105 (34.6%) | 1.13 |
| Total Households | 8,961 (100.0%) | 2.41 |
Household Size by Marriage Status in Bloomingdale
Out of a total of 8,961 households in Bloomingdale, 5,856 (65.3%) are family households, while 3,105 (34.6%) are nonfamily households. The most numerous type of family households are 2-person households, comprising 2,639, and the most common type of nonfamily households are 1-person households, comprising 2,769.
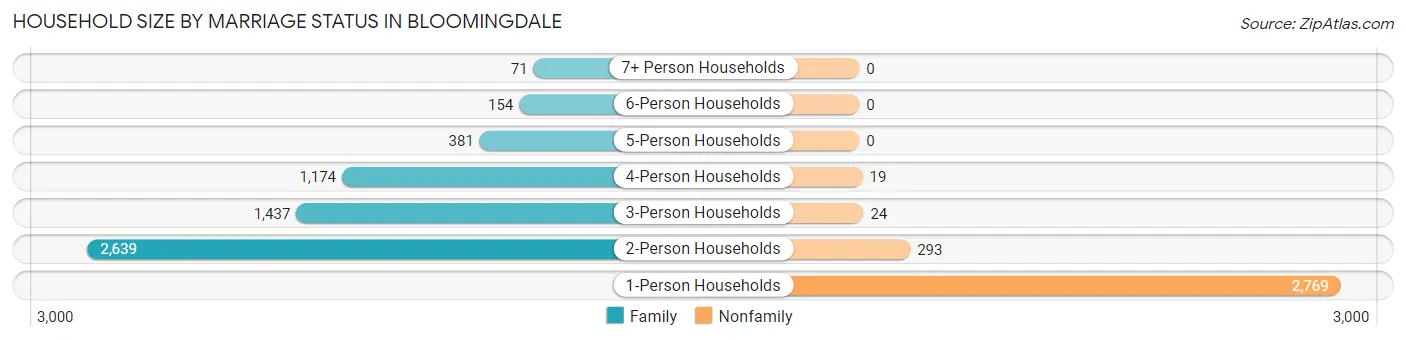
| Household Size | Family Households | Nonfamily Households |
| 1-Person Households | - | 2,769 (30.9%) |
| 2-Person Households | 2,639 (29.4%) | 293 (3.3%) |
| 3-Person Households | 1,437 (16.0%) | 24 (0.3%) |
| 4-Person Households | 1,174 (13.1%) | 19 (0.2%) |
| 5-Person Households | 381 (4.3%) | 0 (0.0%) |
| 6-Person Households | 154 (1.7%) | 0 (0.0%) |
| 7+ Person Households | 71 (0.8%) | 0 (0.0%) |
| Total | 5,856 (65.3%) | 3,105 (34.6%) |
Female Fertility in Bloomingdale
Fertility by Age in Bloomingdale
Average fertility rate in Bloomingdale is 47.0 births per 1,000 women. Women in the age bracket of 20 to 34 years have the highest fertility rate with 62.0 births per 1,000 women. Women in the age bracket of 20 to 34 years acount for 51.4% of all women with births.
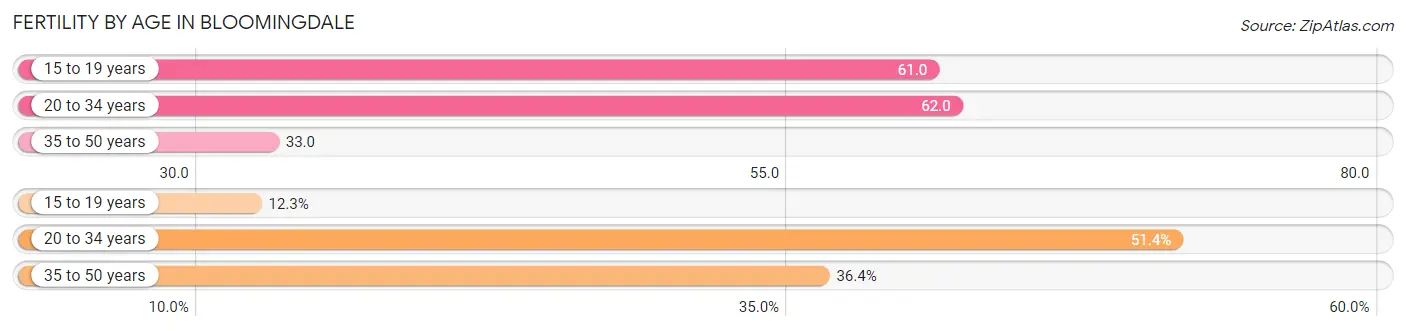
| Age Bracket | Women with Births | Births / 1,000 Women |
| 15 to 19 years | 27 (12.3%) | 61.0 |
| 20 to 34 years | 113 (51.4%) | 62.0 |
| 35 to 50 years | 80 (36.4%) | 33.0 |
| Total | 220 (100.0%) | 47.0 |
Fertility by Age by Marriage Status in Bloomingdale
79.1% of women with births (220) in Bloomingdale are married. The highest percentage of unmarried women with births falls into 15 to 19 years age bracket with 100.0% of them unmarried at the time of birth, while the lowest percentage of unmarried women with births belong to 20 to 34 years age bracket with 6.2% of them unmarried.
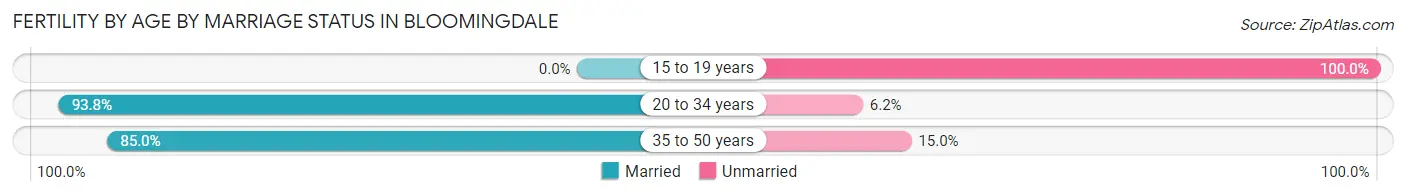
| Age Bracket | Married | Unmarried |
| 15 to 19 years | 0 (0.0%) | 27 (100.0%) |
| 20 to 34 years | 106 (93.8%) | 7 (6.2%) |
| 35 to 50 years | 68 (85.0%) | 12 (15.0%) |
| Total | 174 (79.1%) | 46 (20.9%) |
Fertility by Education in Bloomingdale
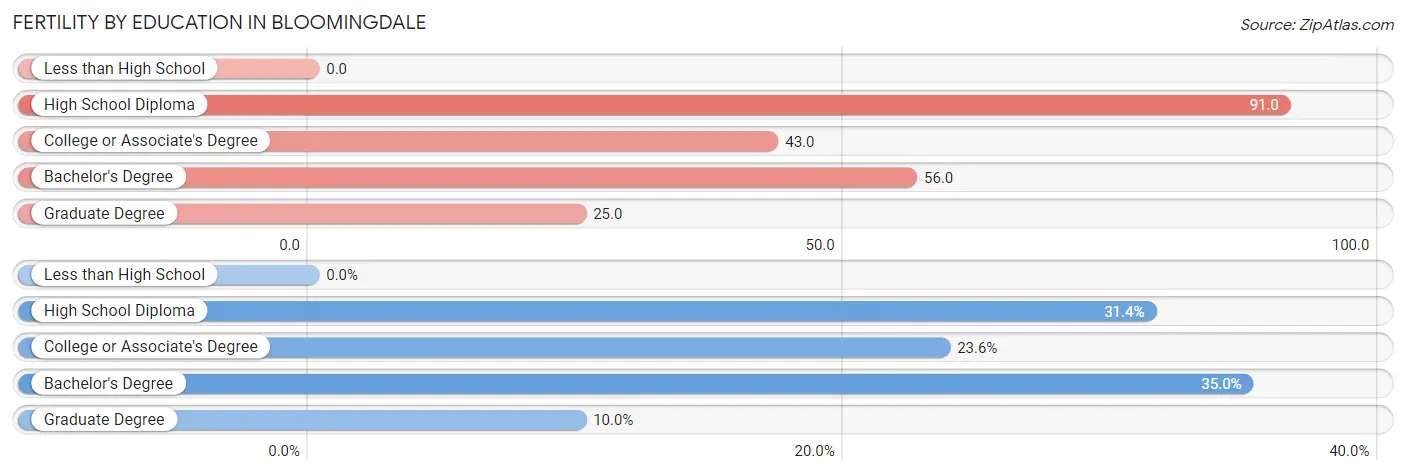
| Educational Attainment | Women with Births | Births / 1,000 Women |
| Less than High School | 0 (0.0%) | 0.0 |
| High School Diploma | 69 (31.4%) | 91.0 |
| College or Associate's Degree | 52 (23.6%) | 43.0 |
| Bachelor's Degree | 77 (35.0%) | 56.0 |
| Graduate Degree | 22 (10.0%) | 25.0 |
| Total | 220 (100.0%) | 47.0 |
Fertility by Education by Marriage Status in Bloomingdale
20.9% of women with births in Bloomingdale are unmarried. Women with the educational attainment of bachelor's degree are most likely to be married with 100.0% of them married at childbirth, while women with the educational attainment of high school diploma are least likely to be married with 43.5% of them unmarried at childbirth.
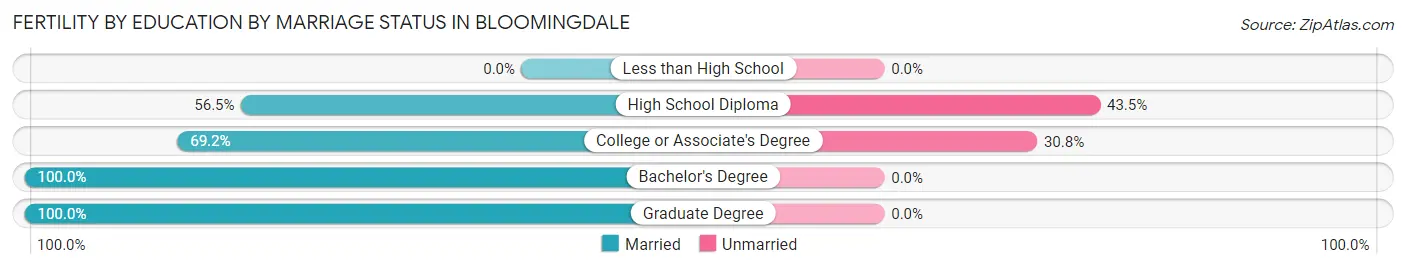
| Educational Attainment | Married | Unmarried |
| Less than High School | 0 (0.0%) | 0 (0.0%) |
| High School Diploma | 39 (56.5%) | 30 (43.5%) |
| College or Associate's Degree | 36 (69.2%) | 16 (30.8%) |
| Bachelor's Degree | 77 (100.0%) | 0 (0.0%) |
| Graduate Degree | 22 (100.0%) | 0 (0.0%) |
| Total | 174 (79.1%) | 46 (20.9%) |
Employment Characteristics in Bloomingdale
Employment by Class of Employer in Bloomingdale
Among the 11,391 employed individuals in Bloomingdale, private company employees (8,594 | 75.4%), self-employed (incorporated) (852 | 7.5%), and not-for-profit organizations (592 | 5.2%) make up the most common classes of employment.
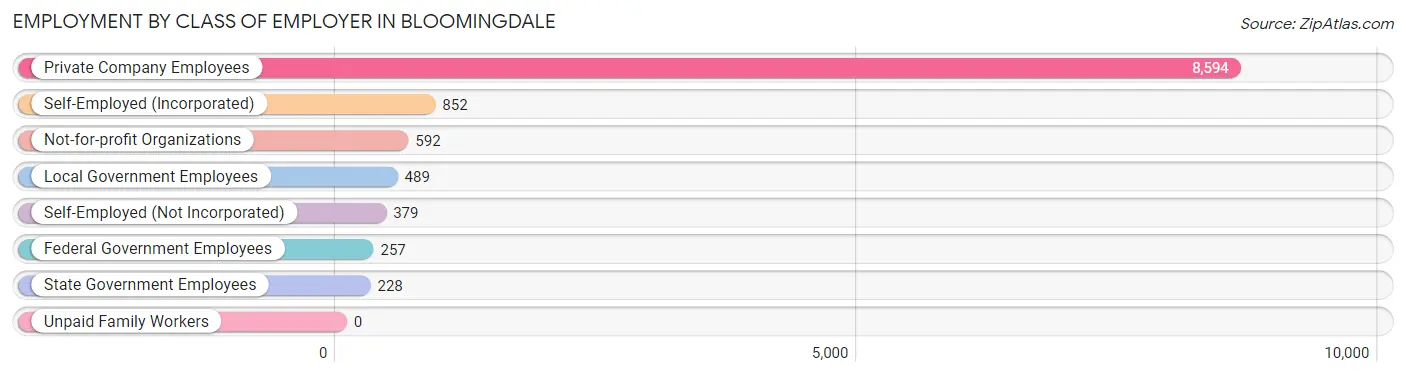
| Employer Class | # Employees | % Employees |
| Private Company Employees | 8,594 | 75.4% |
| Self-Employed (Incorporated) | 852 | 7.5% |
| Self-Employed (Not Incorporated) | 379 | 3.3% |
| Not-for-profit Organizations | 592 | 5.2% |
| Local Government Employees | 489 | 4.3% |
| State Government Employees | 228 | 2.0% |
| Federal Government Employees | 257 | 2.3% |
| Unpaid Family Workers | 0 | 0.0% |
| Total | 11,391 | 100.0% |
Employment Status by Age in Bloomingdale
According to the labor force statistics for Bloomingdale, out of the total population over 16 years of age (18,402), 65.1% or 11,980 individuals are in the labor force, with 3.9% or 467 of them unemployed. The age group with the highest labor force participation rate is 35 to 44 years, with 91.7% or 3,142 individuals in the labor force. Within the labor force, the 45 to 54 years age range has the highest percentage of unemployed individuals, with 10.4% or 232 of them being unemployed.
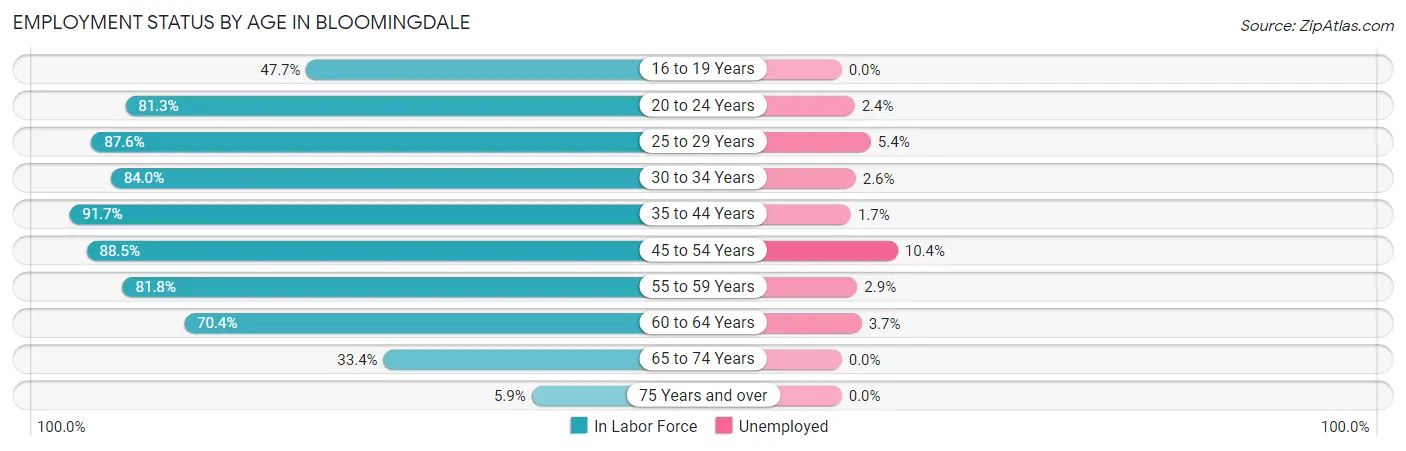
| Age Bracket | In Labor Force | Unemployed |
| 16 to 19 Years | 253 (47.7%) | 0 (0.0%) |
| 20 to 24 Years | 837 (81.3%) | 20 (2.4%) |
| 25 to 29 Years | 1,120 (87.6%) | 60 (5.4%) |
| 30 to 34 Years | 1,096 (84.0%) | 28 (2.6%) |
| 35 to 44 Years | 3,142 (91.7%) | 53 (1.7%) |
| 45 to 54 Years | 2,234 (88.5%) | 232 (10.4%) |
| 55 to 59 Years | 922 (81.8%) | 27 (2.9%) |
| 60 to 64 Years | 1,234 (70.4%) | 46 (3.7%) |
| 65 to 74 Years | 1,007 (33.4%) | 0 (0.0%) |
| 75 Years and over | 142 (5.9%) | 0 (0.0%) |
| Total | 11,980 (65.1%) | 467 (3.9%) |
Employment Status by Educational Attainment in Bloomingdale
According to labor force statistics for Bloomingdale, 85.4% of individuals (9,748) out of the total population between 25 and 64 years of age (11,414) are in the labor force, with 4.6% or 448 of them being unemployed. The group with the highest labor force participation rate are those with the educational attainment of bachelor's degree or higher, with 89.4% or 4,968 individuals in the labor force. Within the labor force, individuals with less than high school education have the highest percentage of unemployment, with 8.1% or 42 of them being unemployed.
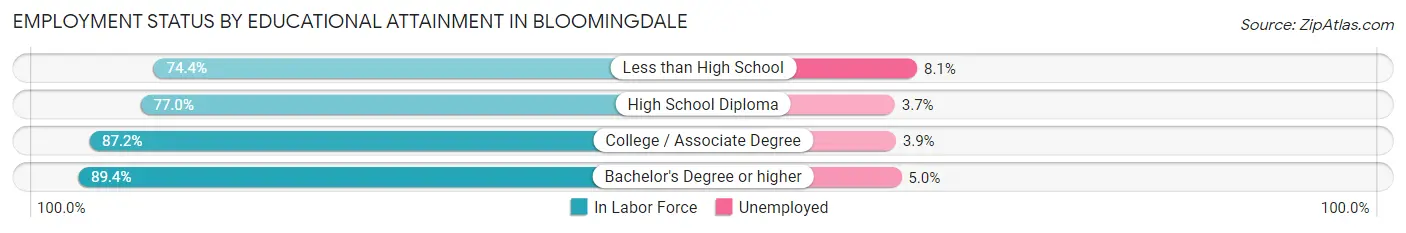
| Educational Attainment | In Labor Force | Unemployed |
| Less than High School | 519 (74.4%) | 57 (8.1%) |
| High School Diploma | 1,798 (77.0%) | 86 (3.7%) |
| College / Associate Degree | 2,463 (87.2%) | 110 (3.9%) |
| Bachelor's Degree or higher | 4,968 (89.4%) | 278 (5.0%) |
| Total | 9,748 (85.4%) | 525 (4.6%) |
Employment Occupations by Sex in Bloomingdale
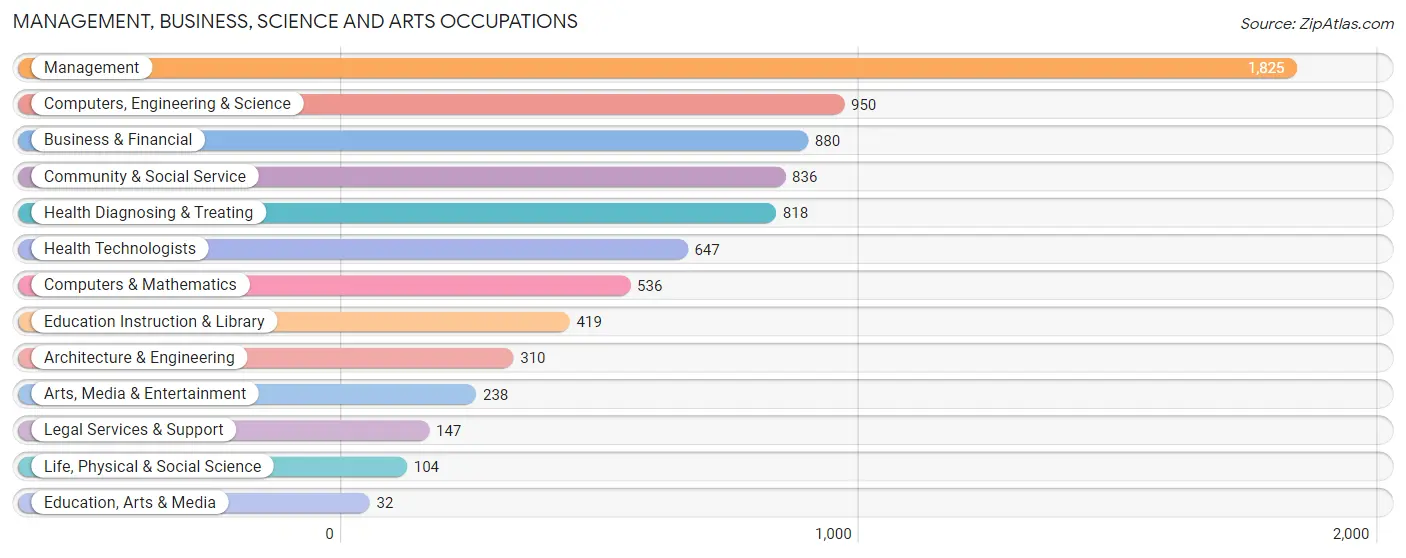
Management, Business, Science and Arts Occupations
The most common Management, Business, Science and Arts occupations in Bloomingdale are Management (1,825 | 15.8%), Computers, Engineering & Science (950 | 8.3%), Business & Financial (880 | 7.6%), Community & Social Service (836 | 7.3%), and Health Diagnosing & Treating (818 | 7.1%).
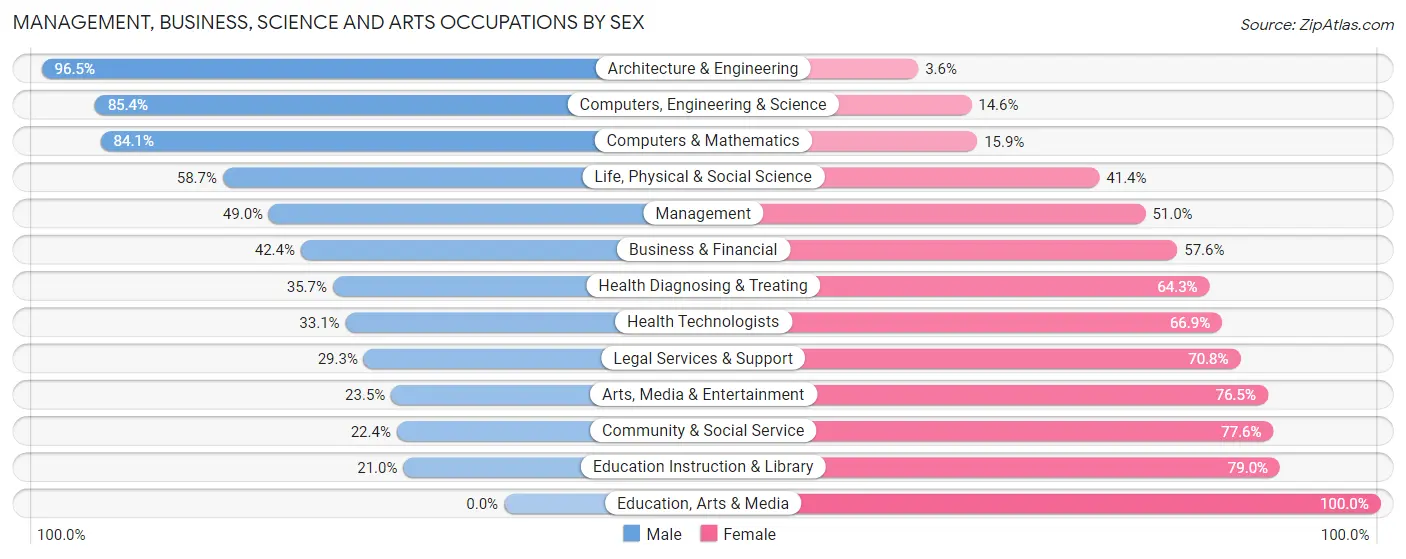
Management, Business, Science and Arts Occupations by Sex
Within the Management, Business, Science and Arts occupations in Bloomingdale, the most male-oriented occupations are Architecture & Engineering (96.5%), Computers, Engineering & Science (85.4%), and Computers & Mathematics (84.1%), while the most female-oriented occupations are Education, Arts & Media (100.0%), Education Instruction & Library (79.0%), and Community & Social Service (77.6%).
| Occupation | Male | Female |
| Management | 895 (49.0%) | 930 (51.0%) |
| Business & Financial | 373 (42.4%) | 507 (57.6%) |
| Computers, Engineering & Science | 811 (85.4%) | 139 (14.6%) |
| Computers & Mathematics | 451 (84.1%) | 85 (15.9%) |
| Architecture & Engineering | 299 (96.5%) | 11 (3.5%) |
| Life, Physical & Social Science | 61 (58.7%) | 43 (41.3%) |
| Community & Social Service | 187 (22.4%) | 649 (77.6%) |
| Education, Arts & Media | 0 (0.0%) | 32 (100.0%) |
| Legal Services & Support | 43 (29.2%) | 104 (70.8%) |
| Education Instruction & Library | 88 (21.0%) | 331 (79.0%) |
| Arts, Media & Entertainment | 56 (23.5%) | 182 (76.5%) |
| Health Diagnosing & Treating | 292 (35.7%) | 526 (64.3%) |
| Health Technologists | 214 (33.1%) | 433 (66.9%) |
| Total (Category) | 2,558 (48.2%) | 2,751 (51.8%) |
| Total (Overall) | 6,139 (53.3%) | 5,379 (46.7%) |
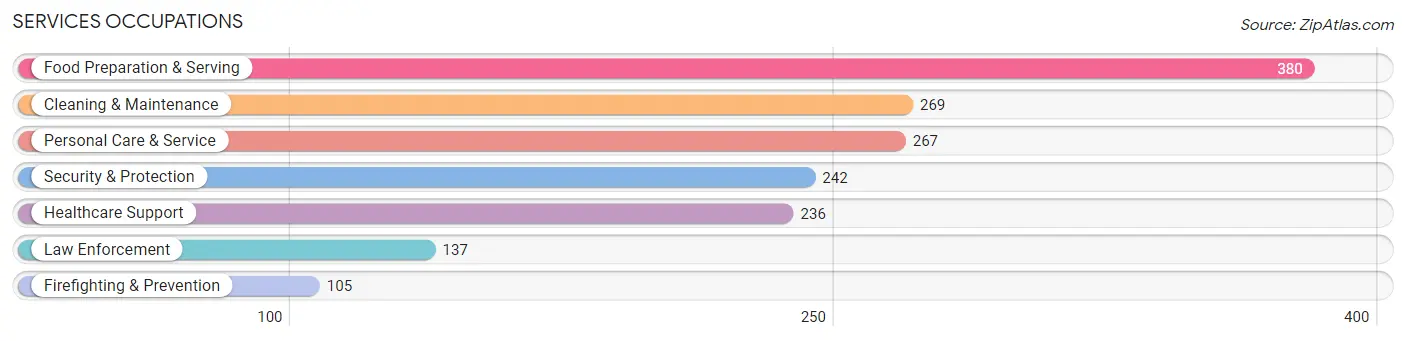
Services Occupations
The most common Services occupations in Bloomingdale are Food Preparation & Serving (380 | 3.3%), Cleaning & Maintenance (269 | 2.3%), Personal Care & Service (267 | 2.3%), Security & Protection (242 | 2.1%), and Healthcare Support (236 | 2.1%).
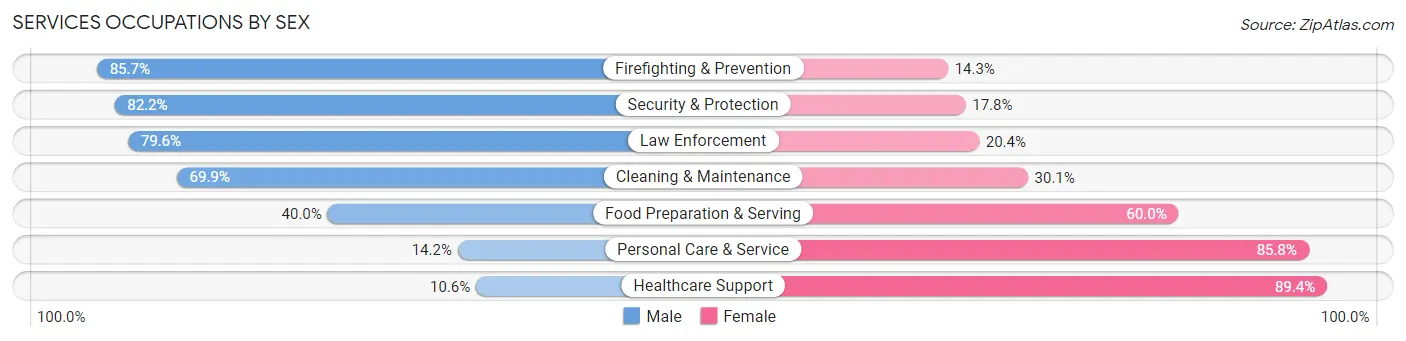
Services Occupations by Sex
Within the Services occupations in Bloomingdale, the most male-oriented occupations are Firefighting & Prevention (85.7%), Security & Protection (82.2%), and Law Enforcement (79.6%), while the most female-oriented occupations are Healthcare Support (89.4%), Personal Care & Service (85.8%), and Food Preparation & Serving (60.0%).
| Occupation | Male | Female |
| Healthcare Support | 25 (10.6%) | 211 (89.4%) |
| Security & Protection | 199 (82.2%) | 43 (17.8%) |
| Firefighting & Prevention | 90 (85.7%) | 15 (14.3%) |
| Law Enforcement | 109 (79.6%) | 28 (20.4%) |
| Food Preparation & Serving | 152 (40.0%) | 228 (60.0%) |
| Cleaning & Maintenance | 188 (69.9%) | 81 (30.1%) |
| Personal Care & Service | 38 (14.2%) | 229 (85.8%) |
| Total (Category) | 602 (43.2%) | 792 (56.8%) |
| Total (Overall) | 6,139 (53.3%) | 5,379 (46.7%) |
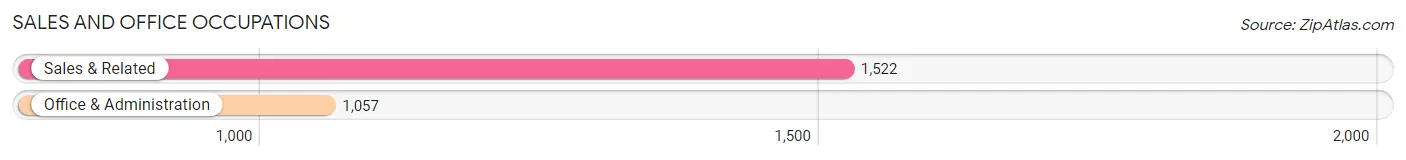
Sales and Office Occupations
The most common Sales and Office occupations in Bloomingdale are Sales & Related (1,522 | 13.2%), and Office & Administration (1,057 | 9.2%).
Sales and Office Occupations by Sex
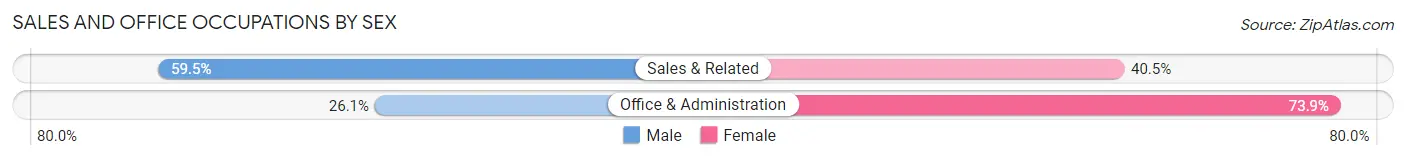
| Occupation | Male | Female |
| Sales & Related | 905 (59.5%) | 617 (40.5%) |
| Office & Administration | 276 (26.1%) | 781 (73.9%) |
| Total (Category) | 1,181 (45.8%) | 1,398 (54.2%) |
| Total (Overall) | 6,139 (53.3%) | 5,379 (46.7%) |
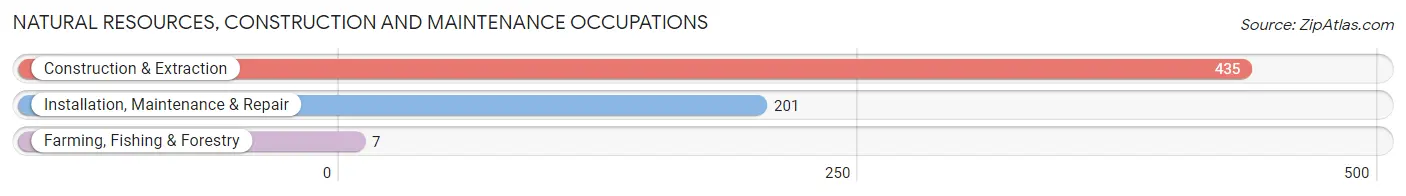
Natural Resources, Construction and Maintenance Occupations
The most common Natural Resources, Construction and Maintenance occupations in Bloomingdale are Construction & Extraction (435 | 3.8%), Installation, Maintenance & Repair (201 | 1.8%), and Farming, Fishing & Forestry (7 | 0.1%).
Natural Resources, Construction and Maintenance Occupations by Sex
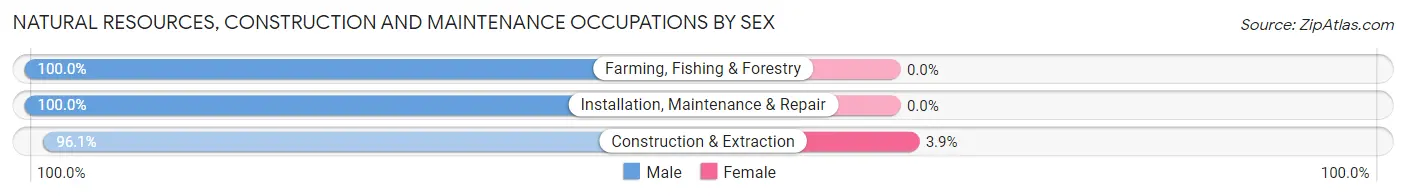
| Occupation | Male | Female |
| Farming, Fishing & Forestry | 7 (100.0%) | 0 (0.0%) |
| Construction & Extraction | 418 (96.1%) | 17 (3.9%) |
| Installation, Maintenance & Repair | 201 (100.0%) | 0 (0.0%) |
| Total (Category) | 626 (97.4%) | 17 (2.6%) |
| Total (Overall) | 6,139 (53.3%) | 5,379 (46.7%) |
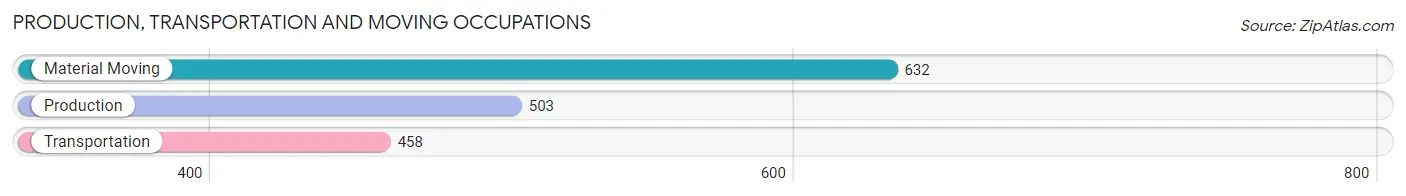
Production, Transportation and Moving Occupations
The most common Production, Transportation and Moving occupations in Bloomingdale are Material Moving (632 | 5.5%), Production (503 | 4.4%), and Transportation (458 | 4.0%).
Production, Transportation and Moving Occupations by Sex
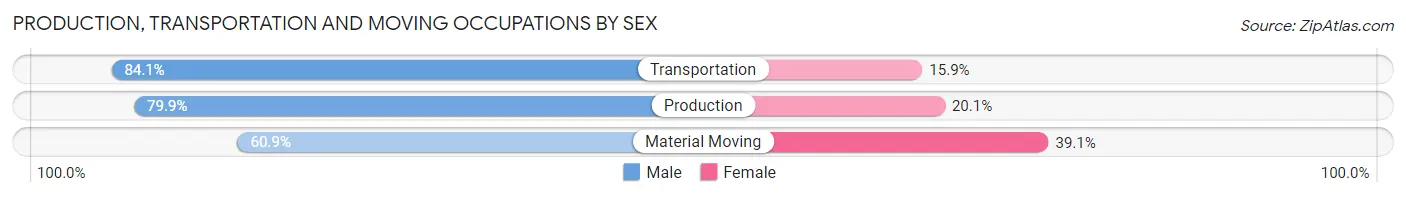
| Occupation | Male | Female |
| Production | 402 (79.9%) | 101 (20.1%) |
| Transportation | 385 (84.1%) | 73 (15.9%) |
| Material Moving | 385 (60.9%) | 247 (39.1%) |
| Total (Category) | 1,172 (73.6%) | 421 (26.4%) |
| Total (Overall) | 6,139 (53.3%) | 5,379 (46.7%) |
Employment Industries by Sex in Bloomingdale
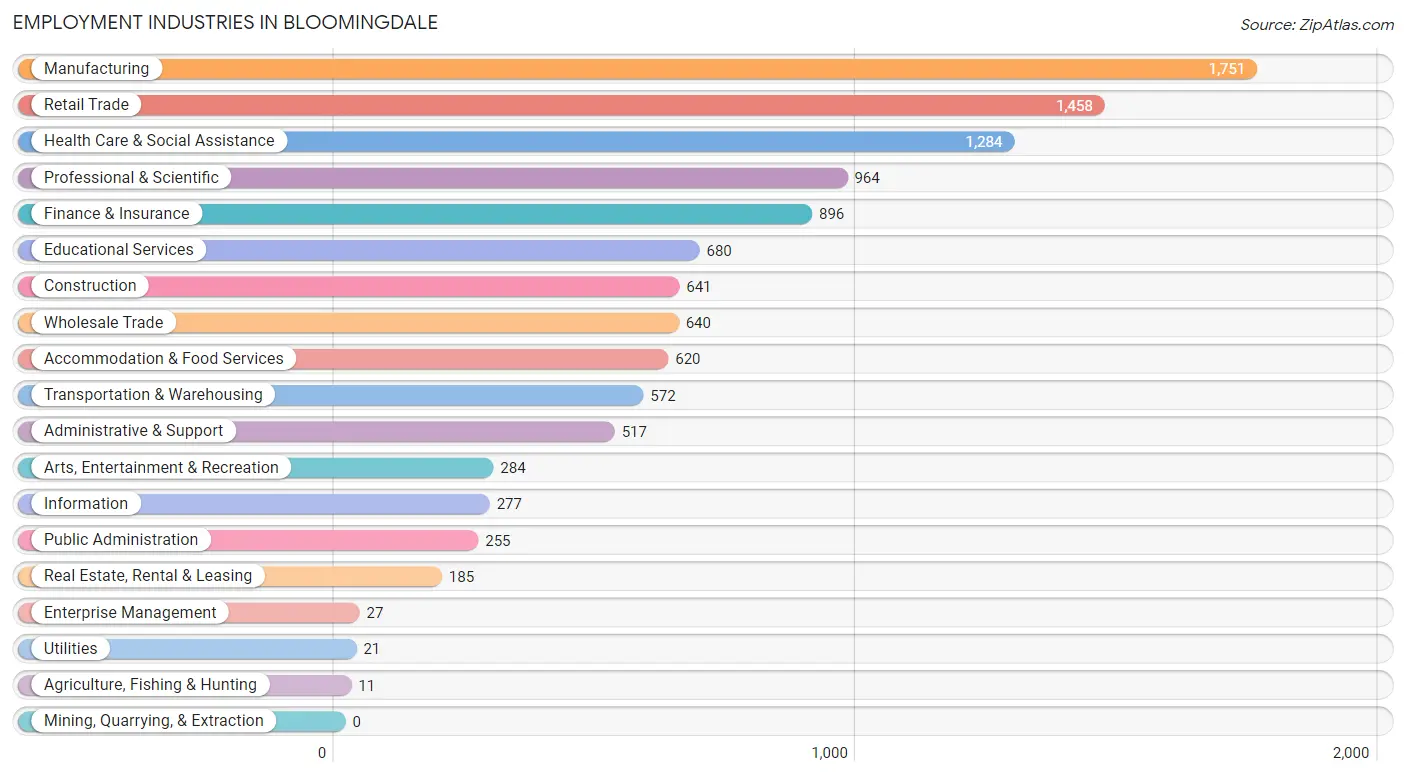
Employment Industries in Bloomingdale
The major employment industries in Bloomingdale include Manufacturing (1,751 | 15.2%), Retail Trade (1,458 | 12.7%), Health Care & Social Assistance (1,284 | 11.2%), Professional & Scientific (964 | 8.4%), and Finance & Insurance (896 | 7.8%).
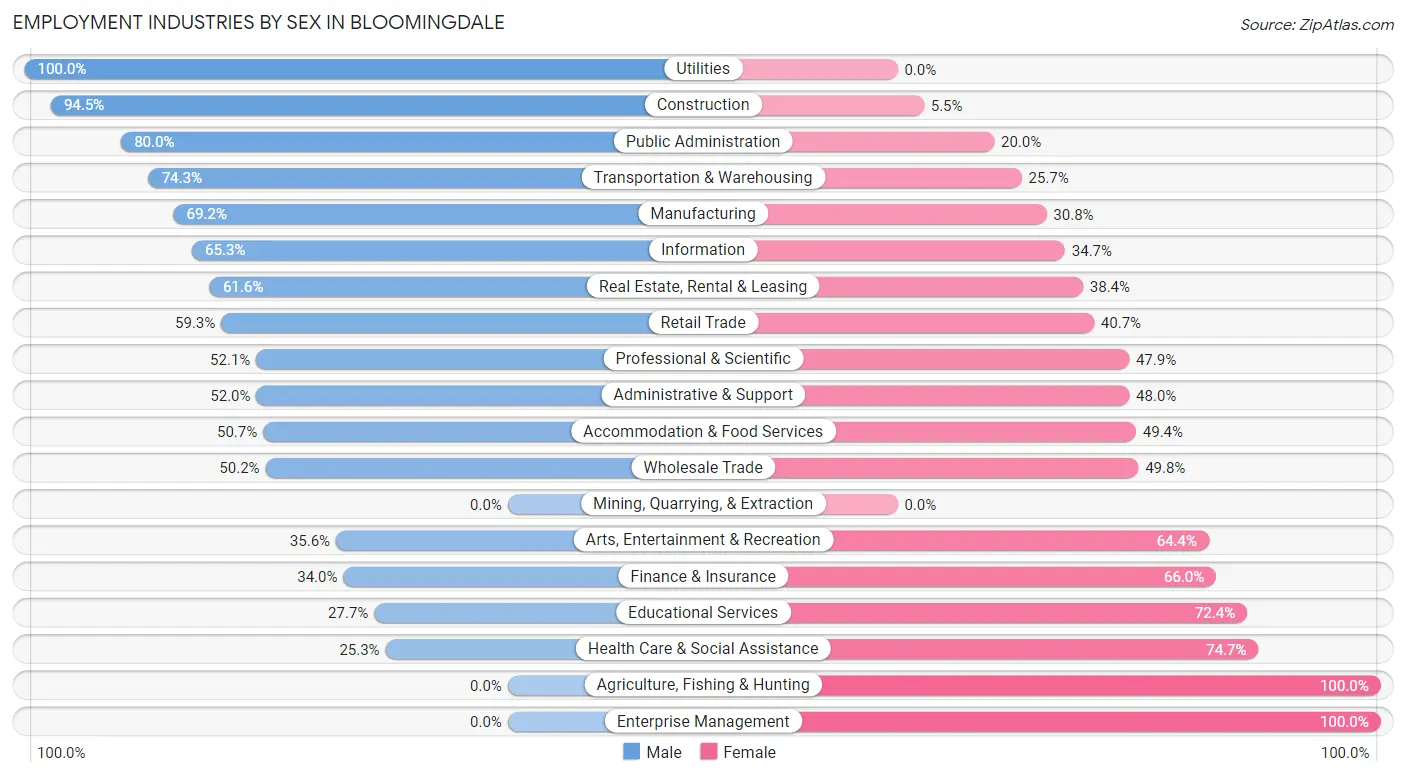
Employment Industries by Sex in Bloomingdale
The Bloomingdale industries that see more men than women are Utilities (100.0%), Construction (94.5%), and Public Administration (80.0%), whereas the industries that tend to have a higher number of women are Agriculture, Fishing & Hunting (100.0%), Enterprise Management (100.0%), and Health Care & Social Assistance (74.7%).
| Industry | Male | Female |
| Agriculture, Fishing & Hunting | 0 (0.0%) | 11 (100.0%) |
| Mining, Quarrying, & Extraction | 0 (0.0%) | 0 (0.0%) |
| Construction | 606 (94.5%) | 35 (5.5%) |
| Manufacturing | 1,211 (69.2%) | 540 (30.8%) |
| Wholesale Trade | 321 (50.2%) | 319 (49.8%) |
| Retail Trade | 865 (59.3%) | 593 (40.7%) |
| Transportation & Warehousing | 425 (74.3%) | 147 (25.7%) |
| Utilities | 21 (100.0%) | 0 (0.0%) |
| Information | 181 (65.3%) | 96 (34.7%) |
| Finance & Insurance | 305 (34.0%) | 591 (66.0%) |
| Real Estate, Rental & Leasing | 114 (61.6%) | 71 (38.4%) |
| Professional & Scientific | 502 (52.1%) | 462 (47.9%) |
| Enterprise Management | 0 (0.0%) | 27 (100.0%) |
| Administrative & Support | 269 (52.0%) | 248 (48.0%) |
| Educational Services | 188 (27.7%) | 492 (72.4%) |
| Health Care & Social Assistance | 325 (25.3%) | 959 (74.7%) |
| Arts, Entertainment & Recreation | 101 (35.6%) | 183 (64.4%) |
| Accommodation & Food Services | 314 (50.6%) | 306 (49.3%) |
| Public Administration | 204 (80.0%) | 51 (20.0%) |
| Total | 6,139 (53.3%) | 5,379 (46.7%) |
Education in Bloomingdale
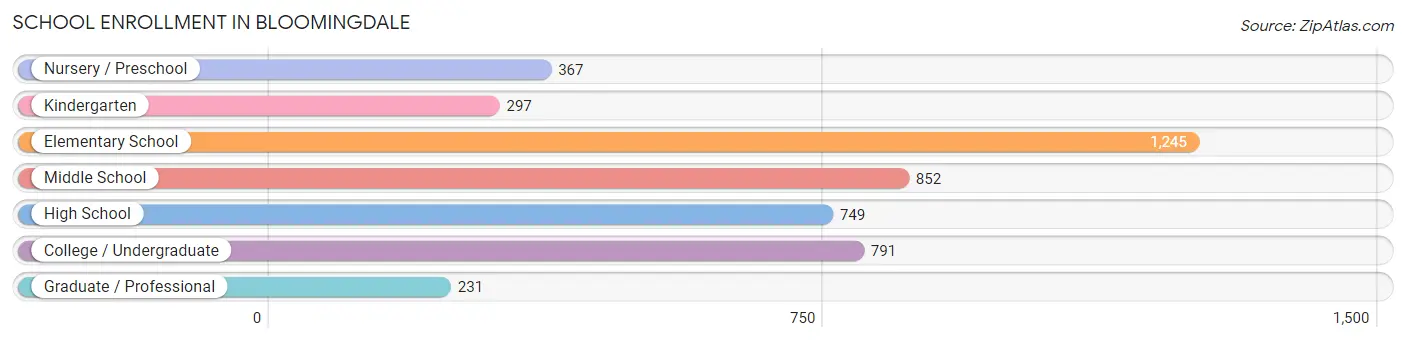
School Enrollment in Bloomingdale
The most common levels of schooling among the 4,532 students in Bloomingdale are elementary school (1,245 | 27.5%), middle school (852 | 18.8%), and college / undergraduate (791 | 17.4%).
| School Level | # Students | % Students |
| Nursery / Preschool | 367 | 8.1% |
| Kindergarten | 297 | 6.6% |
| Elementary School | 1,245 | 27.5% |
| Middle School | 852 | 18.8% |
| High School | 749 | 16.5% |
| College / Undergraduate | 791 | 17.4% |
| Graduate / Professional | 231 | 5.1% |
| Total | 4,532 | 100.0% |
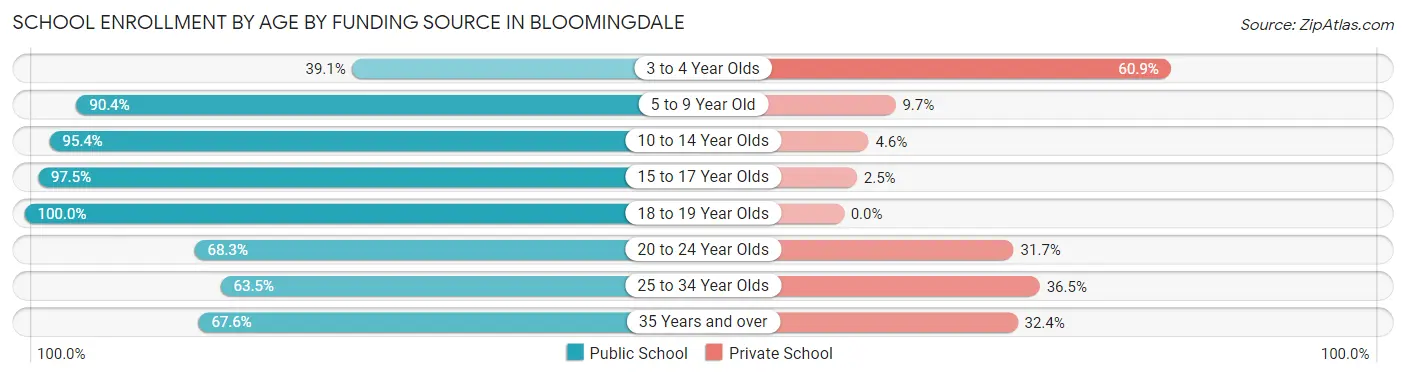
School Enrollment by Age by Funding Source in Bloomingdale
Out of a total of 4,532 students who are enrolled in schools in Bloomingdale, 698 (15.4%) attend a private institution, while the remaining 3,834 (84.6%) are enrolled in public schools. The age group of 3 to 4 year olds has the highest likelihood of being enrolled in private schools, with 162 (60.9% in the age bracket) enrolled. Conversely, the age group of 18 to 19 year olds has the lowest likelihood of being enrolled in a private school, with 144 (100.0% in the age bracket) attending a public institution.
| Age Bracket | Public School | Private School |
| 3 to 4 Year Olds | 104 (39.1%) | 162 (60.9%) |
| 5 to 9 Year Old | 1,385 (90.3%) | 148 (9.7%) |
| 10 to 14 Year Olds | 989 (95.4%) | 48 (4.6%) |
| 15 to 17 Year Olds | 555 (97.5%) | 14 (2.5%) |
| 18 to 19 Year Olds | 144 (100.0%) | 0 (0.0%) |
| 20 to 24 Year Olds | 326 (68.3%) | 151 (31.7%) |
| 25 to 34 Year Olds | 186 (63.5%) | 107 (36.5%) |
| 35 Years and over | 144 (67.6%) | 69 (32.4%) |
| Total | 3,834 (84.6%) | 698 (15.4%) |
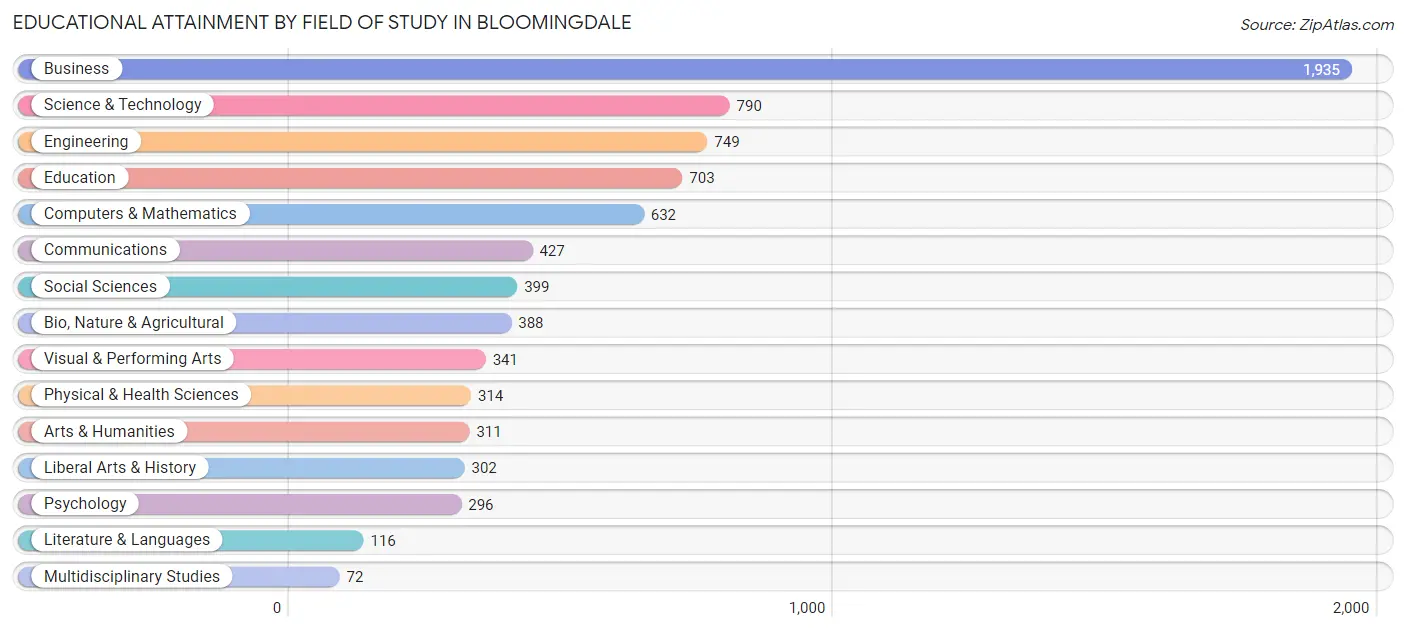
Educational Attainment by Field of Study in Bloomingdale
Business (1,935 | 24.9%), science & technology (790 | 10.2%), engineering (749 | 9.6%), education (703 | 9.0%), and computers & mathematics (632 | 8.1%) are the most common fields of study among 7,775 individuals in Bloomingdale who have obtained a bachelor's degree or higher.
| Field of Study | # Graduates | % Graduates |
| Computers & Mathematics | 632 | 8.1% |
| Bio, Nature & Agricultural | 388 | 5.0% |
| Physical & Health Sciences | 314 | 4.0% |
| Psychology | 296 | 3.8% |
| Social Sciences | 399 | 5.1% |
| Engineering | 749 | 9.6% |
| Multidisciplinary Studies | 72 | 0.9% |
| Science & Technology | 790 | 10.2% |
| Business | 1,935 | 24.9% |
| Education | 703 | 9.0% |
| Literature & Languages | 116 | 1.5% |
| Liberal Arts & History | 302 | 3.9% |
| Visual & Performing Arts | 341 | 4.4% |
| Communications | 427 | 5.5% |
| Arts & Humanities | 311 | 4.0% |
| Total | 7,775 | 100.0% |
Transportation & Commute in Bloomingdale
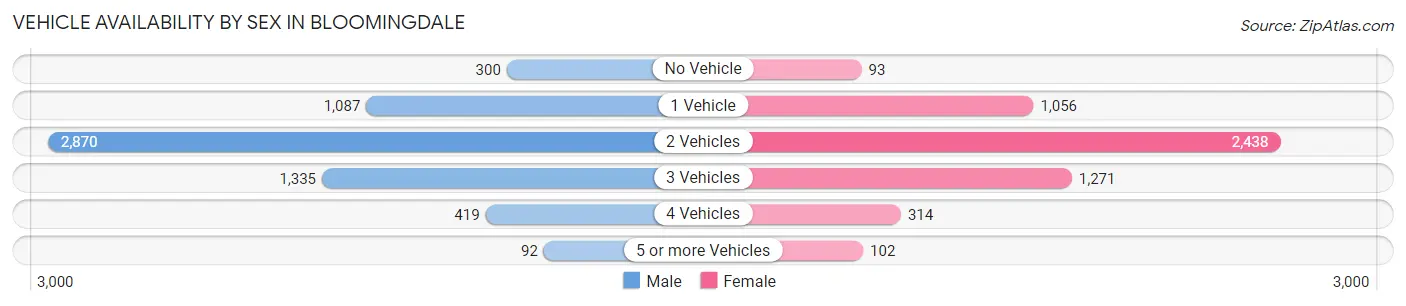
Vehicle Availability by Sex in Bloomingdale
The most prevalent vehicle ownership categories in Bloomingdale are males with 2 vehicles (2,870, accounting for 47.0%) and females with 2 vehicles (2,438, making up 54.4%).
| Vehicles Available | Male | Female |
| No Vehicle | 300 (4.9%) | 93 (1.8%) |
| 1 Vehicle | 1,087 (17.8%) | 1,056 (20.0%) |
| 2 Vehicles | 2,870 (47.0%) | 2,438 (46.2%) |
| 3 Vehicles | 1,335 (21.9%) | 1,271 (24.1%) |
| 4 Vehicles | 419 (6.9%) | 314 (5.9%) |
| 5 or more Vehicles | 92 (1.5%) | 102 (1.9%) |
| Total | 6,103 (100.0%) | 5,274 (100.0%) |
Commute Time in Bloomingdale
The most frequently occuring commute durations in Bloomingdale are 30 to 34 minutes (1,630 commuters, 16.7%), 10 to 14 minutes (1,312 commuters, 13.5%), and 15 to 19 minutes (1,174 commuters, 12.0%).
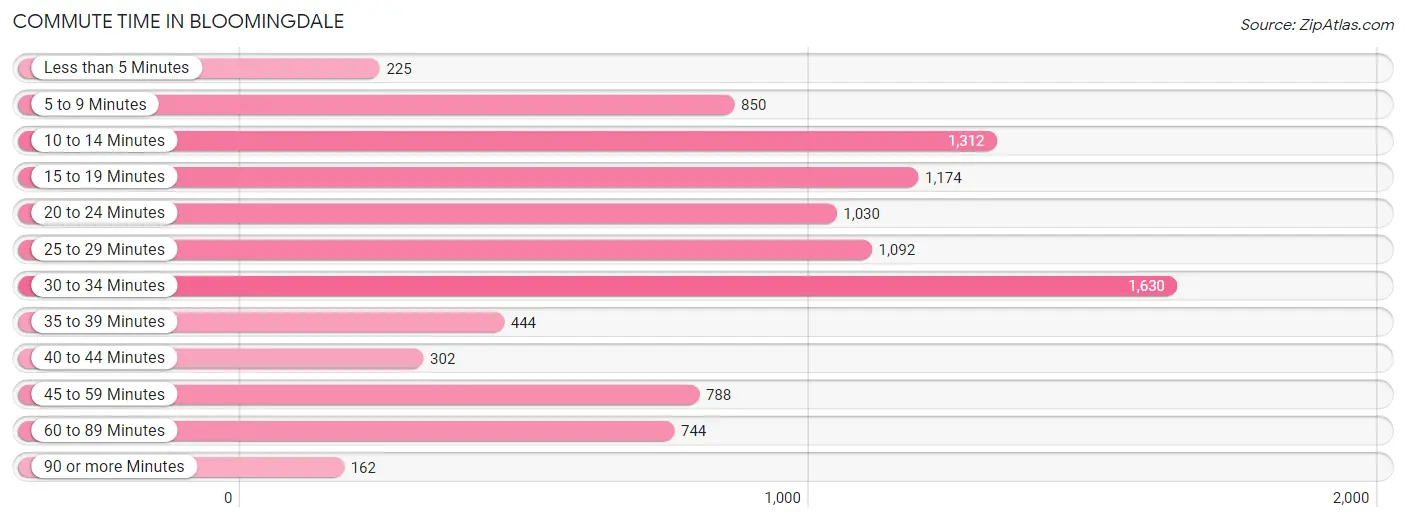
| Commute Time | # Commuters | % Commuters |
| Less than 5 Minutes | 225 | 2.3% |
| 5 to 9 Minutes | 850 | 8.7% |
| 10 to 14 Minutes | 1,312 | 13.5% |
| 15 to 19 Minutes | 1,174 | 12.0% |
| 20 to 24 Minutes | 1,030 | 10.6% |
| 25 to 29 Minutes | 1,092 | 11.2% |
| 30 to 34 Minutes | 1,630 | 16.7% |
| 35 to 39 Minutes | 444 | 4.5% |
| 40 to 44 Minutes | 302 | 3.1% |
| 45 to 59 Minutes | 788 | 8.1% |
| 60 to 89 Minutes | 744 | 7.6% |
| 90 or more Minutes | 162 | 1.7% |
Commute Time by Sex in Bloomingdale
The most common commute times in Bloomingdale are 30 to 34 minutes (846 commuters, 15.6%) for males and 30 to 34 minutes (784 commuters, 18.0%) for females.
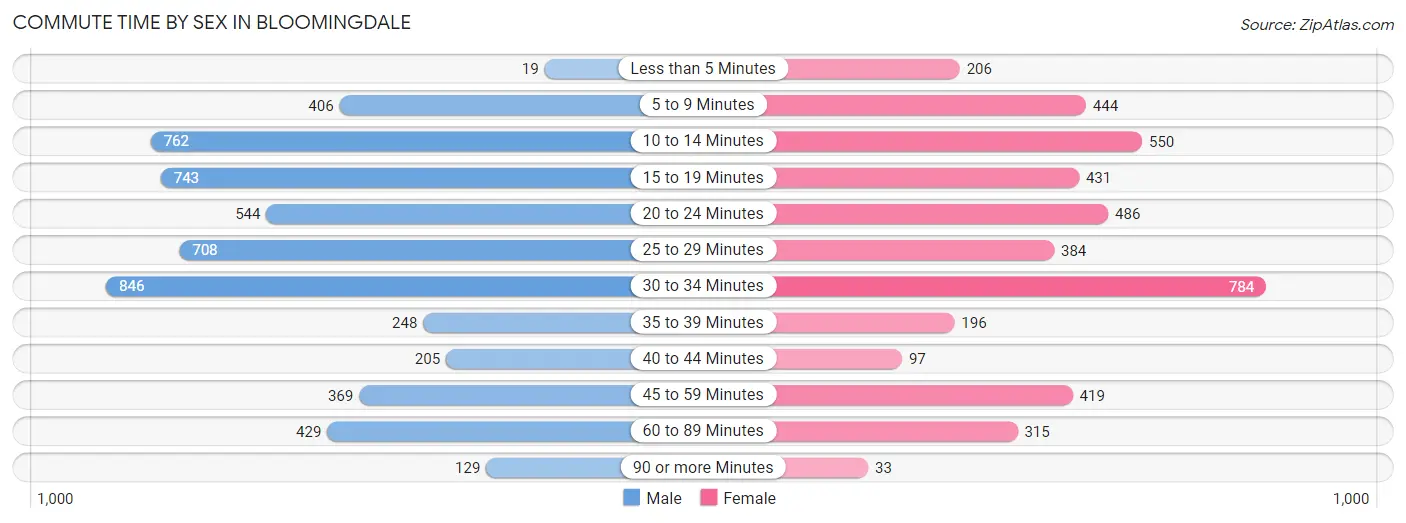
| Commute Time | Male | Female |
| Less than 5 Minutes | 19 (0.4%) | 206 (4.7%) |
| 5 to 9 Minutes | 406 (7.5%) | 444 (10.2%) |
| 10 to 14 Minutes | 762 (14.1%) | 550 (12.7%) |
| 15 to 19 Minutes | 743 (13.7%) | 431 (9.9%) |
| 20 to 24 Minutes | 544 (10.1%) | 486 (11.2%) |
| 25 to 29 Minutes | 708 (13.1%) | 384 (8.8%) |
| 30 to 34 Minutes | 846 (15.6%) | 784 (18.0%) |
| 35 to 39 Minutes | 248 (4.6%) | 196 (4.5%) |
| 40 to 44 Minutes | 205 (3.8%) | 97 (2.2%) |
| 45 to 59 Minutes | 369 (6.8%) | 419 (9.6%) |
| 60 to 89 Minutes | 429 (7.9%) | 315 (7.2%) |
| 90 or more Minutes | 129 (2.4%) | 33 (0.8%) |
Time of Departure to Work by Sex in Bloomingdale
The most frequent times of departure to work in Bloomingdale are 7:30 AM to 7:59 AM (730, 13.5%) for males and 7:00 AM to 7:29 AM (782, 18.0%) for females.
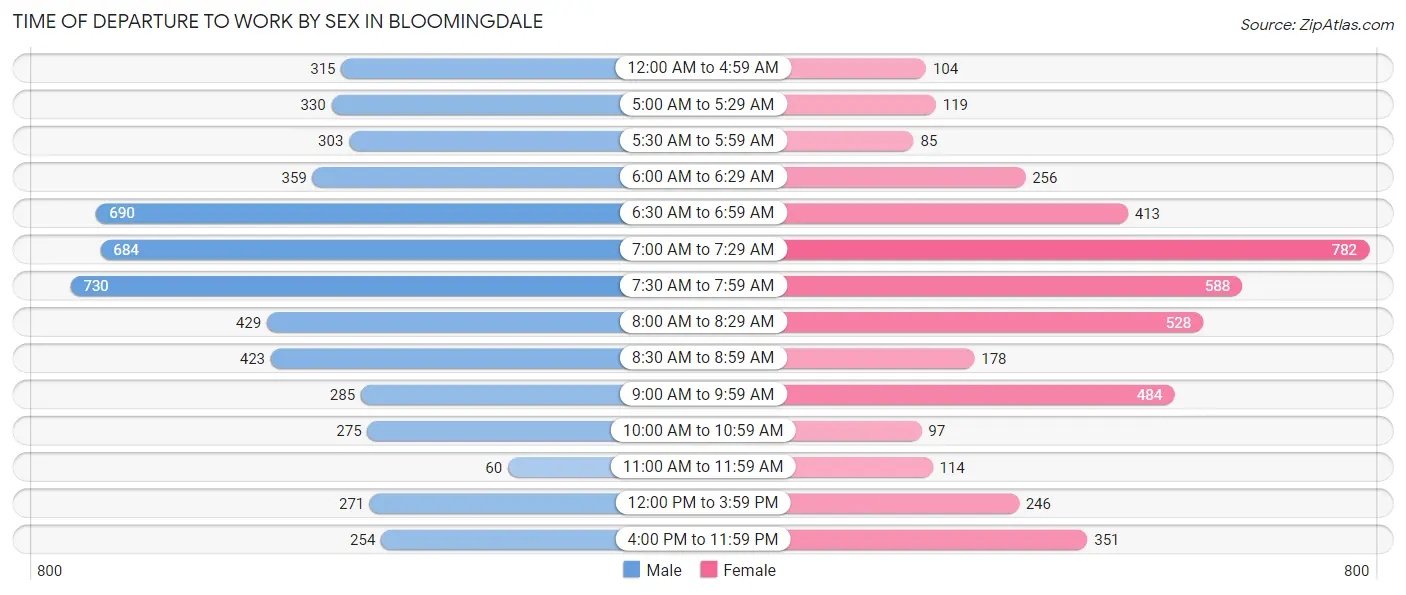
| Time of Departure | Male | Female |
| 12:00 AM to 4:59 AM | 315 (5.8%) | 104 (2.4%) |
| 5:00 AM to 5:29 AM | 330 (6.1%) | 119 (2.7%) |
| 5:30 AM to 5:59 AM | 303 (5.6%) | 85 (2.0%) |
| 6:00 AM to 6:29 AM | 359 (6.6%) | 256 (5.9%) |
| 6:30 AM to 6:59 AM | 690 (12.8%) | 413 (9.5%) |
| 7:00 AM to 7:29 AM | 684 (12.7%) | 782 (18.0%) |
| 7:30 AM to 7:59 AM | 730 (13.5%) | 588 (13.5%) |
| 8:00 AM to 8:29 AM | 429 (7.9%) | 528 (12.1%) |
| 8:30 AM to 8:59 AM | 423 (7.8%) | 178 (4.1%) |
| 9:00 AM to 9:59 AM | 285 (5.3%) | 484 (11.1%) |
| 10:00 AM to 10:59 AM | 275 (5.1%) | 97 (2.2%) |
| 11:00 AM to 11:59 AM | 60 (1.1%) | 114 (2.6%) |
| 12:00 PM to 3:59 PM | 271 (5.0%) | 246 (5.7%) |
| 4:00 PM to 11:59 PM | 254 (4.7%) | 351 (8.1%) |
| Total | 5,408 (100.0%) | 4,345 (100.0%) |
Housing Occupancy in Bloomingdale
Occupancy by Ownership in Bloomingdale
Of the total 8,961 dwellings in Bloomingdale, owner-occupied units account for 6,563 (73.2%), while renter-occupied units make up 2,398 (26.8%).
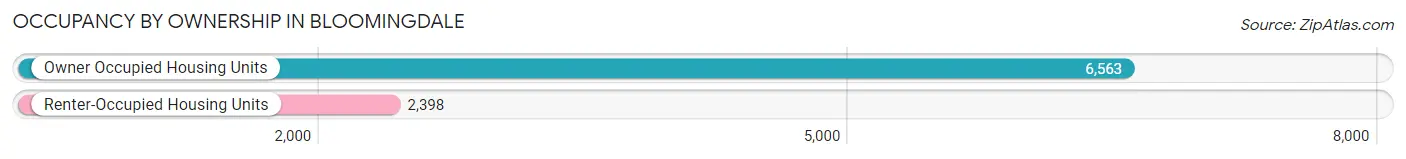
| Occupancy | # Housing Units | % Housing Units |
| Owner Occupied Housing Units | 6,563 | 73.2% |
| Renter-Occupied Housing Units | 2,398 | 26.8% |
| Total Occupied Housing Units | 8,961 | 100.0% |
Occupancy by Household Size in Bloomingdale
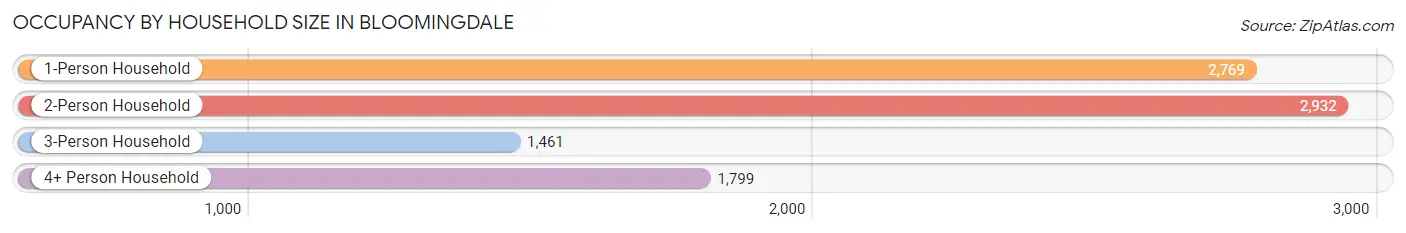
| Household Size | # Housing Units | % Housing Units |
| 1-Person Household | 2,769 | 30.9% |
| 2-Person Household | 2,932 | 32.7% |
| 3-Person Household | 1,461 | 16.3% |
| 4+ Person Household | 1,799 | 20.1% |
| Total Housing Units | 8,961 | 100.0% |
Occupancy by Ownership by Household Size in Bloomingdale
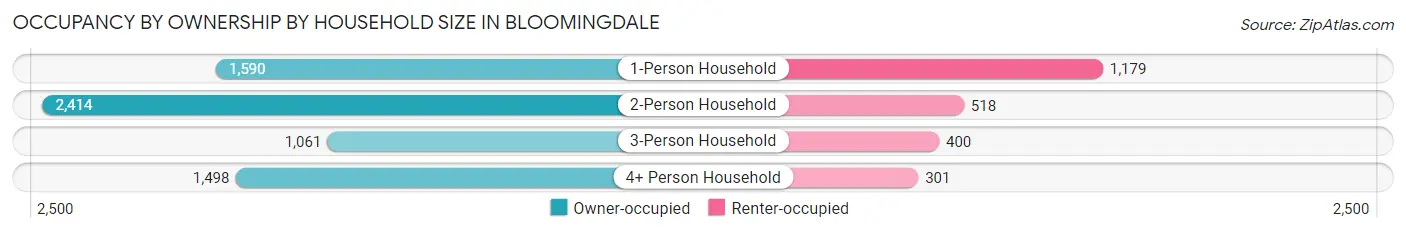
| Household Size | Owner-occupied | Renter-occupied |
| 1-Person Household | 1,590 (57.4%) | 1,179 (42.6%) |
| 2-Person Household | 2,414 (82.3%) | 518 (17.7%) |
| 3-Person Household | 1,061 (72.6%) | 400 (27.4%) |
| 4+ Person Household | 1,498 (83.3%) | 301 (16.7%) |
| Total Housing Units | 6,563 (73.2%) | 2,398 (26.8%) |
Occupancy by Educational Attainment in Bloomingdale
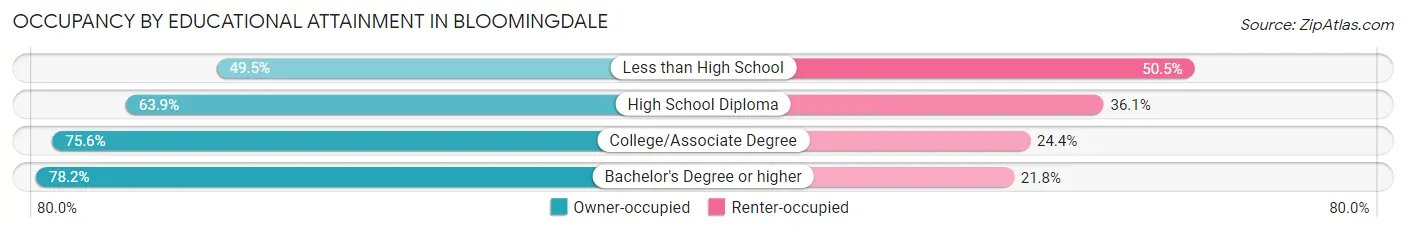
| Household Size | Owner-occupied | Renter-occupied |
| Less than High School | 210 (49.5%) | 214 (50.5%) |
| High School Diploma | 1,161 (63.9%) | 655 (36.1%) |
| College/Associate Degree | 1,815 (75.6%) | 586 (24.4%) |
| Bachelor's Degree or higher | 3,377 (78.2%) | 943 (21.8%) |
Occupancy by Age of Householder in Bloomingdale
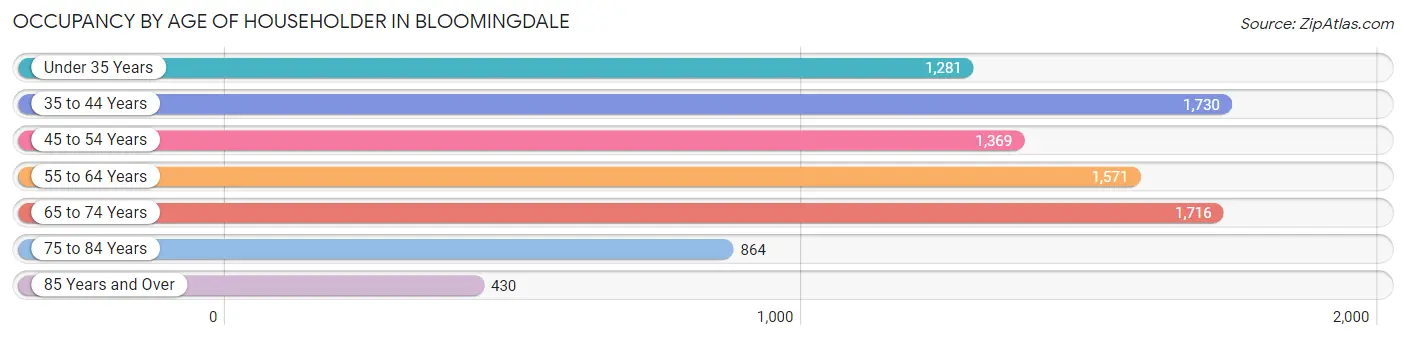
| Age Bracket | # Households | % Households |
| Under 35 Years | 1,281 | 14.3% |
| 35 to 44 Years | 1,730 | 19.3% |
| 45 to 54 Years | 1,369 | 15.3% |
| 55 to 64 Years | 1,571 | 17.5% |
| 65 to 74 Years | 1,716 | 19.2% |
| 75 to 84 Years | 864 | 9.6% |
| 85 Years and Over | 430 | 4.8% |
| Total | 8,961 | 100.0% |
Housing Finances in Bloomingdale
Median Income by Occupancy in Bloomingdale
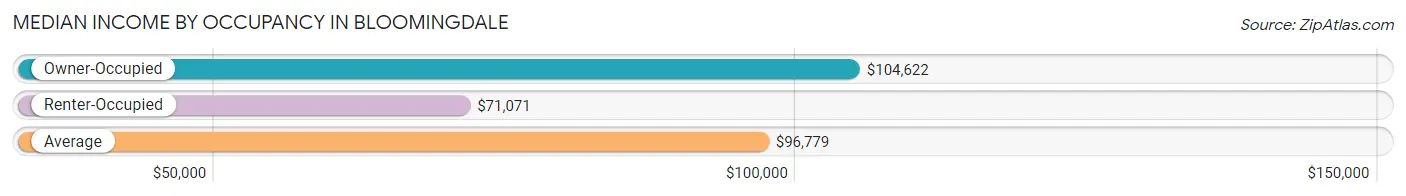
| Occupancy Type | # Households | Median Income |
| Owner-Occupied | 6,563 (73.2%) | $104,622 |
| Renter-Occupied | 2,398 (26.8%) | $71,071 |
| Average | 8,961 (100.0%) | $96,779 |
Occupancy by Householder Income Bracket in Bloomingdale
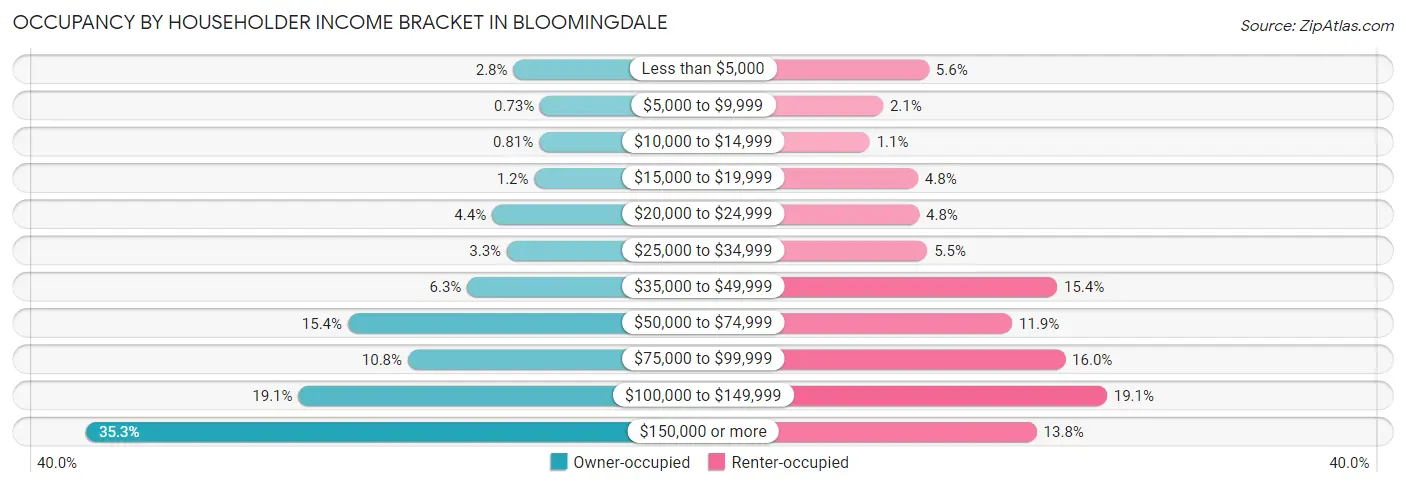
| Income Bracket | Owner-occupied | Renter-occupied |
| Less than $5,000 | 181 (2.8%) | 134 (5.6%) |
| $5,000 to $9,999 | 48 (0.7%) | 50 (2.1%) |
| $10,000 to $14,999 | 53 (0.8%) | 26 (1.1%) |
| $15,000 to $19,999 | 76 (1.2%) | 114 (4.8%) |
| $20,000 to $24,999 | 288 (4.4%) | 116 (4.8%) |
| $25,000 to $34,999 | 213 (3.3%) | 131 (5.5%) |
| $35,000 to $49,999 | 412 (6.3%) | 368 (15.3%) |
| $50,000 to $74,999 | 1,009 (15.4%) | 286 (11.9%) |
| $75,000 to $99,999 | 709 (10.8%) | 383 (16.0%) |
| $100,000 to $149,999 | 1,256 (19.1%) | 459 (19.1%) |
| $150,000 or more | 2,318 (35.3%) | 331 (13.8%) |
| Total | 6,563 (100.0%) | 2,398 (100.0%) |
Monthly Housing Cost Tiers in Bloomingdale
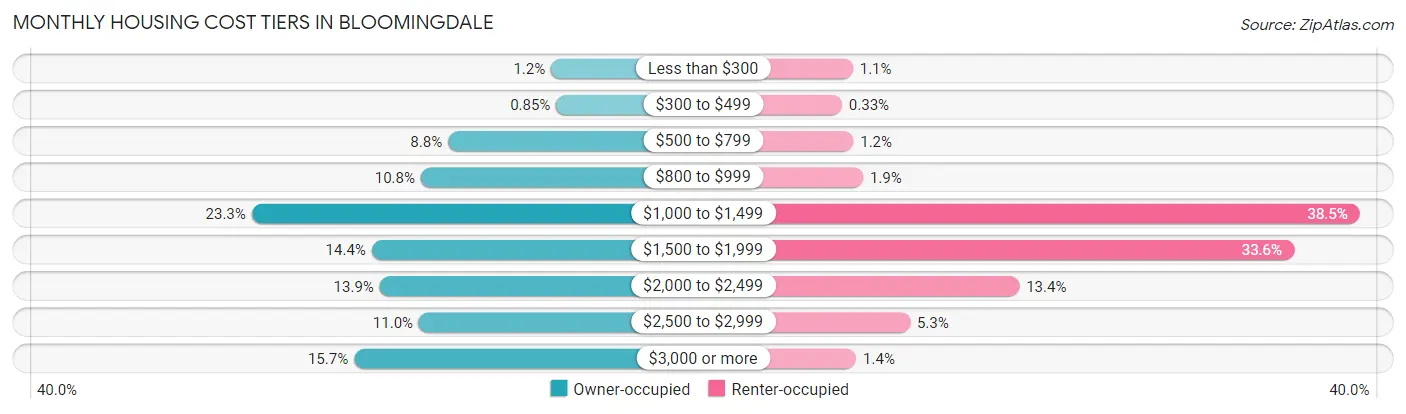
| Monthly Cost | Owner-occupied | Renter-occupied |
| Less than $300 | 81 (1.2%) | 27 (1.1%) |
| $300 to $499 | 56 (0.9%) | 8 (0.3%) |
| $500 to $799 | 579 (8.8%) | 28 (1.2%) |
| $800 to $999 | 710 (10.8%) | 45 (1.9%) |
| $1,000 to $1,499 | 1,528 (23.3%) | 922 (38.5%) |
| $1,500 to $1,999 | 948 (14.4%) | 806 (33.6%) |
| $2,000 to $2,499 | 909 (13.9%) | 321 (13.4%) |
| $2,500 to $2,999 | 719 (11.0%) | 128 (5.3%) |
| $3,000 or more | 1,033 (15.7%) | 33 (1.4%) |
| Total | 6,563 (100.0%) | 2,398 (100.0%) |
Physical Housing Characteristics in Bloomingdale
Housing Structures in Bloomingdale
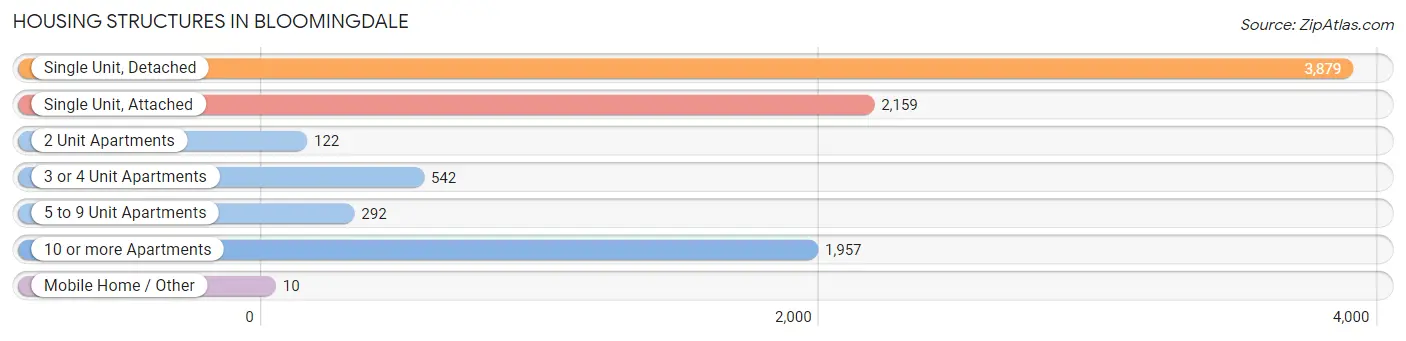
| Structure Type | # Housing Units | % Housing Units |
| Single Unit, Detached | 3,879 | 43.3% |
| Single Unit, Attached | 2,159 | 24.1% |
| 2 Unit Apartments | 122 | 1.4% |
| 3 or 4 Unit Apartments | 542 | 6.0% |
| 5 to 9 Unit Apartments | 292 | 3.3% |
| 10 or more Apartments | 1,957 | 21.8% |
| Mobile Home / Other | 10 | 0.1% |
| Total | 8,961 | 100.0% |
Housing Structures by Occupancy in Bloomingdale
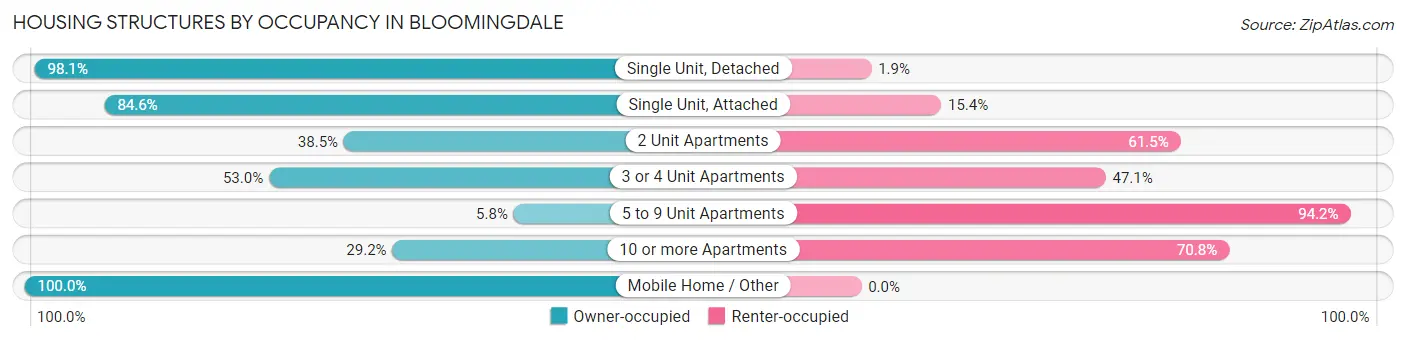
| Structure Type | Owner-occupied | Renter-occupied |
| Single Unit, Detached | 3,804 (98.1%) | 75 (1.9%) |
| Single Unit, Attached | 1,827 (84.6%) | 332 (15.4%) |
| 2 Unit Apartments | 47 (38.5%) | 75 (61.5%) |
| 3 or 4 Unit Apartments | 287 (52.9%) | 255 (47.0%) |
| 5 to 9 Unit Apartments | 17 (5.8%) | 275 (94.2%) |
| 10 or more Apartments | 571 (29.2%) | 1,386 (70.8%) |
| Mobile Home / Other | 10 (100.0%) | 0 (0.0%) |
| Total | 6,563 (73.2%) | 2,398 (26.8%) |
Housing Structures by Number of Rooms in Bloomingdale
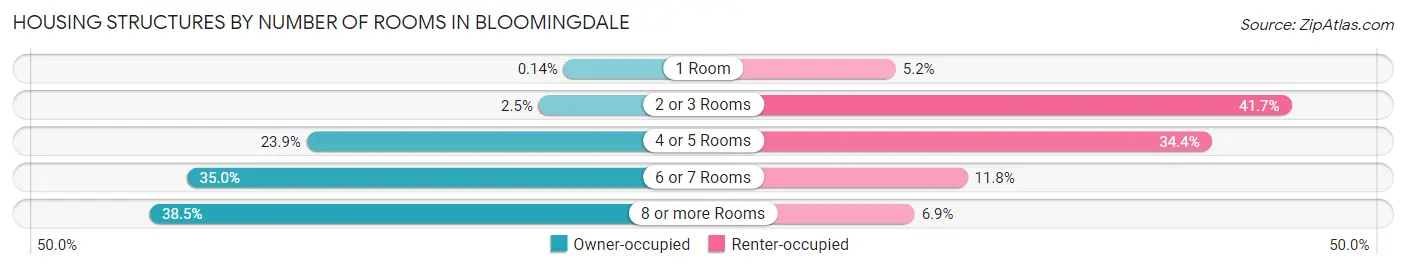
| Number of Rooms | Owner-occupied | Renter-occupied |
| 1 Room | 9 (0.1%) | 124 (5.2%) |
| 2 or 3 Rooms | 161 (2.5%) | 1,001 (41.7%) |
| 4 or 5 Rooms | 1,569 (23.9%) | 824 (34.4%) |
| 6 or 7 Rooms | 2,298 (35.0%) | 283 (11.8%) |
| 8 or more Rooms | 2,526 (38.5%) | 166 (6.9%) |
| Total | 6,563 (100.0%) | 2,398 (100.0%) |
Housing Structure by Heating Type in Bloomingdale
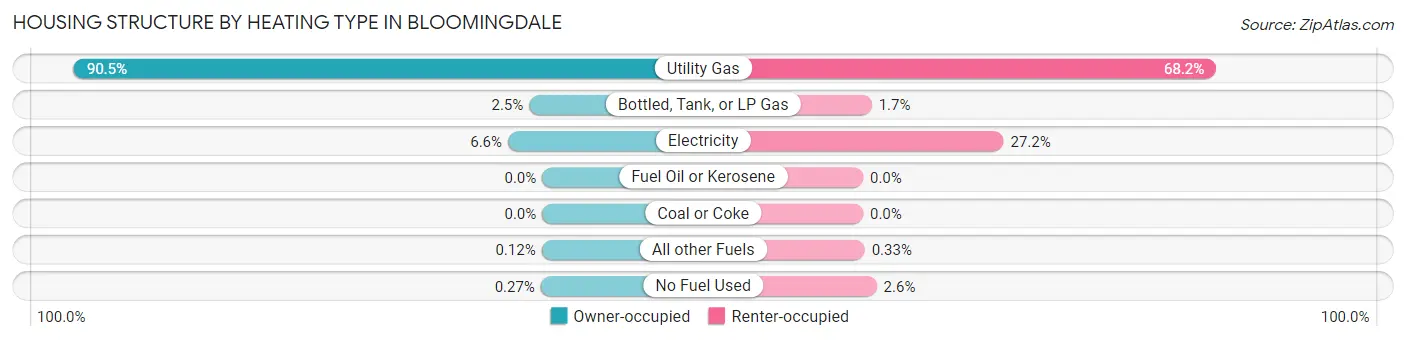
| Heating Type | Owner-occupied | Renter-occupied |
| Utility Gas | 5,938 (90.5%) | 1,636 (68.2%) |
| Bottled, Tank, or LP Gas | 165 (2.5%) | 40 (1.7%) |
| Electricity | 434 (6.6%) | 651 (27.2%) |
| Fuel Oil or Kerosene | 0 (0.0%) | 0 (0.0%) |
| Coal or Coke | 0 (0.0%) | 0 (0.0%) |
| All other Fuels | 8 (0.1%) | 8 (0.3%) |
| No Fuel Used | 18 (0.3%) | 63 (2.6%) |
| Total | 6,563 (100.0%) | 2,398 (100.0%) |
Household Vehicle Usage in Bloomingdale
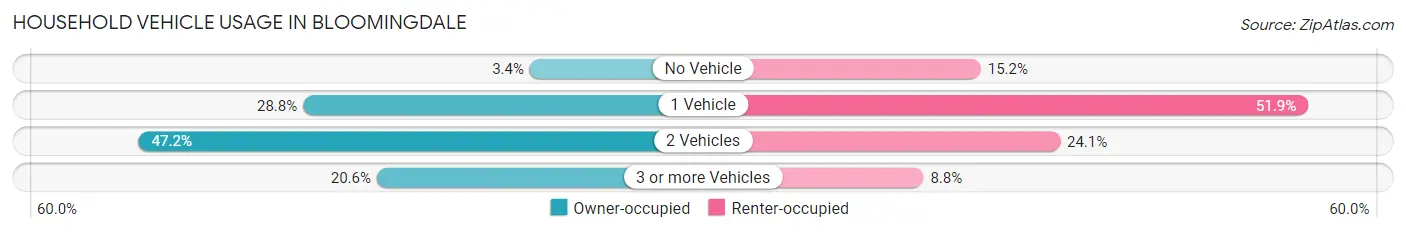
| Vehicles per Household | Owner-occupied | Renter-occupied |
| No Vehicle | 224 (3.4%) | 365 (15.2%) |
| 1 Vehicle | 1,891 (28.8%) | 1,244 (51.9%) |
| 2 Vehicles | 3,099 (47.2%) | 578 (24.1%) |
| 3 or more Vehicles | 1,349 (20.5%) | 211 (8.8%) |
| Total | 6,563 (100.0%) | 2,398 (100.0%) |
Real Estate & Mortgages in Bloomingdale
Real Estate and Mortgage Overview in Bloomingdale
| Characteristic | Without Mortgage | With Mortgage |
| Housing Units | 2,714 | 3,849 |
| Median Property Value | $355,400 | $351,800 |
| Median Household Income | $84,643 | $1,568 |
| Monthly Housing Costs | $1,005 | $967 |
| Real Estate Taxes | $7,832 | $51 |
Property Value by Mortgage Status in Bloomingdale
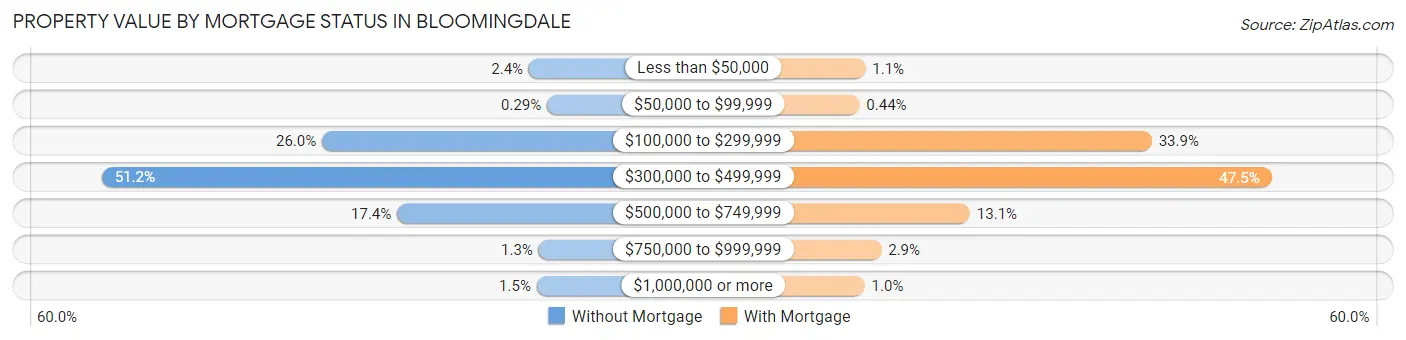
| Property Value | Without Mortgage | With Mortgage |
| Less than $50,000 | 64 (2.4%) | 43 (1.1%) |
| $50,000 to $99,999 | 8 (0.3%) | 17 (0.4%) |
| $100,000 to $299,999 | 706 (26.0%) | 1,303 (33.9%) |
| $300,000 to $499,999 | 1,389 (51.2%) | 1,830 (47.5%) |
| $500,000 to $749,999 | 473 (17.4%) | 503 (13.1%) |
| $750,000 to $999,999 | 34 (1.3%) | 113 (2.9%) |
| $1,000,000 or more | 40 (1.5%) | 40 (1.0%) |
| Total | 2,714 (100.0%) | 3,849 (100.0%) |
Household Income by Mortgage Status in Bloomingdale
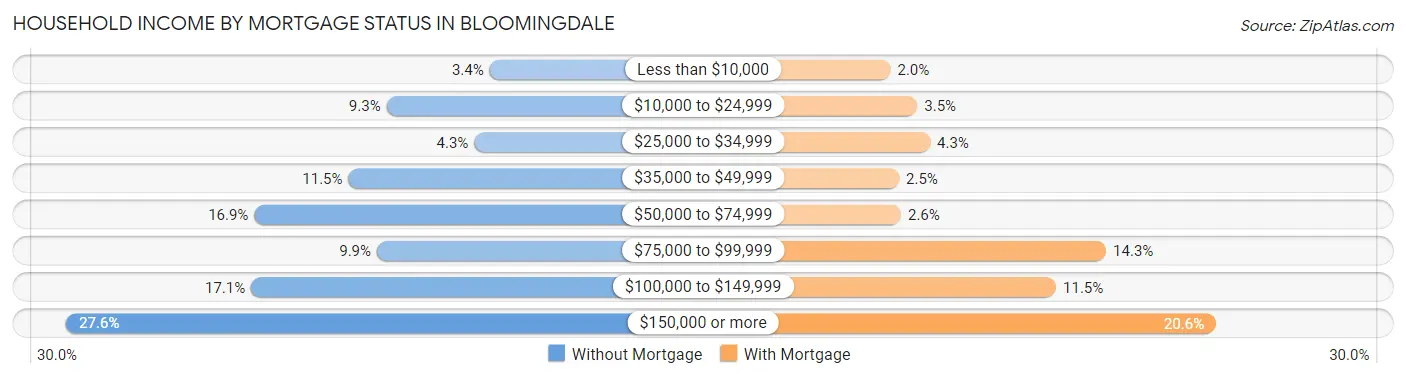
| Household Income | Without Mortgage | With Mortgage |
| Less than $10,000 | 93 (3.4%) | 77 (2.0%) |
| $10,000 to $24,999 | 253 (9.3%) | 136 (3.5%) |
| $25,000 to $34,999 | 117 (4.3%) | 164 (4.3%) |
| $35,000 to $49,999 | 312 (11.5%) | 96 (2.5%) |
| $50,000 to $74,999 | 458 (16.9%) | 100 (2.6%) |
| $75,000 to $99,999 | 268 (9.9%) | 551 (14.3%) |
| $100,000 to $149,999 | 463 (17.1%) | 441 (11.5%) |
| $150,000 or more | 750 (27.6%) | 793 (20.6%) |
| Total | 2,714 (100.0%) | 3,849 (100.0%) |
Property Value to Household Income Ratio in Bloomingdale
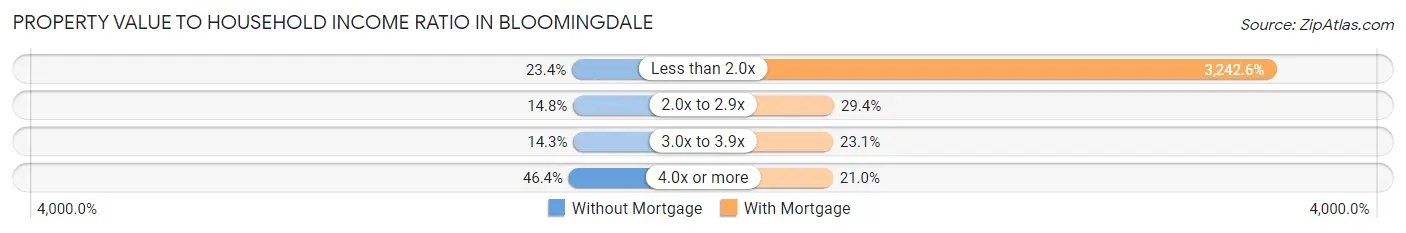
| Value-to-Income Ratio | Without Mortgage | With Mortgage |
| Less than 2.0x | 636 (23.4%) | 124,806 (3,242.6%) |
| 2.0x to 2.9x | 401 (14.8%) | 1,132 (29.4%) |
| 3.0x to 3.9x | 387 (14.3%) | 888 (23.1%) |
| 4.0x or more | 1,259 (46.4%) | 809 (21.0%) |
| Total | 2,714 (100.0%) | 3,849 (100.0%) |
Real Estate Taxes by Mortgage Status in Bloomingdale
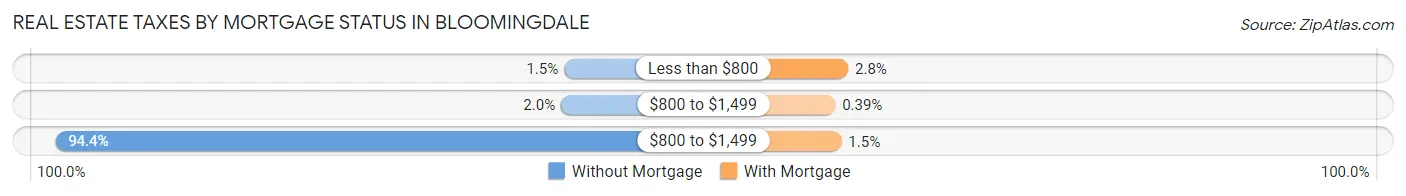
| Property Taxes | Without Mortgage | With Mortgage |
| Less than $800 | 40 (1.5%) | 106 (2.8%) |
| $800 to $1,499 | 55 (2.0%) | 15 (0.4%) |
| $800 to $1,499 | 2,562 (94.4%) | 59 (1.5%) |
| Total | 2,714 (100.0%) | 3,849 (100.0%) |
Health & Disability in Bloomingdale
Health Insurance Coverage by Age in Bloomingdale
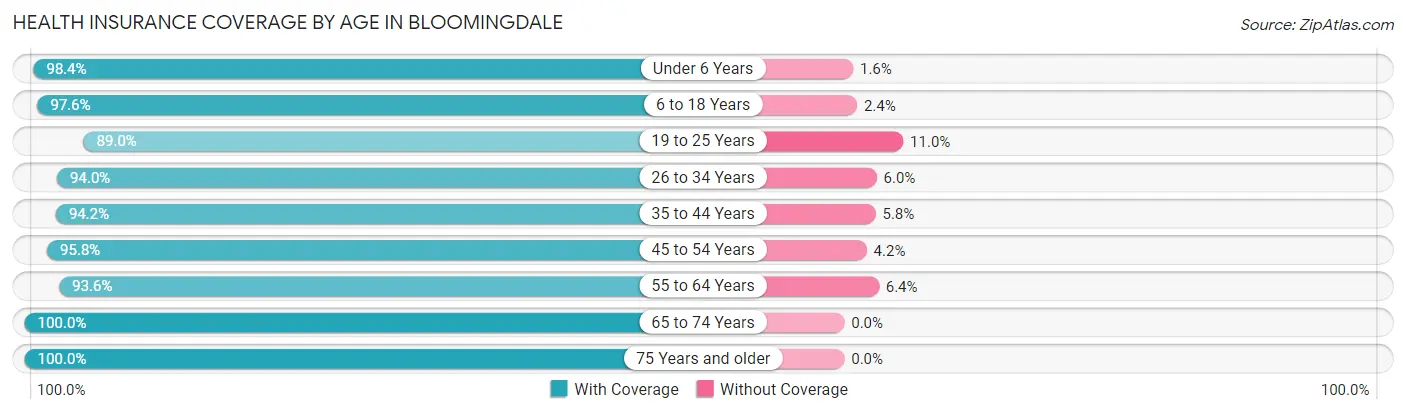
| Age Bracket | With Coverage | Without Coverage |
| Under 6 Years | 1,384 (98.4%) | 23 (1.6%) |
| 6 to 18 Years | 3,005 (97.6%) | 73 (2.4%) |
| 19 to 25 Years | 1,168 (89.0%) | 144 (11.0%) |
| 26 to 34 Years | 2,197 (94.0%) | 141 (6.0%) |
| 35 to 44 Years | 3,197 (94.2%) | 198 (5.8%) |
| 45 to 54 Years | 2,389 (95.8%) | 104 (4.2%) |
| 55 to 64 Years | 2,635 (93.6%) | 181 (6.4%) |
| 65 to 74 Years | 2,927 (100.0%) | 0 (0.0%) |
| 75 Years and older | 1,994 (100.0%) | 0 (0.0%) |
| Total | 20,896 (96.0%) | 864 (4.0%) |
Health Insurance Coverage by Citizenship Status in Bloomingdale
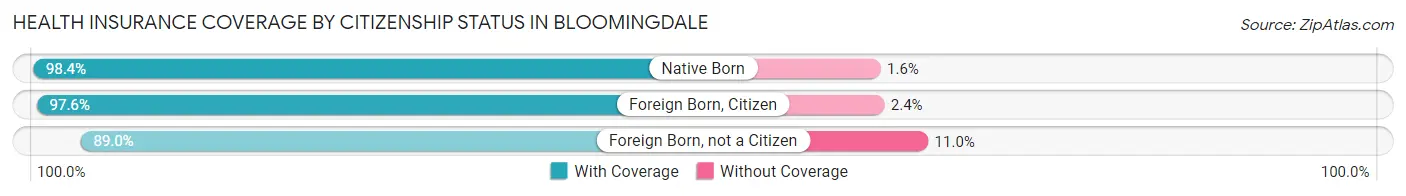
| Citizenship Status | With Coverage | Without Coverage |
| Native Born | 1,384 (98.4%) | 23 (1.6%) |
| Foreign Born, Citizen | 3,005 (97.6%) | 73 (2.4%) |
| Foreign Born, not a Citizen | 1,168 (89.0%) | 144 (11.0%) |
Health Insurance Coverage by Household Income in Bloomingdale
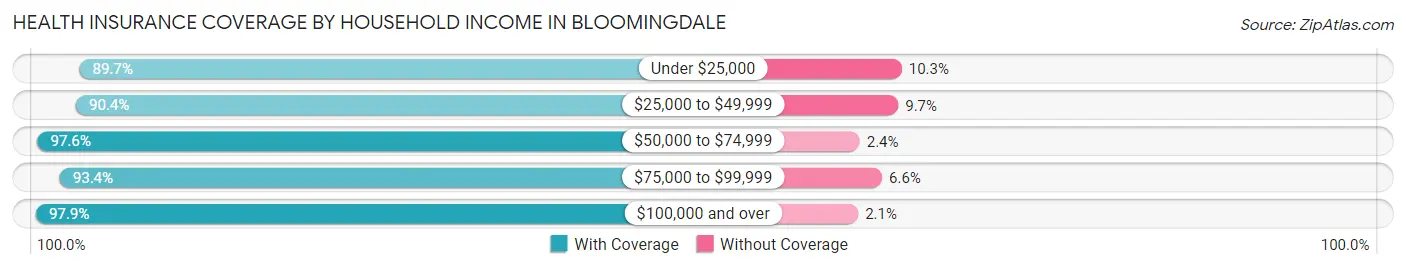
| Household Income | With Coverage | Without Coverage |
| Under $25,000 | 1,507 (89.7%) | 173 (10.3%) |
| $25,000 to $49,999 | 1,676 (90.3%) | 179 (9.7%) |
| $50,000 to $74,999 | 2,494 (97.6%) | 62 (2.4%) |
| $75,000 to $99,999 | 2,374 (93.4%) | 168 (6.6%) |
| $100,000 and over | 12,685 (97.9%) | 278 (2.1%) |
Public vs Private Health Insurance Coverage by Age in Bloomingdale
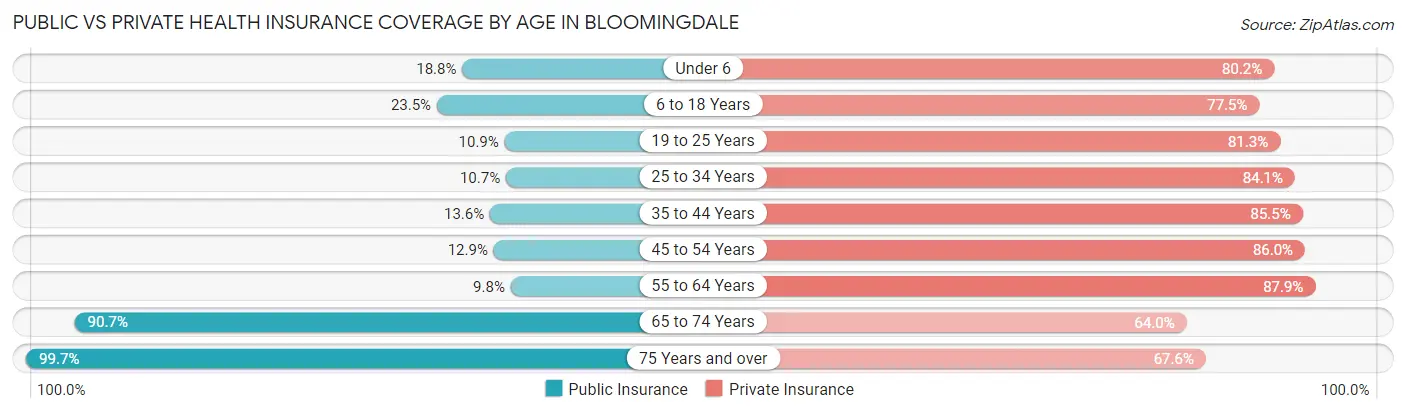
| Age Bracket | Public Insurance | Private Insurance |
| Under 6 | 264 (18.8%) | 1,129 (80.2%) |
| 6 to 18 Years | 722 (23.5%) | 2,385 (77.5%) |
| 19 to 25 Years | 143 (10.9%) | 1,067 (81.3%) |
| 25 to 34 Years | 249 (10.6%) | 1,966 (84.1%) |
| 35 to 44 Years | 462 (13.6%) | 2,903 (85.5%) |
| 45 to 54 Years | 322 (12.9%) | 2,143 (86.0%) |
| 55 to 64 Years | 275 (9.8%) | 2,474 (87.9%) |
| 65 to 74 Years | 2,655 (90.7%) | 1,873 (64.0%) |
| 75 Years and over | 1,988 (99.7%) | 1,347 (67.5%) |
| Total | 7,080 (32.5%) | 17,287 (79.4%) |
Disability Status by Sex by Age in Bloomingdale
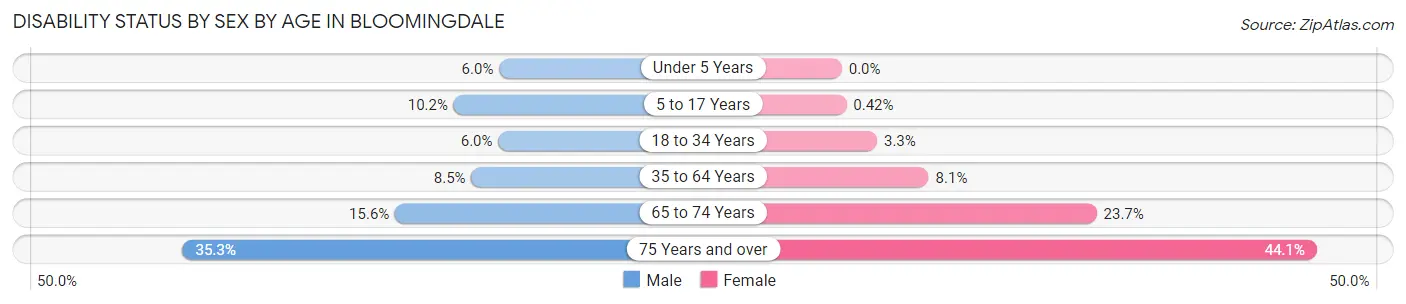
| Age Bracket | Male | Female |
| Under 5 Years | 34 (5.9%) | 0 (0.0%) |
| 5 to 17 Years | 177 (10.2%) | 6 (0.4%) |
| 18 to 34 Years | 110 (6.0%) | 64 (3.3%) |
| 35 to 64 Years | 372 (8.5%) | 350 (8.1%) |
| 65 to 74 Years | 193 (15.6%) | 400 (23.6%) |
| 75 Years and over | 311 (35.3%) | 491 (44.1%) |
Disability Class by Sex by Age in Bloomingdale
Disability Class: Hearing Difficulty
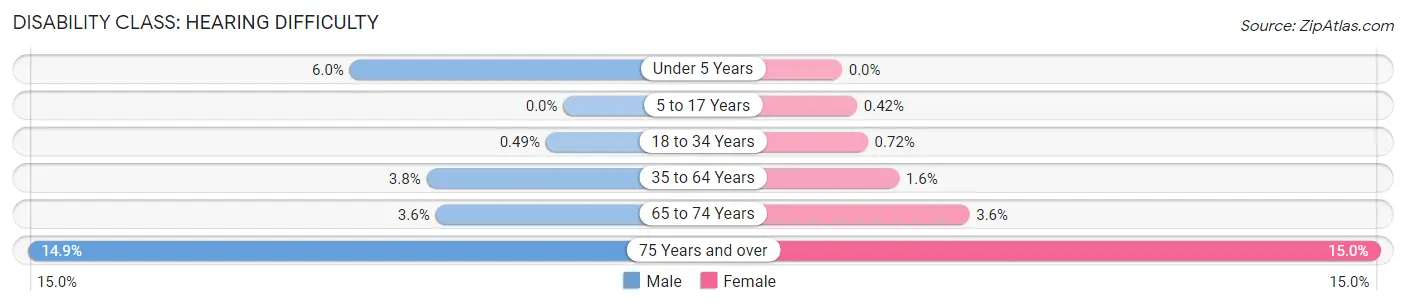
| Age Bracket | Male | Female |
| Under 5 Years | 34 (5.9%) | 0 (0.0%) |
| 5 to 17 Years | 0 (0.0%) | 6 (0.4%) |
| 18 to 34 Years | 9 (0.5%) | 14 (0.7%) |
| 35 to 64 Years | 166 (3.8%) | 69 (1.6%) |
| 65 to 74 Years | 44 (3.6%) | 60 (3.5%) |
| 75 Years and over | 131 (14.9%) | 167 (15.0%) |
Disability Class: Vision Difficulty
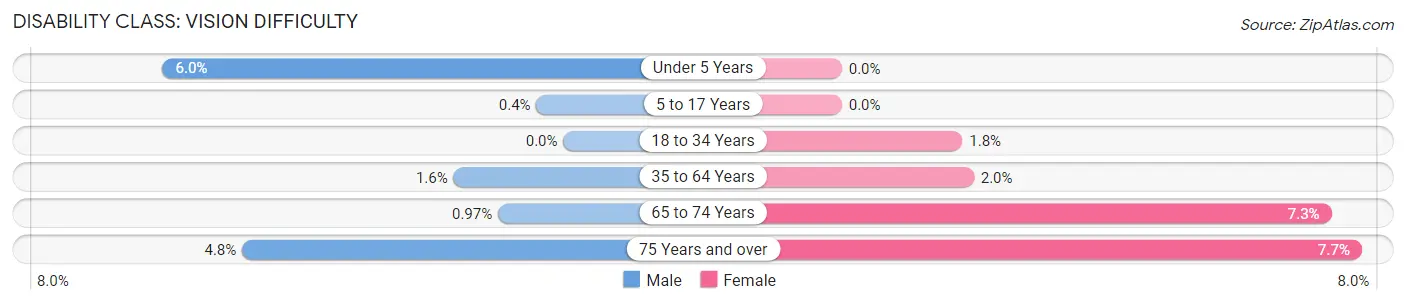
| Age Bracket | Male | Female |
| Under 5 Years | 34 (5.9%) | 0 (0.0%) |
| 5 to 17 Years | 7 (0.4%) | 0 (0.0%) |
| 18 to 34 Years | 0 (0.0%) | 35 (1.8%) |
| 35 to 64 Years | 71 (1.6%) | 85 (2.0%) |
| 65 to 74 Years | 12 (1.0%) | 123 (7.3%) |
| 75 Years and over | 42 (4.8%) | 86 (7.7%) |
Disability Class: Cognitive Difficulty
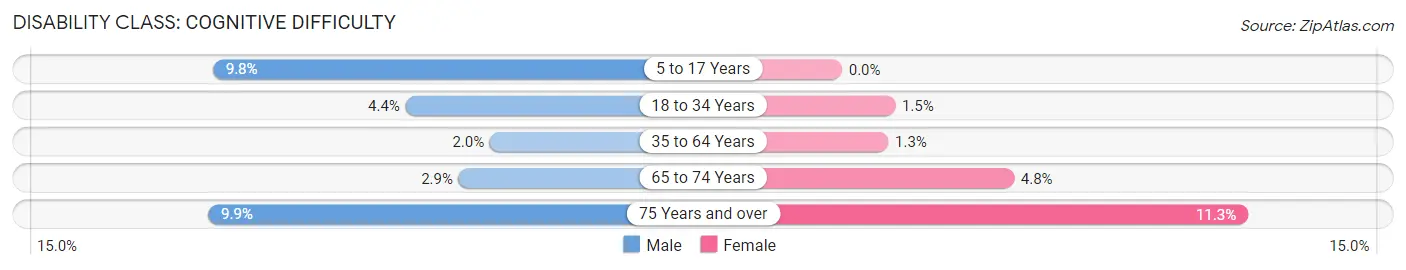
| Age Bracket | Male | Female |
| 5 to 17 Years | 170 (9.8%) | 0 (0.0%) |
| 18 to 34 Years | 80 (4.4%) | 29 (1.5%) |
| 35 to 64 Years | 89 (2.0%) | 56 (1.3%) |
| 65 to 74 Years | 36 (2.9%) | 81 (4.8%) |
| 75 Years and over | 87 (9.9%) | 126 (11.3%) |
Disability Class: Ambulatory Difficulty
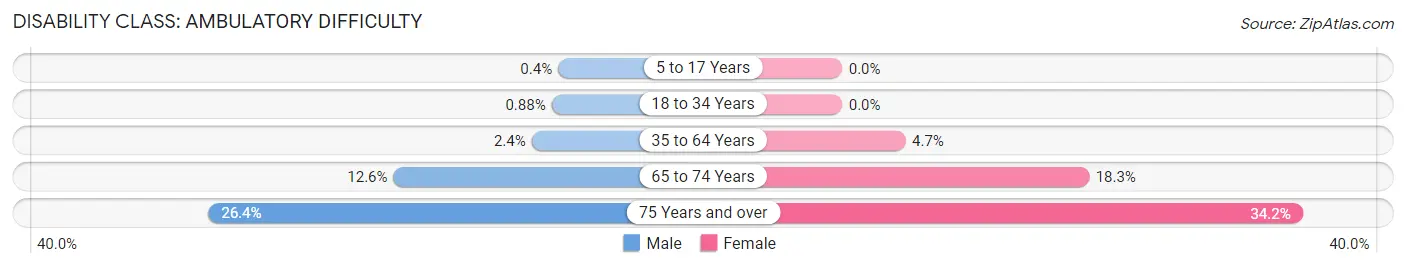
| Age Bracket | Male | Female |
| 5 to 17 Years | 7 (0.4%) | 0 (0.0%) |
| 18 to 34 Years | 16 (0.9%) | 0 (0.0%) |
| 35 to 64 Years | 103 (2.4%) | 204 (4.7%) |
| 65 to 74 Years | 156 (12.6%) | 310 (18.3%) |
| 75 Years and over | 232 (26.4%) | 381 (34.2%) |
Disability Class: Self-Care Difficulty
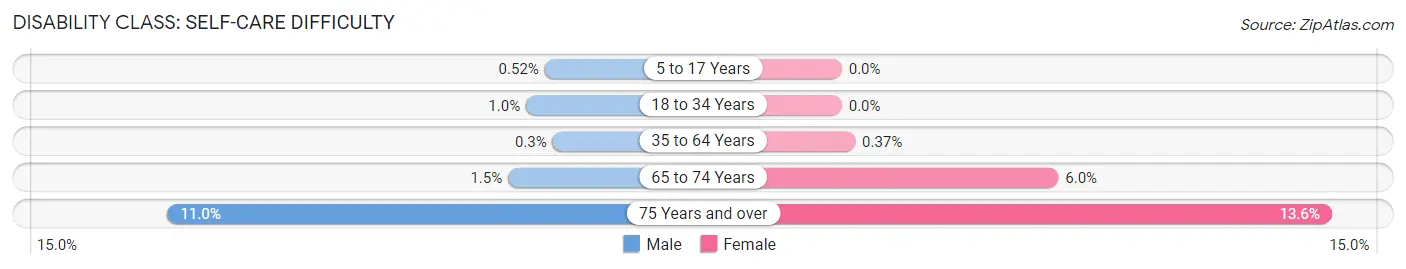
| Age Bracket | Male | Female |
| 5 to 17 Years | 9 (0.5%) | 0 (0.0%) |
| 18 to 34 Years | 19 (1.0%) | 0 (0.0%) |
| 35 to 64 Years | 13 (0.3%) | 16 (0.4%) |
| 65 to 74 Years | 19 (1.5%) | 102 (6.0%) |
| 75 Years and over | 97 (11.0%) | 152 (13.6%) |
Technology Access in Bloomingdale
Computing Device Access in Bloomingdale
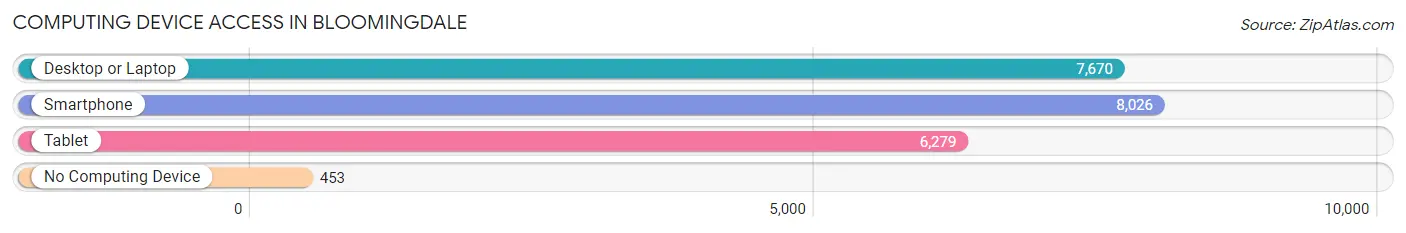
| Device Type | # Households | % Households |
| Desktop or Laptop | 7,670 | 85.6% |
| Smartphone | 8,026 | 89.6% |
| Tablet | 6,279 | 70.1% |
| No Computing Device | 453 | 5.1% |
| Total | 8,961 | 100.0% |
Internet Access in Bloomingdale
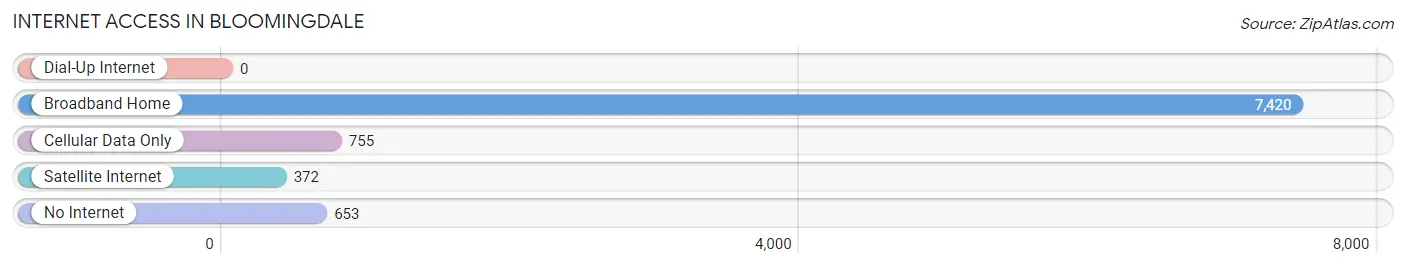
| Internet Type | # Households | % Households |
| Dial-Up Internet | 0 | 0.0% |
| Broadband Home | 7,420 | 82.8% |
| Cellular Data Only | 755 | 8.4% |
| Satellite Internet | 372 | 4.2% |
| No Internet | 653 | 7.3% |
| Total | 8,961 | 100.0% |
Bloomingdale Summary
Bloomingdale is a village located in DuPage County, Illinois, United States. It is a western suburb of Chicago and is part of the Chicago metropolitan area. The population was 22,018 at the 2010 census.
History
The area that is now Bloomingdale was first settled in the 1830s by German immigrants. The village was originally known as Bloomingdale Center, and was incorporated in 1908. The name was changed to Bloomingdale in 1921.
The village was originally a farming community, but in the 1950s and 1960s, it began to experience rapid growth due to its proximity to Chicago. The population of the village has grown steadily since then, and it is now home to a diverse population of families, young professionals, and retirees.
Geography
Bloomingdale is located in northeastern Illinois, about 25 miles west of downtown Chicago. It is bordered by the villages of Roselle to the north, Glendale Heights to the east, and Addison to the south. The village is situated on the DuPage River, which flows through the center of the village.
The village has a total area of 5.2 square miles, of which 5.1 square miles is land and 0.1 square miles is water.
Economy
Bloomingdale is home to a variety of businesses, including retail stores, restaurants, and professional services. The village is also home to several corporate headquarters, including the headquarters of the American Academy of Pediatrics and the American College of Radiology.
The village is served by two major highways, Interstate 355 and Illinois Route 53. The village is also served by Metra, the commuter rail system that serves the Chicago metropolitan area.
Demographics
As of the 2010 census, the population of Bloomingdale was 22,018. The racial makeup of the village was 79.2% White, 8.2% African American, 0.3% Native American, 6.2% Asian, and 4.3% from other races. Hispanic or Latino of any race were 13.2% of the population.
The median household income in Bloomingdale was $76,845 in 2017. The median age of the village was 38.7 years.
Conclusion
Bloomingdale is a village located in DuPage County, Illinois, about 25 miles west of downtown Chicago. It is a western suburb of Chicago and is part of the Chicago metropolitan area. The population was 22,018 at the 2010 census. The village was originally a farming community, but in the 1950s and 1960s, it began to experience rapid growth due to its proximity to Chicago. The village is home to a variety of businesses, including retail stores, restaurants, and professional services. The median household income in Bloomingdale was $76,845 in 2017. The village is served by two major highways, Interstate 355 and Illinois Route 53, and is also served by Metra, the commuter rail system that serves the Chicago metropolitan area.
Common Questions
What is Per Capita Income in Bloomingdale?
Per Capita income in Bloomingdale is $55,073.
What is the Median Family Income in Bloomingdale?
Median Family Income in Bloomingdale is $115,906.
What is the Median Household income in Bloomingdale?
Median Household Income in Bloomingdale is $96,779.
What is Income or Wage Gap in Bloomingdale?
Income or Wage Gap in Bloomingdale is 34.2%.
Women in Bloomingdale earn 65.8 cents for every dollar earned by a man.
What is Inequality or Gini Index in Bloomingdale?
Inequality or Gini Index in Bloomingdale is 0.47.
What is the Total Population of Bloomingdale?
Total Population of Bloomingdale is 22,435.
What is the Total Male Population of Bloomingdale?
Total Male Population of Bloomingdale is 10,896.
What is the Total Female Population of Bloomingdale?
Total Female Population of Bloomingdale is 11,539.
What is the Ratio of Males per 100 Females in Bloomingdale?
There are 94.43 Males per 100 Females in Bloomingdale.
What is the Ratio of Females per 100 Males in Bloomingdale?
There are 105.90 Females per 100 Males in Bloomingdale.
What is the Median Population Age in Bloomingdale?
Median Population Age in Bloomingdale is 43.2 Years.
What is the Average Family Size in Bloomingdale
Average Family Size in Bloomingdale is 3.0 People.
What is the Average Household Size in Bloomingdale
Average Household Size in Bloomingdale is 2.4 People.
How Large is the Labor Force in Bloomingdale?
There are 11,980 People in the Labor Forcein in Bloomingdale.
What is the Percentage of People in the Labor Force in Bloomingdale?
65.1% of People are in the Labor Force in Bloomingdale.
What is the Unemployment Rate in Bloomingdale?
Unemployment Rate in Bloomingdale is 3.9%.