Newington, CT Map & Demographics
Newington Map
Newington Overview
$47,853
PER CAPITA INCOME
$115,957
AVG FAMILY INCOME
$100,239
AVG HOUSEHOLD INCOME
15.2%
WAGE / INCOME GAP [ % ]
84.8¢/ $1
WAGE / INCOME GAP [ $ ]
0.37
INEQUALITY / GINI INDEX
30,458
TOTAL POPULATION
14,491
MALE POPULATION
15,967
FEMALE POPULATION
90.76
MALES / 100 FEMALES
110.19
FEMALES / 100 MALES
44.7
MEDIAN AGE
3.0
AVG FAMILY SIZE
2.4
AVG HOUSEHOLD SIZE
17,740
LABOR FORCE [ PEOPLE ]
68.7%
PERCENT IN LABOR FORCE
3.1%
UNEMPLOYMENT RATE
Newington Zip Codes
Newington Area Codes
Income in Newington
Income Overview in Newington
Per Capita Income in Newington is $47,853, while median incomes of families and households are $115,957 and $100,239 respectively.
| Characteristic | Number | Measure |
| Per Capita Income | 30,458 | $47,853 |
| Median Family Income | 8,224 | $115,957 |
| Mean Family Income | 8,224 | $131,348 |
| Median Household Income | 12,514 | $100,239 |
| Mean Household Income | 12,514 | $115,970 |
| Income Deficit | 8,224 | $0 |
| Wage / Income Gap (%) | 30,458 | 15.15% |
| Wage / Income Gap ($) | 30,458 | 84.85¢ per $1 |
| Gini / Inequality Index | 30,458 | 0.37 |
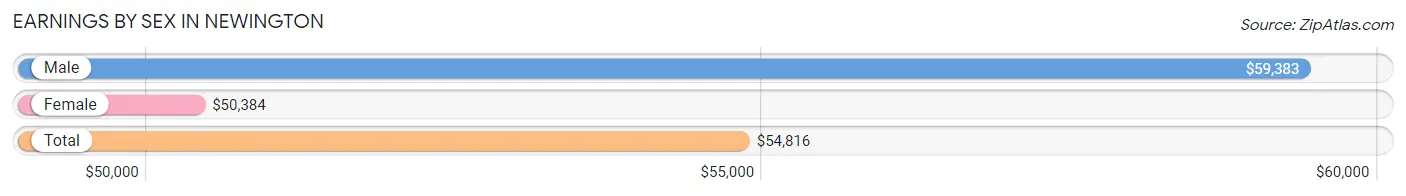
Earnings by Sex in Newington
Average Earnings in Newington are $54,816, $59,383 for men and $50,384 for women, a difference of 15.1%.
| Sex | Number | Average Earnings |
| Male | 9,515 (52.3%) | $59,383 |
| Female | 8,662 (47.6%) | $50,384 |
| Total | 18,177 (100.0%) | $54,816 |
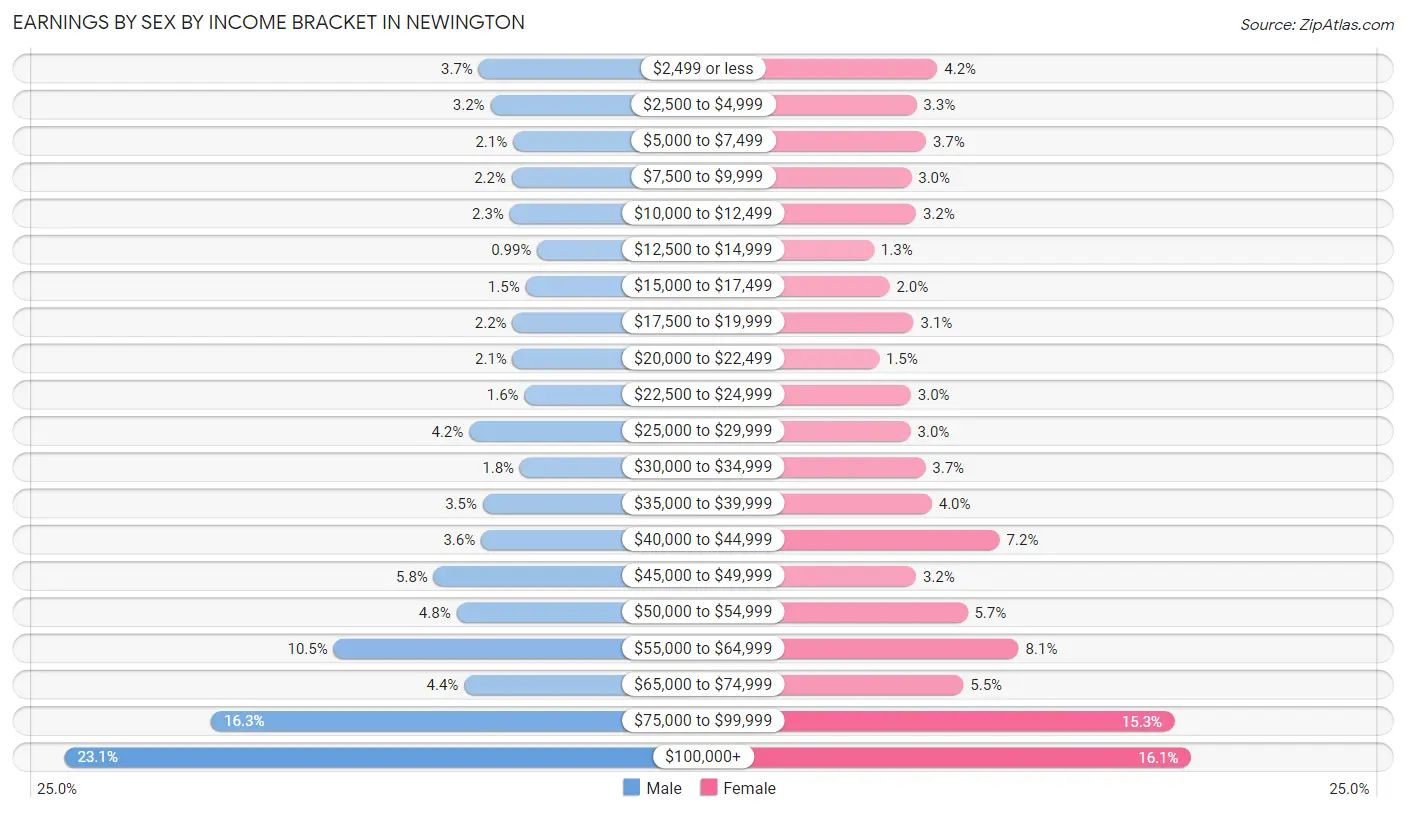
Earnings by Sex by Income Bracket in Newington
The most common earnings brackets in Newington are $100,000+ for men (2,201 | 23.1%) and $100,000+ for women (1,394 | 16.1%).
| Income | Male | Female |
| $2,499 or less | 355 (3.7%) | 367 (4.2%) |
| $2,500 to $4,999 | 303 (3.2%) | 282 (3.3%) |
| $5,000 to $7,499 | 202 (2.1%) | 321 (3.7%) |
| $7,500 to $9,999 | 207 (2.2%) | 262 (3.0%) |
| $10,000 to $12,499 | 217 (2.3%) | 281 (3.2%) |
| $12,500 to $14,999 | 94 (1.0%) | 110 (1.3%) |
| $15,000 to $17,499 | 147 (1.5%) | 173 (2.0%) |
| $17,500 to $19,999 | 205 (2.1%) | 271 (3.1%) |
| $20,000 to $22,499 | 204 (2.1%) | 131 (1.5%) |
| $22,500 to $24,999 | 151 (1.6%) | 260 (3.0%) |
| $25,000 to $29,999 | 398 (4.2%) | 259 (3.0%) |
| $30,000 to $34,999 | 171 (1.8%) | 319 (3.7%) |
| $35,000 to $39,999 | 337 (3.5%) | 345 (4.0%) |
| $40,000 to $44,999 | 344 (3.6%) | 620 (7.2%) |
| $45,000 to $49,999 | 556 (5.8%) | 281 (3.2%) |
| $50,000 to $54,999 | 454 (4.8%) | 489 (5.7%) |
| $55,000 to $64,999 | 1,002 (10.5%) | 697 (8.1%) |
| $65,000 to $74,999 | 420 (4.4%) | 473 (5.5%) |
| $75,000 to $99,999 | 1,547 (16.3%) | 1,327 (15.3%) |
| $100,000+ | 2,201 (23.1%) | 1,394 (16.1%) |
| Total | 9,515 (100.0%) | 8,662 (100.0%) |
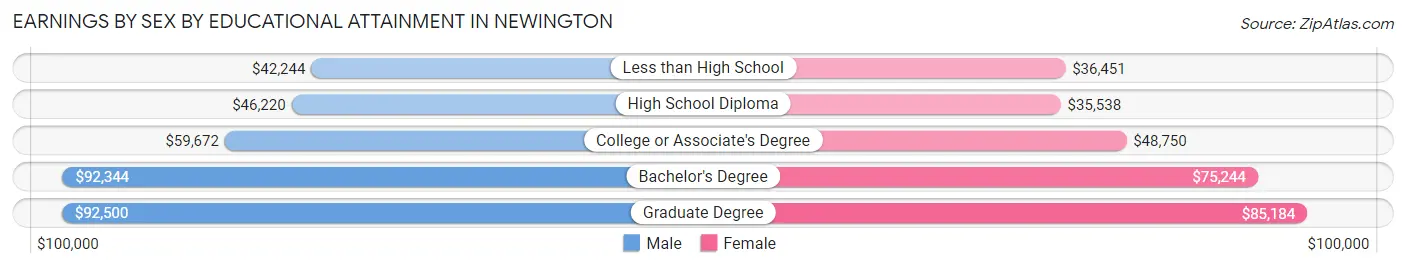
Earnings by Sex by Educational Attainment in Newington
Average earnings in Newington are $64,425 for men and $55,796 for women, a difference of 13.4%. Men with an educational attainment of graduate degree enjoy the highest average annual earnings of $92,500, while those with less than high school education earn the least with $42,244. Women with an educational attainment of graduate degree earn the most with the average annual earnings of $85,184, while those with high school diploma education have the smallest earnings of $35,538.
| Educational Attainment | Male Income | Female Income |
| Less than High School | $42,244 | $36,451 |
| High School Diploma | $46,220 | $35,538 |
| College or Associate's Degree | $59,672 | $48,750 |
| Bachelor's Degree | $92,344 | $75,244 |
| Graduate Degree | $92,500 | $85,184 |
| Total | $64,425 | $55,796 |
Family Income in Newington
Family Income Brackets in Newington
According to the Newington family income data, there are 2,064 families falling into the $100,000 to $149,999 income range, which is the most common income bracket and makes up 25.1% of all families. Conversely, the $10,000 to $14,999 income bracket is the least frequent group with only 148 families (1.8%) belonging to this category.
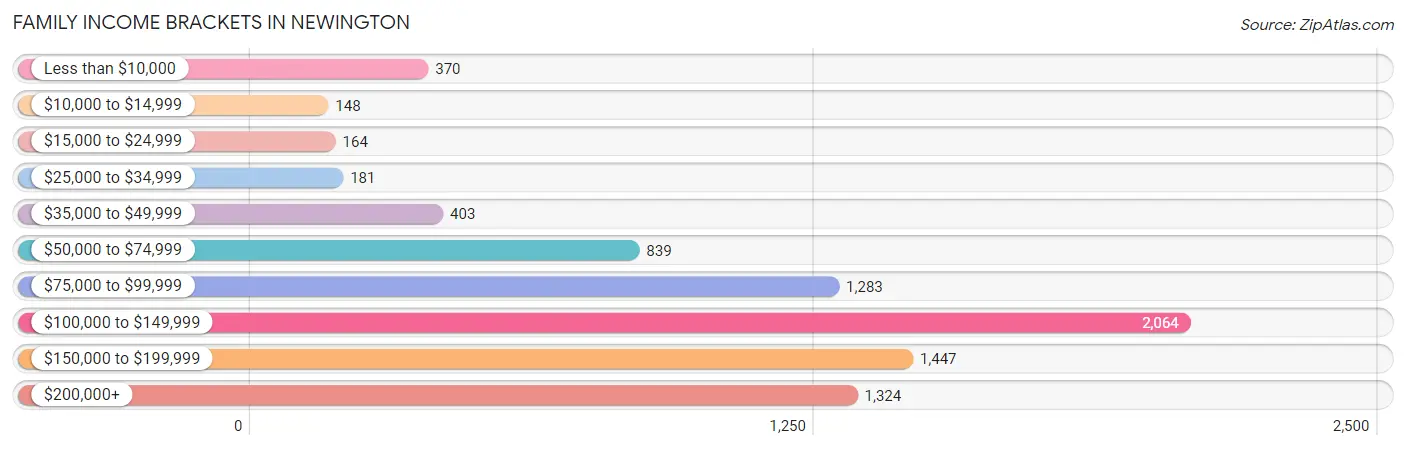
| Income Bracket | # Families | % Families |
| Less than $10,000 | 370 | 4.5% |
| $10,000 to $14,999 | 148 | 1.8% |
| $15,000 to $24,999 | 164 | 2.0% |
| $25,000 to $34,999 | 181 | 2.2% |
| $35,000 to $49,999 | 403 | 4.9% |
| $50,000 to $74,999 | 839 | 10.2% |
| $75,000 to $99,999 | 1,283 | 15.6% |
| $100,000 to $149,999 | 2,064 | 25.1% |
| $150,000 to $199,999 | 1,447 | 17.6% |
| $200,000+ | 1,324 | 16.1% |
Family Income by Famaliy Size in Newington
7+ person families (48 | 0.6%) account for the highest median family income in Newington with $201,071 per family, while 2-person families (4,178 | 50.8%) have the highest median income of $50,147 per family member.
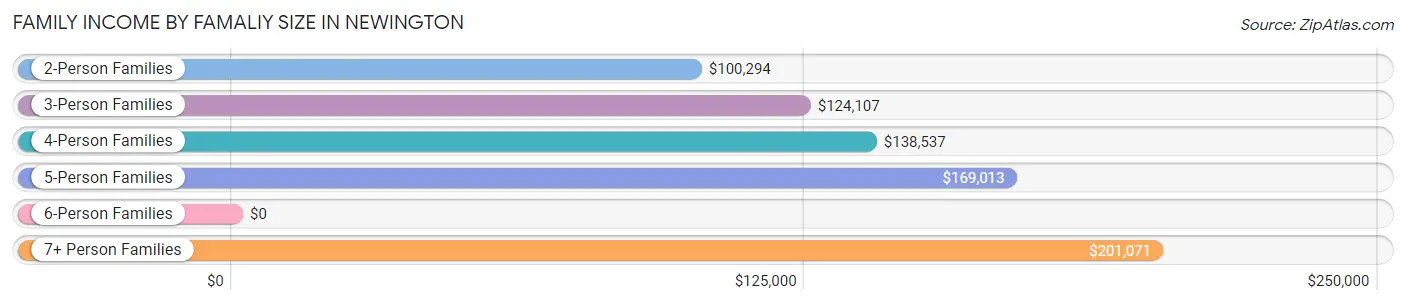
| Income Bracket | # Families | Median Income |
| 2-Person Families | 4,178 (50.8%) | $100,294 |
| 3-Person Families | 1,656 (20.1%) | $124,107 |
| 4-Person Families | 1,549 (18.8%) | $138,537 |
| 5-Person Families | 680 (8.3%) | $169,013 |
| 6-Person Families | 113 (1.4%) | $0 |
| 7+ Person Families | 48 (0.6%) | $201,071 |
| Total | 8,224 (100.0%) | $115,957 |
Family Income by Number of Earners in Newington
The median family income in Newington is $115,957, with families comprising 3+ earners (1,502) having the highest median family income of $173,403, while families with no earners (1,239) have the lowest median family income of $55,169, accounting for 18.3% and 15.1% of families, respectively.
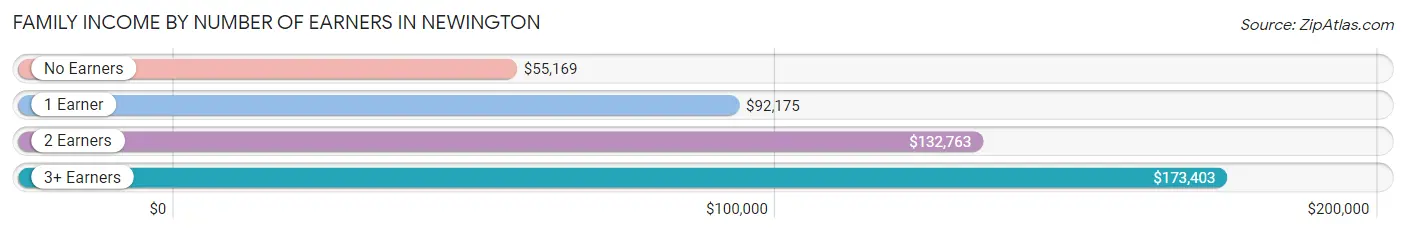
| Number of Earners | # Families | Median Income |
| No Earners | 1,239 (15.1%) | $55,169 |
| 1 Earner | 2,049 (24.9%) | $92,175 |
| 2 Earners | 3,434 (41.8%) | $132,763 |
| 3+ Earners | 1,502 (18.3%) | $173,403 |
| Total | 8,224 (100.0%) | $115,957 |
Household Income in Newington
Household Income Brackets in Newington
With 2,916 households falling in the category, the $100,000 to $149,999 income range is the most frequent in Newington, accounting for 23.3% of all households. In contrast, only 225 households (1.8%) fall into the $10,000 to $14,999 income bracket, making it the least populous group.
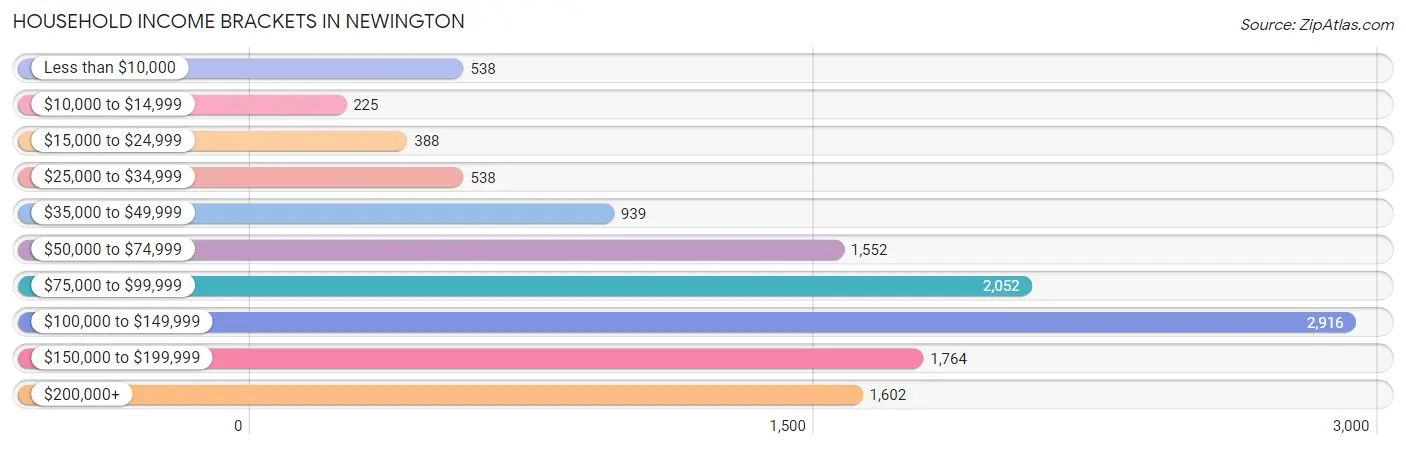
| Income Bracket | # Households | % Households |
| Less than $10,000 | 538 | 4.3% |
| $10,000 to $14,999 | 225 | 1.8% |
| $15,000 to $24,999 | 388 | 3.1% |
| $25,000 to $34,999 | 538 | 4.3% |
| $35,000 to $49,999 | 939 | 7.5% |
| $50,000 to $74,999 | 1,552 | 12.4% |
| $75,000 to $99,999 | 2,052 | 16.4% |
| $100,000 to $149,999 | 2,916 | 23.3% |
| $150,000 to $199,999 | 1,764 | 14.1% |
| $200,000+ | 1,602 | 12.8% |
Household Income by Householder Age in Newington
The median household income in Newington is $100,239, with the highest median household income of $116,106 found in the 45 to 64 years age bracket for the primary householder. A total of 5,000 households (40.0%) fall into this category. Meanwhile, the 15 to 24 years age bracket for the primary householder has the lowest median household income of $0, with 187 households (1.5%) in this group.
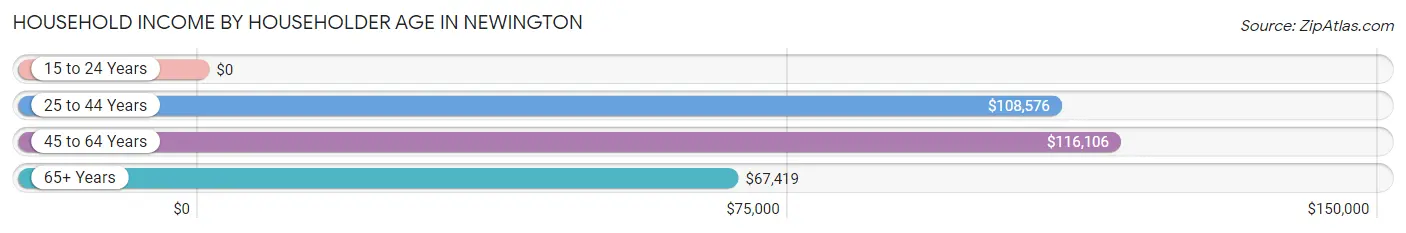
| Income Bracket | # Households | Median Income |
| 15 to 24 Years | 187 (1.5%) | $0 |
| 25 to 44 Years | 3,545 (28.3%) | $108,576 |
| 45 to 64 Years | 5,000 (40.0%) | $116,106 |
| 65+ Years | 3,782 (30.2%) | $67,419 |
| Total | 12,514 (100.0%) | $100,239 |
Poverty in Newington
Income Below Poverty by Sex and Age in Newington
With 6.6% poverty level for males and 8.6% for females among the residents of Newington, under 5 year old males and 5 year old females are the most vulnerable to poverty, with 121 males (19.2%) and 46 females (21.3%) in their respective age groups living below the poverty level.
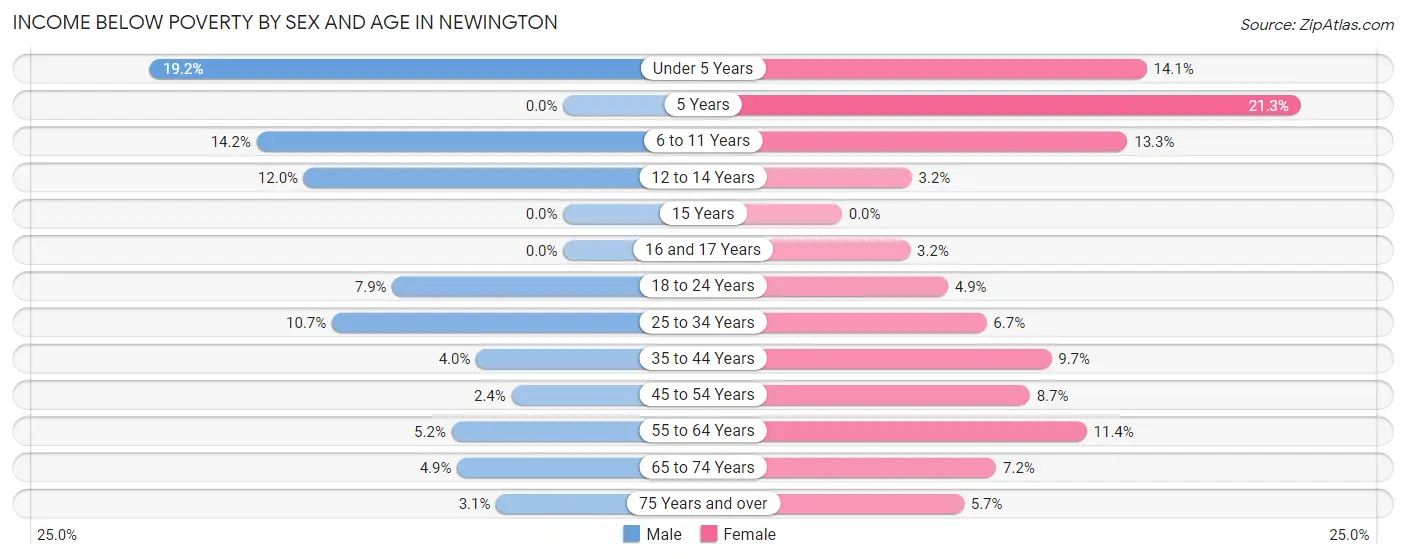
| Age Bracket | Male | Female |
| Under 5 Years | 121 (19.2%) | 95 (14.1%) |
| 5 Years | 0 (0.0%) | 46 (21.3%) |
| 6 to 11 Years | 102 (14.2%) | 121 (13.3%) |
| 12 to 14 Years | 59 (12.0%) | 16 (3.2%) |
| 15 Years | 0 (0.0%) | 0 (0.0%) |
| 16 and 17 Years | 0 (0.0%) | 10 (3.2%) |
| 18 to 24 Years | 92 (7.9%) | 52 (4.9%) |
| 25 to 34 Years | 246 (10.7%) | 109 (6.7%) |
| 35 to 44 Years | 71 (4.0%) | 206 (9.7%) |
| 45 to 54 Years | 50 (2.4%) | 203 (8.7%) |
| 55 to 64 Years | 107 (5.2%) | 291 (11.4%) |
| 65 to 74 Years | 74 (4.9%) | 121 (7.2%) |
| 75 Years and over | 31 (3.1%) | 96 (5.7%) |
| Total | 953 (6.6%) | 1,366 (8.6%) |
Income Above Poverty by Sex and Age in Newington
According to the poverty statistics in Newington, males aged 5 years and females aged 15 years are the age groups that are most secure financially, with 100.0% of males and 100.0% of females in these age groups living above the poverty line.
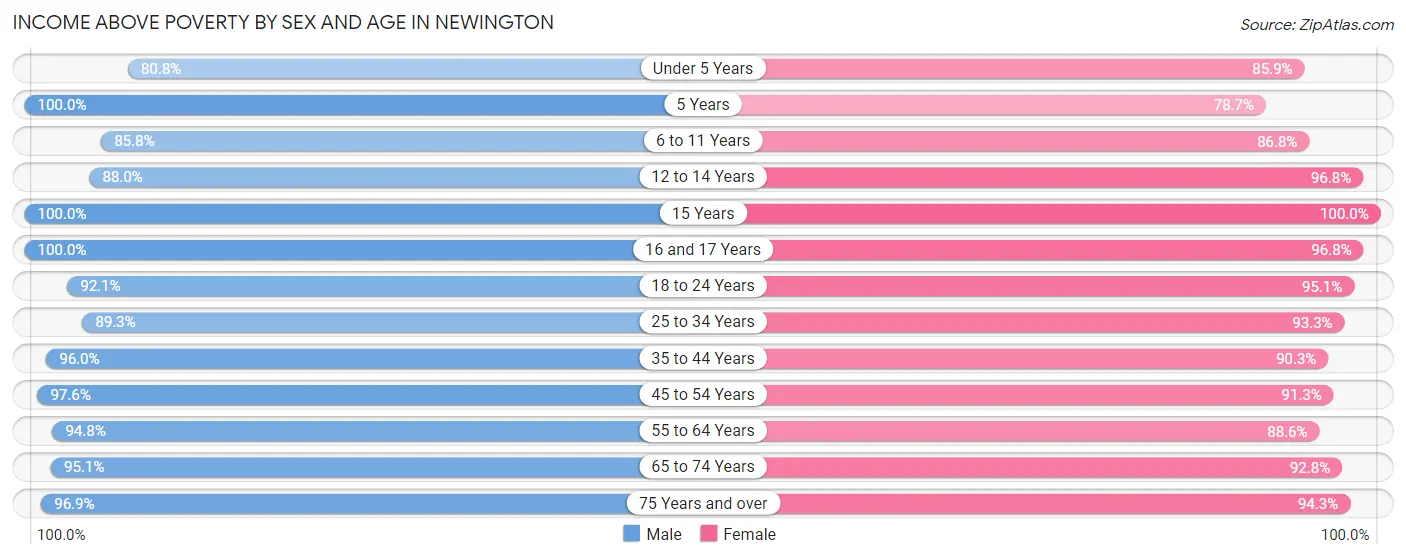
| Age Bracket | Male | Female |
| Under 5 Years | 510 (80.8%) | 577 (85.9%) |
| 5 Years | 56 (100.0%) | 170 (78.7%) |
| 6 to 11 Years | 615 (85.8%) | 792 (86.8%) |
| 12 to 14 Years | 431 (88.0%) | 478 (96.8%) |
| 15 Years | 286 (100.0%) | 105 (100.0%) |
| 16 and 17 Years | 362 (100.0%) | 305 (96.8%) |
| 18 to 24 Years | 1,068 (92.1%) | 1,004 (95.1%) |
| 25 to 34 Years | 2,047 (89.3%) | 1,515 (93.3%) |
| 35 to 44 Years | 1,687 (96.0%) | 1,913 (90.3%) |
| 45 to 54 Years | 2,032 (97.6%) | 2,126 (91.3%) |
| 55 to 64 Years | 1,957 (94.8%) | 2,270 (88.6%) |
| 65 to 74 Years | 1,431 (95.1%) | 1,568 (92.8%) |
| 75 Years and over | 967 (96.9%) | 1,599 (94.3%) |
| Total | 13,449 (93.4%) | 14,422 (91.3%) |
Income Below Poverty Among Married-Couple Families in Newington
The poverty statistics for married-couple families in Newington show that 2.2% or 130 of the total 5,831 families live below the poverty line. Families with 3 or 4 children have the highest poverty rate of 11.2%, comprising of 31 families. On the other hand, families with 1 or 2 children have the lowest poverty rate of 0.5%, which includes 9 families.
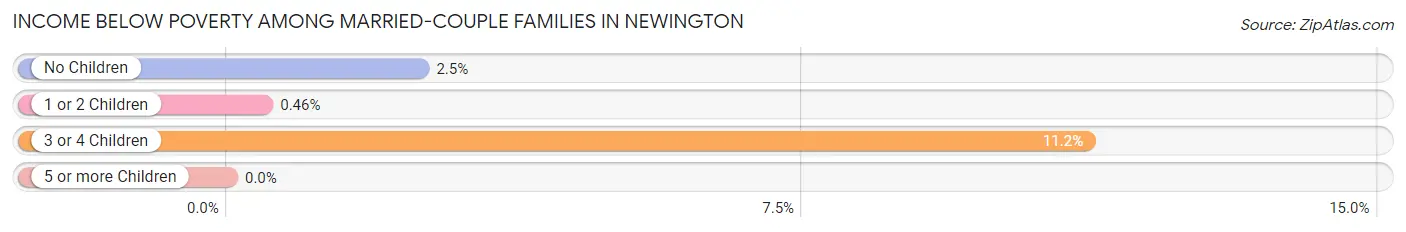
| Children | Above Poverty | Below Poverty |
| No Children | 3,506 (97.5%) | 90 (2.5%) |
| 1 or 2 Children | 1,949 (99.5%) | 9 (0.5%) |
| 3 or 4 Children | 246 (88.8%) | 31 (11.2%) |
| 5 or more Children | 0 (0.0%) | 0 (0.0%) |
| Total | 5,701 (97.8%) | 130 (2.2%) |
Income Below Poverty Among Single-Parent Households in Newington
According to the poverty data in Newington, 23.9% or 191 single-father households and 16.4% or 261 single-mother households are living below the poverty line. Among single-father households, those with 3 or 4 children have the highest poverty rate, with 9 households (100.0%) experiencing poverty. Likewise, among single-mother households, those with 3 or 4 children have the highest poverty rate, with 98 households (74.2%) falling below the poverty line.
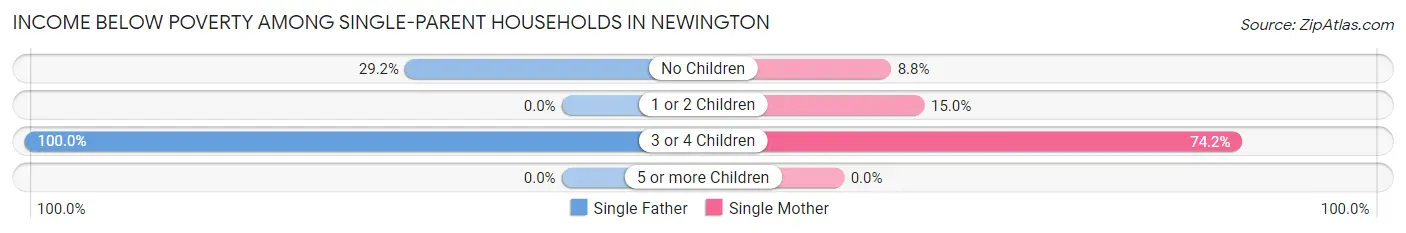
| Children | Single Father | Single Mother |
| No Children | 182 (29.2%) | 79 (8.8%) |
| 1 or 2 Children | 0 (0.0%) | 84 (15.0%) |
| 3 or 4 Children | 9 (100.0%) | 98 (74.2%) |
| 5 or more Children | 0 (0.0%) | 0 (0.0%) |
| Total | 191 (23.9%) | 261 (16.4%) |
Income Below Poverty Among Married-Couple vs Single-Parent Households in Newington
The poverty data for Newington shows that 130 of the married-couple family households (2.2%) and 452 of the single-parent households (18.9%) are living below the poverty level. Within the married-couple family households, those with 3 or 4 children have the highest poverty rate, with 31 households (11.2%) falling below the poverty line. Among the single-parent households, those with 3 or 4 children have the highest poverty rate, with 107 household (75.9%) living below poverty.
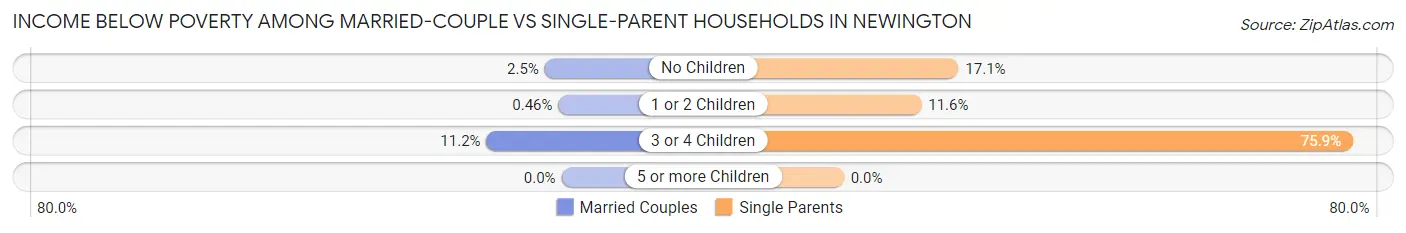
| Children | Married-Couple Families | Single-Parent Households |
| No Children | 90 (2.5%) | 261 (17.1%) |
| 1 or 2 Children | 9 (0.5%) | 84 (11.6%) |
| 3 or 4 Children | 31 (11.2%) | 107 (75.9%) |
| 5 or more Children | 0 (0.0%) | 0 (0.0%) |
| Total | 130 (2.2%) | 452 (18.9%) |
Race in Newington
The most populous races in Newington are White / Caucasian (23,494 | 77.1%), Hispanic or Latino (3,257 | 10.7%), and Two or more Races (2,312 | 7.6%).
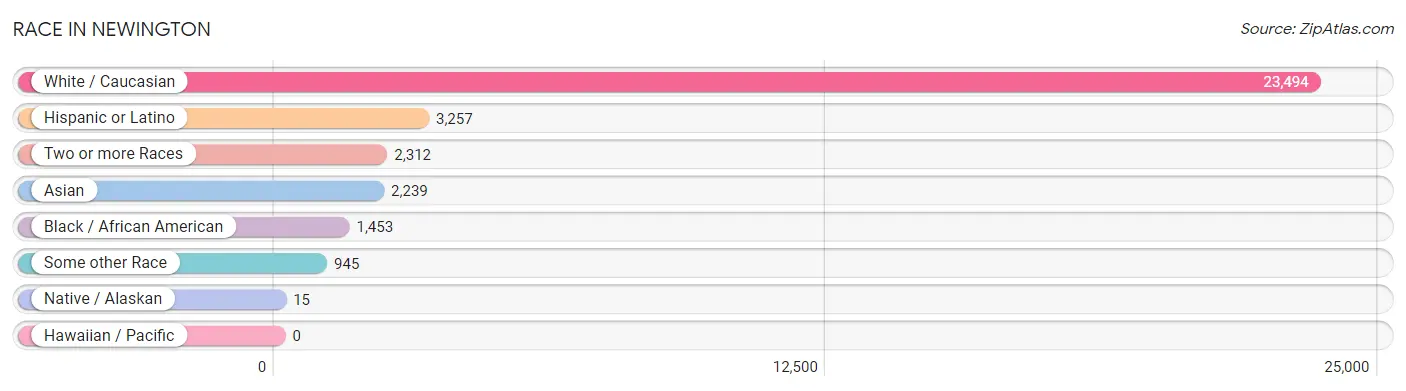
| Race | # Population | % Population |
| Asian | 2,239 | 7.3% |
| Black / African American | 1,453 | 4.8% |
| Hawaiian / Pacific | 0 | 0.0% |
| Hispanic or Latino | 3,257 | 10.7% |
| Native / Alaskan | 15 | 0.1% |
| White / Caucasian | 23,494 | 77.1% |
| Two or more Races | 2,312 | 7.6% |
| Some other Race | 945 | 3.1% |
| Total | 30,458 | 100.0% |
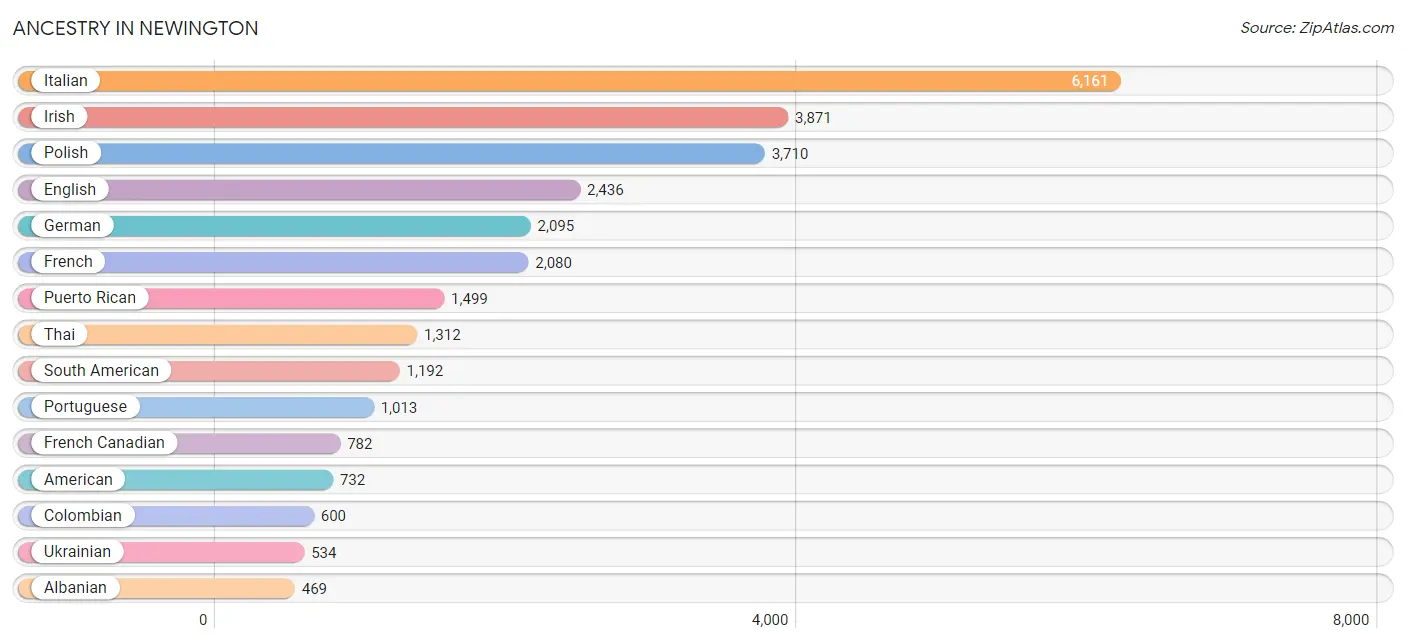
Ancestry in Newington
The most populous ancestries reported in Newington are Italian (6,161 | 20.2%), Irish (3,871 | 12.7%), Polish (3,710 | 12.2%), English (2,436 | 8.0%), and German (2,095 | 6.9%), together accounting for 60.0% of all Newington residents.
| Ancestry | # Population | % Population |
| African | 9 | 0.0% |
| Albanian | 469 | 1.5% |
| Alsatian | 8 | 0.0% |
| American | 732 | 2.4% |
| Arab | 163 | 0.5% |
| Armenian | 119 | 0.4% |
| Assyrian / Chaldean / Syriac | 6 | 0.0% |
| Austrian | 69 | 0.2% |
| Barbadian | 12 | 0.0% |
| Belgian | 7 | 0.0% |
| Bhutanese | 12 | 0.0% |
| Blackfeet | 221 | 0.7% |
| Bolivian | 57 | 0.2% |
| British | 77 | 0.3% |
| British West Indian | 21 | 0.1% |
| Bulgarian | 37 | 0.1% |
| Burmese | 271 | 0.9% |
| Canadian | 86 | 0.3% |
| Central American | 53 | 0.2% |
| Central American Indian | 30 | 0.1% |
| Chilean | 10 | 0.0% |
| Colombian | 600 | 2.0% |
| Creek | 30 | 0.1% |
| Croatian | 14 | 0.1% |
| Cuban | 51 | 0.2% |
| Czech | 104 | 0.3% |
| Czechoslovakian | 12 | 0.0% |
| Danish | 122 | 0.4% |
| Dominican | 87 | 0.3% |
| Dutch | 118 | 0.4% |
| Eastern European | 74 | 0.2% |
| Ecuadorian | 42 | 0.1% |
| English | 2,436 | 8.0% |
| Ethiopian | 112 | 0.4% |
| European | 133 | 0.4% |
| Filipino | 37 | 0.1% |
| Finnish | 17 | 0.1% |
| French | 2,080 | 6.8% |
| French American Indian | 37 | 0.1% |
| French Canadian | 782 | 2.6% |
| German | 2,095 | 6.9% |
| Ghanaian | 47 | 0.2% |
| Greek | 148 | 0.5% |
| Guyanese | 13 | 0.0% |
| Haitian | 83 | 0.3% |
| Honduran | 45 | 0.2% |
| Hungarian | 160 | 0.5% |
| Indian (Asian) | 362 | 1.2% |
| Irish | 3,871 | 12.7% |
| Iroquois | 106 | 0.4% |
| Italian | 6,161 | 20.2% |
| Jamaican | 335 | 1.1% |
| Jordanian | 28 | 0.1% |
| Korean | 287 | 0.9% |
| Latvian | 5 | 0.0% |
| Lebanese | 59 | 0.2% |
| Lithuanian | 101 | 0.3% |
| Mexican | 224 | 0.7% |
| Moroccan | 6 | 0.0% |
| Nigerian | 51 | 0.2% |
| Norwegian | 68 | 0.2% |
| Pakistani | 8 | 0.0% |
| Palestinian | 40 | 0.1% |
| Peruvian | 447 | 1.5% |
| Polish | 3,710 | 12.2% |
| Portuguese | 1,013 | 3.3% |
| Puerto Rican | 1,499 | 4.9% |
| Romanian | 27 | 0.1% |
| Russian | 374 | 1.2% |
| Salvadoran | 8 | 0.0% |
| Scandinavian | 26 | 0.1% |
| Scotch-Irish | 129 | 0.4% |
| Scottish | 352 | 1.2% |
| Slovak | 89 | 0.3% |
| South American | 1,192 | 3.9% |
| Spaniard | 45 | 0.2% |
| Spanish | 24 | 0.1% |
| Sri Lankan | 109 | 0.4% |
| Subsaharan African | 274 | 0.9% |
| Swedish | 362 | 1.2% |
| Swiss | 36 | 0.1% |
| Syrian | 32 | 0.1% |
| Thai | 1,312 | 4.3% |
| Turkish | 138 | 0.4% |
| Ugandan | 27 | 0.1% |
| Ukrainian | 534 | 1.8% |
| Venezuelan | 36 | 0.1% |
| Welsh | 43 | 0.1% |
| West Indian | 10 | 0.0% |
| Yugoslavian | 87 | 0.3% | View All 90 Rows |
Immigrants in Newington
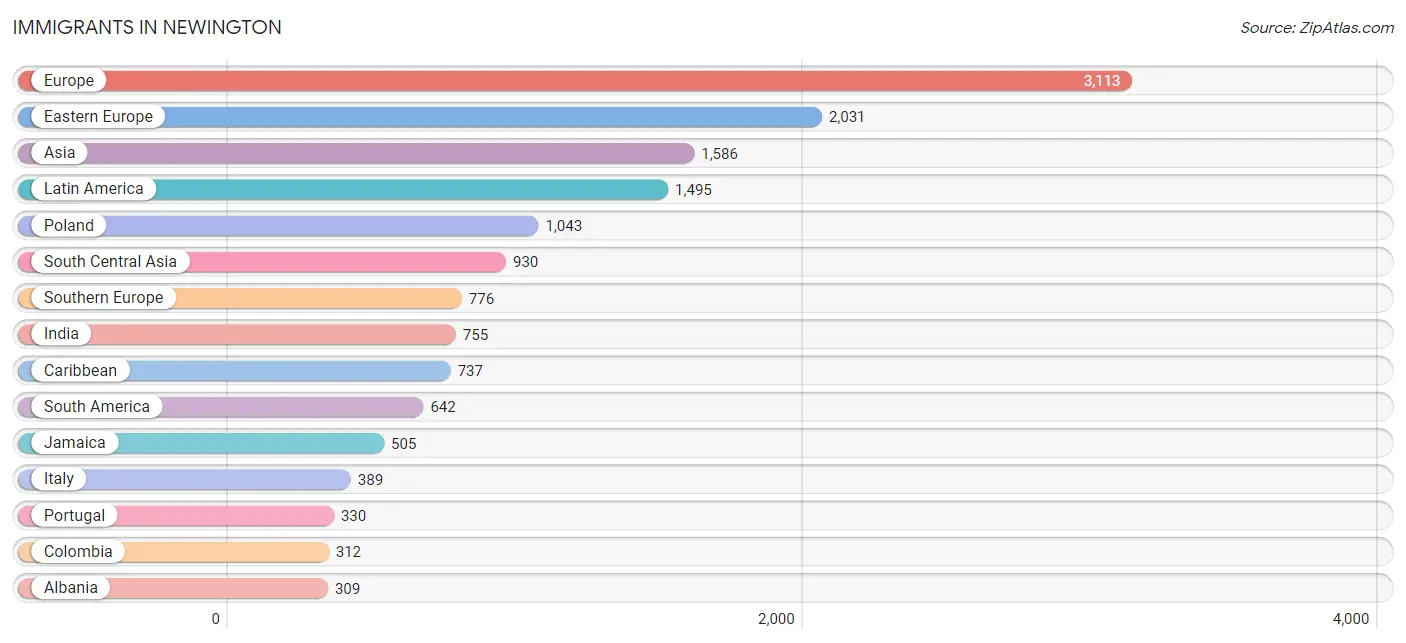
The most numerous immigrant groups reported in Newington came from Europe (3,113 | 10.2%), Eastern Europe (2,031 | 6.7%), Asia (1,586 | 5.2%), Latin America (1,495 | 4.9%), and Poland (1,043 | 3.4%), together accounting for 30.4% of all Newington residents.
| Immigration Origin | # Population | % Population |
| Africa | 126 | 0.4% |
| Albania | 309 | 1.0% |
| Asia | 1,586 | 5.2% |
| Austria | 8 | 0.0% |
| Azores | 11 | 0.0% |
| Barbados | 79 | 0.3% |
| Belarus | 67 | 0.2% |
| Bolivia | 57 | 0.2% |
| Bosnia and Herzegovina | 101 | 0.3% |
| Bulgaria | 37 | 0.1% |
| Canada | 100 | 0.3% |
| Caribbean | 737 | 2.4% |
| Central America | 116 | 0.4% |
| Chile | 34 | 0.1% |
| China | 139 | 0.5% |
| Colombia | 312 | 1.0% |
| Cuba | 27 | 0.1% |
| Dominican Republic | 32 | 0.1% |
| Eastern Africa | 64 | 0.2% |
| Eastern Asia | 261 | 0.9% |
| Eastern Europe | 2,031 | 6.7% |
| Ecuador | 15 | 0.1% |
| El Salvador | 8 | 0.0% |
| England | 126 | 0.4% |
| Ethiopia | 27 | 0.1% |
| Europe | 3,113 | 10.2% |
| France | 16 | 0.1% |
| Germany | 37 | 0.1% |
| Ghana | 19 | 0.1% |
| Greece | 15 | 0.1% |
| Guyana | 7 | 0.0% |
| Haiti | 83 | 0.3% |
| Honduras | 45 | 0.2% |
| Hong Kong | 14 | 0.1% |
| India | 755 | 2.5% |
| Ireland | 14 | 0.1% |
| Italy | 389 | 1.3% |
| Jamaica | 505 | 1.7% |
| Jordan | 15 | 0.1% |
| Kenya | 37 | 0.1% |
| Korea | 122 | 0.4% |
| Latin America | 1,495 | 4.9% |
| Latvia | 24 | 0.1% |
| Mexico | 63 | 0.2% |
| Middle Africa | 14 | 0.1% |
| Morocco | 6 | 0.0% |
| Nigeria | 11 | 0.0% |
| Northern Africa | 18 | 0.1% |
| Northern Europe | 165 | 0.5% |
| Pakistan | 148 | 0.5% |
| Peru | 157 | 0.5% |
| Philippines | 165 | 0.5% |
| Poland | 1,043 | 3.4% |
| Portugal | 330 | 1.1% |
| Romania | 27 | 0.1% |
| Russia | 120 | 0.4% |
| Scotland | 9 | 0.0% |
| South America | 642 | 2.1% |
| South Central Asia | 930 | 3.0% |
| South Eastern Asia | 233 | 0.8% |
| Southern Europe | 776 | 2.5% |
| Spain | 42 | 0.1% |
| Sri Lanka | 27 | 0.1% |
| Switzerland | 30 | 0.1% |
| Syria | 13 | 0.0% |
| Taiwan | 63 | 0.2% |
| Turkey | 88 | 0.3% |
| Ukraine | 303 | 1.0% |
| Venezuela | 60 | 0.2% |
| Vietnam | 68 | 0.2% |
| Western Africa | 30 | 0.1% |
| Western Asia | 140 | 0.5% |
| Western Europe | 91 | 0.3% | View All 73 Rows |
Sex and Age in Newington
Sex and Age in Newington
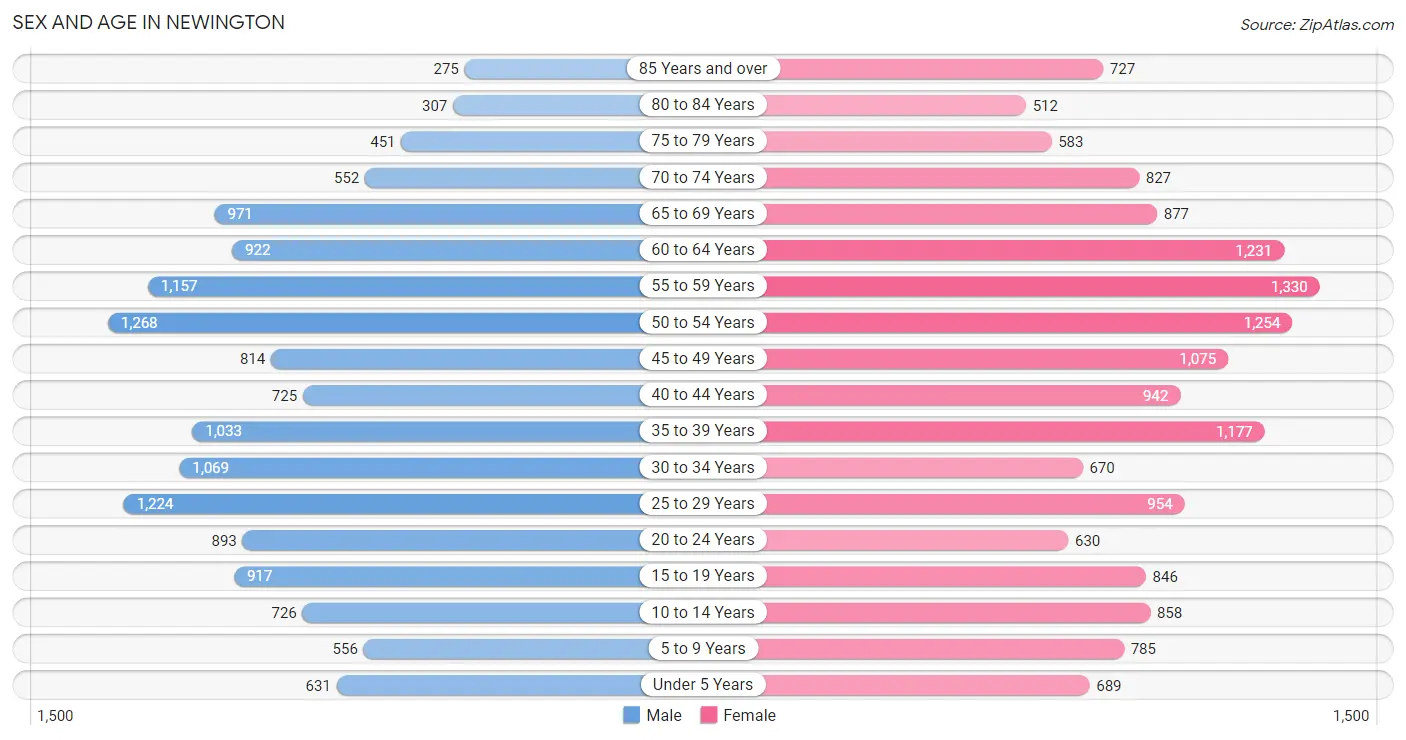
The most populous age groups in Newington are 50 to 54 Years (1,268 | 8.7%) for men and 55 to 59 Years (1,330 | 8.3%) for women.
| Age Bracket | Male | Female |
| Under 5 Years | 631 (4.3%) | 689 (4.3%) |
| 5 to 9 Years | 556 (3.8%) | 785 (4.9%) |
| 10 to 14 Years | 726 (5.0%) | 858 (5.4%) |
| 15 to 19 Years | 917 (6.3%) | 846 (5.3%) |
| 20 to 24 Years | 893 (6.2%) | 630 (4.0%) |
| 25 to 29 Years | 1,224 (8.5%) | 954 (6.0%) |
| 30 to 34 Years | 1,069 (7.4%) | 670 (4.2%) |
| 35 to 39 Years | 1,033 (7.1%) | 1,177 (7.4%) |
| 40 to 44 Years | 725 (5.0%) | 942 (5.9%) |
| 45 to 49 Years | 814 (5.6%) | 1,075 (6.7%) |
| 50 to 54 Years | 1,268 (8.7%) | 1,254 (7.9%) |
| 55 to 59 Years | 1,157 (8.0%) | 1,330 (8.3%) |
| 60 to 64 Years | 922 (6.4%) | 1,231 (7.7%) |
| 65 to 69 Years | 971 (6.7%) | 877 (5.5%) |
| 70 to 74 Years | 552 (3.8%) | 827 (5.2%) |
| 75 to 79 Years | 451 (3.1%) | 583 (3.6%) |
| 80 to 84 Years | 307 (2.1%) | 512 (3.2%) |
| 85 Years and over | 275 (1.9%) | 727 (4.5%) |
| Total | 14,491 (100.0%) | 15,967 (100.0%) |
Families and Households in Newington
Median Family Size in Newington
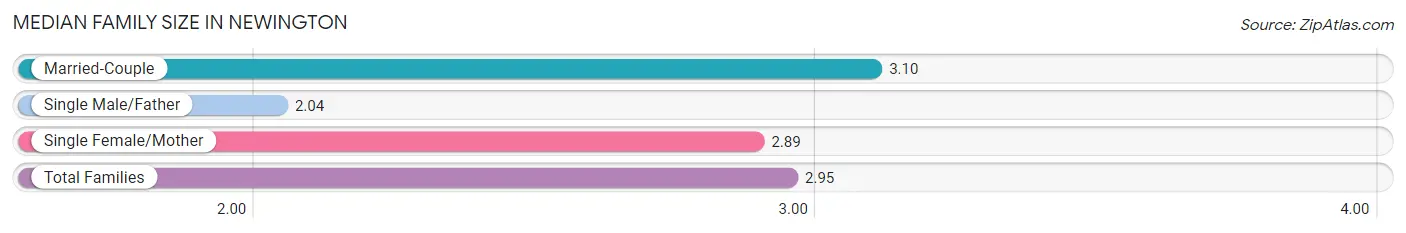
The median family size in Newington is 2.95 persons per family, with married-couple families (5,831 | 70.9%) accounting for the largest median family size of 3.1 persons per family. On the other hand, single male/father families (798 | 9.7%) represent the smallest median family size with 2.04 persons per family.
| Family Type | # Families | Family Size |
| Married-Couple | 5,831 (70.9%) | 3.10 |
| Single Male/Father | 798 (9.7%) | 2.04 |
| Single Female/Mother | 1,595 (19.4%) | 2.89 |
| Total Families | 8,224 (100.0%) | 2.95 |
Median Household Size in Newington
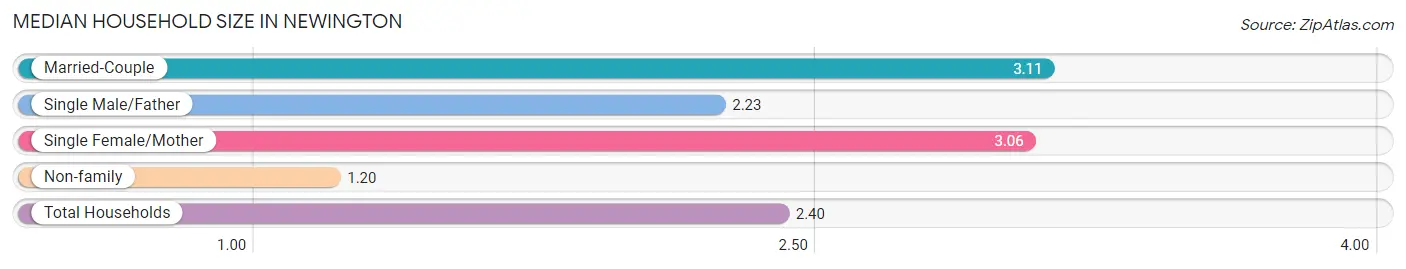
The median household size in Newington is 2.40 persons per household, with married-couple households (5,831 | 46.6%) accounting for the largest median household size of 3.11 persons per household. non-family households (4,290 | 34.3%) represent the smallest median household size with 1.20 persons per household.
| Household Type | # Households | Household Size |
| Married-Couple | 5,831 (46.6%) | 3.11 |
| Single Male/Father | 798 (6.4%) | 2.23 |
| Single Female/Mother | 1,595 (12.8%) | 3.06 |
| Non-family | 4,290 (34.3%) | 1.20 |
| Total Households | 12,514 (100.0%) | 2.40 |
Household Size by Marriage Status in Newington
Out of a total of 12,514 households in Newington, 8,224 (65.7%) are family households, while 4,290 (34.3%) are nonfamily households. The most numerous type of family households are 2-person households, comprising 3,921, and the most common type of nonfamily households are 1-person households, comprising 3,509.
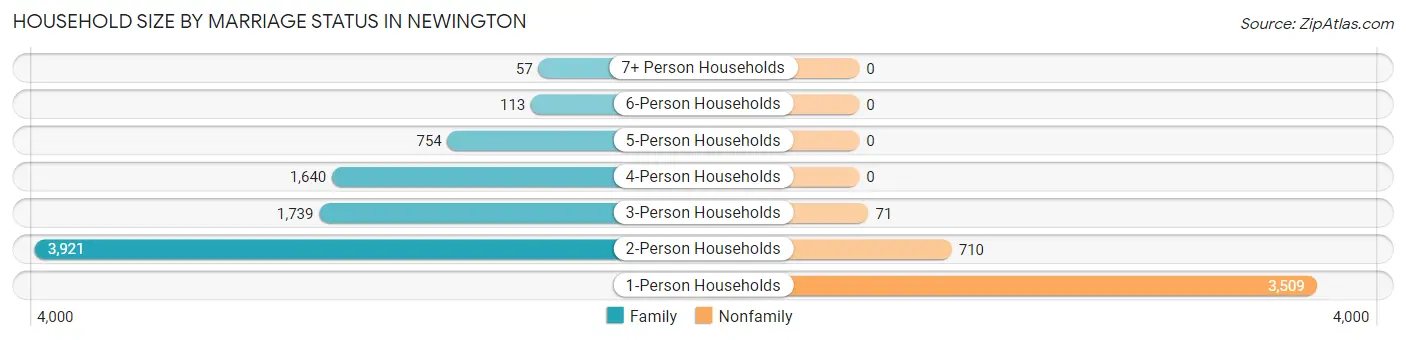
| Household Size | Family Households | Nonfamily Households |
| 1-Person Households | - | 3,509 (28.0%) |
| 2-Person Households | 3,921 (31.3%) | 710 (5.7%) |
| 3-Person Households | 1,739 (13.9%) | 71 (0.6%) |
| 4-Person Households | 1,640 (13.1%) | 0 (0.0%) |
| 5-Person Households | 754 (6.0%) | 0 (0.0%) |
| 6-Person Households | 113 (0.9%) | 0 (0.0%) |
| 7+ Person Households | 57 (0.5%) | 0 (0.0%) |
| Total | 8,224 (65.7%) | 4,290 (34.3%) |
Female Fertility in Newington
Fertility by Age in Newington
Average fertility rate in Newington is 48.0 births per 1,000 women. Women in the age bracket of 20 to 34 years have the highest fertility rate with 78.0 births per 1,000 women. Women in the age bracket of 20 to 34 years acount for 56.2% of all women with births.
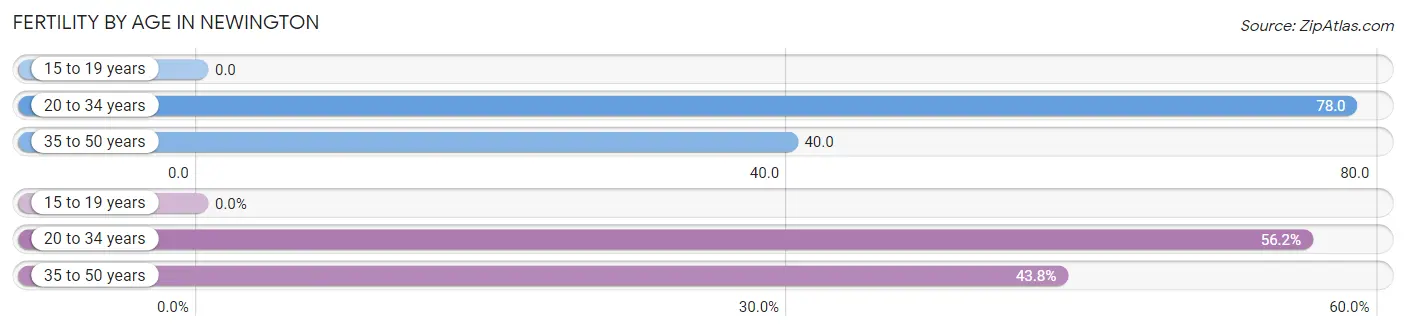
| Age Bracket | Women with Births | Births / 1,000 Women |
| 15 to 19 years | 0 (0.0%) | 0.0 |
| 20 to 34 years | 176 (56.2%) | 78.0 |
| 35 to 50 years | 137 (43.8%) | 40.0 |
| Total | 313 (100.0%) | 48.0 |
Fertility by Age by Marriage Status in Newington
76.0% of women with births (313) in Newington are married. The highest percentage of unmarried women with births falls into 35 to 50 years age bracket with 28.5% of them unmarried at the time of birth, while the lowest percentage of unmarried women with births belong to 20 to 34 years age bracket with 20.5% of them unmarried.
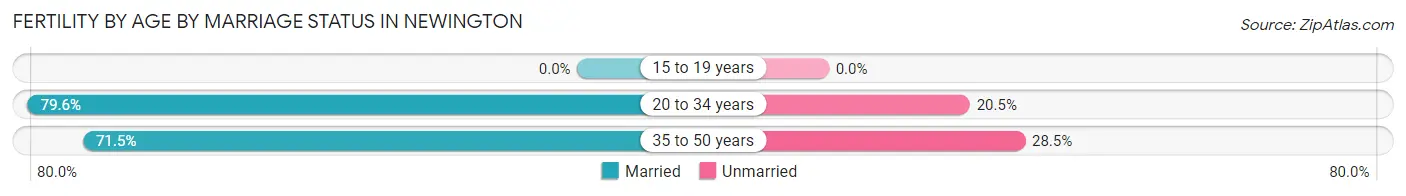
| Age Bracket | Married | Unmarried |
| 15 to 19 years | 0 (0.0%) | 0 (0.0%) |
| 20 to 34 years | 140 (79.5%) | 36 (20.4%) |
| 35 to 50 years | 98 (71.5%) | 39 (28.5%) |
| Total | 238 (76.0%) | 75 (24.0%) |
Fertility by Education in Newington
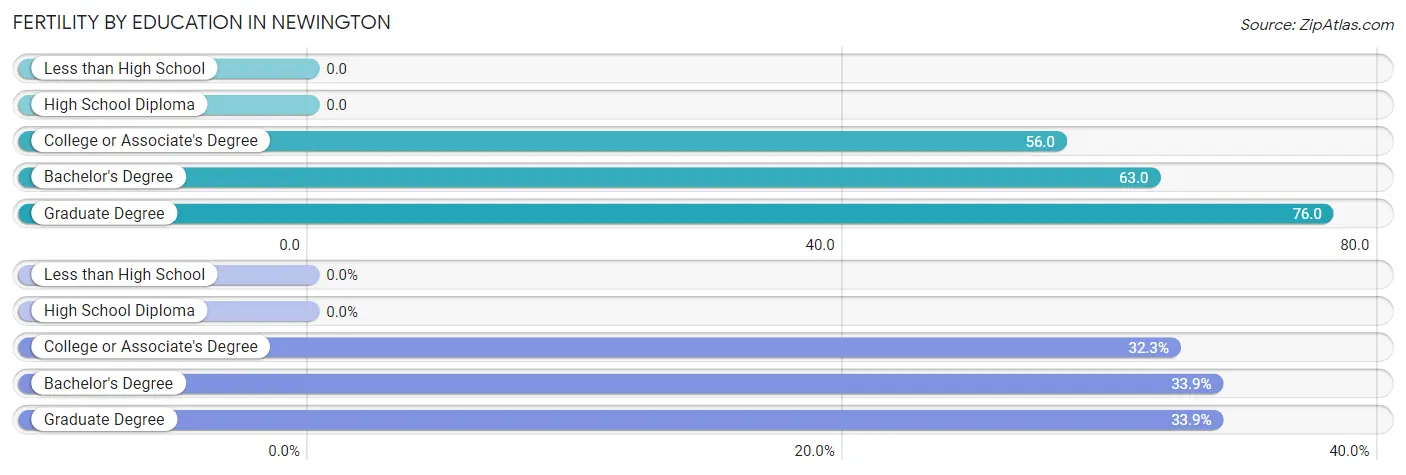
| Educational Attainment | Women with Births | Births / 1,000 Women |
| Less than High School | 0 (0.0%) | 0.0 |
| High School Diploma | 0 (0.0%) | 0.0 |
| College or Associate's Degree | 101 (32.3%) | 56.0 |
| Bachelor's Degree | 106 (33.9%) | 63.0 |
| Graduate Degree | 106 (33.9%) | 76.0 |
| Total | 313 (100.0%) | 48.0 |
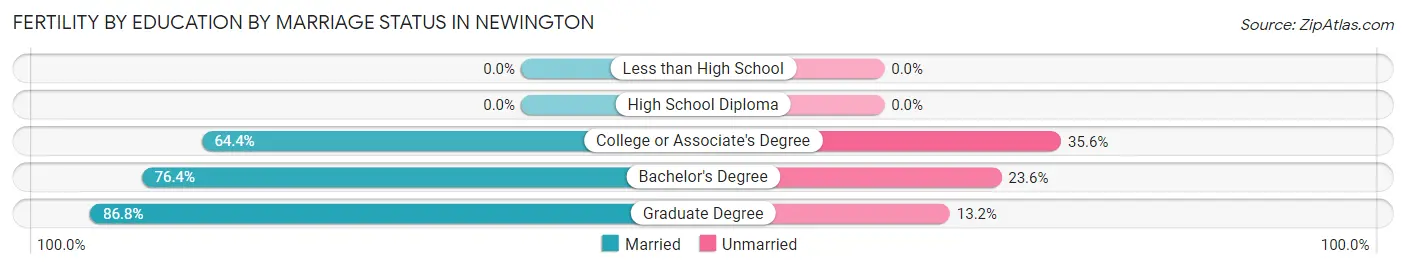
Fertility by Education by Marriage Status in Newington
24.0% of women with births in Newington are unmarried. Women with the educational attainment of graduate degree are most likely to be married with 86.8% of them married at childbirth, while women with the educational attainment of college or associate's degree are least likely to be married with 35.6% of them unmarried at childbirth.
| Educational Attainment | Married | Unmarried |
| Less than High School | 0 (0.0%) | 0 (0.0%) |
| High School Diploma | 0 (0.0%) | 0 (0.0%) |
| College or Associate's Degree | 65 (64.4%) | 36 (35.6%) |
| Bachelor's Degree | 81 (76.4%) | 25 (23.6%) |
| Graduate Degree | 92 (86.8%) | 14 (13.2%) |
| Total | 238 (76.0%) | 75 (24.0%) |
Employment Characteristics in Newington
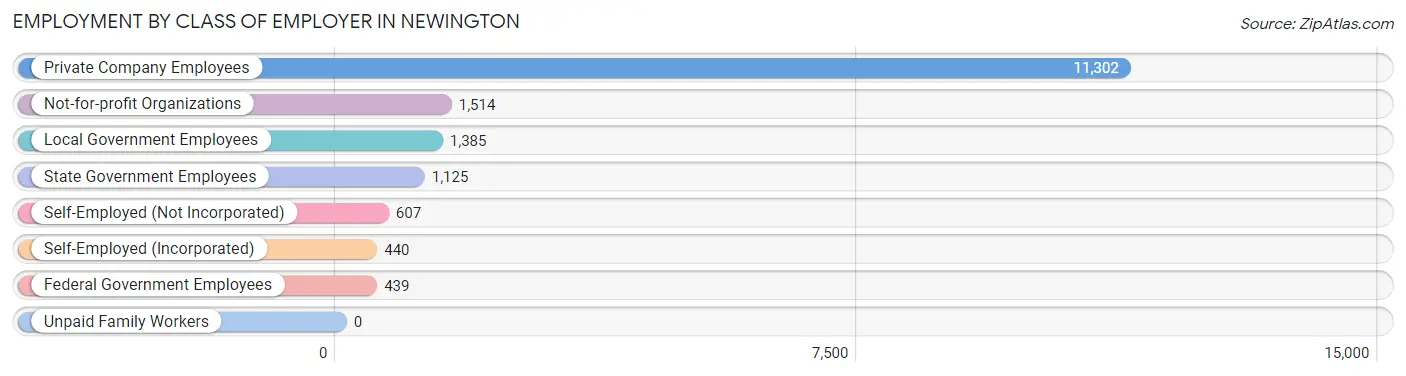
Employment by Class of Employer in Newington
Among the 16,812 employed individuals in Newington, private company employees (11,302 | 67.2%), not-for-profit organizations (1,514 | 9.0%), and local government employees (1,385 | 8.2%) make up the most common classes of employment.
| Employer Class | # Employees | % Employees |
| Private Company Employees | 11,302 | 67.2% |
| Self-Employed (Incorporated) | 440 | 2.6% |
| Self-Employed (Not Incorporated) | 607 | 3.6% |
| Not-for-profit Organizations | 1,514 | 9.0% |
| Local Government Employees | 1,385 | 8.2% |
| State Government Employees | 1,125 | 6.7% |
| Federal Government Employees | 439 | 2.6% |
| Unpaid Family Workers | 0 | 0.0% |
| Total | 16,812 | 100.0% |
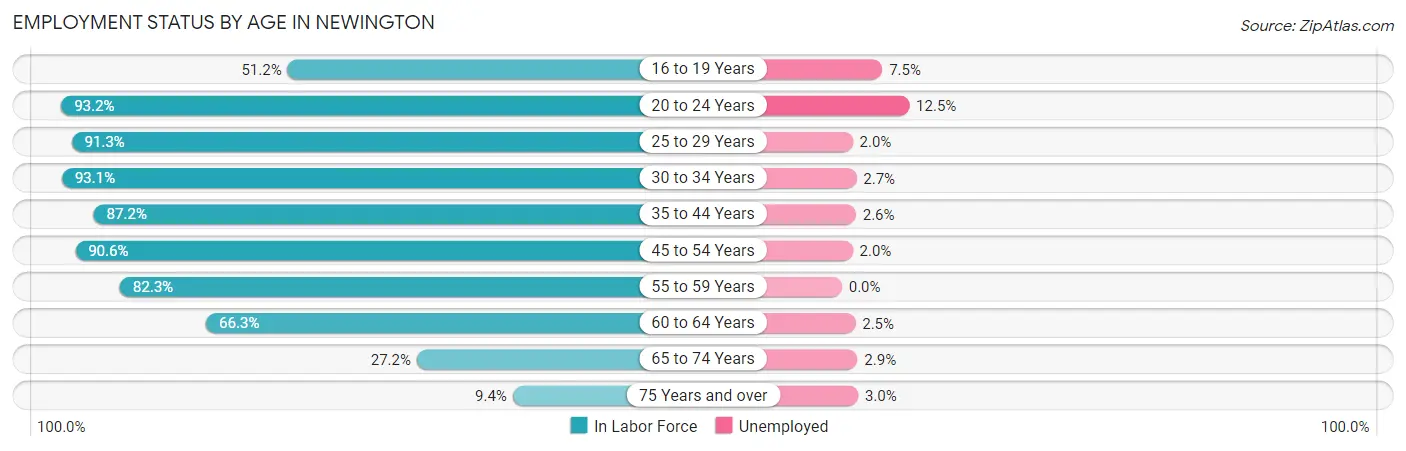
Employment Status by Age in Newington
According to the labor force statistics for Newington, out of the total population over 16 years of age (25,822), 68.7% or 17,740 individuals are in the labor force, with 3.1% or 550 of them unemployed. The age group with the highest labor force participation rate is 20 to 24 years, with 93.2% or 1,419 individuals in the labor force. Within the labor force, the 20 to 24 years age range has the highest percentage of unemployed individuals, with 12.5% or 177 of them being unemployed.
| Age Bracket | In Labor Force | Unemployed |
| 16 to 19 Years | 702 (51.2%) | 53 (7.5%) |
| 20 to 24 Years | 1,419 (93.2%) | 177 (12.5%) |
| 25 to 29 Years | 1,989 (91.3%) | 40 (2.0%) |
| 30 to 34 Years | 1,619 (93.1%) | 44 (2.7%) |
| 35 to 44 Years | 3,381 (87.2%) | 88 (2.6%) |
| 45 to 54 Years | 3,996 (90.6%) | 80 (2.0%) |
| 55 to 59 Years | 2,047 (82.3%) | 0 (0.0%) |
| 60 to 64 Years | 1,427 (66.3%) | 36 (2.5%) |
| 65 to 74 Years | 878 (27.2%) | 25 (2.9%) |
| 75 Years and over | 268 (9.4%) | 8 (3.0%) |
| Total | 17,740 (68.7%) | 550 (3.1%) |
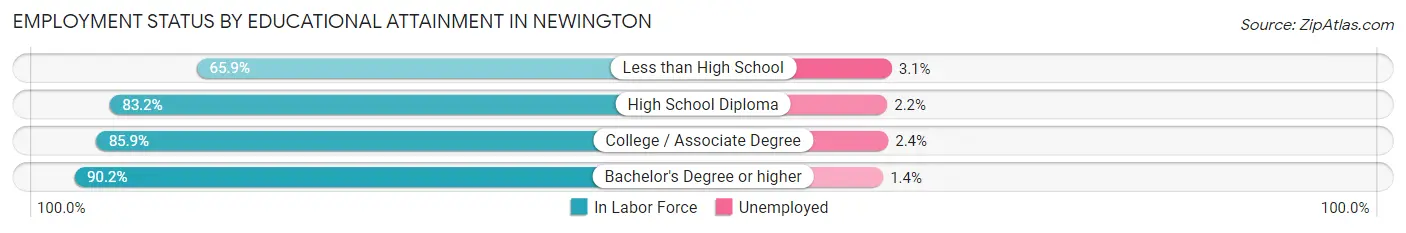
Employment Status by Educational Attainment in Newington
According to labor force statistics for Newington, 85.8% of individuals (14,453) out of the total population between 25 and 64 years of age (16,845) are in the labor force, with 2.0% or 289 of them being unemployed. The group with the highest labor force participation rate are those with the educational attainment of bachelor's degree or higher, with 90.2% or 6,407 individuals in the labor force. Within the labor force, individuals with less than high school education have the highest percentage of unemployment, with 3.1% or 22 of them being unemployed.
| Educational Attainment | In Labor Force | Unemployed |
| Less than High School | 706 (65.9%) | 33 (3.1%) |
| High School Diploma | 2,984 (83.2%) | 79 (2.2%) |
| College / Associate Degree | 4,368 (85.9%) | 122 (2.4%) |
| Bachelor's Degree or higher | 6,407 (90.2%) | 99 (1.4%) |
| Total | 14,453 (85.8%) | 337 (2.0%) |
Employment Occupations by Sex in Newington
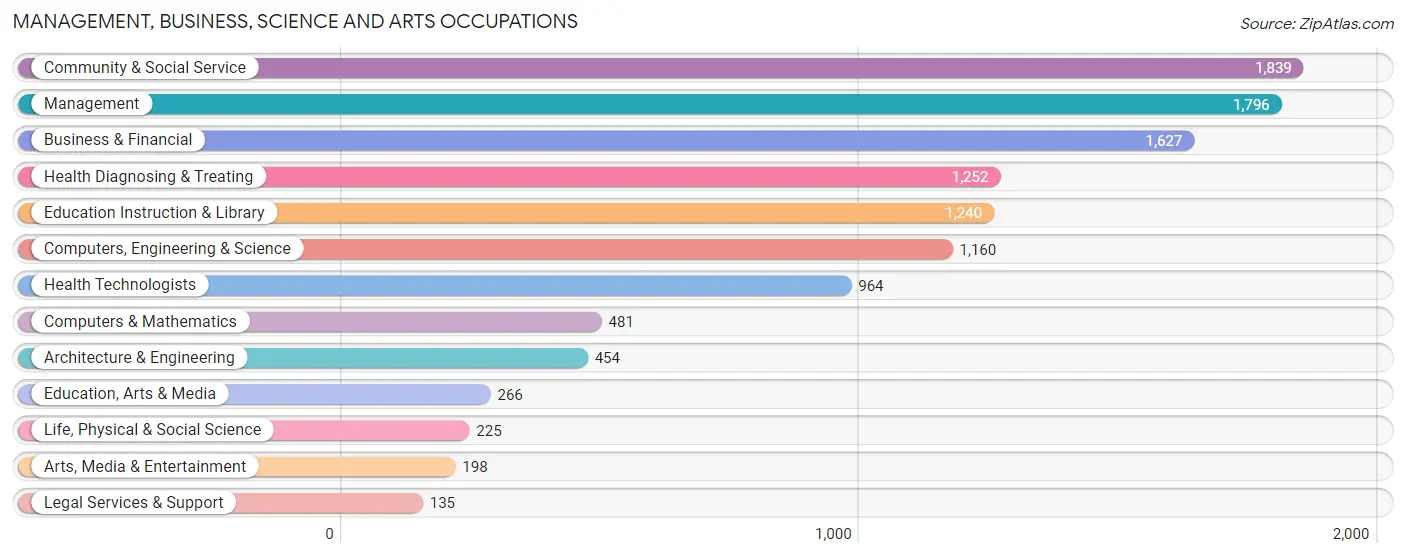
Management, Business, Science and Arts Occupations
The most common Management, Business, Science and Arts occupations in Newington are Community & Social Service (1,839 | 10.7%), Management (1,796 | 10.5%), Business & Financial (1,627 | 9.5%), Health Diagnosing & Treating (1,252 | 7.3%), and Education Instruction & Library (1,240 | 7.2%).
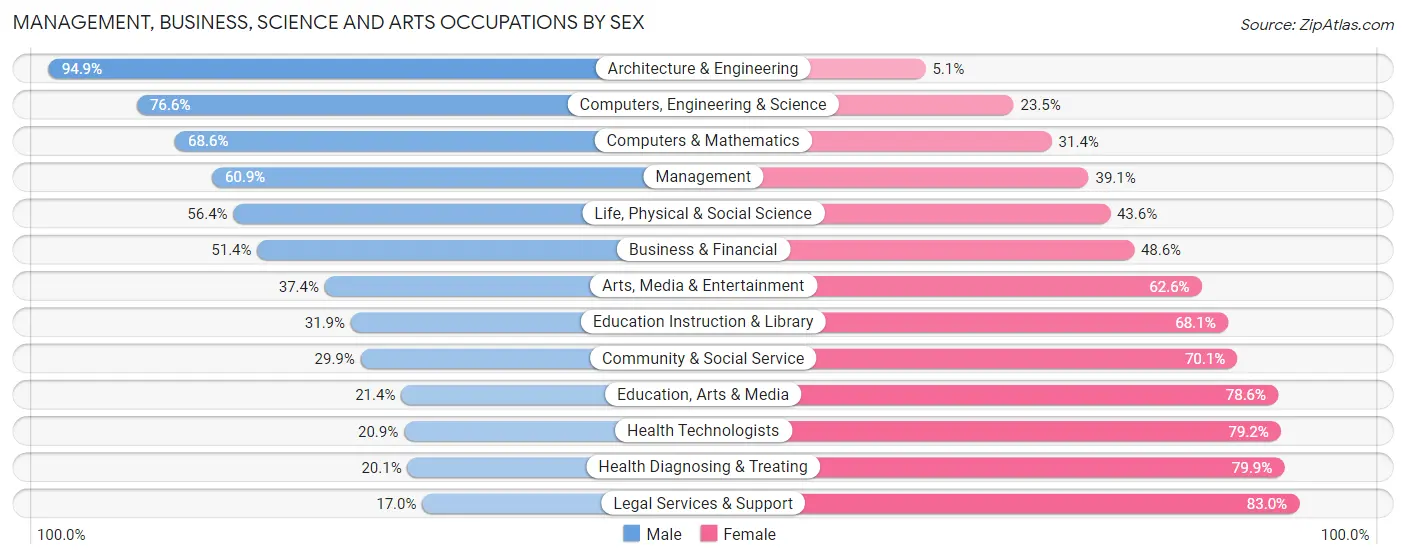
Management, Business, Science and Arts Occupations by Sex
Within the Management, Business, Science and Arts occupations in Newington, the most male-oriented occupations are Architecture & Engineering (94.9%), Computers, Engineering & Science (76.5%), and Computers & Mathematics (68.6%), while the most female-oriented occupations are Legal Services & Support (83.0%), Health Diagnosing & Treating (79.9%), and Health Technologists (79.1%).
| Occupation | Male | Female |
| Management | 1,094 (60.9%) | 702 (39.1%) |
| Business & Financial | 837 (51.4%) | 790 (48.6%) |
| Computers, Engineering & Science | 888 (76.5%) | 272 (23.4%) |
| Computers & Mathematics | 330 (68.6%) | 151 (31.4%) |
| Architecture & Engineering | 431 (94.9%) | 23 (5.1%) |
| Life, Physical & Social Science | 127 (56.4%) | 98 (43.6%) |
| Community & Social Service | 550 (29.9%) | 1,289 (70.1%) |
| Education, Arts & Media | 57 (21.4%) | 209 (78.6%) |
| Legal Services & Support | 23 (17.0%) | 112 (83.0%) |
| Education Instruction & Library | 396 (31.9%) | 844 (68.1%) |
| Arts, Media & Entertainment | 74 (37.4%) | 124 (62.6%) |
| Health Diagnosing & Treating | 252 (20.1%) | 1,000 (79.9%) |
| Health Technologists | 201 (20.8%) | 763 (79.1%) |
| Total (Category) | 3,621 (47.2%) | 4,053 (52.8%) |
| Total (Overall) | 9,000 (52.5%) | 8,128 (47.4%) |
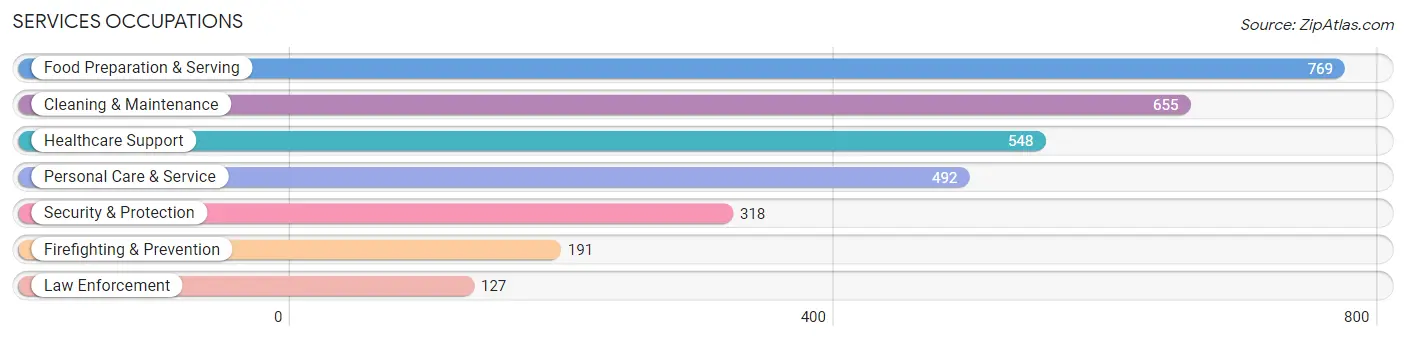
Services Occupations
The most common Services occupations in Newington are Food Preparation & Serving (769 | 4.5%), Cleaning & Maintenance (655 | 3.8%), Healthcare Support (548 | 3.2%), Personal Care & Service (492 | 2.9%), and Security & Protection (318 | 1.9%).
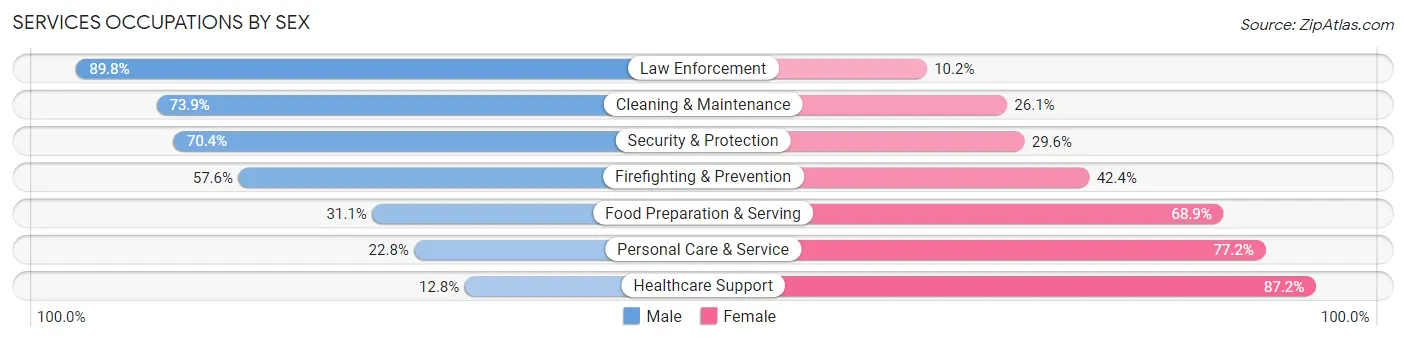
Services Occupations by Sex
Within the Services occupations in Newington, the most male-oriented occupations are Law Enforcement (89.8%), Cleaning & Maintenance (73.9%), and Security & Protection (70.4%), while the most female-oriented occupations are Healthcare Support (87.2%), Personal Care & Service (77.2%), and Food Preparation & Serving (68.9%).
| Occupation | Male | Female |
| Healthcare Support | 70 (12.8%) | 478 (87.2%) |
| Security & Protection | 224 (70.4%) | 94 (29.6%) |
| Firefighting & Prevention | 110 (57.6%) | 81 (42.4%) |
| Law Enforcement | 114 (89.8%) | 13 (10.2%) |
| Food Preparation & Serving | 239 (31.1%) | 530 (68.9%) |
| Cleaning & Maintenance | 484 (73.9%) | 171 (26.1%) |
| Personal Care & Service | 112 (22.8%) | 380 (77.2%) |
| Total (Category) | 1,129 (40.6%) | 1,653 (59.4%) |
| Total (Overall) | 9,000 (52.5%) | 8,128 (47.4%) |
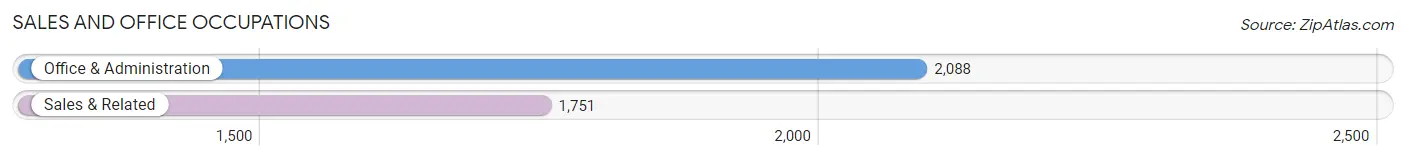
Sales and Office Occupations
The most common Sales and Office occupations in Newington are Office & Administration (2,088 | 12.2%), and Sales & Related (1,751 | 10.2%).
Sales and Office Occupations by Sex
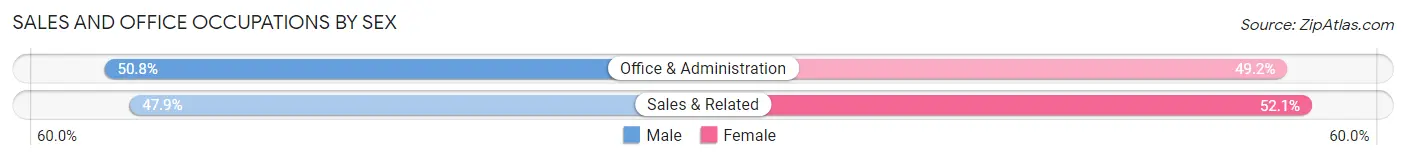
| Occupation | Male | Female |
| Sales & Related | 839 (47.9%) | 912 (52.1%) |
| Office & Administration | 1,060 (50.8%) | 1,028 (49.2%) |
| Total (Category) | 1,899 (49.5%) | 1,940 (50.5%) |
| Total (Overall) | 9,000 (52.5%) | 8,128 (47.4%) |
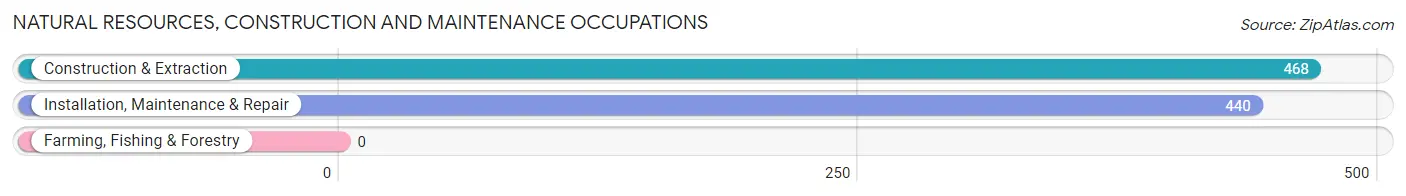
Natural Resources, Construction and Maintenance Occupations
The most common Natural Resources, Construction and Maintenance occupations in Newington are Construction & Extraction (468 | 2.7%), and Installation, Maintenance & Repair (440 | 2.6%).
Natural Resources, Construction and Maintenance Occupations by Sex
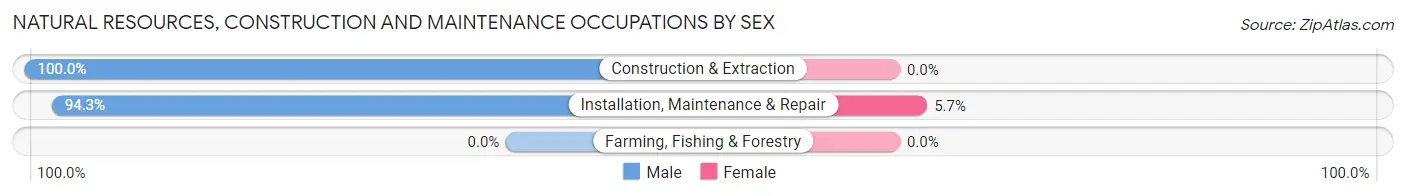
| Occupation | Male | Female |
| Farming, Fishing & Forestry | 0 (0.0%) | 0 (0.0%) |
| Construction & Extraction | 468 (100.0%) | 0 (0.0%) |
| Installation, Maintenance & Repair | 415 (94.3%) | 25 (5.7%) |
| Total (Category) | 883 (97.3%) | 25 (2.8%) |
| Total (Overall) | 9,000 (52.5%) | 8,128 (47.4%) |
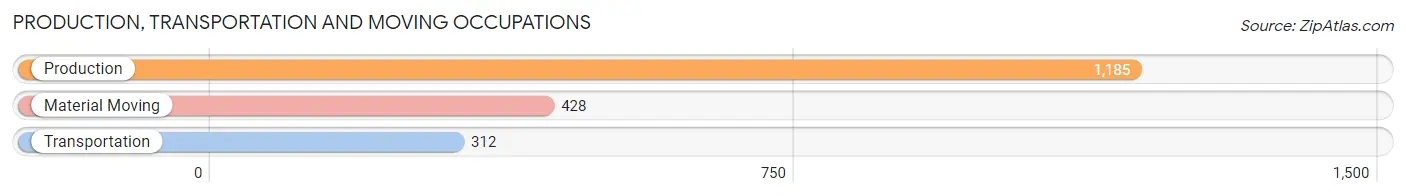
Production, Transportation and Moving Occupations
The most common Production, Transportation and Moving occupations in Newington are Production (1,185 | 6.9%), Material Moving (428 | 2.5%), and Transportation (312 | 1.8%).
Production, Transportation and Moving Occupations by Sex
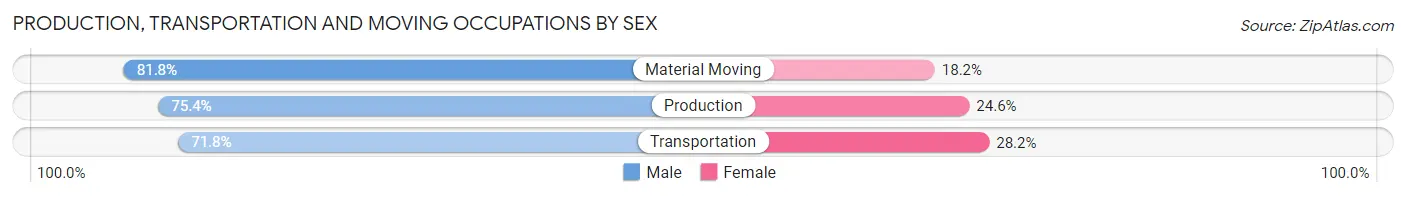
| Occupation | Male | Female |
| Production | 894 (75.4%) | 291 (24.6%) |
| Transportation | 224 (71.8%) | 88 (28.2%) |
| Material Moving | 350 (81.8%) | 78 (18.2%) |
| Total (Category) | 1,468 (76.3%) | 457 (23.7%) |
| Total (Overall) | 9,000 (52.5%) | 8,128 (47.4%) |
Employment Industries by Sex in Newington
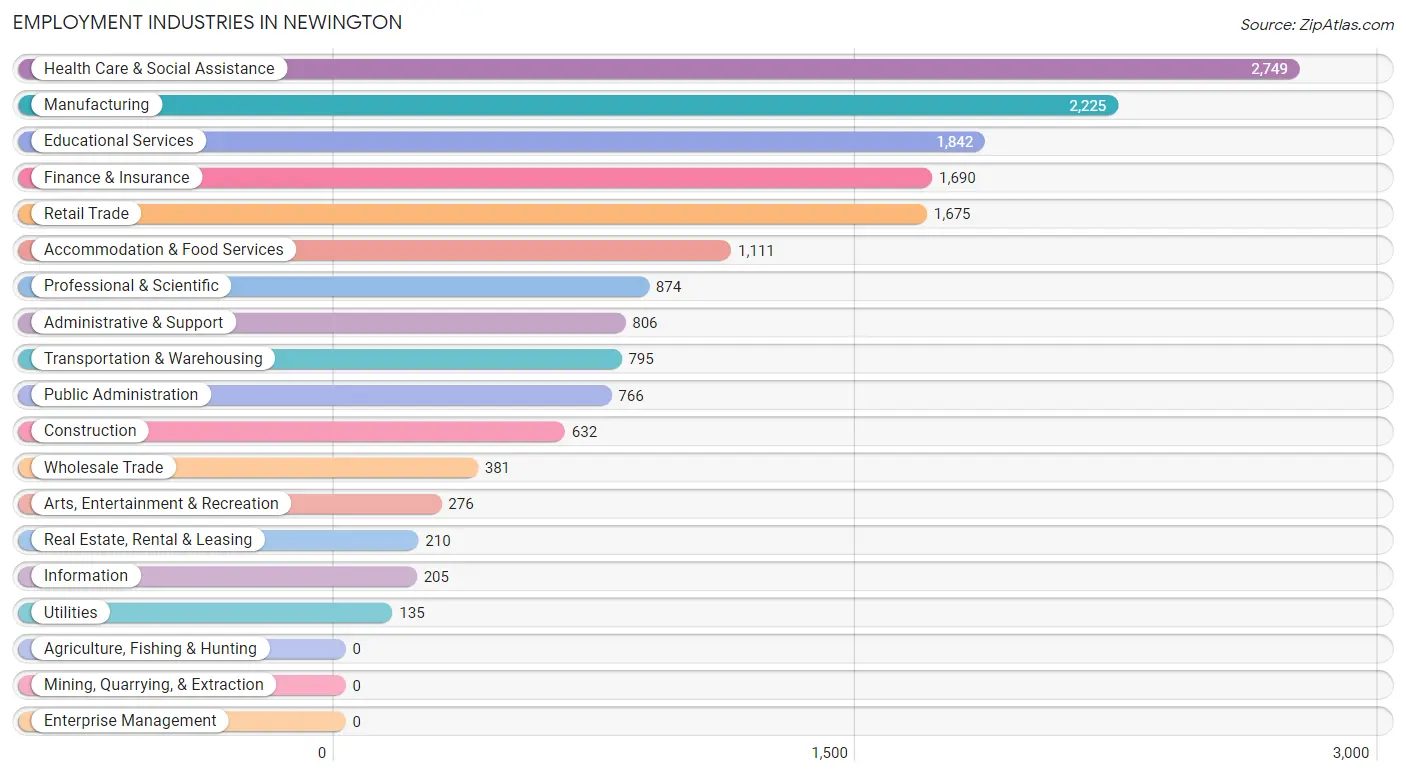
Employment Industries in Newington
The major employment industries in Newington include Health Care & Social Assistance (2,749 | 16.1%), Manufacturing (2,225 | 13.0%), Educational Services (1,842 | 10.7%), Finance & Insurance (1,690 | 9.9%), and Retail Trade (1,675 | 9.8%).
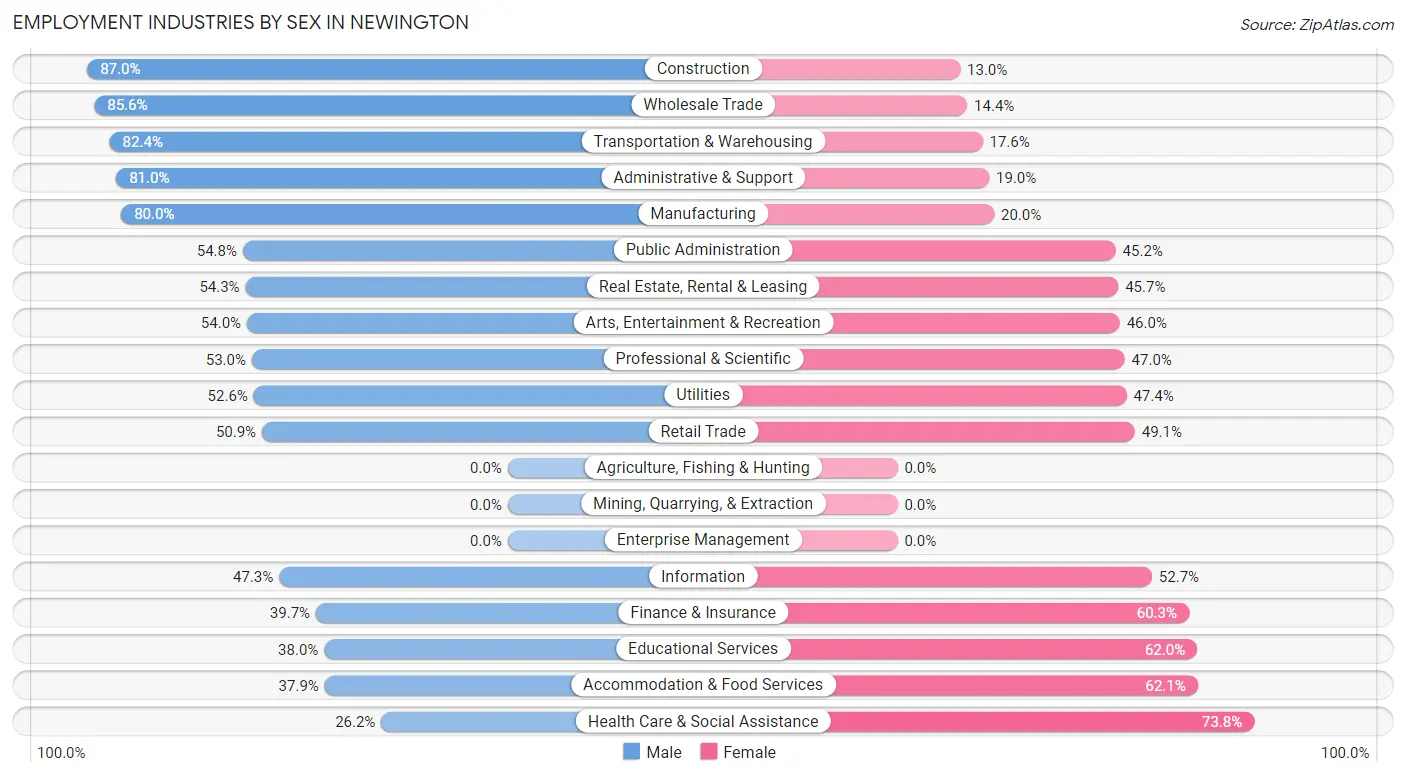
Employment Industries by Sex in Newington
The Newington industries that see more men than women are Construction (87.0%), Wholesale Trade (85.6%), and Transportation & Warehousing (82.4%), whereas the industries that tend to have a higher number of women are Health Care & Social Assistance (73.8%), Accommodation & Food Services (62.1%), and Educational Services (62.0%).
| Industry | Male | Female |
| Agriculture, Fishing & Hunting | 0 (0.0%) | 0 (0.0%) |
| Mining, Quarrying, & Extraction | 0 (0.0%) | 0 (0.0%) |
| Construction | 550 (87.0%) | 82 (13.0%) |
| Manufacturing | 1,780 (80.0%) | 445 (20.0%) |
| Wholesale Trade | 326 (85.6%) | 55 (14.4%) |
| Retail Trade | 852 (50.9%) | 823 (49.1%) |
| Transportation & Warehousing | 655 (82.4%) | 140 (17.6%) |
| Utilities | 71 (52.6%) | 64 (47.4%) |
| Information | 97 (47.3%) | 108 (52.7%) |
| Finance & Insurance | 671 (39.7%) | 1,019 (60.3%) |
| Real Estate, Rental & Leasing | 114 (54.3%) | 96 (45.7%) |
| Professional & Scientific | 463 (53.0%) | 411 (47.0%) |
| Enterprise Management | 0 (0.0%) | 0 (0.0%) |
| Administrative & Support | 653 (81.0%) | 153 (19.0%) |
| Educational Services | 700 (38.0%) | 1,142 (62.0%) |
| Health Care & Social Assistance | 720 (26.2%) | 2,029 (73.8%) |
| Arts, Entertainment & Recreation | 149 (54.0%) | 127 (46.0%) |
| Accommodation & Food Services | 421 (37.9%) | 690 (62.1%) |
| Public Administration | 420 (54.8%) | 346 (45.2%) |
| Total | 9,000 (52.5%) | 8,128 (47.4%) |
Education in Newington
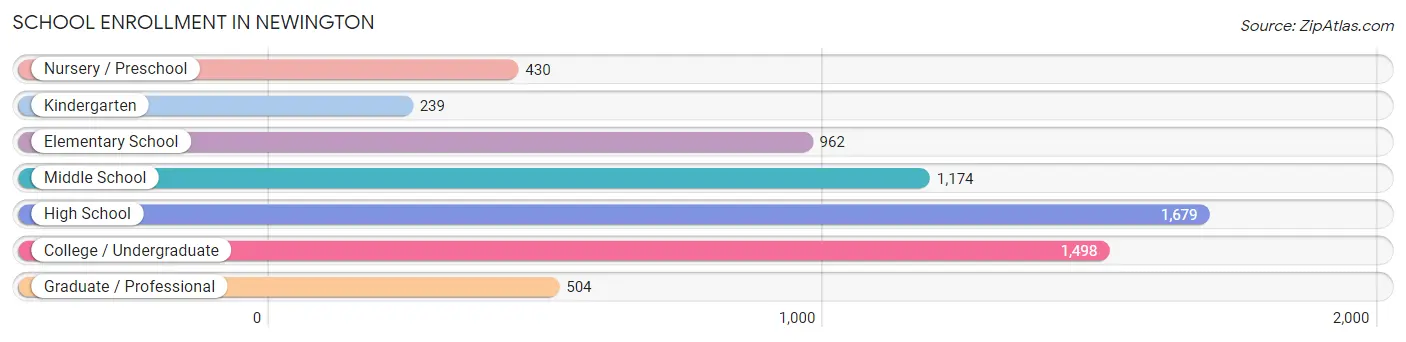
School Enrollment in Newington
The most common levels of schooling among the 6,486 students in Newington are high school (1,679 | 25.9%), college / undergraduate (1,498 | 23.1%), and middle school (1,174 | 18.1%).
| School Level | # Students | % Students |
| Nursery / Preschool | 430 | 6.6% |
| Kindergarten | 239 | 3.7% |
| Elementary School | 962 | 14.8% |
| Middle School | 1,174 | 18.1% |
| High School | 1,679 | 25.9% |
| College / Undergraduate | 1,498 | 23.1% |
| Graduate / Professional | 504 | 7.8% |
| Total | 6,486 | 100.0% |
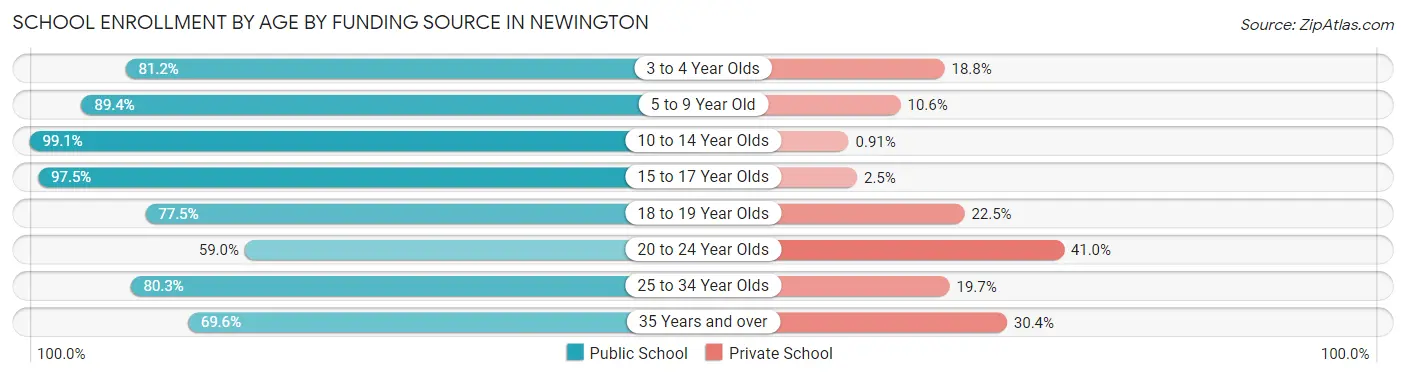
School Enrollment by Age by Funding Source in Newington
Out of a total of 6,486 students who are enrolled in schools in Newington, 882 (13.6%) attend a private institution, while the remaining 5,604 (86.4%) are enrolled in public schools. The age group of 20 to 24 year olds has the highest likelihood of being enrolled in private schools, with 244 (41.0% in the age bracket) enrolled. Conversely, the age group of 10 to 14 year olds has the lowest likelihood of being enrolled in a private school, with 1,524 (99.1% in the age bracket) attending a public institution.
| Age Bracket | Public School | Private School |
| 3 to 4 Year Olds | 255 (81.2%) | 59 (18.8%) |
| 5 to 9 Year Old | 1,165 (89.4%) | 138 (10.6%) |
| 10 to 14 Year Olds | 1,524 (99.1%) | 14 (0.9%) |
| 15 to 17 Year Olds | 1,019 (97.5%) | 26 (2.5%) |
| 18 to 19 Year Olds | 410 (77.5%) | 119 (22.5%) |
| 20 to 24 Year Olds | 351 (59.0%) | 244 (41.0%) |
| 25 to 34 Year Olds | 513 (80.3%) | 126 (19.7%) |
| 35 Years and over | 364 (69.6%) | 159 (30.4%) |
| Total | 5,604 (86.4%) | 882 (13.6%) |
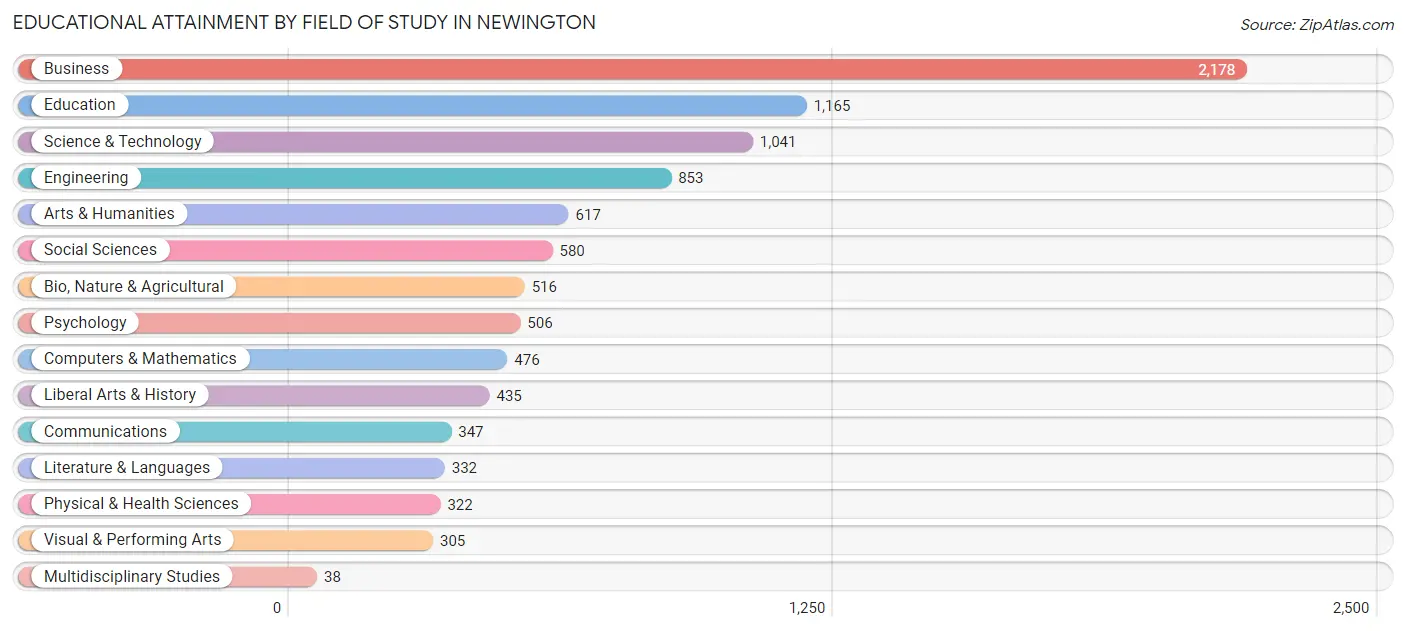
Educational Attainment by Field of Study in Newington
Business (2,178 | 22.4%), education (1,165 | 12.0%), science & technology (1,041 | 10.7%), engineering (853 | 8.8%), and arts & humanities (617 | 6.4%) are the most common fields of study among 9,711 individuals in Newington who have obtained a bachelor's degree or higher.
| Field of Study | # Graduates | % Graduates |
| Computers & Mathematics | 476 | 4.9% |
| Bio, Nature & Agricultural | 516 | 5.3% |
| Physical & Health Sciences | 322 | 3.3% |
| Psychology | 506 | 5.2% |
| Social Sciences | 580 | 6.0% |
| Engineering | 853 | 8.8% |
| Multidisciplinary Studies | 38 | 0.4% |
| Science & Technology | 1,041 | 10.7% |
| Business | 2,178 | 22.4% |
| Education | 1,165 | 12.0% |
| Literature & Languages | 332 | 3.4% |
| Liberal Arts & History | 435 | 4.5% |
| Visual & Performing Arts | 305 | 3.1% |
| Communications | 347 | 3.6% |
| Arts & Humanities | 617 | 6.4% |
| Total | 9,711 | 100.0% |
Transportation & Commute in Newington
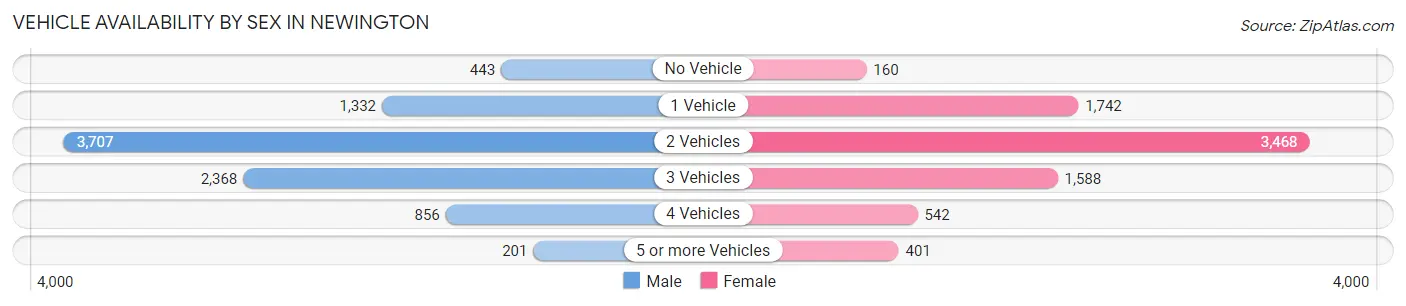
Vehicle Availability by Sex in Newington
The most prevalent vehicle ownership categories in Newington are males with 2 vehicles (3,707, accounting for 41.6%) and females with 2 vehicles (3,468, making up 46.9%).
| Vehicles Available | Male | Female |
| No Vehicle | 443 (5.0%) | 160 (2.0%) |
| 1 Vehicle | 1,332 (14.9%) | 1,742 (22.1%) |
| 2 Vehicles | 3,707 (41.6%) | 3,468 (43.9%) |
| 3 Vehicles | 2,368 (26.6%) | 1,588 (20.1%) |
| 4 Vehicles | 856 (9.6%) | 542 (6.9%) |
| 5 or more Vehicles | 201 (2.3%) | 401 (5.1%) |
| Total | 8,907 (100.0%) | 7,901 (100.0%) |
Commute Time in Newington
The most frequently occuring commute durations in Newington are 20 to 24 minutes (3,055 commuters, 20.5%), 10 to 14 minutes (3,010 commuters, 20.2%), and 15 to 19 minutes (2,965 commuters, 19.9%).
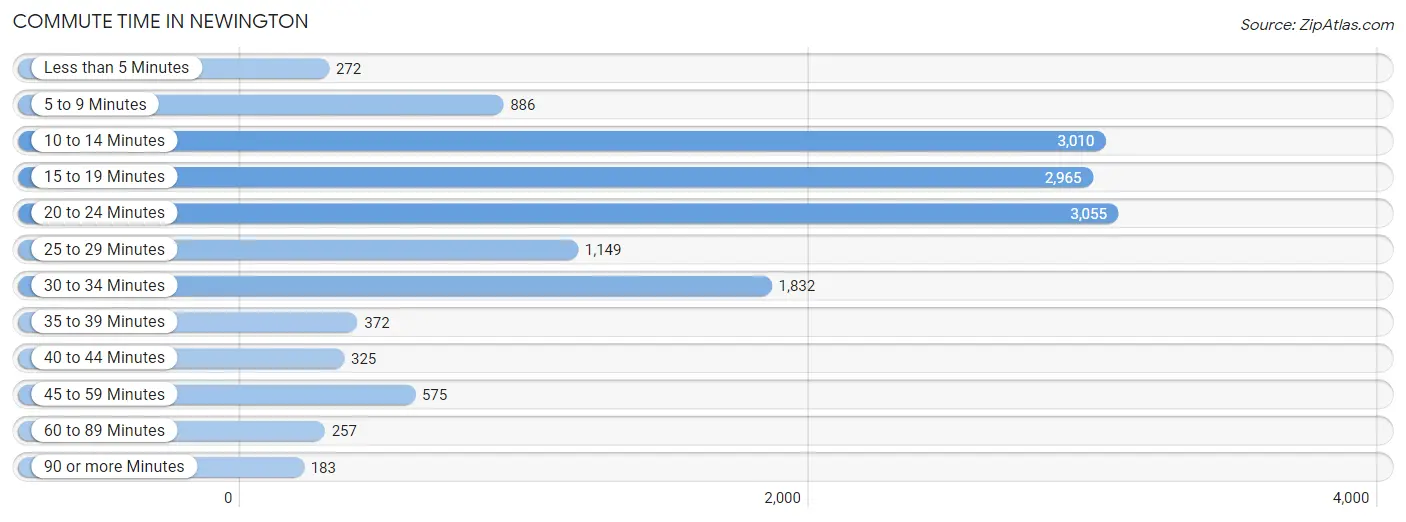
| Commute Time | # Commuters | % Commuters |
| Less than 5 Minutes | 272 | 1.8% |
| 5 to 9 Minutes | 886 | 5.9% |
| 10 to 14 Minutes | 3,010 | 20.2% |
| 15 to 19 Minutes | 2,965 | 19.9% |
| 20 to 24 Minutes | 3,055 | 20.5% |
| 25 to 29 Minutes | 1,149 | 7.7% |
| 30 to 34 Minutes | 1,832 | 12.3% |
| 35 to 39 Minutes | 372 | 2.5% |
| 40 to 44 Minutes | 325 | 2.2% |
| 45 to 59 Minutes | 575 | 3.9% |
| 60 to 89 Minutes | 257 | 1.7% |
| 90 or more Minutes | 183 | 1.2% |
Commute Time by Sex in Newington
The most common commute times in Newington are 15 to 19 minutes (1,679 commuters, 20.9%) for males and 10 to 14 minutes (1,671 commuters, 24.3%) for females.
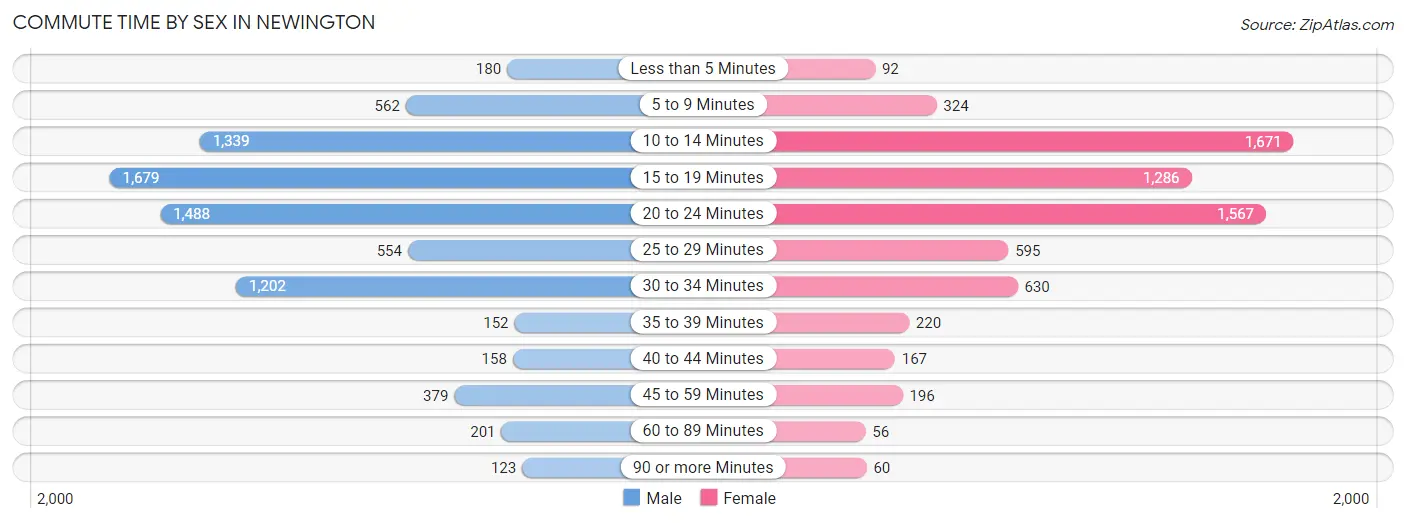
| Commute Time | Male | Female |
| Less than 5 Minutes | 180 (2.2%) | 92 (1.3%) |
| 5 to 9 Minutes | 562 (7.0%) | 324 (4.7%) |
| 10 to 14 Minutes | 1,339 (16.7%) | 1,671 (24.3%) |
| 15 to 19 Minutes | 1,679 (20.9%) | 1,286 (18.7%) |
| 20 to 24 Minutes | 1,488 (18.6%) | 1,567 (22.8%) |
| 25 to 29 Minutes | 554 (6.9%) | 595 (8.7%) |
| 30 to 34 Minutes | 1,202 (15.0%) | 630 (9.2%) |
| 35 to 39 Minutes | 152 (1.9%) | 220 (3.2%) |
| 40 to 44 Minutes | 158 (2.0%) | 167 (2.4%) |
| 45 to 59 Minutes | 379 (4.7%) | 196 (2.9%) |
| 60 to 89 Minutes | 201 (2.5%) | 56 (0.8%) |
| 90 or more Minutes | 123 (1.5%) | 60 (0.9%) |
Time of Departure to Work by Sex in Newington
The most frequent times of departure to work in Newington are 7:30 AM to 7:59 AM (1,268, 15.8%) for males and 8:00 AM to 8:29 AM (1,259, 18.3%) for females.
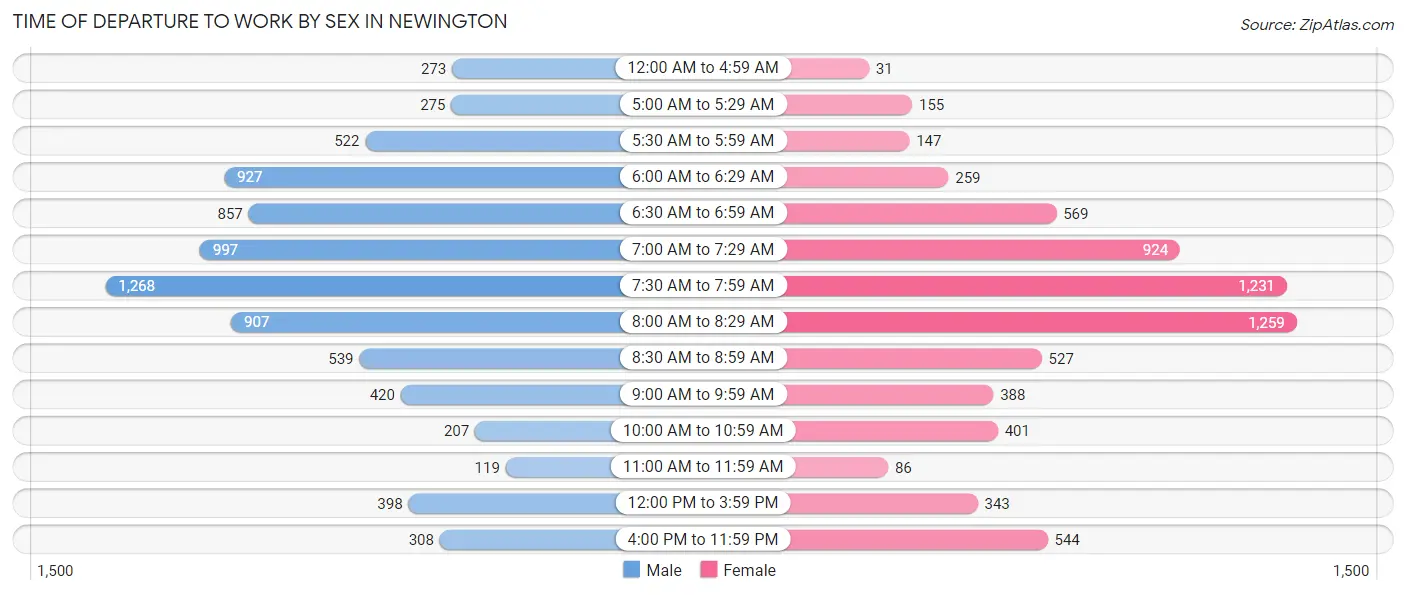
| Time of Departure | Male | Female |
| 12:00 AM to 4:59 AM | 273 (3.4%) | 31 (0.4%) |
| 5:00 AM to 5:29 AM | 275 (3.4%) | 155 (2.3%) |
| 5:30 AM to 5:59 AM | 522 (6.5%) | 147 (2.1%) |
| 6:00 AM to 6:29 AM | 927 (11.6%) | 259 (3.8%) |
| 6:30 AM to 6:59 AM | 857 (10.7%) | 569 (8.3%) |
| 7:00 AM to 7:29 AM | 997 (12.4%) | 924 (13.5%) |
| 7:30 AM to 7:59 AM | 1,268 (15.8%) | 1,231 (17.9%) |
| 8:00 AM to 8:29 AM | 907 (11.3%) | 1,259 (18.3%) |
| 8:30 AM to 8:59 AM | 539 (6.7%) | 527 (7.7%) |
| 9:00 AM to 9:59 AM | 420 (5.2%) | 388 (5.7%) |
| 10:00 AM to 10:59 AM | 207 (2.6%) | 401 (5.8%) |
| 11:00 AM to 11:59 AM | 119 (1.5%) | 86 (1.3%) |
| 12:00 PM to 3:59 PM | 398 (5.0%) | 343 (5.0%) |
| 4:00 PM to 11:59 PM | 308 (3.8%) | 544 (7.9%) |
| Total | 8,017 (100.0%) | 6,864 (100.0%) |
Housing Occupancy in Newington
Occupancy by Ownership in Newington
Of the total 12,514 dwellings in Newington, owner-occupied units account for 9,712 (77.6%), while renter-occupied units make up 2,802 (22.4%).
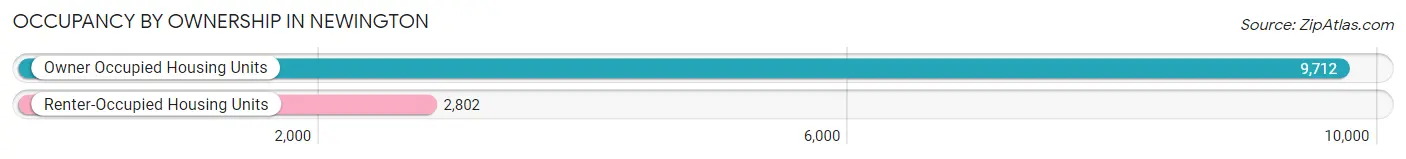
| Occupancy | # Housing Units | % Housing Units |
| Owner Occupied Housing Units | 9,712 | 77.6% |
| Renter-Occupied Housing Units | 2,802 | 22.4% |
| Total Occupied Housing Units | 12,514 | 100.0% |
Occupancy by Household Size in Newington
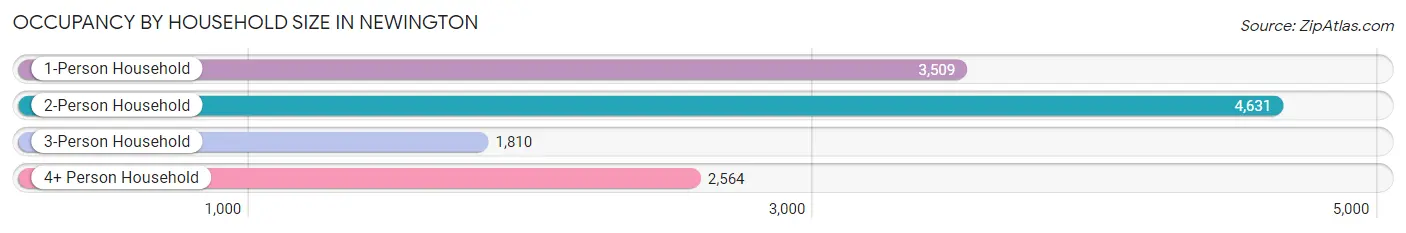
| Household Size | # Housing Units | % Housing Units |
| 1-Person Household | 3,509 | 28.0% |
| 2-Person Household | 4,631 | 37.0% |
| 3-Person Household | 1,810 | 14.5% |
| 4+ Person Household | 2,564 | 20.5% |
| Total Housing Units | 12,514 | 100.0% |
Occupancy by Ownership by Household Size in Newington
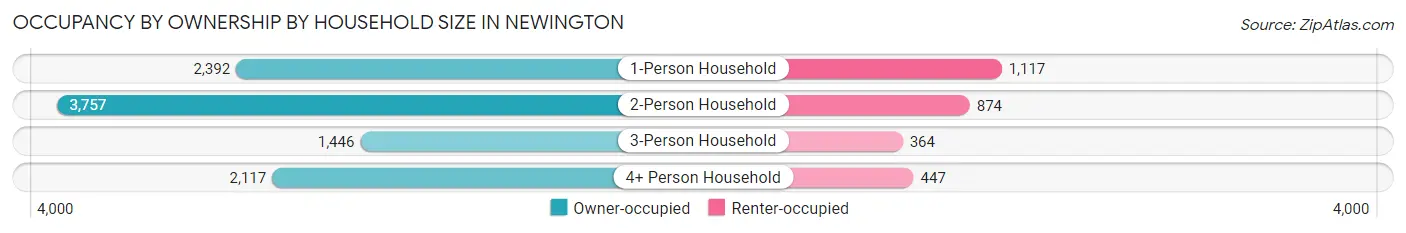
| Household Size | Owner-occupied | Renter-occupied |
| 1-Person Household | 2,392 (68.2%) | 1,117 (31.8%) |
| 2-Person Household | 3,757 (81.1%) | 874 (18.9%) |
| 3-Person Household | 1,446 (79.9%) | 364 (20.1%) |
| 4+ Person Household | 2,117 (82.6%) | 447 (17.4%) |
| Total Housing Units | 9,712 (77.6%) | 2,802 (22.4%) |
Occupancy by Educational Attainment in Newington
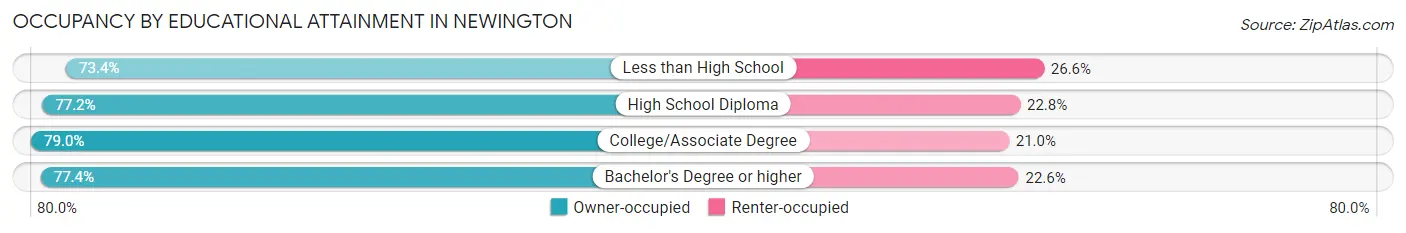
| Household Size | Owner-occupied | Renter-occupied |
| Less than High School | 458 (73.4%) | 166 (26.6%) |
| High School Diploma | 2,117 (77.2%) | 626 (22.8%) |
| College/Associate Degree | 2,833 (79.0%) | 755 (21.0%) |
| Bachelor's Degree or higher | 4,304 (77.4%) | 1,255 (22.6%) |
Occupancy by Age of Householder in Newington
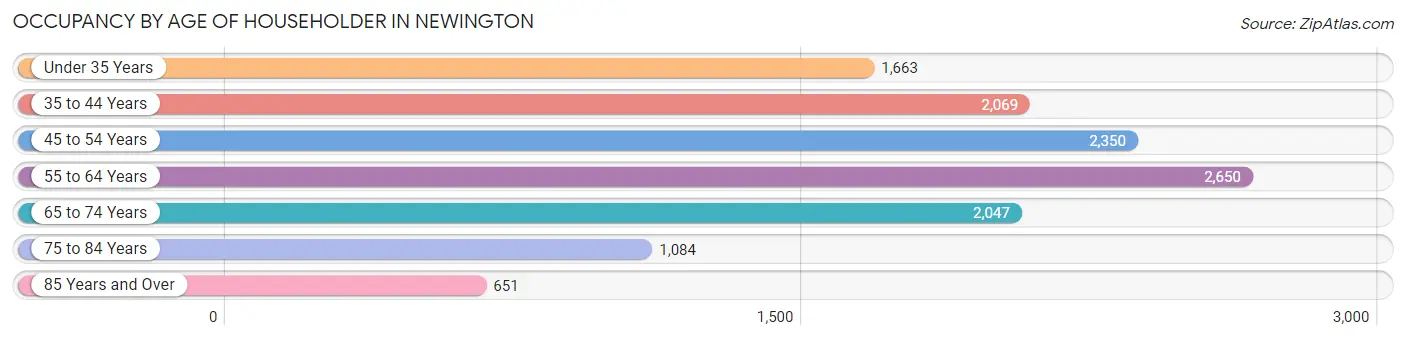
| Age Bracket | # Households | % Households |
| Under 35 Years | 1,663 | 13.3% |
| 35 to 44 Years | 2,069 | 16.5% |
| 45 to 54 Years | 2,350 | 18.8% |
| 55 to 64 Years | 2,650 | 21.2% |
| 65 to 74 Years | 2,047 | 16.4% |
| 75 to 84 Years | 1,084 | 8.7% |
| 85 Years and Over | 651 | 5.2% |
| Total | 12,514 | 100.0% |
Housing Finances in Newington
Median Income by Occupancy in Newington
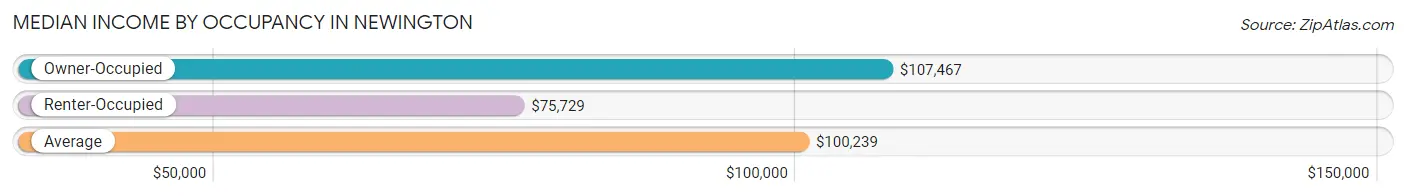
| Occupancy Type | # Households | Median Income |
| Owner-Occupied | 9,712 (77.6%) | $107,467 |
| Renter-Occupied | 2,802 (22.4%) | $75,729 |
| Average | 12,514 (100.0%) | $100,239 |
Occupancy by Householder Income Bracket in Newington
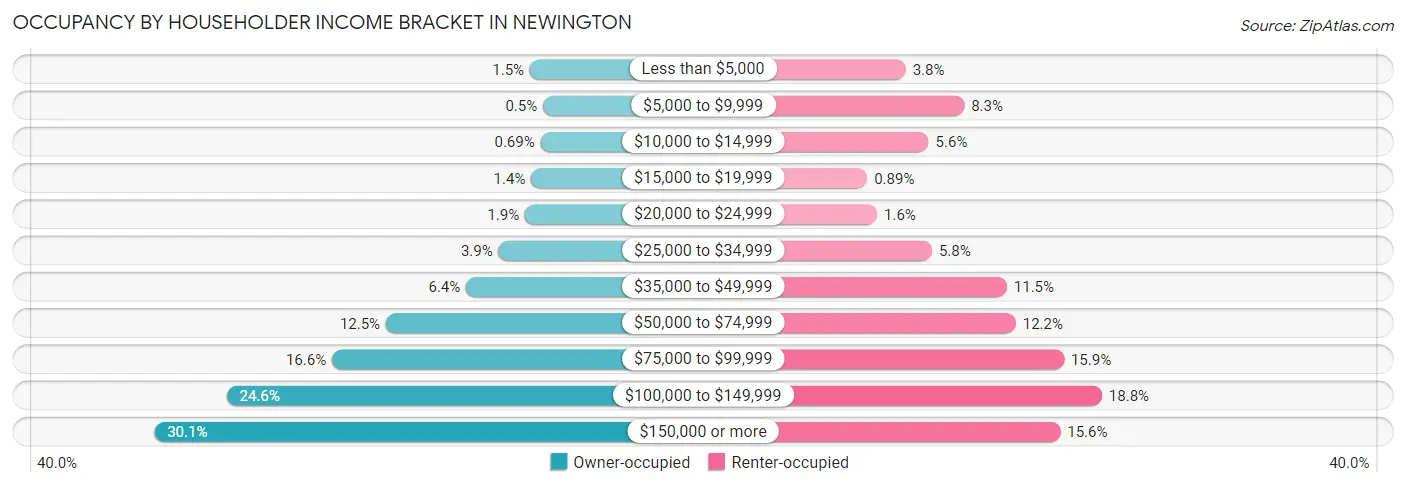
| Income Bracket | Owner-occupied | Renter-occupied |
| Less than $5,000 | 146 (1.5%) | 107 (3.8%) |
| $5,000 to $9,999 | 49 (0.5%) | 232 (8.3%) |
| $10,000 to $14,999 | 67 (0.7%) | 156 (5.6%) |
| $15,000 to $19,999 | 136 (1.4%) | 25 (0.9%) |
| $20,000 to $24,999 | 182 (1.9%) | 46 (1.6%) |
| $25,000 to $34,999 | 378 (3.9%) | 163 (5.8%) |
| $35,000 to $49,999 | 618 (6.4%) | 323 (11.5%) |
| $50,000 to $74,999 | 1,211 (12.5%) | 342 (12.2%) |
| $75,000 to $99,999 | 1,610 (16.6%) | 445 (15.9%) |
| $100,000 to $149,999 | 2,390 (24.6%) | 526 (18.8%) |
| $150,000 or more | 2,925 (30.1%) | 437 (15.6%) |
| Total | 9,712 (100.0%) | 2,802 (100.0%) |
Monthly Housing Cost Tiers in Newington
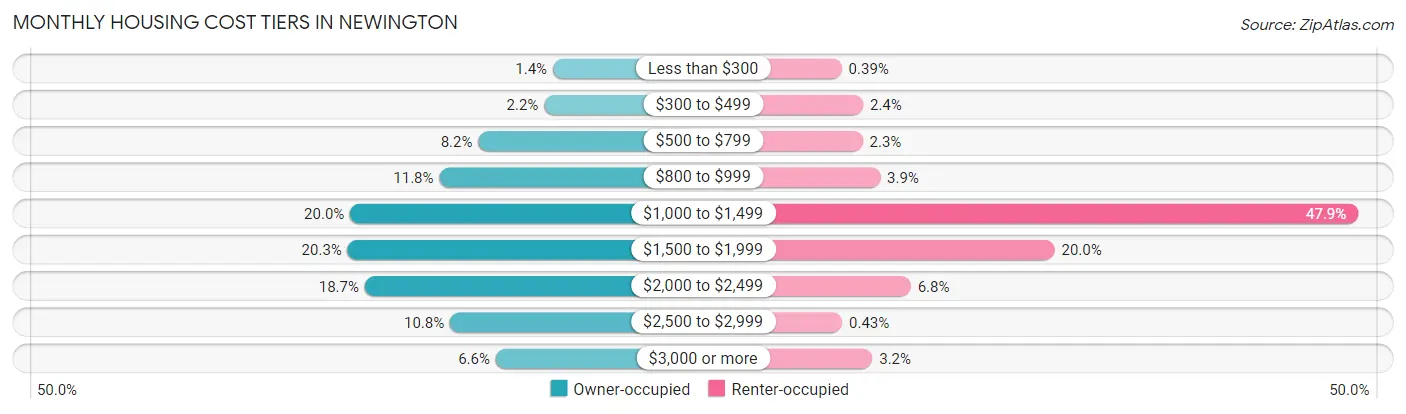
| Monthly Cost | Owner-occupied | Renter-occupied |
| Less than $300 | 132 (1.4%) | 11 (0.4%) |
| $300 to $499 | 211 (2.2%) | 66 (2.4%) |
| $500 to $799 | 799 (8.2%) | 65 (2.3%) |
| $800 to $999 | 1,148 (11.8%) | 110 (3.9%) |
| $1,000 to $1,499 | 1,945 (20.0%) | 1,343 (47.9%) |
| $1,500 to $1,999 | 1,968 (20.3%) | 560 (20.0%) |
| $2,000 to $2,499 | 1,814 (18.7%) | 189 (6.8%) |
| $2,500 to $2,999 | 1,052 (10.8%) | 12 (0.4%) |
| $3,000 or more | 643 (6.6%) | 90 (3.2%) |
| Total | 9,712 (100.0%) | 2,802 (100.0%) |
Physical Housing Characteristics in Newington
Housing Structures in Newington
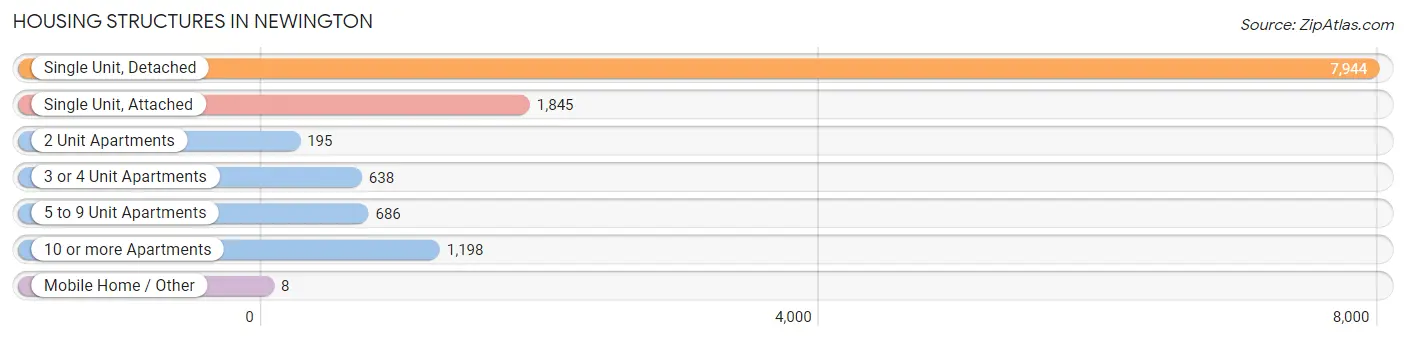
| Structure Type | # Housing Units | % Housing Units |
| Single Unit, Detached | 7,944 | 63.5% |
| Single Unit, Attached | 1,845 | 14.7% |
| 2 Unit Apartments | 195 | 1.6% |
| 3 or 4 Unit Apartments | 638 | 5.1% |
| 5 to 9 Unit Apartments | 686 | 5.5% |
| 10 or more Apartments | 1,198 | 9.6% |
| Mobile Home / Other | 8 | 0.1% |
| Total | 12,514 | 100.0% |
Housing Structures by Occupancy in Newington
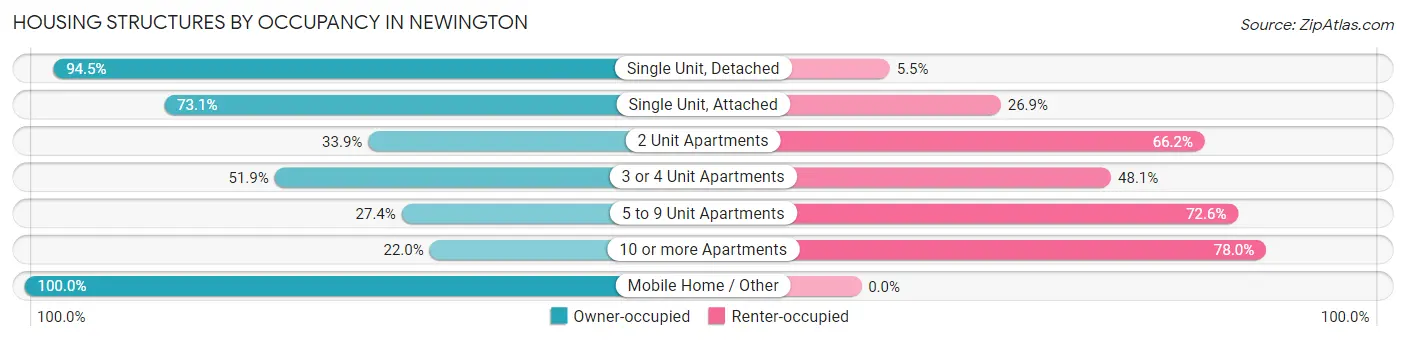
| Structure Type | Owner-occupied | Renter-occupied |
| Single Unit, Detached | 7,506 (94.5%) | 438 (5.5%) |
| Single Unit, Attached | 1,349 (73.1%) | 496 (26.9%) |
| 2 Unit Apartments | 66 (33.9%) | 129 (66.1%) |
| 3 or 4 Unit Apartments | 331 (51.9%) | 307 (48.1%) |
| 5 to 9 Unit Apartments | 188 (27.4%) | 498 (72.6%) |
| 10 or more Apartments | 264 (22.0%) | 934 (78.0%) |
| Mobile Home / Other | 8 (100.0%) | 0 (0.0%) |
| Total | 9,712 (77.6%) | 2,802 (22.4%) |
Housing Structures by Number of Rooms in Newington
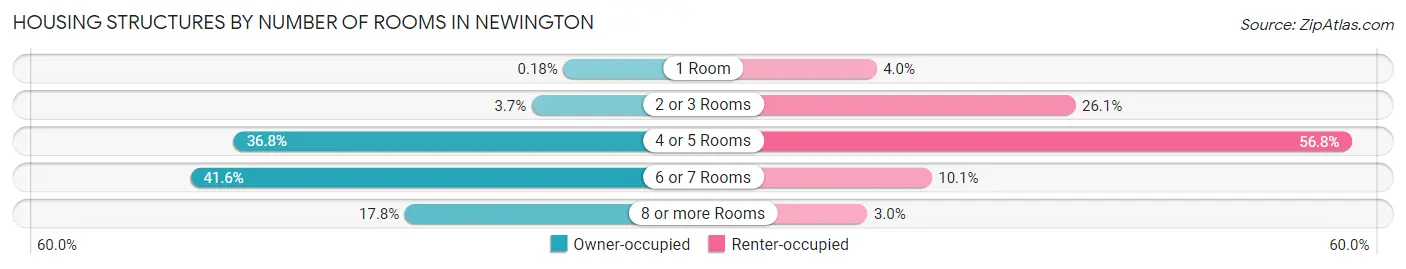
| Number of Rooms | Owner-occupied | Renter-occupied |
| 1 Room | 17 (0.2%) | 113 (4.0%) |
| 2 or 3 Rooms | 357 (3.7%) | 731 (26.1%) |
| 4 or 5 Rooms | 3,573 (36.8%) | 1,590 (56.8%) |
| 6 or 7 Rooms | 4,039 (41.6%) | 284 (10.1%) |
| 8 or more Rooms | 1,726 (17.8%) | 84 (3.0%) |
| Total | 9,712 (100.0%) | 2,802 (100.0%) |
Housing Structure by Heating Type in Newington
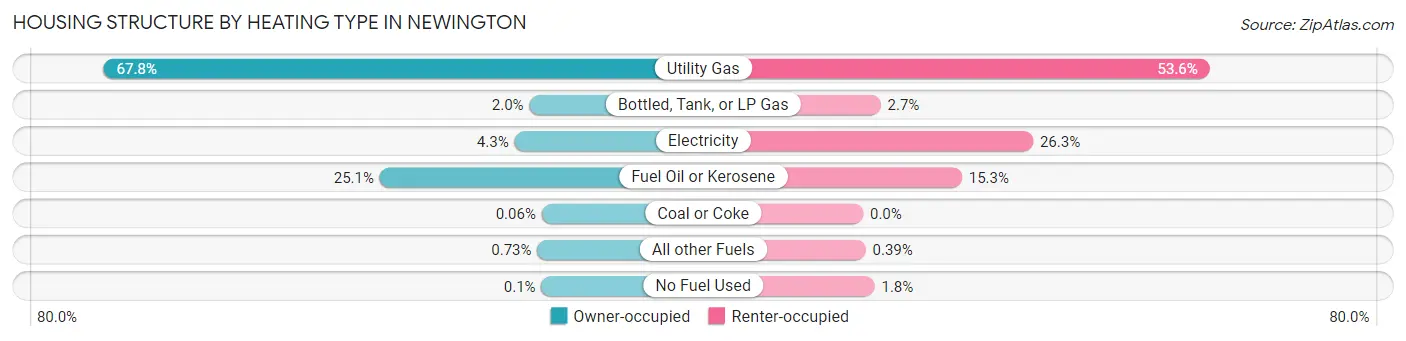
| Heating Type | Owner-occupied | Renter-occupied |
| Utility Gas | 6,583 (67.8%) | 1,501 (53.6%) |
| Bottled, Tank, or LP Gas | 190 (2.0%) | 76 (2.7%) |
| Electricity | 415 (4.3%) | 736 (26.3%) |
| Fuel Oil or Kerosene | 2,437 (25.1%) | 428 (15.3%) |
| Coal or Coke | 6 (0.1%) | 0 (0.0%) |
| All other Fuels | 71 (0.7%) | 11 (0.4%) |
| No Fuel Used | 10 (0.1%) | 50 (1.8%) |
| Total | 9,712 (100.0%) | 2,802 (100.0%) |
Household Vehicle Usage in Newington
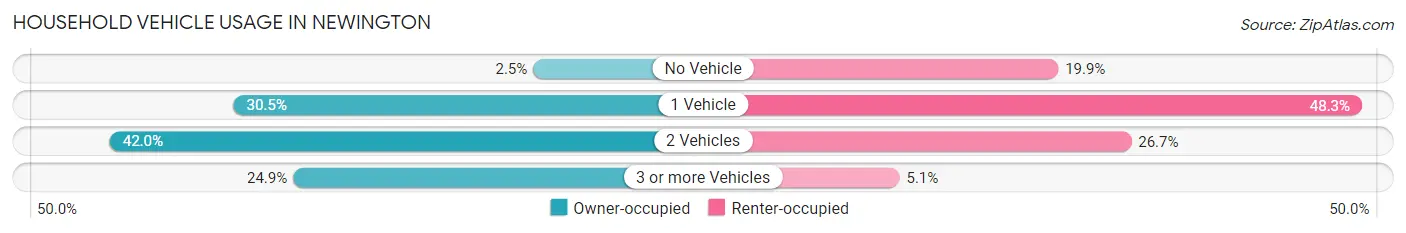
| Vehicles per Household | Owner-occupied | Renter-occupied |
| No Vehicle | 246 (2.5%) | 558 (19.9%) |
| 1 Vehicle | 2,961 (30.5%) | 1,352 (48.2%) |
| 2 Vehicles | 4,083 (42.0%) | 749 (26.7%) |
| 3 or more Vehicles | 2,422 (24.9%) | 143 (5.1%) |
| Total | 9,712 (100.0%) | 2,802 (100.0%) |
Real Estate & Mortgages in Newington
Real Estate and Mortgage Overview in Newington
| Characteristic | Without Mortgage | With Mortgage |
| Housing Units | 3,474 | 6,238 |
| Median Property Value | $269,800 | $264,300 |
| Median Household Income | $85,100 | $2,221 |
| Monthly Housing Costs | $911 | $643 |
| Real Estate Taxes | $6,177 | $64 |
Property Value by Mortgage Status in Newington
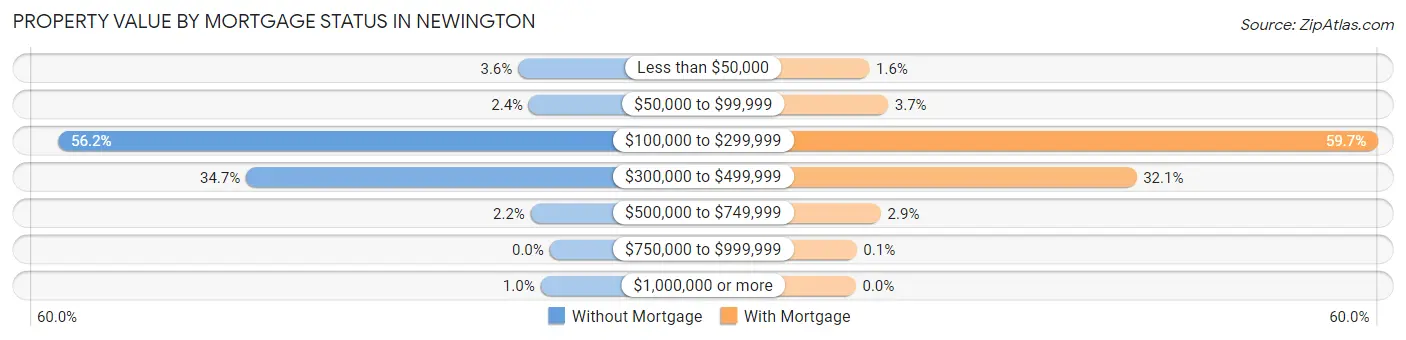
| Property Value | Without Mortgage | With Mortgage |
| Less than $50,000 | 125 (3.6%) | 97 (1.5%) |
| $50,000 to $99,999 | 82 (2.4%) | 230 (3.7%) |
| $100,000 to $299,999 | 1,951 (56.2%) | 3,725 (59.7%) |
| $300,000 to $499,999 | 1,205 (34.7%) | 2,001 (32.1%) |
| $500,000 to $749,999 | 75 (2.2%) | 179 (2.9%) |
| $750,000 to $999,999 | 0 (0.0%) | 6 (0.1%) |
| $1,000,000 or more | 36 (1.0%) | 0 (0.0%) |
| Total | 3,474 (100.0%) | 6,238 (100.0%) |
Household Income by Mortgage Status in Newington
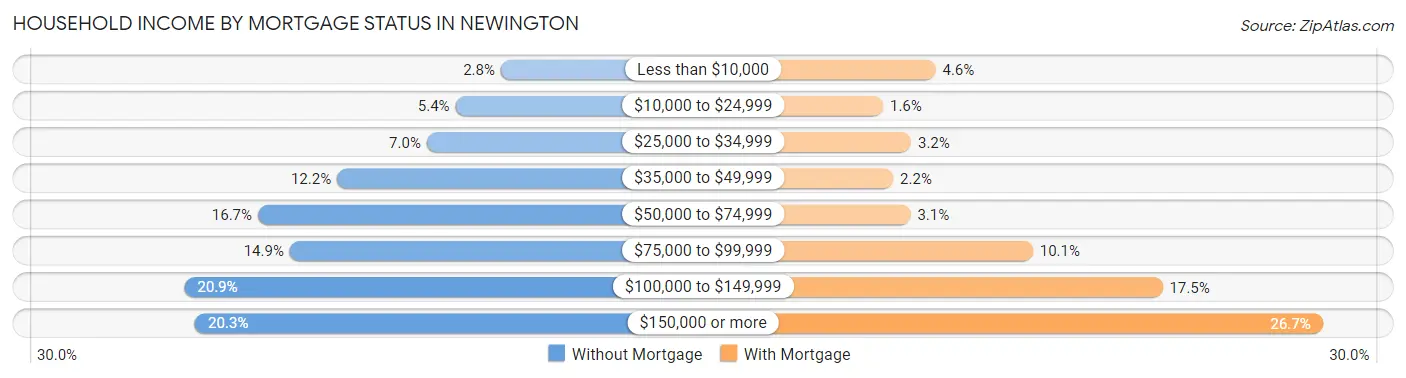
| Household Income | Without Mortgage | With Mortgage |
| Less than $10,000 | 97 (2.8%) | 285 (4.6%) |
| $10,000 to $24,999 | 187 (5.4%) | 98 (1.6%) |
| $25,000 to $34,999 | 244 (7.0%) | 198 (3.2%) |
| $35,000 to $49,999 | 422 (12.1%) | 134 (2.1%) |
| $50,000 to $74,999 | 579 (16.7%) | 196 (3.1%) |
| $75,000 to $99,999 | 516 (14.8%) | 632 (10.1%) |
| $100,000 to $149,999 | 725 (20.9%) | 1,094 (17.5%) |
| $150,000 or more | 704 (20.3%) | 1,665 (26.7%) |
| Total | 3,474 (100.0%) | 6,238 (100.0%) |
Property Value to Household Income Ratio in Newington
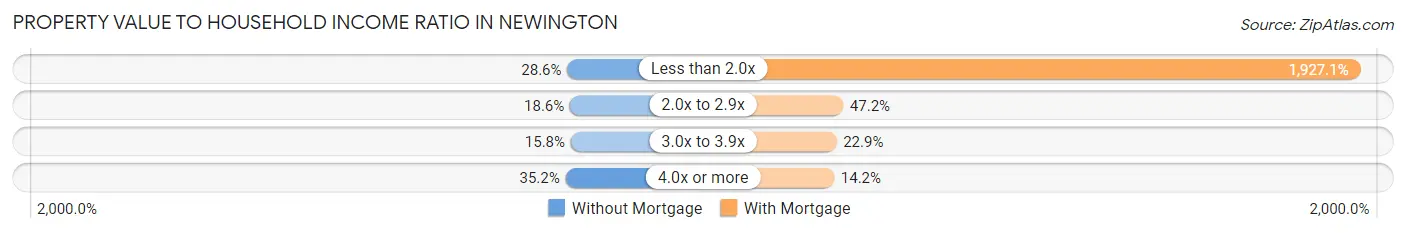
| Value-to-Income Ratio | Without Mortgage | With Mortgage |
| Less than 2.0x | 993 (28.6%) | 120,210 (1,927.1%) |
| 2.0x to 2.9x | 646 (18.6%) | 2,942 (47.2%) |
| 3.0x to 3.9x | 547 (15.8%) | 1,430 (22.9%) |
| 4.0x or more | 1,223 (35.2%) | 886 (14.2%) |
| Total | 3,474 (100.0%) | 6,238 (100.0%) |
Real Estate Taxes by Mortgage Status in Newington
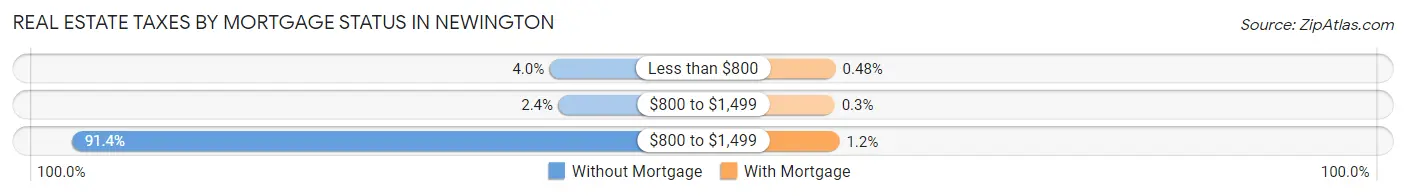
| Property Taxes | Without Mortgage | With Mortgage |
| Less than $800 | 140 (4.0%) | 30 (0.5%) |
| $800 to $1,499 | 84 (2.4%) | 19 (0.3%) |
| $800 to $1,499 | 3,175 (91.4%) | 73 (1.2%) |
| Total | 3,474 (100.0%) | 6,238 (100.0%) |
Health & Disability in Newington
Health Insurance Coverage by Age in Newington
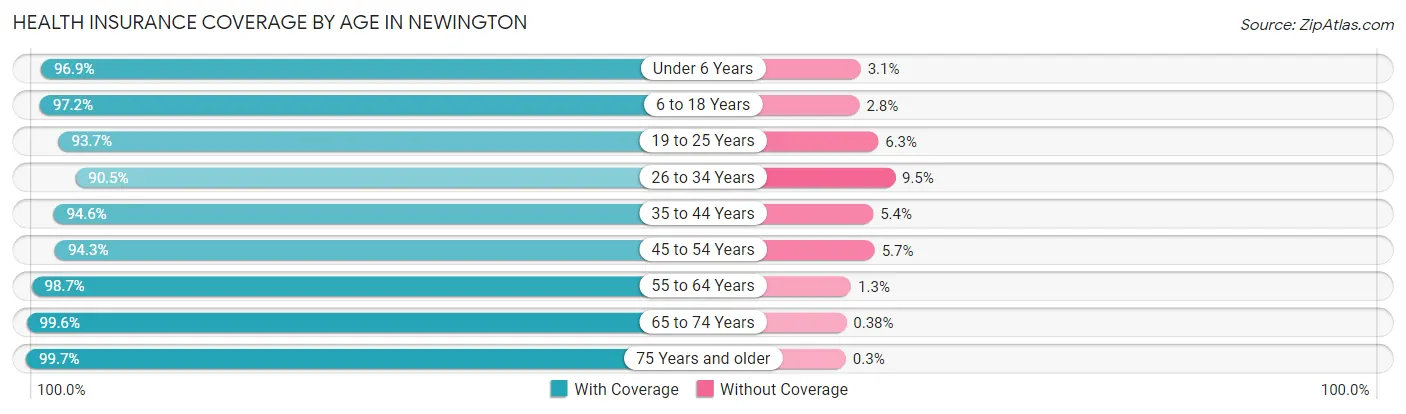
| Age Bracket | With Coverage | Without Coverage |
| Under 6 Years | 1,553 (96.9%) | 49 (3.1%) |
| 6 to 18 Years | 3,935 (97.2%) | 115 (2.8%) |
| 19 to 25 Years | 2,303 (93.7%) | 156 (6.3%) |
| 26 to 34 Years | 2,987 (90.5%) | 312 (9.5%) |
| 35 to 44 Years | 3,649 (94.6%) | 208 (5.4%) |
| 45 to 54 Years | 4,161 (94.3%) | 250 (5.7%) |
| 55 to 64 Years | 4,566 (98.7%) | 59 (1.3%) |
| 65 to 74 Years | 3,182 (99.6%) | 12 (0.4%) |
| 75 Years and older | 2,685 (99.7%) | 8 (0.3%) |
| Total | 29,021 (96.1%) | 1,169 (3.9%) |
Health Insurance Coverage by Citizenship Status in Newington
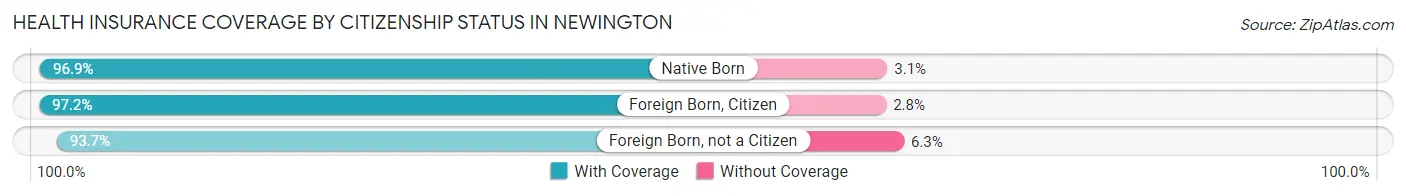
| Citizenship Status | With Coverage | Without Coverage |
| Native Born | 1,553 (96.9%) | 49 (3.1%) |
| Foreign Born, Citizen | 3,935 (97.2%) | 115 (2.8%) |
| Foreign Born, not a Citizen | 2,303 (93.7%) | 156 (6.3%) |
Health Insurance Coverage by Household Income in Newington
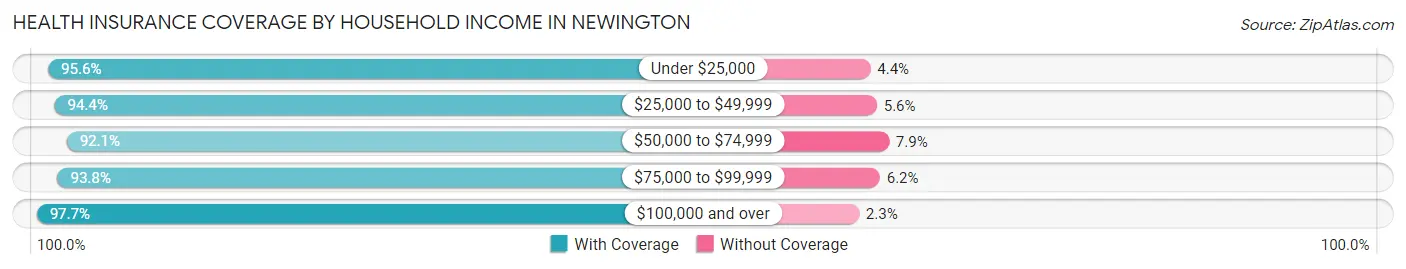
| Household Income | With Coverage | Without Coverage |
| Under $25,000 | 2,074 (95.6%) | 96 (4.4%) |
| $25,000 to $49,999 | 2,050 (94.4%) | 122 (5.6%) |
| $50,000 to $74,999 | 3,070 (92.1%) | 263 (7.9%) |
| $75,000 to $99,999 | 4,386 (93.8%) | 289 (6.2%) |
| $100,000 and over | 17,170 (97.7%) | 399 (2.3%) |
Public vs Private Health Insurance Coverage by Age in Newington
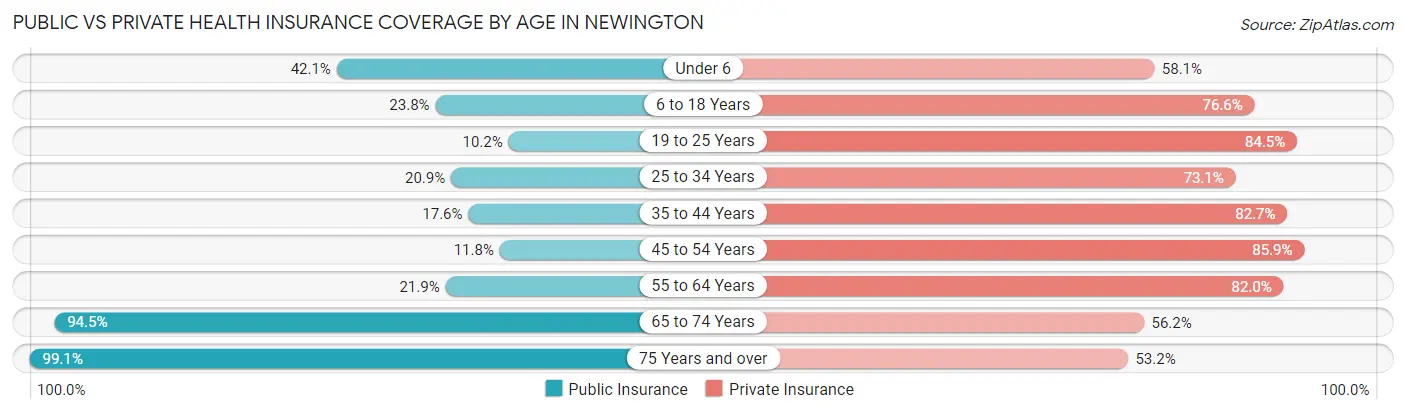
| Age Bracket | Public Insurance | Private Insurance |
| Under 6 | 674 (42.1%) | 931 (58.1%) |
| 6 to 18 Years | 962 (23.7%) | 3,103 (76.6%) |
| 19 to 25 Years | 250 (10.2%) | 2,078 (84.5%) |
| 25 to 34 Years | 688 (20.8%) | 2,412 (73.1%) |
| 35 to 44 Years | 680 (17.6%) | 3,189 (82.7%) |
| 45 to 54 Years | 521 (11.8%) | 3,787 (85.9%) |
| 55 to 64 Years | 1,012 (21.9%) | 3,793 (82.0%) |
| 65 to 74 Years | 3,018 (94.5%) | 1,795 (56.2%) |
| 75 Years and over | 2,668 (99.1%) | 1,433 (53.2%) |
| Total | 10,473 (34.7%) | 22,521 (74.6%) |
Disability Status by Sex by Age in Newington
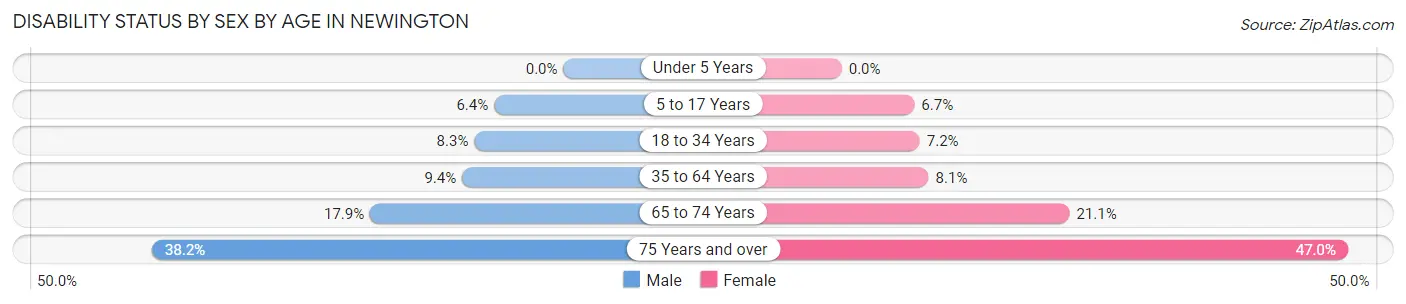
| Age Bracket | Male | Female |
| Under 5 Years | 0 (0.0%) | 0 (0.0%) |
| 5 to 17 Years | 124 (6.4%) | 139 (6.7%) |
| 18 to 34 Years | 283 (8.3%) | 194 (7.2%) |
| 35 to 64 Years | 555 (9.4%) | 563 (8.1%) |
| 65 to 74 Years | 270 (17.9%) | 357 (21.1%) |
| 75 Years and over | 381 (38.2%) | 796 (47.0%) |
Disability Class by Sex by Age in Newington
Disability Class: Hearing Difficulty
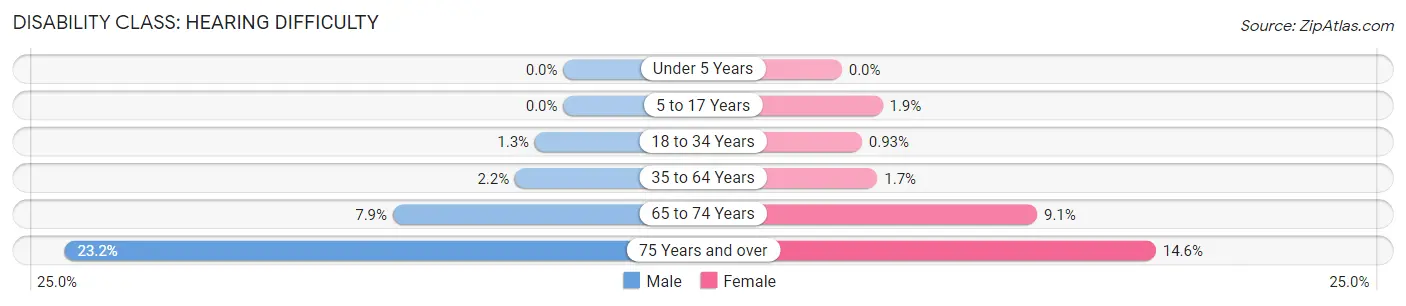
| Age Bracket | Male | Female |
| Under 5 Years | 0 (0.0%) | 0 (0.0%) |
| 5 to 17 Years | 0 (0.0%) | 39 (1.9%) |
| 18 to 34 Years | 45 (1.3%) | 25 (0.9%) |
| 35 to 64 Years | 132 (2.2%) | 115 (1.7%) |
| 65 to 74 Years | 119 (7.9%) | 153 (9.1%) |
| 75 Years and over | 231 (23.2%) | 247 (14.6%) |
Disability Class: Vision Difficulty
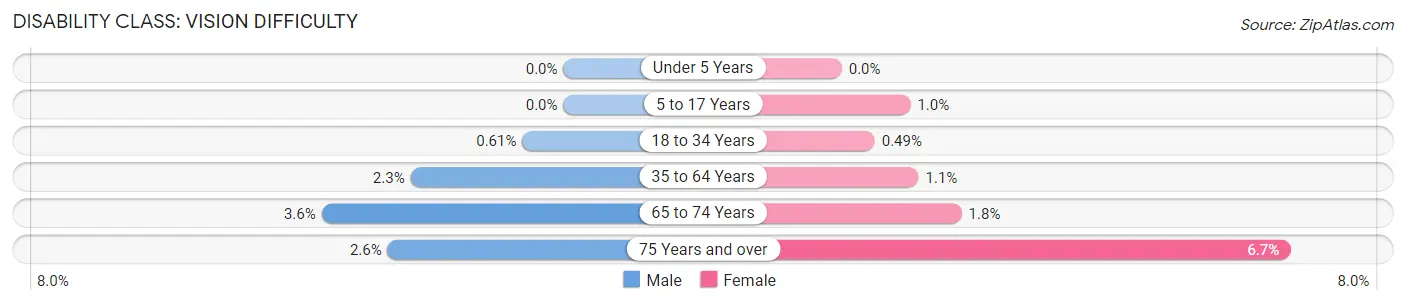
| Age Bracket | Male | Female |
| Under 5 Years | 0 (0.0%) | 0 (0.0%) |
| 5 to 17 Years | 0 (0.0%) | 21 (1.0%) |
| 18 to 34 Years | 21 (0.6%) | 13 (0.5%) |
| 35 to 64 Years | 134 (2.3%) | 80 (1.1%) |
| 65 to 74 Years | 54 (3.6%) | 30 (1.8%) |
| 75 Years and over | 26 (2.6%) | 113 (6.7%) |
Disability Class: Cognitive Difficulty
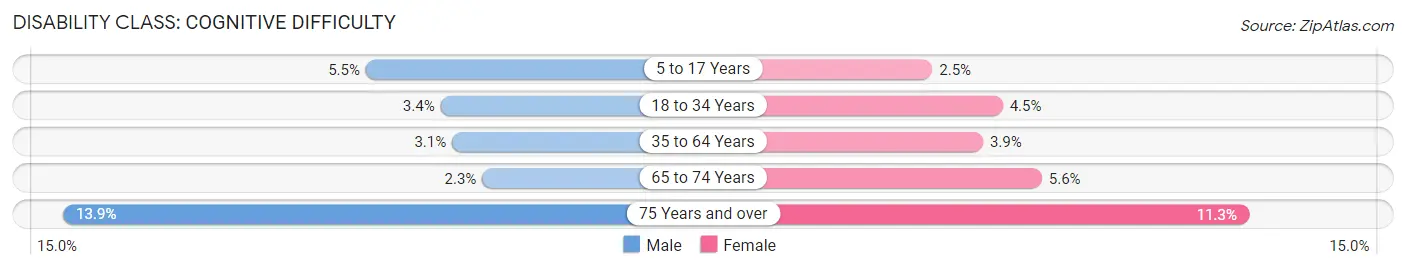
| Age Bracket | Male | Female |
| 5 to 17 Years | 106 (5.5%) | 52 (2.5%) |
| 18 to 34 Years | 117 (3.4%) | 120 (4.5%) |
| 35 to 64 Years | 183 (3.1%) | 275 (3.9%) |
| 65 to 74 Years | 34 (2.3%) | 94 (5.6%) |
| 75 Years and over | 139 (13.9%) | 192 (11.3%) |
Disability Class: Ambulatory Difficulty
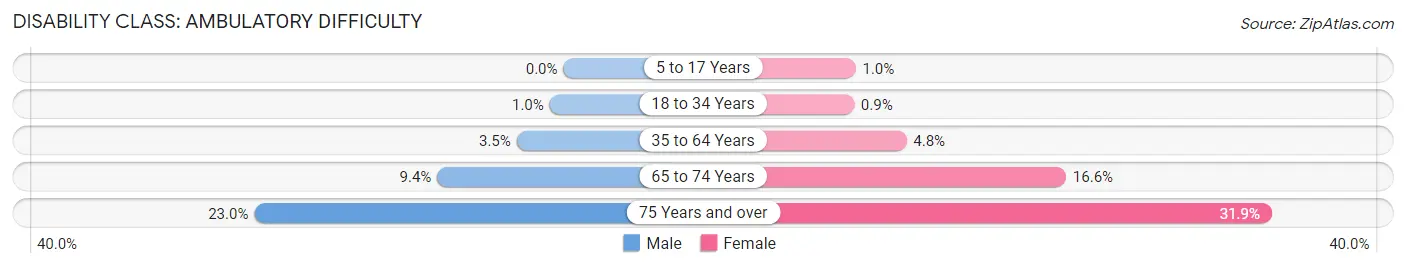
| Age Bracket | Male | Female |
| 5 to 17 Years | 0 (0.0%) | 21 (1.0%) |
| 18 to 34 Years | 35 (1.0%) | 24 (0.9%) |
| 35 to 64 Years | 205 (3.5%) | 335 (4.8%) |
| 65 to 74 Years | 141 (9.4%) | 281 (16.6%) |
| 75 Years and over | 229 (23.0%) | 541 (31.9%) |
Disability Class: Self-Care Difficulty
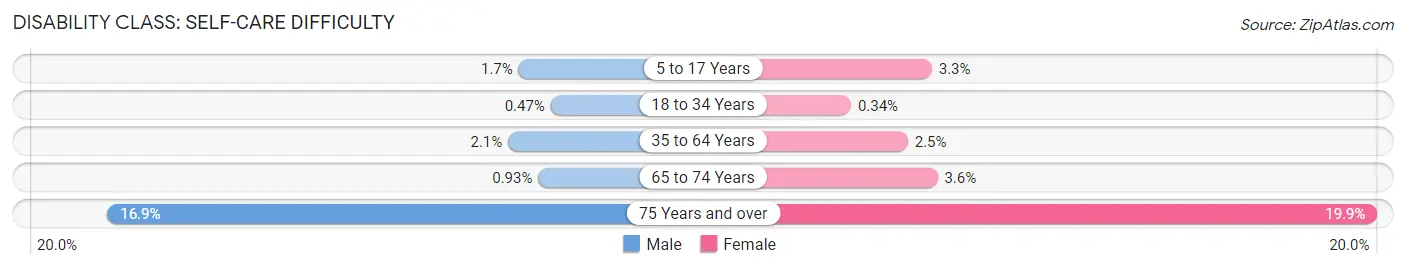
| Age Bracket | Male | Female |
| 5 to 17 Years | 32 (1.7%) | 69 (3.3%) |
| 18 to 34 Years | 16 (0.5%) | 9 (0.3%) |
| 35 to 64 Years | 121 (2.1%) | 171 (2.5%) |
| 65 to 74 Years | 14 (0.9%) | 60 (3.5%) |
| 75 Years and over | 169 (16.9%) | 337 (19.9%) |
Technology Access in Newington
Computing Device Access in Newington
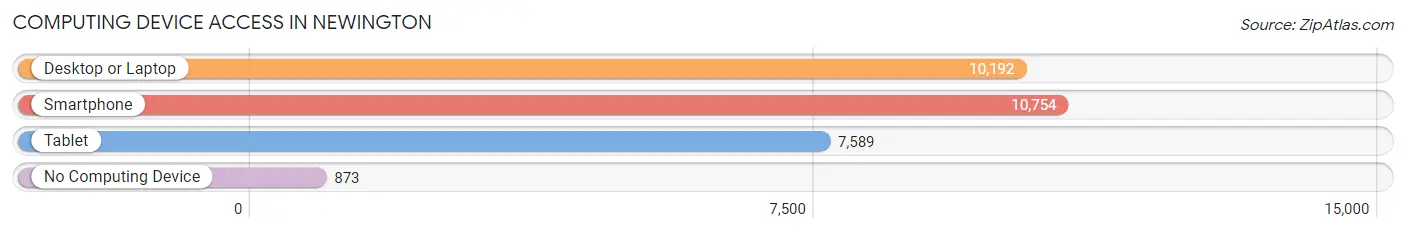
| Device Type | # Households | % Households |
| Desktop or Laptop | 10,192 | 81.4% |
| Smartphone | 10,754 | 85.9% |
| Tablet | 7,589 | 60.6% |
| No Computing Device | 873 | 7.0% |
| Total | 12,514 | 100.0% |
Internet Access in Newington
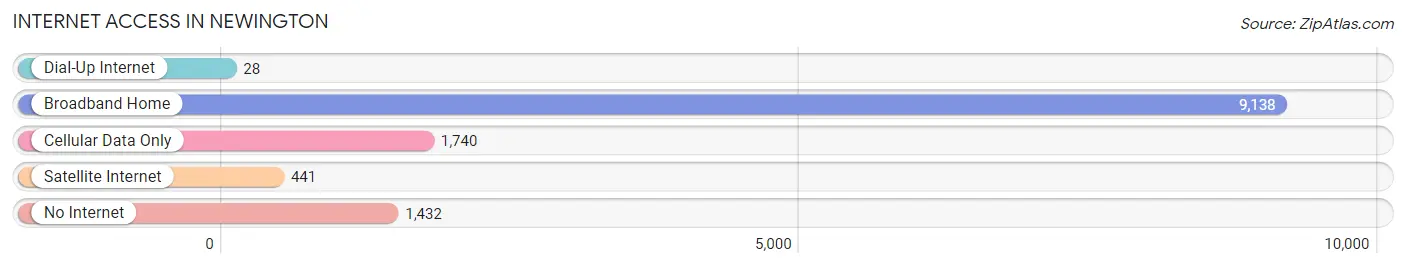
| Internet Type | # Households | % Households |
| Dial-Up Internet | 28 | 0.2% |
| Broadband Home | 9,138 | 73.0% |
| Cellular Data Only | 1,740 | 13.9% |
| Satellite Internet | 441 | 3.5% |
| No Internet | 1,432 | 11.4% |
| Total | 12,514 | 100.0% |
Newington Summary
Newington, Connecticut is a town located in Hartford County, Connecticut. It is situated in the central part of the state, just south of Hartford. The town has a population of approximately 30,000 people and is part of the Greater Hartford metropolitan area.
History
Newington was first settled in 1679 by settlers from Wethersfield, Connecticut. The town was originally known as West Wethersfield, but was later renamed Newington in 1721. The town was incorporated in 1871.
In the 19th century, Newington was a popular summer resort destination for wealthy Hartford residents. The town was home to several large hotels, including the Newington House, which was built in 1845.
Geography
Newington is located in central Connecticut, just south of Hartford. It is bordered by Wethersfield to the north, Rocky Hill to the east, Berlin to the south, and West Hartford to the west. The town covers an area of approximately 10 square miles.
The town is situated on the banks of the Connecticut River, which forms its western border. The town is also home to several small lakes, including Mill Pond, which is located in the center of town.
Economy
Newington is home to several large employers, including the Hartford Insurance Group, the Connecticut Department of Transportation, and the Connecticut Children’s Medical Center. The town is also home to several small businesses, including restaurants, retail stores, and professional services.
Demographics
As of the 2010 census, Newington had a population of 30,562 people. The racial makeup of the town was 87.3% White, 5.2% African American, 0.5% Native American, 3.2% Asian, and 3.8% from other races. Hispanic or Latino of any race were 8.2% of the population.
The median household income in Newington was $68,845, and the median family income was $81,945. The per capita income for the town was $31,945. About 4.3% of families and 5.7% of the population were below the poverty line.
Newington is served by the Newington Public Schools system, which includes four elementary schools, two middle schools, and one high school. The town is also home to several private schools, including the Newington Christian Academy and the St. Mary’s School.
Common Questions
What is Per Capita Income in Newington?
Per Capita income in Newington is $47,853.
What is the Median Family Income in Newington?
Median Family Income in Newington is $115,957.
What is the Median Household income in Newington?
Median Household Income in Newington is $100,239.
What is Income or Wage Gap in Newington?
Income or Wage Gap in Newington is 15.2%.
Women in Newington earn 84.8 cents for every dollar earned by a man.
What is Inequality or Gini Index in Newington?
Inequality or Gini Index in Newington is 0.37.
What is the Total Population of Newington?
Total Population of Newington is 30,458.
What is the Total Male Population of Newington?
Total Male Population of Newington is 14,491.
What is the Total Female Population of Newington?
Total Female Population of Newington is 15,967.
What is the Ratio of Males per 100 Females in Newington?
There are 90.76 Males per 100 Females in Newington.
What is the Ratio of Females per 100 Males in Newington?
There are 110.19 Females per 100 Males in Newington.
What is the Median Population Age in Newington?
Median Population Age in Newington is 44.7 Years.
What is the Average Family Size in Newington
Average Family Size in Newington is 3.0 People.
What is the Average Household Size in Newington
Average Household Size in Newington is 2.4 People.
How Large is the Labor Force in Newington?
There are 17,740 People in the Labor Forcein in Newington.
What is the Percentage of People in the Labor Force in Newington?
68.7% of People are in the Labor Force in Newington.
What is the Unemployment Rate in Newington?
Unemployment Rate in Newington is 3.1%.