Ravenel, SC Map & Demographics
Ravenel Map
Ravenel Overview
$34,356
PER CAPITA INCOME
$78,205
AVG FAMILY INCOME
$70,956
AVG HOUSEHOLD INCOME
5.5%
WAGE / INCOME GAP [ % ]
94.5¢/ $1
WAGE / INCOME GAP [ $ ]
0.45
INEQUALITY / GINI INDEX
2,572
TOTAL POPULATION
1,353
MALE POPULATION
1,219
FEMALE POPULATION
110.99
MALES / 100 FEMALES
90.10
FEMALES / 100 MALES
42.3
MEDIAN AGE
2.9
AVG FAMILY SIZE
2.5
AVG HOUSEHOLD SIZE
1,272
LABOR FORCE [ PEOPLE ]
61.0%
PERCENT IN LABOR FORCE
1.7%
UNEMPLOYMENT RATE
Ravenel Zip Codes
Ravenel Area Codes
Income in Ravenel
Income Overview in Ravenel
Per Capita Income in Ravenel is $34,356, while median incomes of families and households are $78,205 and $70,956 respectively.
| Characteristic | Number | Measure |
| Per Capita Income | 2,572 | $34,356 |
| Median Family Income | 746 | $78,205 |
| Mean Family Income | 746 | $100,957 |
| Median Household Income | 1,009 | $70,956 |
| Mean Household Income | 1,009 | $88,373 |
| Income Deficit | 746 | $0 |
| Wage / Income Gap (%) | 2,572 | 5.47% |
| Wage / Income Gap ($) | 2,572 | 94.53¢ per $1 |
| Gini / Inequality Index | 2,572 | 0.45 |
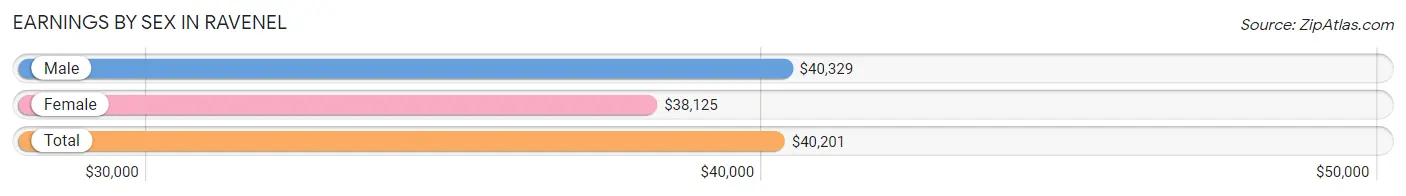
Earnings by Sex in Ravenel
Average Earnings in Ravenel are $40,201, $40,329 for men and $38,125 for women, a difference of 5.5%.
| Sex | Number | Average Earnings |
| Male | 732 (55.6%) | $40,329 |
| Female | 585 (44.4%) | $38,125 |
| Total | 1,317 (100.0%) | $40,201 |
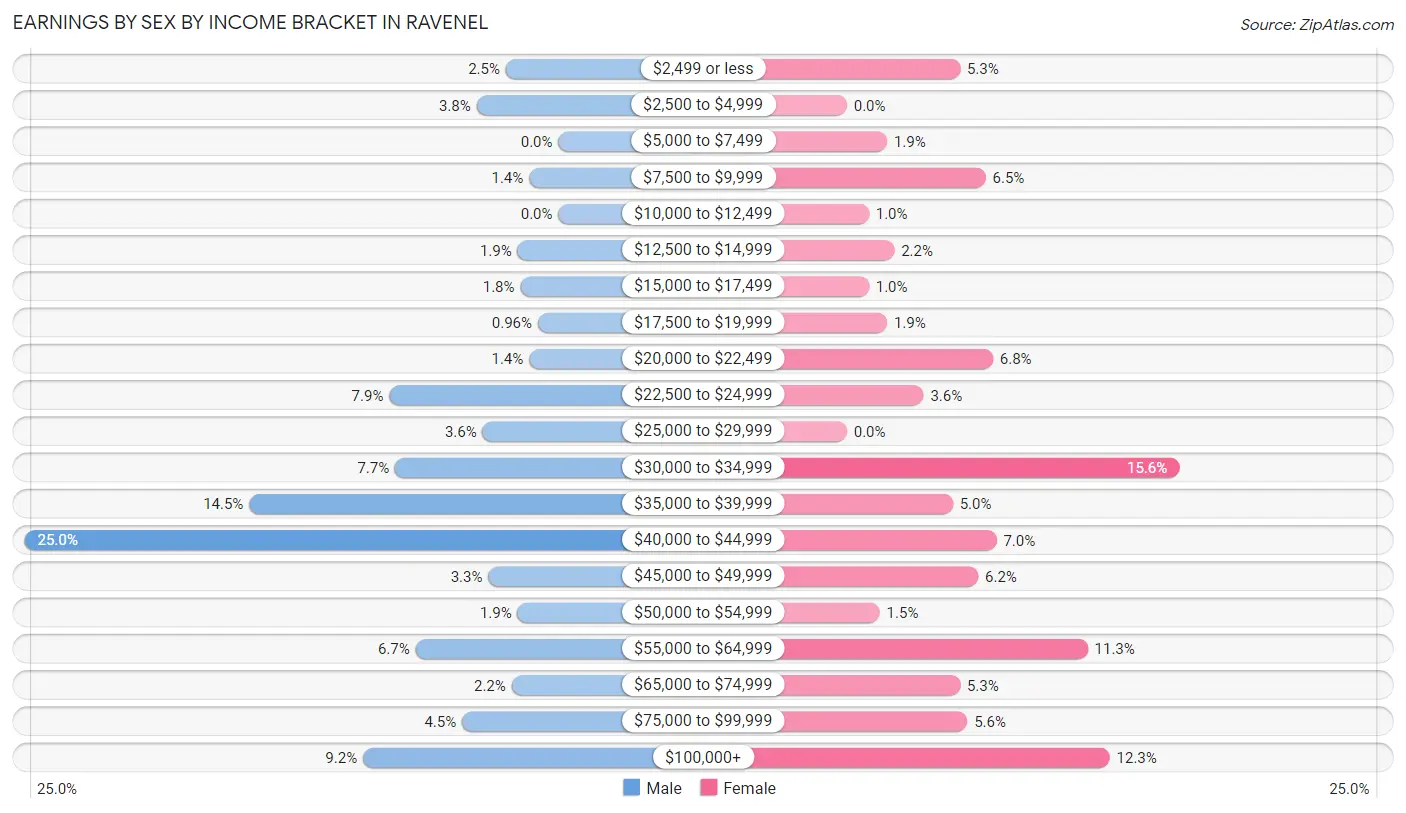
Earnings by Sex by Income Bracket in Ravenel
The most common earnings brackets in Ravenel are $40,000 to $44,999 for men (183 | 25.0%) and $30,000 to $34,999 for women (91 | 15.6%).
| Income | Male | Female |
| $2,499 or less | 18 (2.5%) | 31 (5.3%) |
| $2,500 to $4,999 | 28 (3.8%) | 0 (0.0%) |
| $5,000 to $7,499 | 0 (0.0%) | 11 (1.9%) |
| $7,500 to $9,999 | 10 (1.4%) | 38 (6.5%) |
| $10,000 to $12,499 | 0 (0.0%) | 6 (1.0%) |
| $12,500 to $14,999 | 14 (1.9%) | 13 (2.2%) |
| $15,000 to $17,499 | 13 (1.8%) | 6 (1.0%) |
| $17,500 to $19,999 | 7 (1.0%) | 11 (1.9%) |
| $20,000 to $22,499 | 10 (1.4%) | 40 (6.8%) |
| $22,500 to $24,999 | 58 (7.9%) | 21 (3.6%) |
| $25,000 to $29,999 | 26 (3.5%) | 0 (0.0%) |
| $30,000 to $34,999 | 56 (7.6%) | 91 (15.6%) |
| $35,000 to $39,999 | 106 (14.5%) | 29 (5.0%) |
| $40,000 to $44,999 | 183 (25.0%) | 41 (7.0%) |
| $45,000 to $49,999 | 24 (3.3%) | 36 (6.1%) |
| $50,000 to $54,999 | 14 (1.9%) | 9 (1.5%) |
| $55,000 to $64,999 | 49 (6.7%) | 66 (11.3%) |
| $65,000 to $74,999 | 16 (2.2%) | 31 (5.3%) |
| $75,000 to $99,999 | 33 (4.5%) | 33 (5.6%) |
| $100,000+ | 67 (9.1%) | 72 (12.3%) |
| Total | 732 (100.0%) | 585 (100.0%) |
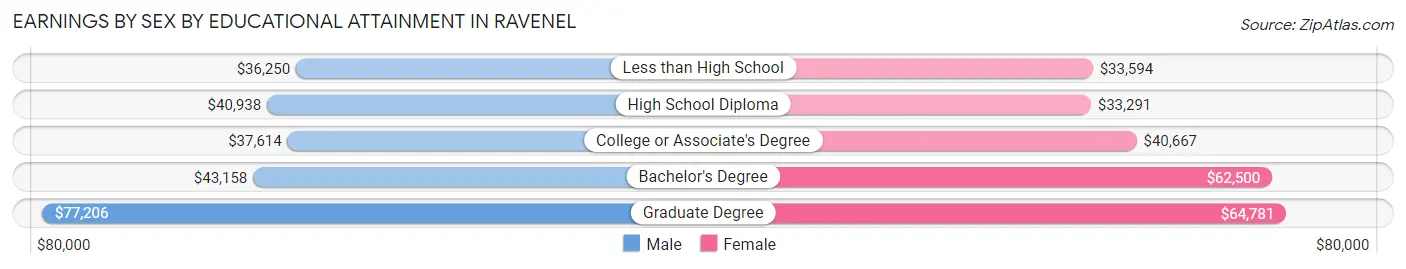
Earnings by Sex by Educational Attainment in Ravenel
Average earnings in Ravenel are $40,666 for men and $41,037 for women, a difference of 0.9%. Men with an educational attainment of graduate degree enjoy the highest average annual earnings of $77,206, while those with less than high school education earn the least with $36,250. Women with an educational attainment of graduate degree earn the most with the average annual earnings of $64,781, while those with high school diploma education have the smallest earnings of $33,291.
| Educational Attainment | Male Income | Female Income |
| Less than High School | $36,250 | $33,594 |
| High School Diploma | $40,938 | $33,291 |
| College or Associate's Degree | $37,614 | $40,667 |
| Bachelor's Degree | $43,158 | $62,500 |
| Graduate Degree | $77,206 | $64,781 |
| Total | $40,666 | $41,037 |
Family Income in Ravenel
Family Income Brackets in Ravenel
According to the Ravenel family income data, there are 214 families falling into the $75,000 to $99,999 income range, which is the most common income bracket and makes up 28.7% of all families.
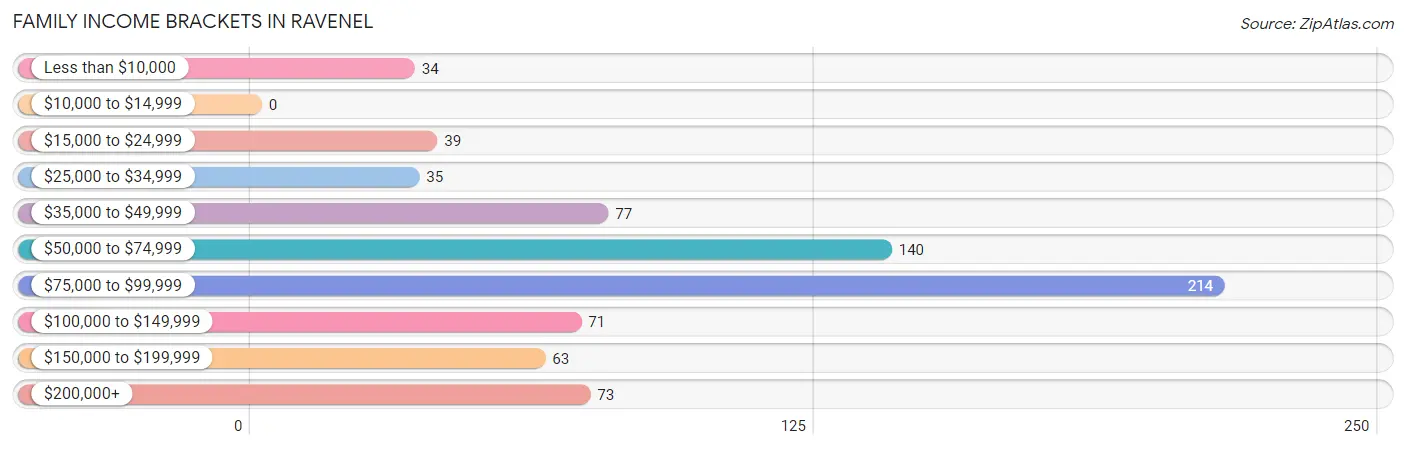
| Income Bracket | # Families | % Families |
| Less than $10,000 | 34 | 4.6% |
| $10,000 to $14,999 | 0 | 0.0% |
| $15,000 to $24,999 | 39 | 5.2% |
| $25,000 to $34,999 | 35 | 4.7% |
| $35,000 to $49,999 | 77 | 10.3% |
| $50,000 to $74,999 | 140 | 18.8% |
| $75,000 to $99,999 | 214 | 28.7% |
| $100,000 to $149,999 | 71 | 9.5% |
| $150,000 to $199,999 | 63 | 8.4% |
| $200,000+ | 73 | 9.8% |
Family Income by Famaliy Size in Ravenel
2-person families (296 | 39.7%) account for the highest median family income in Ravenel with $87,750 per family, while 2-person families (296 | 39.7%) have the highest median income of $43,875 per family member.
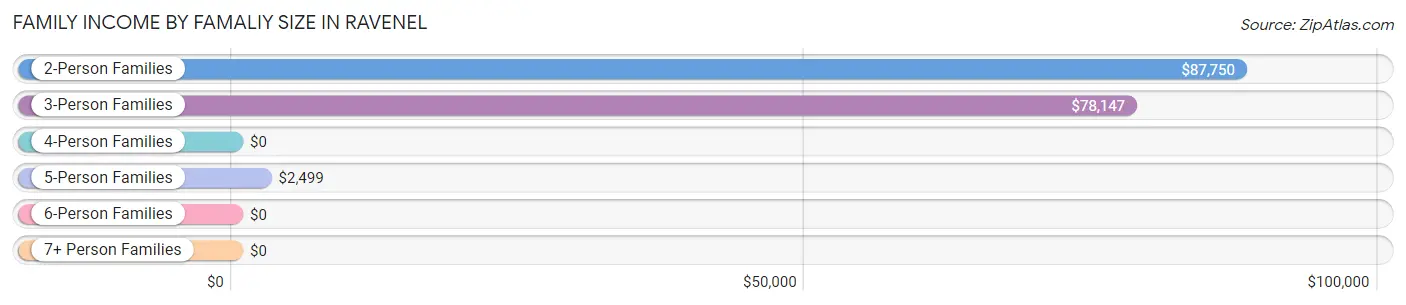
| Income Bracket | # Families | Median Income |
| 2-Person Families | 296 (39.7%) | $87,750 |
| 3-Person Families | 297 (39.8%) | $78,147 |
| 4-Person Families | 96 (12.9%) | $0 |
| 5-Person Families | 57 (7.6%) | $2,499 |
| 6-Person Families | 0 (0.0%) | $0 |
| 7+ Person Families | 0 (0.0%) | $0 |
| Total | 746 (100.0%) | $78,205 |
Family Income by Number of Earners in Ravenel
The median family income in Ravenel is $78,205, with families comprising 3+ earners (38) having the highest median family income of $109,500, while families with no earners (136) have the lowest median family income of $40,375, accounting for 5.1% and 18.2% of families, respectively.
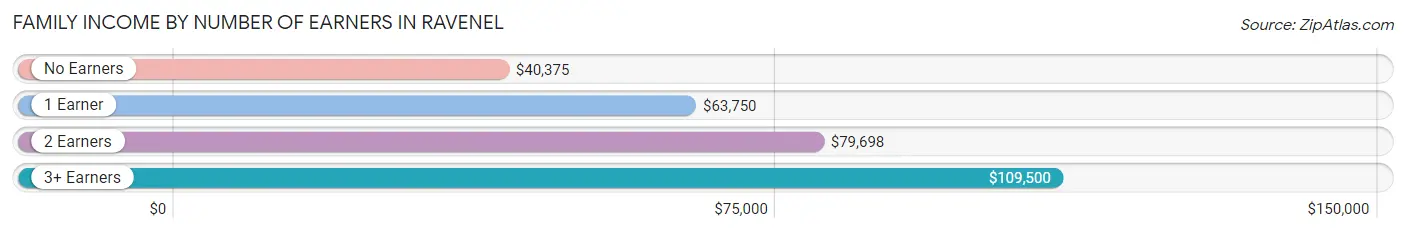
| Number of Earners | # Families | Median Income |
| No Earners | 136 (18.2%) | $40,375 |
| 1 Earner | 190 (25.5%) | $63,750 |
| 2 Earners | 382 (51.2%) | $79,698 |
| 3+ Earners | 38 (5.1%) | $109,500 |
| Total | 746 (100.0%) | $78,205 |
Household Income in Ravenel
Household Income Brackets in Ravenel
With 235 households falling in the category, the $75,000 to $99,999 income range is the most frequent in Ravenel, accounting for 23.3% of all households. In contrast, only 12 households (1.2%) fall into the $10,000 to $14,999 income bracket, making it the least populous group.
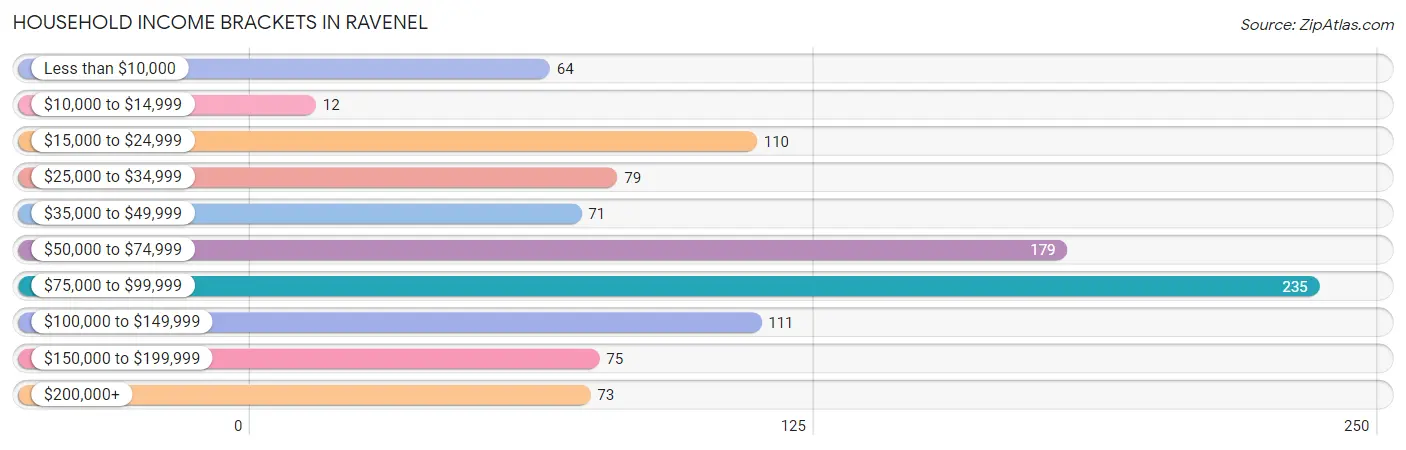
| Income Bracket | # Households | % Households |
| Less than $10,000 | 64 | 6.3% |
| $10,000 to $14,999 | 12 | 1.2% |
| $15,000 to $24,999 | 110 | 10.9% |
| $25,000 to $34,999 | 79 | 7.8% |
| $35,000 to $49,999 | 71 | 7.0% |
| $50,000 to $74,999 | 179 | 17.7% |
| $75,000 to $99,999 | 235 | 23.3% |
| $100,000 to $149,999 | 111 | 11.0% |
| $150,000 to $199,999 | 75 | 7.4% |
| $200,000+ | 73 | 7.2% |
Household Income by Householder Age in Ravenel
The median household income in Ravenel is $70,956, with the highest median household income of $78,836 found in the 25 to 44 years age bracket for the primary householder. A total of 375 households (37.2%) fall into this category. Meanwhile, the 15 to 24 years age bracket for the primary householder has the lowest median household income of $0, with 23 households (2.3%) in this group.
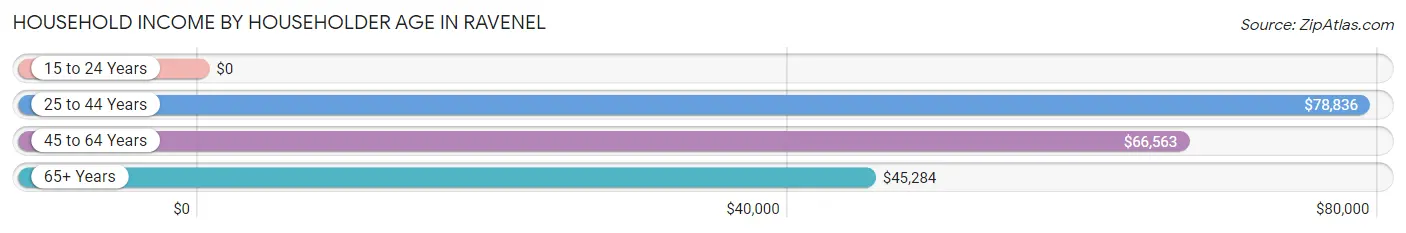
| Income Bracket | # Households | Median Income |
| 15 to 24 Years | 23 (2.3%) | $0 |
| 25 to 44 Years | 375 (37.2%) | $78,836 |
| 45 to 64 Years | 372 (36.9%) | $66,563 |
| 65+ Years | 239 (23.7%) | $45,284 |
| Total | 1,009 (100.0%) | $70,956 |
Poverty in Ravenel
Income Below Poverty by Sex and Age in Ravenel
With 16.1% poverty level for males and 16.6% for females among the residents of Ravenel, 15 year old males and 5 year old females are the most vulnerable to poverty, with 6 males (100.0%) and 34 females (75.6%) in their respective age groups living below the poverty level.
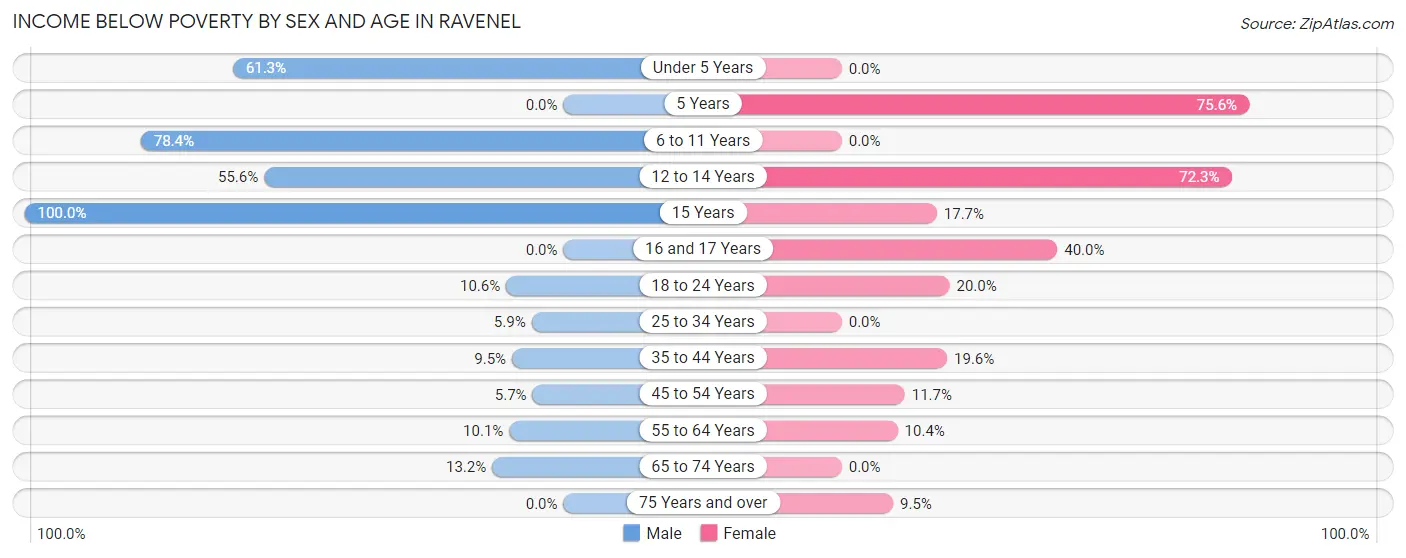
| Age Bracket | Male | Female |
| Under 5 Years | 73 (61.3%) | 0 (0.0%) |
| 5 Years | 0 (0.0%) | 34 (75.6%) |
| 6 to 11 Years | 40 (78.4%) | 0 (0.0%) |
| 12 to 14 Years | 5 (55.6%) | 60 (72.3%) |
| 15 Years | 6 (100.0%) | 6 (17.6%) |
| 16 and 17 Years | 0 (0.0%) | 14 (40.0%) |
| 18 to 24 Years | 10 (10.6%) | 10 (20.0%) |
| 25 to 34 Years | 15 (5.9%) | 0 (0.0%) |
| 35 to 44 Years | 27 (9.5%) | 35 (19.6%) |
| 45 to 54 Years | 7 (5.7%) | 20 (11.7%) |
| 55 to 64 Years | 17 (10.1%) | 17 (10.4%) |
| 65 to 74 Years | 18 (13.2%) | 0 (0.0%) |
| 75 Years and over | 0 (0.0%) | 6 (9.5%) |
| Total | 218 (16.1%) | 202 (16.6%) |
Income Above Poverty by Sex and Age in Ravenel
According to the poverty statistics in Ravenel, males aged 5 years and females aged under 5 years are the age groups that are most secure financially, with 100.0% of males and 100.0% of females in these age groups living above the poverty line.
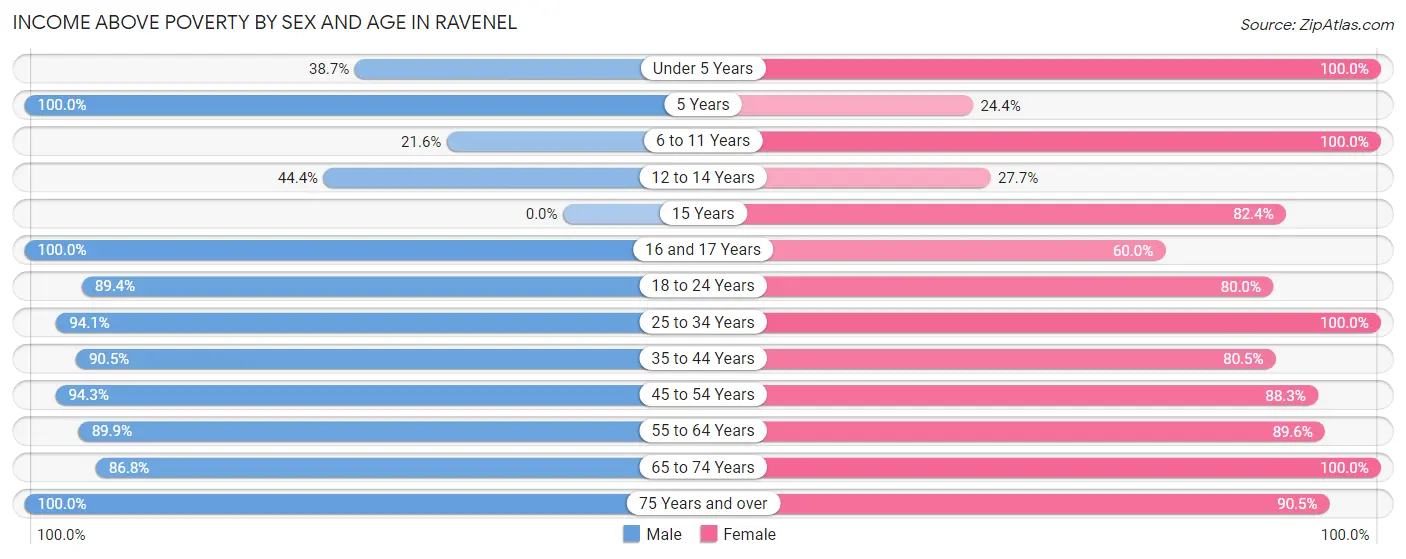
| Age Bracket | Male | Female |
| Under 5 Years | 46 (38.7%) | 108 (100.0%) |
| 5 Years | 13 (100.0%) | 11 (24.4%) |
| 6 to 11 Years | 11 (21.6%) | 19 (100.0%) |
| 12 to 14 Years | 4 (44.4%) | 23 (27.7%) |
| 15 Years | 0 (0.0%) | 28 (82.4%) |
| 16 and 17 Years | 5 (100.0%) | 21 (60.0%) |
| 18 to 24 Years | 84 (89.4%) | 40 (80.0%) |
| 25 to 34 Years | 239 (94.1%) | 86 (100.0%) |
| 35 to 44 Years | 256 (90.5%) | 144 (80.4%) |
| 45 to 54 Years | 115 (94.3%) | 151 (88.3%) |
| 55 to 64 Years | 152 (89.9%) | 147 (89.6%) |
| 65 to 74 Years | 118 (86.8%) | 182 (100.0%) |
| 75 Years and over | 92 (100.0%) | 57 (90.5%) |
| Total | 1,135 (83.9%) | 1,017 (83.4%) |
Income Below Poverty Among Married-Couple Families in Ravenel
The poverty statistics for married-couple families in Ravenel show that 4.6% or 20 of the total 434 families live below the poverty line. Families with 1 or 2 children have the highest poverty rate of 14.4%, comprising of 20 families. On the other hand, families with no children have the lowest poverty rate of 0.0%, which includes 0 families.
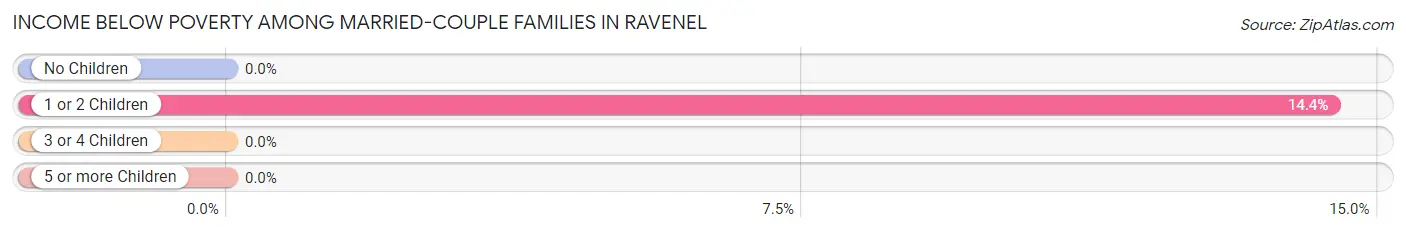
| Children | Above Poverty | Below Poverty |
| No Children | 287 (100.0%) | 0 (0.0%) |
| 1 or 2 Children | 119 (85.6%) | 20 (14.4%) |
| 3 or 4 Children | 8 (100.0%) | 0 (0.0%) |
| 5 or more Children | 0 (0.0%) | 0 (0.0%) |
| Total | 414 (95.4%) | 20 (4.6%) |
Income Below Poverty Among Single-Parent Households in Ravenel
According to the poverty data in Ravenel, 7.1% or 12 single-father households and 28.2% or 40 single-mother households are living below the poverty line. Among single-father households, those with 1 or 2 children have the highest poverty rate, with 12 households (75.0%) experiencing poverty. Likewise, among single-mother households, those with 3 or 4 children have the highest poverty rate, with 29 households (100.0%) falling below the poverty line.
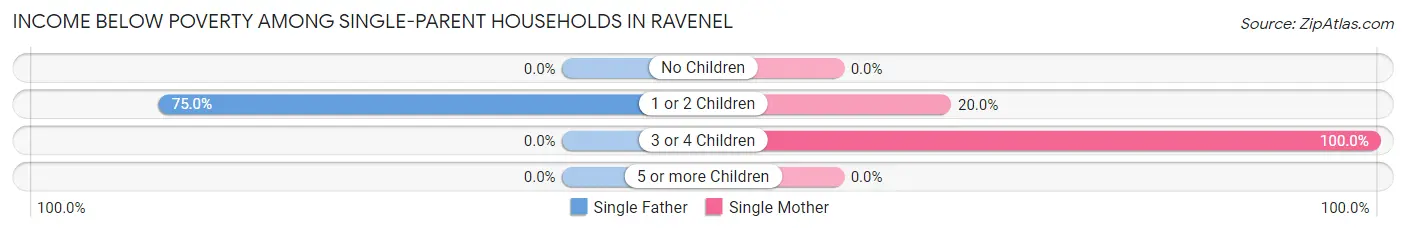
| Children | Single Father | Single Mother |
| No Children | 0 (0.0%) | 0 (0.0%) |
| 1 or 2 Children | 12 (75.0%) | 11 (20.0%) |
| 3 or 4 Children | 0 (0.0%) | 29 (100.0%) |
| 5 or more Children | 0 (0.0%) | 0 (0.0%) |
| Total | 12 (7.1%) | 40 (28.2%) |
Income Below Poverty Among Married-Couple vs Single-Parent Households in Ravenel
The poverty data for Ravenel shows that 20 of the married-couple family households (4.6%) and 52 of the single-parent households (16.7%) are living below the poverty level. Within the married-couple family households, those with 1 or 2 children have the highest poverty rate, with 20 households (14.4%) falling below the poverty line. Among the single-parent households, those with 3 or 4 children have the highest poverty rate, with 29 household (100.0%) living below poverty.
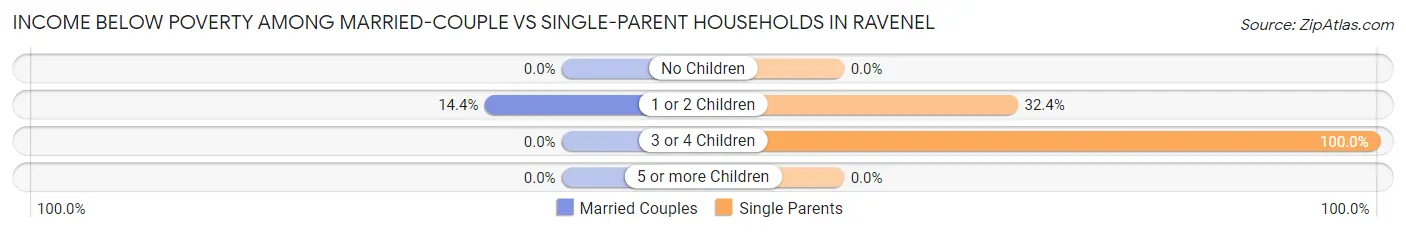
| Children | Married-Couple Families | Single-Parent Households |
| No Children | 0 (0.0%) | 0 (0.0%) |
| 1 or 2 Children | 20 (14.4%) | 23 (32.4%) |
| 3 or 4 Children | 0 (0.0%) | 29 (100.0%) |
| 5 or more Children | 0 (0.0%) | 0 (0.0%) |
| Total | 20 (4.6%) | 52 (16.7%) |
Race in Ravenel
The most populous races in Ravenel are Black / African American (1,219 | 47.4%), White / Caucasian (1,123 | 43.7%), and Hispanic or Latino (226 | 8.8%).
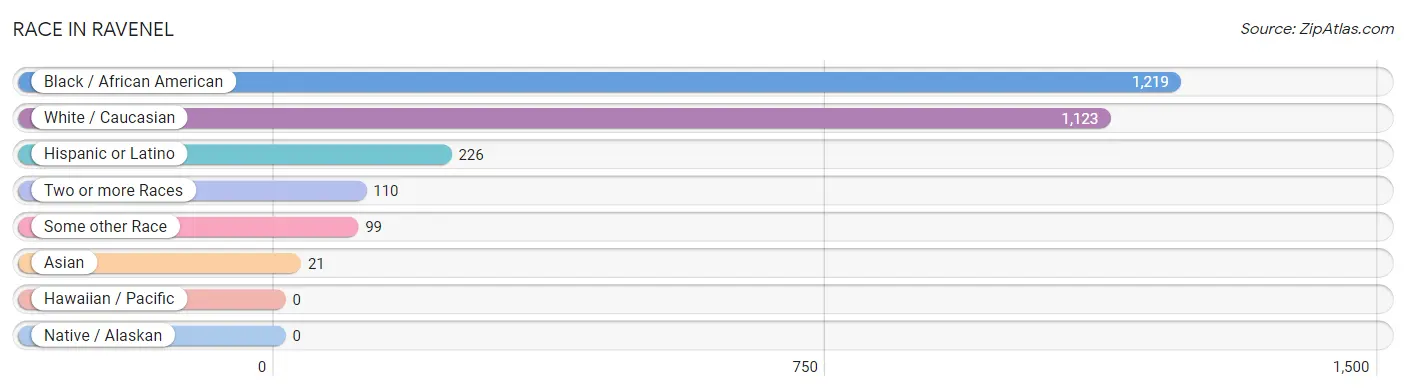
| Race | # Population | % Population |
| Asian | 21 | 0.8% |
| Black / African American | 1,219 | 47.4% |
| Hawaiian / Pacific | 0 | 0.0% |
| Hispanic or Latino | 226 | 8.8% |
| Native / Alaskan | 0 | 0.0% |
| White / Caucasian | 1,123 | 43.7% |
| Two or more Races | 110 | 4.3% |
| Some other Race | 99 | 3.8% |
| Total | 2,572 | 100.0% |
Ancestry in Ravenel
The most populous ancestries reported in Ravenel are American (332 | 12.9%), Polish (223 | 8.7%), German (188 | 7.3%), Mexican (180 | 7.0%), and Irish (126 | 4.9%), together accounting for 40.8% of all Ravenel residents.
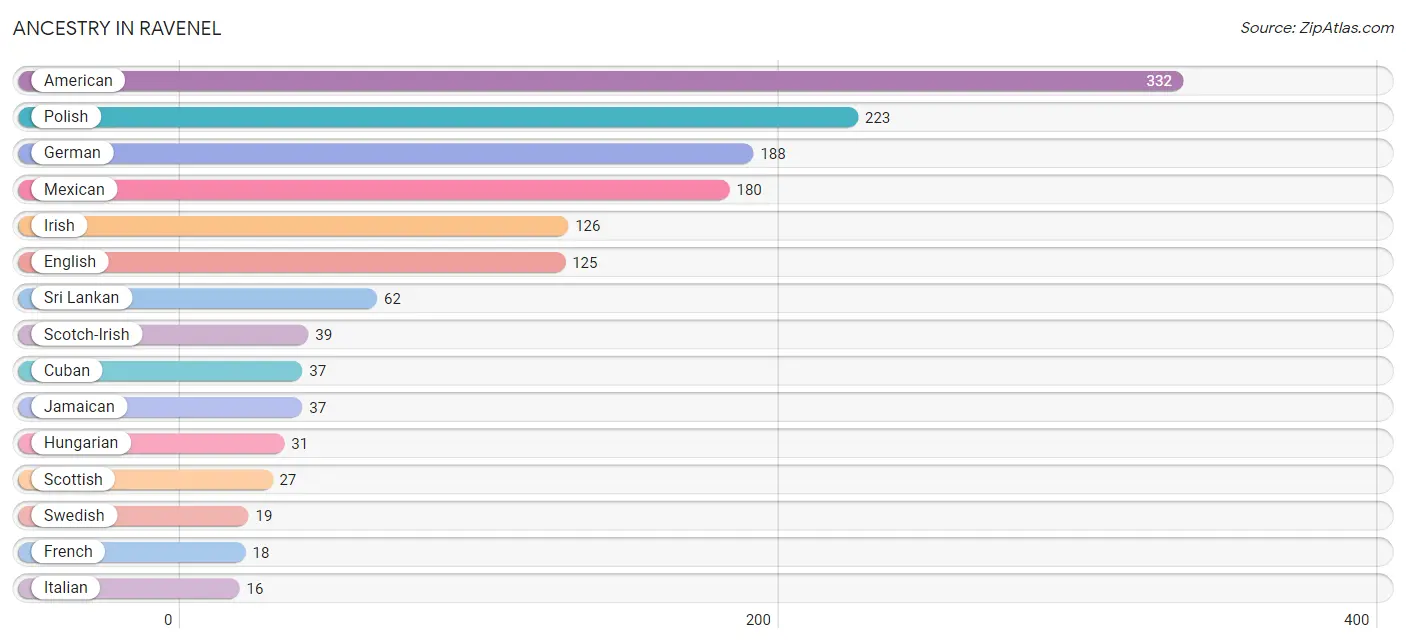
| Ancestry | # Population | % Population |
| American | 332 | 12.9% |
| Arab | 5 | 0.2% |
| Bolivian | 9 | 0.4% |
| British | 5 | 0.2% |
| Canadian | 5 | 0.2% |
| Cuban | 37 | 1.4% |
| English | 125 | 4.9% |
| European | 12 | 0.5% |
| French | 18 | 0.7% |
| German | 188 | 7.3% |
| Greek | 5 | 0.2% |
| Hungarian | 31 | 1.2% |
| Irish | 126 | 4.9% |
| Italian | 16 | 0.6% |
| Jamaican | 37 | 1.4% |
| Lebanese | 5 | 0.2% |
| Mexican | 180 | 7.0% |
| Northern European | 10 | 0.4% |
| Norwegian | 7 | 0.3% |
| Polish | 223 | 8.7% |
| Scotch-Irish | 39 | 1.5% |
| Scottish | 27 | 1.1% |
| South American | 9 | 0.4% |
| Sri Lankan | 62 | 2.4% |
| Swedish | 19 | 0.7% | View All 25 Rows |
Immigrants in Ravenel
The most numerous immigrant groups reported in Ravenel came from Europe (215 | 8.4%), Eastern Europe (207 | 8.1%), Poland (207 | 8.1%), Latin America (82 | 3.2%), and Central America (52 | 2.0%), together accounting for 29.7% of all Ravenel residents.
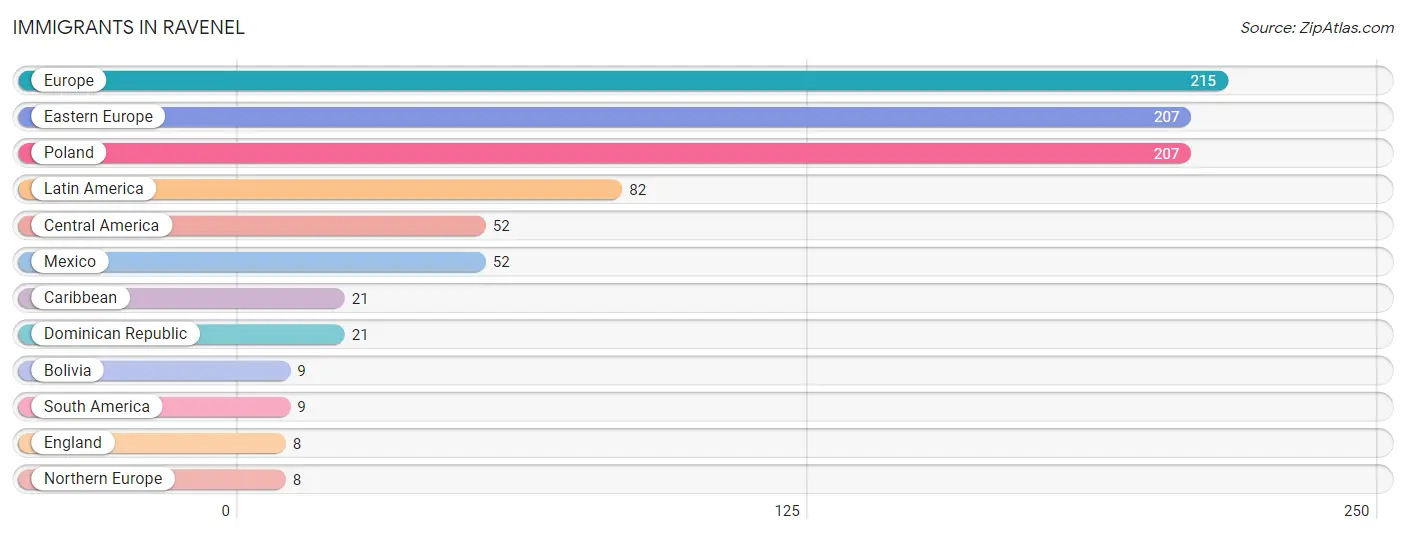
| Immigration Origin | # Population | % Population |
| Bolivia | 9 | 0.4% |
| Caribbean | 21 | 0.8% |
| Central America | 52 | 2.0% |
| Dominican Republic | 21 | 0.8% |
| Eastern Europe | 207 | 8.1% |
| England | 8 | 0.3% |
| Europe | 215 | 8.4% |
| Latin America | 82 | 3.2% |
| Mexico | 52 | 2.0% |
| Northern Europe | 8 | 0.3% |
| Poland | 207 | 8.1% |
| South America | 9 | 0.4% | View All 12 Rows |
Sex and Age in Ravenel
Sex and Age in Ravenel
The most populous age groups in Ravenel are 40 to 44 Years (188 | 13.9%) for men and Under 5 Years (108 | 8.9%) for women.
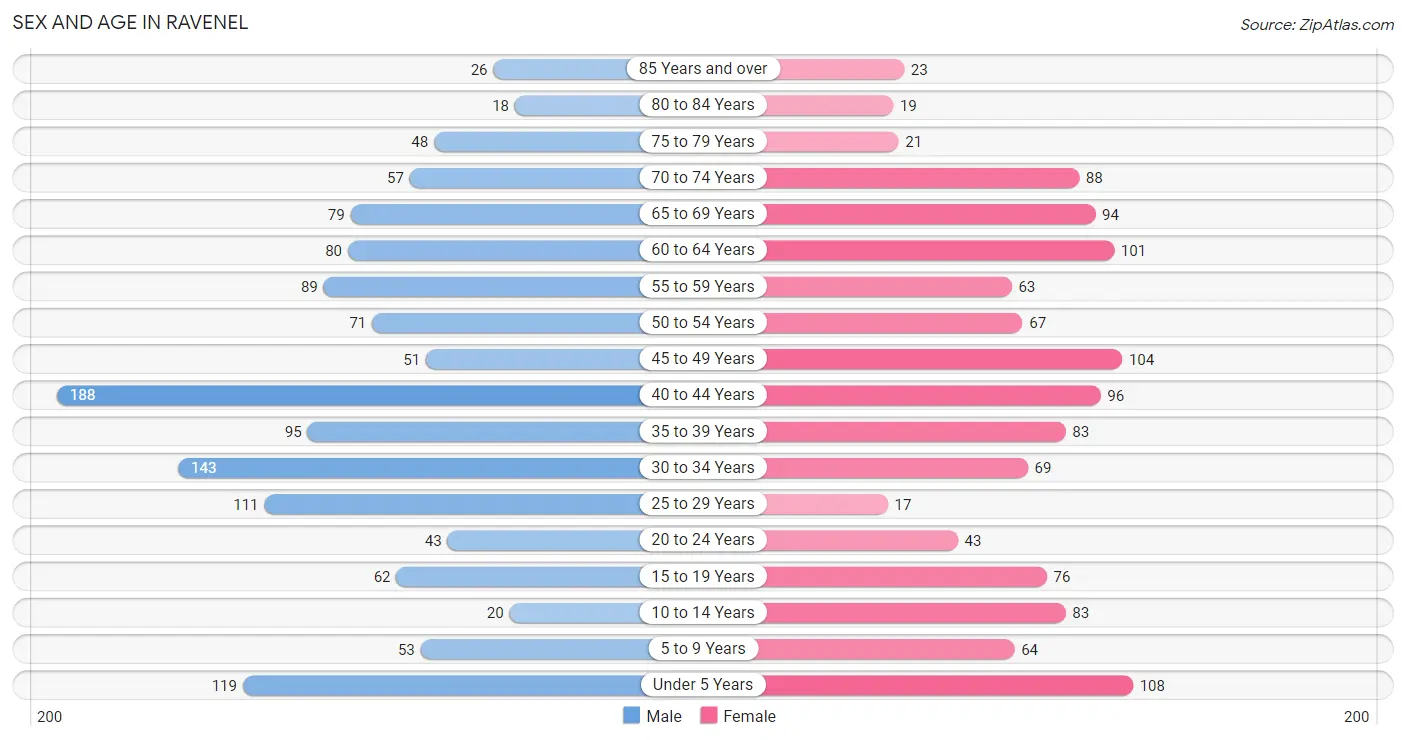
| Age Bracket | Male | Female |
| Under 5 Years | 119 (8.8%) | 108 (8.9%) |
| 5 to 9 Years | 53 (3.9%) | 64 (5.2%) |
| 10 to 14 Years | 20 (1.5%) | 83 (6.8%) |
| 15 to 19 Years | 62 (4.6%) | 76 (6.2%) |
| 20 to 24 Years | 43 (3.2%) | 43 (3.5%) |
| 25 to 29 Years | 111 (8.2%) | 17 (1.4%) |
| 30 to 34 Years | 143 (10.6%) | 69 (5.7%) |
| 35 to 39 Years | 95 (7.0%) | 83 (6.8%) |
| 40 to 44 Years | 188 (13.9%) | 96 (7.9%) |
| 45 to 49 Years | 51 (3.8%) | 104 (8.5%) |
| 50 to 54 Years | 71 (5.2%) | 67 (5.5%) |
| 55 to 59 Years | 89 (6.6%) | 63 (5.2%) |
| 60 to 64 Years | 80 (5.9%) | 101 (8.3%) |
| 65 to 69 Years | 79 (5.8%) | 94 (7.7%) |
| 70 to 74 Years | 57 (4.2%) | 88 (7.2%) |
| 75 to 79 Years | 48 (3.5%) | 21 (1.7%) |
| 80 to 84 Years | 18 (1.3%) | 19 (1.6%) |
| 85 Years and over | 26 (1.9%) | 23 (1.9%) |
| Total | 1,353 (100.0%) | 1,219 (100.0%) |
Families and Households in Ravenel
Median Family Size in Ravenel
The median family size in Ravenel is 2.90 persons per family, with single female/mother families (142 | 19.0%) accounting for the largest median family size of 4.35 persons per family. On the other hand, single male/father families (170 | 22.8%) represent the smallest median family size with 1.60 persons per family.
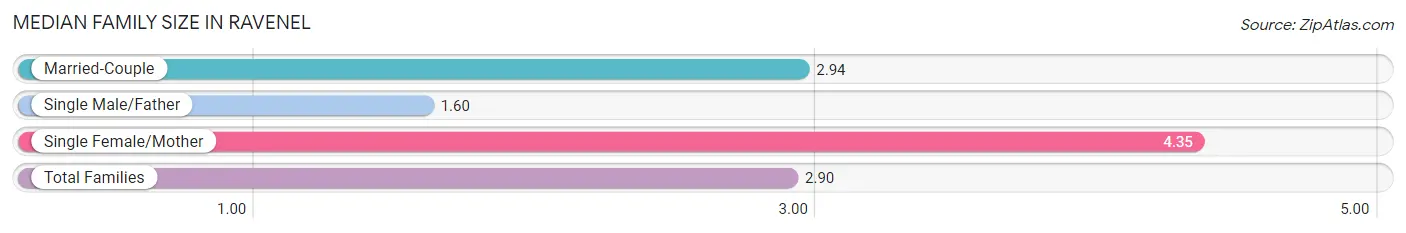
| Family Type | # Families | Family Size |
| Married-Couple | 434 (58.2%) | 2.94 |
| Single Male/Father | 170 (22.8%) | 1.60 |
| Single Female/Mother | 142 (19.0%) | 4.35 |
| Total Families | 746 (100.0%) | 2.90 |
Median Household Size in Ravenel
The median household size in Ravenel is 2.55 persons per household, with single female/mother households (142 | 14.1%) accounting for the largest median household size of 4.51 persons per household. non-family households (263 | 26.1%) represent the smallest median household size with 1.37 persons per household.
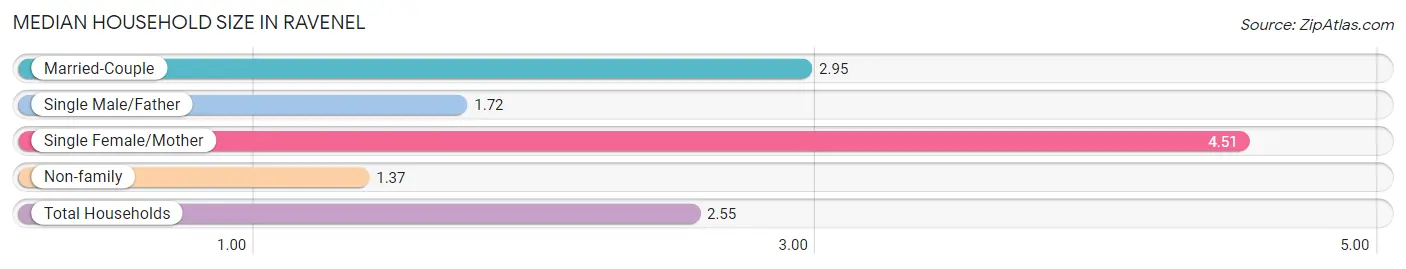
| Household Type | # Households | Household Size |
| Married-Couple | 434 (43.0%) | 2.95 |
| Single Male/Father | 170 (16.9%) | 1.72 |
| Single Female/Mother | 142 (14.1%) | 4.51 |
| Non-family | 263 (26.1%) | 1.37 |
| Total Households | 1,009 (100.0%) | 2.55 |
Household Size by Marriage Status in Ravenel
Out of a total of 1,009 households in Ravenel, 746 (73.9%) are family households, while 263 (26.1%) are nonfamily households. The most numerous type of family households are 3-person households, comprising 309, and the most common type of nonfamily households are 1-person households, comprising 214.
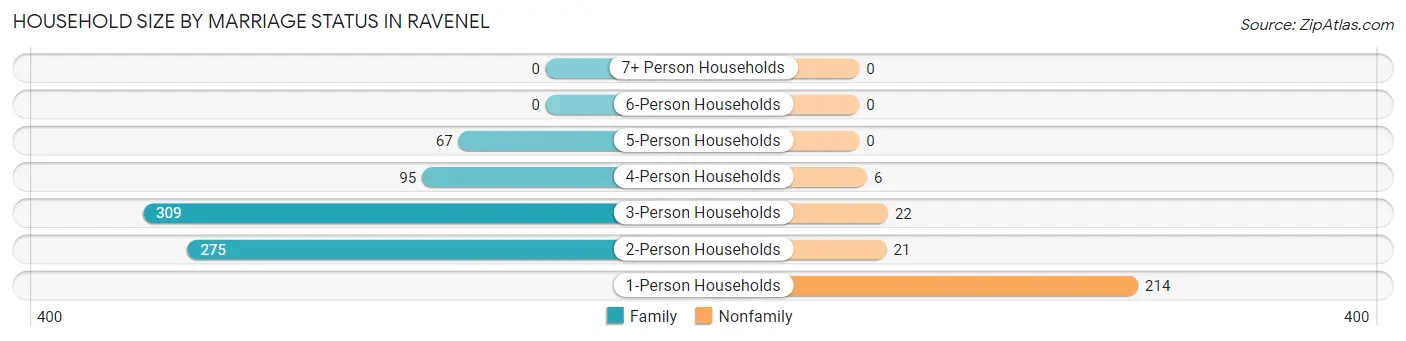
| Household Size | Family Households | Nonfamily Households |
| 1-Person Households | - | 214 (21.2%) |
| 2-Person Households | 275 (27.3%) | 21 (2.1%) |
| 3-Person Households | 309 (30.6%) | 22 (2.2%) |
| 4-Person Households | 95 (9.4%) | 6 (0.6%) |
| 5-Person Households | 67 (6.6%) | 0 (0.0%) |
| 6-Person Households | 0 (0.0%) | 0 (0.0%) |
| 7+ Person Households | 0 (0.0%) | 0 (0.0%) |
| Total | 746 (73.9%) | 263 (26.1%) |
Female Fertility in Ravenel
Fertility by Age in Ravenel
Average fertility rate in Ravenel is 147.0 births per 1,000 women. Women in the age bracket of 35 to 50 years have the highest fertility rate with 181.0 births per 1,000 women. Women in the age bracket of 35 to 50 years acount for 73.3% of all women with births.
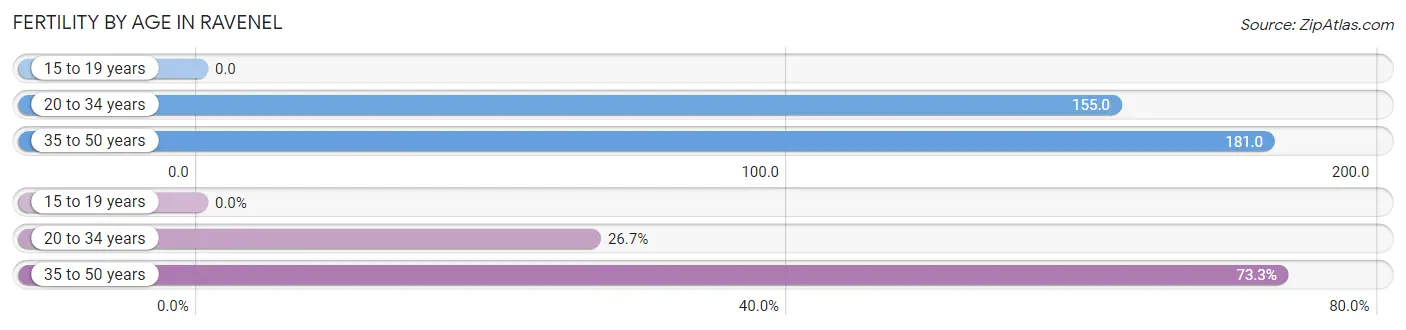
| Age Bracket | Women with Births | Births / 1,000 Women |
| 15 to 19 years | 0 (0.0%) | 0.0 |
| 20 to 34 years | 20 (26.7%) | 155.0 |
| 35 to 50 years | 55 (73.3%) | 181.0 |
| Total | 75 (100.0%) | 147.0 |
Fertility by Age by Marriage Status in Ravenel
34.7% of women with births (75) in Ravenel are married. The highest percentage of unmarried women with births falls into 20 to 34 years age bracket with 100.0% of them unmarried at the time of birth, while the lowest percentage of unmarried women with births belong to 35 to 50 years age bracket with 52.7% of them unmarried.
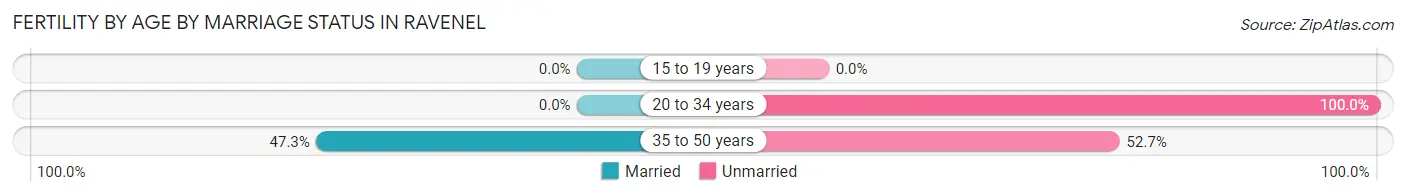
| Age Bracket | Married | Unmarried |
| 15 to 19 years | 0 (0.0%) | 0 (0.0%) |
| 20 to 34 years | 0 (0.0%) | 20 (100.0%) |
| 35 to 50 years | 26 (47.3%) | 29 (52.7%) |
| Total | 26 (34.7%) | 49 (65.3%) |
Fertility by Education in Ravenel
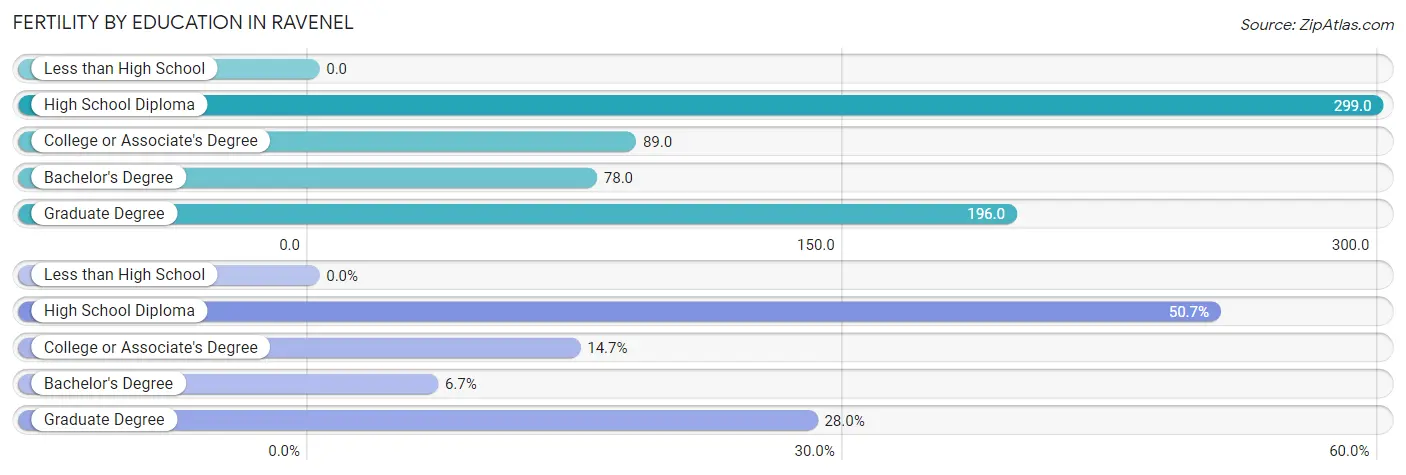
| Educational Attainment | Women with Births | Births / 1,000 Women |
| Less than High School | 0 (0.0%) | 0.0 |
| High School Diploma | 38 (50.7%) | 299.0 |
| College or Associate's Degree | 11 (14.7%) | 89.0 |
| Bachelor's Degree | 5 (6.7%) | 78.0 |
| Graduate Degree | 21 (28.0%) | 196.0 |
| Total | 75 (100.0%) | 147.0 |
Fertility by Education by Marriage Status in Ravenel
65.3% of women with births in Ravenel are unmarried. Women with the educational attainment of bachelor's degree are most likely to be married with 100.0% of them married at childbirth, while women with the educational attainment of high school diploma are least likely to be married with 100.0% of them unmarried at childbirth.
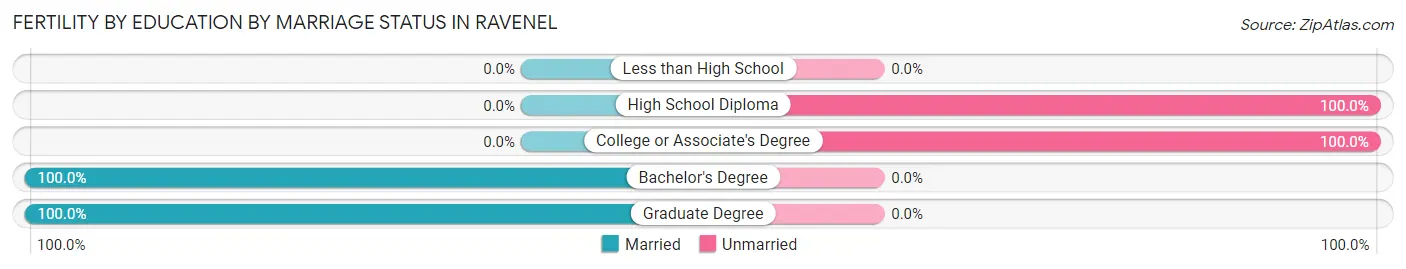
| Educational Attainment | Married | Unmarried |
| Less than High School | 0 (0.0%) | 0 (0.0%) |
| High School Diploma | 0 (0.0%) | 38 (100.0%) |
| College or Associate's Degree | 0 (0.0%) | 11 (100.0%) |
| Bachelor's Degree | 5 (100.0%) | 0 (0.0%) |
| Graduate Degree | 21 (100.0%) | 0 (0.0%) |
| Total | 26 (34.7%) | 49 (65.3%) |
Employment Characteristics in Ravenel
Employment by Class of Employer in Ravenel
Among the 1,245 employed individuals in Ravenel, private company employees (911 | 73.2%), not-for-profit organizations (96 | 7.7%), and self-employed (not incorporated) (88 | 7.1%) make up the most common classes of employment.
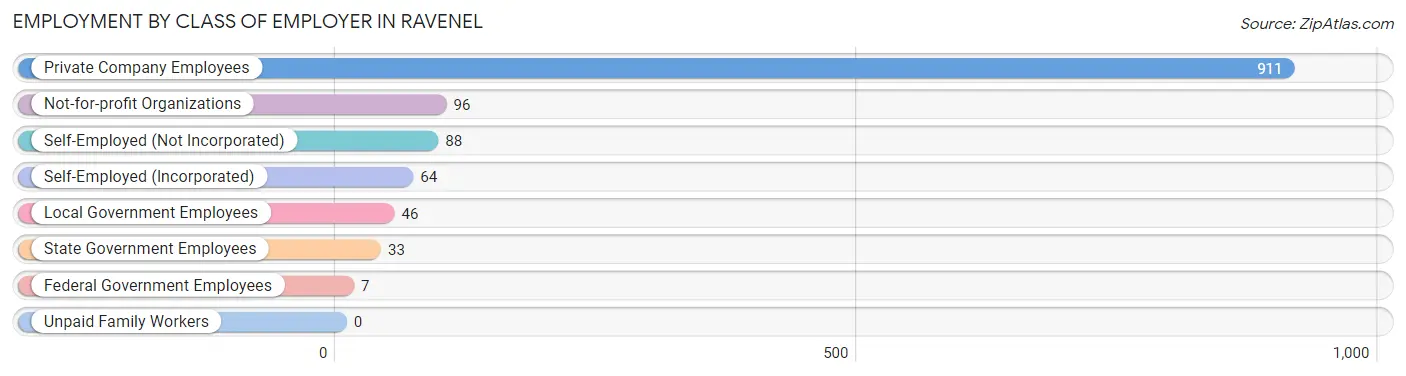
| Employer Class | # Employees | % Employees |
| Private Company Employees | 911 | 73.2% |
| Self-Employed (Incorporated) | 64 | 5.1% |
| Self-Employed (Not Incorporated) | 88 | 7.1% |
| Not-for-profit Organizations | 96 | 7.7% |
| Local Government Employees | 46 | 3.7% |
| State Government Employees | 33 | 2.6% |
| Federal Government Employees | 7 | 0.6% |
| Unpaid Family Workers | 0 | 0.0% |
| Total | 1,245 | 100.0% |
Employment Status by Age in Ravenel
According to the labor force statistics for Ravenel, out of the total population over 16 years of age (2,085), 61.0% or 1,272 individuals are in the labor force, with 1.7% or 22 of them unemployed. The age group with the highest labor force participation rate is 30 to 34 years, with 96.2% or 204 individuals in the labor force. Within the labor force, the 25 to 29 years age range has the highest percentage of unemployed individuals, with 26.1% or 18 of them being unemployed.
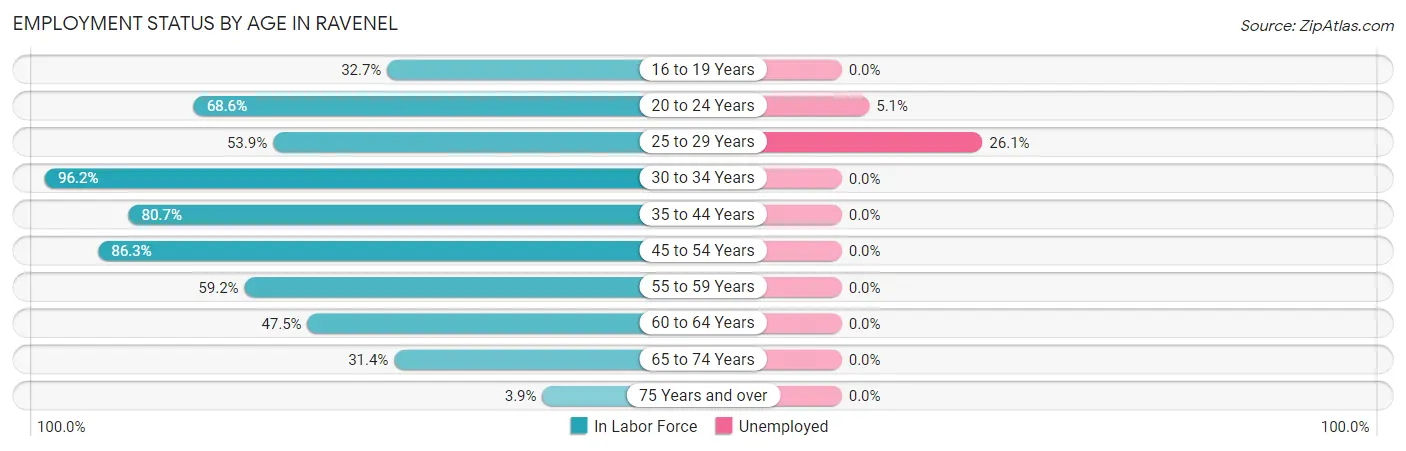
| Age Bracket | In Labor Force | Unemployed |
| 16 to 19 Years | 32 (32.7%) | 0 (0.0%) |
| 20 to 24 Years | 59 (68.6%) | 3 (5.1%) |
| 25 to 29 Years | 69 (53.9%) | 18 (26.1%) |
| 30 to 34 Years | 204 (96.2%) | 0 (0.0%) |
| 35 to 44 Years | 373 (80.7%) | 0 (0.0%) |
| 45 to 54 Years | 253 (86.3%) | 0 (0.0%) |
| 55 to 59 Years | 90 (59.2%) | 0 (0.0%) |
| 60 to 64 Years | 86 (47.5%) | 0 (0.0%) |
| 65 to 74 Years | 100 (31.4%) | 0 (0.0%) |
| 75 Years and over | 6 (3.9%) | 0 (0.0%) |
| Total | 1,272 (61.0%) | 22 (1.7%) |
Employment Status by Educational Attainment in Ravenel
According to labor force statistics for Ravenel, 75.3% of individuals (1,075) out of the total population between 25 and 64 years of age (1,428) are in the labor force, with 1.7% or 18 of them being unemployed. The group with the highest labor force participation rate are those with the educational attainment of bachelor's degree or higher, with 86.4% or 374 individuals in the labor force. Within the labor force, individuals with less than high school education have the highest percentage of unemployment, with 14.1% or 9 of them being unemployed.
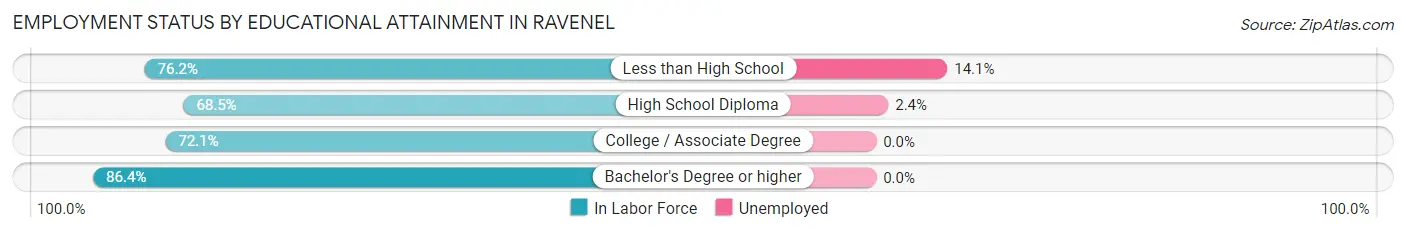
| Educational Attainment | In Labor Force | Unemployed |
| Less than High School | 64 (76.2%) | 12 (14.1%) |
| High School Diploma | 371 (68.5%) | 13 (2.4%) |
| College / Associate Degree | 266 (72.1%) | 0 (0.0%) |
| Bachelor's Degree or higher | 374 (86.4%) | 0 (0.0%) |
| Total | 1,075 (75.3%) | 24 (1.7%) |
Employment Occupations by Sex in Ravenel
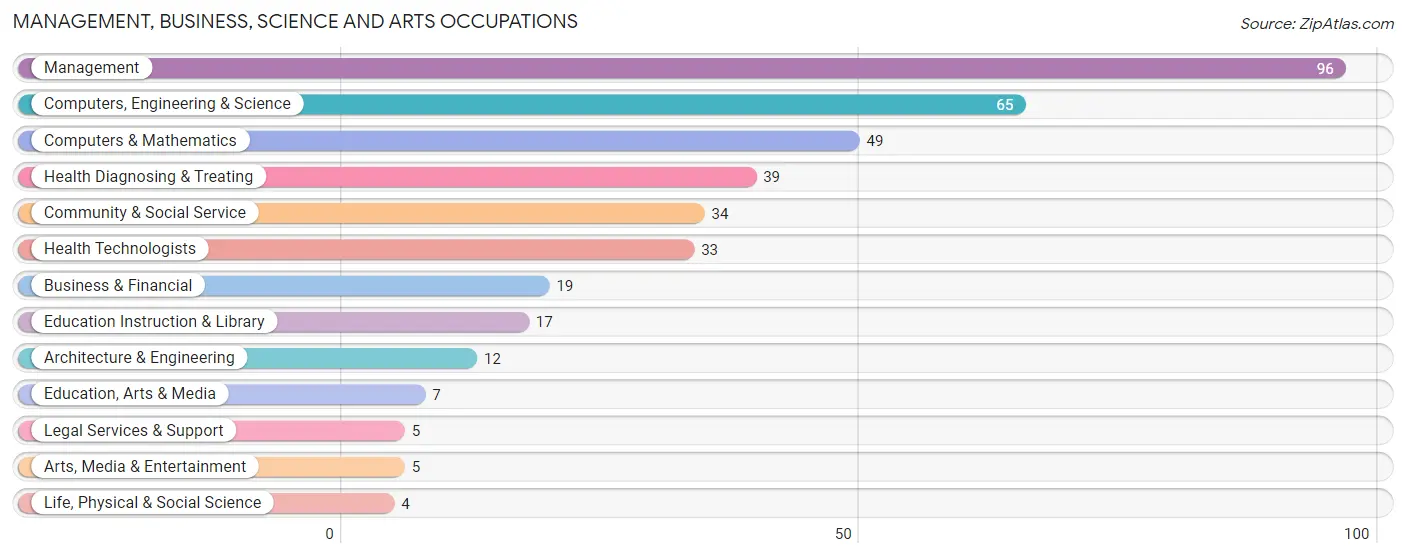
Management, Business, Science and Arts Occupations
The most common Management, Business, Science and Arts occupations in Ravenel are Management (96 | 7.7%), Computers, Engineering & Science (65 | 5.2%), Computers & Mathematics (49 | 3.9%), Health Diagnosing & Treating (39 | 3.1%), and Community & Social Service (34 | 2.7%).
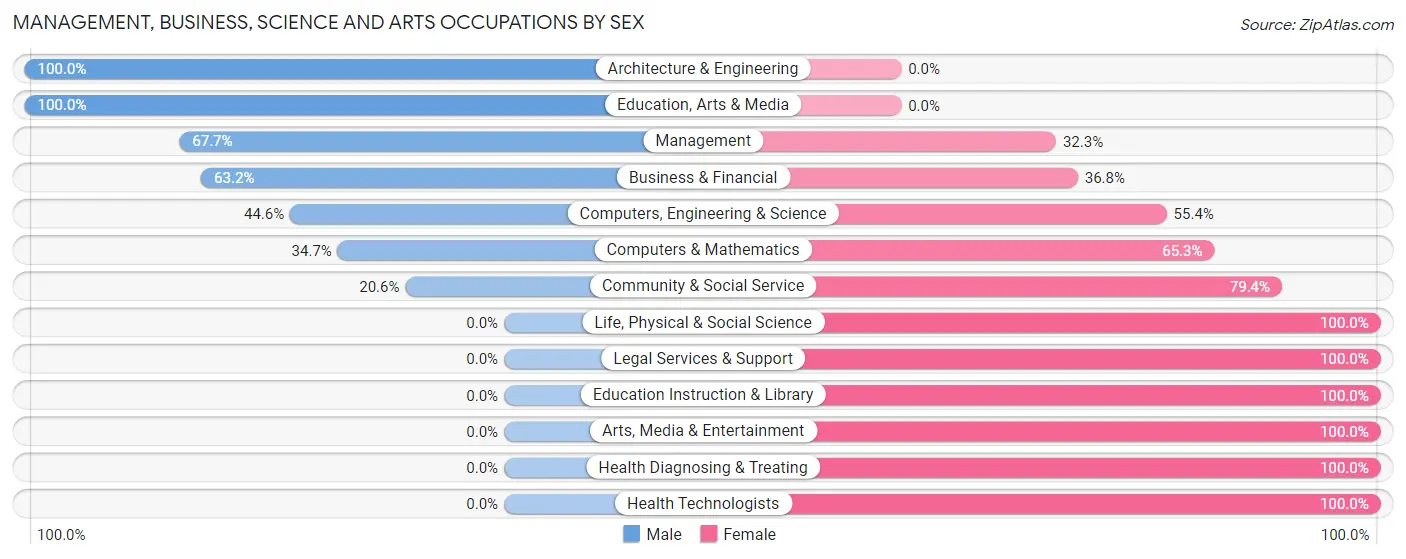
Management, Business, Science and Arts Occupations by Sex
Within the Management, Business, Science and Arts occupations in Ravenel, the most male-oriented occupations are Architecture & Engineering (100.0%), Education, Arts & Media (100.0%), and Management (67.7%), while the most female-oriented occupations are Life, Physical & Social Science (100.0%), Legal Services & Support (100.0%), and Education Instruction & Library (100.0%).
| Occupation | Male | Female |
| Management | 65 (67.7%) | 31 (32.3%) |
| Business & Financial | 12 (63.2%) | 7 (36.8%) |
| Computers, Engineering & Science | 29 (44.6%) | 36 (55.4%) |
| Computers & Mathematics | 17 (34.7%) | 32 (65.3%) |
| Architecture & Engineering | 12 (100.0%) | 0 (0.0%) |
| Life, Physical & Social Science | 0 (0.0%) | 4 (100.0%) |
| Community & Social Service | 7 (20.6%) | 27 (79.4%) |
| Education, Arts & Media | 7 (100.0%) | 0 (0.0%) |
| Legal Services & Support | 0 (0.0%) | 5 (100.0%) |
| Education Instruction & Library | 0 (0.0%) | 17 (100.0%) |
| Arts, Media & Entertainment | 0 (0.0%) | 5 (100.0%) |
| Health Diagnosing & Treating | 0 (0.0%) | 39 (100.0%) |
| Health Technologists | 0 (0.0%) | 33 (100.0%) |
| Total (Category) | 113 (44.7%) | 140 (55.3%) |
| Total (Overall) | 703 (56.2%) | 548 (43.8%) |
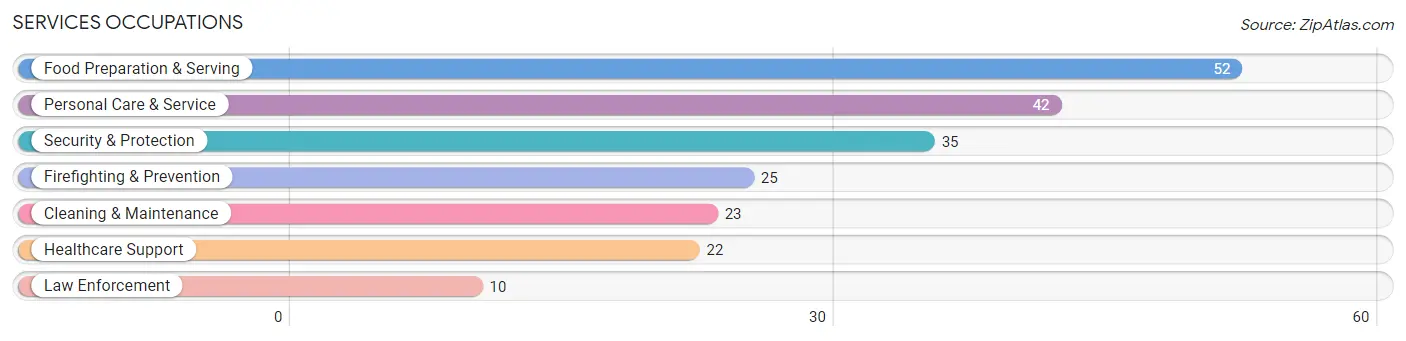
Services Occupations
The most common Services occupations in Ravenel are Food Preparation & Serving (52 | 4.2%), Personal Care & Service (42 | 3.4%), Security & Protection (35 | 2.8%), Firefighting & Prevention (25 | 2.0%), and Cleaning & Maintenance (23 | 1.8%).
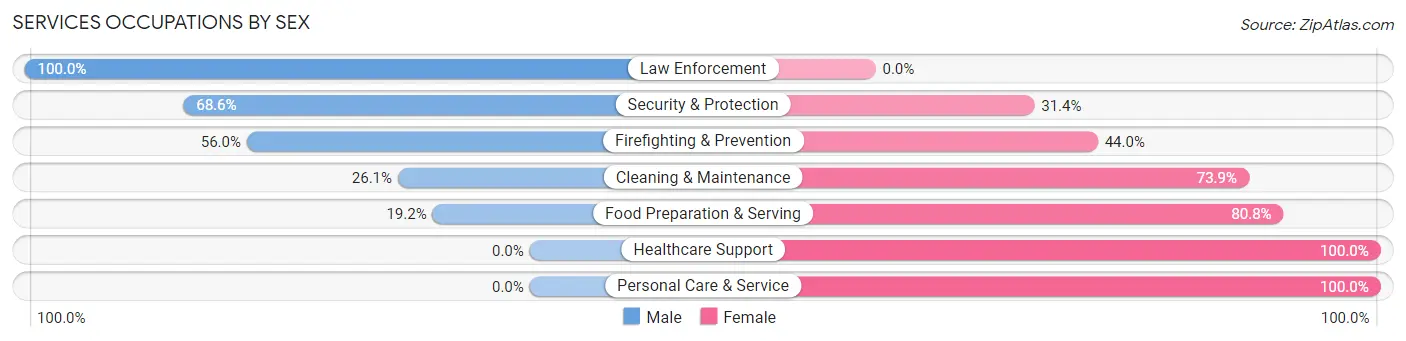
Services Occupations by Sex
Within the Services occupations in Ravenel, the most male-oriented occupations are Law Enforcement (100.0%), Security & Protection (68.6%), and Firefighting & Prevention (56.0%), while the most female-oriented occupations are Healthcare Support (100.0%), Personal Care & Service (100.0%), and Food Preparation & Serving (80.8%).
| Occupation | Male | Female |
| Healthcare Support | 0 (0.0%) | 22 (100.0%) |
| Security & Protection | 24 (68.6%) | 11 (31.4%) |
| Firefighting & Prevention | 14 (56.0%) | 11 (44.0%) |
| Law Enforcement | 10 (100.0%) | 0 (0.0%) |
| Food Preparation & Serving | 10 (19.2%) | 42 (80.8%) |
| Cleaning & Maintenance | 6 (26.1%) | 17 (73.9%) |
| Personal Care & Service | 0 (0.0%) | 42 (100.0%) |
| Total (Category) | 40 (23.0%) | 134 (77.0%) |
| Total (Overall) | 703 (56.2%) | 548 (43.8%) |
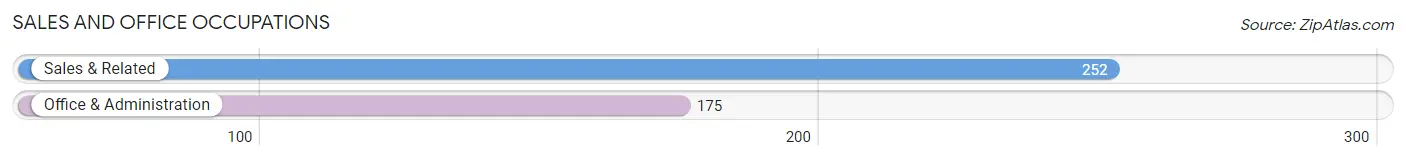
Sales and Office Occupations
The most common Sales and Office occupations in Ravenel are Sales & Related (252 | 20.1%), and Office & Administration (175 | 14.0%).
Sales and Office Occupations by Sex
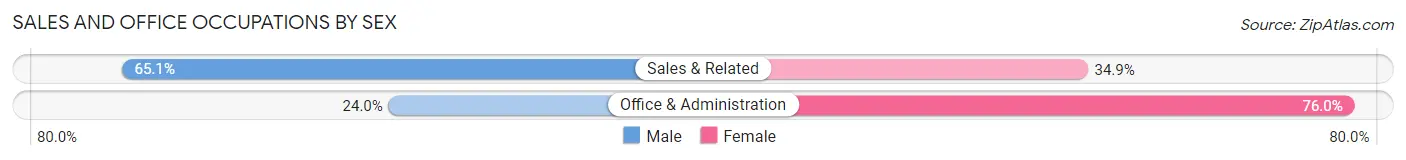
| Occupation | Male | Female |
| Sales & Related | 164 (65.1%) | 88 (34.9%) |
| Office & Administration | 42 (24.0%) | 133 (76.0%) |
| Total (Category) | 206 (48.2%) | 221 (51.8%) |
| Total (Overall) | 703 (56.2%) | 548 (43.8%) |
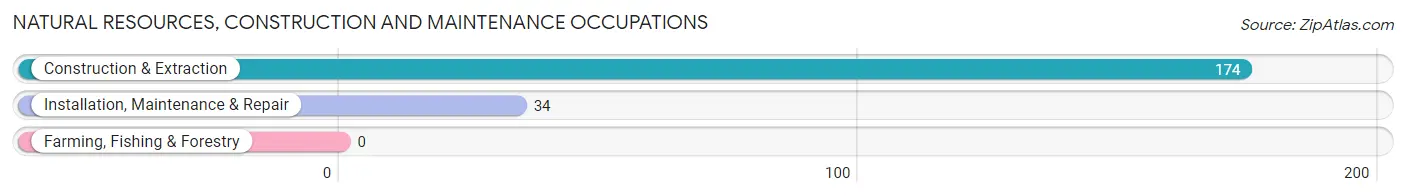
Natural Resources, Construction and Maintenance Occupations
The most common Natural Resources, Construction and Maintenance occupations in Ravenel are Construction & Extraction (174 | 13.9%), and Installation, Maintenance & Repair (34 | 2.7%).
Natural Resources, Construction and Maintenance Occupations by Sex
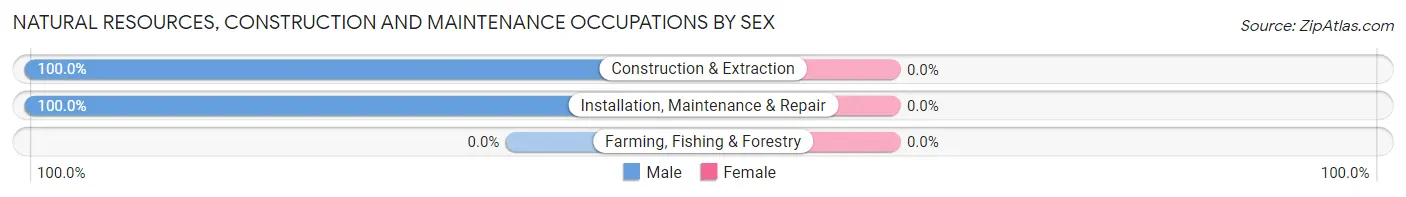
| Occupation | Male | Female |
| Farming, Fishing & Forestry | 0 (0.0%) | 0 (0.0%) |
| Construction & Extraction | 174 (100.0%) | 0 (0.0%) |
| Installation, Maintenance & Repair | 34 (100.0%) | 0 (0.0%) |
| Total (Category) | 208 (100.0%) | 0 (0.0%) |
| Total (Overall) | 703 (56.2%) | 548 (43.8%) |
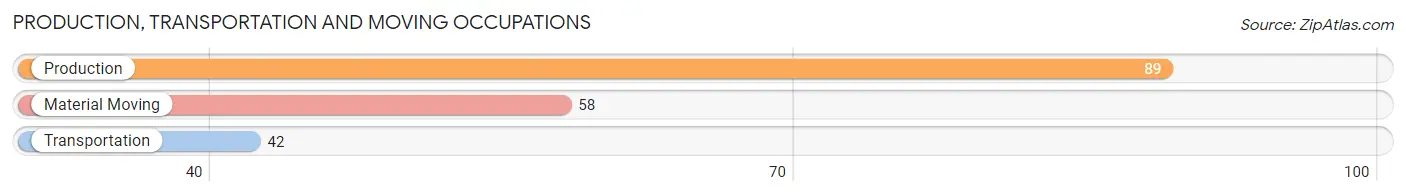
Production, Transportation and Moving Occupations
The most common Production, Transportation and Moving occupations in Ravenel are Production (89 | 7.1%), Material Moving (58 | 4.6%), and Transportation (42 | 3.4%).
Production, Transportation and Moving Occupations by Sex
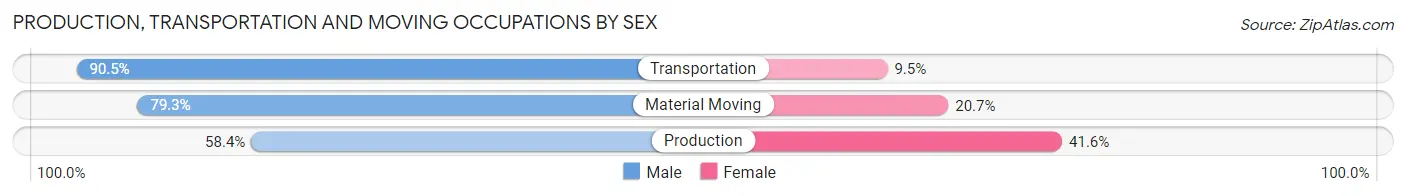
| Occupation | Male | Female |
| Production | 52 (58.4%) | 37 (41.6%) |
| Transportation | 38 (90.5%) | 4 (9.5%) |
| Material Moving | 46 (79.3%) | 12 (20.7%) |
| Total (Category) | 136 (72.0%) | 53 (28.0%) |
| Total (Overall) | 703 (56.2%) | 548 (43.8%) |
Employment Industries by Sex in Ravenel
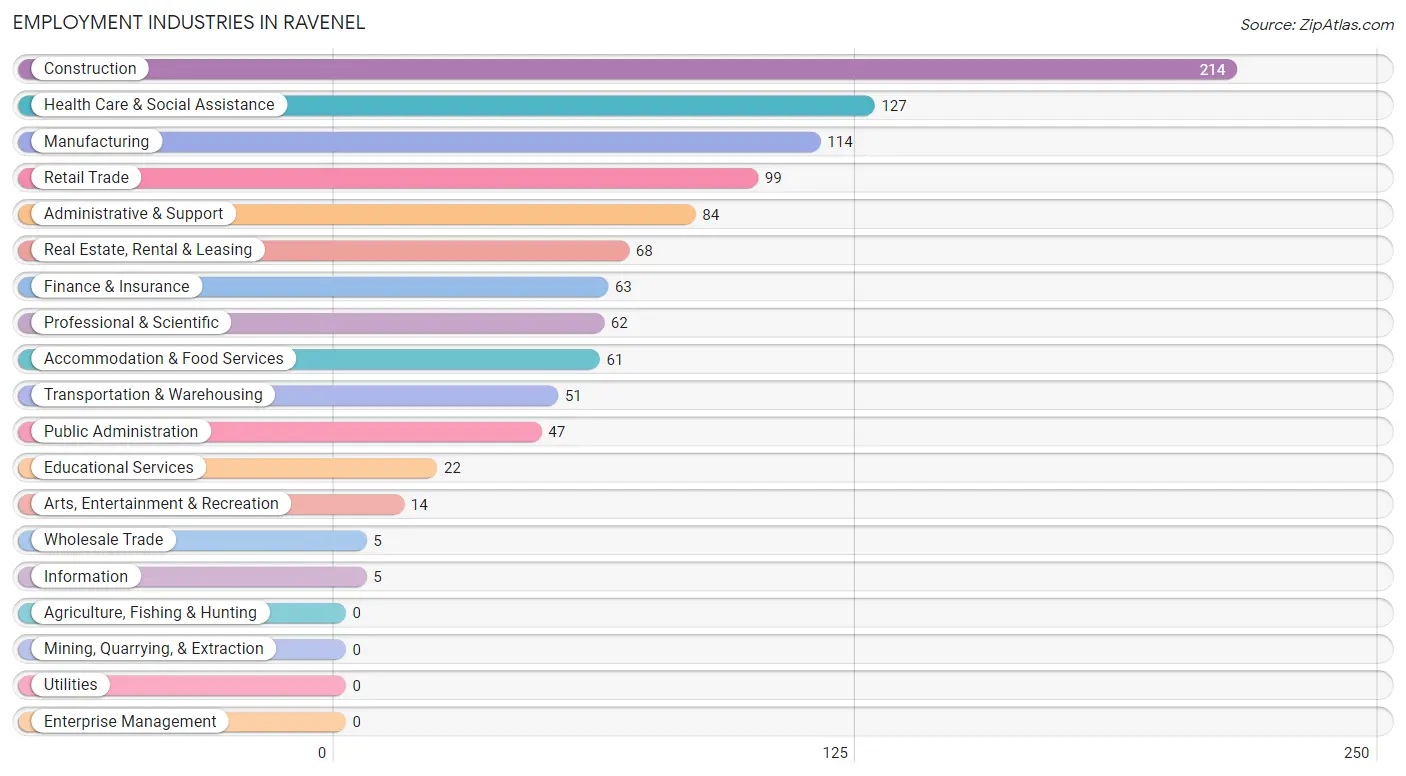
Employment Industries in Ravenel
The major employment industries in Ravenel include Construction (214 | 17.1%), Health Care & Social Assistance (127 | 10.2%), Manufacturing (114 | 9.1%), Retail Trade (99 | 7.9%), and Administrative & Support (84 | 6.7%).
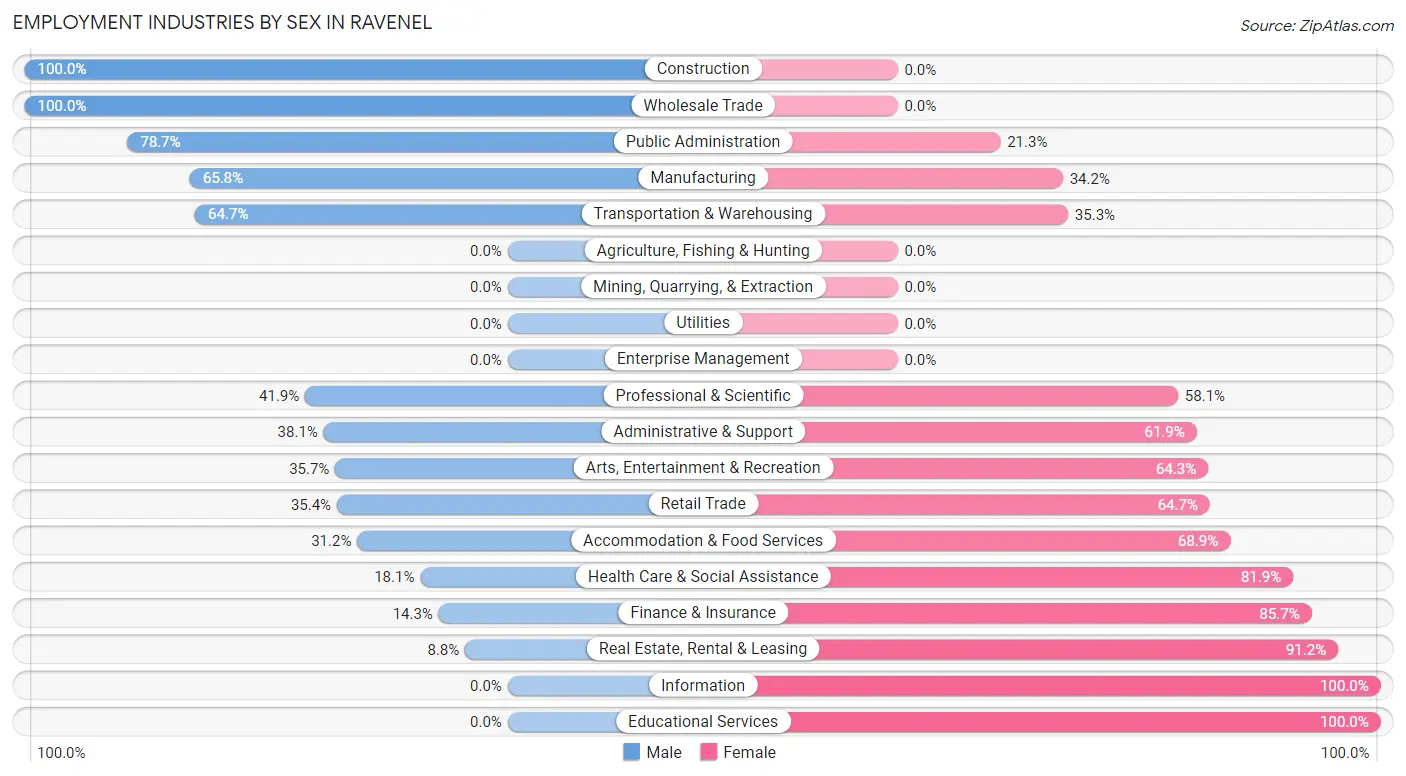
Employment Industries by Sex in Ravenel
The Ravenel industries that see more men than women are Construction (100.0%), Wholesale Trade (100.0%), and Public Administration (78.7%), whereas the industries that tend to have a higher number of women are Information (100.0%), Educational Services (100.0%), and Real Estate, Rental & Leasing (91.2%).
| Industry | Male | Female |
| Agriculture, Fishing & Hunting | 0 (0.0%) | 0 (0.0%) |
| Mining, Quarrying, & Extraction | 0 (0.0%) | 0 (0.0%) |
| Construction | 214 (100.0%) | 0 (0.0%) |
| Manufacturing | 75 (65.8%) | 39 (34.2%) |
| Wholesale Trade | 5 (100.0%) | 0 (0.0%) |
| Retail Trade | 35 (35.3%) | 64 (64.6%) |
| Transportation & Warehousing | 33 (64.7%) | 18 (35.3%) |
| Utilities | 0 (0.0%) | 0 (0.0%) |
| Information | 0 (0.0%) | 5 (100.0%) |
| Finance & Insurance | 9 (14.3%) | 54 (85.7%) |
| Real Estate, Rental & Leasing | 6 (8.8%) | 62 (91.2%) |
| Professional & Scientific | 26 (41.9%) | 36 (58.1%) |
| Enterprise Management | 0 (0.0%) | 0 (0.0%) |
| Administrative & Support | 32 (38.1%) | 52 (61.9%) |
| Educational Services | 0 (0.0%) | 22 (100.0%) |
| Health Care & Social Assistance | 23 (18.1%) | 104 (81.9%) |
| Arts, Entertainment & Recreation | 5 (35.7%) | 9 (64.3%) |
| Accommodation & Food Services | 19 (31.1%) | 42 (68.9%) |
| Public Administration | 37 (78.7%) | 10 (21.3%) |
| Total | 703 (56.2%) | 548 (43.8%) |
Education in Ravenel
School Enrollment in Ravenel
The most common levels of schooling among the 481 students in Ravenel are high school (133 | 27.7%), college / undergraduate (78 | 16.2%), and middle school (69 | 14.3%).
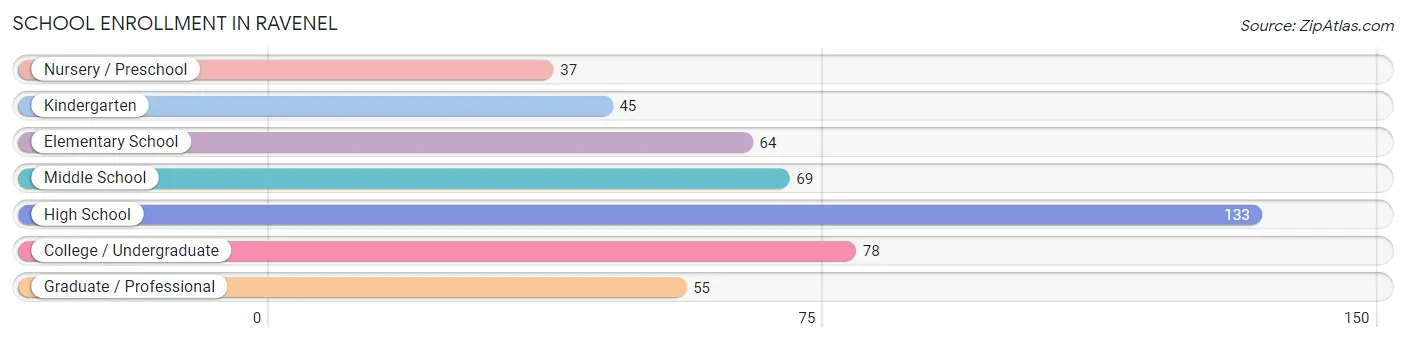
| School Level | # Students | % Students |
| Nursery / Preschool | 37 | 7.7% |
| Kindergarten | 45 | 9.4% |
| Elementary School | 64 | 13.3% |
| Middle School | 69 | 14.3% |
| High School | 133 | 27.7% |
| College / Undergraduate | 78 | 16.2% |
| Graduate / Professional | 55 | 11.4% |
| Total | 481 | 100.0% |
School Enrollment by Age by Funding Source in Ravenel
Out of a total of 481 students who are enrolled in schools in Ravenel, 80 (16.6%) attend a private institution, while the remaining 401 (83.4%) are enrolled in public schools. The age group of 25 to 34 year olds has the highest likelihood of being enrolled in private schools, with 51 (76.1% in the age bracket) enrolled. Conversely, the age group of 3 to 4 year olds has the lowest likelihood of being enrolled in a private school, with 24 (100.0% in the age bracket) attending a public institution.
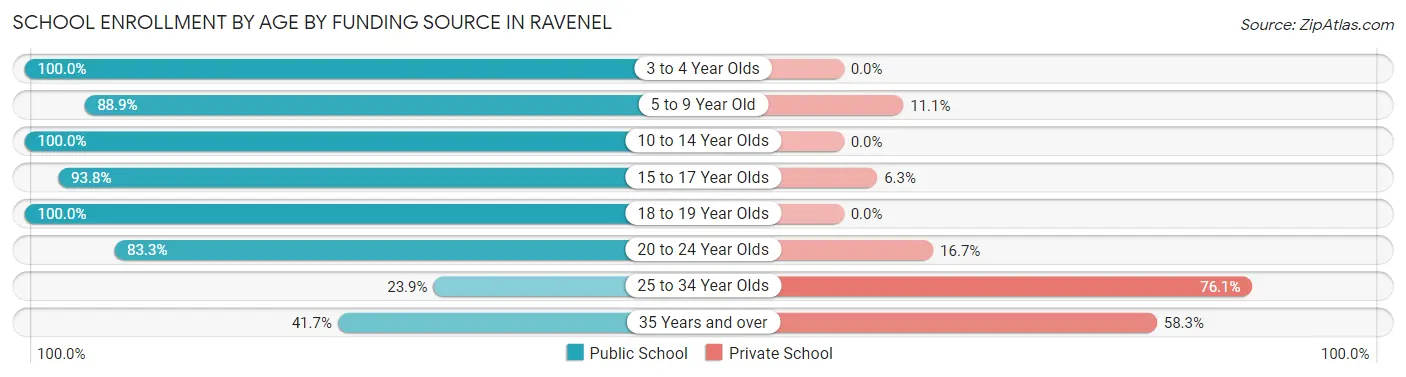
| Age Bracket | Public School | Private School |
| 3 to 4 Year Olds | 24 (100.0%) | 0 (0.0%) |
| 5 to 9 Year Old | 104 (88.9%) | 13 (11.1%) |
| 10 to 14 Year Olds | 103 (100.0%) | 0 (0.0%) |
| 15 to 17 Year Olds | 75 (93.8%) | 5 (6.2%) |
| 18 to 19 Year Olds | 54 (100.0%) | 0 (0.0%) |
| 20 to 24 Year Olds | 20 (83.3%) | 4 (16.7%) |
| 25 to 34 Year Olds | 16 (23.9%) | 51 (76.1%) |
| 35 Years and over | 5 (41.7%) | 7 (58.3%) |
| Total | 401 (83.4%) | 80 (16.6%) |
Educational Attainment by Field of Study in Ravenel
Computers & mathematics (80 | 14.9%), business (75 | 14.0%), bio, nature & agricultural (55 | 10.3%), social sciences (44 | 8.2%), and science & technology (44 | 8.2%) are the most common fields of study among 536 individuals in Ravenel who have obtained a bachelor's degree or higher.
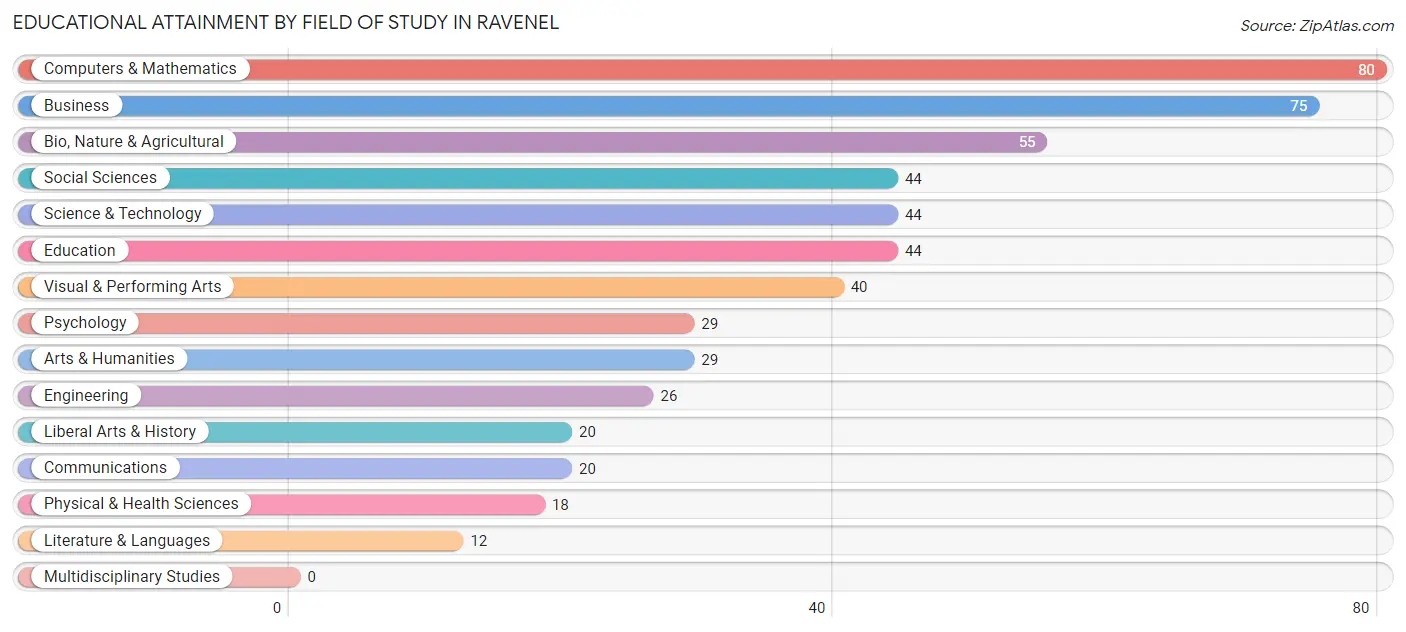
| Field of Study | # Graduates | % Graduates |
| Computers & Mathematics | 80 | 14.9% |
| Bio, Nature & Agricultural | 55 | 10.3% |
| Physical & Health Sciences | 18 | 3.4% |
| Psychology | 29 | 5.4% |
| Social Sciences | 44 | 8.2% |
| Engineering | 26 | 4.9% |
| Multidisciplinary Studies | 0 | 0.0% |
| Science & Technology | 44 | 8.2% |
| Business | 75 | 14.0% |
| Education | 44 | 8.2% |
| Literature & Languages | 12 | 2.2% |
| Liberal Arts & History | 20 | 3.7% |
| Visual & Performing Arts | 40 | 7.5% |
| Communications | 20 | 3.7% |
| Arts & Humanities | 29 | 5.4% |
| Total | 536 | 100.0% |
Transportation & Commute in Ravenel
Vehicle Availability by Sex in Ravenel
The most prevalent vehicle ownership categories in Ravenel are males with 2 vehicles (429, accounting for 61.1%) and females with 2 vehicles (188, making up 79.0%).
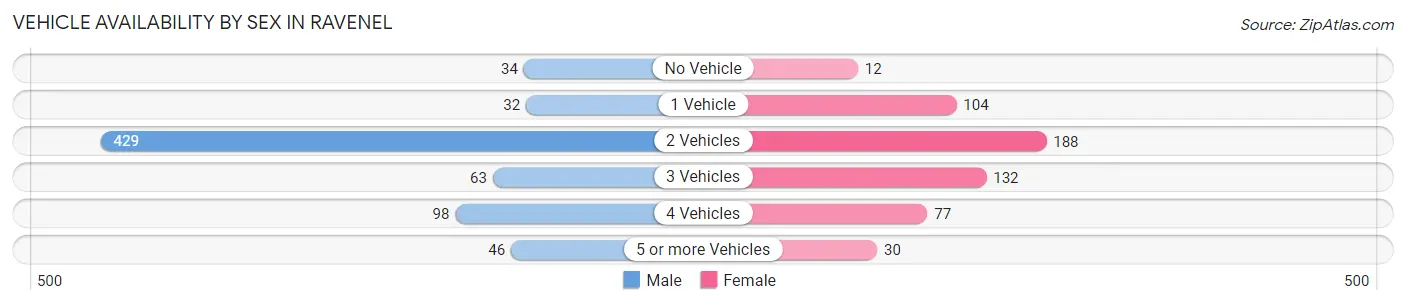
| Vehicles Available | Male | Female |
| No Vehicle | 34 (4.8%) | 12 (2.2%) |
| 1 Vehicle | 32 (4.6%) | 104 (19.2%) |
| 2 Vehicles | 429 (61.1%) | 188 (34.6%) |
| 3 Vehicles | 63 (9.0%) | 132 (24.3%) |
| 4 Vehicles | 98 (14.0%) | 77 (14.2%) |
| 5 or more Vehicles | 46 (6.6%) | 30 (5.5%) |
| Total | 702 (100.0%) | 543 (100.0%) |
Commute Time in Ravenel
The most frequently occuring commute durations in Ravenel are 5 to 9 minutes (247 commuters, 21.5%), 25 to 29 minutes (154 commuters, 13.4%), and 20 to 24 minutes (150 commuters, 13.0%).
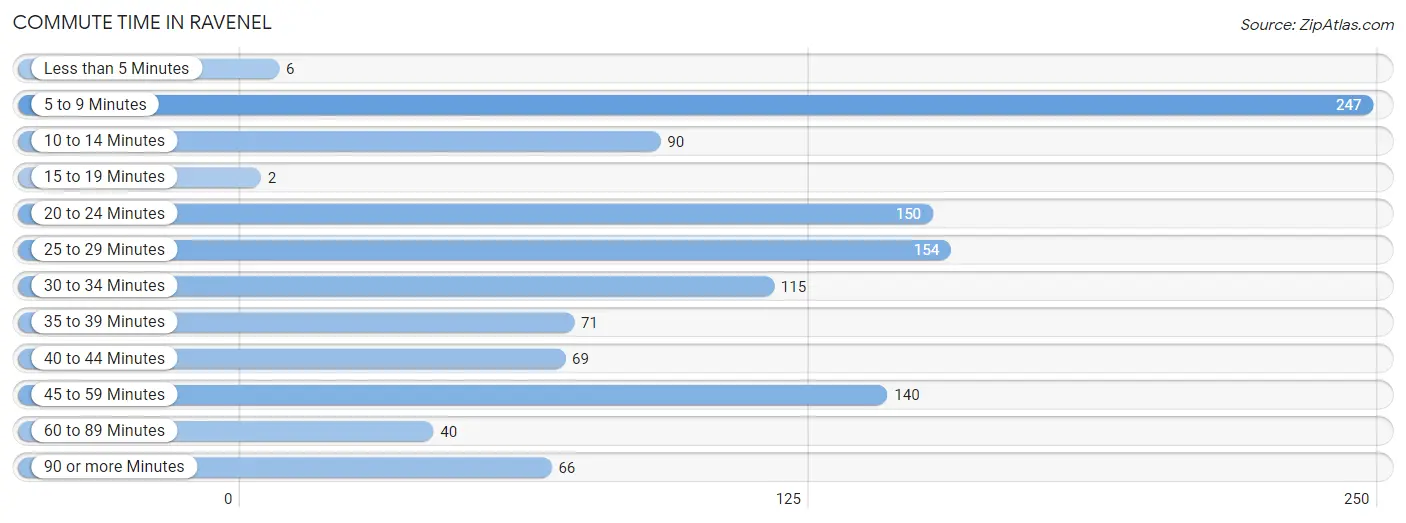
| Commute Time | # Commuters | % Commuters |
| Less than 5 Minutes | 6 | 0.5% |
| 5 to 9 Minutes | 247 | 21.5% |
| 10 to 14 Minutes | 90 | 7.8% |
| 15 to 19 Minutes | 2 | 0.2% |
| 20 to 24 Minutes | 150 | 13.0% |
| 25 to 29 Minutes | 154 | 13.4% |
| 30 to 34 Minutes | 115 | 10.0% |
| 35 to 39 Minutes | 71 | 6.2% |
| 40 to 44 Minutes | 69 | 6.0% |
| 45 to 59 Minutes | 140 | 12.2% |
| 60 to 89 Minutes | 40 | 3.5% |
| 90 or more Minutes | 66 | 5.7% |
Commute Time by Sex in Ravenel
The most common commute times in Ravenel are 5 to 9 minutes (214 commuters, 31.9%) for males and 25 to 29 minutes (103 commuters, 21.5%) for females.
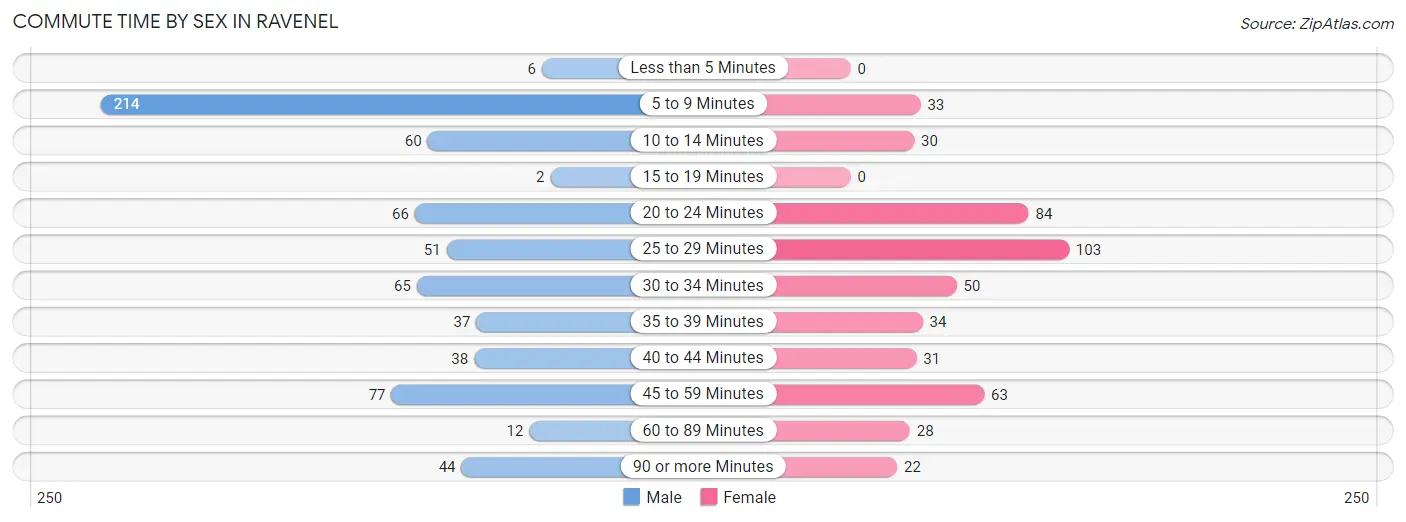
| Commute Time | Male | Female |
| Less than 5 Minutes | 6 (0.9%) | 0 (0.0%) |
| 5 to 9 Minutes | 214 (31.9%) | 33 (6.9%) |
| 10 to 14 Minutes | 60 (8.9%) | 30 (6.3%) |
| 15 to 19 Minutes | 2 (0.3%) | 0 (0.0%) |
| 20 to 24 Minutes | 66 (9.8%) | 84 (17.6%) |
| 25 to 29 Minutes | 51 (7.6%) | 103 (21.5%) |
| 30 to 34 Minutes | 65 (9.7%) | 50 (10.5%) |
| 35 to 39 Minutes | 37 (5.5%) | 34 (7.1%) |
| 40 to 44 Minutes | 38 (5.7%) | 31 (6.5%) |
| 45 to 59 Minutes | 77 (11.5%) | 63 (13.2%) |
| 60 to 89 Minutes | 12 (1.8%) | 28 (5.9%) |
| 90 or more Minutes | 44 (6.6%) | 22 (4.6%) |
Time of Departure to Work by Sex in Ravenel
The most frequent times of departure to work in Ravenel are 7:30 AM to 7:59 AM (202, 30.1%) for males and 6:00 AM to 6:29 AM (130, 27.2%) for females.
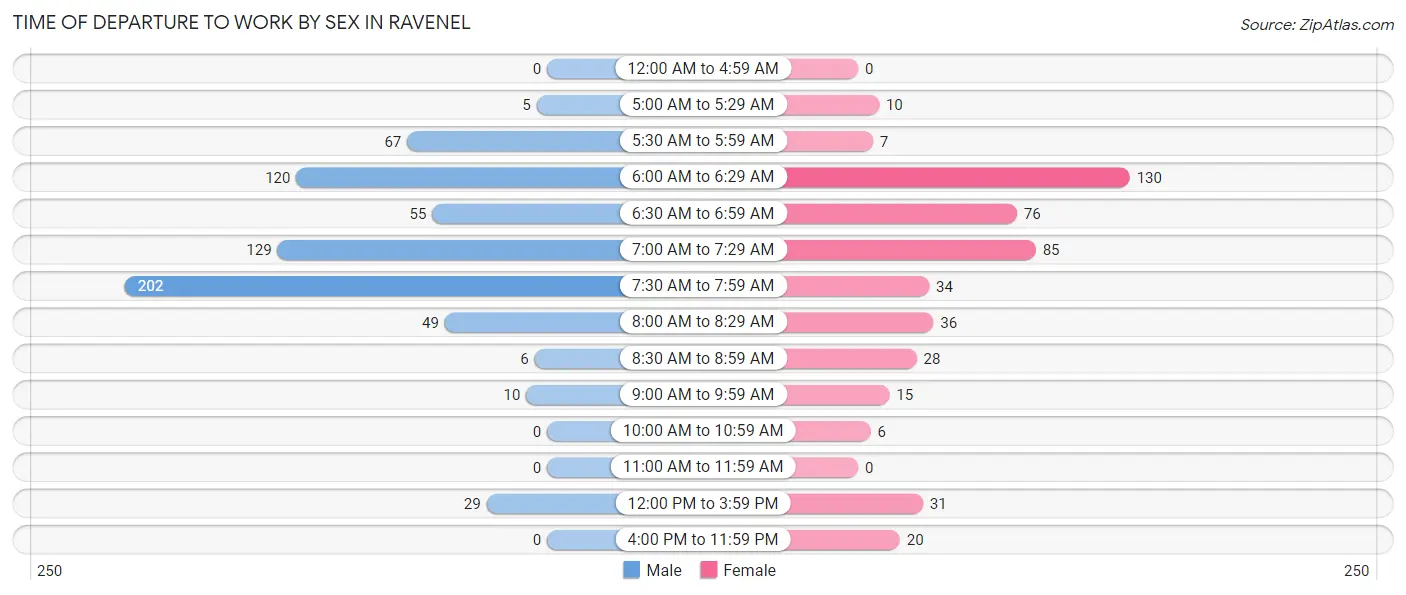
| Time of Departure | Male | Female |
| 12:00 AM to 4:59 AM | 0 (0.0%) | 0 (0.0%) |
| 5:00 AM to 5:29 AM | 5 (0.7%) | 10 (2.1%) |
| 5:30 AM to 5:59 AM | 67 (10.0%) | 7 (1.5%) |
| 6:00 AM to 6:29 AM | 120 (17.9%) | 130 (27.2%) |
| 6:30 AM to 6:59 AM | 55 (8.2%) | 76 (15.9%) |
| 7:00 AM to 7:29 AM | 129 (19.2%) | 85 (17.8%) |
| 7:30 AM to 7:59 AM | 202 (30.1%) | 34 (7.1%) |
| 8:00 AM to 8:29 AM | 49 (7.3%) | 36 (7.5%) |
| 8:30 AM to 8:59 AM | 6 (0.9%) | 28 (5.9%) |
| 9:00 AM to 9:59 AM | 10 (1.5%) | 15 (3.1%) |
| 10:00 AM to 10:59 AM | 0 (0.0%) | 6 (1.3%) |
| 11:00 AM to 11:59 AM | 0 (0.0%) | 0 (0.0%) |
| 12:00 PM to 3:59 PM | 29 (4.3%) | 31 (6.5%) |
| 4:00 PM to 11:59 PM | 0 (0.0%) | 20 (4.2%) |
| Total | 672 (100.0%) | 478 (100.0%) |
Housing Occupancy in Ravenel
Occupancy by Ownership in Ravenel
Of the total 1,009 dwellings in Ravenel, owner-occupied units account for 821 (81.4%), while renter-occupied units make up 188 (18.6%).
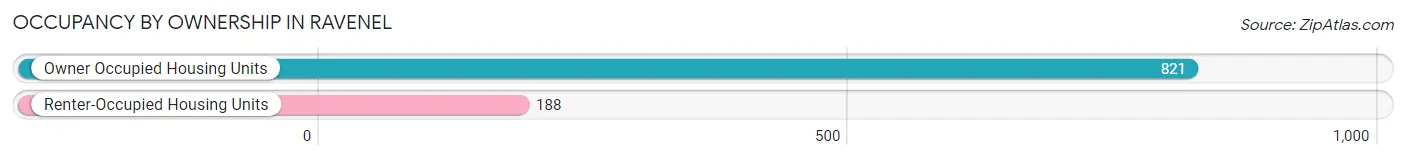
| Occupancy | # Housing Units | % Housing Units |
| Owner Occupied Housing Units | 821 | 81.4% |
| Renter-Occupied Housing Units | 188 | 18.6% |
| Total Occupied Housing Units | 1,009 | 100.0% |
Occupancy by Household Size in Ravenel
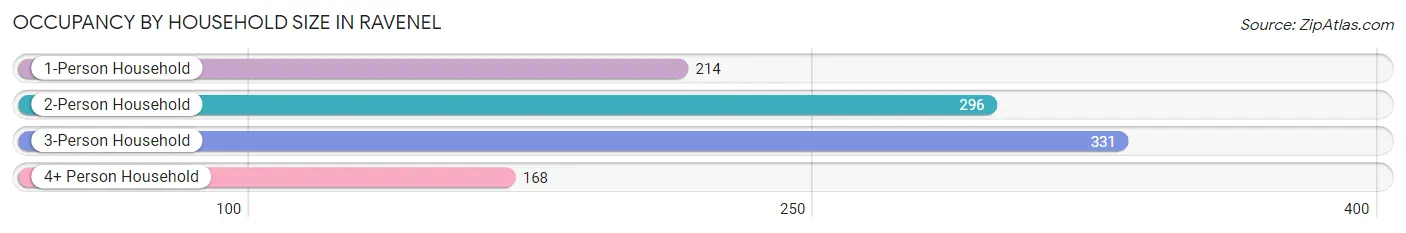
| Household Size | # Housing Units | % Housing Units |
| 1-Person Household | 214 | 21.2% |
| 2-Person Household | 296 | 29.3% |
| 3-Person Household | 331 | 32.8% |
| 4+ Person Household | 168 | 16.7% |
| Total Housing Units | 1,009 | 100.0% |
Occupancy by Ownership by Household Size in Ravenel
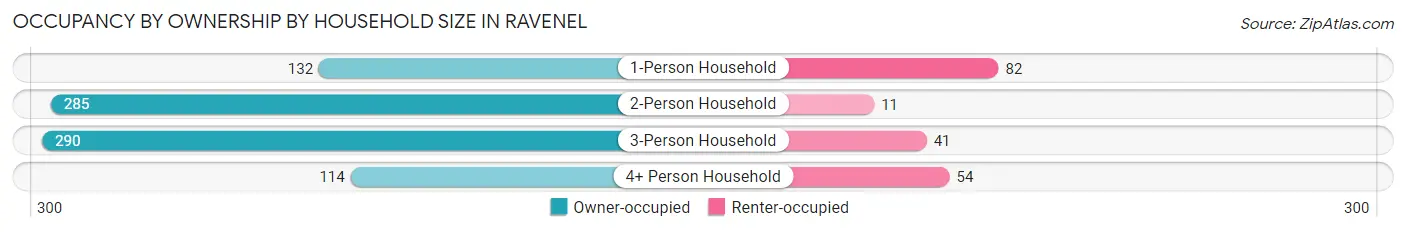
| Household Size | Owner-occupied | Renter-occupied |
| 1-Person Household | 132 (61.7%) | 82 (38.3%) |
| 2-Person Household | 285 (96.3%) | 11 (3.7%) |
| 3-Person Household | 290 (87.6%) | 41 (12.4%) |
| 4+ Person Household | 114 (67.9%) | 54 (32.1%) |
| Total Housing Units | 821 (81.4%) | 188 (18.6%) |
Occupancy by Educational Attainment in Ravenel
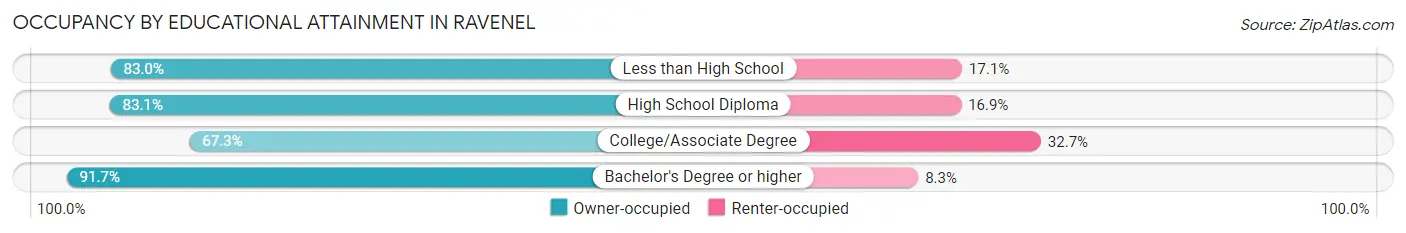
| Household Size | Owner-occupied | Renter-occupied |
| Less than High School | 73 (83.0%) | 15 (17.1%) |
| High School Diploma | 350 (83.1%) | 71 (16.9%) |
| College/Associate Degree | 167 (67.3%) | 81 (32.7%) |
| Bachelor's Degree or higher | 231 (91.7%) | 21 (8.3%) |
Occupancy by Age of Householder in Ravenel
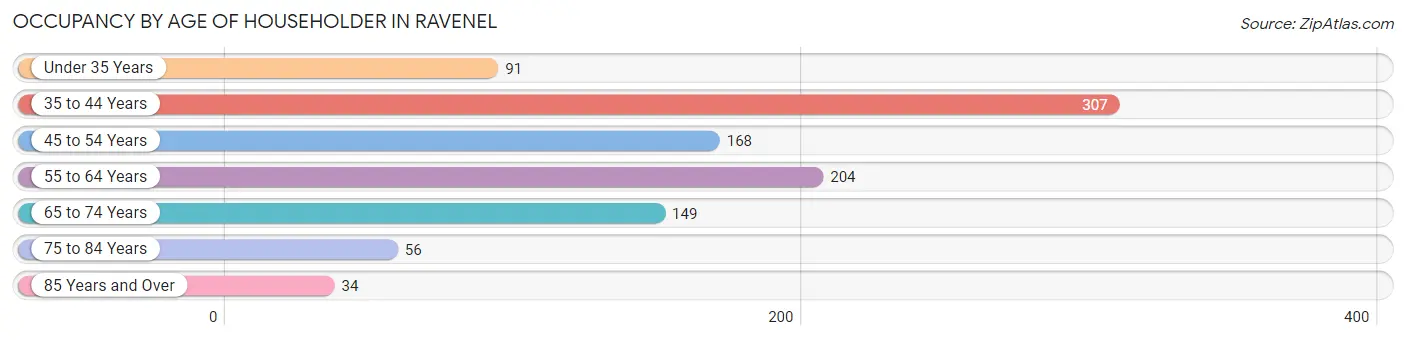
| Age Bracket | # Households | % Households |
| Under 35 Years | 91 | 9.0% |
| 35 to 44 Years | 307 | 30.4% |
| 45 to 54 Years | 168 | 16.7% |
| 55 to 64 Years | 204 | 20.2% |
| 65 to 74 Years | 149 | 14.8% |
| 75 to 84 Years | 56 | 5.6% |
| 85 Years and Over | 34 | 3.4% |
| Total | 1,009 | 100.0% |
Housing Finances in Ravenel
Median Income by Occupancy in Ravenel
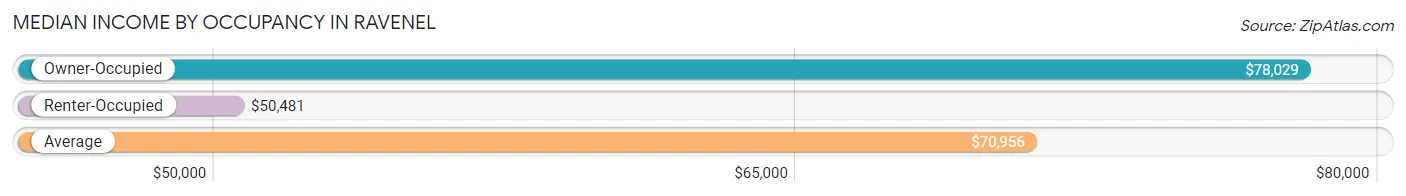
| Occupancy Type | # Households | Median Income |
| Owner-Occupied | 821 (81.4%) | $78,029 |
| Renter-Occupied | 188 (18.6%) | $50,481 |
| Average | 1,009 (100.0%) | $70,956 |
Occupancy by Householder Income Bracket in Ravenel
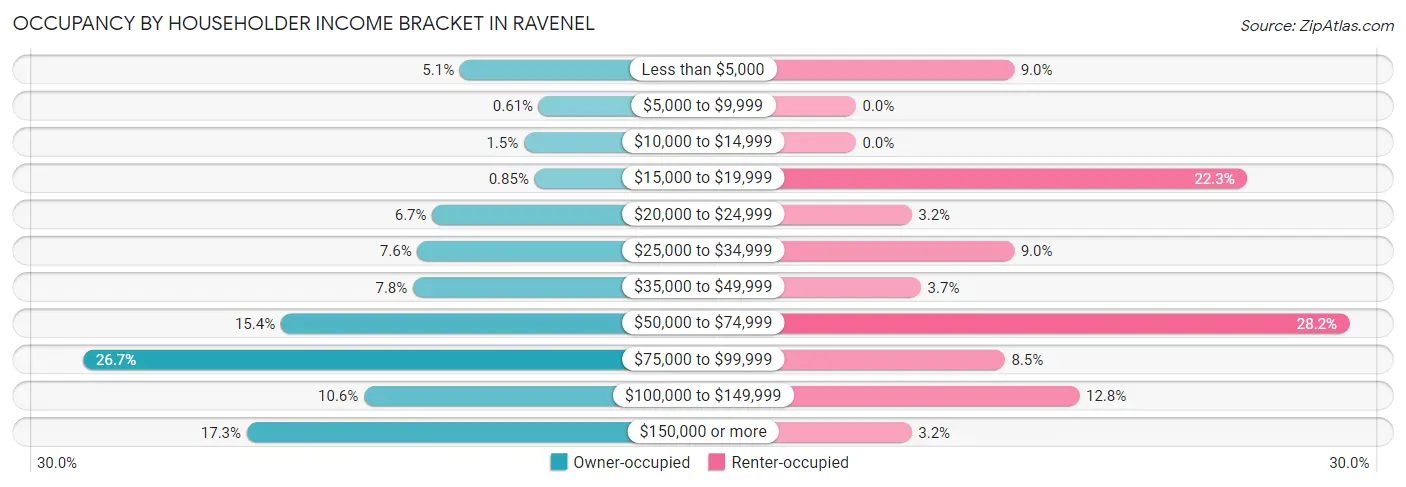
| Income Bracket | Owner-occupied | Renter-occupied |
| Less than $5,000 | 42 (5.1%) | 17 (9.0%) |
| $5,000 to $9,999 | 5 (0.6%) | 0 (0.0%) |
| $10,000 to $14,999 | 12 (1.5%) | 0 (0.0%) |
| $15,000 to $19,999 | 7 (0.9%) | 42 (22.3%) |
| $20,000 to $24,999 | 55 (6.7%) | 6 (3.2%) |
| $25,000 to $34,999 | 62 (7.5%) | 17 (9.0%) |
| $35,000 to $49,999 | 64 (7.8%) | 7 (3.7%) |
| $50,000 to $74,999 | 126 (15.3%) | 53 (28.2%) |
| $75,000 to $99,999 | 219 (26.7%) | 16 (8.5%) |
| $100,000 to $149,999 | 87 (10.6%) | 24 (12.8%) |
| $150,000 or more | 142 (17.3%) | 6 (3.2%) |
| Total | 821 (100.0%) | 188 (100.0%) |
Monthly Housing Cost Tiers in Ravenel
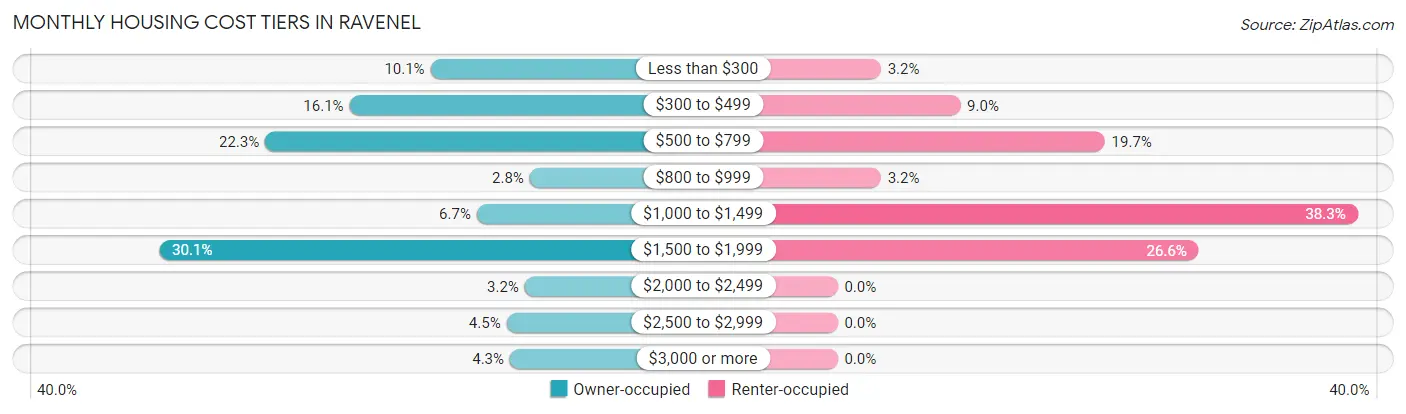
| Monthly Cost | Owner-occupied | Renter-occupied |
| Less than $300 | 83 (10.1%) | 6 (3.2%) |
| $300 to $499 | 132 (16.1%) | 17 (9.0%) |
| $500 to $799 | 183 (22.3%) | 37 (19.7%) |
| $800 to $999 | 23 (2.8%) | 6 (3.2%) |
| $1,000 to $1,499 | 55 (6.7%) | 72 (38.3%) |
| $1,500 to $1,999 | 247 (30.1%) | 50 (26.6%) |
| $2,000 to $2,499 | 26 (3.2%) | 0 (0.0%) |
| $2,500 to $2,999 | 37 (4.5%) | 0 (0.0%) |
| $3,000 or more | 35 (4.3%) | 0 (0.0%) |
| Total | 821 (100.0%) | 188 (100.0%) |
Physical Housing Characteristics in Ravenel
Housing Structures in Ravenel
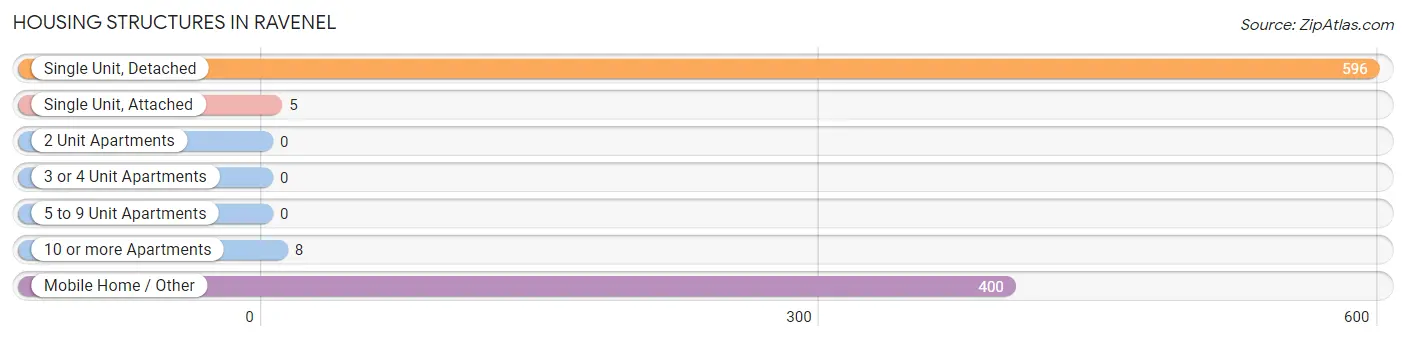
| Structure Type | # Housing Units | % Housing Units |
| Single Unit, Detached | 596 | 59.1% |
| Single Unit, Attached | 5 | 0.5% |
| 2 Unit Apartments | 0 | 0.0% |
| 3 or 4 Unit Apartments | 0 | 0.0% |
| 5 to 9 Unit Apartments | 0 | 0.0% |
| 10 or more Apartments | 8 | 0.8% |
| Mobile Home / Other | 400 | 39.6% |
| Total | 1,009 | 100.0% |
Housing Structures by Occupancy in Ravenel
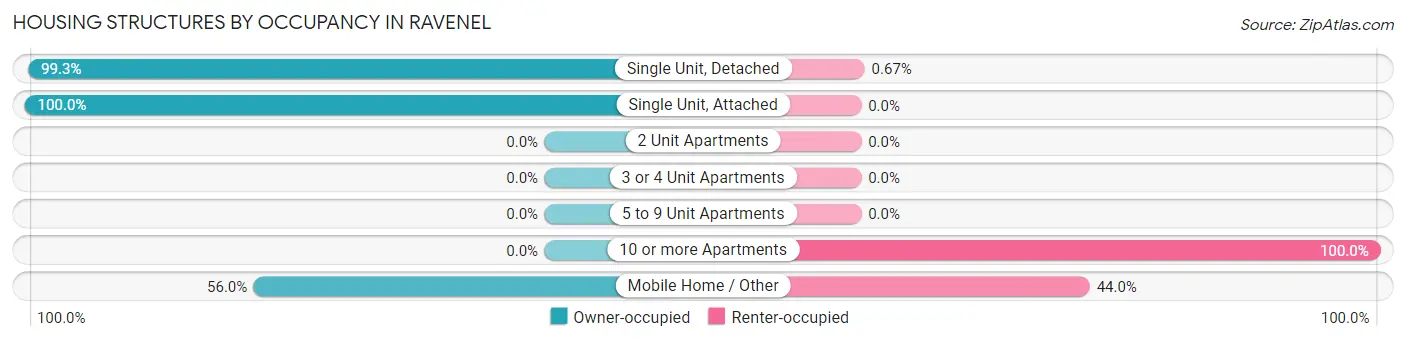
| Structure Type | Owner-occupied | Renter-occupied |
| Single Unit, Detached | 592 (99.3%) | 4 (0.7%) |
| Single Unit, Attached | 5 (100.0%) | 0 (0.0%) |
| 2 Unit Apartments | 0 (0.0%) | 0 (0.0%) |
| 3 or 4 Unit Apartments | 0 (0.0%) | 0 (0.0%) |
| 5 to 9 Unit Apartments | 0 (0.0%) | 0 (0.0%) |
| 10 or more Apartments | 0 (0.0%) | 8 (100.0%) |
| Mobile Home / Other | 224 (56.0%) | 176 (44.0%) |
| Total | 821 (81.4%) | 188 (18.6%) |
Housing Structures by Number of Rooms in Ravenel
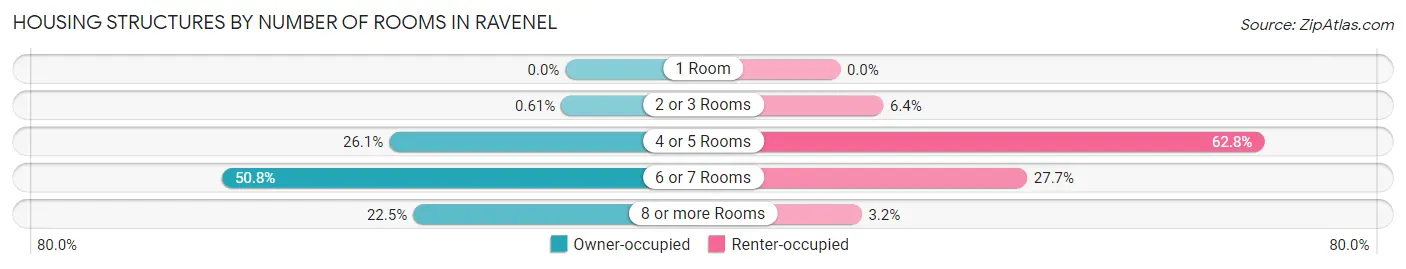
| Number of Rooms | Owner-occupied | Renter-occupied |
| 1 Room | 0 (0.0%) | 0 (0.0%) |
| 2 or 3 Rooms | 5 (0.6%) | 12 (6.4%) |
| 4 or 5 Rooms | 214 (26.1%) | 118 (62.8%) |
| 6 or 7 Rooms | 417 (50.8%) | 52 (27.7%) |
| 8 or more Rooms | 185 (22.5%) | 6 (3.2%) |
| Total | 821 (100.0%) | 188 (100.0%) |
Housing Structure by Heating Type in Ravenel
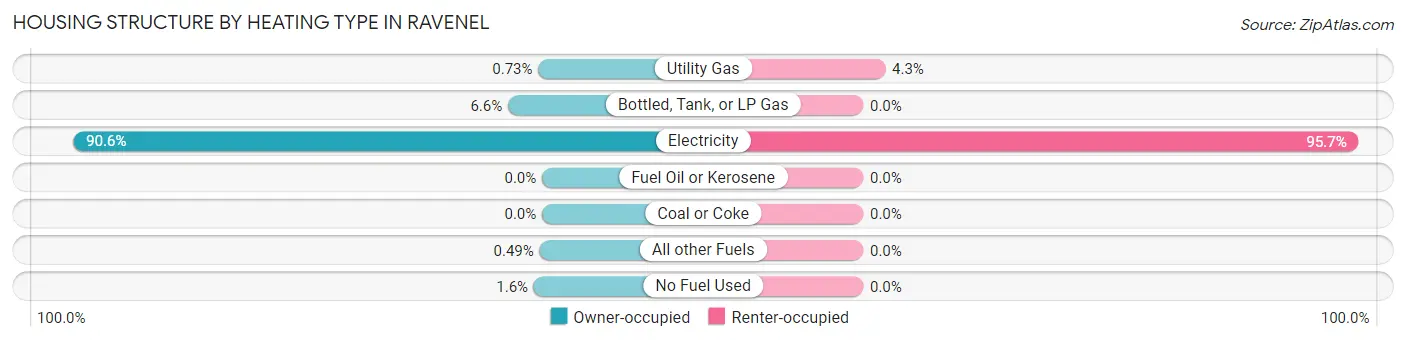
| Heating Type | Owner-occupied | Renter-occupied |
| Utility Gas | 6 (0.7%) | 8 (4.3%) |
| Bottled, Tank, or LP Gas | 54 (6.6%) | 0 (0.0%) |
| Electricity | 744 (90.6%) | 180 (95.7%) |
| Fuel Oil or Kerosene | 0 (0.0%) | 0 (0.0%) |
| Coal or Coke | 0 (0.0%) | 0 (0.0%) |
| All other Fuels | 4 (0.5%) | 0 (0.0%) |
| No Fuel Used | 13 (1.6%) | 0 (0.0%) |
| Total | 821 (100.0%) | 188 (100.0%) |
Household Vehicle Usage in Ravenel
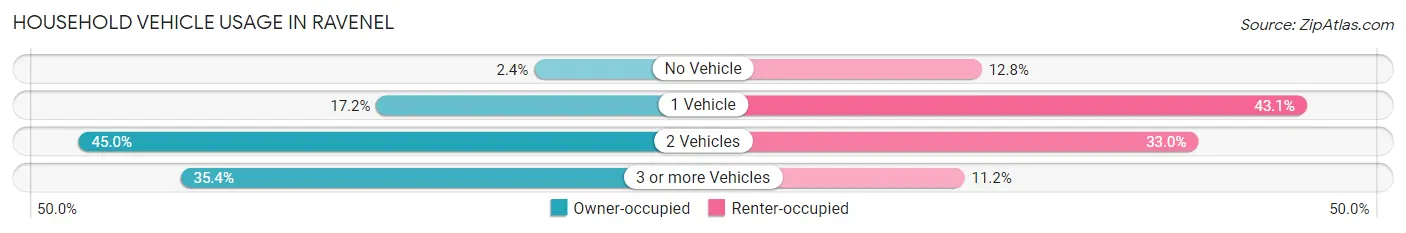
| Vehicles per Household | Owner-occupied | Renter-occupied |
| No Vehicle | 20 (2.4%) | 24 (12.8%) |
| 1 Vehicle | 141 (17.2%) | 81 (43.1%) |
| 2 Vehicles | 369 (45.0%) | 62 (33.0%) |
| 3 or more Vehicles | 291 (35.4%) | 21 (11.2%) |
| Total | 821 (100.0%) | 188 (100.0%) |
Real Estate & Mortgages in Ravenel
Real Estate and Mortgage Overview in Ravenel
| Characteristic | Without Mortgage | With Mortgage |
| Housing Units | 381 | 440 |
| Median Property Value | $200,500 | $232,200 |
| Median Household Income | $46,098 | $91 |
| Monthly Housing Costs | $444 | $35 |
| Real Estate Taxes | $936 | $1 |
Property Value by Mortgage Status in Ravenel
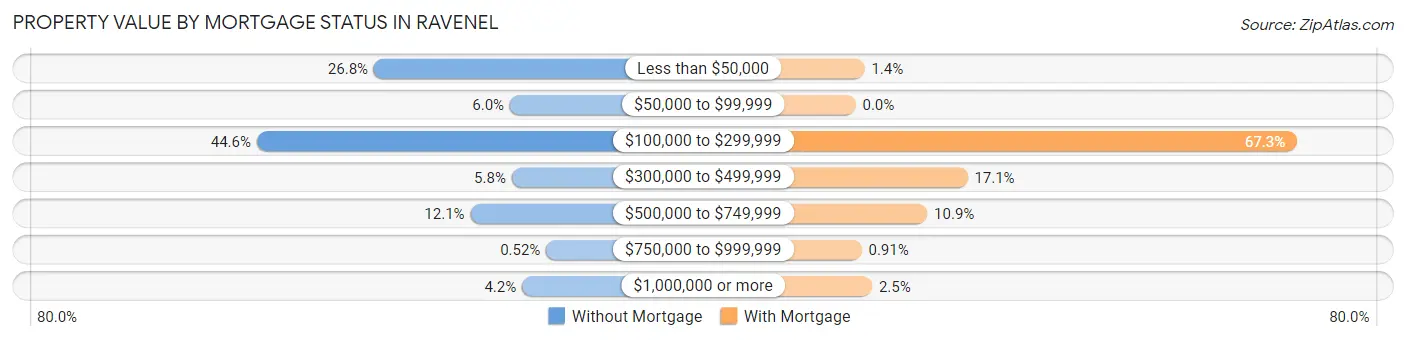
| Property Value | Without Mortgage | With Mortgage |
| Less than $50,000 | 102 (26.8%) | 6 (1.4%) |
| $50,000 to $99,999 | 23 (6.0%) | 0 (0.0%) |
| $100,000 to $299,999 | 170 (44.6%) | 296 (67.3%) |
| $300,000 to $499,999 | 22 (5.8%) | 75 (17.1%) |
| $500,000 to $749,999 | 46 (12.1%) | 48 (10.9%) |
| $750,000 to $999,999 | 2 (0.5%) | 4 (0.9%) |
| $1,000,000 or more | 16 (4.2%) | 11 (2.5%) |
| Total | 381 (100.0%) | 440 (100.0%) |
Household Income by Mortgage Status in Ravenel
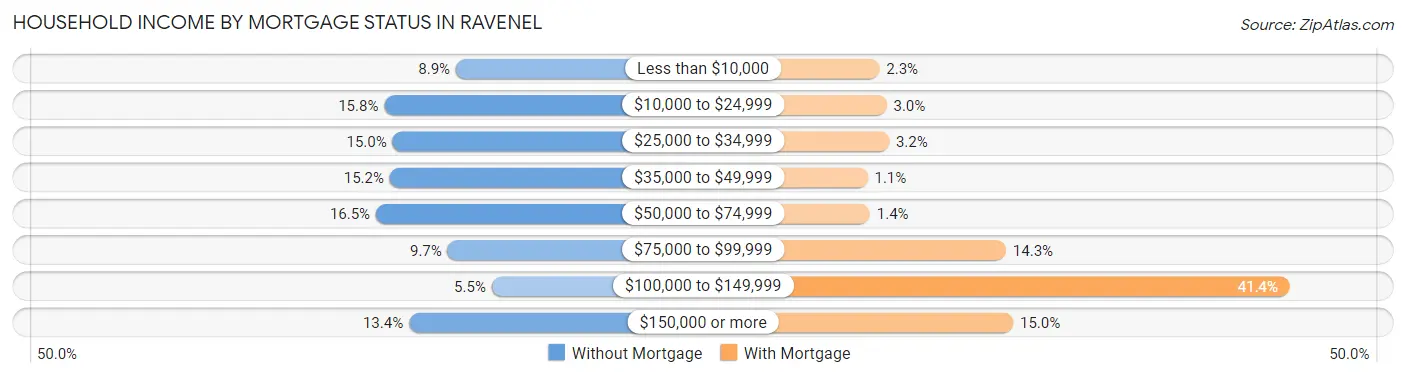
| Household Income | Without Mortgage | With Mortgage |
| Less than $10,000 | 34 (8.9%) | 10 (2.3%) |
| $10,000 to $24,999 | 60 (15.8%) | 13 (2.9%) |
| $25,000 to $34,999 | 57 (15.0%) | 14 (3.2%) |
| $35,000 to $49,999 | 58 (15.2%) | 5 (1.1%) |
| $50,000 to $74,999 | 63 (16.5%) | 6 (1.4%) |
| $75,000 to $99,999 | 37 (9.7%) | 63 (14.3%) |
| $100,000 to $149,999 | 21 (5.5%) | 182 (41.4%) |
| $150,000 or more | 51 (13.4%) | 66 (15.0%) |
| Total | 381 (100.0%) | 440 (100.0%) |
Property Value to Household Income Ratio in Ravenel
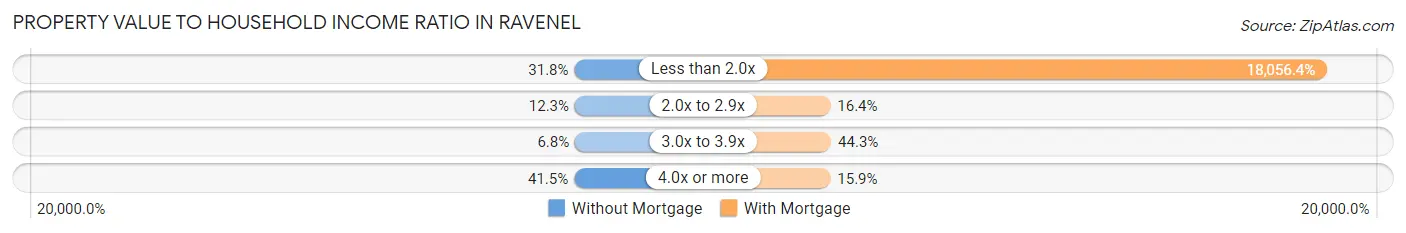
| Value-to-Income Ratio | Without Mortgage | With Mortgage |
| Less than 2.0x | 121 (31.8%) | 79,448 (18,056.4%) |
| 2.0x to 2.9x | 47 (12.3%) | 72 (16.4%) |
| 3.0x to 3.9x | 26 (6.8%) | 195 (44.3%) |
| 4.0x or more | 158 (41.5%) | 70 (15.9%) |
| Total | 381 (100.0%) | 440 (100.0%) |
Real Estate Taxes by Mortgage Status in Ravenel
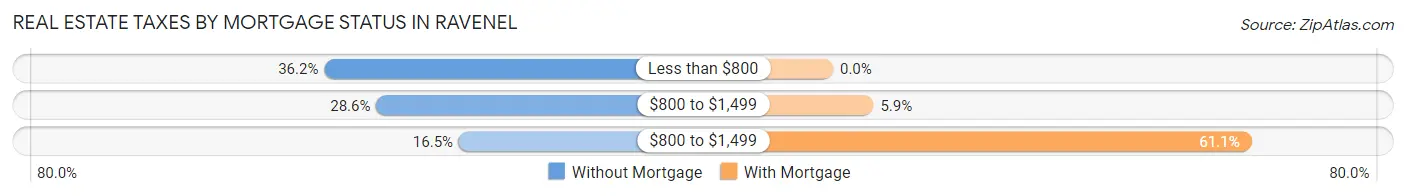
| Property Taxes | Without Mortgage | With Mortgage |
| Less than $800 | 138 (36.2%) | 0 (0.0%) |
| $800 to $1,499 | 109 (28.6%) | 26 (5.9%) |
| $800 to $1,499 | 63 (16.5%) | 269 (61.1%) |
| Total | 381 (100.0%) | 440 (100.0%) |
Health & Disability in Ravenel
Health Insurance Coverage by Age in Ravenel
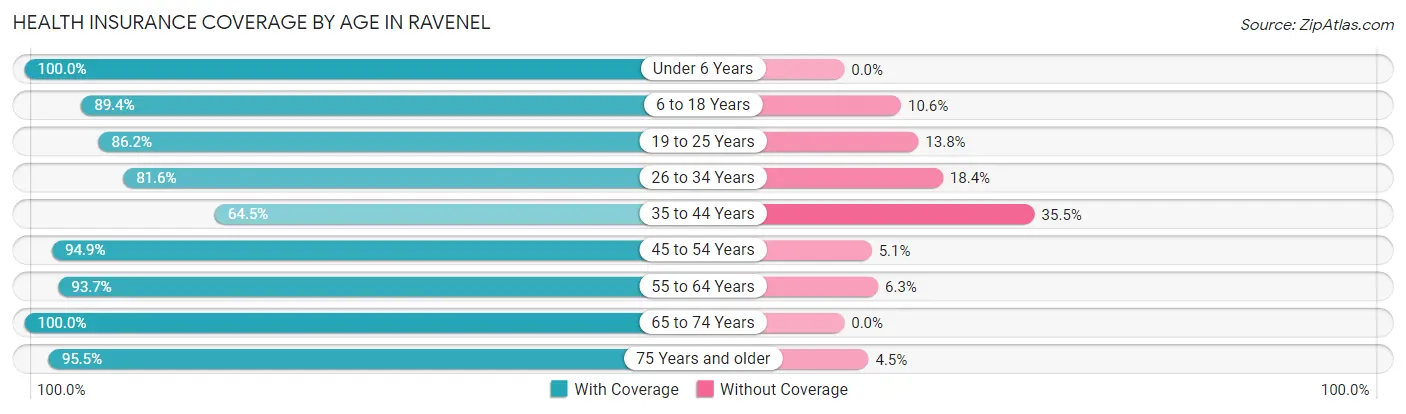
| Age Bracket | With Coverage | Without Coverage |
| Under 6 Years | 285 (100.0%) | 0 (0.0%) |
| 6 to 18 Years | 262 (89.4%) | 31 (10.6%) |
| 19 to 25 Years | 106 (86.2%) | 17 (13.8%) |
| 26 to 34 Years | 253 (81.6%) | 57 (18.4%) |
| 35 to 44 Years | 298 (64.5%) | 164 (35.5%) |
| 45 to 54 Years | 278 (94.9%) | 15 (5.1%) |
| 55 to 64 Years | 312 (93.7%) | 21 (6.3%) |
| 65 to 74 Years | 318 (100.0%) | 0 (0.0%) |
| 75 Years and older | 148 (95.5%) | 7 (4.5%) |
| Total | 2,260 (87.9%) | 312 (12.1%) |
Health Insurance Coverage by Citizenship Status in Ravenel
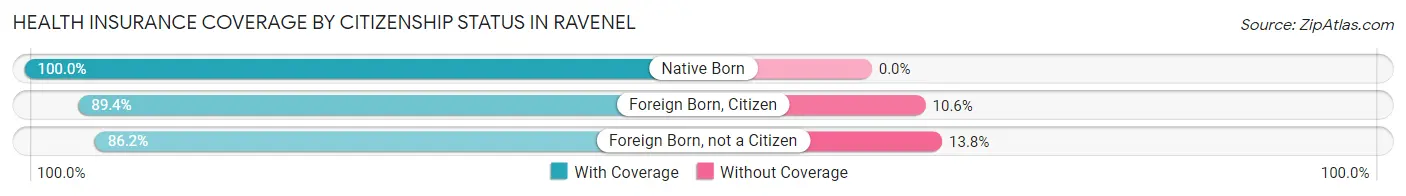
| Citizenship Status | With Coverage | Without Coverage |
| Native Born | 285 (100.0%) | 0 (0.0%) |
| Foreign Born, Citizen | 262 (89.4%) | 31 (10.6%) |
| Foreign Born, not a Citizen | 106 (86.2%) | 17 (13.8%) |
Health Insurance Coverage by Household Income in Ravenel
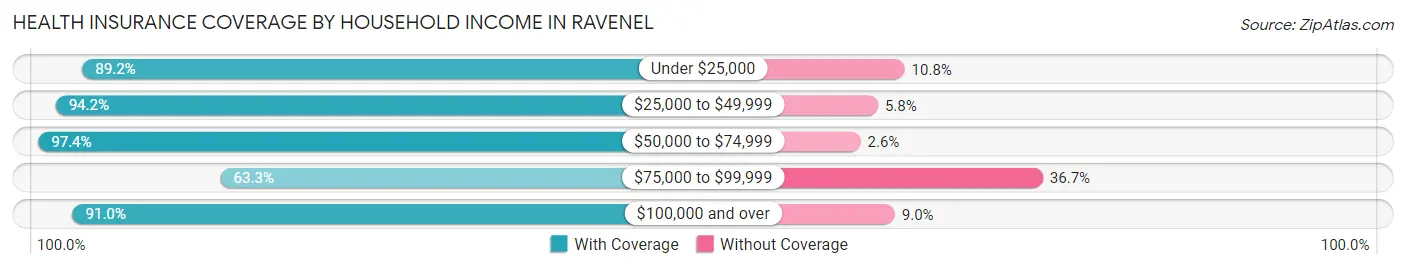
| Household Income | With Coverage | Without Coverage |
| Under $25,000 | 403 (89.2%) | 49 (10.8%) |
| $25,000 to $49,999 | 290 (94.2%) | 18 (5.8%) |
| $50,000 to $74,999 | 567 (97.4%) | 15 (2.6%) |
| $75,000 to $99,999 | 272 (63.3%) | 158 (36.7%) |
| $100,000 and over | 728 (91.0%) | 72 (9.0%) |
Public vs Private Health Insurance Coverage by Age in Ravenel
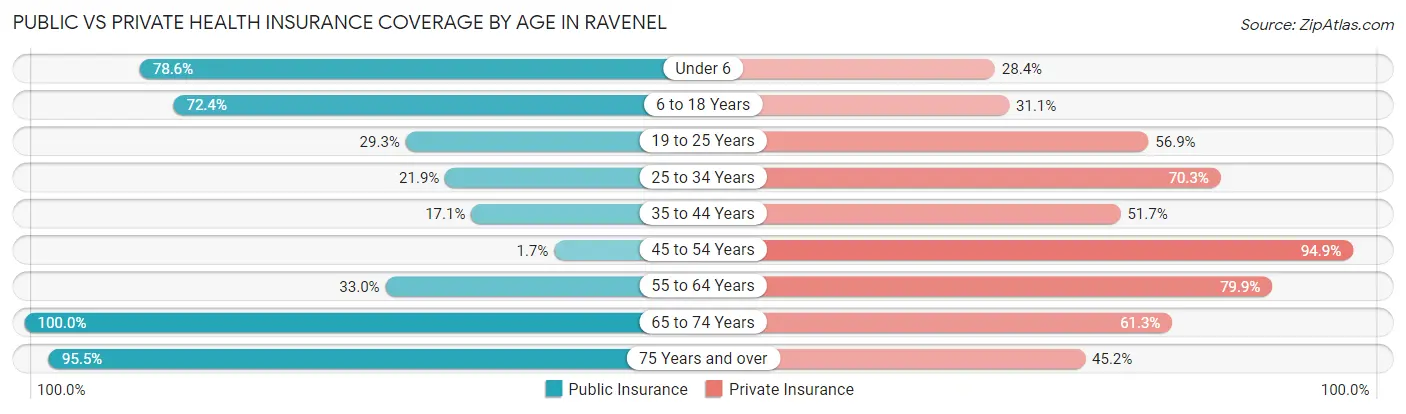
| Age Bracket | Public Insurance | Private Insurance |
| Under 6 | 224 (78.6%) | 81 (28.4%) |
| 6 to 18 Years | 212 (72.4%) | 91 (31.1%) |
| 19 to 25 Years | 36 (29.3%) | 70 (56.9%) |
| 25 to 34 Years | 68 (21.9%) | 218 (70.3%) |
| 35 to 44 Years | 79 (17.1%) | 239 (51.7%) |
| 45 to 54 Years | 5 (1.7%) | 278 (94.9%) |
| 55 to 64 Years | 110 (33.0%) | 266 (79.9%) |
| 65 to 74 Years | 318 (100.0%) | 195 (61.3%) |
| 75 Years and over | 148 (95.5%) | 70 (45.2%) |
| Total | 1,200 (46.7%) | 1,508 (58.6%) |
Disability Status by Sex by Age in Ravenel
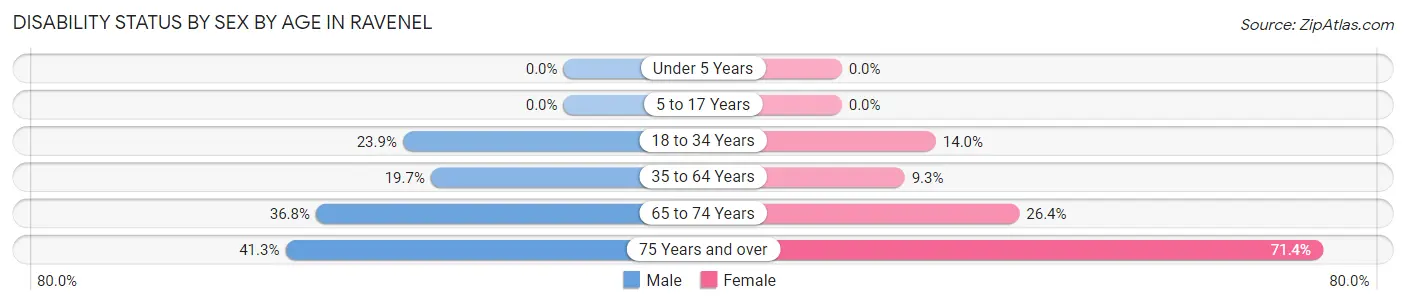
| Age Bracket | Male | Female |
| Under 5 Years | 0 (0.0%) | 0 (0.0%) |
| 5 to 17 Years | 0 (0.0%) | 0 (0.0%) |
| 18 to 34 Years | 83 (23.8%) | 19 (14.0%) |
| 35 to 64 Years | 113 (19.7%) | 48 (9.3%) |
| 65 to 74 Years | 50 (36.8%) | 48 (26.4%) |
| 75 Years and over | 38 (41.3%) | 45 (71.4%) |
Disability Class by Sex by Age in Ravenel
Disability Class: Hearing Difficulty
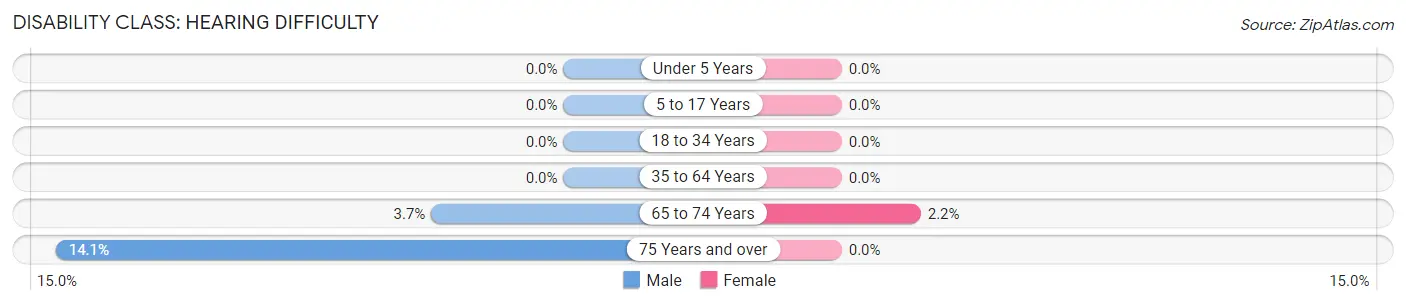
| Age Bracket | Male | Female |
| Under 5 Years | 0 (0.0%) | 0 (0.0%) |
| 5 to 17 Years | 0 (0.0%) | 0 (0.0%) |
| 18 to 34 Years | 0 (0.0%) | 0 (0.0%) |
| 35 to 64 Years | 0 (0.0%) | 0 (0.0%) |
| 65 to 74 Years | 5 (3.7%) | 4 (2.2%) |
| 75 Years and over | 13 (14.1%) | 0 (0.0%) |
Disability Class: Vision Difficulty
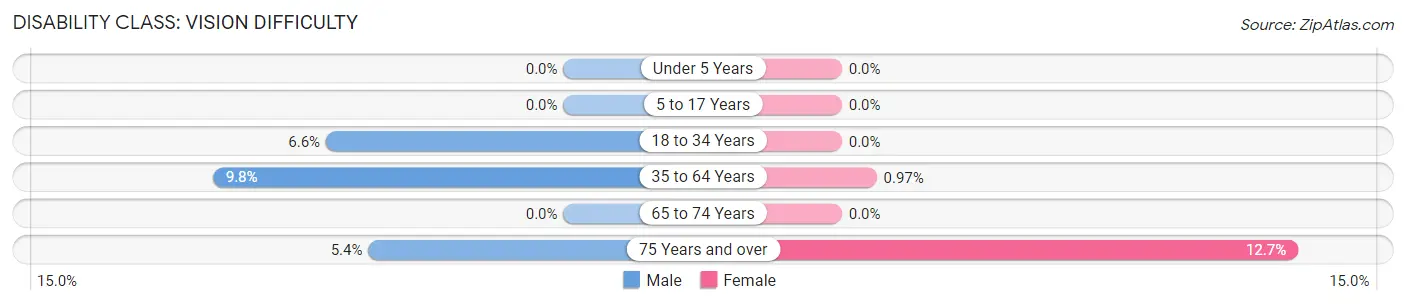
| Age Bracket | Male | Female |
| Under 5 Years | 0 (0.0%) | 0 (0.0%) |
| 5 to 17 Years | 0 (0.0%) | 0 (0.0%) |
| 18 to 34 Years | 23 (6.6%) | 0 (0.0%) |
| 35 to 64 Years | 56 (9.8%) | 5 (1.0%) |
| 65 to 74 Years | 0 (0.0%) | 0 (0.0%) |
| 75 Years and over | 5 (5.4%) | 8 (12.7%) |
Disability Class: Cognitive Difficulty
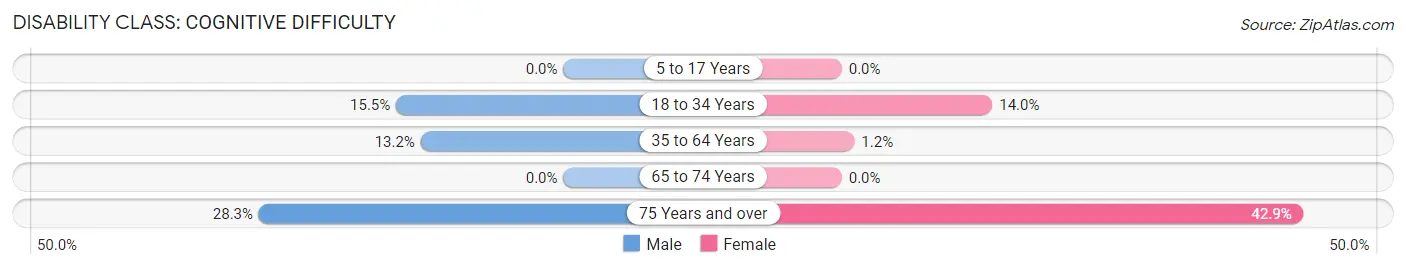
| Age Bracket | Male | Female |
| 5 to 17 Years | 0 (0.0%) | 0 (0.0%) |
| 18 to 34 Years | 54 (15.5%) | 19 (14.0%) |
| 35 to 64 Years | 76 (13.2%) | 6 (1.2%) |
| 65 to 74 Years | 0 (0.0%) | 0 (0.0%) |
| 75 Years and over | 26 (28.3%) | 27 (42.9%) |
Disability Class: Ambulatory Difficulty
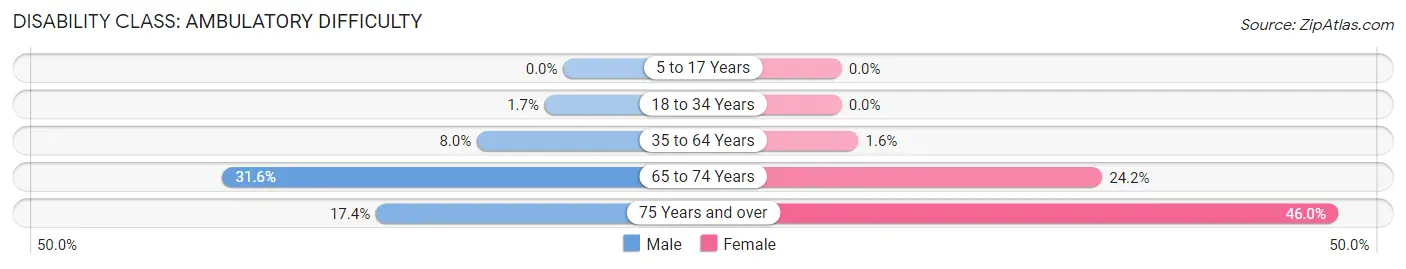
| Age Bracket | Male | Female |
| 5 to 17 Years | 0 (0.0%) | 0 (0.0%) |
| 18 to 34 Years | 6 (1.7%) | 0 (0.0%) |
| 35 to 64 Years | 46 (8.0%) | 8 (1.6%) |
| 65 to 74 Years | 43 (31.6%) | 44 (24.2%) |
| 75 Years and over | 16 (17.4%) | 29 (46.0%) |
Disability Class: Self-Care Difficulty
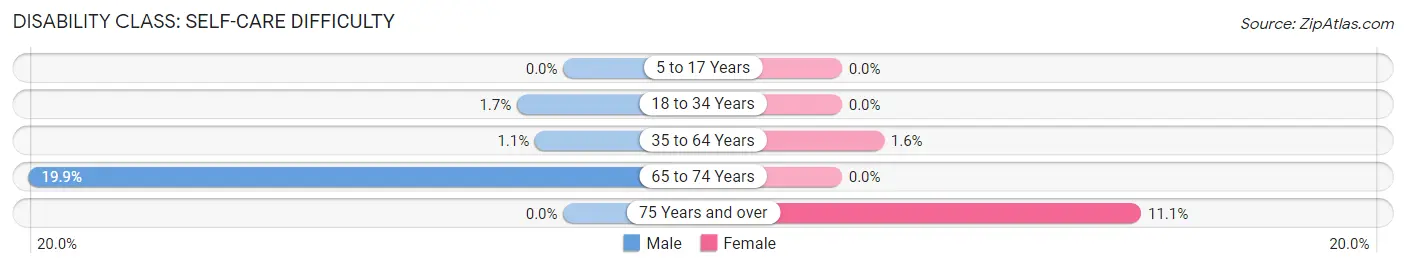
| Age Bracket | Male | Female |
| 5 to 17 Years | 0 (0.0%) | 0 (0.0%) |
| 18 to 34 Years | 6 (1.7%) | 0 (0.0%) |
| 35 to 64 Years | 6 (1.1%) | 8 (1.6%) |
| 65 to 74 Years | 27 (19.9%) | 0 (0.0%) |
| 75 Years and over | 0 (0.0%) | 7 (11.1%) |
Technology Access in Ravenel
Computing Device Access in Ravenel
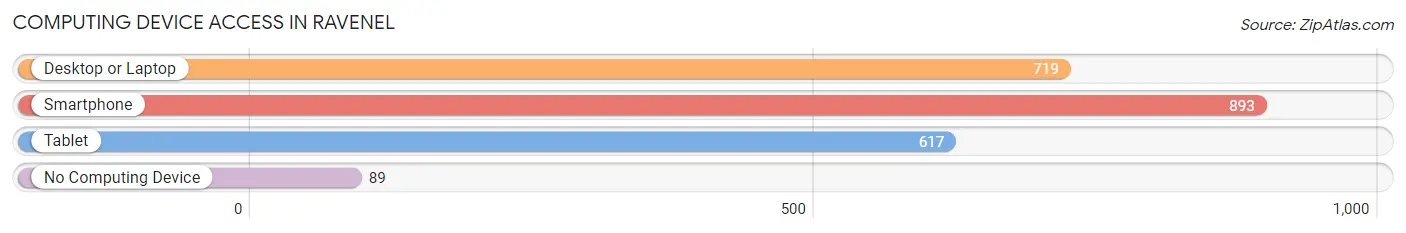
| Device Type | # Households | % Households |
| Desktop or Laptop | 719 | 71.3% |
| Smartphone | 893 | 88.5% |
| Tablet | 617 | 61.2% |
| No Computing Device | 89 | 8.8% |
| Total | 1,009 | 100.0% |
Internet Access in Ravenel
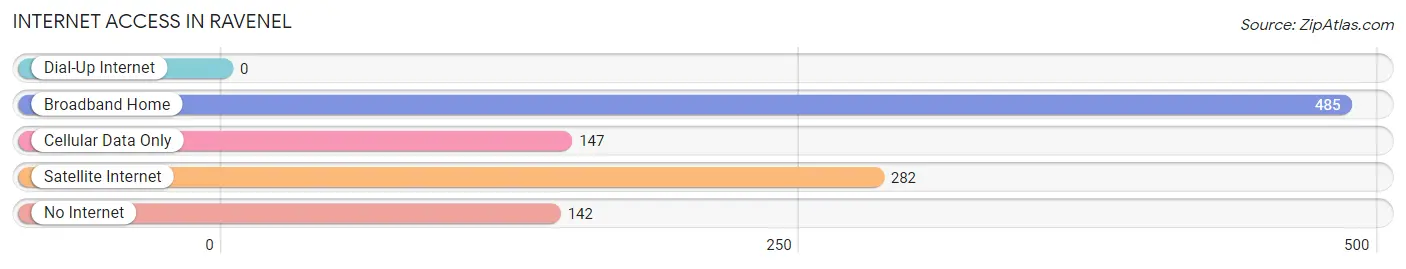
| Internet Type | # Households | % Households |
| Dial-Up Internet | 0 | 0.0% |
| Broadband Home | 485 | 48.1% |
| Cellular Data Only | 147 | 14.6% |
| Satellite Internet | 282 | 28.0% |
| No Internet | 142 | 14.1% |
| Total | 1,009 | 100.0% |
Ravenel Summary
Ravenel is a small town located in Charleston County, South Carolina. It is situated along the banks of the Ashley River, approximately 20 miles northwest of Charleston. The town has a population of 1,845 people, according to the 2010 census.
History
The town of Ravenel was founded in 1871 by William Ravenel, a prominent local planter. The town was named after him and was originally a small farming community. In the late 19th century, the town began to grow and develop as a commercial center for the surrounding area. The town was incorporated in 1891 and the first mayor was elected in 1892.
In the early 20th century, Ravenel experienced a period of growth and prosperity. The town was home to several businesses, including a cotton mill, a sawmill, a grist mill, and a brickyard. The town also had a railroad station, which connected it to other parts of the state.
In the mid-20th century, Ravenel began to decline as the local economy shifted away from agriculture and manufacturing. The town’s population decreased and many of the businesses closed. In the late 20th century, the town began to experience a resurgence as new businesses opened and the population began to grow again.
Geography
Ravenel is located in the Lowcountry region of South Carolina. The town is situated along the banks of the Ashley River, approximately 20 miles northwest of Charleston. The town is surrounded by rural farmland and is located near the Francis Marion National Forest.
The climate in Ravenel is humid subtropical, with hot, humid summers and mild winters. The average annual temperature is around 70 degrees Fahrenheit. The average annual precipitation is around 50 inches.
Economy
The economy of Ravenel is largely based on agriculture and tourism. The town is home to several farms, which produce a variety of crops, including corn, soybeans, and cotton. The town is also home to several tourist attractions, including the Ravenel Bridge, which connects the town to Charleston.
The town is also home to several small businesses, including restaurants, shops, and a local newspaper. The town is served by the Charleston International Airport, which is located approximately 30 miles away.
Demographics
According to the 2010 census, the population of Ravenel was 1,845 people. The racial makeup of the town was 79.3% White, 17.2% African American, 0.7% Native American, 0.7% Asian, 0.2% Pacific Islander, and 1.9% from other races. The median household income was $37,917 and the median family income was $45,938.
Conclusion
Ravenel is a small town located in Charleston County, South Carolina. It is situated along the banks of the Ashley River, approximately 20 miles northwest of Charleston. The town has a population of 1,845 people, according to the 2010 census. The economy of Ravenel is largely based on agriculture and tourism. The town is home to several farms, which produce a variety of crops, and is also home to several tourist attractions. The racial makeup of the town is 79.3% White, 17.2% African American, 0.7% Native American, 0.7% Asian, 0.2% Pacific Islander, and 1.9% from other races. The median household income was $37,917 and the median family income was $45,938.
Common Questions
What is Per Capita Income in Ravenel?
Per Capita income in Ravenel is $34,356.
What is the Median Family Income in Ravenel?
Median Family Income in Ravenel is $78,205.
What is the Median Household income in Ravenel?
Median Household Income in Ravenel is $70,956.
What is Income or Wage Gap in Ravenel?
Income or Wage Gap in Ravenel is 5.5%.
Women in Ravenel earn 94.5 cents for every dollar earned by a man.
What is Inequality or Gini Index in Ravenel?
Inequality or Gini Index in Ravenel is 0.45.
What is the Total Population of Ravenel?
Total Population of Ravenel is 2,572.
What is the Total Male Population of Ravenel?
Total Male Population of Ravenel is 1,353.
What is the Total Female Population of Ravenel?
Total Female Population of Ravenel is 1,219.
What is the Ratio of Males per 100 Females in Ravenel?
There are 110.99 Males per 100 Females in Ravenel.
What is the Ratio of Females per 100 Males in Ravenel?
There are 90.10 Females per 100 Males in Ravenel.
What is the Median Population Age in Ravenel?
Median Population Age in Ravenel is 42.3 Years.
What is the Average Family Size in Ravenel
Average Family Size in Ravenel is 2.9 People.
What is the Average Household Size in Ravenel
Average Household Size in Ravenel is 2.5 People.
How Large is the Labor Force in Ravenel?
There are 1,272 People in the Labor Forcein in Ravenel.
What is the Percentage of People in the Labor Force in Ravenel?
61.0% of People are in the Labor Force in Ravenel.
What is the Unemployment Rate in Ravenel?
Unemployment Rate in Ravenel is 1.7%.