Trout Valley, IL Map & Demographics
Trout Valley Map
Trout Valley Overview
$93,068
PER CAPITA INCOME
$204,000
AVG FAMILY INCOME
$204,688
AVG HOUSEHOLD INCOME
58.8%
WAGE / INCOME GAP [ % ]
41.2¢/ $1
WAGE / INCOME GAP [ $ ]
0.36
INEQUALITY / GINI INDEX
593
TOTAL POPULATION
283
MALE POPULATION
310
FEMALE POPULATION
91.29
MALES / 100 FEMALES
109.54
FEMALES / 100 MALES
55.7
MEDIAN AGE
2.9
AVG FAMILY SIZE
2.5
AVG HOUSEHOLD SIZE
358
LABOR FORCE [ PEOPLE ]
70.1%
PERCENT IN LABOR FORCE
2.0%
UNEMPLOYMENT RATE
Income in Trout Valley
Income Overview in Trout Valley
Per Capita Income in Trout Valley is $93,068, while median incomes of families and households are $204,000 and $204,688 respectively.
| Characteristic | Number | Measure |
| Per Capita Income | 593 | $93,068 |
| Median Family Income | 176 | $204,000 |
| Mean Family Income | 176 | $225,074 |
| Median Household Income | 235 | $204,688 |
| Mean Household Income | 235 | $230,454 |
| Income Deficit | 176 | $0 |
| Wage / Income Gap (%) | 593 | 58.80% |
| Wage / Income Gap ($) | 593 | 41.20¢ per $1 |
| Gini / Inequality Index | 593 | 0.36 |
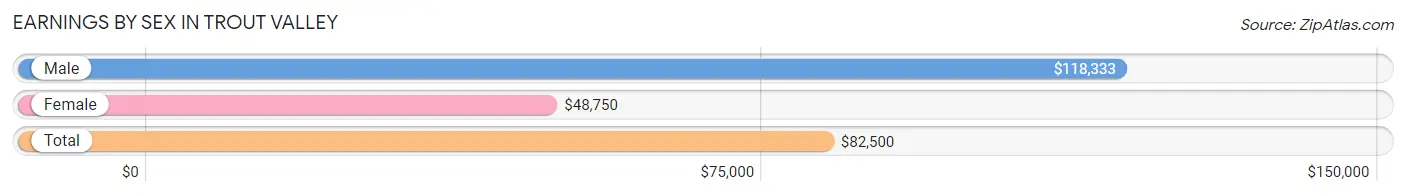
Earnings by Sex in Trout Valley
Average Earnings in Trout Valley are $82,500, $118,333 for men and $48,750 for women, a difference of 58.8%.
| Sex | Number | Average Earnings |
| Male | 198 (54.4%) | $118,333 |
| Female | 166 (45.6%) | $48,750 |
| Total | 364 (100.0%) | $82,500 |
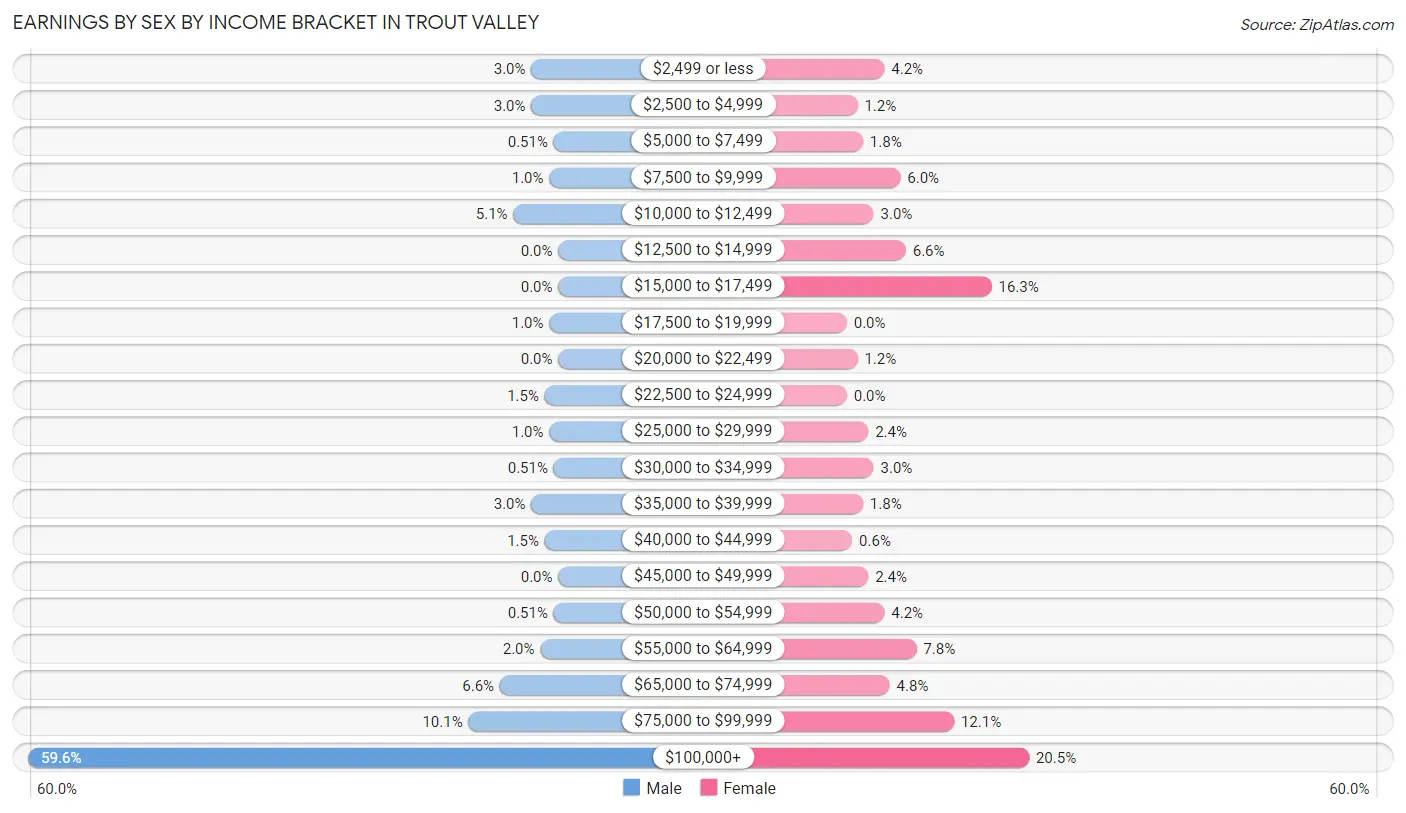
Earnings by Sex by Income Bracket in Trout Valley
The most common earnings brackets in Trout Valley are $100,000+ for men (118 | 59.6%) and $100,000+ for women (34 | 20.5%).
| Income | Male | Female |
| $2,499 or less | 6 (3.0%) | 7 (4.2%) |
| $2,500 to $4,999 | 6 (3.0%) | 2 (1.2%) |
| $5,000 to $7,499 | 1 (0.5%) | 3 (1.8%) |
| $7,500 to $9,999 | 2 (1.0%) | 10 (6.0%) |
| $10,000 to $12,499 | 10 (5.1%) | 5 (3.0%) |
| $12,500 to $14,999 | 0 (0.0%) | 11 (6.6%) |
| $15,000 to $17,499 | 0 (0.0%) | 27 (16.3%) |
| $17,500 to $19,999 | 2 (1.0%) | 0 (0.0%) |
| $20,000 to $22,499 | 0 (0.0%) | 2 (1.2%) |
| $22,500 to $24,999 | 3 (1.5%) | 0 (0.0%) |
| $25,000 to $29,999 | 2 (1.0%) | 4 (2.4%) |
| $30,000 to $34,999 | 1 (0.5%) | 5 (3.0%) |
| $35,000 to $39,999 | 6 (3.0%) | 3 (1.8%) |
| $40,000 to $44,999 | 3 (1.5%) | 1 (0.6%) |
| $45,000 to $49,999 | 0 (0.0%) | 4 (2.4%) |
| $50,000 to $54,999 | 1 (0.5%) | 7 (4.2%) |
| $55,000 to $64,999 | 4 (2.0%) | 13 (7.8%) |
| $65,000 to $74,999 | 13 (6.6%) | 8 (4.8%) |
| $75,000 to $99,999 | 20 (10.1%) | 20 (12.0%) |
| $100,000+ | 118 (59.6%) | 34 (20.5%) |
| Total | 198 (100.0%) | 166 (100.0%) |
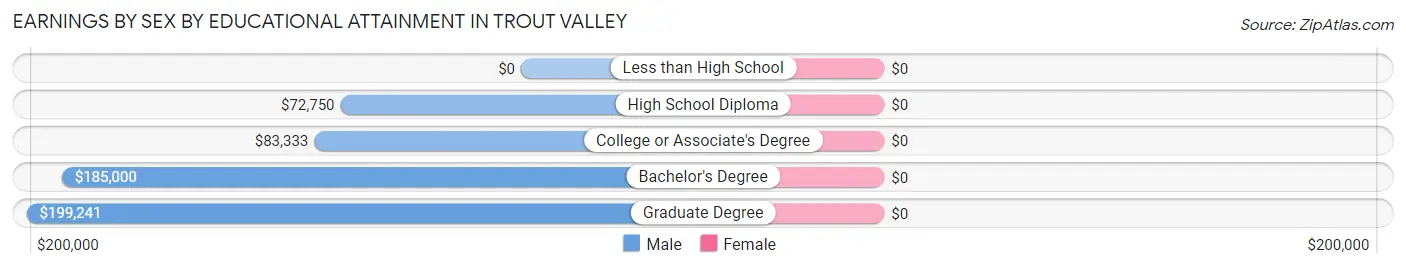
Earnings by Sex by Educational Attainment in Trout Valley
| Educational Attainment | Male Income | Female Income |
| Less than High School | - | - |
| High School Diploma | $72,750 | $0 |
| College or Associate's Degree | $83,333 | $0 |
| Bachelor's Degree | $185,000 | $0 |
| Graduate Degree | $199,241 | $0 |
| Total | $131,250 | $58,594 |
Family Income in Trout Valley
Family Income Brackets in Trout Valley
According to the Trout Valley family income data, there are 94 families falling into the $200,000+ income range, which is the most common income bracket and makes up 53.4% of all families.
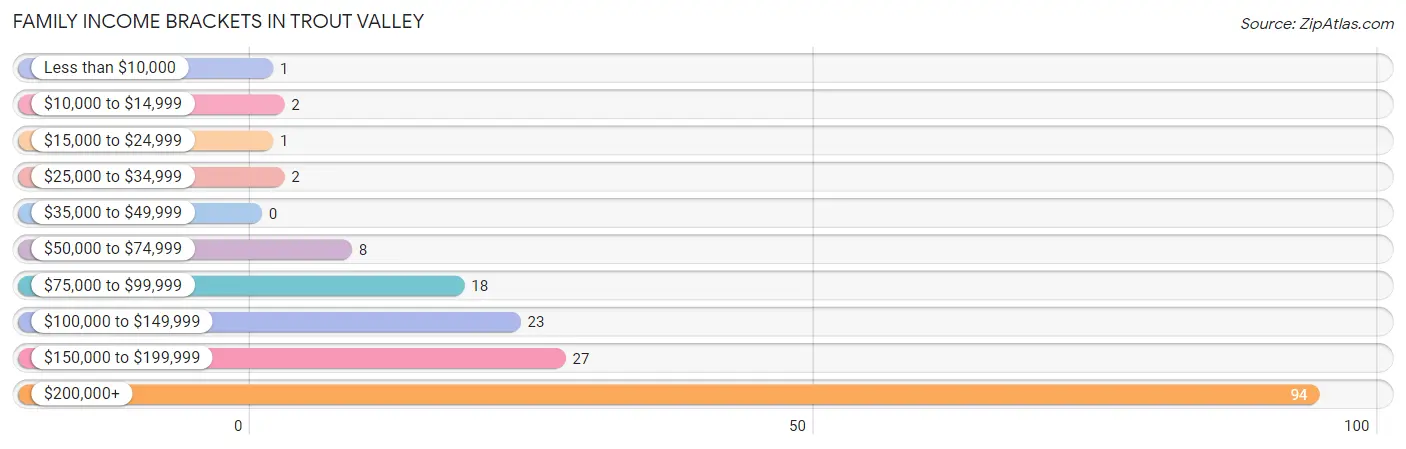
| Income Bracket | # Families | % Families |
| Less than $10,000 | 1 | 0.6% |
| $10,000 to $14,999 | 2 | 1.1% |
| $15,000 to $24,999 | 1 | 0.6% |
| $25,000 to $34,999 | 2 | 1.1% |
| $35,000 to $49,999 | 0 | 0.0% |
| $50,000 to $74,999 | 8 | 4.5% |
| $75,000 to $99,999 | 18 | 10.2% |
| $100,000 to $149,999 | 23 | 13.1% |
| $150,000 to $199,999 | 27 | 15.3% |
| $200,000+ | 94 | 53.4% |
Family Income by Famaliy Size in Trout Valley
3-person families (24 | 13.6%) account for the highest median family income in Trout Valley with $250,001 per family, while 2-person families (106 | 60.2%) have the highest median income of $103,125 per family member.
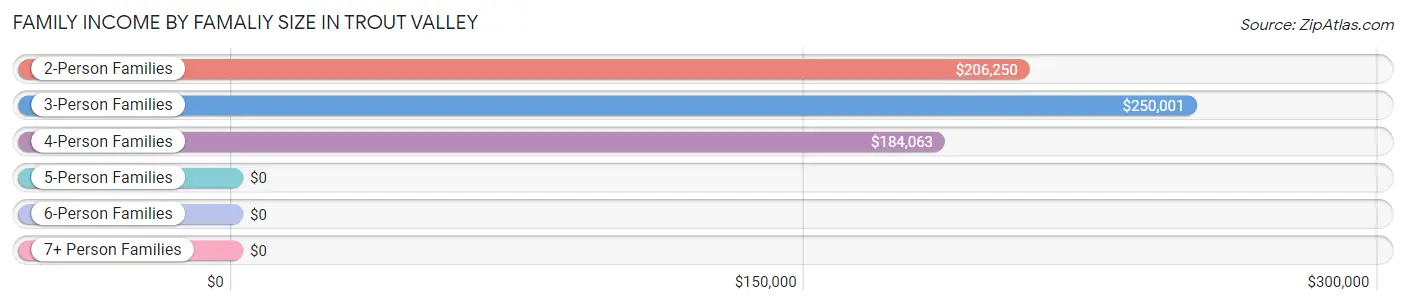
| Income Bracket | # Families | Median Income |
| 2-Person Families | 106 (60.2%) | $206,250 |
| 3-Person Families | 24 (13.6%) | $250,001 |
| 4-Person Families | 33 (18.8%) | $184,063 |
| 5-Person Families | 10 (5.7%) | $0 |
| 6-Person Families | 3 (1.7%) | $0 |
| 7+ Person Families | 0 (0.0%) | $0 |
| Total | 176 (100.0%) | $204,000 |
Family Income by Number of Earners in Trout Valley
The median family income in Trout Valley is $204,000, with families comprising 3+ earners (18) having the highest median family income of $226,250, while families with no earners (18) have the lowest median family income of $96,250, accounting for 10.2% and 10.2% of families, respectively.
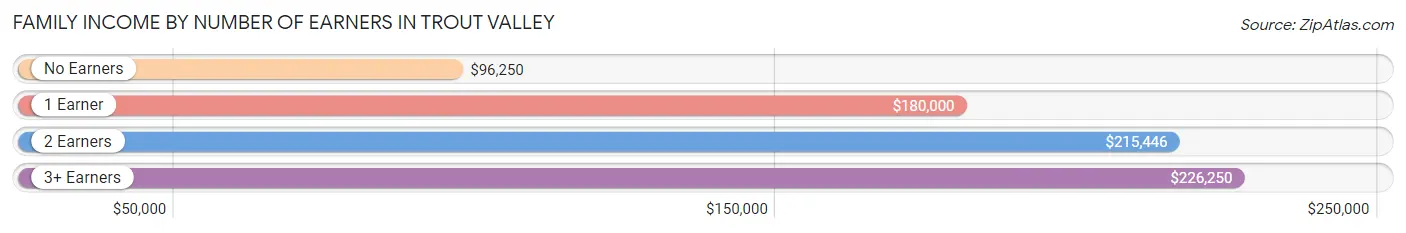
| Number of Earners | # Families | Median Income |
| No Earners | 18 (10.2%) | $96,250 |
| 1 Earner | 46 (26.1%) | $180,000 |
| 2 Earners | 94 (53.4%) | $215,446 |
| 3+ Earners | 18 (10.2%) | $226,250 |
| Total | 176 (100.0%) | $204,000 |
Household Income in Trout Valley
Household Income Brackets in Trout Valley
With 124 households falling in the category, the $200,000+ income range is the most frequent in Trout Valley, accounting for 52.8% of all households. In contrast, only 1 households (0.4%) fall into the less than $10,000 income bracket, making it the least populous group.
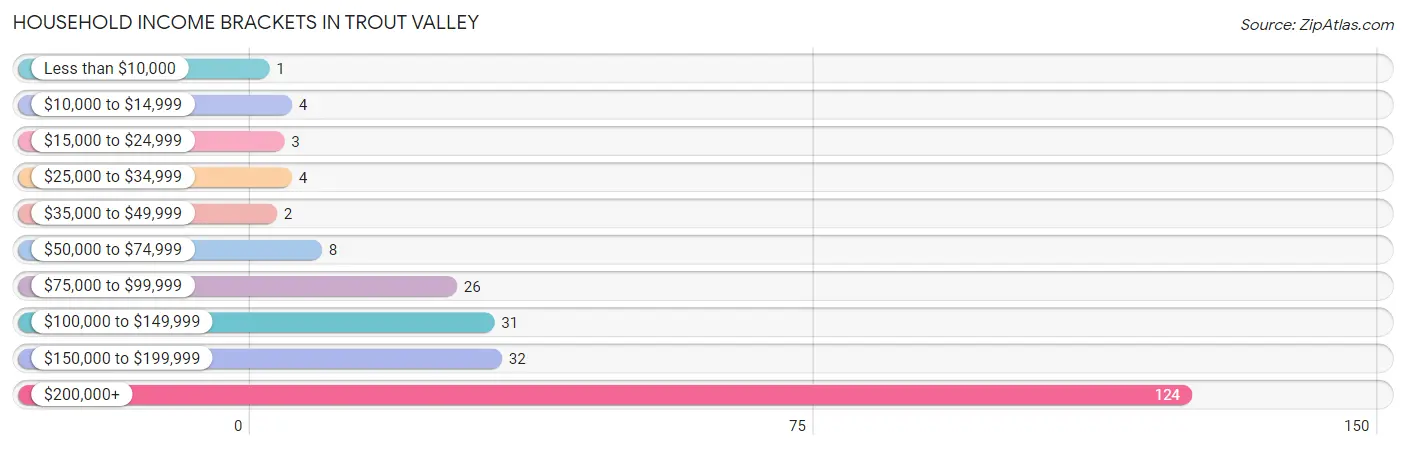
| Income Bracket | # Households | % Households |
| Less than $10,000 | 1 | 0.4% |
| $10,000 to $14,999 | 4 | 1.7% |
| $15,000 to $24,999 | 3 | 1.3% |
| $25,000 to $34,999 | 4 | 1.7% |
| $35,000 to $49,999 | 2 | 0.9% |
| $50,000 to $74,999 | 8 | 3.4% |
| $75,000 to $99,999 | 26 | 11.1% |
| $100,000 to $149,999 | 31 | 13.2% |
| $150,000 to $199,999 | 32 | 13.6% |
| $200,000+ | 124 | 52.8% |
Household Income by Householder Age in Trout Valley
The median household income in Trout Valley is $204,688, with the highest median household income of $216,759 found in the 45 to 64 years age bracket for the primary householder. A total of 118 households (50.2%) fall into this category.
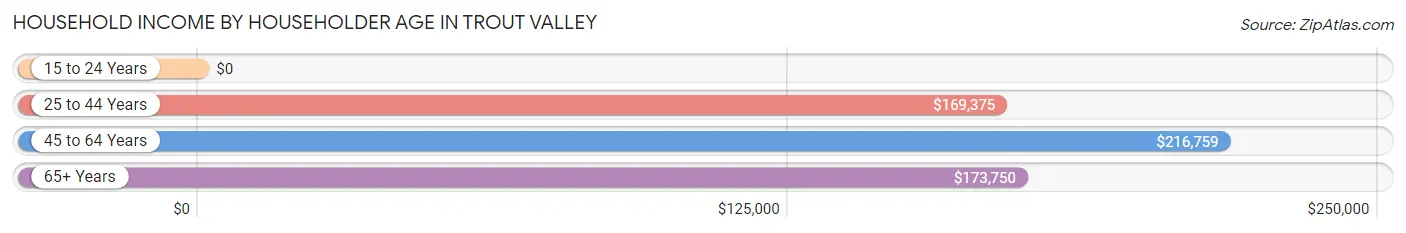
| Income Bracket | # Households | Median Income |
| 15 to 24 Years | 0 (0.0%) | $0 |
| 25 to 44 Years | 37 (15.7%) | $169,375 |
| 45 to 64 Years | 118 (50.2%) | $216,759 |
| 65+ Years | 80 (34.0%) | $173,750 |
| Total | 235 (100.0%) | $204,688 |
Poverty in Trout Valley
Income Below Poverty by Sex and Age in Trout Valley
With 4.6% poverty level for males and 2.6% for females among the residents of Trout Valley, under 5 year old males and 25 to 34 year old females are the most vulnerable to poverty, with 2 males (12.5%) and 2 females (11.1%) in their respective age groups living below the poverty level.
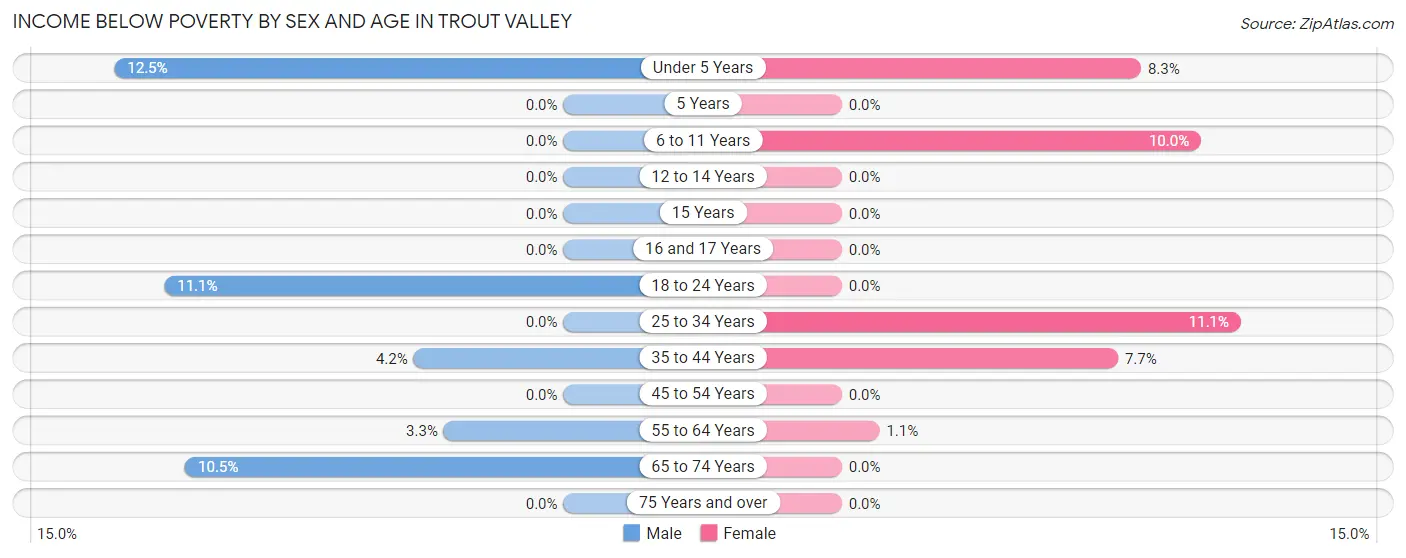
| Age Bracket | Male | Female |
| Under 5 Years | 2 (12.5%) | 2 (8.3%) |
| 5 Years | 0 (0.0%) | 0 (0.0%) |
| 6 to 11 Years | 0 (0.0%) | 1 (10.0%) |
| 12 to 14 Years | 0 (0.0%) | 0 (0.0%) |
| 15 Years | 0 (0.0%) | 0 (0.0%) |
| 16 and 17 Years | 0 (0.0%) | 0 (0.0%) |
| 18 to 24 Years | 1 (11.1%) | 0 (0.0%) |
| 25 to 34 Years | 0 (0.0%) | 2 (11.1%) |
| 35 to 44 Years | 1 (4.2%) | 2 (7.7%) |
| 45 to 54 Years | 0 (0.0%) | 0 (0.0%) |
| 55 to 64 Years | 3 (3.3%) | 1 (1.1%) |
| 65 to 74 Years | 6 (10.5%) | 0 (0.0%) |
| 75 Years and over | 0 (0.0%) | 0 (0.0%) |
| Total | 13 (4.6%) | 8 (2.6%) |
Income Above Poverty by Sex and Age in Trout Valley
According to the poverty statistics in Trout Valley, males aged 5 years and females aged 12 to 14 years are the age groups that are most secure financially, with 100.0% of males and 100.0% of females in these age groups living above the poverty line.
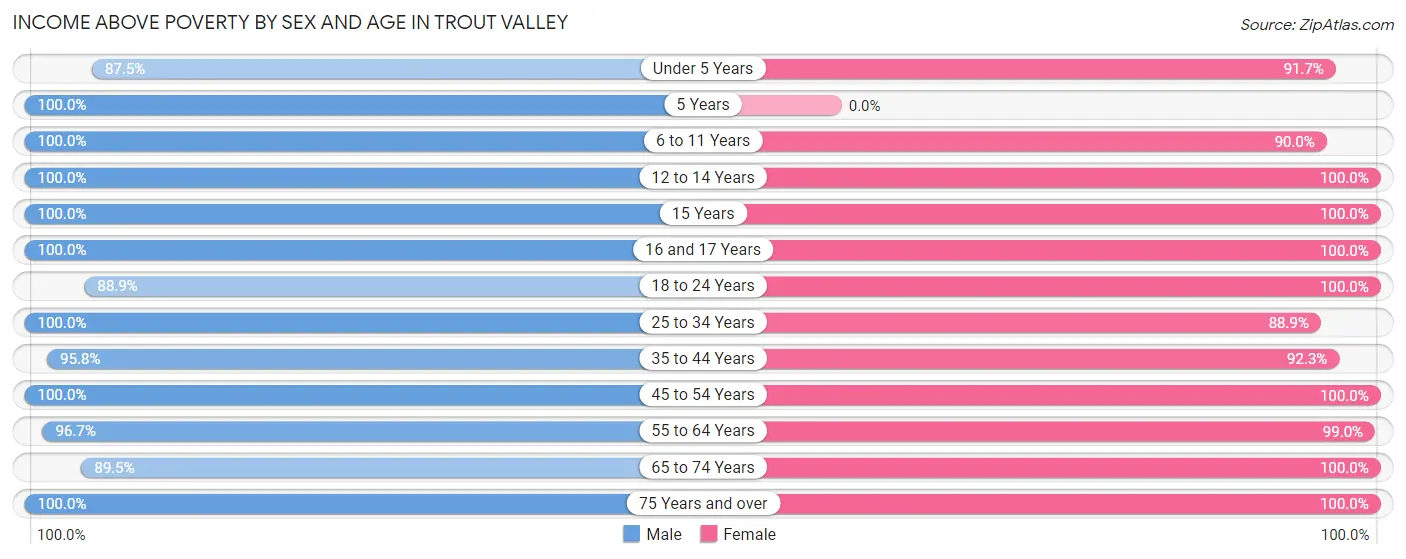
| Age Bracket | Male | Female |
| Under 5 Years | 14 (87.5%) | 22 (91.7%) |
| 5 Years | 4 (100.0%) | 0 (0.0%) |
| 6 to 11 Years | 5 (100.0%) | 9 (90.0%) |
| 12 to 14 Years | 6 (100.0%) | 10 (100.0%) |
| 15 Years | 1 (100.0%) | 6 (100.0%) |
| 16 and 17 Years | 12 (100.0%) | 19 (100.0%) |
| 18 to 24 Years | 8 (88.9%) | 25 (100.0%) |
| 25 to 34 Years | 17 (100.0%) | 16 (88.9%) |
| 35 to 44 Years | 23 (95.8%) | 24 (92.3%) |
| 45 to 54 Years | 28 (100.0%) | 26 (100.0%) |
| 55 to 64 Years | 87 (96.7%) | 94 (99.0%) |
| 65 to 74 Years | 51 (89.5%) | 32 (100.0%) |
| 75 Years and over | 14 (100.0%) | 19 (100.0%) |
| Total | 270 (95.4%) | 302 (97.4%) |
Income Below Poverty Among Married-Couple Families in Trout Valley
The poverty statistics for married-couple families in Trout Valley show that 1.8% or 3 of the total 165 families live below the poverty line. Families with 3 or 4 children have the highest poverty rate of 9.1%, comprising of 1 families. On the other hand, families with 1 or 2 children have the lowest poverty rate of 0.0%, which includes 0 families.
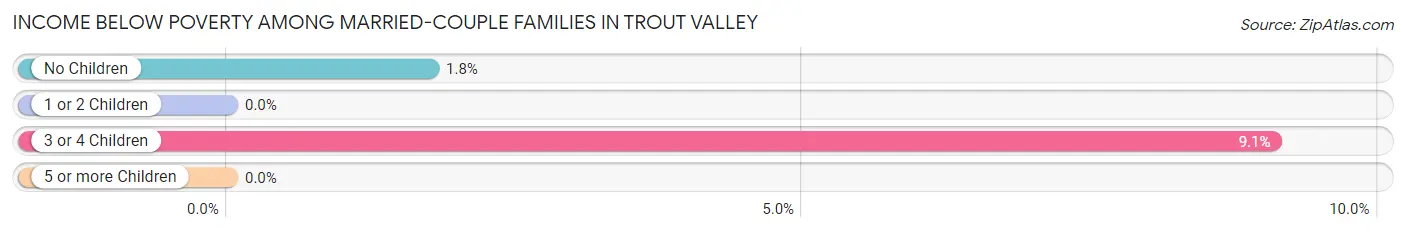
| Children | Above Poverty | Below Poverty |
| No Children | 112 (98.3%) | 2 (1.8%) |
| 1 or 2 Children | 40 (100.0%) | 0 (0.0%) |
| 3 or 4 Children | 10 (90.9%) | 1 (9.1%) |
| 5 or more Children | 0 (0.0%) | 0 (0.0%) |
| Total | 162 (98.2%) | 3 (1.8%) |
Income Below Poverty Among Single-Parent Households in Trout Valley
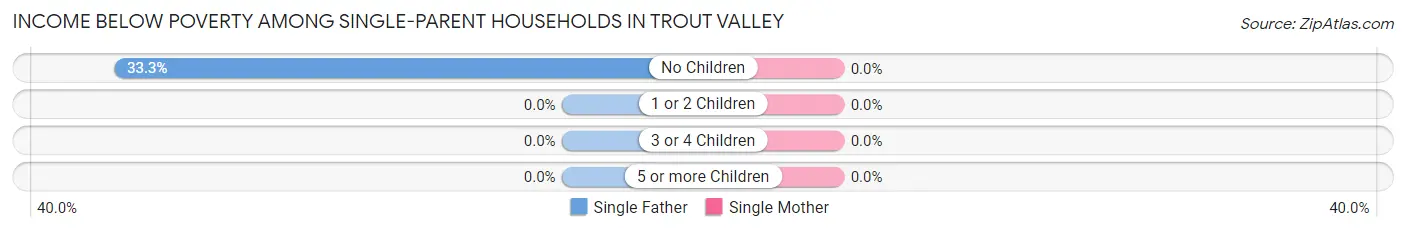
| Children | Single Father | Single Mother |
| No Children | 1 (33.3%) | 0 (0.0%) |
| 1 or 2 Children | 0 (0.0%) | 0 (0.0%) |
| 3 or 4 Children | 0 (0.0%) | 0 (0.0%) |
| 5 or more Children | 0 (0.0%) | 0 (0.0%) |
| Total | 1 (33.3%) | 0 (0.0%) |
Income Below Poverty Among Married-Couple vs Single-Parent Households in Trout Valley
The poverty data for Trout Valley shows that 3 of the married-couple family households (1.8%) and 1 of the single-parent households (9.1%) are living below the poverty level. Within the married-couple family households, those with 3 or 4 children have the highest poverty rate, with 1 households (9.1%) falling below the poverty line. Among the single-parent households, those with no children have the highest poverty rate, with 1 household (11.1%) living below poverty.
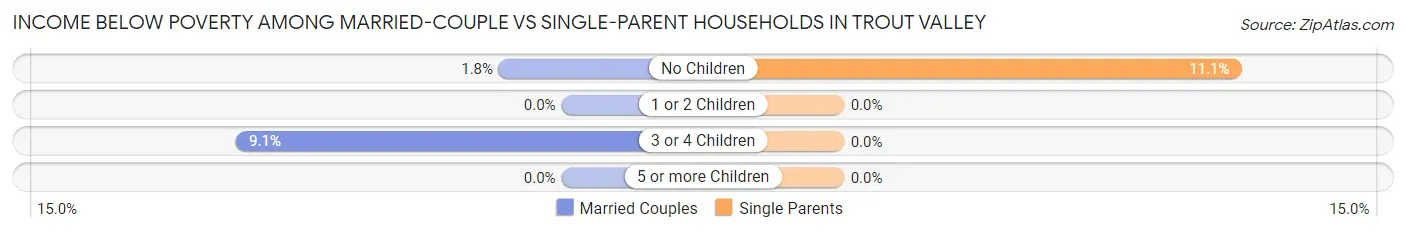
| Children | Married-Couple Families | Single-Parent Households |
| No Children | 2 (1.8%) | 1 (11.1%) |
| 1 or 2 Children | 0 (0.0%) | 0 (0.0%) |
| 3 or 4 Children | 1 (9.1%) | 0 (0.0%) |
| 5 or more Children | 0 (0.0%) | 0 (0.0%) |
| Total | 3 (1.8%) | 1 (9.1%) |
Race in Trout Valley
The most populous races in Trout Valley are White / Caucasian (575 | 97.0%), Hispanic or Latino (19 | 3.2%), and Black / African American (7 | 1.2%).
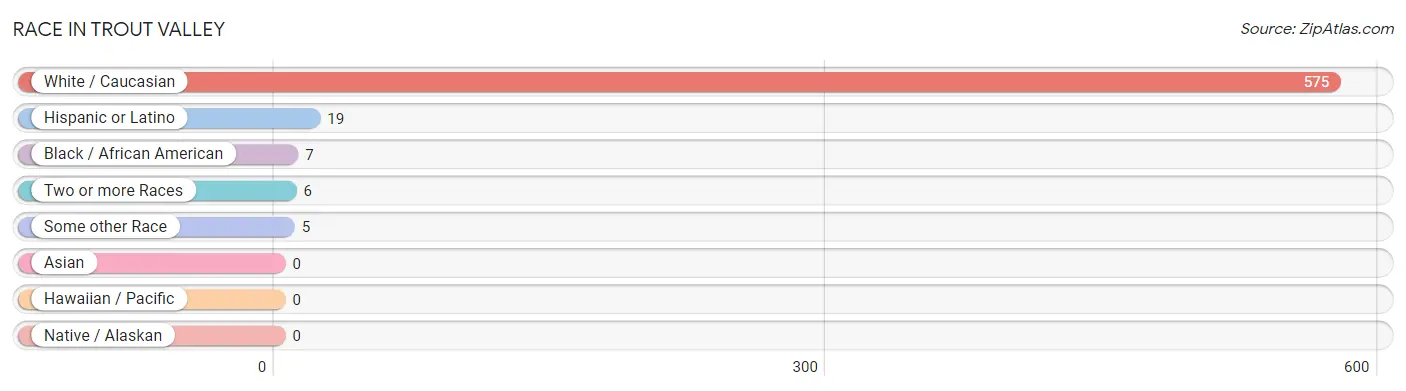
| Race | # Population | % Population |
| Asian | 0 | 0.0% |
| Black / African American | 7 | 1.2% |
| Hawaiian / Pacific | 0 | 0.0% |
| Hispanic or Latino | 19 | 3.2% |
| Native / Alaskan | 0 | 0.0% |
| White / Caucasian | 575 | 97.0% |
| Two or more Races | 6 | 1.0% |
| Some other Race | 5 | 0.8% |
| Total | 593 | 100.0% |
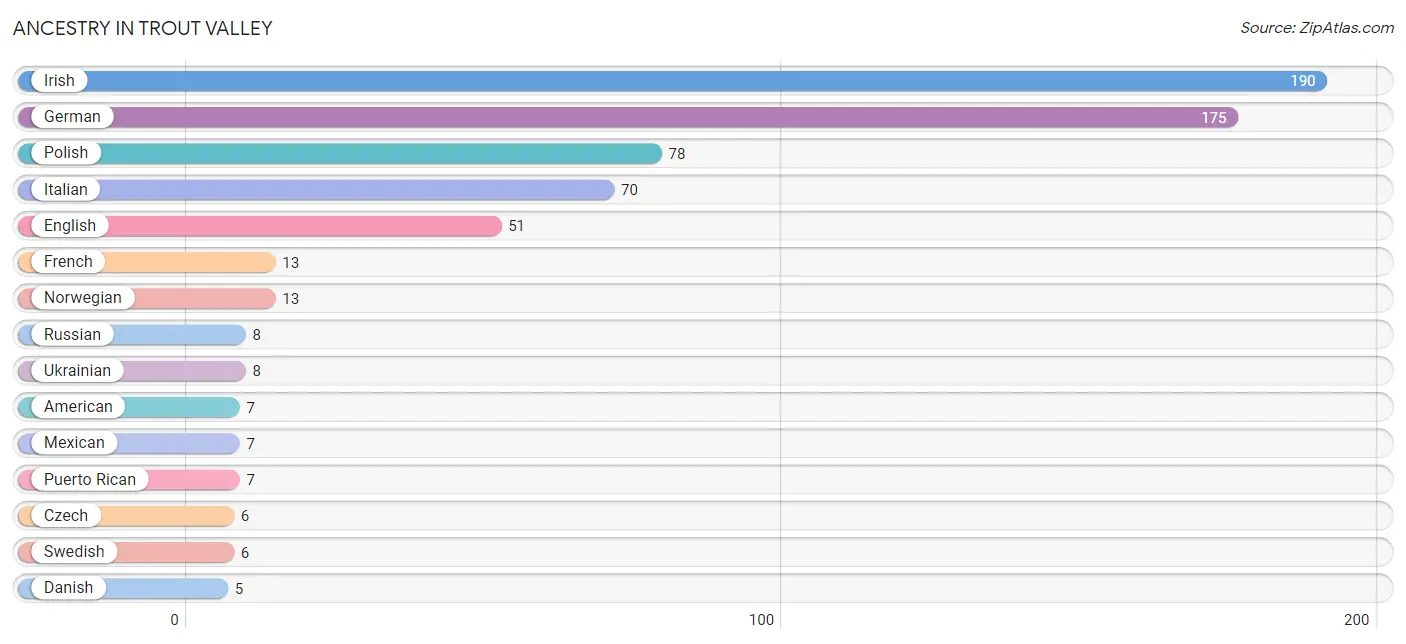
Ancestry in Trout Valley
The most populous ancestries reported in Trout Valley are Irish (190 | 32.0%), German (175 | 29.5%), Polish (78 | 13.2%), Italian (70 | 11.8%), and English (51 | 8.6%), together accounting for 95.1% of all Trout Valley residents.
| Ancestry | # Population | % Population |
| American | 7 | 1.2% |
| Arab | 2 | 0.3% |
| Austrian | 2 | 0.3% |
| Blackfeet | 3 | 0.5% |
| British | 1 | 0.2% |
| Czech | 6 | 1.0% |
| Danish | 5 | 0.8% |
| Dutch | 1 | 0.2% |
| English | 51 | 8.6% |
| European | 4 | 0.7% |
| French | 13 | 2.2% |
| French Canadian | 2 | 0.3% |
| German | 175 | 29.5% |
| Greek | 5 | 0.8% |
| Irish | 190 | 32.0% |
| Italian | 70 | 11.8% |
| Jamaican | 3 | 0.5% |
| Lebanese | 2 | 0.3% |
| Lithuanian | 4 | 0.7% |
| Mexican | 7 | 1.2% |
| Norwegian | 13 | 2.2% |
| Peruvian | 5 | 0.8% |
| Polish | 78 | 13.2% |
| Puerto Rican | 7 | 1.2% |
| Romanian | 2 | 0.3% |
| Russian | 8 | 1.3% |
| Scandinavian | 3 | 0.5% |
| Scotch-Irish | 2 | 0.3% |
| Scottish | 4 | 0.7% |
| Slovak | 4 | 0.7% |
| Slovene | 2 | 0.3% |
| South American | 5 | 0.8% |
| Swedish | 6 | 1.0% |
| Turkish | 1 | 0.2% |
| Ukrainian | 8 | 1.3% | View All 35 Rows |
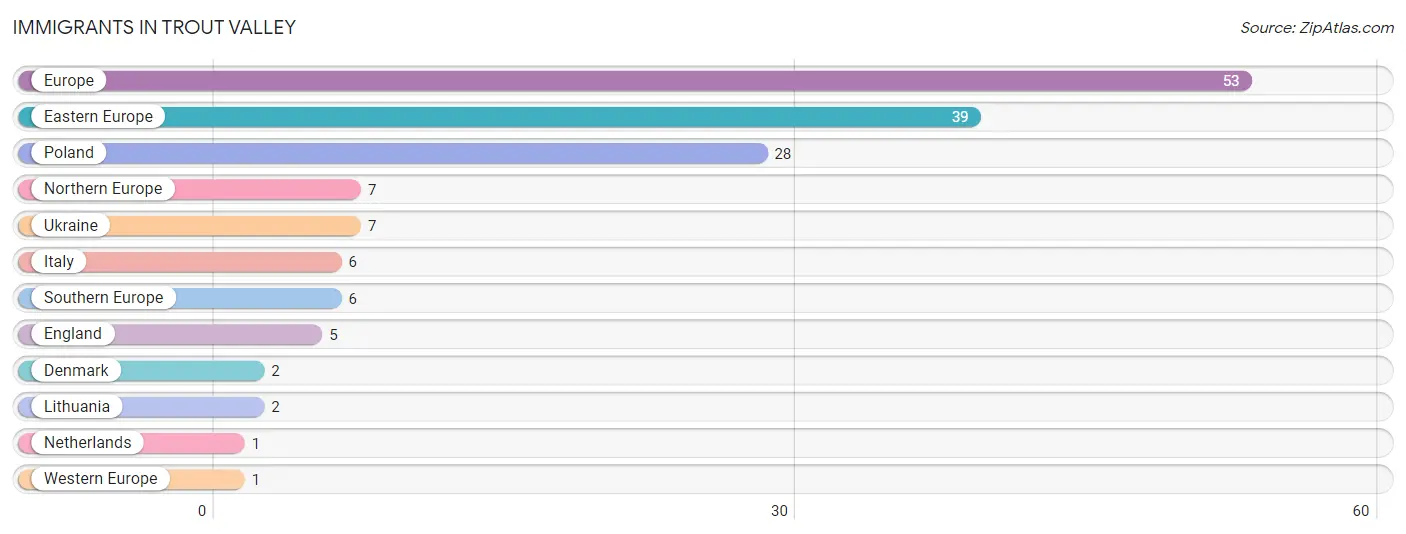
Immigrants in Trout Valley
The most numerous immigrant groups reported in Trout Valley came from Europe (53 | 8.9%), Eastern Europe (39 | 6.6%), Poland (28 | 4.7%), Northern Europe (7 | 1.2%), and Ukraine (7 | 1.2%), together accounting for 22.6% of all Trout Valley residents.
| Immigration Origin | # Population | % Population |
| Denmark | 2 | 0.3% |
| Eastern Europe | 39 | 6.6% |
| England | 5 | 0.8% |
| Europe | 53 | 8.9% |
| Italy | 6 | 1.0% |
| Lithuania | 2 | 0.3% |
| Netherlands | 1 | 0.2% |
| Northern Europe | 7 | 1.2% |
| Poland | 28 | 4.7% |
| Southern Europe | 6 | 1.0% |
| Ukraine | 7 | 1.2% |
| Western Europe | 1 | 0.2% | View All 12 Rows |
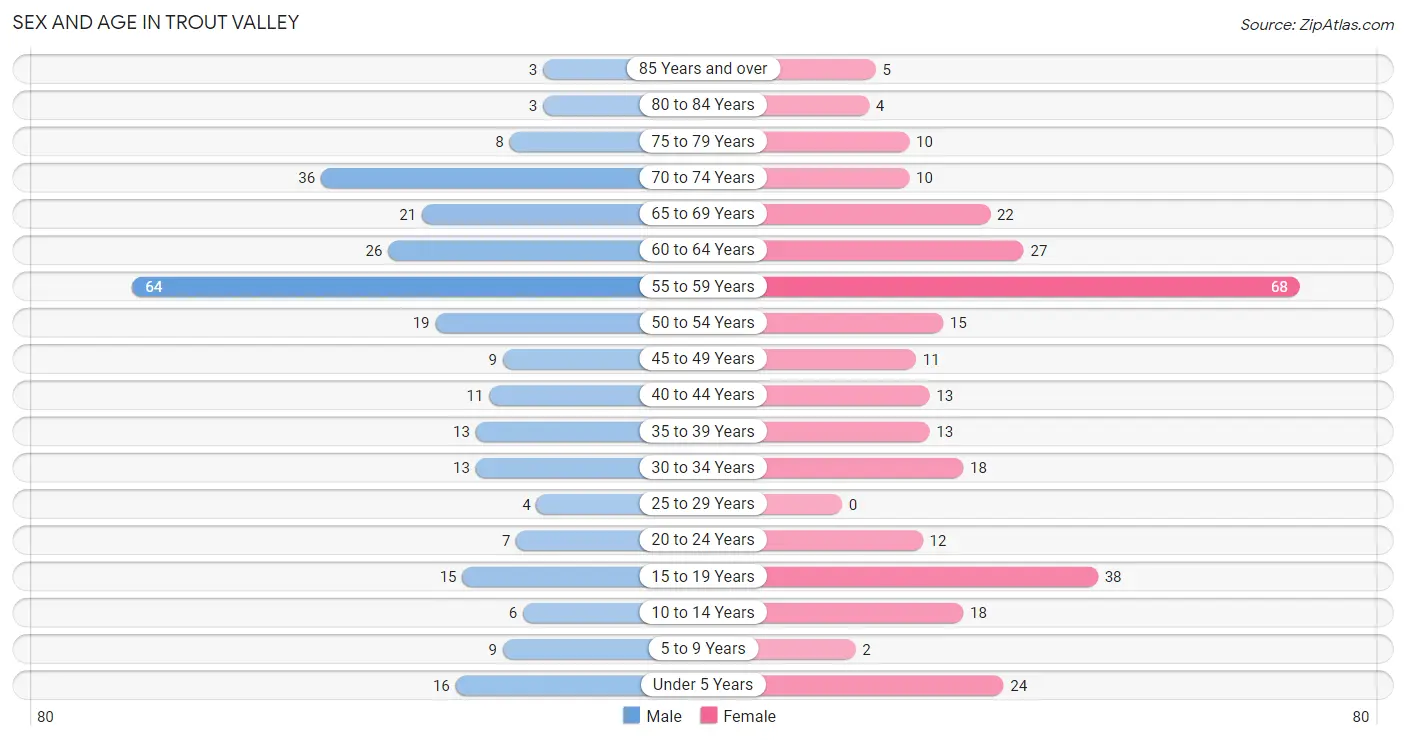
Sex and Age in Trout Valley
Sex and Age in Trout Valley
The most populous age groups in Trout Valley are 55 to 59 Years (64 | 22.6%) for men and 55 to 59 Years (68 | 21.9%) for women.
| Age Bracket | Male | Female |
| Under 5 Years | 16 (5.7%) | 24 (7.7%) |
| 5 to 9 Years | 9 (3.2%) | 2 (0.6%) |
| 10 to 14 Years | 6 (2.1%) | 18 (5.8%) |
| 15 to 19 Years | 15 (5.3%) | 38 (12.3%) |
| 20 to 24 Years | 7 (2.5%) | 12 (3.9%) |
| 25 to 29 Years | 4 (1.4%) | 0 (0.0%) |
| 30 to 34 Years | 13 (4.6%) | 18 (5.8%) |
| 35 to 39 Years | 13 (4.6%) | 13 (4.2%) |
| 40 to 44 Years | 11 (3.9%) | 13 (4.2%) |
| 45 to 49 Years | 9 (3.2%) | 11 (3.5%) |
| 50 to 54 Years | 19 (6.7%) | 15 (4.8%) |
| 55 to 59 Years | 64 (22.6%) | 68 (21.9%) |
| 60 to 64 Years | 26 (9.2%) | 27 (8.7%) |
| 65 to 69 Years | 21 (7.4%) | 22 (7.1%) |
| 70 to 74 Years | 36 (12.7%) | 10 (3.2%) |
| 75 to 79 Years | 8 (2.8%) | 10 (3.2%) |
| 80 to 84 Years | 3 (1.1%) | 4 (1.3%) |
| 85 Years and over | 3 (1.1%) | 5 (1.6%) |
| Total | 283 (100.0%) | 310 (100.0%) |
Families and Households in Trout Valley
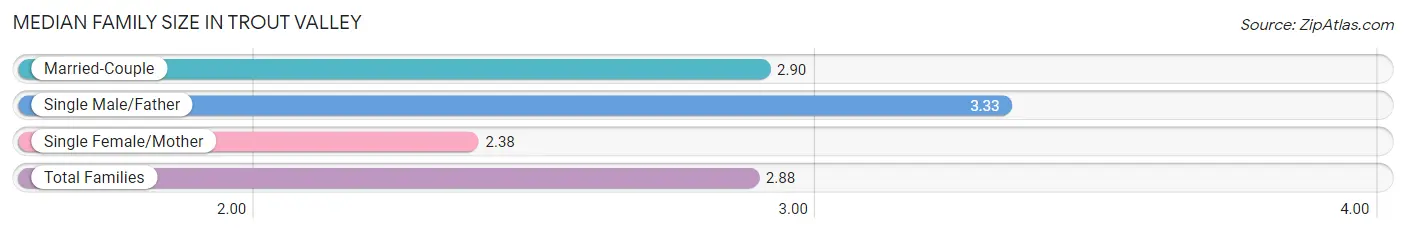
Median Family Size in Trout Valley
The median family size in Trout Valley is 2.88 persons per family, with single male/father families (3 | 1.7%) accounting for the largest median family size of 3.33 persons per family. On the other hand, single female/mother families (8 | 4.5%) represent the smallest median family size with 2.38 persons per family.
| Family Type | # Families | Family Size |
| Married-Couple | 165 (93.8%) | 2.90 |
| Single Male/Father | 3 (1.7%) | 3.33 |
| Single Female/Mother | 8 (4.5%) | 2.38 |
| Total Families | 176 (100.0%) | 2.88 |
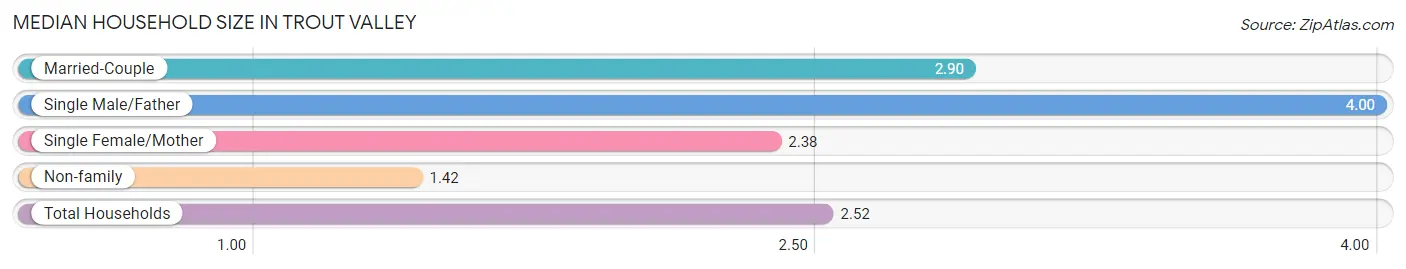
Median Household Size in Trout Valley
The median household size in Trout Valley is 2.52 persons per household, with single male/father households (3 | 1.3%) accounting for the largest median household size of 4 persons per household. non-family households (59 | 25.1%) represent the smallest median household size with 1.42 persons per household.
| Household Type | # Households | Household Size |
| Married-Couple | 165 (70.2%) | 2.90 |
| Single Male/Father | 3 (1.3%) | 4.00 |
| Single Female/Mother | 8 (3.4%) | 2.38 |
| Non-family | 59 (25.1%) | 1.42 |
| Total Households | 235 (100.0%) | 2.52 |
Household Size by Marriage Status in Trout Valley
Out of a total of 235 households in Trout Valley, 176 (74.9%) are family households, while 59 (25.1%) are nonfamily households. The most numerous type of family households are 2-person households, comprising 106, and the most common type of nonfamily households are 1-person households, comprising 35.
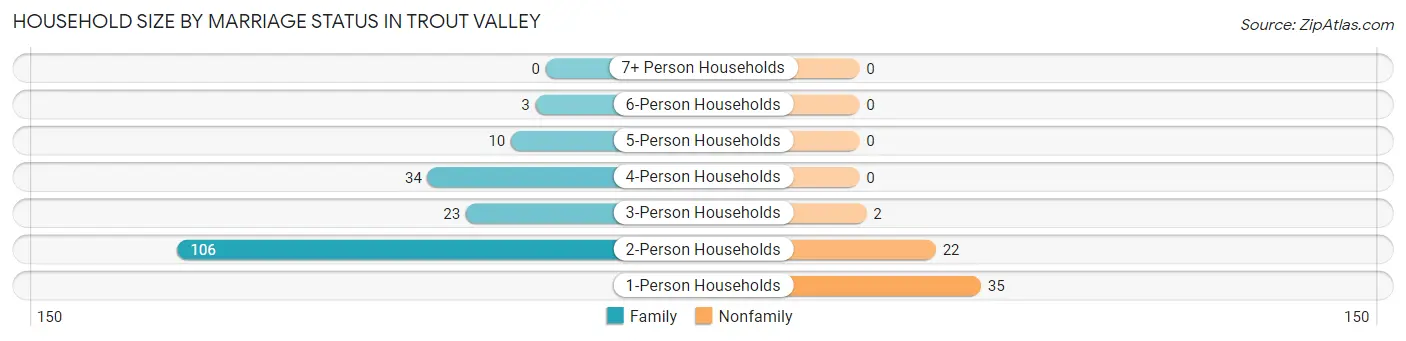
| Household Size | Family Households | Nonfamily Households |
| 1-Person Households | - | 35 (14.9%) |
| 2-Person Households | 106 (45.1%) | 22 (9.4%) |
| 3-Person Households | 23 (9.8%) | 2 (0.9%) |
| 4-Person Households | 34 (14.5%) | 0 (0.0%) |
| 5-Person Households | 10 (4.3%) | 0 (0.0%) |
| 6-Person Households | 3 (1.3%) | 0 (0.0%) |
| 7+ Person Households | 0 (0.0%) | 0 (0.0%) |
| Total | 176 (74.9%) | 59 (25.1%) |
Female Fertility in Trout Valley
Fertility by Age in Trout Valley
Average fertility rate in Trout Valley is 106.0 births per 1,000 women. Women in the age bracket of 20 to 34 years have the highest fertility rate with 267.0 births per 1,000 women. Women in the age bracket of 20 to 34 years acount for 66.7% of all women with births.
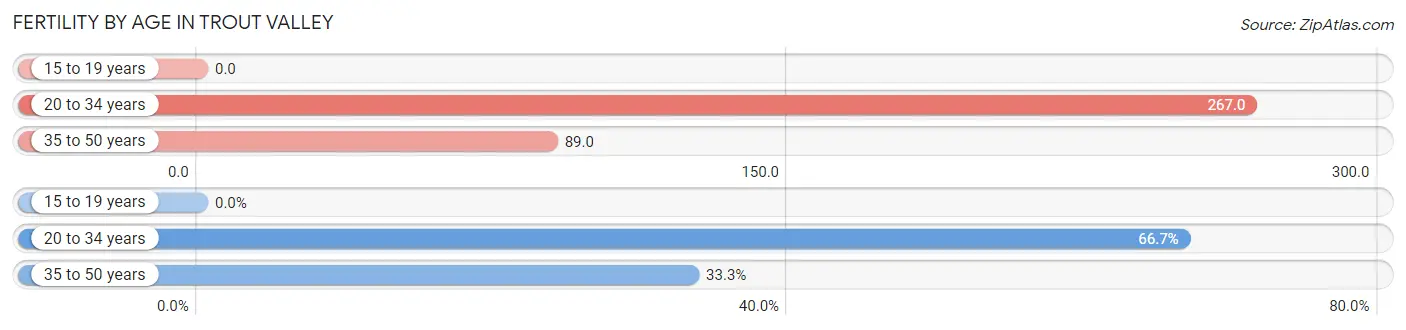
| Age Bracket | Women with Births | Births / 1,000 Women |
| 15 to 19 years | 0 (0.0%) | 0.0 |
| 20 to 34 years | 8 (66.7%) | 267.0 |
| 35 to 50 years | 4 (33.3%) | 89.0 |
| Total | 12 (100.0%) | 106.0 |
Fertility by Age by Marriage Status in Trout Valley
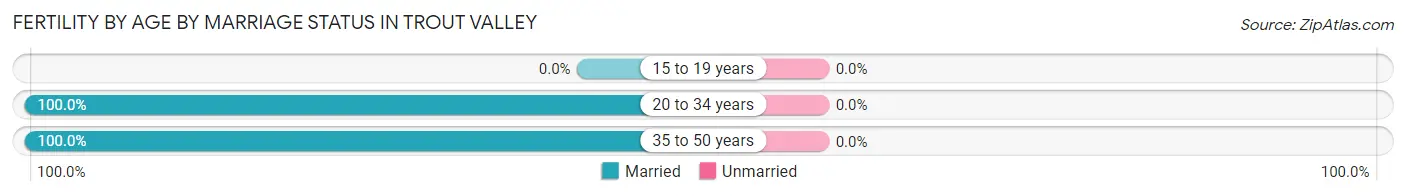
| Age Bracket | Married | Unmarried |
| 15 to 19 years | 0 (0.0%) | 0 (0.0%) |
| 20 to 34 years | 8 (100.0%) | 0 (0.0%) |
| 35 to 50 years | 4 (100.0%) | 0 (0.0%) |
| Total | 12 (100.0%) | 0 (0.0%) |
Fertility by Education in Trout Valley
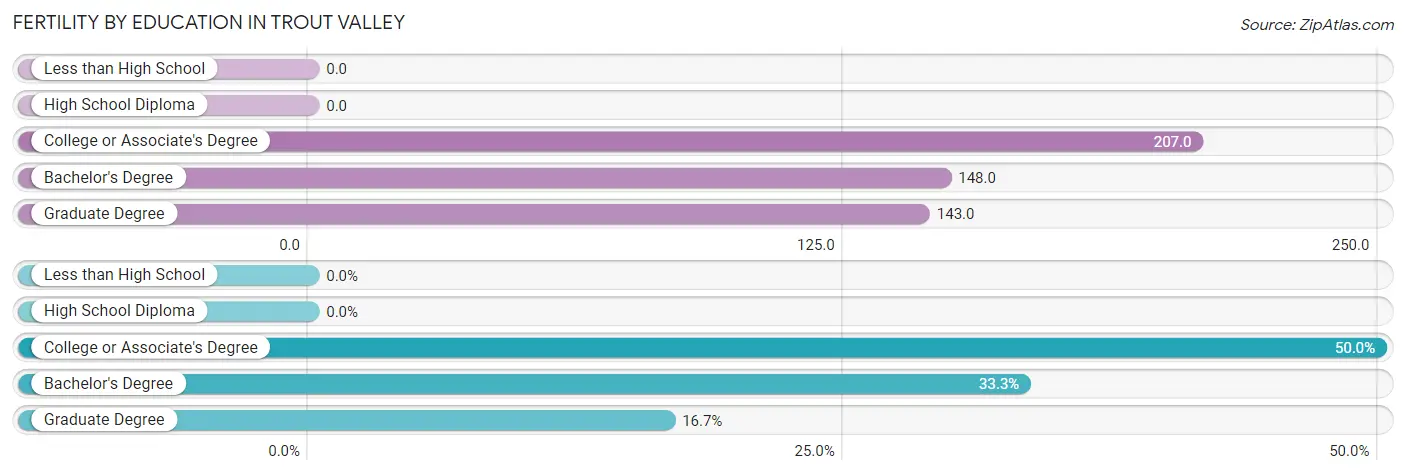
| Educational Attainment | Women with Births | Births / 1,000 Women |
| Less than High School | 0 (0.0%) | 0.0 |
| High School Diploma | 0 (0.0%) | 0.0 |
| College or Associate's Degree | 6 (50.0%) | 207.0 |
| Bachelor's Degree | 4 (33.3%) | 148.0 |
| Graduate Degree | 2 (16.7%) | 143.0 |
| Total | 12 (100.0%) | 106.0 |
Fertility by Education by Marriage Status in Trout Valley
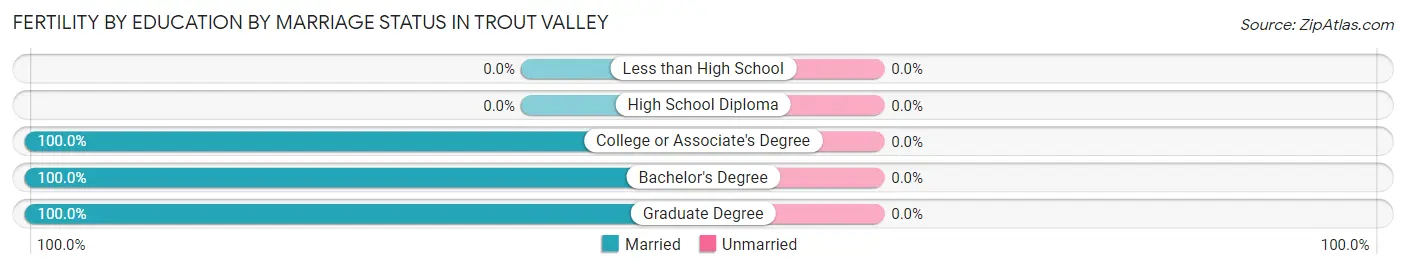
| Educational Attainment | Married | Unmarried |
| Less than High School | 0 (0.0%) | 0 (0.0%) |
| High School Diploma | 0 (0.0%) | 0 (0.0%) |
| College or Associate's Degree | 6 (100.0%) | 0 (0.0%) |
| Bachelor's Degree | 4 (100.0%) | 0 (0.0%) |
| Graduate Degree | 2 (100.0%) | 0 (0.0%) |
| Total | 12 (100.0%) | 0 (0.0%) |
Employment Characteristics in Trout Valley
Employment by Class of Employer in Trout Valley
Among the 346 employed individuals in Trout Valley, private company employees (231 | 66.8%), self-employed (incorporated) (41 | 11.8%), and self-employed (not incorporated) (34 | 9.8%) make up the most common classes of employment.
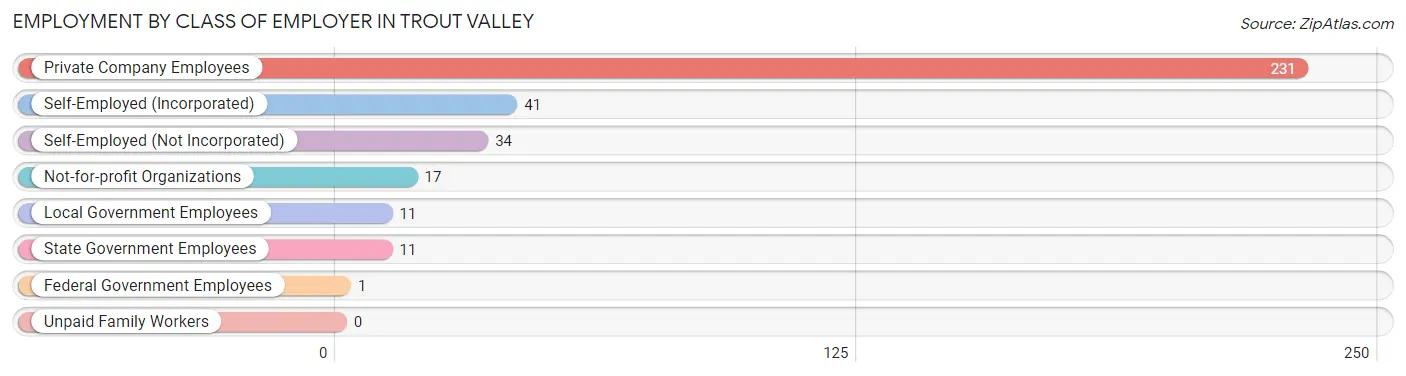
| Employer Class | # Employees | % Employees |
| Private Company Employees | 231 | 66.8% |
| Self-Employed (Incorporated) | 41 | 11.8% |
| Self-Employed (Not Incorporated) | 34 | 9.8% |
| Not-for-profit Organizations | 17 | 4.9% |
| Local Government Employees | 11 | 3.2% |
| State Government Employees | 11 | 3.2% |
| Federal Government Employees | 1 | 0.3% |
| Unpaid Family Workers | 0 | 0.0% |
| Total | 346 | 100.0% |
Employment Status by Age in Trout Valley
According to the labor force statistics for Trout Valley, out of the total population over 16 years of age (511), 70.1% or 358 individuals are in the labor force, with 2.0% or 7 of them unemployed. The age group with the highest labor force participation rate is 25 to 29 years, with 100.0% or 4 individuals in the labor force. Within the labor force, the 45 to 54 years age range has the highest percentage of unemployed individuals, with 9.3% or 4 of them being unemployed.
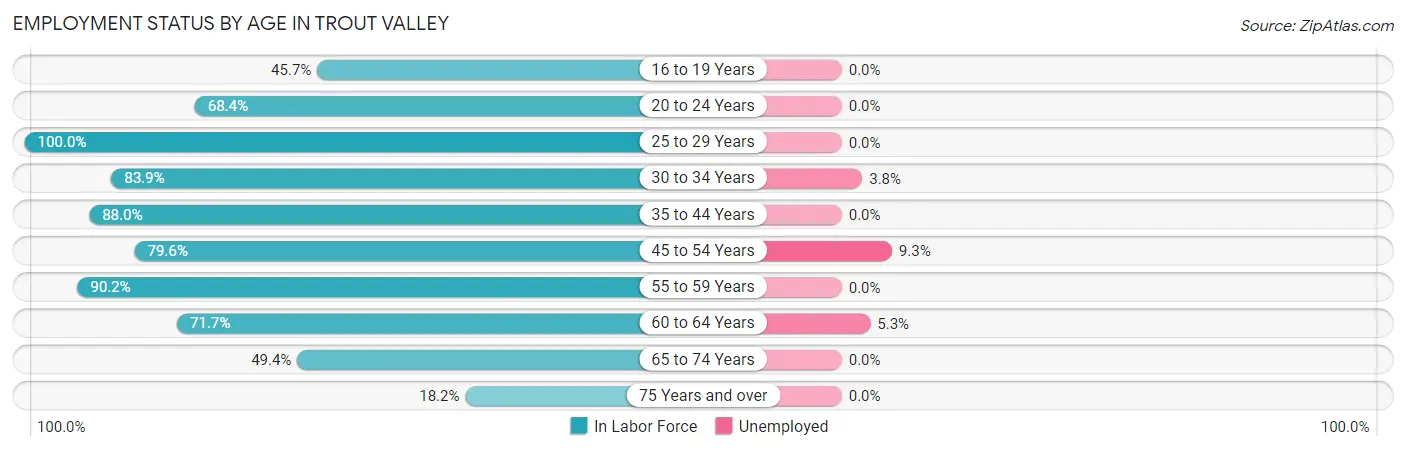
| Age Bracket | In Labor Force | Unemployed |
| 16 to 19 Years | 21 (45.7%) | 0 (0.0%) |
| 20 to 24 Years | 13 (68.4%) | 0 (0.0%) |
| 25 to 29 Years | 4 (100.0%) | 0 (0.0%) |
| 30 to 34 Years | 26 (83.9%) | 1 (3.8%) |
| 35 to 44 Years | 44 (88.0%) | 0 (0.0%) |
| 45 to 54 Years | 43 (79.6%) | 4 (9.3%) |
| 55 to 59 Years | 119 (90.2%) | 0 (0.0%) |
| 60 to 64 Years | 38 (71.7%) | 2 (5.3%) |
| 65 to 74 Years | 44 (49.4%) | 0 (0.0%) |
| 75 Years and over | 6 (18.2%) | 0 (0.0%) |
| Total | 358 (70.1%) | 7 (2.0%) |
Employment Status by Educational Attainment in Trout Valley
According to labor force statistics for Trout Valley, 84.6% of individuals (274) out of the total population between 25 and 64 years of age (324) are in the labor force, with 2.6% or 7 of them being unemployed. The group with the highest labor force participation rate are those with the educational attainment of less than high school, with 100.0% or 2 individuals in the labor force. Within the labor force, individuals with college / associate degree education have the highest percentage of unemployment, with 7.5% or 4 of them being unemployed.
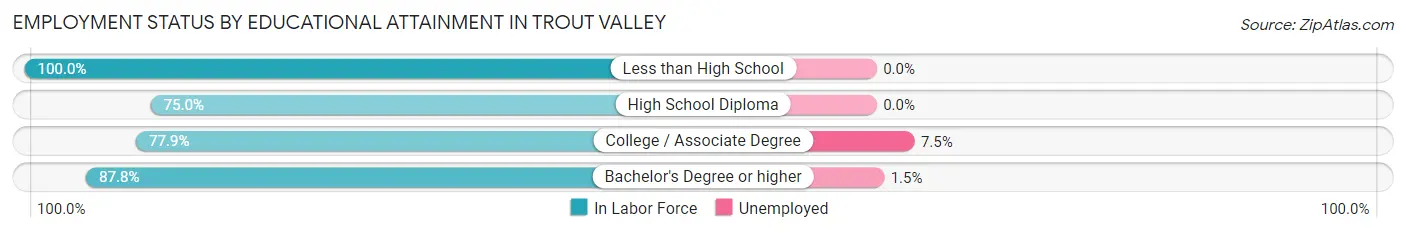
| Educational Attainment | In Labor Force | Unemployed |
| Less than High School | 2 (100.0%) | 0 (0.0%) |
| High School Diploma | 24 (75.0%) | 0 (0.0%) |
| College / Associate Degree | 53 (77.9%) | 5 (7.5%) |
| Bachelor's Degree or higher | 195 (87.8%) | 3 (1.5%) |
| Total | 274 (84.6%) | 8 (2.6%) |
Employment Occupations by Sex in Trout Valley
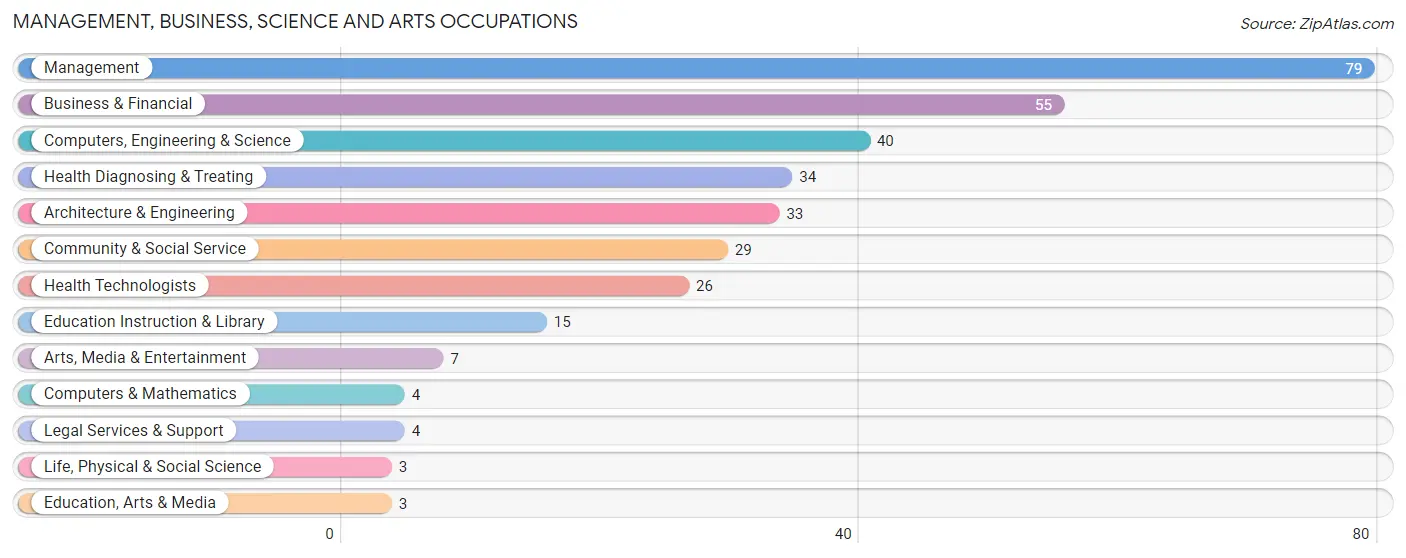
Management, Business, Science and Arts Occupations
The most common Management, Business, Science and Arts occupations in Trout Valley are Management (79 | 22.5%), Business & Financial (55 | 15.7%), Computers, Engineering & Science (40 | 11.4%), Health Diagnosing & Treating (34 | 9.7%), and Architecture & Engineering (33 | 9.4%).
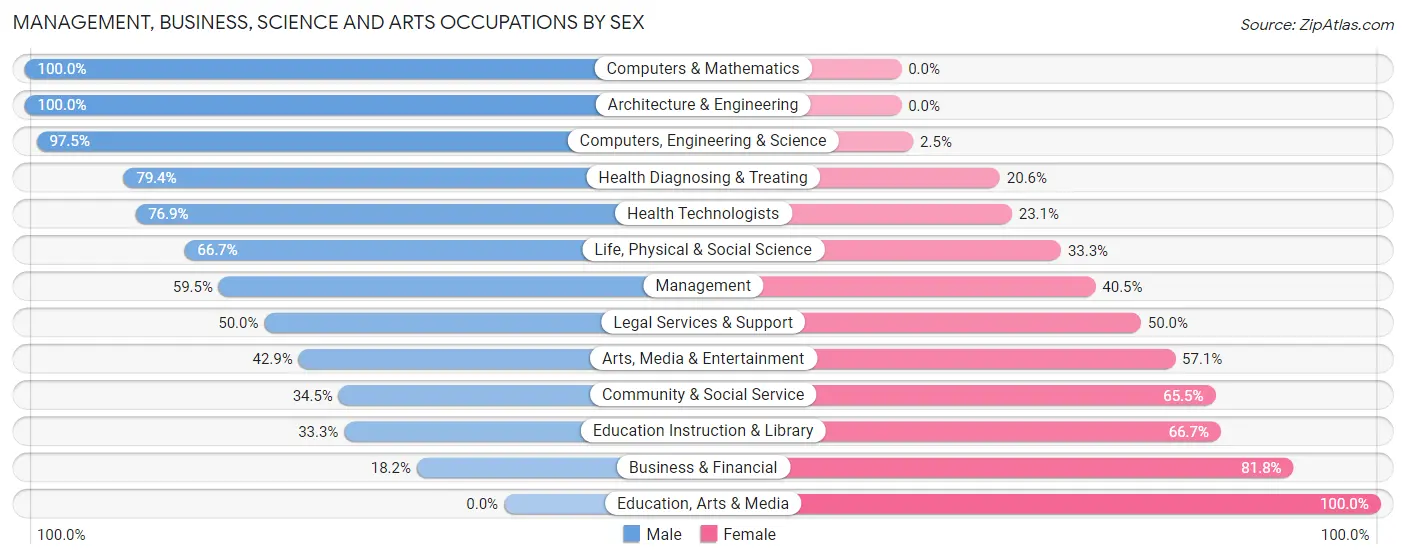
Management, Business, Science and Arts Occupations by Sex
Within the Management, Business, Science and Arts occupations in Trout Valley, the most male-oriented occupations are Computers & Mathematics (100.0%), Architecture & Engineering (100.0%), and Computers, Engineering & Science (97.5%), while the most female-oriented occupations are Education, Arts & Media (100.0%), Business & Financial (81.8%), and Education Instruction & Library (66.7%).
| Occupation | Male | Female |
| Management | 47 (59.5%) | 32 (40.5%) |
| Business & Financial | 10 (18.2%) | 45 (81.8%) |
| Computers, Engineering & Science | 39 (97.5%) | 1 (2.5%) |
| Computers & Mathematics | 4 (100.0%) | 0 (0.0%) |
| Architecture & Engineering | 33 (100.0%) | 0 (0.0%) |
| Life, Physical & Social Science | 2 (66.7%) | 1 (33.3%) |
| Community & Social Service | 10 (34.5%) | 19 (65.5%) |
| Education, Arts & Media | 0 (0.0%) | 3 (100.0%) |
| Legal Services & Support | 2 (50.0%) | 2 (50.0%) |
| Education Instruction & Library | 5 (33.3%) | 10 (66.7%) |
| Arts, Media & Entertainment | 3 (42.9%) | 4 (57.1%) |
| Health Diagnosing & Treating | 27 (79.4%) | 7 (20.6%) |
| Health Technologists | 20 (76.9%) | 6 (23.1%) |
| Total (Category) | 133 (56.1%) | 104 (43.9%) |
| Total (Overall) | 194 (55.3%) | 157 (44.7%) |
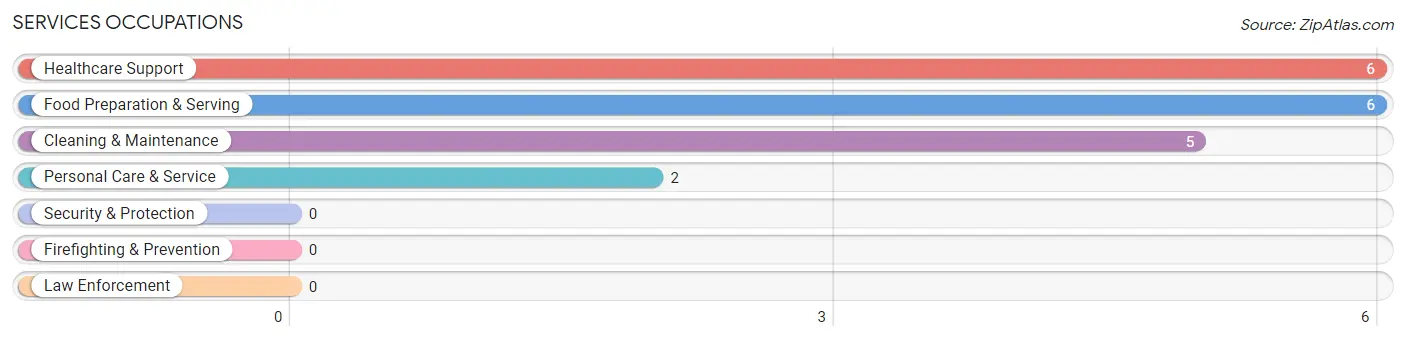
Services Occupations
The most common Services occupations in Trout Valley are Healthcare Support (6 | 1.7%), Food Preparation & Serving (6 | 1.7%), Cleaning & Maintenance (5 | 1.4%), and Personal Care & Service (2 | 0.6%).
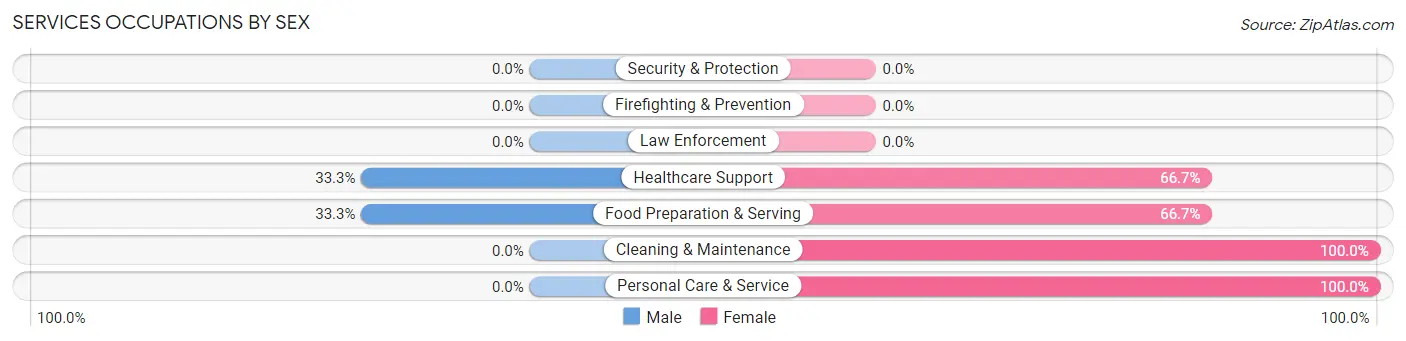
Services Occupations by Sex
Within the Services occupations in Trout Valley, the most male-oriented occupations are Healthcare Support (33.3%), and Food Preparation & Serving (33.3%), while the most female-oriented occupations are Cleaning & Maintenance (100.0%), Personal Care & Service (100.0%), and Healthcare Support (66.7%).
| Occupation | Male | Female |
| Healthcare Support | 2 (33.3%) | 4 (66.7%) |
| Security & Protection | 0 (0.0%) | 0 (0.0%) |
| Firefighting & Prevention | 0 (0.0%) | 0 (0.0%) |
| Law Enforcement | 0 (0.0%) | 0 (0.0%) |
| Food Preparation & Serving | 2 (33.3%) | 4 (66.7%) |
| Cleaning & Maintenance | 0 (0.0%) | 5 (100.0%) |
| Personal Care & Service | 0 (0.0%) | 2 (100.0%) |
| Total (Category) | 4 (21.0%) | 15 (78.9%) |
| Total (Overall) | 194 (55.3%) | 157 (44.7%) |
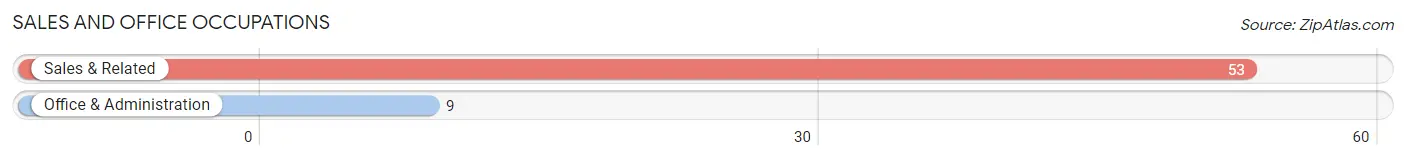
Sales and Office Occupations
The most common Sales and Office occupations in Trout Valley are Sales & Related (53 | 15.1%), and Office & Administration (9 | 2.6%).
Sales and Office Occupations by Sex
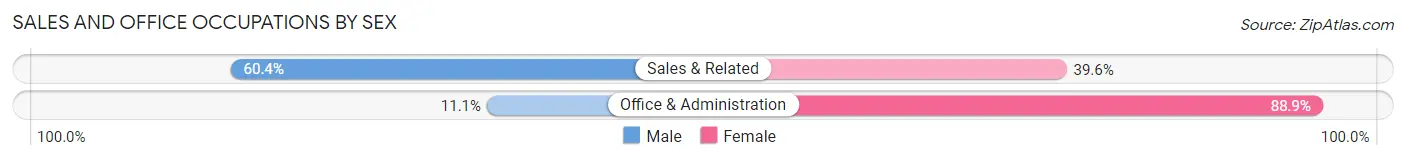
| Occupation | Male | Female |
| Sales & Related | 32 (60.4%) | 21 (39.6%) |
| Office & Administration | 1 (11.1%) | 8 (88.9%) |
| Total (Category) | 33 (53.2%) | 29 (46.8%) |
| Total (Overall) | 194 (55.3%) | 157 (44.7%) |
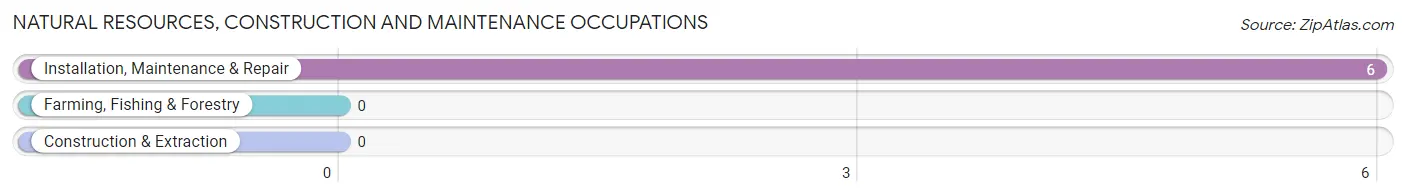
Natural Resources, Construction and Maintenance Occupations
The most common Natural Resources, Construction and Maintenance occupations in Trout Valley are , and Installation, Maintenance & Repair (6 | 1.7%).
Natural Resources, Construction and Maintenance Occupations by Sex
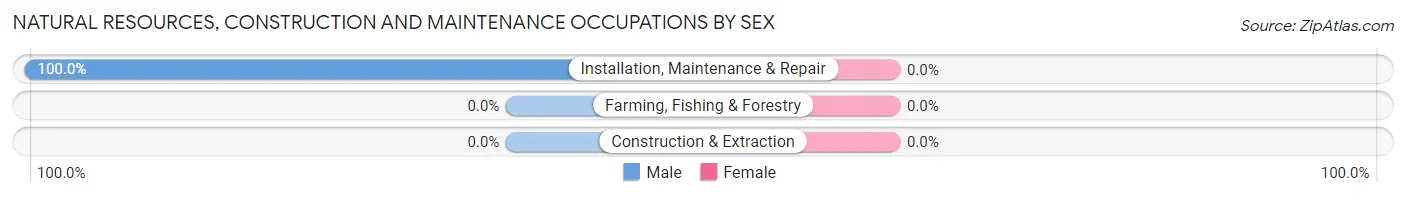
| Occupation | Male | Female |
| Farming, Fishing & Forestry | 0 (0.0%) | 0 (0.0%) |
| Construction & Extraction | 0 (0.0%) | 0 (0.0%) |
| Installation, Maintenance & Repair | 6 (100.0%) | 0 (0.0%) |
| Total (Category) | 6 (100.0%) | 0 (0.0%) |
| Total (Overall) | 194 (55.3%) | 157 (44.7%) |
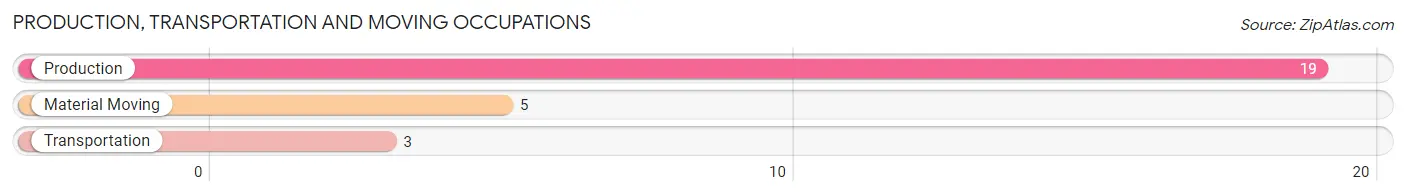
Production, Transportation and Moving Occupations
The most common Production, Transportation and Moving occupations in Trout Valley are Production (19 | 5.4%), Material Moving (5 | 1.4%), and Transportation (3 | 0.9%).
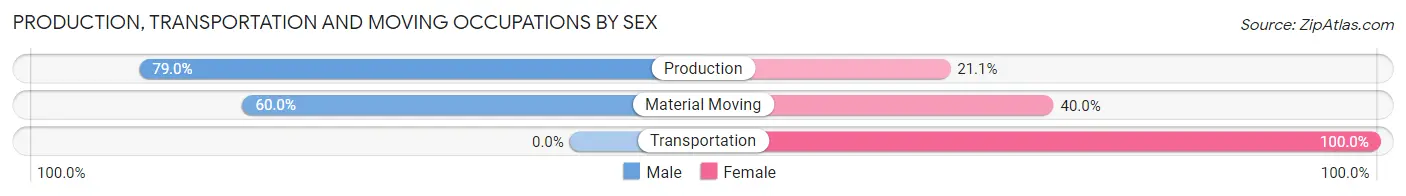
Production, Transportation and Moving Occupations by Sex
| Occupation | Male | Female |
| Production | 15 (78.9%) | 4 (21.0%) |
| Transportation | 0 (0.0%) | 3 (100.0%) |
| Material Moving | 3 (60.0%) | 2 (40.0%) |
| Total (Category) | 18 (66.7%) | 9 (33.3%) |
| Total (Overall) | 194 (55.3%) | 157 (44.7%) |
Employment Industries by Sex in Trout Valley
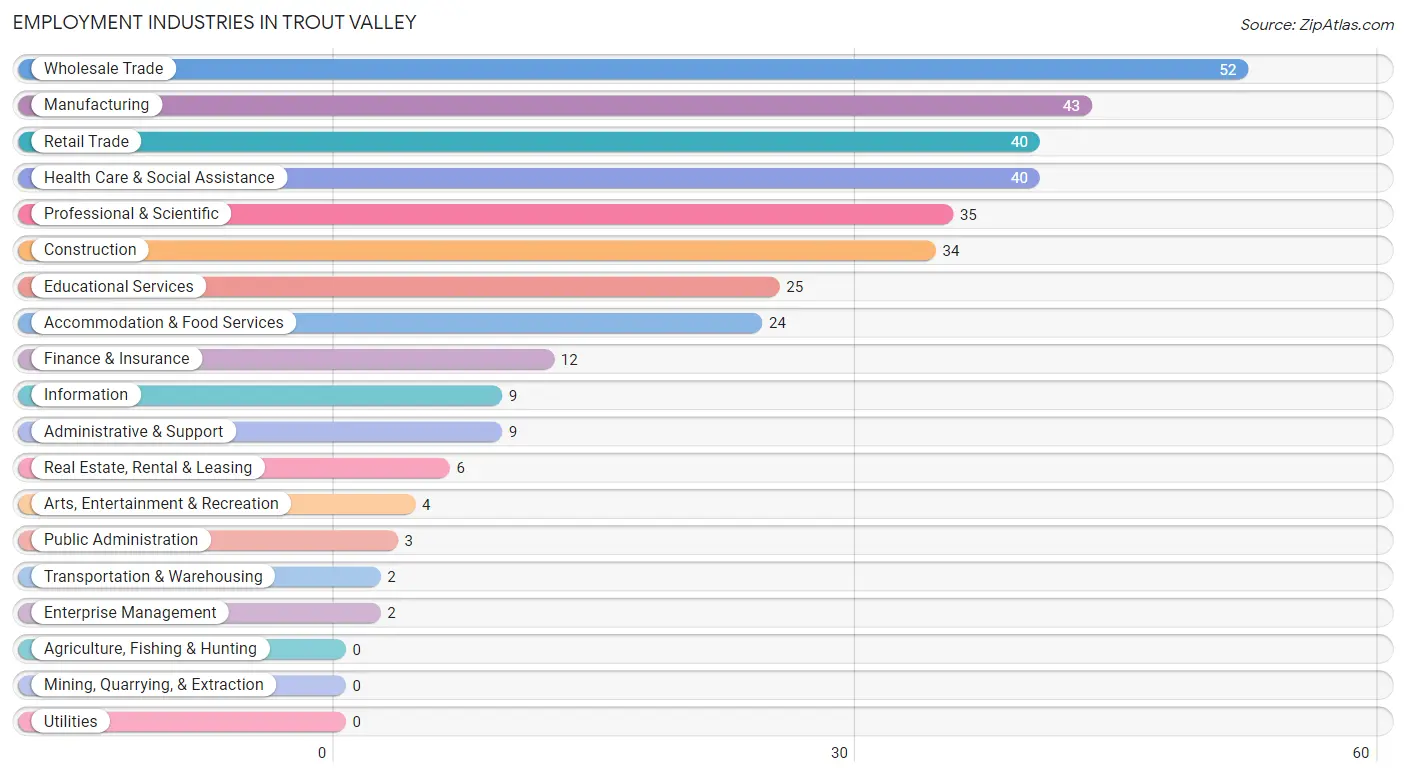
Employment Industries in Trout Valley
The major employment industries in Trout Valley include Wholesale Trade (52 | 14.8%), Manufacturing (43 | 12.2%), Retail Trade (40 | 11.4%), Health Care & Social Assistance (40 | 11.4%), and Professional & Scientific (35 | 10.0%).
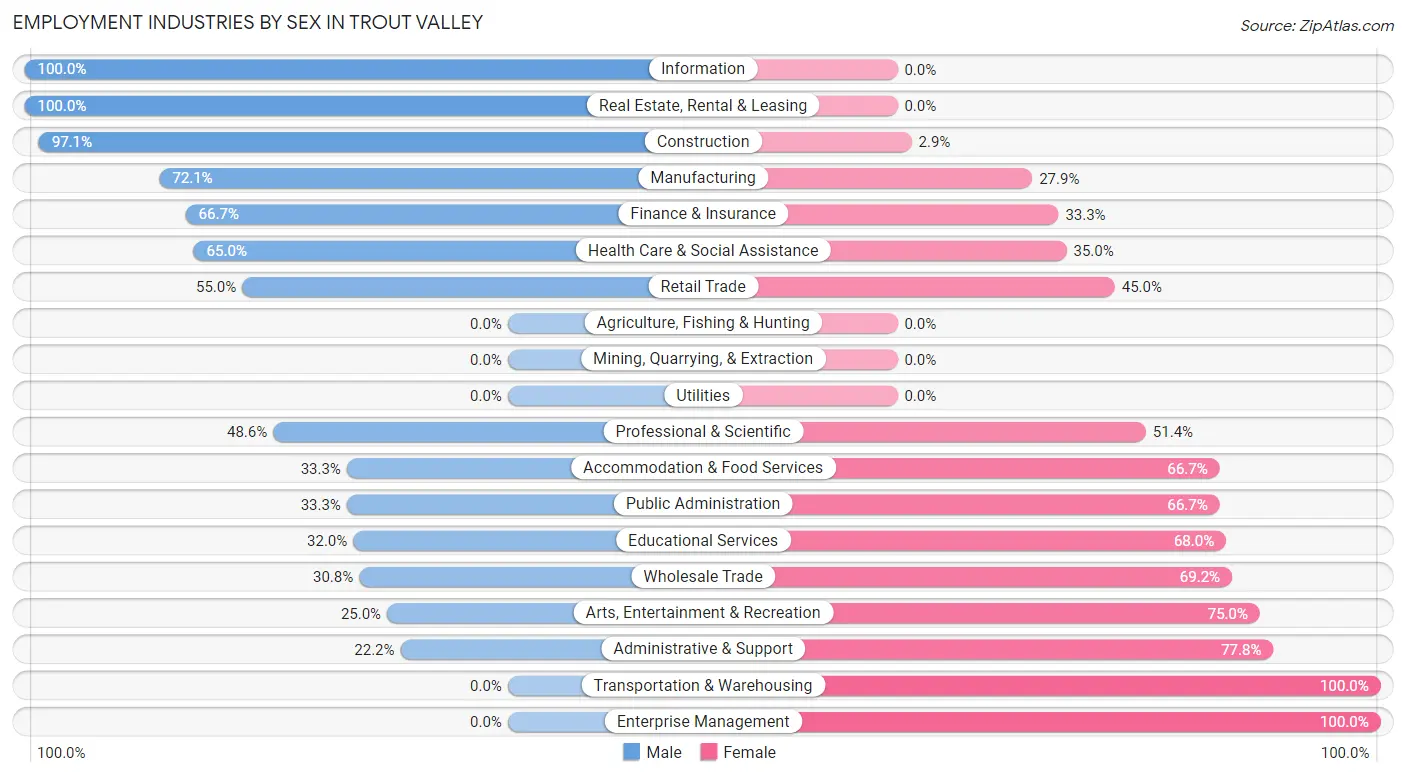
Employment Industries by Sex in Trout Valley
The Trout Valley industries that see more men than women are Information (100.0%), Real Estate, Rental & Leasing (100.0%), and Construction (97.1%), whereas the industries that tend to have a higher number of women are Transportation & Warehousing (100.0%), Enterprise Management (100.0%), and Administrative & Support (77.8%).
| Industry | Male | Female |
| Agriculture, Fishing & Hunting | 0 (0.0%) | 0 (0.0%) |
| Mining, Quarrying, & Extraction | 0 (0.0%) | 0 (0.0%) |
| Construction | 33 (97.1%) | 1 (2.9%) |
| Manufacturing | 31 (72.1%) | 12 (27.9%) |
| Wholesale Trade | 16 (30.8%) | 36 (69.2%) |
| Retail Trade | 22 (55.0%) | 18 (45.0%) |
| Transportation & Warehousing | 0 (0.0%) | 2 (100.0%) |
| Utilities | 0 (0.0%) | 0 (0.0%) |
| Information | 9 (100.0%) | 0 (0.0%) |
| Finance & Insurance | 8 (66.7%) | 4 (33.3%) |
| Real Estate, Rental & Leasing | 6 (100.0%) | 0 (0.0%) |
| Professional & Scientific | 17 (48.6%) | 18 (51.4%) |
| Enterprise Management | 0 (0.0%) | 2 (100.0%) |
| Administrative & Support | 2 (22.2%) | 7 (77.8%) |
| Educational Services | 8 (32.0%) | 17 (68.0%) |
| Health Care & Social Assistance | 26 (65.0%) | 14 (35.0%) |
| Arts, Entertainment & Recreation | 1 (25.0%) | 3 (75.0%) |
| Accommodation & Food Services | 8 (33.3%) | 16 (66.7%) |
| Public Administration | 1 (33.3%) | 2 (66.7%) |
| Total | 194 (55.3%) | 157 (44.7%) |
Education in Trout Valley
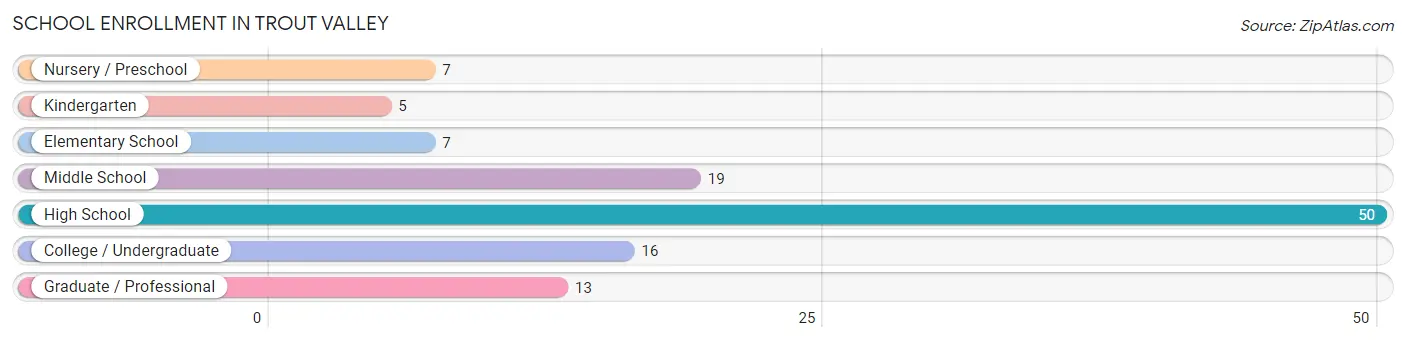
School Enrollment in Trout Valley
The most common levels of schooling among the 117 students in Trout Valley are high school (50 | 42.7%), middle school (19 | 16.2%), and college / undergraduate (16 | 13.7%).
| School Level | # Students | % Students |
| Nursery / Preschool | 7 | 6.0% |
| Kindergarten | 5 | 4.3% |
| Elementary School | 7 | 6.0% |
| Middle School | 19 | 16.2% |
| High School | 50 | 42.7% |
| College / Undergraduate | 16 | 13.7% |
| Graduate / Professional | 13 | 11.1% |
| Total | 117 | 100.0% |
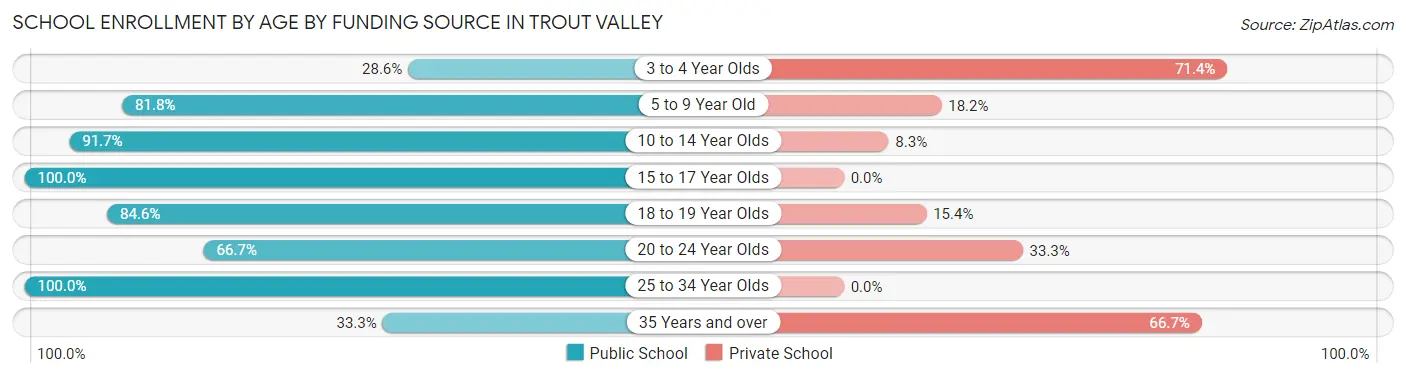
School Enrollment by Age by Funding Source in Trout Valley
Out of a total of 117 students who are enrolled in schools in Trout Valley, 21 (17.9%) attend a private institution, while the remaining 96 (82.1%) are enrolled in public schools. The age group of 3 to 4 year olds has the highest likelihood of being enrolled in private schools, with 5 (71.4% in the age bracket) enrolled. Conversely, the age group of 15 to 17 year olds has the lowest likelihood of being enrolled in a private school, with 38 (100.0% in the age bracket) attending a public institution.
| Age Bracket | Public School | Private School |
| 3 to 4 Year Olds | 2 (28.6%) | 5 (71.4%) |
| 5 to 9 Year Old | 9 (81.8%) | 2 (18.2%) |
| 10 to 14 Year Olds | 22 (91.7%) | 2 (8.3%) |
| 15 to 17 Year Olds | 38 (100.0%) | 0 (0.0%) |
| 18 to 19 Year Olds | 11 (84.6%) | 2 (15.4%) |
| 20 to 24 Year Olds | 8 (66.7%) | 4 (33.3%) |
| 25 to 34 Year Olds | 3 (100.0%) | 0 (0.0%) |
| 35 Years and over | 3 (33.3%) | 6 (66.7%) |
| Total | 96 (82.1%) | 21 (17.9%) |
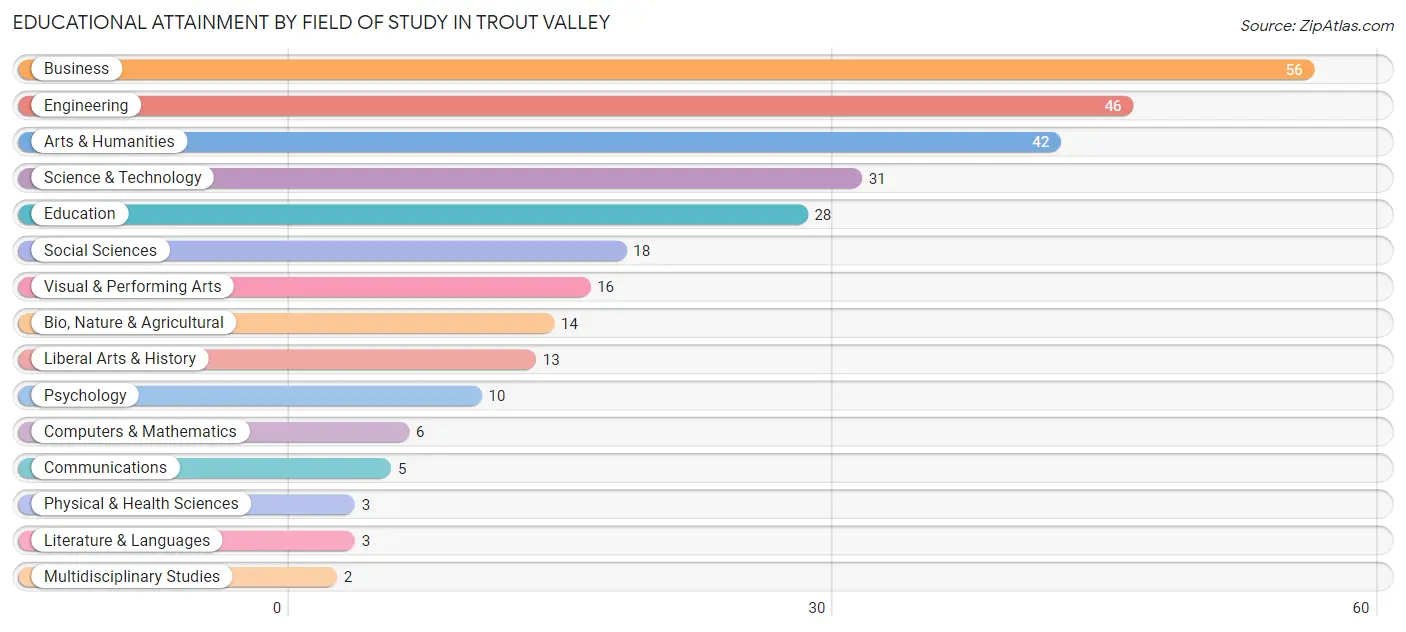
Educational Attainment by Field of Study in Trout Valley
Business (56 | 19.1%), engineering (46 | 15.7%), arts & humanities (42 | 14.3%), science & technology (31 | 10.6%), and education (28 | 9.6%) are the most common fields of study among 293 individuals in Trout Valley who have obtained a bachelor's degree or higher.
| Field of Study | # Graduates | % Graduates |
| Computers & Mathematics | 6 | 2.1% |
| Bio, Nature & Agricultural | 14 | 4.8% |
| Physical & Health Sciences | 3 | 1.0% |
| Psychology | 10 | 3.4% |
| Social Sciences | 18 | 6.1% |
| Engineering | 46 | 15.7% |
| Multidisciplinary Studies | 2 | 0.7% |
| Science & Technology | 31 | 10.6% |
| Business | 56 | 19.1% |
| Education | 28 | 9.6% |
| Literature & Languages | 3 | 1.0% |
| Liberal Arts & History | 13 | 4.4% |
| Visual & Performing Arts | 16 | 5.5% |
| Communications | 5 | 1.7% |
| Arts & Humanities | 42 | 14.3% |
| Total | 293 | 100.0% |
Transportation & Commute in Trout Valley
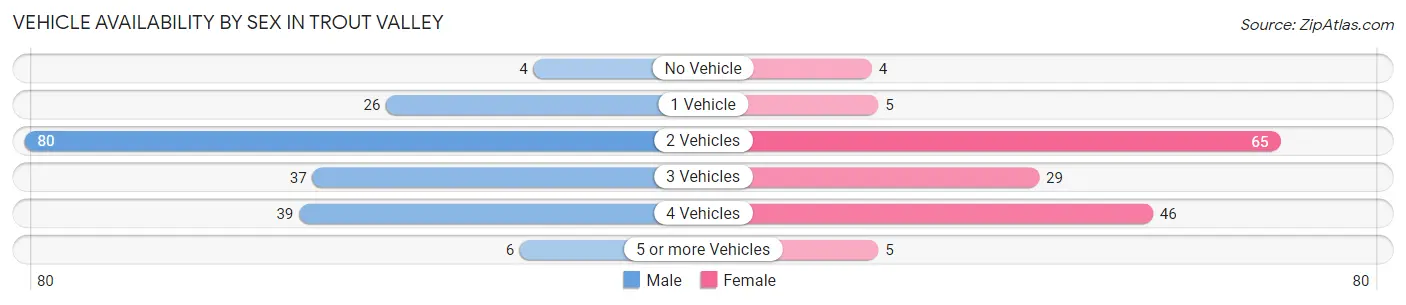
Vehicle Availability by Sex in Trout Valley
The most prevalent vehicle ownership categories in Trout Valley are males with 2 vehicles (80, accounting for 41.7%) and females with 2 vehicles (65, making up 51.9%).
| Vehicles Available | Male | Female |
| No Vehicle | 4 (2.1%) | 4 (2.6%) |
| 1 Vehicle | 26 (13.5%) | 5 (3.3%) |
| 2 Vehicles | 80 (41.7%) | 65 (42.2%) |
| 3 Vehicles | 37 (19.3%) | 29 (18.8%) |
| 4 Vehicles | 39 (20.3%) | 46 (29.9%) |
| 5 or more Vehicles | 6 (3.1%) | 5 (3.3%) |
| Total | 192 (100.0%) | 154 (100.0%) |
Commute Time in Trout Valley
The most frequently occuring commute durations in Trout Valley are 60 to 89 minutes (45 commuters, 15.1%), 25 to 29 minutes (36 commuters, 12.1%), and 45 to 59 minutes (34 commuters, 11.4%).
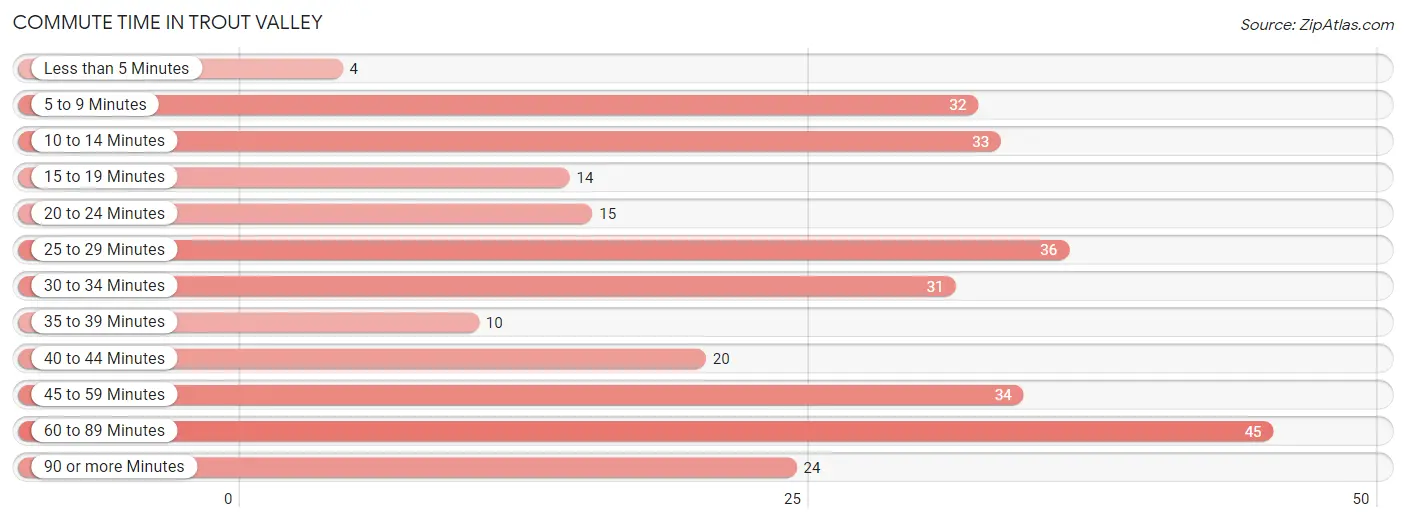
| Commute Time | # Commuters | % Commuters |
| Less than 5 Minutes | 4 | 1.3% |
| 5 to 9 Minutes | 32 | 10.7% |
| 10 to 14 Minutes | 33 | 11.1% |
| 15 to 19 Minutes | 14 | 4.7% |
| 20 to 24 Minutes | 15 | 5.0% |
| 25 to 29 Minutes | 36 | 12.1% |
| 30 to 34 Minutes | 31 | 10.4% |
| 35 to 39 Minutes | 10 | 3.4% |
| 40 to 44 Minutes | 20 | 6.7% |
| 45 to 59 Minutes | 34 | 11.4% |
| 60 to 89 Minutes | 45 | 15.1% |
| 90 or more Minutes | 24 | 8.1% |
Commute Time by Sex in Trout Valley
The most common commute times in Trout Valley are 60 to 89 minutes (44 commuters, 26.8%) for males and 25 to 29 minutes (30 commuters, 22.4%) for females.
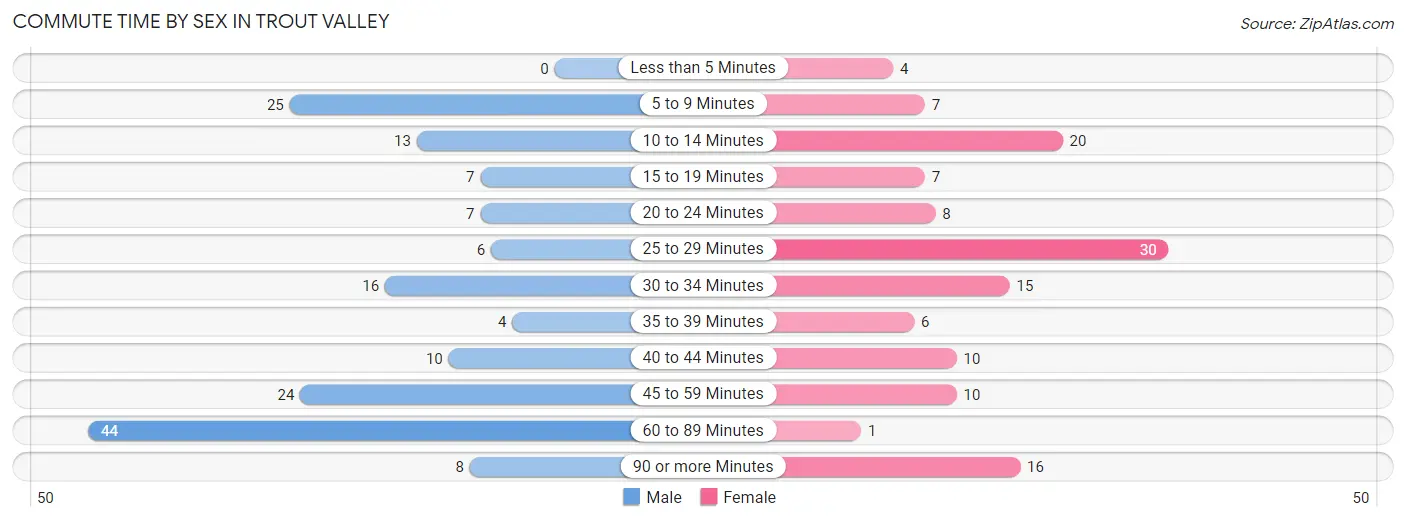
| Commute Time | Male | Female |
| Less than 5 Minutes | 0 (0.0%) | 4 (3.0%) |
| 5 to 9 Minutes | 25 (15.2%) | 7 (5.2%) |
| 10 to 14 Minutes | 13 (7.9%) | 20 (14.9%) |
| 15 to 19 Minutes | 7 (4.3%) | 7 (5.2%) |
| 20 to 24 Minutes | 7 (4.3%) | 8 (6.0%) |
| 25 to 29 Minutes | 6 (3.7%) | 30 (22.4%) |
| 30 to 34 Minutes | 16 (9.8%) | 15 (11.2%) |
| 35 to 39 Minutes | 4 (2.4%) | 6 (4.5%) |
| 40 to 44 Minutes | 10 (6.1%) | 10 (7.5%) |
| 45 to 59 Minutes | 24 (14.6%) | 10 (7.5%) |
| 60 to 89 Minutes | 44 (26.8%) | 1 (0.7%) |
| 90 or more Minutes | 8 (4.9%) | 16 (11.9%) |
Time of Departure to Work by Sex in Trout Valley
The most frequent times of departure to work in Trout Valley are 6:00 AM to 6:29 AM (43, 26.2%) for males and 8:00 AM to 8:29 AM (45, 33.6%) for females.
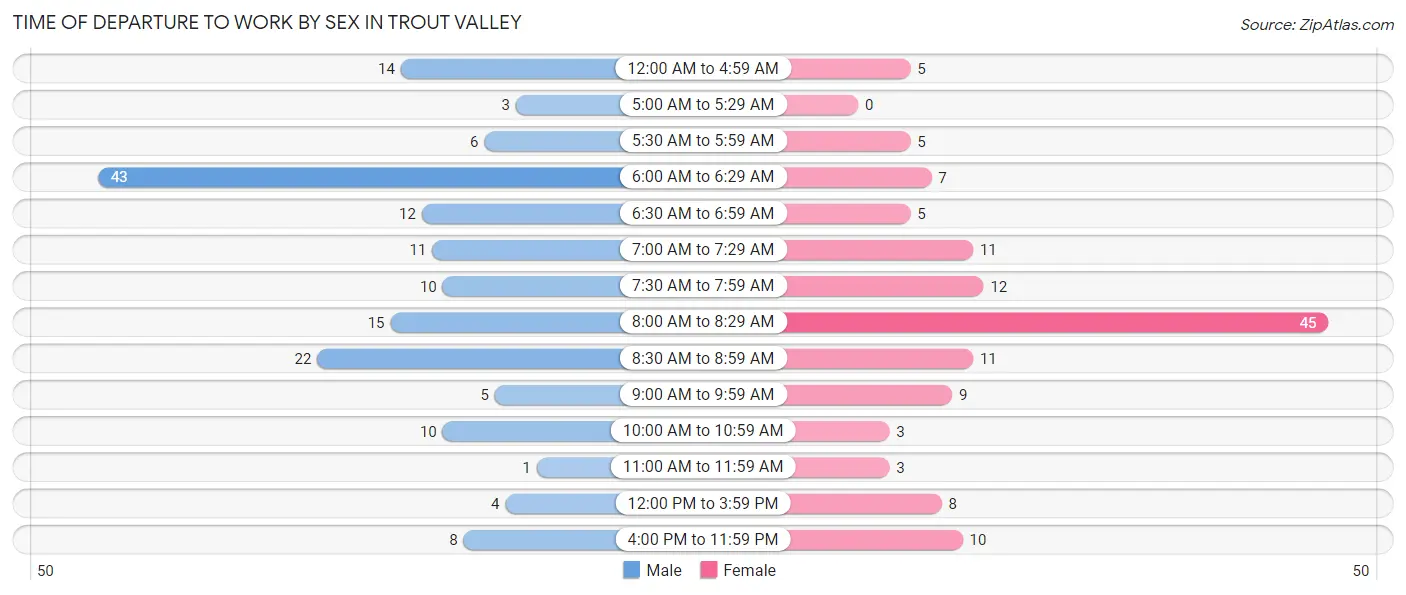
| Time of Departure | Male | Female |
| 12:00 AM to 4:59 AM | 14 (8.5%) | 5 (3.7%) |
| 5:00 AM to 5:29 AM | 3 (1.8%) | 0 (0.0%) |
| 5:30 AM to 5:59 AM | 6 (3.7%) | 5 (3.7%) |
| 6:00 AM to 6:29 AM | 43 (26.2%) | 7 (5.2%) |
| 6:30 AM to 6:59 AM | 12 (7.3%) | 5 (3.7%) |
| 7:00 AM to 7:29 AM | 11 (6.7%) | 11 (8.2%) |
| 7:30 AM to 7:59 AM | 10 (6.1%) | 12 (9.0%) |
| 8:00 AM to 8:29 AM | 15 (9.1%) | 45 (33.6%) |
| 8:30 AM to 8:59 AM | 22 (13.4%) | 11 (8.2%) |
| 9:00 AM to 9:59 AM | 5 (3.0%) | 9 (6.7%) |
| 10:00 AM to 10:59 AM | 10 (6.1%) | 3 (2.2%) |
| 11:00 AM to 11:59 AM | 1 (0.6%) | 3 (2.2%) |
| 12:00 PM to 3:59 PM | 4 (2.4%) | 8 (6.0%) |
| 4:00 PM to 11:59 PM | 8 (4.9%) | 10 (7.5%) |
| Total | 164 (100.0%) | 134 (100.0%) |
Housing Occupancy in Trout Valley
Occupancy by Ownership in Trout Valley
Of the total 235 dwellings in Trout Valley, owner-occupied units account for 233 (99.2%), while renter-occupied units make up 2 (0.9%).
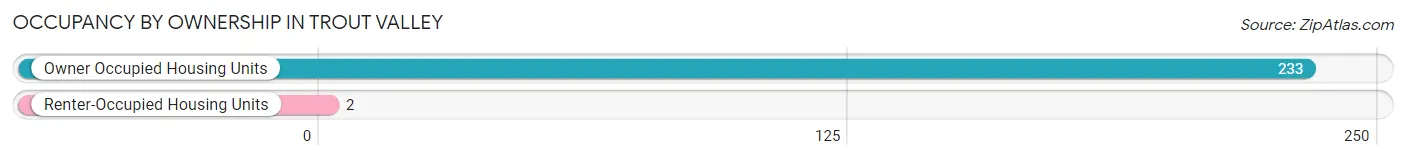
| Occupancy | # Housing Units | % Housing Units |
| Owner Occupied Housing Units | 233 | 99.2% |
| Renter-Occupied Housing Units | 2 | 0.9% |
| Total Occupied Housing Units | 235 | 100.0% |
Occupancy by Household Size in Trout Valley
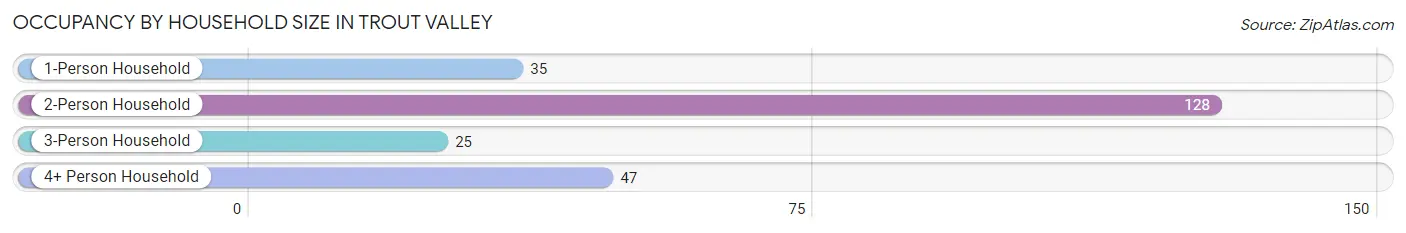
| Household Size | # Housing Units | % Housing Units |
| 1-Person Household | 35 | 14.9% |
| 2-Person Household | 128 | 54.5% |
| 3-Person Household | 25 | 10.6% |
| 4+ Person Household | 47 | 20.0% |
| Total Housing Units | 235 | 100.0% |
Occupancy by Ownership by Household Size in Trout Valley
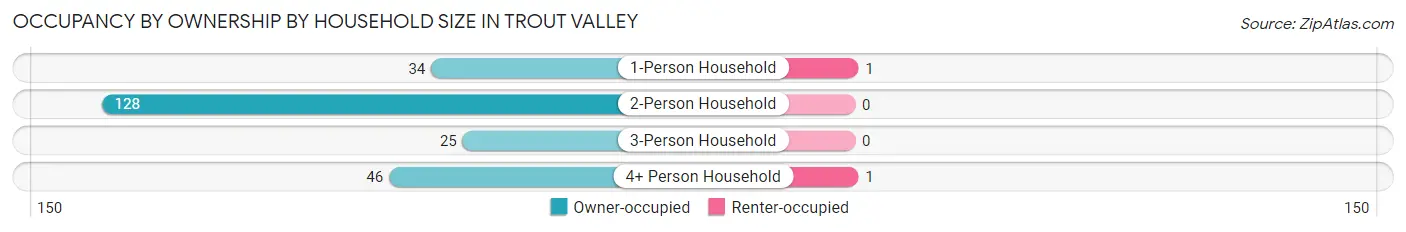
| Household Size | Owner-occupied | Renter-occupied |
| 1-Person Household | 34 (97.1%) | 1 (2.9%) |
| 2-Person Household | 128 (100.0%) | 0 (0.0%) |
| 3-Person Household | 25 (100.0%) | 0 (0.0%) |
| 4+ Person Household | 46 (97.9%) | 1 (2.1%) |
| Total Housing Units | 233 (99.2%) | 2 (0.9%) |
Occupancy by Educational Attainment in Trout Valley
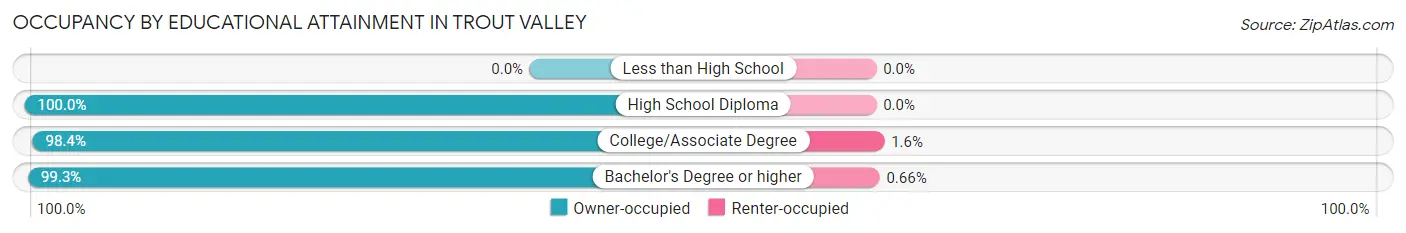
| Household Size | Owner-occupied | Renter-occupied |
| Less than High School | 0 (0.0%) | 0 (0.0%) |
| High School Diploma | 21 (100.0%) | 0 (0.0%) |
| College/Associate Degree | 62 (98.4%) | 1 (1.6%) |
| Bachelor's Degree or higher | 150 (99.3%) | 1 (0.7%) |
Occupancy by Age of Householder in Trout Valley
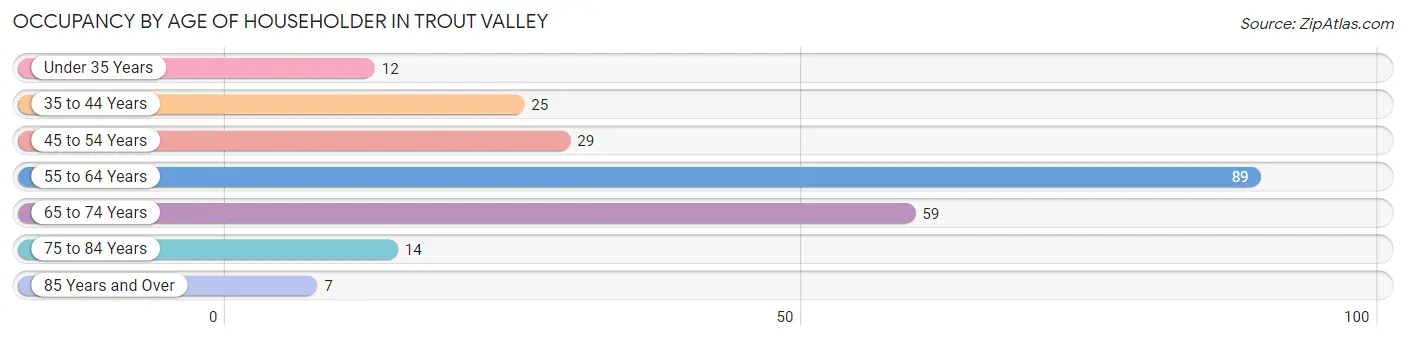
| Age Bracket | # Households | % Households |
| Under 35 Years | 12 | 5.1% |
| 35 to 44 Years | 25 | 10.6% |
| 45 to 54 Years | 29 | 12.3% |
| 55 to 64 Years | 89 | 37.9% |
| 65 to 74 Years | 59 | 25.1% |
| 75 to 84 Years | 14 | 6.0% |
| 85 Years and Over | 7 | 3.0% |
| Total | 235 | 100.0% |
Housing Finances in Trout Valley
Median Income by Occupancy in Trout Valley
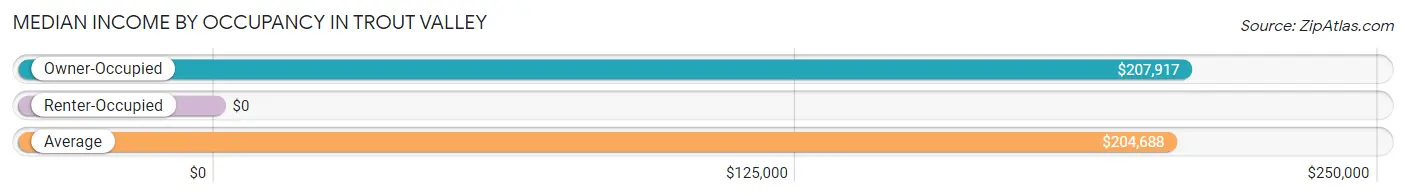
| Occupancy Type | # Households | Median Income |
| Owner-Occupied | 233 (99.2%) | $207,917 |
| Renter-Occupied | 2 (0.9%) | $0 |
| Average | 235 (100.0%) | $204,688 |
Occupancy by Householder Income Bracket in Trout Valley
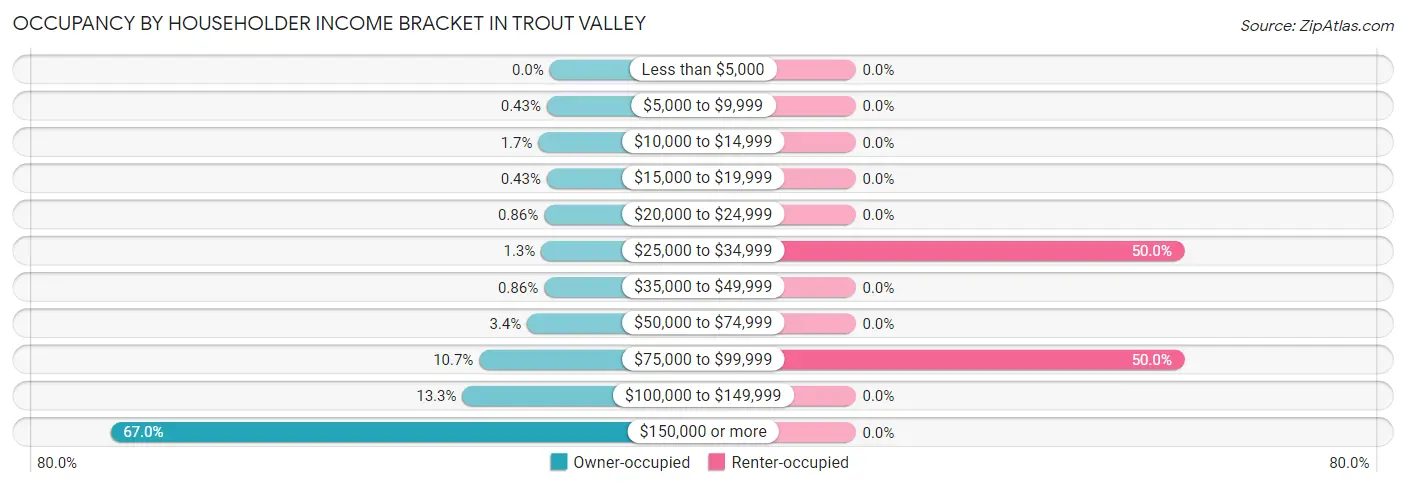
| Income Bracket | Owner-occupied | Renter-occupied |
| Less than $5,000 | 0 (0.0%) | 0 (0.0%) |
| $5,000 to $9,999 | 1 (0.4%) | 0 (0.0%) |
| $10,000 to $14,999 | 4 (1.7%) | 0 (0.0%) |
| $15,000 to $19,999 | 1 (0.4%) | 0 (0.0%) |
| $20,000 to $24,999 | 2 (0.9%) | 0 (0.0%) |
| $25,000 to $34,999 | 3 (1.3%) | 1 (50.0%) |
| $35,000 to $49,999 | 2 (0.9%) | 0 (0.0%) |
| $50,000 to $74,999 | 8 (3.4%) | 0 (0.0%) |
| $75,000 to $99,999 | 25 (10.7%) | 1 (50.0%) |
| $100,000 to $149,999 | 31 (13.3%) | 0 (0.0%) |
| $150,000 or more | 156 (66.9%) | 0 (0.0%) |
| Total | 233 (100.0%) | 2 (100.0%) |
Monthly Housing Cost Tiers in Trout Valley
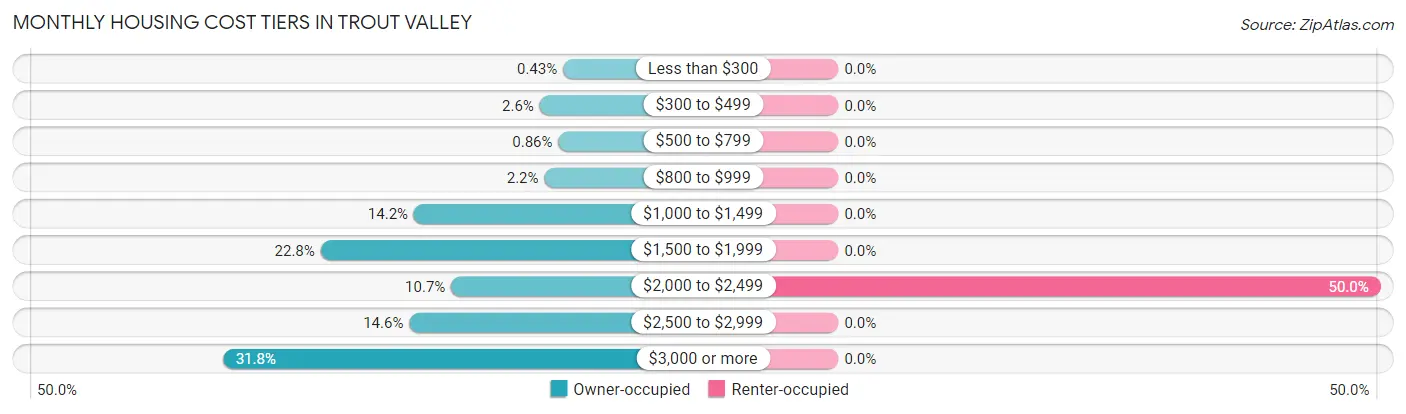
| Monthly Cost | Owner-occupied | Renter-occupied |
| Less than $300 | 1 (0.4%) | 0 (0.0%) |
| $300 to $499 | 6 (2.6%) | 0 (0.0%) |
| $500 to $799 | 2 (0.9%) | 0 (0.0%) |
| $800 to $999 | 5 (2.1%) | 0 (0.0%) |
| $1,000 to $1,499 | 33 (14.2%) | 0 (0.0%) |
| $1,500 to $1,999 | 53 (22.8%) | 0 (0.0%) |
| $2,000 to $2,499 | 25 (10.7%) | 1 (50.0%) |
| $2,500 to $2,999 | 34 (14.6%) | 0 (0.0%) |
| $3,000 or more | 74 (31.8%) | 0 (0.0%) |
| Total | 233 (100.0%) | 2 (100.0%) |
Physical Housing Characteristics in Trout Valley
Housing Structures in Trout Valley
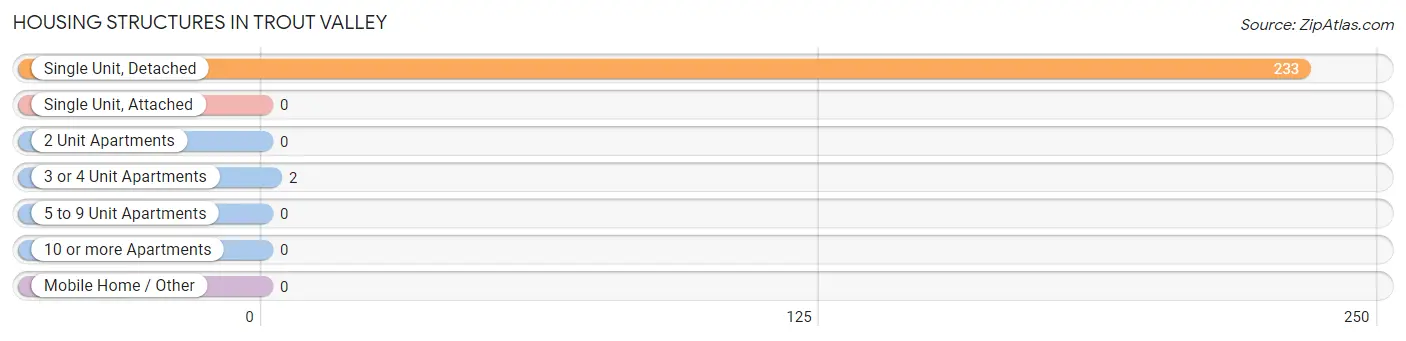
| Structure Type | # Housing Units | % Housing Units |
| Single Unit, Detached | 233 | 99.2% |
| Single Unit, Attached | 0 | 0.0% |
| 2 Unit Apartments | 0 | 0.0% |
| 3 or 4 Unit Apartments | 2 | 0.9% |
| 5 to 9 Unit Apartments | 0 | 0.0% |
| 10 or more Apartments | 0 | 0.0% |
| Mobile Home / Other | 0 | 0.0% |
| Total | 235 | 100.0% |
Housing Structures by Occupancy in Trout Valley
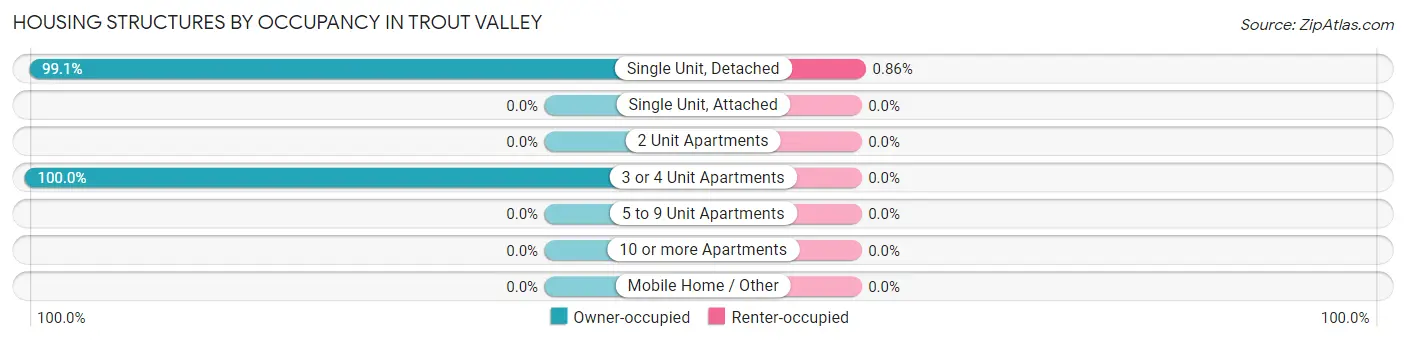
| Structure Type | Owner-occupied | Renter-occupied |
| Single Unit, Detached | 231 (99.1%) | 2 (0.9%) |
| Single Unit, Attached | 0 (0.0%) | 0 (0.0%) |
| 2 Unit Apartments | 0 (0.0%) | 0 (0.0%) |
| 3 or 4 Unit Apartments | 2 (100.0%) | 0 (0.0%) |
| 5 to 9 Unit Apartments | 0 (0.0%) | 0 (0.0%) |
| 10 or more Apartments | 0 (0.0%) | 0 (0.0%) |
| Mobile Home / Other | 0 (0.0%) | 0 (0.0%) |
| Total | 233 (99.2%) | 2 (0.9%) |
Housing Structures by Number of Rooms in Trout Valley
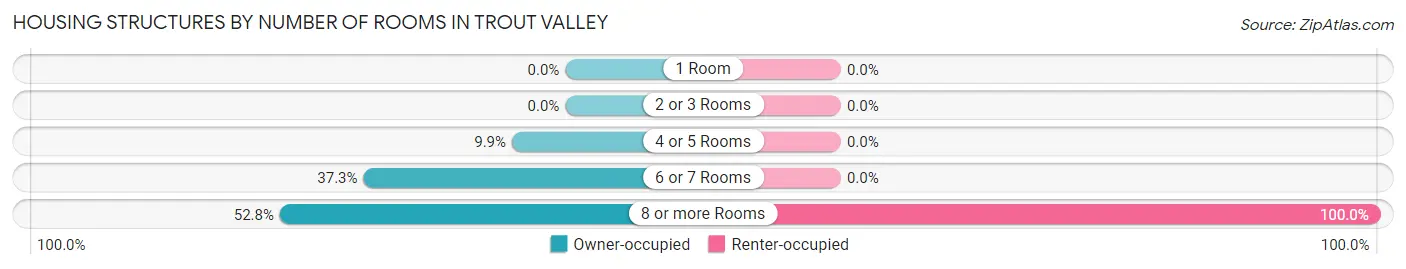
| Number of Rooms | Owner-occupied | Renter-occupied |
| 1 Room | 0 (0.0%) | 0 (0.0%) |
| 2 or 3 Rooms | 0 (0.0%) | 0 (0.0%) |
| 4 or 5 Rooms | 23 (9.9%) | 0 (0.0%) |
| 6 or 7 Rooms | 87 (37.3%) | 0 (0.0%) |
| 8 or more Rooms | 123 (52.8%) | 2 (100.0%) |
| Total | 233 (100.0%) | 2 (100.0%) |
Housing Structure by Heating Type in Trout Valley
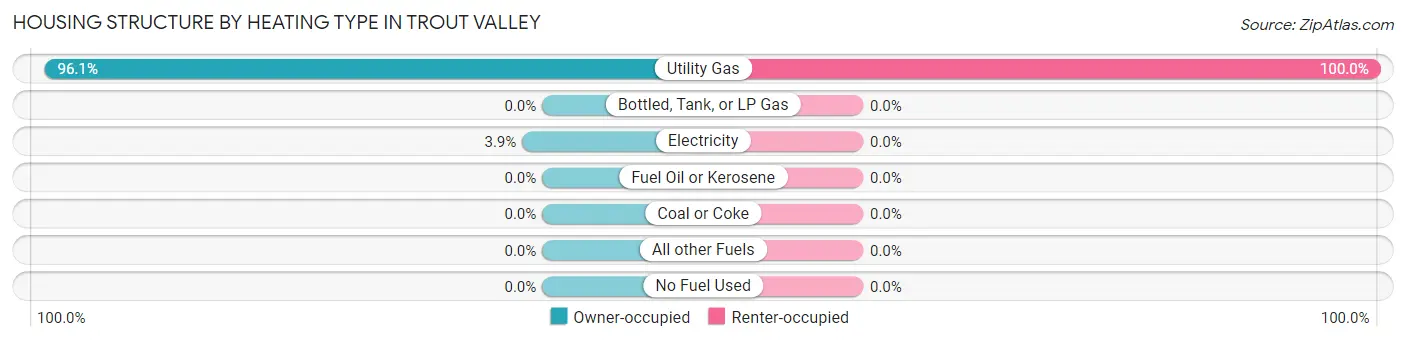
| Heating Type | Owner-occupied | Renter-occupied |
| Utility Gas | 224 (96.1%) | 2 (100.0%) |
| Bottled, Tank, or LP Gas | 0 (0.0%) | 0 (0.0%) |
| Electricity | 9 (3.9%) | 0 (0.0%) |
| Fuel Oil or Kerosene | 0 (0.0%) | 0 (0.0%) |
| Coal or Coke | 0 (0.0%) | 0 (0.0%) |
| All other Fuels | 0 (0.0%) | 0 (0.0%) |
| No Fuel Used | 0 (0.0%) | 0 (0.0%) |
| Total | 233 (100.0%) | 2 (100.0%) |
Household Vehicle Usage in Trout Valley
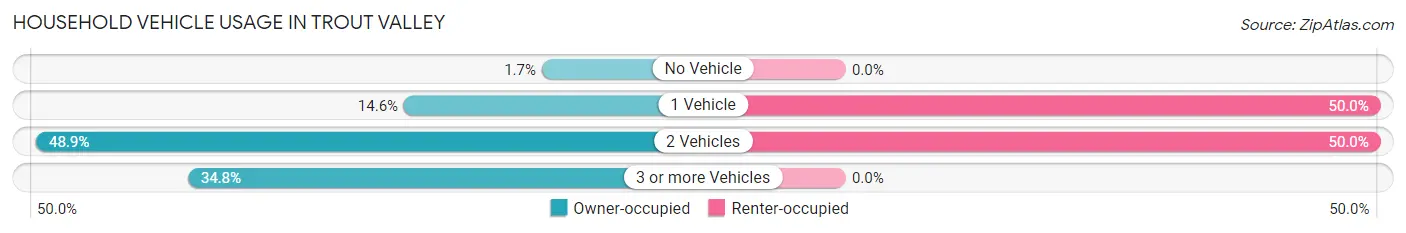
| Vehicles per Household | Owner-occupied | Renter-occupied |
| No Vehicle | 4 (1.7%) | 0 (0.0%) |
| 1 Vehicle | 34 (14.6%) | 1 (50.0%) |
| 2 Vehicles | 114 (48.9%) | 1 (50.0%) |
| 3 or more Vehicles | 81 (34.8%) | 0 (0.0%) |
| Total | 233 (100.0%) | 2 (100.0%) |
Real Estate & Mortgages in Trout Valley
Real Estate and Mortgage Overview in Trout Valley
| Characteristic | Without Mortgage | With Mortgage |
| Housing Units | 93 | 140 |
| Median Property Value | $391,900 | $416,000 |
| Median Household Income | $215,134 | $91 |
| Monthly Housing Costs | $1,501 | $74 |
| Real Estate Taxes | $10,001 | $0 |
Property Value by Mortgage Status in Trout Valley
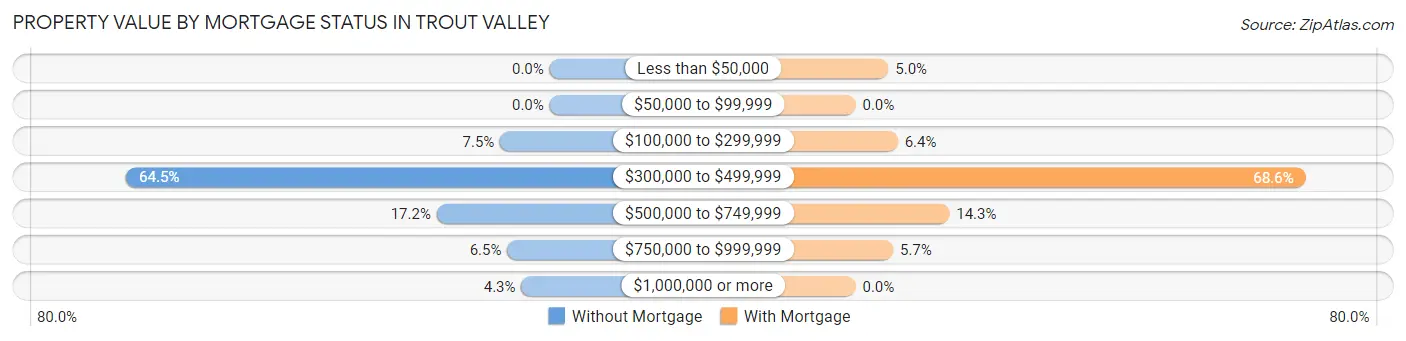
| Property Value | Without Mortgage | With Mortgage |
| Less than $50,000 | 0 (0.0%) | 7 (5.0%) |
| $50,000 to $99,999 | 0 (0.0%) | 0 (0.0%) |
| $100,000 to $299,999 | 7 (7.5%) | 9 (6.4%) |
| $300,000 to $499,999 | 60 (64.5%) | 96 (68.6%) |
| $500,000 to $749,999 | 16 (17.2%) | 20 (14.3%) |
| $750,000 to $999,999 | 6 (6.5%) | 8 (5.7%) |
| $1,000,000 or more | 4 (4.3%) | 0 (0.0%) |
| Total | 93 (100.0%) | 140 (100.0%) |
Household Income by Mortgage Status in Trout Valley
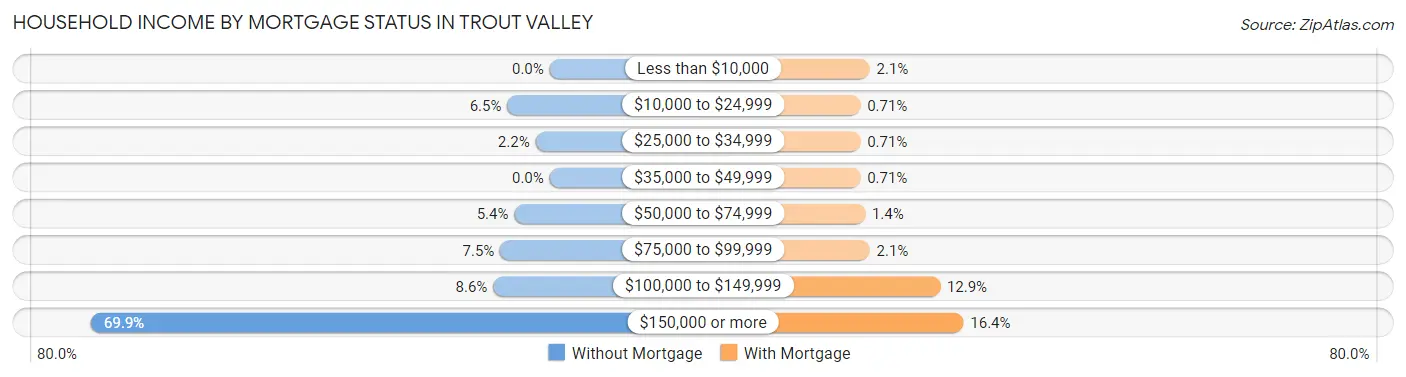
| Household Income | Without Mortgage | With Mortgage |
| Less than $10,000 | 0 (0.0%) | 3 (2.1%) |
| $10,000 to $24,999 | 6 (6.5%) | 1 (0.7%) |
| $25,000 to $34,999 | 2 (2.1%) | 1 (0.7%) |
| $35,000 to $49,999 | 0 (0.0%) | 1 (0.7%) |
| $50,000 to $74,999 | 5 (5.4%) | 2 (1.4%) |
| $75,000 to $99,999 | 7 (7.5%) | 3 (2.1%) |
| $100,000 to $149,999 | 8 (8.6%) | 18 (12.9%) |
| $150,000 or more | 65 (69.9%) | 23 (16.4%) |
| Total | 93 (100.0%) | 140 (100.0%) |
Property Value to Household Income Ratio in Trout Valley
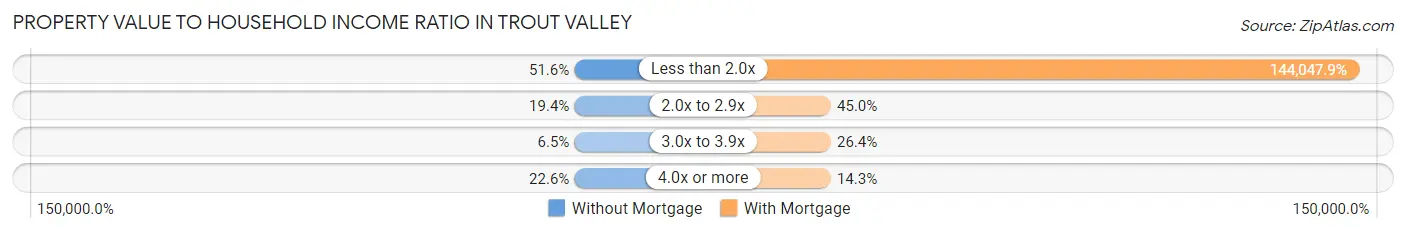
| Value-to-Income Ratio | Without Mortgage | With Mortgage |
| Less than 2.0x | 48 (51.6%) | 201,667 (144,047.9%) |
| 2.0x to 2.9x | 18 (19.4%) | 63 (45.0%) |
| 3.0x to 3.9x | 6 (6.5%) | 37 (26.4%) |
| 4.0x or more | 21 (22.6%) | 20 (14.3%) |
| Total | 93 (100.0%) | 140 (100.0%) |
Real Estate Taxes by Mortgage Status in Trout Valley
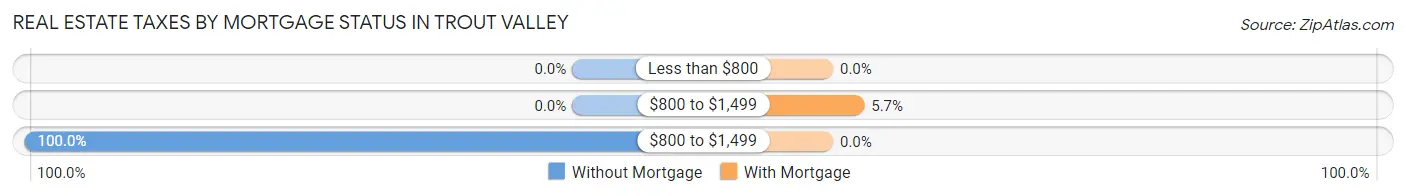
| Property Taxes | Without Mortgage | With Mortgage |
| Less than $800 | 0 (0.0%) | 0 (0.0%) |
| $800 to $1,499 | 0 (0.0%) | 8 (5.7%) |
| $800 to $1,499 | 93 (100.0%) | 0 (0.0%) |
| Total | 93 (100.0%) | 140 (100.0%) |
Health & Disability in Trout Valley
Health Insurance Coverage by Age in Trout Valley
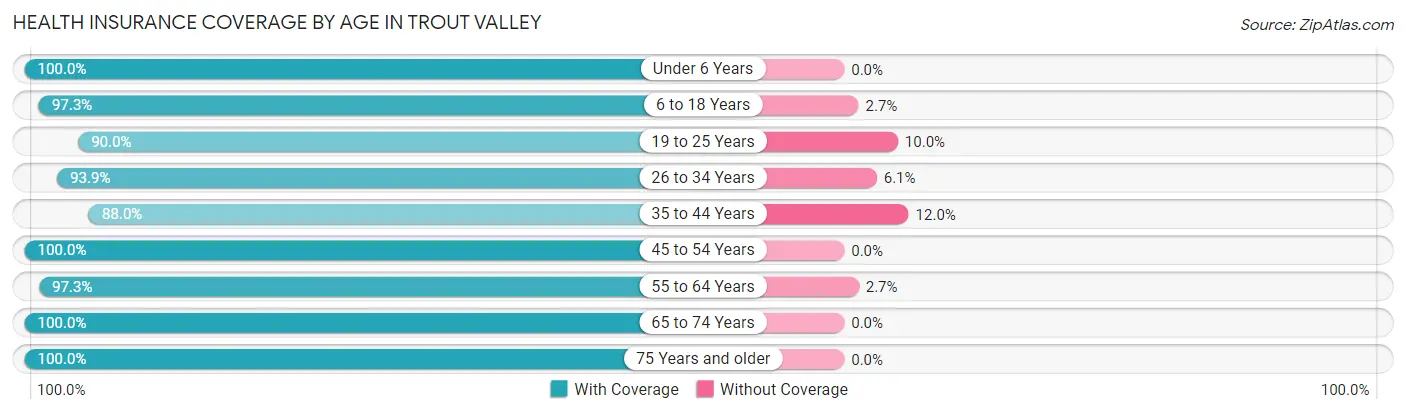
| Age Bracket | With Coverage | Without Coverage |
| Under 6 Years | 44 (100.0%) | 0 (0.0%) |
| 6 to 18 Years | 73 (97.3%) | 2 (2.7%) |
| 19 to 25 Years | 27 (90.0%) | 3 (10.0%) |
| 26 to 34 Years | 31 (93.9%) | 2 (6.1%) |
| 35 to 44 Years | 44 (88.0%) | 6 (12.0%) |
| 45 to 54 Years | 54 (100.0%) | 0 (0.0%) |
| 55 to 64 Years | 180 (97.3%) | 5 (2.7%) |
| 65 to 74 Years | 89 (100.0%) | 0 (0.0%) |
| 75 Years and older | 33 (100.0%) | 0 (0.0%) |
| Total | 575 (97.0%) | 18 (3.0%) |
Health Insurance Coverage by Citizenship Status in Trout Valley
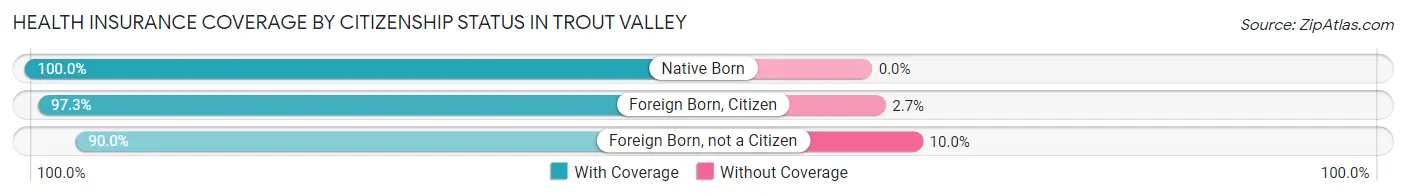
| Citizenship Status | With Coverage | Without Coverage |
| Native Born | 44 (100.0%) | 0 (0.0%) |
| Foreign Born, Citizen | 73 (97.3%) | 2 (2.7%) |
| Foreign Born, not a Citizen | 27 (90.0%) | 3 (10.0%) |
Health Insurance Coverage by Household Income in Trout Valley
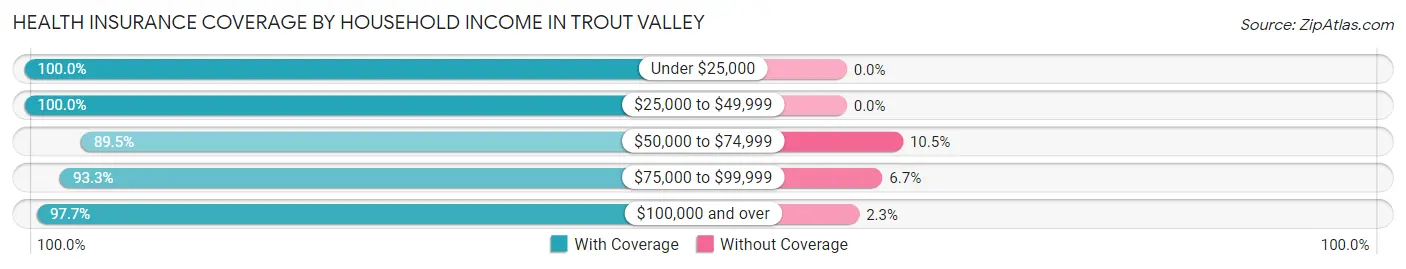
| Household Income | With Coverage | Without Coverage |
| Under $25,000 | 17 (100.0%) | 0 (0.0%) |
| $25,000 to $49,999 | 7 (100.0%) | 0 (0.0%) |
| $50,000 to $74,999 | 17 (89.5%) | 2 (10.5%) |
| $75,000 to $99,999 | 70 (93.3%) | 5 (6.7%) |
| $100,000 and over | 464 (97.7%) | 11 (2.3%) |
Public vs Private Health Insurance Coverage by Age in Trout Valley
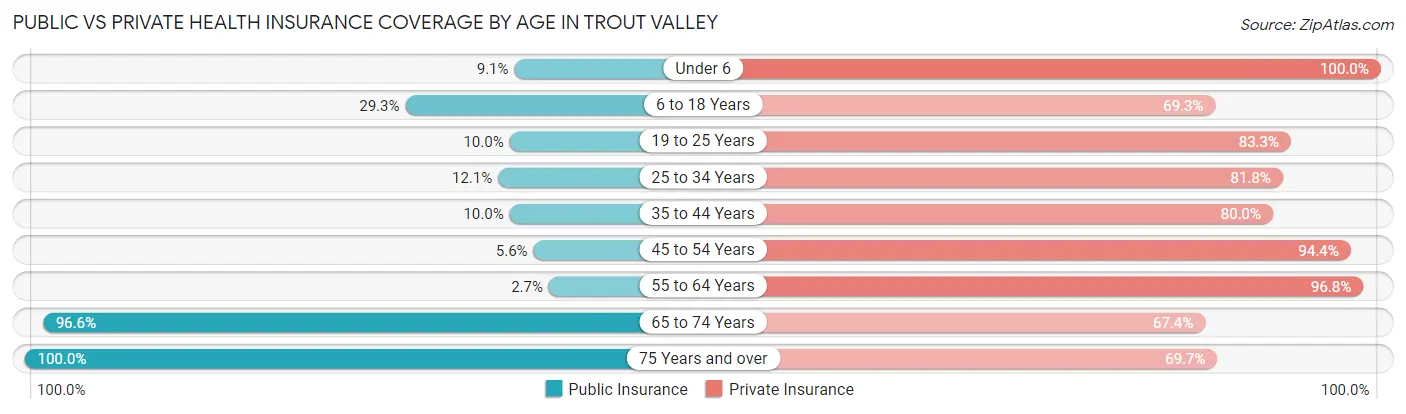
| Age Bracket | Public Insurance | Private Insurance |
| Under 6 | 4 (9.1%) | 44 (100.0%) |
| 6 to 18 Years | 22 (29.3%) | 52 (69.3%) |
| 19 to 25 Years | 3 (10.0%) | 25 (83.3%) |
| 25 to 34 Years | 4 (12.1%) | 27 (81.8%) |
| 35 to 44 Years | 5 (10.0%) | 40 (80.0%) |
| 45 to 54 Years | 3 (5.6%) | 51 (94.4%) |
| 55 to 64 Years | 5 (2.7%) | 179 (96.8%) |
| 65 to 74 Years | 86 (96.6%) | 60 (67.4%) |
| 75 Years and over | 33 (100.0%) | 23 (69.7%) |
| Total | 165 (27.8%) | 501 (84.5%) |
Disability Status by Sex by Age in Trout Valley
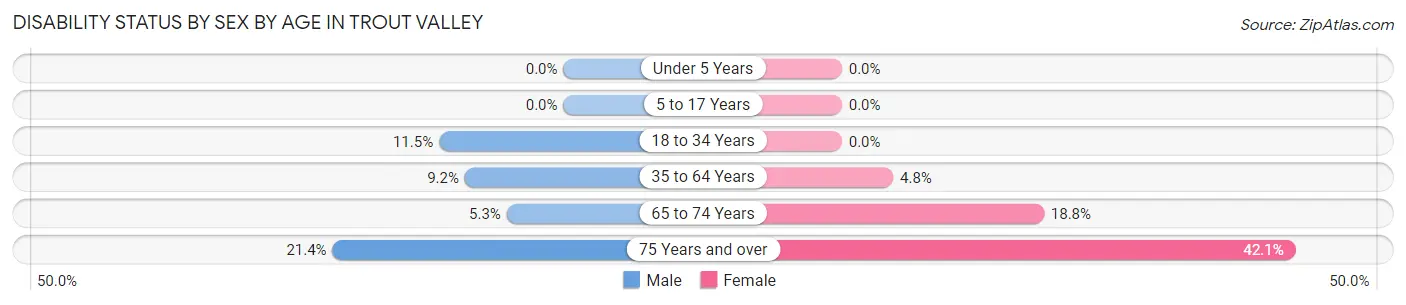
| Age Bracket | Male | Female |
| Under 5 Years | 0 (0.0%) | 0 (0.0%) |
| 5 to 17 Years | 0 (0.0%) | 0 (0.0%) |
| 18 to 34 Years | 3 (11.5%) | 0 (0.0%) |
| 35 to 64 Years | 13 (9.1%) | 7 (4.8%) |
| 65 to 74 Years | 3 (5.3%) | 6 (18.8%) |
| 75 Years and over | 3 (21.4%) | 8 (42.1%) |
Disability Class by Sex by Age in Trout Valley
Disability Class: Hearing Difficulty
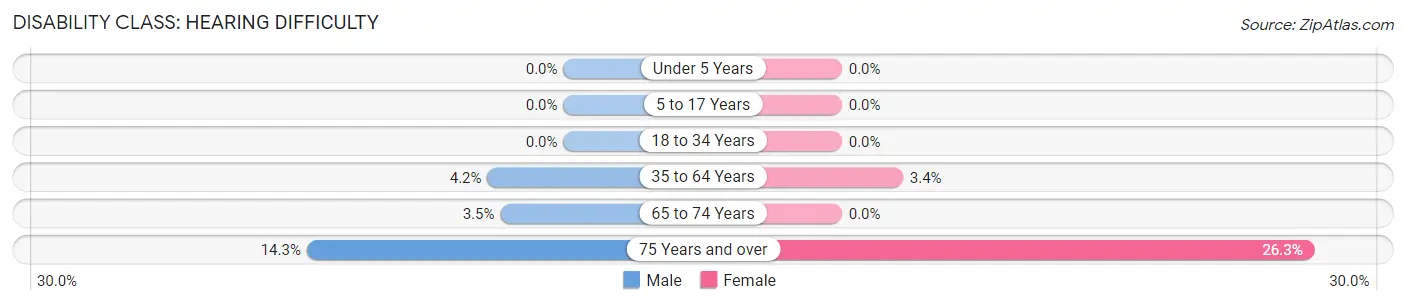
| Age Bracket | Male | Female |
| Under 5 Years | 0 (0.0%) | 0 (0.0%) |
| 5 to 17 Years | 0 (0.0%) | 0 (0.0%) |
| 18 to 34 Years | 0 (0.0%) | 0 (0.0%) |
| 35 to 64 Years | 6 (4.2%) | 5 (3.4%) |
| 65 to 74 Years | 2 (3.5%) | 0 (0.0%) |
| 75 Years and over | 2 (14.3%) | 5 (26.3%) |
Disability Class: Vision Difficulty
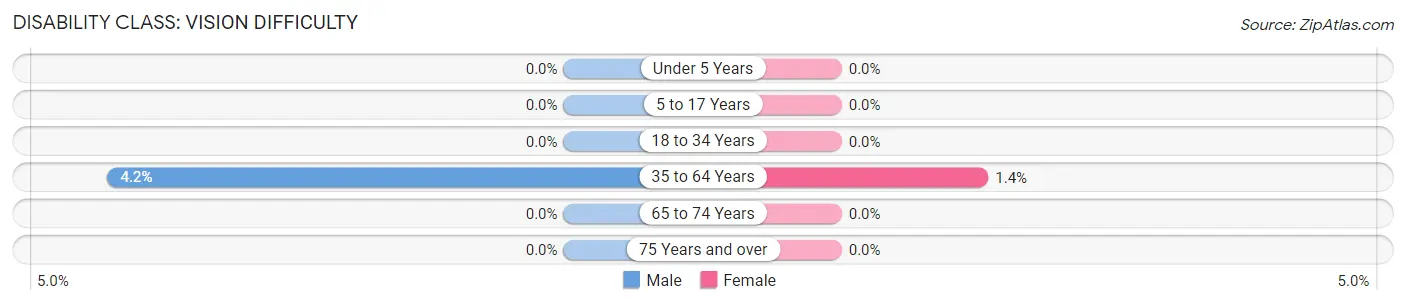
| Age Bracket | Male | Female |
| Under 5 Years | 0 (0.0%) | 0 (0.0%) |
| 5 to 17 Years | 0 (0.0%) | 0 (0.0%) |
| 18 to 34 Years | 0 (0.0%) | 0 (0.0%) |
| 35 to 64 Years | 6 (4.2%) | 2 (1.4%) |
| 65 to 74 Years | 0 (0.0%) | 0 (0.0%) |
| 75 Years and over | 0 (0.0%) | 0 (0.0%) |
Disability Class: Cognitive Difficulty
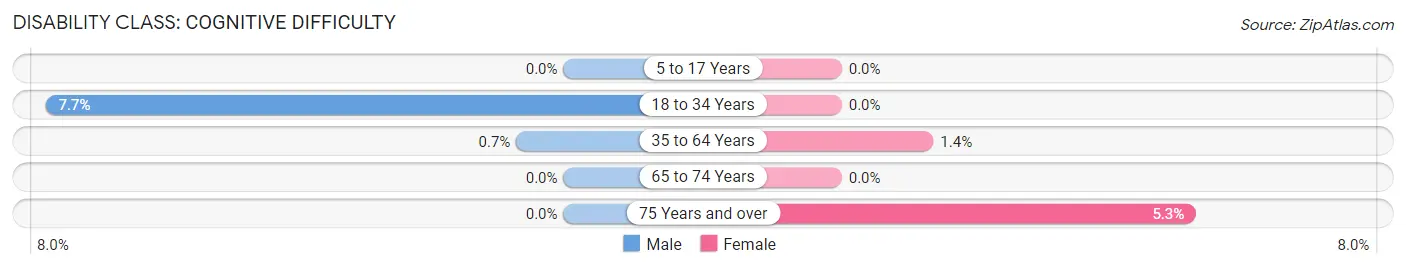
| Age Bracket | Male | Female |
| 5 to 17 Years | 0 (0.0%) | 0 (0.0%) |
| 18 to 34 Years | 2 (7.7%) | 0 (0.0%) |
| 35 to 64 Years | 1 (0.7%) | 2 (1.4%) |
| 65 to 74 Years | 0 (0.0%) | 0 (0.0%) |
| 75 Years and over | 0 (0.0%) | 1 (5.3%) |
Disability Class: Ambulatory Difficulty
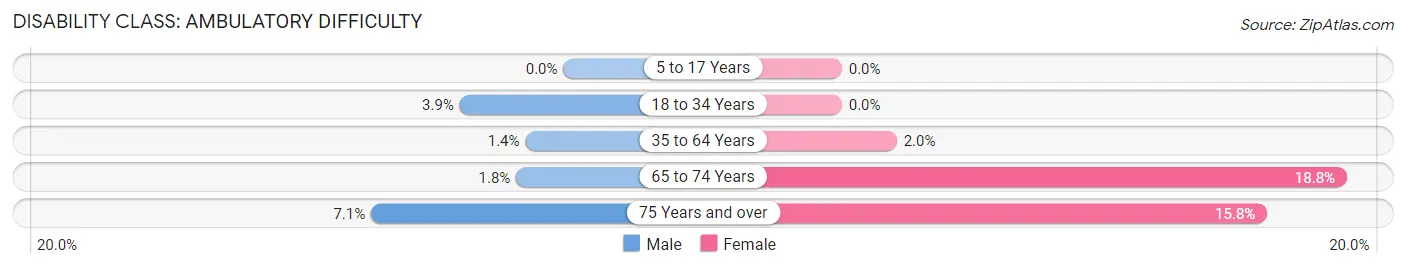
| Age Bracket | Male | Female |
| 5 to 17 Years | 0 (0.0%) | 0 (0.0%) |
| 18 to 34 Years | 1 (3.8%) | 0 (0.0%) |
| 35 to 64 Years | 2 (1.4%) | 3 (2.0%) |
| 65 to 74 Years | 1 (1.8%) | 6 (18.8%) |
| 75 Years and over | 1 (7.1%) | 3 (15.8%) |
Disability Class: Self-Care Difficulty
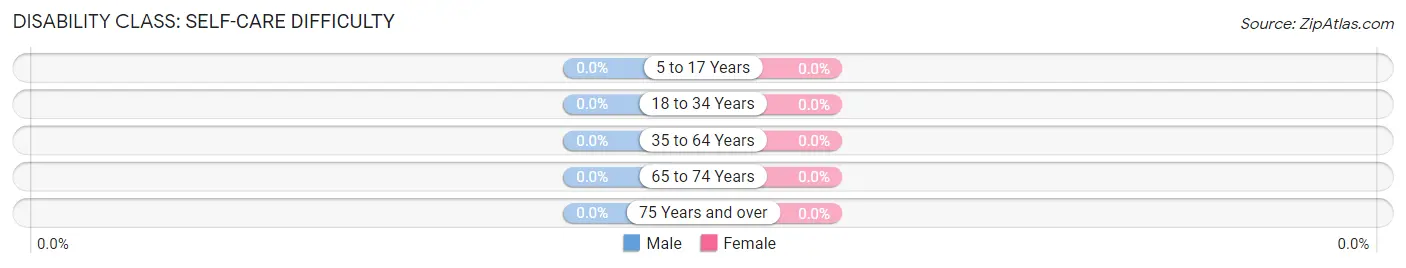
| Age Bracket | Male | Female |
| 5 to 17 Years | 0 (0.0%) | 0 (0.0%) |
| 18 to 34 Years | 0 (0.0%) | 0 (0.0%) |
| 35 to 64 Years | 0 (0.0%) | 0 (0.0%) |
| 65 to 74 Years | 0 (0.0%) | 0 (0.0%) |
| 75 Years and over | 0 (0.0%) | 0 (0.0%) |
Technology Access in Trout Valley
Computing Device Access in Trout Valley
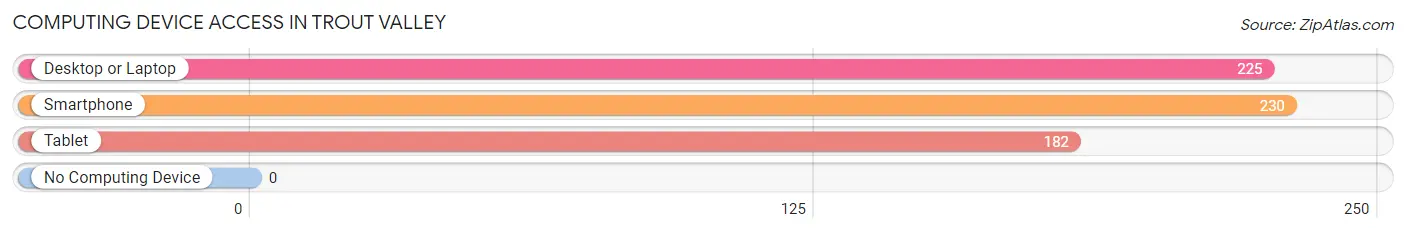
| Device Type | # Households | % Households |
| Desktop or Laptop | 225 | 95.7% |
| Smartphone | 230 | 97.9% |
| Tablet | 182 | 77.4% |
| No Computing Device | 0 | 0.0% |
| Total | 235 | 100.0% |
Internet Access in Trout Valley
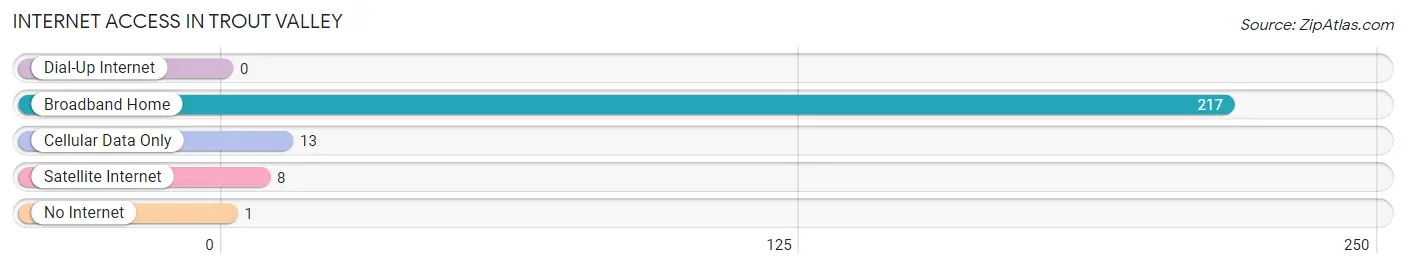
| Internet Type | # Households | % Households |
| Dial-Up Internet | 0 | 0.0% |
| Broadband Home | 217 | 92.3% |
| Cellular Data Only | 13 | 5.5% |
| Satellite Internet | 8 | 3.4% |
| No Internet | 1 | 0.4% |
| Total | 235 | 100.0% |
Trout Valley Summary
Trout Valley is a small village located in McHenry County, Illinois, United States. The village is situated on the banks of the Fox River, approximately 40 miles northwest of Chicago. The population of Trout Valley was 1,093 at the 2010 census.
History
Trout Valley was first settled in the early 1800s by a group of settlers from New York. The village was originally known as “Trout Creek” and was named after the abundance of trout in the nearby Fox River. The village was officially incorporated in 1872.
In the late 1800s, Trout Valley was a popular destination for wealthy Chicagoans looking to escape the hustle and bustle of the city. The village was home to several large estates, including the estate of the late Chicago mayor, Carter Harrison.
In the early 1900s, Trout Valley was a popular destination for vacationers. The village was home to several resorts, including the Trout Valley Inn, which was built in 1910. The inn was a popular destination for fishing and hunting trips.
In the 1950s, Trout Valley began to experience a decline in population as many of the wealthy Chicagoans moved away. The village was also affected by the construction of the Fox River Dam, which caused the river to become stagnant and polluted.
Geography
Trout Valley is located at 42°14'25" North, 88°20'45" West (42.240278, -88.345833). The village is situated on the banks of the Fox River, approximately 40 miles northwest of Chicago.
The village has a total area of 0.9 square miles, all of which is land. The village is located in a rural area and is surrounded by farmland.
Economy
Trout Valley’s economy is largely based on agriculture and tourism. The village is home to several farms, which produce a variety of crops, including corn, soybeans, and wheat.
The village is also home to several small businesses, including restaurants, shops, and a bed and breakfast. The village is a popular destination for fishing and hunting trips, and is home to several resorts and lodges.
Demographics
As of the 2010 census, the population of Trout Valley was 1,093. The racial makeup of the village was 97.3% White, 0.7% African American, 0.2% Native American, 0.2% Asian, 0.2% from other races, and 1.6% from two or more races. Hispanic or Latino of any race were 1.2% of the population.
The median income for a household in Trout Valley was $60,000, and the median income for a family was $68,750. The per capita income for the village was $25,945. About 4.2% of families and 5.2% of the population were below the poverty line, including 6.3% of those under age 18 and 4.2% of those age 65 or over.
Common Questions
What is Per Capita Income in Trout Valley?
Per Capita income in Trout Valley is $93,068.
What is the Median Family Income in Trout Valley?
Median Family Income in Trout Valley is $204,000.
What is the Median Household income in Trout Valley?
Median Household Income in Trout Valley is $204,688.
What is Income or Wage Gap in Trout Valley?
Income or Wage Gap in Trout Valley is 58.8%.
Women in Trout Valley earn 41.2 cents for every dollar earned by a man.
What is Inequality or Gini Index in Trout Valley?
Inequality or Gini Index in Trout Valley is 0.36.
What is the Total Population of Trout Valley?
Total Population of Trout Valley is 593.
What is the Total Male Population of Trout Valley?
Total Male Population of Trout Valley is 283.
What is the Total Female Population of Trout Valley?
Total Female Population of Trout Valley is 310.
What is the Ratio of Males per 100 Females in Trout Valley?
There are 91.29 Males per 100 Females in Trout Valley.
What is the Ratio of Females per 100 Males in Trout Valley?
There are 109.54 Females per 100 Males in Trout Valley.
What is the Median Population Age in Trout Valley?
Median Population Age in Trout Valley is 55.7 Years.
What is the Average Family Size in Trout Valley
Average Family Size in Trout Valley is 2.9 People.
What is the Average Household Size in Trout Valley
Average Household Size in Trout Valley is 2.5 People.
How Large is the Labor Force in Trout Valley?
There are 358 People in the Labor Forcein in Trout Valley.
What is the Percentage of People in the Labor Force in Trout Valley?
70.1% of People are in the Labor Force in Trout Valley.
What is the Unemployment Rate in Trout Valley?
Unemployment Rate in Trout Valley is 2.0%.