Wood Dale, IL Map & Demographics
Wood Dale Map
Wood Dale Overview
$39,094
PER CAPITA INCOME
$97,446
AVG FAMILY INCOME
$86,441
AVG HOUSEHOLD INCOME
24.6%
WAGE / INCOME GAP [ % ]
75.4¢/ $1
WAGE / INCOME GAP [ $ ]
$7,651
FAMILY INCOME DEFICIT
0.39
INEQUALITY / GINI INDEX
13,903
TOTAL POPULATION
7,062
MALE POPULATION
6,841
FEMALE POPULATION
103.23
MALES / 100 FEMALES
96.87
FEMALES / 100 MALES
41.8
MEDIAN AGE
3.2
AVG FAMILY SIZE
2.7
AVG HOUSEHOLD SIZE
8,083
LABOR FORCE [ PEOPLE ]
70.0%
PERCENT IN LABOR FORCE
4.6%
UNEMPLOYMENT RATE
Wood Dale Zip Codes
Income in Wood Dale
Income Overview in Wood Dale
Per Capita Income in Wood Dale is $39,094, while median incomes of families and households are $97,446 and $86,441 respectively.
| Characteristic | Number | Measure |
| Per Capita Income | 13,903 | $39,094 |
| Median Family Income | 3,871 | $97,446 |
| Mean Family Income | 3,871 | $116,330 |
| Median Household Income | 5,113 | $86,441 |
| Mean Household Income | 5,113 | $104,821 |
| Income Deficit | 3,871 | $7,651 |
| Wage / Income Gap (%) | 13,903 | 24.63% |
| Wage / Income Gap ($) | 13,903 | 75.37¢ per $1 |
| Gini / Inequality Index | 13,903 | 0.39 |
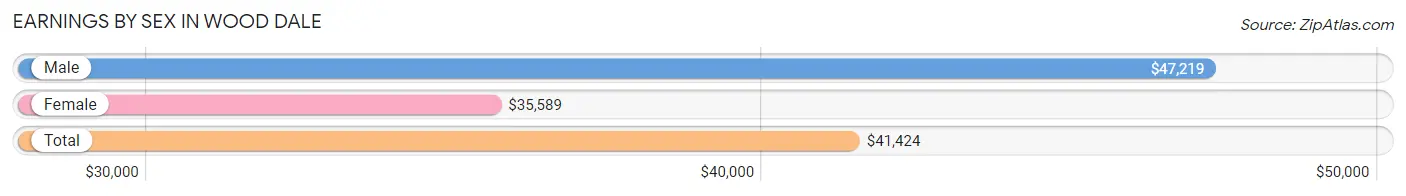
Earnings by Sex in Wood Dale
Average Earnings in Wood Dale are $41,424, $47,219 for men and $35,589 for women, a difference of 24.6%.
| Sex | Number | Average Earnings |
| Male | 4,302 (52.1%) | $47,219 |
| Female | 3,959 (47.9%) | $35,589 |
| Total | 8,261 (100.0%) | $41,424 |
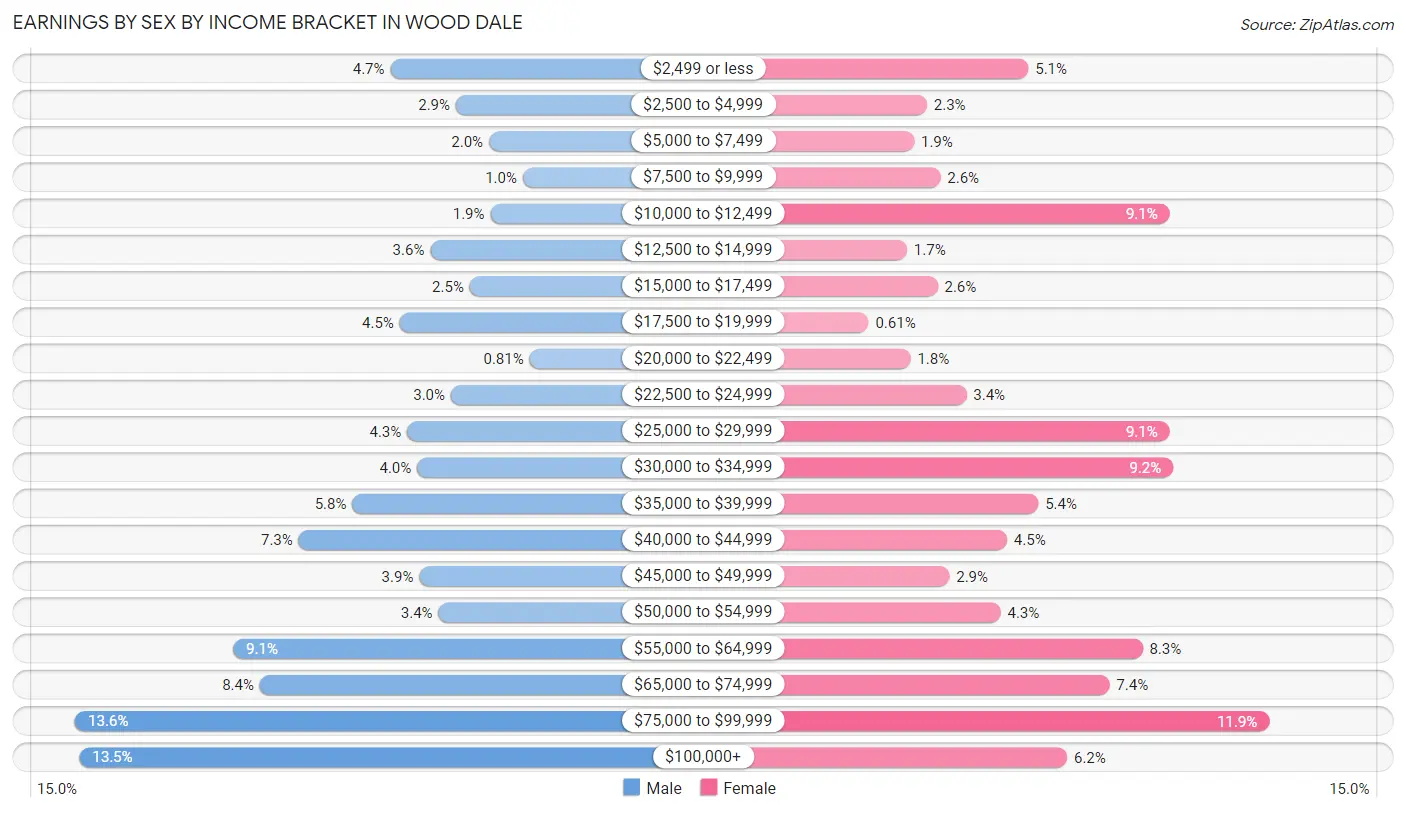
Earnings by Sex by Income Bracket in Wood Dale
The most common earnings brackets in Wood Dale are $75,000 to $99,999 for men (584 | 13.6%) and $75,000 to $99,999 for women (470 | 11.9%).
| Income | Male | Female |
| $2,499 or less | 203 (4.7%) | 202 (5.1%) |
| $2,500 to $4,999 | 124 (2.9%) | 89 (2.2%) |
| $5,000 to $7,499 | 84 (1.9%) | 75 (1.9%) |
| $7,500 to $9,999 | 43 (1.0%) | 104 (2.6%) |
| $10,000 to $12,499 | 82 (1.9%) | 359 (9.1%) |
| $12,500 to $14,999 | 155 (3.6%) | 67 (1.7%) |
| $15,000 to $17,499 | 107 (2.5%) | 101 (2.5%) |
| $17,500 to $19,999 | 192 (4.5%) | 24 (0.6%) |
| $20,000 to $22,499 | 35 (0.8%) | 71 (1.8%) |
| $22,500 to $24,999 | 130 (3.0%) | 133 (3.4%) |
| $25,000 to $29,999 | 183 (4.3%) | 359 (9.1%) |
| $30,000 to $34,999 | 171 (4.0%) | 363 (9.2%) |
| $35,000 to $39,999 | 249 (5.8%) | 213 (5.4%) |
| $40,000 to $44,999 | 314 (7.3%) | 178 (4.5%) |
| $45,000 to $49,999 | 168 (3.9%) | 114 (2.9%) |
| $50,000 to $54,999 | 145 (3.4%) | 171 (4.3%) |
| $55,000 to $64,999 | 393 (9.1%) | 329 (8.3%) |
| $65,000 to $74,999 | 361 (8.4%) | 292 (7.4%) |
| $75,000 to $99,999 | 584 (13.6%) | 470 (11.9%) |
| $100,000+ | 579 (13.5%) | 245 (6.2%) |
| Total | 4,302 (100.0%) | 3,959 (100.0%) |
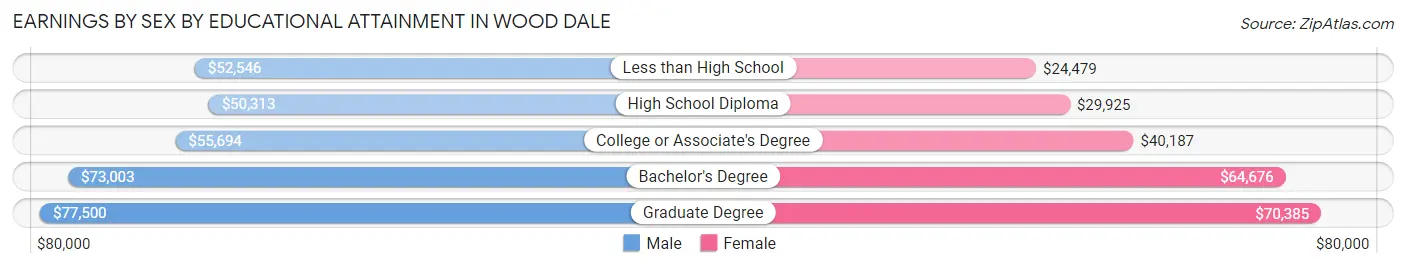
Earnings by Sex by Educational Attainment in Wood Dale
Average earnings in Wood Dale are $56,027 for men and $41,752 for women, a difference of 25.5%. Men with an educational attainment of graduate degree enjoy the highest average annual earnings of $77,500, while those with high school diploma education earn the least with $50,313. Women with an educational attainment of graduate degree earn the most with the average annual earnings of $70,385, while those with less than high school education have the smallest earnings of $24,479.
| Educational Attainment | Male Income | Female Income |
| Less than High School | $52,546 | $24,479 |
| High School Diploma | $50,313 | $29,925 |
| College or Associate's Degree | $55,694 | $40,187 |
| Bachelor's Degree | $73,003 | $64,676 |
| Graduate Degree | $77,500 | $70,385 |
| Total | $56,027 | $41,752 |
Family Income in Wood Dale
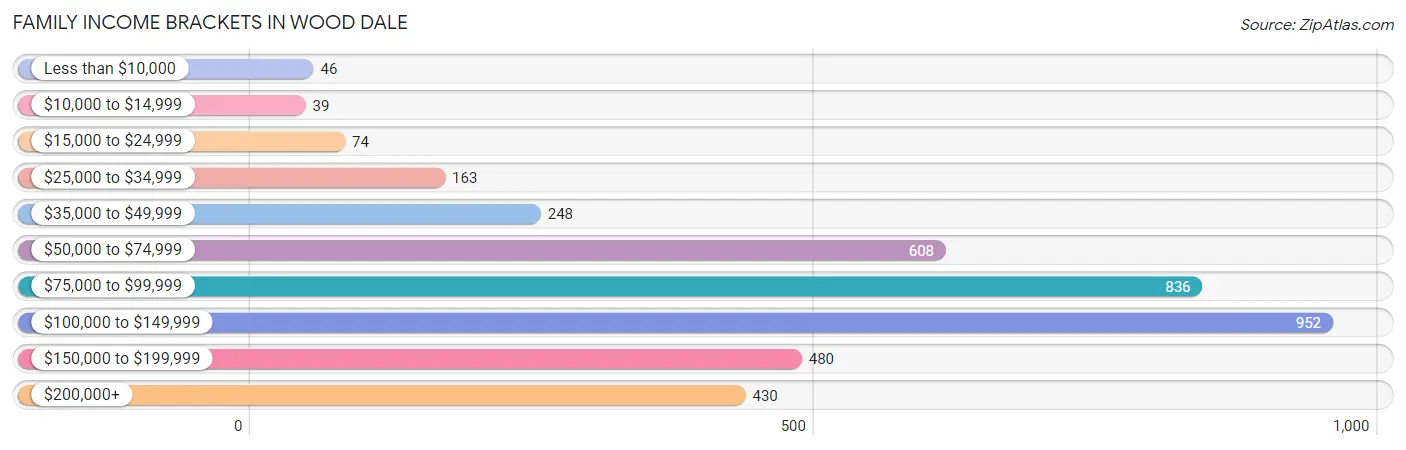
Family Income Brackets in Wood Dale
According to the Wood Dale family income data, there are 952 families falling into the $100,000 to $149,999 income range, which is the most common income bracket and makes up 24.6% of all families. Conversely, the $10,000 to $14,999 income bracket is the least frequent group with only 39 families (1.0%) belonging to this category.
| Income Bracket | # Families | % Families |
| Less than $10,000 | 46 | 1.2% |
| $10,000 to $14,999 | 39 | 1.0% |
| $15,000 to $24,999 | 74 | 1.9% |
| $25,000 to $34,999 | 163 | 4.2% |
| $35,000 to $49,999 | 248 | 6.4% |
| $50,000 to $74,999 | 608 | 15.7% |
| $75,000 to $99,999 | 836 | 21.6% |
| $100,000 to $149,999 | 952 | 24.6% |
| $150,000 to $199,999 | 480 | 12.4% |
| $200,000+ | 430 | 11.1% |
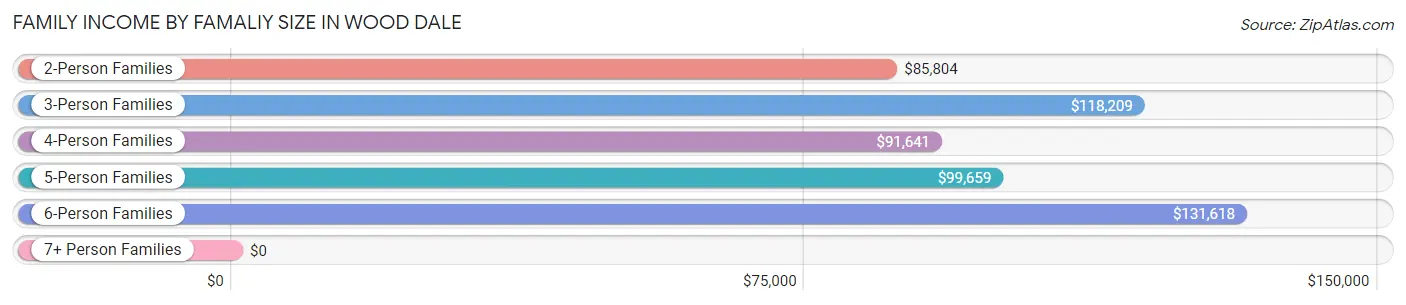
Family Income by Famaliy Size in Wood Dale
6-person families (110 | 2.8%) account for the highest median family income in Wood Dale with $131,618 per family, while 2-person families (1,771 | 45.8%) have the highest median income of $42,902 per family member.
| Income Bracket | # Families | Median Income |
| 2-Person Families | 1,771 (45.8%) | $85,804 |
| 3-Person Families | 771 (19.9%) | $118,209 |
| 4-Person Families | 739 (19.1%) | $91,641 |
| 5-Person Families | 440 (11.4%) | $99,659 |
| 6-Person Families | 110 (2.8%) | $131,618 |
| 7+ Person Families | 40 (1.0%) | $0 |
| Total | 3,871 (100.0%) | $97,446 |
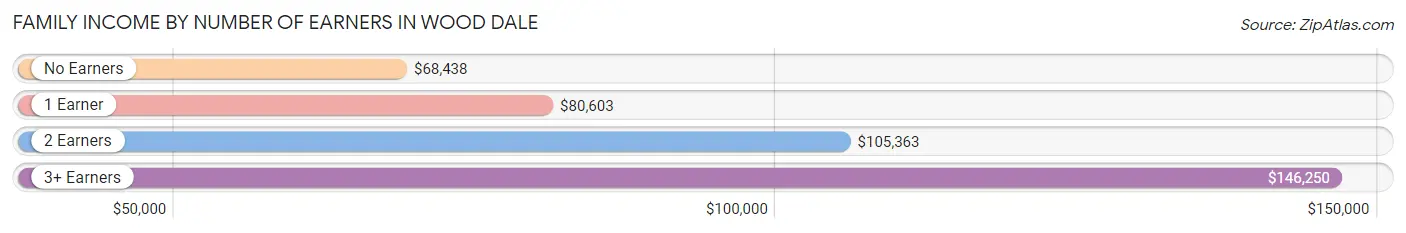
Family Income by Number of Earners in Wood Dale
The median family income in Wood Dale is $97,446, with families comprising 3+ earners (766) having the highest median family income of $146,250, while families with no earners (364) have the lowest median family income of $68,438, accounting for 19.8% and 9.4% of families, respectively.
| Number of Earners | # Families | Median Income |
| No Earners | 364 (9.4%) | $68,438 |
| 1 Earner | 932 (24.1%) | $80,603 |
| 2 Earners | 1,809 (46.7%) | $105,363 |
| 3+ Earners | 766 (19.8%) | $146,250 |
| Total | 3,871 (100.0%) | $97,446 |
Household Income in Wood Dale
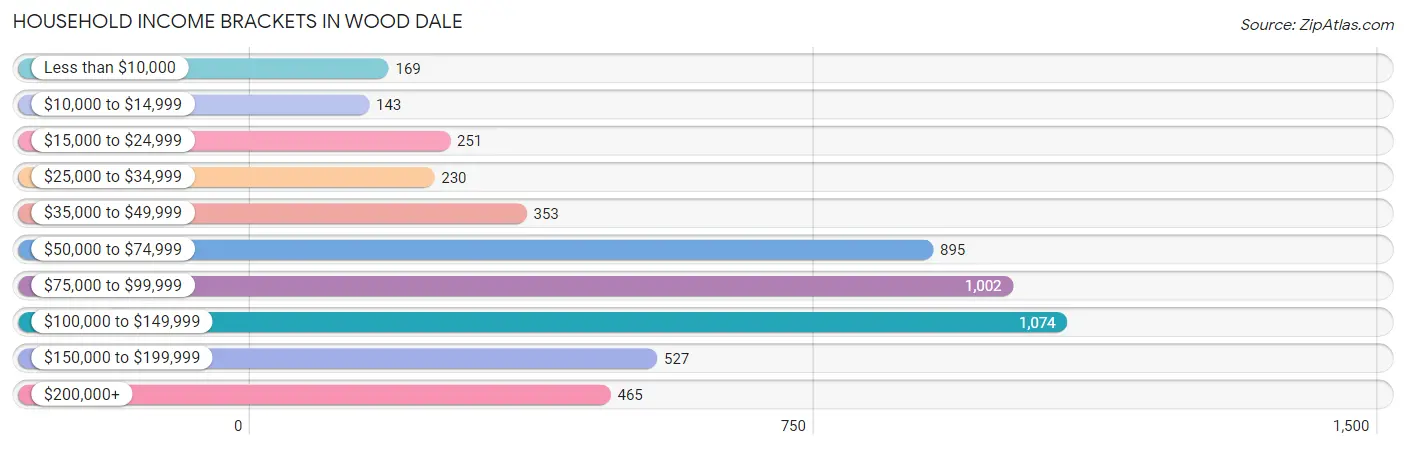
Household Income Brackets in Wood Dale
With 1,074 households falling in the category, the $100,000 to $149,999 income range is the most frequent in Wood Dale, accounting for 21.0% of all households. In contrast, only 143 households (2.8%) fall into the $10,000 to $14,999 income bracket, making it the least populous group.
| Income Bracket | # Households | % Households |
| Less than $10,000 | 169 | 3.3% |
| $10,000 to $14,999 | 143 | 2.8% |
| $15,000 to $24,999 | 251 | 4.9% |
| $25,000 to $34,999 | 230 | 4.5% |
| $35,000 to $49,999 | 353 | 6.9% |
| $50,000 to $74,999 | 895 | 17.5% |
| $75,000 to $99,999 | 1,002 | 19.6% |
| $100,000 to $149,999 | 1,074 | 21.0% |
| $150,000 to $199,999 | 527 | 10.3% |
| $200,000+ | 465 | 9.1% |
Household Income by Householder Age in Wood Dale
The median household income in Wood Dale is $86,441, with the highest median household income of $105,873 found in the 45 to 64 years age bracket for the primary householder. A total of 1,934 households (37.8%) fall into this category. Meanwhile, the 15 to 24 years age bracket for the primary householder has the lowest median household income of $57,833, with 156 households (3.0%) in this group.
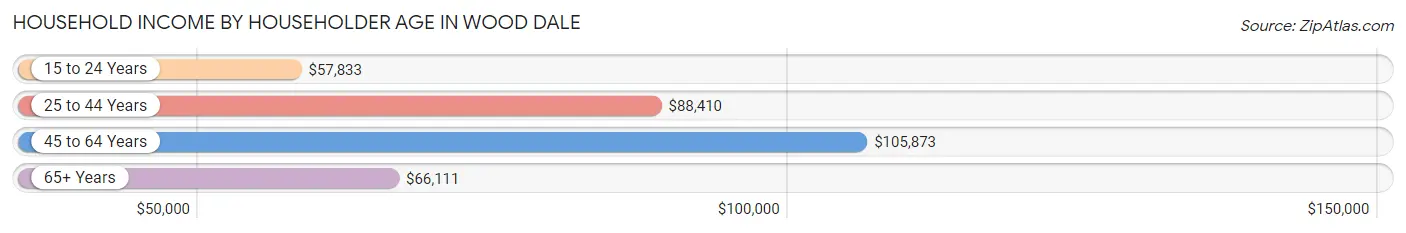
| Income Bracket | # Households | Median Income |
| 15 to 24 Years | 156 (3.0%) | $57,833 |
| 25 to 44 Years | 1,543 (30.2%) | $88,410 |
| 45 to 64 Years | 1,934 (37.8%) | $105,873 |
| 65+ Years | 1,480 (28.9%) | $66,111 |
| Total | 5,113 (100.0%) | $86,441 |
Poverty in Wood Dale
Income Below Poverty by Sex and Age in Wood Dale
With 3.6% poverty level for males and 6.6% for females among the residents of Wood Dale, under 5 year old males and 75 year old and over females are the most vulnerable to poverty, with 68 males (10.9%) and 114 females (16.7%) in their respective age groups living below the poverty level.
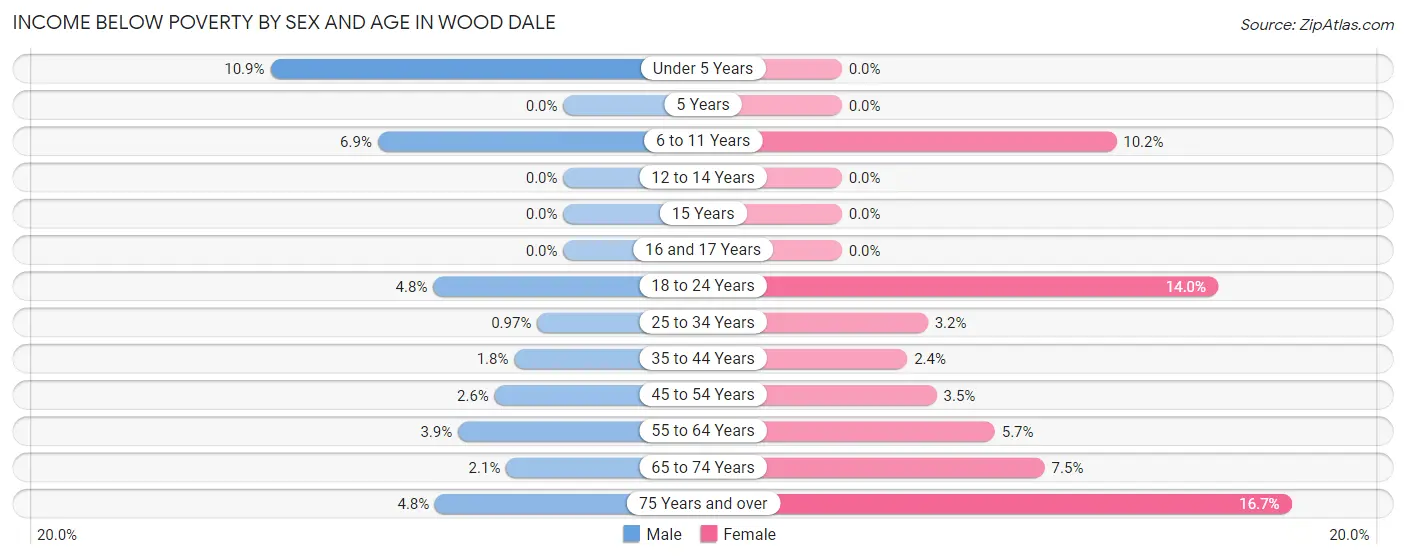
| Age Bracket | Male | Female |
| Under 5 Years | 68 (10.9%) | 0 (0.0%) |
| 5 Years | 0 (0.0%) | 0 (0.0%) |
| 6 to 11 Years | 29 (6.9%) | 48 (10.2%) |
| 12 to 14 Years | 0 (0.0%) | 0 (0.0%) |
| 15 Years | 0 (0.0%) | 0 (0.0%) |
| 16 and 17 Years | 0 (0.0%) | 0 (0.0%) |
| 18 to 24 Years | 40 (4.8%) | 91 (14.0%) |
| 25 to 34 Years | 9 (1.0%) | 27 (3.2%) |
| 35 to 44 Years | 16 (1.8%) | 20 (2.4%) |
| 45 to 54 Years | 25 (2.5%) | 32 (3.5%) |
| 55 to 64 Years | 30 (3.9%) | 63 (5.7%) |
| 65 to 74 Years | 14 (2.1%) | 59 (7.5%) |
| 75 Years and over | 21 (4.8%) | 114 (16.7%) |
| Total | 252 (3.6%) | 454 (6.6%) |
Income Above Poverty by Sex and Age in Wood Dale
According to the poverty statistics in Wood Dale, males aged 5 years and females aged under 5 years are the age groups that are most secure financially, with 100.0% of males and 100.0% of females in these age groups living above the poverty line.
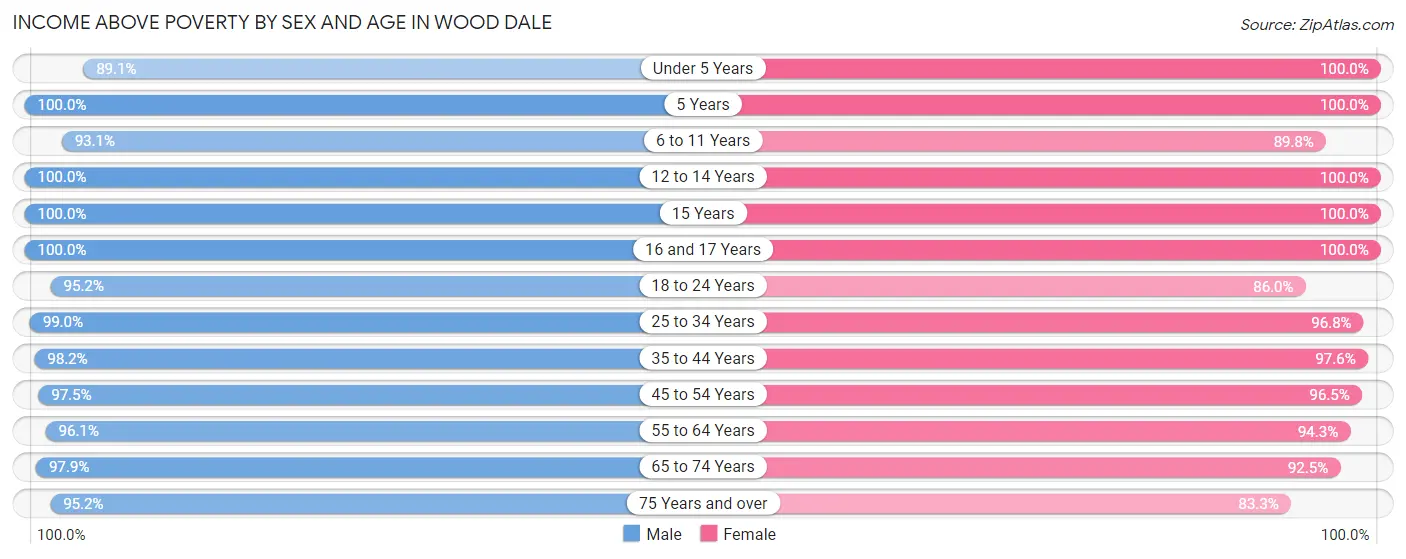
| Age Bracket | Male | Female |
| Under 5 Years | 557 (89.1%) | 128 (100.0%) |
| 5 Years | 57 (100.0%) | 96 (100.0%) |
| 6 to 11 Years | 392 (93.1%) | 423 (89.8%) |
| 12 to 14 Years | 360 (100.0%) | 54 (100.0%) |
| 15 Years | 18 (100.0%) | 125 (100.0%) |
| 16 and 17 Years | 92 (100.0%) | 160 (100.0%) |
| 18 to 24 Years | 788 (95.2%) | 561 (86.0%) |
| 25 to 34 Years | 920 (99.0%) | 819 (96.8%) |
| 35 to 44 Years | 864 (98.2%) | 803 (97.6%) |
| 45 to 54 Years | 957 (97.5%) | 877 (96.5%) |
| 55 to 64 Years | 738 (96.1%) | 1,047 (94.3%) |
| 65 to 74 Years | 646 (97.9%) | 725 (92.5%) |
| 75 Years and over | 420 (95.2%) | 569 (83.3%) |
| Total | 6,809 (96.4%) | 6,387 (93.4%) |
Income Below Poverty Among Married-Couple Families in Wood Dale
The poverty statistics for married-couple families in Wood Dale show that 1.6% or 49 of the total 3,010 families live below the poverty line. Families with no children have the highest poverty rate of 1.8%, comprising of 35 families. On the other hand, families with 3 or 4 children have the lowest poverty rate of 0.0%, which includes 0 families.
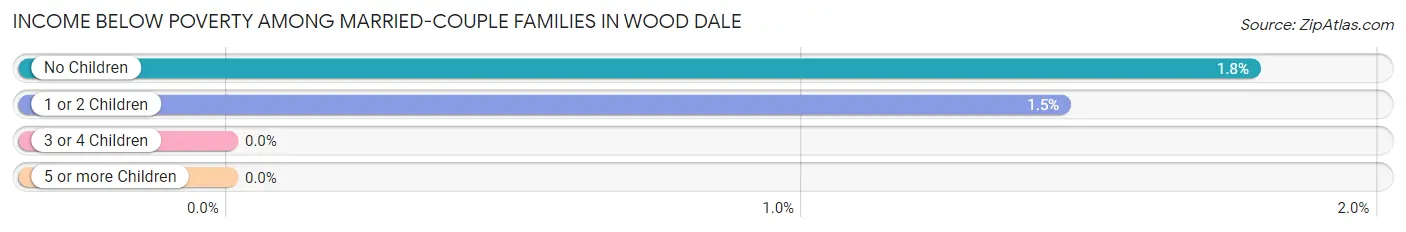
| Children | Above Poverty | Below Poverty |
| No Children | 1,926 (98.2%) | 35 (1.8%) |
| 1 or 2 Children | 950 (98.6%) | 14 (1.5%) |
| 3 or 4 Children | 85 (100.0%) | 0 (0.0%) |
| 5 or more Children | 0 (0.0%) | 0 (0.0%) |
| Total | 2,961 (98.4%) | 49 (1.6%) |
Income Below Poverty Among Single-Parent Households in Wood Dale
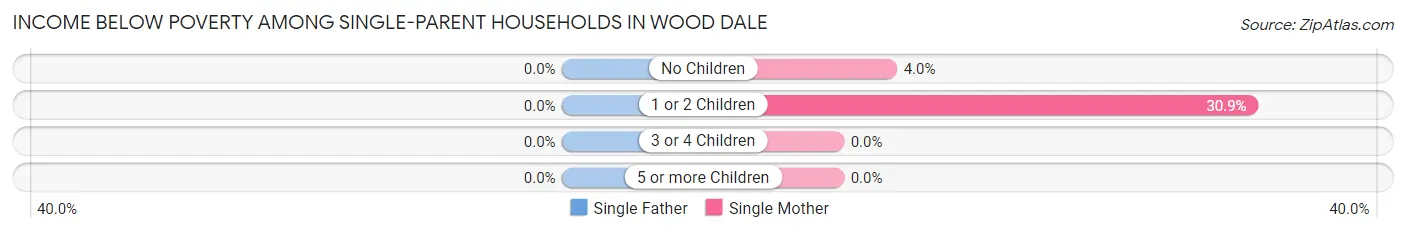
| Children | Single Father | Single Mother |
| No Children | 0 (0.0%) | 7 (4.0%) |
| 1 or 2 Children | 0 (0.0%) | 72 (30.9%) |
| 3 or 4 Children | 0 (0.0%) | 0 (0.0%) |
| 5 or more Children | 0 (0.0%) | 0 (0.0%) |
| Total | 0 (0.0%) | 79 (13.9%) |
Income Below Poverty Among Married-Couple vs Single-Parent Households in Wood Dale
The poverty data for Wood Dale shows that 49 of the married-couple family households (1.6%) and 79 of the single-parent households (9.2%) are living below the poverty level. Within the married-couple family households, those with no children have the highest poverty rate, with 35 households (1.8%) falling below the poverty line. Among the single-parent households, those with 1 or 2 children have the highest poverty rate, with 72 household (22.3%) living below poverty.
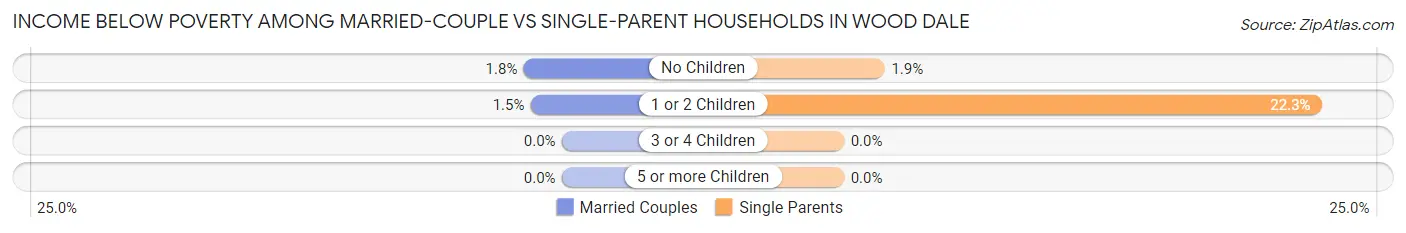
| Children | Married-Couple Families | Single-Parent Households |
| No Children | 35 (1.8%) | 7 (1.9%) |
| 1 or 2 Children | 14 (1.5%) | 72 (22.3%) |
| 3 or 4 Children | 0 (0.0%) | 0 (0.0%) |
| 5 or more Children | 0 (0.0%) | 0 (0.0%) |
| Total | 49 (1.6%) | 79 (9.2%) |
Race in Wood Dale
The most populous races in Wood Dale are White / Caucasian (9,769 | 70.3%), Hispanic or Latino (3,704 | 26.6%), and Two or more Races (1,703 | 12.2%).
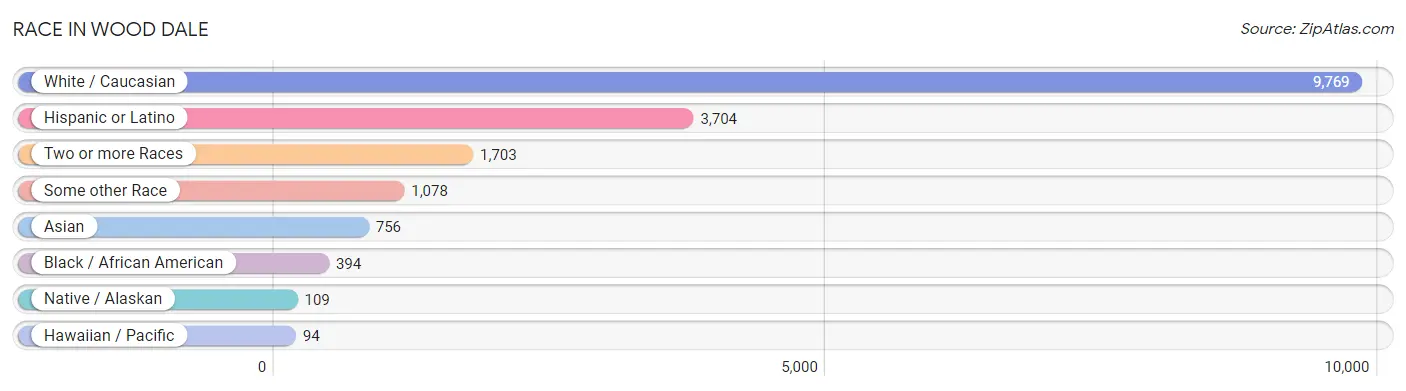
| Race | # Population | % Population |
| Asian | 756 | 5.4% |
| Black / African American | 394 | 2.8% |
| Hawaiian / Pacific | 94 | 0.7% |
| Hispanic or Latino | 3,704 | 26.6% |
| Native / Alaskan | 109 | 0.8% |
| White / Caucasian | 9,769 | 70.3% |
| Two or more Races | 1,703 | 12.2% |
| Some other Race | 1,078 | 7.7% |
| Total | 13,903 | 100.0% |
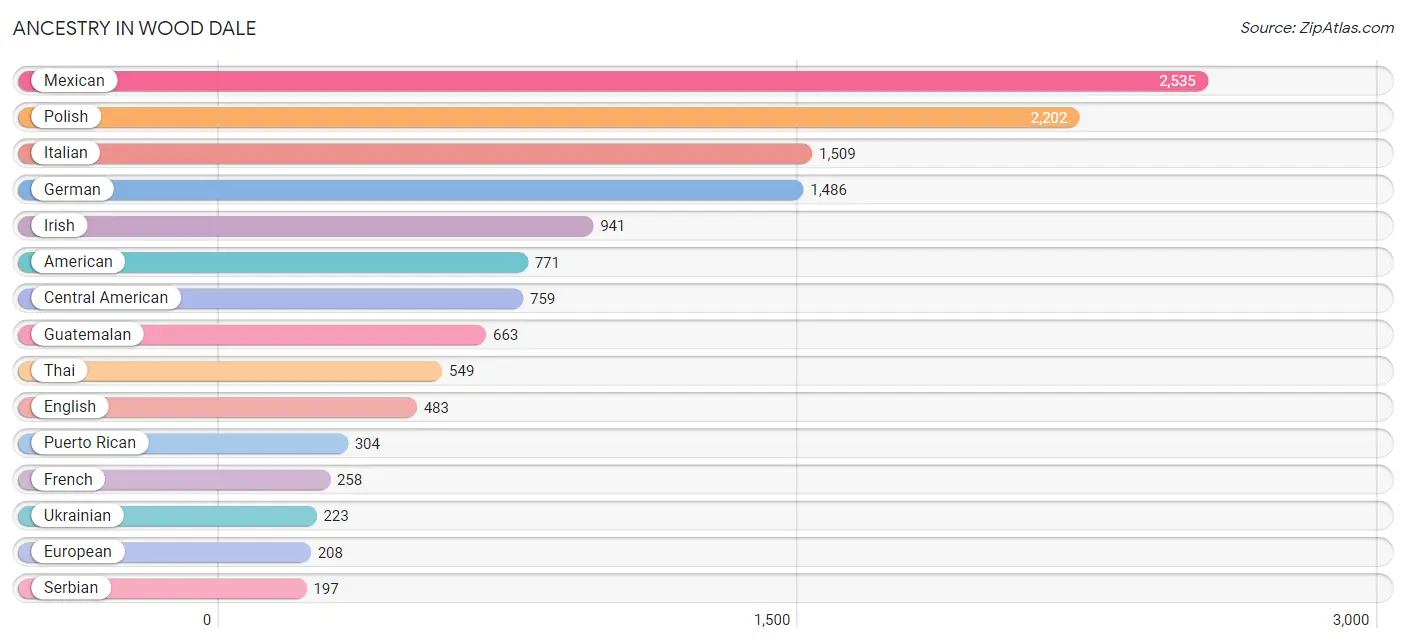
Ancestry in Wood Dale
The most populous ancestries reported in Wood Dale are Mexican (2,535 | 18.2%), Polish (2,202 | 15.8%), Italian (1,509 | 10.8%), German (1,486 | 10.7%), and Irish (941 | 6.8%), together accounting for 62.4% of all Wood Dale residents.
| Ancestry | # Population | % Population |
| African | 44 | 0.3% |
| Albanian | 42 | 0.3% |
| Alsatian | 17 | 0.1% |
| American | 771 | 5.6% |
| Arab | 104 | 0.7% |
| Armenian | 62 | 0.4% |
| Assyrian / Chaldean / Syriac | 12 | 0.1% |
| Austrian | 60 | 0.4% |
| Belgian | 21 | 0.2% |
| Bhutanese | 23 | 0.2% |
| Blackfeet | 7 | 0.1% |
| British | 71 | 0.5% |
| Bulgarian | 151 | 1.1% |
| Burmese | 43 | 0.3% |
| Central American | 759 | 5.5% |
| Cherokee | 18 | 0.1% |
| Chippewa | 8 | 0.1% |
| Colombian | 10 | 0.1% |
| Costa Rican | 10 | 0.1% |
| Croatian | 21 | 0.2% |
| Cuban | 12 | 0.1% |
| Czech | 46 | 0.3% |
| Czechoslovakian | 32 | 0.2% |
| Danish | 29 | 0.2% |
| Dutch | 65 | 0.5% |
| Eastern European | 24 | 0.2% |
| English | 483 | 3.5% |
| European | 208 | 1.5% |
| Finnish | 8 | 0.1% |
| French | 258 | 1.9% |
| French Canadian | 117 | 0.8% |
| German | 1,486 | 10.7% |
| Greek | 85 | 0.6% |
| Guatemalan | 663 | 4.8% |
| Hungarian | 15 | 0.1% |
| Indian (Asian) | 18 | 0.1% |
| Iraqi | 70 | 0.5% |
| Irish | 941 | 6.8% |
| Iroquois | 18 | 0.1% |
| Italian | 1,509 | 10.8% |
| Jamaican | 12 | 0.1% |
| Japanese | 23 | 0.2% |
| Korean | 16 | 0.1% |
| Lebanese | 18 | 0.1% |
| Lithuanian | 104 | 0.7% |
| Luxembourger | 5 | 0.0% |
| Mexican | 2,535 | 18.2% |
| Mexican American Indian | 66 | 0.5% |
| Native Hawaiian | 16 | 0.1% |
| Norwegian | 129 | 0.9% |
| Peruvian | 43 | 0.3% |
| Polish | 2,202 | 15.8% |
| Puerto Rican | 304 | 2.2% |
| Romanian | 42 | 0.3% |
| Russian | 33 | 0.2% |
| Salvadoran | 86 | 0.6% |
| Scandinavian | 52 | 0.4% |
| Scotch-Irish | 33 | 0.2% |
| Scottish | 87 | 0.6% |
| Serbian | 197 | 1.4% |
| Slovak | 38 | 0.3% |
| South American | 53 | 0.4% |
| South American Indian | 43 | 0.3% |
| Spaniard | 24 | 0.2% |
| Sri Lankan | 11 | 0.1% |
| Subsaharan African | 60 | 0.4% |
| Swedish | 132 | 0.9% |
| Thai | 549 | 4.0% |
| Turkish | 21 | 0.2% |
| Ukrainian | 223 | 1.6% |
| Yugoslavian | 118 | 0.9% | View All 71 Rows |
Immigrants in Wood Dale
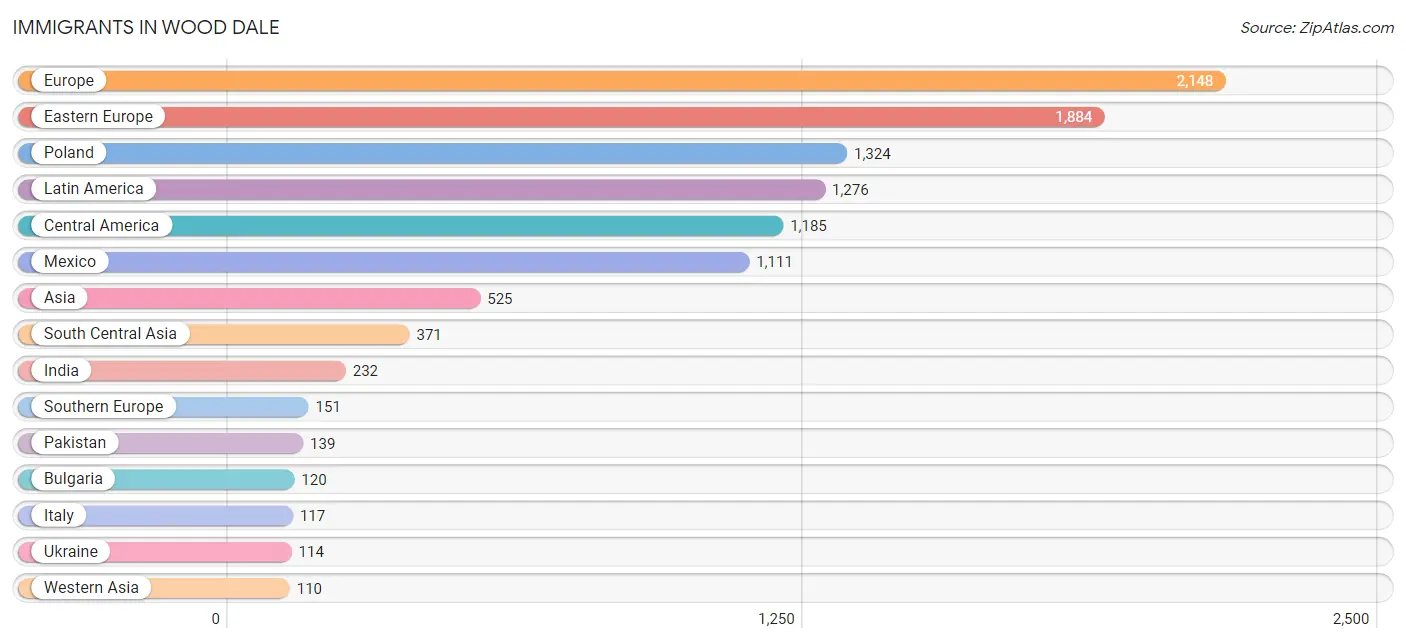
The most numerous immigrant groups reported in Wood Dale came from Europe (2,148 | 15.4%), Eastern Europe (1,884 | 13.6%), Poland (1,324 | 9.5%), Latin America (1,276 | 9.2%), and Central America (1,185 | 8.5%), together accounting for 56.2% of all Wood Dale residents.
| Immigration Origin | # Population | % Population |
| Africa | 22 | 0.2% |
| Asia | 525 | 3.8% |
| Austria | 6 | 0.0% |
| Belarus | 24 | 0.2% |
| Belgium | 22 | 0.2% |
| Bosnia and Herzegovina | 68 | 0.5% |
| Bulgaria | 120 | 0.9% |
| Canada | 57 | 0.4% |
| Central America | 1,185 | 8.5% |
| China | 10 | 0.1% |
| Colombia | 17 | 0.1% |
| Costa Rica | 10 | 0.1% |
| Croatia | 7 | 0.1% |
| Czechoslovakia | 14 | 0.1% |
| Eastern Asia | 33 | 0.2% |
| Eastern Europe | 1,884 | 13.6% |
| El Salvador | 8 | 0.1% |
| Europe | 2,148 | 15.4% |
| Germany | 79 | 0.6% |
| Greece | 34 | 0.2% |
| Guatemala | 56 | 0.4% |
| Hungary | 23 | 0.2% |
| India | 232 | 1.7% |
| Iraq | 46 | 0.3% |
| Italy | 117 | 0.8% |
| Japan | 23 | 0.2% |
| Latin America | 1,276 | 9.2% |
| Latvia | 18 | 0.1% |
| Lebanon | 37 | 0.3% |
| Liberia | 10 | 0.1% |
| Mexico | 1,111 | 8.0% |
| Northern Europe | 6 | 0.0% |
| Pakistan | 139 | 1.0% |
| Peru | 43 | 0.3% |
| Poland | 1,324 | 9.5% |
| Russia | 74 | 0.5% |
| Saudi Arabia | 27 | 0.2% |
| Serbia | 98 | 0.7% |
| South America | 91 | 0.6% |
| South Central Asia | 371 | 2.7% |
| South Eastern Asia | 11 | 0.1% |
| Southern Europe | 151 | 1.1% |
| Sweden | 6 | 0.0% |
| Ukraine | 114 | 0.8% |
| Venezuela | 31 | 0.2% |
| Vietnam | 11 | 0.1% |
| Western Africa | 22 | 0.2% |
| Western Asia | 110 | 0.8% |
| Western Europe | 107 | 0.8% | View All 49 Rows |
Sex and Age in Wood Dale
Sex and Age in Wood Dale
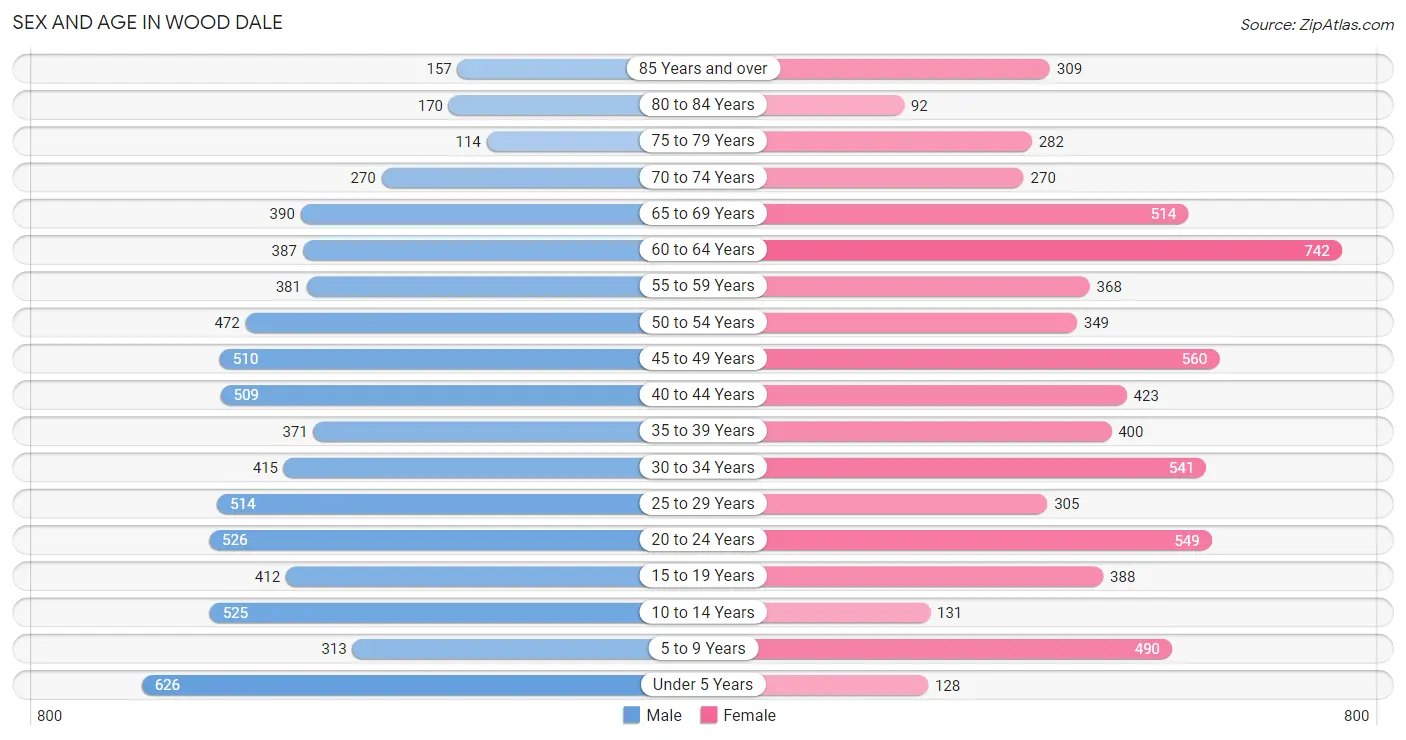
The most populous age groups in Wood Dale are Under 5 Years (626 | 8.9%) for men and 60 to 64 Years (742 | 10.8%) for women.
| Age Bracket | Male | Female |
| Under 5 Years | 626 (8.9%) | 128 (1.9%) |
| 5 to 9 Years | 313 (4.4%) | 490 (7.2%) |
| 10 to 14 Years | 525 (7.4%) | 131 (1.9%) |
| 15 to 19 Years | 412 (5.8%) | 388 (5.7%) |
| 20 to 24 Years | 526 (7.4%) | 549 (8.0%) |
| 25 to 29 Years | 514 (7.3%) | 305 (4.5%) |
| 30 to 34 Years | 415 (5.9%) | 541 (7.9%) |
| 35 to 39 Years | 371 (5.2%) | 400 (5.9%) |
| 40 to 44 Years | 509 (7.2%) | 423 (6.2%) |
| 45 to 49 Years | 510 (7.2%) | 560 (8.2%) |
| 50 to 54 Years | 472 (6.7%) | 349 (5.1%) |
| 55 to 59 Years | 381 (5.4%) | 368 (5.4%) |
| 60 to 64 Years | 387 (5.5%) | 742 (10.8%) |
| 65 to 69 Years | 390 (5.5%) | 514 (7.5%) |
| 70 to 74 Years | 270 (3.8%) | 270 (4.0%) |
| 75 to 79 Years | 114 (1.6%) | 282 (4.1%) |
| 80 to 84 Years | 170 (2.4%) | 92 (1.3%) |
| 85 Years and over | 157 (2.2%) | 309 (4.5%) |
| Total | 7,062 (100.0%) | 6,841 (100.0%) |
Families and Households in Wood Dale
Median Family Size in Wood Dale
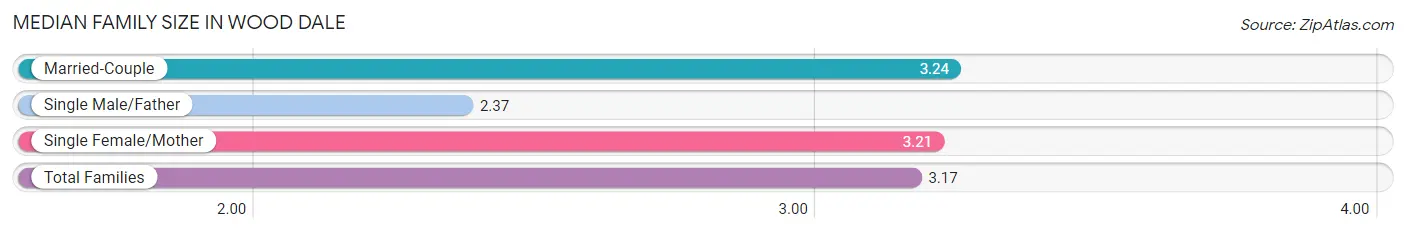
The median family size in Wood Dale is 3.17 persons per family, with married-couple families (3,010 | 77.8%) accounting for the largest median family size of 3.24 persons per family. On the other hand, single male/father families (292 | 7.5%) represent the smallest median family size with 2.37 persons per family.
| Family Type | # Families | Family Size |
| Married-Couple | 3,010 (77.8%) | 3.24 |
| Single Male/Father | 292 (7.5%) | 2.37 |
| Single Female/Mother | 569 (14.7%) | 3.21 |
| Total Families | 3,871 (100.0%) | 3.17 |
Median Household Size in Wood Dale
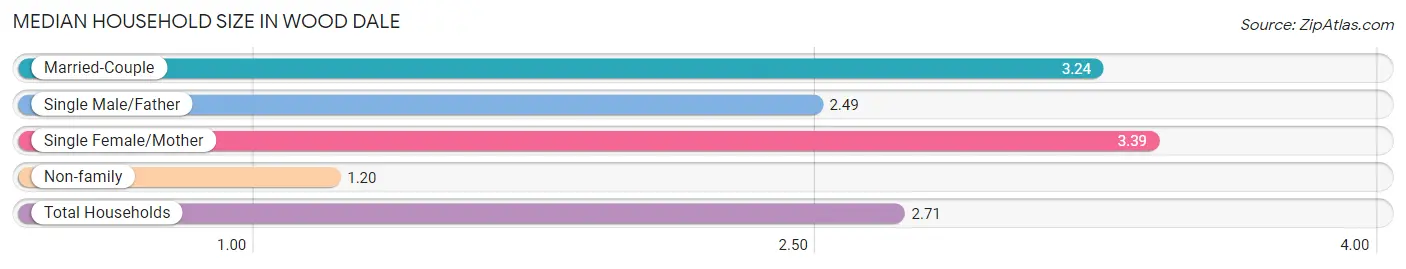
The median household size in Wood Dale is 2.71 persons per household, with single female/mother households (569 | 11.1%) accounting for the largest median household size of 3.39 persons per household. non-family households (1,242 | 24.3%) represent the smallest median household size with 1.20 persons per household.
| Household Type | # Households | Household Size |
| Married-Couple | 3,010 (58.9%) | 3.24 |
| Single Male/Father | 292 (5.7%) | 2.49 |
| Single Female/Mother | 569 (11.1%) | 3.39 |
| Non-family | 1,242 (24.3%) | 1.20 |
| Total Households | 5,113 (100.0%) | 2.71 |
Household Size by Marriage Status in Wood Dale
Out of a total of 5,113 households in Wood Dale, 3,871 (75.7%) are family households, while 1,242 (24.3%) are nonfamily households. The most numerous type of family households are 2-person households, comprising 1,690, and the most common type of nonfamily households are 1-person households, comprising 1,011.
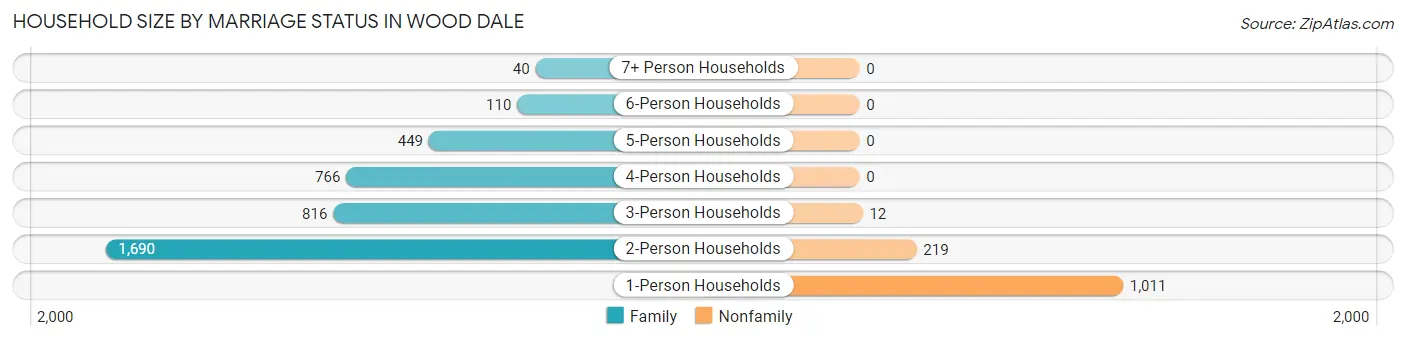
| Household Size | Family Households | Nonfamily Households |
| 1-Person Households | - | 1,011 (19.8%) |
| 2-Person Households | 1,690 (33.1%) | 219 (4.3%) |
| 3-Person Households | 816 (16.0%) | 12 (0.2%) |
| 4-Person Households | 766 (15.0%) | 0 (0.0%) |
| 5-Person Households | 449 (8.8%) | 0 (0.0%) |
| 6-Person Households | 110 (2.1%) | 0 (0.0%) |
| 7+ Person Households | 40 (0.8%) | 0 (0.0%) |
| Total | 3,871 (75.7%) | 1,242 (24.3%) |
Female Fertility in Wood Dale
Fertility by Age in Wood Dale
Average fertility rate in Wood Dale is 115.0 births per 1,000 women. Women in the age bracket of 20 to 34 years have the highest fertility rate with 207.0 births per 1,000 women. Women in the age bracket of 20 to 34 years acount for 78.1% of all women with births.
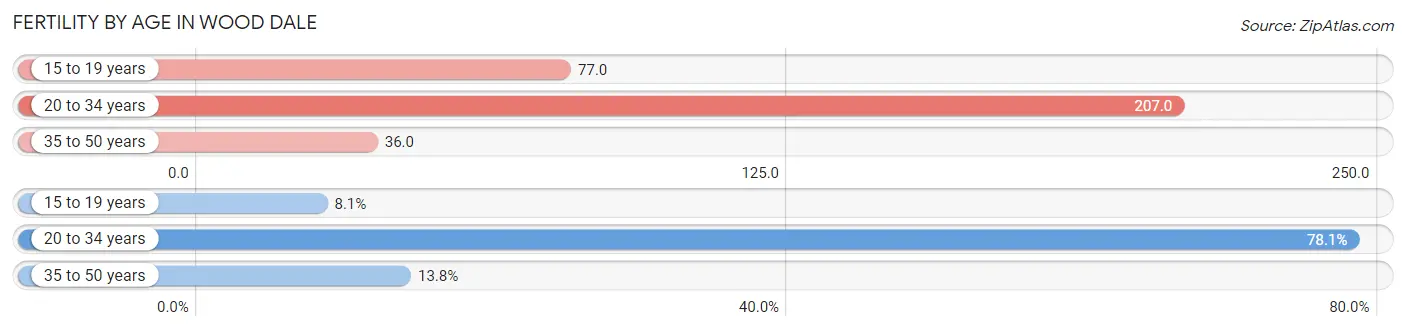
| Age Bracket | Women with Births | Births / 1,000 Women |
| 15 to 19 years | 30 (8.1%) | 77.0 |
| 20 to 34 years | 289 (78.1%) | 207.0 |
| 35 to 50 years | 51 (13.8%) | 36.0 |
| Total | 370 (100.0%) | 115.0 |
Fertility by Age by Marriage Status in Wood Dale
77.6% of women with births (370) in Wood Dale are married. The highest percentage of unmarried women with births falls into 15 to 19 years age bracket with 100.0% of them unmarried at the time of birth, while the lowest percentage of unmarried women with births belong to 35 to 50 years age bracket with 0.0% of them unmarried.
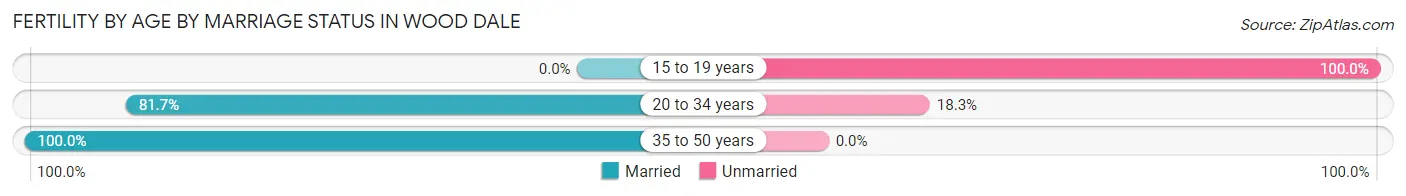
| Age Bracket | Married | Unmarried |
| 15 to 19 years | 0 (0.0%) | 30 (100.0%) |
| 20 to 34 years | 236 (81.7%) | 53 (18.3%) |
| 35 to 50 years | 51 (100.0%) | 0 (0.0%) |
| Total | 287 (77.6%) | 83 (22.4%) |
Fertility by Education in Wood Dale
Average fertility rate in Wood Dale is 115.0 births per 1,000 women. Women with the education attainment of graduate degree have the highest fertility rate of 172.0 births per 1,000 women, while women with the education attainment of bachelor's degree have the lowest fertility at 51.0 births per 1,000 women. Women with the education attainment of college or associate's degree represent 40.0% of all women with births.
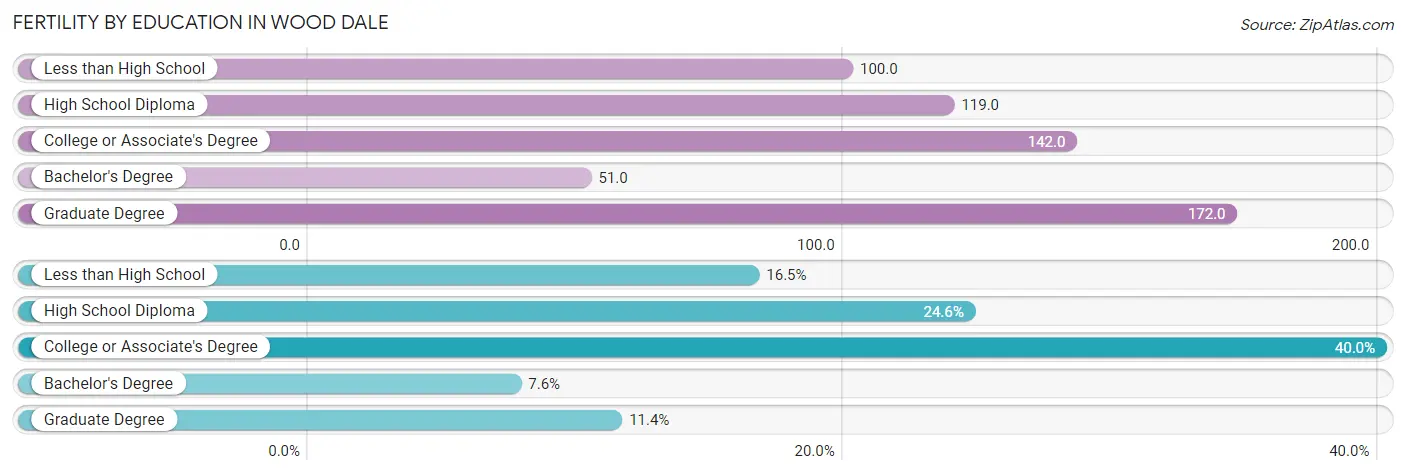
| Educational Attainment | Women with Births | Births / 1,000 Women |
| Less than High School | 61 (16.5%) | 100.0 |
| High School Diploma | 91 (24.6%) | 119.0 |
| College or Associate's Degree | 148 (40.0%) | 142.0 |
| Bachelor's Degree | 28 (7.6%) | 51.0 |
| Graduate Degree | 42 (11.4%) | 172.0 |
| Total | 370 (100.0%) | 115.0 |
Fertility by Education by Marriage Status in Wood Dale
22.4% of women with births in Wood Dale are unmarried. Women with the educational attainment of bachelor's degree are most likely to be married with 100.0% of them married at childbirth, while women with the educational attainment of less than high school are least likely to be married with 49.2% of them unmarried at childbirth.
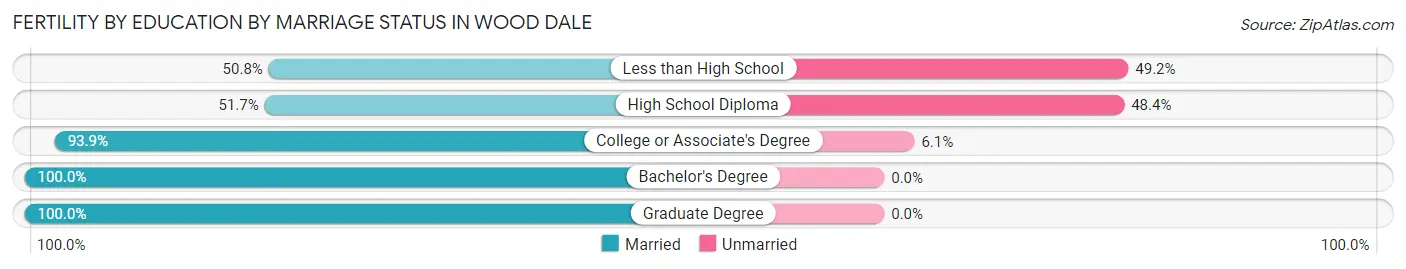
| Educational Attainment | Married | Unmarried |
| Less than High School | 31 (50.8%) | 30 (49.2%) |
| High School Diploma | 47 (51.6%) | 44 (48.3%) |
| College or Associate's Degree | 139 (93.9%) | 9 (6.1%) |
| Bachelor's Degree | 28 (100.0%) | 0 (0.0%) |
| Graduate Degree | 42 (100.0%) | 0 (0.0%) |
| Total | 287 (77.6%) | 83 (22.4%) |
Employment Characteristics in Wood Dale
Employment by Class of Employer in Wood Dale
Among the 7,522 employed individuals in Wood Dale, private company employees (5,832 | 77.5%), local government employees (465 | 6.2%), and self-employed (incorporated) (380 | 5.1%) make up the most common classes of employment.
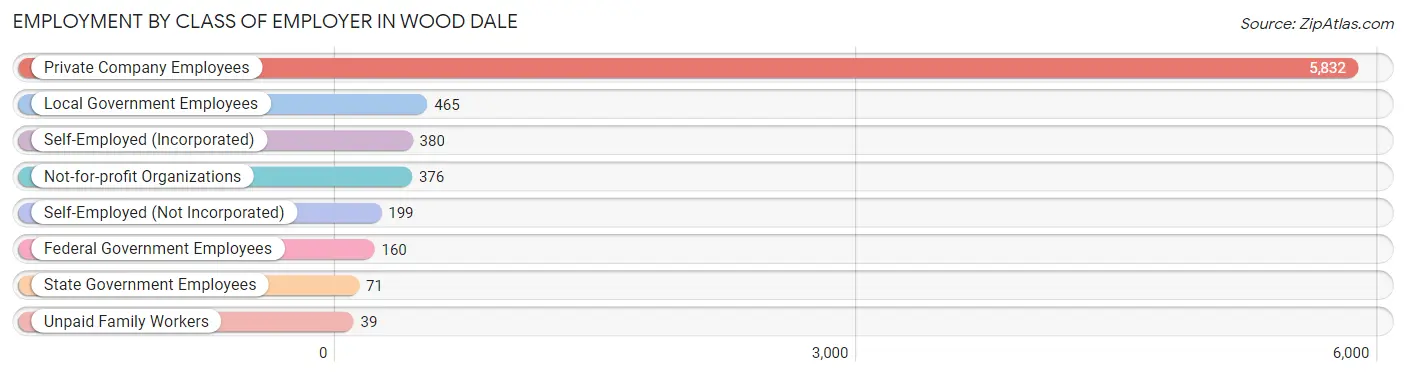
| Employer Class | # Employees | % Employees |
| Private Company Employees | 5,832 | 77.5% |
| Self-Employed (Incorporated) | 380 | 5.1% |
| Self-Employed (Not Incorporated) | 199 | 2.6% |
| Not-for-profit Organizations | 376 | 5.0% |
| Local Government Employees | 465 | 6.2% |
| State Government Employees | 71 | 0.9% |
| Federal Government Employees | 160 | 2.1% |
| Unpaid Family Workers | 39 | 0.5% |
| Total | 7,522 | 100.0% |
Employment Status by Age in Wood Dale
According to the labor force statistics for Wood Dale, out of the total population over 16 years of age (11,547), 70.0% or 8,083 individuals are in the labor force, with 4.6% or 372 of them unemployed. The age group with the highest labor force participation rate is 45 to 54 years, with 92.1% or 1,742 individuals in the labor force. Within the labor force, the 25 to 29 years age range has the highest percentage of unemployed individuals, with 9.8% or 73 of them being unemployed.
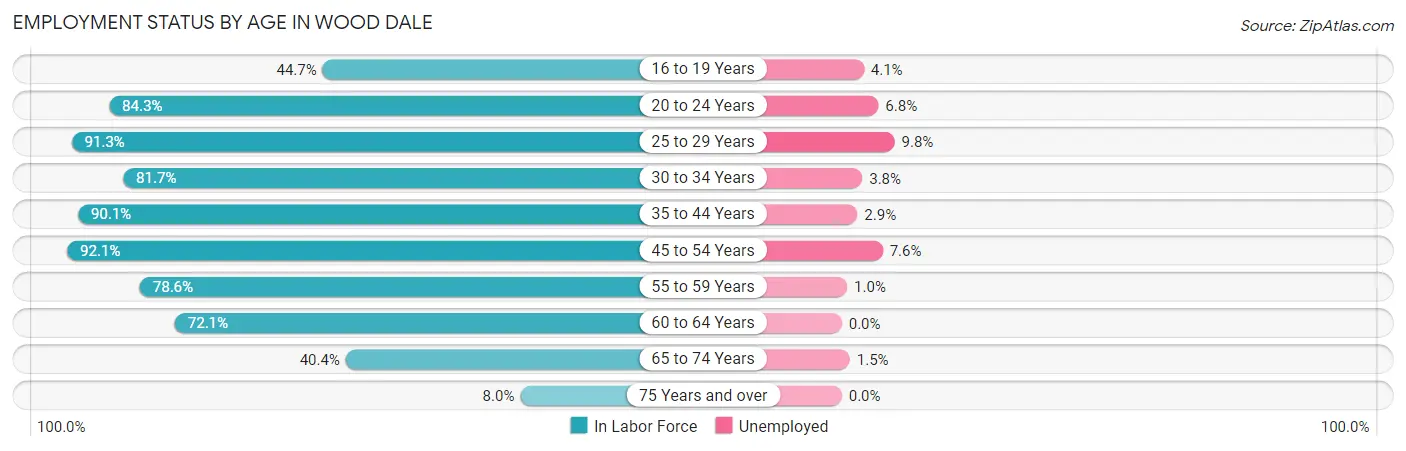
| Age Bracket | In Labor Force | Unemployed |
| 16 to 19 Years | 294 (44.7%) | 12 (4.1%) |
| 20 to 24 Years | 906 (84.3%) | 62 (6.8%) |
| 25 to 29 Years | 748 (91.3%) | 73 (9.8%) |
| 30 to 34 Years | 781 (81.7%) | 30 (3.8%) |
| 35 to 44 Years | 1,534 (90.1%) | 44 (2.9%) |
| 45 to 54 Years | 1,742 (92.1%) | 132 (7.6%) |
| 55 to 59 Years | 589 (78.6%) | 6 (1.0%) |
| 60 to 64 Years | 814 (72.1%) | 0 (0.0%) |
| 65 to 74 Years | 583 (40.4%) | 9 (1.5%) |
| 75 Years and over | 90 (8.0%) | 0 (0.0%) |
| Total | 8,083 (70.0%) | 372 (4.6%) |
Employment Status by Educational Attainment in Wood Dale
According to labor force statistics for Wood Dale, 85.7% of individuals (6,211) out of the total population between 25 and 64 years of age (7,247) are in the labor force, with 4.6% or 286 of them being unemployed. The group with the highest labor force participation rate are those with the educational attainment of bachelor's degree or higher, with 91.0% or 1,696 individuals in the labor force. Within the labor force, individuals with less than high school education have the highest percentage of unemployment, with 9.5% or 44 of them being unemployed.
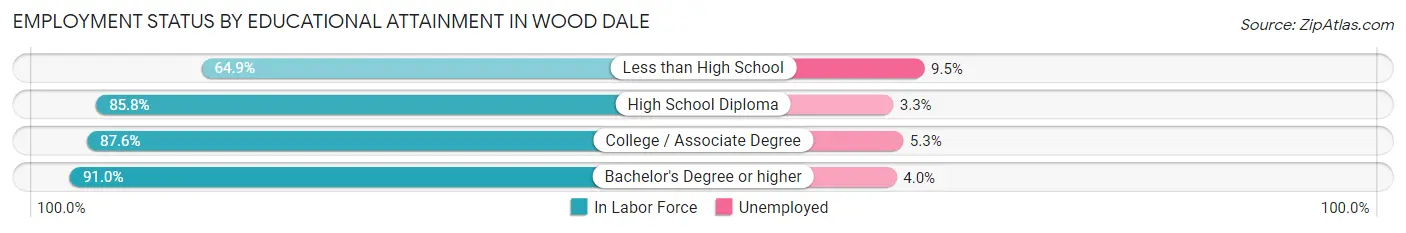
| Educational Attainment | In Labor Force | Unemployed |
| Less than High School | 462 (64.9%) | 68 (9.5%) |
| High School Diploma | 2,032 (85.8%) | 78 (3.3%) |
| College / Associate Degree | 2,017 (87.6%) | 122 (5.3%) |
| Bachelor's Degree or higher | 1,696 (91.0%) | 75 (4.0%) |
| Total | 6,211 (85.7%) | 333 (4.6%) |
Employment Occupations by Sex in Wood Dale
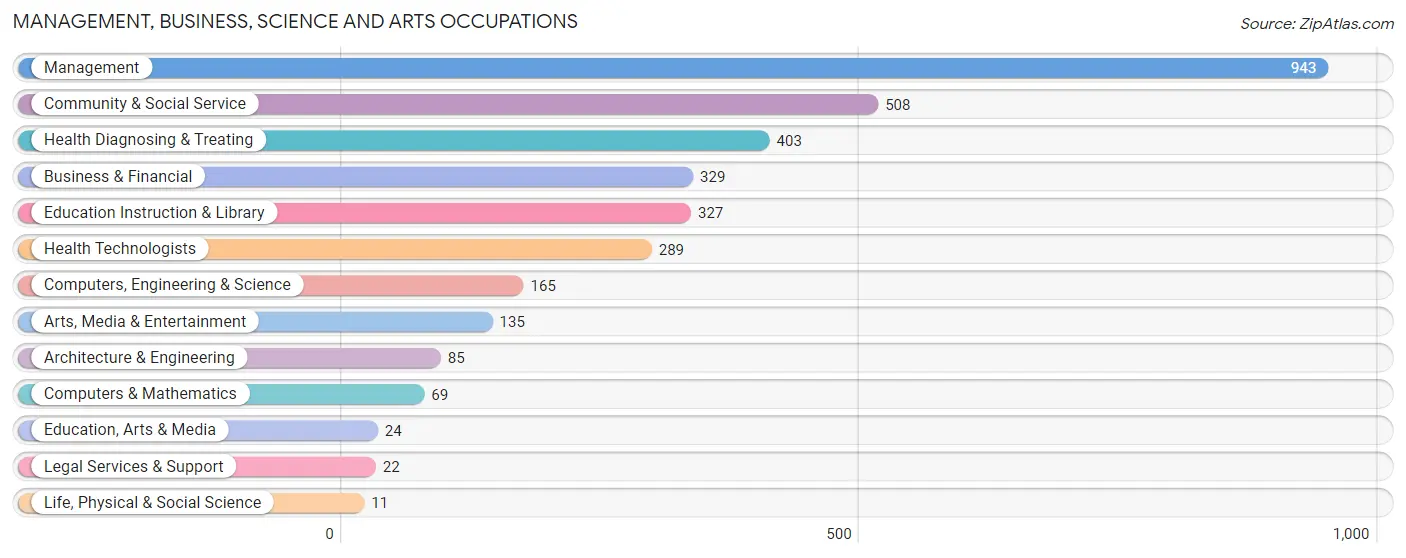
Management, Business, Science and Arts Occupations
The most common Management, Business, Science and Arts occupations in Wood Dale are Management (943 | 12.2%), Community & Social Service (508 | 6.6%), Health Diagnosing & Treating (403 | 5.2%), Business & Financial (329 | 4.3%), and Education Instruction & Library (327 | 4.2%).
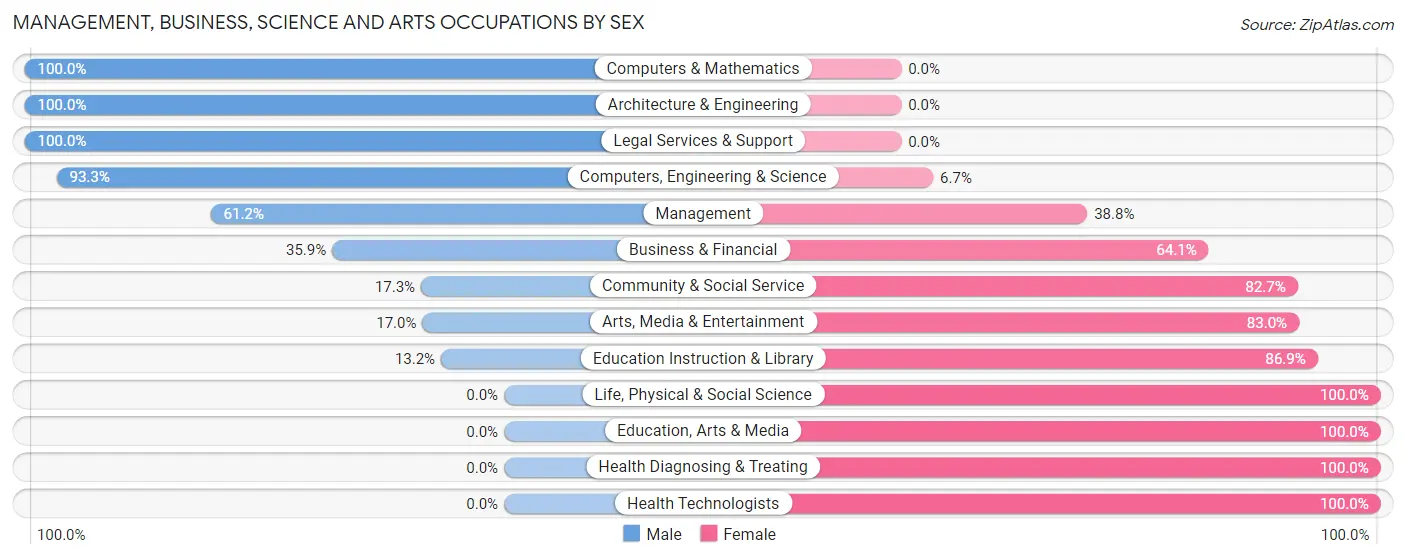
Management, Business, Science and Arts Occupations by Sex
Within the Management, Business, Science and Arts occupations in Wood Dale, the most male-oriented occupations are Computers & Mathematics (100.0%), Architecture & Engineering (100.0%), and Legal Services & Support (100.0%), while the most female-oriented occupations are Life, Physical & Social Science (100.0%), Education, Arts & Media (100.0%), and Health Diagnosing & Treating (100.0%).
| Occupation | Male | Female |
| Management | 577 (61.2%) | 366 (38.8%) |
| Business & Financial | 118 (35.9%) | 211 (64.1%) |
| Computers, Engineering & Science | 154 (93.3%) | 11 (6.7%) |
| Computers & Mathematics | 69 (100.0%) | 0 (0.0%) |
| Architecture & Engineering | 85 (100.0%) | 0 (0.0%) |
| Life, Physical & Social Science | 0 (0.0%) | 11 (100.0%) |
| Community & Social Service | 88 (17.3%) | 420 (82.7%) |
| Education, Arts & Media | 0 (0.0%) | 24 (100.0%) |
| Legal Services & Support | 22 (100.0%) | 0 (0.0%) |
| Education Instruction & Library | 43 (13.2%) | 284 (86.9%) |
| Arts, Media & Entertainment | 23 (17.0%) | 112 (83.0%) |
| Health Diagnosing & Treating | 0 (0.0%) | 403 (100.0%) |
| Health Technologists | 0 (0.0%) | 289 (100.0%) |
| Total (Category) | 937 (39.9%) | 1,411 (60.1%) |
| Total (Overall) | 4,012 (52.0%) | 3,700 (48.0%) |
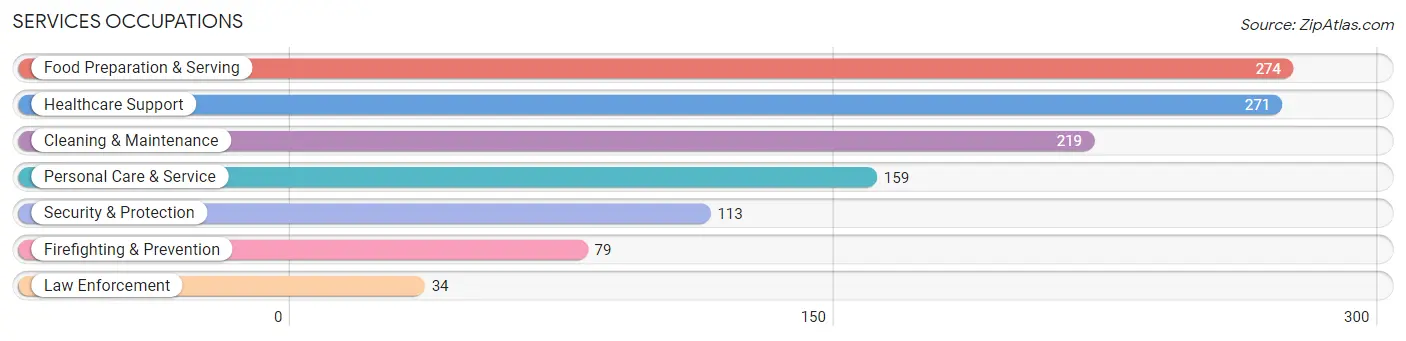
Services Occupations
The most common Services occupations in Wood Dale are Food Preparation & Serving (274 | 3.5%), Healthcare Support (271 | 3.5%), Cleaning & Maintenance (219 | 2.8%), Personal Care & Service (159 | 2.1%), and Security & Protection (113 | 1.5%).
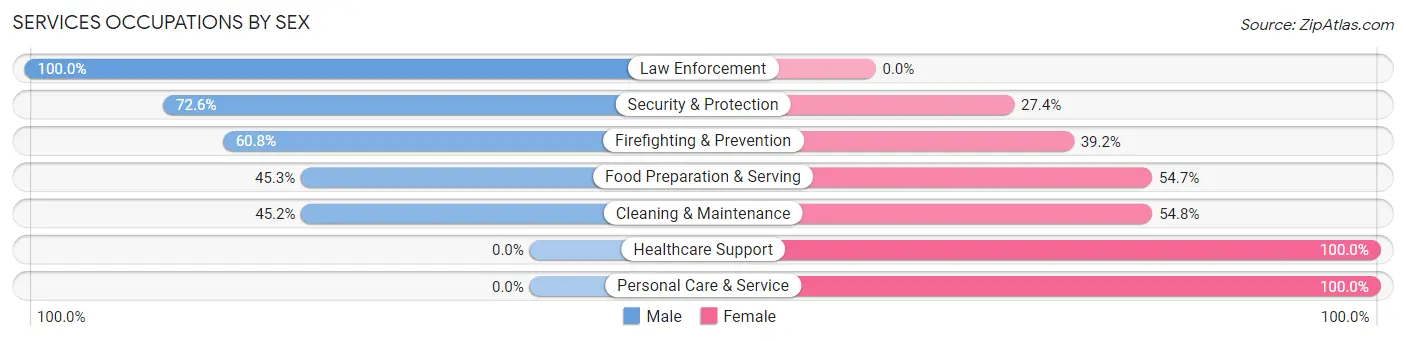
Services Occupations by Sex
Within the Services occupations in Wood Dale, the most male-oriented occupations are Law Enforcement (100.0%), Security & Protection (72.6%), and Firefighting & Prevention (60.8%), while the most female-oriented occupations are Healthcare Support (100.0%), Personal Care & Service (100.0%), and Cleaning & Maintenance (54.8%).
| Occupation | Male | Female |
| Healthcare Support | 0 (0.0%) | 271 (100.0%) |
| Security & Protection | 82 (72.6%) | 31 (27.4%) |
| Firefighting & Prevention | 48 (60.8%) | 31 (39.2%) |
| Law Enforcement | 34 (100.0%) | 0 (0.0%) |
| Food Preparation & Serving | 124 (45.3%) | 150 (54.7%) |
| Cleaning & Maintenance | 99 (45.2%) | 120 (54.8%) |
| Personal Care & Service | 0 (0.0%) | 159 (100.0%) |
| Total (Category) | 305 (29.4%) | 731 (70.6%) |
| Total (Overall) | 4,012 (52.0%) | 3,700 (48.0%) |
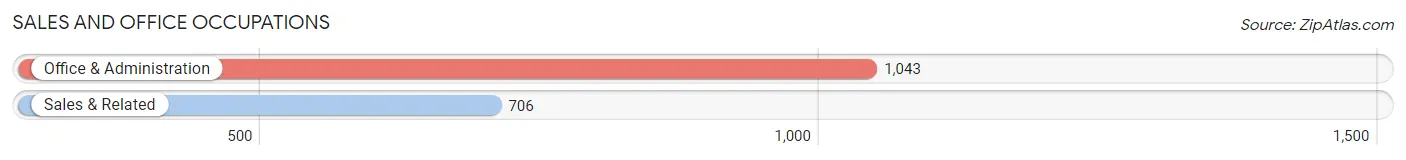
Sales and Office Occupations
The most common Sales and Office occupations in Wood Dale are Office & Administration (1,043 | 13.5%), and Sales & Related (706 | 9.1%).
Sales and Office Occupations by Sex
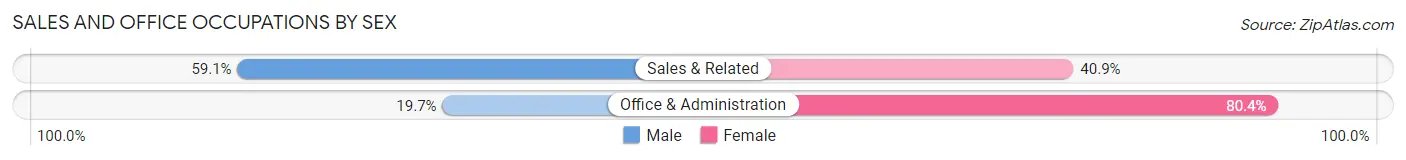
| Occupation | Male | Female |
| Sales & Related | 417 (59.1%) | 289 (40.9%) |
| Office & Administration | 205 (19.7%) | 838 (80.3%) |
| Total (Category) | 622 (35.6%) | 1,127 (64.4%) |
| Total (Overall) | 4,012 (52.0%) | 3,700 (48.0%) |
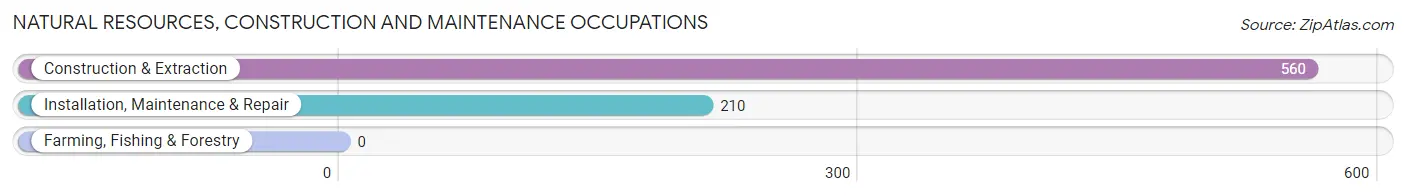
Natural Resources, Construction and Maintenance Occupations
The most common Natural Resources, Construction and Maintenance occupations in Wood Dale are Construction & Extraction (560 | 7.3%), and Installation, Maintenance & Repair (210 | 2.7%).
Natural Resources, Construction and Maintenance Occupations by Sex
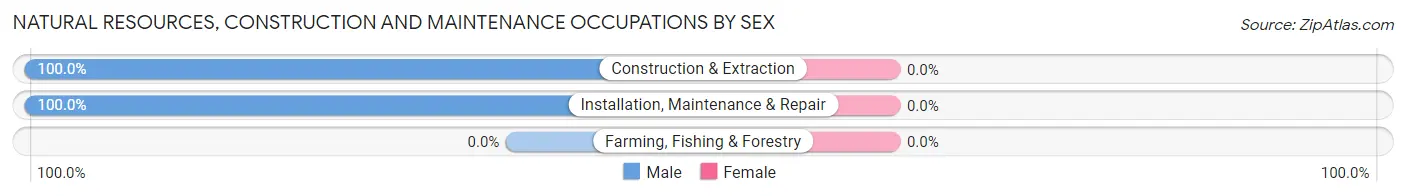
| Occupation | Male | Female |
| Farming, Fishing & Forestry | 0 (0.0%) | 0 (0.0%) |
| Construction & Extraction | 560 (100.0%) | 0 (0.0%) |
| Installation, Maintenance & Repair | 210 (100.0%) | 0 (0.0%) |
| Total (Category) | 770 (100.0%) | 0 (0.0%) |
| Total (Overall) | 4,012 (52.0%) | 3,700 (48.0%) |
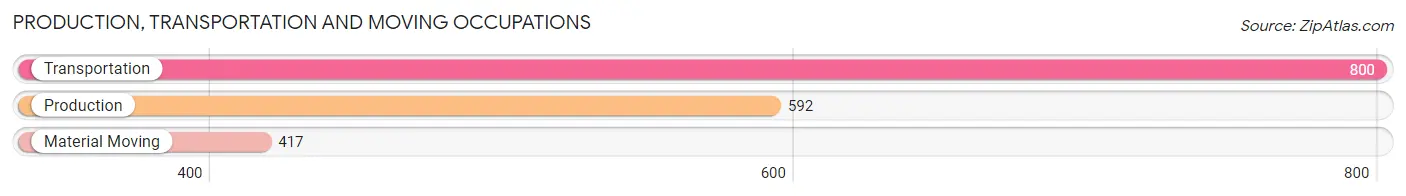
Production, Transportation and Moving Occupations
The most common Production, Transportation and Moving occupations in Wood Dale are Transportation (800 | 10.4%), Production (592 | 7.7%), and Material Moving (417 | 5.4%).
Production, Transportation and Moving Occupations by Sex
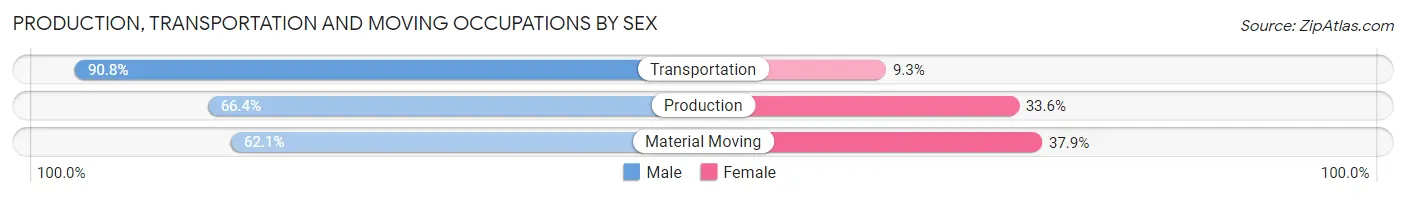
| Occupation | Male | Female |
| Production | 393 (66.4%) | 199 (33.6%) |
| Transportation | 726 (90.7%) | 74 (9.2%) |
| Material Moving | 259 (62.1%) | 158 (37.9%) |
| Total (Category) | 1,378 (76.2%) | 431 (23.8%) |
| Total (Overall) | 4,012 (52.0%) | 3,700 (48.0%) |
Employment Industries by Sex in Wood Dale
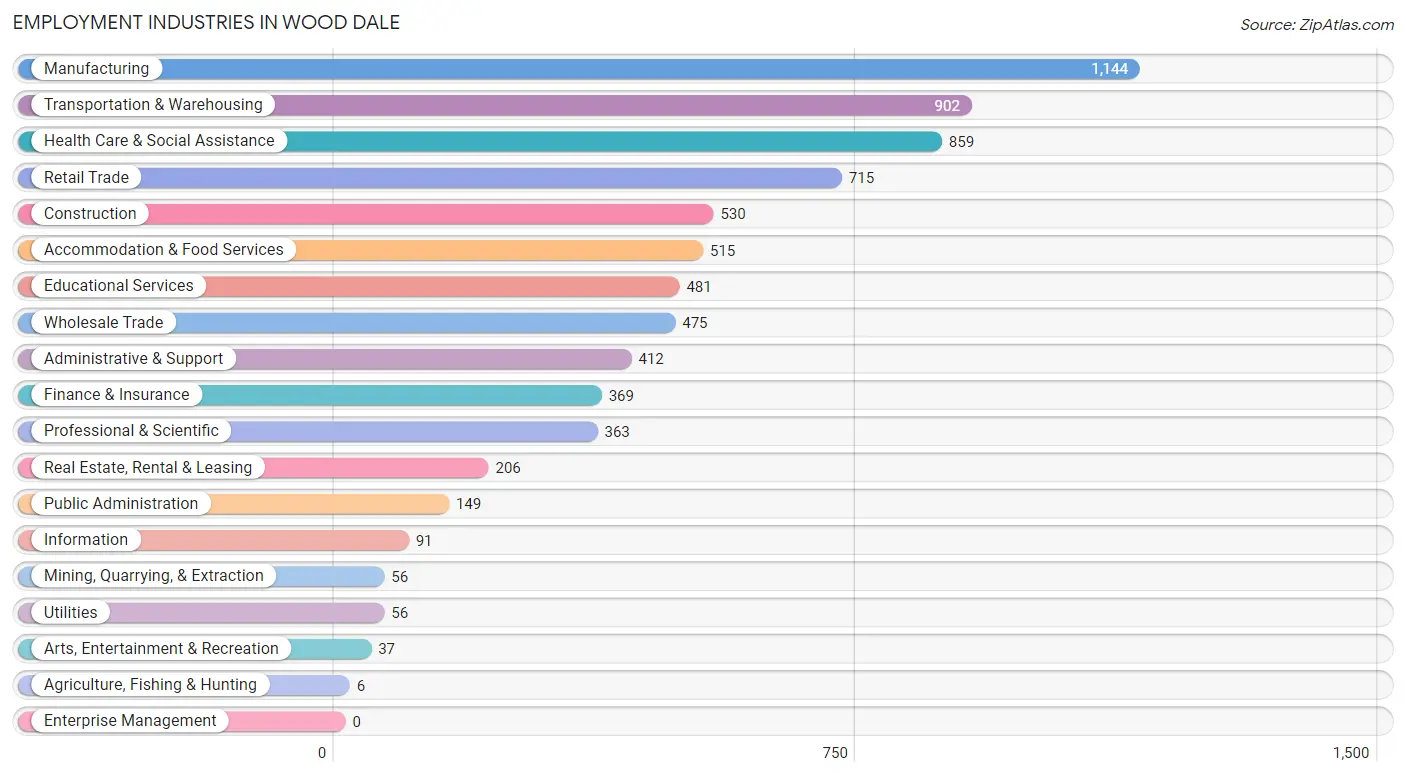
Employment Industries in Wood Dale
The major employment industries in Wood Dale include Manufacturing (1,144 | 14.8%), Transportation & Warehousing (902 | 11.7%), Health Care & Social Assistance (859 | 11.1%), Retail Trade (715 | 9.3%), and Construction (530 | 6.9%).
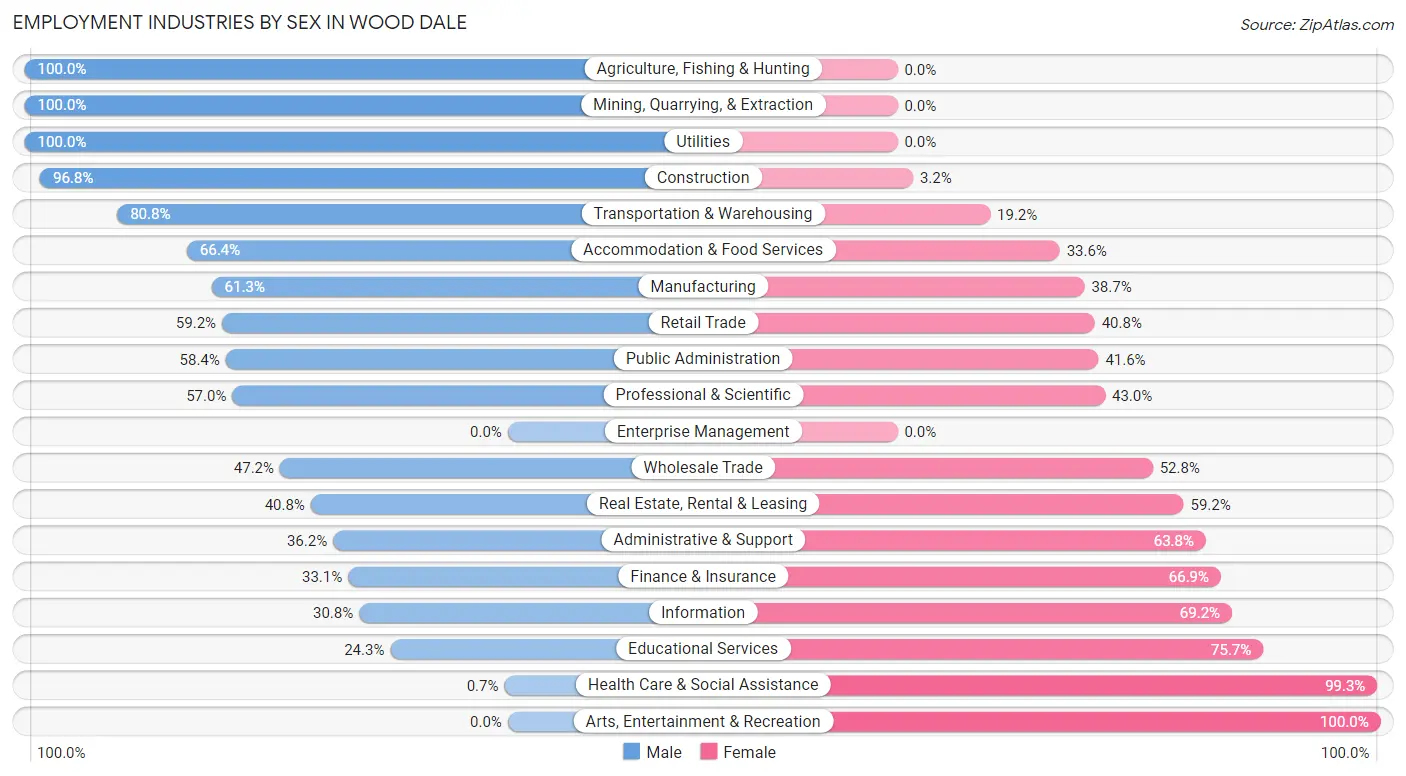
Employment Industries by Sex in Wood Dale
The Wood Dale industries that see more men than women are Agriculture, Fishing & Hunting (100.0%), Mining, Quarrying, & Extraction (100.0%), and Utilities (100.0%), whereas the industries that tend to have a higher number of women are Arts, Entertainment & Recreation (100.0%), Health Care & Social Assistance (99.3%), and Educational Services (75.7%).
| Industry | Male | Female |
| Agriculture, Fishing & Hunting | 6 (100.0%) | 0 (0.0%) |
| Mining, Quarrying, & Extraction | 56 (100.0%) | 0 (0.0%) |
| Construction | 513 (96.8%) | 17 (3.2%) |
| Manufacturing | 701 (61.3%) | 443 (38.7%) |
| Wholesale Trade | 224 (47.2%) | 251 (52.8%) |
| Retail Trade | 423 (59.2%) | 292 (40.8%) |
| Transportation & Warehousing | 729 (80.8%) | 173 (19.2%) |
| Utilities | 56 (100.0%) | 0 (0.0%) |
| Information | 28 (30.8%) | 63 (69.2%) |
| Finance & Insurance | 122 (33.1%) | 247 (66.9%) |
| Real Estate, Rental & Leasing | 84 (40.8%) | 122 (59.2%) |
| Professional & Scientific | 207 (57.0%) | 156 (43.0%) |
| Enterprise Management | 0 (0.0%) | 0 (0.0%) |
| Administrative & Support | 149 (36.2%) | 263 (63.8%) |
| Educational Services | 117 (24.3%) | 364 (75.7%) |
| Health Care & Social Assistance | 6 (0.7%) | 853 (99.3%) |
| Arts, Entertainment & Recreation | 0 (0.0%) | 37 (100.0%) |
| Accommodation & Food Services | 342 (66.4%) | 173 (33.6%) |
| Public Administration | 87 (58.4%) | 62 (41.6%) |
| Total | 4,012 (52.0%) | 3,700 (48.0%) |
Education in Wood Dale
School Enrollment in Wood Dale
The most common levels of schooling among the 2,786 students in Wood Dale are college / undergraduate (718 | 25.8%), elementary school (680 | 24.4%), and middle school (542 | 19.5%).
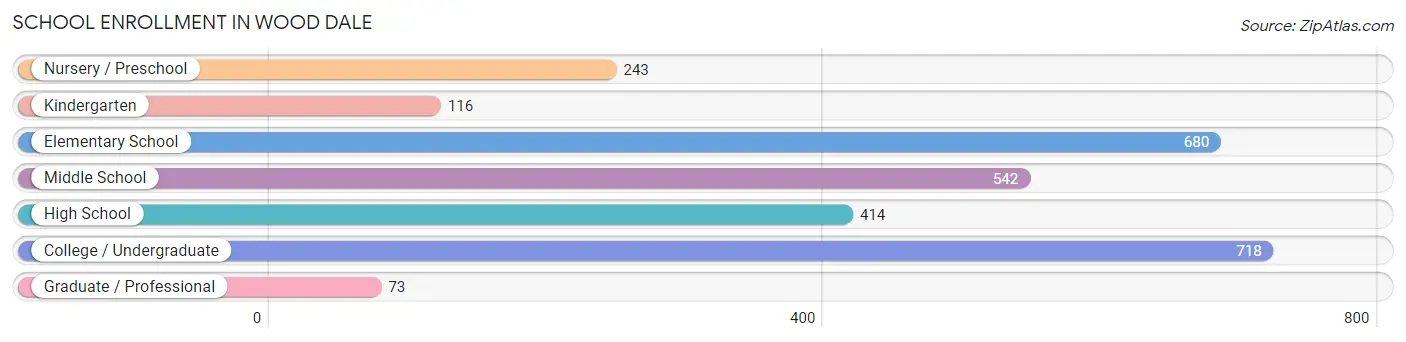
| School Level | # Students | % Students |
| Nursery / Preschool | 243 | 8.7% |
| Kindergarten | 116 | 4.2% |
| Elementary School | 680 | 24.4% |
| Middle School | 542 | 19.5% |
| High School | 414 | 14.9% |
| College / Undergraduate | 718 | 25.8% |
| Graduate / Professional | 73 | 2.6% |
| Total | 2,786 | 100.0% |
School Enrollment by Age by Funding Source in Wood Dale
Out of a total of 2,786 students who are enrolled in schools in Wood Dale, 440 (15.8%) attend a private institution, while the remaining 2,346 (84.2%) are enrolled in public schools. The age group of 3 to 4 year olds has the highest likelihood of being enrolled in private schools, with 147 (81.7% in the age bracket) enrolled. Conversely, the age group of 35 years and over has the lowest likelihood of being enrolled in a private school, with 73 (100.0% in the age bracket) attending a public institution.
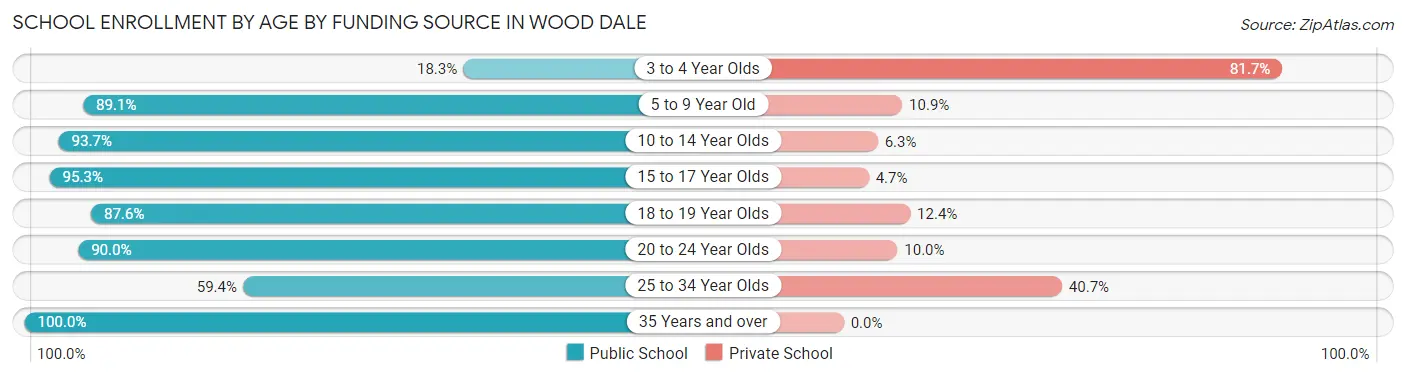
| Age Bracket | Public School | Private School |
| 3 to 4 Year Olds | 33 (18.3%) | 147 (81.7%) |
| 5 to 9 Year Old | 663 (89.1%) | 81 (10.9%) |
| 10 to 14 Year Olds | 606 (93.7%) | 41 (6.3%) |
| 15 to 17 Year Olds | 306 (95.3%) | 15 (4.7%) |
| 18 to 19 Year Olds | 269 (87.6%) | 38 (12.4%) |
| 20 to 24 Year Olds | 270 (90.0%) | 30 (10.0%) |
| 25 to 34 Year Olds | 127 (59.4%) | 87 (40.6%) |
| 35 Years and over | 73 (100.0%) | 0 (0.0%) |
| Total | 2,346 (84.2%) | 440 (15.8%) |
Educational Attainment by Field of Study in Wood Dale
Business (676 | 27.8%), communications (309 | 12.7%), education (282 | 11.6%), bio, nature & agricultural (186 | 7.6%), and engineering (185 | 7.6%) are the most common fields of study among 2,433 individuals in Wood Dale who have obtained a bachelor's degree or higher.
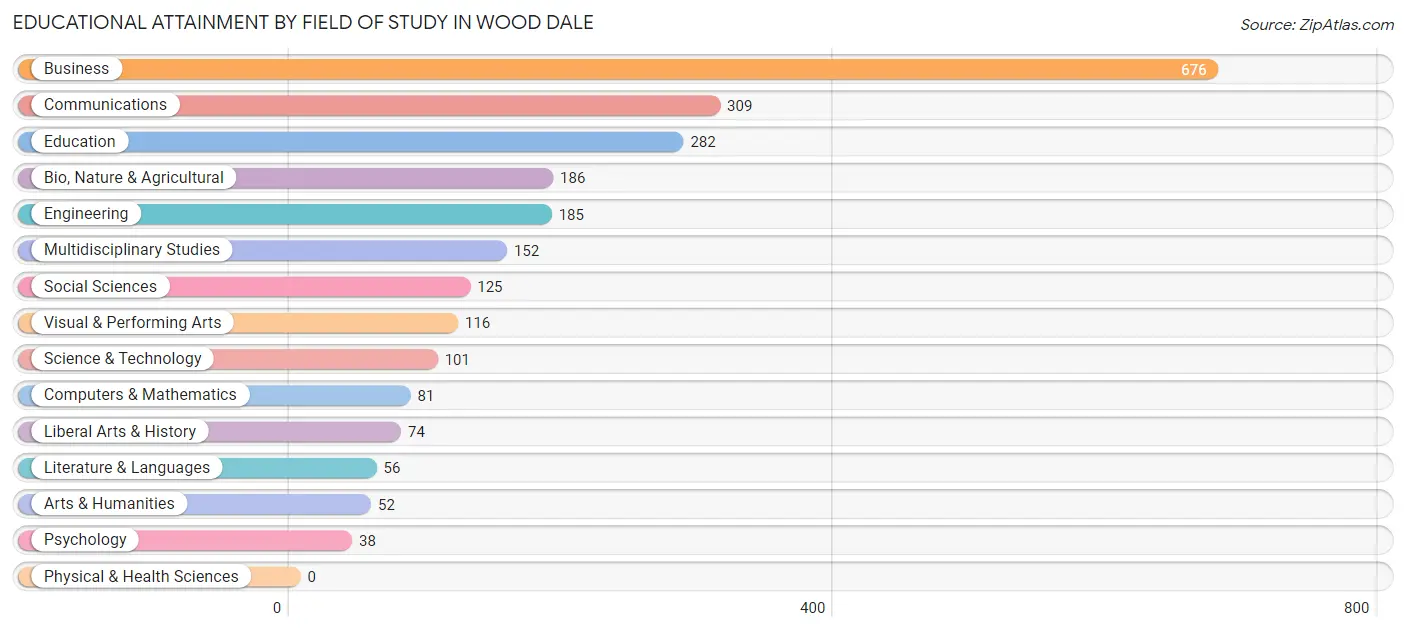
| Field of Study | # Graduates | % Graduates |
| Computers & Mathematics | 81 | 3.3% |
| Bio, Nature & Agricultural | 186 | 7.6% |
| Physical & Health Sciences | 0 | 0.0% |
| Psychology | 38 | 1.6% |
| Social Sciences | 125 | 5.1% |
| Engineering | 185 | 7.6% |
| Multidisciplinary Studies | 152 | 6.2% |
| Science & Technology | 101 | 4.2% |
| Business | 676 | 27.8% |
| Education | 282 | 11.6% |
| Literature & Languages | 56 | 2.3% |
| Liberal Arts & History | 74 | 3.0% |
| Visual & Performing Arts | 116 | 4.8% |
| Communications | 309 | 12.7% |
| Arts & Humanities | 52 | 2.1% |
| Total | 2,433 | 100.0% |
Transportation & Commute in Wood Dale
Vehicle Availability by Sex in Wood Dale
The most prevalent vehicle ownership categories in Wood Dale are males with 2 vehicles (1,818, accounting for 46.4%) and females with 2 vehicles (1,717, making up 50.5%).
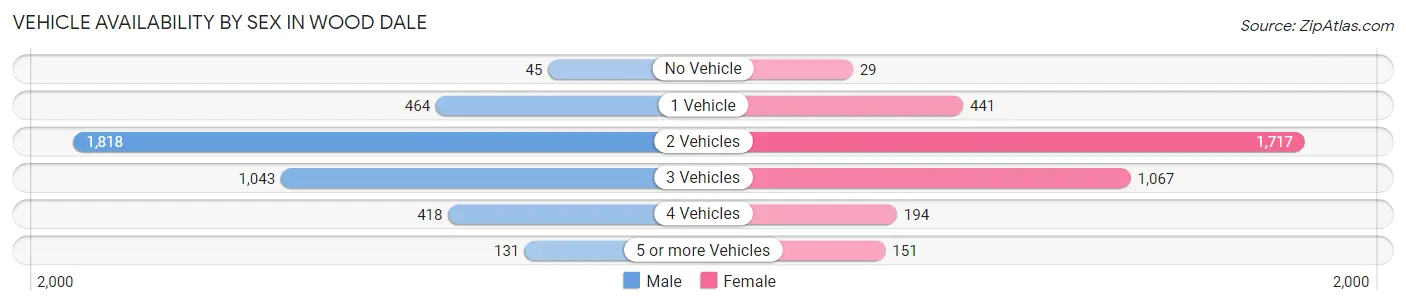
| Vehicles Available | Male | Female |
| No Vehicle | 45 (1.1%) | 29 (0.8%) |
| 1 Vehicle | 464 (11.8%) | 441 (12.2%) |
| 2 Vehicles | 1,818 (46.4%) | 1,717 (47.7%) |
| 3 Vehicles | 1,043 (26.6%) | 1,067 (29.6%) |
| 4 Vehicles | 418 (10.7%) | 194 (5.4%) |
| 5 or more Vehicles | 131 (3.3%) | 151 (4.2%) |
| Total | 3,919 (100.0%) | 3,599 (100.0%) |
Commute Time in Wood Dale
The most frequently occuring commute durations in Wood Dale are 10 to 14 minutes (1,258 commuters, 18.2%), 30 to 34 minutes (1,213 commuters, 17.6%), and 20 to 24 minutes (1,118 commuters, 16.2%).
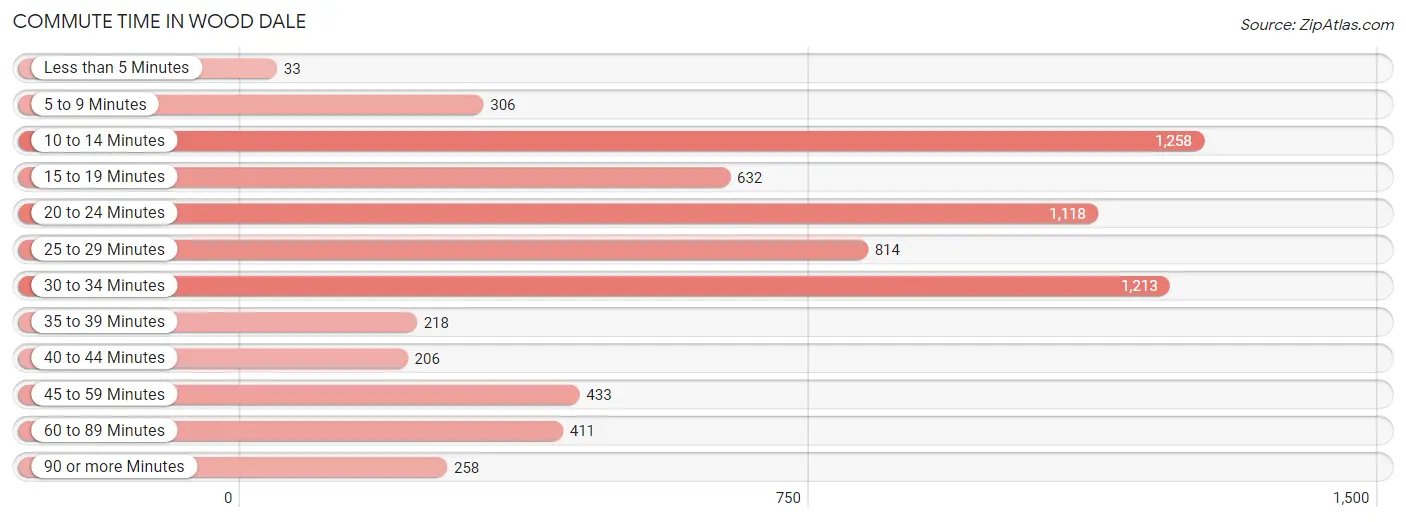
| Commute Time | # Commuters | % Commuters |
| Less than 5 Minutes | 33 | 0.5% |
| 5 to 9 Minutes | 306 | 4.4% |
| 10 to 14 Minutes | 1,258 | 18.2% |
| 15 to 19 Minutes | 632 | 9.2% |
| 20 to 24 Minutes | 1,118 | 16.2% |
| 25 to 29 Minutes | 814 | 11.8% |
| 30 to 34 Minutes | 1,213 | 17.6% |
| 35 to 39 Minutes | 218 | 3.2% |
| 40 to 44 Minutes | 206 | 3.0% |
| 45 to 59 Minutes | 433 | 6.3% |
| 60 to 89 Minutes | 411 | 6.0% |
| 90 or more Minutes | 258 | 3.7% |
Commute Time by Sex in Wood Dale
The most common commute times in Wood Dale are 10 to 14 minutes (703 commuters, 18.9%) for males and 30 to 34 minutes (695 commuters, 21.9%) for females.
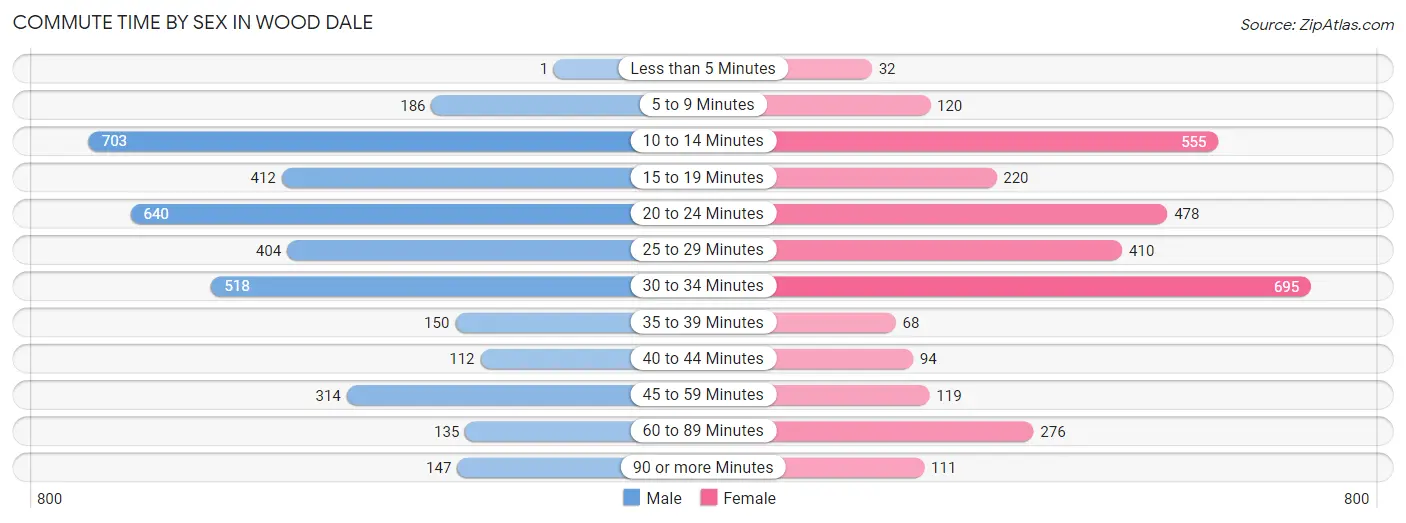
| Commute Time | Male | Female |
| Less than 5 Minutes | 1 (0.0%) | 32 (1.0%) |
| 5 to 9 Minutes | 186 (5.0%) | 120 (3.8%) |
| 10 to 14 Minutes | 703 (18.9%) | 555 (17.5%) |
| 15 to 19 Minutes | 412 (11.1%) | 220 (6.9%) |
| 20 to 24 Minutes | 640 (17.2%) | 478 (15.0%) |
| 25 to 29 Minutes | 404 (10.8%) | 410 (12.9%) |
| 30 to 34 Minutes | 518 (13.9%) | 695 (21.9%) |
| 35 to 39 Minutes | 150 (4.0%) | 68 (2.1%) |
| 40 to 44 Minutes | 112 (3.0%) | 94 (3.0%) |
| 45 to 59 Minutes | 314 (8.4%) | 119 (3.7%) |
| 60 to 89 Minutes | 135 (3.6%) | 276 (8.7%) |
| 90 or more Minutes | 147 (4.0%) | 111 (3.5%) |
Time of Departure to Work by Sex in Wood Dale
The most frequent times of departure to work in Wood Dale are 7:00 AM to 7:29 AM (565, 15.2%) for males and 8:00 AM to 8:29 AM (527, 16.6%) for females.
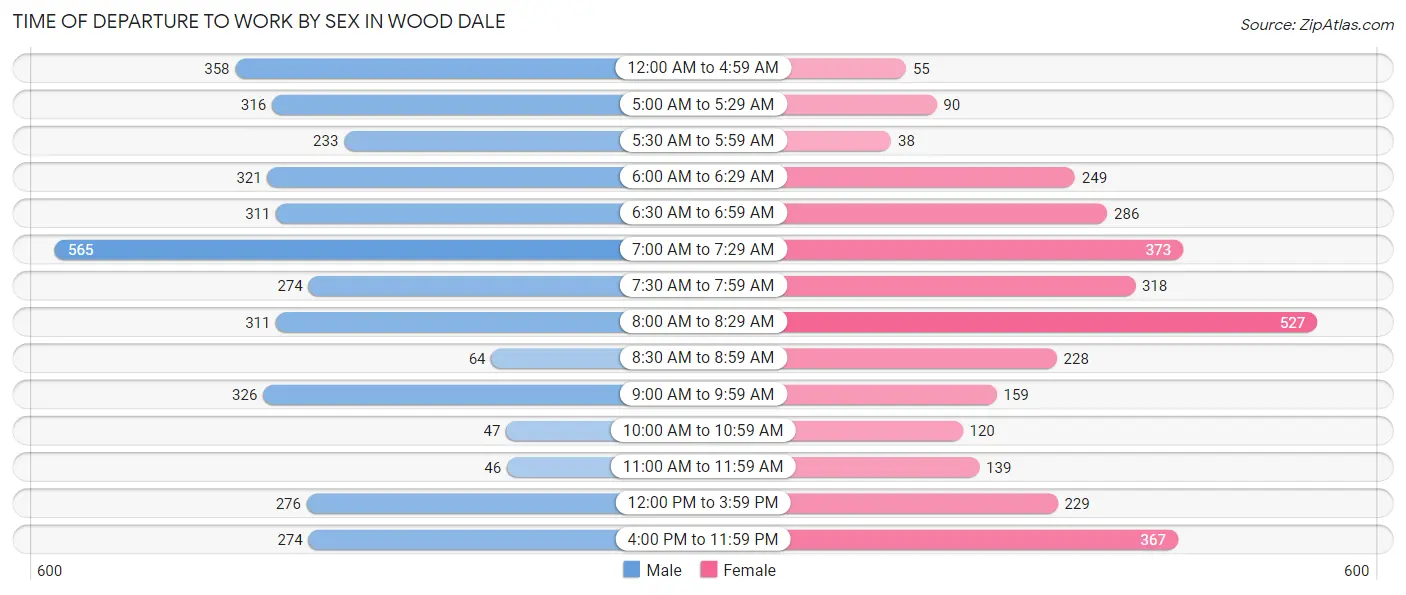
| Time of Departure | Male | Female |
| 12:00 AM to 4:59 AM | 358 (9.6%) | 55 (1.7%) |
| 5:00 AM to 5:29 AM | 316 (8.5%) | 90 (2.8%) |
| 5:30 AM to 5:59 AM | 233 (6.3%) | 38 (1.2%) |
| 6:00 AM to 6:29 AM | 321 (8.6%) | 249 (7.8%) |
| 6:30 AM to 6:59 AM | 311 (8.4%) | 286 (9.0%) |
| 7:00 AM to 7:29 AM | 565 (15.2%) | 373 (11.7%) |
| 7:30 AM to 7:59 AM | 274 (7.4%) | 318 (10.0%) |
| 8:00 AM to 8:29 AM | 311 (8.4%) | 527 (16.6%) |
| 8:30 AM to 8:59 AM | 64 (1.7%) | 228 (7.2%) |
| 9:00 AM to 9:59 AM | 326 (8.8%) | 159 (5.0%) |
| 10:00 AM to 10:59 AM | 47 (1.3%) | 120 (3.8%) |
| 11:00 AM to 11:59 AM | 46 (1.2%) | 139 (4.4%) |
| 12:00 PM to 3:59 PM | 276 (7.4%) | 229 (7.2%) |
| 4:00 PM to 11:59 PM | 274 (7.4%) | 367 (11.6%) |
| Total | 3,722 (100.0%) | 3,178 (100.0%) |
Housing Occupancy in Wood Dale
Occupancy by Ownership in Wood Dale
Of the total 5,113 dwellings in Wood Dale, owner-occupied units account for 3,908 (76.4%), while renter-occupied units make up 1,205 (23.6%).
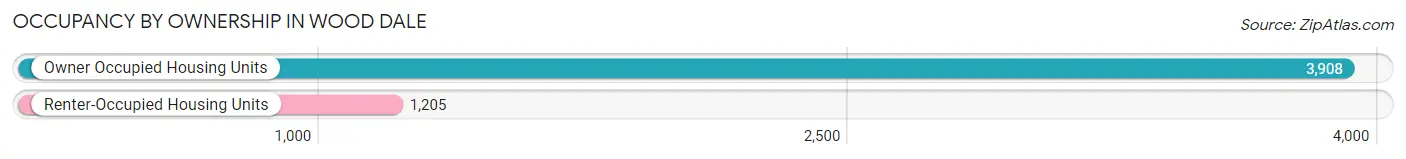
| Occupancy | # Housing Units | % Housing Units |
| Owner Occupied Housing Units | 3,908 | 76.4% |
| Renter-Occupied Housing Units | 1,205 | 23.6% |
| Total Occupied Housing Units | 5,113 | 100.0% |
Occupancy by Household Size in Wood Dale
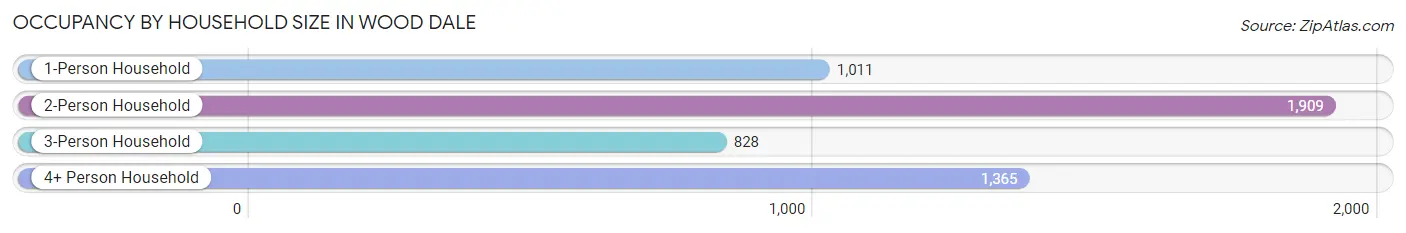
| Household Size | # Housing Units | % Housing Units |
| 1-Person Household | 1,011 | 19.8% |
| 2-Person Household | 1,909 | 37.3% |
| 3-Person Household | 828 | 16.2% |
| 4+ Person Household | 1,365 | 26.7% |
| Total Housing Units | 5,113 | 100.0% |
Occupancy by Ownership by Household Size in Wood Dale
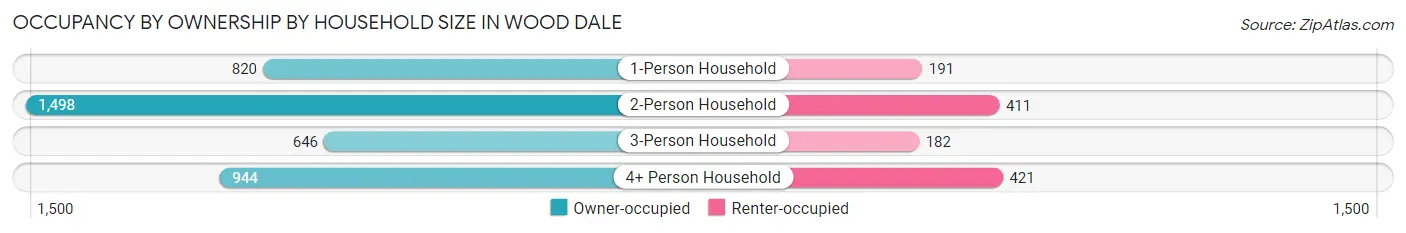
| Household Size | Owner-occupied | Renter-occupied |
| 1-Person Household | 820 (81.1%) | 191 (18.9%) |
| 2-Person Household | 1,498 (78.5%) | 411 (21.5%) |
| 3-Person Household | 646 (78.0%) | 182 (22.0%) |
| 4+ Person Household | 944 (69.2%) | 421 (30.8%) |
| Total Housing Units | 3,908 (76.4%) | 1,205 (23.6%) |
Occupancy by Educational Attainment in Wood Dale
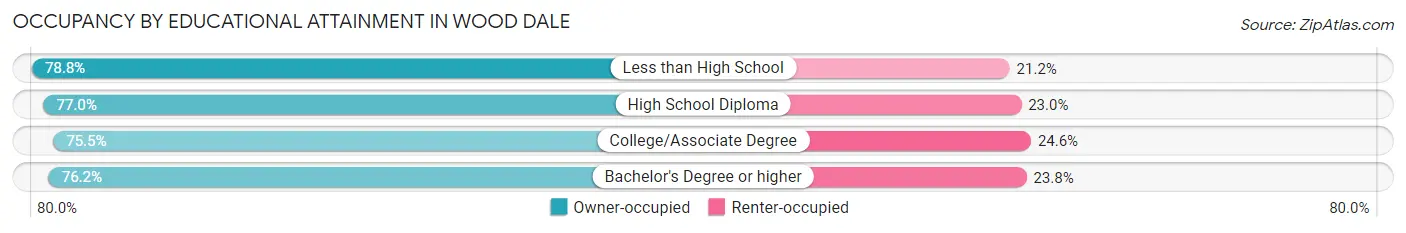
| Household Size | Owner-occupied | Renter-occupied |
| Less than High School | 309 (78.8%) | 83 (21.2%) |
| High School Diploma | 1,345 (77.0%) | 402 (23.0%) |
| College/Associate Degree | 1,168 (75.4%) | 380 (24.5%) |
| Bachelor's Degree or higher | 1,086 (76.2%) | 340 (23.8%) |
Occupancy by Age of Householder in Wood Dale
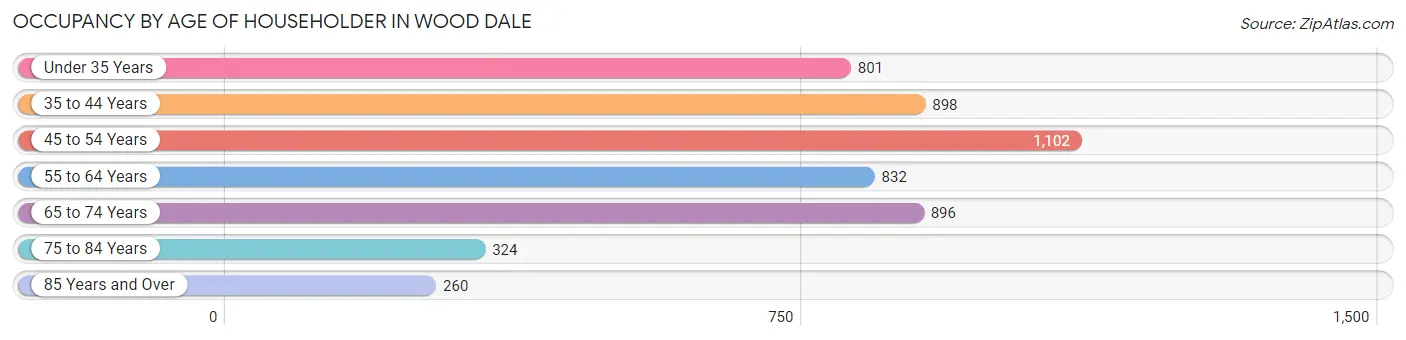
| Age Bracket | # Households | % Households |
| Under 35 Years | 801 | 15.7% |
| 35 to 44 Years | 898 | 17.6% |
| 45 to 54 Years | 1,102 | 21.5% |
| 55 to 64 Years | 832 | 16.3% |
| 65 to 74 Years | 896 | 17.5% |
| 75 to 84 Years | 324 | 6.3% |
| 85 Years and Over | 260 | 5.1% |
| Total | 5,113 | 100.0% |
Housing Finances in Wood Dale
Median Income by Occupancy in Wood Dale
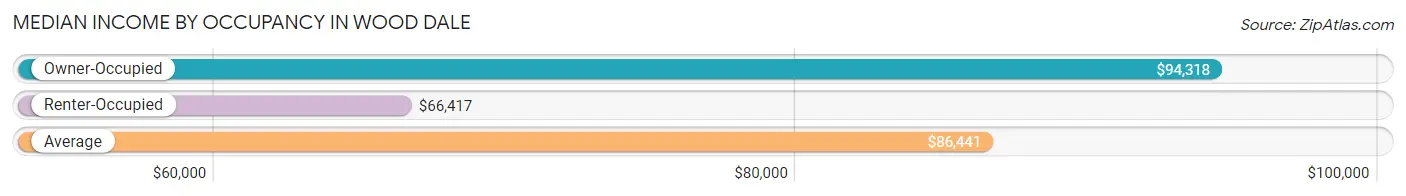
| Occupancy Type | # Households | Median Income |
| Owner-Occupied | 3,908 (76.4%) | $94,318 |
| Renter-Occupied | 1,205 (23.6%) | $66,417 |
| Average | 5,113 (100.0%) | $86,441 |
Occupancy by Householder Income Bracket in Wood Dale
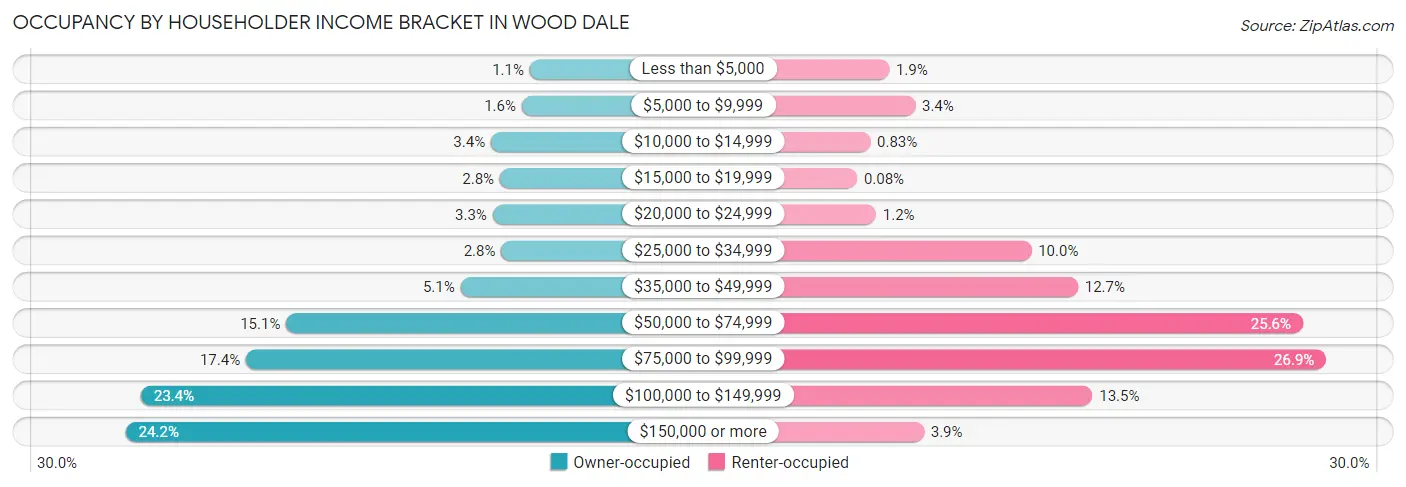
| Income Bracket | Owner-occupied | Renter-occupied |
| Less than $5,000 | 44 (1.1%) | 23 (1.9%) |
| $5,000 to $9,999 | 62 (1.6%) | 41 (3.4%) |
| $10,000 to $14,999 | 131 (3.4%) | 10 (0.8%) |
| $15,000 to $19,999 | 111 (2.8%) | 1 (0.1%) |
| $20,000 to $24,999 | 127 (3.3%) | 14 (1.2%) |
| $25,000 to $34,999 | 108 (2.8%) | 121 (10.0%) |
| $35,000 to $49,999 | 199 (5.1%) | 153 (12.7%) |
| $50,000 to $74,999 | 588 (15.0%) | 308 (25.6%) |
| $75,000 to $99,999 | 678 (17.3%) | 324 (26.9%) |
| $100,000 to $149,999 | 913 (23.4%) | 163 (13.5%) |
| $150,000 or more | 947 (24.2%) | 47 (3.9%) |
| Total | 3,908 (100.0%) | 1,205 (100.0%) |
Monthly Housing Cost Tiers in Wood Dale
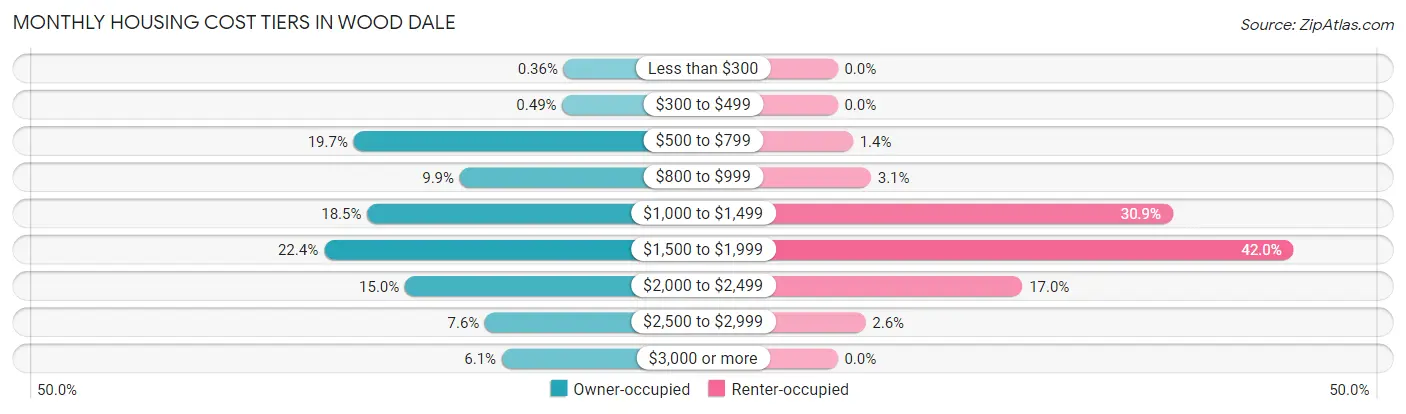
| Monthly Cost | Owner-occupied | Renter-occupied |
| Less than $300 | 14 (0.4%) | 0 (0.0%) |
| $300 to $499 | 19 (0.5%) | 0 (0.0%) |
| $500 to $799 | 770 (19.7%) | 17 (1.4%) |
| $800 to $999 | 388 (9.9%) | 37 (3.1%) |
| $1,000 to $1,499 | 721 (18.4%) | 372 (30.9%) |
| $1,500 to $1,999 | 877 (22.4%) | 506 (42.0%) |
| $2,000 to $2,499 | 585 (15.0%) | 205 (17.0%) |
| $2,500 to $2,999 | 297 (7.6%) | 31 (2.6%) |
| $3,000 or more | 237 (6.1%) | 0 (0.0%) |
| Total | 3,908 (100.0%) | 1,205 (100.0%) |
Physical Housing Characteristics in Wood Dale
Housing Structures in Wood Dale
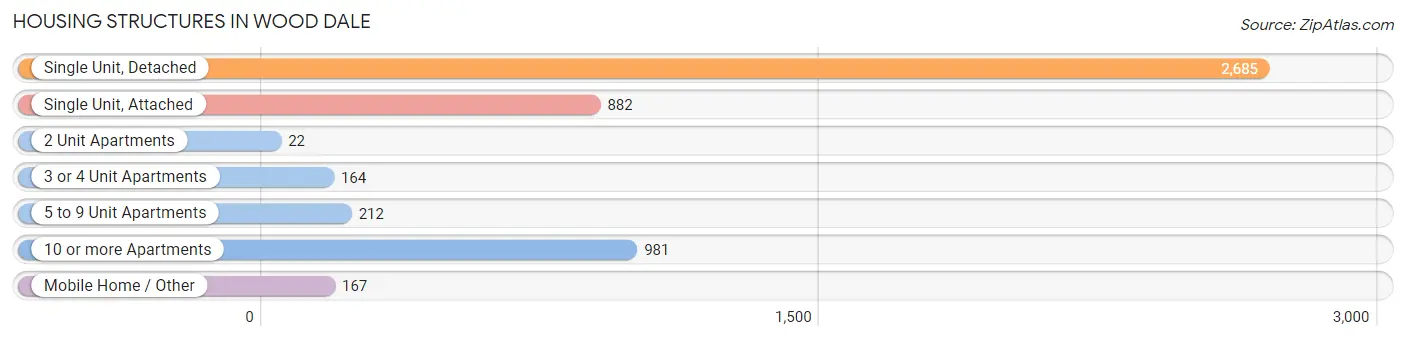
| Structure Type | # Housing Units | % Housing Units |
| Single Unit, Detached | 2,685 | 52.5% |
| Single Unit, Attached | 882 | 17.2% |
| 2 Unit Apartments | 22 | 0.4% |
| 3 or 4 Unit Apartments | 164 | 3.2% |
| 5 to 9 Unit Apartments | 212 | 4.2% |
| 10 or more Apartments | 981 | 19.2% |
| Mobile Home / Other | 167 | 3.3% |
| Total | 5,113 | 100.0% |
Housing Structures by Occupancy in Wood Dale
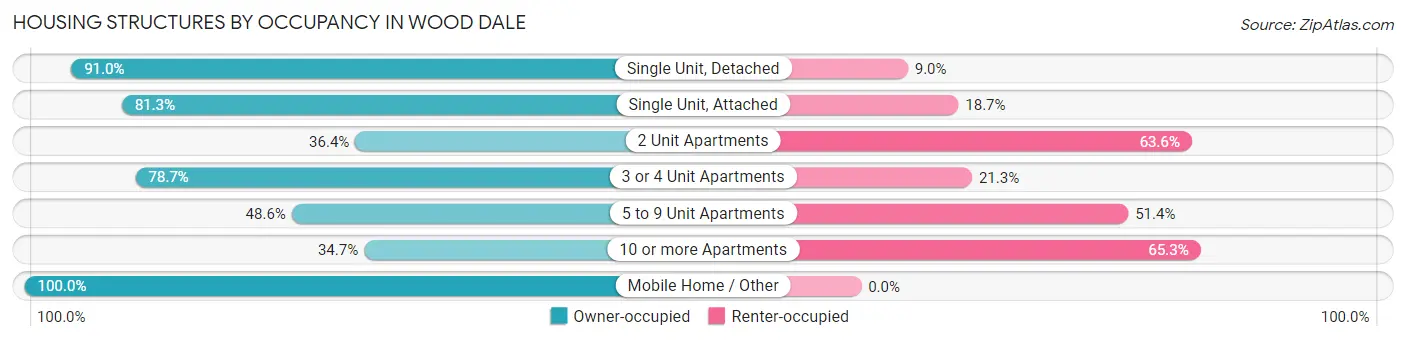
| Structure Type | Owner-occupied | Renter-occupied |
| Single Unit, Detached | 2,444 (91.0%) | 241 (9.0%) |
| Single Unit, Attached | 717 (81.3%) | 165 (18.7%) |
| 2 Unit Apartments | 8 (36.4%) | 14 (63.6%) |
| 3 or 4 Unit Apartments | 129 (78.7%) | 35 (21.3%) |
| 5 to 9 Unit Apartments | 103 (48.6%) | 109 (51.4%) |
| 10 or more Apartments | 340 (34.7%) | 641 (65.3%) |
| Mobile Home / Other | 167 (100.0%) | 0 (0.0%) |
| Total | 3,908 (76.4%) | 1,205 (23.6%) |
Housing Structures by Number of Rooms in Wood Dale
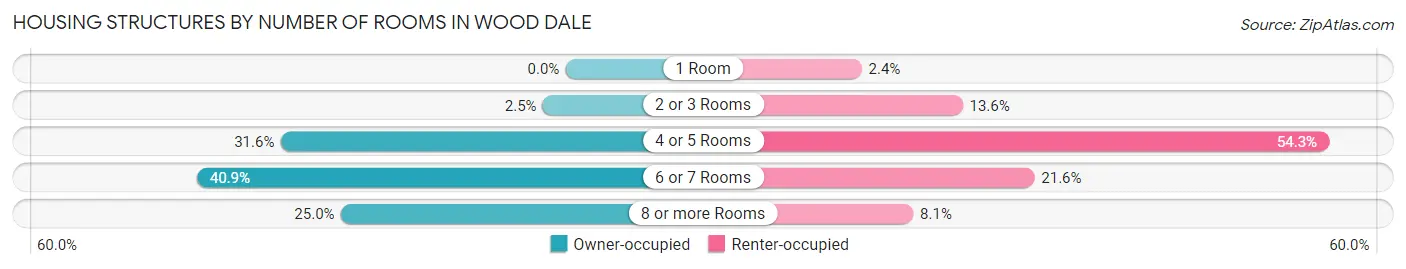
| Number of Rooms | Owner-occupied | Renter-occupied |
| 1 Room | 0 (0.0%) | 29 (2.4%) |
| 2 or 3 Rooms | 99 (2.5%) | 164 (13.6%) |
| 4 or 5 Rooms | 1,236 (31.6%) | 654 (54.3%) |
| 6 or 7 Rooms | 1,598 (40.9%) | 260 (21.6%) |
| 8 or more Rooms | 975 (24.9%) | 98 (8.1%) |
| Total | 3,908 (100.0%) | 1,205 (100.0%) |
Housing Structure by Heating Type in Wood Dale
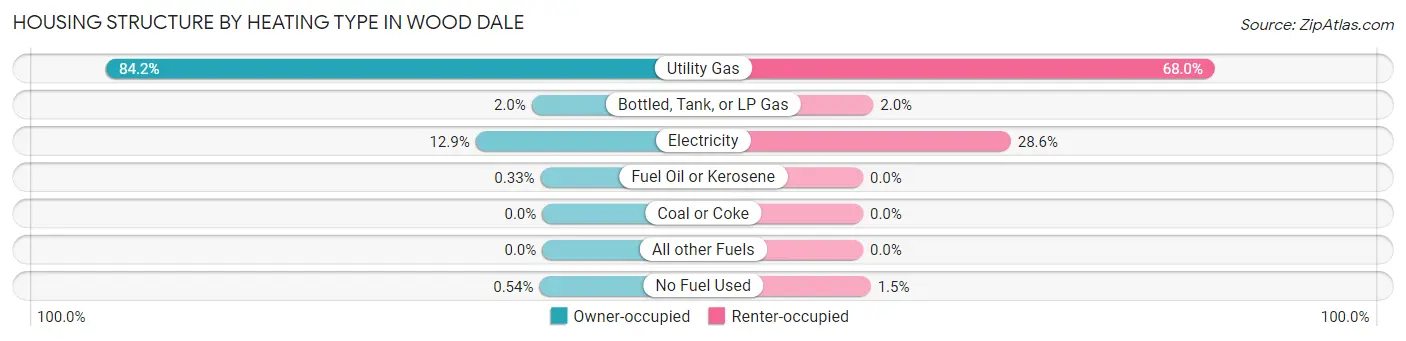
| Heating Type | Owner-occupied | Renter-occupied |
| Utility Gas | 3,292 (84.2%) | 819 (68.0%) |
| Bottled, Tank, or LP Gas | 79 (2.0%) | 24 (2.0%) |
| Electricity | 503 (12.9%) | 344 (28.5%) |
| Fuel Oil or Kerosene | 13 (0.3%) | 0 (0.0%) |
| Coal or Coke | 0 (0.0%) | 0 (0.0%) |
| All other Fuels | 0 (0.0%) | 0 (0.0%) |
| No Fuel Used | 21 (0.5%) | 18 (1.5%) |
| Total | 3,908 (100.0%) | 1,205 (100.0%) |
Household Vehicle Usage in Wood Dale
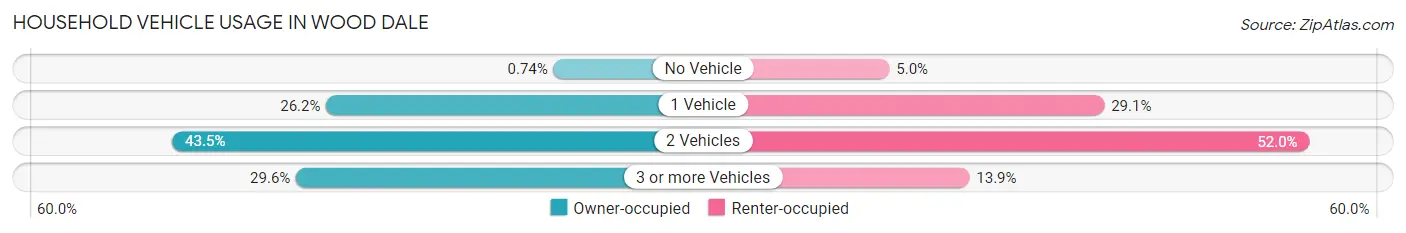
| Vehicles per Household | Owner-occupied | Renter-occupied |
| No Vehicle | 29 (0.7%) | 60 (5.0%) |
| 1 Vehicle | 1,024 (26.2%) | 350 (29.0%) |
| 2 Vehicles | 1,699 (43.5%) | 627 (52.0%) |
| 3 or more Vehicles | 1,156 (29.6%) | 168 (13.9%) |
| Total | 3,908 (100.0%) | 1,205 (100.0%) |
Real Estate & Mortgages in Wood Dale
Real Estate and Mortgage Overview in Wood Dale
| Characteristic | Without Mortgage | With Mortgage |
| Housing Units | 1,619 | 2,289 |
| Median Property Value | $258,800 | $303,900 |
| Median Household Income | $66,587 | $708 |
| Monthly Housing Costs | $818 | $237 |
| Real Estate Taxes | $5,384 | $0 |
Property Value by Mortgage Status in Wood Dale
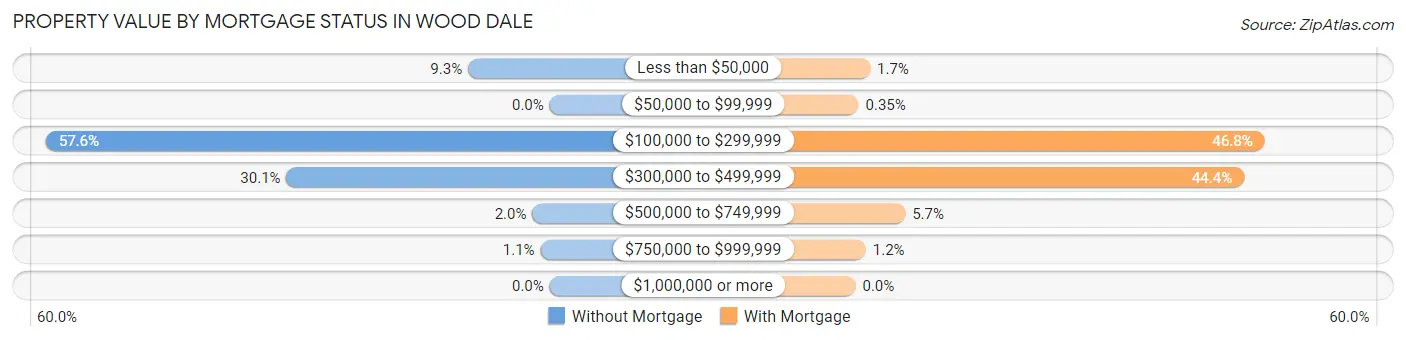
| Property Value | Without Mortgage | With Mortgage |
| Less than $50,000 | 151 (9.3%) | 38 (1.7%) |
| $50,000 to $99,999 | 0 (0.0%) | 8 (0.4%) |
| $100,000 to $299,999 | 932 (57.6%) | 1,070 (46.8%) |
| $300,000 to $499,999 | 487 (30.1%) | 1,016 (44.4%) |
| $500,000 to $749,999 | 32 (2.0%) | 130 (5.7%) |
| $750,000 to $999,999 | 17 (1.1%) | 27 (1.2%) |
| $1,000,000 or more | 0 (0.0%) | 0 (0.0%) |
| Total | 1,619 (100.0%) | 2,289 (100.0%) |
Household Income by Mortgage Status in Wood Dale
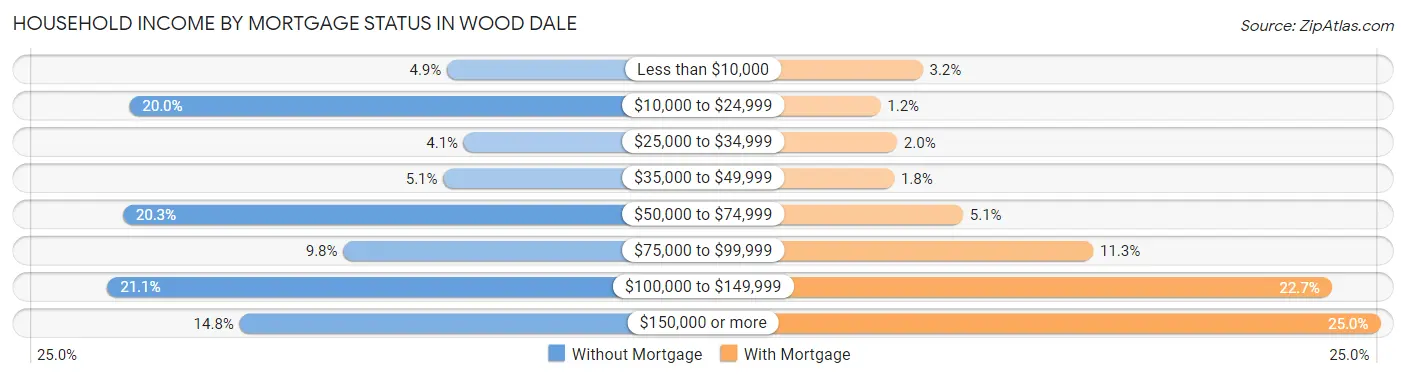
| Household Income | Without Mortgage | With Mortgage |
| Less than $10,000 | 79 (4.9%) | 73 (3.2%) |
| $10,000 to $24,999 | 324 (20.0%) | 27 (1.2%) |
| $25,000 to $34,999 | 66 (4.1%) | 45 (2.0%) |
| $35,000 to $49,999 | 82 (5.1%) | 42 (1.8%) |
| $50,000 to $74,999 | 329 (20.3%) | 117 (5.1%) |
| $75,000 to $99,999 | 159 (9.8%) | 259 (11.3%) |
| $100,000 to $149,999 | 341 (21.1%) | 519 (22.7%) |
| $150,000 or more | 239 (14.8%) | 572 (25.0%) |
| Total | 1,619 (100.0%) | 2,289 (100.0%) |
Property Value to Household Income Ratio in Wood Dale
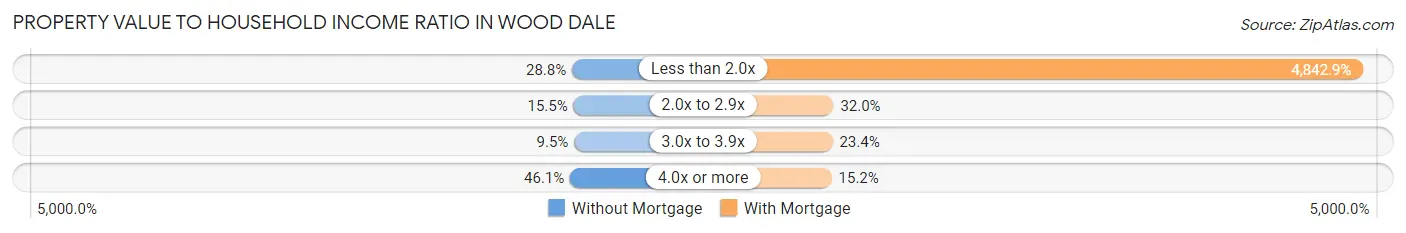
| Value-to-Income Ratio | Without Mortgage | With Mortgage |
| Less than 2.0x | 467 (28.8%) | 110,854 (4,842.9%) |
| 2.0x to 2.9x | 251 (15.5%) | 732 (32.0%) |
| 3.0x to 3.9x | 154 (9.5%) | 535 (23.4%) |
| 4.0x or more | 747 (46.1%) | 347 (15.2%) |
| Total | 1,619 (100.0%) | 2,289 (100.0%) |
Real Estate Taxes by Mortgage Status in Wood Dale
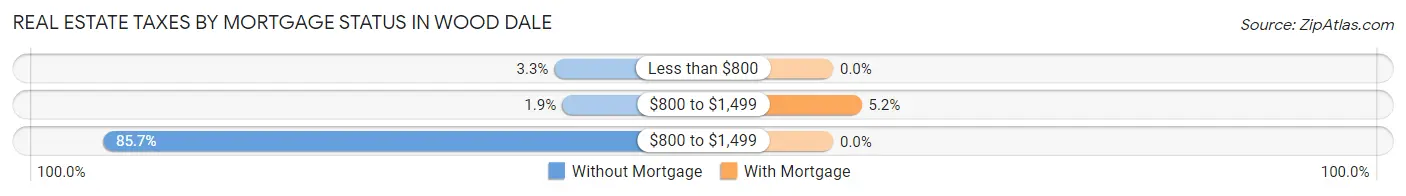
| Property Taxes | Without Mortgage | With Mortgage |
| Less than $800 | 53 (3.3%) | 0 (0.0%) |
| $800 to $1,499 | 30 (1.8%) | 119 (5.2%) |
| $800 to $1,499 | 1,387 (85.7%) | 0 (0.0%) |
| Total | 1,619 (100.0%) | 2,289 (100.0%) |
Health & Disability in Wood Dale
Health Insurance Coverage by Age in Wood Dale
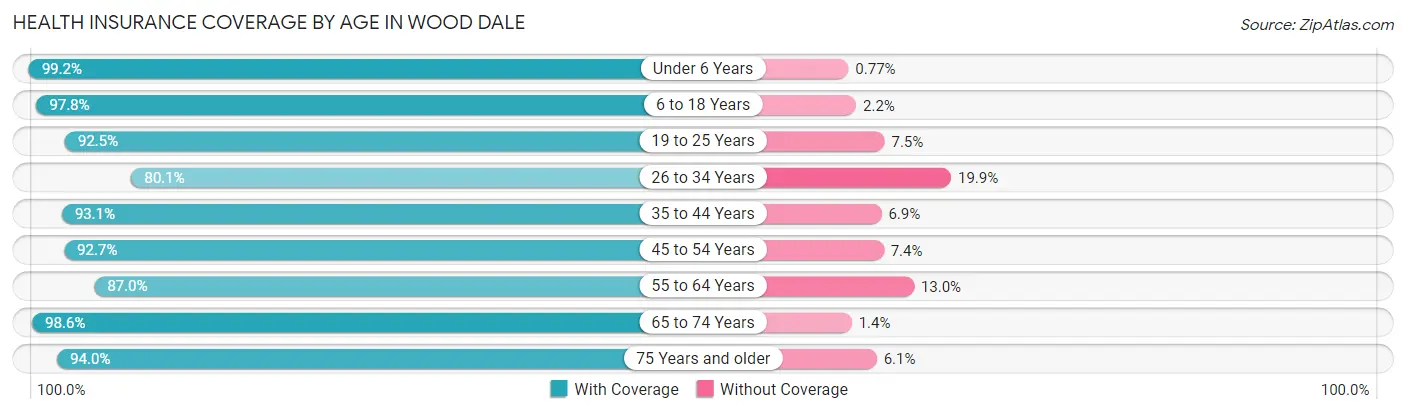
| Age Bracket | With Coverage | Without Coverage |
| Under 6 Years | 900 (99.2%) | 7 (0.8%) |
| 6 to 18 Years | 1,952 (97.8%) | 44 (2.2%) |
| 19 to 25 Years | 1,172 (92.5%) | 95 (7.5%) |
| 26 to 34 Years | 1,356 (80.1%) | 337 (19.9%) |
| 35 to 44 Years | 1,585 (93.1%) | 118 (6.9%) |
| 45 to 54 Years | 1,752 (92.6%) | 139 (7.3%) |
| 55 to 64 Years | 1,634 (87.0%) | 244 (13.0%) |
| 65 to 74 Years | 1,424 (98.6%) | 20 (1.4%) |
| 75 Years and older | 1,056 (94.0%) | 68 (6.0%) |
| Total | 12,831 (92.3%) | 1,072 (7.7%) |
Health Insurance Coverage by Citizenship Status in Wood Dale
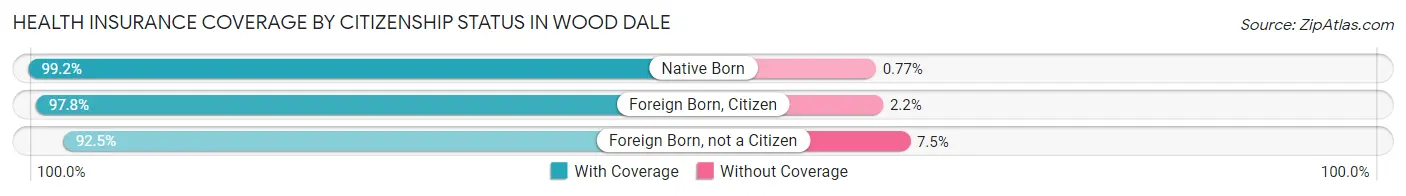
| Citizenship Status | With Coverage | Without Coverage |
| Native Born | 900 (99.2%) | 7 (0.8%) |
| Foreign Born, Citizen | 1,952 (97.8%) | 44 (2.2%) |
| Foreign Born, not a Citizen | 1,172 (92.5%) | 95 (7.5%) |
Health Insurance Coverage by Household Income in Wood Dale
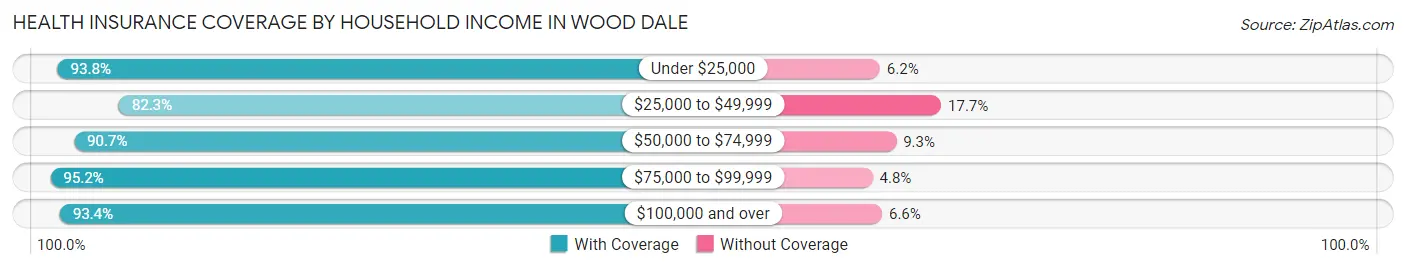
| Household Income | With Coverage | Without Coverage |
| Under $25,000 | 726 (93.8%) | 48 (6.2%) |
| $25,000 to $49,999 | 1,058 (82.3%) | 227 (17.7%) |
| $50,000 to $74,999 | 2,166 (90.7%) | 221 (9.3%) |
| $75,000 to $99,999 | 2,577 (95.2%) | 131 (4.8%) |
| $100,000 and over | 6,283 (93.4%) | 444 (6.6%) |
Public vs Private Health Insurance Coverage by Age in Wood Dale
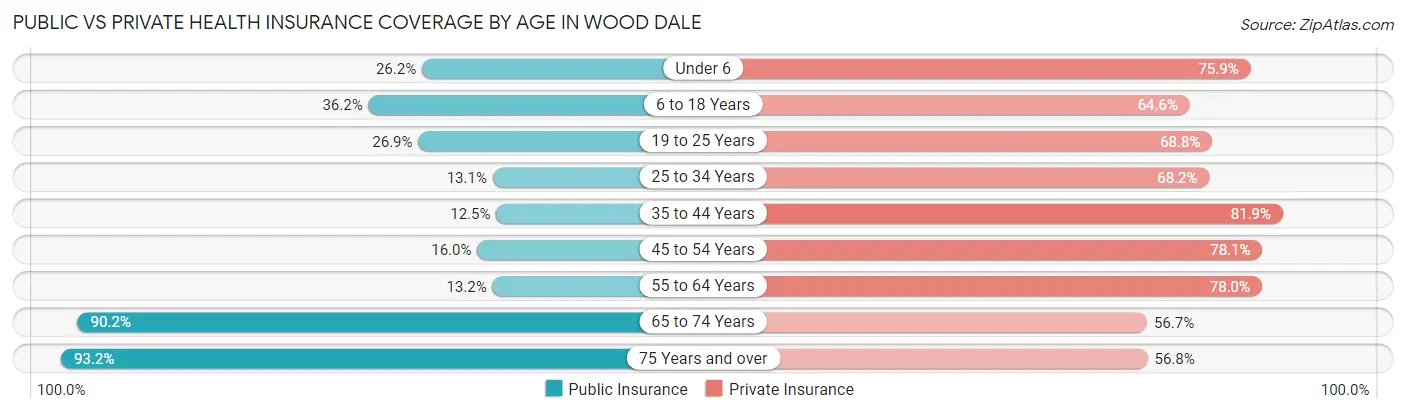
| Age Bracket | Public Insurance | Private Insurance |
| Under 6 | 238 (26.2%) | 688 (75.8%) |
| 6 to 18 Years | 722 (36.2%) | 1,289 (64.6%) |
| 19 to 25 Years | 341 (26.9%) | 871 (68.8%) |
| 25 to 34 Years | 222 (13.1%) | 1,155 (68.2%) |
| 35 to 44 Years | 212 (12.4%) | 1,394 (81.9%) |
| 45 to 54 Years | 302 (16.0%) | 1,476 (78.0%) |
| 55 to 64 Years | 247 (13.2%) | 1,464 (78.0%) |
| 65 to 74 Years | 1,302 (90.2%) | 818 (56.7%) |
| 75 Years and over | 1,048 (93.2%) | 638 (56.8%) |
| Total | 4,634 (33.3%) | 9,793 (70.4%) |
Disability Status by Sex by Age in Wood Dale
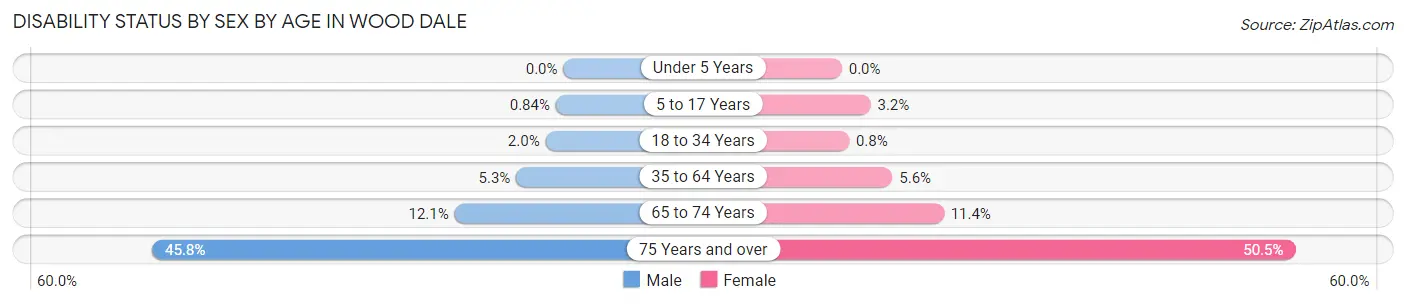
| Age Bracket | Male | Female |
| Under 5 Years | 0 (0.0%) | 0 (0.0%) |
| 5 to 17 Years | 8 (0.8%) | 29 (3.2%) |
| 18 to 34 Years | 35 (2.0%) | 12 (0.8%) |
| 35 to 64 Years | 138 (5.2%) | 160 (5.6%) |
| 65 to 74 Years | 80 (12.1%) | 89 (11.4%) |
| 75 Years and over | 202 (45.8%) | 345 (50.5%) |
Disability Class by Sex by Age in Wood Dale
Disability Class: Hearing Difficulty
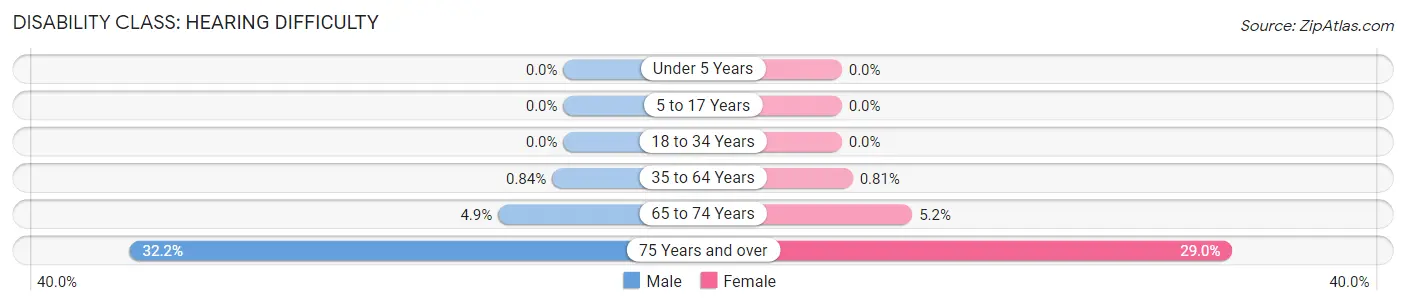
| Age Bracket | Male | Female |
| Under 5 Years | 0 (0.0%) | 0 (0.0%) |
| 5 to 17 Years | 0 (0.0%) | 0 (0.0%) |
| 18 to 34 Years | 0 (0.0%) | 0 (0.0%) |
| 35 to 64 Years | 22 (0.8%) | 23 (0.8%) |
| 65 to 74 Years | 32 (4.9%) | 41 (5.2%) |
| 75 Years and over | 142 (32.2%) | 198 (29.0%) |
Disability Class: Vision Difficulty
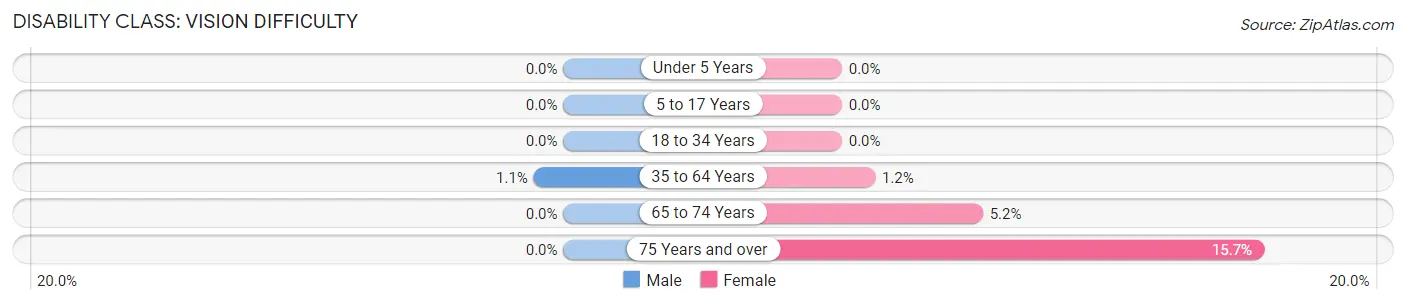
| Age Bracket | Male | Female |
| Under 5 Years | 0 (0.0%) | 0 (0.0%) |
| 5 to 17 Years | 0 (0.0%) | 0 (0.0%) |
| 18 to 34 Years | 0 (0.0%) | 0 (0.0%) |
| 35 to 64 Years | 29 (1.1%) | 35 (1.2%) |
| 65 to 74 Years | 0 (0.0%) | 41 (5.2%) |
| 75 Years and over | 0 (0.0%) | 107 (15.7%) |
Disability Class: Cognitive Difficulty
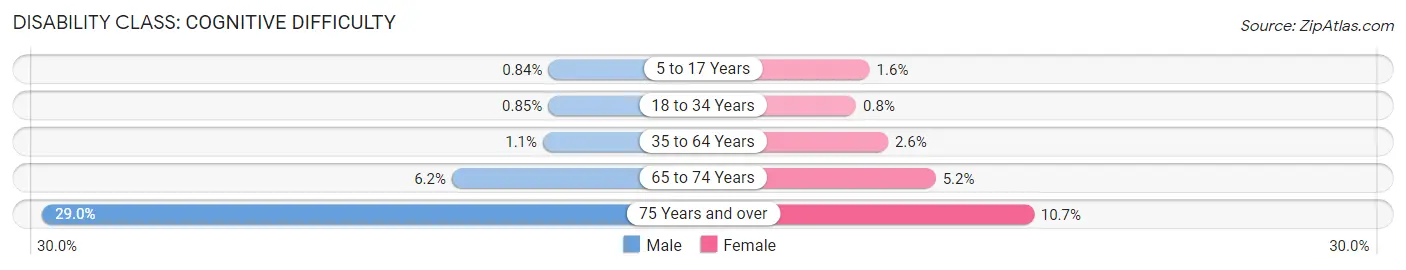
| Age Bracket | Male | Female |
| 5 to 17 Years | 8 (0.8%) | 14 (1.5%) |
| 18 to 34 Years | 15 (0.9%) | 12 (0.8%) |
| 35 to 64 Years | 30 (1.1%) | 73 (2.6%) |
| 65 to 74 Years | 41 (6.2%) | 41 (5.2%) |
| 75 Years and over | 128 (29.0%) | 73 (10.7%) |
Disability Class: Ambulatory Difficulty
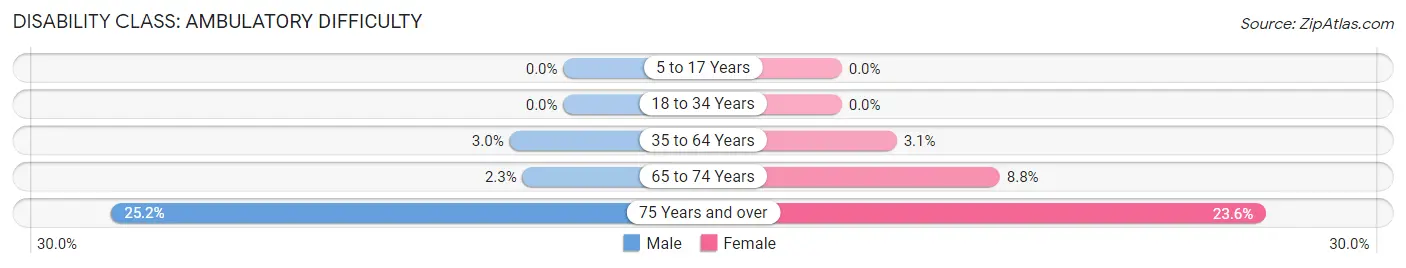
| Age Bracket | Male | Female |
| 5 to 17 Years | 0 (0.0%) | 0 (0.0%) |
| 18 to 34 Years | 0 (0.0%) | 0 (0.0%) |
| 35 to 64 Years | 79 (3.0%) | 87 (3.1%) |
| 65 to 74 Years | 15 (2.3%) | 69 (8.8%) |
| 75 Years and over | 111 (25.2%) | 161 (23.6%) |
Disability Class: Self-Care Difficulty
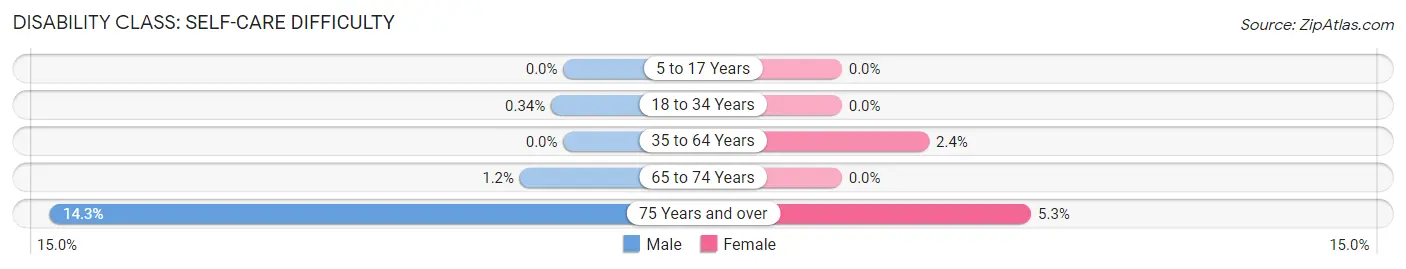
| Age Bracket | Male | Female |
| 5 to 17 Years | 0 (0.0%) | 0 (0.0%) |
| 18 to 34 Years | 6 (0.3%) | 0 (0.0%) |
| 35 to 64 Years | 0 (0.0%) | 69 (2.4%) |
| 65 to 74 Years | 8 (1.2%) | 0 (0.0%) |
| 75 Years and over | 63 (14.3%) | 36 (5.3%) |
Technology Access in Wood Dale
Computing Device Access in Wood Dale
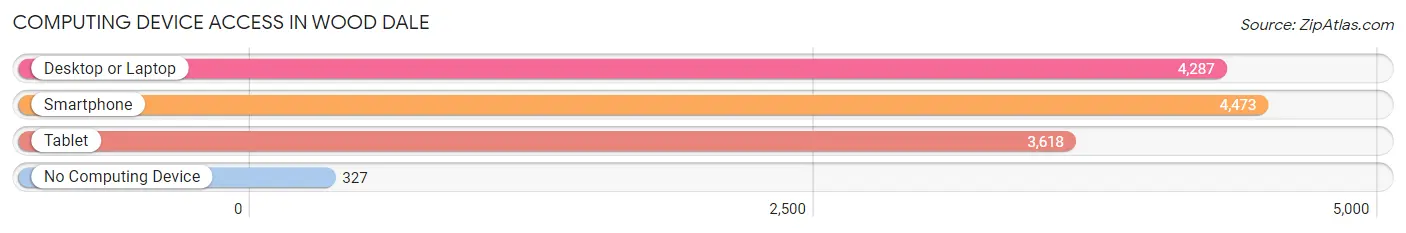
| Device Type | # Households | % Households |
| Desktop or Laptop | 4,287 | 83.9% |
| Smartphone | 4,473 | 87.5% |
| Tablet | 3,618 | 70.8% |
| No Computing Device | 327 | 6.4% |
| Total | 5,113 | 100.0% |
Internet Access in Wood Dale
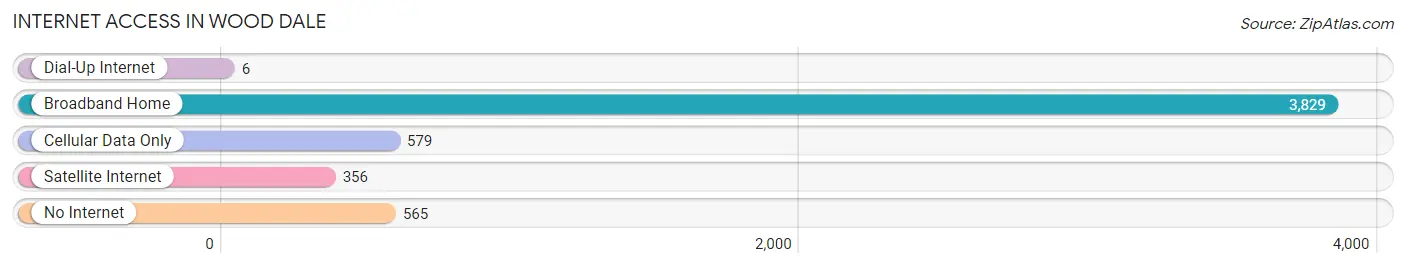
| Internet Type | # Households | % Households |
| Dial-Up Internet | 6 | 0.1% |
| Broadband Home | 3,829 | 74.9% |
| Cellular Data Only | 579 | 11.3% |
| Satellite Internet | 356 | 7.0% |
| No Internet | 565 | 11.1% |
| Total | 5,113 | 100.0% |
Wood Dale Summary
History
Wood Dale, Illinois is a small city located in DuPage County, about 25 miles northwest of Chicago. The city was founded in 1873 by German immigrants, who named it after a nearby grove of trees. The city was incorporated in 1939, and has since grown to a population of over 13,000 people.
The city has a rich history, and was once home to a large German-American population. The city was home to a number of German-American businesses, including a brewery, a sausage factory, and a brickyard. The city was also home to a number of German-American churches, including St. Paul’s Lutheran Church, which was founded in 1875.
The city was also home to a number of other businesses, including a number of factories and a large lumber yard. The city was also home to a number of farms, which provided food for the local population.
Geography
Wood Dale is located in DuPage County, about 25 miles northwest of Chicago. The city is situated on the western edge of the Chicago metropolitan area, and is bordered by the cities of Addison, Bensenville, and Itasca. The city is located on the Des Plaines River, and is surrounded by a number of small lakes and ponds.
The city has a total area of 4.2 square miles, of which 4.1 square miles is land and 0.1 square miles is water. The city is located at an elevation of 645 feet above sea level.
Economy
Wood Dale’s economy is largely based on manufacturing and retail. The city is home to a number of manufacturing companies, including a number of food processing plants, a printing company, and a number of other industrial businesses. The city is also home to a number of retail stores, including a number of grocery stores, a number of restaurants, and a number of other retail outlets.
The city is also home to a number of corporate headquarters, including the headquarters of the American Society of Anesthesiologists, the American Academy of Pediatrics, and the American College of Surgeons.
Demographics
As of the 2010 census, the population of Wood Dale was 13,535. The racial makeup of the city was 87.3% White, 4.2% African American, 0.2% Native American, 4.2% Asian, and 4.1% from other races. Hispanic or Latino of any race were 11.2% of the population.
The median household income in Wood Dale was $63,945, and the median family income was $76,945. The per capita income in the city was $30,945. About 4.2% of families and 5.7% of the population were below the poverty line, including 6.7% of those under age 18 and 4.2% of those age 65 or over.
Common Questions
What is Per Capita Income in Wood Dale?
Per Capita income in Wood Dale is $39,094.
What is the Median Family Income in Wood Dale?
Median Family Income in Wood Dale is $97,446.
What is the Median Household income in Wood Dale?
Median Household Income in Wood Dale is $86,441.
What is Income or Wage Gap in Wood Dale?
Income or Wage Gap in Wood Dale is 24.6%.
Women in Wood Dale earn 75.4 cents for every dollar earned by a man.
What is Family Income Deficit in Wood Dale?
Family Income Deficit in Wood Dale is $7,651.
Families that are below poverty line in Wood Dale earn $7,651 less on average than the poverty threshold level.
What is Inequality or Gini Index in Wood Dale?
Inequality or Gini Index in Wood Dale is 0.39.
What is the Total Population of Wood Dale?
Total Population of Wood Dale is 13,903.
What is the Total Male Population of Wood Dale?
Total Male Population of Wood Dale is 7,062.
What is the Total Female Population of Wood Dale?
Total Female Population of Wood Dale is 6,841.
What is the Ratio of Males per 100 Females in Wood Dale?
There are 103.23 Males per 100 Females in Wood Dale.
What is the Ratio of Females per 100 Males in Wood Dale?
There are 96.87 Females per 100 Males in Wood Dale.
What is the Median Population Age in Wood Dale?
Median Population Age in Wood Dale is 41.8 Years.
What is the Average Family Size in Wood Dale
Average Family Size in Wood Dale is 3.2 People.
What is the Average Household Size in Wood Dale
Average Household Size in Wood Dale is 2.7 People.
How Large is the Labor Force in Wood Dale?
There are 8,083 People in the Labor Forcein in Wood Dale.
What is the Percentage of People in the Labor Force in Wood Dale?
70.0% of People are in the Labor Force in Wood Dale.
What is the Unemployment Rate in Wood Dale?
Unemployment Rate in Wood Dale is 4.6%.