South Amboy, NJ Map & Demographics
South Amboy Map
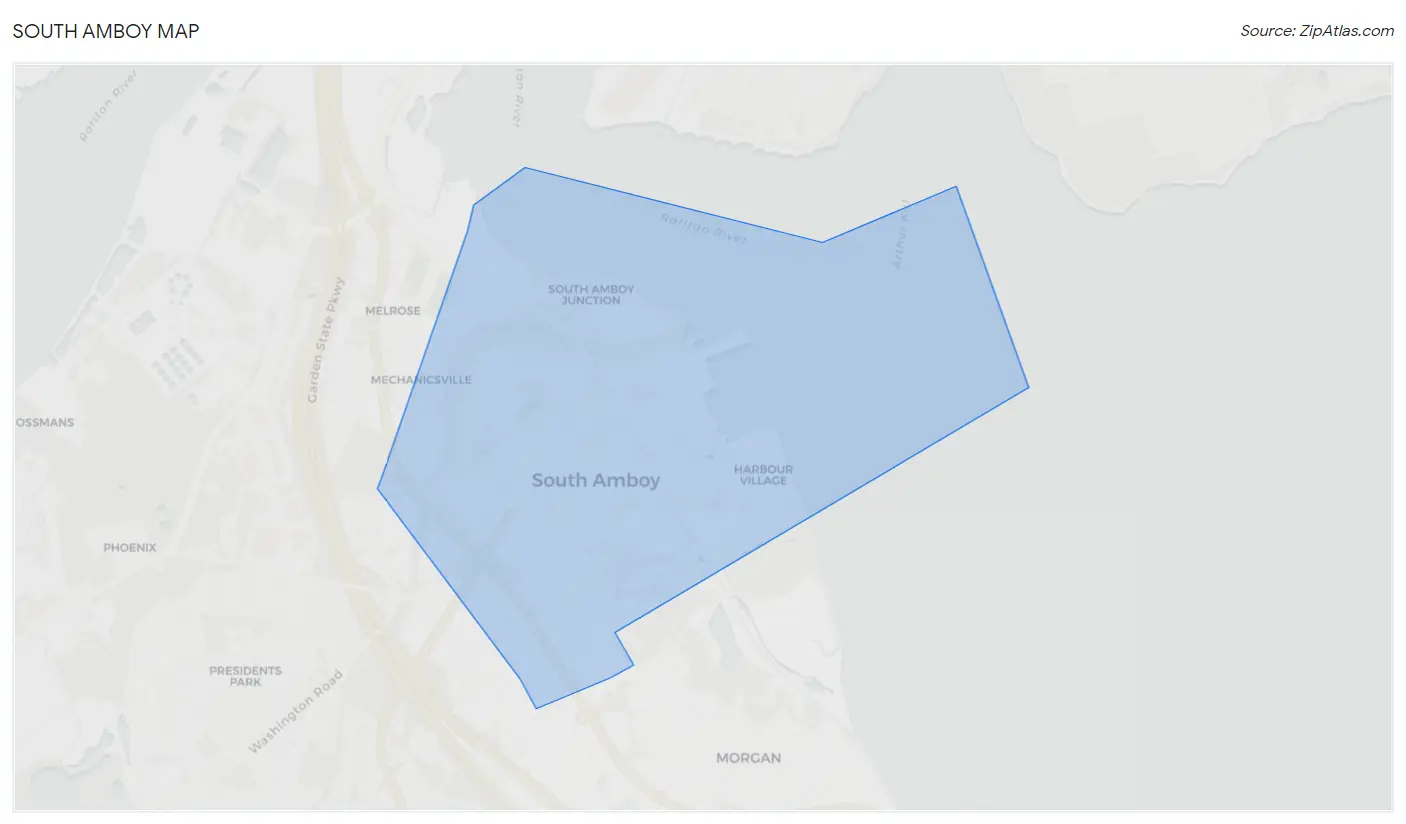
South Amboy Overview
$46,481
PER CAPITA INCOME
$110,576
AVG FAMILY INCOME
$94,776
AVG HOUSEHOLD INCOME
0.3%
WAGE / INCOME GAP [ % ]
99.7¢/ $1
WAGE / INCOME GAP [ $ ]
$8,397
FAMILY INCOME DEFICIT
0.39
INEQUALITY / GINI INDEX
9,336
TOTAL POPULATION
4,270
MALE POPULATION
5,066
FEMALE POPULATION
84.29
MALES / 100 FEMALES
118.64
FEMALES / 100 MALES
41.0
MEDIAN AGE
2.7
AVG FAMILY SIZE
2.3
AVG HOUSEHOLD SIZE
5,610
LABOR FORCE [ PEOPLE ]
70.9%
PERCENT IN LABOR FORCE
5.7%
UNEMPLOYMENT RATE
South Amboy Zip Codes
South Amboy Area Codes
Income in South Amboy
Income Overview in South Amboy
Per Capita Income in South Amboy is $46,481, while median incomes of families and households are $110,576 and $94,776 respectively.
| Characteristic | Number | Measure |
| Per Capita Income | 9,336 | $46,481 |
| Median Family Income | 2,889 | $110,576 |
| Mean Family Income | 2,889 | $116,340 |
| Median Household Income | 4,031 | $94,776 |
| Mean Household Income | 4,031 | $107,104 |
| Income Deficit | 2,889 | $8,397 |
| Wage / Income Gap (%) | 9,336 | 0.30% |
| Wage / Income Gap ($) | 9,336 | 99.70¢ per $1 |
| Gini / Inequality Index | 9,336 | 0.39 |
Earnings by Sex in South Amboy
Average Earnings in South Amboy are $55,811, $55,718 for men and $55,888 for women, a difference of 0.3%.
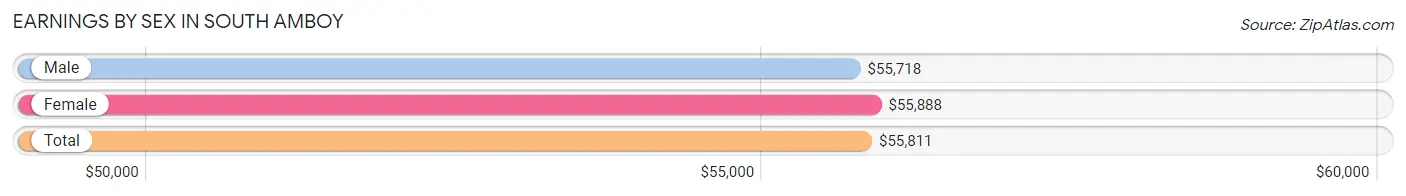
| Sex | Number | Average Earnings |
| Male | 2,878 (50.6%) | $55,718 |
| Female | 2,806 (49.4%) | $55,888 |
| Total | 5,684 (100.0%) | $55,811 |
Earnings by Sex by Income Bracket in South Amboy
The most common earnings brackets in South Amboy are $55,000 to $64,999 for men (534 | 18.5%) and $55,000 to $64,999 for women (617 | 22.0%).
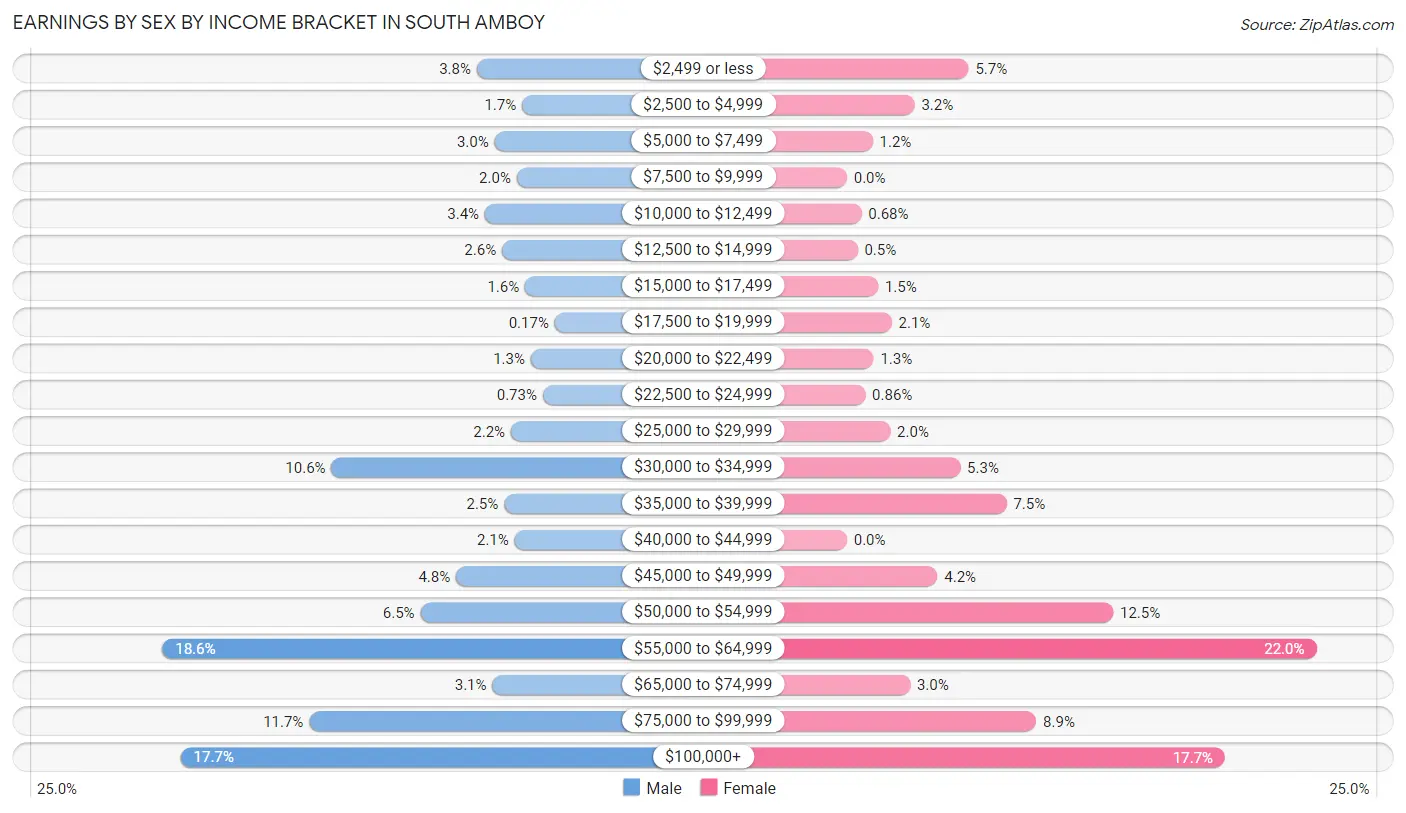
| Income | Male | Female |
| $2,499 or less | 110 (3.8%) | 160 (5.7%) |
| $2,500 to $4,999 | 49 (1.7%) | 89 (3.2%) |
| $5,000 to $7,499 | 86 (3.0%) | 34 (1.2%) |
| $7,500 to $9,999 | 56 (1.9%) | 0 (0.0%) |
| $10,000 to $12,499 | 99 (3.4%) | 19 (0.7%) |
| $12,500 to $14,999 | 76 (2.6%) | 14 (0.5%) |
| $15,000 to $17,499 | 45 (1.6%) | 41 (1.5%) |
| $17,500 to $19,999 | 5 (0.2%) | 59 (2.1%) |
| $20,000 to $22,499 | 37 (1.3%) | 35 (1.3%) |
| $22,500 to $24,999 | 21 (0.7%) | 24 (0.9%) |
| $25,000 to $29,999 | 64 (2.2%) | 57 (2.0%) |
| $30,000 to $34,999 | 306 (10.6%) | 149 (5.3%) |
| $35,000 to $39,999 | 73 (2.5%) | 210 (7.5%) |
| $40,000 to $44,999 | 59 (2.1%) | 0 (0.0%) |
| $45,000 to $49,999 | 138 (4.8%) | 119 (4.2%) |
| $50,000 to $54,999 | 186 (6.5%) | 350 (12.5%) |
| $55,000 to $64,999 | 534 (18.5%) | 617 (22.0%) |
| $65,000 to $74,999 | 89 (3.1%) | 83 (3.0%) |
| $75,000 to $99,999 | 336 (11.7%) | 249 (8.9%) |
| $100,000+ | 509 (17.7%) | 497 (17.7%) |
| Total | 2,878 (100.0%) | 2,806 (100.0%) |
Earnings by Sex by Educational Attainment in South Amboy
Average earnings in South Amboy are $58,511 for men and $57,737 for women, a difference of 1.3%. Men with an educational attainment of graduate degree enjoy the highest average annual earnings of $144,034, while those with less than high school education earn the least with $29,792. Women with an educational attainment of bachelor's degree earn the most with the average annual earnings of $105,702, while those with college or associate's degree education have the smallest earnings of $51,325.
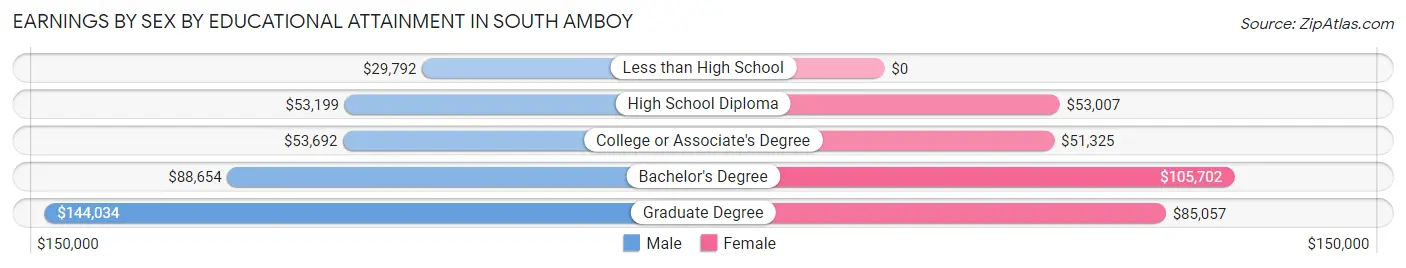
| Educational Attainment | Male Income | Female Income |
| Less than High School | $29,792 | $0 |
| High School Diploma | $53,199 | $53,007 |
| College or Associate's Degree | $53,692 | $51,325 |
| Bachelor's Degree | $88,654 | $105,702 |
| Graduate Degree | $144,034 | $85,057 |
| Total | $58,511 | $57,737 |
Family Income in South Amboy
Family Income Brackets in South Amboy
According to the South Amboy family income data, there are 745 families falling into the $100,000 to $149,999 income range, which is the most common income bracket and makes up 25.8% of all families. Conversely, the less than $10,000 income bracket is the least frequent group with only 3 families (0.1%) belonging to this category.
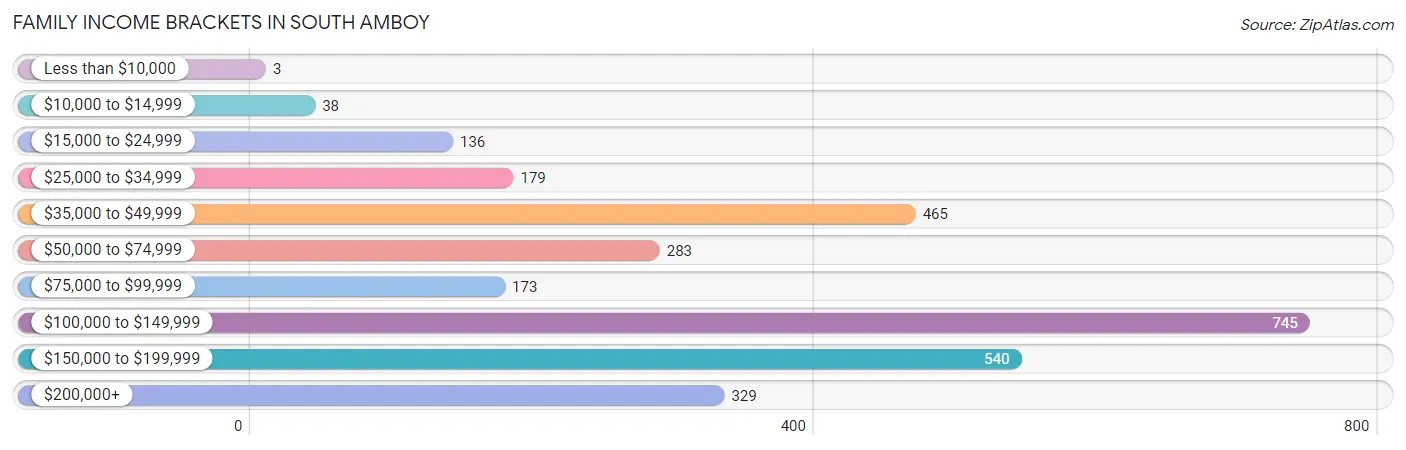
| Income Bracket | # Families | % Families |
| Less than $10,000 | 3 | 0.1% |
| $10,000 to $14,999 | 38 | 1.3% |
| $15,000 to $24,999 | 136 | 4.7% |
| $25,000 to $34,999 | 179 | 6.2% |
| $35,000 to $49,999 | 465 | 16.1% |
| $50,000 to $74,999 | 283 | 9.8% |
| $75,000 to $99,999 | 173 | 6.0% |
| $100,000 to $149,999 | 745 | 25.8% |
| $150,000 to $199,999 | 540 | 18.7% |
| $200,000+ | 329 | 11.4% |
Family Income by Famaliy Size in South Amboy
5-person families (141 | 4.9%) account for the highest median family income in South Amboy with $161,283 per family, while 3-person families (702 | 24.3%) have the highest median income of $42,576 per family member.
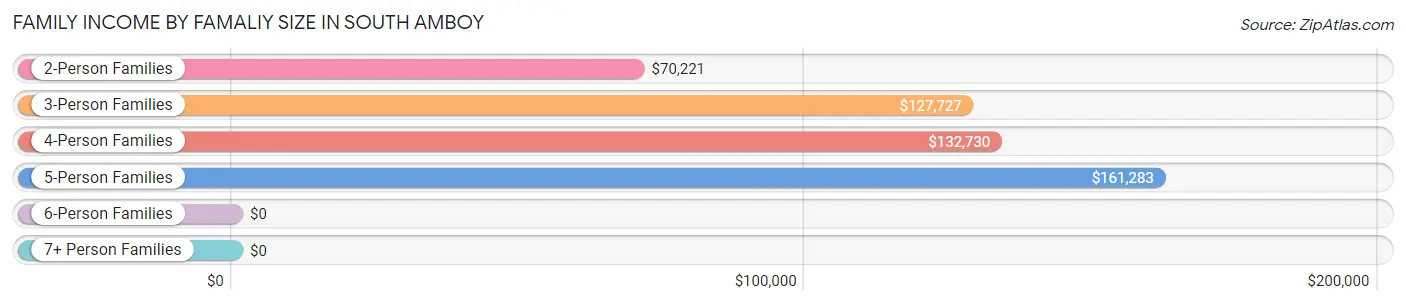
| Income Bracket | # Families | Median Income |
| 2-Person Families | 1,568 (54.3%) | $70,221 |
| 3-Person Families | 702 (24.3%) | $127,727 |
| 4-Person Families | 430 (14.9%) | $132,730 |
| 5-Person Families | 141 (4.9%) | $161,283 |
| 6-Person Families | 48 (1.7%) | $0 |
| 7+ Person Families | 0 (0.0%) | $0 |
| Total | 2,889 (100.0%) | $110,576 |
Family Income by Number of Earners in South Amboy
The median family income in South Amboy is $110,576, with families comprising 3+ earners (387) having the highest median family income of $162,383, while families with 1 earner (1,028) have the lowest median family income of $44,646, accounting for 13.4% and 35.6% of families, respectively.
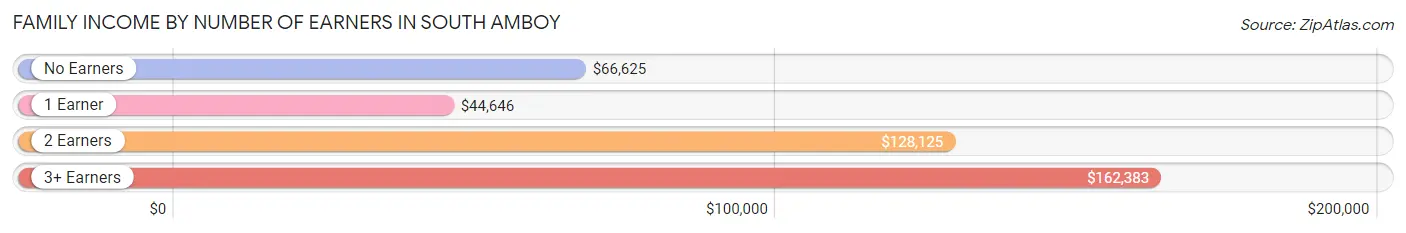
| Number of Earners | # Families | Median Income |
| No Earners | 303 (10.5%) | $66,625 |
| 1 Earner | 1,028 (35.6%) | $44,646 |
| 2 Earners | 1,171 (40.5%) | $128,125 |
| 3+ Earners | 387 (13.4%) | $162,383 |
| Total | 2,889 (100.0%) | $110,576 |
Household Income in South Amboy
Household Income Brackets in South Amboy
With 935 households falling in the category, the $100,000 to $149,999 income range is the most frequent in South Amboy, accounting for 23.2% of all households. In contrast, only 93 households (2.3%) fall into the less than $10,000 income bracket, making it the least populous group.
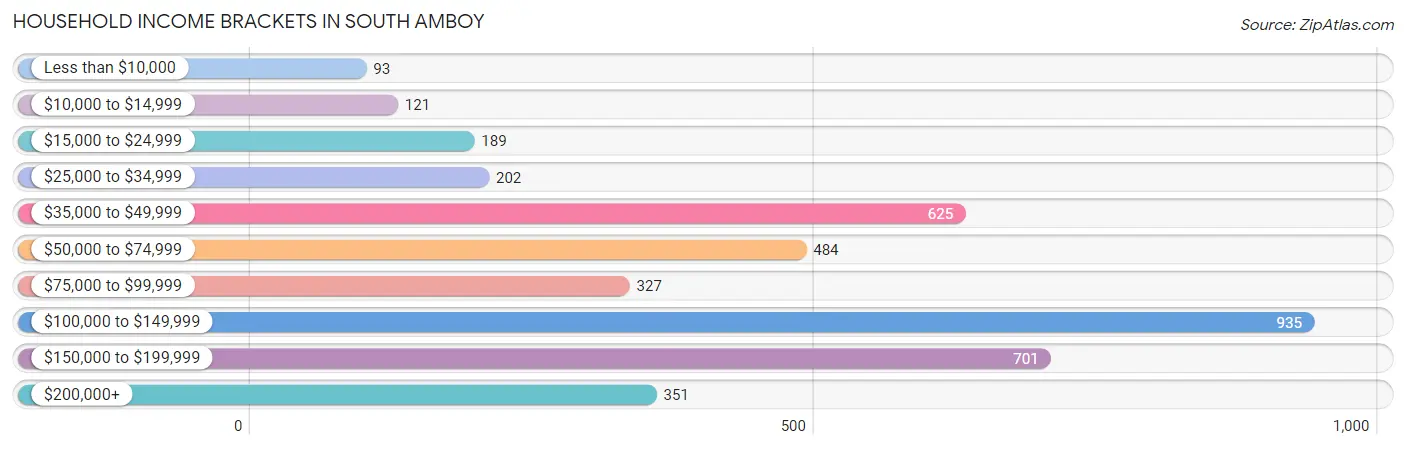
| Income Bracket | # Households | % Households |
| Less than $10,000 | 93 | 2.3% |
| $10,000 to $14,999 | 121 | 3.0% |
| $15,000 to $24,999 | 189 | 4.7% |
| $25,000 to $34,999 | 202 | 5.0% |
| $35,000 to $49,999 | 625 | 15.5% |
| $50,000 to $74,999 | 484 | 12.0% |
| $75,000 to $99,999 | 327 | 8.1% |
| $100,000 to $149,999 | 935 | 23.2% |
| $150,000 to $199,999 | 701 | 17.4% |
| $200,000+ | 351 | 8.7% |
Household Income by Householder Age in South Amboy
The median household income in South Amboy is $94,776, with the highest median household income of $121,657 found in the 25 to 44 years age bracket for the primary householder. A total of 1,414 households (35.1%) fall into this category. Meanwhile, the 15 to 24 years age bracket for the primary householder has the lowest median household income of $0, with 32 households (0.8%) in this group.
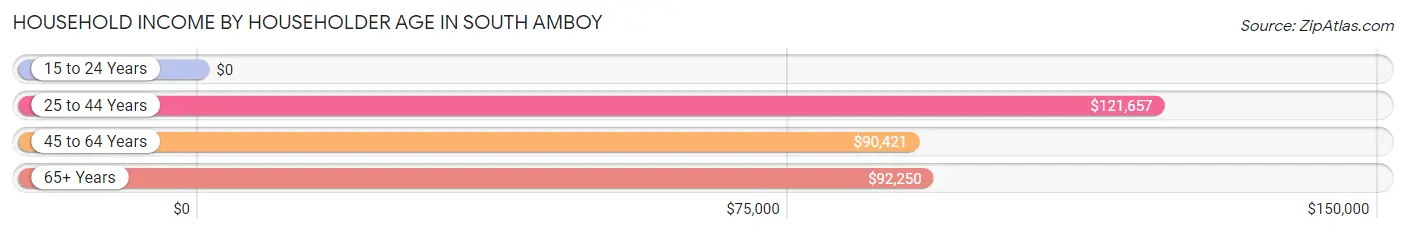
| Income Bracket | # Households | Median Income |
| 15 to 24 Years | 32 (0.8%) | $0 |
| 25 to 44 Years | 1,414 (35.1%) | $121,657 |
| 45 to 64 Years | 1,650 (40.9%) | $90,421 |
| 65+ Years | 935 (23.2%) | $92,250 |
| Total | 4,031 (100.0%) | $94,776 |
Poverty in South Amboy
Income Below Poverty by Sex and Age in South Amboy
With 5.9% poverty level for males and 8.5% for females among the residents of South Amboy, 12 to 14 year old males and 12 to 14 year old females are the most vulnerable to poverty, with 14 males (26.4%) and 104 females (46.4%) in their respective age groups living below the poverty level.
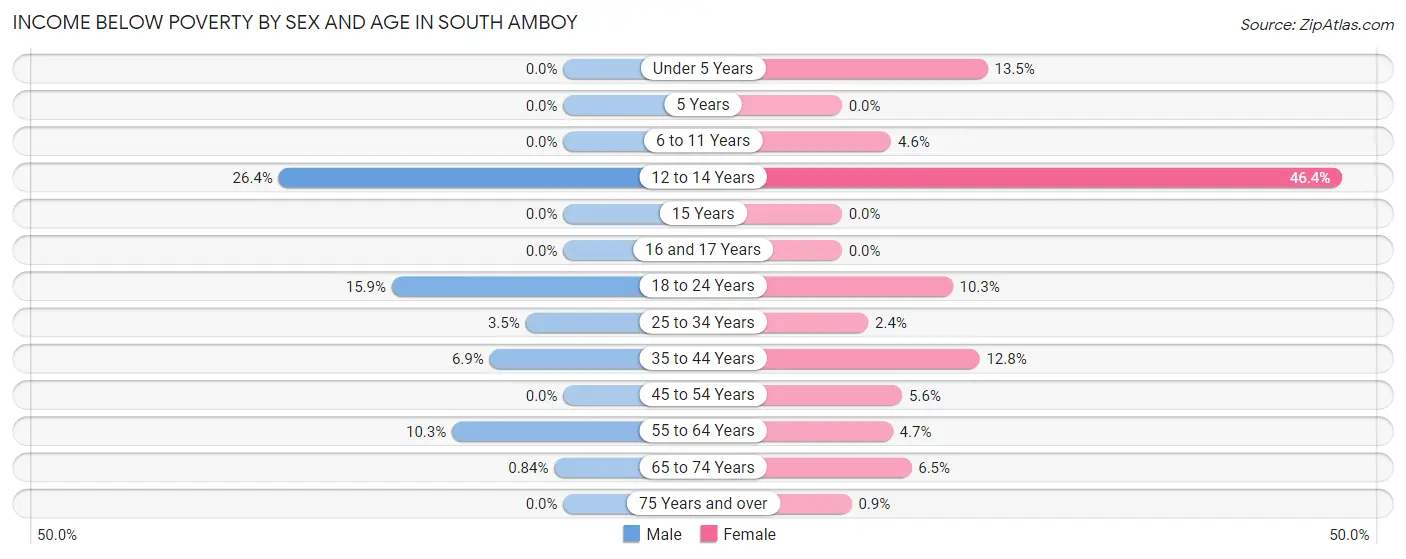
| Age Bracket | Male | Female |
| Under 5 Years | 0 (0.0%) | 36 (13.5%) |
| 5 Years | 0 (0.0%) | 0 (0.0%) |
| 6 to 11 Years | 0 (0.0%) | 19 (4.6%) |
| 12 to 14 Years | 14 (26.4%) | 104 (46.4%) |
| 15 Years | 0 (0.0%) | 0 (0.0%) |
| 16 and 17 Years | 0 (0.0%) | 0 (0.0%) |
| 18 to 24 Years | 57 (15.9%) | 40 (10.3%) |
| 25 to 34 Years | 26 (3.5%) | 18 (2.4%) |
| 35 to 44 Years | 45 (6.9%) | 91 (12.8%) |
| 45 to 54 Years | 0 (0.0%) | 38 (5.6%) |
| 55 to 64 Years | 106 (10.3%) | 39 (4.7%) |
| 65 to 74 Years | 4 (0.8%) | 43 (6.5%) |
| 75 Years and over | 0 (0.0%) | 1 (0.9%) |
| Total | 252 (5.9%) | 429 (8.5%) |
Income Above Poverty by Sex and Age in South Amboy
According to the poverty statistics in South Amboy, males aged under 5 years and females aged 16 and 17 years are the age groups that are most secure financially, with 100.0% of males and 100.0% of females in these age groups living above the poverty line.
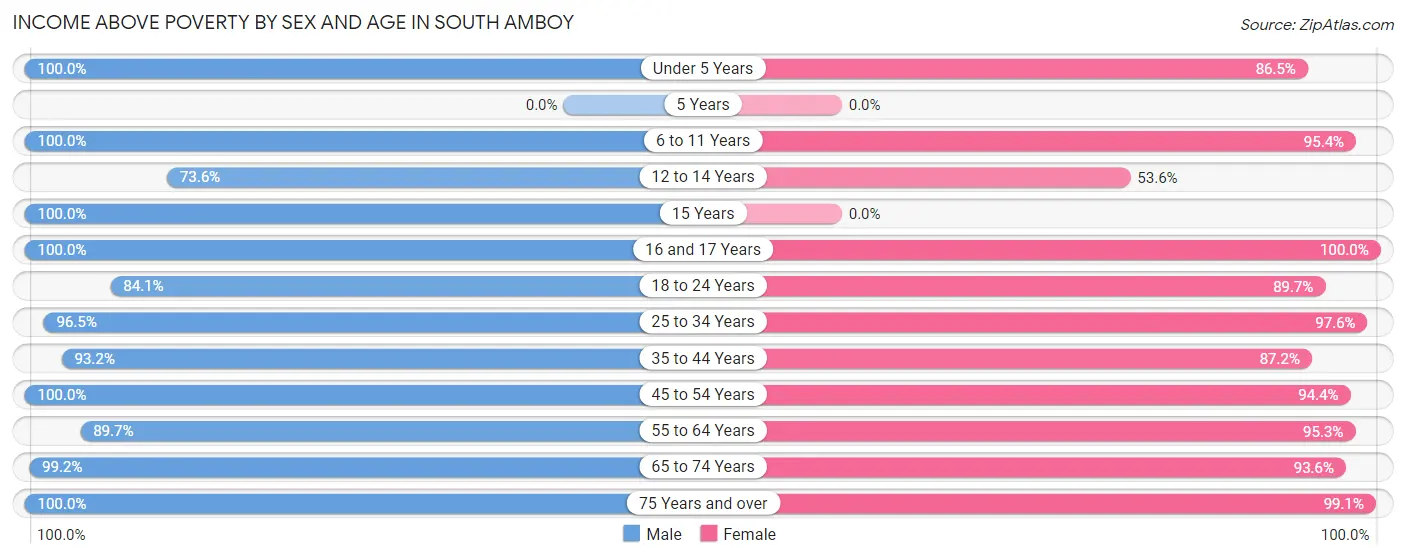
| Age Bracket | Male | Female |
| Under 5 Years | 189 (100.0%) | 230 (86.5%) |
| 5 Years | 0 (0.0%) | 0 (0.0%) |
| 6 to 11 Years | 208 (100.0%) | 396 (95.4%) |
| 12 to 14 Years | 39 (73.6%) | 120 (53.6%) |
| 15 Years | 68 (100.0%) | 0 (0.0%) |
| 16 and 17 Years | 47 (100.0%) | 14 (100.0%) |
| 18 to 24 Years | 301 (84.1%) | 349 (89.7%) |
| 25 to 34 Years | 715 (96.5%) | 721 (97.6%) |
| 35 to 44 Years | 612 (93.1%) | 621 (87.2%) |
| 45 to 54 Years | 278 (100.0%) | 640 (94.4%) |
| 55 to 64 Years | 920 (89.7%) | 788 (95.3%) |
| 65 to 74 Years | 474 (99.2%) | 624 (93.5%) |
| 75 Years and over | 161 (100.0%) | 110 (99.1%) |
| Total | 4,012 (94.1%) | 4,613 (91.5%) |
Income Below Poverty Among Married-Couple Families in South Amboy
The poverty statistics for married-couple families in South Amboy show that 1.3% or 25 of the total 1,945 families live below the poverty line. Families with no children have the highest poverty rate of 1.8%, comprising of 25 families. On the other hand, families with 1 or 2 children have the lowest poverty rate of 0.0%, which includes 0 families.
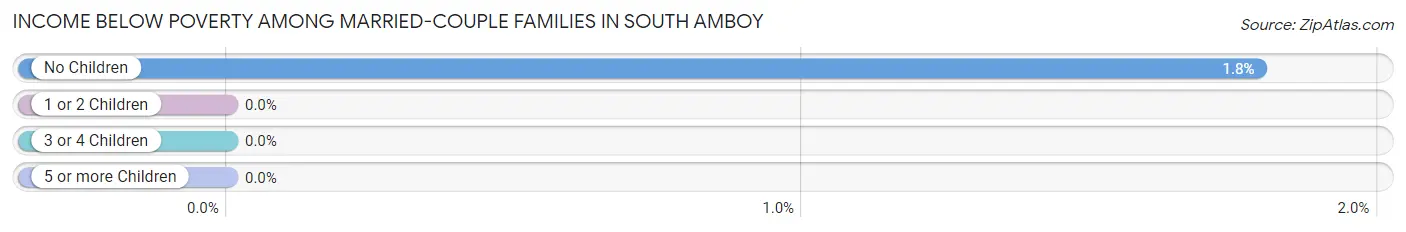
| Children | Above Poverty | Below Poverty |
| No Children | 1,374 (98.2%) | 25 (1.8%) |
| 1 or 2 Children | 500 (100.0%) | 0 (0.0%) |
| 3 or 4 Children | 46 (100.0%) | 0 (0.0%) |
| 5 or more Children | 0 (0.0%) | 0 (0.0%) |
| Total | 1,920 (98.7%) | 25 (1.3%) |
Income Below Poverty Among Single-Parent Households in South Amboy
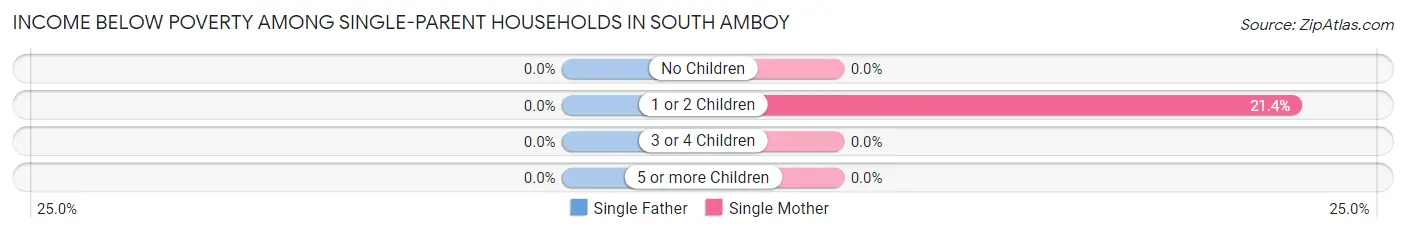
| Children | Single Father | Single Mother |
| No Children | 0 (0.0%) | 0 (0.0%) |
| 1 or 2 Children | 0 (0.0%) | 114 (21.3%) |
| 3 or 4 Children | 0 (0.0%) | 0 (0.0%) |
| 5 or more Children | 0 (0.0%) | 0 (0.0%) |
| Total | 0 (0.0%) | 114 (13.2%) |
Income Below Poverty Among Married-Couple vs Single-Parent Households in South Amboy
The poverty data for South Amboy shows that 25 of the married-couple family households (1.3%) and 114 of the single-parent households (12.1%) are living below the poverty level. Within the married-couple family households, those with no children have the highest poverty rate, with 25 households (1.8%) falling below the poverty line. Among the single-parent households, those with 1 or 2 children have the highest poverty rate, with 114 household (21.3%) living below poverty.
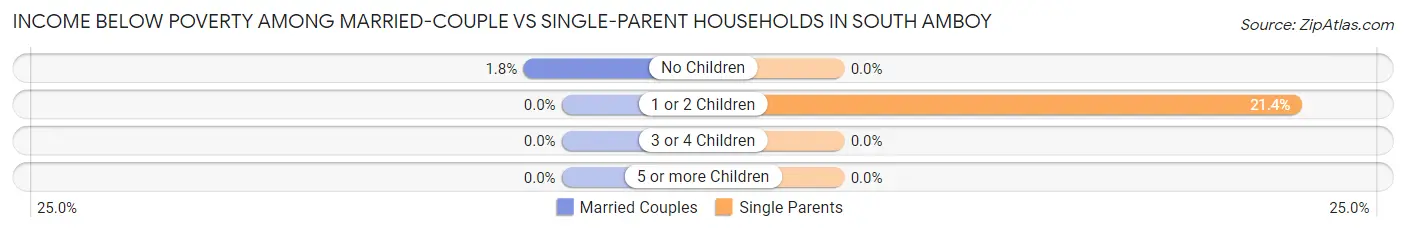
| Children | Married-Couple Families | Single-Parent Households |
| No Children | 25 (1.8%) | 0 (0.0%) |
| 1 or 2 Children | 0 (0.0%) | 114 (21.3%) |
| 3 or 4 Children | 0 (0.0%) | 0 (0.0%) |
| 5 or more Children | 0 (0.0%) | 0 (0.0%) |
| Total | 25 (1.3%) | 114 (12.1%) |
Race in South Amboy
The most populous races in South Amboy are White / Caucasian (6,007 | 64.3%), Hispanic or Latino (2,266 | 24.3%), and Black / African American (1,074 | 11.5%).
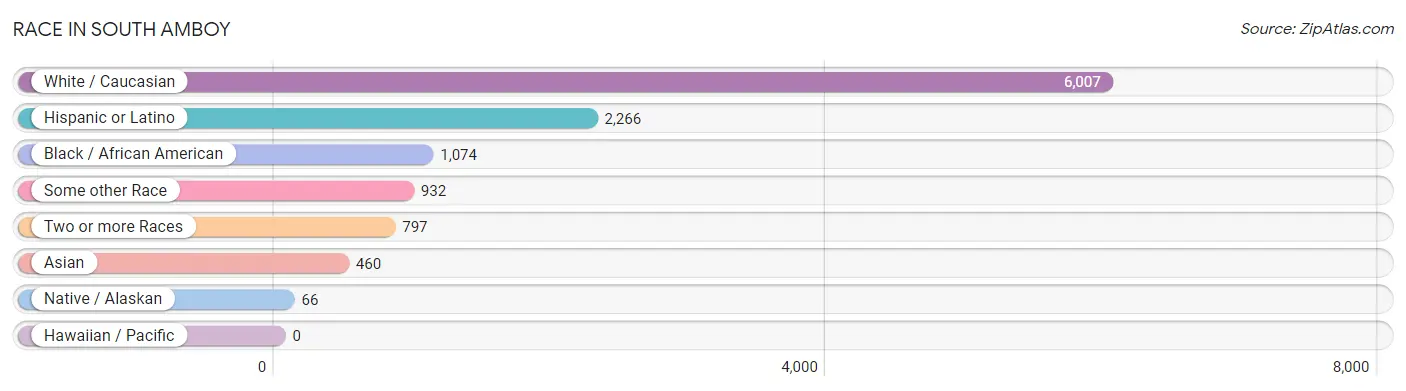
| Race | # Population | % Population |
| Asian | 460 | 4.9% |
| Black / African American | 1,074 | 11.5% |
| Hawaiian / Pacific | 0 | 0.0% |
| Hispanic or Latino | 2,266 | 24.3% |
| Native / Alaskan | 66 | 0.7% |
| White / Caucasian | 6,007 | 64.3% |
| Two or more Races | 797 | 8.5% |
| Some other Race | 932 | 10.0% |
| Total | 9,336 | 100.0% |
Ancestry in South Amboy
The most populous ancestries reported in South Amboy are Irish (1,755 | 18.8%), Italian (1,433 | 15.3%), Polish (1,013 | 10.8%), German (974 | 10.4%), and Dominican (692 | 7.4%), together accounting for 62.8% of all South Amboy residents.
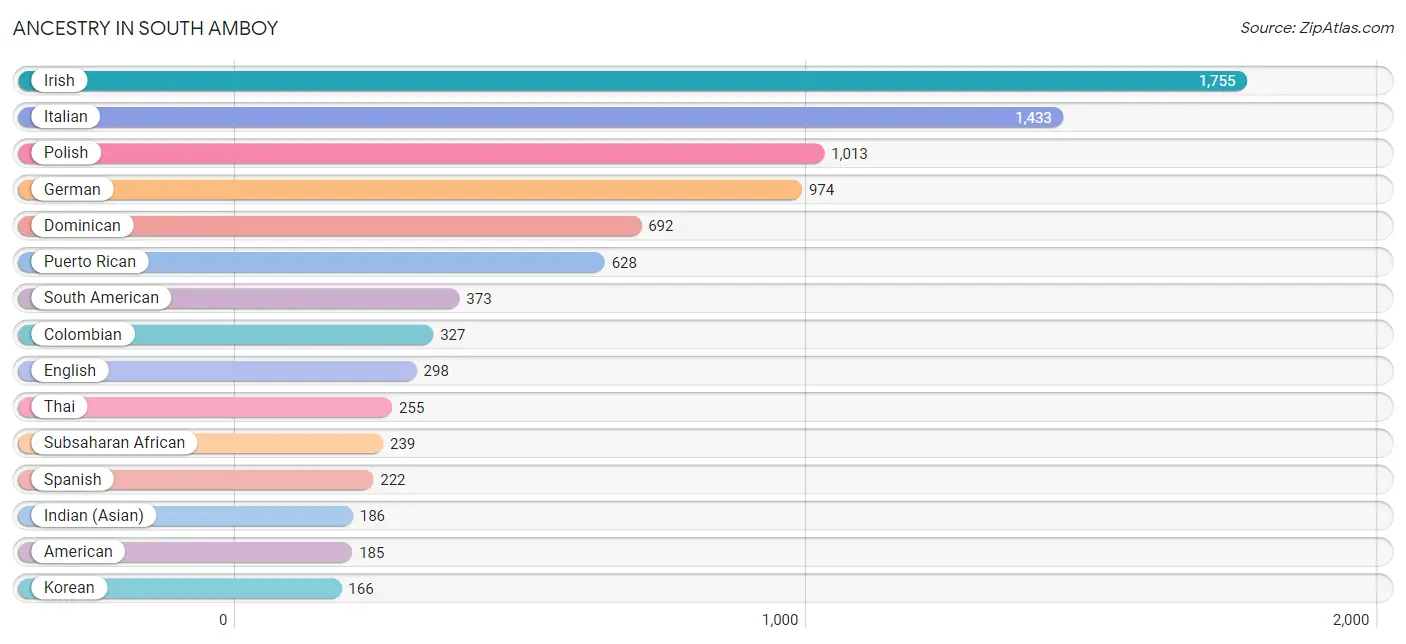
| Ancestry | # Population | % Population |
| African | 96 | 1.0% |
| American | 185 | 2.0% |
| Arab | 129 | 1.4% |
| Australian | 21 | 0.2% |
| Brazilian | 19 | 0.2% |
| British | 10 | 0.1% |
| Central American | 45 | 0.5% |
| Central American Indian | 65 | 0.7% |
| Colombian | 327 | 3.5% |
| Croatian | 12 | 0.1% |
| Cuban | 99 | 1.1% |
| Czech | 72 | 0.8% |
| Danish | 12 | 0.1% |
| Dominican | 692 | 7.4% |
| Dutch | 118 | 1.3% |
| Eastern European | 24 | 0.3% |
| Egyptian | 25 | 0.3% |
| English | 298 | 3.2% |
| French | 75 | 0.8% |
| German | 974 | 10.4% |
| Greek | 37 | 0.4% |
| Guatemalan | 45 | 0.5% |
| Hungarian | 120 | 1.3% |
| Indian (Asian) | 186 | 2.0% |
| Irish | 1,755 | 18.8% |
| Israeli | 1 | 0.0% |
| Italian | 1,433 | 15.3% |
| Korean | 166 | 1.8% |
| Mexican | 147 | 1.6% |
| Mexican American Indian | 21 | 0.2% |
| Nigerian | 143 | 1.5% |
| Norwegian | 35 | 0.4% |
| Pennsylvania German | 21 | 0.2% |
| Peruvian | 46 | 0.5% |
| Polish | 1,013 | 10.8% |
| Portuguese | 3 | 0.0% |
| Pueblo | 3 | 0.0% |
| Puerto Rican | 628 | 6.7% |
| Russian | 145 | 1.5% |
| Scotch-Irish | 12 | 0.1% |
| Scottish | 43 | 0.5% |
| Slovak | 11 | 0.1% |
| South American | 373 | 4.0% |
| Spaniard | 45 | 0.5% |
| Spanish | 222 | 2.4% |
| Subsaharan African | 239 | 2.6% |
| Swedish | 151 | 1.6% |
| Swiss | 24 | 0.3% |
| Thai | 255 | 2.7% |
| Ukrainian | 107 | 1.1% |
| Welsh | 65 | 0.7% | View All 51 Rows |
Immigrants in South Amboy
The most numerous immigrant groups reported in South Amboy came from Latin America (821 | 8.8%), Europe (523 | 5.6%), Eastern Europe (456 | 4.9%), Caribbean (416 | 4.5%), and Poland (389 | 4.2%), together accounting for 27.9% of all South Amboy residents.
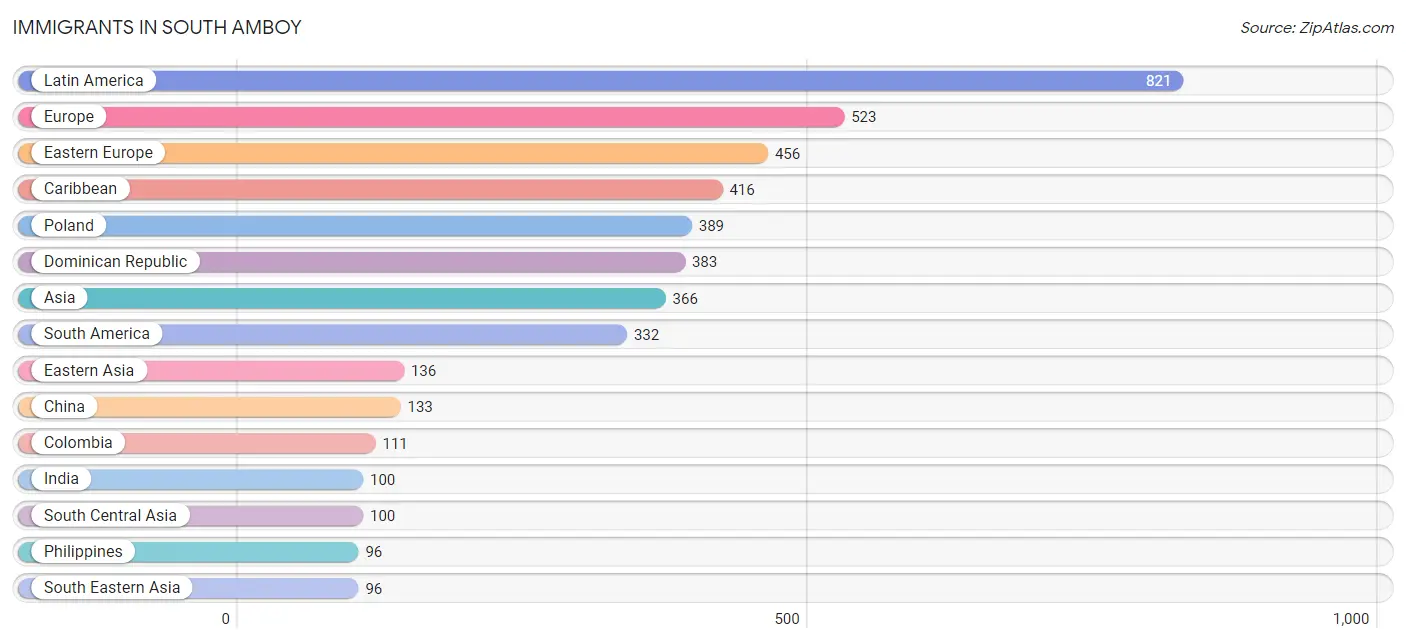
| Immigration Origin | # Population | % Population |
| Africa | 38 | 0.4% |
| Asia | 366 | 3.9% |
| Brazil | 52 | 0.6% |
| Caribbean | 416 | 4.5% |
| Central America | 73 | 0.8% |
| China | 133 | 1.4% |
| Colombia | 111 | 1.2% |
| Cuba | 33 | 0.4% |
| Dominican Republic | 383 | 4.1% |
| Eastern Asia | 136 | 1.5% |
| Eastern Europe | 456 | 4.9% |
| Egypt | 25 | 0.3% |
| Europe | 523 | 5.6% |
| Germany | 33 | 0.4% |
| Guyana | 19 | 0.2% |
| India | 100 | 1.1% |
| Israel | 15 | 0.2% |
| Jordan | 19 | 0.2% |
| Korea | 3 | 0.0% |
| Latin America | 821 | 8.8% |
| Mexico | 73 | 0.8% |
| Netherlands | 34 | 0.4% |
| Nigeria | 13 | 0.1% |
| Northern Africa | 25 | 0.3% |
| Peru | 94 | 1.0% |
| Philippines | 96 | 1.0% |
| Poland | 389 | 4.2% |
| Romania | 28 | 0.3% |
| Russia | 39 | 0.4% |
| South America | 332 | 3.6% |
| South Central Asia | 100 | 1.1% |
| South Eastern Asia | 96 | 1.0% |
| Taiwan | 62 | 0.7% |
| Uruguay | 28 | 0.3% |
| Venezuela | 28 | 0.3% |
| Western Africa | 13 | 0.1% |
| Western Asia | 34 | 0.4% |
| Western Europe | 67 | 0.7% | View All 38 Rows |
Sex and Age in South Amboy
Sex and Age in South Amboy
The most populous age groups in South Amboy are 55 to 59 Years (635 | 14.9%) for men and 30 to 34 Years (537 | 10.6%) for women.
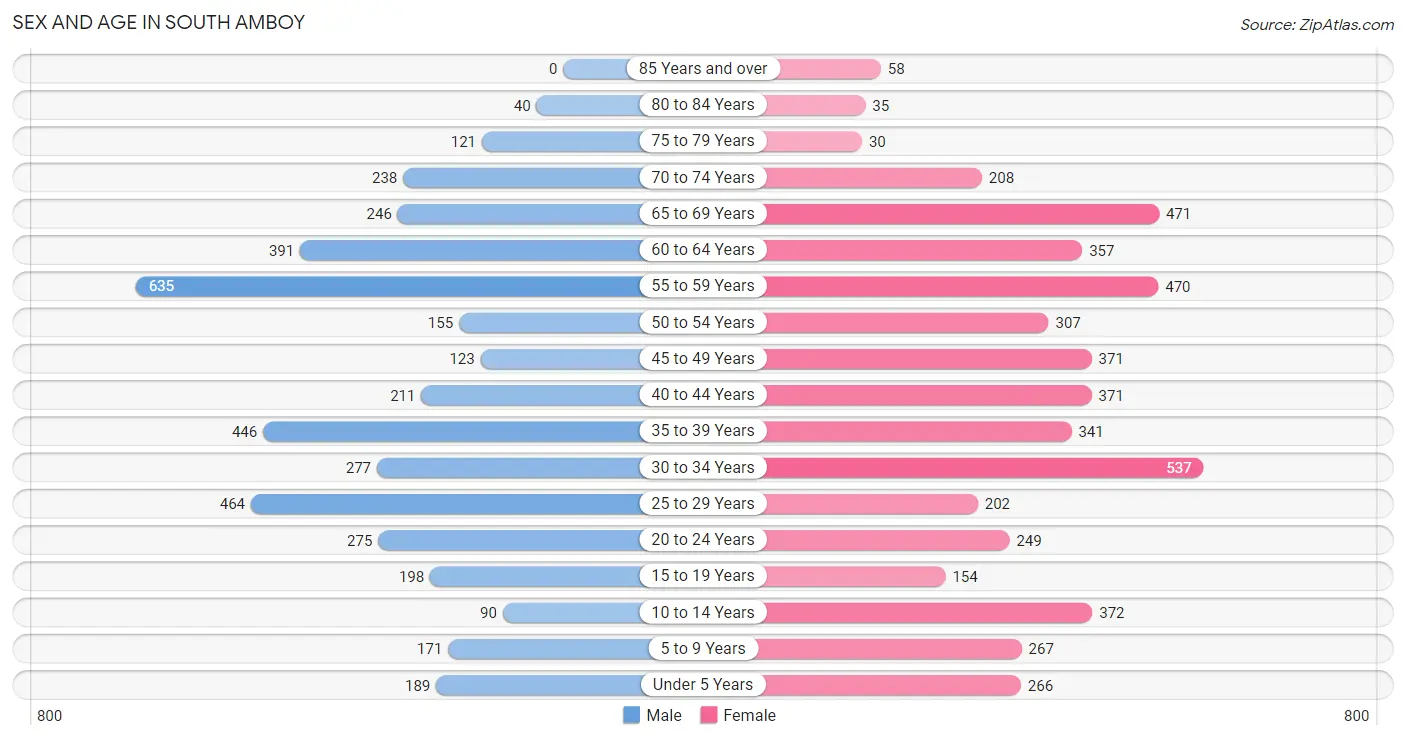
| Age Bracket | Male | Female |
| Under 5 Years | 189 (4.4%) | 266 (5.2%) |
| 5 to 9 Years | 171 (4.0%) | 267 (5.3%) |
| 10 to 14 Years | 90 (2.1%) | 372 (7.3%) |
| 15 to 19 Years | 198 (4.6%) | 154 (3.0%) |
| 20 to 24 Years | 275 (6.4%) | 249 (4.9%) |
| 25 to 29 Years | 464 (10.9%) | 202 (4.0%) |
| 30 to 34 Years | 277 (6.5%) | 537 (10.6%) |
| 35 to 39 Years | 446 (10.4%) | 341 (6.7%) |
| 40 to 44 Years | 211 (4.9%) | 371 (7.3%) |
| 45 to 49 Years | 123 (2.9%) | 371 (7.3%) |
| 50 to 54 Years | 155 (3.6%) | 307 (6.1%) |
| 55 to 59 Years | 635 (14.9%) | 470 (9.3%) |
| 60 to 64 Years | 391 (9.2%) | 357 (7.0%) |
| 65 to 69 Years | 246 (5.8%) | 471 (9.3%) |
| 70 to 74 Years | 238 (5.6%) | 208 (4.1%) |
| 75 to 79 Years | 121 (2.8%) | 30 (0.6%) |
| 80 to 84 Years | 40 (0.9%) | 35 (0.7%) |
| 85 Years and over | 0 (0.0%) | 58 (1.1%) |
| Total | 4,270 (100.0%) | 5,066 (100.0%) |
Families and Households in South Amboy
Median Family Size in South Amboy
The median family size in South Amboy is 2.74 persons per family, with married-couple families (1,945 | 67.3%) accounting for the largest median family size of 2.88 persons per family. On the other hand, single male/father families (77 | 2.7%) represent the smallest median family size with 2.30 persons per family.
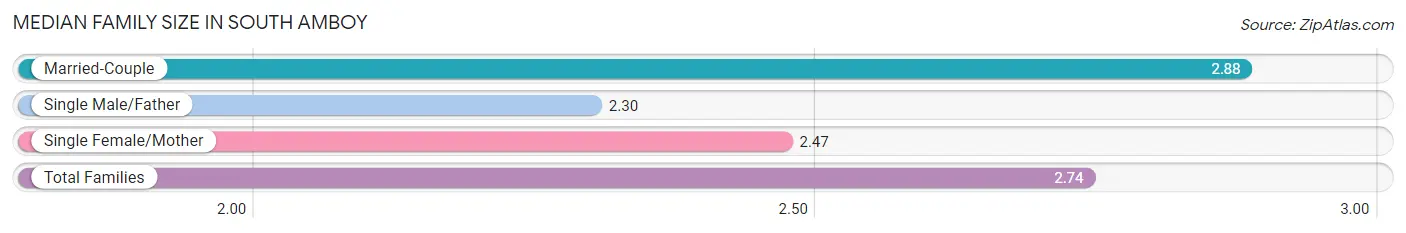
| Family Type | # Families | Family Size |
| Married-Couple | 1,945 (67.3%) | 2.88 |
| Single Male/Father | 77 (2.7%) | 2.30 |
| Single Female/Mother | 867 (30.0%) | 2.47 |
| Total Families | 2,889 (100.0%) | 2.74 |
Median Household Size in South Amboy
The median household size in South Amboy is 2.31 persons per household, with married-couple households (1,945 | 48.2%) accounting for the largest median household size of 2.88 persons per household. non-family households (1,142 | 28.3%) represent the smallest median household size with 1.16 persons per household.
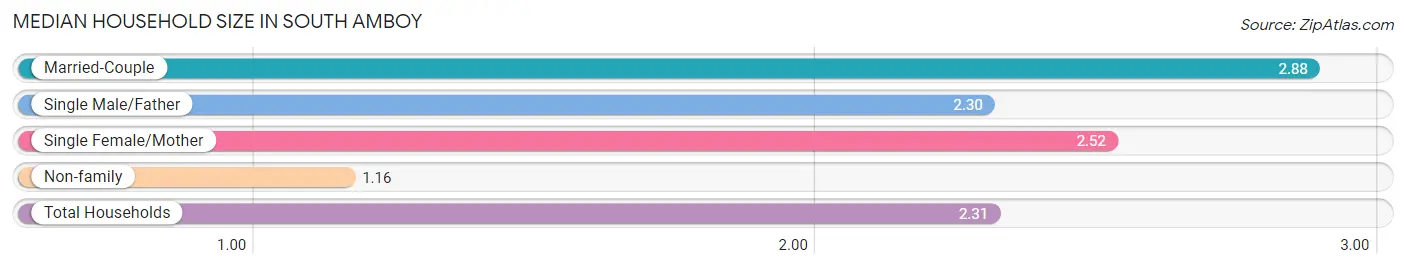
| Household Type | # Households | Household Size |
| Married-Couple | 1,945 (48.2%) | 2.88 |
| Single Male/Father | 77 (1.9%) | 2.30 |
| Single Female/Mother | 867 (21.5%) | 2.52 |
| Non-family | 1,142 (28.3%) | 1.16 |
| Total Households | 4,031 (100.0%) | 2.31 |
Household Size by Marriage Status in South Amboy
Out of a total of 4,031 households in South Amboy, 2,889 (71.7%) are family households, while 1,142 (28.3%) are nonfamily households. The most numerous type of family households are 2-person households, comprising 1,546, and the most common type of nonfamily households are 1-person households, comprising 971.
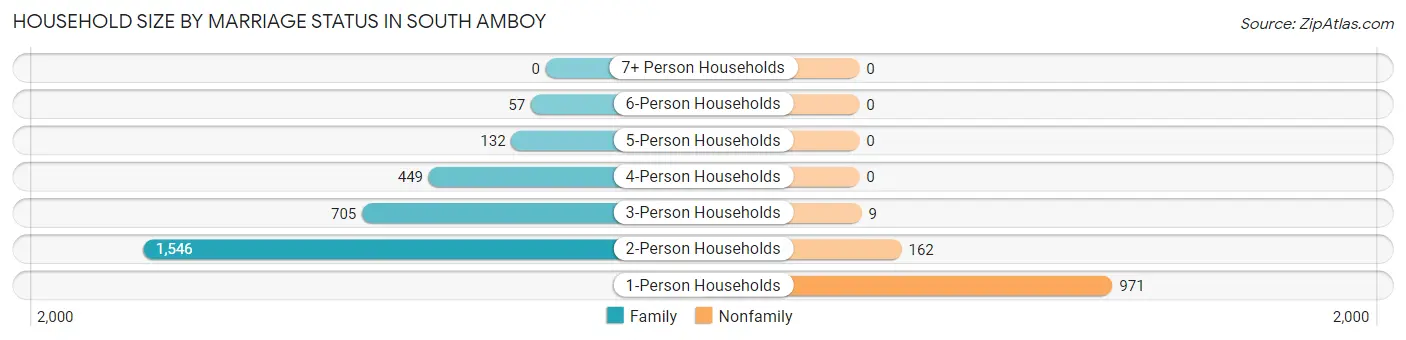
| Household Size | Family Households | Nonfamily Households |
| 1-Person Households | - | 971 (24.1%) |
| 2-Person Households | 1,546 (38.4%) | 162 (4.0%) |
| 3-Person Households | 705 (17.5%) | 9 (0.2%) |
| 4-Person Households | 449 (11.1%) | 0 (0.0%) |
| 5-Person Households | 132 (3.3%) | 0 (0.0%) |
| 6-Person Households | 57 (1.4%) | 0 (0.0%) |
| 7+ Person Households | 0 (0.0%) | 0 (0.0%) |
| Total | 2,889 (71.7%) | 1,142 (28.3%) |
Female Fertility in South Amboy
Fertility by Age in South Amboy
Average fertility rate in South Amboy is 42.0 births per 1,000 women. Women in the age bracket of 20 to 34 years have the highest fertility rate with 96.0 births per 1,000 women. Women in the age bracket of 20 to 34 years acount for 100.0% of all women with births.
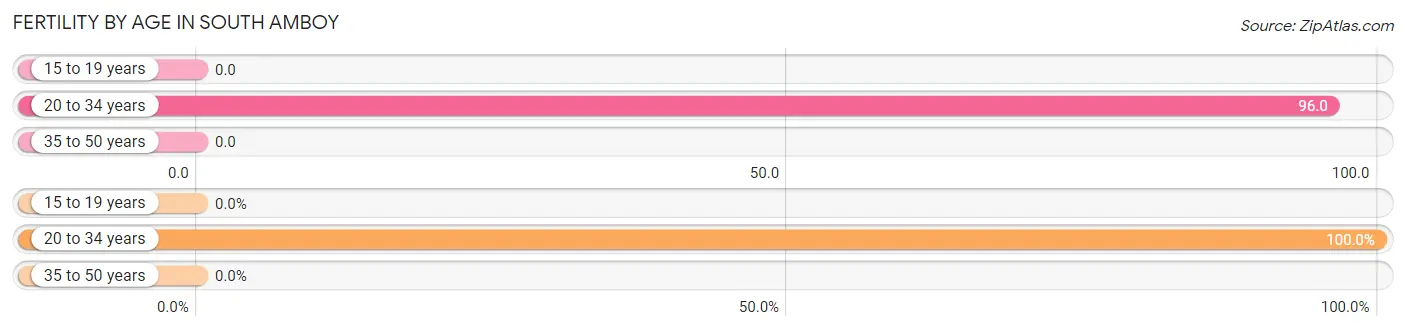
| Age Bracket | Women with Births | Births / 1,000 Women |
| 15 to 19 years | 0 (0.0%) | 0.0 |
| 20 to 34 years | 95 (100.0%) | 96.0 |
| 35 to 50 years | 0 (0.0%) | 0.0 |
| Total | 95 (100.0%) | 42.0 |
Fertility by Age by Marriage Status in South Amboy
62.1% of women with births (95) in South Amboy are married. The highest percentage of unmarried women with births falls into 20 to 34 years age bracket with 37.9% of them unmarried at the time of birth, while the lowest percentage of unmarried women with births belong to 20 to 34 years age bracket with 37.9% of them unmarried.
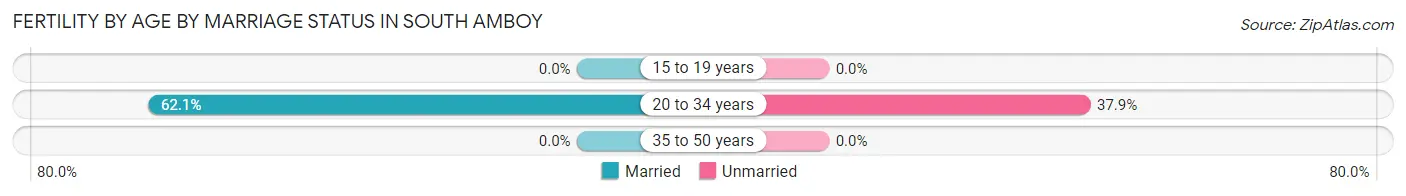
| Age Bracket | Married | Unmarried |
| 15 to 19 years | 0 (0.0%) | 0 (0.0%) |
| 20 to 34 years | 59 (62.1%) | 36 (37.9%) |
| 35 to 50 years | 0 (0.0%) | 0 (0.0%) |
| Total | 59 (62.1%) | 36 (37.9%) |
Fertility by Education in South Amboy
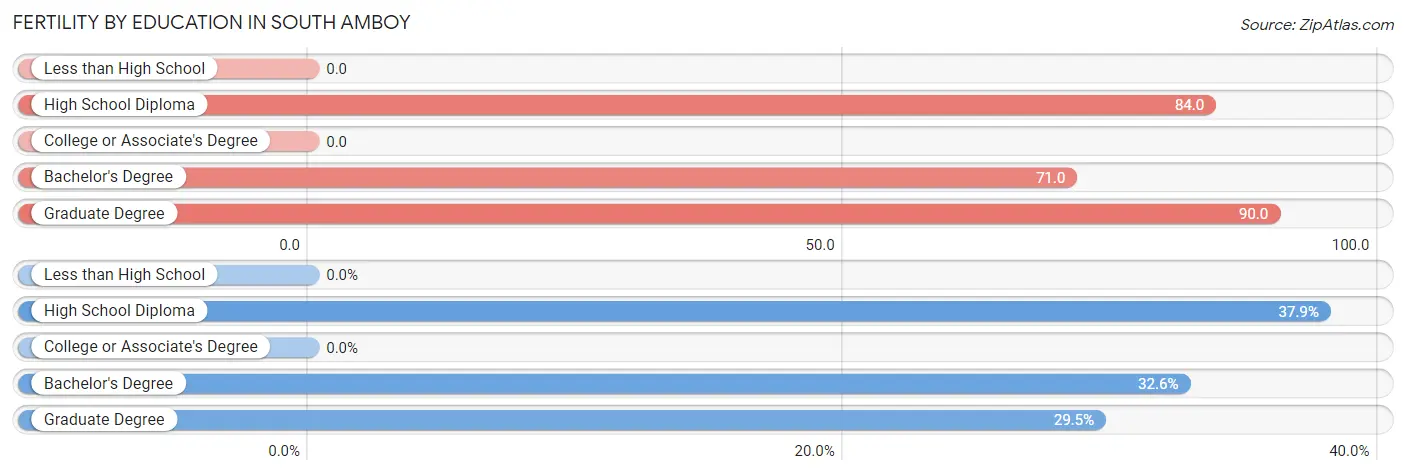
| Educational Attainment | Women with Births | Births / 1,000 Women |
| Less than High School | 0 (0.0%) | 0.0 |
| High School Diploma | 36 (37.9%) | 84.0 |
| College or Associate's Degree | 0 (0.0%) | 0.0 |
| Bachelor's Degree | 31 (32.6%) | 71.0 |
| Graduate Degree | 28 (29.5%) | 90.0 |
| Total | 95 (100.0%) | 42.0 |
Fertility by Education by Marriage Status in South Amboy
37.9% of women with births in South Amboy are unmarried. Women with the educational attainment of bachelor's degree are most likely to be married with 100.0% of them married at childbirth, while women with the educational attainment of high school diploma are least likely to be married with 100.0% of them unmarried at childbirth.
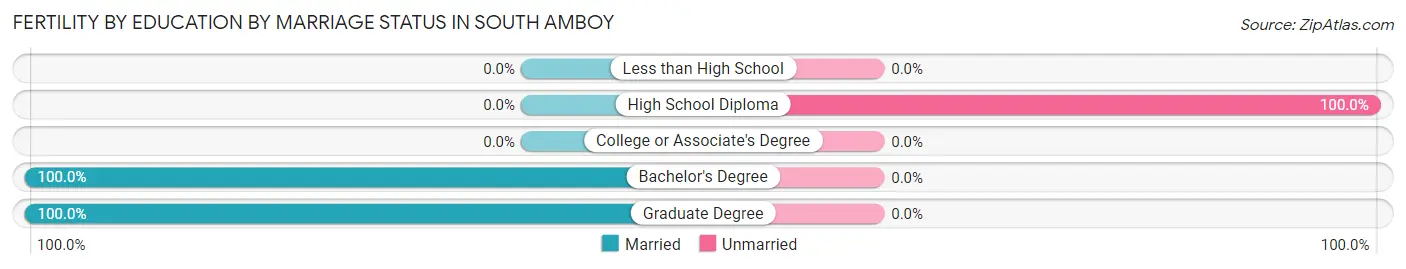
| Educational Attainment | Married | Unmarried |
| Less than High School | 0 (0.0%) | 0 (0.0%) |
| High School Diploma | 0 (0.0%) | 36 (100.0%) |
| College or Associate's Degree | 0 (0.0%) | 0 (0.0%) |
| Bachelor's Degree | 31 (100.0%) | 0 (0.0%) |
| Graduate Degree | 28 (100.0%) | 0 (0.0%) |
| Total | 59 (62.1%) | 36 (37.9%) |
Employment Characteristics in South Amboy
Employment by Class of Employer in South Amboy
Among the 5,210 employed individuals in South Amboy, private company employees (3,802 | 73.0%), local government employees (477 | 9.2%), and state government employees (313 | 6.0%) make up the most common classes of employment.
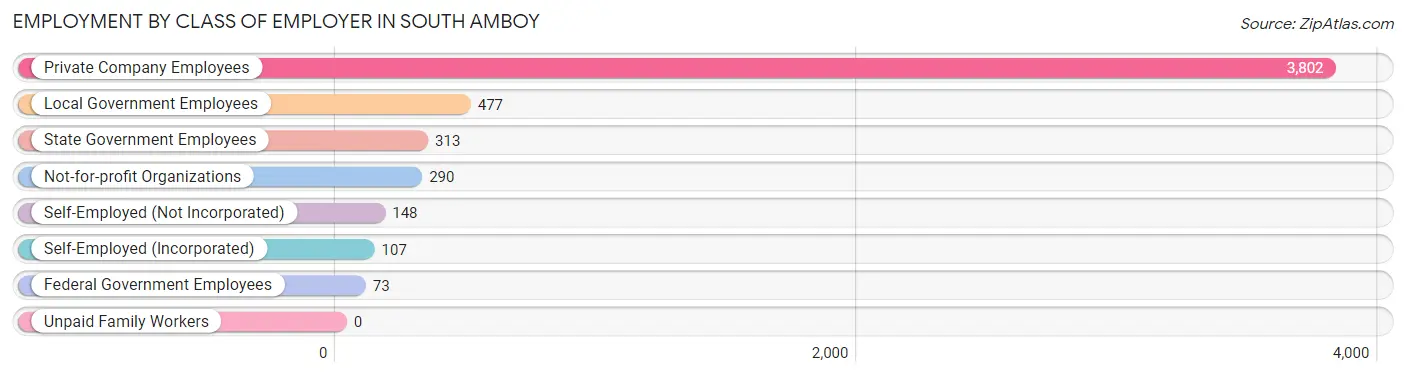
| Employer Class | # Employees | % Employees |
| Private Company Employees | 3,802 | 73.0% |
| Self-Employed (Incorporated) | 107 | 2.1% |
| Self-Employed (Not Incorporated) | 148 | 2.8% |
| Not-for-profit Organizations | 290 | 5.6% |
| Local Government Employees | 477 | 9.2% |
| State Government Employees | 313 | 6.0% |
| Federal Government Employees | 73 | 1.4% |
| Unpaid Family Workers | 0 | 0.0% |
| Total | 5,210 | 100.0% |
Employment Status by Age in South Amboy
According to the labor force statistics for South Amboy, out of the total population over 16 years of age (7,913), 70.9% or 5,610 individuals are in the labor force, with 5.7% or 320 of them unemployed. The age group with the highest labor force participation rate is 25 to 29 years, with 98.5% or 656 individuals in the labor force. Within the labor force, the 25 to 29 years age range has the highest percentage of unemployed individuals, with 17.4% or 114 of them being unemployed.
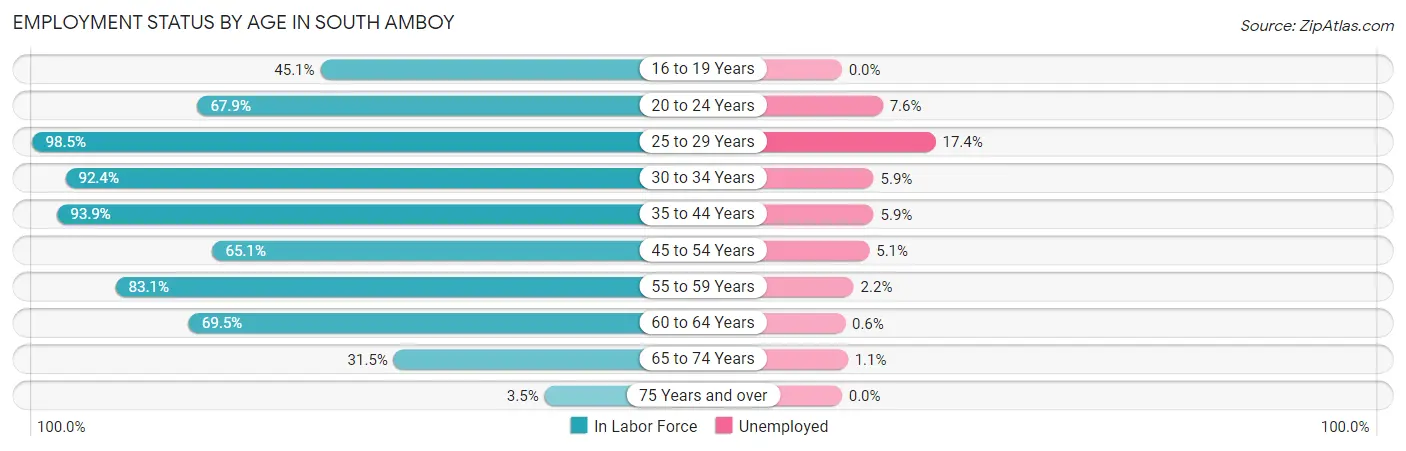
| Age Bracket | In Labor Force | Unemployed |
| 16 to 19 Years | 128 (45.1%) | 0 (0.0%) |
| 20 to 24 Years | 356 (67.9%) | 27 (7.6%) |
| 25 to 29 Years | 656 (98.5%) | 114 (17.4%) |
| 30 to 34 Years | 752 (92.4%) | 44 (5.9%) |
| 35 to 44 Years | 1,285 (93.9%) | 76 (5.9%) |
| 45 to 54 Years | 622 (65.1%) | 32 (5.1%) |
| 55 to 59 Years | 918 (83.1%) | 20 (2.2%) |
| 60 to 64 Years | 520 (69.5%) | 3 (0.6%) |
| 65 to 74 Years | 366 (31.5%) | 4 (1.1%) |
| 75 Years and over | 10 (3.5%) | 0 (0.0%) |
| Total | 5,610 (70.9%) | 320 (5.7%) |
Employment Status by Educational Attainment in South Amboy
According to labor force statistics for South Amboy, 84.0% of individuals (4,753) out of the total population between 25 and 64 years of age (5,658) are in the labor force, with 6.1% or 290 of them being unemployed. The group with the highest labor force participation rate are those with the educational attainment of college / associate degree, with 91.1% or 1,498 individuals in the labor force. Within the labor force, individuals with less than high school education have the highest percentage of unemployment, with 17.1% or 39 of them being unemployed.
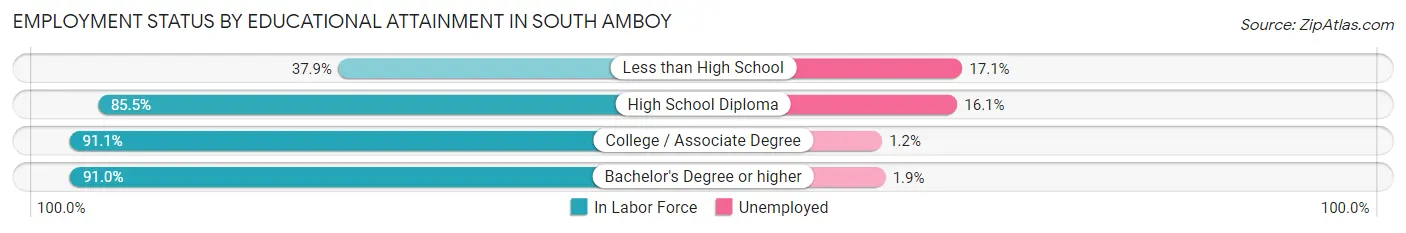
| Educational Attainment | In Labor Force | Unemployed |
| Less than High School | 228 (37.9%) | 103 (17.1%) |
| High School Diploma | 1,229 (85.5%) | 232 (16.1%) |
| College / Associate Degree | 1,498 (91.1%) | 20 (1.2%) |
| Bachelor's Degree or higher | 1,796 (91.0%) | 38 (1.9%) |
| Total | 4,753 (84.0%) | 345 (6.1%) |
Employment Occupations by Sex in South Amboy
Management, Business, Science and Arts Occupations
The most common Management, Business, Science and Arts occupations in South Amboy are Community & Social Service (517 | 9.8%), Computers, Engineering & Science (475 | 9.0%), Management (456 | 8.6%), Health Diagnosing & Treating (351 | 6.6%), and Health Technologists (270 | 5.1%).
Management, Business, Science and Arts Occupations by Sex
Within the Management, Business, Science and Arts occupations in South Amboy, the most male-oriented occupations are Arts, Media & Entertainment (85.3%), Computers & Mathematics (68.7%), and Architecture & Engineering (50.4%), while the most female-oriented occupations are Life, Physical & Social Science (100.0%), Health Technologists (92.6%), and Education, Arts & Media (90.0%).
| Occupation | Male | Female |
| Management | 181 (39.7%) | 275 (60.3%) |
| Business & Financial | 78 (32.1%) | 165 (67.9%) |
| Computers, Engineering & Science | 235 (49.5%) | 240 (50.5%) |
| Computers & Mathematics | 123 (68.7%) | 56 (31.3%) |
| Architecture & Engineering | 112 (50.4%) | 110 (49.5%) |
| Life, Physical & Social Science | 0 (0.0%) | 74 (100.0%) |
| Community & Social Service | 186 (36.0%) | 331 (64.0%) |
| Education, Arts & Media | 5 (10.0%) | 45 (90.0%) |
| Legal Services & Support | 66 (45.8%) | 78 (54.2%) |
| Education Instruction & Library | 63 (24.0%) | 199 (75.9%) |
| Arts, Media & Entertainment | 52 (85.3%) | 9 (14.7%) |
| Health Diagnosing & Treating | 70 (19.9%) | 281 (80.1%) |
| Health Technologists | 20 (7.4%) | 250 (92.6%) |
| Total (Category) | 750 (36.7%) | 1,292 (63.3%) |
| Total (Overall) | 2,738 (51.7%) | 2,555 (48.3%) |
Services Occupations
The most common Services occupations in South Amboy are Security & Protection (159 | 3.0%), Firefighting & Prevention (148 | 2.8%), Healthcare Support (116 | 2.2%), Cleaning & Maintenance (115 | 2.2%), and Food Preparation & Serving (61 | 1.1%).
Services Occupations by Sex
Within the Services occupations in South Amboy, the most male-oriented occupations are Law Enforcement (100.0%), Security & Protection (78.6%), and Firefighting & Prevention (77.0%), while the most female-oriented occupations are Personal Care & Service (100.0%), Healthcare Support (85.3%), and Cleaning & Maintenance (84.4%).
| Occupation | Male | Female |
| Healthcare Support | 17 (14.7%) | 99 (85.3%) |
| Security & Protection | 125 (78.6%) | 34 (21.4%) |
| Firefighting & Prevention | 114 (77.0%) | 34 (23.0%) |
| Law Enforcement | 11 (100.0%) | 0 (0.0%) |
| Food Preparation & Serving | 28 (45.9%) | 33 (54.1%) |
| Cleaning & Maintenance | 18 (15.7%) | 97 (84.4%) |
| Personal Care & Service | 0 (0.0%) | 46 (100.0%) |
| Total (Category) | 188 (37.8%) | 309 (62.2%) |
| Total (Overall) | 2,738 (51.7%) | 2,555 (48.3%) |
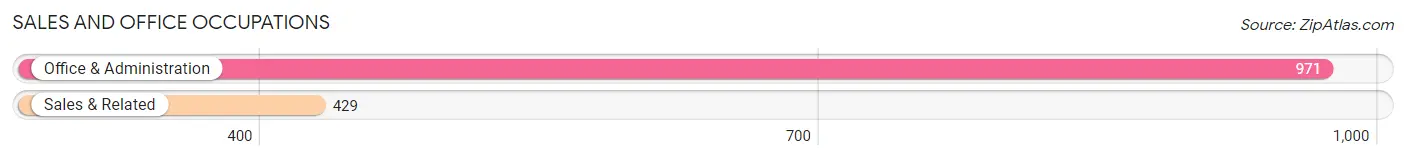
Sales and Office Occupations
The most common Sales and Office occupations in South Amboy are Office & Administration (971 | 18.3%), and Sales & Related (429 | 8.1%).
Sales and Office Occupations by Sex
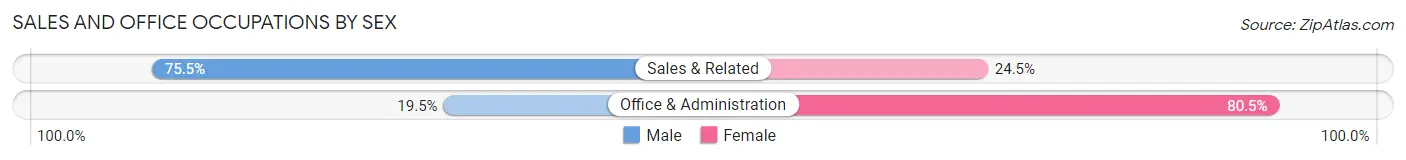
| Occupation | Male | Female |
| Sales & Related | 324 (75.5%) | 105 (24.5%) |
| Office & Administration | 189 (19.5%) | 782 (80.5%) |
| Total (Category) | 513 (36.6%) | 887 (63.4%) |
| Total (Overall) | 2,738 (51.7%) | 2,555 (48.3%) |
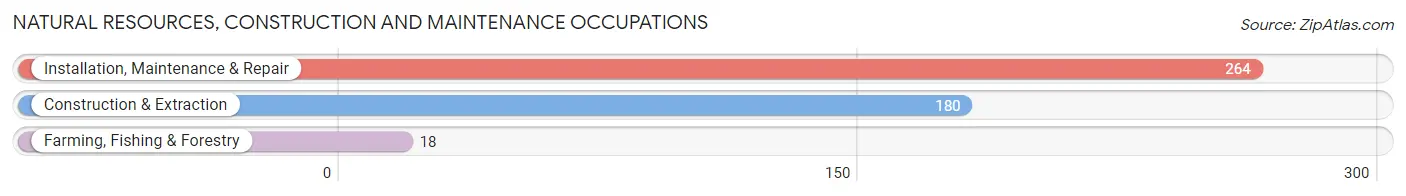
Natural Resources, Construction and Maintenance Occupations
The most common Natural Resources, Construction and Maintenance occupations in South Amboy are Installation, Maintenance & Repair (264 | 5.0%), Construction & Extraction (180 | 3.4%), and Farming, Fishing & Forestry (18 | 0.3%).
Natural Resources, Construction and Maintenance Occupations by Sex
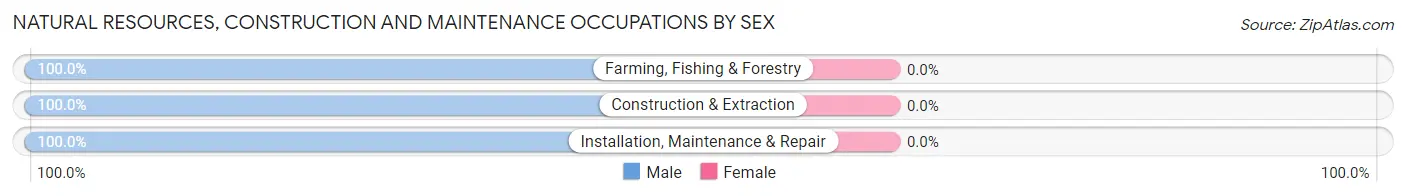
| Occupation | Male | Female |
| Farming, Fishing & Forestry | 18 (100.0%) | 0 (0.0%) |
| Construction & Extraction | 180 (100.0%) | 0 (0.0%) |
| Installation, Maintenance & Repair | 264 (100.0%) | 0 (0.0%) |
| Total (Category) | 462 (100.0%) | 0 (0.0%) |
| Total (Overall) | 2,738 (51.7%) | 2,555 (48.3%) |
Production, Transportation and Moving Occupations
The most common Production, Transportation and Moving occupations in South Amboy are Transportation (511 | 9.7%), Production (192 | 3.6%), and Material Moving (189 | 3.6%).
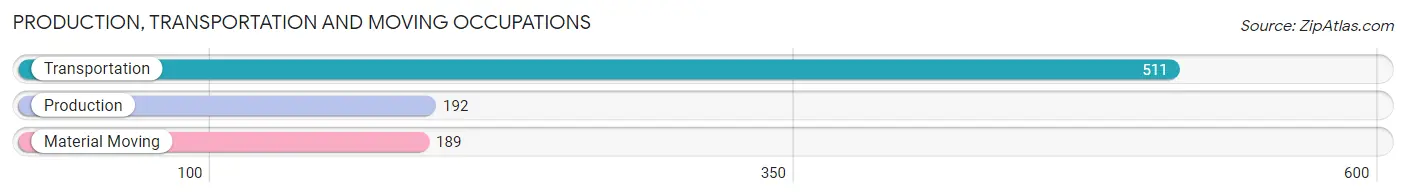
Production, Transportation and Moving Occupations by Sex
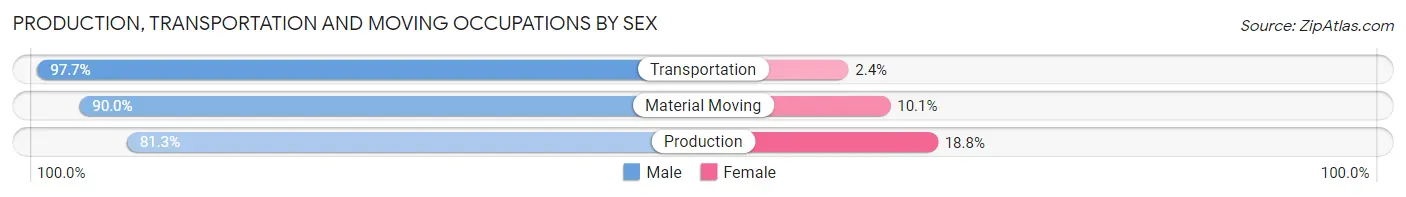
| Occupation | Male | Female |
| Production | 156 (81.2%) | 36 (18.8%) |
| Transportation | 499 (97.7%) | 12 (2.4%) |
| Material Moving | 170 (89.9%) | 19 (10.1%) |
| Total (Category) | 825 (92.5%) | 67 (7.5%) |
| Total (Overall) | 2,738 (51.7%) | 2,555 (48.3%) |
Employment Industries by Sex in South Amboy
Employment Industries in South Amboy
The major employment industries in South Amboy include Health Care & Social Assistance (858 | 16.2%), Transportation & Warehousing (690 | 13.0%), Finance & Insurance (606 | 11.5%), Retail Trade (553 | 10.4%), and Professional & Scientific (488 | 9.2%).
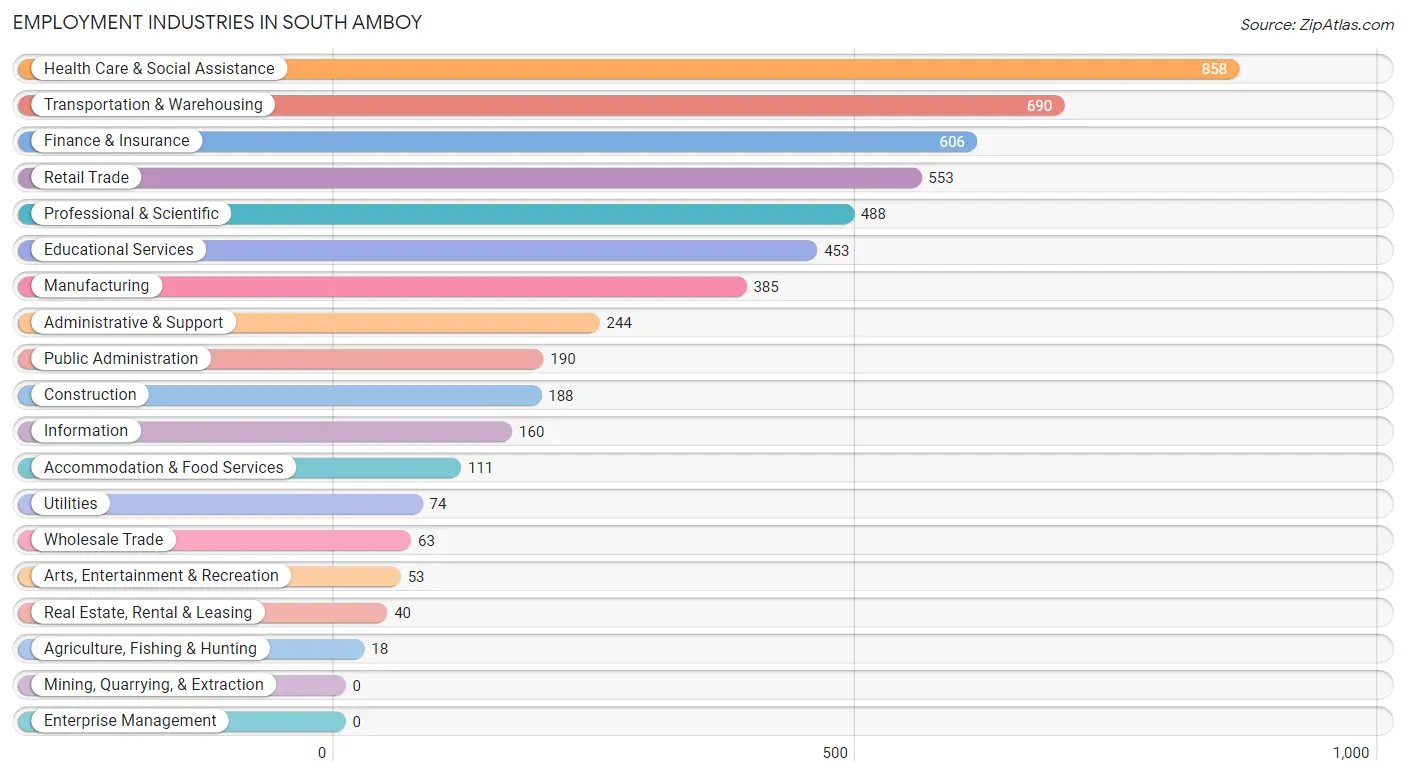
Employment Industries by Sex in South Amboy
The South Amboy industries that see more men than women are Agriculture, Fishing & Hunting (100.0%), Utilities (100.0%), and Arts, Entertainment & Recreation (100.0%), whereas the industries that tend to have a higher number of women are Health Care & Social Assistance (80.6%), Finance & Insurance (71.0%), and Educational Services (62.9%).
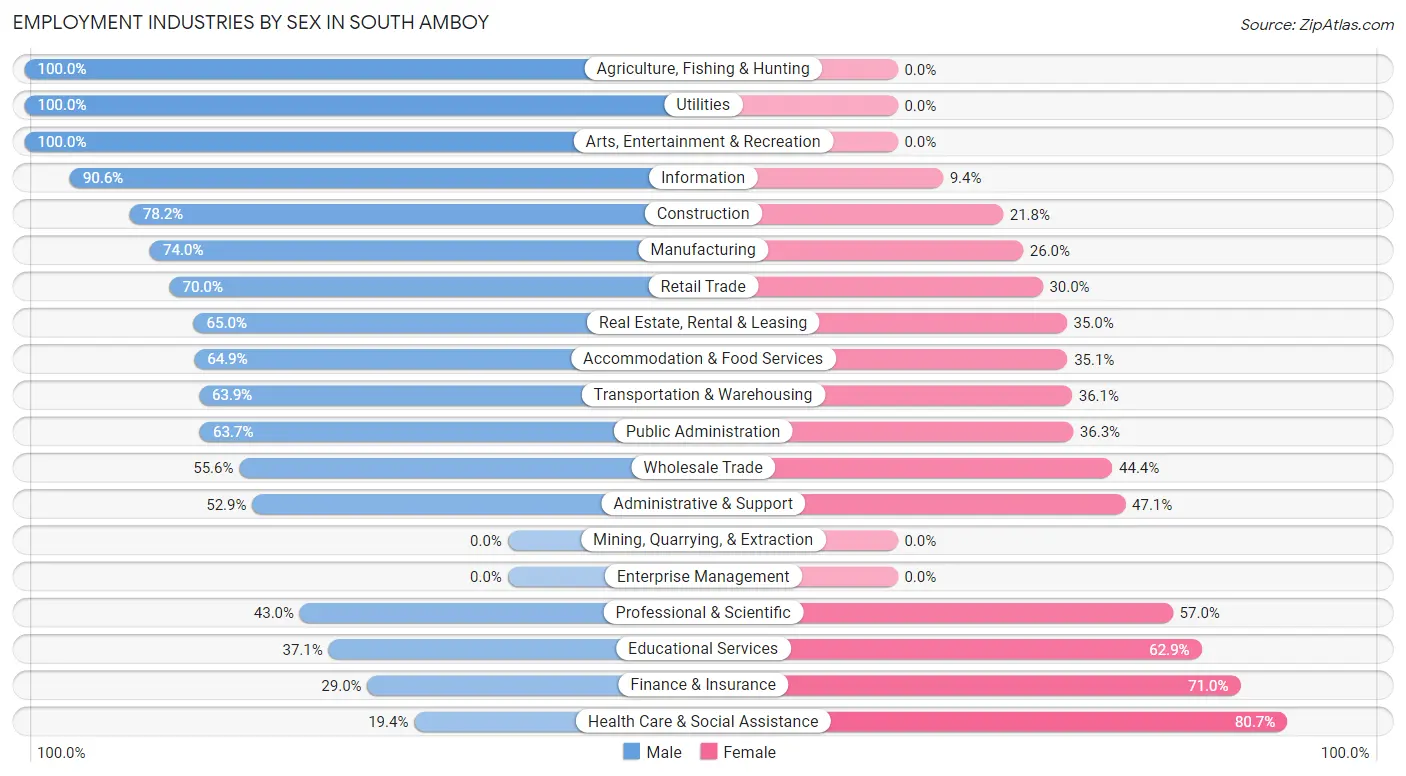
| Industry | Male | Female |
| Agriculture, Fishing & Hunting | 18 (100.0%) | 0 (0.0%) |
| Mining, Quarrying, & Extraction | 0 (0.0%) | 0 (0.0%) |
| Construction | 147 (78.2%) | 41 (21.8%) |
| Manufacturing | 285 (74.0%) | 100 (26.0%) |
| Wholesale Trade | 35 (55.6%) | 28 (44.4%) |
| Retail Trade | 387 (70.0%) | 166 (30.0%) |
| Transportation & Warehousing | 441 (63.9%) | 249 (36.1%) |
| Utilities | 74 (100.0%) | 0 (0.0%) |
| Information | 145 (90.6%) | 15 (9.4%) |
| Finance & Insurance | 176 (29.0%) | 430 (71.0%) |
| Real Estate, Rental & Leasing | 26 (65.0%) | 14 (35.0%) |
| Professional & Scientific | 210 (43.0%) | 278 (57.0%) |
| Enterprise Management | 0 (0.0%) | 0 (0.0%) |
| Administrative & Support | 129 (52.9%) | 115 (47.1%) |
| Educational Services | 168 (37.1%) | 285 (62.9%) |
| Health Care & Social Assistance | 166 (19.4%) | 692 (80.6%) |
| Arts, Entertainment & Recreation | 53 (100.0%) | 0 (0.0%) |
| Accommodation & Food Services | 72 (64.9%) | 39 (35.1%) |
| Public Administration | 121 (63.7%) | 69 (36.3%) |
| Total | 2,738 (51.7%) | 2,555 (48.3%) |
Education in South Amboy
School Enrollment in South Amboy
The most common levels of schooling among the 1,612 students in South Amboy are college / undergraduate (452 | 28.0%), middle school (355 | 22.0%), and elementary school (352 | 21.8%).
| School Level | # Students | % Students |
| Nursery / Preschool | 74 | 4.6% |
| Kindergarten | 86 | 5.3% |
| Elementary School | 352 | 21.8% |
| Middle School | 355 | 22.0% |
| High School | 266 | 16.5% |
| College / Undergraduate | 452 | 28.0% |
| Graduate / Professional | 27 | 1.7% |
| Total | 1,612 | 100.0% |
School Enrollment by Age by Funding Source in South Amboy
Out of a total of 1,612 students who are enrolled in schools in South Amboy, 322 (20.0%) attend a private institution, while the remaining 1,290 (80.0%) are enrolled in public schools. The age group of 20 to 24 year olds has the highest likelihood of being enrolled in private schools, with 149 (58.2% in the age bracket) enrolled. Conversely, the age group of 18 to 19 year olds has the lowest likelihood of being enrolled in a private school, with 154 (100.0% in the age bracket) attending a public institution.
| Age Bracket | Public School | Private School |
| 3 to 4 Year Olds | 32 (43.2%) | 42 (56.8%) |
| 5 to 9 Year Old | 402 (91.8%) | 36 (8.2%) |
| 10 to 14 Year Olds | 423 (91.6%) | 39 (8.4%) |
| 15 to 17 Year Olds | 115 (89.1%) | 14 (10.8%) |
| 18 to 19 Year Olds | 154 (100.0%) | 0 (0.0%) |
| 20 to 24 Year Olds | 107 (41.8%) | 149 (58.2%) |
| 25 to 34 Year Olds | 37 (46.8%) | 42 (53.2%) |
| 35 Years and over | 20 (100.0%) | 0 (0.0%) |
| Total | 1,290 (80.0%) | 322 (20.0%) |
Educational Attainment by Field of Study in South Amboy
Business (613 | 26.8%), social sciences (259 | 11.3%), science & technology (258 | 11.3%), engineering (230 | 10.0%), and communications (155 | 6.8%) are the most common fields of study among 2,291 individuals in South Amboy who have obtained a bachelor's degree or higher.
| Field of Study | # Graduates | % Graduates |
| Computers & Mathematics | 125 | 5.5% |
| Bio, Nature & Agricultural | 38 | 1.7% |
| Physical & Health Sciences | 64 | 2.8% |
| Psychology | 149 | 6.5% |
| Social Sciences | 259 | 11.3% |
| Engineering | 230 | 10.0% |
| Multidisciplinary Studies | 0 | 0.0% |
| Science & Technology | 258 | 11.3% |
| Business | 613 | 26.8% |
| Education | 126 | 5.5% |
| Literature & Languages | 58 | 2.5% |
| Liberal Arts & History | 111 | 4.9% |
| Visual & Performing Arts | 43 | 1.9% |
| Communications | 155 | 6.8% |
| Arts & Humanities | 62 | 2.7% |
| Total | 2,291 | 100.0% |
Transportation & Commute in South Amboy
Vehicle Availability by Sex in South Amboy
The most prevalent vehicle ownership categories in South Amboy are males with 2 vehicles (1,270, accounting for 46.8%) and females with 2 vehicles (876, making up 51.0%).
| Vehicles Available | Male | Female |
| No Vehicle | 222 (8.2%) | 4 (0.2%) |
| 1 Vehicle | 425 (15.7%) | 885 (35.5%) |
| 2 Vehicles | 1,270 (46.8%) | 876 (35.2%) |
| 3 Vehicles | 512 (18.9%) | 392 (15.7%) |
| 4 Vehicles | 257 (9.5%) | 283 (11.4%) |
| 5 or more Vehicles | 27 (1.0%) | 51 (2.1%) |
| Total | 2,713 (100.0%) | 2,491 (100.0%) |
Commute Time in South Amboy
The most frequently occuring commute durations in South Amboy are 20 to 24 minutes (1,045 commuters, 22.2%), 15 to 19 minutes (656 commuters, 14.0%), and 30 to 34 minutes (543 commuters, 11.6%).
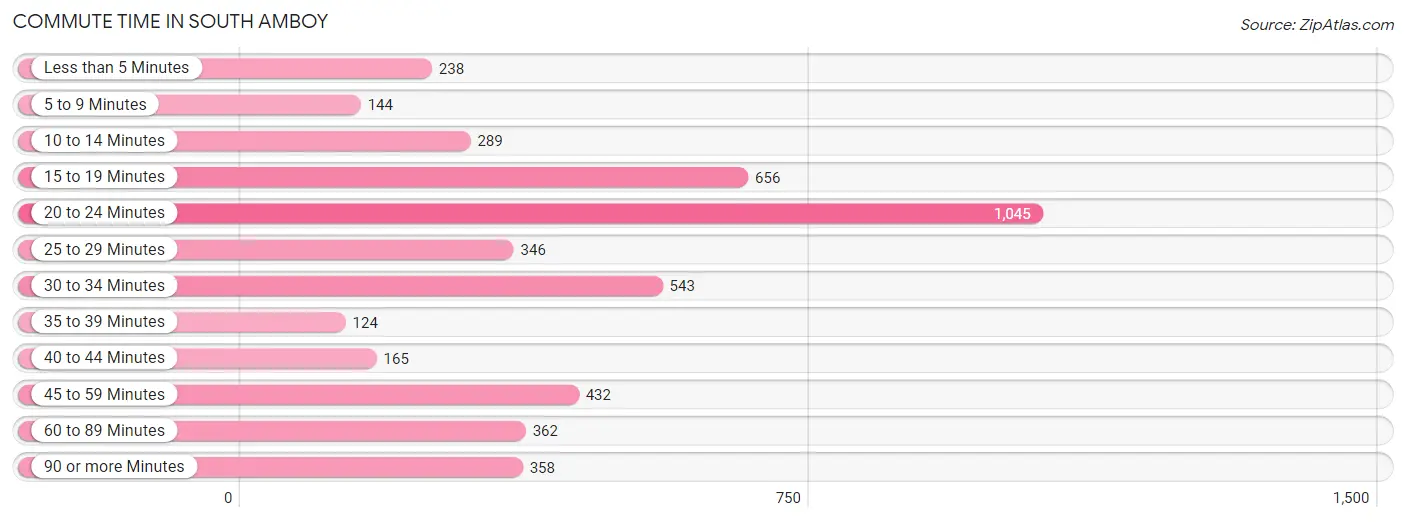
| Commute Time | # Commuters | % Commuters |
| Less than 5 Minutes | 238 | 5.1% |
| 5 to 9 Minutes | 144 | 3.1% |
| 10 to 14 Minutes | 289 | 6.1% |
| 15 to 19 Minutes | 656 | 14.0% |
| 20 to 24 Minutes | 1,045 | 22.2% |
| 25 to 29 Minutes | 346 | 7.4% |
| 30 to 34 Minutes | 543 | 11.6% |
| 35 to 39 Minutes | 124 | 2.6% |
| 40 to 44 Minutes | 165 | 3.5% |
| 45 to 59 Minutes | 432 | 9.2% |
| 60 to 89 Minutes | 362 | 7.7% |
| 90 or more Minutes | 358 | 7.6% |
Commute Time by Sex in South Amboy
The most common commute times in South Amboy are 20 to 24 minutes (564 commuters, 22.0%) for males and 20 to 24 minutes (481 commuters, 22.6%) for females.
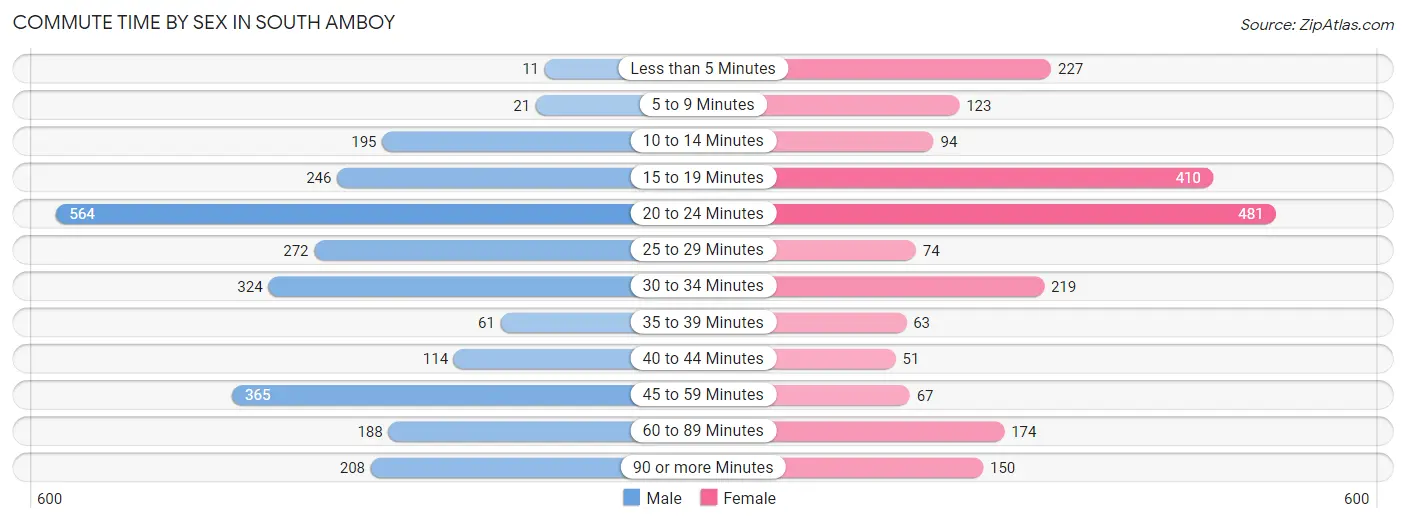
| Commute Time | Male | Female |
| Less than 5 Minutes | 11 (0.4%) | 227 (10.6%) |
| 5 to 9 Minutes | 21 (0.8%) | 123 (5.8%) |
| 10 to 14 Minutes | 195 (7.6%) | 94 (4.4%) |
| 15 to 19 Minutes | 246 (9.6%) | 410 (19.2%) |
| 20 to 24 Minutes | 564 (22.0%) | 481 (22.6%) |
| 25 to 29 Minutes | 272 (10.6%) | 74 (3.5%) |
| 30 to 34 Minutes | 324 (12.6%) | 219 (10.3%) |
| 35 to 39 Minutes | 61 (2.4%) | 63 (2.9%) |
| 40 to 44 Minutes | 114 (4.4%) | 51 (2.4%) |
| 45 to 59 Minutes | 365 (14.2%) | 67 (3.1%) |
| 60 to 89 Minutes | 188 (7.3%) | 174 (8.2%) |
| 90 or more Minutes | 208 (8.1%) | 150 (7.0%) |
Time of Departure to Work by Sex in South Amboy
The most frequent times of departure to work in South Amboy are 8:00 AM to 8:29 AM (340, 13.2%) for males and 8:00 AM to 8:29 AM (666, 31.2%) for females.
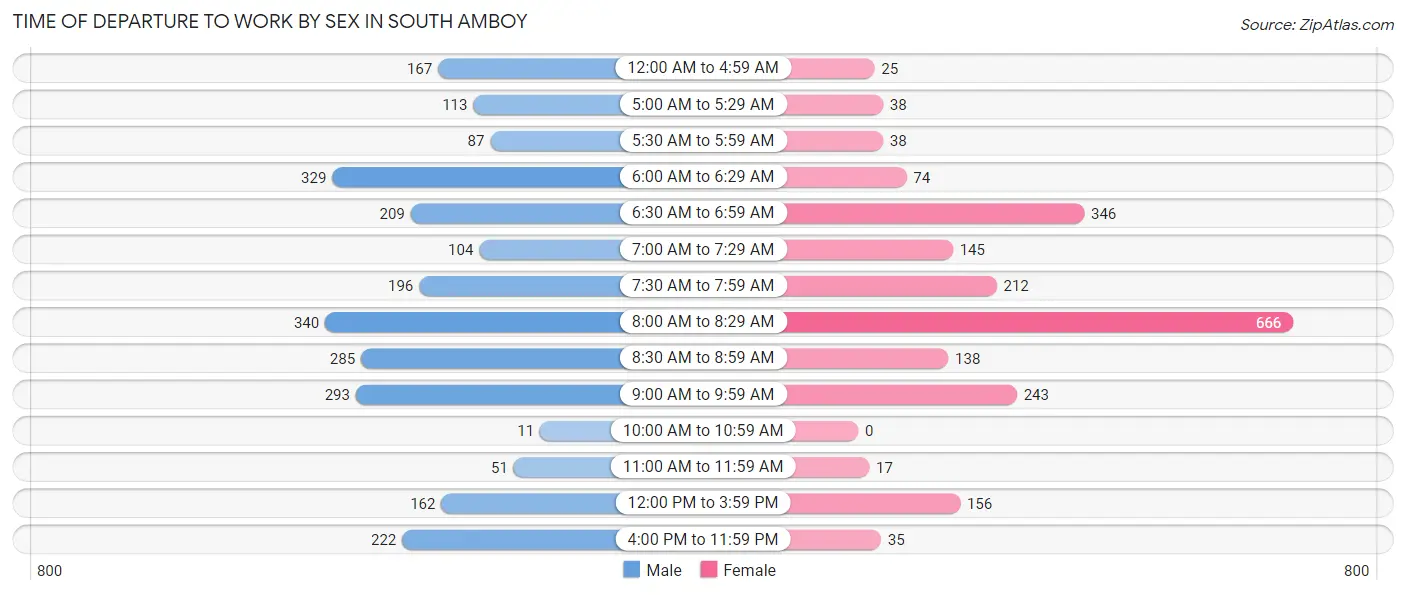
| Time of Departure | Male | Female |
| 12:00 AM to 4:59 AM | 167 (6.5%) | 25 (1.2%) |
| 5:00 AM to 5:29 AM | 113 (4.4%) | 38 (1.8%) |
| 5:30 AM to 5:59 AM | 87 (3.4%) | 38 (1.8%) |
| 6:00 AM to 6:29 AM | 329 (12.8%) | 74 (3.5%) |
| 6:30 AM to 6:59 AM | 209 (8.1%) | 346 (16.2%) |
| 7:00 AM to 7:29 AM | 104 (4.1%) | 145 (6.8%) |
| 7:30 AM to 7:59 AM | 196 (7.6%) | 212 (9.9%) |
| 8:00 AM to 8:29 AM | 340 (13.2%) | 666 (31.2%) |
| 8:30 AM to 8:59 AM | 285 (11.1%) | 138 (6.5%) |
| 9:00 AM to 9:59 AM | 293 (11.4%) | 243 (11.4%) |
| 10:00 AM to 10:59 AM | 11 (0.4%) | 0 (0.0%) |
| 11:00 AM to 11:59 AM | 51 (2.0%) | 17 (0.8%) |
| 12:00 PM to 3:59 PM | 162 (6.3%) | 156 (7.3%) |
| 4:00 PM to 11:59 PM | 222 (8.6%) | 35 (1.6%) |
| Total | 2,569 (100.0%) | 2,133 (100.0%) |
Housing Occupancy in South Amboy
Occupancy by Ownership in South Amboy
Of the total 4,031 dwellings in South Amboy, owner-occupied units account for 2,176 (54.0%), while renter-occupied units make up 1,855 (46.0%).
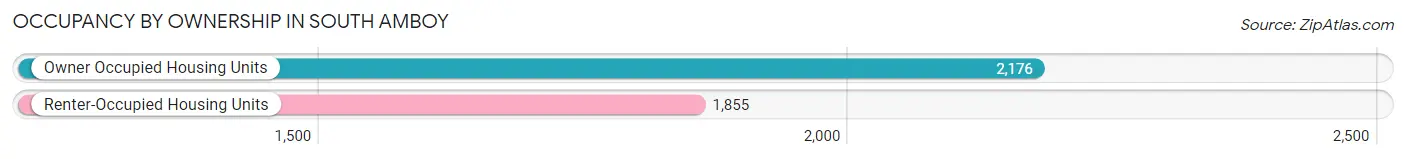
| Occupancy | # Housing Units | % Housing Units |
| Owner Occupied Housing Units | 2,176 | 54.0% |
| Renter-Occupied Housing Units | 1,855 | 46.0% |
| Total Occupied Housing Units | 4,031 | 100.0% |
Occupancy by Household Size in South Amboy
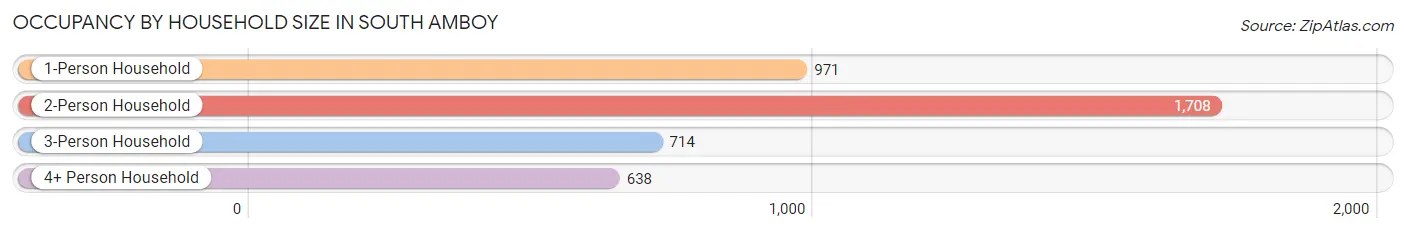
| Household Size | # Housing Units | % Housing Units |
| 1-Person Household | 971 | 24.1% |
| 2-Person Household | 1,708 | 42.4% |
| 3-Person Household | 714 | 17.7% |
| 4+ Person Household | 638 | 15.8% |
| Total Housing Units | 4,031 | 100.0% |
Occupancy by Ownership by Household Size in South Amboy
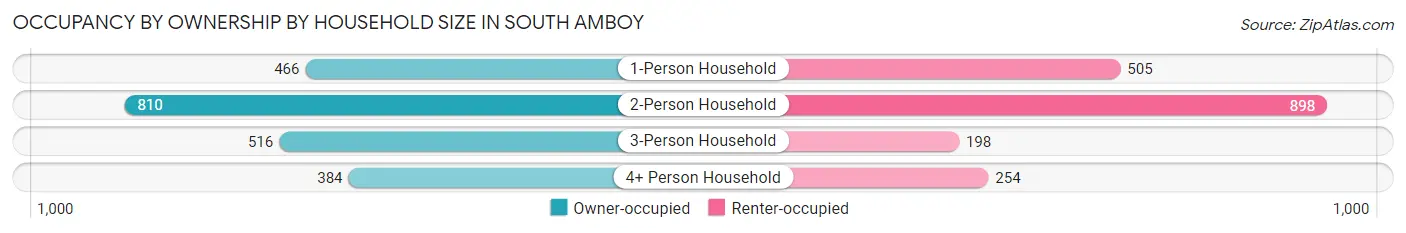
| Household Size | Owner-occupied | Renter-occupied |
| 1-Person Household | 466 (48.0%) | 505 (52.0%) |
| 2-Person Household | 810 (47.4%) | 898 (52.6%) |
| 3-Person Household | 516 (72.3%) | 198 (27.7%) |
| 4+ Person Household | 384 (60.2%) | 254 (39.8%) |
| Total Housing Units | 2,176 (54.0%) | 1,855 (46.0%) |
Occupancy by Educational Attainment in South Amboy
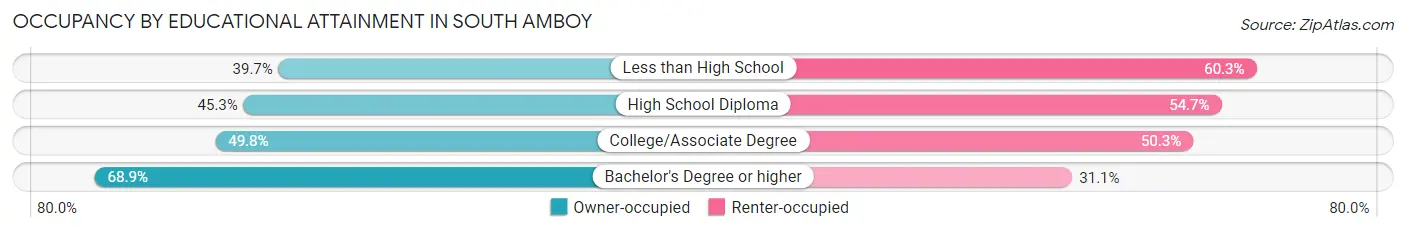
| Household Size | Owner-occupied | Renter-occupied |
| Less than High School | 166 (39.7%) | 252 (60.3%) |
| High School Diploma | 554 (45.3%) | 670 (54.7%) |
| College/Associate Degree | 493 (49.7%) | 498 (50.2%) |
| Bachelor's Degree or higher | 963 (68.9%) | 435 (31.1%) |
Occupancy by Age of Householder in South Amboy
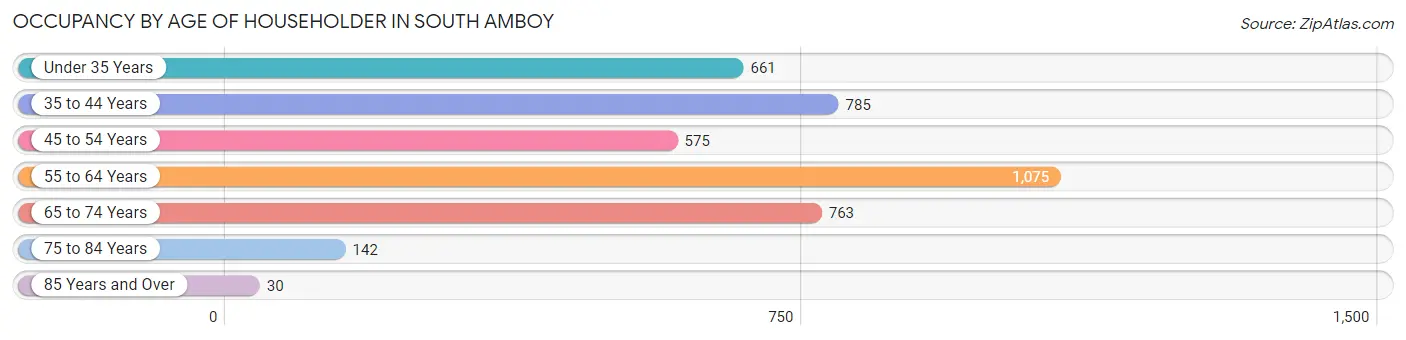
| Age Bracket | # Households | % Households |
| Under 35 Years | 661 | 16.4% |
| 35 to 44 Years | 785 | 19.5% |
| 45 to 54 Years | 575 | 14.3% |
| 55 to 64 Years | 1,075 | 26.7% |
| 65 to 74 Years | 763 | 18.9% |
| 75 to 84 Years | 142 | 3.5% |
| 85 Years and Over | 30 | 0.7% |
| Total | 4,031 | 100.0% |
Housing Finances in South Amboy
Median Income by Occupancy in South Amboy
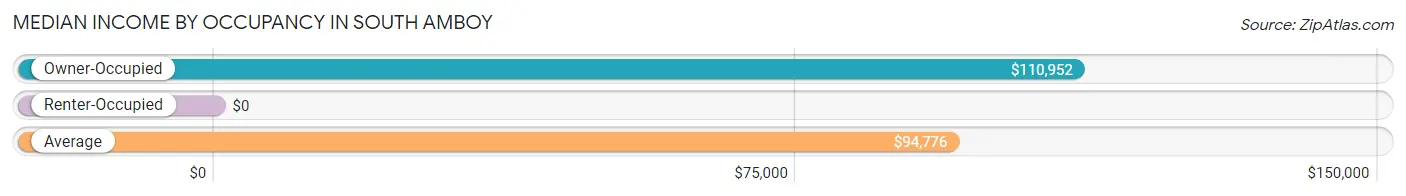
| Occupancy Type | # Households | Median Income |
| Owner-Occupied | 2,176 (54.0%) | $110,952 |
| Renter-Occupied | 1,855 (46.0%) | $0 |
| Average | 4,031 (100.0%) | $94,776 |
Occupancy by Householder Income Bracket in South Amboy
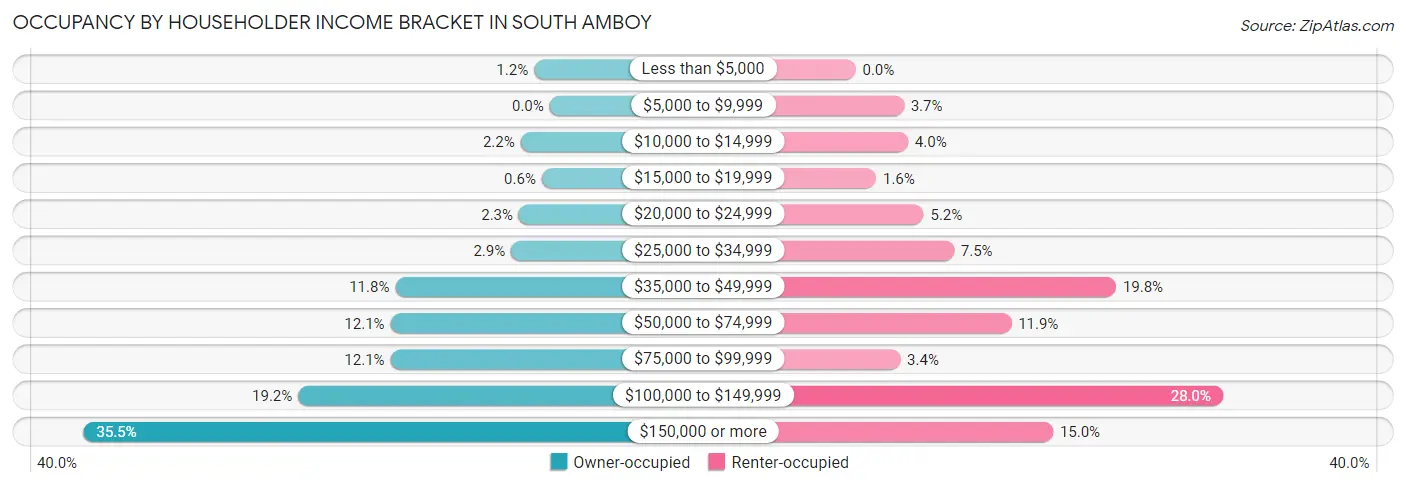
| Income Bracket | Owner-occupied | Renter-occupied |
| Less than $5,000 | 26 (1.2%) | 0 (0.0%) |
| $5,000 to $9,999 | 0 (0.0%) | 68 (3.7%) |
| $10,000 to $14,999 | 48 (2.2%) | 74 (4.0%) |
| $15,000 to $19,999 | 13 (0.6%) | 29 (1.6%) |
| $20,000 to $24,999 | 51 (2.3%) | 96 (5.2%) |
| $25,000 to $34,999 | 64 (2.9%) | 139 (7.5%) |
| $35,000 to $49,999 | 256 (11.8%) | 368 (19.8%) |
| $50,000 to $74,999 | 264 (12.1%) | 220 (11.9%) |
| $75,000 to $99,999 | 264 (12.1%) | 63 (3.4%) |
| $100,000 to $149,999 | 417 (19.2%) | 519 (28.0%) |
| $150,000 or more | 773 (35.5%) | 279 (15.0%) |
| Total | 2,176 (100.0%) | 1,855 (100.0%) |
Monthly Housing Cost Tiers in South Amboy
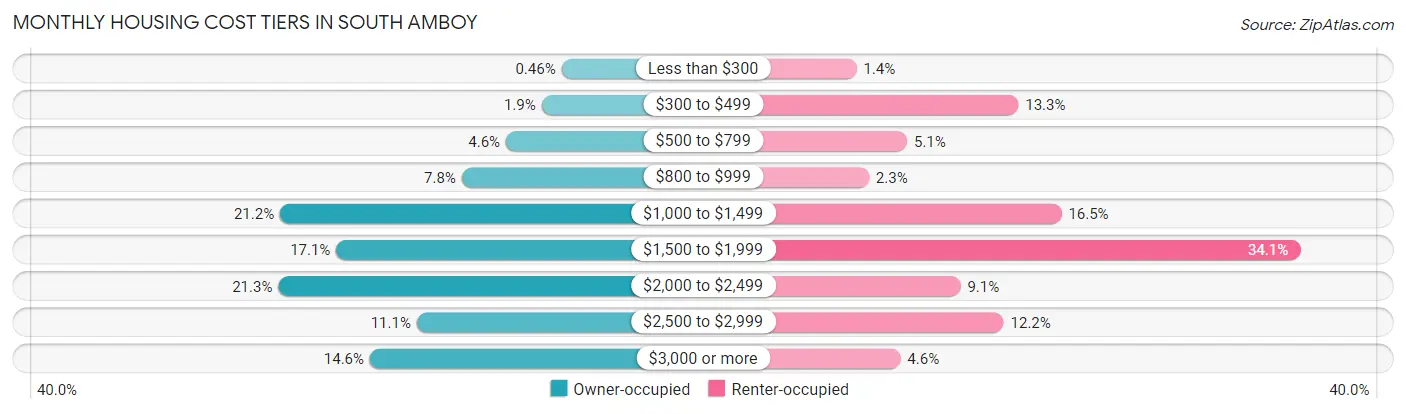
| Monthly Cost | Owner-occupied | Renter-occupied |
| Less than $300 | 10 (0.5%) | 26 (1.4%) |
| $300 to $499 | 42 (1.9%) | 247 (13.3%) |
| $500 to $799 | 99 (4.5%) | 95 (5.1%) |
| $800 to $999 | 170 (7.8%) | 43 (2.3%) |
| $1,000 to $1,499 | 461 (21.2%) | 306 (16.5%) |
| $1,500 to $1,999 | 371 (17.1%) | 632 (34.1%) |
| $2,000 to $2,499 | 464 (21.3%) | 168 (9.1%) |
| $2,500 to $2,999 | 242 (11.1%) | 227 (12.2%) |
| $3,000 or more | 317 (14.6%) | 86 (4.6%) |
| Total | 2,176 (100.0%) | 1,855 (100.0%) |
Physical Housing Characteristics in South Amboy
Housing Structures in South Amboy
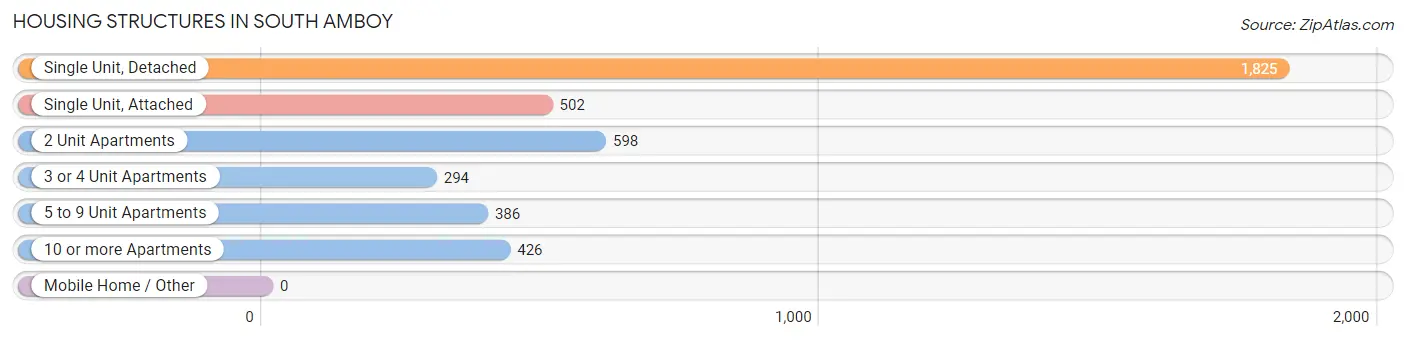
| Structure Type | # Housing Units | % Housing Units |
| Single Unit, Detached | 1,825 | 45.3% |
| Single Unit, Attached | 502 | 12.4% |
| 2 Unit Apartments | 598 | 14.8% |
| 3 or 4 Unit Apartments | 294 | 7.3% |
| 5 to 9 Unit Apartments | 386 | 9.6% |
| 10 or more Apartments | 426 | 10.6% |
| Mobile Home / Other | 0 | 0.0% |
| Total | 4,031 | 100.0% |
Housing Structures by Occupancy in South Amboy
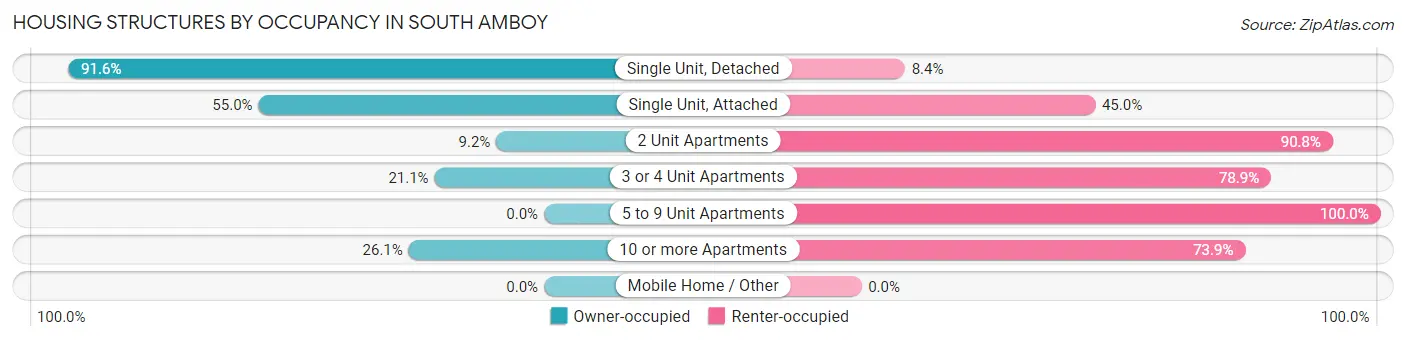
| Structure Type | Owner-occupied | Renter-occupied |
| Single Unit, Detached | 1,672 (91.6%) | 153 (8.4%) |
| Single Unit, Attached | 276 (55.0%) | 226 (45.0%) |
| 2 Unit Apartments | 55 (9.2%) | 543 (90.8%) |
| 3 or 4 Unit Apartments | 62 (21.1%) | 232 (78.9%) |
| 5 to 9 Unit Apartments | 0 (0.0%) | 386 (100.0%) |
| 10 or more Apartments | 111 (26.1%) | 315 (73.9%) |
| Mobile Home / Other | 0 (0.0%) | 0 (0.0%) |
| Total | 2,176 (54.0%) | 1,855 (46.0%) |
Housing Structures by Number of Rooms in South Amboy
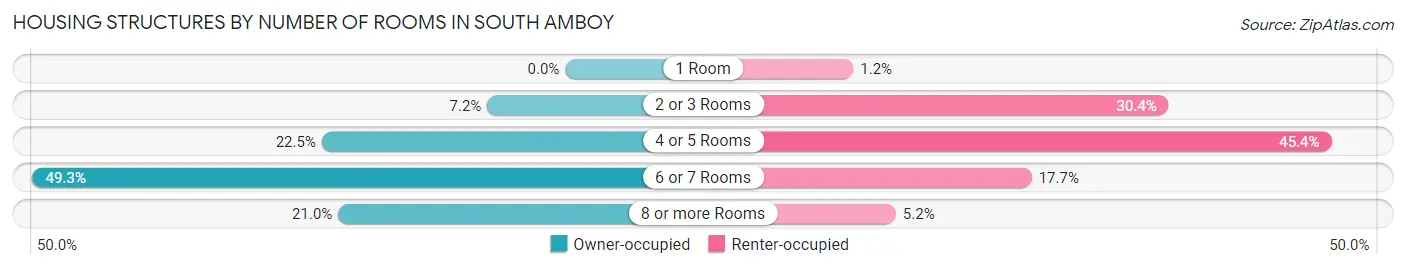
| Number of Rooms | Owner-occupied | Renter-occupied |
| 1 Room | 0 (0.0%) | 23 (1.2%) |
| 2 or 3 Rooms | 157 (7.2%) | 564 (30.4%) |
| 4 or 5 Rooms | 490 (22.5%) | 843 (45.4%) |
| 6 or 7 Rooms | 1,072 (49.3%) | 329 (17.7%) |
| 8 or more Rooms | 457 (21.0%) | 96 (5.2%) |
| Total | 2,176 (100.0%) | 1,855 (100.0%) |
Housing Structure by Heating Type in South Amboy
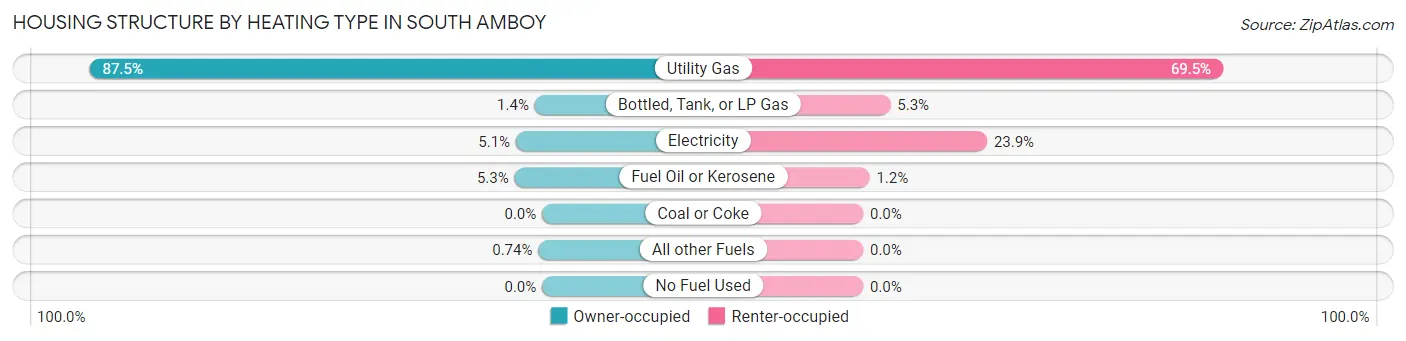
| Heating Type | Owner-occupied | Renter-occupied |
| Utility Gas | 1,903 (87.5%) | 1,290 (69.5%) |
| Bottled, Tank, or LP Gas | 31 (1.4%) | 98 (5.3%) |
| Electricity | 110 (5.1%) | 444 (23.9%) |
| Fuel Oil or Kerosene | 116 (5.3%) | 23 (1.2%) |
| Coal or Coke | 0 (0.0%) | 0 (0.0%) |
| All other Fuels | 16 (0.7%) | 0 (0.0%) |
| No Fuel Used | 0 (0.0%) | 0 (0.0%) |
| Total | 2,176 (100.0%) | 1,855 (100.0%) |
Household Vehicle Usage in South Amboy
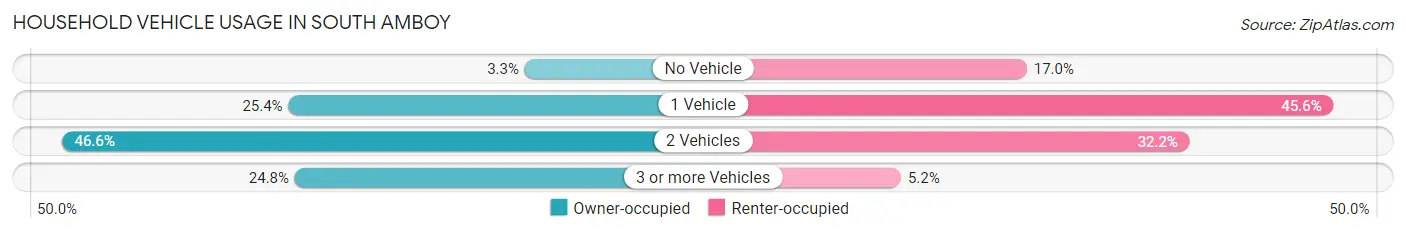
| Vehicles per Household | Owner-occupied | Renter-occupied |
| No Vehicle | 72 (3.3%) | 315 (17.0%) |
| 1 Vehicle | 552 (25.4%) | 846 (45.6%) |
| 2 Vehicles | 1,013 (46.6%) | 597 (32.2%) |
| 3 or more Vehicles | 539 (24.8%) | 97 (5.2%) |
| Total | 2,176 (100.0%) | 1,855 (100.0%) |
Real Estate & Mortgages in South Amboy
Real Estate and Mortgage Overview in South Amboy
| Characteristic | Without Mortgage | With Mortgage |
| Housing Units | 831 | 1,345 |
| Median Property Value | $342,700 | $349,400 |
| Median Household Income | $73,990 | $570 |
| Monthly Housing Costs | $1,111 | $317 |
| Real Estate Taxes | $8,555 | $9 |
Property Value by Mortgage Status in South Amboy
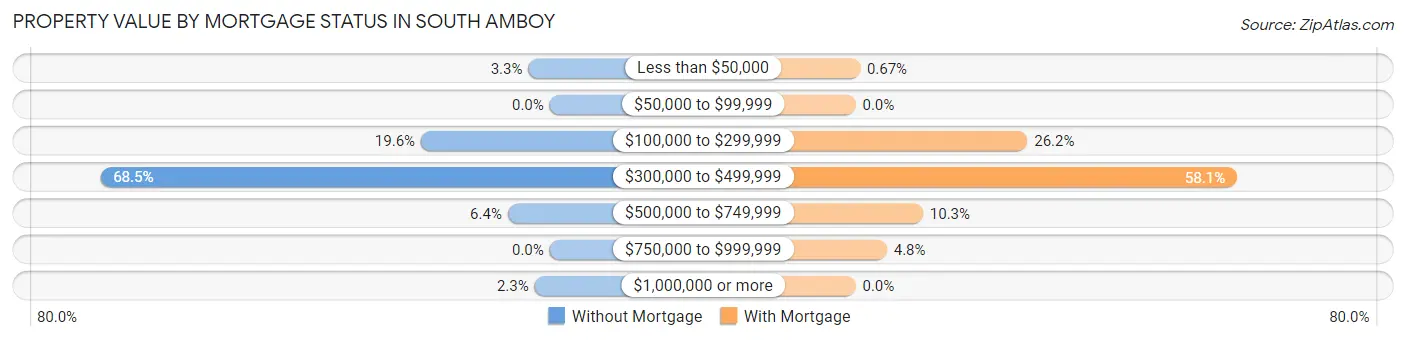
| Property Value | Without Mortgage | With Mortgage |
| Less than $50,000 | 27 (3.3%) | 9 (0.7%) |
| $50,000 to $99,999 | 0 (0.0%) | 0 (0.0%) |
| $100,000 to $299,999 | 163 (19.6%) | 352 (26.2%) |
| $300,000 to $499,999 | 569 (68.5%) | 782 (58.1%) |
| $500,000 to $749,999 | 53 (6.4%) | 138 (10.3%) |
| $750,000 to $999,999 | 0 (0.0%) | 64 (4.8%) |
| $1,000,000 or more | 19 (2.3%) | 0 (0.0%) |
| Total | 831 (100.0%) | 1,345 (100.0%) |
Household Income by Mortgage Status in South Amboy
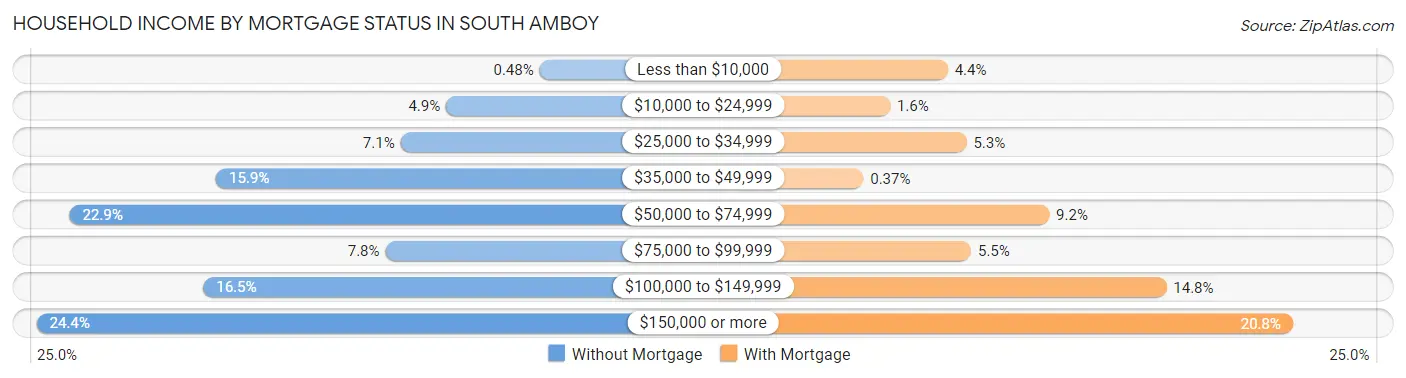
| Household Income | Without Mortgage | With Mortgage |
| Less than $10,000 | 4 (0.5%) | 59 (4.4%) |
| $10,000 to $24,999 | 41 (4.9%) | 22 (1.6%) |
| $25,000 to $34,999 | 59 (7.1%) | 71 (5.3%) |
| $35,000 to $49,999 | 132 (15.9%) | 5 (0.4%) |
| $50,000 to $74,999 | 190 (22.9%) | 124 (9.2%) |
| $75,000 to $99,999 | 65 (7.8%) | 74 (5.5%) |
| $100,000 to $149,999 | 137 (16.5%) | 199 (14.8%) |
| $150,000 or more | 203 (24.4%) | 280 (20.8%) |
| Total | 831 (100.0%) | 1,345 (100.0%) |
Property Value to Household Income Ratio in South Amboy
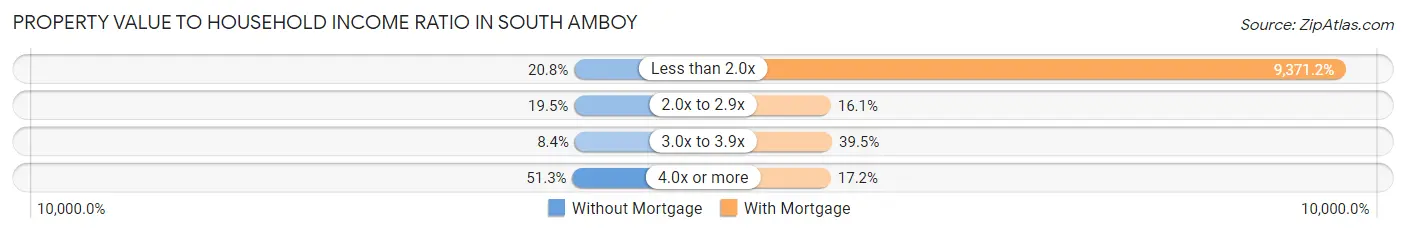
| Value-to-Income Ratio | Without Mortgage | With Mortgage |
| Less than 2.0x | 173 (20.8%) | 126,042 (9,371.2%) |
| 2.0x to 2.9x | 162 (19.5%) | 216 (16.1%) |
| 3.0x to 3.9x | 70 (8.4%) | 531 (39.5%) |
| 4.0x or more | 426 (51.3%) | 231 (17.2%) |
| Total | 831 (100.0%) | 1,345 (100.0%) |
Real Estate Taxes by Mortgage Status in South Amboy
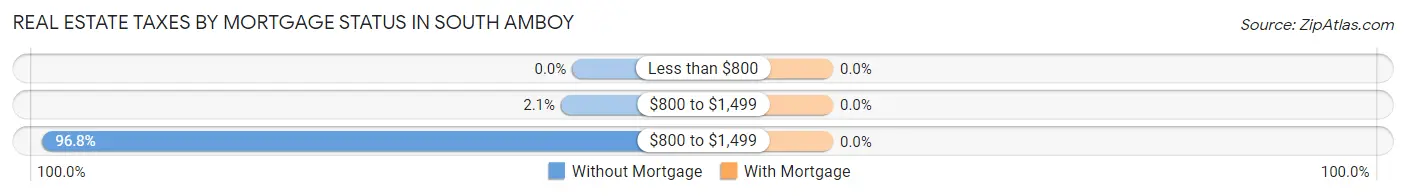
| Property Taxes | Without Mortgage | With Mortgage |
| Less than $800 | 0 (0.0%) | 0 (0.0%) |
| $800 to $1,499 | 17 (2.1%) | 0 (0.0%) |
| $800 to $1,499 | 804 (96.8%) | 0 (0.0%) |
| Total | 831 (100.0%) | 1,345 (100.0%) |
Health & Disability in South Amboy
Health Insurance Coverage by Age in South Amboy
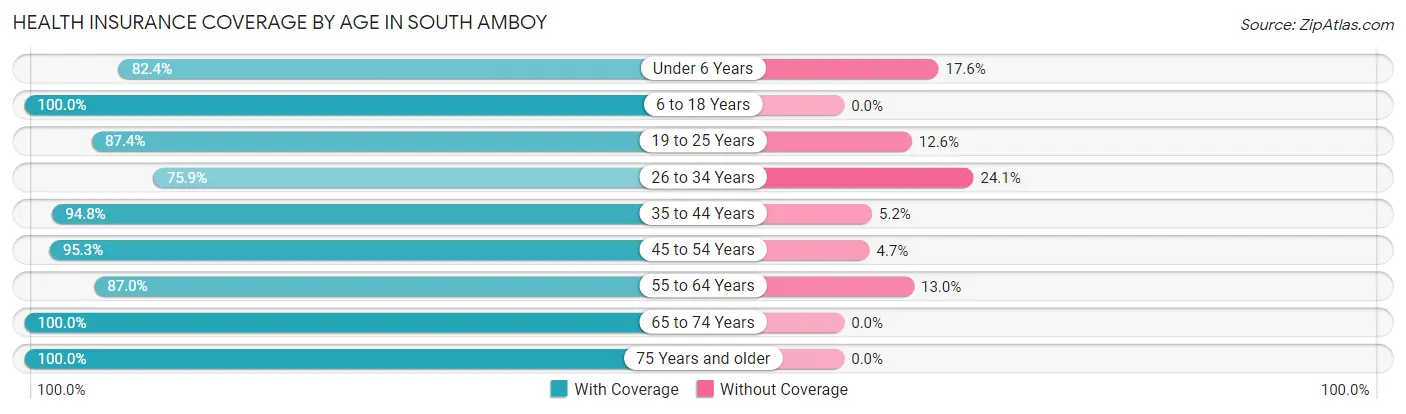
| Age Bracket | With Coverage | Without Coverage |
| Under 6 Years | 375 (82.4%) | 80 (17.6%) |
| 6 to 18 Years | 1,074 (100.0%) | 0 (0.0%) |
| 19 to 25 Years | 645 (87.4%) | 93 (12.6%) |
| 26 to 34 Years | 1,096 (75.9%) | 348 (24.1%) |
| 35 to 44 Years | 1,298 (94.8%) | 71 (5.2%) |
| 45 to 54 Years | 911 (95.3%) | 45 (4.7%) |
| 55 to 64 Years | 1,612 (87.0%) | 241 (13.0%) |
| 65 to 74 Years | 1,145 (100.0%) | 0 (0.0%) |
| 75 Years and older | 272 (100.0%) | 0 (0.0%) |
| Total | 8,428 (90.6%) | 878 (9.4%) |
Health Insurance Coverage by Citizenship Status in South Amboy
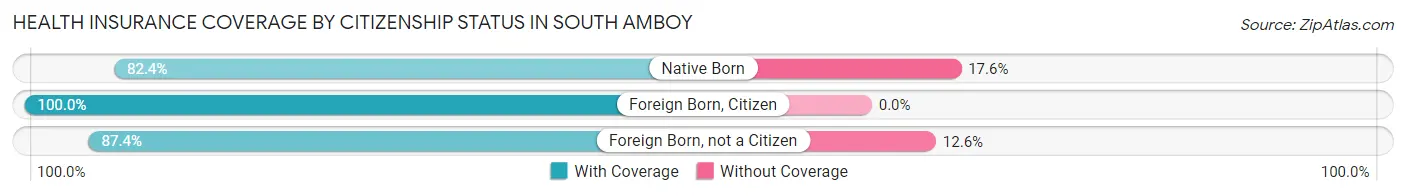
| Citizenship Status | With Coverage | Without Coverage |
| Native Born | 375 (82.4%) | 80 (17.6%) |
| Foreign Born, Citizen | 1,074 (100.0%) | 0 (0.0%) |
| Foreign Born, not a Citizen | 645 (87.4%) | 93 (12.6%) |
Health Insurance Coverage by Household Income in South Amboy
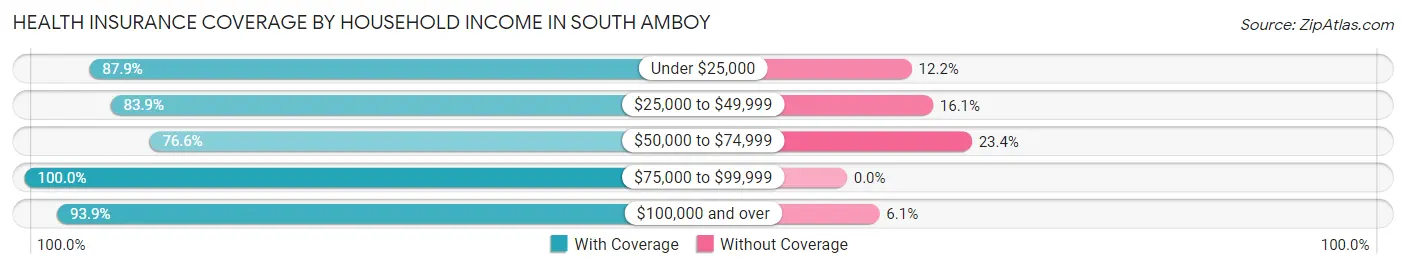
| Household Income | With Coverage | Without Coverage |
| Under $25,000 | 629 (87.8%) | 87 (12.1%) |
| $25,000 to $49,999 | 1,363 (83.9%) | 262 (16.1%) |
| $50,000 to $74,999 | 645 (76.6%) | 197 (23.4%) |
| $75,000 to $99,999 | 685 (100.0%) | 0 (0.0%) |
| $100,000 and over | 5,098 (93.9%) | 332 (6.1%) |
Public vs Private Health Insurance Coverage by Age in South Amboy
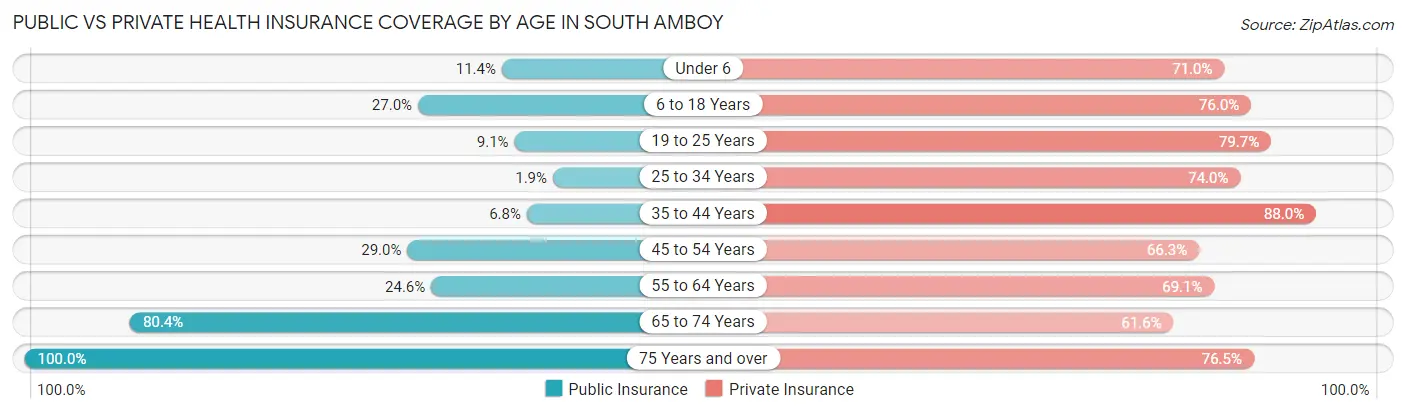
| Age Bracket | Public Insurance | Private Insurance |
| Under 6 | 52 (11.4%) | 323 (71.0%) |
| 6 to 18 Years | 290 (27.0%) | 816 (76.0%) |
| 19 to 25 Years | 67 (9.1%) | 588 (79.7%) |
| 25 to 34 Years | 28 (1.9%) | 1,068 (74.0%) |
| 35 to 44 Years | 93 (6.8%) | 1,205 (88.0%) |
| 45 to 54 Years | 277 (29.0%) | 634 (66.3%) |
| 55 to 64 Years | 455 (24.5%) | 1,281 (69.1%) |
| 65 to 74 Years | 921 (80.4%) | 705 (61.6%) |
| 75 Years and over | 272 (100.0%) | 208 (76.5%) |
| Total | 2,455 (26.4%) | 6,828 (73.4%) |
Disability Status by Sex by Age in South Amboy
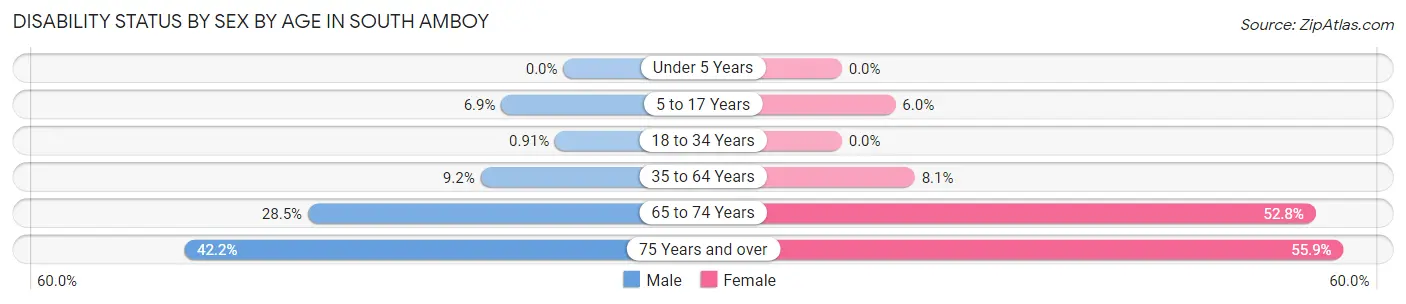
| Age Bracket | Male | Female |
| Under 5 Years | 0 (0.0%) | 0 (0.0%) |
| 5 to 17 Years | 26 (6.9%) | 39 (6.0%) |
| 18 to 34 Years | 10 (0.9%) | 0 (0.0%) |
| 35 to 64 Years | 181 (9.2%) | 180 (8.1%) |
| 65 to 74 Years | 136 (28.4%) | 352 (52.8%) |
| 75 Years and over | 68 (42.2%) | 62 (55.9%) |
Disability Class by Sex by Age in South Amboy
Disability Class: Hearing Difficulty
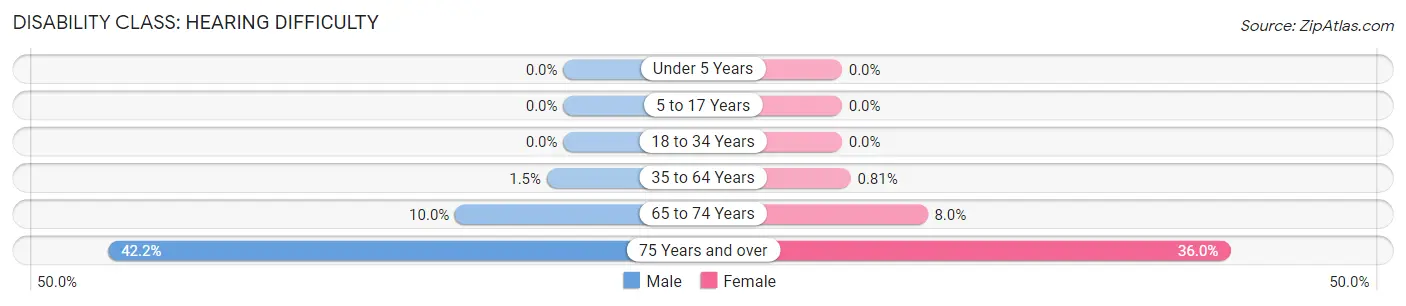
| Age Bracket | Male | Female |
| Under 5 Years | 0 (0.0%) | 0 (0.0%) |
| 5 to 17 Years | 0 (0.0%) | 0 (0.0%) |
| 18 to 34 Years | 0 (0.0%) | 0 (0.0%) |
| 35 to 64 Years | 30 (1.5%) | 18 (0.8%) |
| 65 to 74 Years | 48 (10.0%) | 53 (8.0%) |
| 75 Years and over | 68 (42.2%) | 40 (36.0%) |
Disability Class: Vision Difficulty
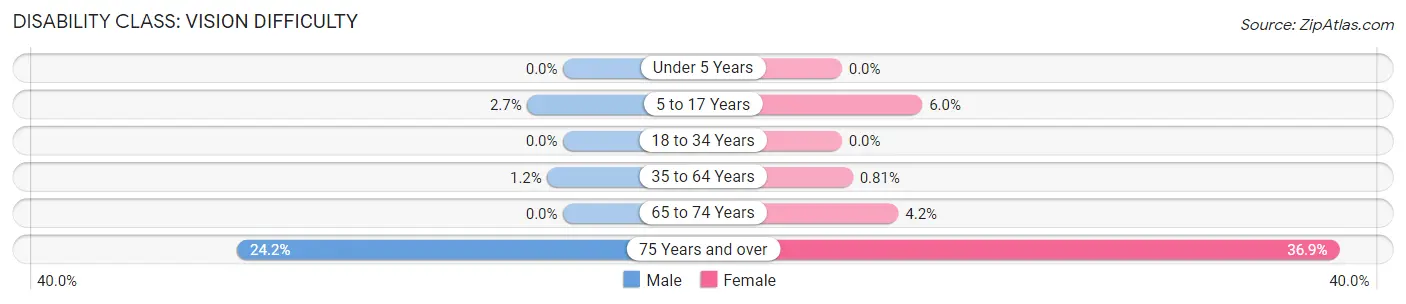
| Age Bracket | Male | Female |
| Under 5 Years | 0 (0.0%) | 0 (0.0%) |
| 5 to 17 Years | 10 (2.7%) | 39 (6.0%) |
| 18 to 34 Years | 0 (0.0%) | 0 (0.0%) |
| 35 to 64 Years | 23 (1.2%) | 18 (0.8%) |
| 65 to 74 Years | 0 (0.0%) | 28 (4.2%) |
| 75 Years and over | 39 (24.2%) | 41 (36.9%) |
Disability Class: Cognitive Difficulty
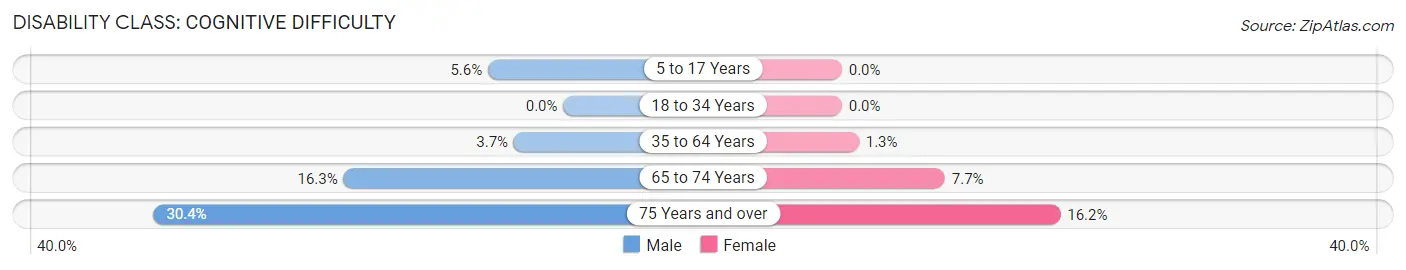
| Age Bracket | Male | Female |
| 5 to 17 Years | 21 (5.6%) | 0 (0.0%) |
| 18 to 34 Years | 0 (0.0%) | 0 (0.0%) |
| 35 to 64 Years | 72 (3.7%) | 28 (1.3%) |
| 65 to 74 Years | 78 (16.3%) | 51 (7.6%) |
| 75 Years and over | 49 (30.4%) | 18 (16.2%) |
Disability Class: Ambulatory Difficulty
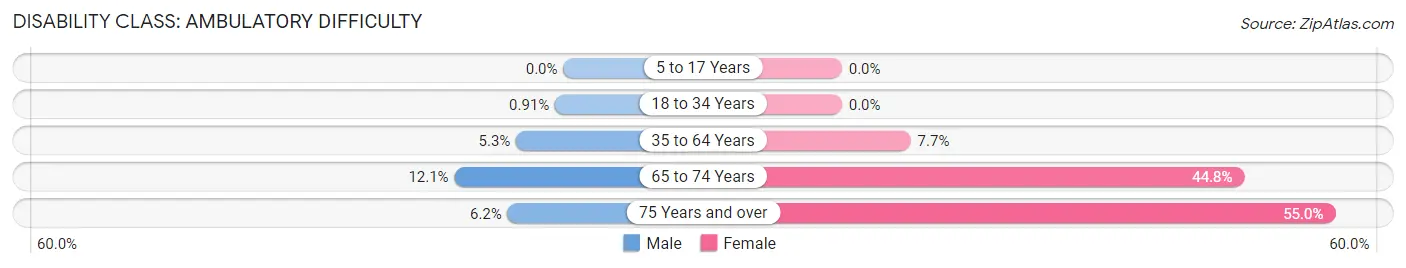
| Age Bracket | Male | Female |
| 5 to 17 Years | 0 (0.0%) | 0 (0.0%) |
| 18 to 34 Years | 10 (0.9%) | 0 (0.0%) |
| 35 to 64 Years | 103 (5.2%) | 170 (7.7%) |
| 65 to 74 Years | 58 (12.1%) | 299 (44.8%) |
| 75 Years and over | 10 (6.2%) | 61 (54.9%) |
Disability Class: Self-Care Difficulty
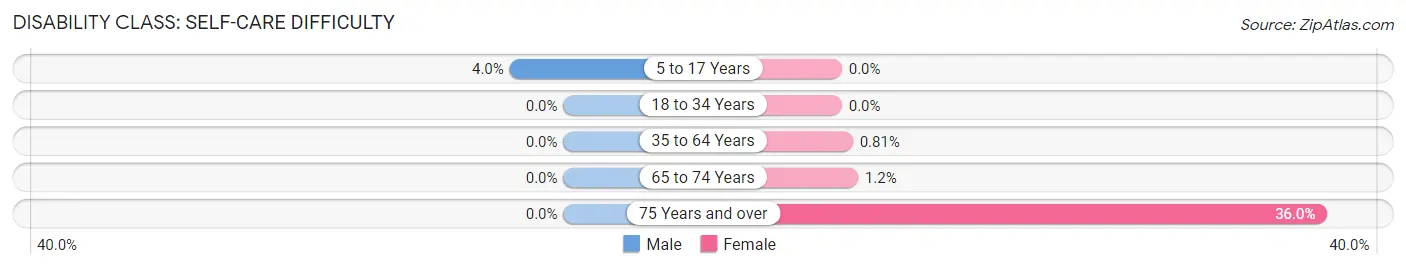
| Age Bracket | Male | Female |
| 5 to 17 Years | 15 (4.0%) | 0 (0.0%) |
| 18 to 34 Years | 0 (0.0%) | 0 (0.0%) |
| 35 to 64 Years | 0 (0.0%) | 18 (0.8%) |
| 65 to 74 Years | 0 (0.0%) | 8 (1.2%) |
| 75 Years and over | 0 (0.0%) | 40 (36.0%) |
Technology Access in South Amboy
Computing Device Access in South Amboy
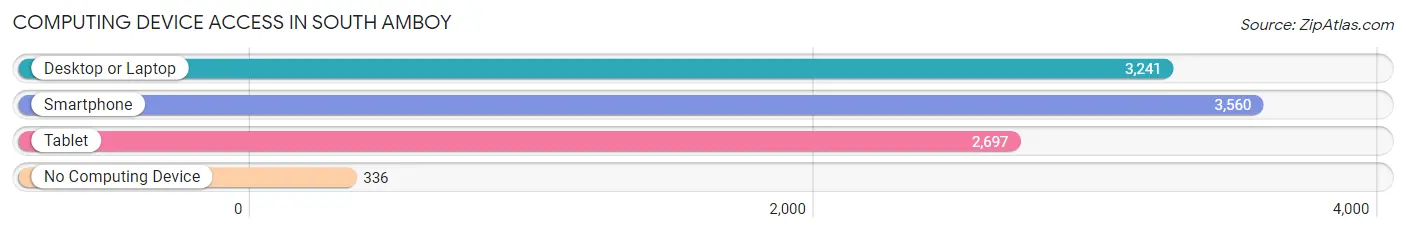
| Device Type | # Households | % Households |
| Desktop or Laptop | 3,241 | 80.4% |
| Smartphone | 3,560 | 88.3% |
| Tablet | 2,697 | 66.9% |
| No Computing Device | 336 | 8.3% |
| Total | 4,031 | 100.0% |
Internet Access in South Amboy
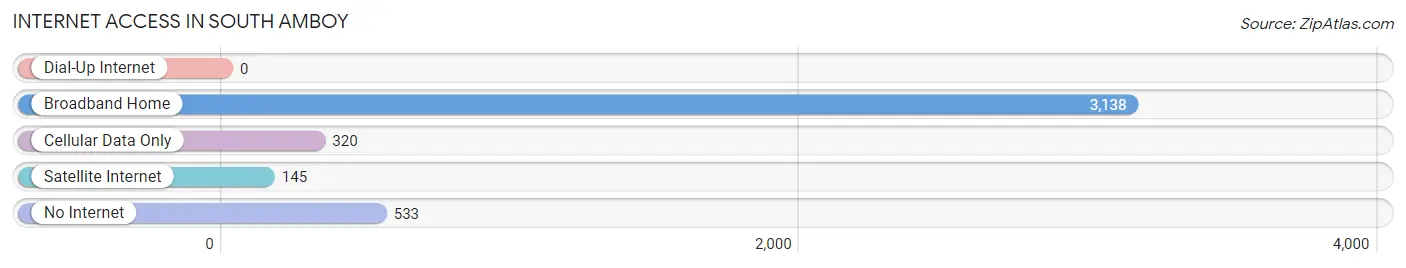
| Internet Type | # Households | % Households |
| Dial-Up Internet | 0 | 0.0% |
| Broadband Home | 3,138 | 77.8% |
| Cellular Data Only | 320 | 7.9% |
| Satellite Internet | 145 | 3.6% |
| No Internet | 533 | 13.2% |
| Total | 4,031 | 100.0% |
South Amboy Summary
South Amboy is a city located in Middlesex County, New Jersey, United States. It is situated on the Raritan Bay, near the mouth of the Raritan River. As of the 2010 United States Census, the city had a total population of 8,631, reflecting an increase of 1,536 (+21.7%) from the 7,095 counted in the 2000 Census, which had in turn increased by 1,343 (+23.3%) from the 5,752 counted in the 1990 Census.
History
South Amboy was originally formed as a borough by an act of the New Jersey Legislature on March 17, 1867, from portions of Perth Amboy Township. On April 2, 1908, South Amboy was incorporated as a city, replacing South Amboy Borough, based on the results of a referendum held on May 12, 1908.
The city s name derives from the fact that it is located south of the city of Perth Amboy
Geography
South Amboy is located at 40 29 00 N 74 17 35 W 40 4833 74 2930
According to the United States Census Bureau, the city had a total area of 2.694 square miles (6.972 km2), including 2.087 square miles (5.403 km2) of land and 0.607 square miles (1.569 km2) of water (22.54%).
The city is bordered by Sayreville to the north, Perth Amboy to the south, and the Raritan Bay to the east.
Economy
South Amboy is home to a variety of businesses, including manufacturing, retail, and service industries. The city is also home to a number of corporate headquarters, including the headquarters of the South Amboy-based company, Amboy Bank.
The city is also home to a number of small businesses, including restaurants, bars, and other retail establishments.
Demographics
As of the 2010 United States Census, there were 8,631 people, 3,372 households, and 2,093 families residing in the city. The population density was 4,125.3 per square mile (1,590.2/km2). There were 3,619 housing units at an average density of 1,737.2 per square mile (671.3/km2). The racial makeup of the city was 79.17% (6,845) White, 5.90% (509) Black or African American, 0.20% (17) Native American, 6.45% (556) Asian, 0.03% (2) Pacific Islander, 5.45% (471) from other races, and 2.80% (242) from two or more races. Hispanic or Latino of any race were 15.90% (1,372) of the population.
There were 3,372 households out of which 28.2% had children under the age of 18 living with them, 43.2% were married couples living together, 14.7% had a female householder with no husband present, and 36.2% were non-families. 30.2% of all households were made up of individuals, and 11.2% had someone living alone who was 65 years of age or older. The average household size was 2.55 and the average family size was 3.20.
In the city, the population was spread out with 22.2% under the age of 18, 8.2% from 18 to 24, 31.2% from 25 to 44, 24.2% from 45 to 64, and 14.2% who were 65 years of age or older. The median age was 37.4 years. For every 100 females there were 94.2 males. For every 100 females ages 18 and older there were 91.2 males.
The Census Bureau's 2006-2010 American Community Survey showed that (in 2010 inflation-adjusted dollars) median household income was $54,945 (with a margin of error of +/- $4,845) and the median family income was $63,958 (+/- $7,945). Males had a median income of $45,813 (+/- $4,945) versus $41,250 (+/- $3,945) for females. The per capita income for the borough was $25,835 (+/- $2,945). About 6.7% of families and 8.3% of the population were below the poverty line, including 11.3% of those under age 18 and 8.3% of those age 65 or over.
Common Questions
What is Per Capita Income in South Amboy?
Per Capita income in South Amboy is $46,481.
What is the Median Family Income in South Amboy?
Median Family Income in South Amboy is $110,576.
What is the Median Household income in South Amboy?
Median Household Income in South Amboy is $94,776.
What is Income or Wage Gap in South Amboy?
Income or Wage Gap in South Amboy is 0.3%.
Women in South Amboy earn 99.7 cents for every dollar earned by a man.
What is Family Income Deficit in South Amboy?
Family Income Deficit in South Amboy is $8,397.
Families that are below poverty line in South Amboy earn $8,397 less on average than the poverty threshold level.
What is Inequality or Gini Index in South Amboy?
Inequality or Gini Index in South Amboy is 0.39.
What is the Total Population of South Amboy?
Total Population of South Amboy is 9,336.
What is the Total Male Population of South Amboy?
Total Male Population of South Amboy is 4,270.
What is the Total Female Population of South Amboy?
Total Female Population of South Amboy is 5,066.
What is the Ratio of Males per 100 Females in South Amboy?
There are 84.29 Males per 100 Females in South Amboy.
What is the Ratio of Females per 100 Males in South Amboy?
There are 118.64 Females per 100 Males in South Amboy.
What is the Median Population Age in South Amboy?
Median Population Age in South Amboy is 41.0 Years.
What is the Average Family Size in South Amboy
Average Family Size in South Amboy is 2.7 People.
What is the Average Household Size in South Amboy
Average Household Size in South Amboy is 2.3 People.
How Large is the Labor Force in South Amboy?
There are 5,610 People in the Labor Forcein in South Amboy.
What is the Percentage of People in the Labor Force in South Amboy?
70.9% of People are in the Labor Force in South Amboy.
What is the Unemployment Rate in South Amboy?
Unemployment Rate in South Amboy is 5.7%.