Smallwood, NY Map & Demographics
Smallwood Map
Smallwood Overview
$38,680
PER CAPITA INCOME
$77,862
AVG FAMILY INCOME
$63,909
AVG HOUSEHOLD INCOME
16.2%
WAGE / INCOME GAP [ % ]
83.8¢/ $1
WAGE / INCOME GAP [ $ ]
0.41
INEQUALITY / GINI INDEX
666
TOTAL POPULATION
318
MALE POPULATION
348
FEMALE POPULATION
91.38
MALES / 100 FEMALES
109.43
FEMALES / 100 MALES
67.1
MEDIAN AGE
2.4
AVG FAMILY SIZE
1.8
AVG HOUSEHOLD SIZE
184
LABOR FORCE [ PEOPLE ]
32.5%
PERCENT IN LABOR FORCE
Smallwood Zip Codes
Smallwood Area Codes
Income in Smallwood
Income Overview in Smallwood
Per Capita Income in Smallwood is $38,680, while median incomes of families and households are $77,862 and $63,909 respectively.
| Characteristic | Number | Measure |
| Per Capita Income | 666 | $38,680 |
| Median Family Income | 215 | $77,862 |
| Mean Family Income | 215 | $78,035 |
| Median Household Income | 369 | $63,909 |
| Mean Household Income | 369 | $66,130 |
| Income Deficit | 215 | $0 |
| Wage / Income Gap (%) | 666 | 16.15% |
| Wage / Income Gap ($) | 666 | 83.85¢ per $1 |
| Gini / Inequality Index | 666 | 0.41 |
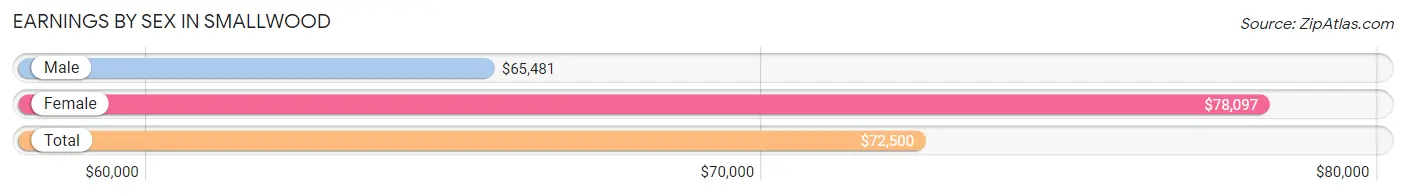
Earnings by Sex in Smallwood
Average Earnings in Smallwood are $72,500, $65,481 for men and $78,097 for women, a difference of 16.2%.
| Sex | Number | Average Earnings |
| Male | 121 (58.2%) | $65,481 |
| Female | 87 (41.8%) | $78,097 |
| Total | 208 (100.0%) | $72,500 |
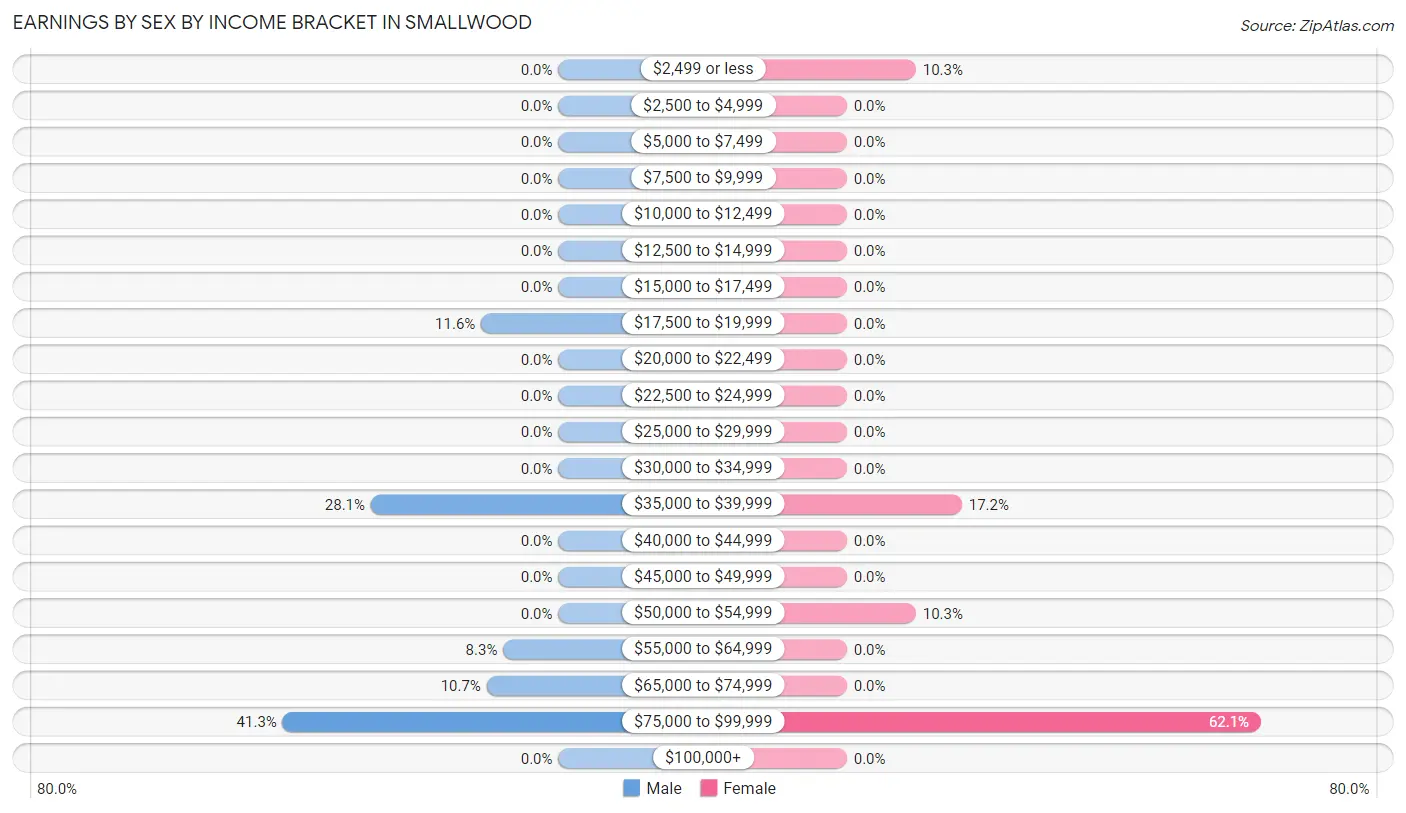
Earnings by Sex by Income Bracket in Smallwood
The most common earnings brackets in Smallwood are $75,000 to $99,999 for men (50 | 41.3%) and $75,000 to $99,999 for women (54 | 62.1%).
| Income | Male | Female |
| $2,499 or less | 0 (0.0%) | 9 (10.3%) |
| $2,500 to $4,999 | 0 (0.0%) | 0 (0.0%) |
| $5,000 to $7,499 | 0 (0.0%) | 0 (0.0%) |
| $7,500 to $9,999 | 0 (0.0%) | 0 (0.0%) |
| $10,000 to $12,499 | 0 (0.0%) | 0 (0.0%) |
| $12,500 to $14,999 | 0 (0.0%) | 0 (0.0%) |
| $15,000 to $17,499 | 0 (0.0%) | 0 (0.0%) |
| $17,500 to $19,999 | 14 (11.6%) | 0 (0.0%) |
| $20,000 to $22,499 | 0 (0.0%) | 0 (0.0%) |
| $22,500 to $24,999 | 0 (0.0%) | 0 (0.0%) |
| $25,000 to $29,999 | 0 (0.0%) | 0 (0.0%) |
| $30,000 to $34,999 | 0 (0.0%) | 0 (0.0%) |
| $35,000 to $39,999 | 34 (28.1%) | 15 (17.2%) |
| $40,000 to $44,999 | 0 (0.0%) | 0 (0.0%) |
| $45,000 to $49,999 | 0 (0.0%) | 0 (0.0%) |
| $50,000 to $54,999 | 0 (0.0%) | 9 (10.3%) |
| $55,000 to $64,999 | 10 (8.3%) | 0 (0.0%) |
| $65,000 to $74,999 | 13 (10.7%) | 0 (0.0%) |
| $75,000 to $99,999 | 50 (41.3%) | 54 (62.1%) |
| $100,000+ | 0 (0.0%) | 0 (0.0%) |
| Total | 121 (100.0%) | 87 (100.0%) |
Earnings by Sex by Educational Attainment in Smallwood
| Educational Attainment | Male Income | Female Income |
| Less than High School | - | - |
| High School Diploma | - | - |
| College or Associate's Degree | - | - |
| Bachelor's Degree | - | - |
| Graduate Degree | - | - |
| Total | $65,481 | $78,097 |
Family Income in Smallwood
Family Income Brackets in Smallwood
According to the Smallwood family income data, there are 68 families falling into the $75,000 to $99,999 income range, which is the most common income bracket and makes up 31.6% of all families.
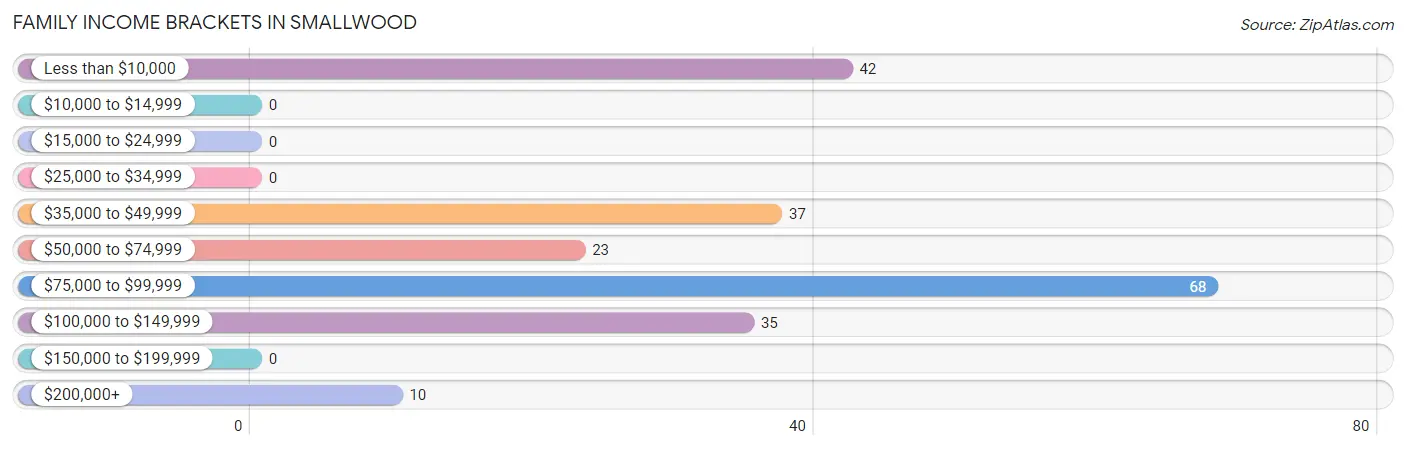
| Income Bracket | # Families | % Families |
| Less than $10,000 | 42 | 19.5% |
| $10,000 to $14,999 | 0 | 0.0% |
| $15,000 to $24,999 | 0 | 0.0% |
| $25,000 to $34,999 | 0 | 0.0% |
| $35,000 to $49,999 | 37 | 17.2% |
| $50,000 to $74,999 | 23 | 10.7% |
| $75,000 to $99,999 | 68 | 31.6% |
| $100,000 to $149,999 | 35 | 16.3% |
| $150,000 to $199,999 | 0 | 0.0% |
| $200,000+ | 10 | 4.7% |
Family Income by Famaliy Size in Smallwood
2-person families (173 | 80.5%) account for the highest median family income in Smallwood with $79,243 per family, while 2-person families (173 | 80.5%) have the highest median income of $39,622 per family member.
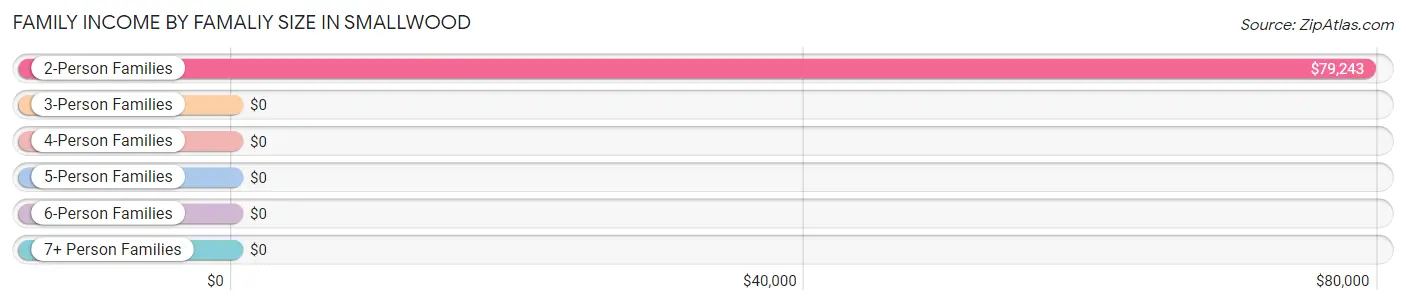
| Income Bracket | # Families | Median Income |
| 2-Person Families | 173 (80.5%) | $79,243 |
| 3-Person Families | 0 (0.0%) | $0 |
| 4-Person Families | 42 (19.5%) | $0 |
| 5-Person Families | 0 (0.0%) | $0 |
| 6-Person Families | 0 (0.0%) | $0 |
| 7+ Person Families | 0 (0.0%) | $0 |
| Total | 215 (100.0%) | $77,862 |
Family Income by Number of Earners in Smallwood
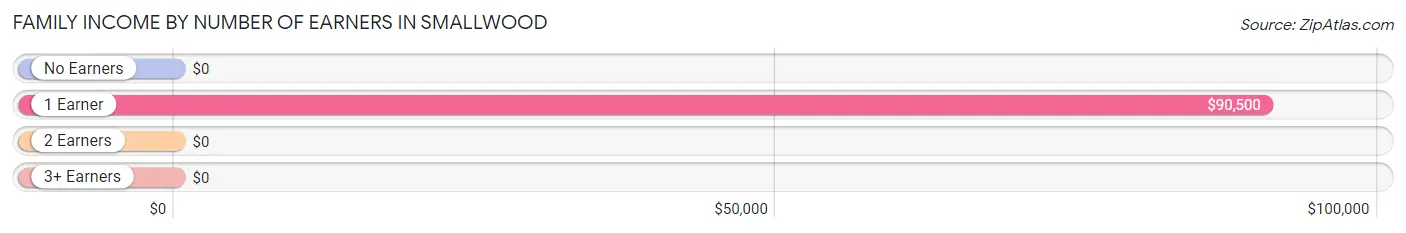
| Number of Earners | # Families | Median Income |
| No Earners | 102 (47.4%) | $0 |
| 1 Earner | 88 (40.9%) | $90,500 |
| 2 Earners | 25 (11.6%) | $0 |
| 3+ Earners | 0 (0.0%) | $0 |
| Total | 215 (100.0%) | $77,862 |
Household Income in Smallwood
Household Income Brackets in Smallwood
With 98 households falling in the category, the $50,000 to $74,999 income range is the most frequent in Smallwood, accounting for 26.6% of all households.
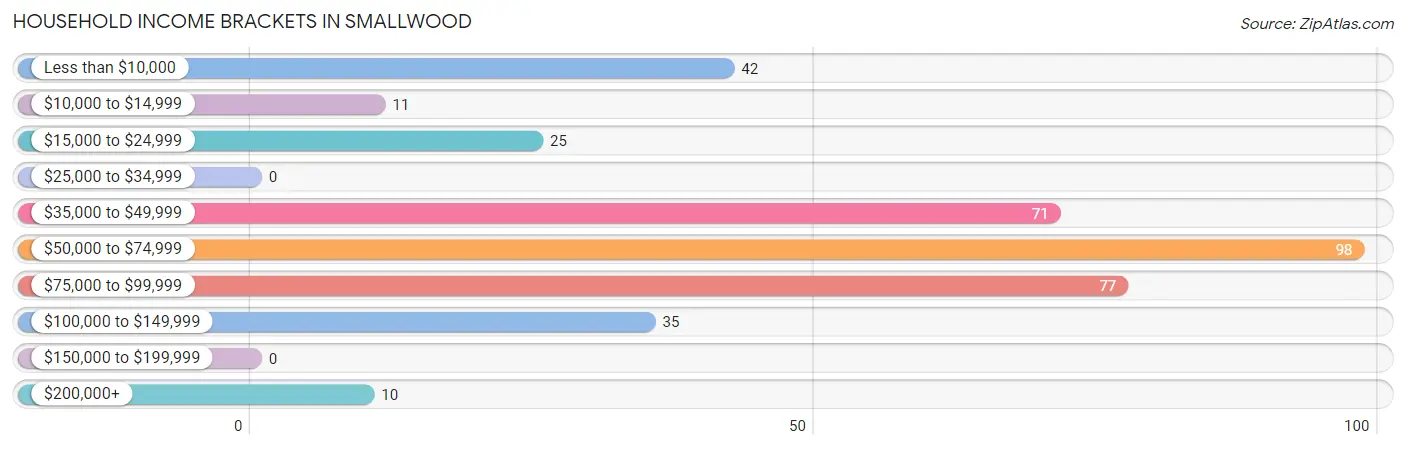
| Income Bracket | # Households | % Households |
| Less than $10,000 | 42 | 11.4% |
| $10,000 to $14,999 | 11 | 3.0% |
| $15,000 to $24,999 | 25 | 6.8% |
| $25,000 to $34,999 | 0 | 0.0% |
| $35,000 to $49,999 | 71 | 19.2% |
| $50,000 to $74,999 | 98 | 26.6% |
| $75,000 to $99,999 | 77 | 20.9% |
| $100,000 to $149,999 | 35 | 9.5% |
| $150,000 to $199,999 | 0 | 0.0% |
| $200,000+ | 10 | 2.7% |
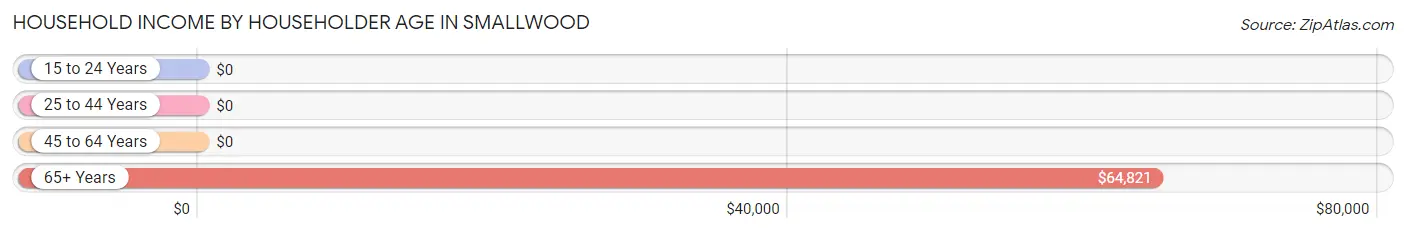
Household Income by Householder Age in Smallwood
The median household income in Smallwood is $63,909, with the highest median household income of $64,821 found in the 65+ years age bracket for the primary householder. A total of 263 households (71.3%) fall into this category.
| Income Bracket | # Households | Median Income |
| 15 to 24 Years | 0 (0.0%) | $0 |
| 25 to 44 Years | 0 (0.0%) | $0 |
| 45 to 64 Years | 106 (28.7%) | $0 |
| 65+ Years | 263 (71.3%) | $64,821 |
| Total | 369 (100.0%) | $63,909 |
Poverty in Smallwood
Income Below Poverty by Sex and Age in Smallwood
With 13.2% poverty level for males and 31.6% for females among the residents of Smallwood, 6 to 11 year old males and 6 to 11 year old females are the most vulnerable to poverty, with 31 males (100.0%) and 68 females (100.0%) in their respective age groups living below the poverty level.
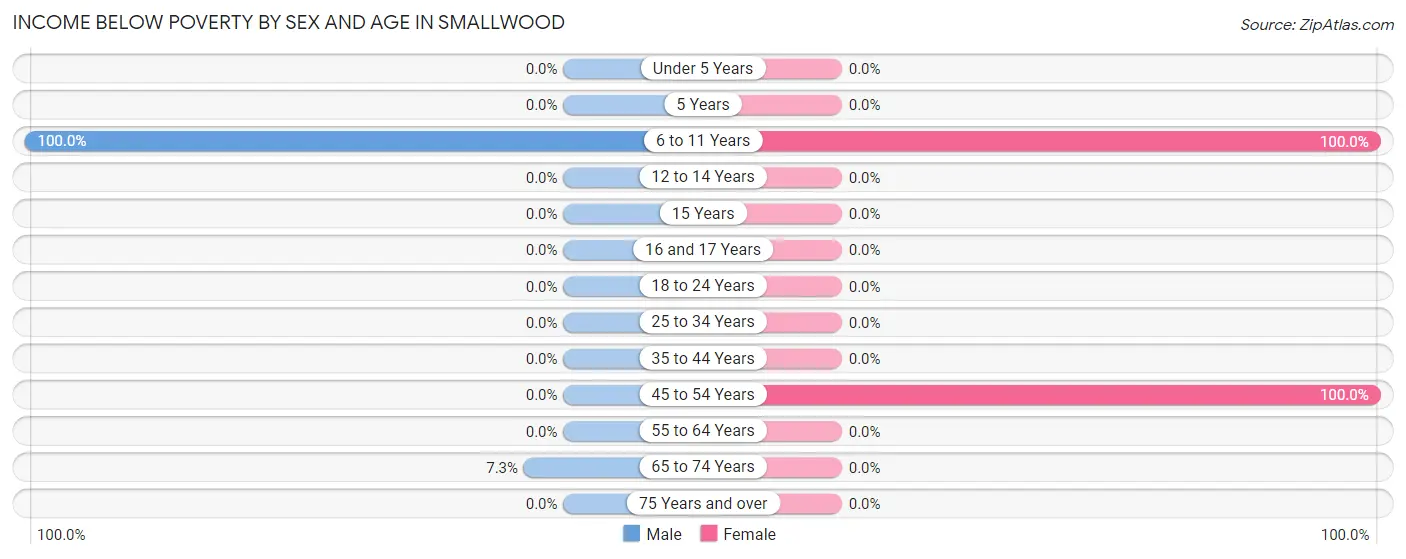
| Age Bracket | Male | Female |
| Under 5 Years | 0 (0.0%) | 0 (0.0%) |
| 5 Years | 0 (0.0%) | 0 (0.0%) |
| 6 to 11 Years | 31 (100.0%) | 68 (100.0%) |
| 12 to 14 Years | 0 (0.0%) | 0 (0.0%) |
| 15 Years | 0 (0.0%) | 0 (0.0%) |
| 16 and 17 Years | 0 (0.0%) | 0 (0.0%) |
| 18 to 24 Years | 0 (0.0%) | 0 (0.0%) |
| 25 to 34 Years | 0 (0.0%) | 0 (0.0%) |
| 35 to 44 Years | 0 (0.0%) | 0 (0.0%) |
| 45 to 54 Years | 0 (0.0%) | 42 (100.0%) |
| 55 to 64 Years | 0 (0.0%) | 0 (0.0%) |
| 65 to 74 Years | 11 (7.3%) | 0 (0.0%) |
| 75 Years and over | 0 (0.0%) | 0 (0.0%) |
| Total | 42 (13.2%) | 110 (31.6%) |
Income Above Poverty by Sex and Age in Smallwood
According to the poverty statistics in Smallwood, males aged 35 to 44 years and females aged 55 to 64 years are the age groups that are most secure financially, with 100.0% of males and 100.0% of females in these age groups living above the poverty line.
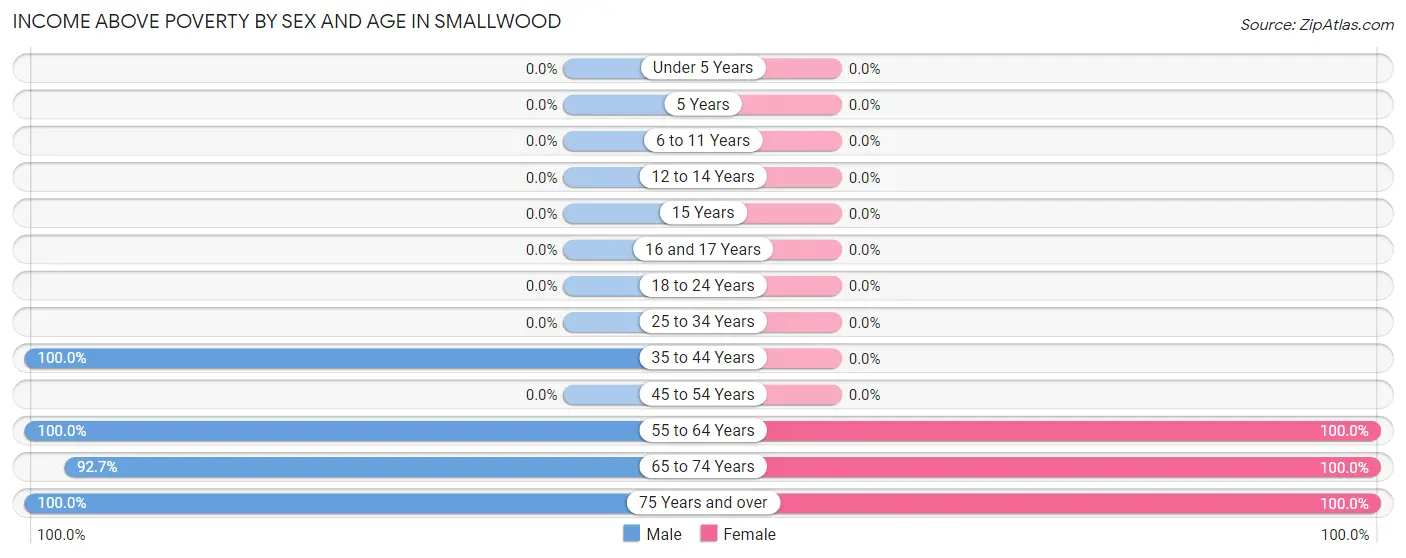
| Age Bracket | Male | Female |
| Under 5 Years | 0 (0.0%) | 0 (0.0%) |
| 5 Years | 0 (0.0%) | 0 (0.0%) |
| 6 to 11 Years | 0 (0.0%) | 0 (0.0%) |
| 12 to 14 Years | 0 (0.0%) | 0 (0.0%) |
| 15 Years | 0 (0.0%) | 0 (0.0%) |
| 16 and 17 Years | 0 (0.0%) | 0 (0.0%) |
| 18 to 24 Years | 0 (0.0%) | 0 (0.0%) |
| 25 to 34 Years | 0 (0.0%) | 0 (0.0%) |
| 35 to 44 Years | 20 (100.0%) | 0 (0.0%) |
| 45 to 54 Years | 0 (0.0%) | 0 (0.0%) |
| 55 to 64 Years | 64 (100.0%) | 92 (100.0%) |
| 65 to 74 Years | 139 (92.7%) | 135 (100.0%) |
| 75 Years and over | 53 (100.0%) | 11 (100.0%) |
| Total | 276 (86.8%) | 238 (68.4%) |
Income Below Poverty Among Married-Couple Families in Smallwood
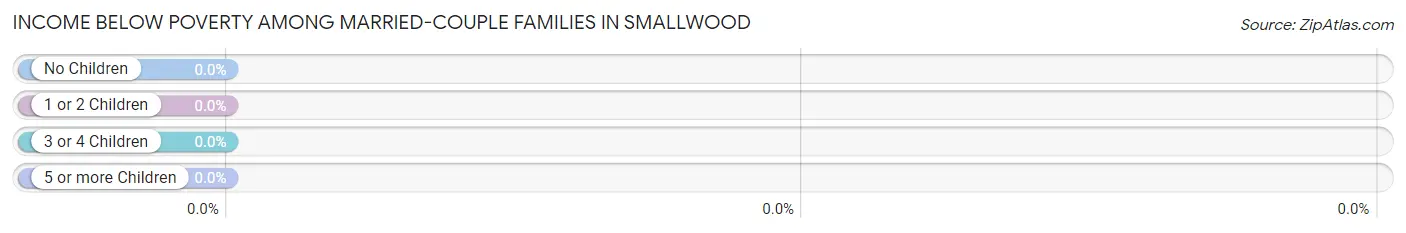
| Children | Above Poverty | Below Poverty |
| No Children | 158 (100.0%) | 0 (0.0%) |
| 1 or 2 Children | 0 (0.0%) | 0 (0.0%) |
| 3 or 4 Children | 0 (0.0%) | 0 (0.0%) |
| 5 or more Children | 0 (0.0%) | 0 (0.0%) |
| Total | 158 (100.0%) | 0 (0.0%) |
Income Below Poverty Among Single-Parent Households in Smallwood
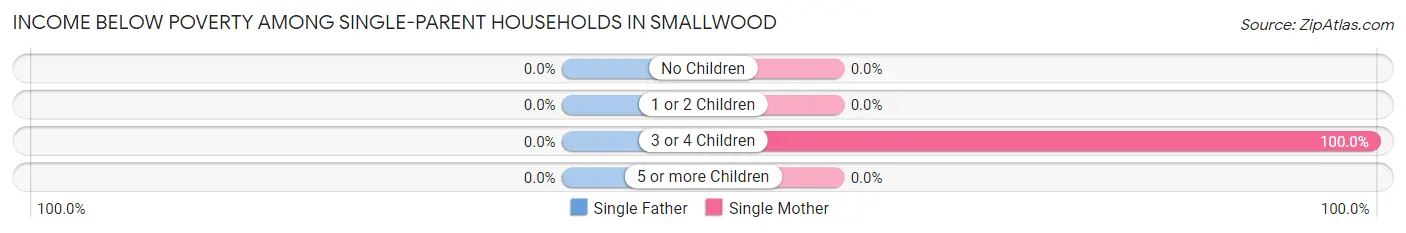
| Children | Single Father | Single Mother |
| No Children | 0 (0.0%) | 0 (0.0%) |
| 1 or 2 Children | 0 (0.0%) | 0 (0.0%) |
| 3 or 4 Children | 0 (0.0%) | 42 (100.0%) |
| 5 or more Children | 0 (0.0%) | 0 (0.0%) |
| Total | 0 (0.0%) | 42 (73.7%) |
Income Below Poverty Among Married-Couple vs Single-Parent Households in Smallwood
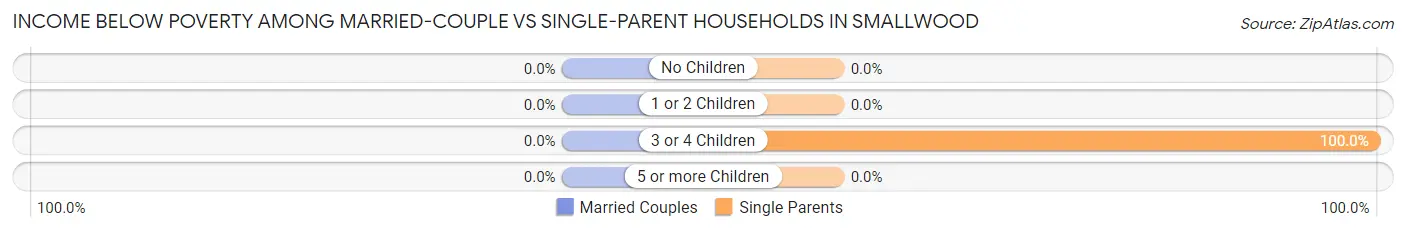
| Children | Married-Couple Families | Single-Parent Households |
| No Children | 0 (0.0%) | 0 (0.0%) |
| 1 or 2 Children | 0 (0.0%) | 0 (0.0%) |
| 3 or 4 Children | 0 (0.0%) | 42 (100.0%) |
| 5 or more Children | 0 (0.0%) | 0 (0.0%) |
| Total | 0 (0.0%) | 42 (73.7%) |
Race in Smallwood
The most populous races in Smallwood are White / Caucasian (560 | 84.1%), Some other Race (93 | 14.0%), and Two or more Races (13 | 1.9%).
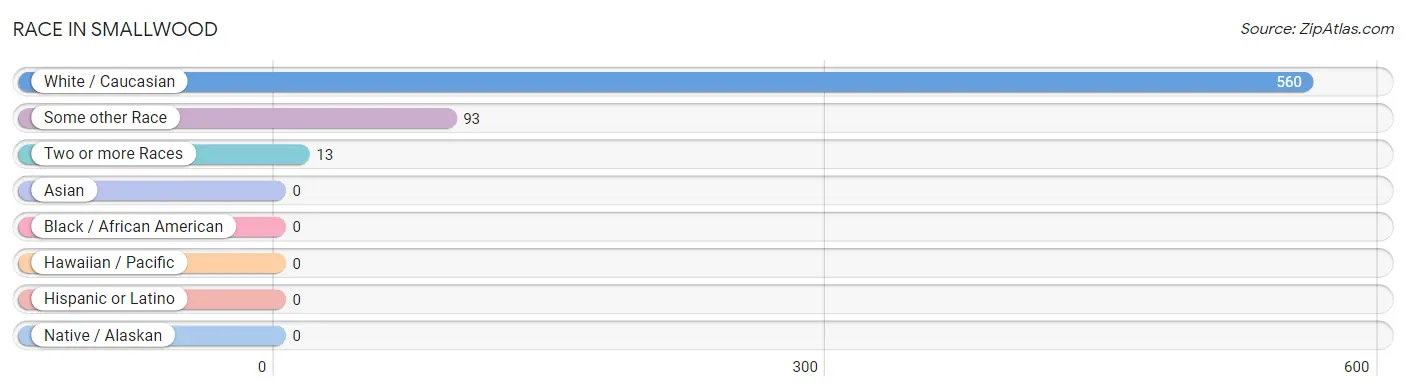
| Race | # Population | % Population |
| Asian | 0 | 0.0% |
| Black / African American | 0 | 0.0% |
| Hawaiian / Pacific | 0 | 0.0% |
| Hispanic or Latino | 0 | 0.0% |
| Native / Alaskan | 0 | 0.0% |
| White / Caucasian | 560 | 84.1% |
| Two or more Races | 13 | 1.9% |
| Some other Race | 93 | 14.0% |
| Total | 666 | 100.0% |
Ancestry in Smallwood
The most populous ancestries reported in Smallwood are Russian (175 | 26.3%), Irish (88 | 13.2%), Polish (77 | 11.6%), Norwegian (64 | 9.6%), and Italian (55 | 8.3%), together accounting for 68.9% of all Smallwood residents.
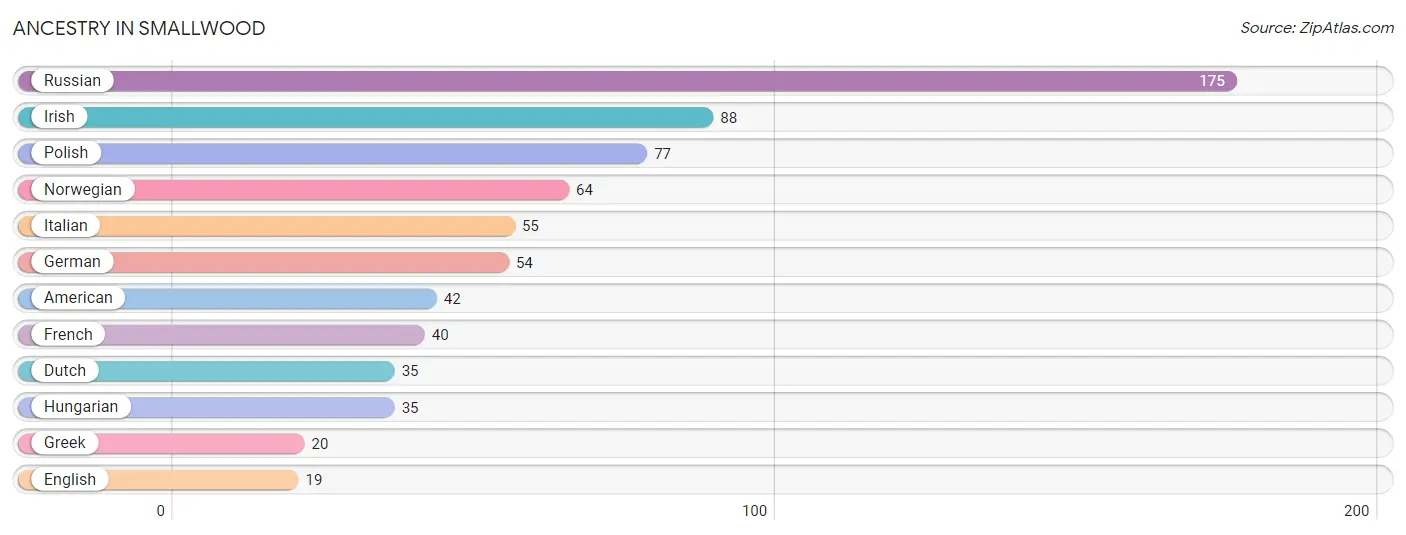
| Ancestry | # Population | % Population |
| American | 42 | 6.3% |
| Dutch | 35 | 5.3% |
| English | 19 | 2.9% |
| French | 40 | 6.0% |
| German | 54 | 8.1% |
| Greek | 20 | 3.0% |
| Hungarian | 35 | 5.3% |
| Irish | 88 | 13.2% |
| Italian | 55 | 8.3% |
| Norwegian | 64 | 9.6% |
| Polish | 77 | 11.6% |
| Russian | 175 | 26.3% | View All 12 Rows |
Immigrants in Smallwood
The most numerous immigrant groups reported in Smallwood came from Europe (119 | 17.9%), Eastern Europe (110 | 16.5%), Poland (68 | 10.2%), Germany (9 | 1.3%), and Western Europe (9 | 1.3%), together accounting for 47.3% of all Smallwood residents.
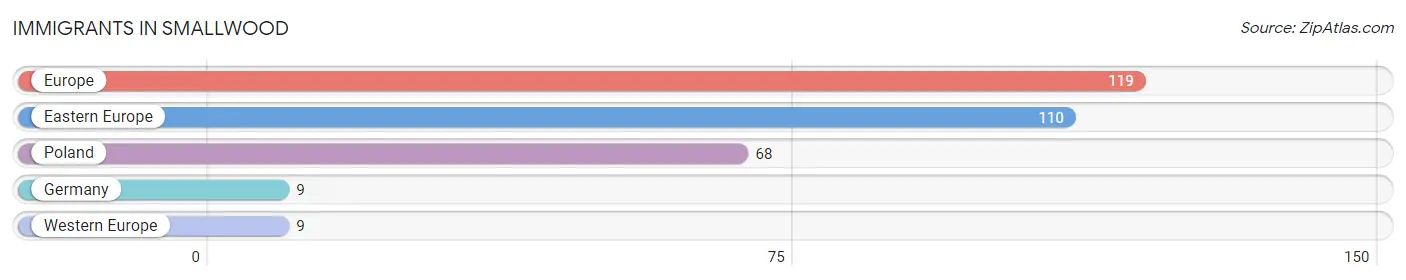
| Immigration Origin | # Population | % Population |
| Eastern Europe | 110 | 16.5% |
| Europe | 119 | 17.9% |
| Germany | 9 | 1.3% |
| Poland | 68 | 10.2% |
| Western Europe | 9 | 1.3% | View All 5 Rows |
Sex and Age in Smallwood
Sex and Age in Smallwood
The most populous age groups in Smallwood are 65 to 69 Years (98 | 30.8%) for men and 70 to 74 Years (112 | 32.2%) for women.
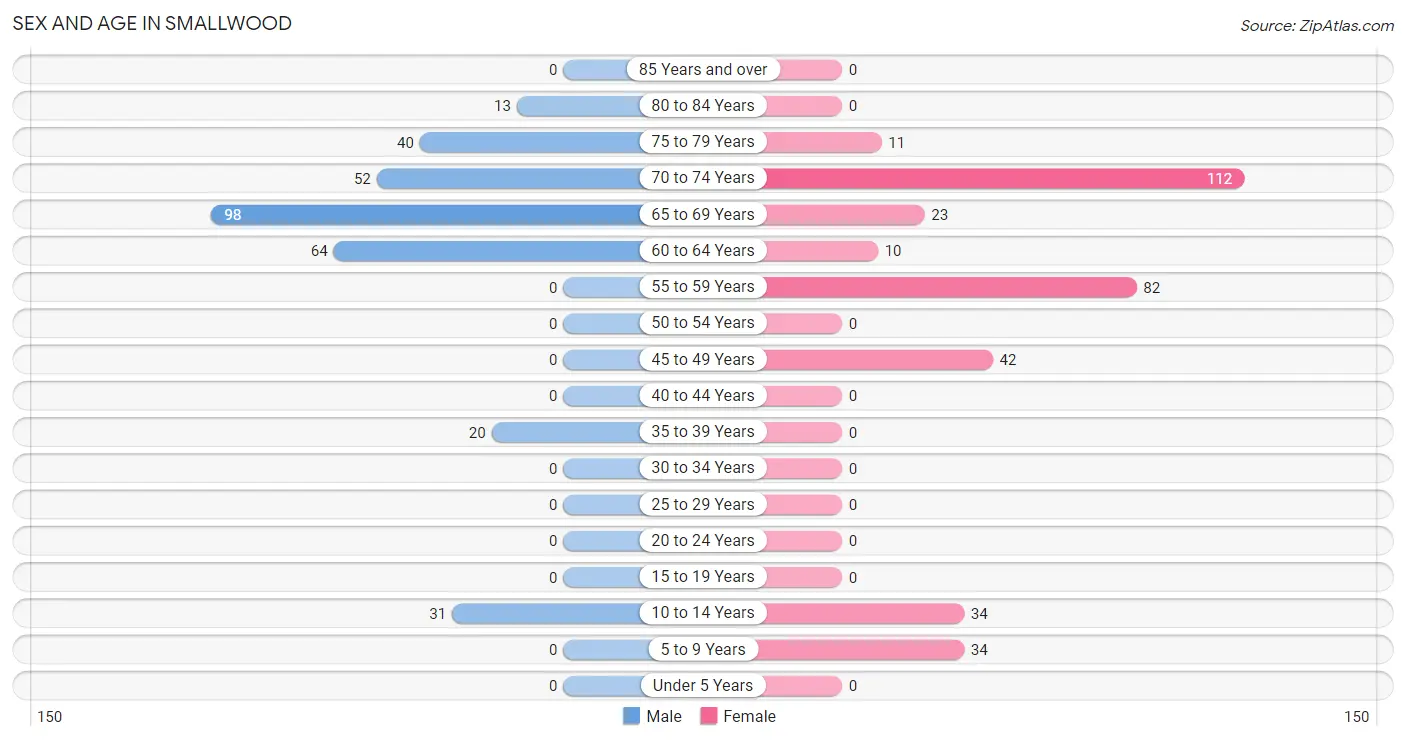
| Age Bracket | Male | Female |
| Under 5 Years | 0 (0.0%) | 0 (0.0%) |
| 5 to 9 Years | 0 (0.0%) | 34 (9.8%) |
| 10 to 14 Years | 31 (9.8%) | 34 (9.8%) |
| 15 to 19 Years | 0 (0.0%) | 0 (0.0%) |
| 20 to 24 Years | 0 (0.0%) | 0 (0.0%) |
| 25 to 29 Years | 0 (0.0%) | 0 (0.0%) |
| 30 to 34 Years | 0 (0.0%) | 0 (0.0%) |
| 35 to 39 Years | 20 (6.3%) | 0 (0.0%) |
| 40 to 44 Years | 0 (0.0%) | 0 (0.0%) |
| 45 to 49 Years | 0 (0.0%) | 42 (12.1%) |
| 50 to 54 Years | 0 (0.0%) | 0 (0.0%) |
| 55 to 59 Years | 0 (0.0%) | 82 (23.6%) |
| 60 to 64 Years | 64 (20.1%) | 10 (2.9%) |
| 65 to 69 Years | 98 (30.8%) | 23 (6.6%) |
| 70 to 74 Years | 52 (16.4%) | 112 (32.2%) |
| 75 to 79 Years | 40 (12.6%) | 11 (3.2%) |
| 80 to 84 Years | 13 (4.1%) | 0 (0.0%) |
| 85 Years and over | 0 (0.0%) | 0 (0.0%) |
| Total | 318 (100.0%) | 348 (100.0%) |
Families and Households in Smallwood
Median Family Size in Smallwood
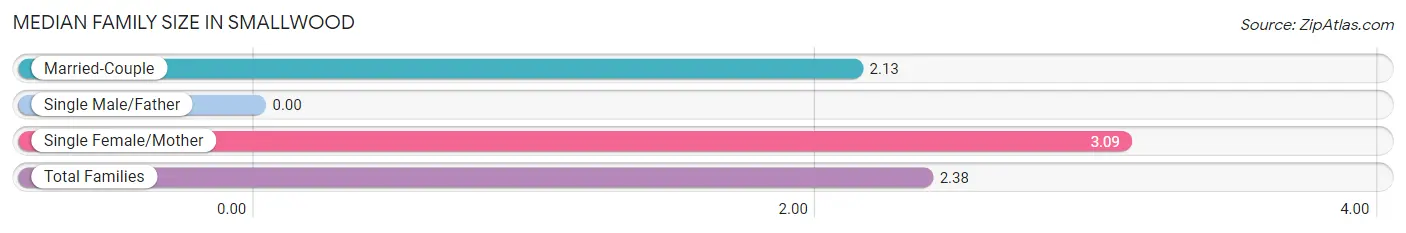
| Family Type | # Families | Family Size |
| Married-Couple | 158 (73.5%) | 2.13 |
| Single Male/Father | 0 (0.0%) | - |
| Single Female/Mother | 57 (26.5%) | 3.09 |
| Total Families | 215 (100.0%) | 2.38 |
Median Household Size in Smallwood
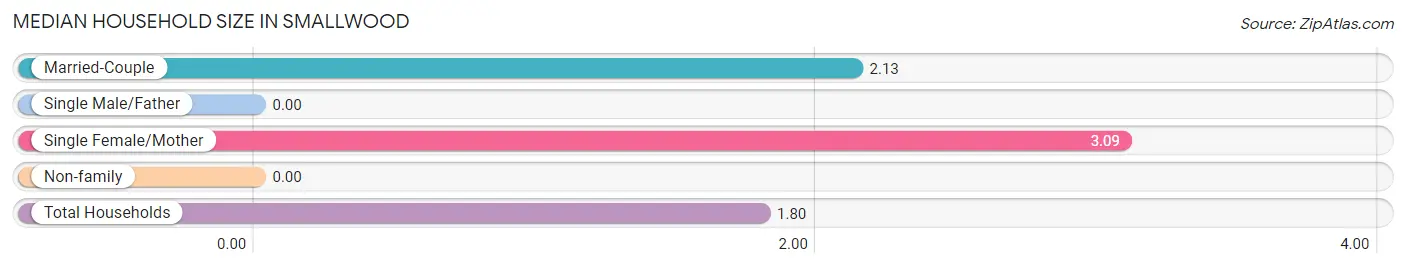
| Household Type | # Households | Household Size |
| Married-Couple | 158 (42.8%) | 2.13 |
| Single Male/Father | 0 (0.0%) | - |
| Single Female/Mother | 57 (15.4%) | 3.09 |
| Non-family | 154 (41.7%) | - |
| Total Households | 369 (100.0%) | 1.80 |
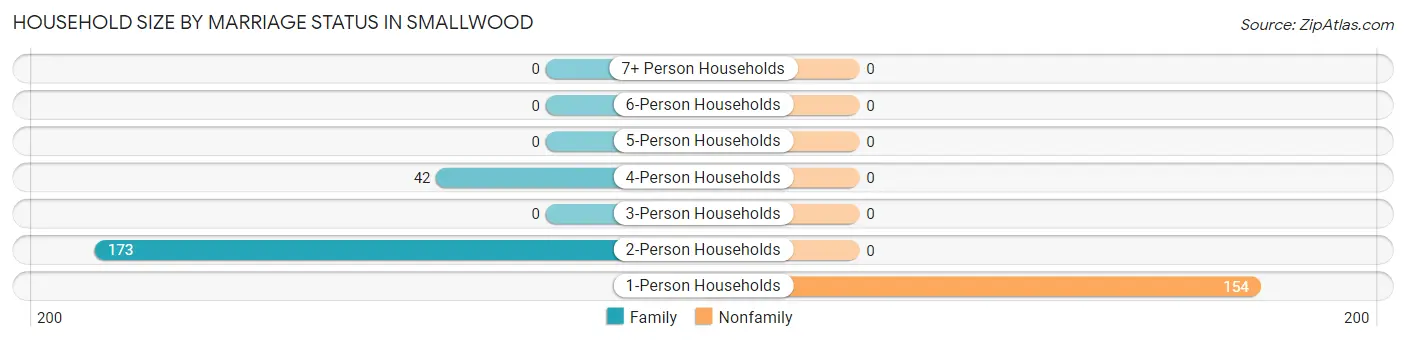
Household Size by Marriage Status in Smallwood
Out of a total of 369 households in Smallwood, 215 (58.3%) are family households, while 154 (41.7%) are nonfamily households. The most numerous type of family households are 2-person households, comprising 173, and the most common type of nonfamily households are 1-person households, comprising 154.
| Household Size | Family Households | Nonfamily Households |
| 1-Person Households | - | 154 (41.7%) |
| 2-Person Households | 173 (46.9%) | 0 (0.0%) |
| 3-Person Households | 0 (0.0%) | 0 (0.0%) |
| 4-Person Households | 42 (11.4%) | 0 (0.0%) |
| 5-Person Households | 0 (0.0%) | 0 (0.0%) |
| 6-Person Households | 0 (0.0%) | 0 (0.0%) |
| 7+ Person Households | 0 (0.0%) | 0 (0.0%) |
| Total | 215 (58.3%) | 154 (41.7%) |
Female Fertility in Smallwood
Fertility by Age in Smallwood
| Age Bracket | Women with Births | Births / 1,000 Women |
| 15 to 19 years | 0 (0.0%) | 0.0 |
| 20 to 34 years | 0 (0.0%) | 0.0 |
| 35 to 50 years | 0 (0.0%) | 0.0 |
| Total | 0 (0.0%) | 0.0 |
Fertility by Age by Marriage Status in Smallwood
| Age Bracket | Married | Unmarried |
| 15 to 19 years | 0 (0.0%) | 0 (0.0%) |
| 20 to 34 years | 0 (0.0%) | 0 (0.0%) |
| 35 to 50 years | 0 (0.0%) | 0 (0.0%) |
| Total | 0 (0.0%) | 0 (0.0%) |
Fertility by Education in Smallwood
| Educational Attainment | Women with Births | Births / 1,000 Women |
| Less than High School | 0 (0.0%) | 0.0 |
| High School Diploma | 0 (0.0%) | 0.0 |
| College or Associate's Degree | 0 (0.0%) | 0.0 |
| Bachelor's Degree | 0 (0.0%) | 0.0 |
| Graduate Degree | 0 (0.0%) | 0.0 |
| Total | 0 (0.0%) | 0.0 |
Fertility by Education by Marriage Status in Smallwood
| Educational Attainment | Married | Unmarried |
| Less than High School | 0 (0.0%) | 0 (0.0%) |
| High School Diploma | 0 (0.0%) | 0 (0.0%) |
| College or Associate's Degree | 0 (0.0%) | 0 (0.0%) |
| Bachelor's Degree | 0 (0.0%) | 0 (0.0%) |
| Graduate Degree | 0 (0.0%) | 0 (0.0%) |
| Total | 0 (0.0%) | 0 (0.0%) |
Employment Characteristics in Smallwood
Employment by Class of Employer in Smallwood
Among the 170 employed individuals in Smallwood, private company employees (131 | 77.1%), local government employees (20 | 11.8%), and self-employed (incorporated) (10 | 5.9%) make up the most common classes of employment.
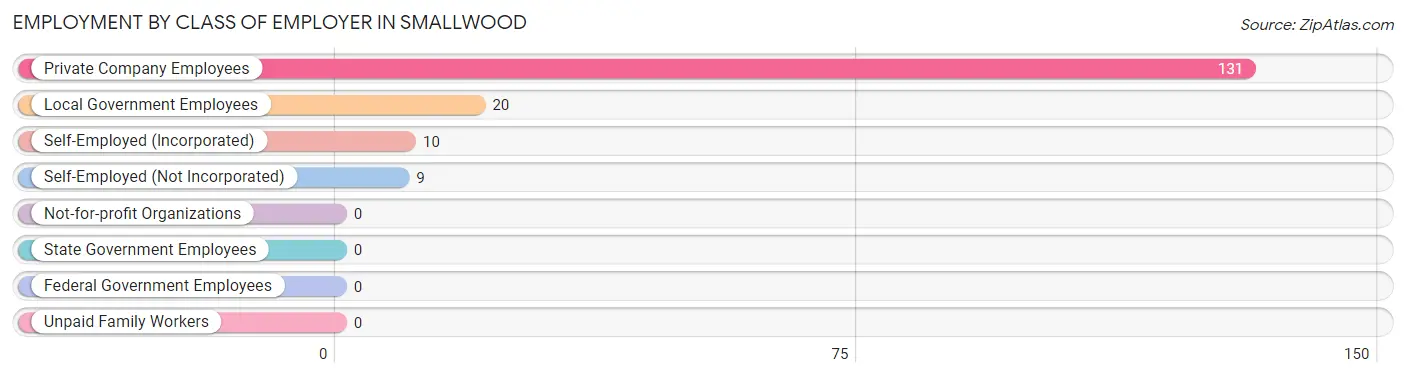
| Employer Class | # Employees | % Employees |
| Private Company Employees | 131 | 77.1% |
| Self-Employed (Incorporated) | 10 | 5.9% |
| Self-Employed (Not Incorporated) | 9 | 5.3% |
| Not-for-profit Organizations | 0 | 0.0% |
| Local Government Employees | 20 | 11.8% |
| State Government Employees | 0 | 0.0% |
| Federal Government Employees | 0 | 0.0% |
| Unpaid Family Workers | 0 | 0.0% |
| Total | 170 | 100.0% |
Employment Status by Age in Smallwood
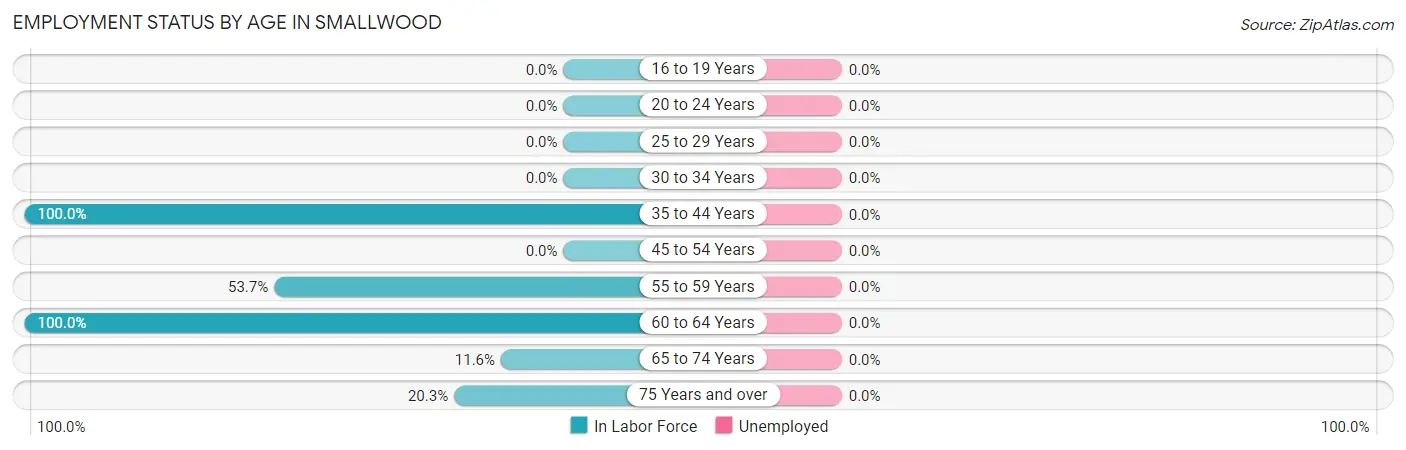
| Age Bracket | In Labor Force | Unemployed |
| 16 to 19 Years | 0 (0.0%) | 0 (0.0%) |
| 20 to 24 Years | 0 (0.0%) | 0 (0.0%) |
| 25 to 29 Years | 0 (0.0%) | 0 (0.0%) |
| 30 to 34 Years | 0 (0.0%) | 0 (0.0%) |
| 35 to 44 Years | 20 (100.0%) | 0 (0.0%) |
| 45 to 54 Years | 0 (0.0%) | 0 (0.0%) |
| 55 to 59 Years | 44 (53.7%) | 0 (0.0%) |
| 60 to 64 Years | 74 (100.0%) | 0 (0.0%) |
| 65 to 74 Years | 33 (11.6%) | 0 (0.0%) |
| 75 Years and over | 13 (20.3%) | 0 (0.0%) |
| Total | 184 (32.5%) | 0 (0.0%) |
Employment Status by Educational Attainment in Smallwood
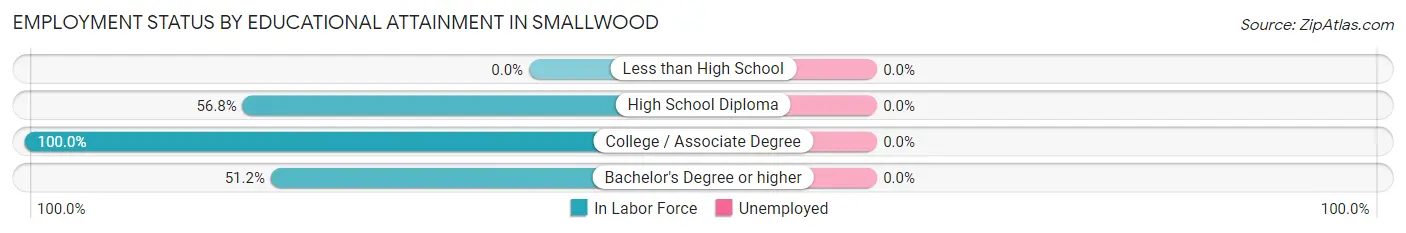
| Educational Attainment | In Labor Force | Unemployed |
| Less than High School | 0 (0.0%) | 0 (0.0%) |
| High School Diploma | 50 (56.8%) | 0 (0.0%) |
| College / Associate Degree | 44 (100.0%) | 0 (0.0%) |
| Bachelor's Degree or higher | 44 (51.2%) | 0 (0.0%) |
| Total | 138 (63.3%) | 0 (0.0%) |
Employment Occupations by Sex in Smallwood
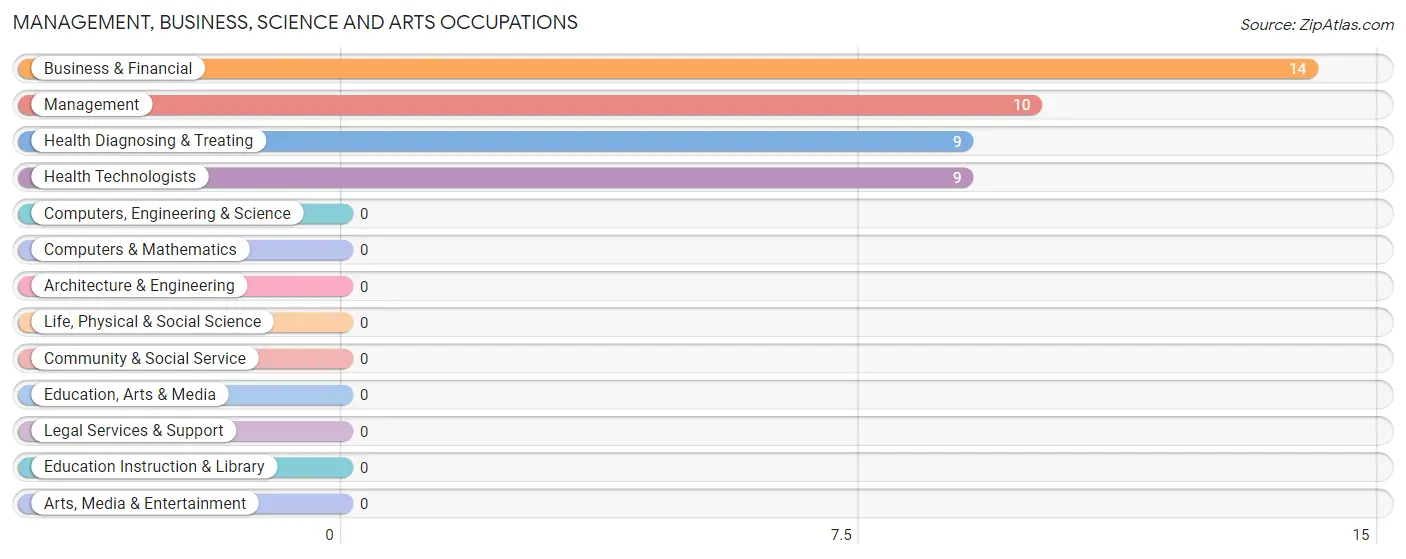
Management, Business, Science and Arts Occupations
The most common Management, Business, Science and Arts occupations in Smallwood are Business & Financial (14 | 7.6%), Management (10 | 5.4%), Health Diagnosing & Treating (9 | 4.9%), and Health Technologists (9 | 4.9%).
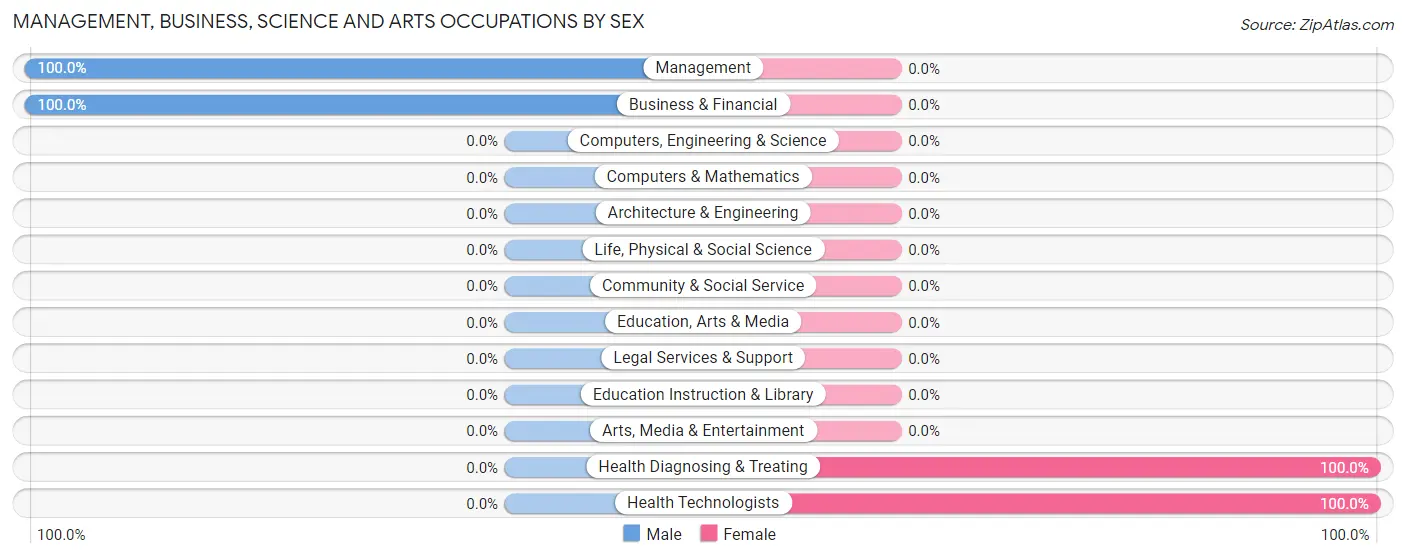
Management, Business, Science and Arts Occupations by Sex
Within the Management, Business, Science and Arts occupations in Smallwood, the most male-oriented occupations are Management (100.0%), and Business & Financial (100.0%), while the most female-oriented occupations are Health Diagnosing & Treating (100.0%), and Health Technologists (100.0%).
| Occupation | Male | Female |
| Management | 10 (100.0%) | 0 (0.0%) |
| Business & Financial | 14 (100.0%) | 0 (0.0%) |
| Computers, Engineering & Science | 0 (0.0%) | 0 (0.0%) |
| Computers & Mathematics | 0 (0.0%) | 0 (0.0%) |
| Architecture & Engineering | 0 (0.0%) | 0 (0.0%) |
| Life, Physical & Social Science | 0 (0.0%) | 0 (0.0%) |
| Community & Social Service | 0 (0.0%) | 0 (0.0%) |
| Education, Arts & Media | 0 (0.0%) | 0 (0.0%) |
| Legal Services & Support | 0 (0.0%) | 0 (0.0%) |
| Education Instruction & Library | 0 (0.0%) | 0 (0.0%) |
| Arts, Media & Entertainment | 0 (0.0%) | 0 (0.0%) |
| Health Diagnosing & Treating | 0 (0.0%) | 9 (100.0%) |
| Health Technologists | 0 (0.0%) | 9 (100.0%) |
| Total (Category) | 24 (72.7%) | 9 (27.3%) |
| Total (Overall) | 121 (65.8%) | 63 (34.2%) |
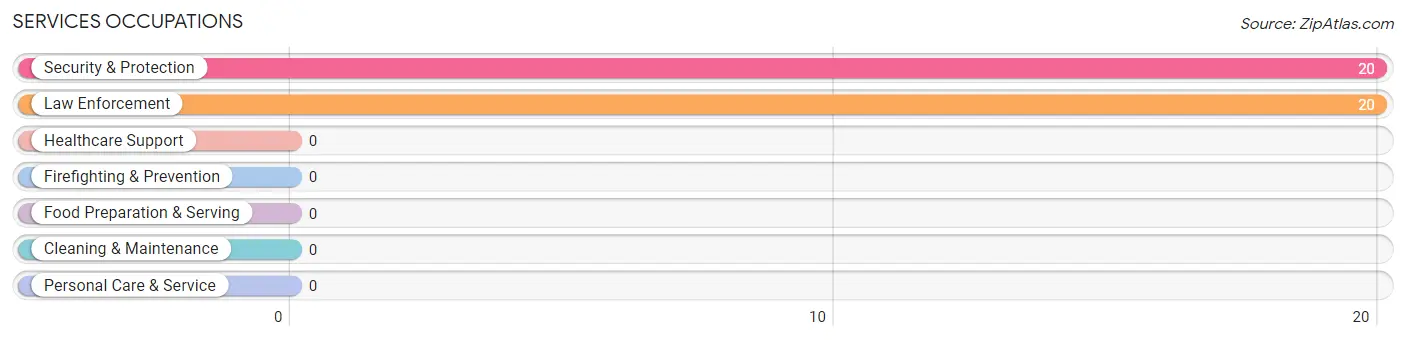
Services Occupations
The most common Services occupations in Smallwood are Security & Protection (20 | 10.9%), and Law Enforcement (20 | 10.9%).
Services Occupations by Sex
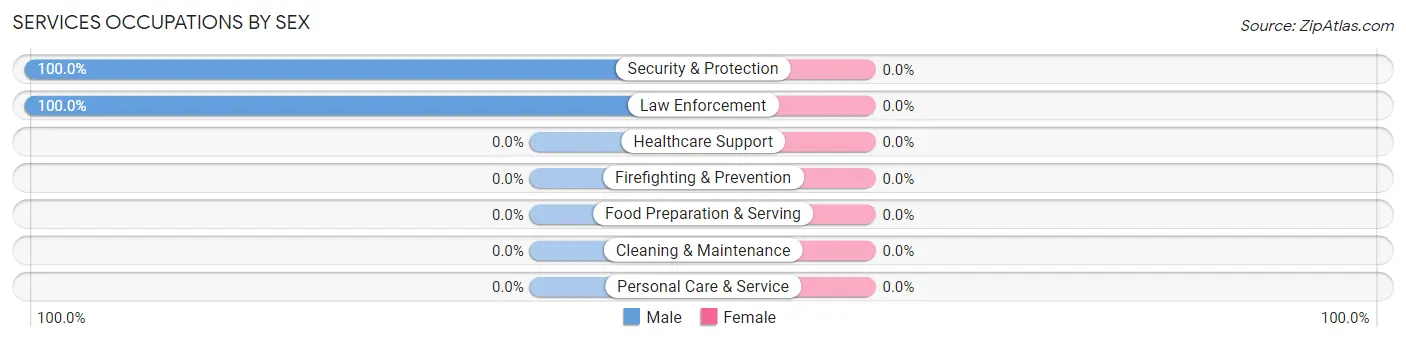
| Occupation | Male | Female |
| Healthcare Support | 0 (0.0%) | 0 (0.0%) |
| Security & Protection | 20 (100.0%) | 0 (0.0%) |
| Firefighting & Prevention | 0 (0.0%) | 0 (0.0%) |
| Law Enforcement | 20 (100.0%) | 0 (0.0%) |
| Food Preparation & Serving | 0 (0.0%) | 0 (0.0%) |
| Cleaning & Maintenance | 0 (0.0%) | 0 (0.0%) |
| Personal Care & Service | 0 (0.0%) | 0 (0.0%) |
| Total (Category) | 20 (100.0%) | 0 (0.0%) |
| Total (Overall) | 121 (65.8%) | 63 (34.2%) |
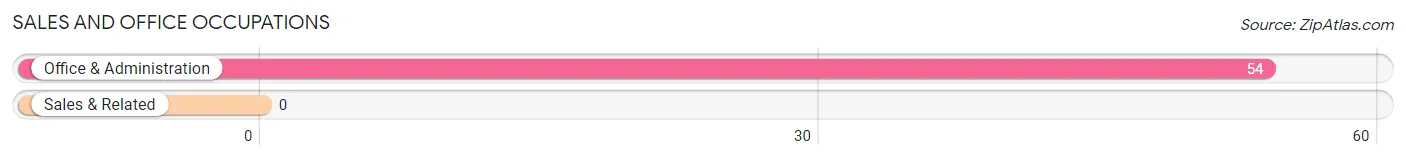
Sales and Office Occupations
The most common Sales and Office occupations in Smallwood are , and Office & Administration (54 | 29.3%).
Sales and Office Occupations by Sex
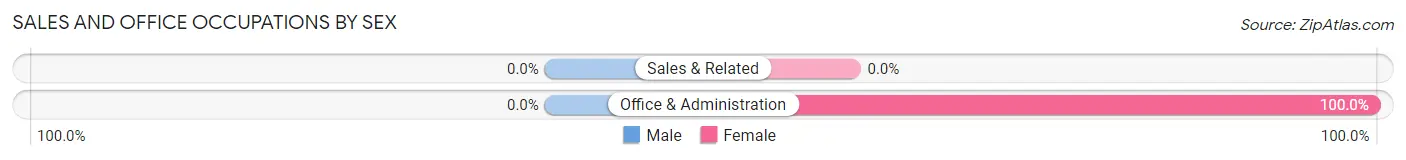
| Occupation | Male | Female |
| Sales & Related | 0 (0.0%) | 0 (0.0%) |
| Office & Administration | 0 (0.0%) | 54 (100.0%) |
| Total (Category) | 0 (0.0%) | 54 (100.0%) |
| Total (Overall) | 121 (65.8%) | 63 (34.2%) |
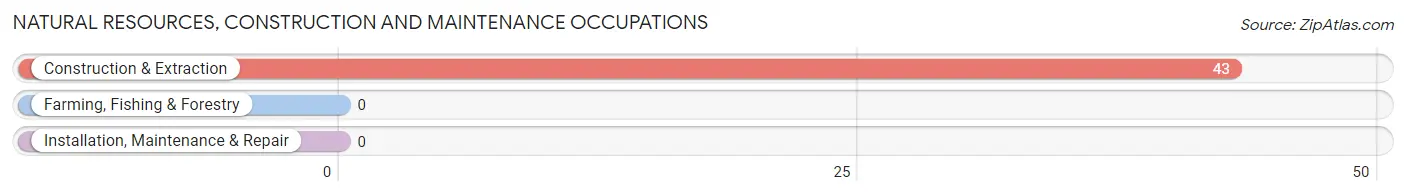
Natural Resources, Construction and Maintenance Occupations
The most common Natural Resources, Construction and Maintenance occupations in Smallwood are , and Construction & Extraction (43 | 23.4%).
Natural Resources, Construction and Maintenance Occupations by Sex
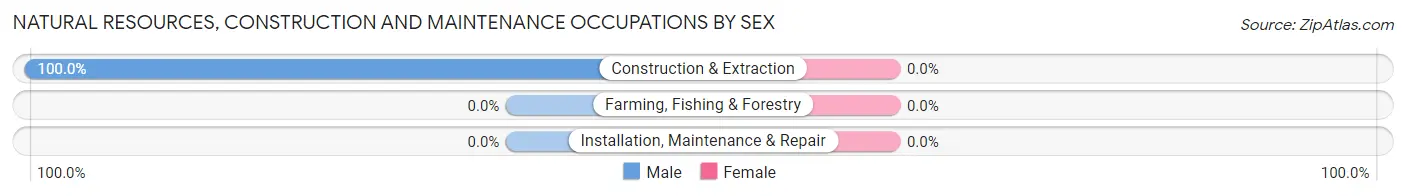
| Occupation | Male | Female |
| Farming, Fishing & Forestry | 0 (0.0%) | 0 (0.0%) |
| Construction & Extraction | 43 (100.0%) | 0 (0.0%) |
| Installation, Maintenance & Repair | 0 (0.0%) | 0 (0.0%) |
| Total (Category) | 43 (100.0%) | 0 (0.0%) |
| Total (Overall) | 121 (65.8%) | 63 (34.2%) |
Production, Transportation and Moving Occupations
The most common Production, Transportation and Moving occupations in Smallwood are , and Transportation (34 | 18.5%).
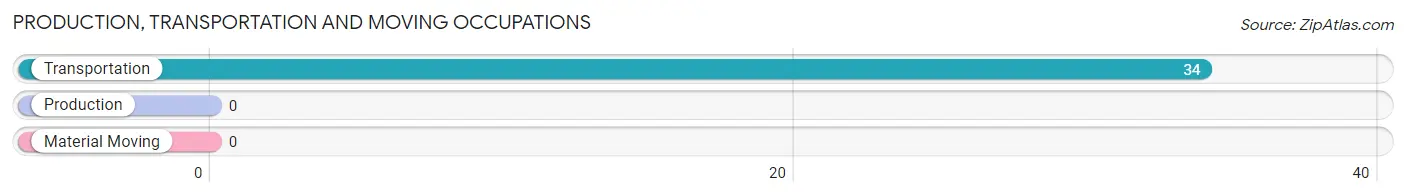
Production, Transportation and Moving Occupations by Sex
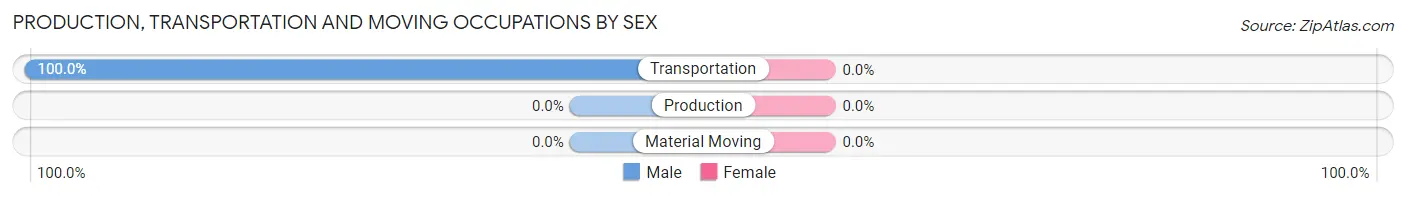
| Occupation | Male | Female |
| Production | 0 (0.0%) | 0 (0.0%) |
| Transportation | 34 (100.0%) | 0 (0.0%) |
| Material Moving | 0 (0.0%) | 0 (0.0%) |
| Total (Category) | 34 (100.0%) | 0 (0.0%) |
| Total (Overall) | 121 (65.8%) | 63 (34.2%) |
Employment Industries by Sex in Smallwood
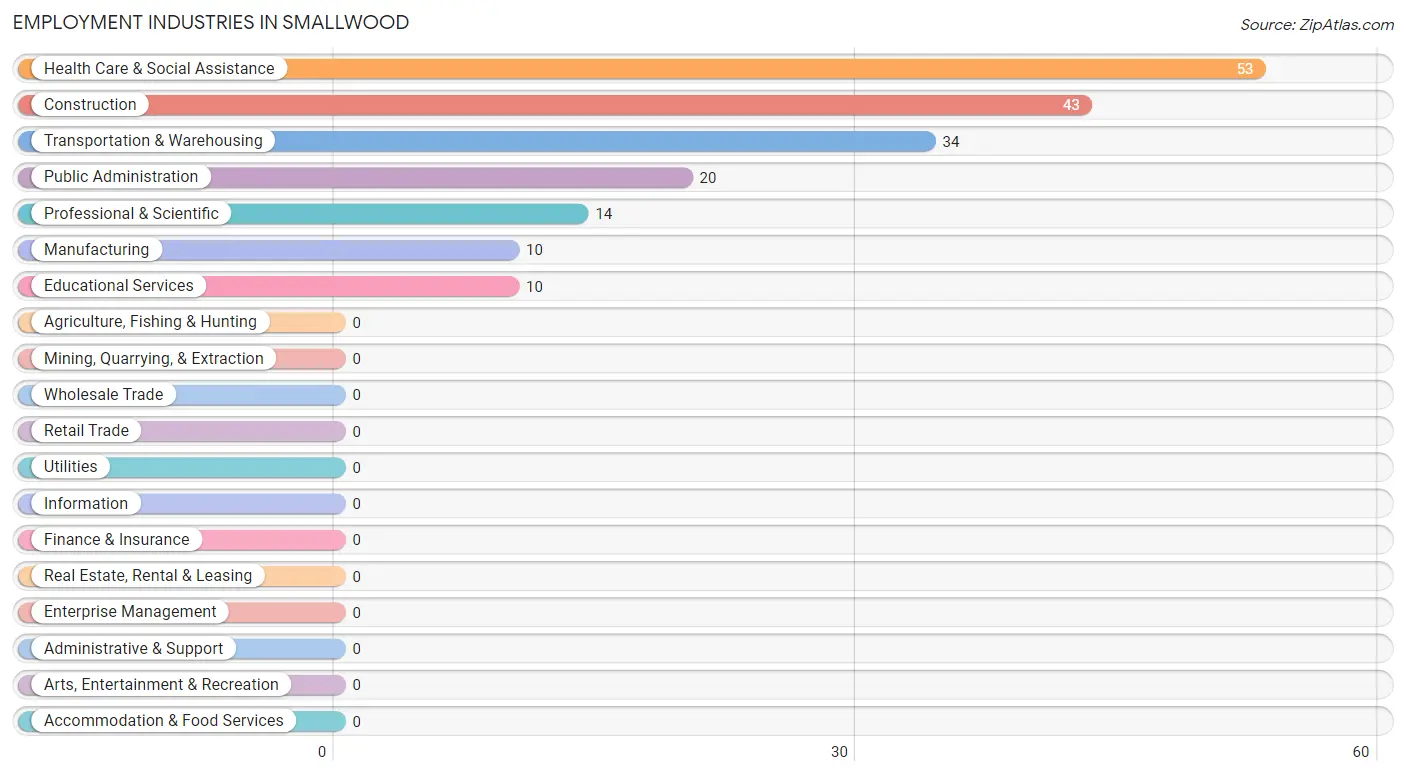
Employment Industries in Smallwood
The major employment industries in Smallwood include Health Care & Social Assistance (53 | 28.8%), Construction (43 | 23.4%), Transportation & Warehousing (34 | 18.5%), Public Administration (20 | 10.9%), and Professional & Scientific (14 | 7.6%).
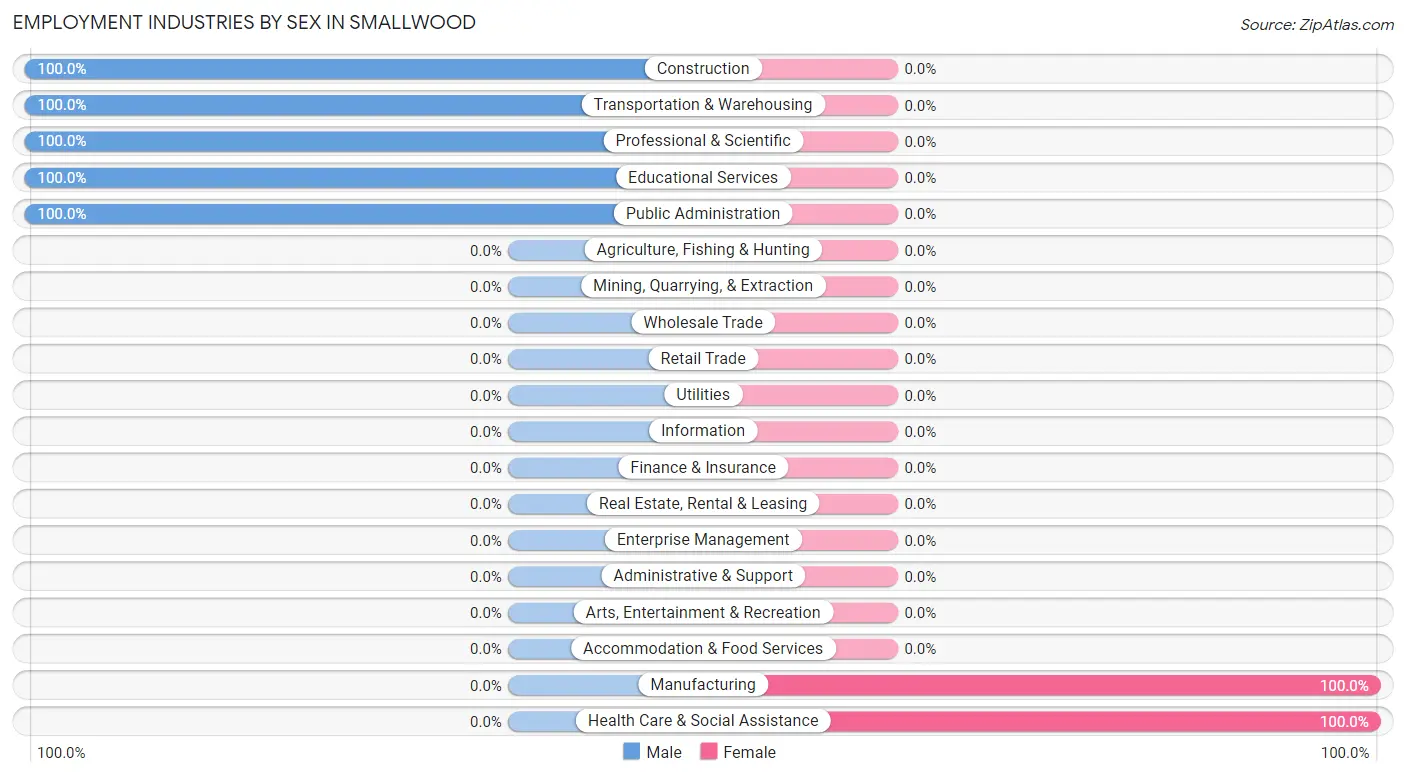
Employment Industries by Sex in Smallwood
The Smallwood industries that see more men than women are Construction (100.0%), Transportation & Warehousing (100.0%), and Professional & Scientific (100.0%), whereas the industries that tend to have a higher number of women are Manufacturing (100.0%), and Health Care & Social Assistance (100.0%).
| Industry | Male | Female |
| Agriculture, Fishing & Hunting | 0 (0.0%) | 0 (0.0%) |
| Mining, Quarrying, & Extraction | 0 (0.0%) | 0 (0.0%) |
| Construction | 43 (100.0%) | 0 (0.0%) |
| Manufacturing | 0 (0.0%) | 10 (100.0%) |
| Wholesale Trade | 0 (0.0%) | 0 (0.0%) |
| Retail Trade | 0 (0.0%) | 0 (0.0%) |
| Transportation & Warehousing | 34 (100.0%) | 0 (0.0%) |
| Utilities | 0 (0.0%) | 0 (0.0%) |
| Information | 0 (0.0%) | 0 (0.0%) |
| Finance & Insurance | 0 (0.0%) | 0 (0.0%) |
| Real Estate, Rental & Leasing | 0 (0.0%) | 0 (0.0%) |
| Professional & Scientific | 14 (100.0%) | 0 (0.0%) |
| Enterprise Management | 0 (0.0%) | 0 (0.0%) |
| Administrative & Support | 0 (0.0%) | 0 (0.0%) |
| Educational Services | 10 (100.0%) | 0 (0.0%) |
| Health Care & Social Assistance | 0 (0.0%) | 53 (100.0%) |
| Arts, Entertainment & Recreation | 0 (0.0%) | 0 (0.0%) |
| Accommodation & Food Services | 0 (0.0%) | 0 (0.0%) |
| Public Administration | 20 (100.0%) | 0 (0.0%) |
| Total | 121 (65.8%) | 63 (34.2%) |
Education in Smallwood
School Enrollment in Smallwood
The most common levels of schooling among the 99 students in Smallwood are middle school (65 | 65.7%), and kindergarten (34 | 34.3%).
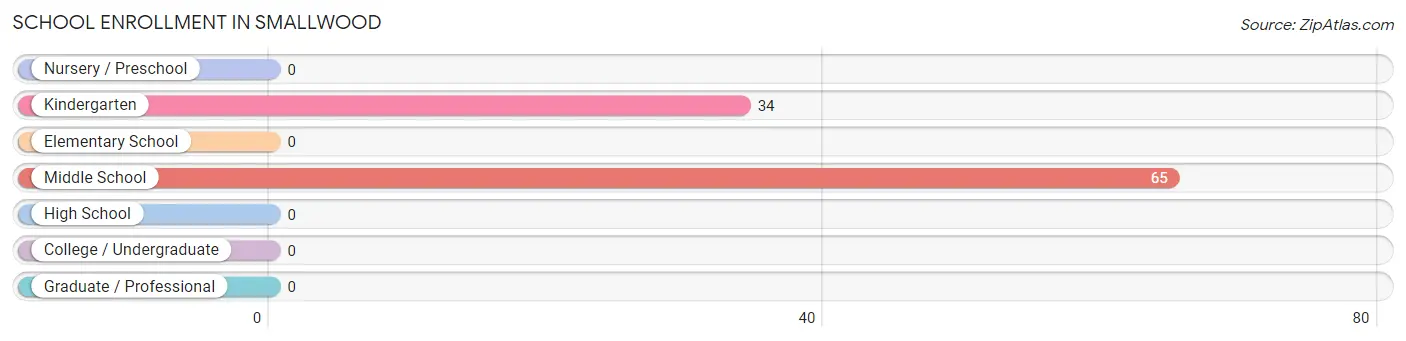
| School Level | # Students | % Students |
| Nursery / Preschool | 0 | 0.0% |
| Kindergarten | 34 | 34.3% |
| Elementary School | 0 | 0.0% |
| Middle School | 65 | 65.7% |
| High School | 0 | 0.0% |
| College / Undergraduate | 0 | 0.0% |
| Graduate / Professional | 0 | 0.0% |
| Total | 99 | 100.0% |
School Enrollment by Age by Funding Source in Smallwood
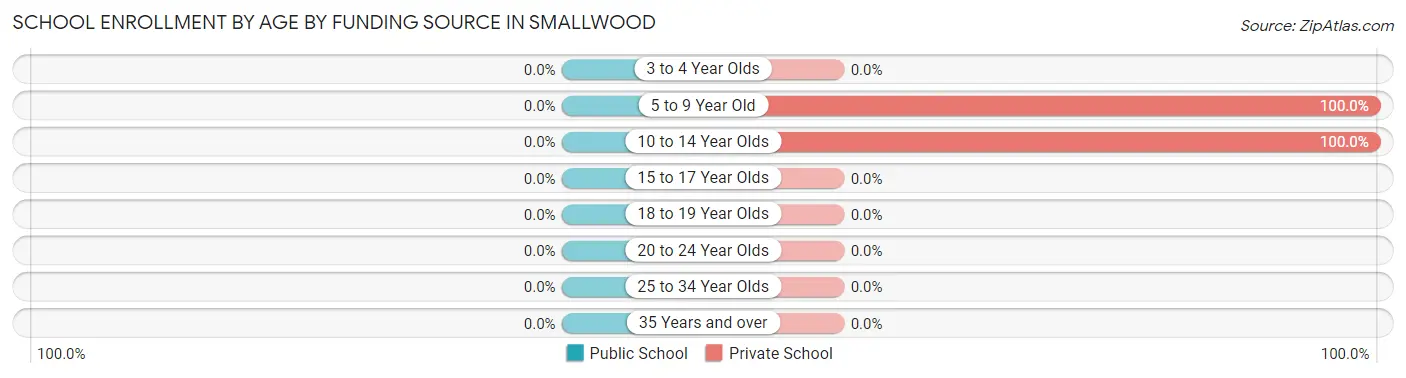
| Age Bracket | Public School | Private School |
| 3 to 4 Year Olds | 0 (0.0%) | 0 (0.0%) |
| 5 to 9 Year Old | 0 (0.0%) | 34 (100.0%) |
| 10 to 14 Year Olds | 0 (0.0%) | 65 (100.0%) |
| 15 to 17 Year Olds | 0 (0.0%) | 0 (0.0%) |
| 18 to 19 Year Olds | 0 (0.0%) | 0 (0.0%) |
| 20 to 24 Year Olds | 0 (0.0%) | 0 (0.0%) |
| 25 to 34 Year Olds | 0 (0.0%) | 0 (0.0%) |
| 35 Years and over | 0 (0.0%) | 0 (0.0%) |
| Total | 0 (0.0%) | 99 (100.0%) |
Educational Attainment by Field of Study in Smallwood
Liberal arts & history (47 | 29.2%), science & technology (44 | 27.3%), psychology (42 | 26.1%), education (19 | 11.8%), and arts & humanities (9 | 5.6%) are the most common fields of study among 161 individuals in Smallwood who have obtained a bachelor's degree or higher.
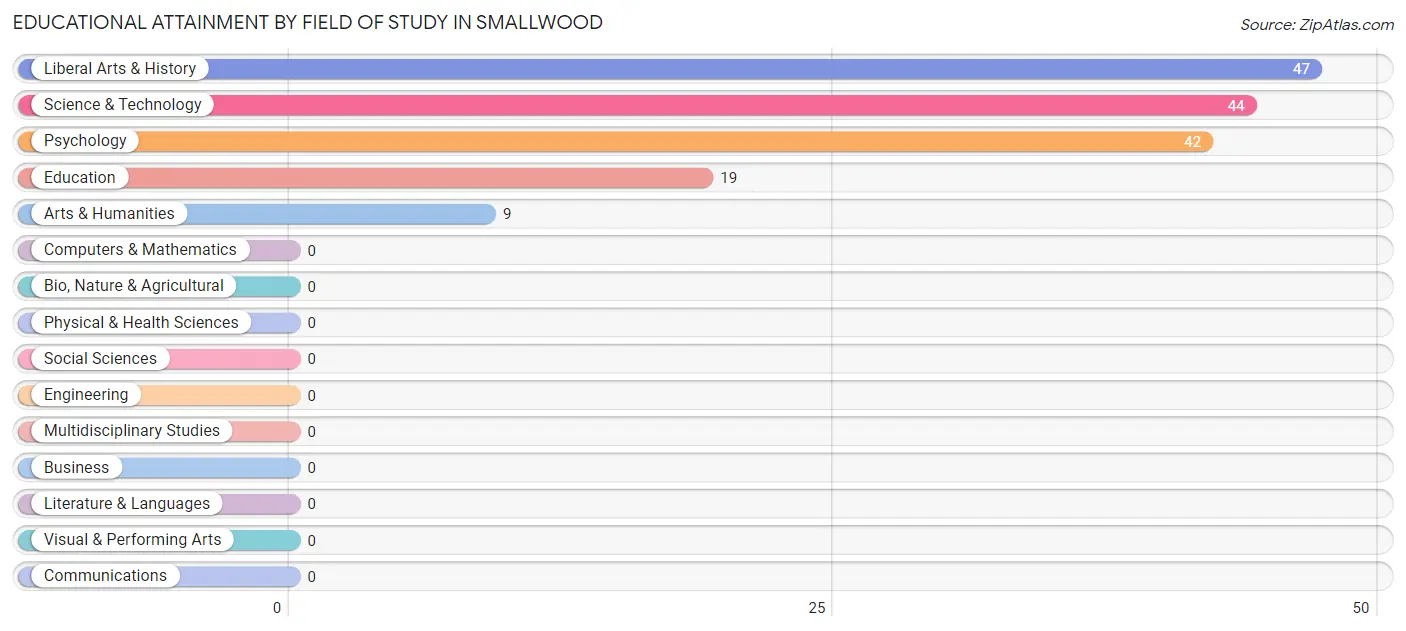
| Field of Study | # Graduates | % Graduates |
| Computers & Mathematics | 0 | 0.0% |
| Bio, Nature & Agricultural | 0 | 0.0% |
| Physical & Health Sciences | 0 | 0.0% |
| Psychology | 42 | 26.1% |
| Social Sciences | 0 | 0.0% |
| Engineering | 0 | 0.0% |
| Multidisciplinary Studies | 0 | 0.0% |
| Science & Technology | 44 | 27.3% |
| Business | 0 | 0.0% |
| Education | 19 | 11.8% |
| Literature & Languages | 0 | 0.0% |
| Liberal Arts & History | 47 | 29.2% |
| Visual & Performing Arts | 0 | 0.0% |
| Communications | 0 | 0.0% |
| Arts & Humanities | 9 | 5.6% |
| Total | 161 | 100.0% |
Transportation & Commute in Smallwood
Vehicle Availability by Sex in Smallwood
The most prevalent vehicle ownership categories in Smallwood are males with 3 vehicles (44, accounting for 41.1%) and females with 3 vehicles (0, making up 69.8%).
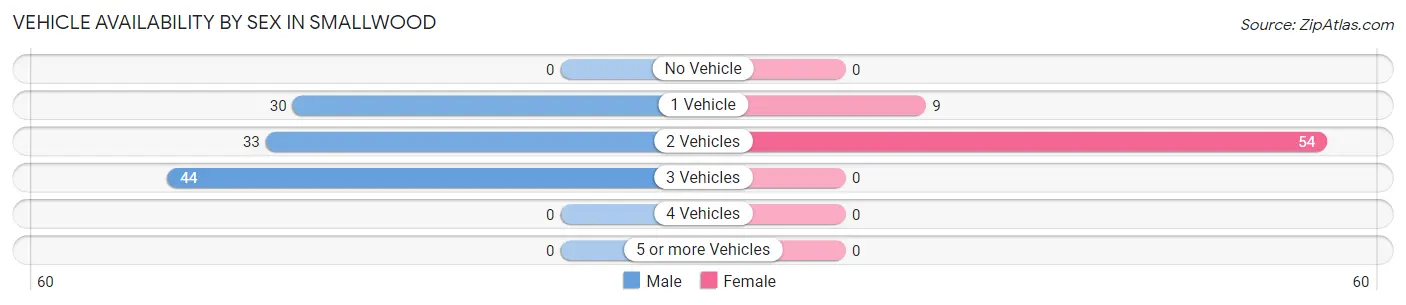
| Vehicles Available | Male | Female |
| No Vehicle | 0 (0.0%) | 0 (0.0%) |
| 1 Vehicle | 30 (28.0%) | 9 (14.3%) |
| 2 Vehicles | 33 (30.8%) | 54 (85.7%) |
| 3 Vehicles | 44 (41.1%) | 0 (0.0%) |
| 4 Vehicles | 0 (0.0%) | 0 (0.0%) |
| 5 or more Vehicles | 0 (0.0%) | 0 (0.0%) |
| Total | 107 (100.0%) | 63 (100.0%) |
Commute Time in Smallwood
The most frequently occuring commute durations in Smallwood are 90 or more minutes (74 commuters, 46.3%), 5 to 9 minutes (34 commuters, 21.2%), and 15 to 19 minutes (30 commuters, 18.8%).
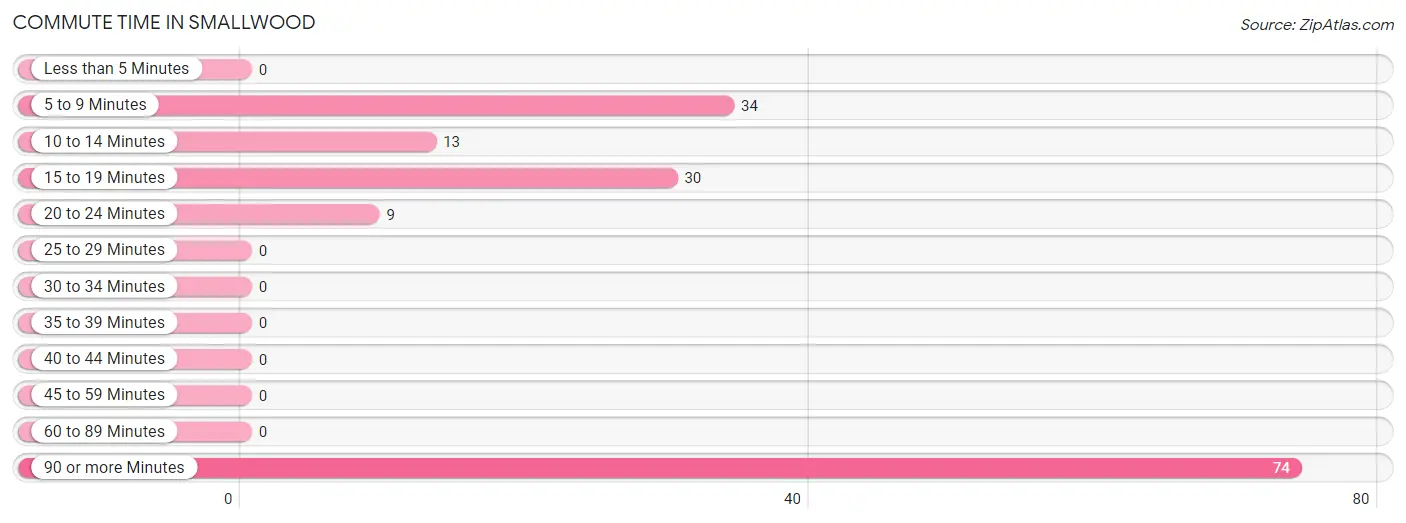
| Commute Time | # Commuters | % Commuters |
| Less than 5 Minutes | 0 | 0.0% |
| 5 to 9 Minutes | 34 | 21.2% |
| 10 to 14 Minutes | 13 | 8.1% |
| 15 to 19 Minutes | 30 | 18.8% |
| 20 to 24 Minutes | 9 | 5.6% |
| 25 to 29 Minutes | 0 | 0.0% |
| 30 to 34 Minutes | 0 | 0.0% |
| 35 to 39 Minutes | 0 | 0.0% |
| 40 to 44 Minutes | 0 | 0.0% |
| 45 to 59 Minutes | 0 | 0.0% |
| 60 to 89 Minutes | 0 | 0.0% |
| 90 or more Minutes | 74 | 46.3% |
Commute Time by Sex in Smallwood
The most common commute times in Smallwood are 5 to 9 minutes (34 commuters, 31.8%) for males and 90 or more minutes (44 commuters, 83.0%) for females.
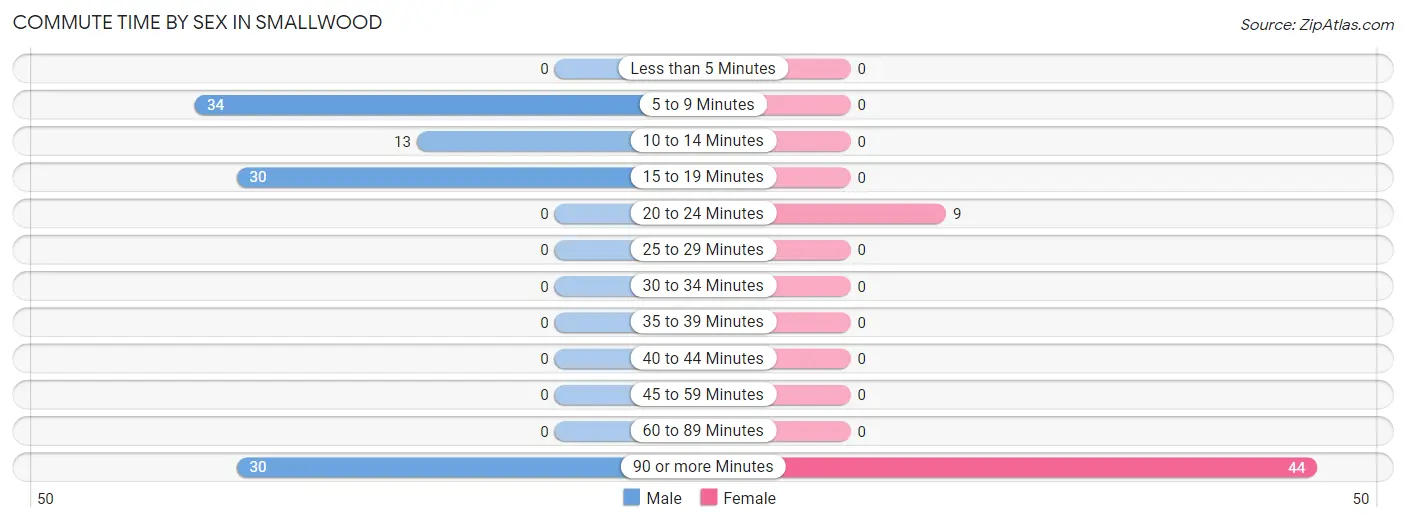
| Commute Time | Male | Female |
| Less than 5 Minutes | 0 (0.0%) | 0 (0.0%) |
| 5 to 9 Minutes | 34 (31.8%) | 0 (0.0%) |
| 10 to 14 Minutes | 13 (12.1%) | 0 (0.0%) |
| 15 to 19 Minutes | 30 (28.0%) | 0 (0.0%) |
| 20 to 24 Minutes | 0 (0.0%) | 9 (17.0%) |
| 25 to 29 Minutes | 0 (0.0%) | 0 (0.0%) |
| 30 to 34 Minutes | 0 (0.0%) | 0 (0.0%) |
| 35 to 39 Minutes | 0 (0.0%) | 0 (0.0%) |
| 40 to 44 Minutes | 0 (0.0%) | 0 (0.0%) |
| 45 to 59 Minutes | 0 (0.0%) | 0 (0.0%) |
| 60 to 89 Minutes | 0 (0.0%) | 0 (0.0%) |
| 90 or more Minutes | 30 (28.0%) | 44 (83.0%) |
Time of Departure to Work by Sex in Smallwood
The most frequent times of departure to work in Smallwood are 6:00 AM to 6:29 AM (34, 31.8%) for males and 7:30 AM to 7:59 AM (44, 83.0%) for females.
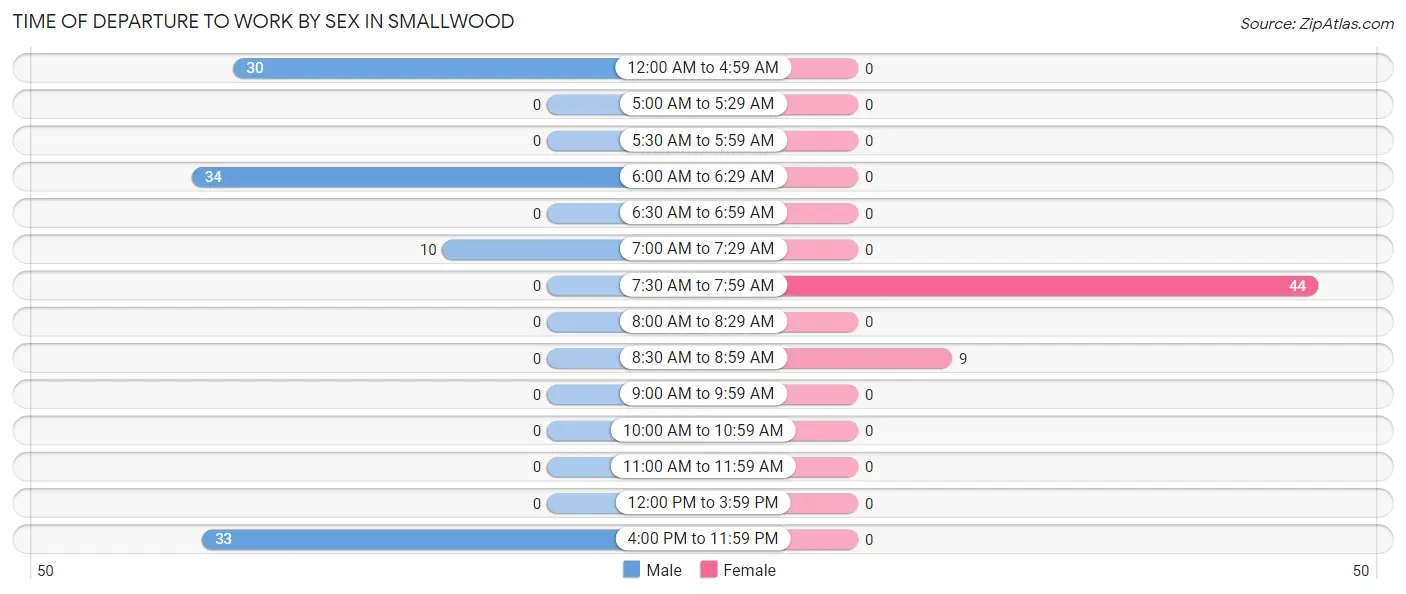
| Time of Departure | Male | Female |
| 12:00 AM to 4:59 AM | 30 (28.0%) | 0 (0.0%) |
| 5:00 AM to 5:29 AM | 0 (0.0%) | 0 (0.0%) |
| 5:30 AM to 5:59 AM | 0 (0.0%) | 0 (0.0%) |
| 6:00 AM to 6:29 AM | 34 (31.8%) | 0 (0.0%) |
| 6:30 AM to 6:59 AM | 0 (0.0%) | 0 (0.0%) |
| 7:00 AM to 7:29 AM | 10 (9.3%) | 0 (0.0%) |
| 7:30 AM to 7:59 AM | 0 (0.0%) | 44 (83.0%) |
| 8:00 AM to 8:29 AM | 0 (0.0%) | 0 (0.0%) |
| 8:30 AM to 8:59 AM | 0 (0.0%) | 9 (17.0%) |
| 9:00 AM to 9:59 AM | 0 (0.0%) | 0 (0.0%) |
| 10:00 AM to 10:59 AM | 0 (0.0%) | 0 (0.0%) |
| 11:00 AM to 11:59 AM | 0 (0.0%) | 0 (0.0%) |
| 12:00 PM to 3:59 PM | 0 (0.0%) | 0 (0.0%) |
| 4:00 PM to 11:59 PM | 33 (30.8%) | 0 (0.0%) |
| Total | 107 (100.0%) | 53 (100.0%) |
Housing Occupancy in Smallwood
Occupancy by Ownership in Smallwood
Of the total 369 dwellings in Smallwood, owner-occupied units account for 327 (88.6%), while renter-occupied units make up 42 (11.4%).
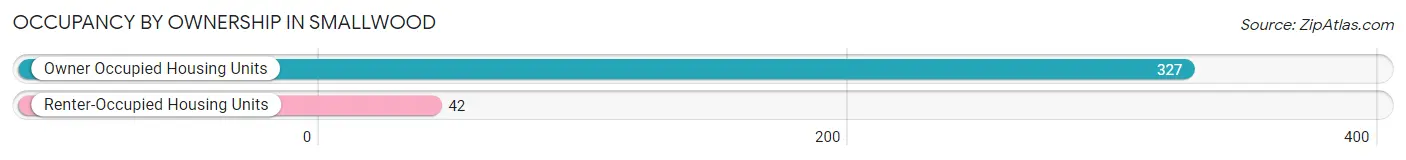
| Occupancy | # Housing Units | % Housing Units |
| Owner Occupied Housing Units | 327 | 88.6% |
| Renter-Occupied Housing Units | 42 | 11.4% |
| Total Occupied Housing Units | 369 | 100.0% |
Occupancy by Household Size in Smallwood
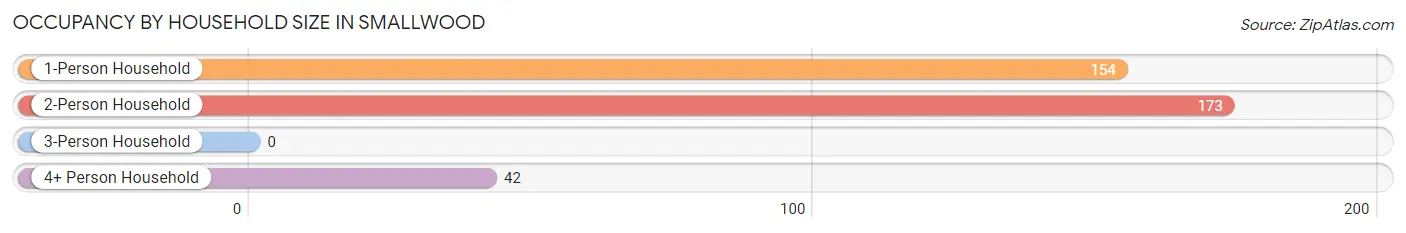
| Household Size | # Housing Units | % Housing Units |
| 1-Person Household | 154 | 41.7% |
| 2-Person Household | 173 | 46.9% |
| 3-Person Household | 0 | 0.0% |
| 4+ Person Household | 42 | 11.4% |
| Total Housing Units | 369 | 100.0% |
Occupancy by Ownership by Household Size in Smallwood
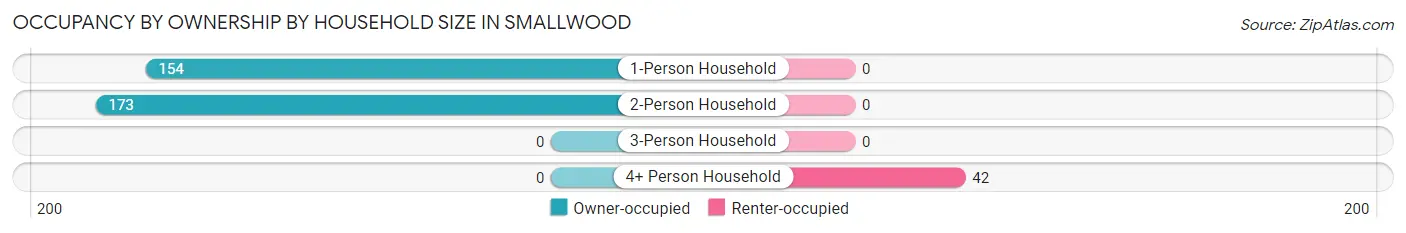
| Household Size | Owner-occupied | Renter-occupied |
| 1-Person Household | 154 (100.0%) | 0 (0.0%) |
| 2-Person Household | 173 (100.0%) | 0 (0.0%) |
| 3-Person Household | 0 (0.0%) | 0 (0.0%) |
| 4+ Person Household | 0 (0.0%) | 42 (100.0%) |
| Total Housing Units | 327 (88.6%) | 42 (11.4%) |
Occupancy by Educational Attainment in Smallwood
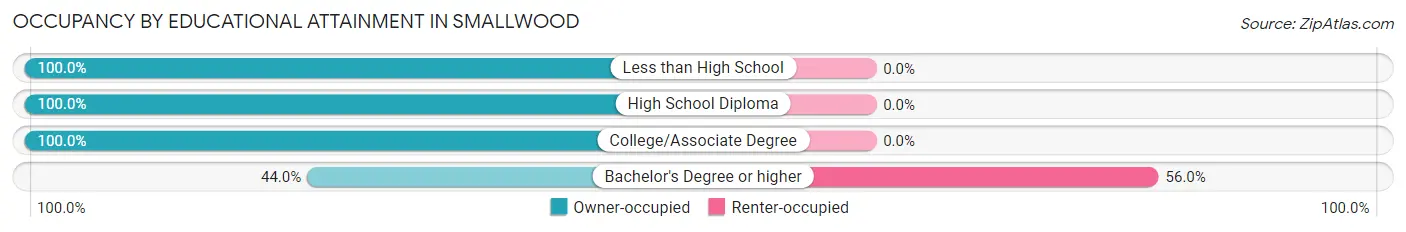
| Household Size | Owner-occupied | Renter-occupied |
| Less than High School | 71 (100.0%) | 0 (0.0%) |
| High School Diploma | 45 (100.0%) | 0 (0.0%) |
| College/Associate Degree | 178 (100.0%) | 0 (0.0%) |
| Bachelor's Degree or higher | 33 (44.0%) | 42 (56.0%) |
Occupancy by Age of Householder in Smallwood
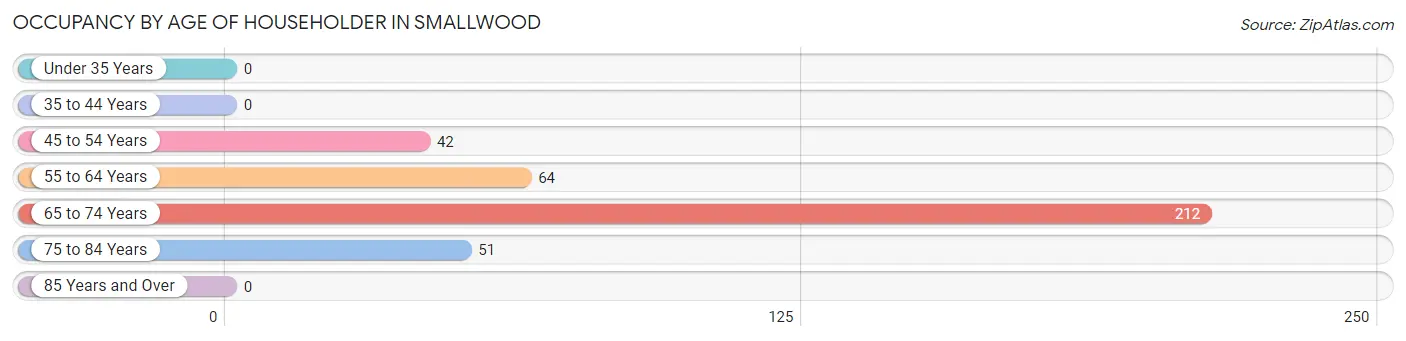
| Age Bracket | # Households | % Households |
| Under 35 Years | 0 | 0.0% |
| 35 to 44 Years | 0 | 0.0% |
| 45 to 54 Years | 42 | 11.4% |
| 55 to 64 Years | 64 | 17.3% |
| 65 to 74 Years | 212 | 57.5% |
| 75 to 84 Years | 51 | 13.8% |
| 85 Years and Over | 0 | 0.0% |
| Total | 369 | 100.0% |
Housing Finances in Smallwood
Median Income by Occupancy in Smallwood
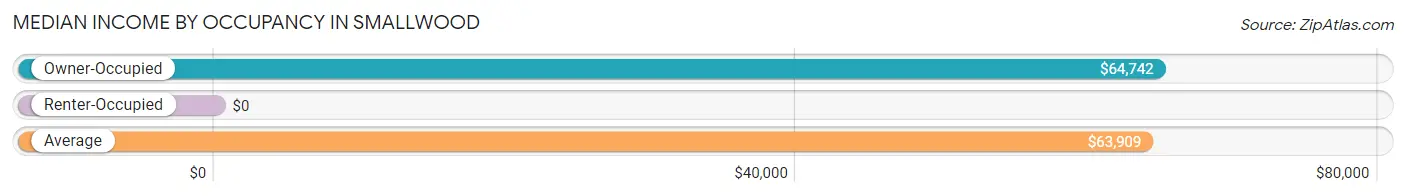
| Occupancy Type | # Households | Median Income |
| Owner-Occupied | 327 (88.6%) | $64,742 |
| Renter-Occupied | 42 (11.4%) | $0 |
| Average | 369 (100.0%) | $63,909 |
Occupancy by Householder Income Bracket in Smallwood
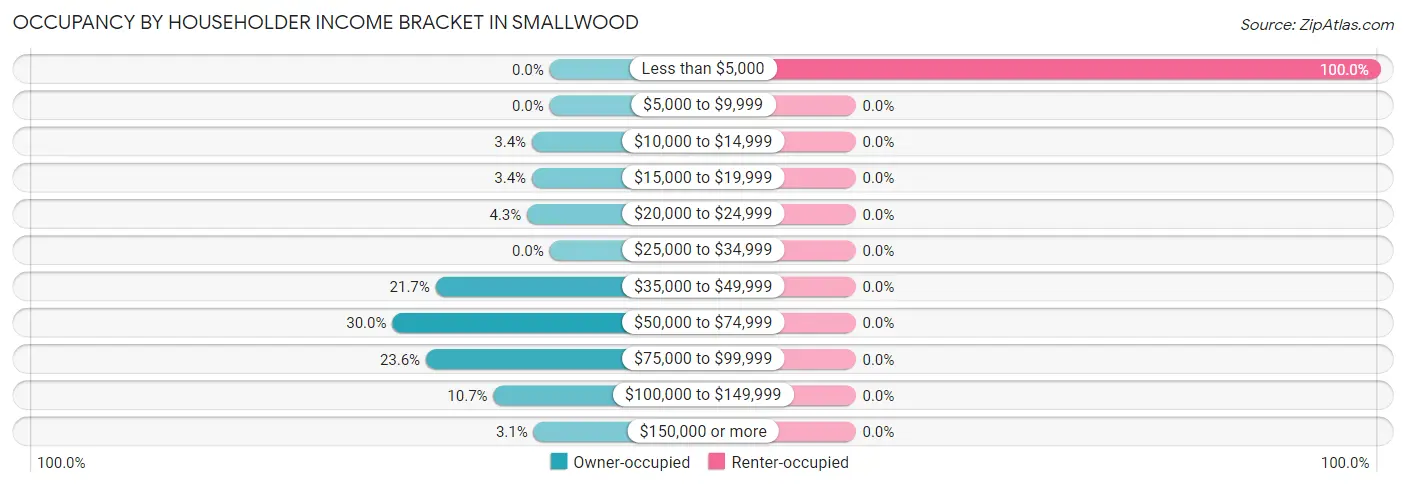
| Income Bracket | Owner-occupied | Renter-occupied |
| Less than $5,000 | 0 (0.0%) | 42 (100.0%) |
| $5,000 to $9,999 | 0 (0.0%) | 0 (0.0%) |
| $10,000 to $14,999 | 11 (3.4%) | 0 (0.0%) |
| $15,000 to $19,999 | 11 (3.4%) | 0 (0.0%) |
| $20,000 to $24,999 | 14 (4.3%) | 0 (0.0%) |
| $25,000 to $34,999 | 0 (0.0%) | 0 (0.0%) |
| $35,000 to $49,999 | 71 (21.7%) | 0 (0.0%) |
| $50,000 to $74,999 | 98 (30.0%) | 0 (0.0%) |
| $75,000 to $99,999 | 77 (23.5%) | 0 (0.0%) |
| $100,000 to $149,999 | 35 (10.7%) | 0 (0.0%) |
| $150,000 or more | 10 (3.1%) | 0 (0.0%) |
| Total | 327 (100.0%) | 42 (100.0%) |
Monthly Housing Cost Tiers in Smallwood
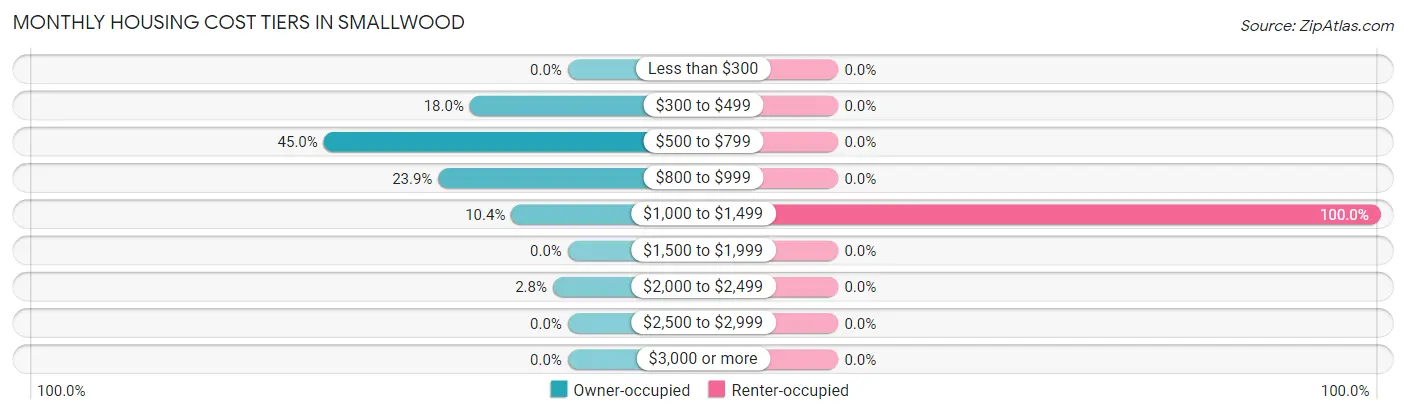
| Monthly Cost | Owner-occupied | Renter-occupied |
| Less than $300 | 0 (0.0%) | 0 (0.0%) |
| $300 to $499 | 59 (18.0%) | 0 (0.0%) |
| $500 to $799 | 147 (45.0%) | 0 (0.0%) |
| $800 to $999 | 78 (23.8%) | 0 (0.0%) |
| $1,000 to $1,499 | 34 (10.4%) | 42 (100.0%) |
| $1,500 to $1,999 | 0 (0.0%) | 0 (0.0%) |
| $2,000 to $2,499 | 9 (2.8%) | 0 (0.0%) |
| $2,500 to $2,999 | 0 (0.0%) | 0 (0.0%) |
| $3,000 or more | 0 (0.0%) | 0 (0.0%) |
| Total | 327 (100.0%) | 42 (100.0%) |
Physical Housing Characteristics in Smallwood
Housing Structures in Smallwood
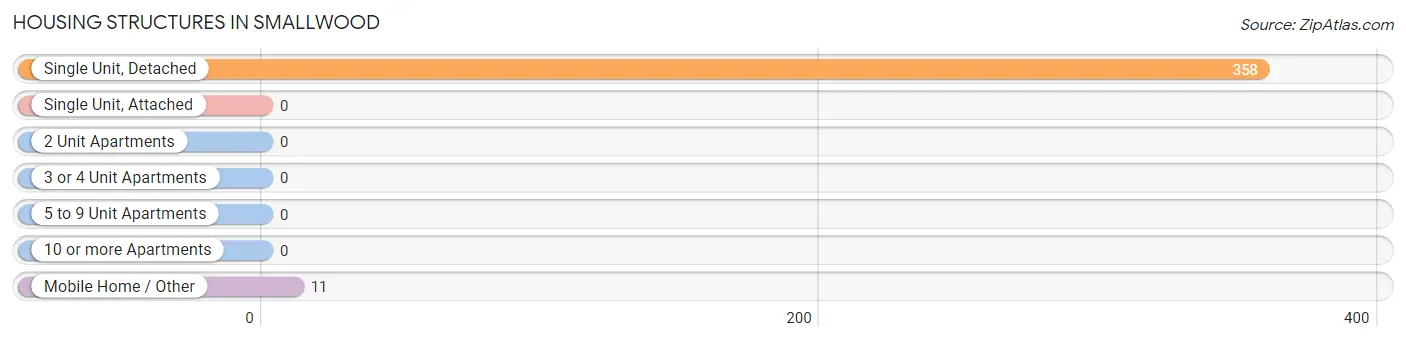
| Structure Type | # Housing Units | % Housing Units |
| Single Unit, Detached | 358 | 97.0% |
| Single Unit, Attached | 0 | 0.0% |
| 2 Unit Apartments | 0 | 0.0% |
| 3 or 4 Unit Apartments | 0 | 0.0% |
| 5 to 9 Unit Apartments | 0 | 0.0% |
| 10 or more Apartments | 0 | 0.0% |
| Mobile Home / Other | 11 | 3.0% |
| Total | 369 | 100.0% |
Housing Structures by Occupancy in Smallwood
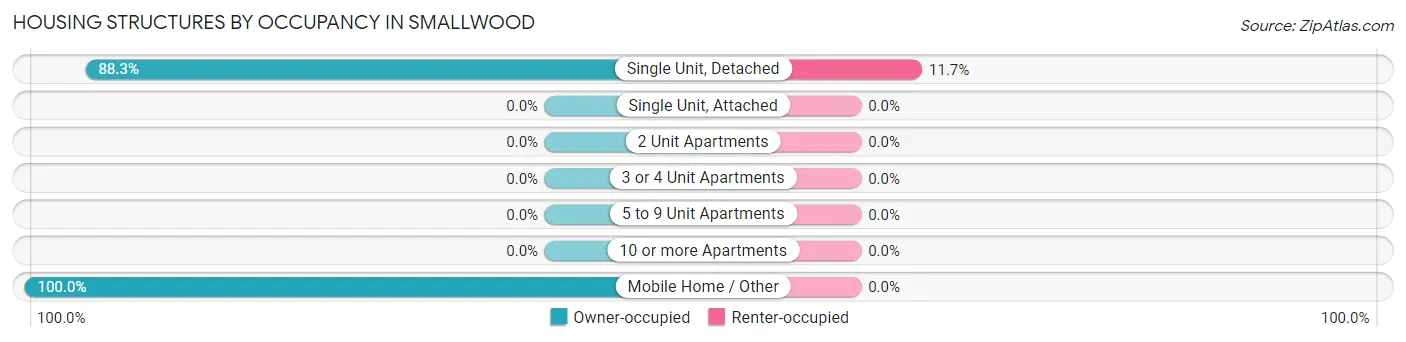
| Structure Type | Owner-occupied | Renter-occupied |
| Single Unit, Detached | 316 (88.3%) | 42 (11.7%) |
| Single Unit, Attached | 0 (0.0%) | 0 (0.0%) |
| 2 Unit Apartments | 0 (0.0%) | 0 (0.0%) |
| 3 or 4 Unit Apartments | 0 (0.0%) | 0 (0.0%) |
| 5 to 9 Unit Apartments | 0 (0.0%) | 0 (0.0%) |
| 10 or more Apartments | 0 (0.0%) | 0 (0.0%) |
| Mobile Home / Other | 11 (100.0%) | 0 (0.0%) |
| Total | 327 (88.6%) | 42 (11.4%) |
Housing Structures by Number of Rooms in Smallwood
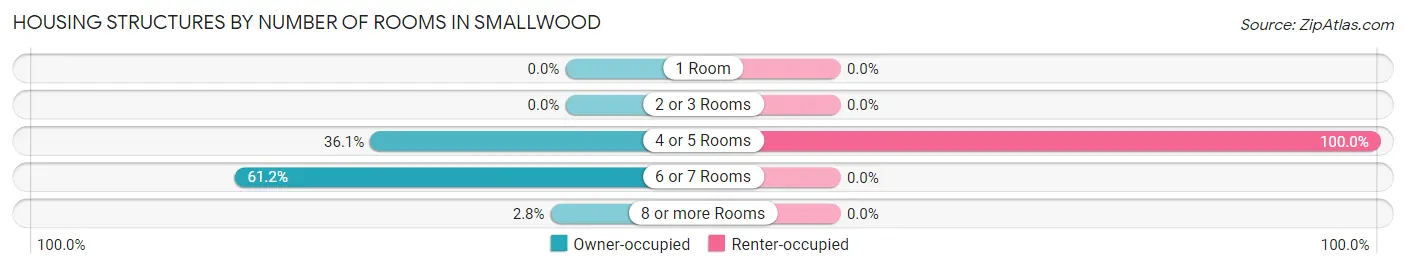
| Number of Rooms | Owner-occupied | Renter-occupied |
| 1 Room | 0 (0.0%) | 0 (0.0%) |
| 2 or 3 Rooms | 0 (0.0%) | 0 (0.0%) |
| 4 or 5 Rooms | 118 (36.1%) | 42 (100.0%) |
| 6 or 7 Rooms | 200 (61.2%) | 0 (0.0%) |
| 8 or more Rooms | 9 (2.8%) | 0 (0.0%) |
| Total | 327 (100.0%) | 42 (100.0%) |
Housing Structure by Heating Type in Smallwood
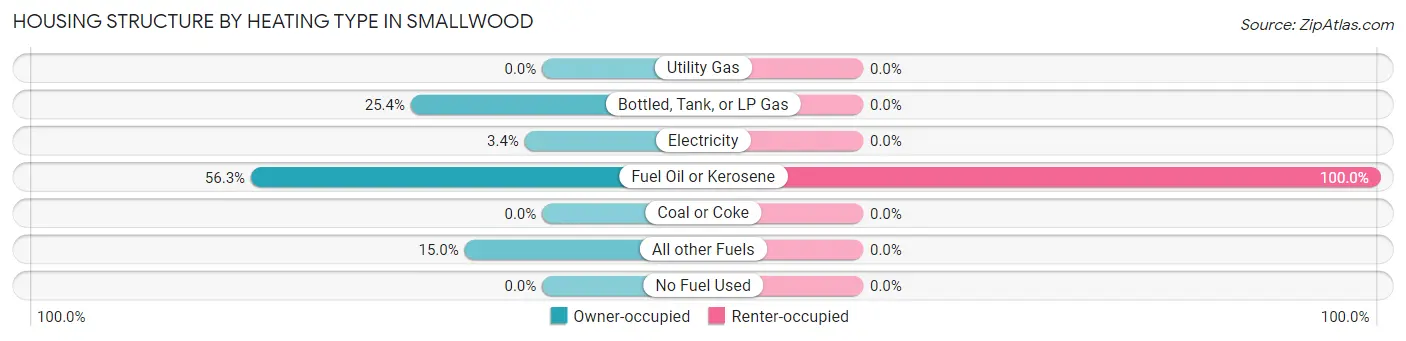
| Heating Type | Owner-occupied | Renter-occupied |
| Utility Gas | 0 (0.0%) | 0 (0.0%) |
| Bottled, Tank, or LP Gas | 83 (25.4%) | 0 (0.0%) |
| Electricity | 11 (3.4%) | 0 (0.0%) |
| Fuel Oil or Kerosene | 184 (56.3%) | 42 (100.0%) |
| Coal or Coke | 0 (0.0%) | 0 (0.0%) |
| All other Fuels | 49 (15.0%) | 0 (0.0%) |
| No Fuel Used | 0 (0.0%) | 0 (0.0%) |
| Total | 327 (100.0%) | 42 (100.0%) |
Household Vehicle Usage in Smallwood
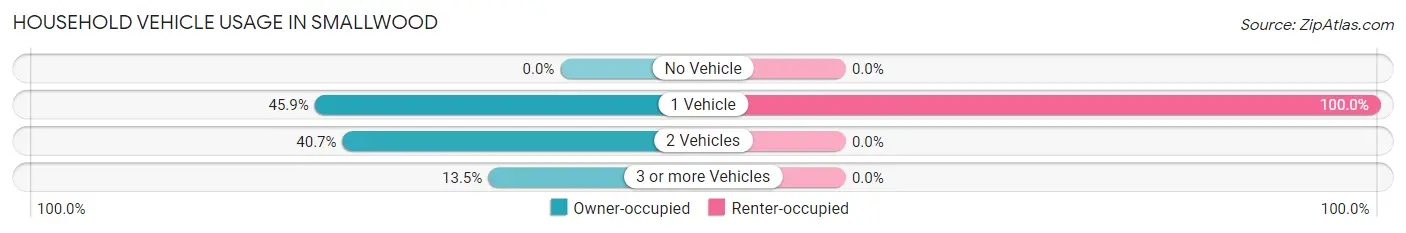
| Vehicles per Household | Owner-occupied | Renter-occupied |
| No Vehicle | 0 (0.0%) | 0 (0.0%) |
| 1 Vehicle | 150 (45.9%) | 42 (100.0%) |
| 2 Vehicles | 133 (40.7%) | 0 (0.0%) |
| 3 or more Vehicles | 44 (13.5%) | 0 (0.0%) |
| Total | 327 (100.0%) | 42 (100.0%) |
Real Estate & Mortgages in Smallwood
Real Estate and Mortgage Overview in Smallwood
| Characteristic | Without Mortgage | With Mortgage |
| Housing Units | 243 | 84 |
| Median Property Value | $165,200 | $126,400 |
| Median Household Income | $64,076 | $0 |
| Monthly Housing Costs | $721 | $0 |
| Real Estate Taxes | $3,233 | $0 |
Property Value by Mortgage Status in Smallwood
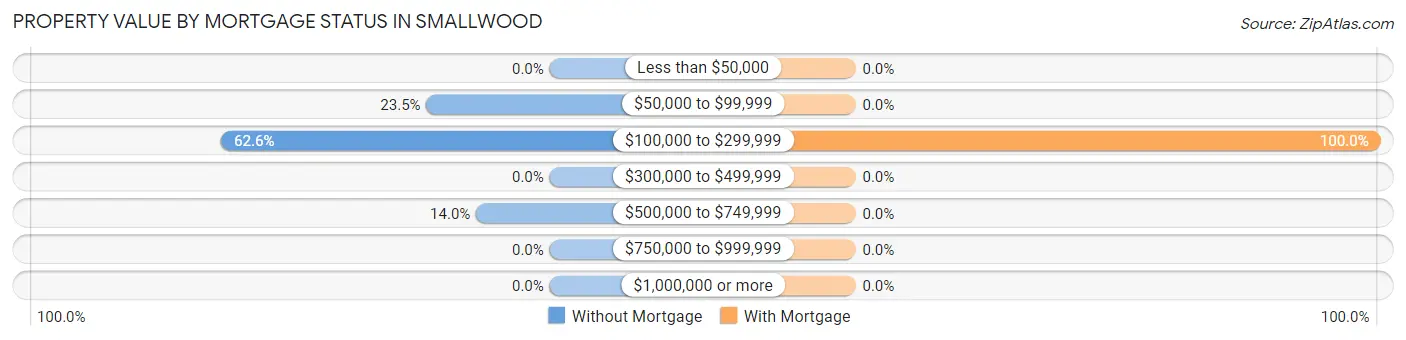
| Property Value | Without Mortgage | With Mortgage |
| Less than $50,000 | 0 (0.0%) | 0 (0.0%) |
| $50,000 to $99,999 | 57 (23.5%) | 0 (0.0%) |
| $100,000 to $299,999 | 152 (62.5%) | 84 (100.0%) |
| $300,000 to $499,999 | 0 (0.0%) | 0 (0.0%) |
| $500,000 to $749,999 | 34 (14.0%) | 0 (0.0%) |
| $750,000 to $999,999 | 0 (0.0%) | 0 (0.0%) |
| $1,000,000 or more | 0 (0.0%) | 0 (0.0%) |
| Total | 243 (100.0%) | 84 (100.0%) |
Household Income by Mortgage Status in Smallwood
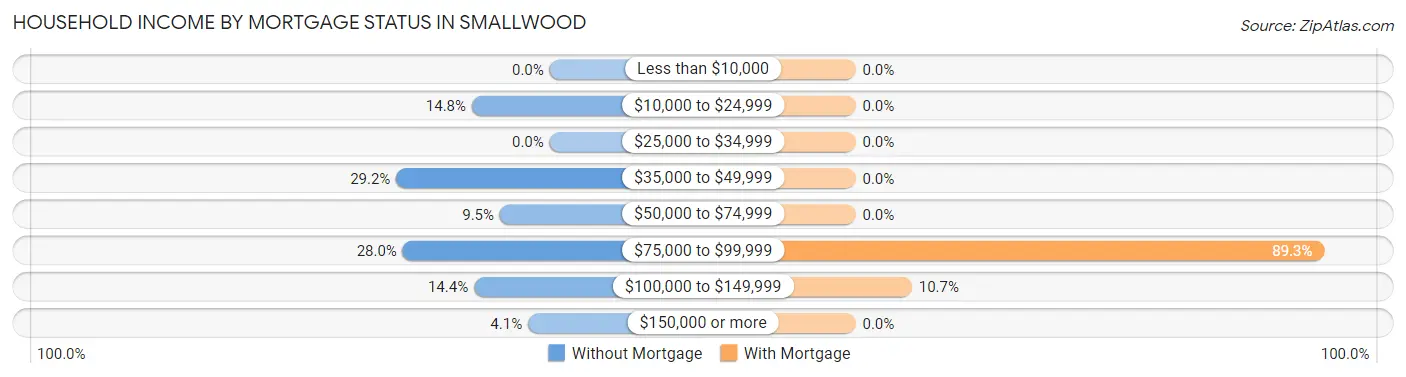
| Household Income | Without Mortgage | With Mortgage |
| Less than $10,000 | 0 (0.0%) | 0 (0.0%) |
| $10,000 to $24,999 | 36 (14.8%) | 0 (0.0%) |
| $25,000 to $34,999 | 0 (0.0%) | 0 (0.0%) |
| $35,000 to $49,999 | 71 (29.2%) | 0 (0.0%) |
| $50,000 to $74,999 | 23 (9.5%) | 0 (0.0%) |
| $75,000 to $99,999 | 68 (28.0%) | 75 (89.3%) |
| $100,000 to $149,999 | 35 (14.4%) | 9 (10.7%) |
| $150,000 or more | 10 (4.1%) | 0 (0.0%) |
| Total | 243 (100.0%) | 84 (100.0%) |
Property Value to Household Income Ratio in Smallwood

| Value-to-Income Ratio | Without Mortgage | With Mortgage |
| Less than 2.0x | 112 (46.1%) | 70,143 (83,503.6%) |
| 2.0x to 2.9x | 61 (25.1%) | 40 (47.6%) |
| 3.0x to 3.9x | 0 (0.0%) | 44 (52.4%) |
| 4.0x or more | 70 (28.8%) | 0 (0.0%) |
| Total | 243 (100.0%) | 84 (100.0%) |
Real Estate Taxes by Mortgage Status in Smallwood
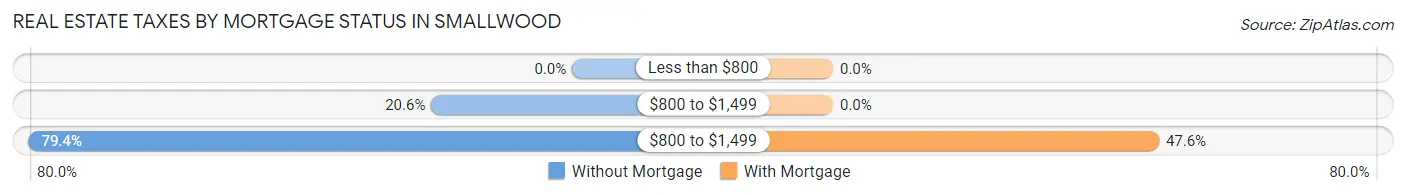
| Property Taxes | Without Mortgage | With Mortgage |
| Less than $800 | 0 (0.0%) | 0 (0.0%) |
| $800 to $1,499 | 50 (20.6%) | 0 (0.0%) |
| $800 to $1,499 | 193 (79.4%) | 40 (47.6%) |
| Total | 243 (100.0%) | 84 (100.0%) |
Health & Disability in Smallwood
Health Insurance Coverage by Age in Smallwood
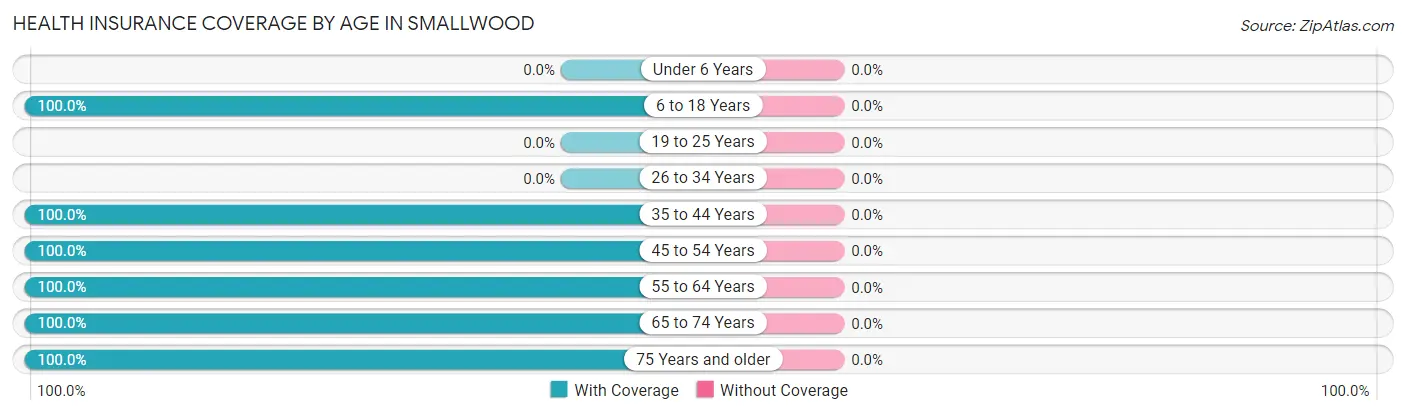
| Age Bracket | With Coverage | Without Coverage |
| Under 6 Years | 0 (0.0%) | 0 (0.0%) |
| 6 to 18 Years | 99 (100.0%) | 0 (0.0%) |
| 19 to 25 Years | 0 (0.0%) | 0 (0.0%) |
| 26 to 34 Years | 0 (0.0%) | 0 (0.0%) |
| 35 to 44 Years | 20 (100.0%) | 0 (0.0%) |
| 45 to 54 Years | 42 (100.0%) | 0 (0.0%) |
| 55 to 64 Years | 156 (100.0%) | 0 (0.0%) |
| 65 to 74 Years | 285 (100.0%) | 0 (0.0%) |
| 75 Years and older | 64 (100.0%) | 0 (0.0%) |
| Total | 666 (100.0%) | 0 (0.0%) |
Health Insurance Coverage by Citizenship Status in Smallwood
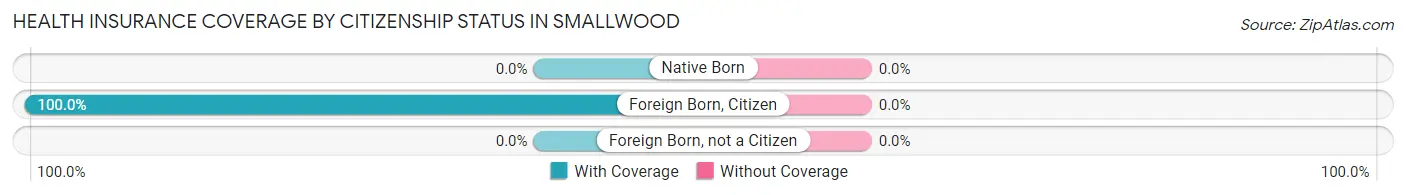
| Citizenship Status | With Coverage | Without Coverage |
| Native Born | 0 (0.0%) | 0 (0.0%) |
| Foreign Born, Citizen | 99 (100.0%) | 0 (0.0%) |
| Foreign Born, not a Citizen | 0 (0.0%) | 0 (0.0%) |
Health Insurance Coverage by Household Income in Smallwood
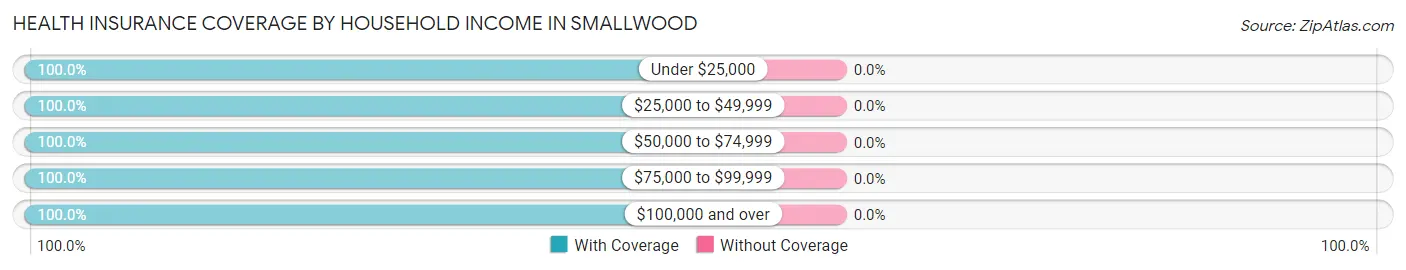
| Household Income | With Coverage | Without Coverage |
| Under $25,000 | 177 (100.0%) | 0 (0.0%) |
| $25,000 to $49,999 | 104 (100.0%) | 0 (0.0%) |
| $50,000 to $74,999 | 129 (100.0%) | 0 (0.0%) |
| $75,000 to $99,999 | 159 (100.0%) | 0 (0.0%) |
| $100,000 and over | 97 (100.0%) | 0 (0.0%) |
Public vs Private Health Insurance Coverage by Age in Smallwood
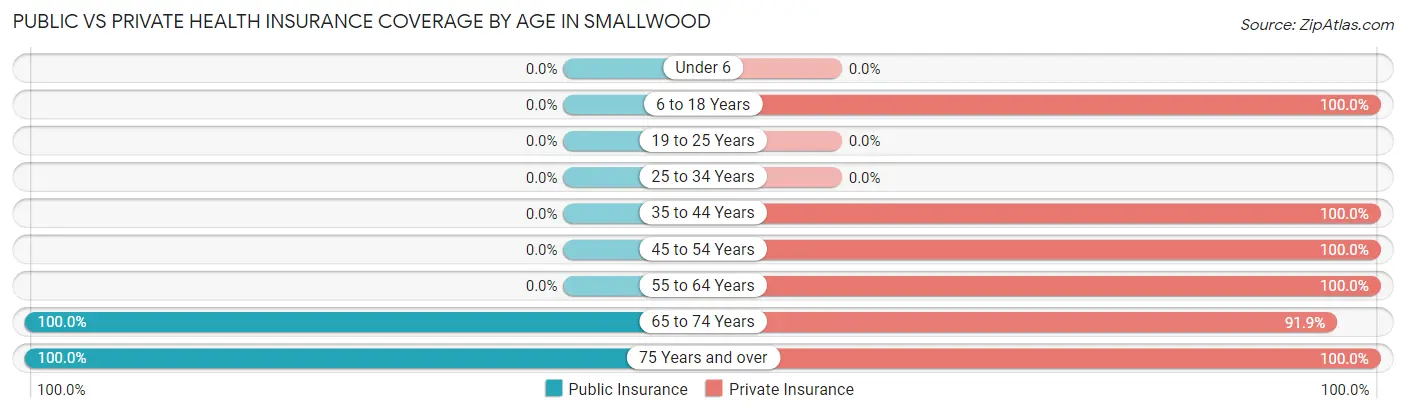
| Age Bracket | Public Insurance | Private Insurance |
| Under 6 | 0 (0.0%) | 0 (0.0%) |
| 6 to 18 Years | 0 (0.0%) | 99 (100.0%) |
| 19 to 25 Years | 0 (0.0%) | 0 (0.0%) |
| 25 to 34 Years | 0 (0.0%) | 0 (0.0%) |
| 35 to 44 Years | 0 (0.0%) | 20 (100.0%) |
| 45 to 54 Years | 0 (0.0%) | 42 (100.0%) |
| 55 to 64 Years | 0 (0.0%) | 156 (100.0%) |
| 65 to 74 Years | 285 (100.0%) | 262 (91.9%) |
| 75 Years and over | 64 (100.0%) | 64 (100.0%) |
| Total | 349 (52.4%) | 643 (96.6%) |
Disability Status by Sex by Age in Smallwood
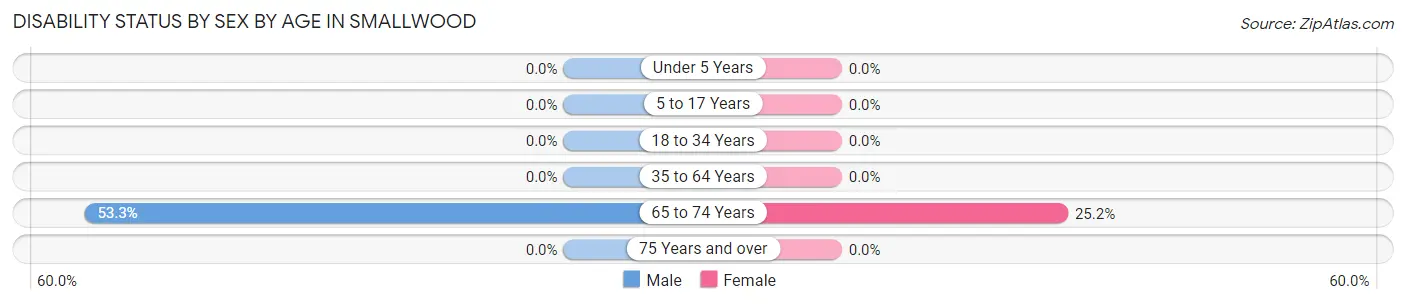
| Age Bracket | Male | Female |
| Under 5 Years | 0 (0.0%) | 0 (0.0%) |
| 5 to 17 Years | 0 (0.0%) | 0 (0.0%) |
| 18 to 34 Years | 0 (0.0%) | 0 (0.0%) |
| 35 to 64 Years | 0 (0.0%) | 0 (0.0%) |
| 65 to 74 Years | 80 (53.3%) | 34 (25.2%) |
| 75 Years and over | 0 (0.0%) | 0 (0.0%) |
Disability Class by Sex by Age in Smallwood
Disability Class: Hearing Difficulty
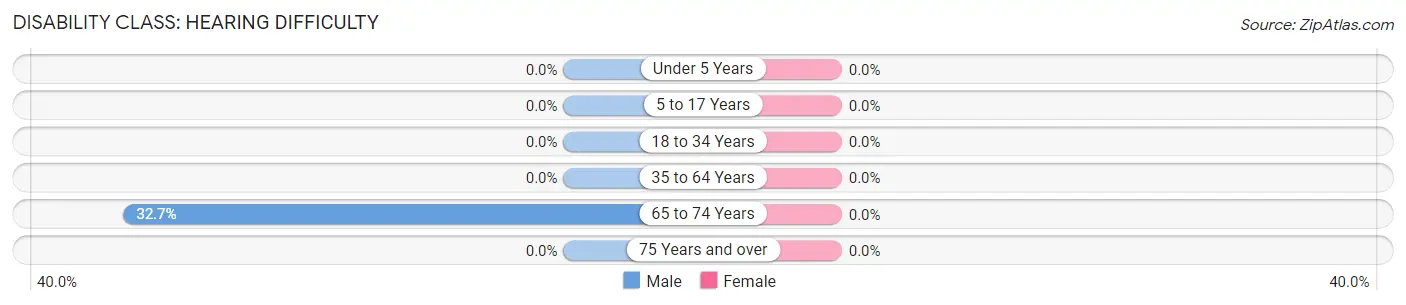
| Age Bracket | Male | Female |
| Under 5 Years | 0 (0.0%) | 0 (0.0%) |
| 5 to 17 Years | 0 (0.0%) | 0 (0.0%) |
| 18 to 34 Years | 0 (0.0%) | 0 (0.0%) |
| 35 to 64 Years | 0 (0.0%) | 0 (0.0%) |
| 65 to 74 Years | 49 (32.7%) | 0 (0.0%) |
| 75 Years and over | 0 (0.0%) | 0 (0.0%) |
Disability Class: Vision Difficulty
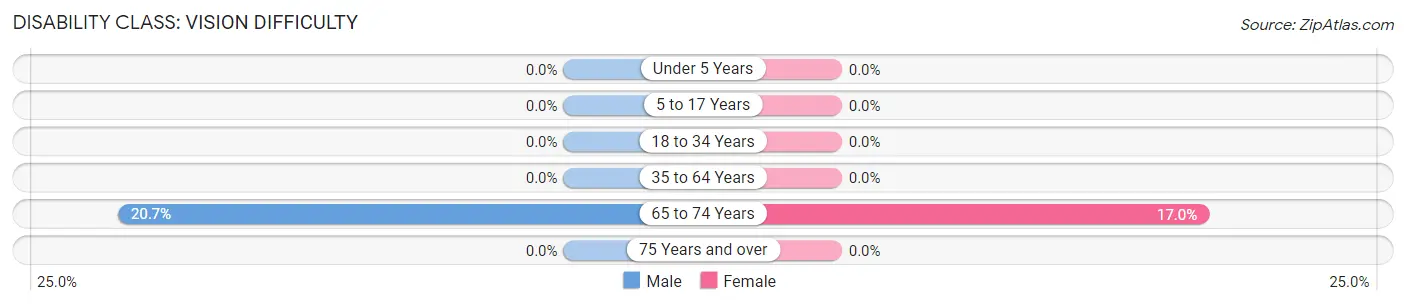
| Age Bracket | Male | Female |
| Under 5 Years | 0 (0.0%) | 0 (0.0%) |
| 5 to 17 Years | 0 (0.0%) | 0 (0.0%) |
| 18 to 34 Years | 0 (0.0%) | 0 (0.0%) |
| 35 to 64 Years | 0 (0.0%) | 0 (0.0%) |
| 65 to 74 Years | 31 (20.7%) | 23 (17.0%) |
| 75 Years and over | 0 (0.0%) | 0 (0.0%) |
Disability Class: Cognitive Difficulty
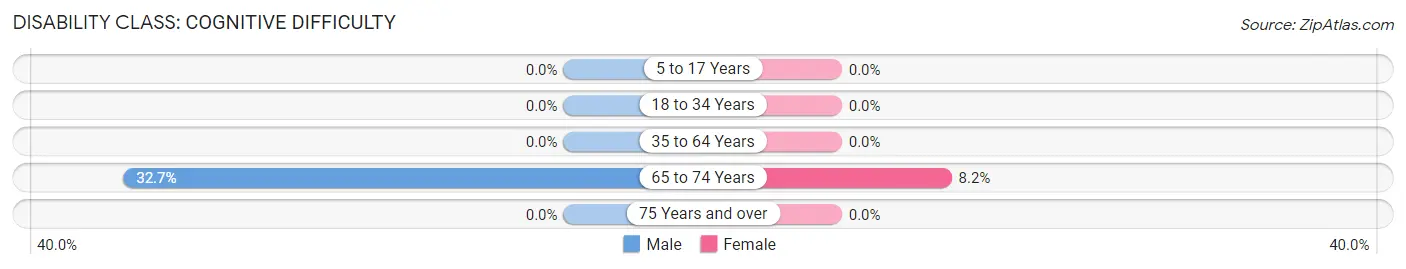
| Age Bracket | Male | Female |
| 5 to 17 Years | 0 (0.0%) | 0 (0.0%) |
| 18 to 34 Years | 0 (0.0%) | 0 (0.0%) |
| 35 to 64 Years | 0 (0.0%) | 0 (0.0%) |
| 65 to 74 Years | 49 (32.7%) | 11 (8.2%) |
| 75 Years and over | 0 (0.0%) | 0 (0.0%) |
Disability Class: Ambulatory Difficulty
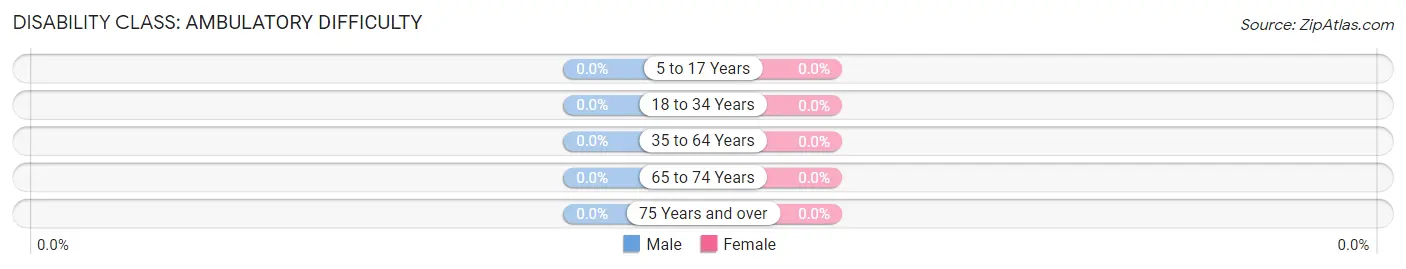
| Age Bracket | Male | Female |
| 5 to 17 Years | 0 (0.0%) | 0 (0.0%) |
| 18 to 34 Years | 0 (0.0%) | 0 (0.0%) |
| 35 to 64 Years | 0 (0.0%) | 0 (0.0%) |
| 65 to 74 Years | 0 (0.0%) | 0 (0.0%) |
| 75 Years and over | 0 (0.0%) | 0 (0.0%) |
Disability Class: Self-Care Difficulty
| Age Bracket | Male | Female |
| 5 to 17 Years | 0 (0.0%) | 0 (0.0%) |
| 18 to 34 Years | 0 (0.0%) | 0 (0.0%) |
| 35 to 64 Years | 0 (0.0%) | 0 (0.0%) |
| 65 to 74 Years | 0 (0.0%) | 0 (0.0%) |
| 75 Years and over | 0 (0.0%) | 0 (0.0%) |
Technology Access in Smallwood
Computing Device Access in Smallwood
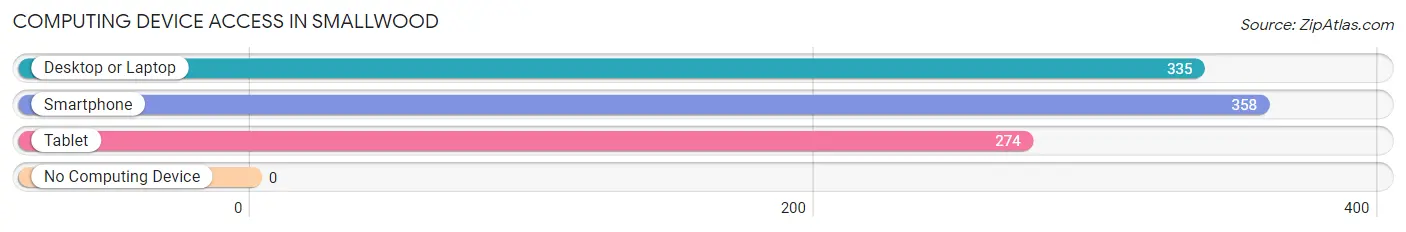
| Device Type | # Households | % Households |
| Desktop or Laptop | 335 | 90.8% |
| Smartphone | 358 | 97.0% |
| Tablet | 274 | 74.3% |
| No Computing Device | 0 | 0.0% |
| Total | 369 | 100.0% |
Internet Access in Smallwood
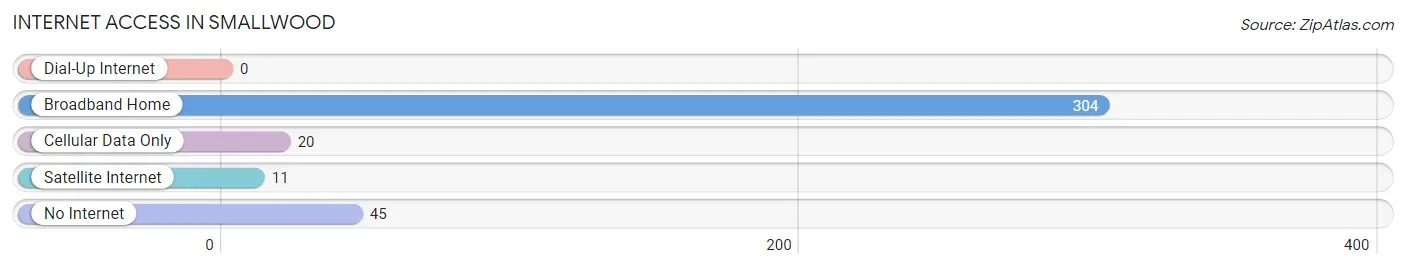
| Internet Type | # Households | % Households |
| Dial-Up Internet | 0 | 0.0% |
| Broadband Home | 304 | 82.4% |
| Cellular Data Only | 20 | 5.4% |
| Satellite Internet | 11 | 3.0% |
| No Internet | 45 | 12.2% |
| Total | 369 | 100.0% |
Smallwood Summary
Smallwood is a hamlet located in the town of Bethel in Sullivan County, New York. It is situated in the Catskill Mountains, approximately two hours from New York City. The hamlet is home to a population of approximately 1,000 people and is known for its rural charm and natural beauty.
History
Smallwood was first settled in the late 1700s by a group of German immigrants. The hamlet was originally known as “Smallwood’s Settlement” and was named after the family who first settled there. The hamlet was officially incorporated in 1845 and has remained a small, rural community ever since.
Geography
Smallwood is located in the Catskill Mountains, approximately two hours from New York City. The hamlet is situated in the town of Bethel, which is located in Sullivan County. The hamlet is surrounded by lush forests and rolling hills, making it a popular destination for outdoor recreation. The Neversink River runs through the hamlet, providing a scenic backdrop for the area.
Economy
Smallwood’s economy is largely based on tourism and outdoor recreation. The hamlet is home to several small businesses, including restaurants, shops, and lodging. The hamlet is also home to a number of farms, which produce a variety of fruits and vegetables. The hamlet is also home to a number of artists and craftspeople, who sell their wares at local markets and festivals.
Demographics
As of the 2010 census, Smallwood had a population of 1,000 people. The median age of the population was 44.7 years, and the median household income was $45,000. The majority of the population is white (94.2%), with a small percentage of African Americans (2.2%) and Hispanics (2.6%). The hamlet is home to a number of religious denominations, including Protestant (45.2%), Catholic (25.2%), and Jewish (2.2%).
Smallwood is a charming hamlet with a rich history and a vibrant economy. The hamlet is home to a diverse population and is a popular destination for outdoor recreation. The hamlet is a great place to live, work, and play, and is sure to remain a popular destination for years to come.
Common Questions
What is Per Capita Income in Smallwood?
Per Capita income in Smallwood is $38,680.
What is the Median Family Income in Smallwood?
Median Family Income in Smallwood is $77,862.
What is the Median Household income in Smallwood?
Median Household Income in Smallwood is $63,909.
What is Income or Wage Gap in Smallwood?
Income or Wage Gap in Smallwood is 16.2%.
Women in Smallwood earn 83.8 cents for every dollar earned by a man.
What is Inequality or Gini Index in Smallwood?
Inequality or Gini Index in Smallwood is 0.41.
What is the Total Population of Smallwood?
Total Population of Smallwood is 666.
What is the Total Male Population of Smallwood?
Total Male Population of Smallwood is 318.
What is the Total Female Population of Smallwood?
Total Female Population of Smallwood is 348.
What is the Ratio of Males per 100 Females in Smallwood?
There are 91.38 Males per 100 Females in Smallwood.
What is the Ratio of Females per 100 Males in Smallwood?
There are 109.43 Females per 100 Males in Smallwood.
What is the Median Population Age in Smallwood?
Median Population Age in Smallwood is 67.1 Years.
What is the Average Family Size in Smallwood
Average Family Size in Smallwood is 2.4 People.
What is the Average Household Size in Smallwood
Average Household Size in Smallwood is 1.8 People.
How Large is the Labor Force in Smallwood?
There are 184 People in the Labor Forcein in Smallwood.
What is the Percentage of People in the Labor Force in Smallwood?
32.5% of People are in the Labor Force in Smallwood.