Hartsdale, NY Map & Demographics
Hartsdale Map
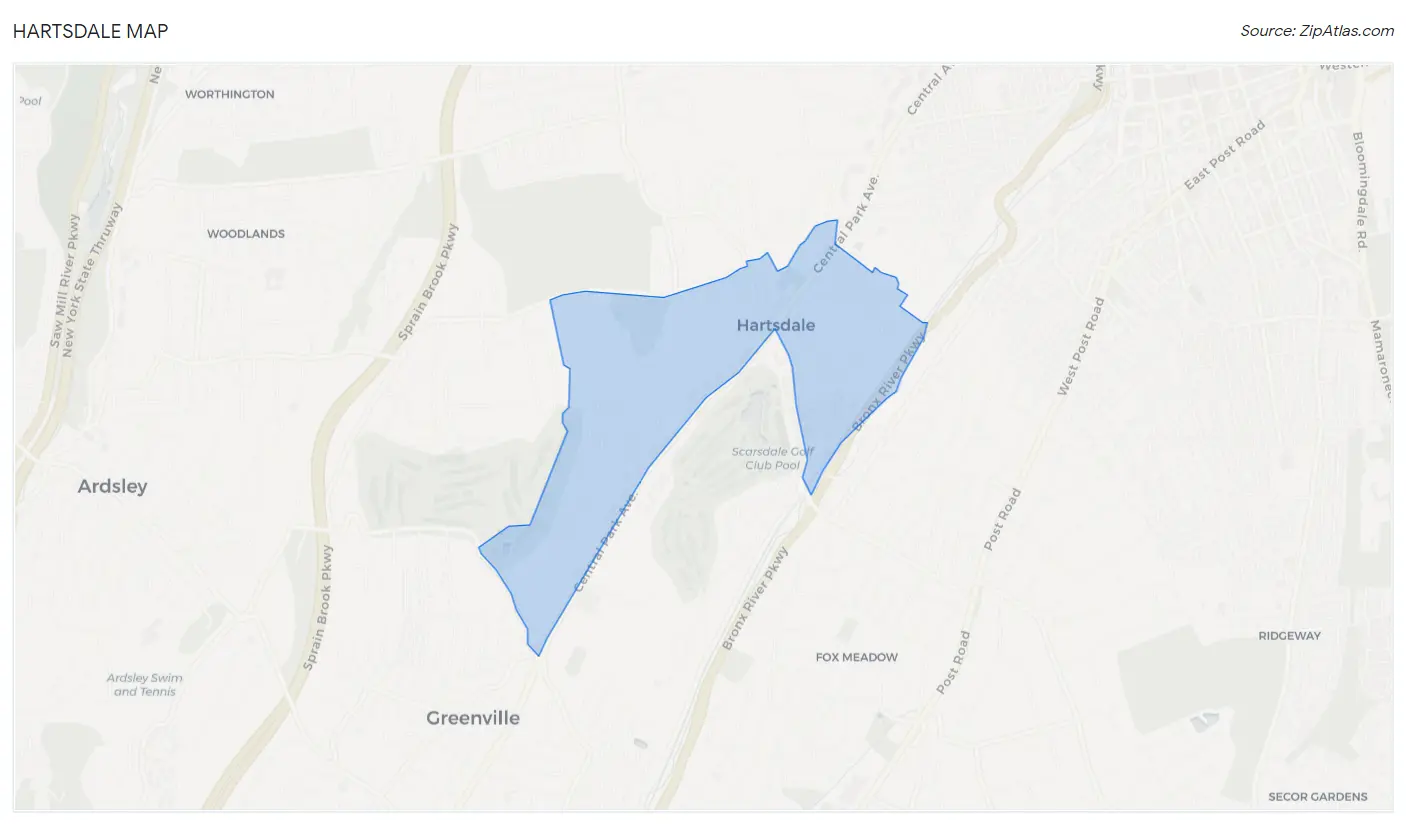
Hartsdale Overview
$99,147
PER CAPITA INCOME
$223,233
AVG FAMILY INCOME
$157,891
AVG HOUSEHOLD INCOME
37.5%
WAGE / INCOME GAP [ % ]
62.5¢/ $1
WAGE / INCOME GAP [ $ ]
0.50
INEQUALITY / GINI INDEX
3,082
TOTAL POPULATION
1,281
MALE POPULATION
1,801
FEMALE POPULATION
71.13
MALES / 100 FEMALES
140.59
FEMALES / 100 MALES
47.4
MEDIAN AGE
2.8
AVG FAMILY SIZE
2.3
AVG HOUSEHOLD SIZE
1,783
LABOR FORCE [ PEOPLE ]
67.5%
PERCENT IN LABOR FORCE
1.6%
UNEMPLOYMENT RATE
Hartsdale Zip Codes
Hartsdale Area Codes
Income in Hartsdale
Income Overview in Hartsdale
Per Capita Income in Hartsdale is $99,147, while median incomes of families and households are $223,233 and $157,891 respectively.
| Characteristic | Number | Measure |
| Per Capita Income | 3,082 | $99,147 |
| Median Family Income | 858 | $223,233 |
| Mean Family Income | 858 | $304,691 |
| Median Household Income | 1,317 | $157,891 |
| Mean Household Income | 1,317 | $236,284 |
| Income Deficit | 858 | $0 |
| Wage / Income Gap (%) | 3,082 | 37.46% |
| Wage / Income Gap ($) | 3,082 | 62.54¢ per $1 |
| Gini / Inequality Index | 3,082 | 0.50 |
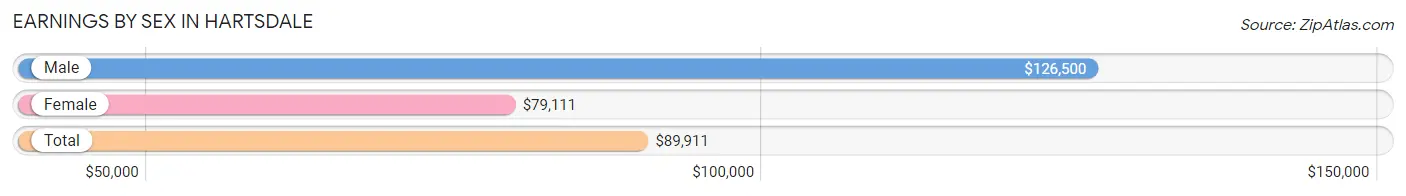
Earnings by Sex in Hartsdale
Average Earnings in Hartsdale are $89,911, $126,500 for men and $79,111 for women, a difference of 37.5%.
| Sex | Number | Average Earnings |
| Male | 878 (46.9%) | $126,500 |
| Female | 996 (53.1%) | $79,111 |
| Total | 1,874 (100.0%) | $89,911 |
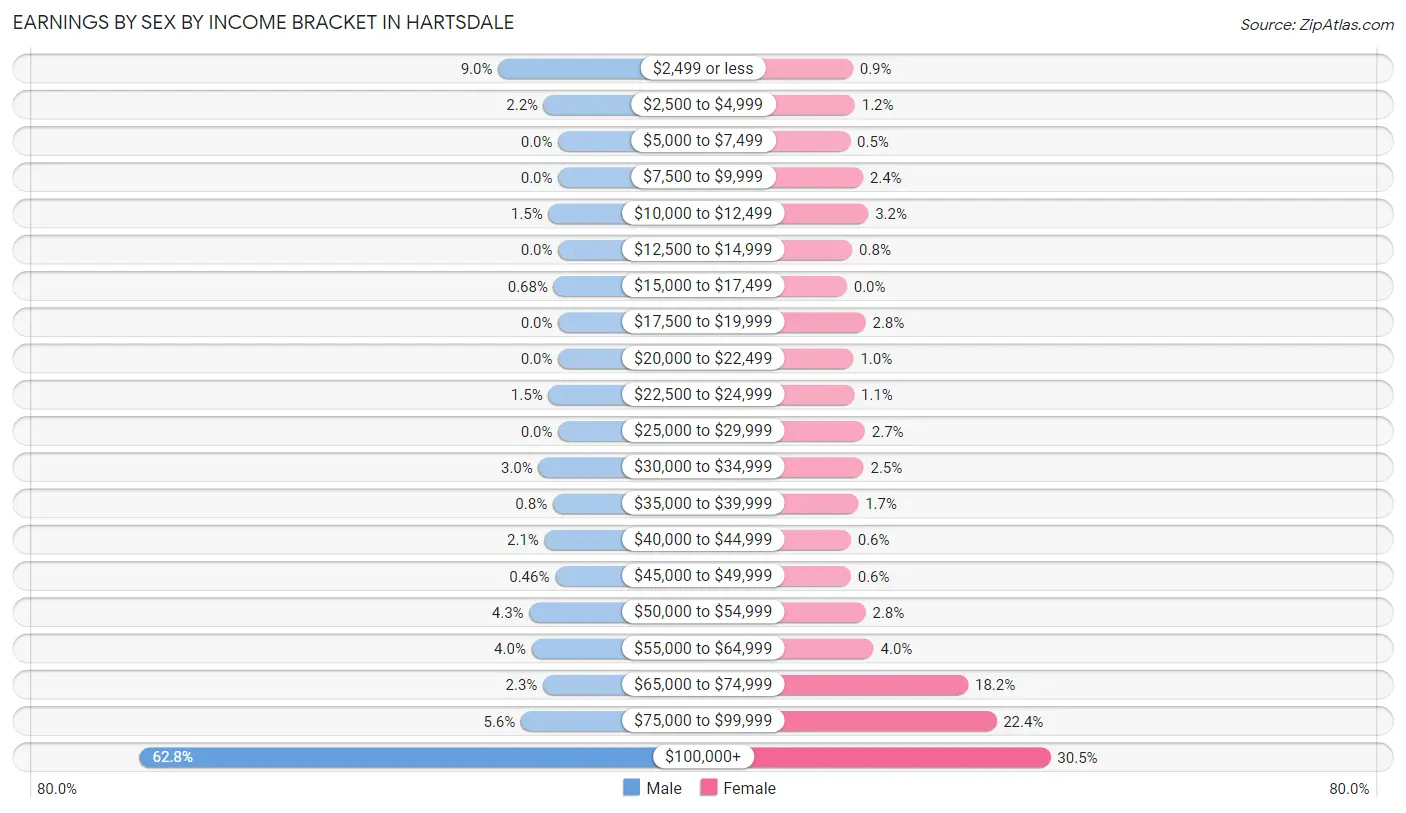
Earnings by Sex by Income Bracket in Hartsdale
The most common earnings brackets in Hartsdale are $100,000+ for men (551 | 62.8%) and $100,000+ for women (304 | 30.5%).
| Income | Male | Female |
| $2,499 or less | 79 (9.0%) | 9 (0.9%) |
| $2,500 to $4,999 | 19 (2.2%) | 12 (1.2%) |
| $5,000 to $7,499 | 0 (0.0%) | 5 (0.5%) |
| $7,500 to $9,999 | 0 (0.0%) | 24 (2.4%) |
| $10,000 to $12,499 | 13 (1.5%) | 32 (3.2%) |
| $12,500 to $14,999 | 0 (0.0%) | 8 (0.8%) |
| $15,000 to $17,499 | 6 (0.7%) | 0 (0.0%) |
| $17,500 to $19,999 | 0 (0.0%) | 28 (2.8%) |
| $20,000 to $22,499 | 0 (0.0%) | 10 (1.0%) |
| $22,500 to $24,999 | 13 (1.5%) | 11 (1.1%) |
| $25,000 to $29,999 | 0 (0.0%) | 27 (2.7%) |
| $30,000 to $34,999 | 26 (3.0%) | 25 (2.5%) |
| $35,000 to $39,999 | 7 (0.8%) | 17 (1.7%) |
| $40,000 to $44,999 | 18 (2.1%) | 6 (0.6%) |
| $45,000 to $49,999 | 4 (0.5%) | 6 (0.6%) |
| $50,000 to $54,999 | 38 (4.3%) | 28 (2.8%) |
| $55,000 to $64,999 | 35 (4.0%) | 40 (4.0%) |
| $65,000 to $74,999 | 20 (2.3%) | 181 (18.2%) |
| $75,000 to $99,999 | 49 (5.6%) | 223 (22.4%) |
| $100,000+ | 551 (62.8%) | 304 (30.5%) |
| Total | 878 (100.0%) | 996 (100.0%) |
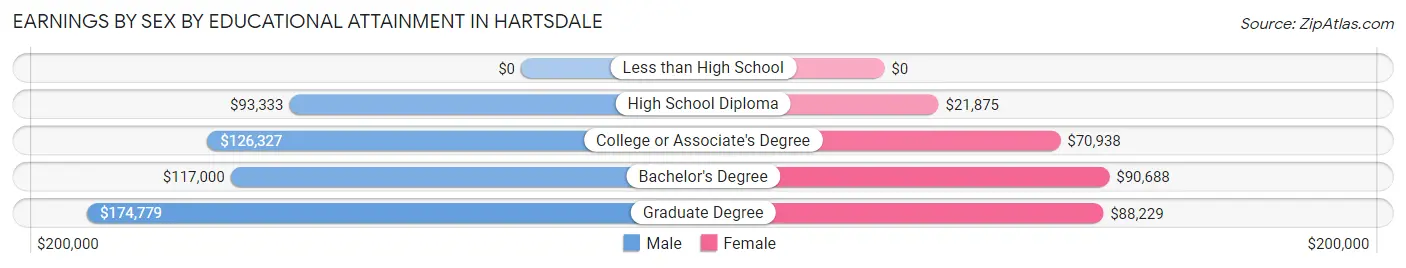
Earnings by Sex by Educational Attainment in Hartsdale
Average earnings in Hartsdale are $133,125 for men and $78,722 for women, a difference of 40.9%. Men with an educational attainment of graduate degree enjoy the highest average annual earnings of $174,779, while those with high school diploma education earn the least with $93,333. Women with an educational attainment of bachelor's degree earn the most with the average annual earnings of $90,688, while those with high school diploma education have the smallest earnings of $21,875.
| Educational Attainment | Male Income | Female Income |
| Less than High School | - | - |
| High School Diploma | $93,333 | $21,875 |
| College or Associate's Degree | $126,327 | $70,938 |
| Bachelor's Degree | $117,000 | $90,688 |
| Graduate Degree | $174,779 | $88,229 |
| Total | $133,125 | $78,722 |
Family Income in Hartsdale
Family Income Brackets in Hartsdale
According to the Hartsdale family income data, there are 490 families falling into the $200,000+ income range, which is the most common income bracket and makes up 57.1% of all families.
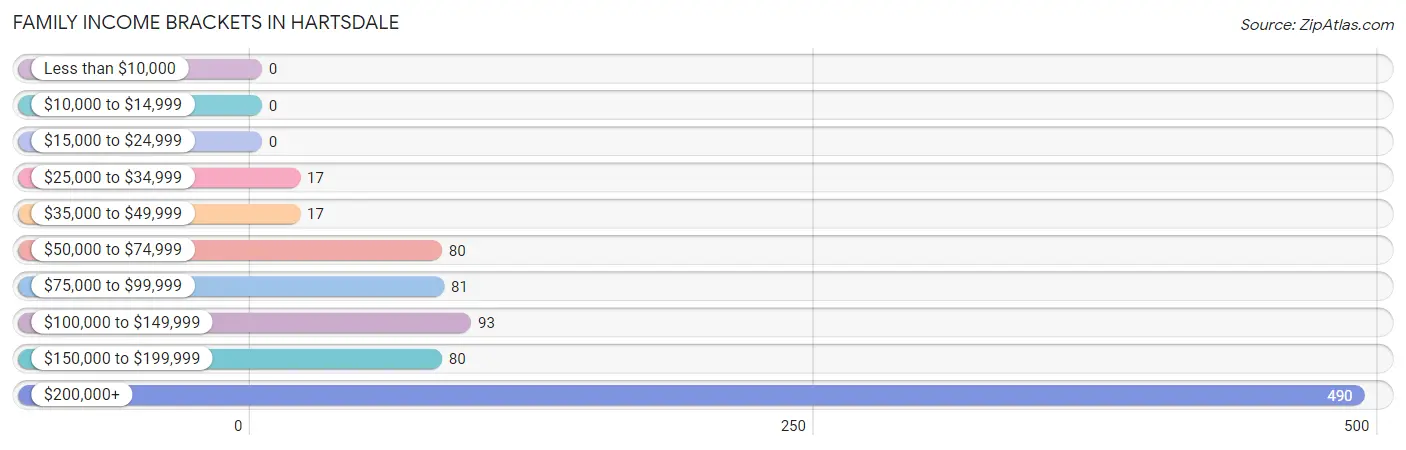
| Income Bracket | # Families | % Families |
| Less than $10,000 | 0 | 0.0% |
| $10,000 to $14,999 | 0 | 0.0% |
| $15,000 to $24,999 | 0 | 0.0% |
| $25,000 to $34,999 | 17 | 2.0% |
| $35,000 to $49,999 | 17 | 2.0% |
| $50,000 to $74,999 | 80 | 9.3% |
| $75,000 to $99,999 | 81 | 9.4% |
| $100,000 to $149,999 | 93 | 10.8% |
| $150,000 to $199,999 | 80 | 9.3% |
| $200,000+ | 490 | 57.1% |
Family Income by Famaliy Size in Hartsdale
5-person families (77 | 9.0%) account for the highest median family income in Hartsdale with $250,001 per family, while 2-person families (393 | 45.8%) have the highest median income of $73,203 per family member.
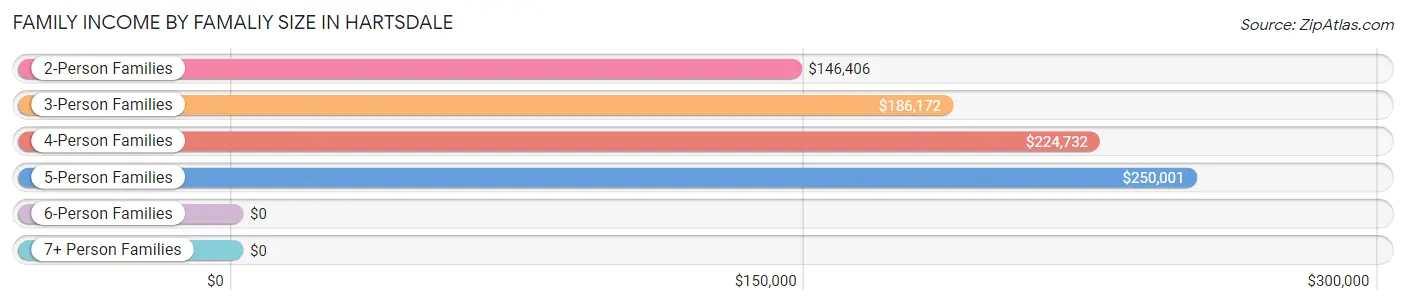
| Income Bracket | # Families | Median Income |
| 2-Person Families | 393 (45.8%) | $146,406 |
| 3-Person Families | 225 (26.2%) | $186,172 |
| 4-Person Families | 149 (17.4%) | $224,732 |
| 5-Person Families | 77 (9.0%) | $250,001 |
| 6-Person Families | 14 (1.6%) | $0 |
| 7+ Person Families | 0 (0.0%) | $0 |
| Total | 858 (100.0%) | $223,233 |
Family Income by Number of Earners in Hartsdale
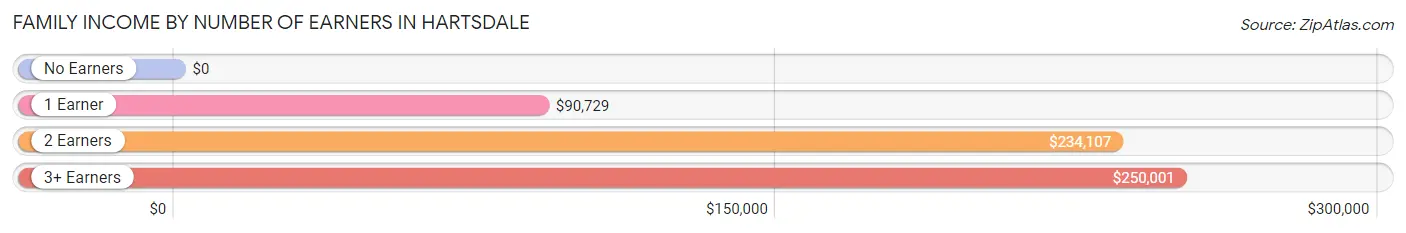
| Number of Earners | # Families | Median Income |
| No Earners | 45 (5.2%) | $0 |
| 1 Earner | 240 (28.0%) | $90,729 |
| 2 Earners | 435 (50.7%) | $234,107 |
| 3+ Earners | 138 (16.1%) | $250,001 |
| Total | 858 (100.0%) | $223,233 |
Household Income in Hartsdale
Household Income Brackets in Hartsdale
With 553 households falling in the category, the $200,000+ income range is the most frequent in Hartsdale, accounting for 42.0% of all households.
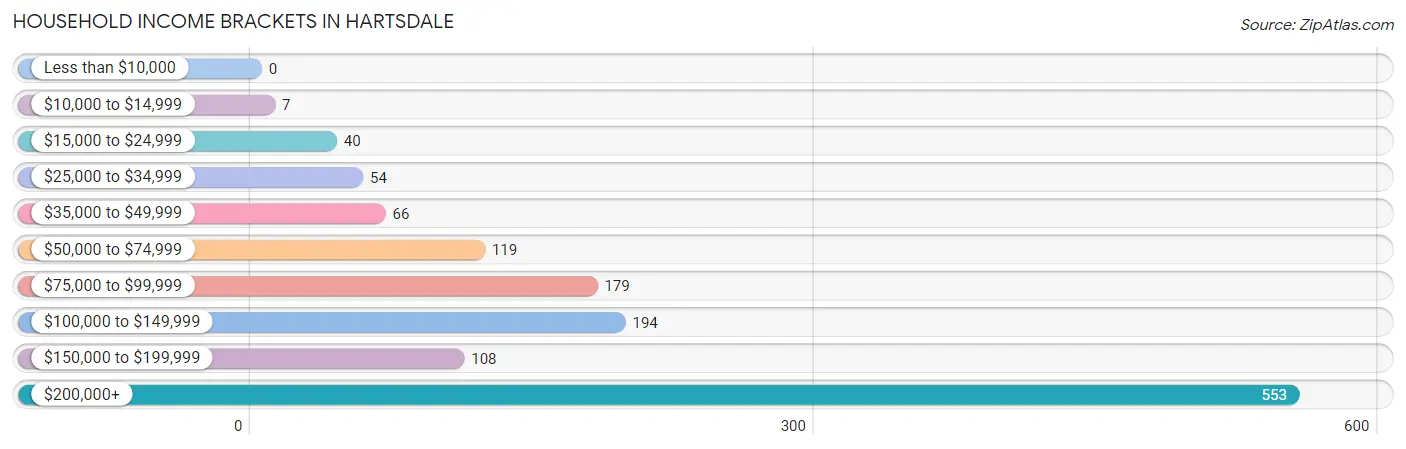
| Income Bracket | # Households | % Households |
| Less than $10,000 | 0 | 0.0% |
| $10,000 to $14,999 | 7 | 0.5% |
| $15,000 to $24,999 | 40 | 3.0% |
| $25,000 to $34,999 | 54 | 4.1% |
| $35,000 to $49,999 | 66 | 5.0% |
| $50,000 to $74,999 | 119 | 9.0% |
| $75,000 to $99,999 | 179 | 13.6% |
| $100,000 to $149,999 | 194 | 14.7% |
| $150,000 to $199,999 | 108 | 8.2% |
| $200,000+ | 553 | 42.0% |
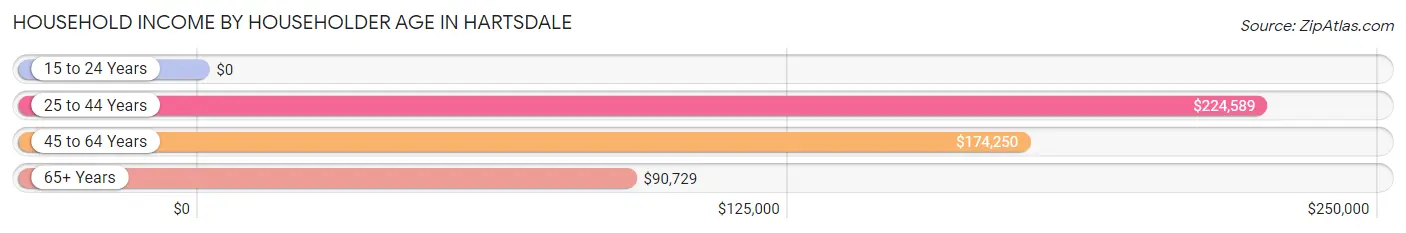
Household Income by Householder Age in Hartsdale
The median household income in Hartsdale is $157,891, with the highest median household income of $224,589 found in the 25 to 44 years age bracket for the primary householder. A total of 285 households (21.6%) fall into this category.
| Income Bracket | # Households | Median Income |
| 15 to 24 Years | 0 (0.0%) | $0 |
| 25 to 44 Years | 285 (21.6%) | $224,589 |
| 45 to 64 Years | 678 (51.5%) | $174,250 |
| 65+ Years | 354 (26.9%) | $90,729 |
| Total | 1,317 (100.0%) | $157,891 |
Poverty in Hartsdale
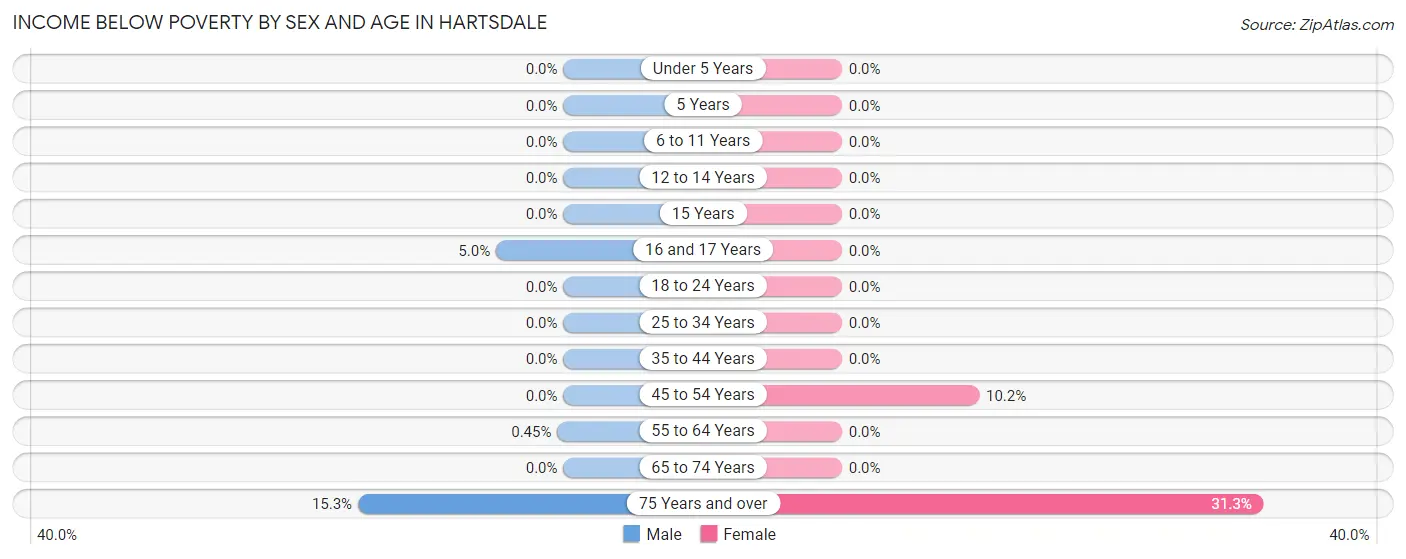
Income Below Poverty by Sex and Age in Hartsdale
With 1.0% poverty level for males and 6.4% for females among the residents of Hartsdale, 75 year old and over males and 75 year old and over females are the most vulnerable to poverty, with 9 males (15.2%) and 88 females (31.3%) in their respective age groups living below the poverty level.
| Age Bracket | Male | Female |
| Under 5 Years | 0 (0.0%) | 0 (0.0%) |
| 5 Years | 0 (0.0%) | 0 (0.0%) |
| 6 to 11 Years | 0 (0.0%) | 0 (0.0%) |
| 12 to 14 Years | 0 (0.0%) | 0 (0.0%) |
| 15 Years | 0 (0.0%) | 0 (0.0%) |
| 16 and 17 Years | 3 (5.0%) | 0 (0.0%) |
| 18 to 24 Years | 0 (0.0%) | 0 (0.0%) |
| 25 to 34 Years | 0 (0.0%) | 0 (0.0%) |
| 35 to 44 Years | 0 (0.0%) | 0 (0.0%) |
| 45 to 54 Years | 0 (0.0%) | 27 (10.2%) |
| 55 to 64 Years | 1 (0.4%) | 0 (0.0%) |
| 65 to 74 Years | 0 (0.0%) | 0 (0.0%) |
| 75 Years and over | 9 (15.2%) | 88 (31.3%) |
| Total | 13 (1.0%) | 115 (6.4%) |
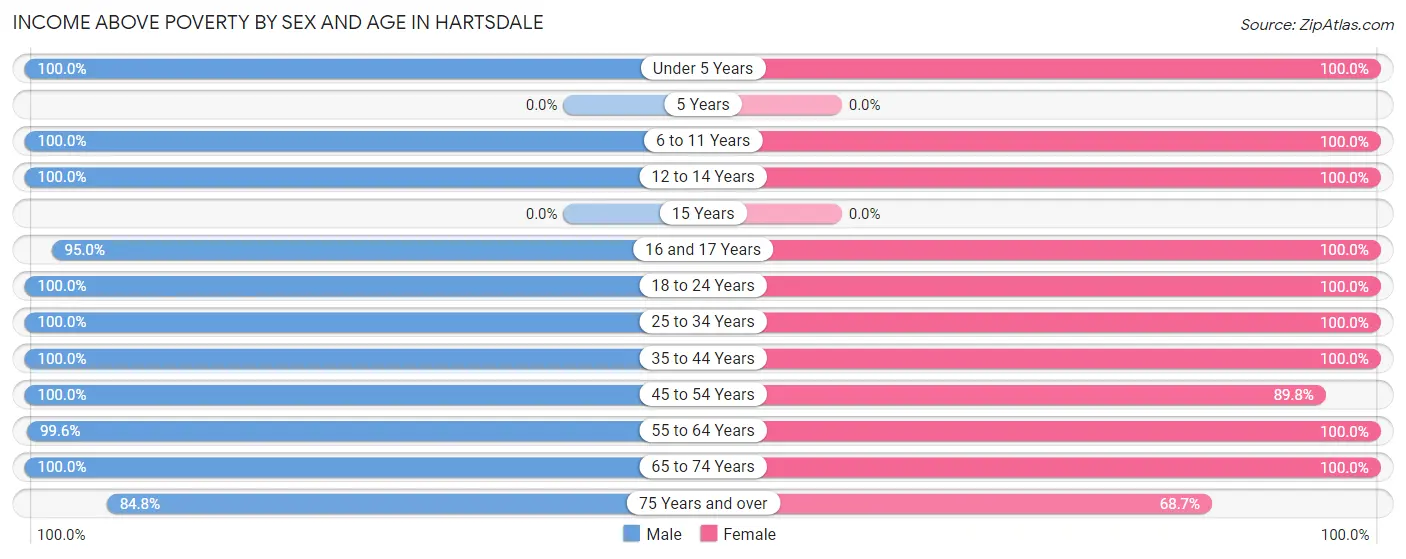
Income Above Poverty by Sex and Age in Hartsdale
According to the poverty statistics in Hartsdale, males aged under 5 years and females aged under 5 years are the age groups that are most secure financially, with 100.0% of males and 100.0% of females in these age groups living above the poverty line.
| Age Bracket | Male | Female |
| Under 5 Years | 38 (100.0%) | 132 (100.0%) |
| 5 Years | 0 (0.0%) | 0 (0.0%) |
| 6 to 11 Years | 75 (100.0%) | 138 (100.0%) |
| 12 to 14 Years | 38 (100.0%) | 20 (100.0%) |
| 15 Years | 0 (0.0%) | 0 (0.0%) |
| 16 and 17 Years | 57 (95.0%) | 18 (100.0%) |
| 18 to 24 Years | 94 (100.0%) | 90 (100.0%) |
| 25 to 34 Years | 47 (100.0%) | 86 (100.0%) |
| 35 to 44 Years | 235 (100.0%) | 291 (100.0%) |
| 45 to 54 Years | 258 (100.0%) | 238 (89.8%) |
| 55 to 64 Years | 219 (99.6%) | 277 (100.0%) |
| 65 to 74 Years | 157 (100.0%) | 203 (100.0%) |
| 75 Years and over | 50 (84.8%) | 193 (68.7%) |
| Total | 1,268 (99.0%) | 1,686 (93.6%) |
Income Below Poverty Among Married-Couple Families in Hartsdale
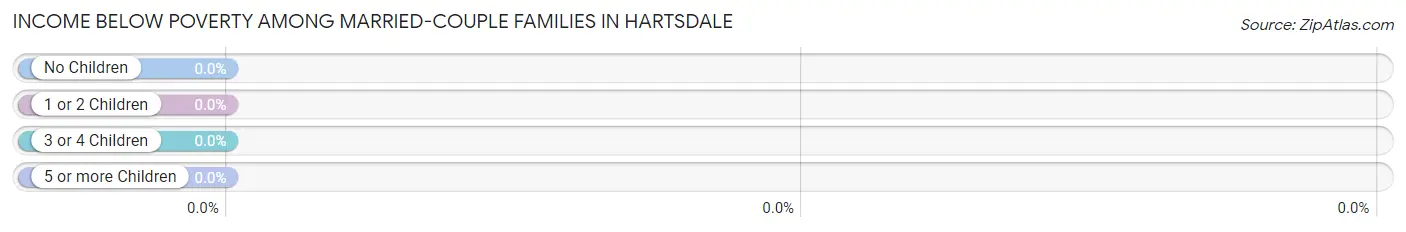
| Children | Above Poverty | Below Poverty |
| No Children | 364 (100.0%) | 0 (0.0%) |
| 1 or 2 Children | 291 (100.0%) | 0 (0.0%) |
| 3 or 4 Children | 24 (100.0%) | 0 (0.0%) |
| 5 or more Children | 0 (0.0%) | 0 (0.0%) |
| Total | 679 (100.0%) | 0 (0.0%) |
Income Below Poverty Among Single-Parent Households in Hartsdale
| Children | Single Father | Single Mother |
| No Children | 0 (0.0%) | 0 (0.0%) |
| 1 or 2 Children | 0 (0.0%) | 0 (0.0%) |
| 3 or 4 Children | 0 (0.0%) | 0 (0.0%) |
| 5 or more Children | 0 (0.0%) | 0 (0.0%) |
| Total | 0 (0.0%) | 0 (0.0%) |
Income Below Poverty Among Married-Couple vs Single-Parent Households in Hartsdale
| Children | Married-Couple Families | Single-Parent Households |
| No Children | 0 (0.0%) | 0 (0.0%) |
| 1 or 2 Children | 0 (0.0%) | 0 (0.0%) |
| 3 or 4 Children | 0 (0.0%) | 0 (0.0%) |
| 5 or more Children | 0 (0.0%) | 0 (0.0%) |
| Total | 0 (0.0%) | 0 (0.0%) |
Race in Hartsdale
The most populous races in Hartsdale are White / Caucasian (2,171 | 70.4%), Asian (486 | 15.8%), and Hispanic or Latino (267 | 8.7%).
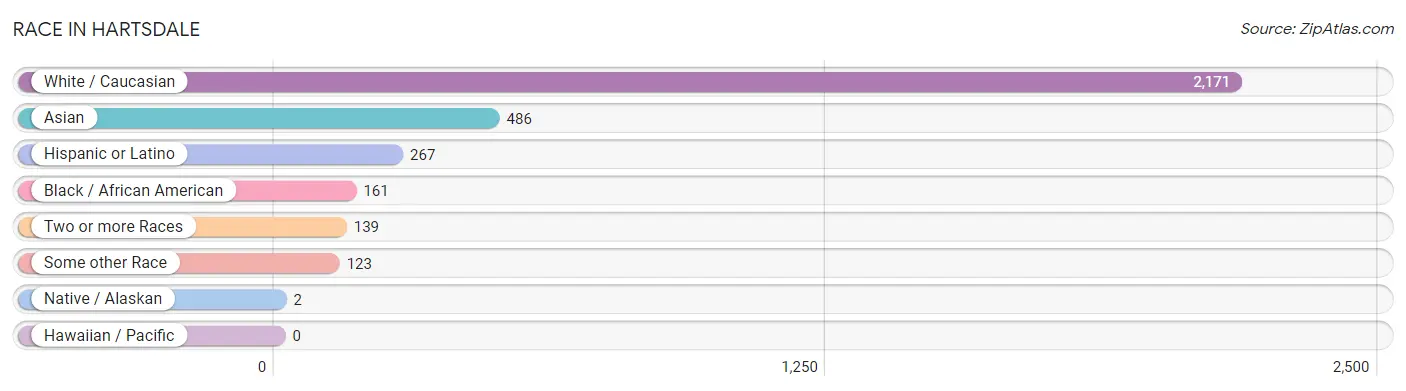
| Race | # Population | % Population |
| Asian | 486 | 15.8% |
| Black / African American | 161 | 5.2% |
| Hawaiian / Pacific | 0 | 0.0% |
| Hispanic or Latino | 267 | 8.7% |
| Native / Alaskan | 2 | 0.1% |
| White / Caucasian | 2,171 | 70.4% |
| Two or more Races | 139 | 4.5% |
| Some other Race | 123 | 4.0% |
| Total | 3,082 | 100.0% |
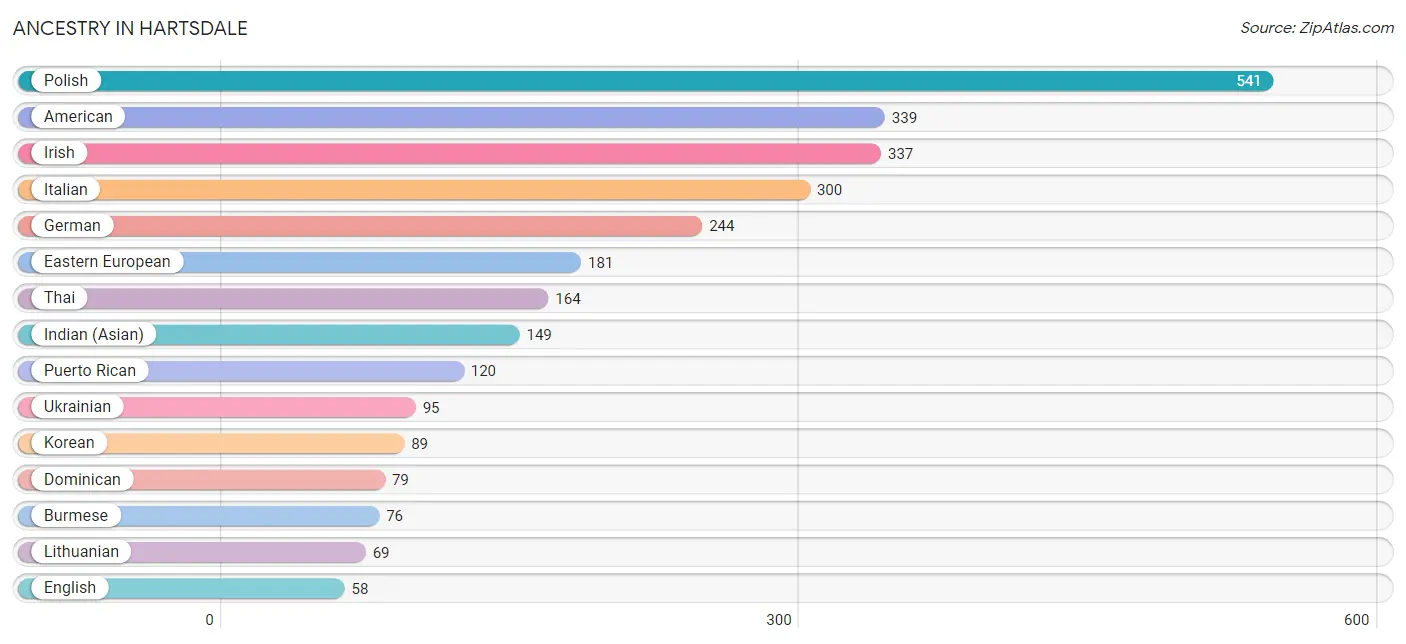
Ancestry in Hartsdale
The most populous ancestries reported in Hartsdale are Polish (541 | 17.5%), American (339 | 11.0%), Irish (337 | 10.9%), Italian (300 | 9.7%), and German (244 | 7.9%), together accounting for 57.1% of all Hartsdale residents.
| Ancestry | # Population | % Population |
| Albanian | 55 | 1.8% |
| Alsatian | 18 | 0.6% |
| American | 339 | 11.0% |
| Arab | 18 | 0.6% |
| Armenian | 7 | 0.2% |
| Austrian | 17 | 0.5% |
| Bhutanese | 33 | 1.1% |
| British | 8 | 0.3% |
| British West Indian | 14 | 0.4% |
| Bulgarian | 10 | 0.3% |
| Burmese | 76 | 2.5% |
| Canadian | 24 | 0.8% |
| Central American Indian | 2 | 0.1% |
| Cuban | 11 | 0.4% |
| Czechoslovakian | 7 | 0.2% |
| Danish | 7 | 0.2% |
| Dominican | 79 | 2.6% |
| Dutch | 12 | 0.4% |
| Eastern European | 181 | 5.9% |
| Ecuadorian | 13 | 0.4% |
| English | 58 | 1.9% |
| European | 37 | 1.2% |
| Finnish | 57 | 1.8% |
| French | 34 | 1.1% |
| French Canadian | 5 | 0.2% |
| German | 244 | 7.9% |
| Greek | 31 | 1.0% |
| Guyanese | 20 | 0.6% |
| Hungarian | 7 | 0.2% |
| Indian (Asian) | 149 | 4.8% |
| Irish | 337 | 10.9% |
| Italian | 300 | 9.7% |
| Korean | 89 | 2.9% |
| Lebanese | 18 | 0.6% |
| Lithuanian | 69 | 2.2% |
| Mexican | 10 | 0.3% |
| Norwegian | 4 | 0.1% |
| Peruvian | 26 | 0.8% |
| Polish | 541 | 17.5% |
| Puerto Rican | 120 | 3.9% |
| Romanian | 19 | 0.6% |
| Russian | 46 | 1.5% |
| Scottish | 9 | 0.3% |
| Slavic | 15 | 0.5% |
| South American | 39 | 1.3% |
| Spaniard | 8 | 0.3% |
| Sri Lankan | 9 | 0.3% |
| Subsaharan African | 36 | 1.2% |
| Swiss | 10 | 0.3% |
| Thai | 164 | 5.3% |
| Ukrainian | 95 | 3.1% | View All 51 Rows |
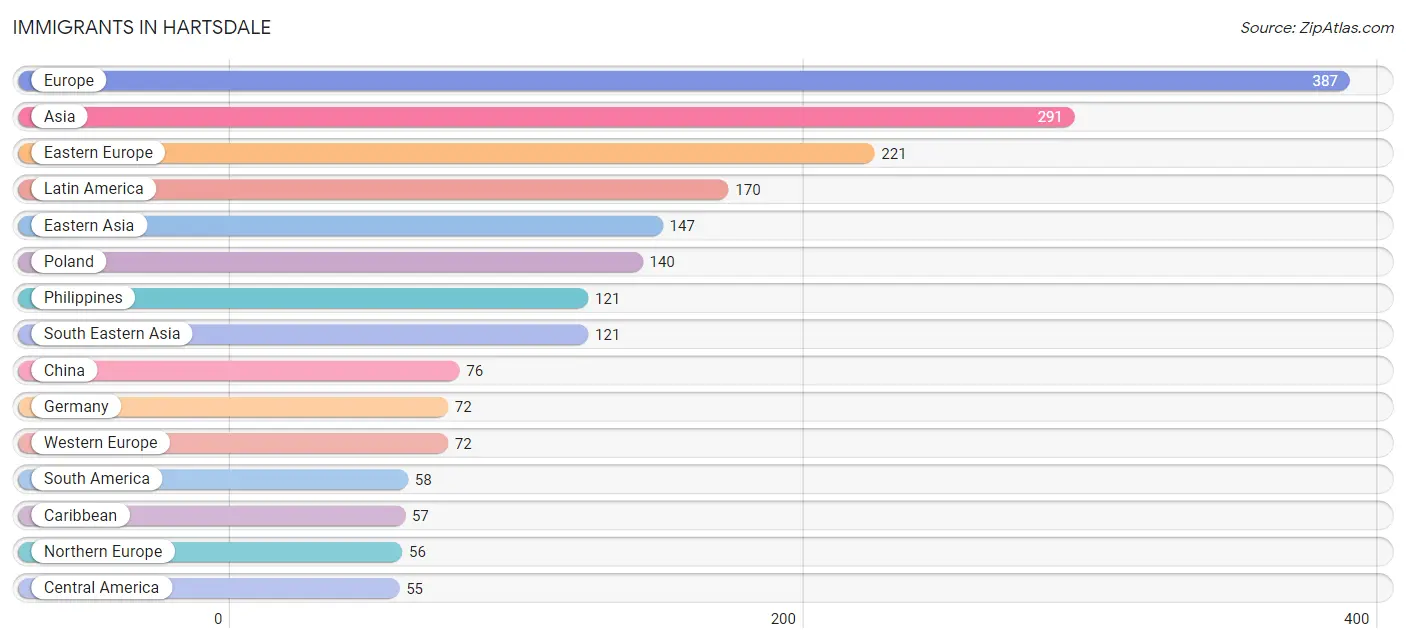
Immigrants in Hartsdale
The most numerous immigrant groups reported in Hartsdale came from Europe (387 | 12.6%), Asia (291 | 9.4%), Eastern Europe (221 | 7.2%), Latin America (170 | 5.5%), and Eastern Asia (147 | 4.8%), together accounting for 39.5% of all Hartsdale residents.
| Immigration Origin | # Population | % Population |
| Africa | 44 | 1.4% |
| Albania | 5 | 0.2% |
| Asia | 291 | 9.4% |
| Bulgaria | 10 | 0.3% |
| Canada | 24 | 0.8% |
| Caribbean | 57 | 1.8% |
| Central America | 55 | 1.8% |
| China | 76 | 2.5% |
| Colombia | 2 | 0.1% |
| Cuba | 11 | 0.4% |
| Czechoslovakia | 7 | 0.2% |
| Dominican Republic | 46 | 1.5% |
| Eastern Africa | 25 | 0.8% |
| Eastern Asia | 147 | 4.8% |
| Eastern Europe | 221 | 7.2% |
| Ecuador | 13 | 0.4% |
| Europe | 387 | 12.6% |
| Germany | 72 | 2.3% |
| Greece | 31 | 1.0% |
| Guyana | 20 | 0.6% |
| Hong Kong | 27 | 0.9% |
| India | 23 | 0.7% |
| Ireland | 19 | 0.6% |
| Italy | 7 | 0.2% |
| Japan | 27 | 0.9% |
| Kenya | 11 | 0.4% |
| Korea | 44 | 1.4% |
| Latin America | 170 | 5.5% |
| Mexico | 55 | 1.8% |
| Northern Europe | 56 | 1.8% |
| Peru | 13 | 0.4% |
| Philippines | 121 | 3.9% |
| Poland | 140 | 4.5% |
| Scotland | 9 | 0.3% |
| South Africa | 19 | 0.6% |
| South America | 58 | 1.9% |
| South Central Asia | 23 | 0.7% |
| South Eastern Asia | 121 | 3.9% |
| Southern Europe | 38 | 1.2% |
| Taiwan | 7 | 0.2% |
| Ukraine | 33 | 1.1% |
| Venezuela | 10 | 0.3% |
| Western Europe | 72 | 2.3% | View All 43 Rows |
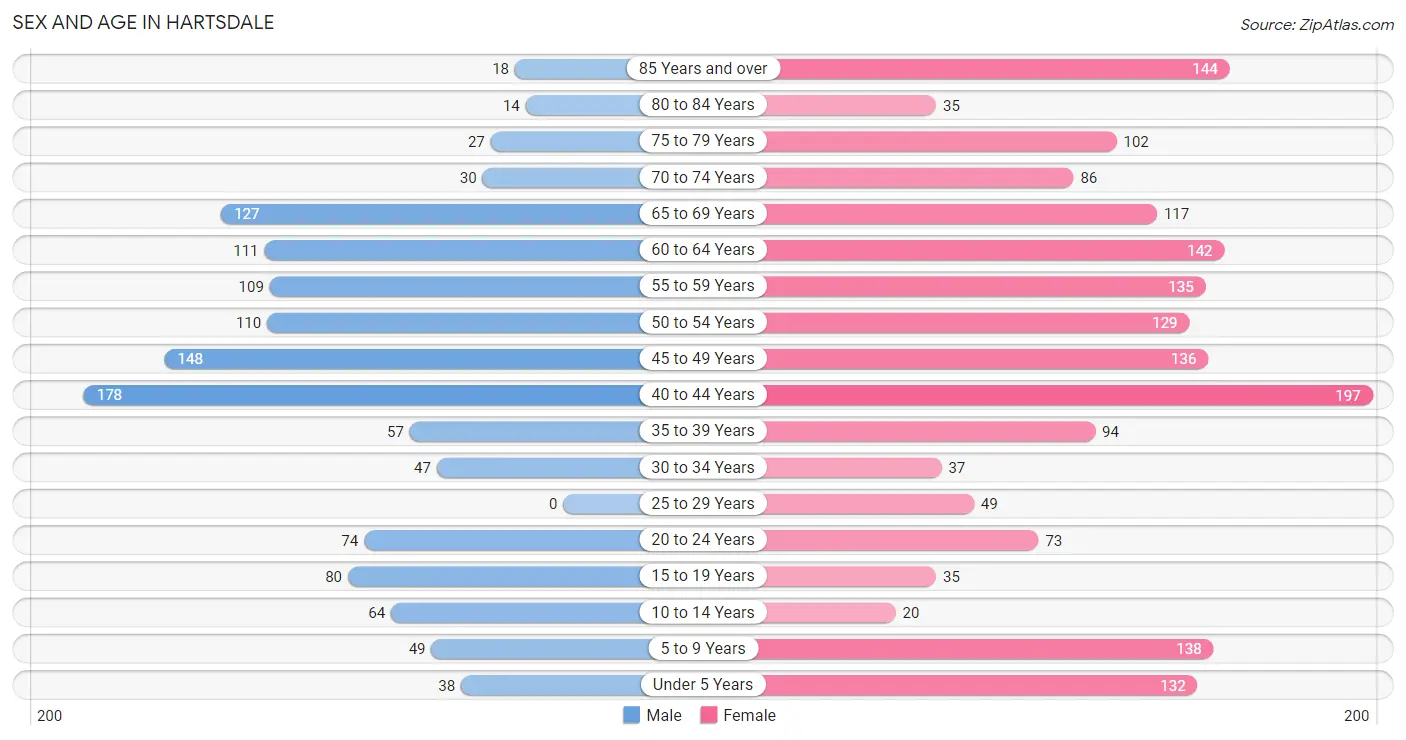
Sex and Age in Hartsdale
Sex and Age in Hartsdale
The most populous age groups in Hartsdale are 40 to 44 Years (178 | 13.9%) for men and 40 to 44 Years (197 | 10.9%) for women.
| Age Bracket | Male | Female |
| Under 5 Years | 38 (3.0%) | 132 (7.3%) |
| 5 to 9 Years | 49 (3.8%) | 138 (7.7%) |
| 10 to 14 Years | 64 (5.0%) | 20 (1.1%) |
| 15 to 19 Years | 80 (6.2%) | 35 (1.9%) |
| 20 to 24 Years | 74 (5.8%) | 73 (4.1%) |
| 25 to 29 Years | 0 (0.0%) | 49 (2.7%) |
| 30 to 34 Years | 47 (3.7%) | 37 (2.1%) |
| 35 to 39 Years | 57 (4.4%) | 94 (5.2%) |
| 40 to 44 Years | 178 (13.9%) | 197 (10.9%) |
| 45 to 49 Years | 148 (11.6%) | 136 (7.5%) |
| 50 to 54 Years | 110 (8.6%) | 129 (7.2%) |
| 55 to 59 Years | 109 (8.5%) | 135 (7.5%) |
| 60 to 64 Years | 111 (8.7%) | 142 (7.9%) |
| 65 to 69 Years | 127 (9.9%) | 117 (6.5%) |
| 70 to 74 Years | 30 (2.3%) | 86 (4.8%) |
| 75 to 79 Years | 27 (2.1%) | 102 (5.7%) |
| 80 to 84 Years | 14 (1.1%) | 35 (1.9%) |
| 85 Years and over | 18 (1.4%) | 144 (8.0%) |
| Total | 1,281 (100.0%) | 1,801 (100.0%) |
Families and Households in Hartsdale
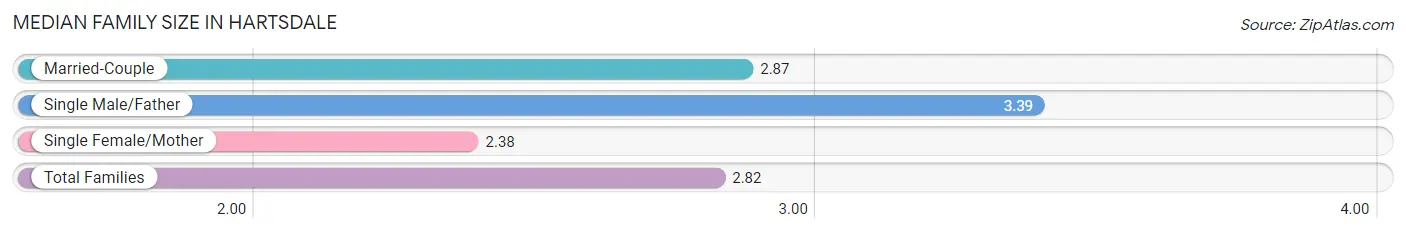
Median Family Size in Hartsdale
The median family size in Hartsdale is 2.82 persons per family, with single male/father families (44 | 5.1%) accounting for the largest median family size of 3.39 persons per family. On the other hand, single female/mother families (135 | 15.7%) represent the smallest median family size with 2.38 persons per family.
| Family Type | # Families | Family Size |
| Married-Couple | 679 (79.1%) | 2.87 |
| Single Male/Father | 44 (5.1%) | 3.39 |
| Single Female/Mother | 135 (15.7%) | 2.38 |
| Total Families | 858 (100.0%) | 2.82 |
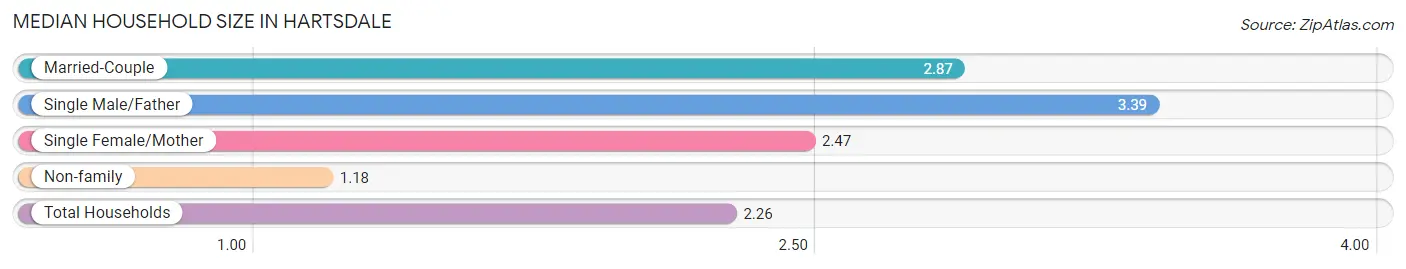
Median Household Size in Hartsdale
The median household size in Hartsdale is 2.26 persons per household, with single male/father households (44 | 3.3%) accounting for the largest median household size of 3.39 persons per household. non-family households (459 | 34.8%) represent the smallest median household size with 1.18 persons per household.
| Household Type | # Households | Household Size |
| Married-Couple | 679 (51.6%) | 2.87 |
| Single Male/Father | 44 (3.3%) | 3.39 |
| Single Female/Mother | 135 (10.2%) | 2.47 |
| Non-family | 459 (34.8%) | 1.18 |
| Total Households | 1,317 (100.0%) | 2.26 |
Household Size by Marriage Status in Hartsdale
Out of a total of 1,317 households in Hartsdale, 858 (65.1%) are family households, while 459 (34.8%) are nonfamily households. The most numerous type of family households are 2-person households, comprising 380, and the most common type of nonfamily households are 1-person households, comprising 393.
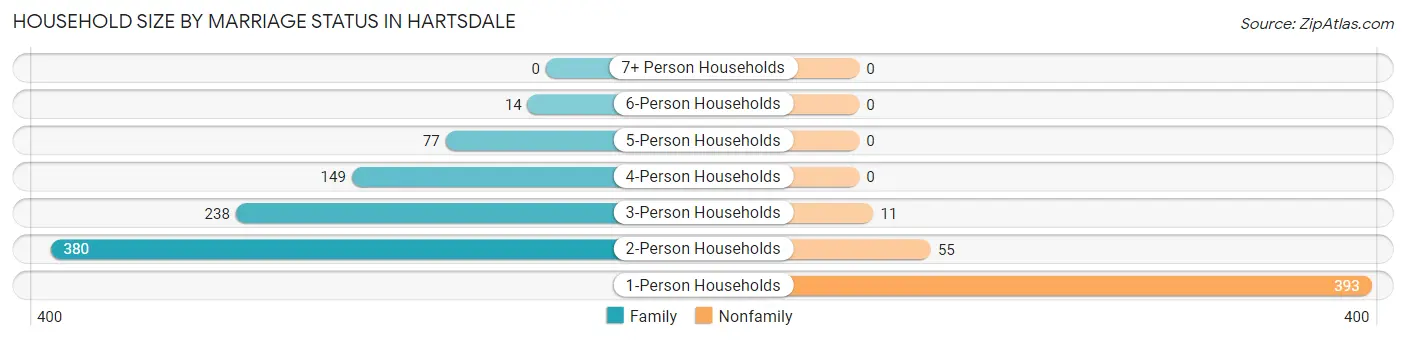
| Household Size | Family Households | Nonfamily Households |
| 1-Person Households | - | 393 (29.8%) |
| 2-Person Households | 380 (28.8%) | 55 (4.2%) |
| 3-Person Households | 238 (18.1%) | 11 (0.8%) |
| 4-Person Households | 149 (11.3%) | 0 (0.0%) |
| 5-Person Households | 77 (5.9%) | 0 (0.0%) |
| 6-Person Households | 14 (1.1%) | 0 (0.0%) |
| 7+ Person Households | 0 (0.0%) | 0 (0.0%) |
| Total | 858 (65.1%) | 459 (34.8%) |
Female Fertility in Hartsdale
Fertility by Age in Hartsdale
Average fertility rate in Hartsdale is 27.0 births per 1,000 women. Women in the age bracket of 35 to 50 years have the highest fertility rate with 39.0 births per 1,000 women. Women in the age bracket of 35 to 50 years acount for 100.0% of all women with births.
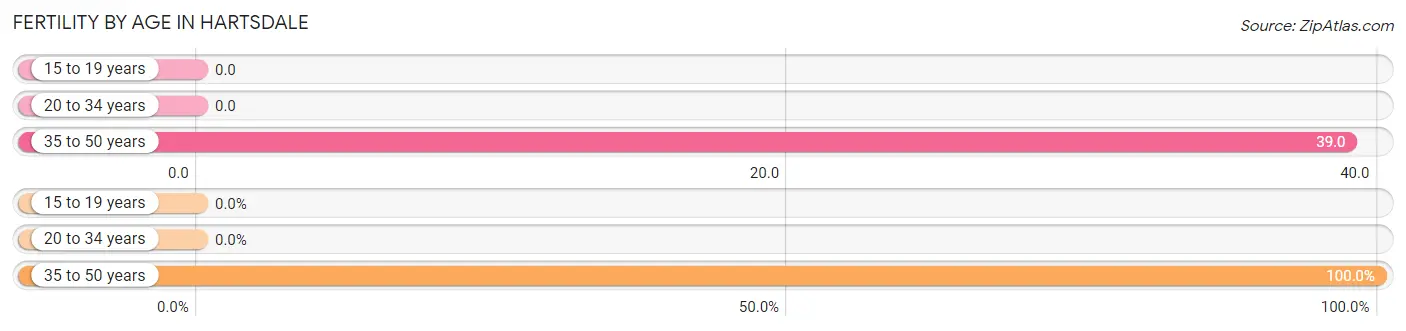
| Age Bracket | Women with Births | Births / 1,000 Women |
| 15 to 19 years | 0 (0.0%) | 0.0 |
| 20 to 34 years | 0 (0.0%) | 0.0 |
| 35 to 50 years | 17 (100.0%) | 39.0 |
| Total | 17 (100.0%) | 27.0 |
Fertility by Age by Marriage Status in Hartsdale
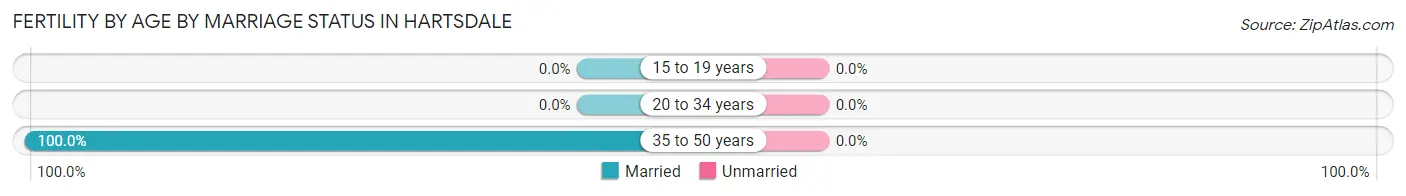
| Age Bracket | Married | Unmarried |
| 15 to 19 years | 0 (0.0%) | 0 (0.0%) |
| 20 to 34 years | 0 (0.0%) | 0 (0.0%) |
| 35 to 50 years | 17 (100.0%) | 0 (0.0%) |
| Total | 17 (100.0%) | 0 (0.0%) |
Fertility by Education in Hartsdale
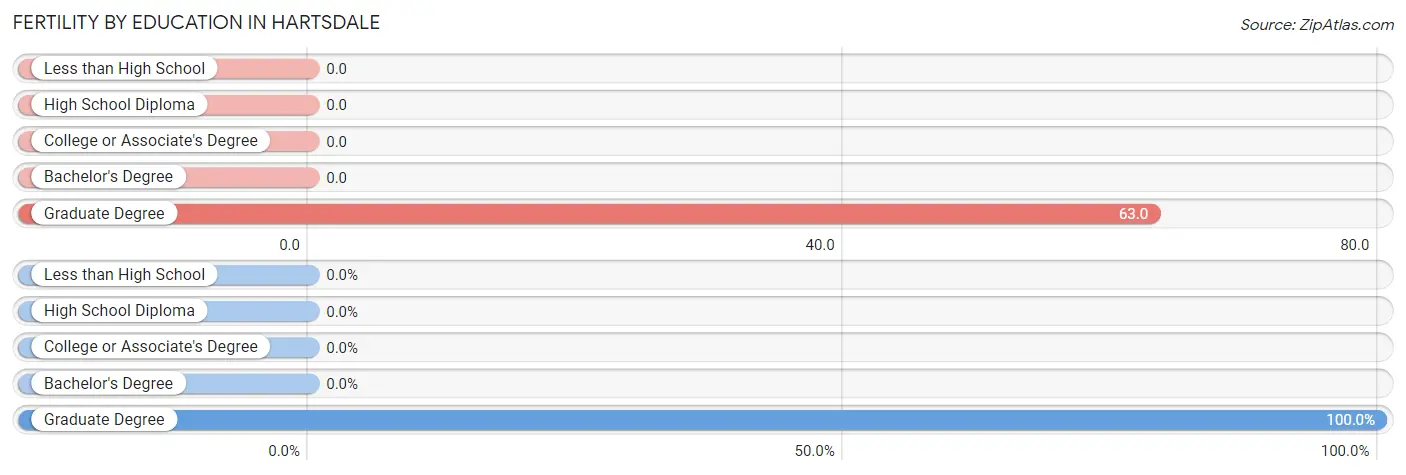
| Educational Attainment | Women with Births | Births / 1,000 Women |
| Less than High School | 0 (0.0%) | 0.0 |
| High School Diploma | 0 (0.0%) | 0.0 |
| College or Associate's Degree | 0 (0.0%) | 0.0 |
| Bachelor's Degree | 0 (0.0%) | 0.0 |
| Graduate Degree | 17 (100.0%) | 63.0 |
| Total | 17 (100.0%) | 27.0 |
Fertility by Education by Marriage Status in Hartsdale
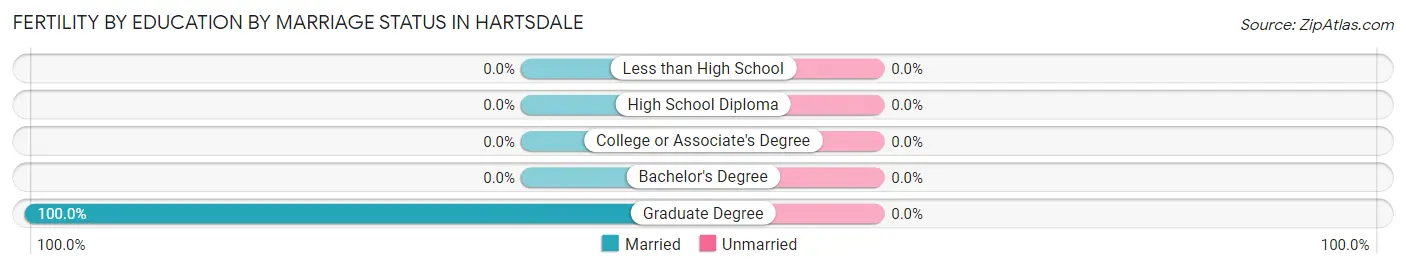
| Educational Attainment | Married | Unmarried |
| Less than High School | 0 (0.0%) | 0 (0.0%) |
| High School Diploma | 0 (0.0%) | 0 (0.0%) |
| College or Associate's Degree | 0 (0.0%) | 0 (0.0%) |
| Bachelor's Degree | 0 (0.0%) | 0 (0.0%) |
| Graduate Degree | 17 (100.0%) | 0 (0.0%) |
| Total | 17 (100.0%) | 0 (0.0%) |
Employment Characteristics in Hartsdale
Employment by Class of Employer in Hartsdale
Among the 1,724 employed individuals in Hartsdale, private company employees (986 | 57.2%), not-for-profit organizations (315 | 18.3%), and local government employees (194 | 11.3%) make up the most common classes of employment.
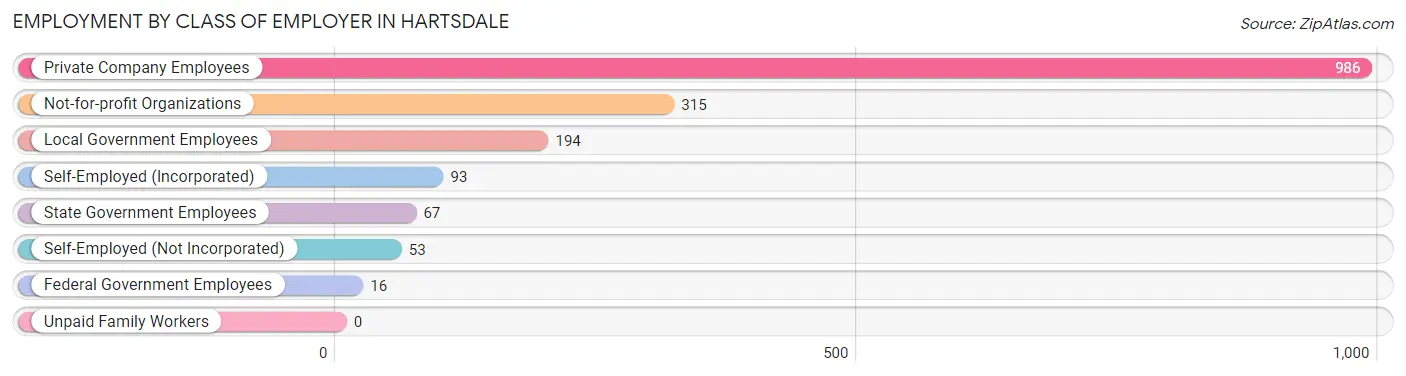
| Employer Class | # Employees | % Employees |
| Private Company Employees | 986 | 57.2% |
| Self-Employed (Incorporated) | 93 | 5.4% |
| Self-Employed (Not Incorporated) | 53 | 3.1% |
| Not-for-profit Organizations | 315 | 18.3% |
| Local Government Employees | 194 | 11.3% |
| State Government Employees | 67 | 3.9% |
| Federal Government Employees | 16 | 0.9% |
| Unpaid Family Workers | 0 | 0.0% |
| Total | 1,724 | 100.0% |
Employment Status by Age in Hartsdale
According to the labor force statistics for Hartsdale, out of the total population over 16 years of age (2,641), 67.5% or 1,783 individuals are in the labor force, with 1.6% or 29 of them unemployed. The age group with the highest labor force participation rate is 35 to 44 years, with 93.7% or 493 individuals in the labor force. Within the labor force, the 55 to 59 years age range has the highest percentage of unemployed individuals, with 8.5% or 17 of them being unemployed.
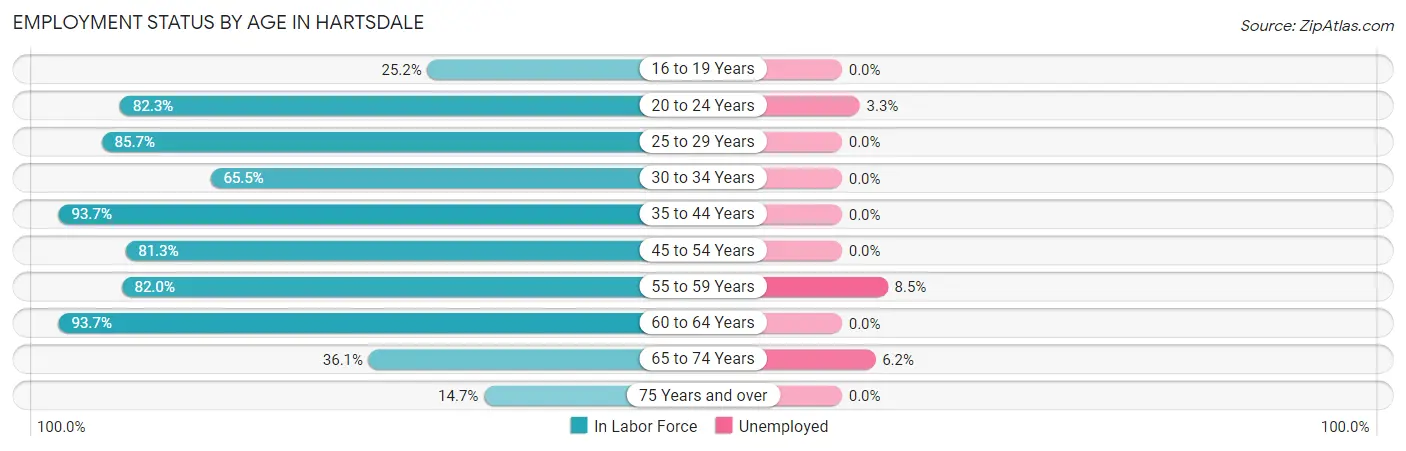
| Age Bracket | In Labor Force | Unemployed |
| 16 to 19 Years | 29 (25.2%) | 0 (0.0%) |
| 20 to 24 Years | 121 (82.3%) | 4 (3.3%) |
| 25 to 29 Years | 42 (85.7%) | 0 (0.0%) |
| 30 to 34 Years | 55 (65.5%) | 0 (0.0%) |
| 35 to 44 Years | 493 (93.7%) | 0 (0.0%) |
| 45 to 54 Years | 425 (81.3%) | 0 (0.0%) |
| 55 to 59 Years | 200 (82.0%) | 17 (8.5%) |
| 60 to 64 Years | 237 (93.7%) | 0 (0.0%) |
| 65 to 74 Years | 130 (36.1%) | 8 (6.2%) |
| 75 Years and over | 50 (14.7%) | 0 (0.0%) |
| Total | 1,783 (67.5%) | 29 (1.6%) |
Employment Status by Educational Attainment in Hartsdale
According to labor force statistics for Hartsdale, 86.5% of individuals (1,452) out of the total population between 25 and 64 years of age (1,679) are in the labor force, with 1.2% or 17 of them being unemployed. The group with the highest labor force participation rate are those with the educational attainment of less than high school, with 100.0% or 35 individuals in the labor force. Within the labor force, individuals with bachelor's degree or higher education have the highest percentage of unemployment, with 1.5% or 17 of them being unemployed.
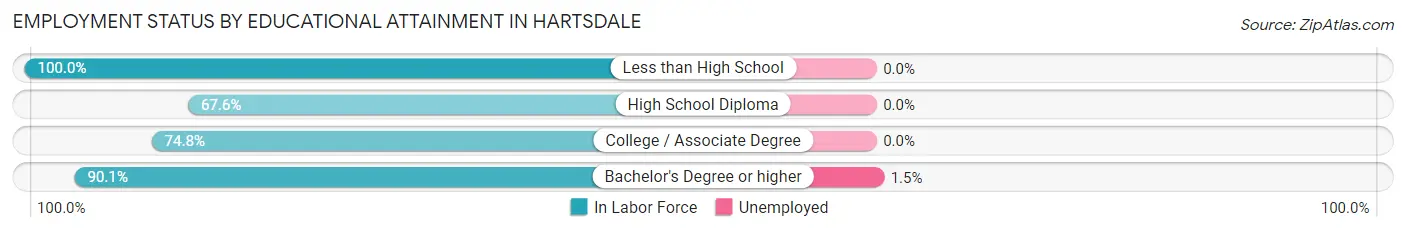
| Educational Attainment | In Labor Force | Unemployed |
| Less than High School | 35 (100.0%) | 0 (0.0%) |
| High School Diploma | 75 (67.6%) | 0 (0.0%) |
| College / Associate Degree | 190 (74.8%) | 0 (0.0%) |
| Bachelor's Degree or higher | 1,152 (90.1%) | 19 (1.5%) |
| Total | 1,452 (86.5%) | 20 (1.2%) |
Employment Occupations by Sex in Hartsdale
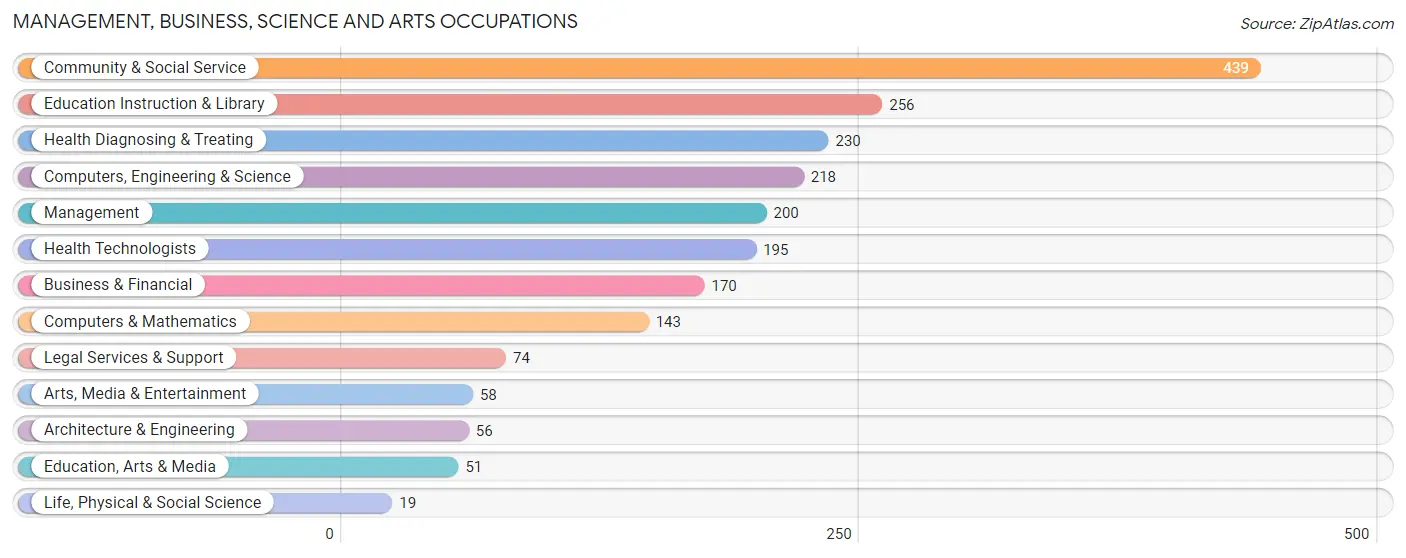
Management, Business, Science and Arts Occupations
The most common Management, Business, Science and Arts occupations in Hartsdale are Community & Social Service (439 | 25.0%), Education Instruction & Library (256 | 14.6%), Health Diagnosing & Treating (230 | 13.1%), Computers, Engineering & Science (218 | 12.4%), and Management (200 | 11.4%).
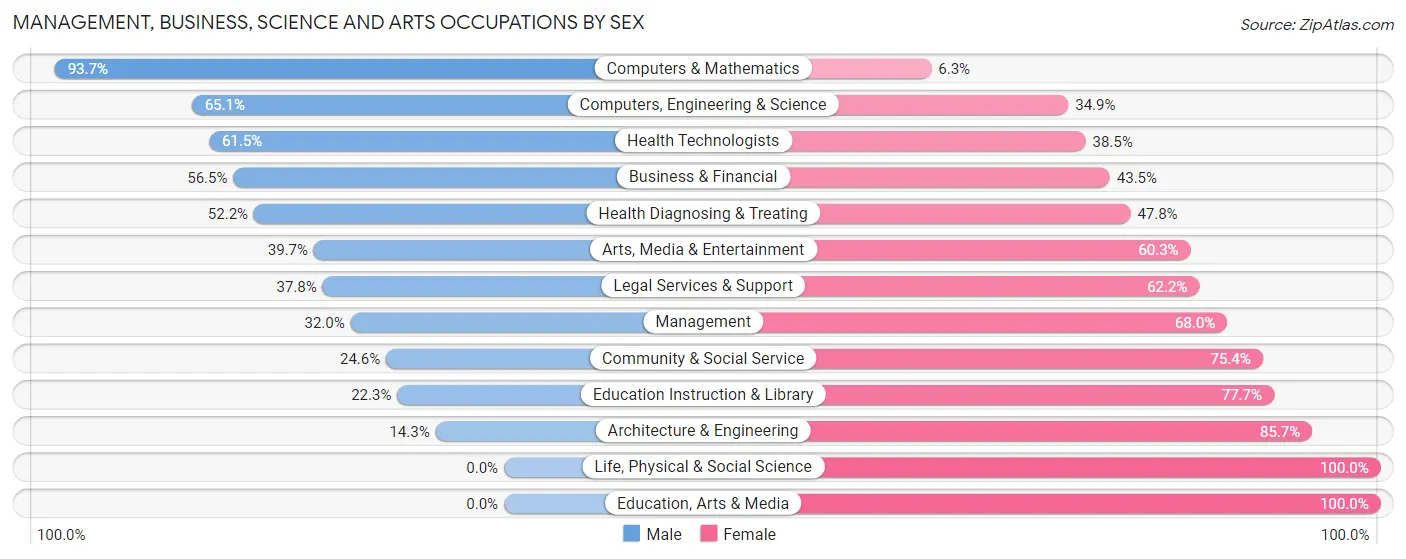
Management, Business, Science and Arts Occupations by Sex
Within the Management, Business, Science and Arts occupations in Hartsdale, the most male-oriented occupations are Computers & Mathematics (93.7%), Computers, Engineering & Science (65.1%), and Health Technologists (61.5%), while the most female-oriented occupations are Life, Physical & Social Science (100.0%), Education, Arts & Media (100.0%), and Architecture & Engineering (85.7%).
| Occupation | Male | Female |
| Management | 64 (32.0%) | 136 (68.0%) |
| Business & Financial | 96 (56.5%) | 74 (43.5%) |
| Computers, Engineering & Science | 142 (65.1%) | 76 (34.9%) |
| Computers & Mathematics | 134 (93.7%) | 9 (6.3%) |
| Architecture & Engineering | 8 (14.3%) | 48 (85.7%) |
| Life, Physical & Social Science | 0 (0.0%) | 19 (100.0%) |
| Community & Social Service | 108 (24.6%) | 331 (75.4%) |
| Education, Arts & Media | 0 (0.0%) | 51 (100.0%) |
| Legal Services & Support | 28 (37.8%) | 46 (62.2%) |
| Education Instruction & Library | 57 (22.3%) | 199 (77.7%) |
| Arts, Media & Entertainment | 23 (39.7%) | 35 (60.3%) |
| Health Diagnosing & Treating | 120 (52.2%) | 110 (47.8%) |
| Health Technologists | 120 (61.5%) | 75 (38.5%) |
| Total (Category) | 530 (42.2%) | 727 (57.8%) |
| Total (Overall) | 784 (44.7%) | 969 (55.3%) |
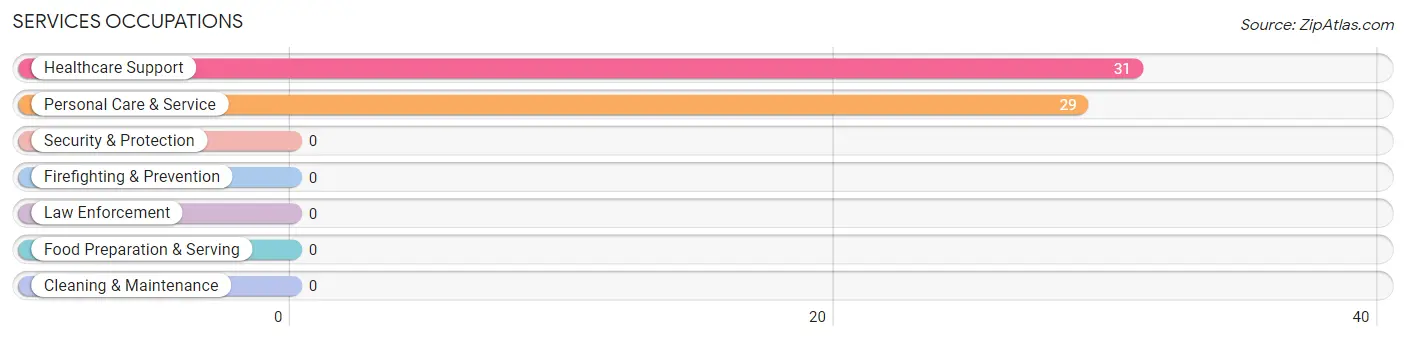
Services Occupations
The most common Services occupations in Hartsdale are Healthcare Support (31 | 1.8%), and Personal Care & Service (29 | 1.7%).
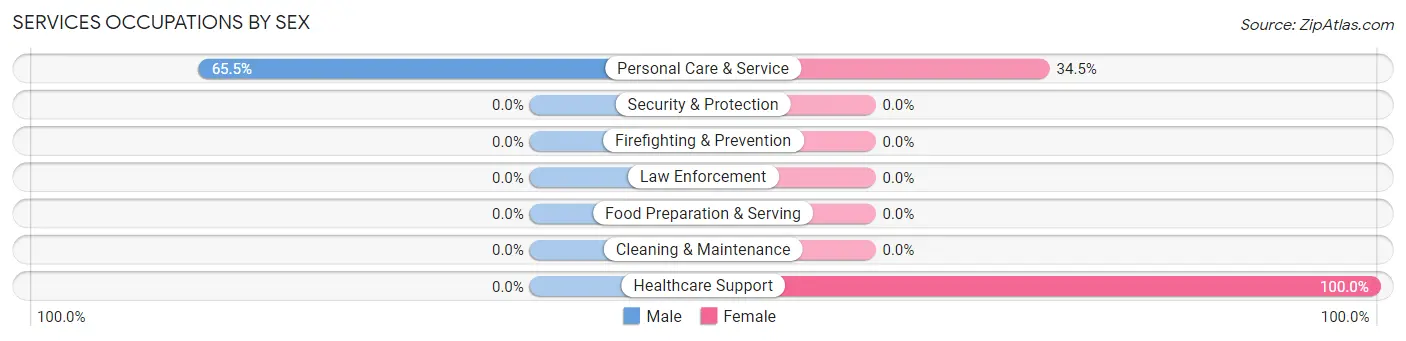
Services Occupations by Sex
| Occupation | Male | Female |
| Healthcare Support | 0 (0.0%) | 31 (100.0%) |
| Security & Protection | 0 (0.0%) | 0 (0.0%) |
| Firefighting & Prevention | 0 (0.0%) | 0 (0.0%) |
| Law Enforcement | 0 (0.0%) | 0 (0.0%) |
| Food Preparation & Serving | 0 (0.0%) | 0 (0.0%) |
| Cleaning & Maintenance | 0 (0.0%) | 0 (0.0%) |
| Personal Care & Service | 19 (65.5%) | 10 (34.5%) |
| Total (Category) | 19 (31.7%) | 41 (68.3%) |
| Total (Overall) | 784 (44.7%) | 969 (55.3%) |
Sales and Office Occupations
The most common Sales and Office occupations in Hartsdale are Office & Administration (222 | 12.7%), and Sales & Related (106 | 6.0%).
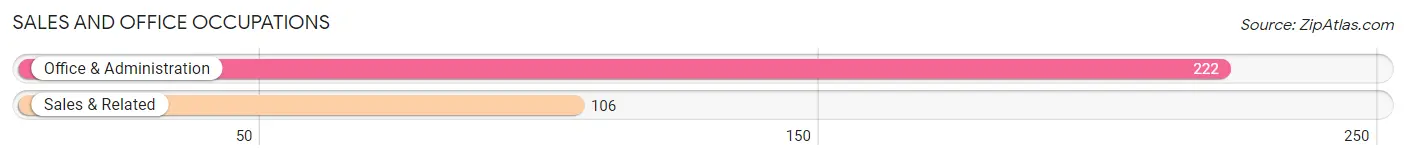
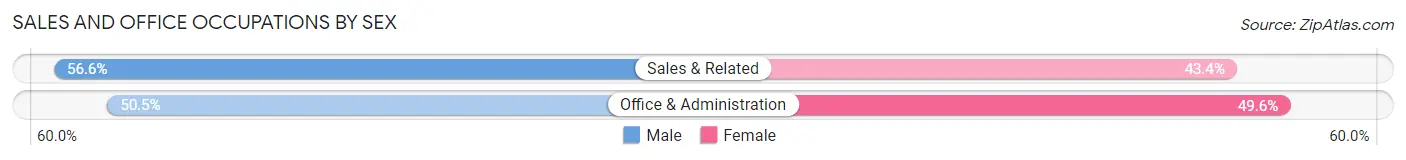
Sales and Office Occupations by Sex
| Occupation | Male | Female |
| Sales & Related | 60 (56.6%) | 46 (43.4%) |
| Office & Administration | 112 (50.4%) | 110 (49.5%) |
| Total (Category) | 172 (52.4%) | 156 (47.6%) |
| Total (Overall) | 784 (44.7%) | 969 (55.3%) |
Natural Resources, Construction and Maintenance Occupations
The most common Natural Resources, Construction and Maintenance occupations in Hartsdale are , and Installation, Maintenance & Repair (34 | 1.9%).
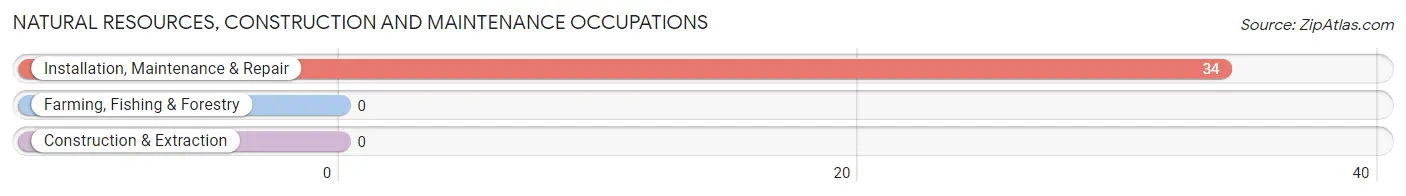
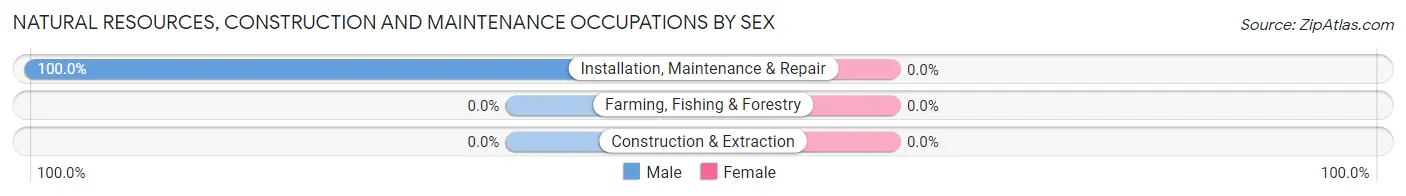
Natural Resources, Construction and Maintenance Occupations by Sex
| Occupation | Male | Female |
| Farming, Fishing & Forestry | 0 (0.0%) | 0 (0.0%) |
| Construction & Extraction | 0 (0.0%) | 0 (0.0%) |
| Installation, Maintenance & Repair | 34 (100.0%) | 0 (0.0%) |
| Total (Category) | 34 (100.0%) | 0 (0.0%) |
| Total (Overall) | 784 (44.7%) | 969 (55.3%) |
Production, Transportation and Moving Occupations
The most common Production, Transportation and Moving occupations in Hartsdale are Material Moving (56 | 3.2%), Transportation (13 | 0.7%), and Production (5 | 0.3%).
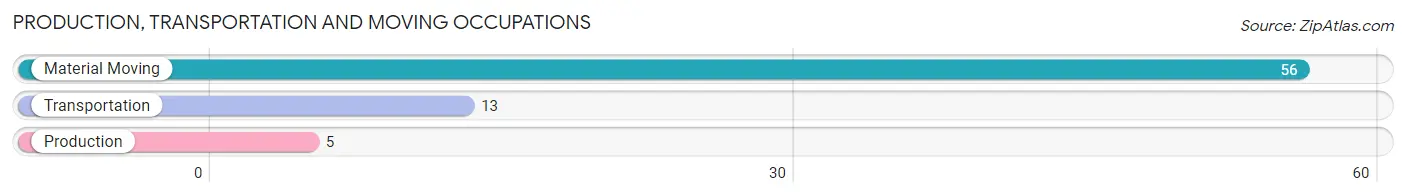
Production, Transportation and Moving Occupations by Sex
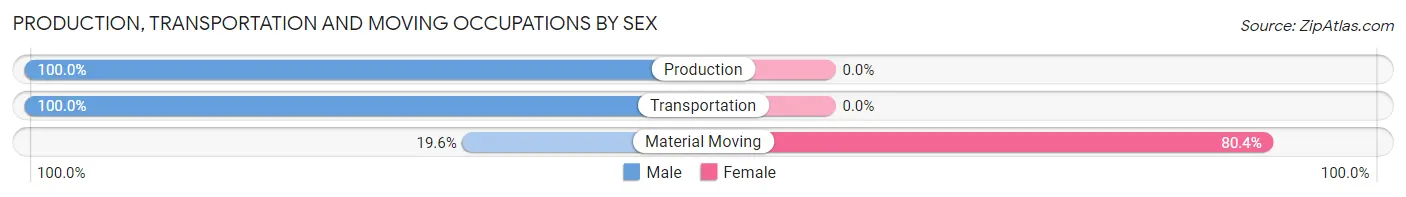
| Occupation | Male | Female |
| Production | 5 (100.0%) | 0 (0.0%) |
| Transportation | 13 (100.0%) | 0 (0.0%) |
| Material Moving | 11 (19.6%) | 45 (80.4%) |
| Total (Category) | 29 (39.2%) | 45 (60.8%) |
| Total (Overall) | 784 (44.7%) | 969 (55.3%) |
Employment Industries by Sex in Hartsdale
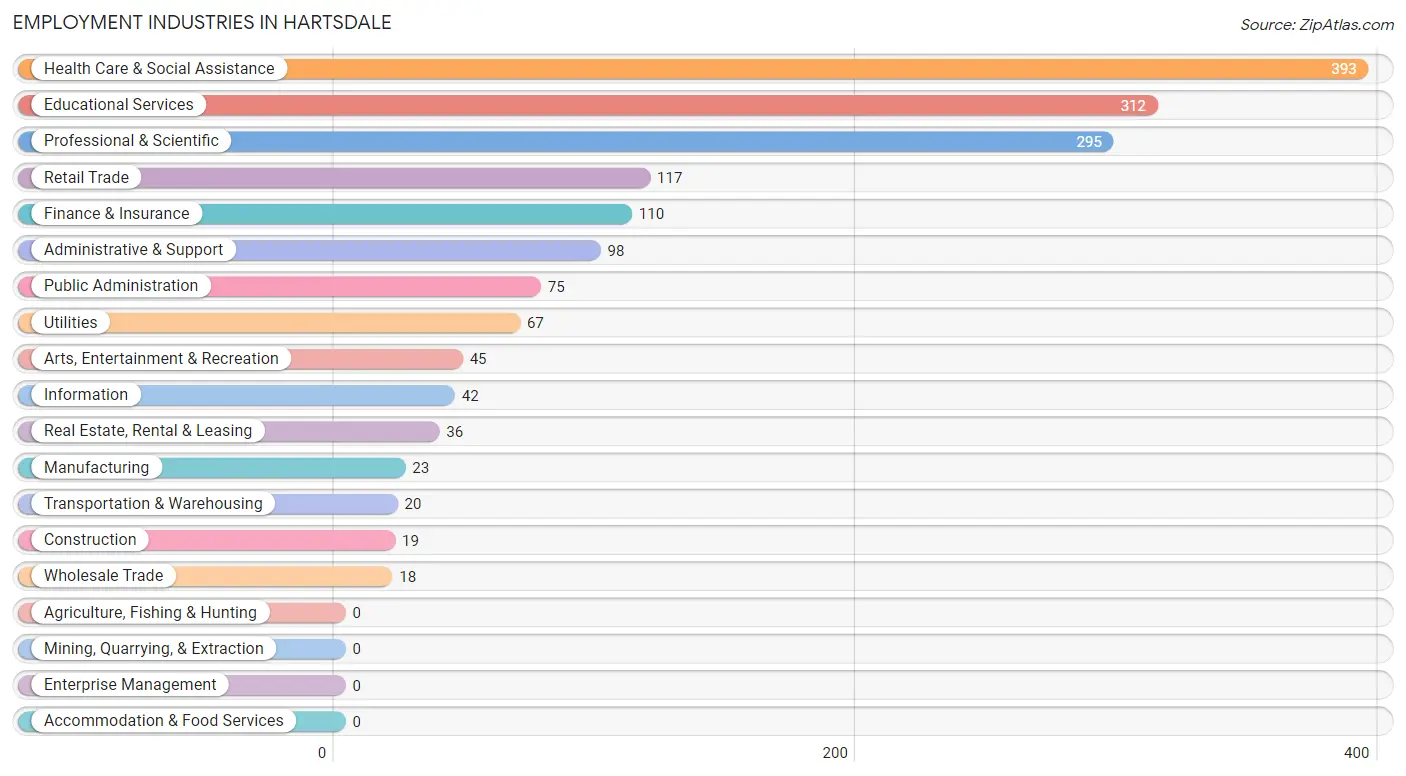
Employment Industries in Hartsdale
The major employment industries in Hartsdale include Health Care & Social Assistance (393 | 22.4%), Educational Services (312 | 17.8%), Professional & Scientific (295 | 16.8%), Retail Trade (117 | 6.7%), and Finance & Insurance (110 | 6.3%).
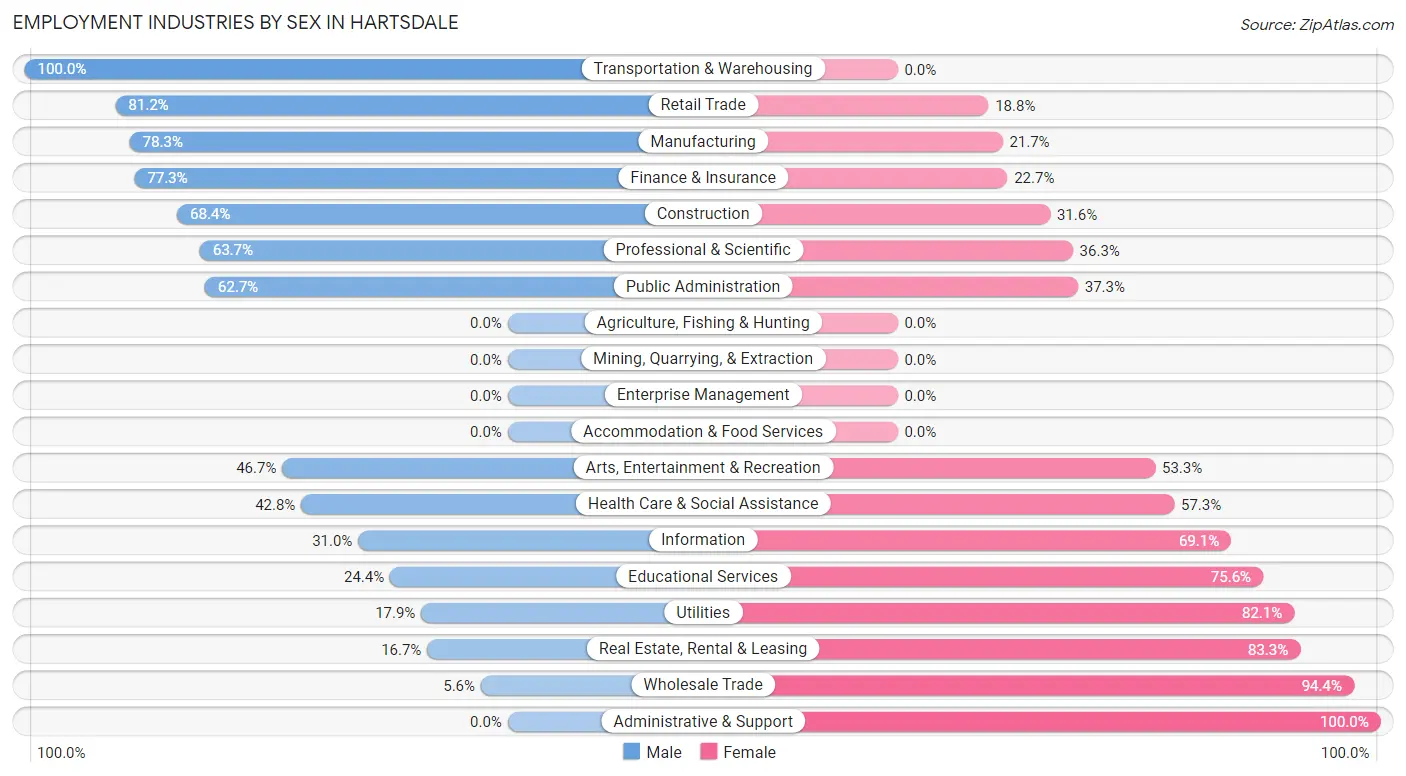
Employment Industries by Sex in Hartsdale
The Hartsdale industries that see more men than women are Transportation & Warehousing (100.0%), Retail Trade (81.2%), and Manufacturing (78.3%), whereas the industries that tend to have a higher number of women are Administrative & Support (100.0%), Wholesale Trade (94.4%), and Real Estate, Rental & Leasing (83.3%).
| Industry | Male | Female |
| Agriculture, Fishing & Hunting | 0 (0.0%) | 0 (0.0%) |
| Mining, Quarrying, & Extraction | 0 (0.0%) | 0 (0.0%) |
| Construction | 13 (68.4%) | 6 (31.6%) |
| Manufacturing | 18 (78.3%) | 5 (21.7%) |
| Wholesale Trade | 1 (5.6%) | 17 (94.4%) |
| Retail Trade | 95 (81.2%) | 22 (18.8%) |
| Transportation & Warehousing | 20 (100.0%) | 0 (0.0%) |
| Utilities | 12 (17.9%) | 55 (82.1%) |
| Information | 13 (30.9%) | 29 (69.1%) |
| Finance & Insurance | 85 (77.3%) | 25 (22.7%) |
| Real Estate, Rental & Leasing | 6 (16.7%) | 30 (83.3%) |
| Professional & Scientific | 188 (63.7%) | 107 (36.3%) |
| Enterprise Management | 0 (0.0%) | 0 (0.0%) |
| Administrative & Support | 0 (0.0%) | 98 (100.0%) |
| Educational Services | 76 (24.4%) | 236 (75.6%) |
| Health Care & Social Assistance | 168 (42.7%) | 225 (57.3%) |
| Arts, Entertainment & Recreation | 21 (46.7%) | 24 (53.3%) |
| Accommodation & Food Services | 0 (0.0%) | 0 (0.0%) |
| Public Administration | 47 (62.7%) | 28 (37.3%) |
| Total | 784 (44.7%) | 969 (55.3%) |
Education in Hartsdale
School Enrollment in Hartsdale
The most common levels of schooling among the 550 students in Hartsdale are nursery / preschool (120 | 21.8%), elementary school (118 | 21.4%), and middle school (84 | 15.3%).
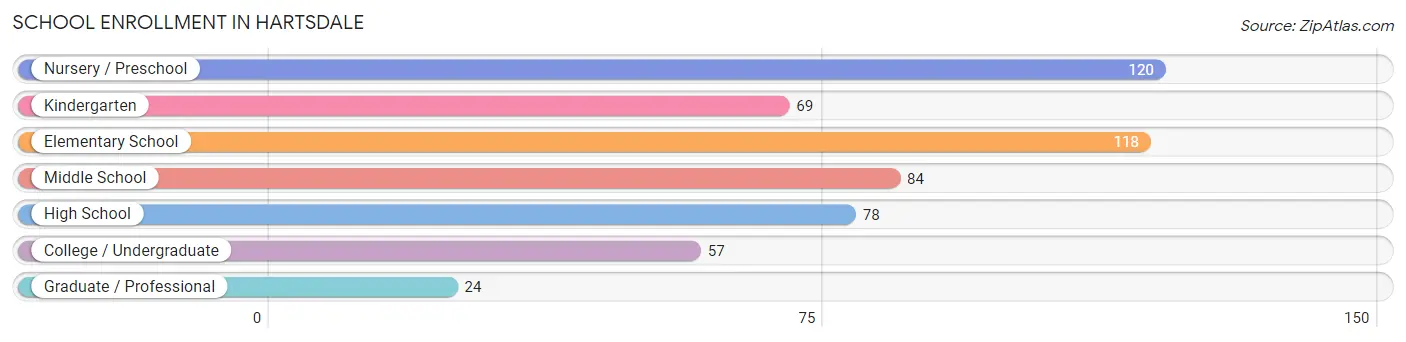
| School Level | # Students | % Students |
| Nursery / Preschool | 120 | 21.8% |
| Kindergarten | 69 | 12.6% |
| Elementary School | 118 | 21.4% |
| Middle School | 84 | 15.3% |
| High School | 78 | 14.2% |
| College / Undergraduate | 57 | 10.4% |
| Graduate / Professional | 24 | 4.4% |
| Total | 550 | 100.0% |
School Enrollment by Age by Funding Source in Hartsdale
Out of a total of 550 students who are enrolled in schools in Hartsdale, 375 (68.2%) attend a private institution, while the remaining 175 (31.8%) are enrolled in public schools. The age group of 25 to 34 year olds has the highest likelihood of being enrolled in private schools, with 10 (100.0% in the age bracket) enrolled. Conversely, the age group of 10 to 14 year olds has the lowest likelihood of being enrolled in a private school, with 58 (69.1% in the age bracket) attending a public institution.
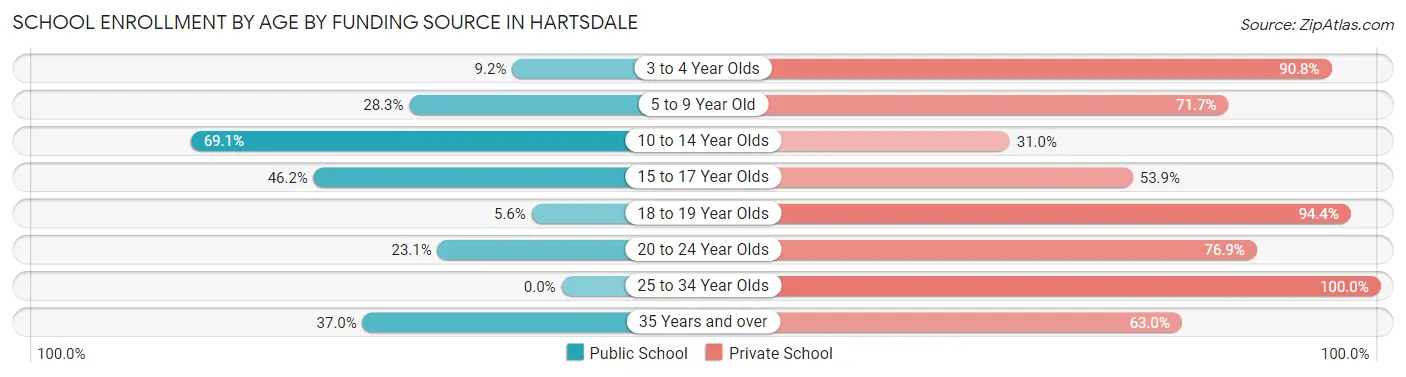
| Age Bracket | Public School | Private School |
| 3 to 4 Year Olds | 11 (9.2%) | 109 (90.8%) |
| 5 to 9 Year Old | 53 (28.3%) | 134 (71.7%) |
| 10 to 14 Year Olds | 58 (69.1%) | 26 (30.9%) |
| 15 to 17 Year Olds | 36 (46.2%) | 42 (53.8%) |
| 18 to 19 Year Olds | 1 (5.6%) | 17 (94.4%) |
| 20 to 24 Year Olds | 6 (23.1%) | 20 (76.9%) |
| 25 to 34 Year Olds | 0 (0.0%) | 10 (100.0%) |
| 35 Years and over | 10 (37.0%) | 17 (63.0%) |
| Total | 175 (31.8%) | 375 (68.2%) |
Educational Attainment by Field of Study in Hartsdale
Business (319 | 15.6%), social sciences (212 | 10.4%), science & technology (192 | 9.4%), psychology (190 | 9.3%), and engineering (186 | 9.1%) are the most common fields of study among 2,041 individuals in Hartsdale who have obtained a bachelor's degree or higher.
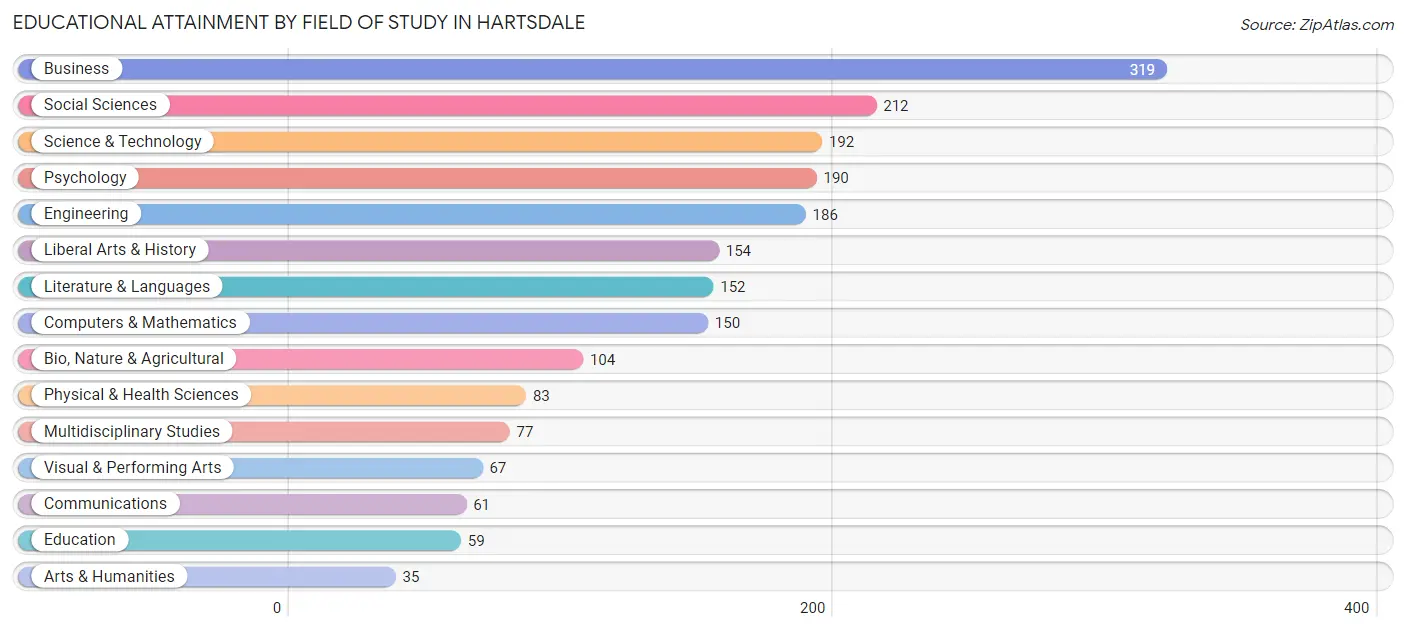
| Field of Study | # Graduates | % Graduates |
| Computers & Mathematics | 150 | 7.3% |
| Bio, Nature & Agricultural | 104 | 5.1% |
| Physical & Health Sciences | 83 | 4.1% |
| Psychology | 190 | 9.3% |
| Social Sciences | 212 | 10.4% |
| Engineering | 186 | 9.1% |
| Multidisciplinary Studies | 77 | 3.8% |
| Science & Technology | 192 | 9.4% |
| Business | 319 | 15.6% |
| Education | 59 | 2.9% |
| Literature & Languages | 152 | 7.4% |
| Liberal Arts & History | 154 | 7.5% |
| Visual & Performing Arts | 67 | 3.3% |
| Communications | 61 | 3.0% |
| Arts & Humanities | 35 | 1.7% |
| Total | 2,041 | 100.0% |
Transportation & Commute in Hartsdale
Vehicle Availability by Sex in Hartsdale
The most prevalent vehicle ownership categories in Hartsdale are males with 2 vehicles (333, accounting for 43.5%) and females with 2 vehicles (298, making up 34.7%).
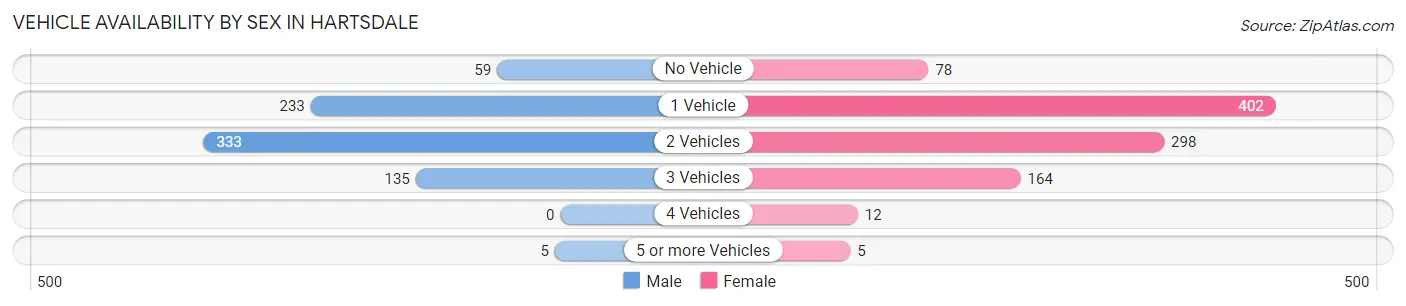
| Vehicles Available | Male | Female |
| No Vehicle | 59 (7.7%) | 78 (8.1%) |
| 1 Vehicle | 233 (30.5%) | 402 (41.9%) |
| 2 Vehicles | 333 (43.5%) | 298 (31.1%) |
| 3 Vehicles | 135 (17.6%) | 164 (17.1%) |
| 4 Vehicles | 0 (0.0%) | 12 (1.3%) |
| 5 or more Vehicles | 5 (0.6%) | 5 (0.5%) |
| Total | 765 (100.0%) | 959 (100.0%) |
Commute Time in Hartsdale
The most frequently occuring commute durations in Hartsdale are 60 to 89 minutes (400 commuters, 28.6%), 25 to 29 minutes (206 commuters, 14.7%), and 90 or more minutes (169 commuters, 12.1%).
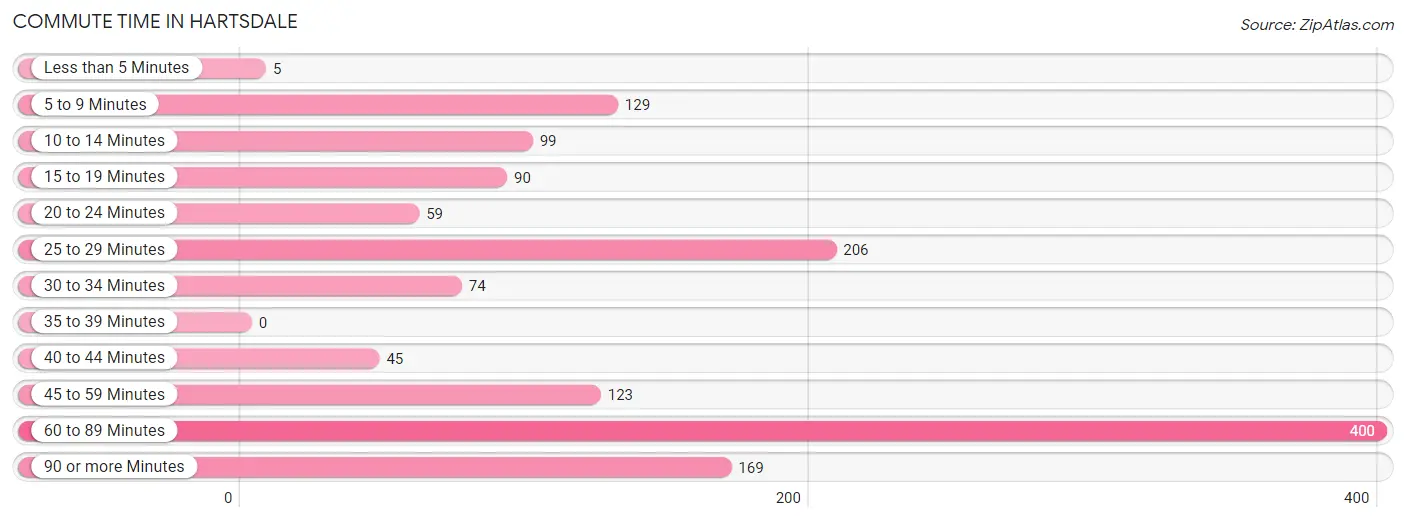
| Commute Time | # Commuters | % Commuters |
| Less than 5 Minutes | 5 | 0.4% |
| 5 to 9 Minutes | 129 | 9.2% |
| 10 to 14 Minutes | 99 | 7.1% |
| 15 to 19 Minutes | 90 | 6.4% |
| 20 to 24 Minutes | 59 | 4.2% |
| 25 to 29 Minutes | 206 | 14.7% |
| 30 to 34 Minutes | 74 | 5.3% |
| 35 to 39 Minutes | 0 | 0.0% |
| 40 to 44 Minutes | 45 | 3.2% |
| 45 to 59 Minutes | 123 | 8.8% |
| 60 to 89 Minutes | 400 | 28.6% |
| 90 or more Minutes | 169 | 12.1% |
Commute Time by Sex in Hartsdale
The most common commute times in Hartsdale are 60 to 89 minutes (199 commuters, 31.1%) for males and 60 to 89 minutes (201 commuters, 26.5%) for females.
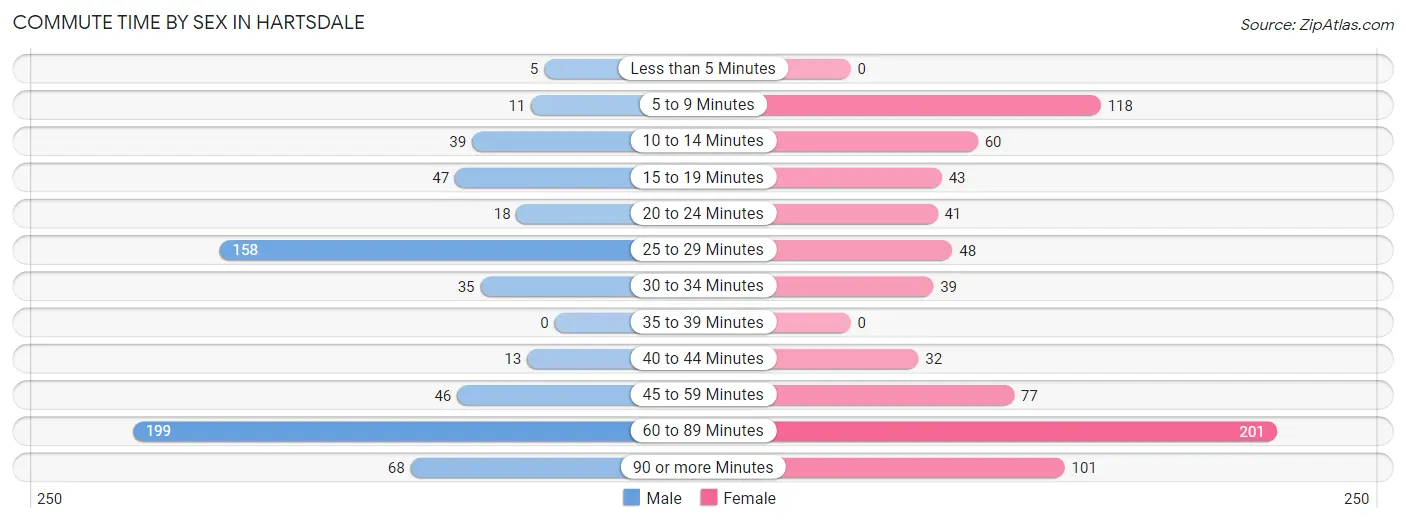
| Commute Time | Male | Female |
| Less than 5 Minutes | 5 (0.8%) | 0 (0.0%) |
| 5 to 9 Minutes | 11 (1.7%) | 118 (15.5%) |
| 10 to 14 Minutes | 39 (6.1%) | 60 (7.9%) |
| 15 to 19 Minutes | 47 (7.4%) | 43 (5.7%) |
| 20 to 24 Minutes | 18 (2.8%) | 41 (5.4%) |
| 25 to 29 Minutes | 158 (24.7%) | 48 (6.3%) |
| 30 to 34 Minutes | 35 (5.5%) | 39 (5.1%) |
| 35 to 39 Minutes | 0 (0.0%) | 0 (0.0%) |
| 40 to 44 Minutes | 13 (2.0%) | 32 (4.2%) |
| 45 to 59 Minutes | 46 (7.2%) | 77 (10.1%) |
| 60 to 89 Minutes | 199 (31.1%) | 201 (26.5%) |
| 90 or more Minutes | 68 (10.6%) | 101 (13.3%) |
Time of Departure to Work by Sex in Hartsdale
The most frequent times of departure to work in Hartsdale are 9:00 AM to 9:59 AM (117, 18.3%) for males and 7:30 AM to 7:59 AM (164, 21.6%) for females.
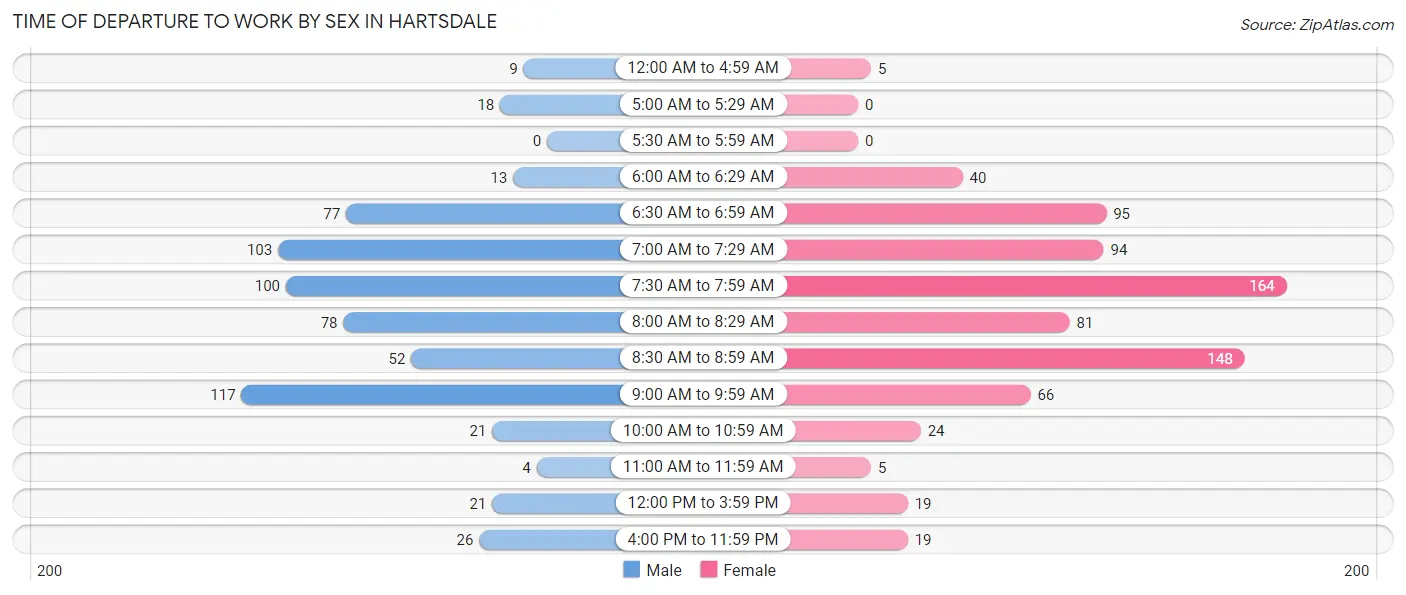
| Time of Departure | Male | Female |
| 12:00 AM to 4:59 AM | 9 (1.4%) | 5 (0.7%) |
| 5:00 AM to 5:29 AM | 18 (2.8%) | 0 (0.0%) |
| 5:30 AM to 5:59 AM | 0 (0.0%) | 0 (0.0%) |
| 6:00 AM to 6:29 AM | 13 (2.0%) | 40 (5.3%) |
| 6:30 AM to 6:59 AM | 77 (12.0%) | 95 (12.5%) |
| 7:00 AM to 7:29 AM | 103 (16.1%) | 94 (12.4%) |
| 7:30 AM to 7:59 AM | 100 (15.7%) | 164 (21.6%) |
| 8:00 AM to 8:29 AM | 78 (12.2%) | 81 (10.7%) |
| 8:30 AM to 8:59 AM | 52 (8.1%) | 148 (19.5%) |
| 9:00 AM to 9:59 AM | 117 (18.3%) | 66 (8.7%) |
| 10:00 AM to 10:59 AM | 21 (3.3%) | 24 (3.2%) |
| 11:00 AM to 11:59 AM | 4 (0.6%) | 5 (0.7%) |
| 12:00 PM to 3:59 PM | 21 (3.3%) | 19 (2.5%) |
| 4:00 PM to 11:59 PM | 26 (4.1%) | 19 (2.5%) |
| Total | 639 (100.0%) | 760 (100.0%) |
Housing Occupancy in Hartsdale
Occupancy by Ownership in Hartsdale
Of the total 1,317 dwellings in Hartsdale, owner-occupied units account for 1,149 (87.2%), while renter-occupied units make up 168 (12.8%).
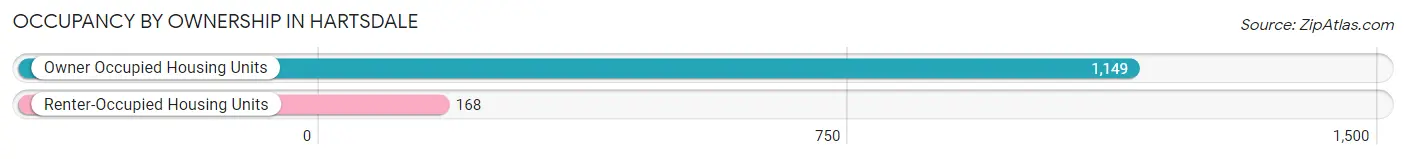
| Occupancy | # Housing Units | % Housing Units |
| Owner Occupied Housing Units | 1,149 | 87.2% |
| Renter-Occupied Housing Units | 168 | 12.8% |
| Total Occupied Housing Units | 1,317 | 100.0% |
Occupancy by Household Size in Hartsdale
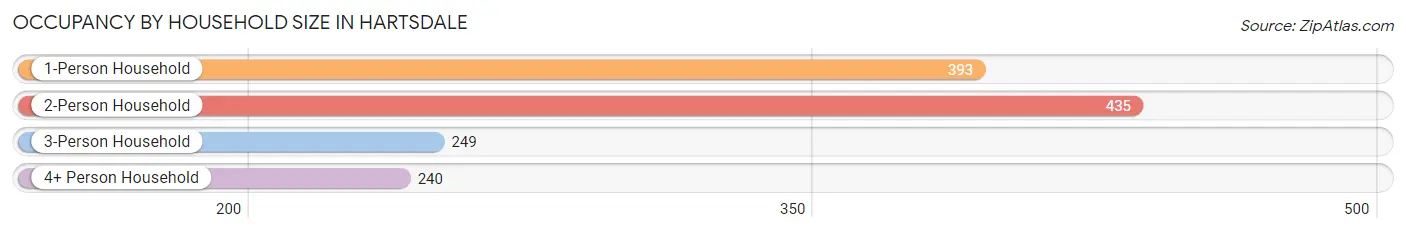
| Household Size | # Housing Units | % Housing Units |
| 1-Person Household | 393 | 29.8% |
| 2-Person Household | 435 | 33.0% |
| 3-Person Household | 249 | 18.9% |
| 4+ Person Household | 240 | 18.2% |
| Total Housing Units | 1,317 | 100.0% |
Occupancy by Ownership by Household Size in Hartsdale
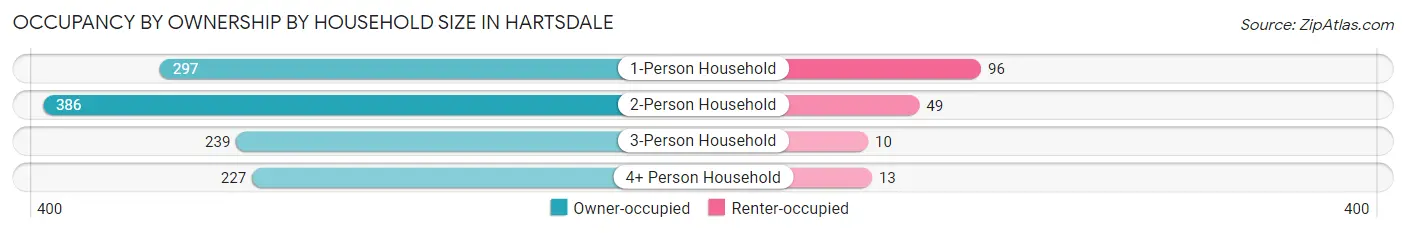
| Household Size | Owner-occupied | Renter-occupied |
| 1-Person Household | 297 (75.6%) | 96 (24.4%) |
| 2-Person Household | 386 (88.7%) | 49 (11.3%) |
| 3-Person Household | 239 (96.0%) | 10 (4.0%) |
| 4+ Person Household | 227 (94.6%) | 13 (5.4%) |
| Total Housing Units | 1,149 (87.2%) | 168 (12.8%) |
Occupancy by Educational Attainment in Hartsdale
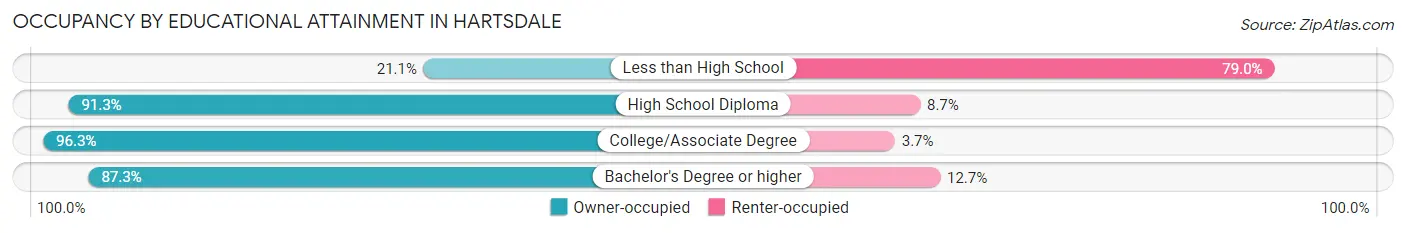
| Household Size | Owner-occupied | Renter-occupied |
| Less than High School | 8 (21.0%) | 30 (78.9%) |
| High School Diploma | 105 (91.3%) | 10 (8.7%) |
| College/Associate Degree | 209 (96.3%) | 8 (3.7%) |
| Bachelor's Degree or higher | 827 (87.3%) | 120 (12.7%) |
Occupancy by Age of Householder in Hartsdale
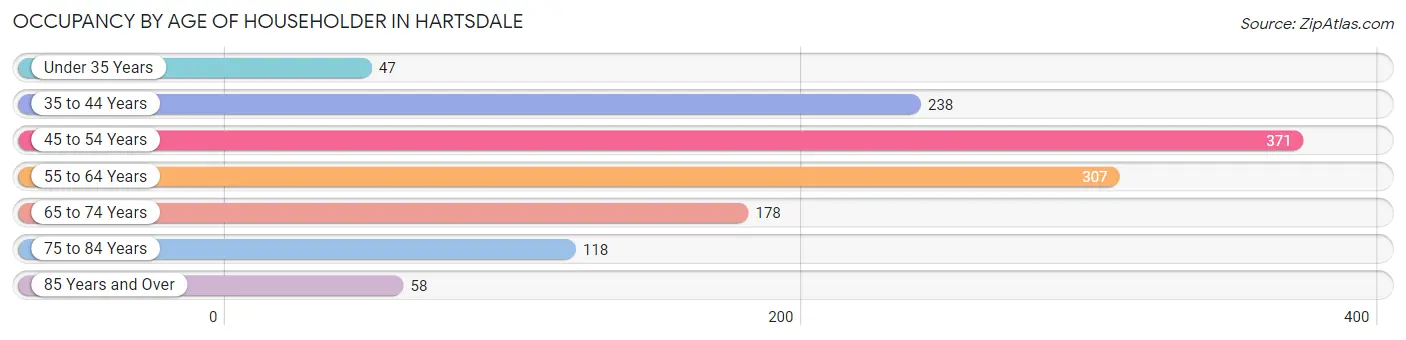
| Age Bracket | # Households | % Households |
| Under 35 Years | 47 | 3.6% |
| 35 to 44 Years | 238 | 18.1% |
| 45 to 54 Years | 371 | 28.2% |
| 55 to 64 Years | 307 | 23.3% |
| 65 to 74 Years | 178 | 13.5% |
| 75 to 84 Years | 118 | 9.0% |
| 85 Years and Over | 58 | 4.4% |
| Total | 1,317 | 100.0% |
Housing Finances in Hartsdale
Median Income by Occupancy in Hartsdale
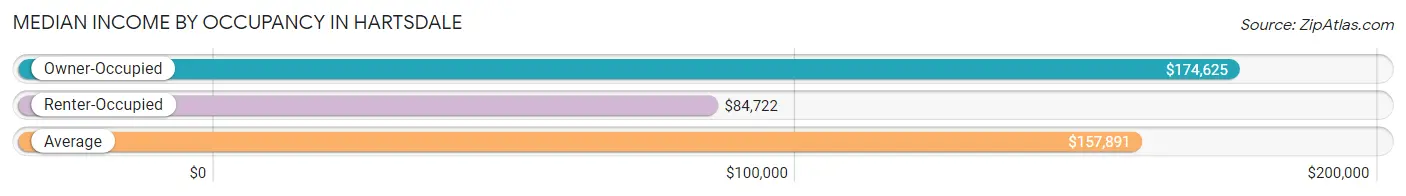
| Occupancy Type | # Households | Median Income |
| Owner-Occupied | 1,149 (87.2%) | $174,625 |
| Renter-Occupied | 168 (12.8%) | $84,722 |
| Average | 1,317 (100.0%) | $157,891 |
Occupancy by Householder Income Bracket in Hartsdale
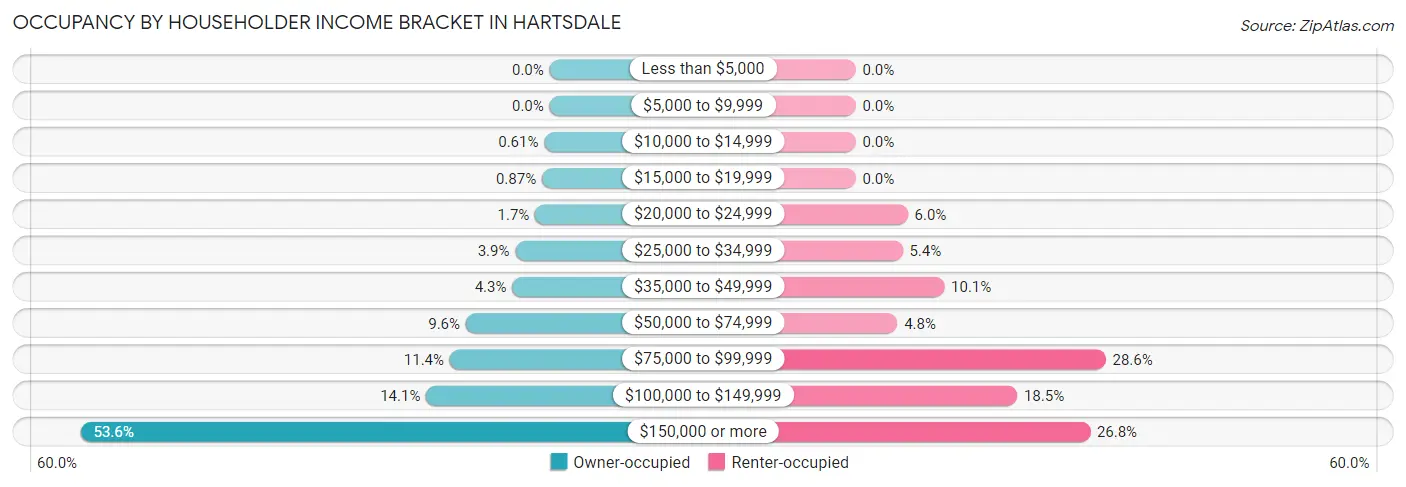
| Income Bracket | Owner-occupied | Renter-occupied |
| Less than $5,000 | 0 (0.0%) | 0 (0.0%) |
| $5,000 to $9,999 | 0 (0.0%) | 0 (0.0%) |
| $10,000 to $14,999 | 7 (0.6%) | 0 (0.0%) |
| $15,000 to $19,999 | 10 (0.9%) | 0 (0.0%) |
| $20,000 to $24,999 | 19 (1.7%) | 10 (5.9%) |
| $25,000 to $34,999 | 45 (3.9%) | 9 (5.4%) |
| $35,000 to $49,999 | 49 (4.3%) | 17 (10.1%) |
| $50,000 to $74,999 | 110 (9.6%) | 8 (4.8%) |
| $75,000 to $99,999 | 131 (11.4%) | 48 (28.6%) |
| $100,000 to $149,999 | 162 (14.1%) | 31 (18.4%) |
| $150,000 or more | 616 (53.6%) | 45 (26.8%) |
| Total | 1,149 (100.0%) | 168 (100.0%) |
Monthly Housing Cost Tiers in Hartsdale
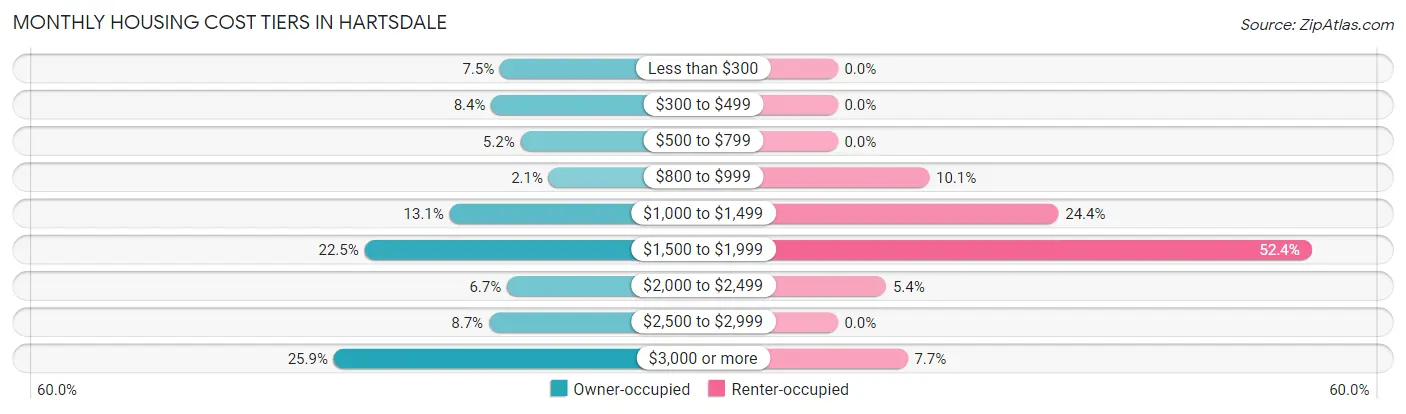
| Monthly Cost | Owner-occupied | Renter-occupied |
| Less than $300 | 86 (7.5%) | 0 (0.0%) |
| $300 to $499 | 97 (8.4%) | 0 (0.0%) |
| $500 to $799 | 60 (5.2%) | 0 (0.0%) |
| $800 to $999 | 24 (2.1%) | 17 (10.1%) |
| $1,000 to $1,499 | 150 (13.1%) | 41 (24.4%) |
| $1,500 to $1,999 | 258 (22.5%) | 88 (52.4%) |
| $2,000 to $2,499 | 77 (6.7%) | 9 (5.4%) |
| $2,500 to $2,999 | 100 (8.7%) | 0 (0.0%) |
| $3,000 or more | 297 (25.9%) | 13 (7.7%) |
| Total | 1,149 (100.0%) | 168 (100.0%) |
Physical Housing Characteristics in Hartsdale
Housing Structures in Hartsdale
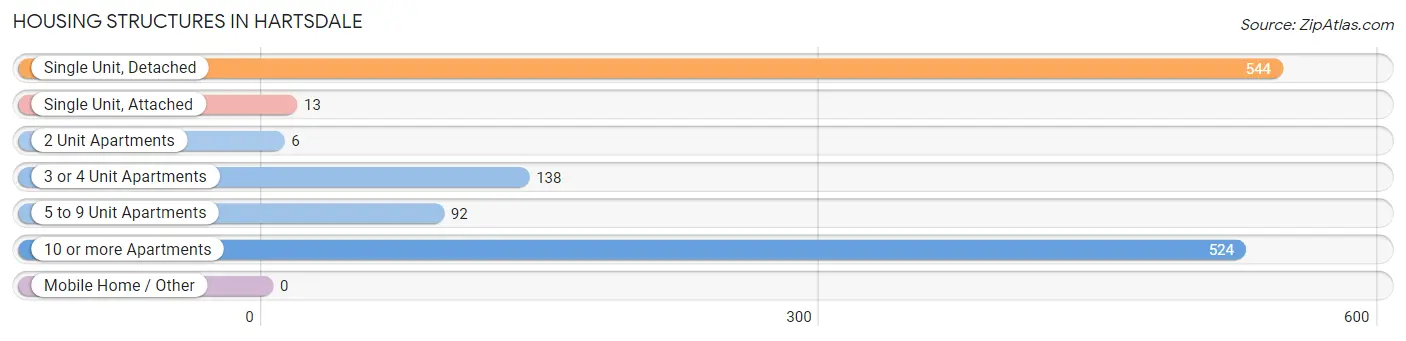
| Structure Type | # Housing Units | % Housing Units |
| Single Unit, Detached | 544 | 41.3% |
| Single Unit, Attached | 13 | 1.0% |
| 2 Unit Apartments | 6 | 0.5% |
| 3 or 4 Unit Apartments | 138 | 10.5% |
| 5 to 9 Unit Apartments | 92 | 7.0% |
| 10 or more Apartments | 524 | 39.8% |
| Mobile Home / Other | 0 | 0.0% |
| Total | 1,317 | 100.0% |
Housing Structures by Occupancy in Hartsdale
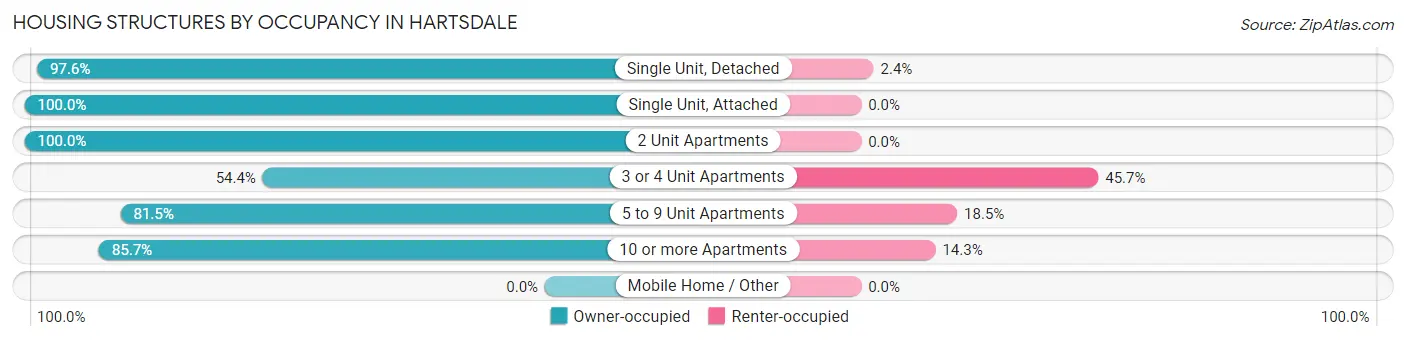
| Structure Type | Owner-occupied | Renter-occupied |
| Single Unit, Detached | 531 (97.6%) | 13 (2.4%) |
| Single Unit, Attached | 13 (100.0%) | 0 (0.0%) |
| 2 Unit Apartments | 6 (100.0%) | 0 (0.0%) |
| 3 or 4 Unit Apartments | 75 (54.3%) | 63 (45.7%) |
| 5 to 9 Unit Apartments | 75 (81.5%) | 17 (18.5%) |
| 10 or more Apartments | 449 (85.7%) | 75 (14.3%) |
| Mobile Home / Other | 0 (0.0%) | 0 (0.0%) |
| Total | 1,149 (87.2%) | 168 (12.8%) |
Housing Structures by Number of Rooms in Hartsdale
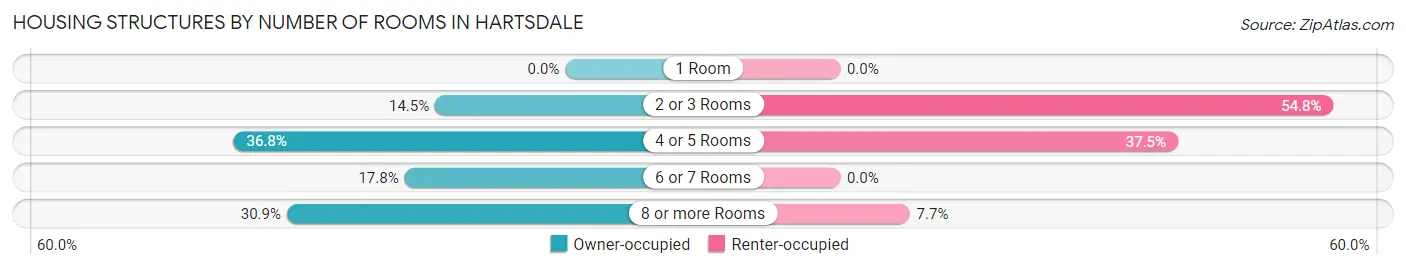
| Number of Rooms | Owner-occupied | Renter-occupied |
| 1 Room | 0 (0.0%) | 0 (0.0%) |
| 2 or 3 Rooms | 166 (14.4%) | 92 (54.8%) |
| 4 or 5 Rooms | 423 (36.8%) | 63 (37.5%) |
| 6 or 7 Rooms | 205 (17.8%) | 0 (0.0%) |
| 8 or more Rooms | 355 (30.9%) | 13 (7.7%) |
| Total | 1,149 (100.0%) | 168 (100.0%) |
Housing Structure by Heating Type in Hartsdale
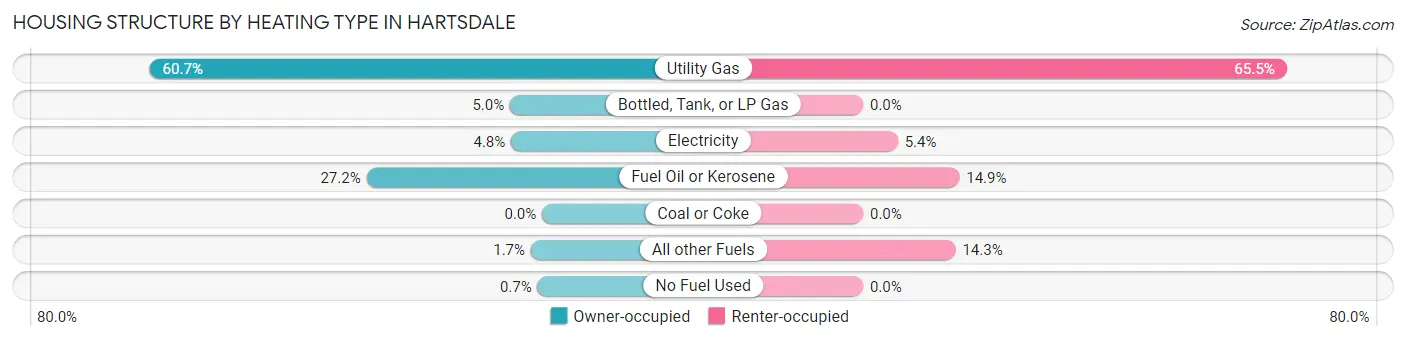
| Heating Type | Owner-occupied | Renter-occupied |
| Utility Gas | 697 (60.7%) | 110 (65.5%) |
| Bottled, Tank, or LP Gas | 57 (5.0%) | 0 (0.0%) |
| Electricity | 55 (4.8%) | 9 (5.4%) |
| Fuel Oil or Kerosene | 312 (27.2%) | 25 (14.9%) |
| Coal or Coke | 0 (0.0%) | 0 (0.0%) |
| All other Fuels | 20 (1.7%) | 24 (14.3%) |
| No Fuel Used | 8 (0.7%) | 0 (0.0%) |
| Total | 1,149 (100.0%) | 168 (100.0%) |
Household Vehicle Usage in Hartsdale
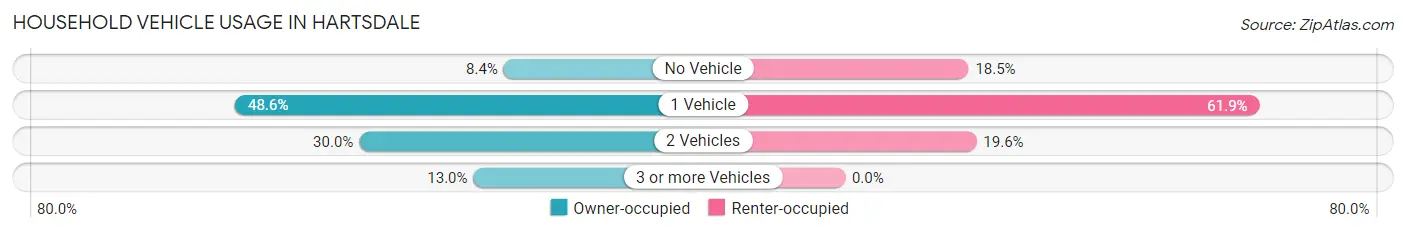
| Vehicles per Household | Owner-occupied | Renter-occupied |
| No Vehicle | 97 (8.4%) | 31 (18.4%) |
| 1 Vehicle | 558 (48.6%) | 104 (61.9%) |
| 2 Vehicles | 345 (30.0%) | 33 (19.6%) |
| 3 or more Vehicles | 149 (13.0%) | 0 (0.0%) |
| Total | 1,149 (100.0%) | 168 (100.0%) |
Real Estate & Mortgages in Hartsdale
Real Estate and Mortgage Overview in Hartsdale
| Characteristic | Without Mortgage | With Mortgage |
| Housing Units | 502 | 647 |
| Median Property Value | $354,800 | $346,000 |
| Median Household Income | $119,375 | $397 |
| Monthly Housing Costs | $1,477 | $262 |
| Real Estate Taxes | $10,001 | $134 |
Property Value by Mortgage Status in Hartsdale
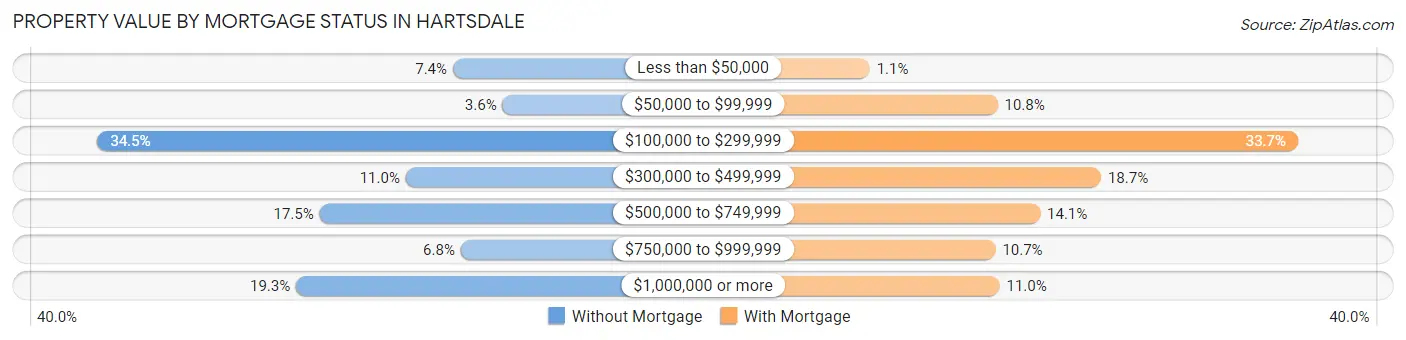
| Property Value | Without Mortgage | With Mortgage |
| Less than $50,000 | 37 (7.4%) | 7 (1.1%) |
| $50,000 to $99,999 | 18 (3.6%) | 70 (10.8%) |
| $100,000 to $299,999 | 173 (34.5%) | 218 (33.7%) |
| $300,000 to $499,999 | 55 (11.0%) | 121 (18.7%) |
| $500,000 to $749,999 | 88 (17.5%) | 91 (14.1%) |
| $750,000 to $999,999 | 34 (6.8%) | 69 (10.7%) |
| $1,000,000 or more | 97 (19.3%) | 71 (11.0%) |
| Total | 502 (100.0%) | 647 (100.0%) |
Household Income by Mortgage Status in Hartsdale
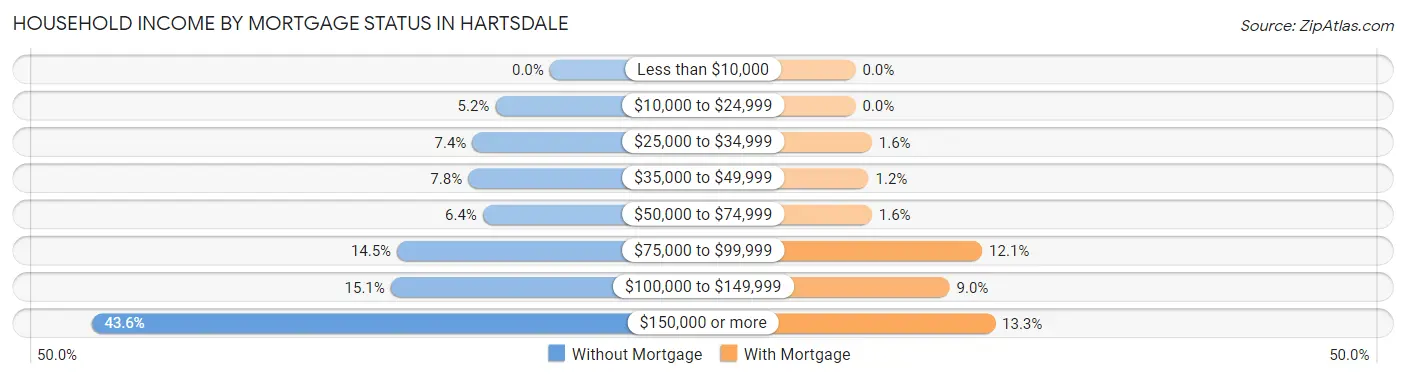
| Household Income | Without Mortgage | With Mortgage |
| Less than $10,000 | 0 (0.0%) | 0 (0.0%) |
| $10,000 to $24,999 | 26 (5.2%) | 0 (0.0%) |
| $25,000 to $34,999 | 37 (7.4%) | 10 (1.5%) |
| $35,000 to $49,999 | 39 (7.8%) | 8 (1.2%) |
| $50,000 to $74,999 | 32 (6.4%) | 10 (1.5%) |
| $75,000 to $99,999 | 73 (14.5%) | 78 (12.1%) |
| $100,000 to $149,999 | 76 (15.1%) | 58 (9.0%) |
| $150,000 or more | 219 (43.6%) | 86 (13.3%) |
| Total | 502 (100.0%) | 647 (100.0%) |
Property Value to Household Income Ratio in Hartsdale
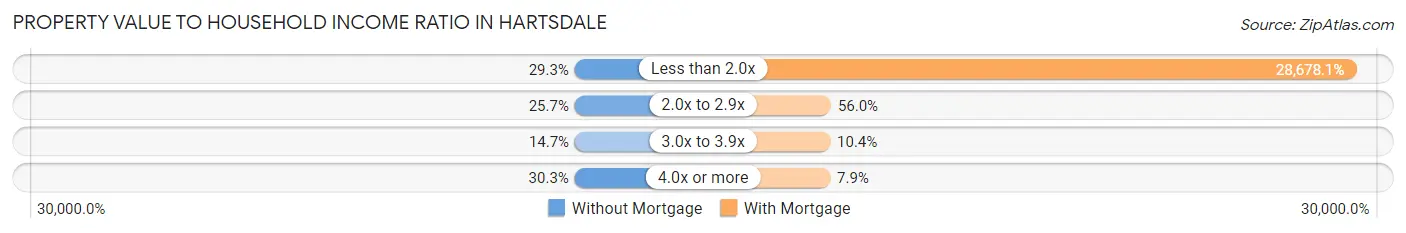
| Value-to-Income Ratio | Without Mortgage | With Mortgage |
| Less than 2.0x | 147 (29.3%) | 185,547 (28,678.1%) |
| 2.0x to 2.9x | 129 (25.7%) | 362 (55.9%) |
| 3.0x to 3.9x | 74 (14.7%) | 67 (10.4%) |
| 4.0x or more | 152 (30.3%) | 51 (7.9%) |
| Total | 502 (100.0%) | 647 (100.0%) |
Real Estate Taxes by Mortgage Status in Hartsdale
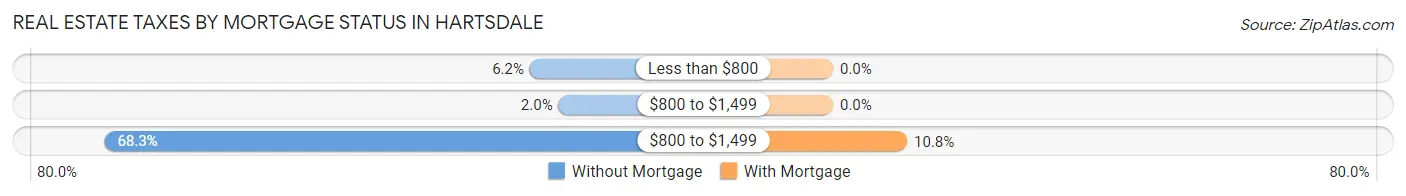
| Property Taxes | Without Mortgage | With Mortgage |
| Less than $800 | 31 (6.2%) | 0 (0.0%) |
| $800 to $1,499 | 10 (2.0%) | 0 (0.0%) |
| $800 to $1,499 | 343 (68.3%) | 70 (10.8%) |
| Total | 502 (100.0%) | 647 (100.0%) |
Health & Disability in Hartsdale
Health Insurance Coverage by Age in Hartsdale
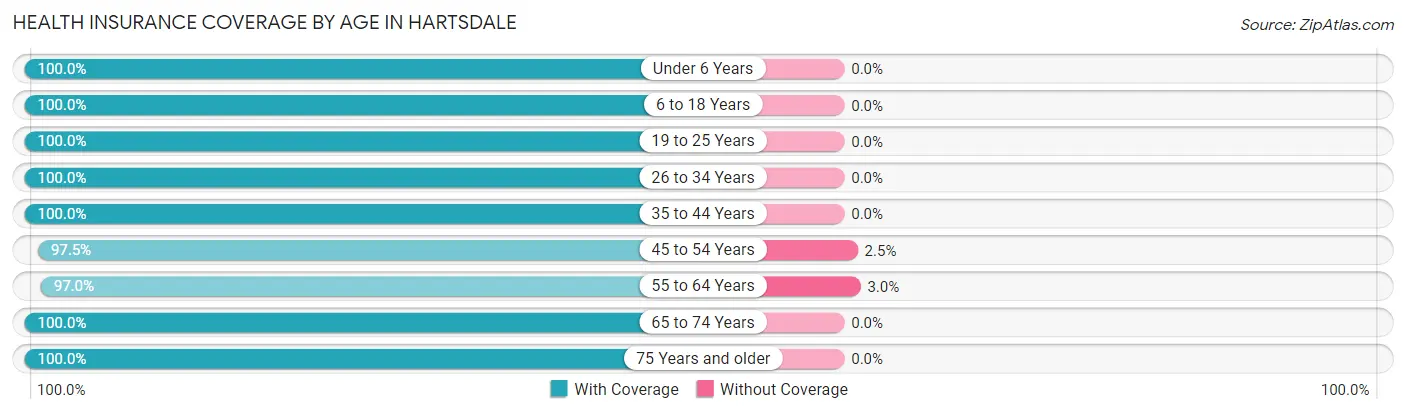
| Age Bracket | With Coverage | Without Coverage |
| Under 6 Years | 170 (100.0%) | 0 (0.0%) |
| 6 to 18 Years | 366 (100.0%) | 0 (0.0%) |
| 19 to 25 Years | 167 (100.0%) | 0 (0.0%) |
| 26 to 34 Years | 133 (100.0%) | 0 (0.0%) |
| 35 to 44 Years | 526 (100.0%) | 0 (0.0%) |
| 45 to 54 Years | 510 (97.5%) | 13 (2.5%) |
| 55 to 64 Years | 482 (97.0%) | 15 (3.0%) |
| 65 to 74 Years | 360 (100.0%) | 0 (0.0%) |
| 75 Years and older | 340 (100.0%) | 0 (0.0%) |
| Total | 3,054 (99.1%) | 28 (0.9%) |
Health Insurance Coverage by Citizenship Status in Hartsdale
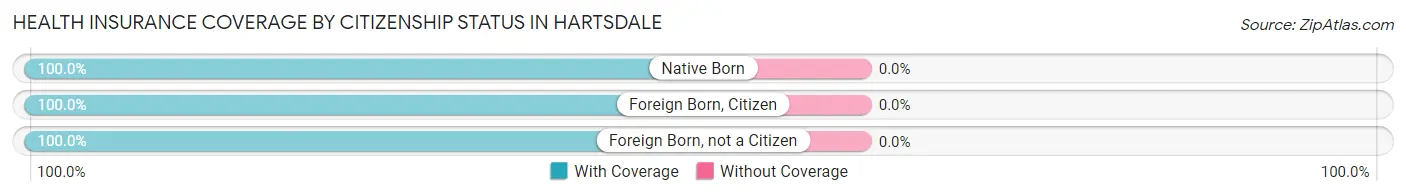
| Citizenship Status | With Coverage | Without Coverage |
| Native Born | 170 (100.0%) | 0 (0.0%) |
| Foreign Born, Citizen | 366 (100.0%) | 0 (0.0%) |
| Foreign Born, not a Citizen | 167 (100.0%) | 0 (0.0%) |
Health Insurance Coverage by Household Income in Hartsdale
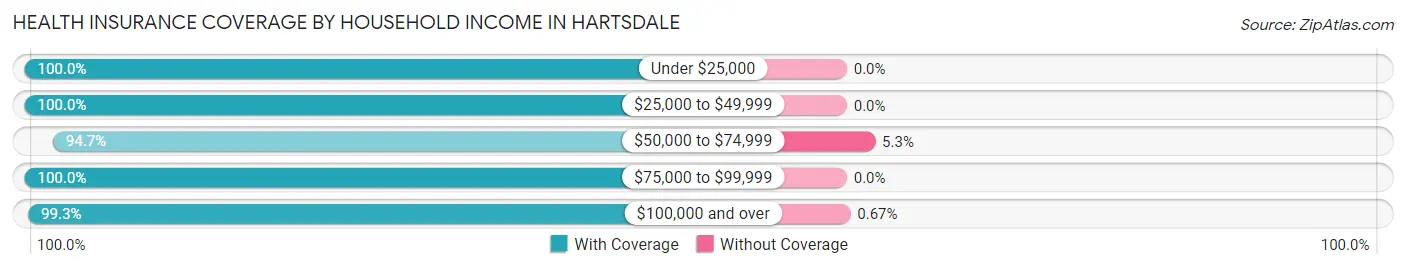
| Household Income | With Coverage | Without Coverage |
| Under $25,000 | 46 (100.0%) | 0 (0.0%) |
| $25,000 to $49,999 | 153 (100.0%) | 0 (0.0%) |
| $50,000 to $74,999 | 232 (94.7%) | 13 (5.3%) |
| $75,000 to $99,999 | 296 (100.0%) | 0 (0.0%) |
| $100,000 and over | 2,219 (99.3%) | 15 (0.7%) |
Public vs Private Health Insurance Coverage by Age in Hartsdale
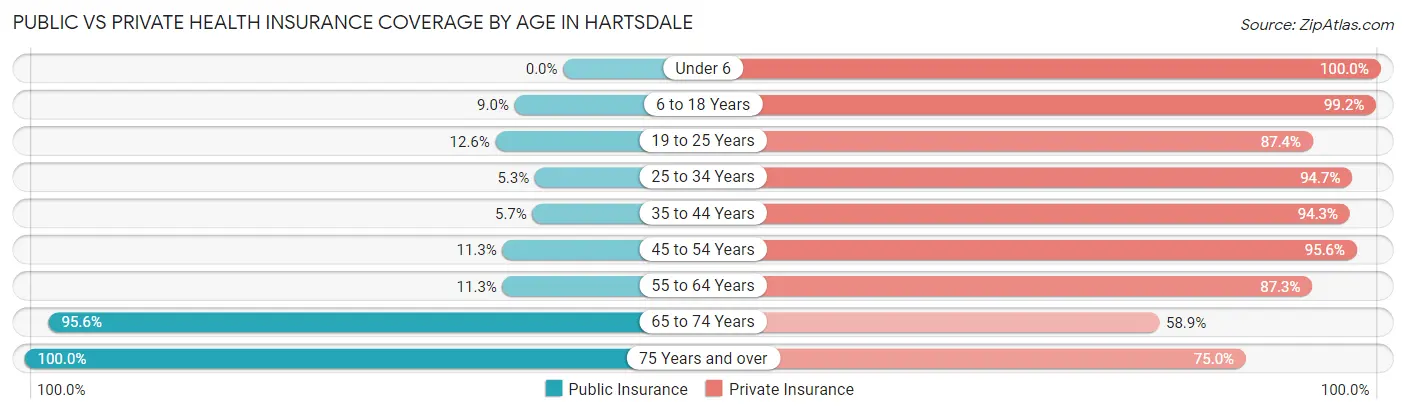
| Age Bracket | Public Insurance | Private Insurance |
| Under 6 | 0 (0.0%) | 170 (100.0%) |
| 6 to 18 Years | 33 (9.0%) | 363 (99.2%) |
| 19 to 25 Years | 21 (12.6%) | 146 (87.4%) |
| 25 to 34 Years | 7 (5.3%) | 126 (94.7%) |
| 35 to 44 Years | 30 (5.7%) | 496 (94.3%) |
| 45 to 54 Years | 59 (11.3%) | 500 (95.6%) |
| 55 to 64 Years | 56 (11.3%) | 434 (87.3%) |
| 65 to 74 Years | 344 (95.6%) | 212 (58.9%) |
| 75 Years and over | 340 (100.0%) | 255 (75.0%) |
| Total | 890 (28.9%) | 2,702 (87.7%) |
Disability Status by Sex by Age in Hartsdale
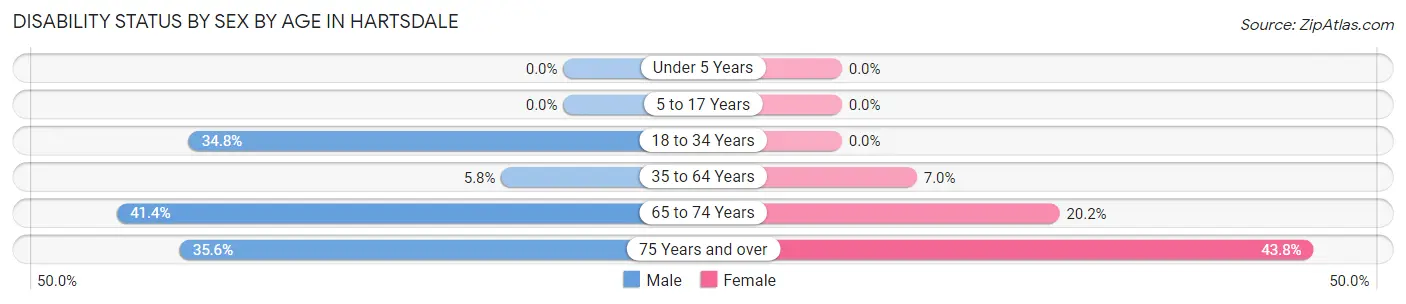
| Age Bracket | Male | Female |
| Under 5 Years | 0 (0.0%) | 0 (0.0%) |
| 5 to 17 Years | 0 (0.0%) | 0 (0.0%) |
| 18 to 34 Years | 49 (34.7%) | 0 (0.0%) |
| 35 to 64 Years | 41 (5.8%) | 58 (7.0%) |
| 65 to 74 Years | 65 (41.4%) | 41 (20.2%) |
| 75 Years and over | 21 (35.6%) | 123 (43.8%) |
Disability Class by Sex by Age in Hartsdale
Disability Class: Hearing Difficulty
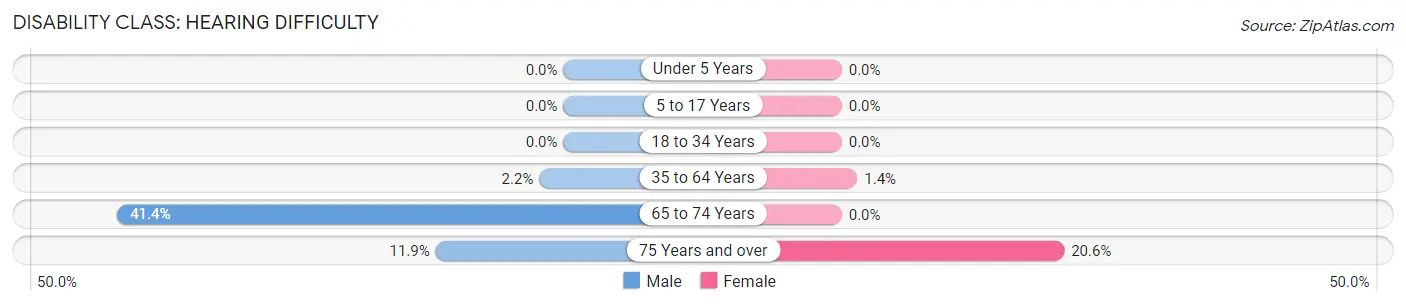
| Age Bracket | Male | Female |
| Under 5 Years | 0 (0.0%) | 0 (0.0%) |
| 5 to 17 Years | 0 (0.0%) | 0 (0.0%) |
| 18 to 34 Years | 0 (0.0%) | 0 (0.0%) |
| 35 to 64 Years | 16 (2.2%) | 12 (1.4%) |
| 65 to 74 Years | 65 (41.4%) | 0 (0.0%) |
| 75 Years and over | 7 (11.9%) | 58 (20.6%) |
Disability Class: Vision Difficulty
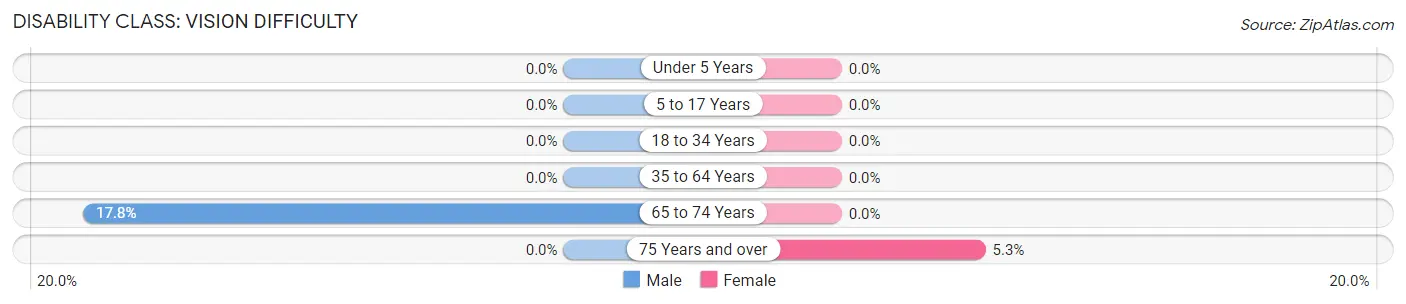
| Age Bracket | Male | Female |
| Under 5 Years | 0 (0.0%) | 0 (0.0%) |
| 5 to 17 Years | 0 (0.0%) | 0 (0.0%) |
| 18 to 34 Years | 0 (0.0%) | 0 (0.0%) |
| 35 to 64 Years | 0 (0.0%) | 0 (0.0%) |
| 65 to 74 Years | 28 (17.8%) | 0 (0.0%) |
| 75 Years and over | 0 (0.0%) | 15 (5.3%) |
Disability Class: Cognitive Difficulty
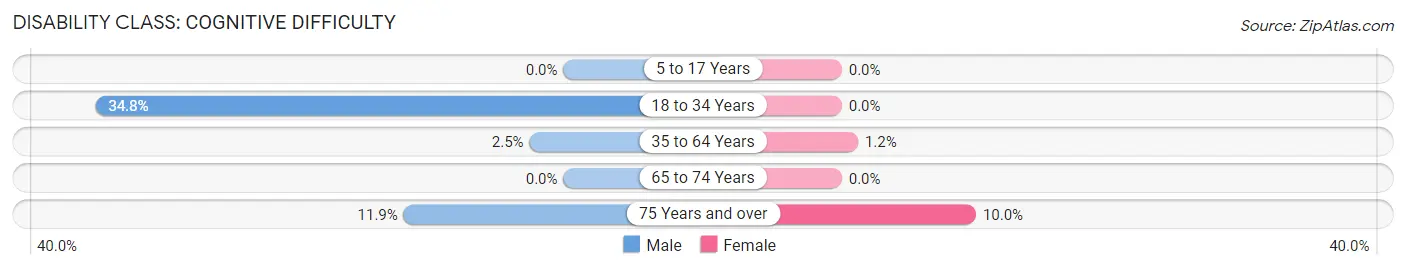
| Age Bracket | Male | Female |
| 5 to 17 Years | 0 (0.0%) | 0 (0.0%) |
| 18 to 34 Years | 49 (34.7%) | 0 (0.0%) |
| 35 to 64 Years | 18 (2.5%) | 10 (1.2%) |
| 65 to 74 Years | 0 (0.0%) | 0 (0.0%) |
| 75 Years and over | 7 (11.9%) | 28 (10.0%) |
Disability Class: Ambulatory Difficulty
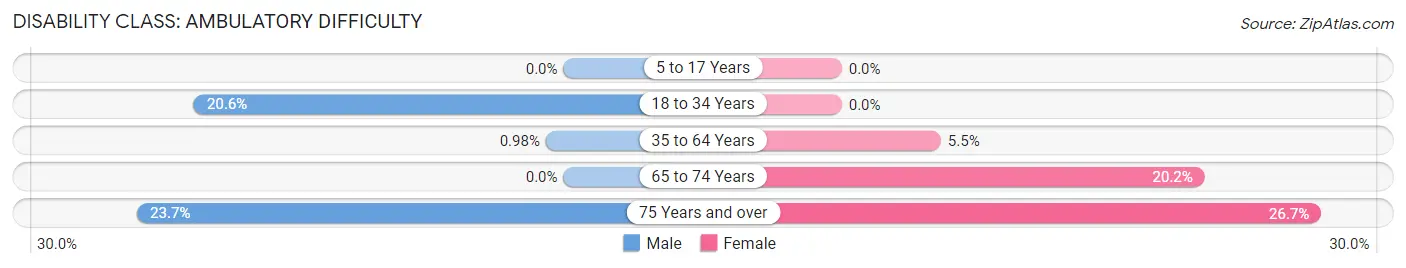
| Age Bracket | Male | Female |
| 5 to 17 Years | 0 (0.0%) | 0 (0.0%) |
| 18 to 34 Years | 29 (20.6%) | 0 (0.0%) |
| 35 to 64 Years | 7 (1.0%) | 46 (5.5%) |
| 65 to 74 Years | 0 (0.0%) | 41 (20.2%) |
| 75 Years and over | 14 (23.7%) | 75 (26.7%) |
Disability Class: Self-Care Difficulty
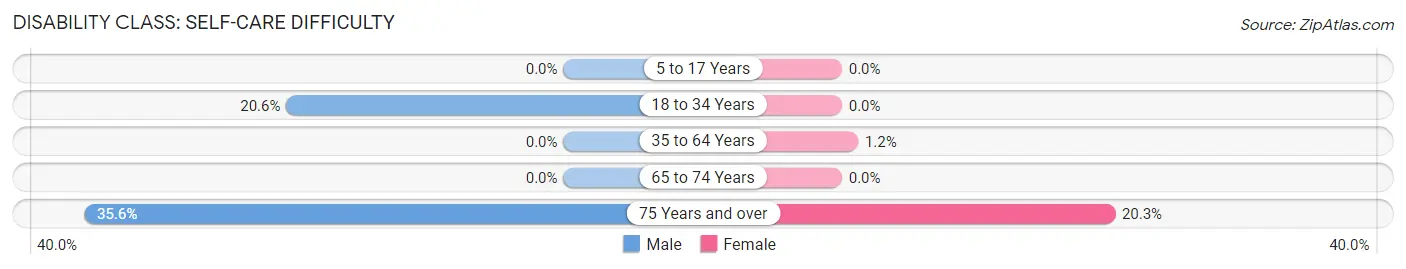
| Age Bracket | Male | Female |
| 5 to 17 Years | 0 (0.0%) | 0 (0.0%) |
| 18 to 34 Years | 29 (20.6%) | 0 (0.0%) |
| 35 to 64 Years | 0 (0.0%) | 10 (1.2%) |
| 65 to 74 Years | 0 (0.0%) | 0 (0.0%) |
| 75 Years and over | 21 (35.6%) | 57 (20.3%) |
Technology Access in Hartsdale
Computing Device Access in Hartsdale
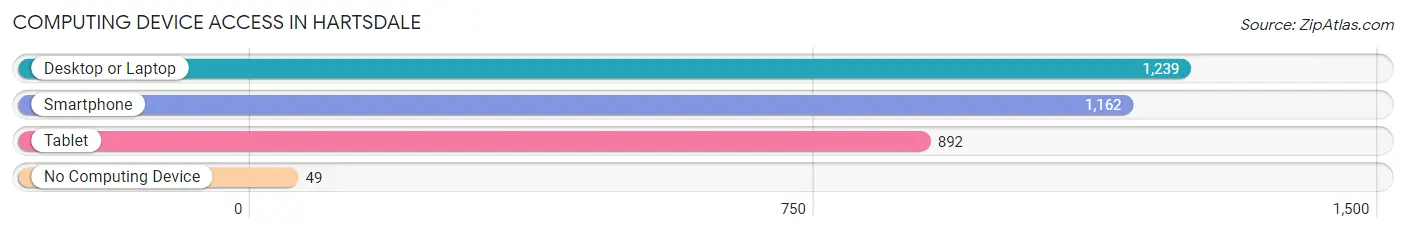
| Device Type | # Households | % Households |
| Desktop or Laptop | 1,239 | 94.1% |
| Smartphone | 1,162 | 88.2% |
| Tablet | 892 | 67.7% |
| No Computing Device | 49 | 3.7% |
| Total | 1,317 | 100.0% |
Internet Access in Hartsdale
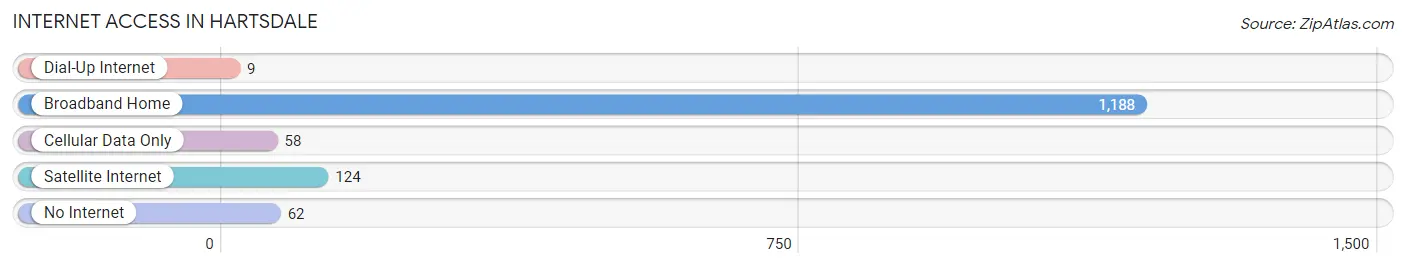
| Internet Type | # Households | % Households |
| Dial-Up Internet | 9 | 0.7% |
| Broadband Home | 1,188 | 90.2% |
| Cellular Data Only | 58 | 4.4% |
| Satellite Internet | 124 | 9.4% |
| No Internet | 62 | 4.7% |
| Total | 1,317 | 100.0% |
Hartsdale Summary
Hartsdale is a village located in Westchester County, New York, United States. It is part of the town of Greenburgh. The population was 5,293 at the 2010 census. It is a suburb of New York City located about 20 miles north of Midtown Manhattan.
History
Hartsdale was first settled in 1683 by William Hart, a Quaker from Yorkshire, England. The village was originally known as "Hart's Dale" and was part of the town of Greenburgh. In 1891, the village was incorporated as the Village of Hartsdale.
Geography
Hartsdale is located at 41°2′N 73°48′W (41.037, -73.800). According to the United States Census Bureau, the village has a total area of 0.6 square miles (1.6 km2), all of it land.
Economy
Hartsdale is a primarily residential community, with a few small businesses located in the village. The village is home to a variety of shops, restaurants, and services. The village is also home to the Hartsdale Train Station, which is served by Metro-North Railroad.
Demographics
As of the census of 2000, there were 5,293 people, 2,220 households, and 1,364 families residing in the village. The population density was 8,717.3 people per square mile (3,372.2/km2). There were 2,279 housing units at an average density of 3,743.3 per square mile (1,444.2/km2). The racial makeup of the village was 79.17% White, 8.45% African American, 0.17% Native American, 8.45% Asian, 0.02% Pacific Islander, 1.45% from other races, and 2.30% from two or more races. Hispanic or Latino of any race were 5.90% of the population.
There were 2,220 households, out of which 28.2% had children under the age of 18 living with them, 48.2% were married couples living together, 10.2% had a female householder with no husband present, and 38.2% were non-families. 32.2% of all households were made up of individuals, and 11.2% had someone living alone who was 65 years of age or older. The average household size was 2.38 and the average family size was 3.06.
In the village, the population was spread out, with 22.2% under the age of 18, 5.2% from 18 to 24, 32.2% from 25 to 44, 24.2% from 45 to 64, and 16.2% who were 65 years of age or older. The median age was 40 years. For every 100 females, there were 87.2 males. For every 100 females age 18 and over, there were 82.2 males.
The median income for a household in the village was $68,958, and the median income for a family was $86,902. Males had a median income of $60,938 versus $41,964 for females. The per capita income for the village was $37,945. About 2.2% of families and 4.2% of the population were below the poverty line, including 4.2% of those under age 18 and 4.2% of those age 65 or over.
Common Questions
What is Per Capita Income in Hartsdale?
Per Capita income in Hartsdale is $99,147.
What is the Median Family Income in Hartsdale?
Median Family Income in Hartsdale is $223,233.
What is the Median Household income in Hartsdale?
Median Household Income in Hartsdale is $157,891.
What is Income or Wage Gap in Hartsdale?
Income or Wage Gap in Hartsdale is 37.5%.
Women in Hartsdale earn 62.5 cents for every dollar earned by a man.
What is Inequality or Gini Index in Hartsdale?
Inequality or Gini Index in Hartsdale is 0.50.
What is the Total Population of Hartsdale?
Total Population of Hartsdale is 3,082.
What is the Total Male Population of Hartsdale?
Total Male Population of Hartsdale is 1,281.
What is the Total Female Population of Hartsdale?
Total Female Population of Hartsdale is 1,801.
What is the Ratio of Males per 100 Females in Hartsdale?
There are 71.13 Males per 100 Females in Hartsdale.
What is the Ratio of Females per 100 Males in Hartsdale?
There are 140.59 Females per 100 Males in Hartsdale.
What is the Median Population Age in Hartsdale?
Median Population Age in Hartsdale is 47.4 Years.
What is the Average Family Size in Hartsdale
Average Family Size in Hartsdale is 2.8 People.
What is the Average Household Size in Hartsdale
Average Household Size in Hartsdale is 2.3 People.
How Large is the Labor Force in Hartsdale?
There are 1,783 People in the Labor Forcein in Hartsdale.
What is the Percentage of People in the Labor Force in Hartsdale?
67.5% of People are in the Labor Force in Hartsdale.
What is the Unemployment Rate in Hartsdale?
Unemployment Rate in Hartsdale is 1.6%.