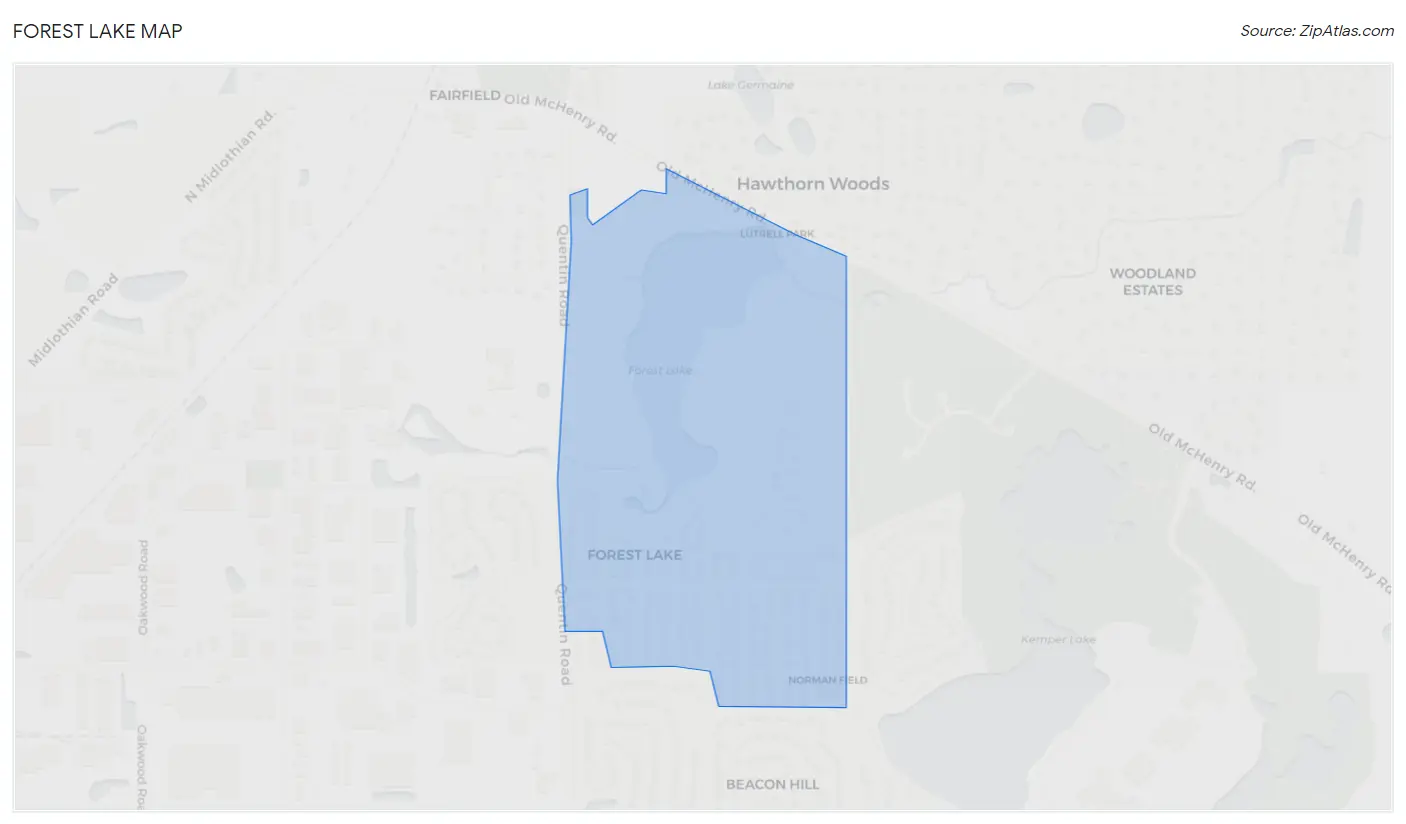
Forest Lake, IL Map & Demographics
Forest Lake Map
Forest Lake Overview
$55,557
PER CAPITA INCOME
$110,313
AVG FAMILY INCOME
$112,031
AVG HOUSEHOLD INCOME
0.28
INEQUALITY / GINI INDEX
1,344
TOTAL POPULATION
548
MALE POPULATION
796
FEMALE POPULATION
68.84
MALES / 100 FEMALES
145.26
FEMALES / 100 MALES
51.7
MEDIAN AGE
2.5
AVG FAMILY SIZE
2.5
AVG HOUSEHOLD SIZE
1,018
LABOR FORCE [ PEOPLE ]
87.0%
PERCENT IN LABOR FORCE
5.4%
UNEMPLOYMENT RATE
Income in Forest Lake
Income Overview in Forest Lake
Per Capita Income in Forest Lake is $55,557, while median incomes of families and households are $110,313 and $112,031 respectively.
| Characteristic | Number | Measure |
| Per Capita Income | 1,344 | $55,557 |
| Median Family Income | 480 | $110,313 |
| Mean Family Income | 480 | $134,312 |
| Median Household Income | 544 | $112,031 |
| Mean Household Income | 544 | $134,678 |
| Income Deficit | 480 | $0 |
| Wage / Income Gap (%) | 1,344 | 0.00% |
| Wage / Income Gap ($) | 1,344 | 100.00¢ per $1 |
| Gini / Inequality Index | 1,344 | 0.28 |
Earnings by Sex in Forest Lake
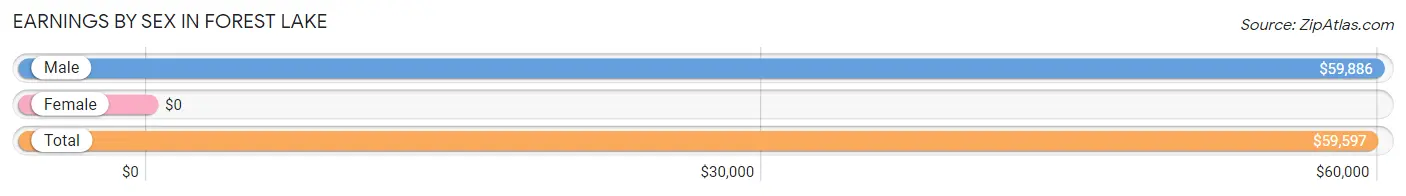
| Sex | Number | Average Earnings |
| Male | 481 (46.9%) | $59,886 |
| Female | 544 (53.1%) | $0 |
| Total | 1,025 (100.0%) | $59,597 |
Earnings by Sex by Income Bracket in Forest Lake
The most common earnings brackets in Forest Lake are $100,000+ for men (146 | 30.3%) and $25,000 to $29,999 for women (157 | 28.9%).
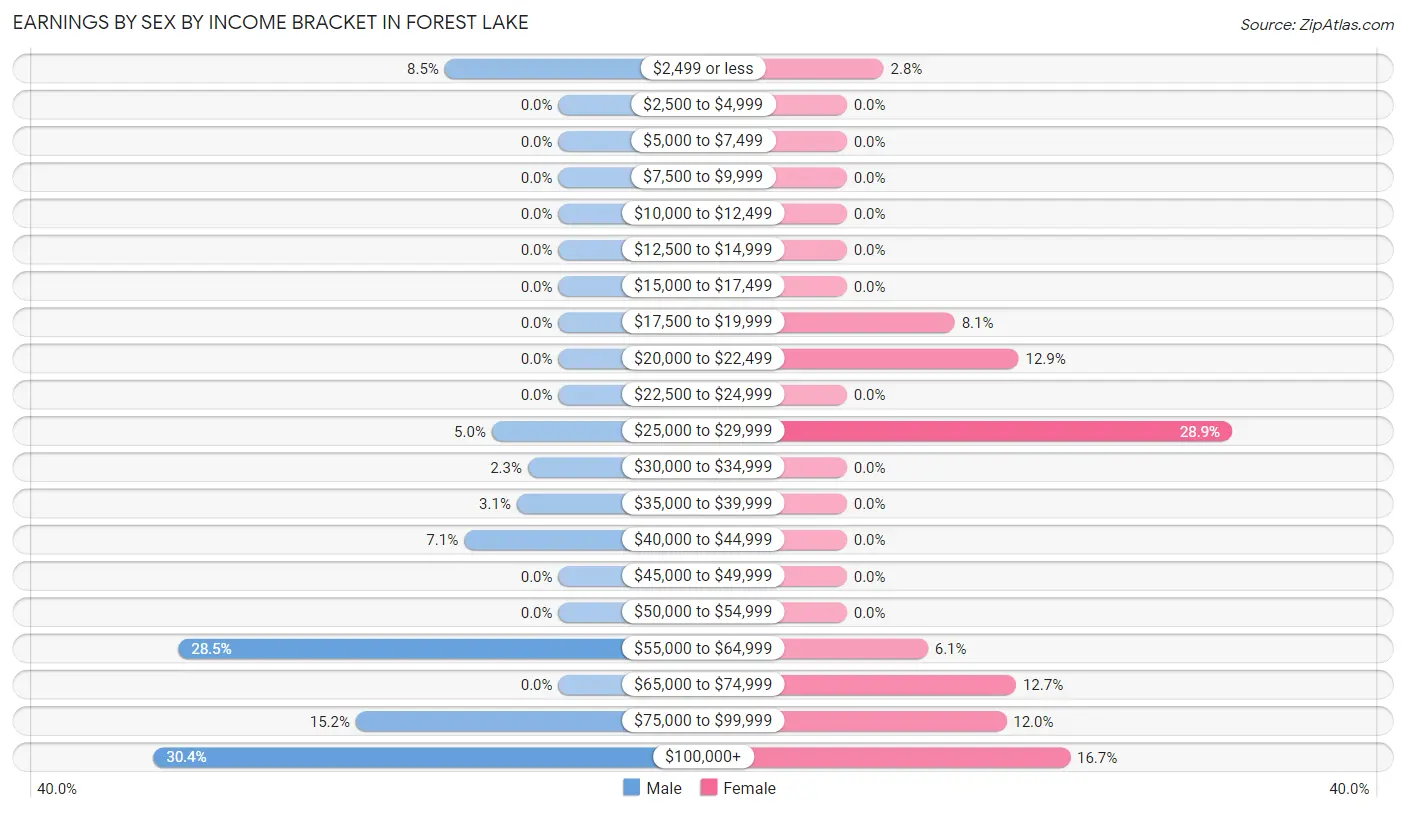
| Income | Male | Female |
| $2,499 or less | 41 (8.5%) | 15 (2.8%) |
| $2,500 to $4,999 | 0 (0.0%) | 0 (0.0%) |
| $5,000 to $7,499 | 0 (0.0%) | 0 (0.0%) |
| $7,500 to $9,999 | 0 (0.0%) | 0 (0.0%) |
| $10,000 to $12,499 | 0 (0.0%) | 0 (0.0%) |
| $12,500 to $14,999 | 0 (0.0%) | 0 (0.0%) |
| $15,000 to $17,499 | 0 (0.0%) | 0 (0.0%) |
| $17,500 to $19,999 | 0 (0.0%) | 44 (8.1%) |
| $20,000 to $22,499 | 0 (0.0%) | 70 (12.9%) |
| $22,500 to $24,999 | 0 (0.0%) | 0 (0.0%) |
| $25,000 to $29,999 | 24 (5.0%) | 157 (28.9%) |
| $30,000 to $34,999 | 11 (2.3%) | 0 (0.0%) |
| $35,000 to $39,999 | 15 (3.1%) | 0 (0.0%) |
| $40,000 to $44,999 | 34 (7.1%) | 0 (0.0%) |
| $45,000 to $49,999 | 0 (0.0%) | 0 (0.0%) |
| $50,000 to $54,999 | 0 (0.0%) | 0 (0.0%) |
| $55,000 to $64,999 | 137 (28.5%) | 33 (6.1%) |
| $65,000 to $74,999 | 0 (0.0%) | 69 (12.7%) |
| $75,000 to $99,999 | 73 (15.2%) | 65 (11.9%) |
| $100,000+ | 146 (30.3%) | 91 (16.7%) |
| Total | 481 (100.0%) | 544 (100.0%) |
Earnings by Sex by Educational Attainment in Forest Lake
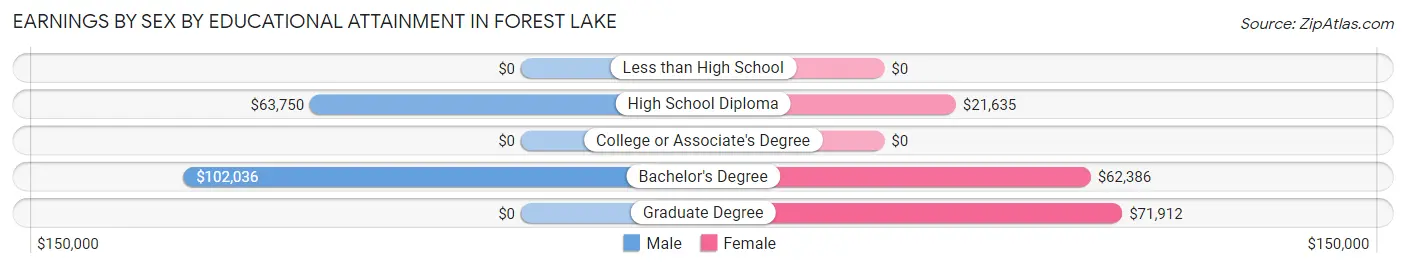
| Educational Attainment | Male Income | Female Income |
| Less than High School | - | - |
| High School Diploma | $63,750 | $21,635 |
| College or Associate's Degree | - | - |
| Bachelor's Degree | $102,036 | $62,386 |
| Graduate Degree | - | - |
| Total | $64,844 | $0 |
Family Income in Forest Lake
Family Income Brackets in Forest Lake
According to the Forest Lake family income data, there are 169 families falling into the $75,000 to $99,999 income range, which is the most common income bracket and makes up 35.2% of all families.
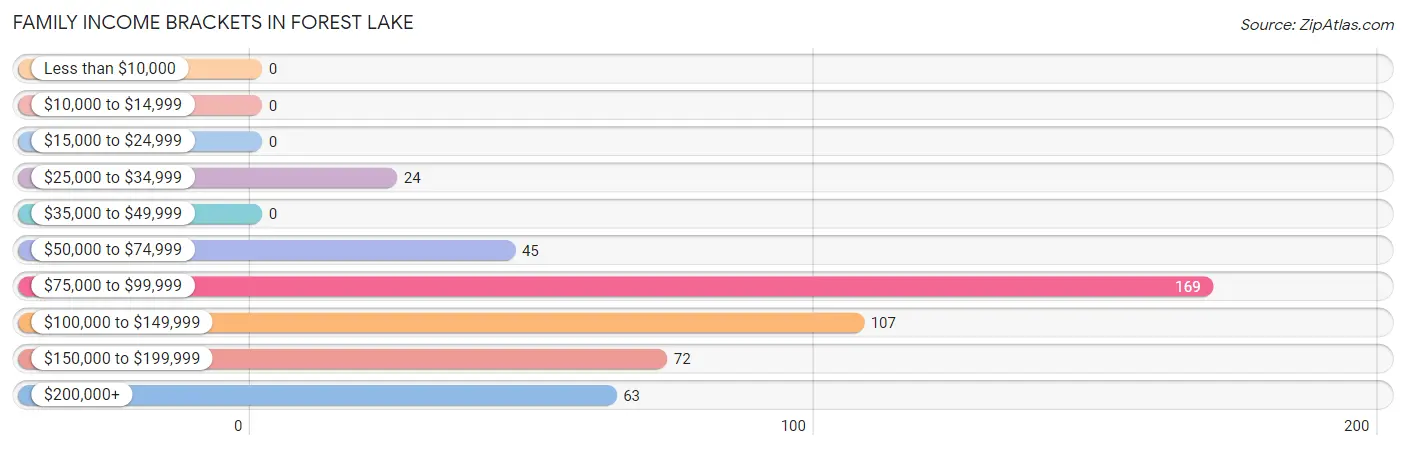
| Income Bracket | # Families | % Families |
| Less than $10,000 | 0 | 0.0% |
| $10,000 to $14,999 | 0 | 0.0% |
| $15,000 to $24,999 | 0 | 0.0% |
| $25,000 to $34,999 | 24 | 5.0% |
| $35,000 to $49,999 | 0 | 0.0% |
| $50,000 to $74,999 | 45 | 9.4% |
| $75,000 to $99,999 | 169 | 35.2% |
| $100,000 to $149,999 | 107 | 22.3% |
| $150,000 to $199,999 | 72 | 15.0% |
| $200,000+ | 63 | 13.1% |
Family Income by Famaliy Size in Forest Lake
2-person families (372 | 77.5%) account for the highest median family income in Forest Lake with $89,711 per family, while 2-person families (372 | 77.5%) have the highest median income of $44,856 per family member.
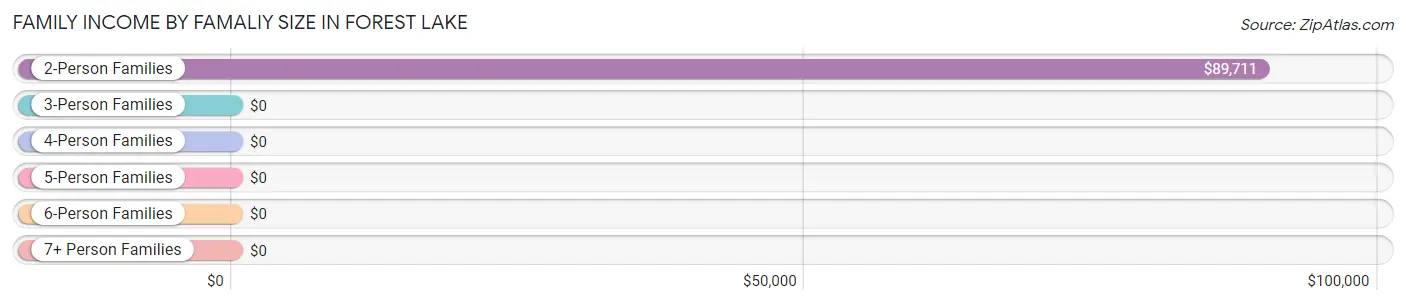
| Income Bracket | # Families | Median Income |
| 2-Person Families | 372 (77.5%) | $89,711 |
| 3-Person Families | 59 (12.3%) | $0 |
| 4-Person Families | 33 (6.9%) | $0 |
| 5-Person Families | 16 (3.3%) | $0 |
| 6-Person Families | 0 (0.0%) | $0 |
| 7+ Person Families | 0 (0.0%) | $0 |
| Total | 480 (100.0%) | $110,313 |
Family Income by Number of Earners in Forest Lake
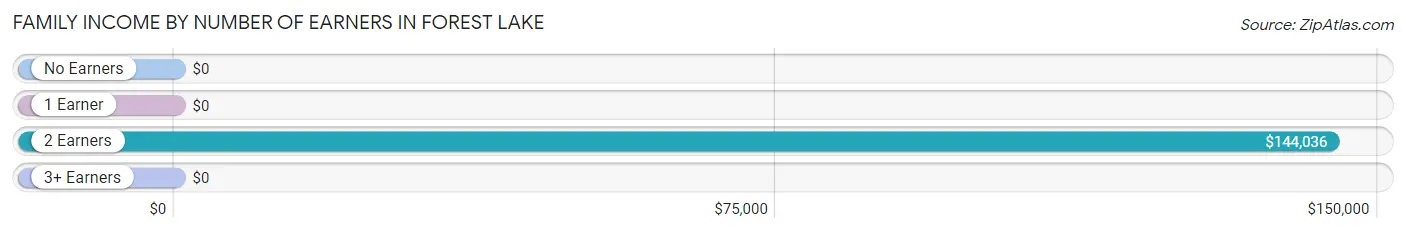
| Number of Earners | # Families | Median Income |
| No Earners | 18 (3.7%) | $0 |
| 1 Earner | 69 (14.4%) | $0 |
| 2 Earners | 377 (78.5%) | $144,036 |
| 3+ Earners | 16 (3.3%) | $0 |
| Total | 480 (100.0%) | $110,313 |
Household Income in Forest Lake
Household Income Brackets in Forest Lake
With 190 households falling in the category, the $75,000 to $99,999 income range is the most frequent in Forest Lake, accounting for 34.9% of all households.
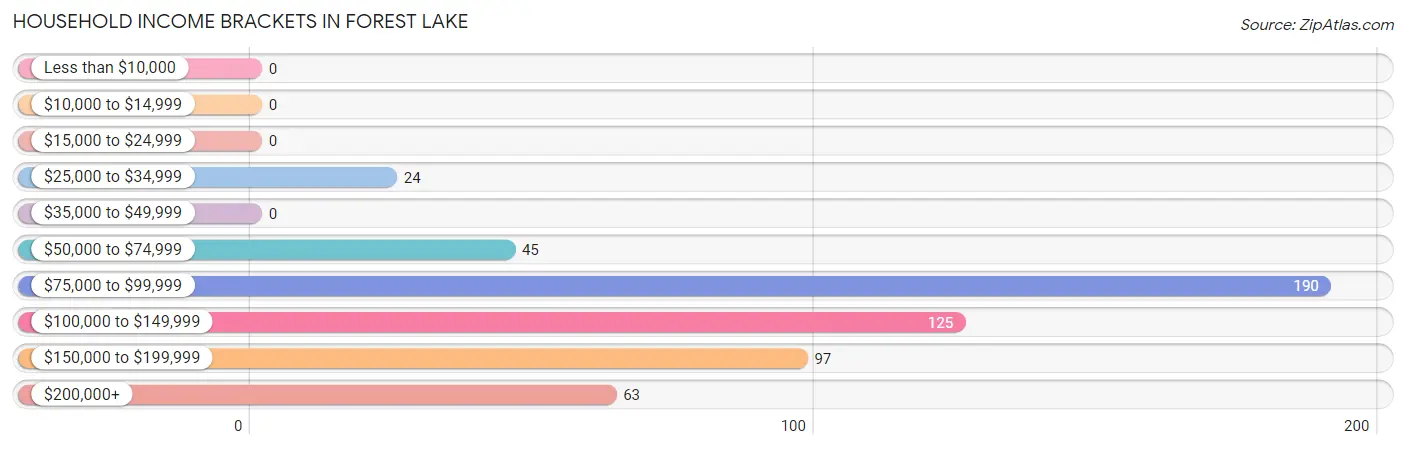
| Income Bracket | # Households | % Households |
| Less than $10,000 | 0 | 0.0% |
| $10,000 to $14,999 | 0 | 0.0% |
| $15,000 to $24,999 | 0 | 0.0% |
| $25,000 to $34,999 | 24 | 4.4% |
| $35,000 to $49,999 | 0 | 0.0% |
| $50,000 to $74,999 | 45 | 8.3% |
| $75,000 to $99,999 | 190 | 34.9% |
| $100,000 to $149,999 | 125 | 23.0% |
| $150,000 to $199,999 | 97 | 17.8% |
| $200,000+ | 63 | 11.6% |
Household Income by Householder Age in Forest Lake
The median household income in Forest Lake is $112,031, with the highest median household income of $143,786 found in the 25 to 44 years age bracket for the primary householder. A total of 104 households (19.1%) fall into this category.
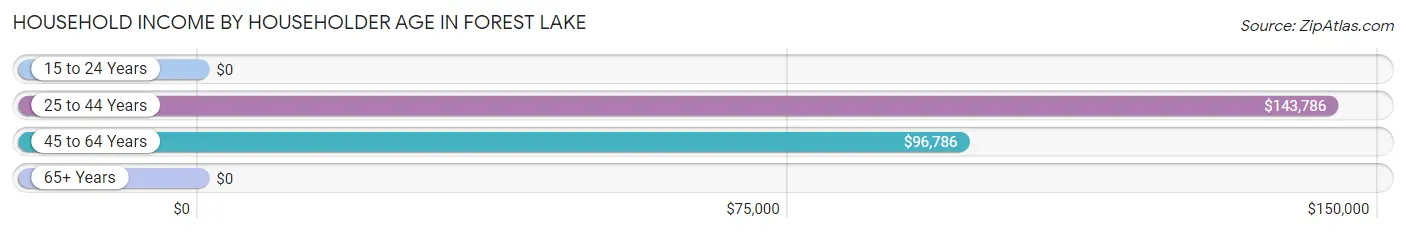
| Income Bracket | # Households | Median Income |
| 15 to 24 Years | 0 (0.0%) | $0 |
| 25 to 44 Years | 104 (19.1%) | $143,786 |
| 45 to 64 Years | 406 (74.6%) | $96,786 |
| 65+ Years | 34 (6.2%) | $0 |
| Total | 544 (100.0%) | $112,031 |
Poverty in Forest Lake
Income Below Poverty by Sex and Age in Forest Lake
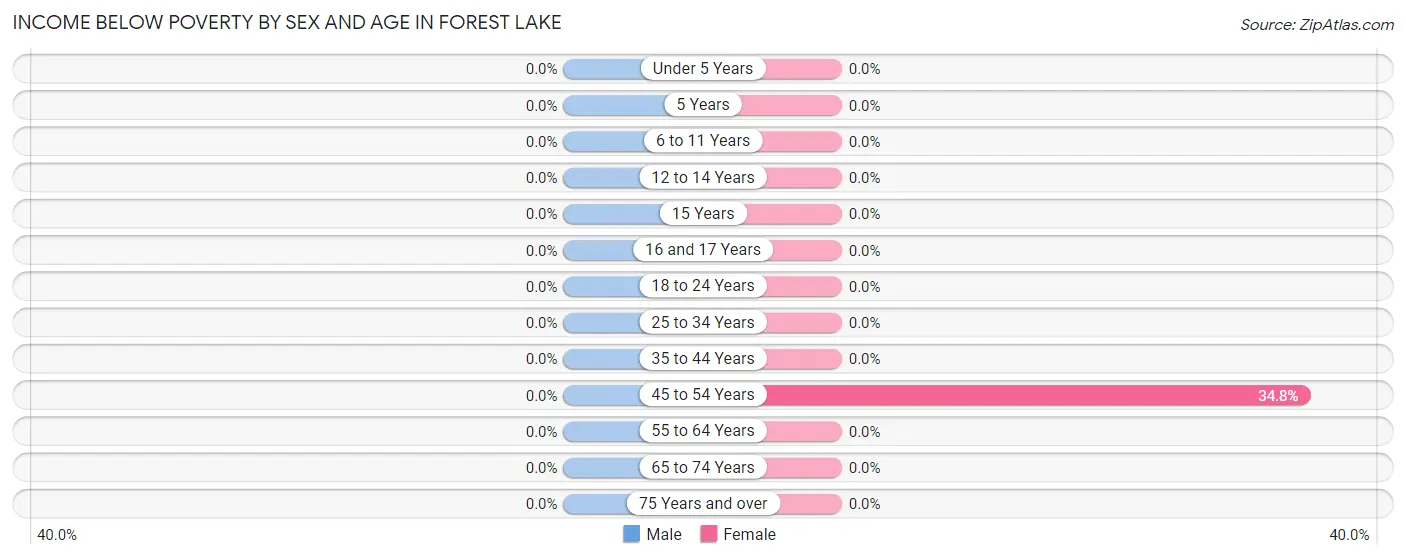
| Age Bracket | Male | Female |
| Under 5 Years | 0 (0.0%) | 0 (0.0%) |
| 5 Years | 0 (0.0%) | 0 (0.0%) |
| 6 to 11 Years | 0 (0.0%) | 0 (0.0%) |
| 12 to 14 Years | 0 (0.0%) | 0 (0.0%) |
| 15 Years | 0 (0.0%) | 0 (0.0%) |
| 16 and 17 Years | 0 (0.0%) | 0 (0.0%) |
| 18 to 24 Years | 0 (0.0%) | 0 (0.0%) |
| 25 to 34 Years | 0 (0.0%) | 0 (0.0%) |
| 35 to 44 Years | 0 (0.0%) | 0 (0.0%) |
| 45 to 54 Years | 0 (0.0%) | 32 (34.8%) |
| 55 to 64 Years | 0 (0.0%) | 0 (0.0%) |
| 65 to 74 Years | 0 (0.0%) | 0 (0.0%) |
| 75 Years and over | 0 (0.0%) | 0 (0.0%) |
| Total | 0 (0.0%) | 32 (4.0%) |
Income Above Poverty by Sex and Age in Forest Lake
According to the poverty statistics in Forest Lake, males aged 12 to 14 years and females aged 6 to 11 years are the age groups that are most secure financially, with 100.0% of males and 100.0% of females in these age groups living above the poverty line.
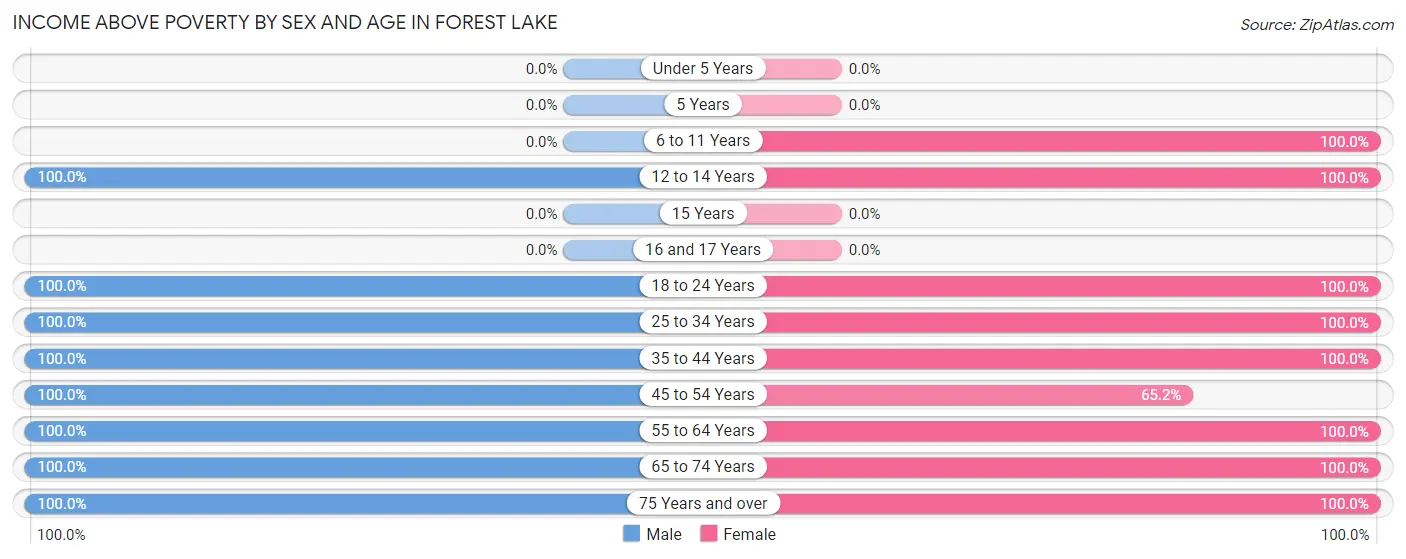
| Age Bracket | Male | Female |
| Under 5 Years | 0 (0.0%) | 0 (0.0%) |
| 5 Years | 0 (0.0%) | 0 (0.0%) |
| 6 to 11 Years | 0 (0.0%) | 105 (100.0%) |
| 12 to 14 Years | 49 (100.0%) | 20 (100.0%) |
| 15 Years | 0 (0.0%) | 0 (0.0%) |
| 16 and 17 Years | 0 (0.0%) | 0 (0.0%) |
| 18 to 24 Years | 41 (100.0%) | 87 (100.0%) |
| 25 to 34 Years | 35 (100.0%) | 35 (100.0%) |
| 35 to 44 Years | 36 (100.0%) | 99 (100.0%) |
| 45 to 54 Years | 108 (100.0%) | 60 (65.2%) |
| 55 to 64 Years | 244 (100.0%) | 288 (100.0%) |
| 65 to 74 Years | 17 (100.0%) | 36 (100.0%) |
| 75 Years and over | 18 (100.0%) | 34 (100.0%) |
| Total | 548 (100.0%) | 764 (96.0%) |
Income Below Poverty Among Married-Couple Families in Forest Lake
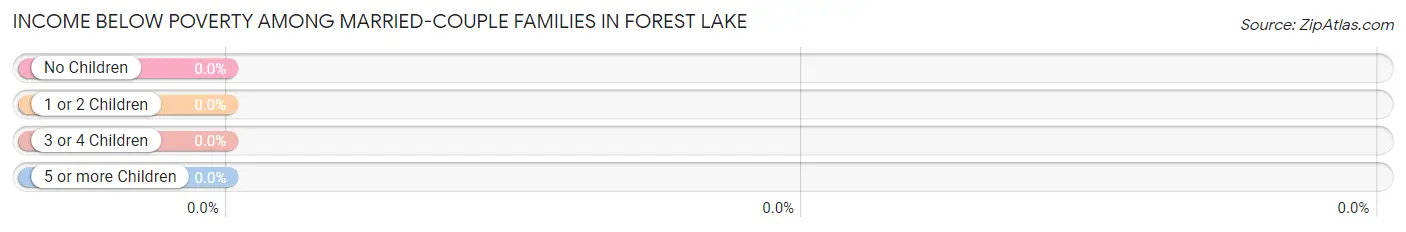
| Children | Above Poverty | Below Poverty |
| No Children | 322 (100.0%) | 0 (0.0%) |
| 1 or 2 Children | 84 (100.0%) | 0 (0.0%) |
| 3 or 4 Children | 0 (0.0%) | 0 (0.0%) |
| 5 or more Children | 0 (0.0%) | 0 (0.0%) |
| Total | 406 (100.0%) | 0 (0.0%) |
Income Below Poverty Among Single-Parent Households in Forest Lake
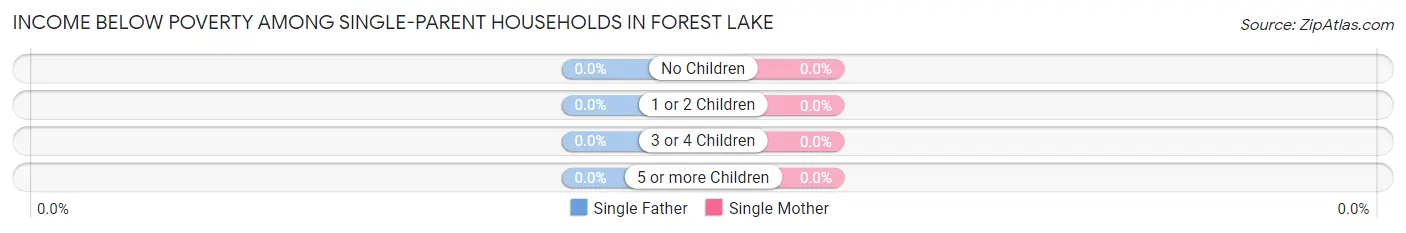
| Children | Single Father | Single Mother |
| No Children | 0 (0.0%) | 0 (0.0%) |
| 1 or 2 Children | 0 (0.0%) | 0 (0.0%) |
| 3 or 4 Children | 0 (0.0%) | 0 (0.0%) |
| 5 or more Children | 0 (0.0%) | 0 (0.0%) |
| Total | 0 (0.0%) | 0 (0.0%) |
Income Below Poverty Among Married-Couple vs Single-Parent Households in Forest Lake
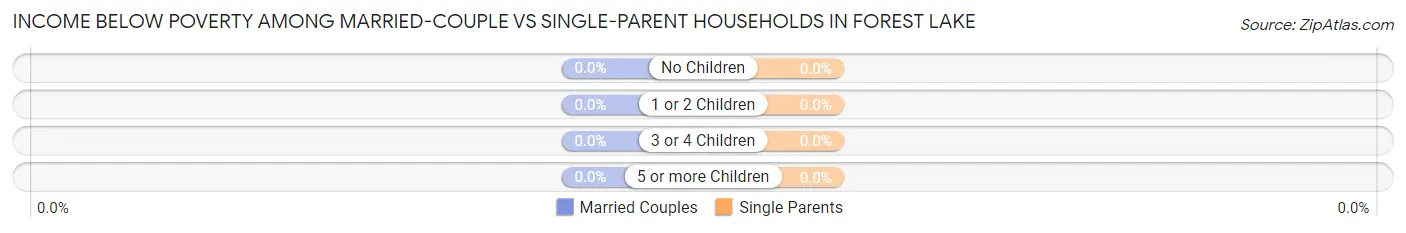
| Children | Married-Couple Families | Single-Parent Households |
| No Children | 0 (0.0%) | 0 (0.0%) |
| 1 or 2 Children | 0 (0.0%) | 0 (0.0%) |
| 3 or 4 Children | 0 (0.0%) | 0 (0.0%) |
| 5 or more Children | 0 (0.0%) | 0 (0.0%) |
| Total | 0 (0.0%) | 0 (0.0%) |
Race in Forest Lake
The most populous races in Forest Lake are White / Caucasian (1,018 | 75.7%), Hispanic or Latino (291 | 21.6%), and Some other Race (291 | 21.6%).
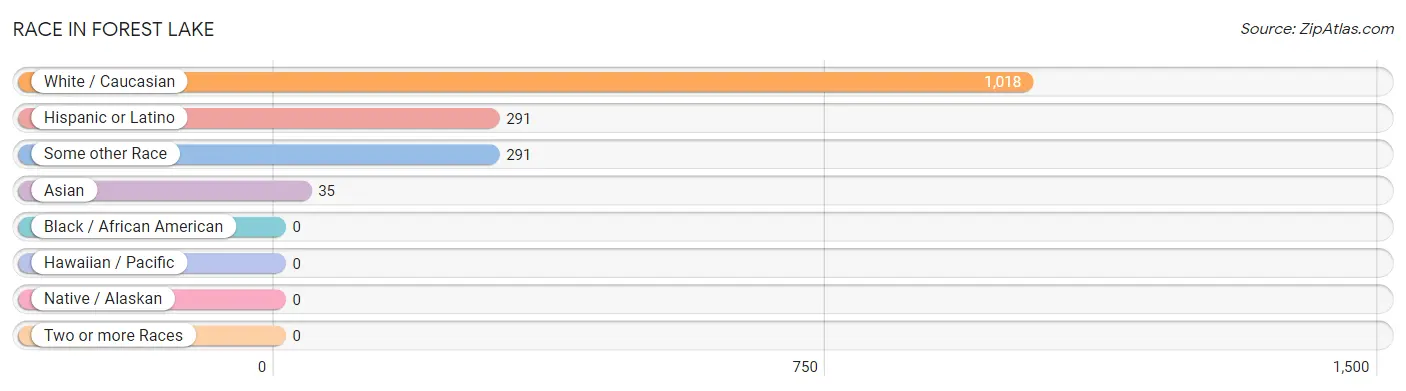
| Race | # Population | % Population |
| Asian | 35 | 2.6% |
| Black / African American | 0 | 0.0% |
| Hawaiian / Pacific | 0 | 0.0% |
| Hispanic or Latino | 291 | 21.6% |
| Native / Alaskan | 0 | 0.0% |
| White / Caucasian | 1,018 | 75.7% |
| Two or more Races | 0 | 0.0% |
| Some other Race | 291 | 21.6% |
| Total | 1,344 | 100.0% |
Ancestry in Forest Lake
The most populous ancestries reported in Forest Lake are German (298 | 22.2%), Mexican (272 | 20.2%), Irish (262 | 19.5%), Polish (230 | 17.1%), and Russian (72 | 5.4%), together accounting for 84.4% of all Forest Lake residents.
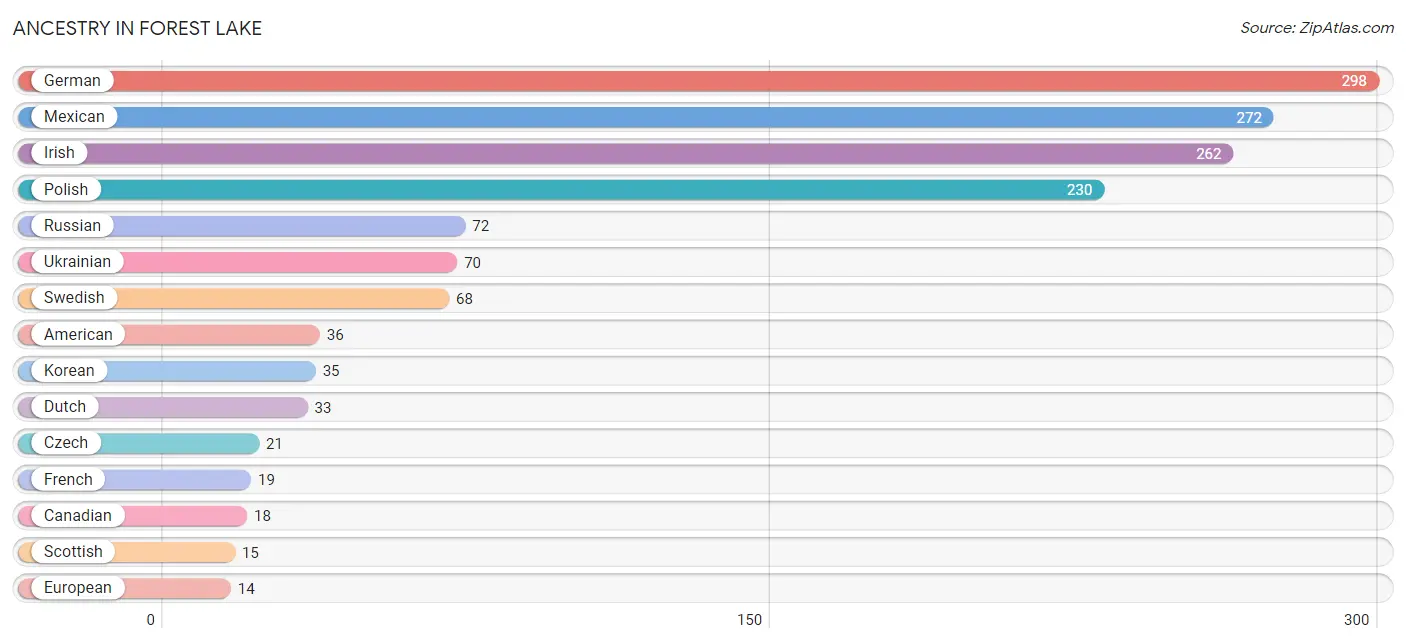
| Ancestry | # Population | % Population |
| American | 36 | 2.7% |
| Canadian | 18 | 1.3% |
| Central American | 11 | 0.8% |
| Czech | 21 | 1.6% |
| Dutch | 33 | 2.5% |
| European | 14 | 1.0% |
| French | 19 | 1.4% |
| German | 298 | 22.2% |
| Honduran | 11 | 0.8% |
| Irish | 262 | 19.5% |
| Korean | 35 | 2.6% |
| Mexican | 272 | 20.2% |
| Polish | 230 | 17.1% |
| Russian | 72 | 5.4% |
| Scottish | 15 | 1.1% |
| Swedish | 68 | 5.1% |
| Ukrainian | 70 | 5.2% | View All 17 Rows |
Immigrants in Forest Lake
The most numerous immigrant groups reported in Forest Lake came from Central America (283 | 21.1%), Latin America (283 | 21.1%), Mexico (272 | 20.2%), Europe (220 | 16.4%), and Eastern Europe (183 | 13.6%), together accounting for 92.4% of all Forest Lake residents.
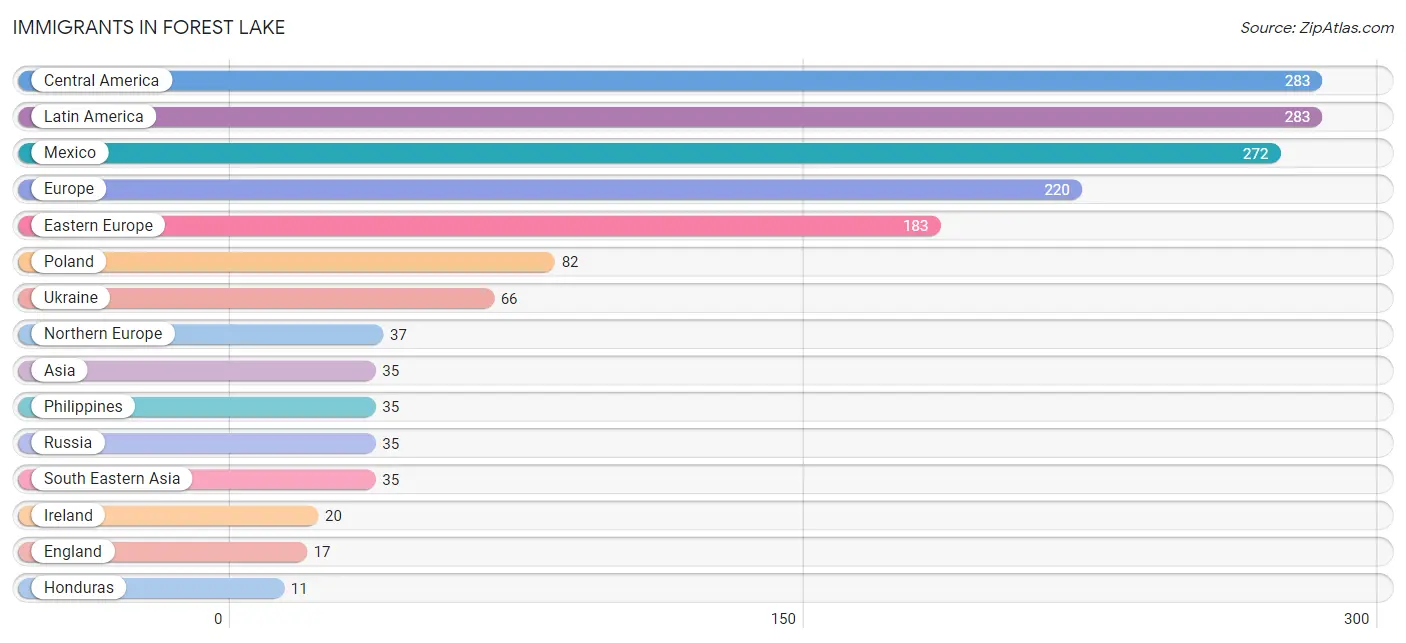
| Immigration Origin | # Population | % Population |
| Asia | 35 | 2.6% |
| Central America | 283 | 21.1% |
| Eastern Europe | 183 | 13.6% |
| England | 17 | 1.3% |
| Europe | 220 | 16.4% |
| Honduras | 11 | 0.8% |
| Ireland | 20 | 1.5% |
| Latin America | 283 | 21.1% |
| Mexico | 272 | 20.2% |
| Northern Europe | 37 | 2.8% |
| Philippines | 35 | 2.6% |
| Poland | 82 | 6.1% |
| Russia | 35 | 2.6% |
| South Eastern Asia | 35 | 2.6% |
| Ukraine | 66 | 4.9% | View All 15 Rows |
Sex and Age in Forest Lake
Sex and Age in Forest Lake
The most populous age groups in Forest Lake are 60 to 64 Years (152 | 27.7%) for men and 55 to 59 Years (216 | 27.1%) for women.
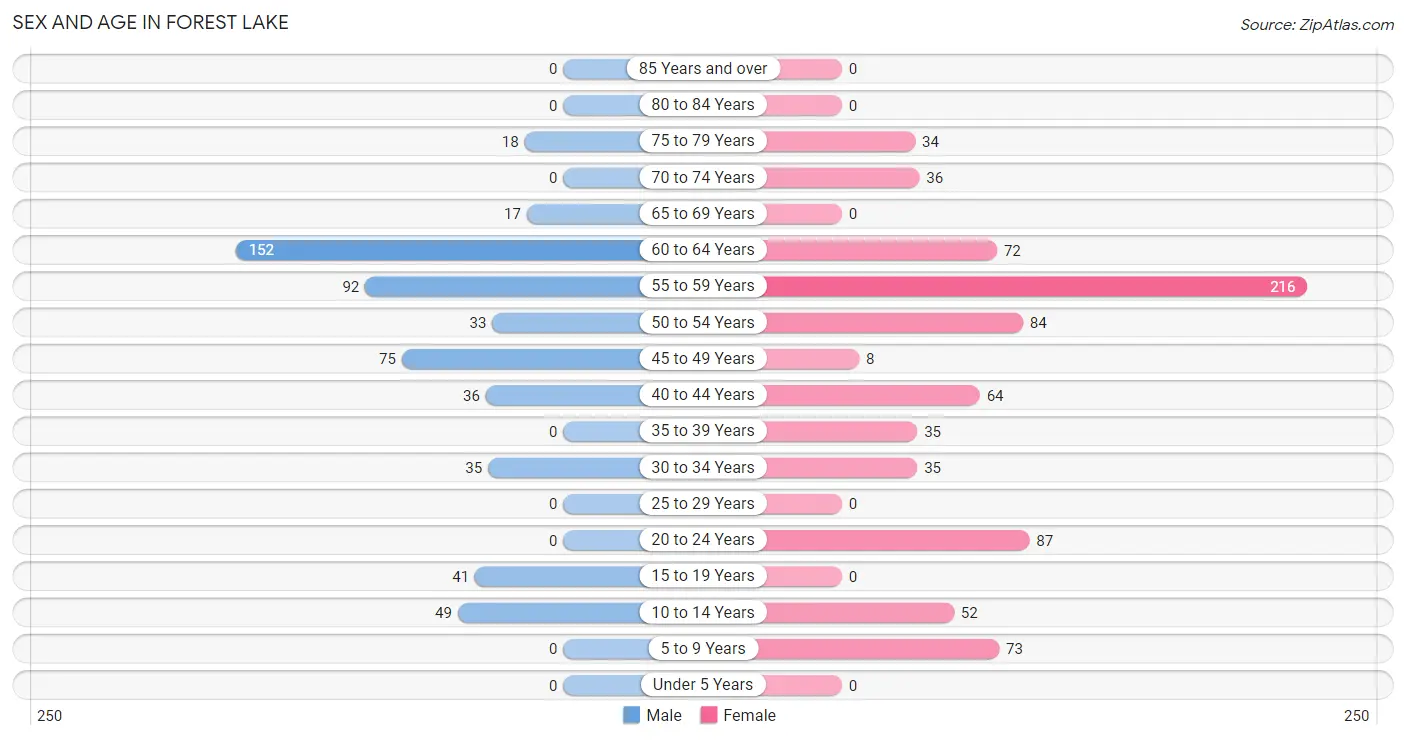
| Age Bracket | Male | Female |
| Under 5 Years | 0 (0.0%) | 0 (0.0%) |
| 5 to 9 Years | 0 (0.0%) | 73 (9.2%) |
| 10 to 14 Years | 49 (8.9%) | 52 (6.5%) |
| 15 to 19 Years | 41 (7.5%) | 0 (0.0%) |
| 20 to 24 Years | 0 (0.0%) | 87 (10.9%) |
| 25 to 29 Years | 0 (0.0%) | 0 (0.0%) |
| 30 to 34 Years | 35 (6.4%) | 35 (4.4%) |
| 35 to 39 Years | 0 (0.0%) | 35 (4.4%) |
| 40 to 44 Years | 36 (6.6%) | 64 (8.0%) |
| 45 to 49 Years | 75 (13.7%) | 8 (1.0%) |
| 50 to 54 Years | 33 (6.0%) | 84 (10.5%) |
| 55 to 59 Years | 92 (16.8%) | 216 (27.1%) |
| 60 to 64 Years | 152 (27.7%) | 72 (9.0%) |
| 65 to 69 Years | 17 (3.1%) | 0 (0.0%) |
| 70 to 74 Years | 0 (0.0%) | 36 (4.5%) |
| 75 to 79 Years | 18 (3.3%) | 34 (4.3%) |
| 80 to 84 Years | 0 (0.0%) | 0 (0.0%) |
| 85 Years and over | 0 (0.0%) | 0 (0.0%) |
| Total | 548 (100.0%) | 796 (100.0%) |
Families and Households in Forest Lake
Median Family Size in Forest Lake
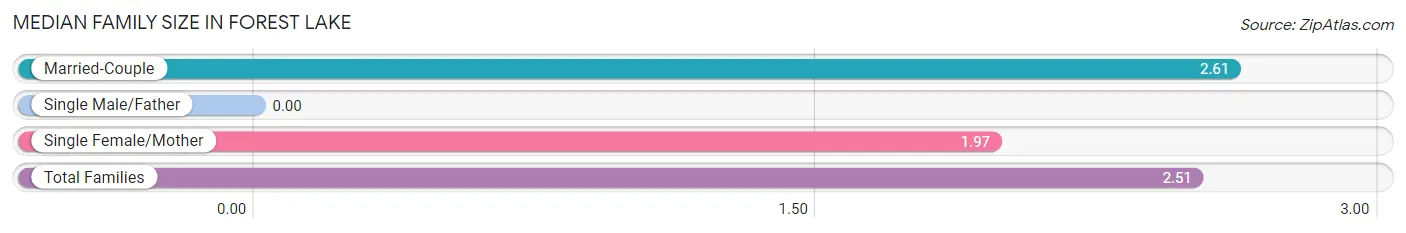
| Family Type | # Families | Family Size |
| Married-Couple | 406 (84.6%) | 2.61 |
| Single Male/Father | 0 (0.0%) | - |
| Single Female/Mother | 74 (15.4%) | 1.97 |
| Total Families | 480 (100.0%) | 2.51 |
Median Household Size in Forest Lake
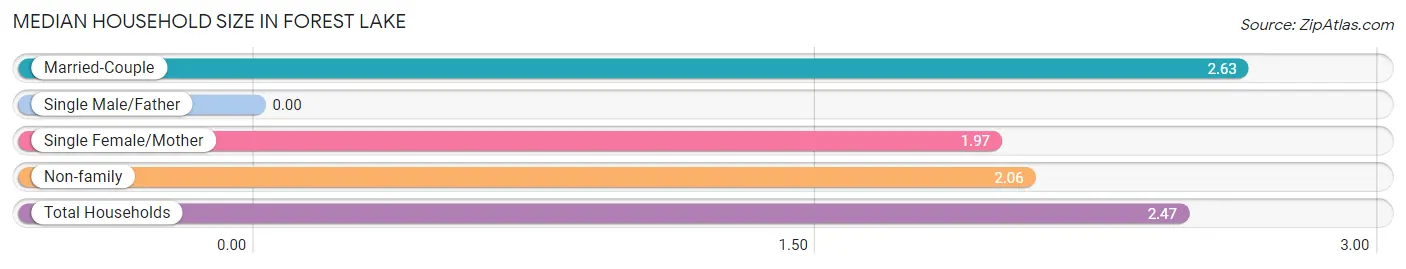
| Household Type | # Households | Household Size |
| Married-Couple | 406 (74.6%) | 2.63 |
| Single Male/Father | 0 (0.0%) | - |
| Single Female/Mother | 74 (13.6%) | 1.97 |
| Non-family | 64 (11.8%) | 2.06 |
| Total Households | 544 (100.0%) | 2.47 |
Household Size by Marriage Status in Forest Lake
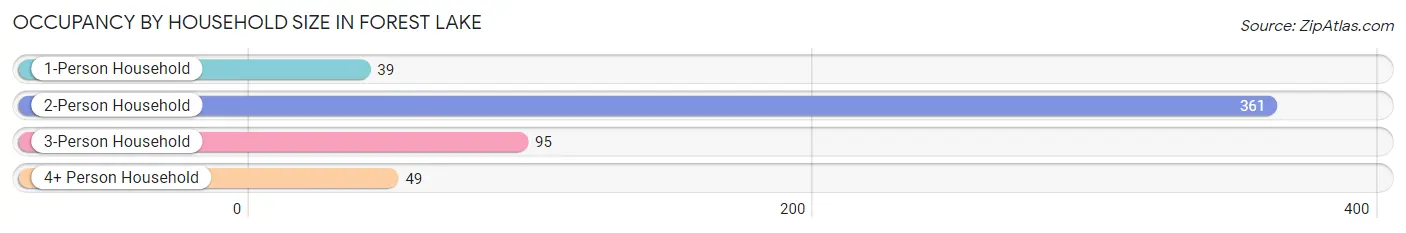
Out of a total of 544 households in Forest Lake, 480 (88.2%) are family households, while 64 (11.8%) are nonfamily households. The most numerous type of family households are 2-person households, comprising 361, and the most common type of nonfamily households are 1-person households, comprising 39.
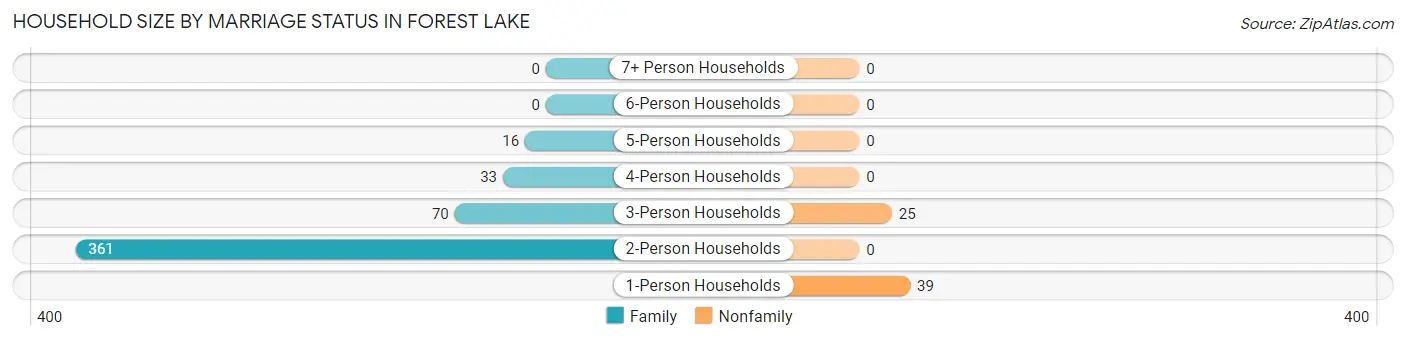
| Household Size | Family Households | Nonfamily Households |
| 1-Person Households | - | 39 (7.2%) |
| 2-Person Households | 361 (66.4%) | 0 (0.0%) |
| 3-Person Households | 70 (12.9%) | 25 (4.6%) |
| 4-Person Households | 33 (6.1%) | 0 (0.0%) |
| 5-Person Households | 16 (2.9%) | 0 (0.0%) |
| 6-Person Households | 0 (0.0%) | 0 (0.0%) |
| 7+ Person Households | 0 (0.0%) | 0 (0.0%) |
| Total | 480 (88.2%) | 64 (11.8%) |
Female Fertility in Forest Lake
Fertility by Age in Forest Lake
| Age Bracket | Women with Births | Births / 1,000 Women |
| 15 to 19 years | 0 (0.0%) | 0.0 |
| 20 to 34 years | 0 (0.0%) | 0.0 |
| 35 to 50 years | 0 (0.0%) | 0.0 |
| Total | 0 (0.0%) | 0.0 |
Fertility by Age by Marriage Status in Forest Lake
| Age Bracket | Married | Unmarried |
| 15 to 19 years | 0 (0.0%) | 0 (0.0%) |
| 20 to 34 years | 0 (0.0%) | 0 (0.0%) |
| 35 to 50 years | 0 (0.0%) | 0 (0.0%) |
| Total | 0 (0.0%) | 0 (0.0%) |
Fertility by Education in Forest Lake
| Educational Attainment | Women with Births | Births / 1,000 Women |
| Less than High School | 0 (0.0%) | 0.0 |
| High School Diploma | 0 (0.0%) | 0.0 |
| College or Associate's Degree | 0 (0.0%) | 0.0 |
| Bachelor's Degree | 0 (0.0%) | 0.0 |
| Graduate Degree | 0 (0.0%) | 0.0 |
| Total | 0 (0.0%) | 0.0 |
Fertility by Education by Marriage Status in Forest Lake
| Educational Attainment | Married | Unmarried |
| Less than High School | 0 (0.0%) | 0 (0.0%) |
| High School Diploma | 0 (0.0%) | 0 (0.0%) |
| College or Associate's Degree | 0 (0.0%) | 0 (0.0%) |
| Bachelor's Degree | 0 (0.0%) | 0 (0.0%) |
| Graduate Degree | 0 (0.0%) | 0 (0.0%) |
| Total | 0 (0.0%) | 0 (0.0%) |
Employment Characteristics in Forest Lake
Employment by Class of Employer in Forest Lake
Among the 963 employed individuals in Forest Lake, private company employees (691 | 71.8%), self-employed (incorporated) (136 | 14.1%), and local government employees (66 | 6.9%) make up the most common classes of employment.
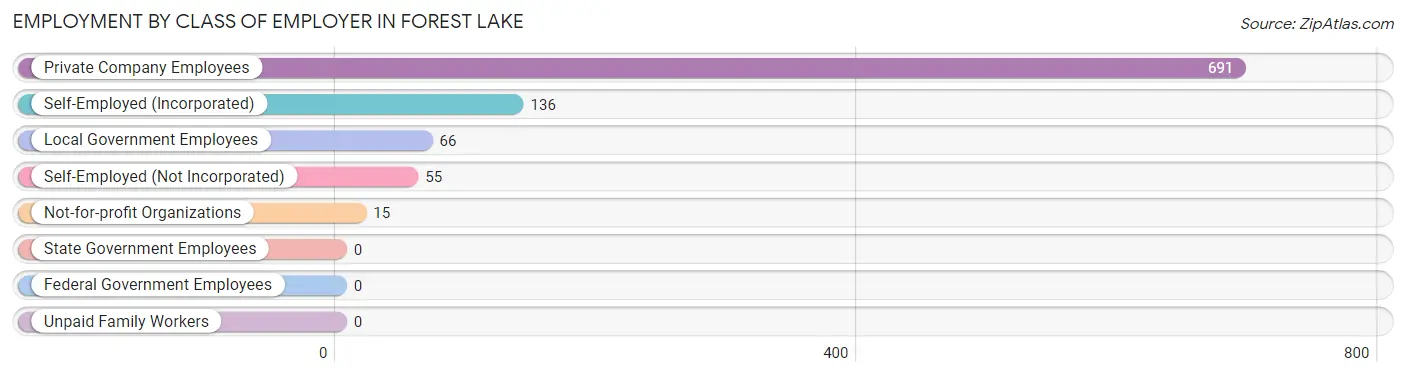
| Employer Class | # Employees | % Employees |
| Private Company Employees | 691 | 71.8% |
| Self-Employed (Incorporated) | 136 | 14.1% |
| Self-Employed (Not Incorporated) | 55 | 5.7% |
| Not-for-profit Organizations | 15 | 1.6% |
| Local Government Employees | 66 | 6.9% |
| State Government Employees | 0 | 0.0% |
| Federal Government Employees | 0 | 0.0% |
| Unpaid Family Workers | 0 | 0.0% |
| Total | 963 | 100.0% |
Employment Status by Age in Forest Lake
According to the labor force statistics for Forest Lake, out of the total population over 16 years of age (1,170), 87.0% or 1,018 individuals are in the labor force, with 5.4% or 55 of them unemployed. The age group with the highest labor force participation rate is 30 to 34 years, with 100.0% or 70 individuals in the labor force. Within the labor force, the 45 to 54 years age range has the highest percentage of unemployed individuals, with 14.3% or 24 of them being unemployed.
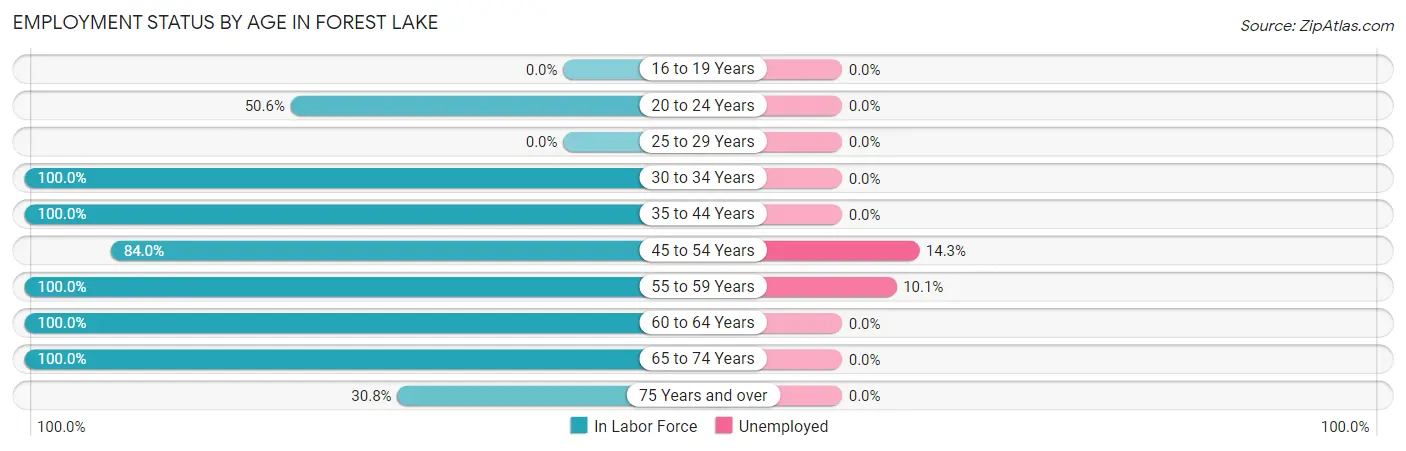
| Age Bracket | In Labor Force | Unemployed |
| 16 to 19 Years | 0 (0.0%) | 0 (0.0%) |
| 20 to 24 Years | 44 (50.6%) | 0 (0.0%) |
| 25 to 29 Years | 0 (0.0%) | 0 (0.0%) |
| 30 to 34 Years | 70 (100.0%) | 0 (0.0%) |
| 35 to 44 Years | 135 (100.0%) | 0 (0.0%) |
| 45 to 54 Years | 168 (84.0%) | 24 (14.3%) |
| 55 to 59 Years | 308 (100.0%) | 31 (10.1%) |
| 60 to 64 Years | 224 (100.0%) | 0 (0.0%) |
| 65 to 74 Years | 53 (100.0%) | 0 (0.0%) |
| 75 Years and over | 16 (30.8%) | 0 (0.0%) |
| Total | 1,018 (87.0%) | 55 (5.4%) |
Employment Status by Educational Attainment in Forest Lake
According to labor force statistics for Forest Lake, 96.6% of individuals (905) out of the total population between 25 and 64 years of age (937) are in the labor force, with 6.1% or 55 of them being unemployed. The group with the highest labor force participation rate are those with the educational attainment of less than high school, with 100.0% or 273 individuals in the labor force. Within the labor force, individuals with high school diploma education have the highest percentage of unemployment, with 32.6% or 45 of them being unemployed.
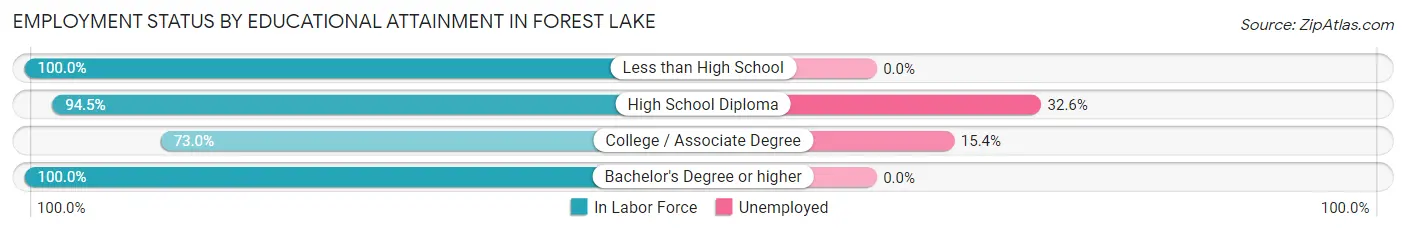
| Educational Attainment | In Labor Force | Unemployed |
| Less than High School | 273 (100.0%) | 0 (0.0%) |
| High School Diploma | 138 (94.5%) | 48 (32.6%) |
| College / Associate Degree | 65 (73.0%) | 14 (15.4%) |
| Bachelor's Degree or higher | 429 (100.0%) | 0 (0.0%) |
| Total | 905 (96.6%) | 57 (6.1%) |
Employment Occupations by Sex in Forest Lake
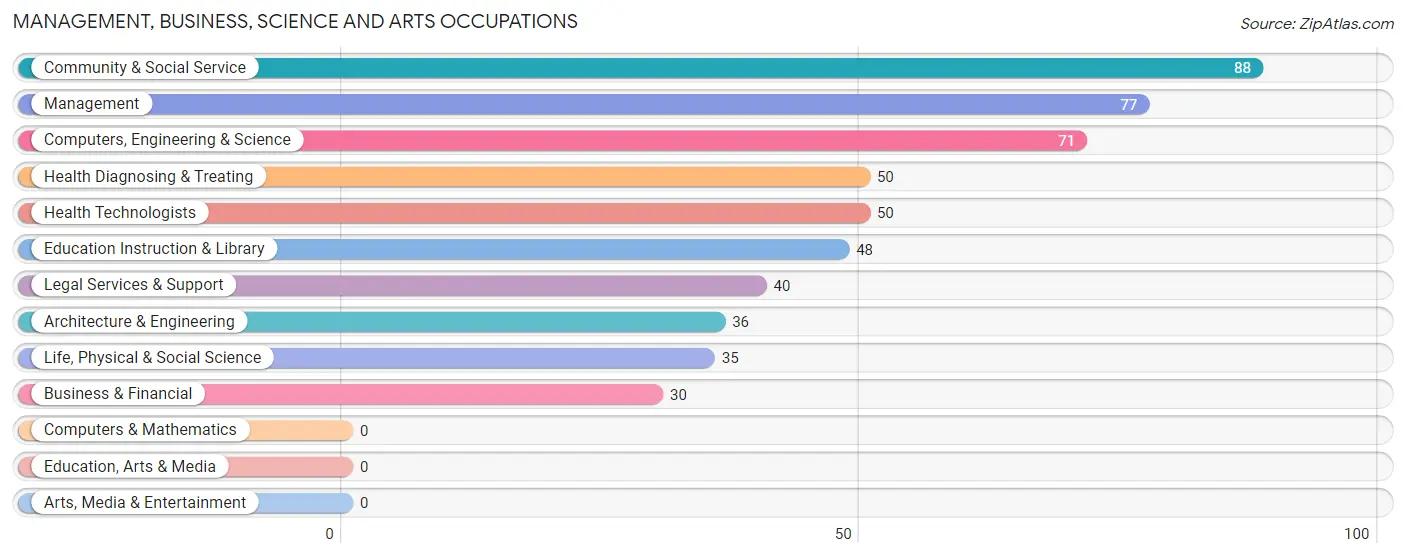
Management, Business, Science and Arts Occupations
The most common Management, Business, Science and Arts occupations in Forest Lake are Community & Social Service (88 | 9.1%), Management (77 | 8.0%), Computers, Engineering & Science (71 | 7.4%), Health Diagnosing & Treating (50 | 5.2%), and Health Technologists (50 | 5.2%).
Management, Business, Science and Arts Occupations by Sex
Within the Management, Business, Science and Arts occupations in Forest Lake, the most male-oriented occupations are Architecture & Engineering (100.0%), Business & Financial (53.3%), and Computers, Engineering & Science (50.7%), while the most female-oriented occupations are Life, Physical & Social Science (100.0%), Community & Social Service (100.0%), and Legal Services & Support (100.0%).
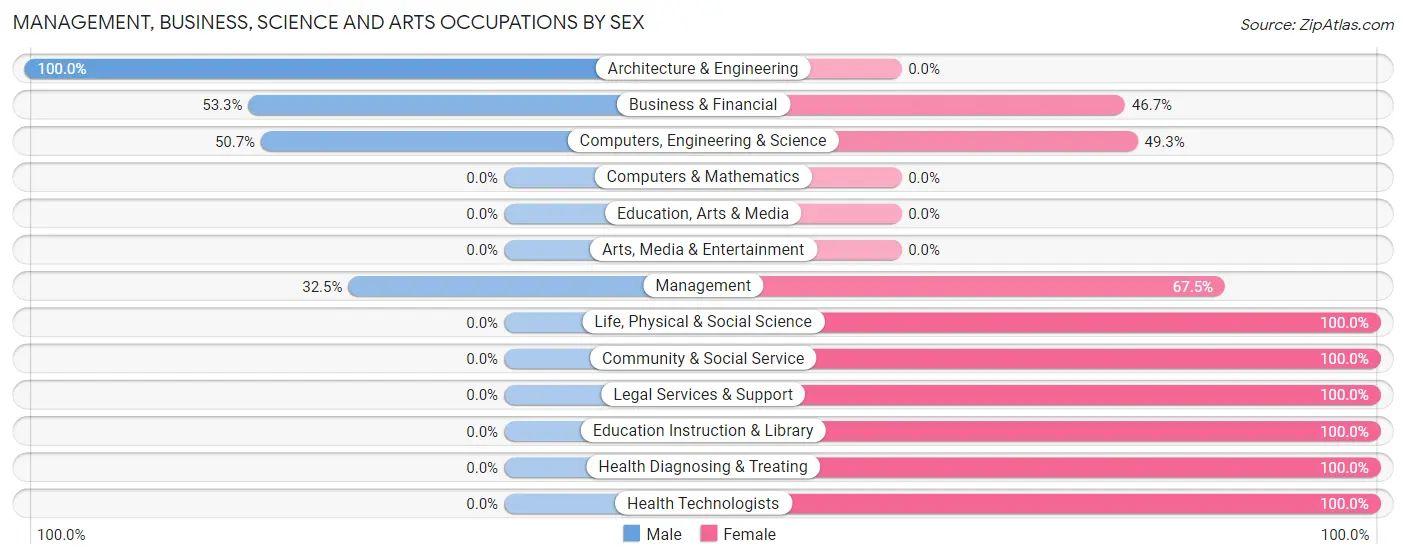
| Occupation | Male | Female |
| Management | 25 (32.5%) | 52 (67.5%) |
| Business & Financial | 16 (53.3%) | 14 (46.7%) |
| Computers, Engineering & Science | 36 (50.7%) | 35 (49.3%) |
| Computers & Mathematics | 0 (0.0%) | 0 (0.0%) |
| Architecture & Engineering | 36 (100.0%) | 0 (0.0%) |
| Life, Physical & Social Science | 0 (0.0%) | 35 (100.0%) |
| Community & Social Service | 0 (0.0%) | 88 (100.0%) |
| Education, Arts & Media | 0 (0.0%) | 0 (0.0%) |
| Legal Services & Support | 0 (0.0%) | 40 (100.0%) |
| Education Instruction & Library | 0 (0.0%) | 48 (100.0%) |
| Arts, Media & Entertainment | 0 (0.0%) | 0 (0.0%) |
| Health Diagnosing & Treating | 0 (0.0%) | 50 (100.0%) |
| Health Technologists | 0 (0.0%) | 50 (100.0%) |
| Total (Category) | 77 (24.4%) | 239 (75.6%) |
| Total (Overall) | 419 (43.5%) | 544 (56.5%) |
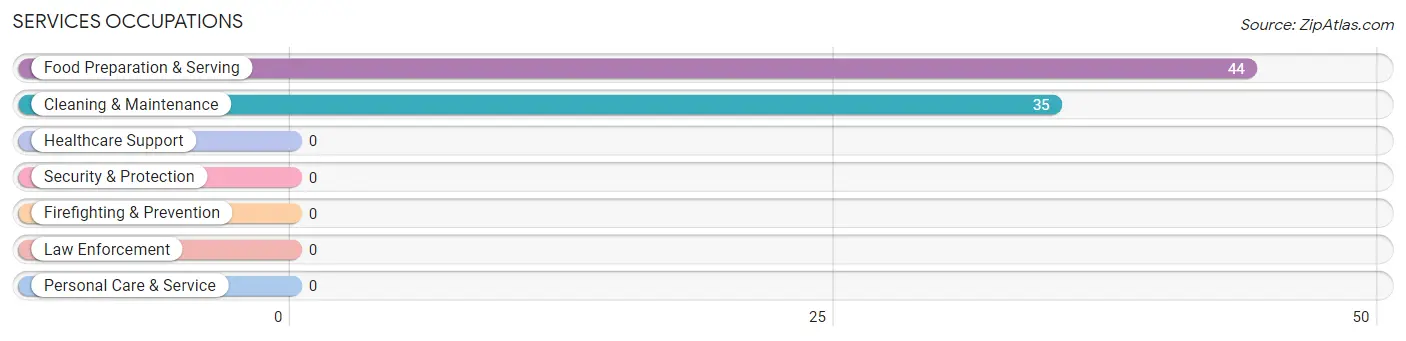
Services Occupations
The most common Services occupations in Forest Lake are Food Preparation & Serving (44 | 4.6%), and Cleaning & Maintenance (35 | 3.6%).
Services Occupations by Sex
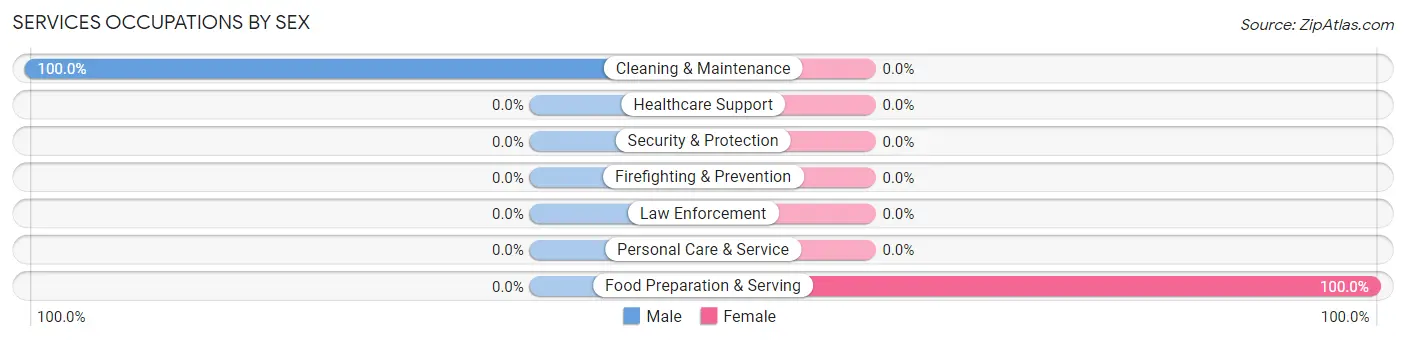
| Occupation | Male | Female |
| Healthcare Support | 0 (0.0%) | 0 (0.0%) |
| Security & Protection | 0 (0.0%) | 0 (0.0%) |
| Firefighting & Prevention | 0 (0.0%) | 0 (0.0%) |
| Law Enforcement | 0 (0.0%) | 0 (0.0%) |
| Food Preparation & Serving | 0 (0.0%) | 44 (100.0%) |
| Cleaning & Maintenance | 35 (100.0%) | 0 (0.0%) |
| Personal Care & Service | 0 (0.0%) | 0 (0.0%) |
| Total (Category) | 35 (44.3%) | 44 (55.7%) |
| Total (Overall) | 419 (43.5%) | 544 (56.5%) |
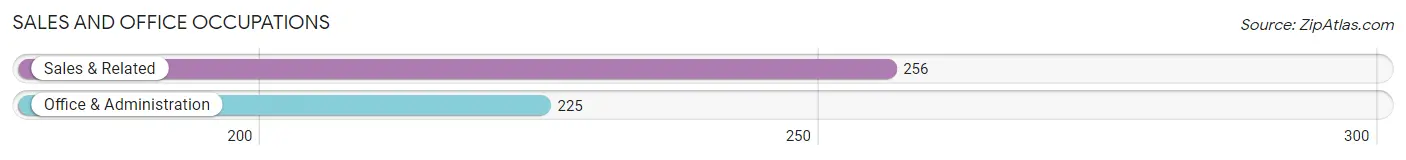
Sales and Office Occupations
The most common Sales and Office occupations in Forest Lake are Sales & Related (256 | 26.6%), and Office & Administration (225 | 23.4%).
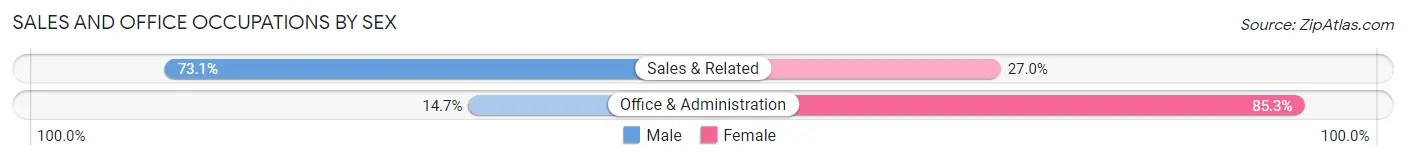
Sales and Office Occupations by Sex
| Occupation | Male | Female |
| Sales & Related | 187 (73.1%) | 69 (27.0%) |
| Office & Administration | 33 (14.7%) | 192 (85.3%) |
| Total (Category) | 220 (45.7%) | 261 (54.3%) |
| Total (Overall) | 419 (43.5%) | 544 (56.5%) |
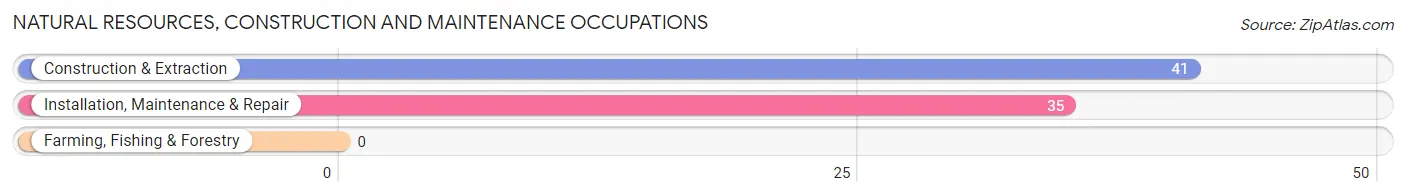
Natural Resources, Construction and Maintenance Occupations
The most common Natural Resources, Construction and Maintenance occupations in Forest Lake are Construction & Extraction (41 | 4.3%), and Installation, Maintenance & Repair (35 | 3.6%).
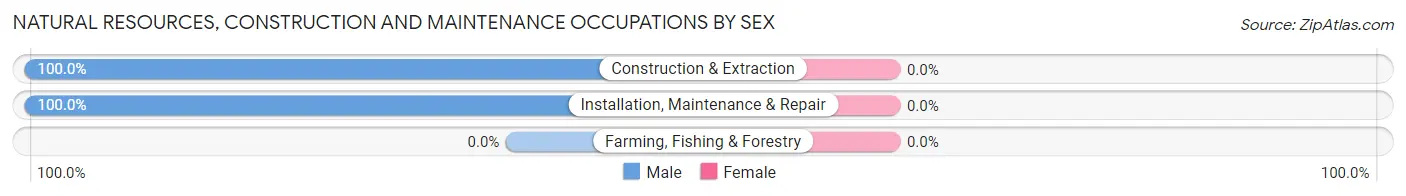
Natural Resources, Construction and Maintenance Occupations by Sex
| Occupation | Male | Female |
| Farming, Fishing & Forestry | 0 (0.0%) | 0 (0.0%) |
| Construction & Extraction | 41 (100.0%) | 0 (0.0%) |
| Installation, Maintenance & Repair | 35 (100.0%) | 0 (0.0%) |
| Total (Category) | 76 (100.0%) | 0 (0.0%) |
| Total (Overall) | 419 (43.5%) | 544 (56.5%) |
Production, Transportation and Moving Occupations
The most common Production, Transportation and Moving occupations in Forest Lake are , and Production (11 | 1.1%).
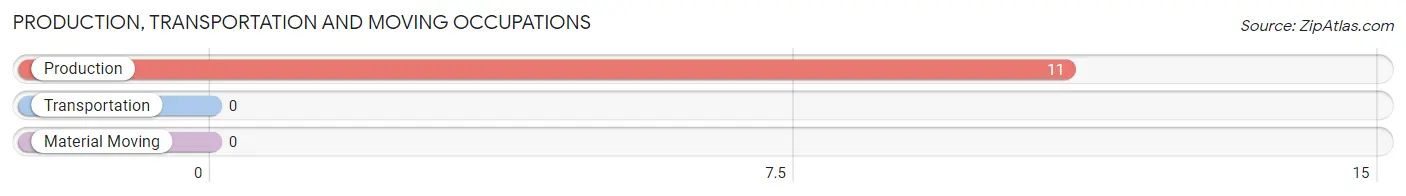
Production, Transportation and Moving Occupations by Sex
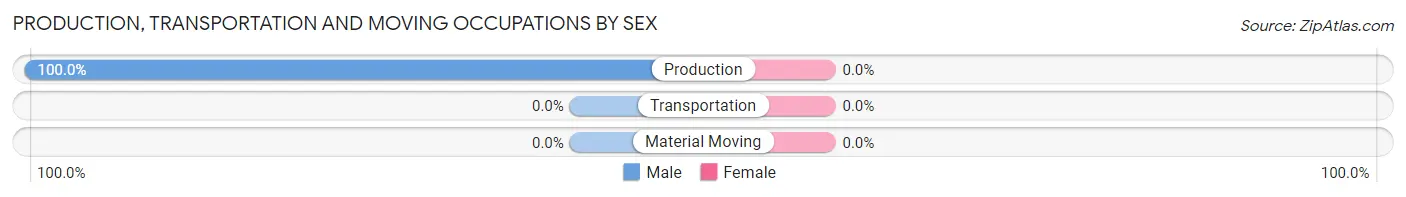
| Occupation | Male | Female |
| Production | 11 (100.0%) | 0 (0.0%) |
| Transportation | 0 (0.0%) | 0 (0.0%) |
| Material Moving | 0 (0.0%) | 0 (0.0%) |
| Total (Category) | 11 (100.0%) | 0 (0.0%) |
| Total (Overall) | 419 (43.5%) | 544 (56.5%) |
Employment Industries by Sex in Forest Lake
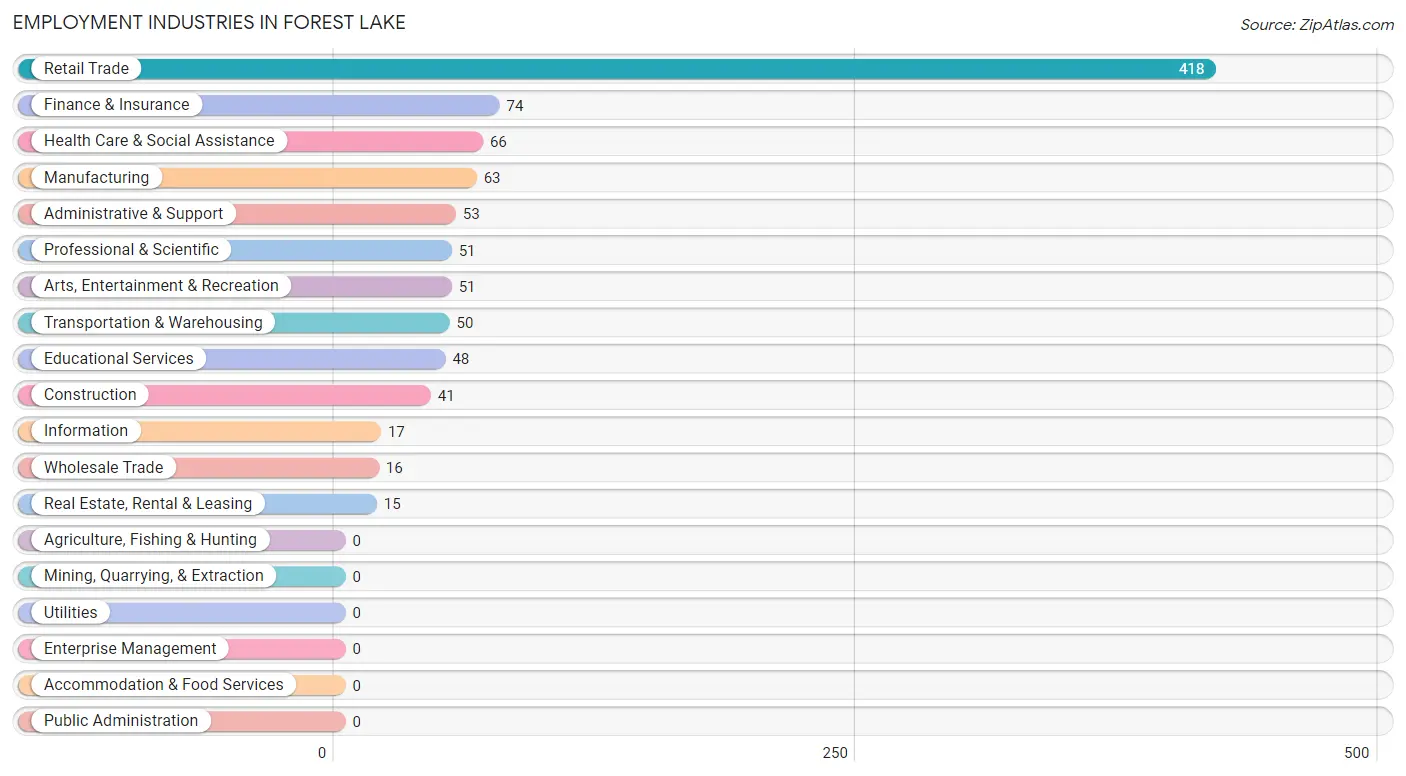
Employment Industries in Forest Lake
The major employment industries in Forest Lake include Retail Trade (418 | 43.4%), Finance & Insurance (74 | 7.7%), Health Care & Social Assistance (66 | 6.9%), Manufacturing (63 | 6.5%), and Administrative & Support (53 | 5.5%).
Employment Industries by Sex in Forest Lake
The Forest Lake industries that see more men than women are Construction (100.0%), Wholesale Trade (100.0%), and Information (100.0%), whereas the industries that tend to have a higher number of women are Finance & Insurance (100.0%), Real Estate, Rental & Leasing (100.0%), and Professional & Scientific (100.0%).
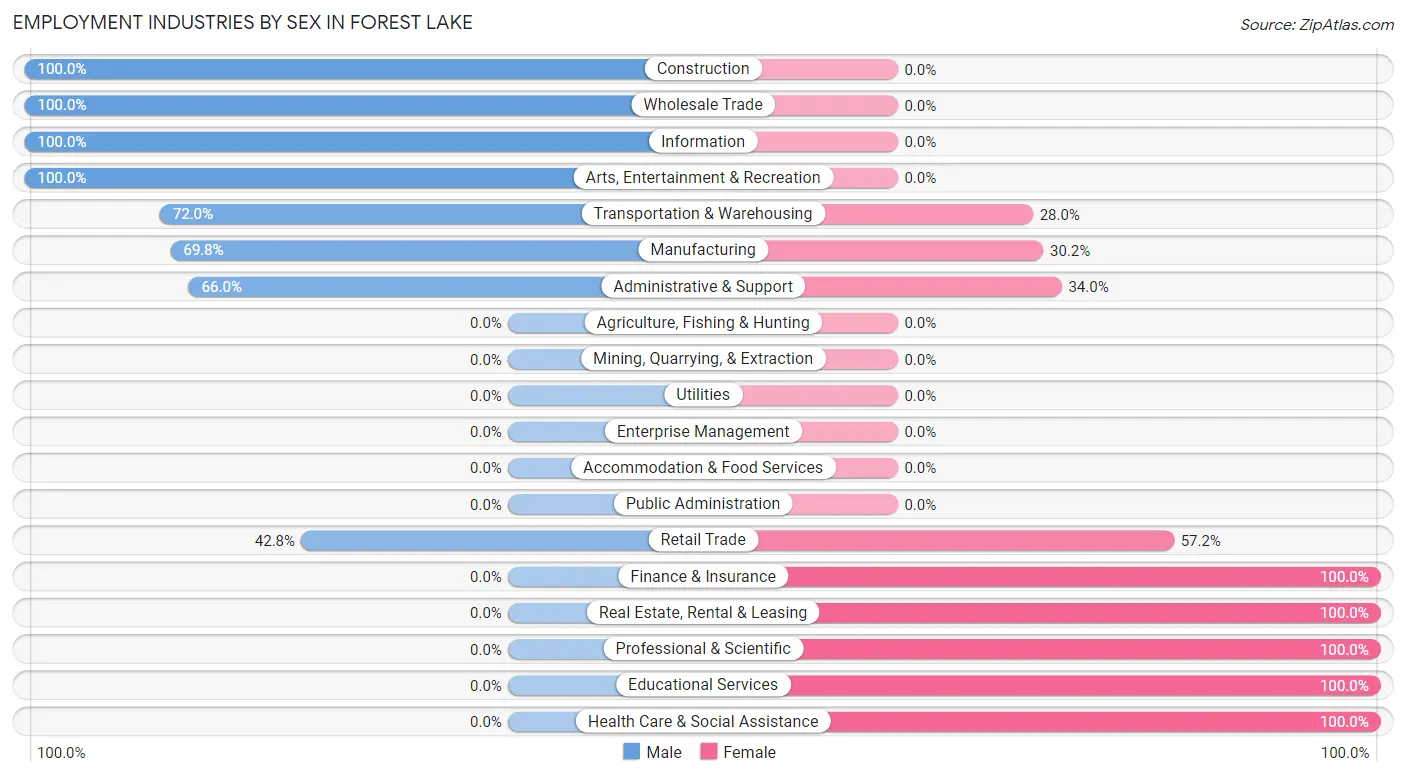
| Industry | Male | Female |
| Agriculture, Fishing & Hunting | 0 (0.0%) | 0 (0.0%) |
| Mining, Quarrying, & Extraction | 0 (0.0%) | 0 (0.0%) |
| Construction | 41 (100.0%) | 0 (0.0%) |
| Manufacturing | 44 (69.8%) | 19 (30.2%) |
| Wholesale Trade | 16 (100.0%) | 0 (0.0%) |
| Retail Trade | 179 (42.8%) | 239 (57.2%) |
| Transportation & Warehousing | 36 (72.0%) | 14 (28.0%) |
| Utilities | 0 (0.0%) | 0 (0.0%) |
| Information | 17 (100.0%) | 0 (0.0%) |
| Finance & Insurance | 0 (0.0%) | 74 (100.0%) |
| Real Estate, Rental & Leasing | 0 (0.0%) | 15 (100.0%) |
| Professional & Scientific | 0 (0.0%) | 51 (100.0%) |
| Enterprise Management | 0 (0.0%) | 0 (0.0%) |
| Administrative & Support | 35 (66.0%) | 18 (34.0%) |
| Educational Services | 0 (0.0%) | 48 (100.0%) |
| Health Care & Social Assistance | 0 (0.0%) | 66 (100.0%) |
| Arts, Entertainment & Recreation | 51 (100.0%) | 0 (0.0%) |
| Accommodation & Food Services | 0 (0.0%) | 0 (0.0%) |
| Public Administration | 0 (0.0%) | 0 (0.0%) |
| Total | 419 (43.5%) | 544 (56.5%) |
Education in Forest Lake
School Enrollment in Forest Lake
The most common levels of schooling among the 221 students in Forest Lake are middle school (101 | 45.7%), graduate / professional (43 | 19.5%), and high school (41 | 18.5%).
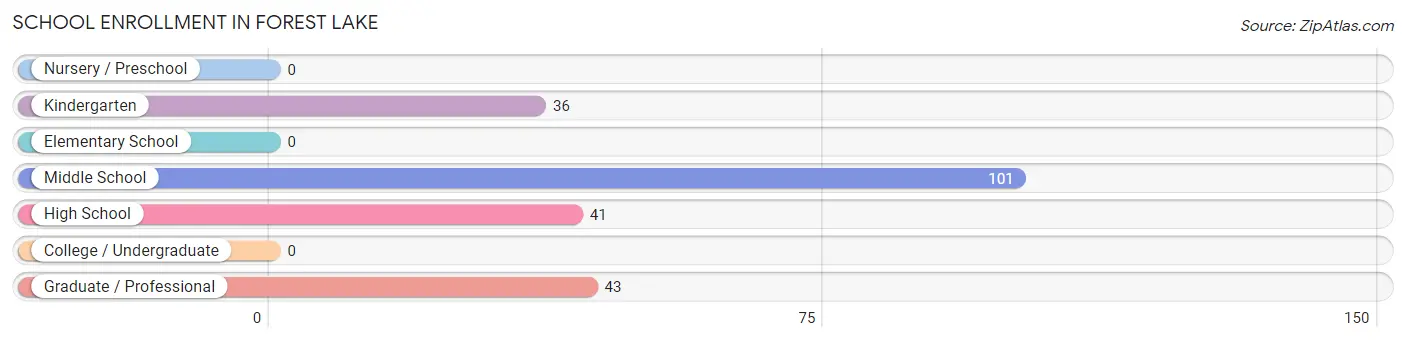
| School Level | # Students | % Students |
| Nursery / Preschool | 0 | 0.0% |
| Kindergarten | 36 | 16.3% |
| Elementary School | 0 | 0.0% |
| Middle School | 101 | 45.7% |
| High School | 41 | 18.5% |
| College / Undergraduate | 0 | 0.0% |
| Graduate / Professional | 43 | 19.5% |
| Total | 221 | 100.0% |
School Enrollment by Age by Funding Source in Forest Lake
Out of a total of 221 students who are enrolled in schools in Forest Lake, 43 (19.5%) attend a private institution, while the remaining 178 (80.5%) are enrolled in public schools. The age group of 20 to 24 year olds has the highest likelihood of being enrolled in private schools, with 43 (100.0% in the age bracket) enrolled. Conversely, the age group of 5 to 9 year old has the lowest likelihood of being enrolled in a private school, with 36 (100.0% in the age bracket) attending a public institution.
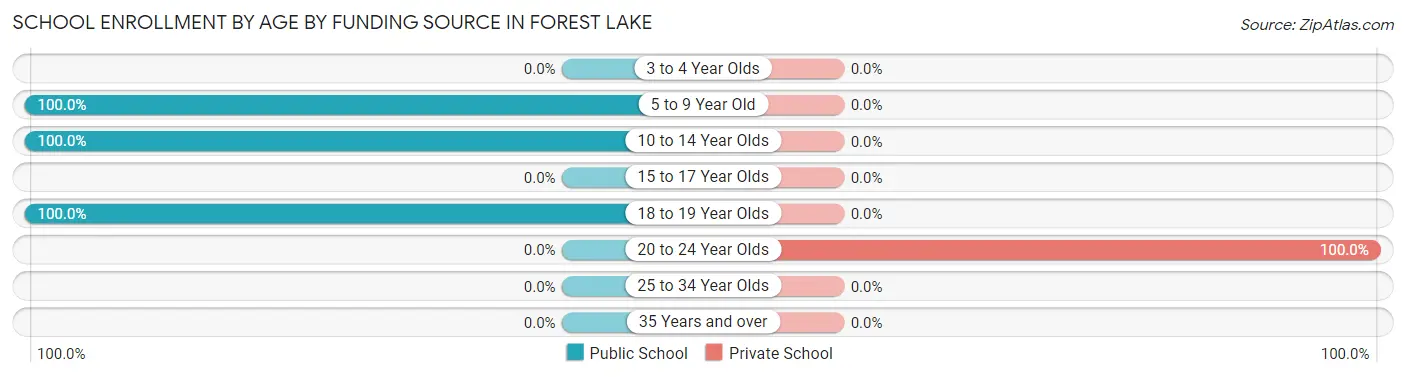
| Age Bracket | Public School | Private School |
| 3 to 4 Year Olds | 0 (0.0%) | 0 (0.0%) |
| 5 to 9 Year Old | 36 (100.0%) | 0 (0.0%) |
| 10 to 14 Year Olds | 101 (100.0%) | 0 (0.0%) |
| 15 to 17 Year Olds | 0 (0.0%) | 0 (0.0%) |
| 18 to 19 Year Olds | 41 (100.0%) | 0 (0.0%) |
| 20 to 24 Year Olds | 0 (0.0%) | 43 (100.0%) |
| 25 to 34 Year Olds | 0 (0.0%) | 0 (0.0%) |
| 35 Years and over | 0 (0.0%) | 0 (0.0%) |
| Total | 178 (80.5%) | 43 (19.5%) |
Educational Attainment by Field of Study in Forest Lake
Business (69 | 15.0%), arts & humanities (69 | 15.0%), science & technology (65 | 14.1%), communications (51 | 11.1%), and psychology (50 | 10.8%) are the most common fields of study among 461 individuals in Forest Lake who have obtained a bachelor's degree or higher.
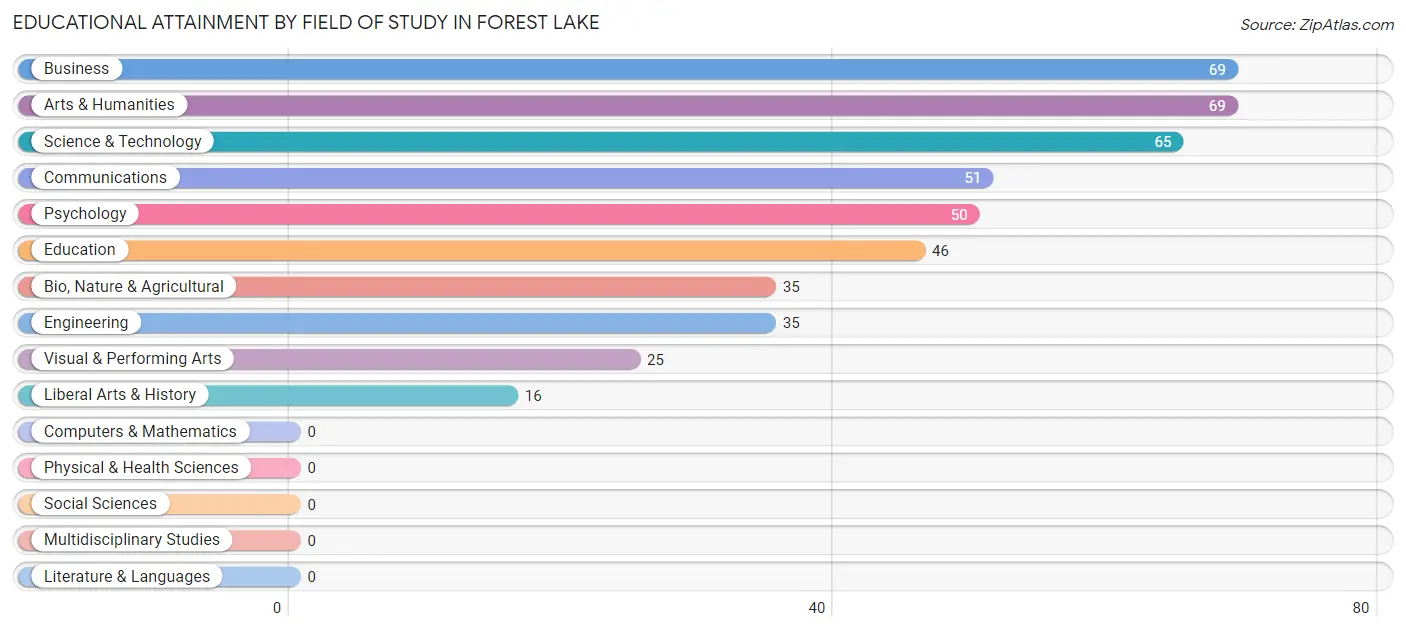
| Field of Study | # Graduates | % Graduates |
| Computers & Mathematics | 0 | 0.0% |
| Bio, Nature & Agricultural | 35 | 7.6% |
| Physical & Health Sciences | 0 | 0.0% |
| Psychology | 50 | 10.8% |
| Social Sciences | 0 | 0.0% |
| Engineering | 35 | 7.6% |
| Multidisciplinary Studies | 0 | 0.0% |
| Science & Technology | 65 | 14.1% |
| Business | 69 | 15.0% |
| Education | 46 | 10.0% |
| Literature & Languages | 0 | 0.0% |
| Liberal Arts & History | 16 | 3.5% |
| Visual & Performing Arts | 25 | 5.4% |
| Communications | 51 | 11.1% |
| Arts & Humanities | 69 | 15.0% |
| Total | 461 | 100.0% |
Transportation & Commute in Forest Lake
Vehicle Availability by Sex in Forest Lake
The most prevalent vehicle ownership categories in Forest Lake are males with 2 vehicles (248, accounting for 59.2%) and females with 2 vehicles (300, making up 45.6%).
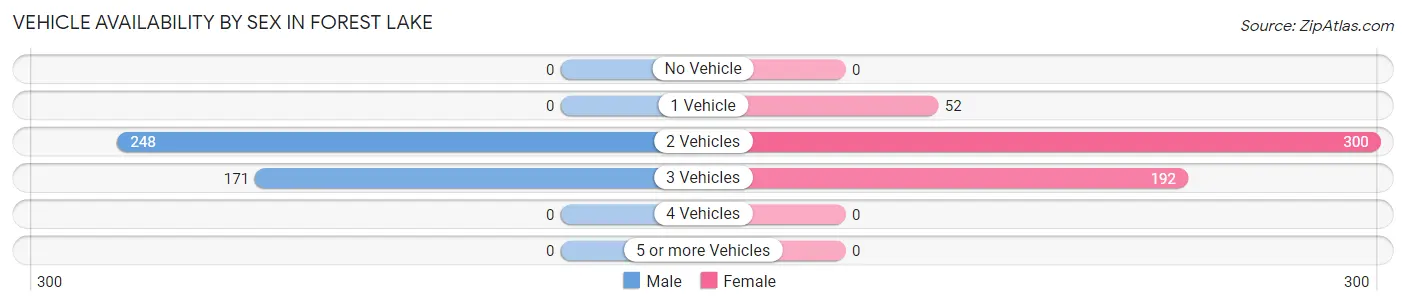
| Vehicles Available | Male | Female |
| No Vehicle | 0 (0.0%) | 0 (0.0%) |
| 1 Vehicle | 0 (0.0%) | 52 (9.6%) |
| 2 Vehicles | 248 (59.2%) | 300 (55.1%) |
| 3 Vehicles | 171 (40.8%) | 192 (35.3%) |
| 4 Vehicles | 0 (0.0%) | 0 (0.0%) |
| 5 or more Vehicles | 0 (0.0%) | 0 (0.0%) |
| Total | 419 (100.0%) | 544 (100.0%) |
Commute Time in Forest Lake
The most frequently occuring commute durations in Forest Lake are 45 to 59 minutes (353 commuters, 39.3%), 15 to 19 minutes (148 commuters, 16.5%), and 5 to 9 minutes (131 commuters, 14.6%).
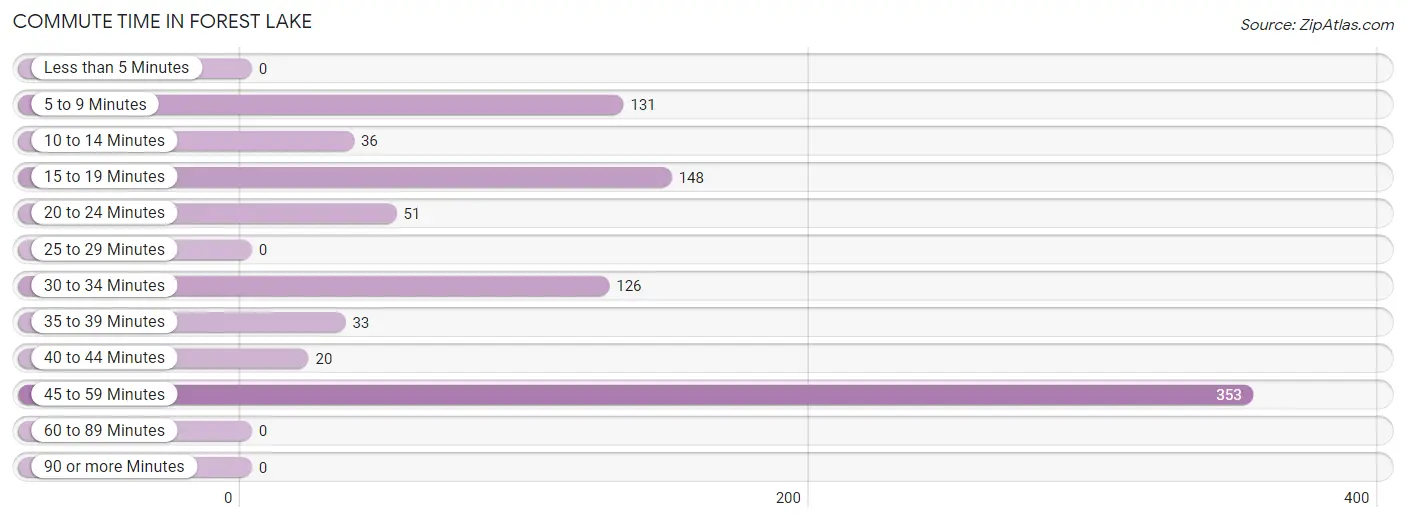
| Commute Time | # Commuters | % Commuters |
| Less than 5 Minutes | 0 | 0.0% |
| 5 to 9 Minutes | 131 | 14.6% |
| 10 to 14 Minutes | 36 | 4.0% |
| 15 to 19 Minutes | 148 | 16.5% |
| 20 to 24 Minutes | 51 | 5.7% |
| 25 to 29 Minutes | 0 | 0.0% |
| 30 to 34 Minutes | 126 | 14.0% |
| 35 to 39 Minutes | 33 | 3.7% |
| 40 to 44 Minutes | 20 | 2.2% |
| 45 to 59 Minutes | 353 | 39.3% |
| 60 to 89 Minutes | 0 | 0.0% |
| 90 or more Minutes | 0 | 0.0% |
Commute Time by Sex in Forest Lake
The most common commute times in Forest Lake are 45 to 59 minutes (161 commuters, 43.5%) for males and 45 to 59 minutes (192 commuters, 36.4%) for females.
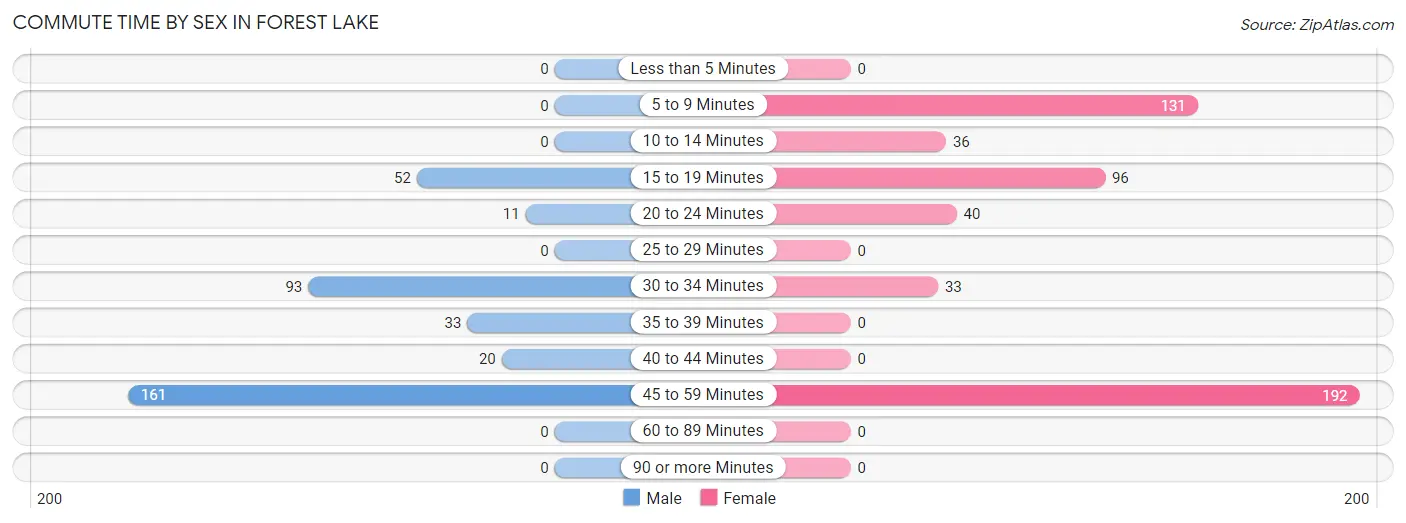
| Commute Time | Male | Female |
| Less than 5 Minutes | 0 (0.0%) | 0 (0.0%) |
| 5 to 9 Minutes | 0 (0.0%) | 131 (24.8%) |
| 10 to 14 Minutes | 0 (0.0%) | 36 (6.8%) |
| 15 to 19 Minutes | 52 (14.1%) | 96 (18.2%) |
| 20 to 24 Minutes | 11 (3.0%) | 40 (7.6%) |
| 25 to 29 Minutes | 0 (0.0%) | 0 (0.0%) |
| 30 to 34 Minutes | 93 (25.1%) | 33 (6.2%) |
| 35 to 39 Minutes | 33 (8.9%) | 0 (0.0%) |
| 40 to 44 Minutes | 20 (5.4%) | 0 (0.0%) |
| 45 to 59 Minutes | 161 (43.5%) | 192 (36.4%) |
| 60 to 89 Minutes | 0 (0.0%) | 0 (0.0%) |
| 90 or more Minutes | 0 (0.0%) | 0 (0.0%) |
Time of Departure to Work by Sex in Forest Lake
The most frequent times of departure to work in Forest Lake are 7:30 AM to 7:59 AM (141, 38.1%) for males and 7:30 AM to 7:59 AM (194, 36.7%) for females.
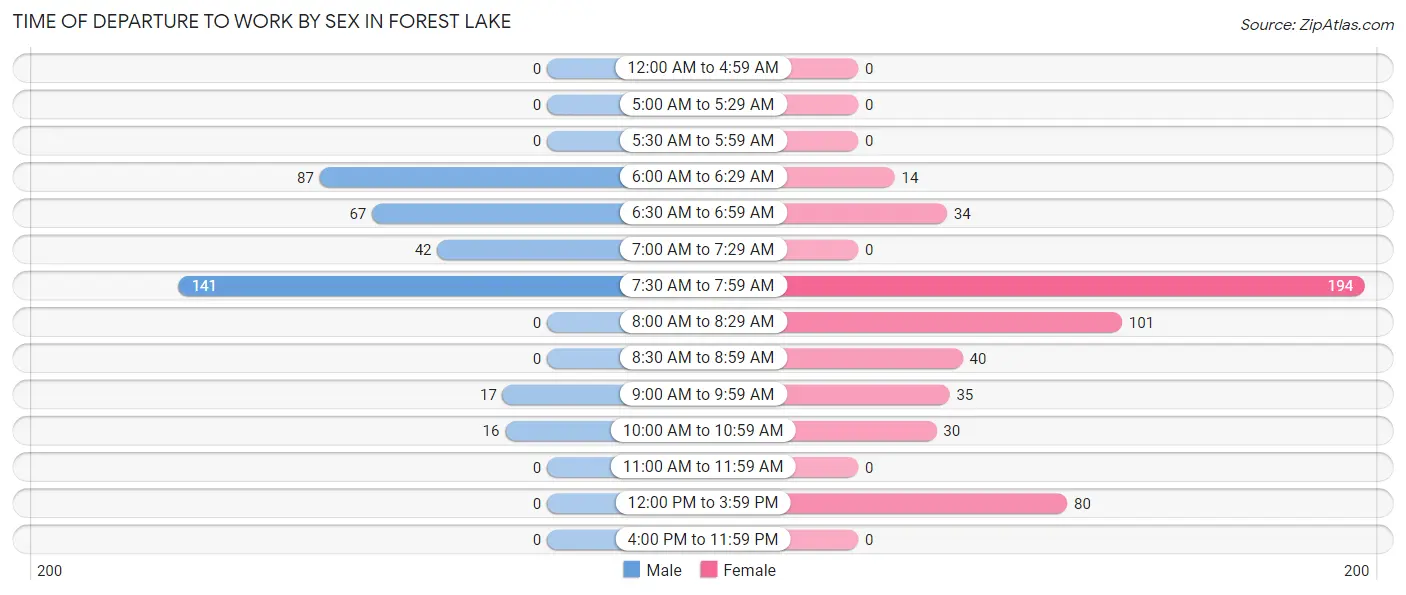
| Time of Departure | Male | Female |
| 12:00 AM to 4:59 AM | 0 (0.0%) | 0 (0.0%) |
| 5:00 AM to 5:29 AM | 0 (0.0%) | 0 (0.0%) |
| 5:30 AM to 5:59 AM | 0 (0.0%) | 0 (0.0%) |
| 6:00 AM to 6:29 AM | 87 (23.5%) | 14 (2.6%) |
| 6:30 AM to 6:59 AM | 67 (18.1%) | 34 (6.4%) |
| 7:00 AM to 7:29 AM | 42 (11.4%) | 0 (0.0%) |
| 7:30 AM to 7:59 AM | 141 (38.1%) | 194 (36.7%) |
| 8:00 AM to 8:29 AM | 0 (0.0%) | 101 (19.1%) |
| 8:30 AM to 8:59 AM | 0 (0.0%) | 40 (7.6%) |
| 9:00 AM to 9:59 AM | 17 (4.6%) | 35 (6.6%) |
| 10:00 AM to 10:59 AM | 16 (4.3%) | 30 (5.7%) |
| 11:00 AM to 11:59 AM | 0 (0.0%) | 0 (0.0%) |
| 12:00 PM to 3:59 PM | 0 (0.0%) | 80 (15.1%) |
| 4:00 PM to 11:59 PM | 0 (0.0%) | 0 (0.0%) |
| Total | 370 (100.0%) | 528 (100.0%) |
Housing Occupancy in Forest Lake
Occupancy by Ownership in Forest Lake
Of the total 544 dwellings in Forest Lake, owner-occupied units account for 520 (95.6%), while renter-occupied units make up 24 (4.4%).
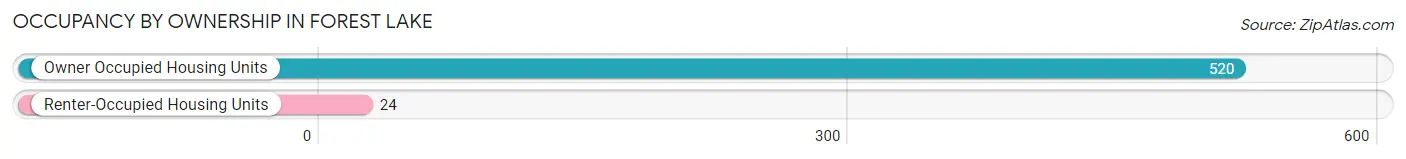
| Occupancy | # Housing Units | % Housing Units |
| Owner Occupied Housing Units | 520 | 95.6% |
| Renter-Occupied Housing Units | 24 | 4.4% |
| Total Occupied Housing Units | 544 | 100.0% |
Occupancy by Household Size in Forest Lake
| Household Size | # Housing Units | % Housing Units |
| 1-Person Household | 39 | 7.2% |
| 2-Person Household | 361 | 66.4% |
| 3-Person Household | 95 | 17.5% |
| 4+ Person Household | 49 | 9.0% |
| Total Housing Units | 544 | 100.0% |
Occupancy by Ownership by Household Size in Forest Lake
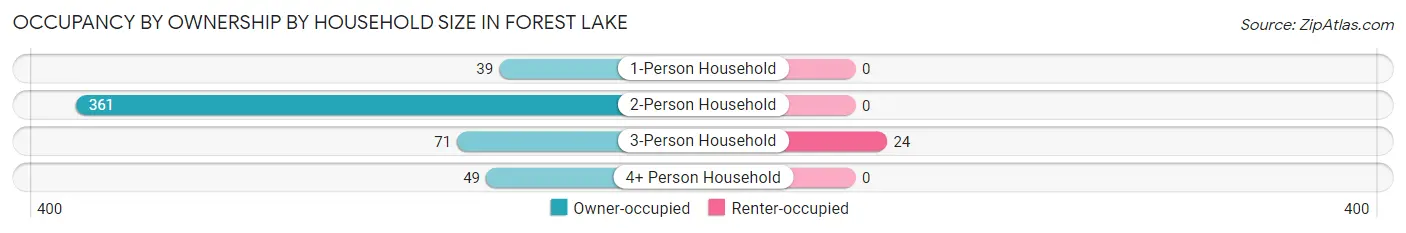
| Household Size | Owner-occupied | Renter-occupied |
| 1-Person Household | 39 (100.0%) | 0 (0.0%) |
| 2-Person Household | 361 (100.0%) | 0 (0.0%) |
| 3-Person Household | 71 (74.7%) | 24 (25.3%) |
| 4+ Person Household | 49 (100.0%) | 0 (0.0%) |
| Total Housing Units | 520 (95.6%) | 24 (4.4%) |
Occupancy by Educational Attainment in Forest Lake
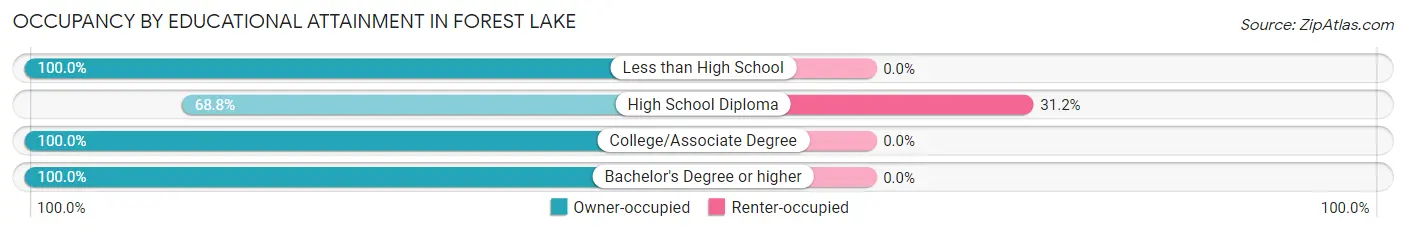
| Household Size | Owner-occupied | Renter-occupied |
| Less than High School | 132 (100.0%) | 0 (0.0%) |
| High School Diploma | 53 (68.8%) | 24 (31.2%) |
| College/Associate Degree | 58 (100.0%) | 0 (0.0%) |
| Bachelor's Degree or higher | 277 (100.0%) | 0 (0.0%) |
Occupancy by Age of Householder in Forest Lake
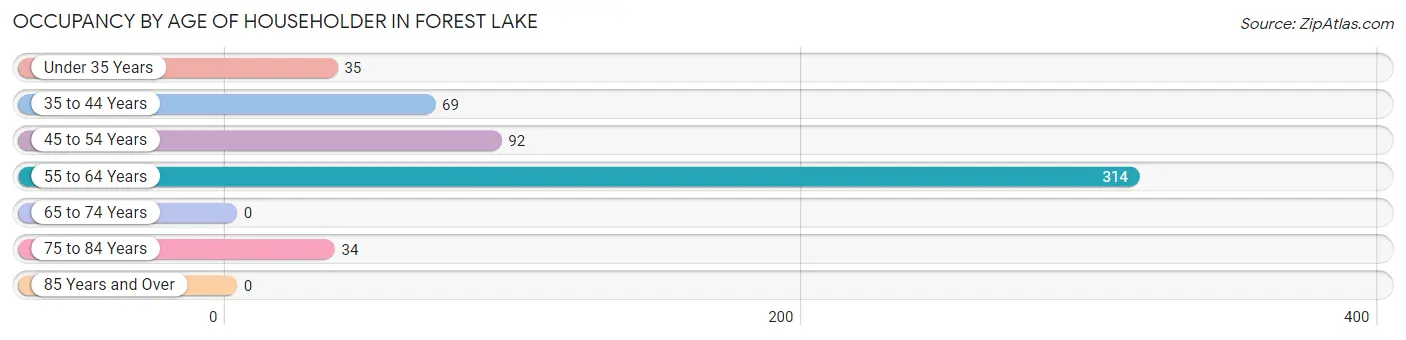
| Age Bracket | # Households | % Households |
| Under 35 Years | 35 | 6.4% |
| 35 to 44 Years | 69 | 12.7% |
| 45 to 54 Years | 92 | 16.9% |
| 55 to 64 Years | 314 | 57.7% |
| 65 to 74 Years | 0 | 0.0% |
| 75 to 84 Years | 34 | 6.2% |
| 85 Years and Over | 0 | 0.0% |
| Total | 544 | 100.0% |
Housing Finances in Forest Lake
Median Income by Occupancy in Forest Lake
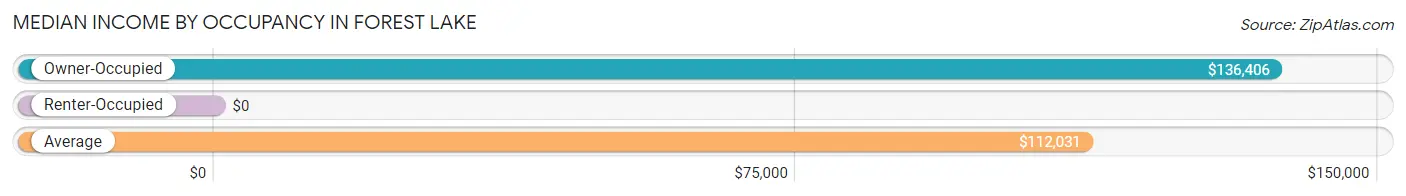
| Occupancy Type | # Households | Median Income |
| Owner-Occupied | 520 (95.6%) | $136,406 |
| Renter-Occupied | 24 (4.4%) | $0 |
| Average | 544 (100.0%) | $112,031 |
Occupancy by Householder Income Bracket in Forest Lake
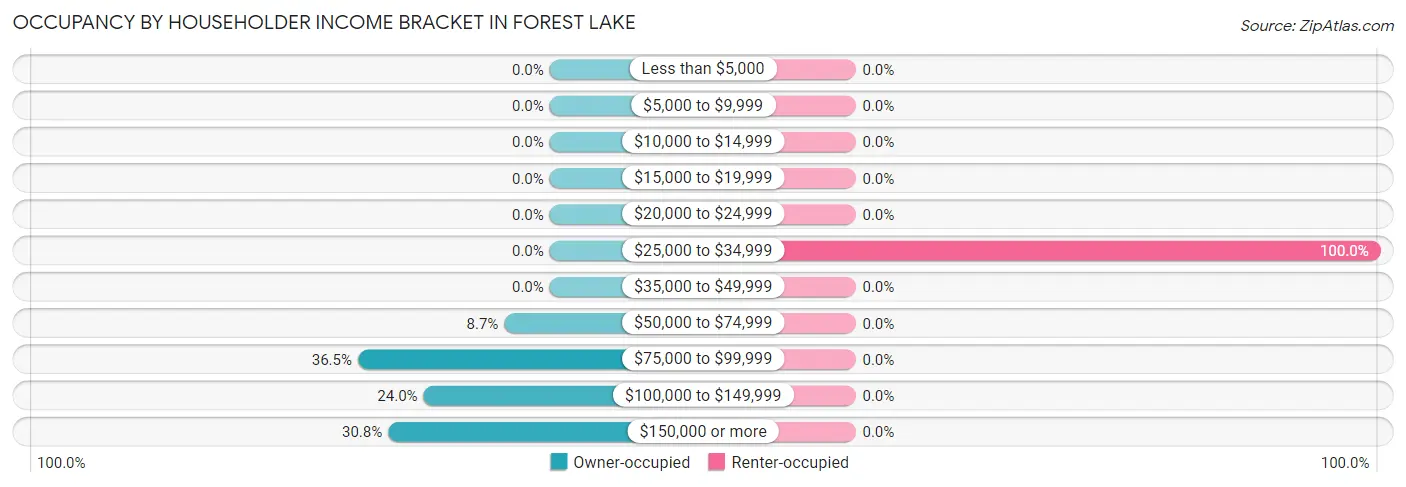
| Income Bracket | Owner-occupied | Renter-occupied |
| Less than $5,000 | 0 (0.0%) | 0 (0.0%) |
| $5,000 to $9,999 | 0 (0.0%) | 0 (0.0%) |
| $10,000 to $14,999 | 0 (0.0%) | 0 (0.0%) |
| $15,000 to $19,999 | 0 (0.0%) | 0 (0.0%) |
| $20,000 to $24,999 | 0 (0.0%) | 0 (0.0%) |
| $25,000 to $34,999 | 0 (0.0%) | 24 (100.0%) |
| $35,000 to $49,999 | 0 (0.0%) | 0 (0.0%) |
| $50,000 to $74,999 | 45 (8.6%) | 0 (0.0%) |
| $75,000 to $99,999 | 190 (36.5%) | 0 (0.0%) |
| $100,000 to $149,999 | 125 (24.0%) | 0 (0.0%) |
| $150,000 or more | 160 (30.8%) | 0 (0.0%) |
| Total | 520 (100.0%) | 24 (100.0%) |
Monthly Housing Cost Tiers in Forest Lake
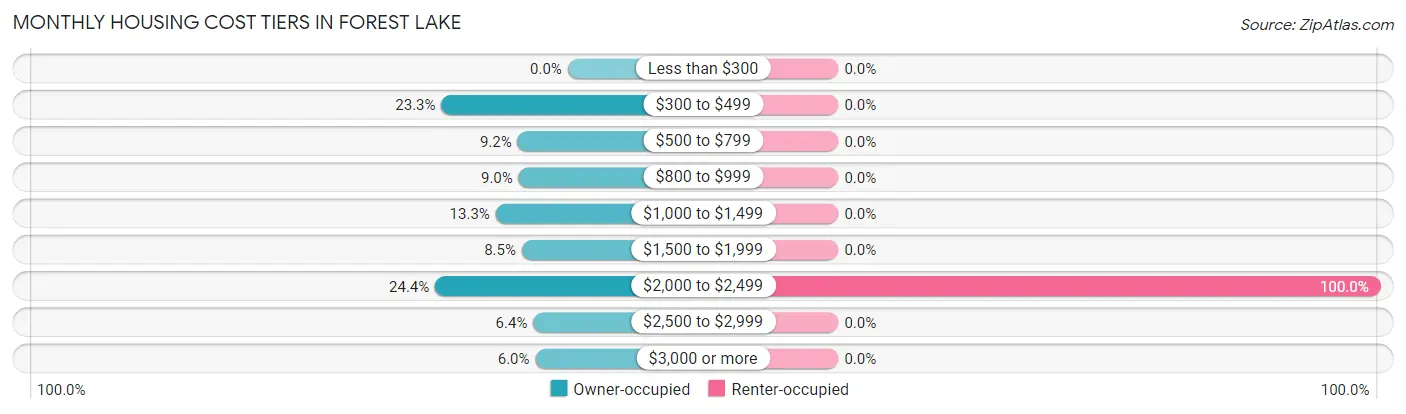
| Monthly Cost | Owner-occupied | Renter-occupied |
| Less than $300 | 0 (0.0%) | 0 (0.0%) |
| $300 to $499 | 121 (23.3%) | 0 (0.0%) |
| $500 to $799 | 48 (9.2%) | 0 (0.0%) |
| $800 to $999 | 47 (9.0%) | 0 (0.0%) |
| $1,000 to $1,499 | 69 (13.3%) | 0 (0.0%) |
| $1,500 to $1,999 | 44 (8.5%) | 0 (0.0%) |
| $2,000 to $2,499 | 127 (24.4%) | 24 (100.0%) |
| $2,500 to $2,999 | 33 (6.4%) | 0 (0.0%) |
| $3,000 or more | 31 (6.0%) | 0 (0.0%) |
| Total | 520 (100.0%) | 24 (100.0%) |
Physical Housing Characteristics in Forest Lake
Housing Structures in Forest Lake
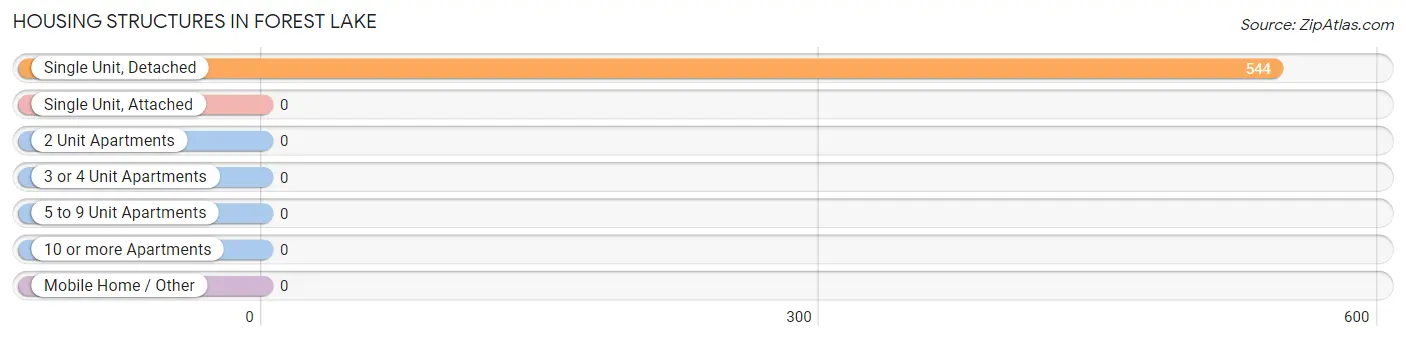
| Structure Type | # Housing Units | % Housing Units |
| Single Unit, Detached | 544 | 100.0% |
| Single Unit, Attached | 0 | 0.0% |
| 2 Unit Apartments | 0 | 0.0% |
| 3 or 4 Unit Apartments | 0 | 0.0% |
| 5 to 9 Unit Apartments | 0 | 0.0% |
| 10 or more Apartments | 0 | 0.0% |
| Mobile Home / Other | 0 | 0.0% |
| Total | 544 | 100.0% |
Housing Structures by Occupancy in Forest Lake
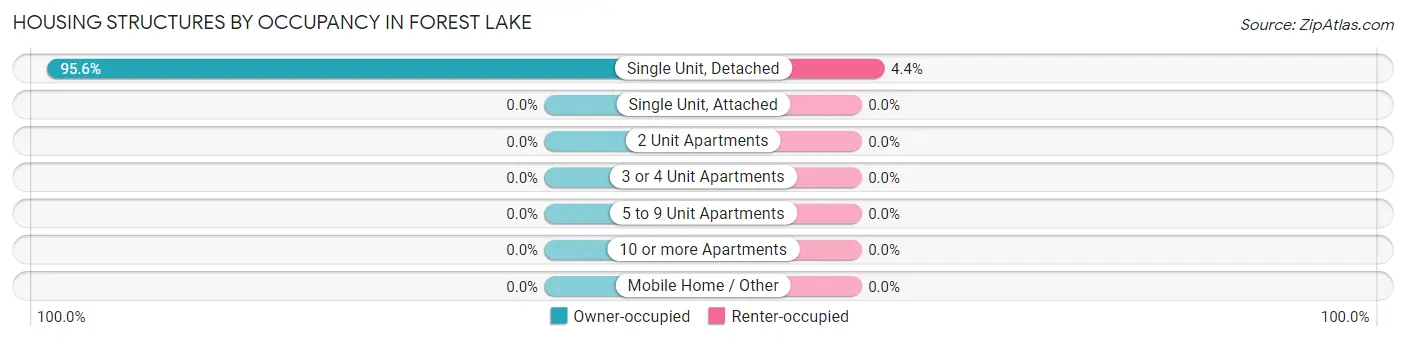
| Structure Type | Owner-occupied | Renter-occupied |
| Single Unit, Detached | 520 (95.6%) | 24 (4.4%) |
| Single Unit, Attached | 0 (0.0%) | 0 (0.0%) |
| 2 Unit Apartments | 0 (0.0%) | 0 (0.0%) |
| 3 or 4 Unit Apartments | 0 (0.0%) | 0 (0.0%) |
| 5 to 9 Unit Apartments | 0 (0.0%) | 0 (0.0%) |
| 10 or more Apartments | 0 (0.0%) | 0 (0.0%) |
| Mobile Home / Other | 0 (0.0%) | 0 (0.0%) |
| Total | 520 (95.6%) | 24 (4.4%) |
Housing Structures by Number of Rooms in Forest Lake
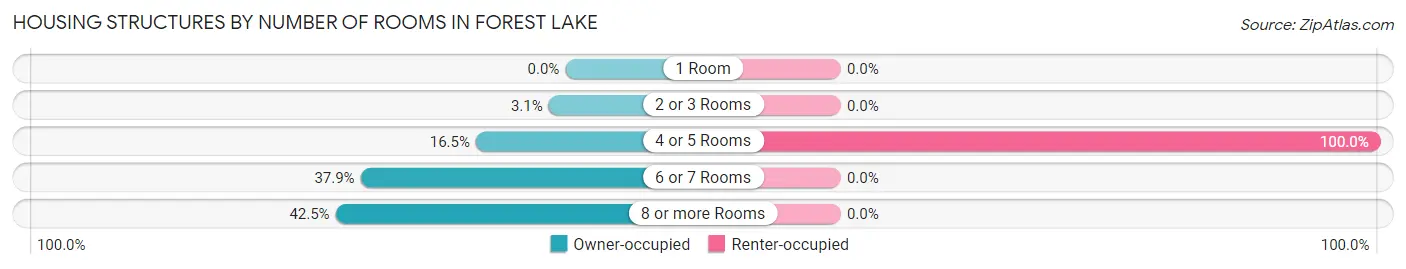
| Number of Rooms | Owner-occupied | Renter-occupied |
| 1 Room | 0 (0.0%) | 0 (0.0%) |
| 2 or 3 Rooms | 16 (3.1%) | 0 (0.0%) |
| 4 or 5 Rooms | 86 (16.5%) | 24 (100.0%) |
| 6 or 7 Rooms | 197 (37.9%) | 0 (0.0%) |
| 8 or more Rooms | 221 (42.5%) | 0 (0.0%) |
| Total | 520 (100.0%) | 24 (100.0%) |
Housing Structure by Heating Type in Forest Lake
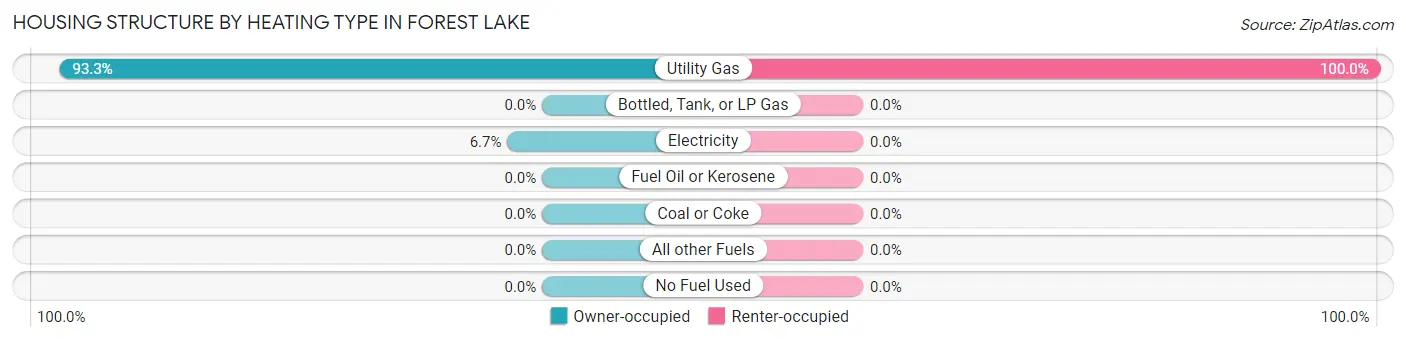
| Heating Type | Owner-occupied | Renter-occupied |
| Utility Gas | 485 (93.3%) | 24 (100.0%) |
| Bottled, Tank, or LP Gas | 0 (0.0%) | 0 (0.0%) |
| Electricity | 35 (6.7%) | 0 (0.0%) |
| Fuel Oil or Kerosene | 0 (0.0%) | 0 (0.0%) |
| Coal or Coke | 0 (0.0%) | 0 (0.0%) |
| All other Fuels | 0 (0.0%) | 0 (0.0%) |
| No Fuel Used | 0 (0.0%) | 0 (0.0%) |
| Total | 520 (100.0%) | 24 (100.0%) |
Household Vehicle Usage in Forest Lake
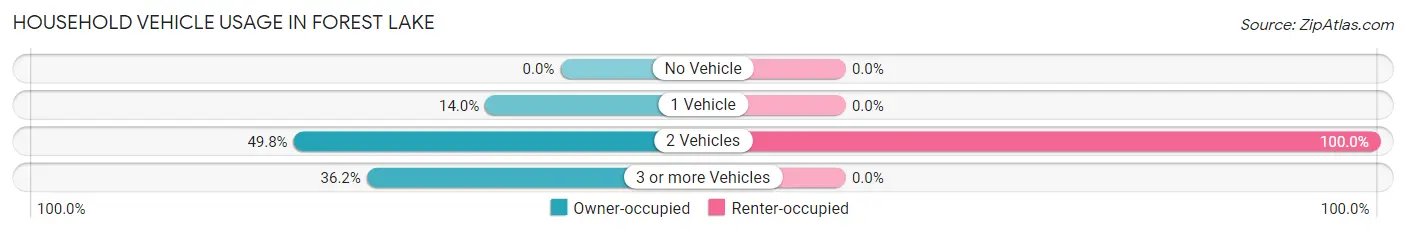
| Vehicles per Household | Owner-occupied | Renter-occupied |
| No Vehicle | 0 (0.0%) | 0 (0.0%) |
| 1 Vehicle | 73 (14.0%) | 0 (0.0%) |
| 2 Vehicles | 259 (49.8%) | 24 (100.0%) |
| 3 or more Vehicles | 188 (36.1%) | 0 (0.0%) |
| Total | 520 (100.0%) | 24 (100.0%) |
Real Estate & Mortgages in Forest Lake
Real Estate and Mortgage Overview in Forest Lake
| Characteristic | Without Mortgage | With Mortgage |
| Housing Units | 148 | 372 |
| Median Property Value | $317,000 | $310,900 |
| Median Household Income | $96,429 | $145 |
| Monthly Housing Costs | $855 | $31 |
| Real Estate Taxes | $6,366 | $0 |
Property Value by Mortgage Status in Forest Lake
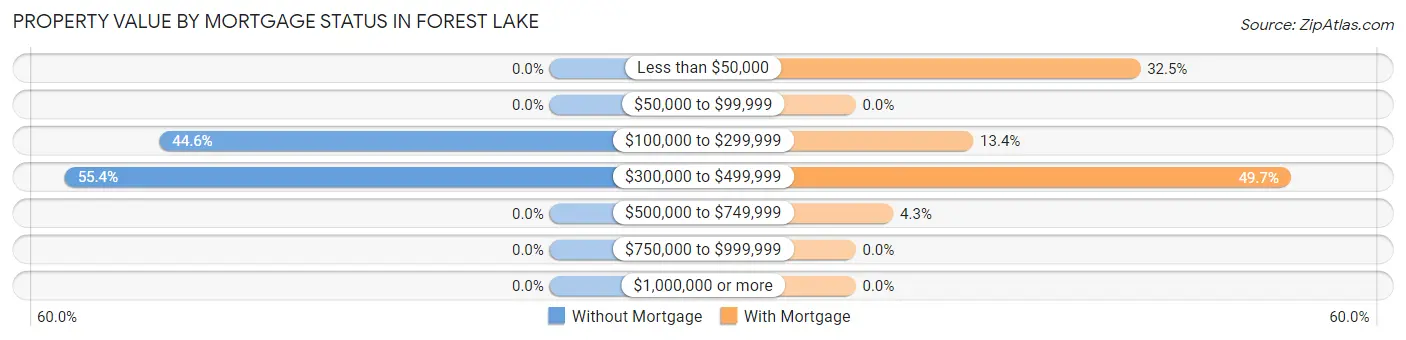
| Property Value | Without Mortgage | With Mortgage |
| Less than $50,000 | 0 (0.0%) | 121 (32.5%) |
| $50,000 to $99,999 | 0 (0.0%) | 0 (0.0%) |
| $100,000 to $299,999 | 66 (44.6%) | 50 (13.4%) |
| $300,000 to $499,999 | 82 (55.4%) | 185 (49.7%) |
| $500,000 to $749,999 | 0 (0.0%) | 16 (4.3%) |
| $750,000 to $999,999 | 0 (0.0%) | 0 (0.0%) |
| $1,000,000 or more | 0 (0.0%) | 0 (0.0%) |
| Total | 148 (100.0%) | 372 (100.0%) |
Household Income by Mortgage Status in Forest Lake
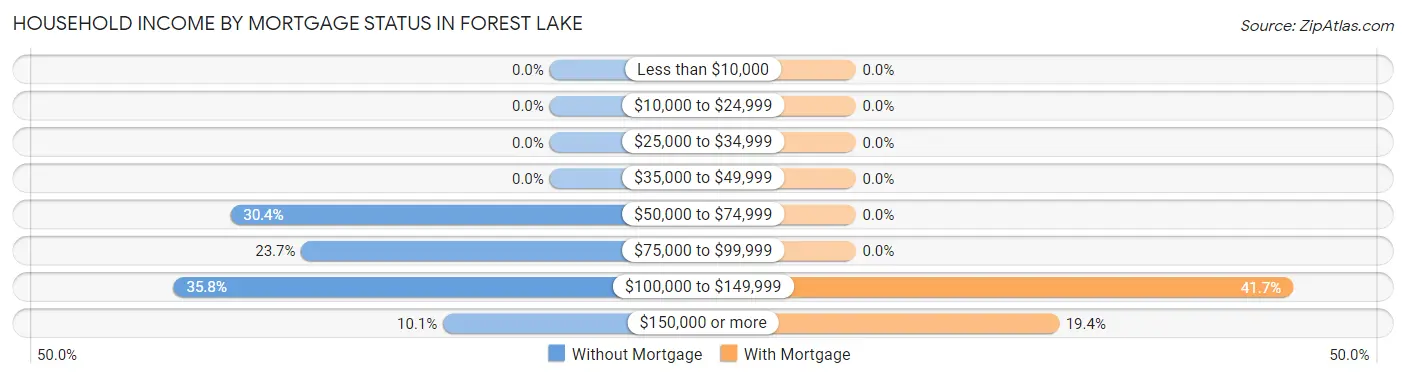
| Household Income | Without Mortgage | With Mortgage |
| Less than $10,000 | 0 (0.0%) | 0 (0.0%) |
| $10,000 to $24,999 | 0 (0.0%) | 0 (0.0%) |
| $25,000 to $34,999 | 0 (0.0%) | 0 (0.0%) |
| $35,000 to $49,999 | 0 (0.0%) | 0 (0.0%) |
| $50,000 to $74,999 | 45 (30.4%) | 0 (0.0%) |
| $75,000 to $99,999 | 35 (23.6%) | 0 (0.0%) |
| $100,000 to $149,999 | 53 (35.8%) | 155 (41.7%) |
| $150,000 or more | 15 (10.1%) | 72 (19.4%) |
| Total | 148 (100.0%) | 372 (100.0%) |
Property Value to Household Income Ratio in Forest Lake
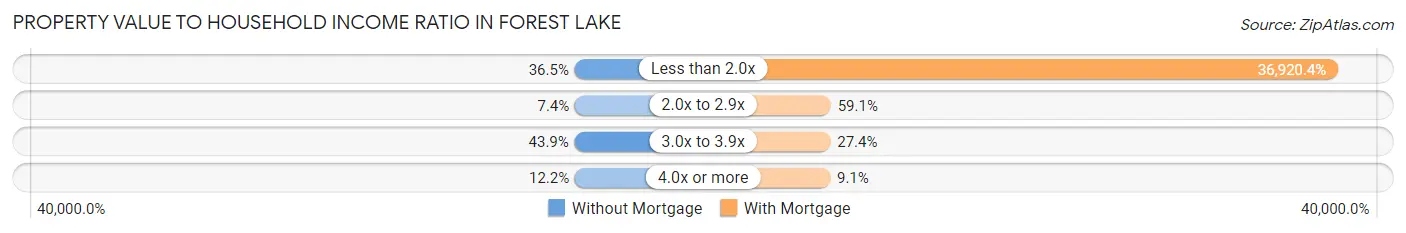
| Value-to-Income Ratio | Without Mortgage | With Mortgage |
| Less than 2.0x | 54 (36.5%) | 137,344 (36,920.4%) |
| 2.0x to 2.9x | 11 (7.4%) | 220 (59.1%) |
| 3.0x to 3.9x | 65 (43.9%) | 102 (27.4%) |
| 4.0x or more | 18 (12.2%) | 34 (9.1%) |
| Total | 148 (100.0%) | 372 (100.0%) |
Real Estate Taxes by Mortgage Status in Forest Lake
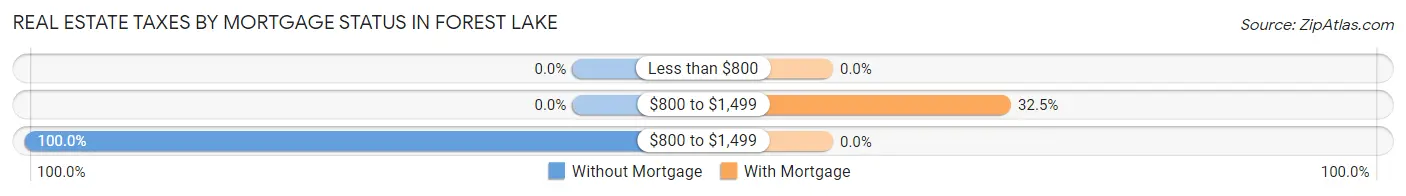
| Property Taxes | Without Mortgage | With Mortgage |
| Less than $800 | 0 (0.0%) | 0 (0.0%) |
| $800 to $1,499 | 0 (0.0%) | 121 (32.5%) |
| $800 to $1,499 | 148 (100.0%) | 0 (0.0%) |
| Total | 148 (100.0%) | 372 (100.0%) |
Health & Disability in Forest Lake
Health Insurance Coverage by Age in Forest Lake
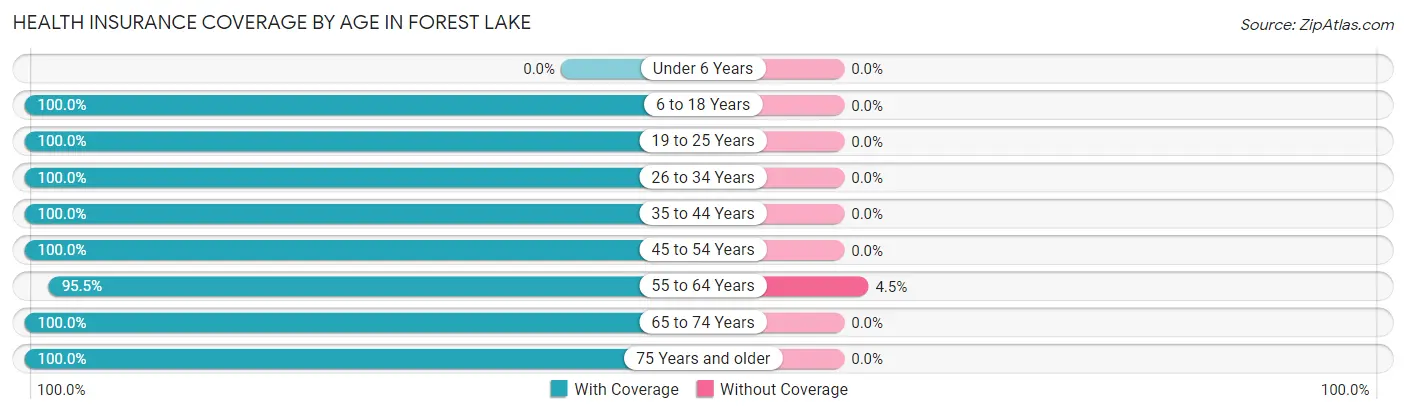
| Age Bracket | With Coverage | Without Coverage |
| Under 6 Years | 0 (0.0%) | 0 (0.0%) |
| 6 to 18 Years | 215 (100.0%) | 0 (0.0%) |
| 19 to 25 Years | 87 (100.0%) | 0 (0.0%) |
| 26 to 34 Years | 70 (100.0%) | 0 (0.0%) |
| 35 to 44 Years | 135 (100.0%) | 0 (0.0%) |
| 45 to 54 Years | 200 (100.0%) | 0 (0.0%) |
| 55 to 64 Years | 508 (95.5%) | 24 (4.5%) |
| 65 to 74 Years | 53 (100.0%) | 0 (0.0%) |
| 75 Years and older | 52 (100.0%) | 0 (0.0%) |
| Total | 1,320 (98.2%) | 24 (1.8%) |
Health Insurance Coverage by Citizenship Status in Forest Lake
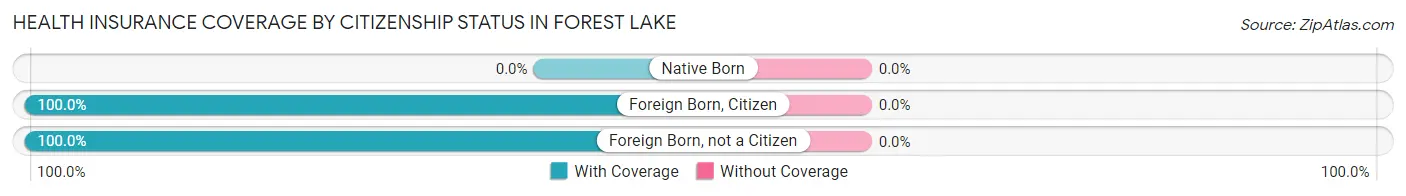
| Citizenship Status | With Coverage | Without Coverage |
| Native Born | 0 (0.0%) | 0 (0.0%) |
| Foreign Born, Citizen | 215 (100.0%) | 0 (0.0%) |
| Foreign Born, not a Citizen | 87 (100.0%) | 0 (0.0%) |
Health Insurance Coverage by Household Income in Forest Lake
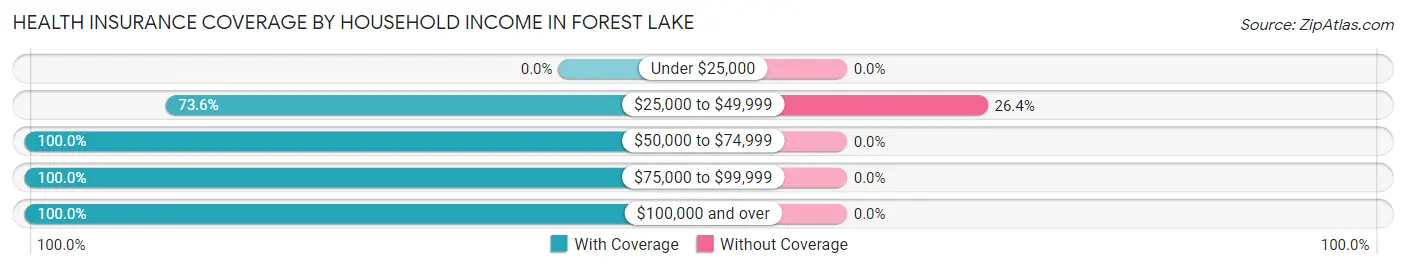
| Household Income | With Coverage | Without Coverage |
| Under $25,000 | 0 (0.0%) | 0 (0.0%) |
| $25,000 to $49,999 | 67 (73.6%) | 24 (26.4%) |
| $50,000 to $74,999 | 98 (100.0%) | 0 (0.0%) |
| $75,000 to $99,999 | 382 (100.0%) | 0 (0.0%) |
| $100,000 and over | 773 (100.0%) | 0 (0.0%) |
Public vs Private Health Insurance Coverage by Age in Forest Lake
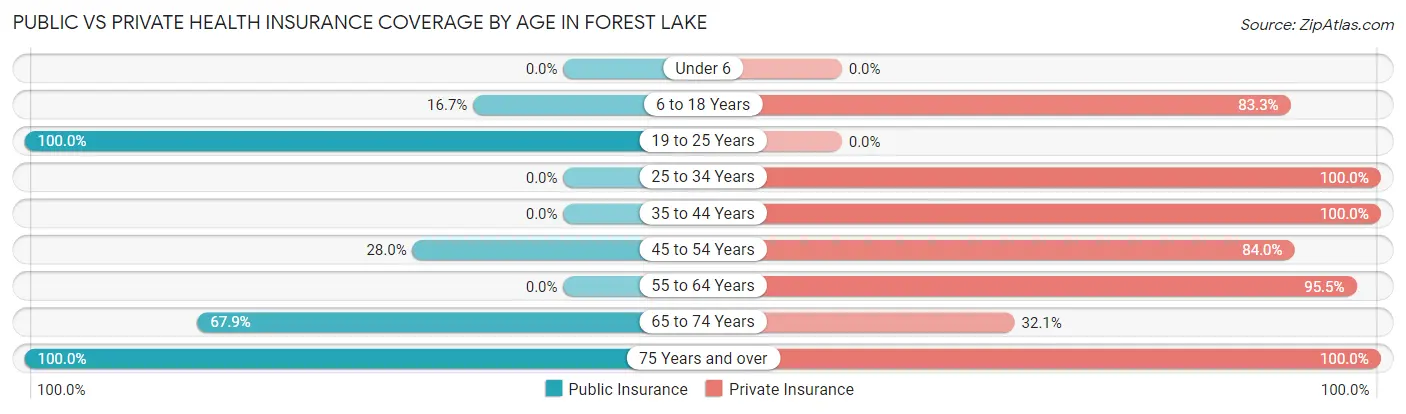
| Age Bracket | Public Insurance | Private Insurance |
| Under 6 | 0 (0.0%) | 0 (0.0%) |
| 6 to 18 Years | 36 (16.7%) | 179 (83.3%) |
| 19 to 25 Years | 87 (100.0%) | 0 (0.0%) |
| 25 to 34 Years | 0 (0.0%) | 70 (100.0%) |
| 35 to 44 Years | 0 (0.0%) | 135 (100.0%) |
| 45 to 54 Years | 56 (28.0%) | 168 (84.0%) |
| 55 to 64 Years | 0 (0.0%) | 508 (95.5%) |
| 65 to 74 Years | 36 (67.9%) | 17 (32.1%) |
| 75 Years and over | 52 (100.0%) | 52 (100.0%) |
| Total | 267 (19.9%) | 1,129 (84.0%) |
Disability Status by Sex by Age in Forest Lake
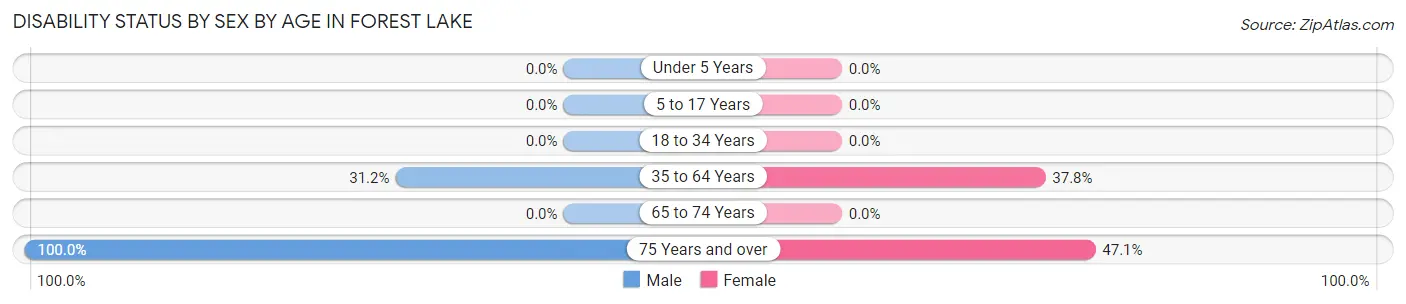
| Age Bracket | Male | Female |
| Under 5 Years | 0 (0.0%) | 0 (0.0%) |
| 5 to 17 Years | 0 (0.0%) | 0 (0.0%) |
| 18 to 34 Years | 0 (0.0%) | 0 (0.0%) |
| 35 to 64 Years | 121 (31.2%) | 181 (37.8%) |
| 65 to 74 Years | 0 (0.0%) | 0 (0.0%) |
| 75 Years and over | 18 (100.0%) | 16 (47.1%) |
Disability Class by Sex by Age in Forest Lake
Disability Class: Hearing Difficulty
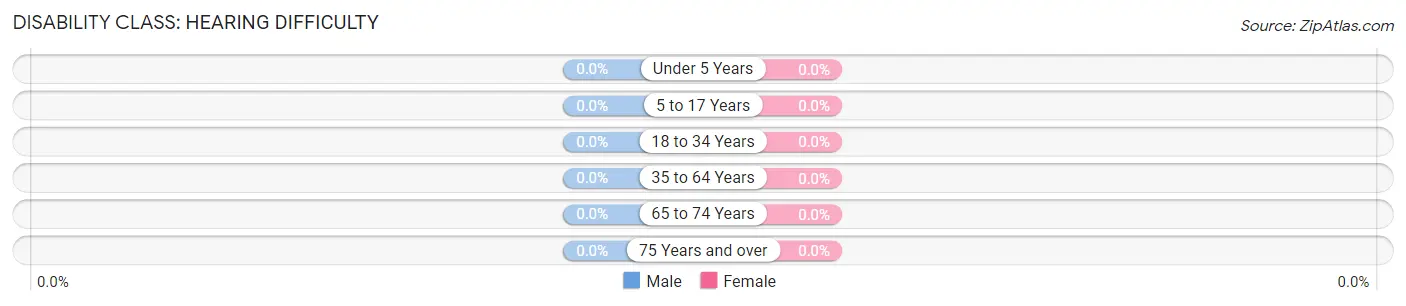
| Age Bracket | Male | Female |
| Under 5 Years | 0 (0.0%) | 0 (0.0%) |
| 5 to 17 Years | 0 (0.0%) | 0 (0.0%) |
| 18 to 34 Years | 0 (0.0%) | 0 (0.0%) |
| 35 to 64 Years | 0 (0.0%) | 0 (0.0%) |
| 65 to 74 Years | 0 (0.0%) | 0 (0.0%) |
| 75 Years and over | 0 (0.0%) | 0 (0.0%) |
Disability Class: Vision Difficulty
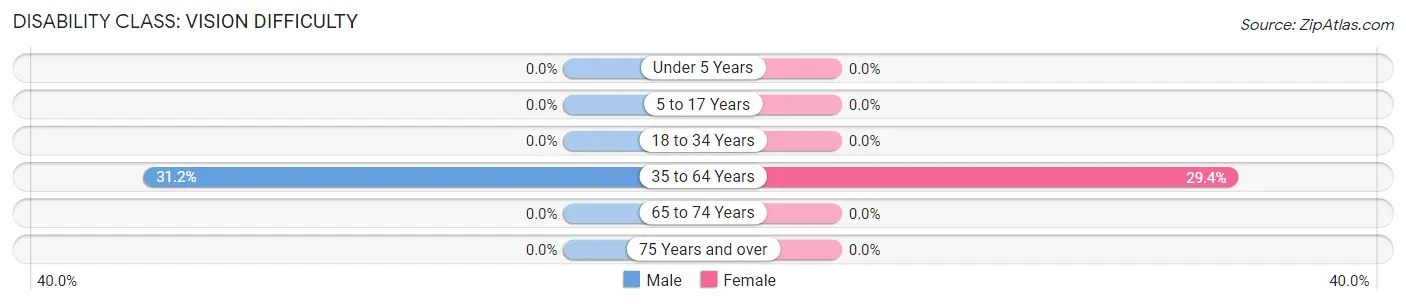
| Age Bracket | Male | Female |
| Under 5 Years | 0 (0.0%) | 0 (0.0%) |
| 5 to 17 Years | 0 (0.0%) | 0 (0.0%) |
| 18 to 34 Years | 0 (0.0%) | 0 (0.0%) |
| 35 to 64 Years | 121 (31.2%) | 141 (29.4%) |
| 65 to 74 Years | 0 (0.0%) | 0 (0.0%) |
| 75 Years and over | 0 (0.0%) | 0 (0.0%) |
Disability Class: Cognitive Difficulty
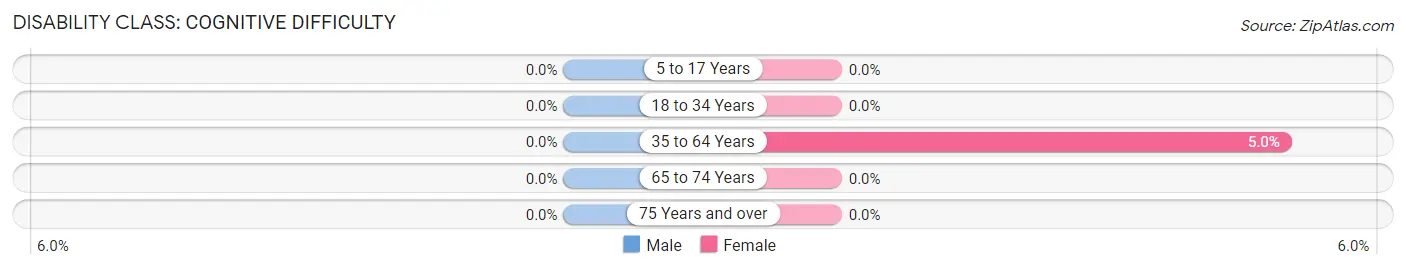
| Age Bracket | Male | Female |
| 5 to 17 Years | 0 (0.0%) | 0 (0.0%) |
| 18 to 34 Years | 0 (0.0%) | 0 (0.0%) |
| 35 to 64 Years | 0 (0.0%) | 24 (5.0%) |
| 65 to 74 Years | 0 (0.0%) | 0 (0.0%) |
| 75 Years and over | 0 (0.0%) | 0 (0.0%) |
Disability Class: Ambulatory Difficulty
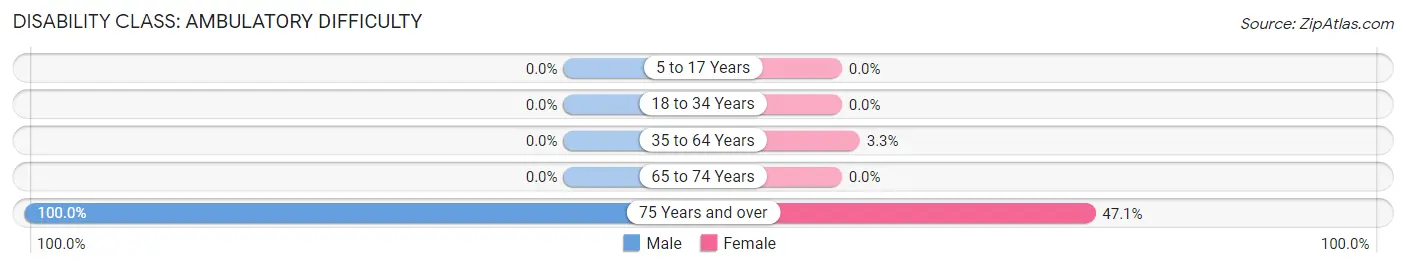
| Age Bracket | Male | Female |
| 5 to 17 Years | 0 (0.0%) | 0 (0.0%) |
| 18 to 34 Years | 0 (0.0%) | 0 (0.0%) |
| 35 to 64 Years | 0 (0.0%) | 16 (3.3%) |
| 65 to 74 Years | 0 (0.0%) | 0 (0.0%) |
| 75 Years and over | 18 (100.0%) | 16 (47.1%) |
Disability Class: Self-Care Difficulty
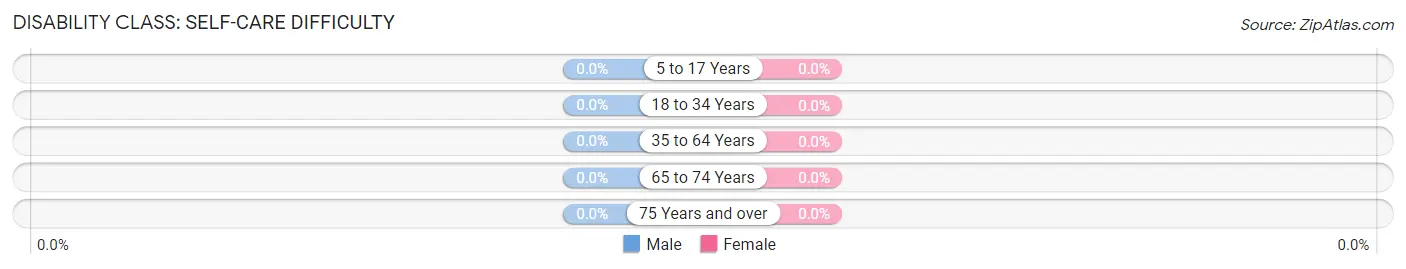
| Age Bracket | Male | Female |
| 5 to 17 Years | 0 (0.0%) | 0 (0.0%) |
| 18 to 34 Years | 0 (0.0%) | 0 (0.0%) |
| 35 to 64 Years | 0 (0.0%) | 0 (0.0%) |
| 65 to 74 Years | 0 (0.0%) | 0 (0.0%) |
| 75 Years and over | 0 (0.0%) | 0 (0.0%) |
Technology Access in Forest Lake
Computing Device Access in Forest Lake
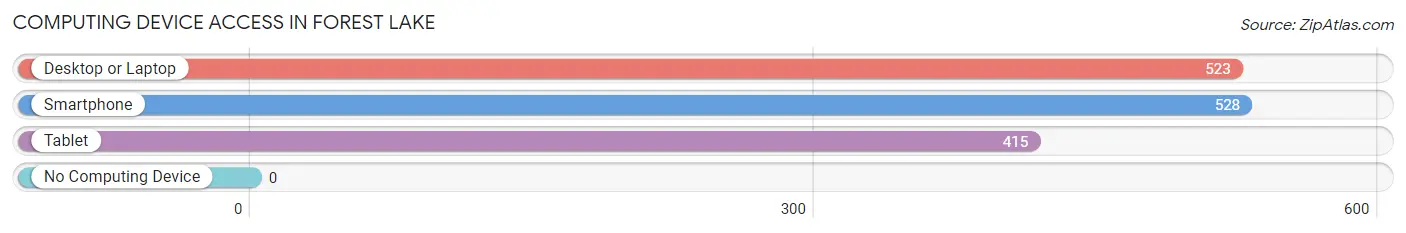
| Device Type | # Households | % Households |
| Desktop or Laptop | 523 | 96.1% |
| Smartphone | 528 | 97.1% |
| Tablet | 415 | 76.3% |
| No Computing Device | 0 | 0.0% |
| Total | 544 | 100.0% |
Internet Access in Forest Lake
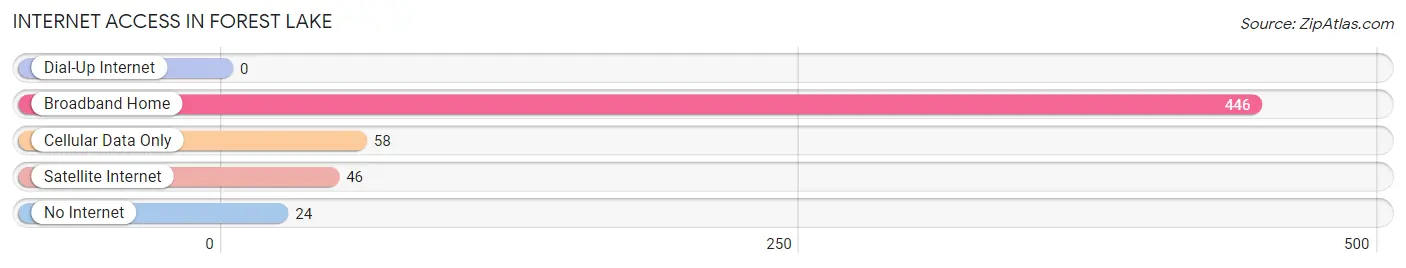
| Internet Type | # Households | % Households |
| Dial-Up Internet | 0 | 0.0% |
| Broadband Home | 446 | 82.0% |
| Cellular Data Only | 58 | 10.7% |
| Satellite Internet | 46 | 8.5% |
| No Internet | 24 | 4.4% |
| Total | 544 | 100.0% |
Forest Lake Summary
Lake Forest is a city located in Lake County, Illinois, United States. It is a suburb of Chicago, located on the shore of Lake Michigan. As of the 2010 census, the city had a population of 19,375. The city is part of the Chicago metropolitan area and is located in the North Shore region.
History
The area that is now Lake Forest was originally inhabited by the Potawatomi Native Americans. The first non-native settlers arrived in the area in the 1830s. The first permanent settler was a man named Daniel Wright, who built a cabin in the area in 1836. The area was officially incorporated as the City of Lake Forest in 1861.
The city was originally developed as a resort community for wealthy Chicagoans. The city was designed by landscape architect Frederick Law Olmsted, who also designed New York City's Central Park. The city was designed to be a picturesque community with winding roads, large lots, and plenty of green space.
The city was also home to several prominent institutions, including Lake Forest College, which was founded in 1857. The college was the first coeducational college in the Midwest and was attended by many prominent figures, including President Dwight D. Eisenhower.
Geography
Lake Forest is located in northeastern Illinois, about 40 miles north of Chicago. It is situated on the shore of Lake Michigan. The city covers an area of 10.2 square miles, of which 9.9 square miles is land and 0.3 square miles is water.
The city is bordered by Lake Bluff to the north, Libertyville to the west, Lake Forest to the south, and Lake Michigan to the east. The city is located in the North Shore region of Illinois, which is known for its rolling hills, wooded areas, and picturesque lakes.
Economy
The economy of Lake Forest is largely based on the service industry. The city is home to several large companies, including Tenneco, W.W. Grainger, and Brunswick Corporation. The city is also home to several smaller businesses, including restaurants, retail stores, and professional services.
The city is also home to several educational institutions, including Lake Forest College, Lake Forest Graduate School of Management, and Lake Forest Academy. These institutions provide a significant number of jobs to the local economy.
Demographics
As of the 2010 census, the city had a population of 19,375. The racial makeup of the city was 87.3% White, 4.2% African American, 0.2% Native American, 5.2% Asian, 0.1% Pacific Islander, 1.2% from other races, and 1.9% from two or more races. Hispanic or Latino of any race were 4.3% of the population.
The median income for a household in the city was $117,813, and the median income for a family was $150,890. The per capita income for the city was $68,945. About 4.2% of families and 5.7% of the population were below the poverty line, including 6.2% of those under age 18 and 4.2% of those age 65 or over.
Lake Forest is a diverse city with a variety of cultures and backgrounds. The city is home to a large number of immigrants, including those from India, China, and Mexico. The city is also home to a large number of professionals, including doctors, lawyers, and business executives.
Common Questions
What is Per Capita Income in Forest Lake?
Per Capita income in Forest Lake is $55,557.
What is the Median Family Income in Forest Lake?
Median Family Income in Forest Lake is $110,313.
What is the Median Household income in Forest Lake?
Median Household Income in Forest Lake is $112,031.
What is Inequality or Gini Index in Forest Lake?
Inequality or Gini Index in Forest Lake is 0.28.
What is the Total Population of Forest Lake?
Total Population of Forest Lake is 1,344.
What is the Total Male Population of Forest Lake?
Total Male Population of Forest Lake is 548.
What is the Total Female Population of Forest Lake?
Total Female Population of Forest Lake is 796.
What is the Ratio of Males per 100 Females in Forest Lake?
There are 68.84 Males per 100 Females in Forest Lake.
What is the Ratio of Females per 100 Males in Forest Lake?
There are 145.26 Females per 100 Males in Forest Lake.
What is the Median Population Age in Forest Lake?
Median Population Age in Forest Lake is 51.7 Years.
What is the Average Family Size in Forest Lake
Average Family Size in Forest Lake is 2.5 People.
What is the Average Household Size in Forest Lake
Average Household Size in Forest Lake is 2.5 People.
How Large is the Labor Force in Forest Lake?
There are 1,018 People in the Labor Forcein in Forest Lake.
What is the Percentage of People in the Labor Force in Forest Lake?
87.0% of People are in the Labor Force in Forest Lake.
What is the Unemployment Rate in Forest Lake?
Unemployment Rate in Forest Lake is 5.4%.