Brewster, MA Map & Demographics
Brewster Map
Brewster Overview
$65,884
PER CAPITA INCOME
$139,688
AVG FAMILY INCOME
$62,695
AVG HOUSEHOLD INCOME
4.5%
WAGE / INCOME GAP [ % ]
95.5¢/ $1
WAGE / INCOME GAP [ $ ]
0.57
INEQUALITY / GINI INDEX
1,739
TOTAL POPULATION
885
MALE POPULATION
854
FEMALE POPULATION
103.63
MALES / 100 FEMALES
96.50
FEMALES / 100 MALES
62.4
MEDIAN AGE
2.5
AVG FAMILY SIZE
2.0
AVG HOUSEHOLD SIZE
709
LABOR FORCE [ PEOPLE ]
43.5%
PERCENT IN LABOR FORCE
7.1%
UNEMPLOYMENT RATE
Brewster Zip Codes
Income in Brewster
Income Overview in Brewster
Per Capita Income in Brewster is $65,884, while median incomes of families and households are $139,688 and $62,695 respectively.
| Characteristic | Number | Measure |
| Per Capita Income | 1,739 | $65,884 |
| Median Family Income | 513 | $139,688 |
| Mean Family Income | 513 | $183,732 |
| Median Household Income | 861 | $62,695 |
| Mean Household Income | 861 | $132,375 |
| Income Deficit | 513 | $0 |
| Wage / Income Gap (%) | 1,739 | 4.48% |
| Wage / Income Gap ($) | 1,739 | 95.52¢ per $1 |
| Gini / Inequality Index | 1,739 | 0.57 |
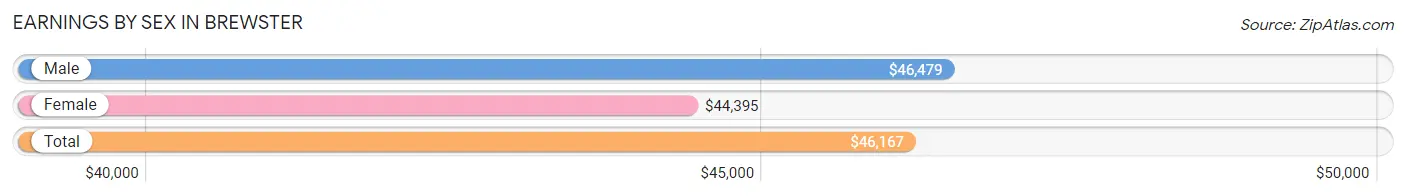
Earnings by Sex in Brewster
Average Earnings in Brewster are $46,167, $46,479 for men and $44,395 for women, a difference of 4.5%.
| Sex | Number | Average Earnings |
| Male | 403 (53.2%) | $46,479 |
| Female | 355 (46.8%) | $44,395 |
| Total | 758 (100.0%) | $46,167 |
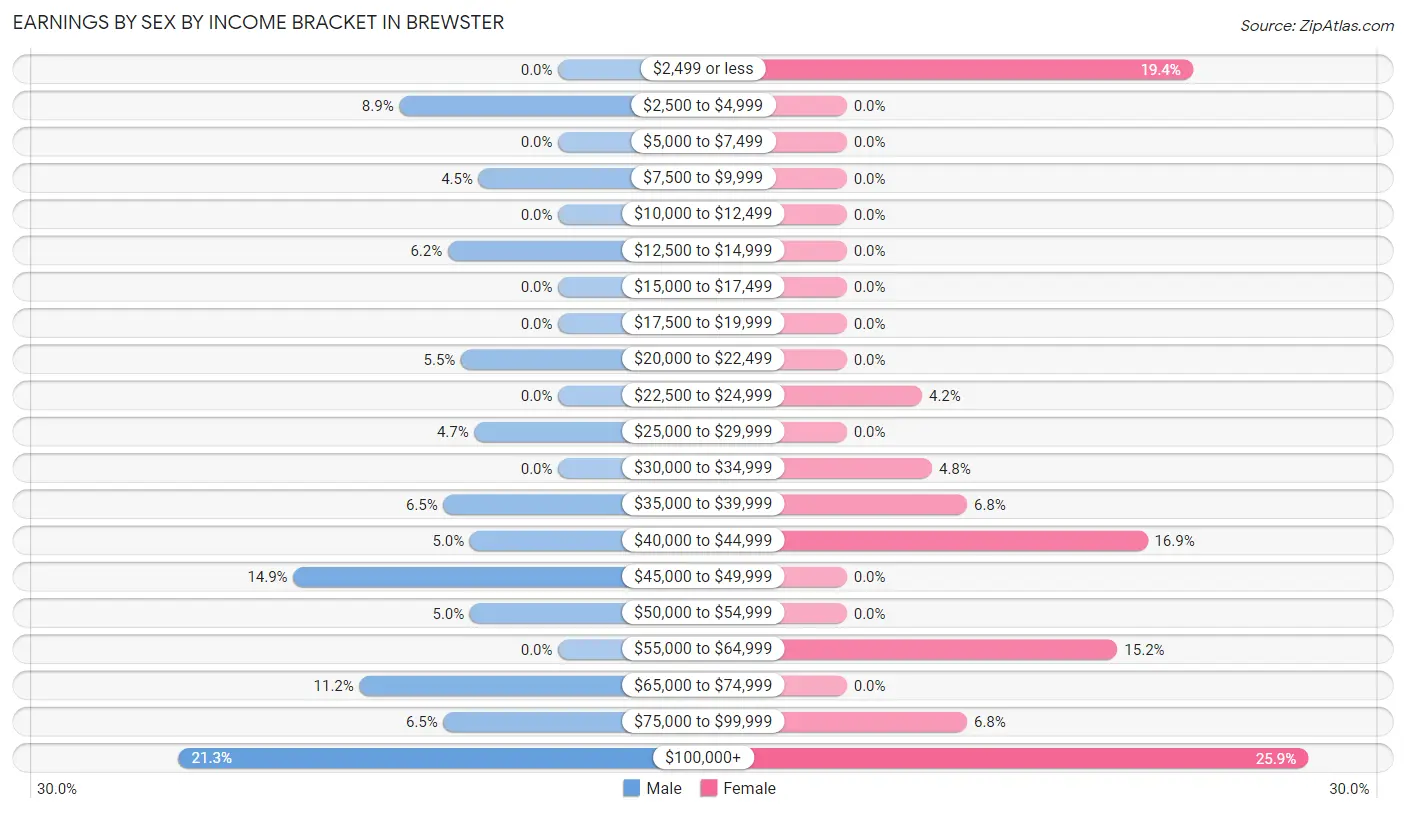
Earnings by Sex by Income Bracket in Brewster
The most common earnings brackets in Brewster are $100,000+ for men (86 | 21.3%) and $100,000+ for women (92 | 25.9%).
| Income | Male | Female |
| $2,499 or less | 0 (0.0%) | 69 (19.4%) |
| $2,500 to $4,999 | 36 (8.9%) | 0 (0.0%) |
| $5,000 to $7,499 | 0 (0.0%) | 0 (0.0%) |
| $7,500 to $9,999 | 18 (4.5%) | 0 (0.0%) |
| $10,000 to $12,499 | 0 (0.0%) | 0 (0.0%) |
| $12,500 to $14,999 | 25 (6.2%) | 0 (0.0%) |
| $15,000 to $17,499 | 0 (0.0%) | 0 (0.0%) |
| $17,500 to $19,999 | 0 (0.0%) | 0 (0.0%) |
| $20,000 to $22,499 | 22 (5.5%) | 0 (0.0%) |
| $22,500 to $24,999 | 0 (0.0%) | 15 (4.2%) |
| $25,000 to $29,999 | 19 (4.7%) | 0 (0.0%) |
| $30,000 to $34,999 | 0 (0.0%) | 17 (4.8%) |
| $35,000 to $39,999 | 26 (6.5%) | 24 (6.8%) |
| $40,000 to $44,999 | 20 (5.0%) | 60 (16.9%) |
| $45,000 to $49,999 | 60 (14.9%) | 0 (0.0%) |
| $50,000 to $54,999 | 20 (5.0%) | 0 (0.0%) |
| $55,000 to $64,999 | 0 (0.0%) | 54 (15.2%) |
| $65,000 to $74,999 | 45 (11.2%) | 0 (0.0%) |
| $75,000 to $99,999 | 26 (6.5%) | 24 (6.8%) |
| $100,000+ | 86 (21.3%) | 92 (25.9%) |
| Total | 403 (100.0%) | 355 (100.0%) |
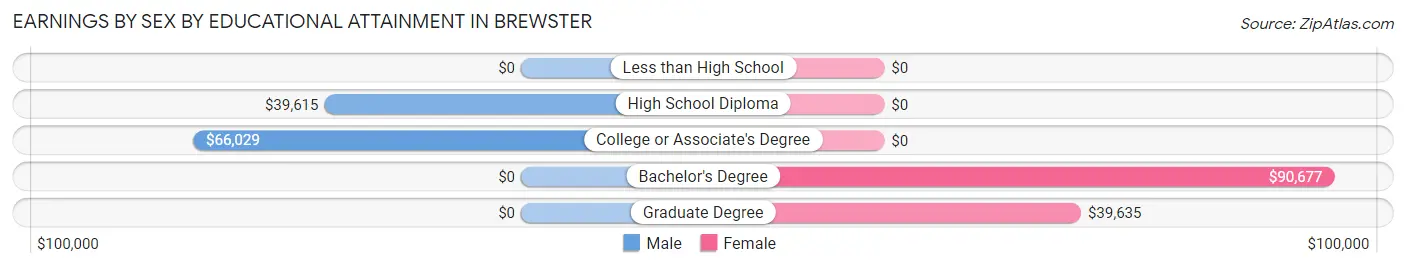
Earnings by Sex by Educational Attainment in Brewster
Average earnings in Brewster are $46,875 for men and $44,395 for women, a difference of 5.3%. Men with an educational attainment of college or associate's degree enjoy the highest average annual earnings of $66,029, while those with high school diploma education earn the least with $39,615. Women with an educational attainment of bachelor's degree earn the most with the average annual earnings of $90,677, while those with graduate degree education have the smallest earnings of $39,635.
| Educational Attainment | Male Income | Female Income |
| Less than High School | - | - |
| High School Diploma | $39,615 | $0 |
| College or Associate's Degree | $66,029 | $0 |
| Bachelor's Degree | - | - |
| Graduate Degree | - | - |
| Total | $46,875 | $44,395 |
Family Income in Brewster
Family Income Brackets in Brewster
According to the Brewster family income data, there are 136 families falling into the $200,000+ income range, which is the most common income bracket and makes up 26.5% of all families.
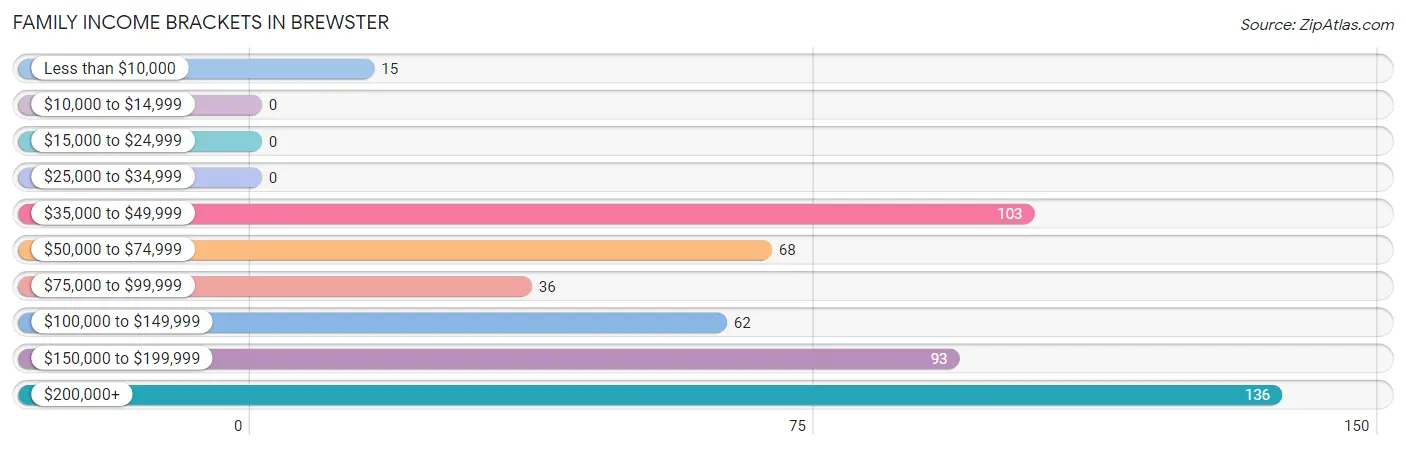
| Income Bracket | # Families | % Families |
| Less than $10,000 | 15 | 2.9% |
| $10,000 to $14,999 | 0 | 0.0% |
| $15,000 to $24,999 | 0 | 0.0% |
| $25,000 to $34,999 | 0 | 0.0% |
| $35,000 to $49,999 | 103 | 20.1% |
| $50,000 to $74,999 | 68 | 13.3% |
| $75,000 to $99,999 | 36 | 7.0% |
| $100,000 to $149,999 | 62 | 12.1% |
| $150,000 to $199,999 | 93 | 18.1% |
| $200,000+ | 136 | 26.5% |
Family Income by Famaliy Size in Brewster
3-person families (82 | 16.0%) account for the highest median family income in Brewster with $250,001 per family, while 3-person families (82 | 16.0%) have the highest median income of $83,334 per family member.
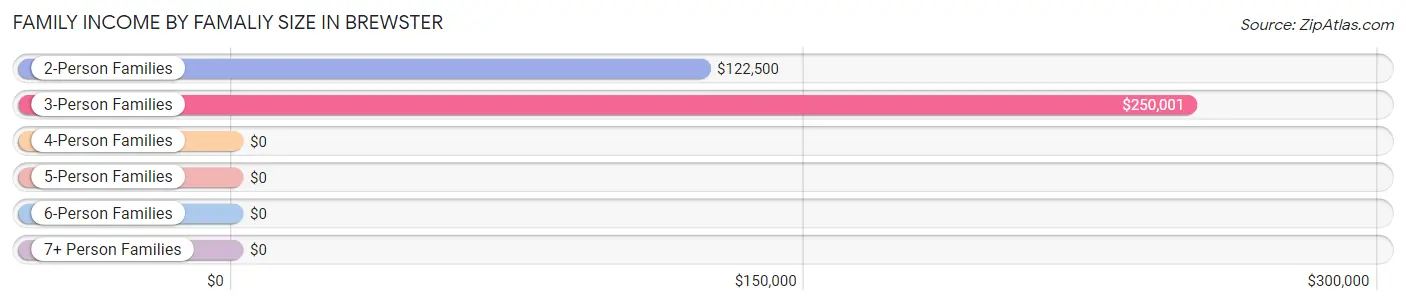
| Income Bracket | # Families | Median Income |
| 2-Person Families | 374 (72.9%) | $122,500 |
| 3-Person Families | 82 (16.0%) | $250,001 |
| 4-Person Families | 20 (3.9%) | $0 |
| 5-Person Families | 37 (7.2%) | $0 |
| 6-Person Families | 0 (0.0%) | $0 |
| 7+ Person Families | 0 (0.0%) | $0 |
| Total | 513 (100.0%) | $139,688 |
Family Income by Number of Earners in Brewster
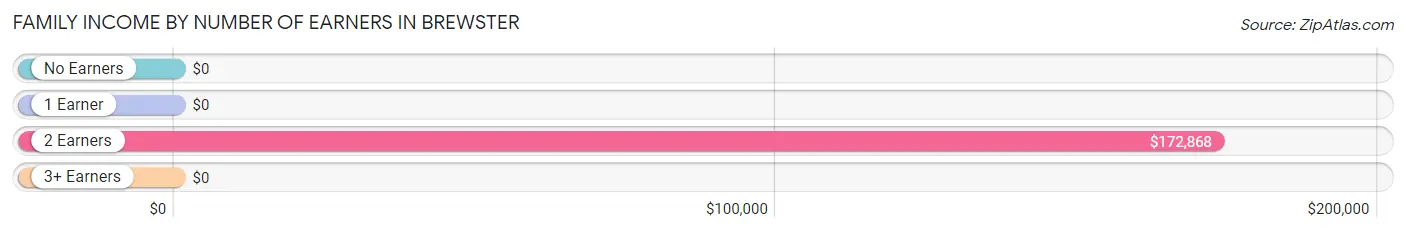
| Number of Earners | # Families | Median Income |
| No Earners | 220 (42.9%) | $0 |
| 1 Earner | 59 (11.5%) | $0 |
| 2 Earners | 217 (42.3%) | $172,868 |
| 3+ Earners | 17 (3.3%) | $0 |
| Total | 513 (100.0%) | $139,688 |
Household Income in Brewster
Household Income Brackets in Brewster
With 150 households falling in the category, the $200,000+ income range is the most frequent in Brewster, accounting for 17.4% of all households.
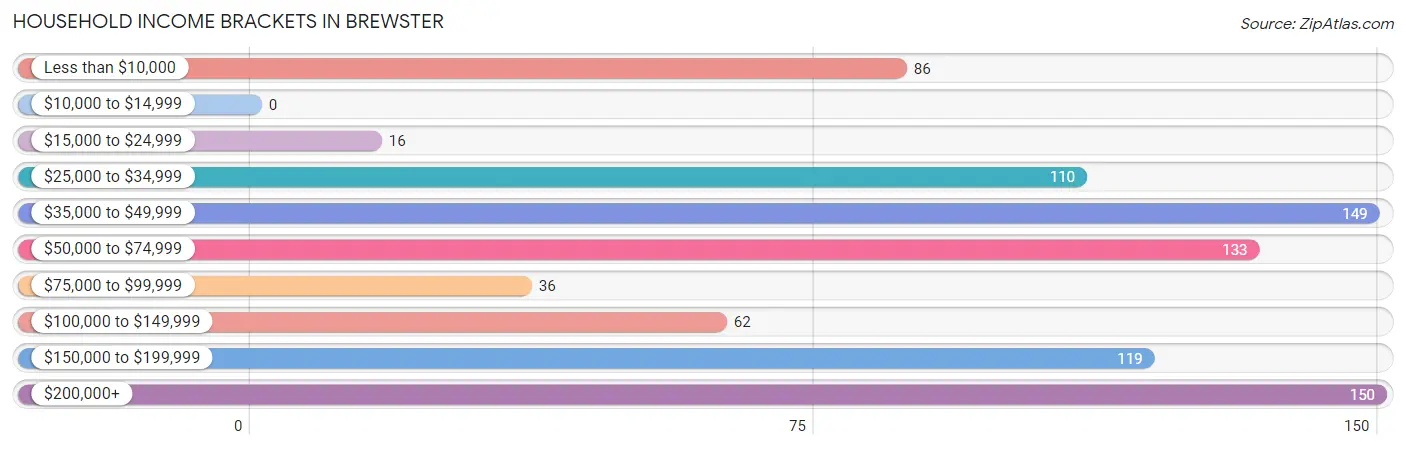
| Income Bracket | # Households | % Households |
| Less than $10,000 | 86 | 10.0% |
| $10,000 to $14,999 | 0 | 0.0% |
| $15,000 to $24,999 | 16 | 1.9% |
| $25,000 to $34,999 | 110 | 12.8% |
| $35,000 to $49,999 | 149 | 17.3% |
| $50,000 to $74,999 | 133 | 15.4% |
| $75,000 to $99,999 | 36 | 4.2% |
| $100,000 to $149,999 | 62 | 7.2% |
| $150,000 to $199,999 | 119 | 13.8% |
| $200,000+ | 150 | 17.4% |
Household Income by Householder Age in Brewster
The median household income in Brewster is $62,695, with the highest median household income of $162,574 found in the 45 to 64 years age bracket for the primary householder. A total of 323 households (37.5%) fall into this category.
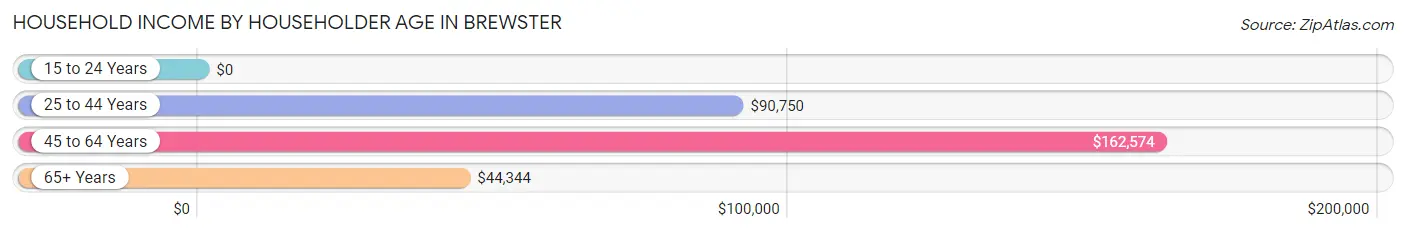
| Income Bracket | # Households | Median Income |
| 15 to 24 Years | 0 (0.0%) | $0 |
| 25 to 44 Years | 80 (9.3%) | $90,750 |
| 45 to 64 Years | 323 (37.5%) | $162,574 |
| 65+ Years | 458 (53.2%) | $44,344 |
| Total | 861 (100.0%) | $62,695 |
Poverty in Brewster
Income Below Poverty by Sex and Age in Brewster
With 4.3% poverty level for males and 10.2% for females among the residents of Brewster, 16 and 17 year old males and 75 year old and over females are the most vulnerable to poverty, with 15 males (17.2%) and 55 females (27.6%) in their respective age groups living below the poverty level.
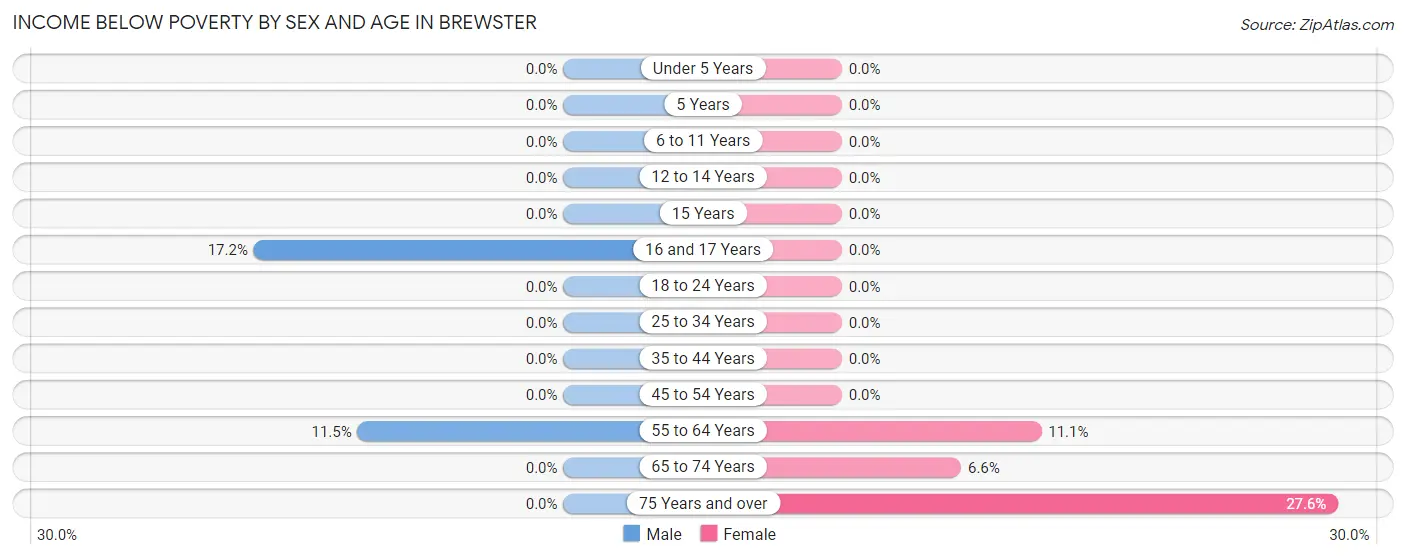
| Age Bracket | Male | Female |
| Under 5 Years | 0 (0.0%) | 0 (0.0%) |
| 5 Years | 0 (0.0%) | 0 (0.0%) |
| 6 to 11 Years | 0 (0.0%) | 0 (0.0%) |
| 12 to 14 Years | 0 (0.0%) | 0 (0.0%) |
| 15 Years | 0 (0.0%) | 0 (0.0%) |
| 16 and 17 Years | 15 (17.2%) | 0 (0.0%) |
| 18 to 24 Years | 0 (0.0%) | 0 (0.0%) |
| 25 to 34 Years | 0 (0.0%) | 0 (0.0%) |
| 35 to 44 Years | 0 (0.0%) | 0 (0.0%) |
| 45 to 54 Years | 0 (0.0%) | 0 (0.0%) |
| 55 to 64 Years | 22 (11.5%) | 15 (11.1%) |
| 65 to 74 Years | 0 (0.0%) | 16 (6.6%) |
| 75 Years and over | 0 (0.0%) | 55 (27.6%) |
| Total | 37 (4.3%) | 86 (10.2%) |
Income Above Poverty by Sex and Age in Brewster
According to the poverty statistics in Brewster, males aged 6 to 11 years and females aged 6 to 11 years are the age groups that are most secure financially, with 100.0% of males and 100.0% of females in these age groups living above the poverty line.
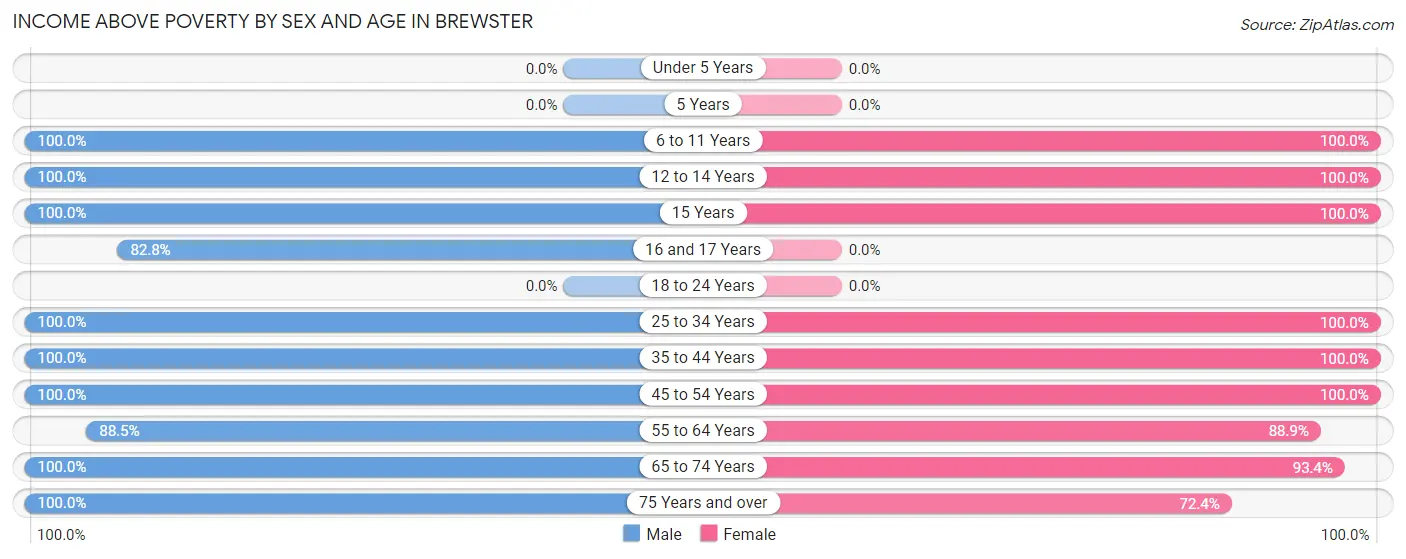
| Age Bracket | Male | Female |
| Under 5 Years | 0 (0.0%) | 0 (0.0%) |
| 5 Years | 0 (0.0%) | 0 (0.0%) |
| 6 to 11 Years | 18 (100.0%) | 17 (100.0%) |
| 12 to 14 Years | 19 (100.0%) | 19 (100.0%) |
| 15 Years | 19 (100.0%) | 18 (100.0%) |
| 16 and 17 Years | 72 (82.8%) | 0 (0.0%) |
| 18 to 24 Years | 0 (0.0%) | 0 (0.0%) |
| 25 to 34 Years | 74 (100.0%) | 48 (100.0%) |
| 35 to 44 Years | 44 (100.0%) | 20 (100.0%) |
| 45 to 54 Years | 109 (100.0%) | 145 (100.0%) |
| 55 to 64 Years | 170 (88.5%) | 120 (88.9%) |
| 65 to 74 Years | 156 (100.0%) | 225 (93.4%) |
| 75 Years and over | 147 (100.0%) | 144 (72.4%) |
| Total | 828 (95.7%) | 756 (89.8%) |
Income Below Poverty Among Married-Couple Families in Brewster
The poverty statistics for married-couple families in Brewster show that 3.0% or 15 of the total 496 families live below the poverty line. Families with 1 or 2 children have the highest poverty rate of 17.6%, comprising of 15 families. On the other hand, families with no children have the lowest poverty rate of 0.0%, which includes 0 families.
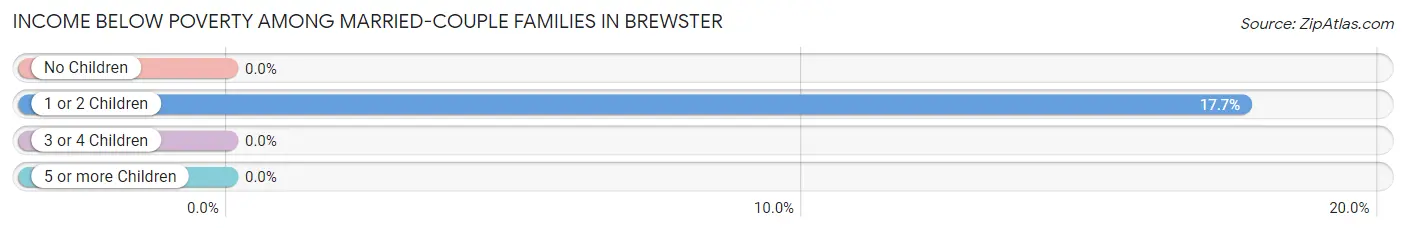
| Children | Above Poverty | Below Poverty |
| No Children | 394 (100.0%) | 0 (0.0%) |
| 1 or 2 Children | 70 (82.4%) | 15 (17.6%) |
| 3 or 4 Children | 17 (100.0%) | 0 (0.0%) |
| 5 or more Children | 0 (0.0%) | 0 (0.0%) |
| Total | 481 (97.0%) | 15 (3.0%) |
Income Below Poverty Among Single-Parent Households in Brewster
| Children | Single Father | Single Mother |
| No Children | 0 (0.0%) | 0 (0.0%) |
| 1 or 2 Children | 0 (0.0%) | 0 (0.0%) |
| 3 or 4 Children | 0 (0.0%) | 0 (0.0%) |
| 5 or more Children | 0 (0.0%) | 0 (0.0%) |
| Total | 0 (0.0%) | 0 (0.0%) |
Income Below Poverty Among Married-Couple vs Single-Parent Households in Brewster
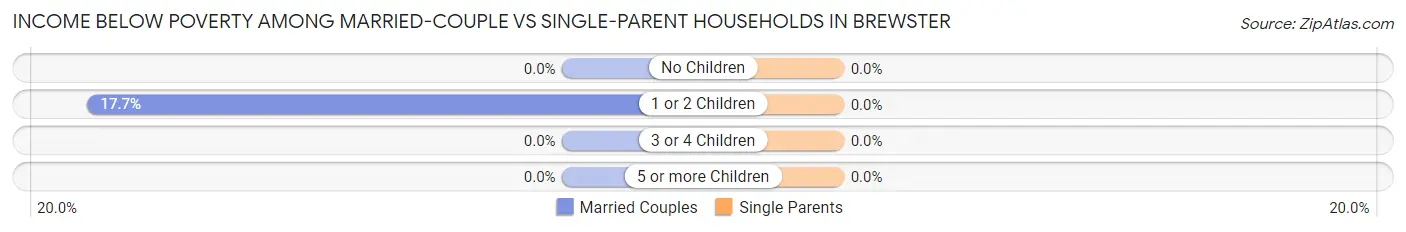
| Children | Married-Couple Families | Single-Parent Households |
| No Children | 0 (0.0%) | 0 (0.0%) |
| 1 or 2 Children | 15 (17.6%) | 0 (0.0%) |
| 3 or 4 Children | 0 (0.0%) | 0 (0.0%) |
| 5 or more Children | 0 (0.0%) | 0 (0.0%) |
| Total | 15 (3.0%) | 0 (0.0%) |
Race in Brewster
The most populous races in Brewster are White / Caucasian (1,644 | 94.5%), Two or more Races (85 | 4.9%), and Hispanic or Latino (53 | 3.0%).
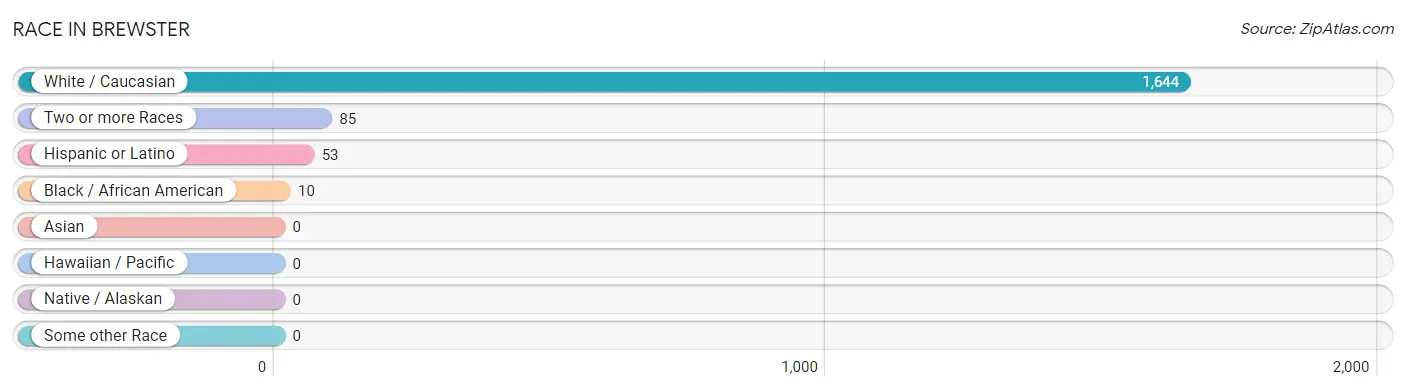
| Race | # Population | % Population |
| Asian | 0 | 0.0% |
| Black / African American | 10 | 0.6% |
| Hawaiian / Pacific | 0 | 0.0% |
| Hispanic or Latino | 53 | 3.0% |
| Native / Alaskan | 0 | 0.0% |
| White / Caucasian | 1,644 | 94.5% |
| Two or more Races | 85 | 4.9% |
| Some other Race | 0 | 0.0% |
| Total | 1,739 | 100.0% |
Ancestry in Brewster
The most populous ancestries reported in Brewster are Irish (639 | 36.7%), English (489 | 28.1%), German (264 | 15.2%), Swedish (146 | 8.4%), and French (133 | 7.6%), together accounting for 96.1% of all Brewster residents.
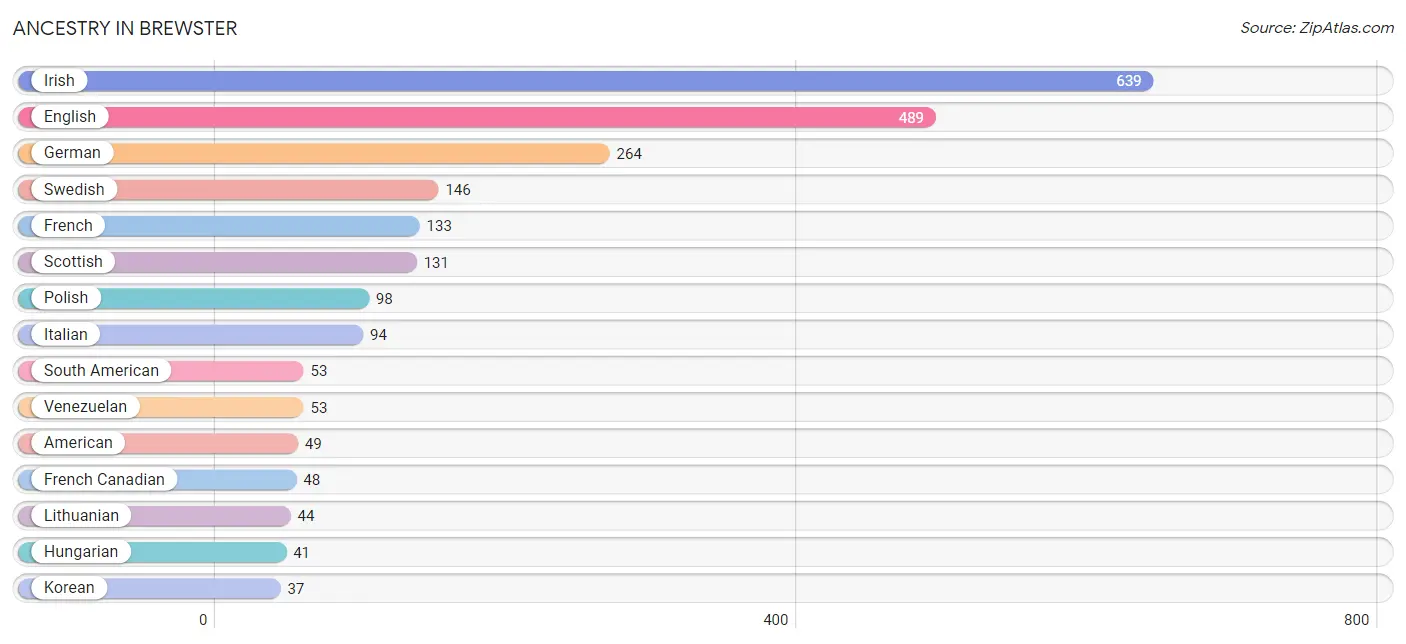
| Ancestry | # Population | % Population |
| African | 16 | 0.9% |
| American | 49 | 2.8% |
| Danish | 16 | 0.9% |
| Dutch | 25 | 1.4% |
| Eastern European | 18 | 1.0% |
| English | 489 | 28.1% |
| French | 133 | 7.6% |
| French Canadian | 48 | 2.8% |
| German | 264 | 15.2% |
| Hungarian | 41 | 2.4% |
| Irish | 639 | 36.7% |
| Italian | 94 | 5.4% |
| Korean | 37 | 2.1% |
| Lithuanian | 44 | 2.5% |
| Norwegian | 26 | 1.5% |
| Polish | 98 | 5.6% |
| Portuguese | 26 | 1.5% |
| Scotch-Irish | 15 | 0.9% |
| Scottish | 131 | 7.5% |
| South American | 53 | 3.0% |
| Subsaharan African | 16 | 0.9% |
| Swedish | 146 | 8.4% |
| Venezuelan | 53 | 3.0% | View All 23 Rows |
Immigrants in Brewster
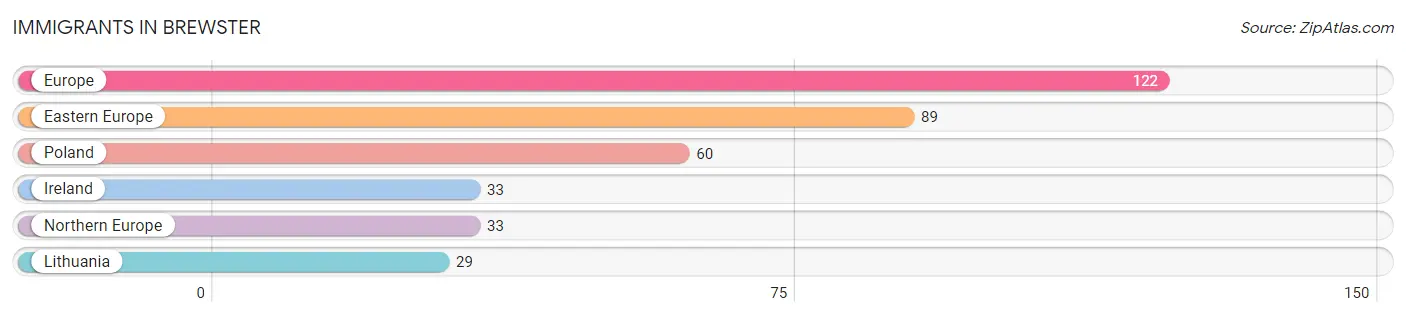
The most numerous immigrant groups reported in Brewster came from Europe (122 | 7.0%), Eastern Europe (89 | 5.1%), Poland (60 | 3.5%), Ireland (33 | 1.9%), and Northern Europe (33 | 1.9%), together accounting for 19.4% of all Brewster residents.
| Immigration Origin | # Population | % Population |
| Eastern Europe | 89 | 5.1% |
| Europe | 122 | 7.0% |
| Ireland | 33 | 1.9% |
| Lithuania | 29 | 1.7% |
| Northern Europe | 33 | 1.9% |
| Poland | 60 | 3.5% | View All 6 Rows |
Sex and Age in Brewster
Sex and Age in Brewster
The most populous age groups in Brewster are 60 to 64 Years (192 | 21.7%) for men and 70 to 74 Years (186 | 21.8%) for women.
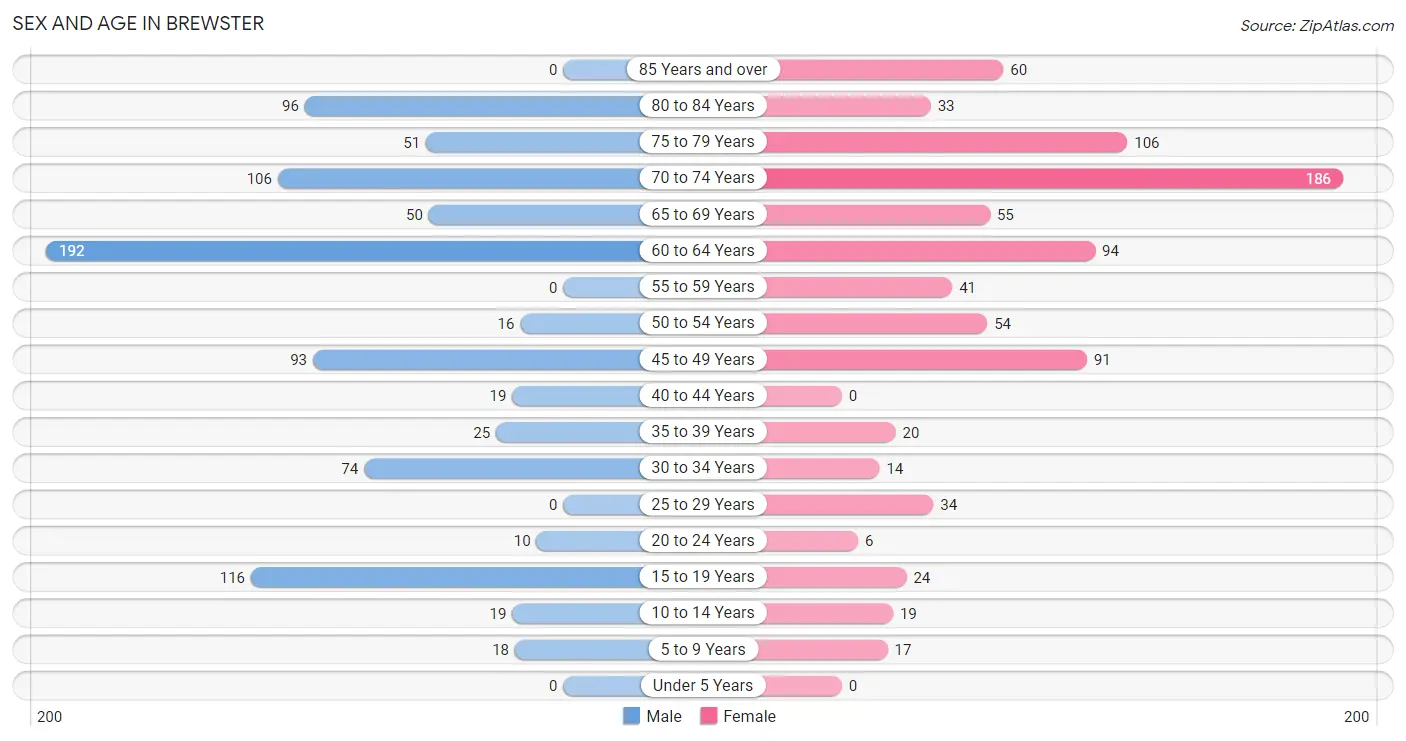
| Age Bracket | Male | Female |
| Under 5 Years | 0 (0.0%) | 0 (0.0%) |
| 5 to 9 Years | 18 (2.0%) | 17 (2.0%) |
| 10 to 14 Years | 19 (2.1%) | 19 (2.2%) |
| 15 to 19 Years | 116 (13.1%) | 24 (2.8%) |
| 20 to 24 Years | 10 (1.1%) | 6 (0.7%) |
| 25 to 29 Years | 0 (0.0%) | 34 (4.0%) |
| 30 to 34 Years | 74 (8.4%) | 14 (1.6%) |
| 35 to 39 Years | 25 (2.8%) | 20 (2.3%) |
| 40 to 44 Years | 19 (2.1%) | 0 (0.0%) |
| 45 to 49 Years | 93 (10.5%) | 91 (10.7%) |
| 50 to 54 Years | 16 (1.8%) | 54 (6.3%) |
| 55 to 59 Years | 0 (0.0%) | 41 (4.8%) |
| 60 to 64 Years | 192 (21.7%) | 94 (11.0%) |
| 65 to 69 Years | 50 (5.7%) | 55 (6.4%) |
| 70 to 74 Years | 106 (12.0%) | 186 (21.8%) |
| 75 to 79 Years | 51 (5.8%) | 106 (12.4%) |
| 80 to 84 Years | 96 (10.8%) | 33 (3.9%) |
| 85 Years and over | 0 (0.0%) | 60 (7.0%) |
| Total | 885 (100.0%) | 854 (100.0%) |
Families and Households in Brewster
Median Family Size in Brewster
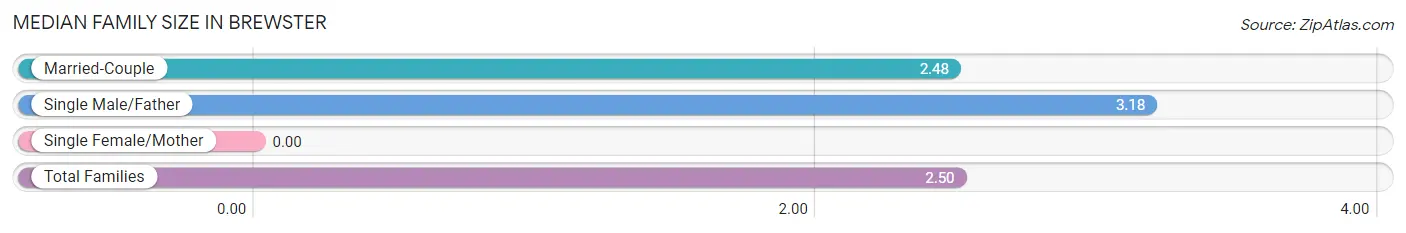
| Family Type | # Families | Family Size |
| Married-Couple | 496 (96.7%) | 2.48 |
| Single Male/Father | 17 (3.3%) | 3.18 |
| Single Female/Mother | 0 (0.0%) | - |
| Total Families | 513 (100.0%) | 2.50 |
Median Household Size in Brewster
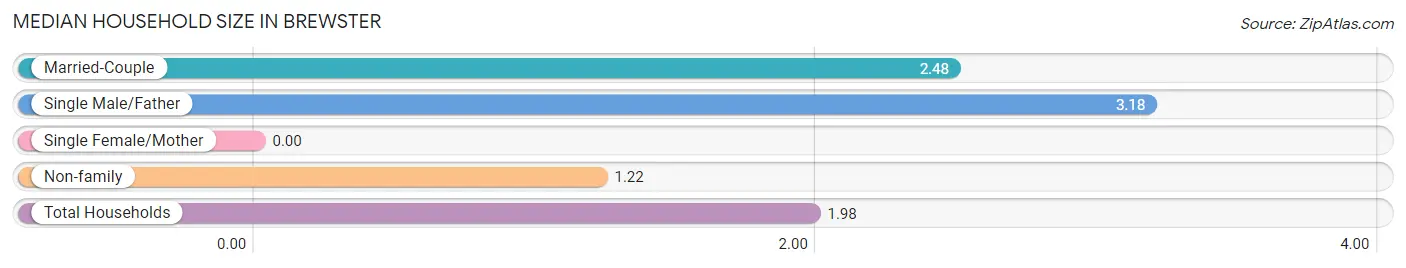
| Household Type | # Households | Household Size |
| Married-Couple | 496 (57.6%) | 2.48 |
| Single Male/Father | 17 (2.0%) | 3.18 |
| Single Female/Mother | 0 (0.0%) | - |
| Non-family | 348 (40.4%) | 1.22 |
| Total Households | 861 (100.0%) | 1.98 |
Household Size by Marriage Status in Brewster
Out of a total of 861 households in Brewster, 513 (59.6%) are family households, while 348 (40.4%) are nonfamily households. The most numerous type of family households are 2-person households, comprising 374, and the most common type of nonfamily households are 1-person households, comprising 308.
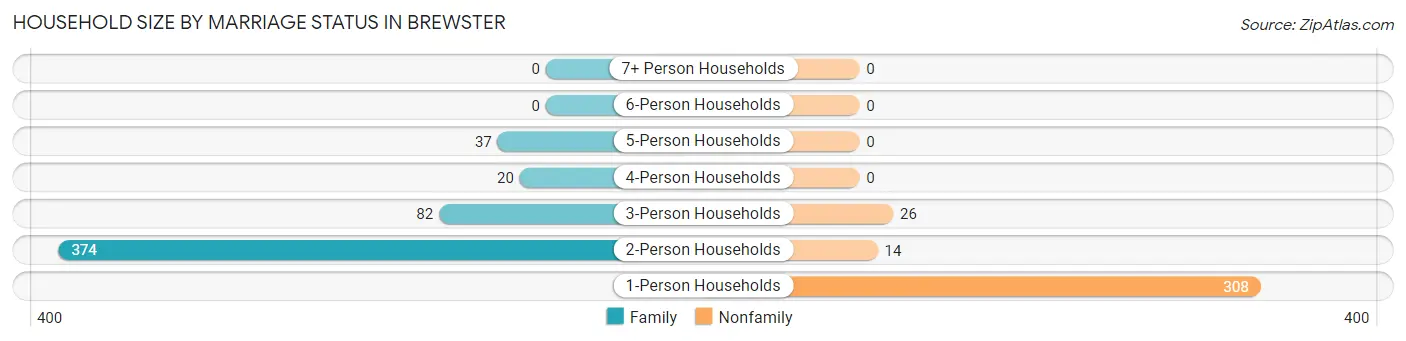
| Household Size | Family Households | Nonfamily Households |
| 1-Person Households | - | 308 (35.8%) |
| 2-Person Households | 374 (43.4%) | 14 (1.6%) |
| 3-Person Households | 82 (9.5%) | 26 (3.0%) |
| 4-Person Households | 20 (2.3%) | 0 (0.0%) |
| 5-Person Households | 37 (4.3%) | 0 (0.0%) |
| 6-Person Households | 0 (0.0%) | 0 (0.0%) |
| 7+ Person Households | 0 (0.0%) | 0 (0.0%) |
| Total | 513 (59.6%) | 348 (40.4%) |
Female Fertility in Brewster
Fertility by Age in Brewster
| Age Bracket | Women with Births | Births / 1,000 Women |
| 15 to 19 years | 0 (0.0%) | 0.0 |
| 20 to 34 years | 0 (0.0%) | 0.0 |
| 35 to 50 years | 0 (0.0%) | 0.0 |
| Total | 0 (0.0%) | 0.0 |
Fertility by Age by Marriage Status in Brewster
| Age Bracket | Married | Unmarried |
| 15 to 19 years | 0 (0.0%) | 0 (0.0%) |
| 20 to 34 years | 0 (0.0%) | 0 (0.0%) |
| 35 to 50 years | 0 (0.0%) | 0 (0.0%) |
| Total | 0 (0.0%) | 0 (0.0%) |
Fertility by Education in Brewster
| Educational Attainment | Women with Births | Births / 1,000 Women |
| Less than High School | 0 (0.0%) | 0.0 |
| High School Diploma | 0 (0.0%) | 0.0 |
| College or Associate's Degree | 0 (0.0%) | 0.0 |
| Bachelor's Degree | 0 (0.0%) | 0.0 |
| Graduate Degree | 0 (0.0%) | 0.0 |
| Total | 0 (0.0%) | 0.0 |
Fertility by Education by Marriage Status in Brewster
| Educational Attainment | Married | Unmarried |
| Less than High School | 0 (0.0%) | 0 (0.0%) |
| High School Diploma | 0 (0.0%) | 0 (0.0%) |
| College or Associate's Degree | 0 (0.0%) | 0 (0.0%) |
| Bachelor's Degree | 0 (0.0%) | 0 (0.0%) |
| Graduate Degree | 0 (0.0%) | 0 (0.0%) |
| Total | 0 (0.0%) | 0 (0.0%) |
Employment Characteristics in Brewster
Employment by Class of Employer in Brewster
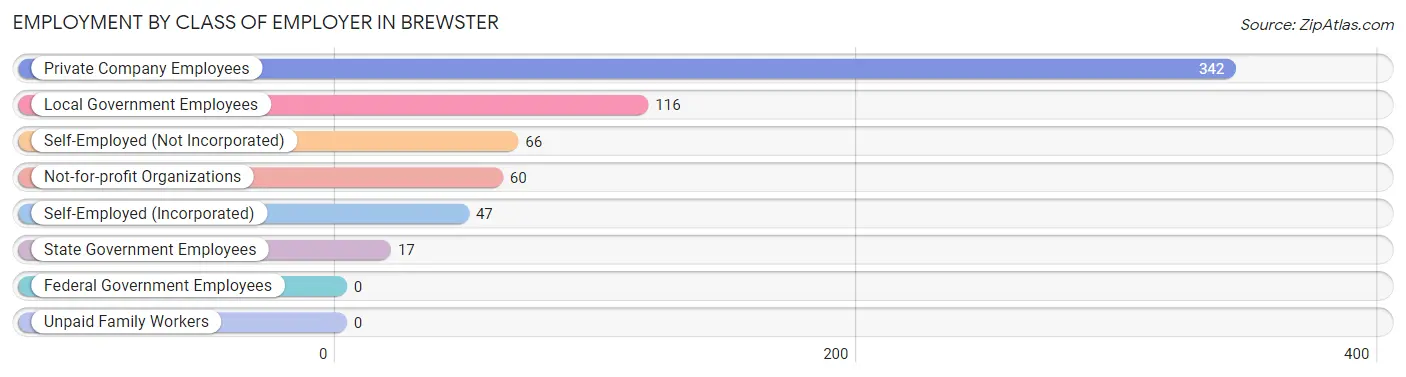
Among the 648 employed individuals in Brewster, private company employees (342 | 52.8%), local government employees (116 | 17.9%), and self-employed (not incorporated) (66 | 10.2%) make up the most common classes of employment.
| Employer Class | # Employees | % Employees |
| Private Company Employees | 342 | 52.8% |
| Self-Employed (Incorporated) | 47 | 7.2% |
| Self-Employed (Not Incorporated) | 66 | 10.2% |
| Not-for-profit Organizations | 60 | 9.3% |
| Local Government Employees | 116 | 17.9% |
| State Government Employees | 17 | 2.6% |
| Federal Government Employees | 0 | 0.0% |
| Unpaid Family Workers | 0 | 0.0% |
| Total | 648 | 100.0% |
Employment Status by Age in Brewster
According to the labor force statistics for Brewster, out of the total population over 16 years of age (1,629), 43.5% or 709 individuals are in the labor force, with 7.1% or 50 of them unemployed. The age group with the highest labor force participation rate is 25 to 29 years, with 100.0% or 34 individuals in the labor force. Within the labor force, the 45 to 54 years age range has the highest percentage of unemployed individuals, with 21.9% or 50 of them being unemployed.
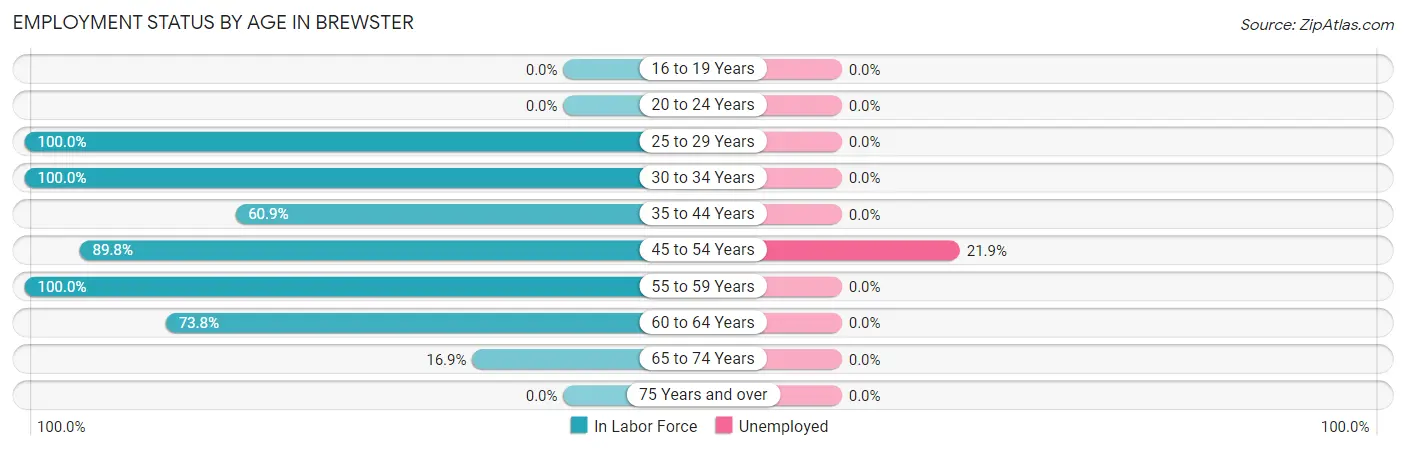
| Age Bracket | In Labor Force | Unemployed |
| 16 to 19 Years | 0 (0.0%) | 0 (0.0%) |
| 20 to 24 Years | 0 (0.0%) | 0 (0.0%) |
| 25 to 29 Years | 34 (100.0%) | 0 (0.0%) |
| 30 to 34 Years | 88 (100.0%) | 0 (0.0%) |
| 35 to 44 Years | 39 (60.9%) | 0 (0.0%) |
| 45 to 54 Years | 228 (89.8%) | 50 (21.9%) |
| 55 to 59 Years | 41 (100.0%) | 0 (0.0%) |
| 60 to 64 Years | 211 (73.8%) | 0 (0.0%) |
| 65 to 74 Years | 67 (16.9%) | 0 (0.0%) |
| 75 Years and over | 0 (0.0%) | 0 (0.0%) |
| Total | 709 (43.5%) | 50 (7.1%) |
Employment Status by Educational Attainment in Brewster
According to labor force statistics for Brewster, 83.6% of individuals (641) out of the total population between 25 and 64 years of age (767) are in the labor force, with 7.8% or 50 of them being unemployed. The group with the highest labor force participation rate are those with the educational attainment of college / associate degree, with 95.0% or 301 individuals in the labor force. Within the labor force, individuals with high school diploma education have the highest percentage of unemployment, with 36.2% or 50 of them being unemployed.
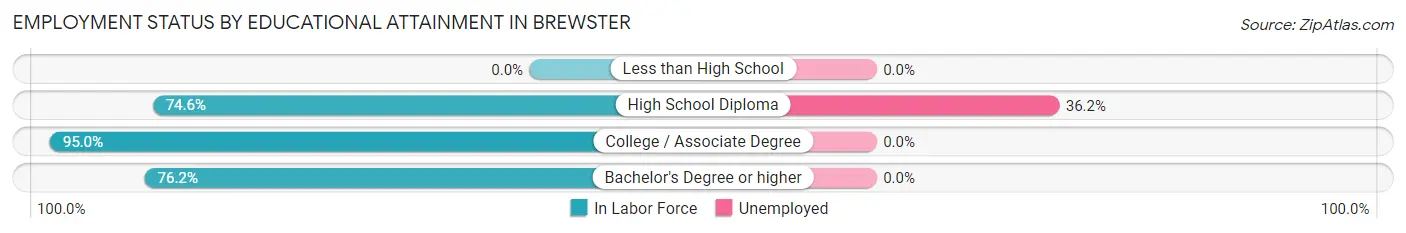
| Educational Attainment | In Labor Force | Unemployed |
| Less than High School | 0 (0.0%) | 0 (0.0%) |
| High School Diploma | 138 (74.6%) | 67 (36.2%) |
| College / Associate Degree | 301 (95.0%) | 0 (0.0%) |
| Bachelor's Degree or higher | 202 (76.2%) | 0 (0.0%) |
| Total | 641 (83.6%) | 60 (7.8%) |
Employment Occupations by Sex in Brewster
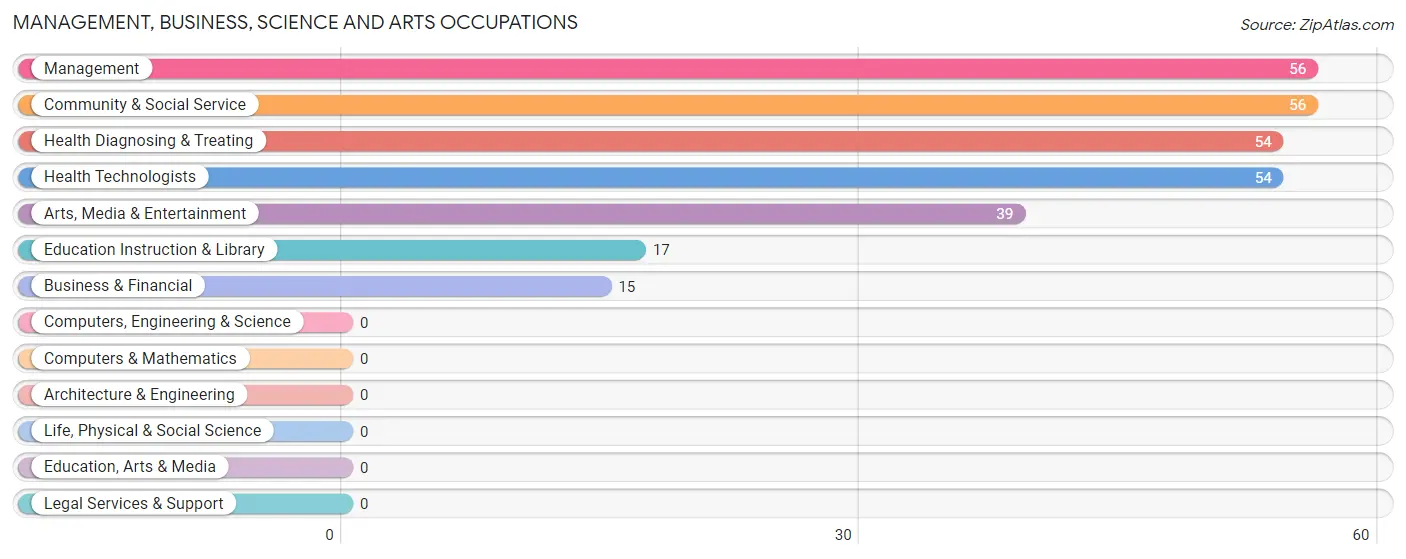
Management, Business, Science and Arts Occupations
The most common Management, Business, Science and Arts occupations in Brewster are Management (56 | 8.5%), Community & Social Service (56 | 8.5%), Health Diagnosing & Treating (54 | 8.2%), Health Technologists (54 | 8.2%), and Arts, Media & Entertainment (39 | 5.9%).
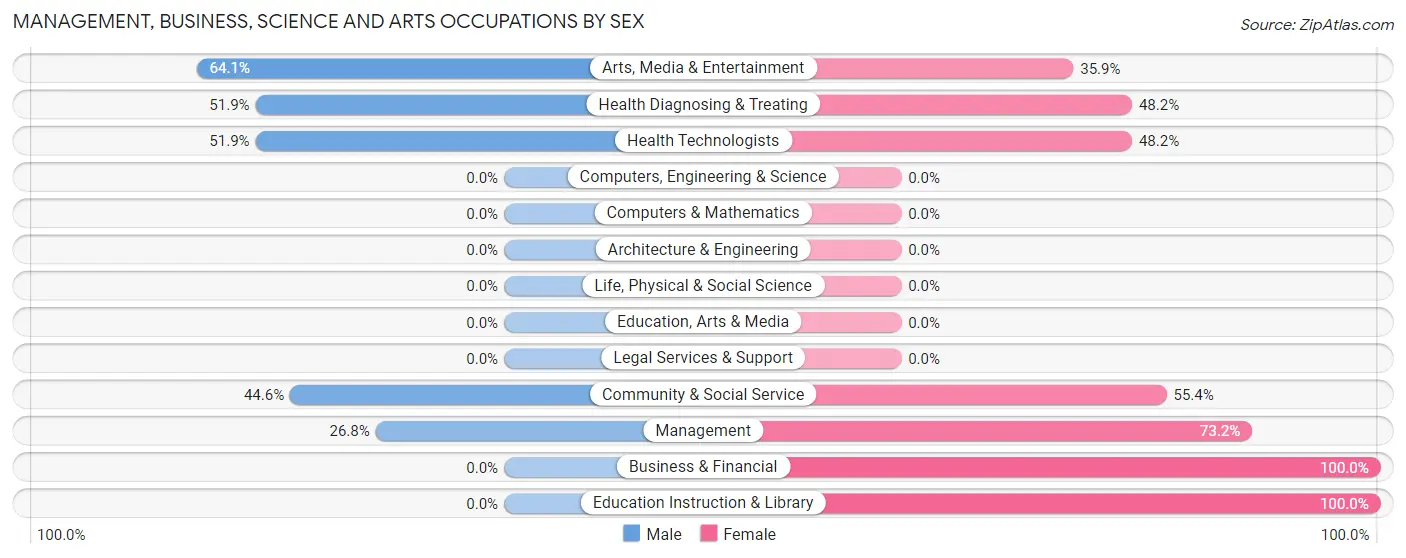
Management, Business, Science and Arts Occupations by Sex
Within the Management, Business, Science and Arts occupations in Brewster, the most male-oriented occupations are Arts, Media & Entertainment (64.1%), Health Diagnosing & Treating (51.8%), and Health Technologists (51.8%), while the most female-oriented occupations are Business & Financial (100.0%), Education Instruction & Library (100.0%), and Management (73.2%).
| Occupation | Male | Female |
| Management | 15 (26.8%) | 41 (73.2%) |
| Business & Financial | 0 (0.0%) | 15 (100.0%) |
| Computers, Engineering & Science | 0 (0.0%) | 0 (0.0%) |
| Computers & Mathematics | 0 (0.0%) | 0 (0.0%) |
| Architecture & Engineering | 0 (0.0%) | 0 (0.0%) |
| Life, Physical & Social Science | 0 (0.0%) | 0 (0.0%) |
| Community & Social Service | 25 (44.6%) | 31 (55.4%) |
| Education, Arts & Media | 0 (0.0%) | 0 (0.0%) |
| Legal Services & Support | 0 (0.0%) | 0 (0.0%) |
| Education Instruction & Library | 0 (0.0%) | 17 (100.0%) |
| Arts, Media & Entertainment | 25 (64.1%) | 14 (35.9%) |
| Health Diagnosing & Treating | 28 (51.8%) | 26 (48.1%) |
| Health Technologists | 28 (51.8%) | 26 (48.1%) |
| Total (Category) | 68 (37.6%) | 113 (62.4%) |
| Total (Overall) | 384 (58.4%) | 274 (41.6%) |
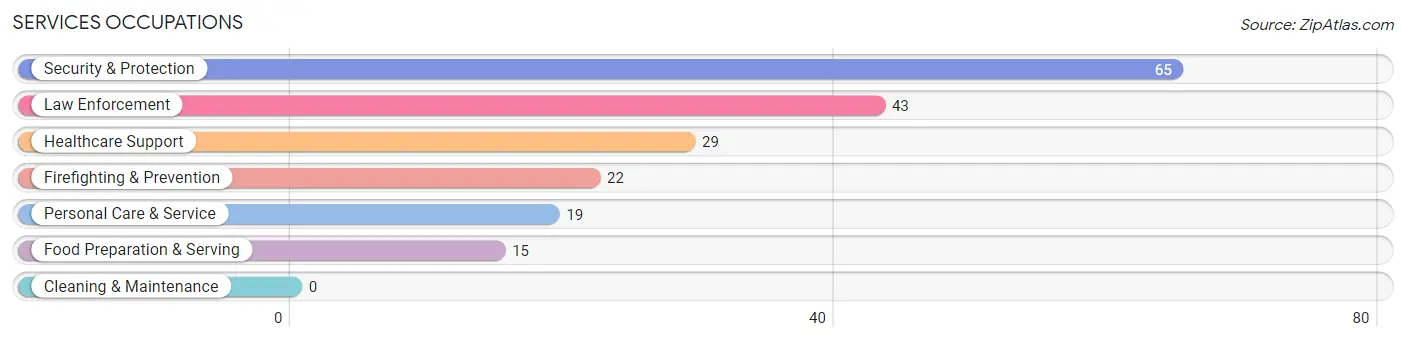
Services Occupations
The most common Services occupations in Brewster are Security & Protection (65 | 9.9%), Law Enforcement (43 | 6.5%), Healthcare Support (29 | 4.4%), Firefighting & Prevention (22 | 3.3%), and Personal Care & Service (19 | 2.9%).
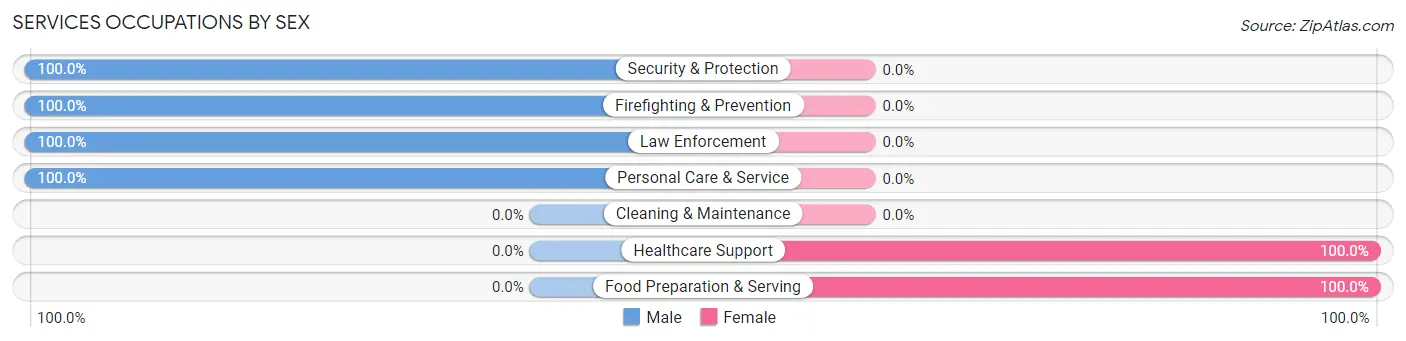
Services Occupations by Sex
Within the Services occupations in Brewster, the most male-oriented occupations are Security & Protection (100.0%), Firefighting & Prevention (100.0%), and Law Enforcement (100.0%), while the most female-oriented occupations are Healthcare Support (100.0%), and Food Preparation & Serving (100.0%).
| Occupation | Male | Female |
| Healthcare Support | 0 (0.0%) | 29 (100.0%) |
| Security & Protection | 65 (100.0%) | 0 (0.0%) |
| Firefighting & Prevention | 22 (100.0%) | 0 (0.0%) |
| Law Enforcement | 43 (100.0%) | 0 (0.0%) |
| Food Preparation & Serving | 0 (0.0%) | 15 (100.0%) |
| Cleaning & Maintenance | 0 (0.0%) | 0 (0.0%) |
| Personal Care & Service | 19 (100.0%) | 0 (0.0%) |
| Total (Category) | 84 (65.6%) | 44 (34.4%) |
| Total (Overall) | 384 (58.4%) | 274 (41.6%) |
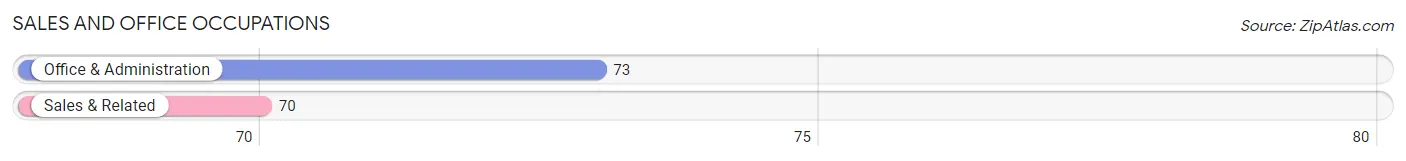
Sales and Office Occupations
The most common Sales and Office occupations in Brewster are Office & Administration (73 | 11.1%), and Sales & Related (70 | 10.6%).
Sales and Office Occupations by Sex
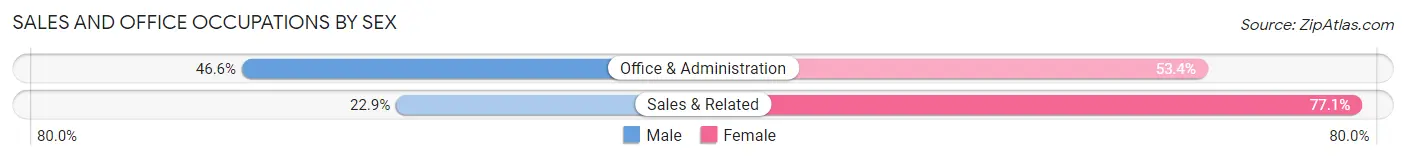
| Occupation | Male | Female |
| Sales & Related | 16 (22.9%) | 54 (77.1%) |
| Office & Administration | 34 (46.6%) | 39 (53.4%) |
| Total (Category) | 50 (35.0%) | 93 (65.0%) |
| Total (Overall) | 384 (58.4%) | 274 (41.6%) |
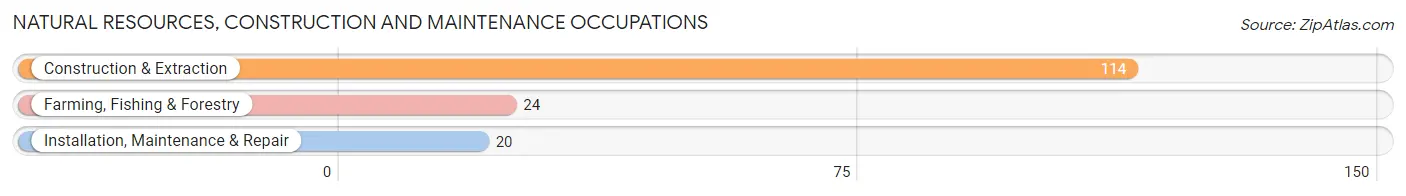
Natural Resources, Construction and Maintenance Occupations
The most common Natural Resources, Construction and Maintenance occupations in Brewster are Construction & Extraction (114 | 17.3%), Farming, Fishing & Forestry (24 | 3.6%), and Installation, Maintenance & Repair (20 | 3.0%).
Natural Resources, Construction and Maintenance Occupations by Sex
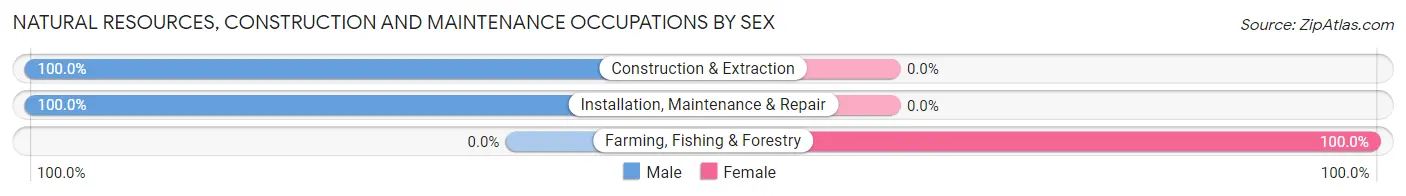
| Occupation | Male | Female |
| Farming, Fishing & Forestry | 0 (0.0%) | 24 (100.0%) |
| Construction & Extraction | 114 (100.0%) | 0 (0.0%) |
| Installation, Maintenance & Repair | 20 (100.0%) | 0 (0.0%) |
| Total (Category) | 134 (84.8%) | 24 (15.2%) |
| Total (Overall) | 384 (58.4%) | 274 (41.6%) |
Production, Transportation and Moving Occupations
The most common Production, Transportation and Moving occupations in Brewster are Transportation (30 | 4.6%), and Production (18 | 2.7%).
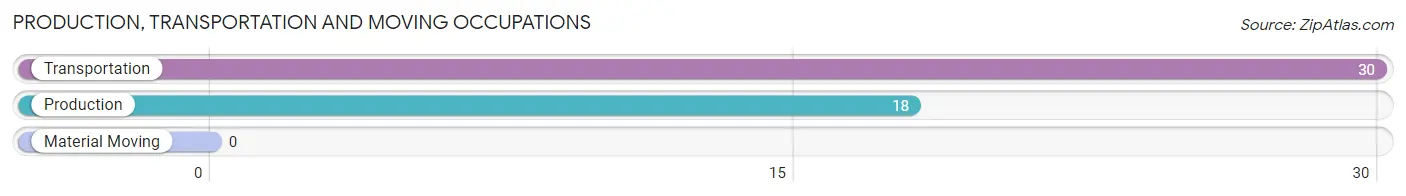
Production, Transportation and Moving Occupations by Sex
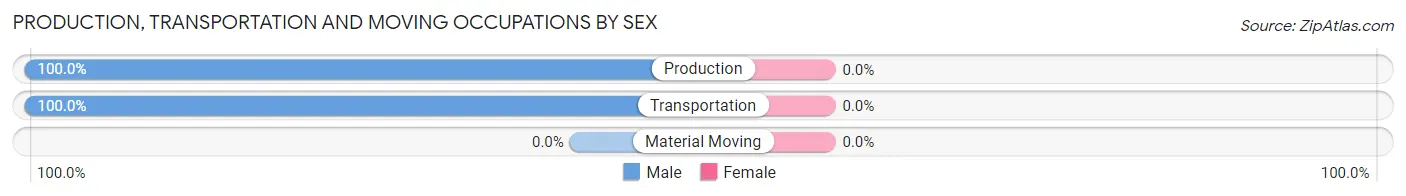
| Occupation | Male | Female |
| Production | 18 (100.0%) | 0 (0.0%) |
| Transportation | 30 (100.0%) | 0 (0.0%) |
| Material Moving | 0 (0.0%) | 0 (0.0%) |
| Total (Category) | 48 (100.0%) | 0 (0.0%) |
| Total (Overall) | 384 (58.4%) | 274 (41.6%) |
Employment Industries by Sex in Brewster
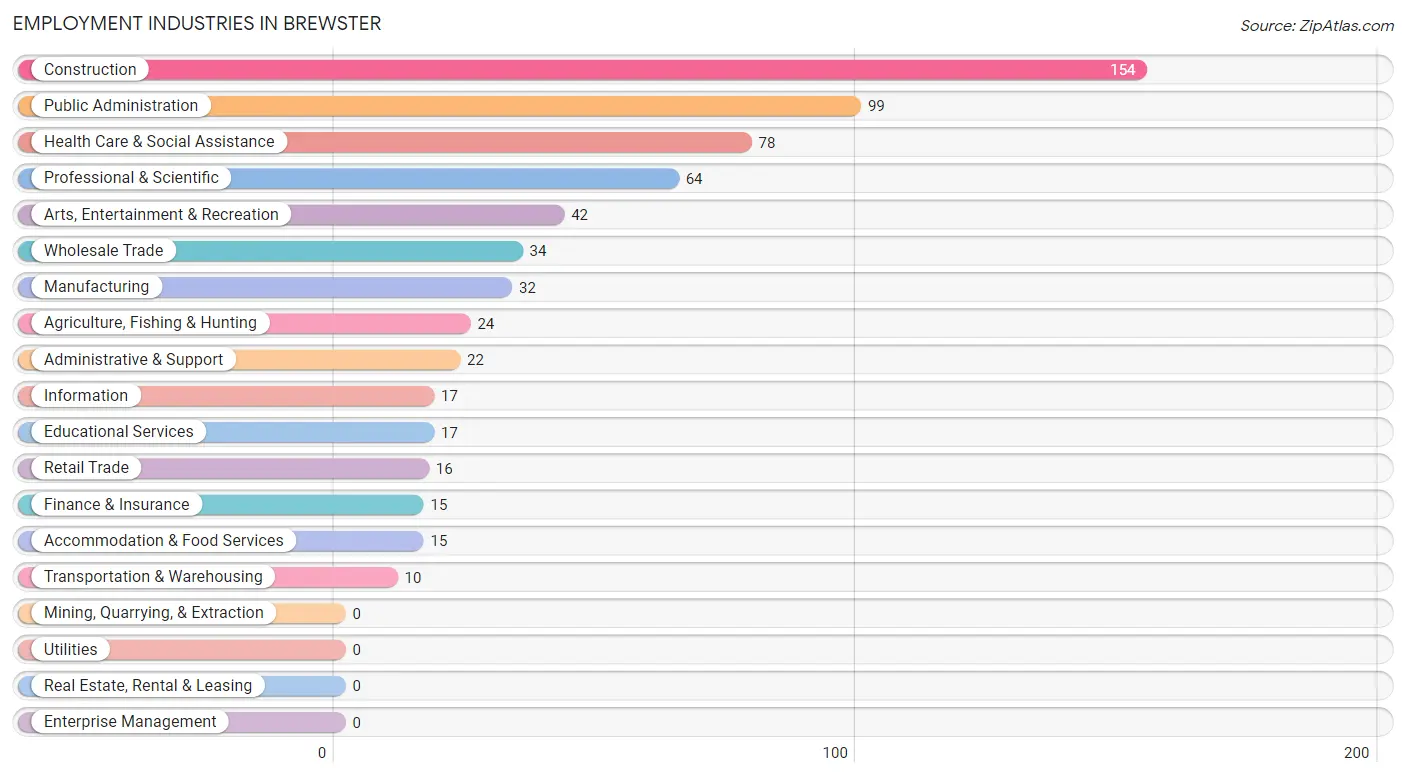
Employment Industries in Brewster
The major employment industries in Brewster include Construction (154 | 23.4%), Public Administration (99 | 15.0%), Health Care & Social Assistance (78 | 11.8%), Professional & Scientific (64 | 9.7%), and Arts, Entertainment & Recreation (42 | 6.4%).
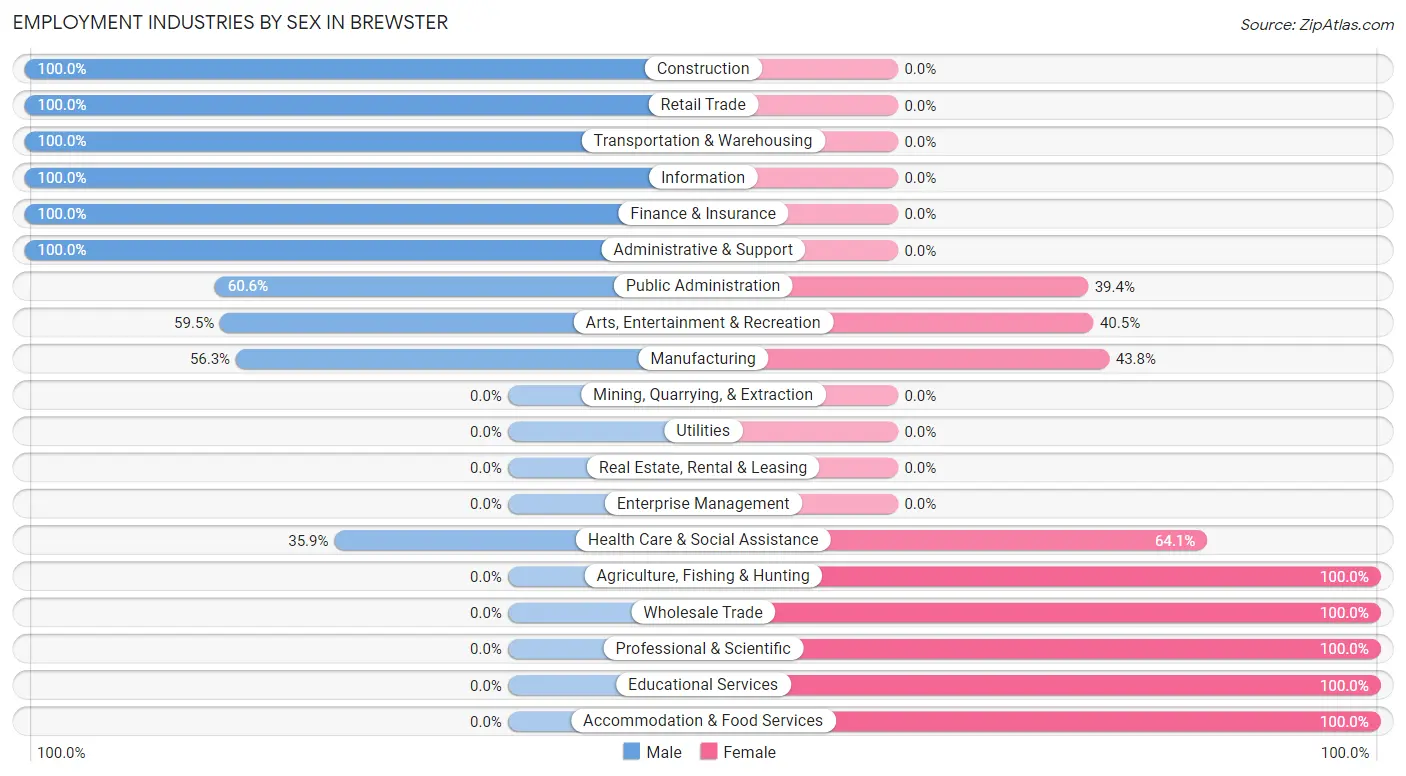
Employment Industries by Sex in Brewster
The Brewster industries that see more men than women are Construction (100.0%), Retail Trade (100.0%), and Transportation & Warehousing (100.0%), whereas the industries that tend to have a higher number of women are Agriculture, Fishing & Hunting (100.0%), Wholesale Trade (100.0%), and Professional & Scientific (100.0%).
| Industry | Male | Female |
| Agriculture, Fishing & Hunting | 0 (0.0%) | 24 (100.0%) |
| Mining, Quarrying, & Extraction | 0 (0.0%) | 0 (0.0%) |
| Construction | 154 (100.0%) | 0 (0.0%) |
| Manufacturing | 18 (56.2%) | 14 (43.8%) |
| Wholesale Trade | 0 (0.0%) | 34 (100.0%) |
| Retail Trade | 16 (100.0%) | 0 (0.0%) |
| Transportation & Warehousing | 10 (100.0%) | 0 (0.0%) |
| Utilities | 0 (0.0%) | 0 (0.0%) |
| Information | 17 (100.0%) | 0 (0.0%) |
| Finance & Insurance | 15 (100.0%) | 0 (0.0%) |
| Real Estate, Rental & Leasing | 0 (0.0%) | 0 (0.0%) |
| Professional & Scientific | 0 (0.0%) | 64 (100.0%) |
| Enterprise Management | 0 (0.0%) | 0 (0.0%) |
| Administrative & Support | 22 (100.0%) | 0 (0.0%) |
| Educational Services | 0 (0.0%) | 17 (100.0%) |
| Health Care & Social Assistance | 28 (35.9%) | 50 (64.1%) |
| Arts, Entertainment & Recreation | 25 (59.5%) | 17 (40.5%) |
| Accommodation & Food Services | 0 (0.0%) | 15 (100.0%) |
| Public Administration | 60 (60.6%) | 39 (39.4%) |
| Total | 384 (58.4%) | 274 (41.6%) |
Education in Brewster
School Enrollment in Brewster
The most common levels of schooling among the 236 students in Brewster are high school (142 | 60.2%), middle school (38 | 16.1%), and elementary school (35 | 14.8%).
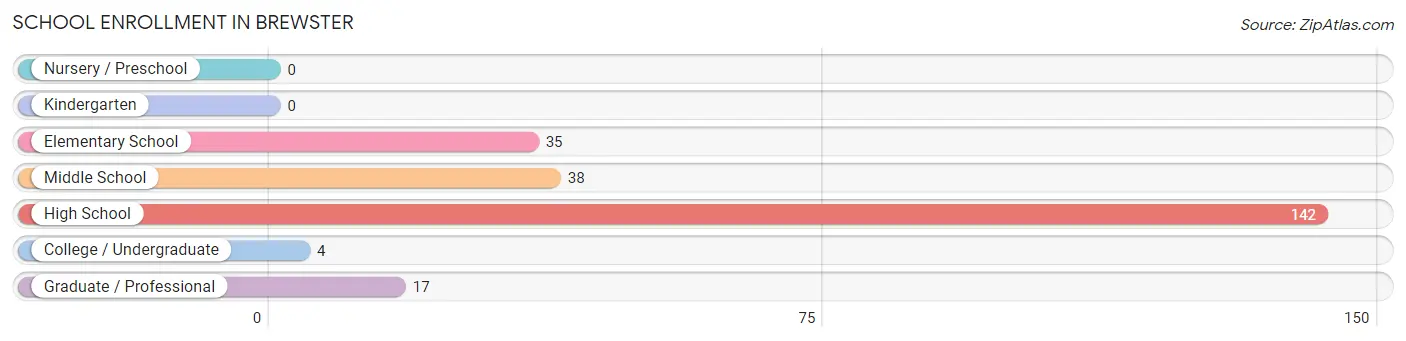
| School Level | # Students | % Students |
| Nursery / Preschool | 0 | 0.0% |
| Kindergarten | 0 | 0.0% |
| Elementary School | 35 | 14.8% |
| Middle School | 38 | 16.1% |
| High School | 142 | 60.2% |
| College / Undergraduate | 4 | 1.7% |
| Graduate / Professional | 17 | 7.2% |
| Total | 236 | 100.0% |
School Enrollment by Age by Funding Source in Brewster
Out of a total of 236 students who are enrolled in schools in Brewster, 35 (14.8%) attend a private institution, while the remaining 201 (85.2%) are enrolled in public schools. The age group of 35 years and over has the highest likelihood of being enrolled in private schools, with 17 (100.0% in the age bracket) enrolled. Conversely, the age group of 5 to 9 year old has the lowest likelihood of being enrolled in a private school, with 35 (100.0% in the age bracket) attending a public institution.
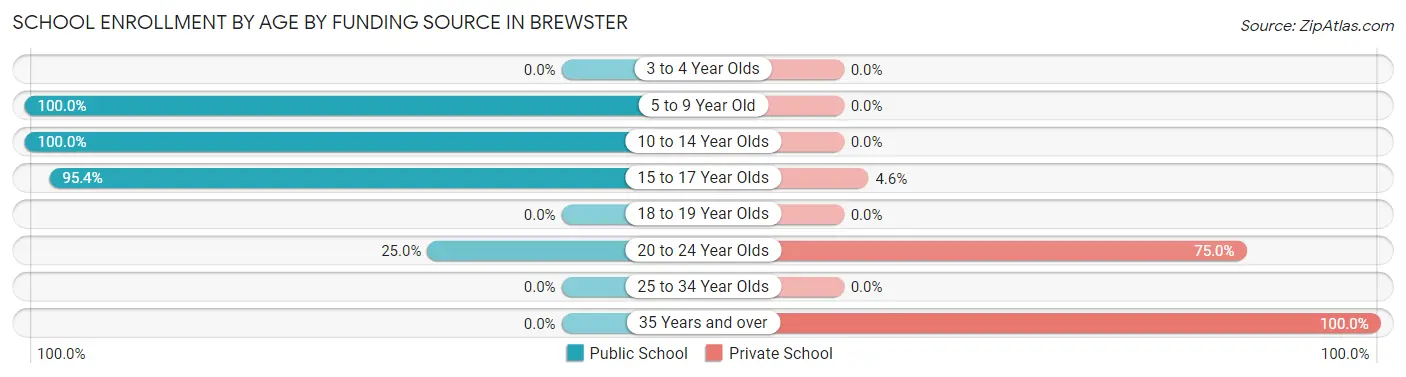
| Age Bracket | Public School | Private School |
| 3 to 4 Year Olds | 0 (0.0%) | 0 (0.0%) |
| 5 to 9 Year Old | 35 (100.0%) | 0 (0.0%) |
| 10 to 14 Year Olds | 38 (100.0%) | 0 (0.0%) |
| 15 to 17 Year Olds | 124 (95.4%) | 6 (4.6%) |
| 18 to 19 Year Olds | 0 (0.0%) | 0 (0.0%) |
| 20 to 24 Year Olds | 4 (25.0%) | 12 (75.0%) |
| 25 to 34 Year Olds | 0 (0.0%) | 0 (0.0%) |
| 35 Years and over | 0 (0.0%) | 17 (100.0%) |
| Total | 201 (85.2%) | 35 (14.8%) |
Educational Attainment by Field of Study in Brewster
Education (174 | 22.8%), social sciences (124 | 16.3%), visual & performing arts (91 | 11.9%), business (74 | 9.7%), and bio, nature & agricultural (71 | 9.3%) are the most common fields of study among 763 individuals in Brewster who have obtained a bachelor's degree or higher.
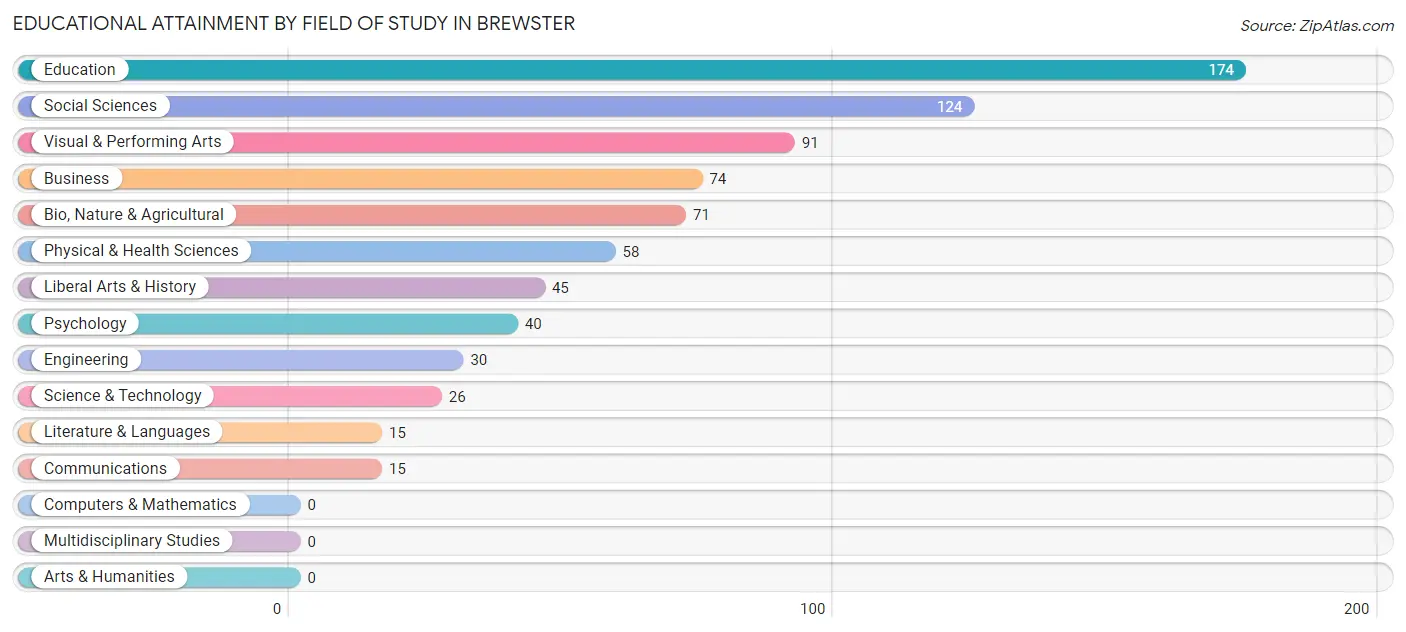
| Field of Study | # Graduates | % Graduates |
| Computers & Mathematics | 0 | 0.0% |
| Bio, Nature & Agricultural | 71 | 9.3% |
| Physical & Health Sciences | 58 | 7.6% |
| Psychology | 40 | 5.2% |
| Social Sciences | 124 | 16.3% |
| Engineering | 30 | 3.9% |
| Multidisciplinary Studies | 0 | 0.0% |
| Science & Technology | 26 | 3.4% |
| Business | 74 | 9.7% |
| Education | 174 | 22.8% |
| Literature & Languages | 15 | 2.0% |
| Liberal Arts & History | 45 | 5.9% |
| Visual & Performing Arts | 91 | 11.9% |
| Communications | 15 | 2.0% |
| Arts & Humanities | 0 | 0.0% |
| Total | 763 | 100.0% |
Transportation & Commute in Brewster
Vehicle Availability by Sex in Brewster
The most prevalent vehicle ownership categories in Brewster are males with 2 vehicles (245, accounting for 65.5%) and females with 2 vehicles (150, making up 89.4%).
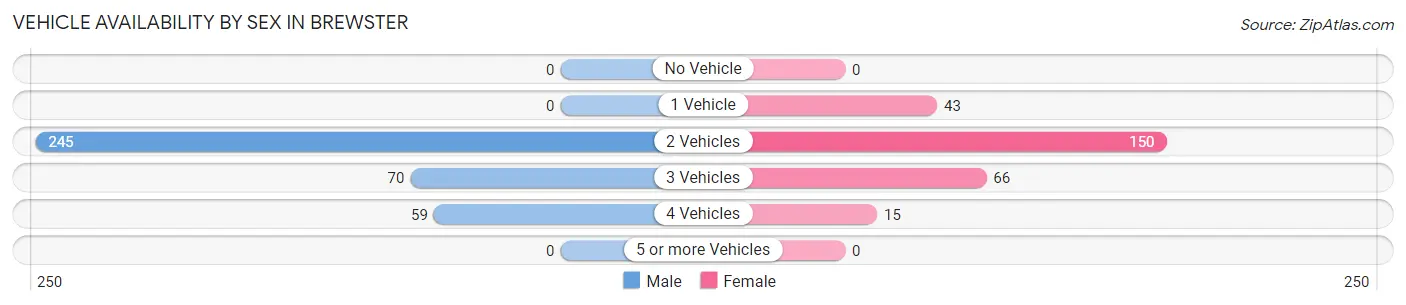
| Vehicles Available | Male | Female |
| No Vehicle | 0 (0.0%) | 0 (0.0%) |
| 1 Vehicle | 0 (0.0%) | 43 (15.7%) |
| 2 Vehicles | 245 (65.5%) | 150 (54.7%) |
| 3 Vehicles | 70 (18.7%) | 66 (24.1%) |
| 4 Vehicles | 59 (15.8%) | 15 (5.5%) |
| 5 or more Vehicles | 0 (0.0%) | 0 (0.0%) |
| Total | 374 (100.0%) | 274 (100.0%) |
Commute Time in Brewster
The most frequently occuring commute durations in Brewster are 15 to 19 minutes (196 commuters, 32.7%), 25 to 29 minutes (83 commuters, 13.9%), and 10 to 14 minutes (61 commuters, 10.2%).
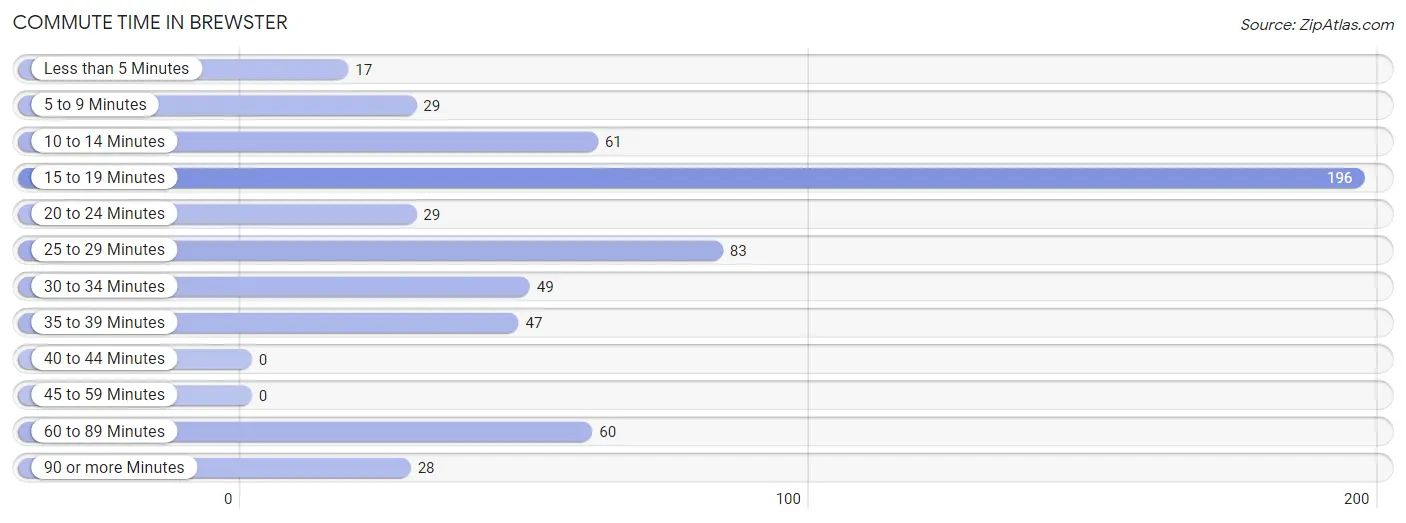
| Commute Time | # Commuters | % Commuters |
| Less than 5 Minutes | 17 | 2.8% |
| 5 to 9 Minutes | 29 | 4.8% |
| 10 to 14 Minutes | 61 | 10.2% |
| 15 to 19 Minutes | 196 | 32.7% |
| 20 to 24 Minutes | 29 | 4.8% |
| 25 to 29 Minutes | 83 | 13.9% |
| 30 to 34 Minutes | 49 | 8.2% |
| 35 to 39 Minutes | 47 | 7.9% |
| 40 to 44 Minutes | 0 | 0.0% |
| 45 to 59 Minutes | 0 | 0.0% |
| 60 to 89 Minutes | 60 | 10.0% |
| 90 or more Minutes | 28 | 4.7% |
Commute Time by Sex in Brewster
The most common commute times in Brewster are 15 to 19 minutes (125 commuters, 38.5%) for males and 15 to 19 minutes (71 commuters, 25.9%) for females.
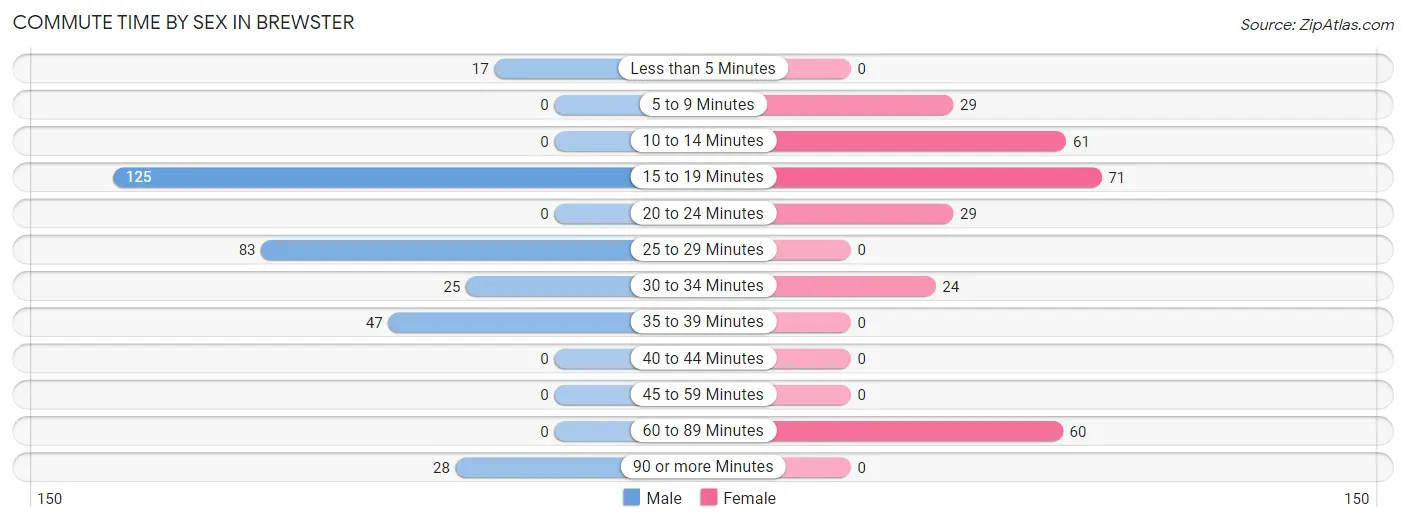
| Commute Time | Male | Female |
| Less than 5 Minutes | 17 (5.2%) | 0 (0.0%) |
| 5 to 9 Minutes | 0 (0.0%) | 29 (10.6%) |
| 10 to 14 Minutes | 0 (0.0%) | 61 (22.3%) |
| 15 to 19 Minutes | 125 (38.5%) | 71 (25.9%) |
| 20 to 24 Minutes | 0 (0.0%) | 29 (10.6%) |
| 25 to 29 Minutes | 83 (25.5%) | 0 (0.0%) |
| 30 to 34 Minutes | 25 (7.7%) | 24 (8.8%) |
| 35 to 39 Minutes | 47 (14.5%) | 0 (0.0%) |
| 40 to 44 Minutes | 0 (0.0%) | 0 (0.0%) |
| 45 to 59 Minutes | 0 (0.0%) | 0 (0.0%) |
| 60 to 89 Minutes | 0 (0.0%) | 60 (21.9%) |
| 90 or more Minutes | 28 (8.6%) | 0 (0.0%) |
Time of Departure to Work by Sex in Brewster
The most frequent times of departure to work in Brewster are 4:00 PM to 11:59 PM (94, 28.9%) for males and 4:00 PM to 11:59 PM (80, 29.2%) for females.
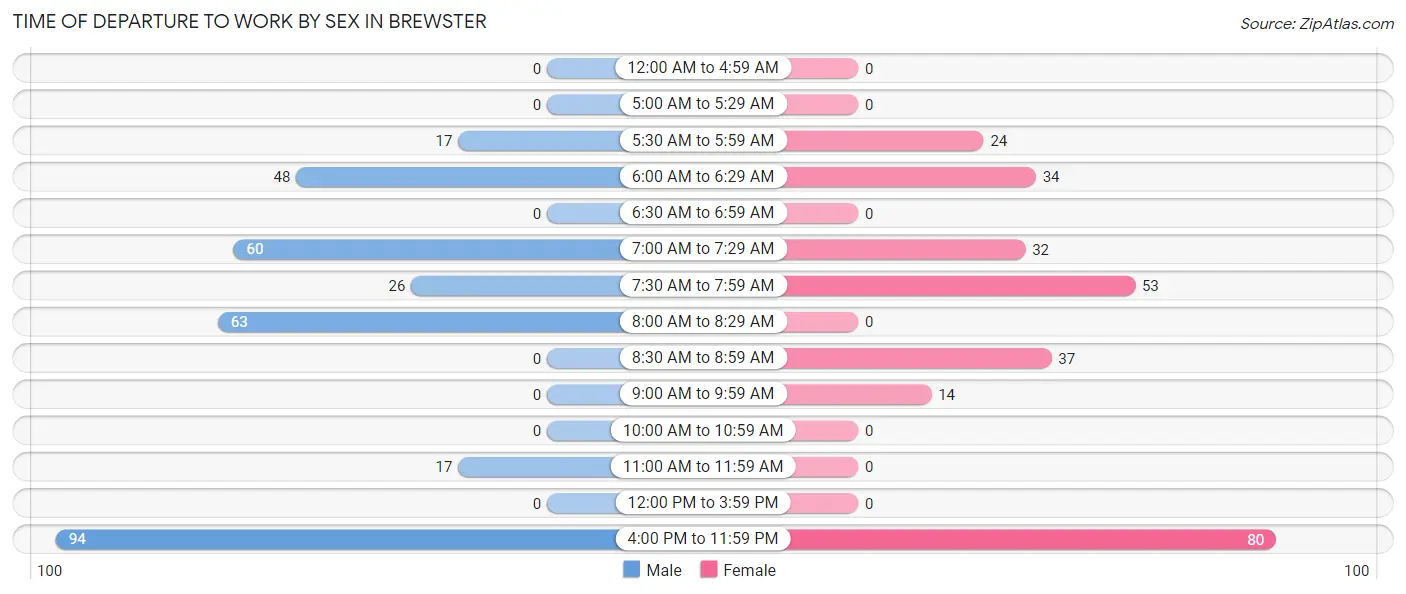
| Time of Departure | Male | Female |
| 12:00 AM to 4:59 AM | 0 (0.0%) | 0 (0.0%) |
| 5:00 AM to 5:29 AM | 0 (0.0%) | 0 (0.0%) |
| 5:30 AM to 5:59 AM | 17 (5.2%) | 24 (8.8%) |
| 6:00 AM to 6:29 AM | 48 (14.8%) | 34 (12.4%) |
| 6:30 AM to 6:59 AM | 0 (0.0%) | 0 (0.0%) |
| 7:00 AM to 7:29 AM | 60 (18.5%) | 32 (11.7%) |
| 7:30 AM to 7:59 AM | 26 (8.0%) | 53 (19.3%) |
| 8:00 AM to 8:29 AM | 63 (19.4%) | 0 (0.0%) |
| 8:30 AM to 8:59 AM | 0 (0.0%) | 37 (13.5%) |
| 9:00 AM to 9:59 AM | 0 (0.0%) | 14 (5.1%) |
| 10:00 AM to 10:59 AM | 0 (0.0%) | 0 (0.0%) |
| 11:00 AM to 11:59 AM | 17 (5.2%) | 0 (0.0%) |
| 12:00 PM to 3:59 PM | 0 (0.0%) | 0 (0.0%) |
| 4:00 PM to 11:59 PM | 94 (28.9%) | 80 (29.2%) |
| Total | 325 (100.0%) | 274 (100.0%) |
Housing Occupancy in Brewster
Occupancy by Ownership in Brewster
Of the total 861 dwellings in Brewster, owner-occupied units account for 696 (80.8%), while renter-occupied units make up 165 (19.2%).
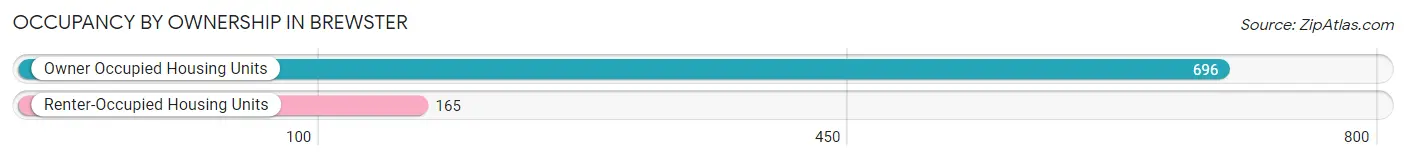
| Occupancy | # Housing Units | % Housing Units |
| Owner Occupied Housing Units | 696 | 80.8% |
| Renter-Occupied Housing Units | 165 | 19.2% |
| Total Occupied Housing Units | 861 | 100.0% |
Occupancy by Household Size in Brewster
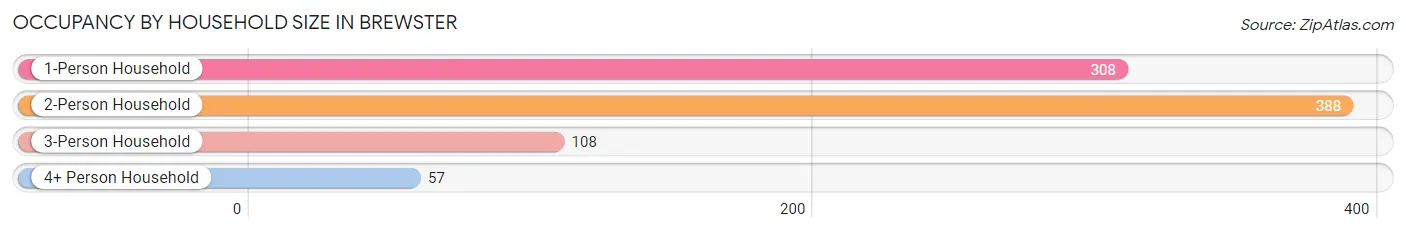
| Household Size | # Housing Units | % Housing Units |
| 1-Person Household | 308 | 35.8% |
| 2-Person Household | 388 | 45.1% |
| 3-Person Household | 108 | 12.5% |
| 4+ Person Household | 57 | 6.6% |
| Total Housing Units | 861 | 100.0% |
Occupancy by Ownership by Household Size in Brewster
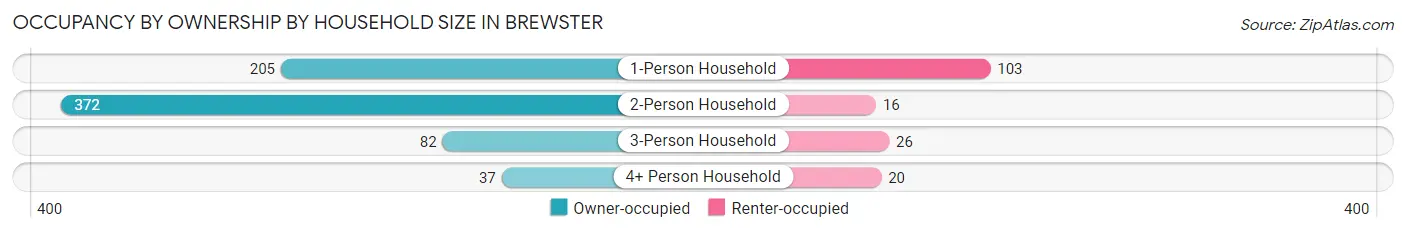
| Household Size | Owner-occupied | Renter-occupied |
| 1-Person Household | 205 (66.6%) | 103 (33.4%) |
| 2-Person Household | 372 (95.9%) | 16 (4.1%) |
| 3-Person Household | 82 (75.9%) | 26 (24.1%) |
| 4+ Person Household | 37 (64.9%) | 20 (35.1%) |
| Total Housing Units | 696 (80.8%) | 165 (19.2%) |
Occupancy by Educational Attainment in Brewster
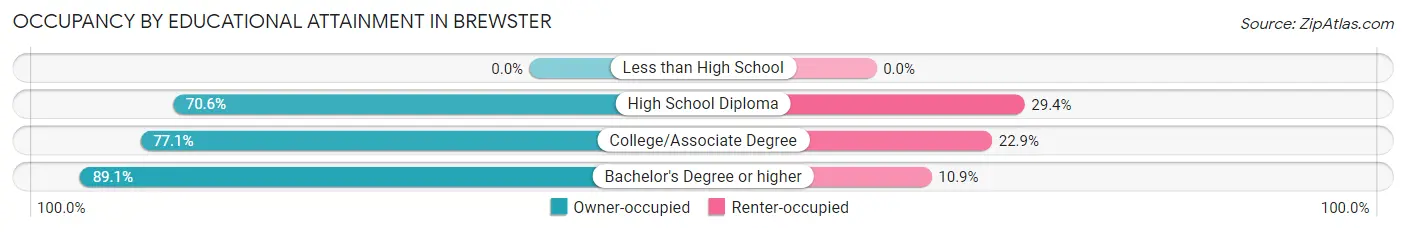
| Household Size | Owner-occupied | Renter-occupied |
| Less than High School | 0 (0.0%) | 0 (0.0%) |
| High School Diploma | 149 (70.6%) | 62 (29.4%) |
| College/Associate Degree | 205 (77.1%) | 61 (22.9%) |
| Bachelor's Degree or higher | 342 (89.1%) | 42 (10.9%) |
Occupancy by Age of Householder in Brewster
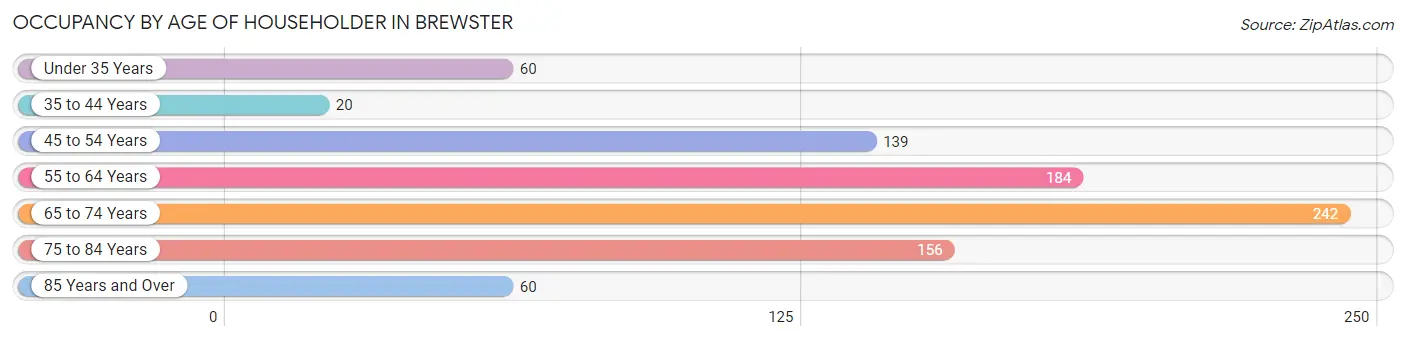
| Age Bracket | # Households | % Households |
| Under 35 Years | 60 | 7.0% |
| 35 to 44 Years | 20 | 2.3% |
| 45 to 54 Years | 139 | 16.1% |
| 55 to 64 Years | 184 | 21.4% |
| 65 to 74 Years | 242 | 28.1% |
| 75 to 84 Years | 156 | 18.1% |
| 85 Years and Over | 60 | 7.0% |
| Total | 861 | 100.0% |
Housing Finances in Brewster
Median Income by Occupancy in Brewster
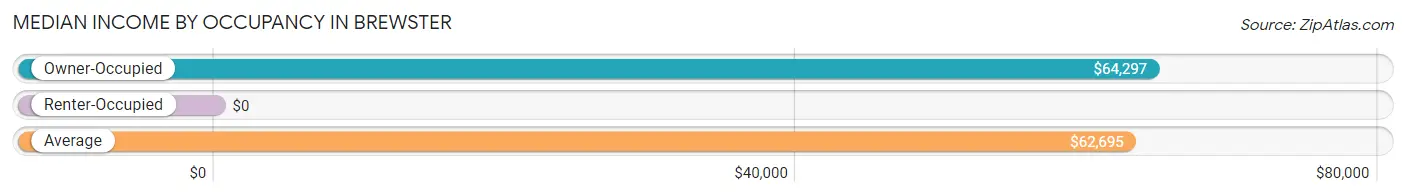
| Occupancy Type | # Households | Median Income |
| Owner-Occupied | 696 (80.8%) | $64,297 |
| Renter-Occupied | 165 (19.2%) | $0 |
| Average | 861 (100.0%) | $62,695 |
Occupancy by Householder Income Bracket in Brewster
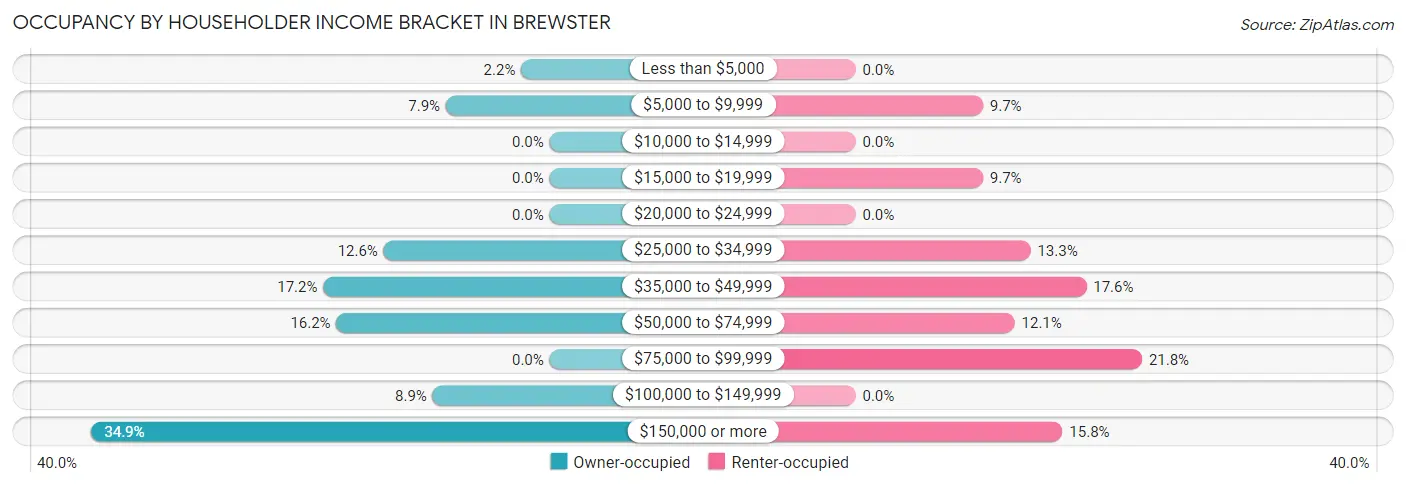
| Income Bracket | Owner-occupied | Renter-occupied |
| Less than $5,000 | 15 (2.2%) | 0 (0.0%) |
| $5,000 to $9,999 | 55 (7.9%) | 16 (9.7%) |
| $10,000 to $14,999 | 0 (0.0%) | 0 (0.0%) |
| $15,000 to $19,999 | 0 (0.0%) | 16 (9.7%) |
| $20,000 to $24,999 | 0 (0.0%) | 0 (0.0%) |
| $25,000 to $34,999 | 88 (12.6%) | 22 (13.3%) |
| $35,000 to $49,999 | 120 (17.2%) | 29 (17.6%) |
| $50,000 to $74,999 | 113 (16.2%) | 20 (12.1%) |
| $75,000 to $99,999 | 0 (0.0%) | 36 (21.8%) |
| $100,000 to $149,999 | 62 (8.9%) | 0 (0.0%) |
| $150,000 or more | 243 (34.9%) | 26 (15.8%) |
| Total | 696 (100.0%) | 165 (100.0%) |
Monthly Housing Cost Tiers in Brewster
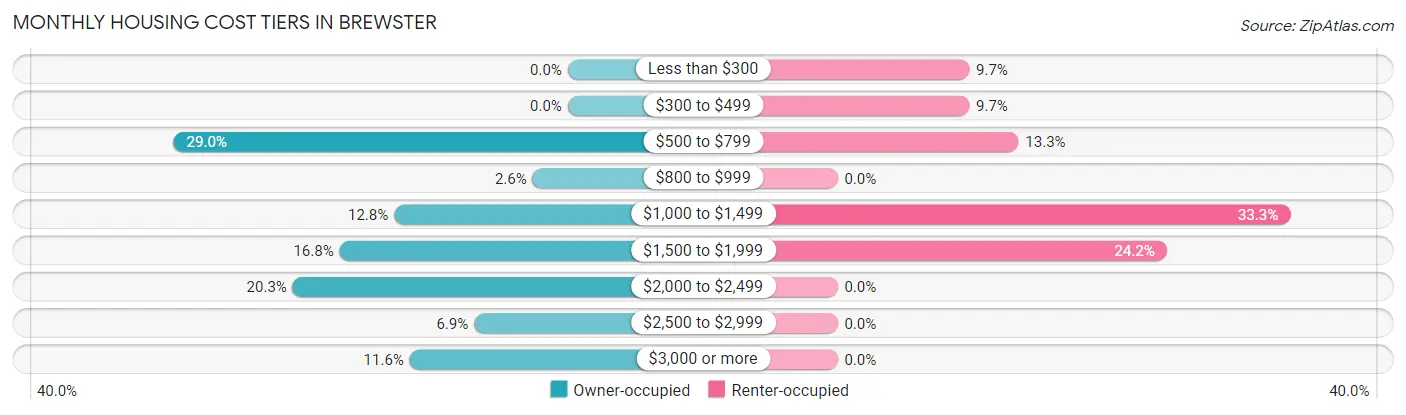
| Monthly Cost | Owner-occupied | Renter-occupied |
| Less than $300 | 0 (0.0%) | 16 (9.7%) |
| $300 to $499 | 0 (0.0%) | 16 (9.7%) |
| $500 to $799 | 202 (29.0%) | 22 (13.3%) |
| $800 to $999 | 18 (2.6%) | 0 (0.0%) |
| $1,000 to $1,499 | 89 (12.8%) | 55 (33.3%) |
| $1,500 to $1,999 | 117 (16.8%) | 40 (24.2%) |
| $2,000 to $2,499 | 141 (20.3%) | 0 (0.0%) |
| $2,500 to $2,999 | 48 (6.9%) | 0 (0.0%) |
| $3,000 or more | 81 (11.6%) | 0 (0.0%) |
| Total | 696 (100.0%) | 165 (100.0%) |
Physical Housing Characteristics in Brewster
Housing Structures in Brewster
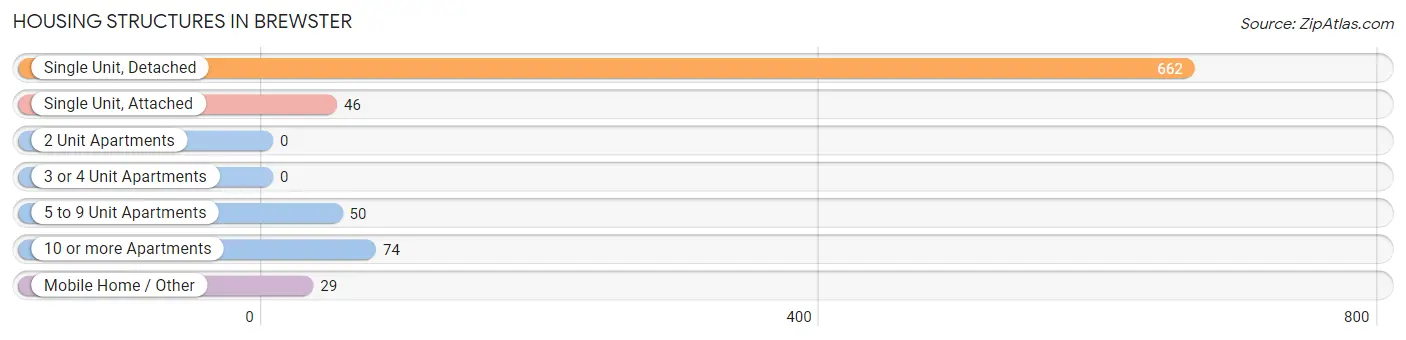
| Structure Type | # Housing Units | % Housing Units |
| Single Unit, Detached | 662 | 76.9% |
| Single Unit, Attached | 46 | 5.3% |
| 2 Unit Apartments | 0 | 0.0% |
| 3 or 4 Unit Apartments | 0 | 0.0% |
| 5 to 9 Unit Apartments | 50 | 5.8% |
| 10 or more Apartments | 74 | 8.6% |
| Mobile Home / Other | 29 | 3.4% |
| Total | 861 | 100.0% |
Housing Structures by Occupancy in Brewster
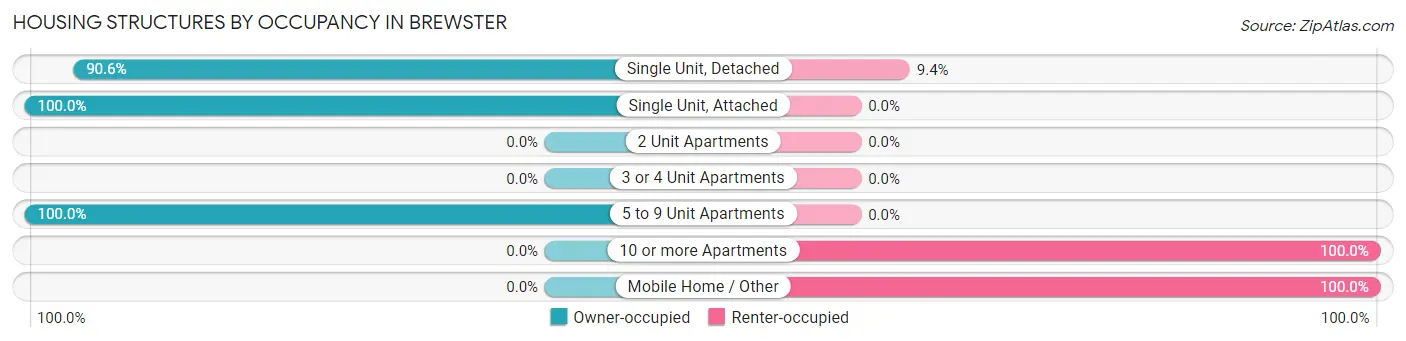
| Structure Type | Owner-occupied | Renter-occupied |
| Single Unit, Detached | 600 (90.6%) | 62 (9.4%) |
| Single Unit, Attached | 46 (100.0%) | 0 (0.0%) |
| 2 Unit Apartments | 0 (0.0%) | 0 (0.0%) |
| 3 or 4 Unit Apartments | 0 (0.0%) | 0 (0.0%) |
| 5 to 9 Unit Apartments | 50 (100.0%) | 0 (0.0%) |
| 10 or more Apartments | 0 (0.0%) | 74 (100.0%) |
| Mobile Home / Other | 0 (0.0%) | 29 (100.0%) |
| Total | 696 (80.8%) | 165 (19.2%) |
Housing Structures by Number of Rooms in Brewster
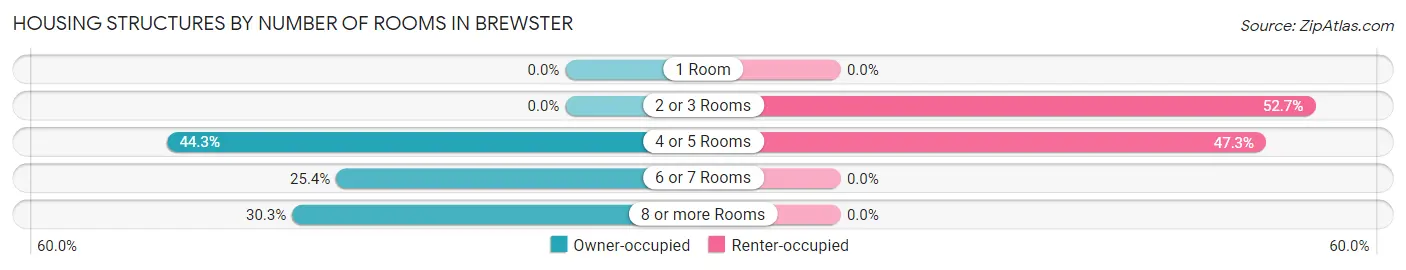
| Number of Rooms | Owner-occupied | Renter-occupied |
| 1 Room | 0 (0.0%) | 0 (0.0%) |
| 2 or 3 Rooms | 0 (0.0%) | 87 (52.7%) |
| 4 or 5 Rooms | 308 (44.3%) | 78 (47.3%) |
| 6 or 7 Rooms | 177 (25.4%) | 0 (0.0%) |
| 8 or more Rooms | 211 (30.3%) | 0 (0.0%) |
| Total | 696 (100.0%) | 165 (100.0%) |
Housing Structure by Heating Type in Brewster
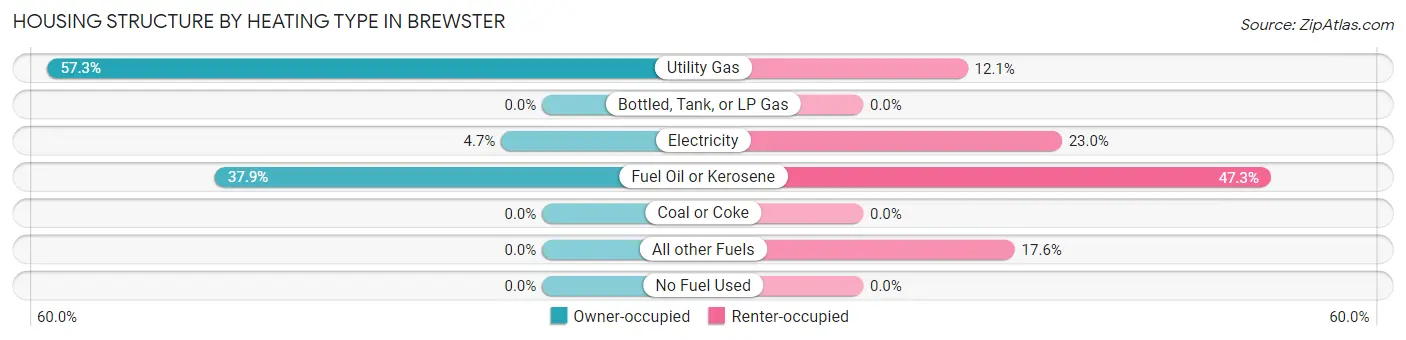
| Heating Type | Owner-occupied | Renter-occupied |
| Utility Gas | 399 (57.3%) | 20 (12.1%) |
| Bottled, Tank, or LP Gas | 0 (0.0%) | 0 (0.0%) |
| Electricity | 33 (4.7%) | 38 (23.0%) |
| Fuel Oil or Kerosene | 264 (37.9%) | 78 (47.3%) |
| Coal or Coke | 0 (0.0%) | 0 (0.0%) |
| All other Fuels | 0 (0.0%) | 29 (17.6%) |
| No Fuel Used | 0 (0.0%) | 0 (0.0%) |
| Total | 696 (100.0%) | 165 (100.0%) |
Household Vehicle Usage in Brewster
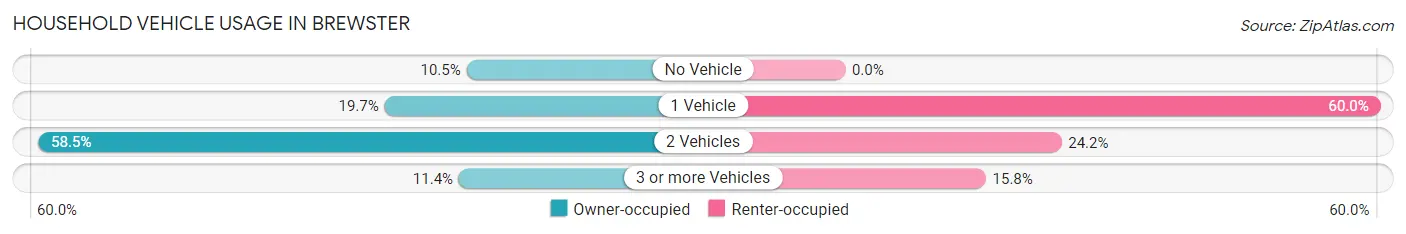
| Vehicles per Household | Owner-occupied | Renter-occupied |
| No Vehicle | 73 (10.5%) | 0 (0.0%) |
| 1 Vehicle | 137 (19.7%) | 99 (60.0%) |
| 2 Vehicles | 407 (58.5%) | 40 (24.2%) |
| 3 or more Vehicles | 79 (11.4%) | 26 (15.8%) |
| Total | 696 (100.0%) | 165 (100.0%) |
Real Estate & Mortgages in Brewster
Real Estate and Mortgage Overview in Brewster
| Characteristic | Without Mortgage | With Mortgage |
| Housing Units | 349 | 347 |
| Median Property Value | $736,400 | $607,000 |
| Median Household Income | $44,406 | $146 |
| Monthly Housing Costs | $783 | $63 |
| Real Estate Taxes | $3,824 | $0 |
Property Value by Mortgage Status in Brewster
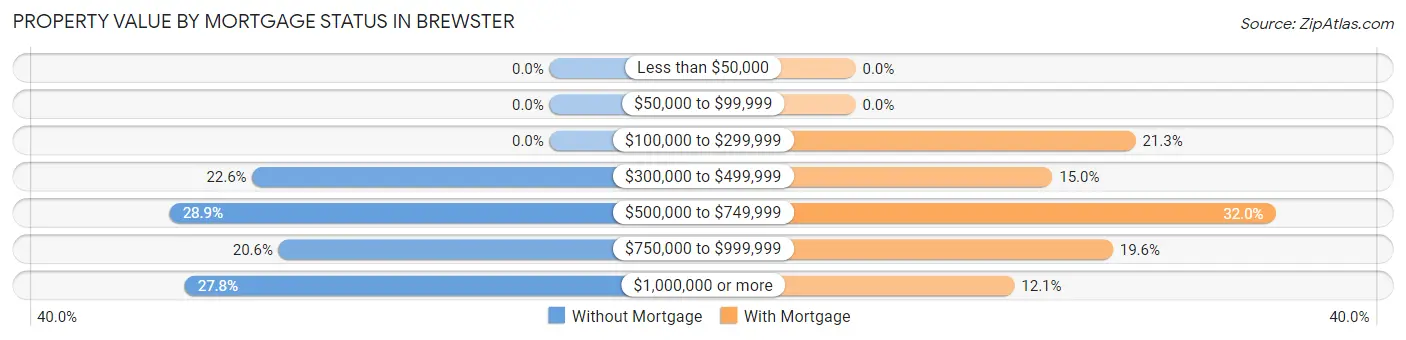
| Property Value | Without Mortgage | With Mortgage |
| Less than $50,000 | 0 (0.0%) | 0 (0.0%) |
| $50,000 to $99,999 | 0 (0.0%) | 0 (0.0%) |
| $100,000 to $299,999 | 0 (0.0%) | 74 (21.3%) |
| $300,000 to $499,999 | 79 (22.6%) | 52 (15.0%) |
| $500,000 to $749,999 | 101 (28.9%) | 111 (32.0%) |
| $750,000 to $999,999 | 72 (20.6%) | 68 (19.6%) |
| $1,000,000 or more | 97 (27.8%) | 42 (12.1%) |
| Total | 349 (100.0%) | 347 (100.0%) |
Household Income by Mortgage Status in Brewster
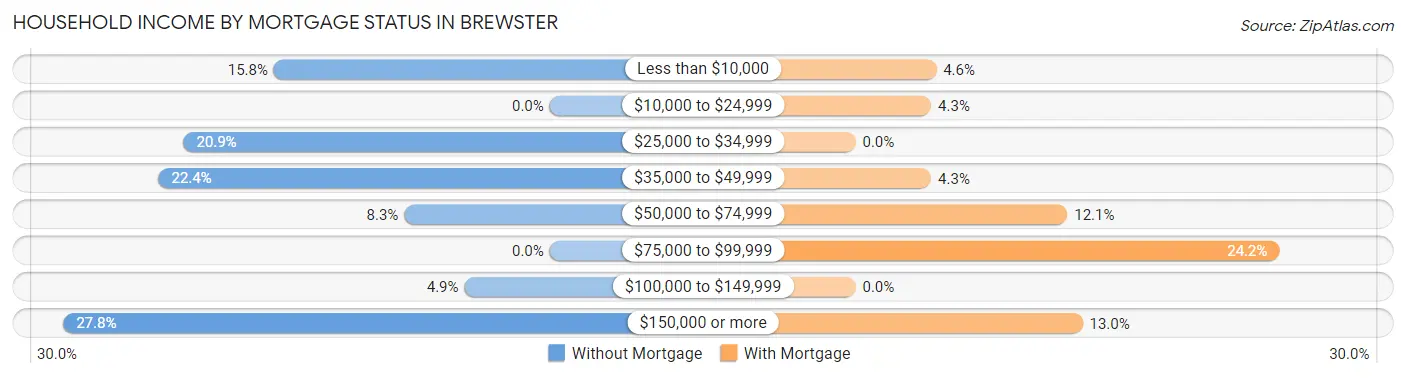
| Household Income | Without Mortgage | With Mortgage |
| Less than $10,000 | 55 (15.8%) | 16 (4.6%) |
| $10,000 to $24,999 | 0 (0.0%) | 15 (4.3%) |
| $25,000 to $34,999 | 73 (20.9%) | 0 (0.0%) |
| $35,000 to $49,999 | 78 (22.4%) | 15 (4.3%) |
| $50,000 to $74,999 | 29 (8.3%) | 42 (12.1%) |
| $75,000 to $99,999 | 0 (0.0%) | 84 (24.2%) |
| $100,000 to $149,999 | 17 (4.9%) | 0 (0.0%) |
| $150,000 or more | 97 (27.8%) | 45 (13.0%) |
| Total | 349 (100.0%) | 347 (100.0%) |
Property Value to Household Income Ratio in Brewster
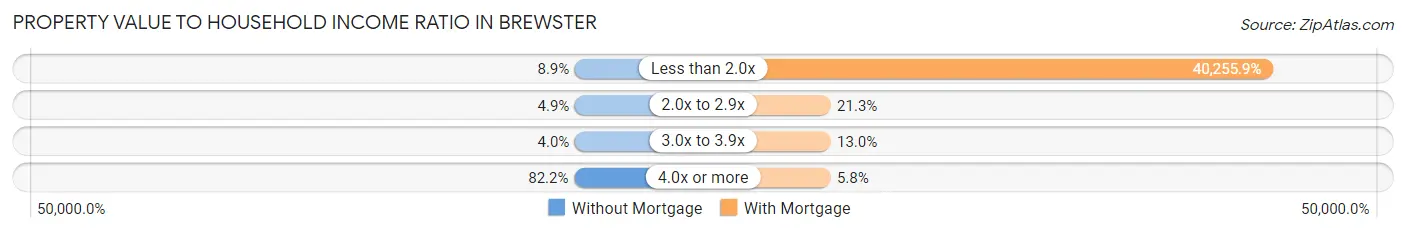
| Value-to-Income Ratio | Without Mortgage | With Mortgage |
| Less than 2.0x | 31 (8.9%) | 139,688 (40,255.9%) |
| 2.0x to 2.9x | 17 (4.9%) | 74 (21.3%) |
| 3.0x to 3.9x | 14 (4.0%) | 45 (13.0%) |
| 4.0x or more | 287 (82.2%) | 20 (5.8%) |
| Total | 349 (100.0%) | 347 (100.0%) |
Real Estate Taxes by Mortgage Status in Brewster
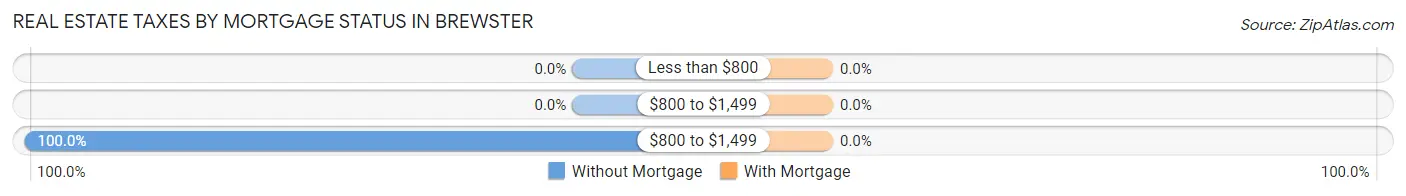
| Property Taxes | Without Mortgage | With Mortgage |
| Less than $800 | 0 (0.0%) | 0 (0.0%) |
| $800 to $1,499 | 0 (0.0%) | 0 (0.0%) |
| $800 to $1,499 | 349 (100.0%) | 0 (0.0%) |
| Total | 349 (100.0%) | 347 (100.0%) |
Health & Disability in Brewster
Health Insurance Coverage by Age in Brewster
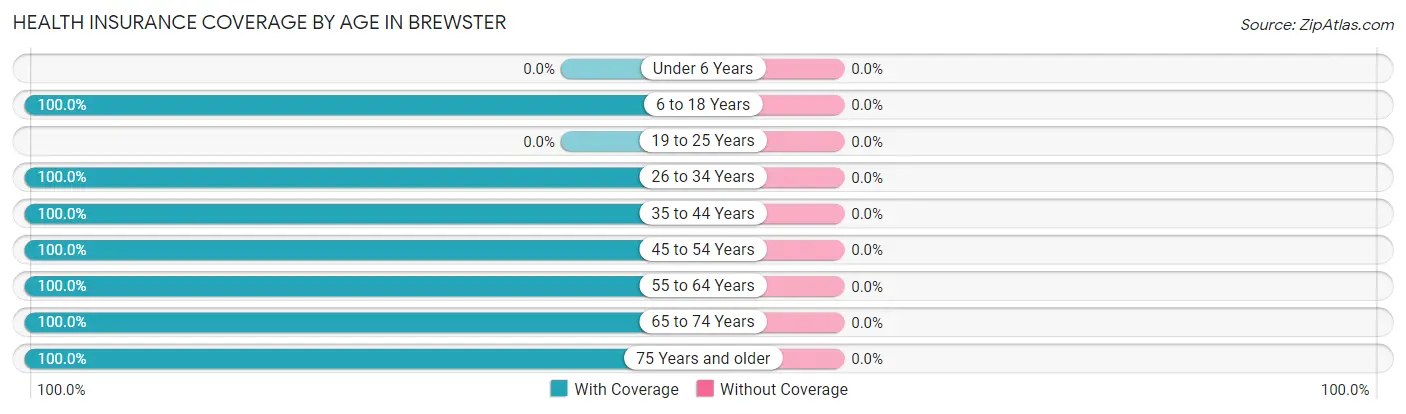
| Age Bracket | With Coverage | Without Coverage |
| Under 6 Years | 0 (0.0%) | 0 (0.0%) |
| 6 to 18 Years | 197 (100.0%) | 0 (0.0%) |
| 19 to 25 Years | 0 (0.0%) | 0 (0.0%) |
| 26 to 34 Years | 122 (100.0%) | 0 (0.0%) |
| 35 to 44 Years | 64 (100.0%) | 0 (0.0%) |
| 45 to 54 Years | 254 (100.0%) | 0 (0.0%) |
| 55 to 64 Years | 327 (100.0%) | 0 (0.0%) |
| 65 to 74 Years | 397 (100.0%) | 0 (0.0%) |
| 75 Years and older | 346 (100.0%) | 0 (0.0%) |
| Total | 1,707 (100.0%) | 0 (0.0%) |
Health Insurance Coverage by Citizenship Status in Brewster
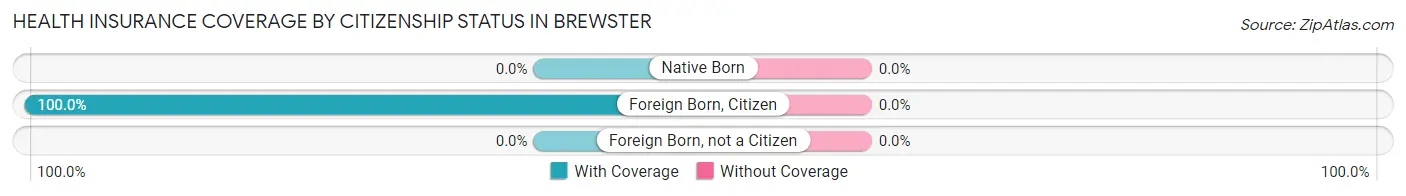
| Citizenship Status | With Coverage | Without Coverage |
| Native Born | 0 (0.0%) | 0 (0.0%) |
| Foreign Born, Citizen | 197 (100.0%) | 0 (0.0%) |
| Foreign Born, not a Citizen | 0 (0.0%) | 0 (0.0%) |
Health Insurance Coverage by Household Income in Brewster
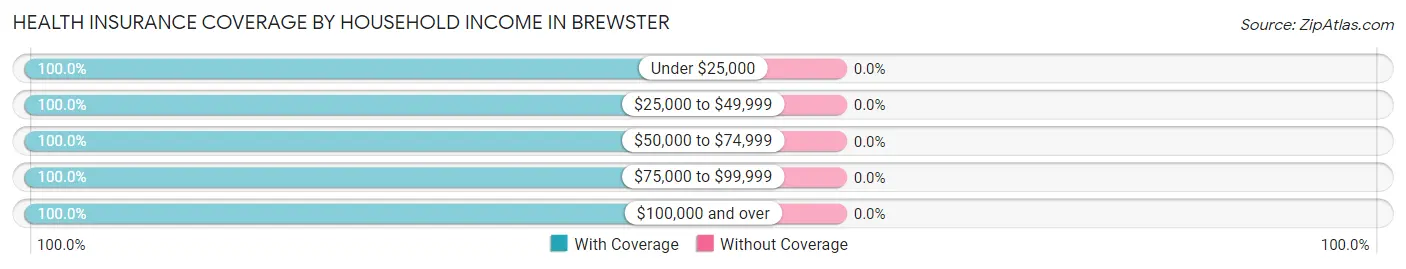
| Household Income | With Coverage | Without Coverage |
| Under $25,000 | 139 (100.0%) | 0 (0.0%) |
| $25,000 to $49,999 | 363 (100.0%) | 0 (0.0%) |
| $50,000 to $74,999 | 221 (100.0%) | 0 (0.0%) |
| $75,000 to $99,999 | 104 (100.0%) | 0 (0.0%) |
| $100,000 and over | 880 (100.0%) | 0 (0.0%) |
Public vs Private Health Insurance Coverage by Age in Brewster
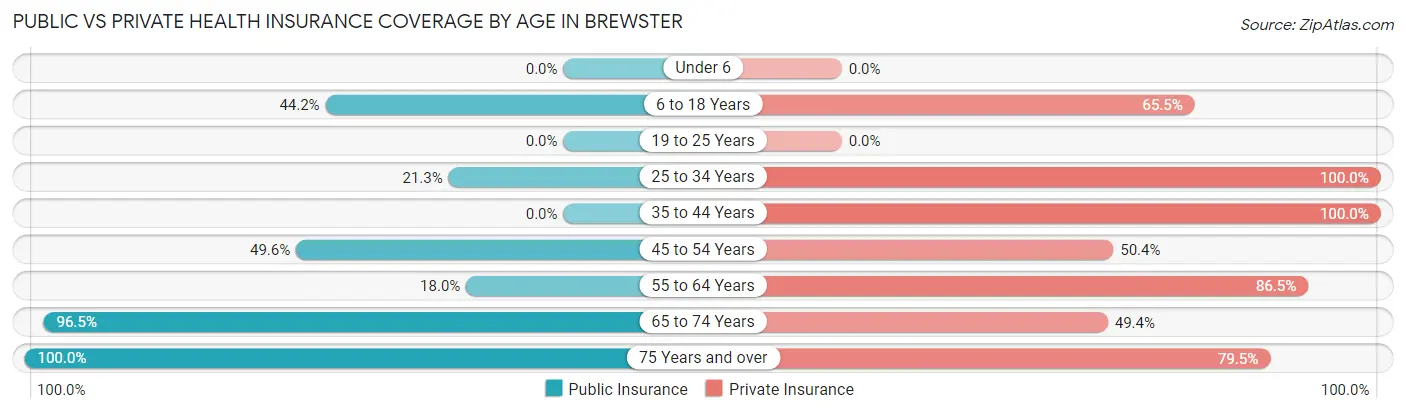
| Age Bracket | Public Insurance | Private Insurance |
| Under 6 | 0 (0.0%) | 0 (0.0%) |
| 6 to 18 Years | 87 (44.2%) | 129 (65.5%) |
| 19 to 25 Years | 0 (0.0%) | 0 (0.0%) |
| 25 to 34 Years | 26 (21.3%) | 122 (100.0%) |
| 35 to 44 Years | 0 (0.0%) | 64 (100.0%) |
| 45 to 54 Years | 126 (49.6%) | 128 (50.4%) |
| 55 to 64 Years | 59 (18.0%) | 283 (86.5%) |
| 65 to 74 Years | 383 (96.5%) | 196 (49.4%) |
| 75 Years and over | 346 (100.0%) | 275 (79.5%) |
| Total | 1,027 (60.2%) | 1,197 (70.1%) |
Disability Status by Sex by Age in Brewster
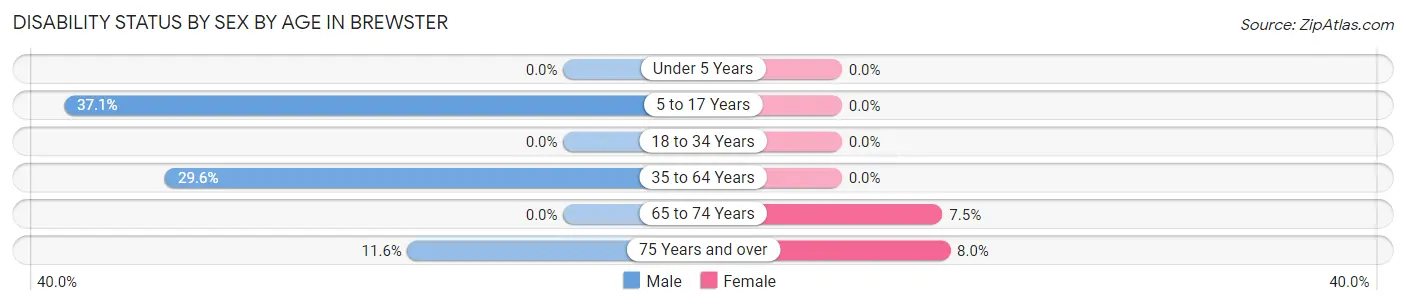
| Age Bracket | Male | Female |
| Under 5 Years | 0 (0.0%) | 0 (0.0%) |
| 5 to 17 Years | 53 (37.1%) | 0 (0.0%) |
| 18 to 34 Years | 0 (0.0%) | 0 (0.0%) |
| 35 to 64 Years | 102 (29.6%) | 0 (0.0%) |
| 65 to 74 Years | 0 (0.0%) | 18 (7.5%) |
| 75 Years and over | 17 (11.6%) | 16 (8.0%) |
Disability Class by Sex by Age in Brewster
Disability Class: Hearing Difficulty
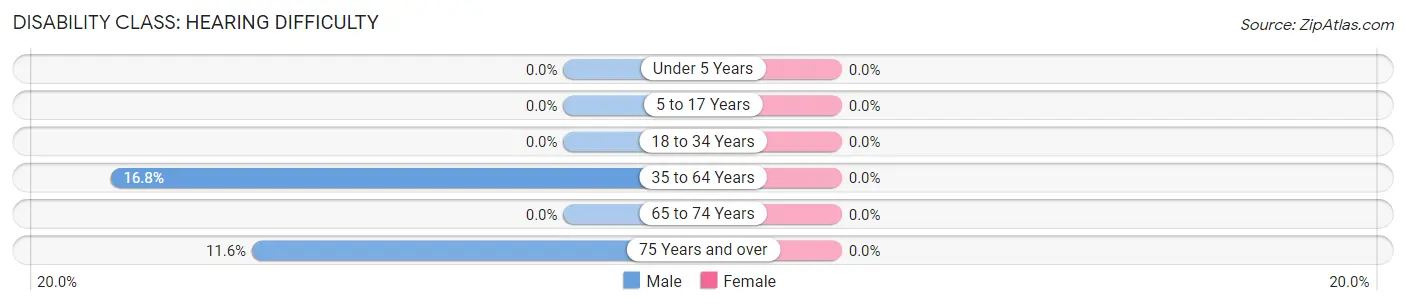
| Age Bracket | Male | Female |
| Under 5 Years | 0 (0.0%) | 0 (0.0%) |
| 5 to 17 Years | 0 (0.0%) | 0 (0.0%) |
| 18 to 34 Years | 0 (0.0%) | 0 (0.0%) |
| 35 to 64 Years | 58 (16.8%) | 0 (0.0%) |
| 65 to 74 Years | 0 (0.0%) | 0 (0.0%) |
| 75 Years and over | 17 (11.6%) | 0 (0.0%) |
Disability Class: Vision Difficulty
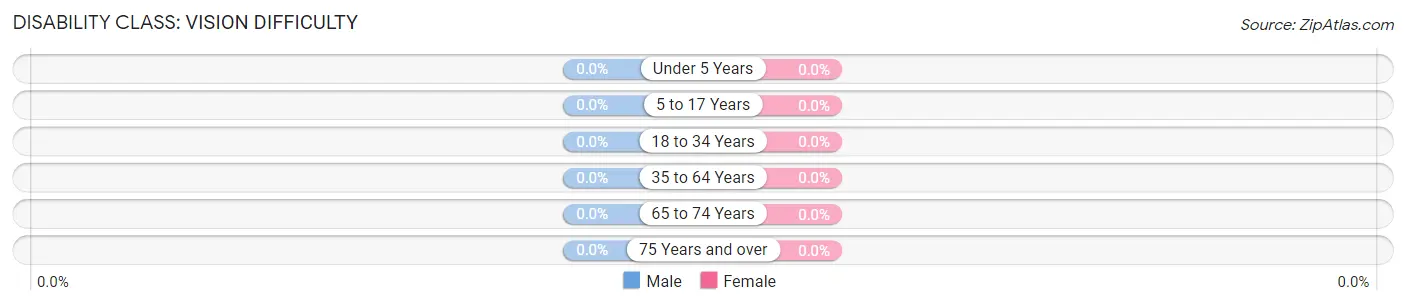
| Age Bracket | Male | Female |
| Under 5 Years | 0 (0.0%) | 0 (0.0%) |
| 5 to 17 Years | 0 (0.0%) | 0 (0.0%) |
| 18 to 34 Years | 0 (0.0%) | 0 (0.0%) |
| 35 to 64 Years | 0 (0.0%) | 0 (0.0%) |
| 65 to 74 Years | 0 (0.0%) | 0 (0.0%) |
| 75 Years and over | 0 (0.0%) | 0 (0.0%) |
Disability Class: Cognitive Difficulty
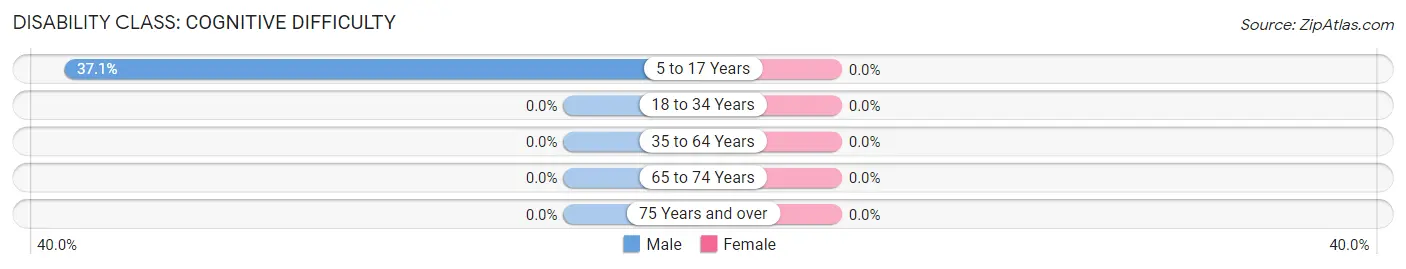
| Age Bracket | Male | Female |
| 5 to 17 Years | 53 (37.1%) | 0 (0.0%) |
| 18 to 34 Years | 0 (0.0%) | 0 (0.0%) |
| 35 to 64 Years | 0 (0.0%) | 0 (0.0%) |
| 65 to 74 Years | 0 (0.0%) | 0 (0.0%) |
| 75 Years and over | 0 (0.0%) | 0 (0.0%) |
Disability Class: Ambulatory Difficulty
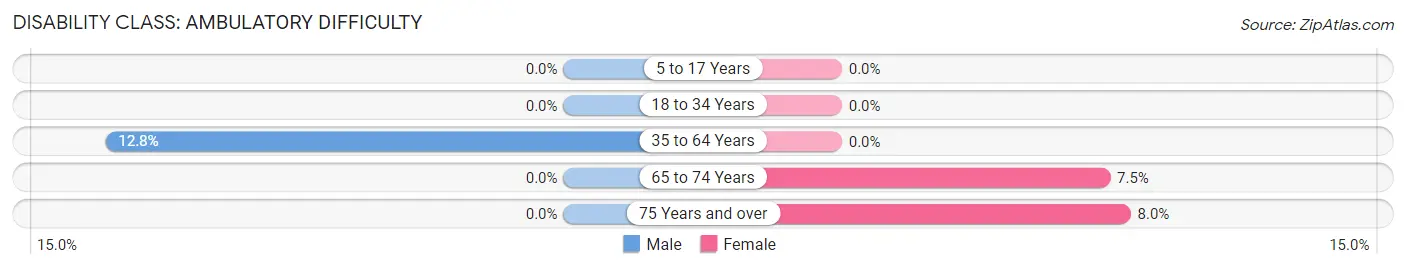
| Age Bracket | Male | Female |
| 5 to 17 Years | 0 (0.0%) | 0 (0.0%) |
| 18 to 34 Years | 0 (0.0%) | 0 (0.0%) |
| 35 to 64 Years | 44 (12.8%) | 0 (0.0%) |
| 65 to 74 Years | 0 (0.0%) | 18 (7.5%) |
| 75 Years and over | 0 (0.0%) | 16 (8.0%) |
Disability Class: Self-Care Difficulty
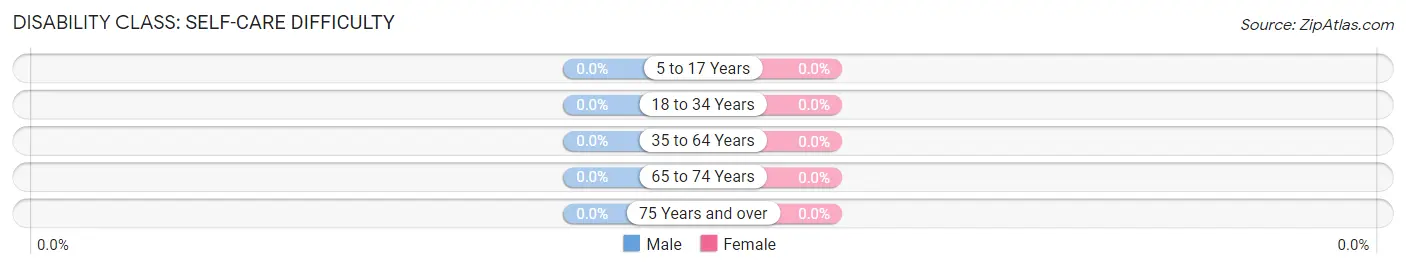
| Age Bracket | Male | Female |
| 5 to 17 Years | 0 (0.0%) | 0 (0.0%) |
| 18 to 34 Years | 0 (0.0%) | 0 (0.0%) |
| 35 to 64 Years | 0 (0.0%) | 0 (0.0%) |
| 65 to 74 Years | 0 (0.0%) | 0 (0.0%) |
| 75 Years and over | 0 (0.0%) | 0 (0.0%) |
Technology Access in Brewster
Computing Device Access in Brewster
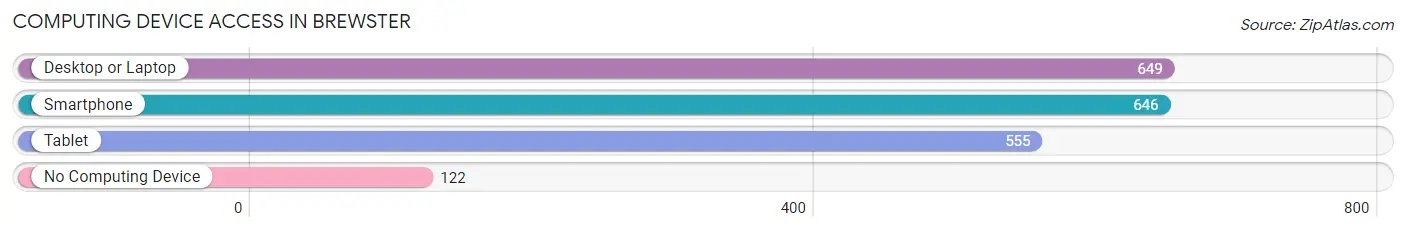
| Device Type | # Households | % Households |
| Desktop or Laptop | 649 | 75.4% |
| Smartphone | 646 | 75.0% |
| Tablet | 555 | 64.5% |
| No Computing Device | 122 | 14.2% |
| Total | 861 | 100.0% |
Internet Access in Brewster
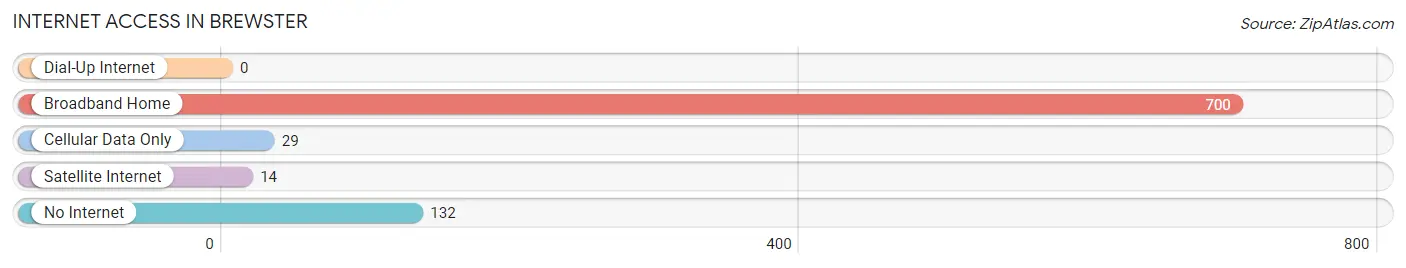
| Internet Type | # Households | % Households |
| Dial-Up Internet | 0 | 0.0% |
| Broadband Home | 700 | 81.3% |
| Cellular Data Only | 29 | 3.4% |
| Satellite Internet | 14 | 1.6% |
| No Internet | 132 | 15.3% |
| Total | 861 | 100.0% |
Brewster Summary
Brewster, MA is a town located in Barnstable County, Massachusetts, United States. It is situated on Cape Cod, approximately halfway between the towns of Orleans and Chatham. As of the 2010 census, the town had a population of 10,094.
History
Brewster was first settled in 1656 by a group of settlers from the Plymouth Colony. The town was named after Elder William Brewster, a Pilgrim leader and the first minister of the Plymouth Colony. The town was officially incorporated in 1803.
In the 19th century, Brewster was a popular summer resort for wealthy Bostonians. The town was home to several large hotels, including the Brewster House, which was built in 1868 and was one of the largest hotels on Cape Cod.
Geography
Brewster is located at 41°45'N 70°08'W (41.75, -70.13). According to the United States Census Bureau, the town has a total area of 28.2 square miles (73.1 km2), of which 25.2 square miles (65.3 km2) is land and 3.0 square miles (7.8 km2) (10.62%) is water.
Brewster is bordered by the towns of Harwich to the north, Orleans to the east, Eastham to the south, and Dennis to the west. The town is located on the western side of Cape Cod, and is approximately halfway between the towns of Chatham and Orleans.
Economy
Brewster's economy is largely based on tourism. The town is home to several popular beaches, including Brewster Beach, which is located on the eastern side of town. The town is also home to several golf courses, including the Captains Golf Course, which is located on the western side of town.
In addition to tourism, Brewster is home to several small businesses, including restaurants, retail stores, and art galleries. The town is also home to several cranberry bogs, which are a major source of income for the town.
Demographics
As of the 2010 census, there were 10,094 people, 4,072 households, and 2,717 families residing in the town. The population density was 401.2 people per square mile (154.9/km2). There were 5,845 housing units at an average density of 231.3 per square mile (89.3/km2). The racial makeup of the town was 97.2% White, 0.7% African American, 0.2% Native American, 0.6% Asian, 0.1% Pacific Islander, 0.4% from other races, and 0.9% from two or more races. Hispanic or Latino of any race were 1.3% of the population.
There were 4,072 households, out of which 28.2% had children under the age of 18 living with them, 54.2% were married couples living together, 9.2% had a female householder with no husband present, and 32.7% were non-families. 26.2% of all households were made up of individuals, and 11.2% had someone living alone who was 65 years of age or older. The average household size was 2.45 and the average family size was 2.97.
In the town, the population was spread out, with 23.2% under the age of 18, 5.2% from 18 to 24, 24.2% from 25 to 44, 30.2% from 45 to 64, and 17.2% who were 65 years of age or older. The median age was 43 years. For every 100 females, there were 94.2 males. For every 100 females age 18 and over, there were 91.2 males.
The median income for a household in the town was $60,938, and the median income for a family was $71,944. Males had a median income of $50,813 versus $37,917 for females. The per capita income for the town was $31,945. About 4.2% of families and 6.2% of the population were below the poverty line, including 8.2% of those under age 18 and 4.2% of those age 65 or over.
Common Questions
What is Per Capita Income in Brewster?
Per Capita income in Brewster is $65,884.
What is the Median Family Income in Brewster?
Median Family Income in Brewster is $139,688.
What is the Median Household income in Brewster?
Median Household Income in Brewster is $62,695.
What is Income or Wage Gap in Brewster?
Income or Wage Gap in Brewster is 4.5%.
Women in Brewster earn 95.5 cents for every dollar earned by a man.
What is Inequality or Gini Index in Brewster?
Inequality or Gini Index in Brewster is 0.57.
What is the Total Population of Brewster?
Total Population of Brewster is 1,739.
What is the Total Male Population of Brewster?
Total Male Population of Brewster is 885.
What is the Total Female Population of Brewster?
Total Female Population of Brewster is 854.
What is the Ratio of Males per 100 Females in Brewster?
There are 103.63 Males per 100 Females in Brewster.
What is the Ratio of Females per 100 Males in Brewster?
There are 96.50 Females per 100 Males in Brewster.
What is the Median Population Age in Brewster?
Median Population Age in Brewster is 62.4 Years.
What is the Average Family Size in Brewster
Average Family Size in Brewster is 2.5 People.
What is the Average Household Size in Brewster
Average Household Size in Brewster is 2.0 People.
How Large is the Labor Force in Brewster?
There are 709 People in the Labor Forcein in Brewster.
What is the Percentage of People in the Labor Force in Brewster?
43.5% of People are in the Labor Force in Brewster.
What is the Unemployment Rate in Brewster?
Unemployment Rate in Brewster is 7.1%.