Readsboro, VT Map & Demographics
Readsboro Map
Readsboro Overview
$37,779
PER CAPITA INCOME
$54,345
AVG FAMILY INCOME
$44,559
AVG HOUSEHOLD INCOME
55.2%
WAGE / INCOME GAP [ % ]
44.8¢/ $1
WAGE / INCOME GAP [ $ ]
0.50
INEQUALITY / GINI INDEX
284
TOTAL POPULATION
84
MALE POPULATION
200
FEMALE POPULATION
42.00
MALES / 100 FEMALES
238.10
FEMALES / 100 MALES
50.5
MEDIAN AGE
2.9
AVG FAMILY SIZE
2.1
AVG HOUSEHOLD SIZE
189
LABOR FORCE [ PEOPLE ]
66.5%
PERCENT IN LABOR FORCE
Readsboro Zip Codes
Readsboro Area Codes
Income in Readsboro
Income Overview in Readsboro
Per Capita Income in Readsboro is $37,779, while median incomes of families and households are $54,345 and $44,559 respectively.
| Characteristic | Number | Measure |
| Per Capita Income | 284 | $37,779 |
| Median Family Income | 53 | $54,345 |
| Mean Family Income | 53 | $75,153 |
| Median Household Income | 134 | $44,559 |
| Mean Household Income | 134 | $73,719 |
| Income Deficit | 53 | $0 |
| Wage / Income Gap (%) | 284 | 55.17% |
| Wage / Income Gap ($) | 284 | 44.83¢ per $1 |
| Gini / Inequality Index | 284 | 0.50 |
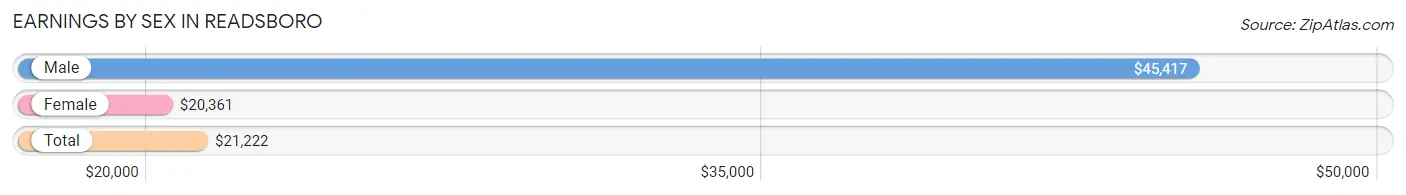
Earnings by Sex in Readsboro
Average Earnings in Readsboro are $21,222, $45,417 for men and $20,361 for women, a difference of 55.2%.
| Sex | Number | Average Earnings |
| Male | 35 (18.2%) | $45,417 |
| Female | 157 (81.8%) | $20,361 |
| Total | 192 (100.0%) | $21,222 |
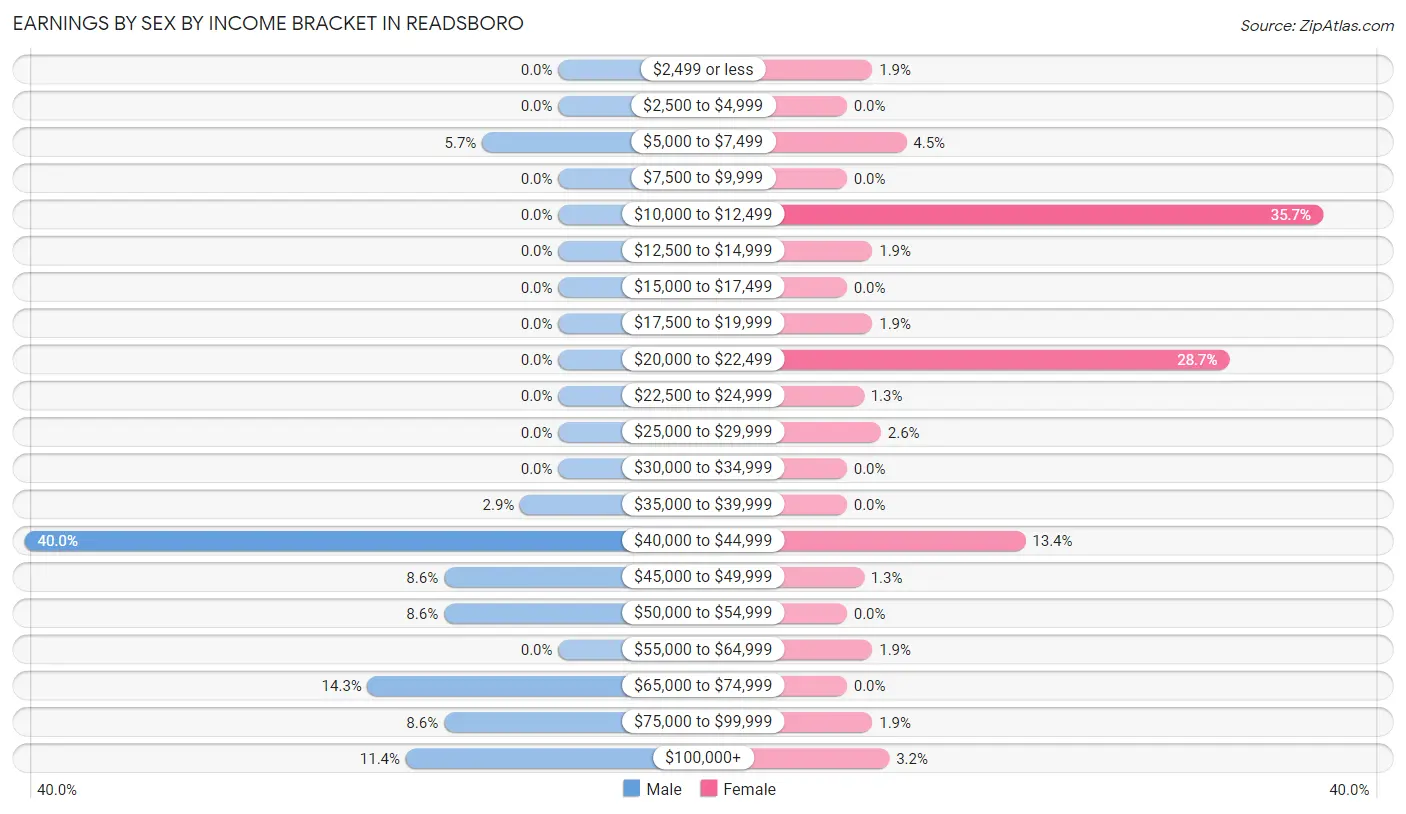
Earnings by Sex by Income Bracket in Readsboro
The most common earnings brackets in Readsboro are $40,000 to $44,999 for men (14 | 40.0%) and $10,000 to $12,499 for women (56 | 35.7%).
| Income | Male | Female |
| $2,499 or less | 0 (0.0%) | 3 (1.9%) |
| $2,500 to $4,999 | 0 (0.0%) | 0 (0.0%) |
| $5,000 to $7,499 | 2 (5.7%) | 7 (4.5%) |
| $7,500 to $9,999 | 0 (0.0%) | 0 (0.0%) |
| $10,000 to $12,499 | 0 (0.0%) | 56 (35.7%) |
| $12,500 to $14,999 | 0 (0.0%) | 3 (1.9%) |
| $15,000 to $17,499 | 0 (0.0%) | 0 (0.0%) |
| $17,500 to $19,999 | 0 (0.0%) | 3 (1.9%) |
| $20,000 to $22,499 | 0 (0.0%) | 45 (28.7%) |
| $22,500 to $24,999 | 0 (0.0%) | 2 (1.3%) |
| $25,000 to $29,999 | 0 (0.0%) | 4 (2.5%) |
| $30,000 to $34,999 | 0 (0.0%) | 0 (0.0%) |
| $35,000 to $39,999 | 1 (2.9%) | 0 (0.0%) |
| $40,000 to $44,999 | 14 (40.0%) | 21 (13.4%) |
| $45,000 to $49,999 | 3 (8.6%) | 2 (1.3%) |
| $50,000 to $54,999 | 3 (8.6%) | 0 (0.0%) |
| $55,000 to $64,999 | 0 (0.0%) | 3 (1.9%) |
| $65,000 to $74,999 | 5 (14.3%) | 0 (0.0%) |
| $75,000 to $99,999 | 3 (8.6%) | 3 (1.9%) |
| $100,000+ | 4 (11.4%) | 5 (3.2%) |
| Total | 35 (100.0%) | 157 (100.0%) |
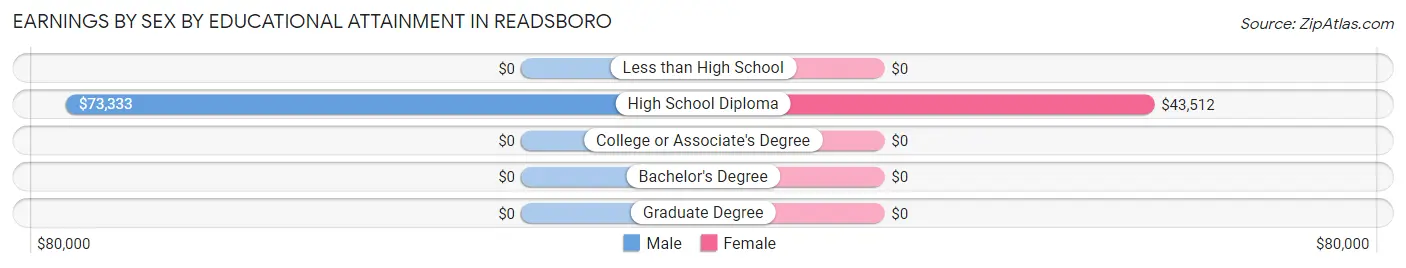
Earnings by Sex by Educational Attainment in Readsboro
Average earnings in Readsboro are $44,821 for men and $43,810 for women, a difference of 2.3%. Men with an educational attainment of high school diploma enjoy the highest average annual earnings of $73,333, while those with high school diploma education earn the least with $73,333. Women with an educational attainment of high school diploma earn the most with the average annual earnings of $43,512, while those with high school diploma education have the smallest earnings of $43,512.
| Educational Attainment | Male Income | Female Income |
| Less than High School | - | - |
| High School Diploma | $73,333 | $43,512 |
| College or Associate's Degree | - | - |
| Bachelor's Degree | - | - |
| Graduate Degree | - | - |
| Total | $44,821 | $43,810 |
Family Income in Readsboro
Family Income Brackets in Readsboro
According to the Readsboro family income data, there are 32 families falling into the $50,000 to $74,999 income range, which is the most common income bracket and makes up 60.4% of all families.
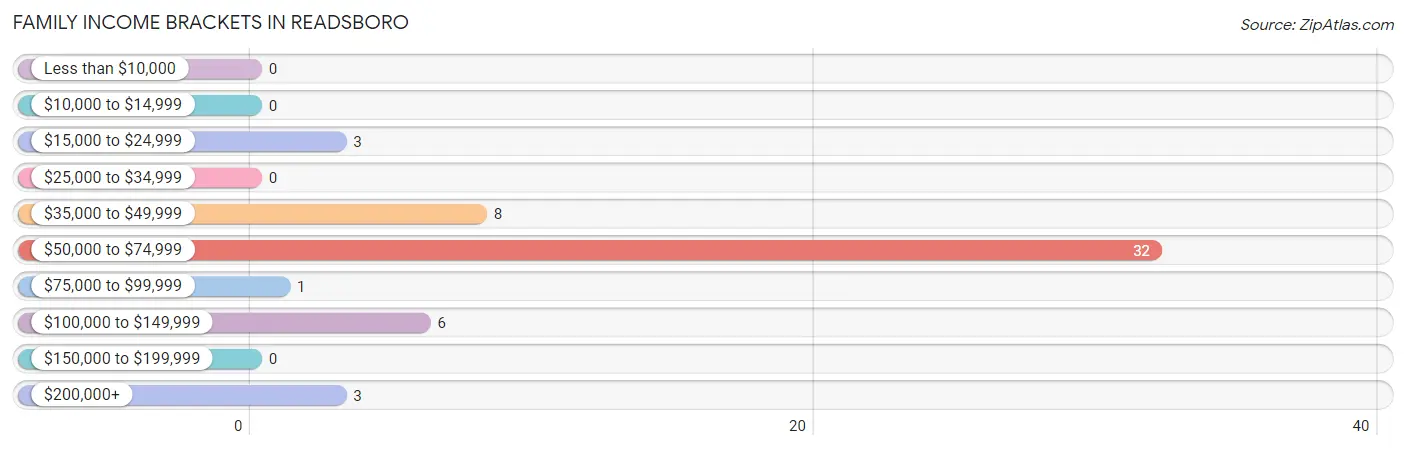
| Income Bracket | # Families | % Families |
| Less than $10,000 | 0 | 0.0% |
| $10,000 to $14,999 | 0 | 0.0% |
| $15,000 to $24,999 | 3 | 5.7% |
| $25,000 to $34,999 | 0 | 0.0% |
| $35,000 to $49,999 | 8 | 15.1% |
| $50,000 to $74,999 | 32 | 60.4% |
| $75,000 to $99,999 | 1 | 1.9% |
| $100,000 to $149,999 | 6 | 11.3% |
| $150,000 to $199,999 | 0 | 0.0% |
| $200,000+ | 3 | 5.7% |
Family Income by Famaliy Size in Readsboro
2-person families (49 | 92.4%) account for the highest median family income in Readsboro with $54,107 per family, while 2-person families (49 | 92.4%) have the highest median income of $27,054 per family member.
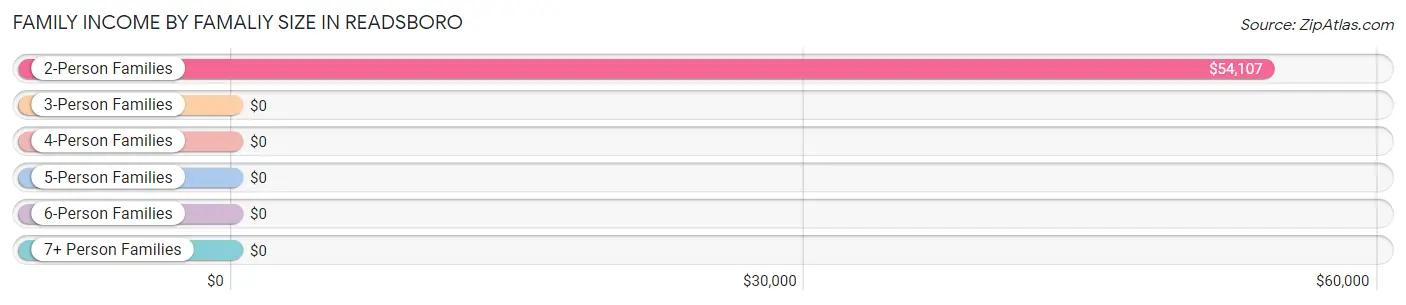
| Income Bracket | # Families | Median Income |
| 2-Person Families | 49 (92.4%) | $54,107 |
| 3-Person Families | 1 (1.9%) | $0 |
| 4-Person Families | 3 (5.7%) | $0 |
| 5-Person Families | 0 (0.0%) | $0 |
| 6-Person Families | 0 (0.0%) | $0 |
| 7+ Person Families | 0 (0.0%) | $0 |
| Total | 53 (100.0%) | $54,345 |
Family Income by Number of Earners in Readsboro
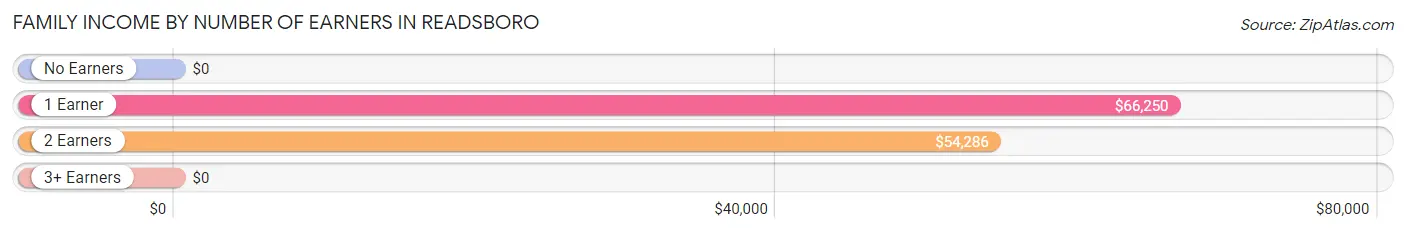
| Number of Earners | # Families | Median Income |
| No Earners | 14 (26.4%) | $0 |
| 1 Earner | 8 (15.1%) | $66,250 |
| 2 Earners | 30 (56.6%) | $54,286 |
| 3+ Earners | 1 (1.9%) | $0 |
| Total | 53 (100.0%) | $54,345 |
Household Income in Readsboro
Household Income Brackets in Readsboro
With 31 households falling in the category, the $75,000 to $99,999 income range is the most frequent in Readsboro, accounting for 23.1% of all households.
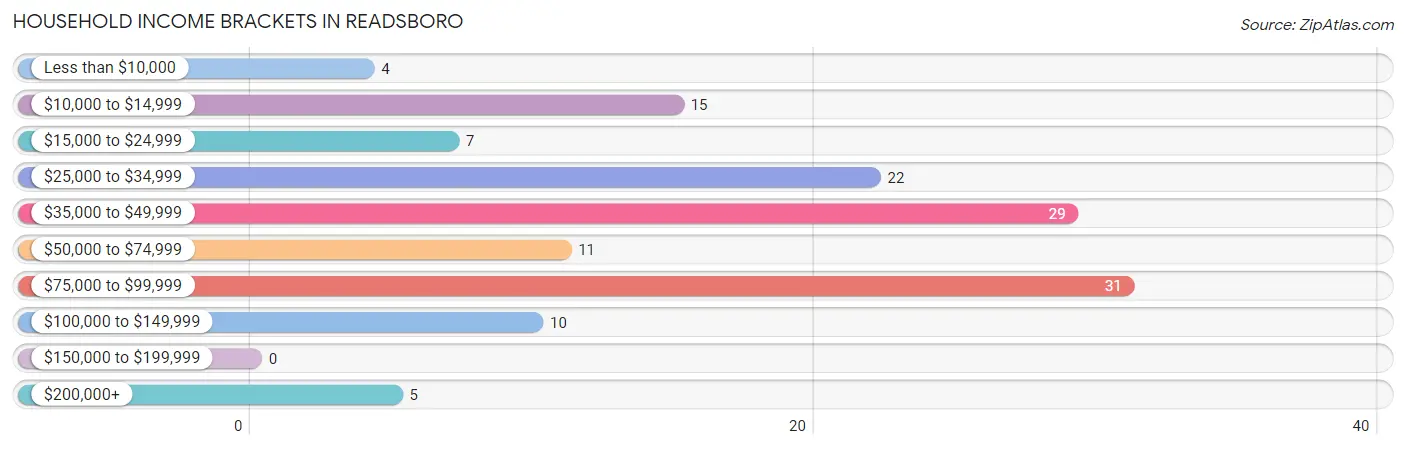
| Income Bracket | # Households | % Households |
| Less than $10,000 | 4 | 3.0% |
| $10,000 to $14,999 | 15 | 11.2% |
| $15,000 to $24,999 | 7 | 5.2% |
| $25,000 to $34,999 | 22 | 16.4% |
| $35,000 to $49,999 | 29 | 21.6% |
| $50,000 to $74,999 | 11 | 8.2% |
| $75,000 to $99,999 | 31 | 23.1% |
| $100,000 to $149,999 | 10 | 7.5% |
| $150,000 to $199,999 | 0 | 0.0% |
| $200,000+ | 5 | 3.7% |
Household Income by Householder Age in Readsboro
The median household income in Readsboro is $44,559, with the highest median household income of $75,060 found in the 45 to 64 years age bracket for the primary householder. A total of 73 households (54.5%) fall into this category.
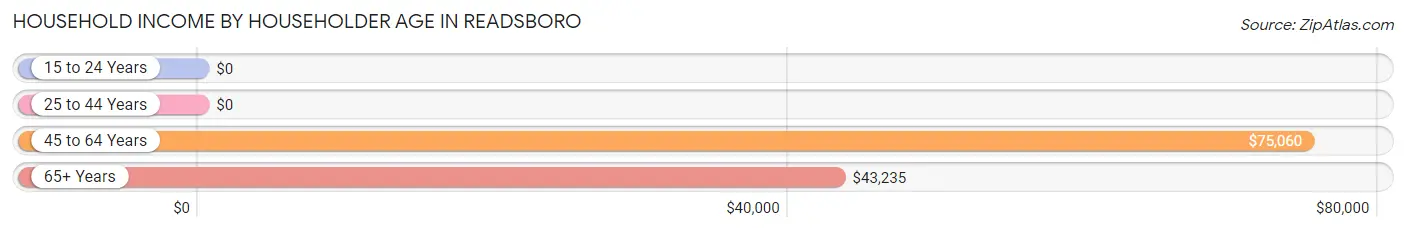
| Income Bracket | # Households | Median Income |
| 15 to 24 Years | 0 (0.0%) | $0 |
| 25 to 44 Years | 5 (3.7%) | $0 |
| 45 to 64 Years | 73 (54.5%) | $75,060 |
| 65+ Years | 56 (41.8%) | $43,235 |
| Total | 134 (100.0%) | $44,559 |
Poverty in Readsboro
Income Below Poverty by Sex and Age in Readsboro
With 10.7% poverty level for males and 5.5% for females among the residents of Readsboro, 55 to 64 year old males and 65 to 74 year old females are the most vulnerable to poverty, with 8 males (38.1%) and 11 females (44.0%) in their respective age groups living below the poverty level.
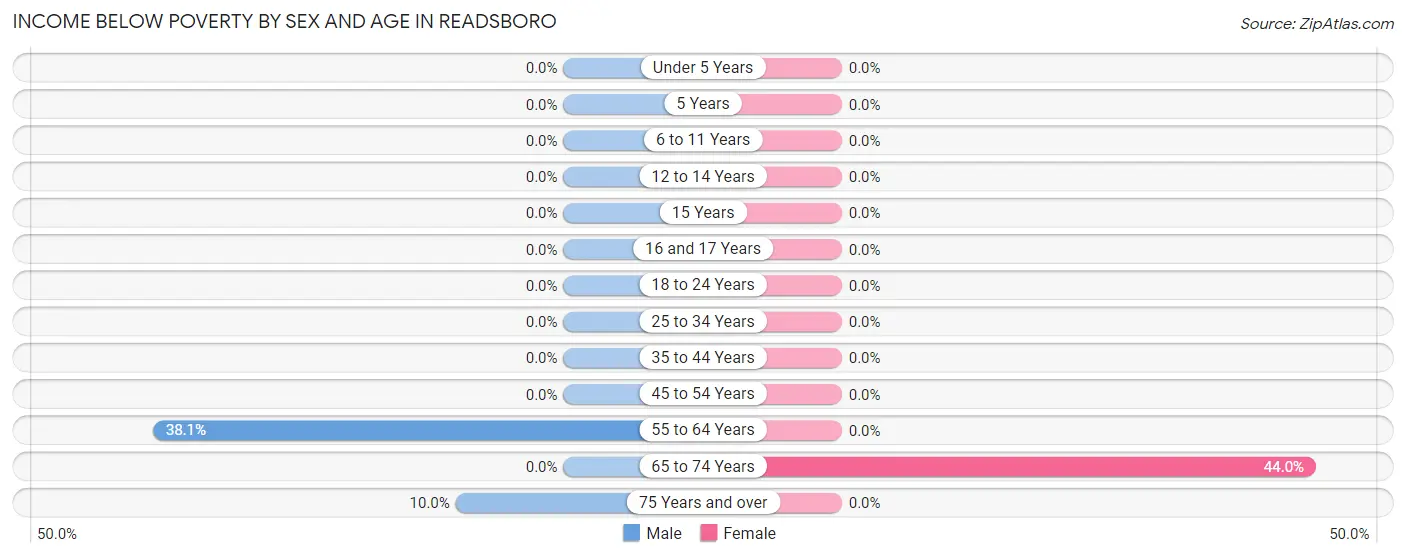
| Age Bracket | Male | Female |
| Under 5 Years | 0 (0.0%) | 0 (0.0%) |
| 5 Years | 0 (0.0%) | 0 (0.0%) |
| 6 to 11 Years | 0 (0.0%) | 0 (0.0%) |
| 12 to 14 Years | 0 (0.0%) | 0 (0.0%) |
| 15 Years | 0 (0.0%) | 0 (0.0%) |
| 16 and 17 Years | 0 (0.0%) | 0 (0.0%) |
| 18 to 24 Years | 0 (0.0%) | 0 (0.0%) |
| 25 to 34 Years | 0 (0.0%) | 0 (0.0%) |
| 35 to 44 Years | 0 (0.0%) | 0 (0.0%) |
| 45 to 54 Years | 0 (0.0%) | 0 (0.0%) |
| 55 to 64 Years | 8 (38.1%) | 0 (0.0%) |
| 65 to 74 Years | 0 (0.0%) | 11 (44.0%) |
| 75 Years and over | 1 (10.0%) | 0 (0.0%) |
| Total | 9 (10.7%) | 11 (5.5%) |
Income Above Poverty by Sex and Age in Readsboro
According to the poverty statistics in Readsboro, males aged 18 to 24 years and females aged 18 to 24 years are the age groups that are most secure financially, with 100.0% of males and 100.0% of females in these age groups living above the poverty line.
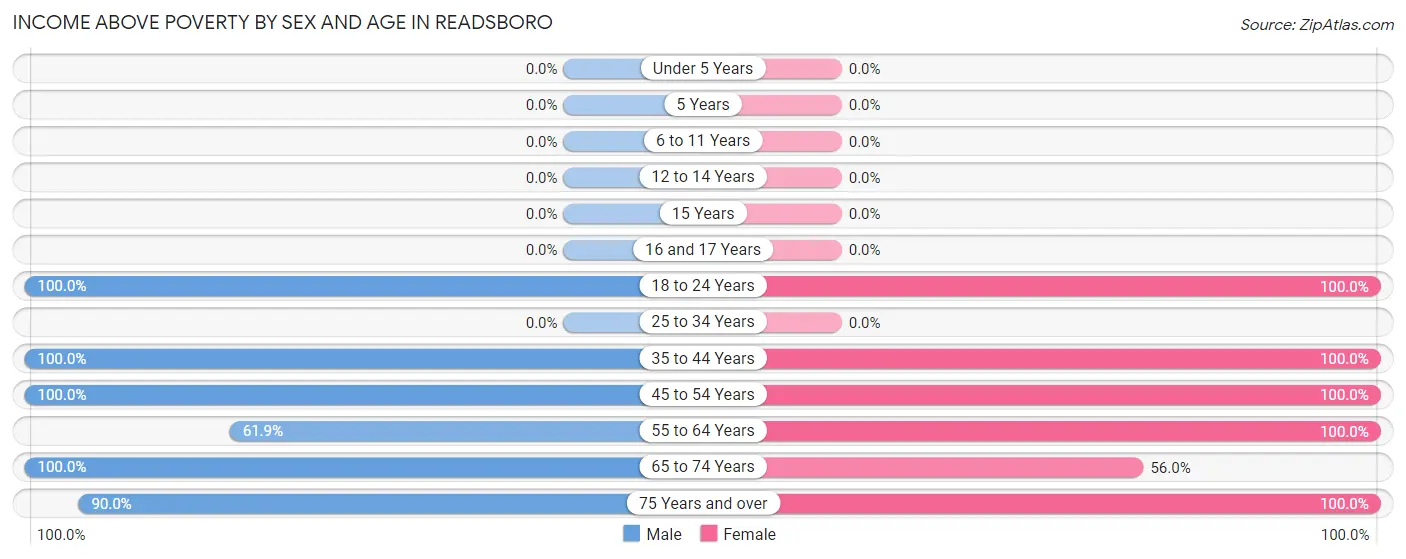
| Age Bracket | Male | Female |
| Under 5 Years | 0 (0.0%) | 0 (0.0%) |
| 5 Years | 0 (0.0%) | 0 (0.0%) |
| 6 to 11 Years | 0 (0.0%) | 0 (0.0%) |
| 12 to 14 Years | 0 (0.0%) | 0 (0.0%) |
| 15 Years | 0 (0.0%) | 0 (0.0%) |
| 16 and 17 Years | 0 (0.0%) | 0 (0.0%) |
| 18 to 24 Years | 7 (100.0%) | 111 (100.0%) |
| 25 to 34 Years | 0 (0.0%) | 0 (0.0%) |
| 35 to 44 Years | 3 (100.0%) | 5 (100.0%) |
| 45 to 54 Years | 15 (100.0%) | 11 (100.0%) |
| 55 to 64 Years | 13 (61.9%) | 36 (100.0%) |
| 65 to 74 Years | 28 (100.0%) | 14 (56.0%) |
| 75 Years and over | 9 (90.0%) | 12 (100.0%) |
| Total | 75 (89.3%) | 189 (94.5%) |
Income Below Poverty Among Married-Couple Families in Readsboro
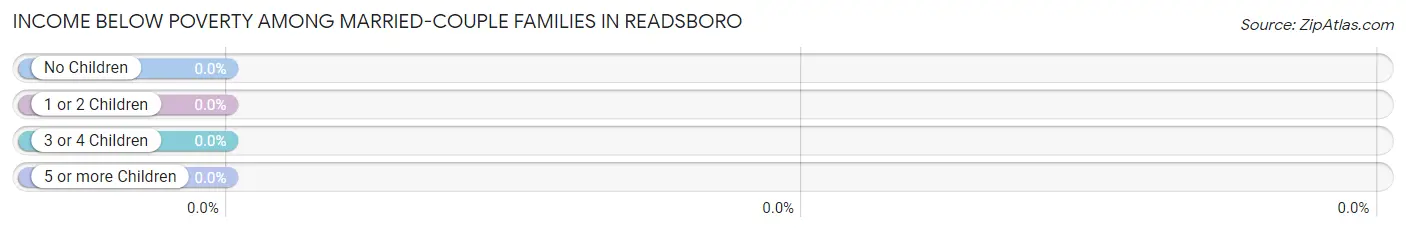
| Children | Above Poverty | Below Poverty |
| No Children | 29 (100.0%) | 0 (0.0%) |
| 1 or 2 Children | 0 (0.0%) | 0 (0.0%) |
| 3 or 4 Children | 0 (0.0%) | 0 (0.0%) |
| 5 or more Children | 0 (0.0%) | 0 (0.0%) |
| Total | 29 (100.0%) | 0 (0.0%) |
Income Below Poverty Among Single-Parent Households in Readsboro
| Children | Single Father | Single Mother |
| No Children | 0 (0.0%) | 0 (0.0%) |
| 1 or 2 Children | 0 (0.0%) | 0 (0.0%) |
| 3 or 4 Children | 0 (0.0%) | 0 (0.0%) |
| 5 or more Children | 0 (0.0%) | 0 (0.0%) |
| Total | 0 (0.0%) | 0 (0.0%) |
Income Below Poverty Among Married-Couple vs Single-Parent Households in Readsboro
| Children | Married-Couple Families | Single-Parent Households |
| No Children | 0 (0.0%) | 0 (0.0%) |
| 1 or 2 Children | 0 (0.0%) | 0 (0.0%) |
| 3 or 4 Children | 0 (0.0%) | 0 (0.0%) |
| 5 or more Children | 0 (0.0%) | 0 (0.0%) |
| Total | 0 (0.0%) | 0 (0.0%) |
Race in Readsboro
The most populous races in Readsboro are , and White / Caucasian (284 | 100.0%).
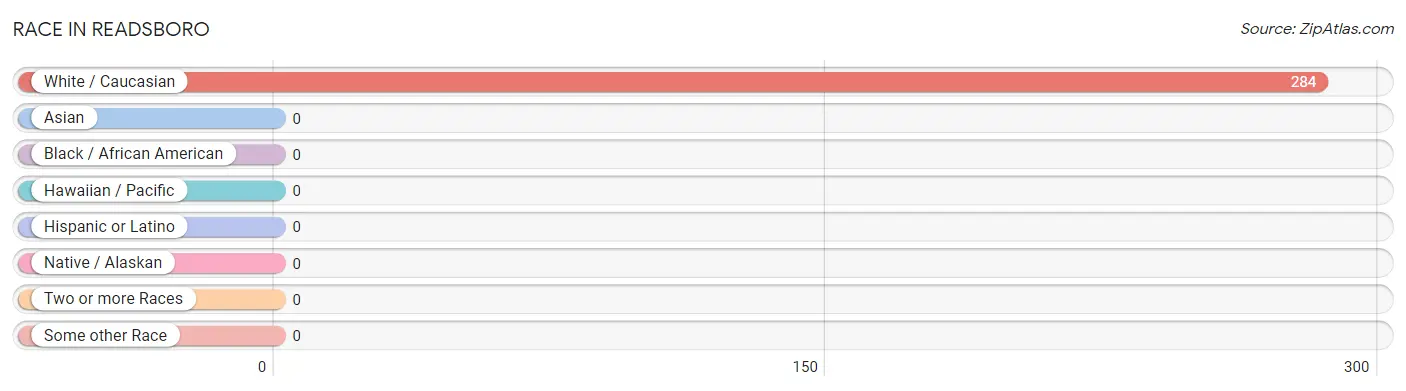
| Race | # Population | % Population |
| Asian | 0 | 0.0% |
| Black / African American | 0 | 0.0% |
| Hawaiian / Pacific | 0 | 0.0% |
| Hispanic or Latino | 0 | 0.0% |
| Native / Alaskan | 0 | 0.0% |
| White / Caucasian | 284 | 100.0% |
| Two or more Races | 0 | 0.0% |
| Some other Race | 0 | 0.0% |
| Total | 284 | 100.0% |
Ancestry in Readsboro
The most populous ancestries reported in Readsboro are English (38 | 13.4%), French (22 | 7.7%), Italian (19 | 6.7%), German (15 | 5.3%), and American (14 | 4.9%), together accounting for 38.0% of all Readsboro residents.
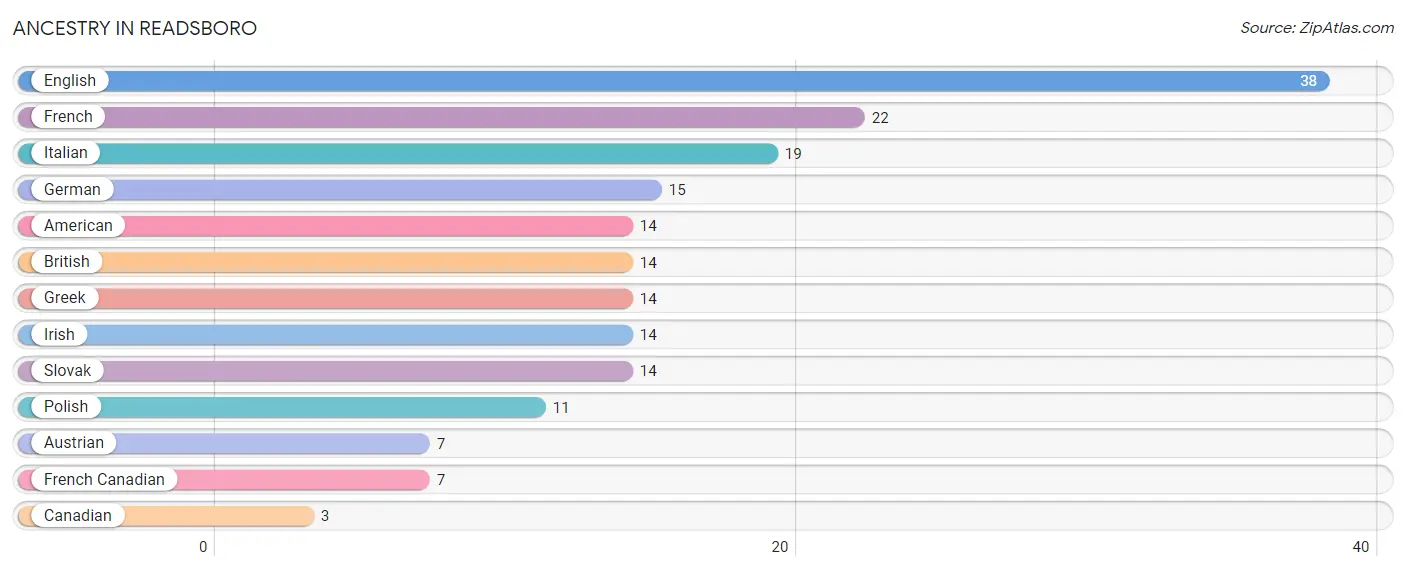
| Ancestry | # Population | % Population |
| American | 14 | 4.9% |
| Austrian | 7 | 2.5% |
| British | 14 | 4.9% |
| Canadian | 3 | 1.1% |
| English | 38 | 13.4% |
| French | 22 | 7.7% |
| French Canadian | 7 | 2.5% |
| German | 15 | 5.3% |
| Greek | 14 | 4.9% |
| Irish | 14 | 4.9% |
| Italian | 19 | 6.7% |
| Polish | 11 | 3.9% |
| Slovak | 14 | 4.9% | View All 13 Rows |
Immigrants in Readsboro
The most numerous immigrant groups reported in Readsboro came from Europe (6 | 2.1%), Czechoslovakia (3 | 1.1%), Eastern Europe (3 | 1.1%), Germany (3 | 1.1%), and Western Europe (3 | 1.1%), together accounting for 6.4% of all Readsboro residents.
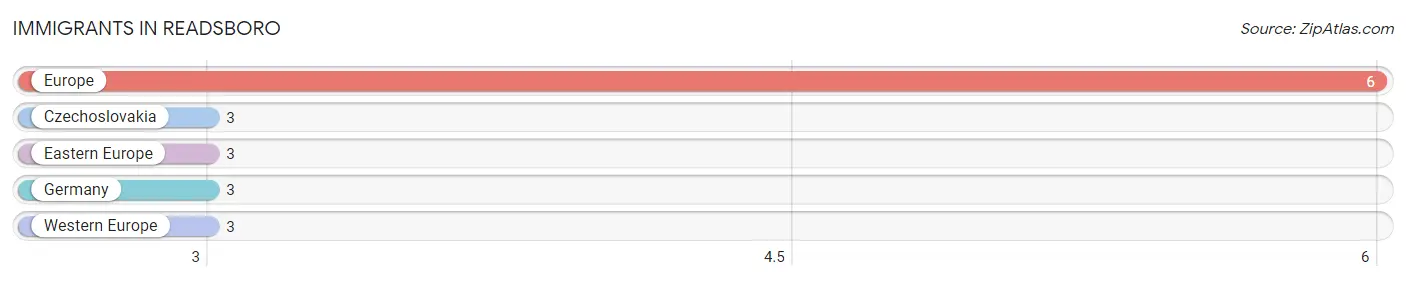
| Immigration Origin | # Population | % Population |
| Czechoslovakia | 3 | 1.1% |
| Eastern Europe | 3 | 1.1% |
| Europe | 6 | 2.1% |
| Germany | 3 | 1.1% |
| Western Europe | 3 | 1.1% | View All 5 Rows |
Sex and Age in Readsboro
Sex and Age in Readsboro
The most populous age groups in Readsboro are 65 to 69 Years (26 | 30.9%) for men and 20 to 24 Years (104 | 52.0%) for women.
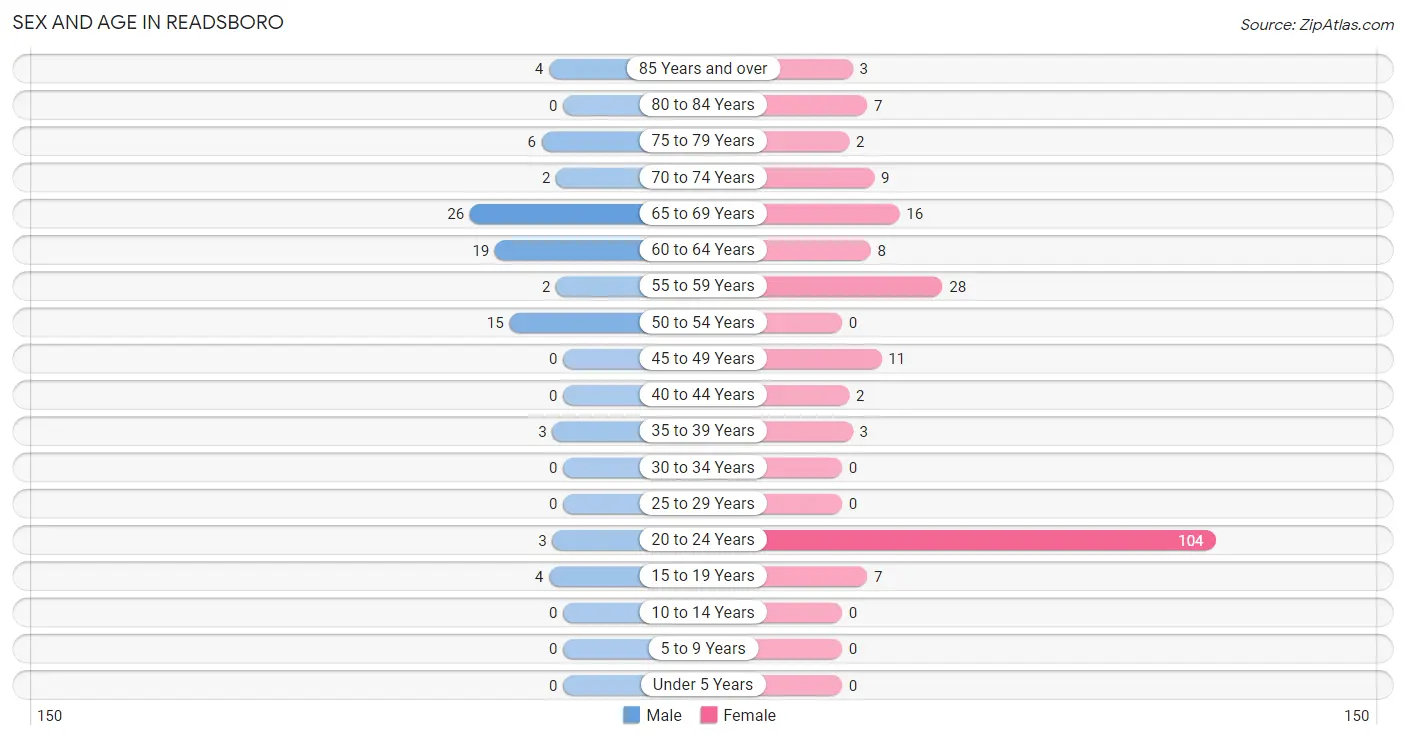
| Age Bracket | Male | Female |
| Under 5 Years | 0 (0.0%) | 0 (0.0%) |
| 5 to 9 Years | 0 (0.0%) | 0 (0.0%) |
| 10 to 14 Years | 0 (0.0%) | 0 (0.0%) |
| 15 to 19 Years | 4 (4.8%) | 7 (3.5%) |
| 20 to 24 Years | 3 (3.6%) | 104 (52.0%) |
| 25 to 29 Years | 0 (0.0%) | 0 (0.0%) |
| 30 to 34 Years | 0 (0.0%) | 0 (0.0%) |
| 35 to 39 Years | 3 (3.6%) | 3 (1.5%) |
| 40 to 44 Years | 0 (0.0%) | 2 (1.0%) |
| 45 to 49 Years | 0 (0.0%) | 11 (5.5%) |
| 50 to 54 Years | 15 (17.9%) | 0 (0.0%) |
| 55 to 59 Years | 2 (2.4%) | 28 (14.0%) |
| 60 to 64 Years | 19 (22.6%) | 8 (4.0%) |
| 65 to 69 Years | 26 (30.9%) | 16 (8.0%) |
| 70 to 74 Years | 2 (2.4%) | 9 (4.5%) |
| 75 to 79 Years | 6 (7.1%) | 2 (1.0%) |
| 80 to 84 Years | 0 (0.0%) | 7 (3.5%) |
| 85 Years and over | 4 (4.8%) | 3 (1.5%) |
| Total | 84 (100.0%) | 200 (100.0%) |
Families and Households in Readsboro
Median Family Size in Readsboro
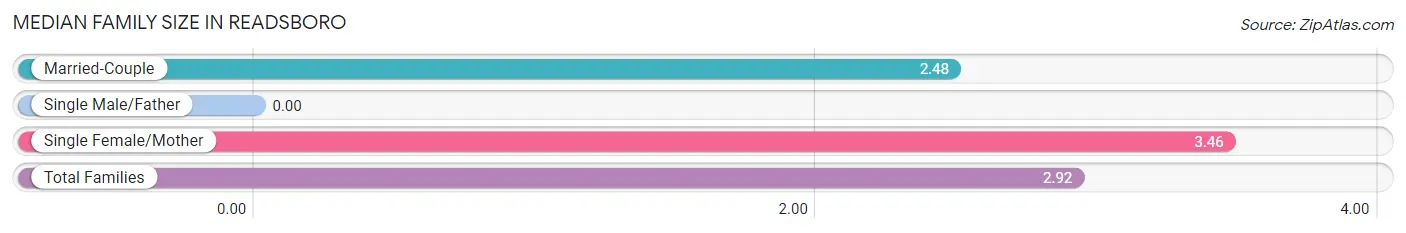
| Family Type | # Families | Family Size |
| Married-Couple | 29 (54.7%) | 2.48 |
| Single Male/Father | 0 (0.0%) | - |
| Single Female/Mother | 24 (45.3%) | 3.46 |
| Total Families | 53 (100.0%) | 2.92 |
Median Household Size in Readsboro
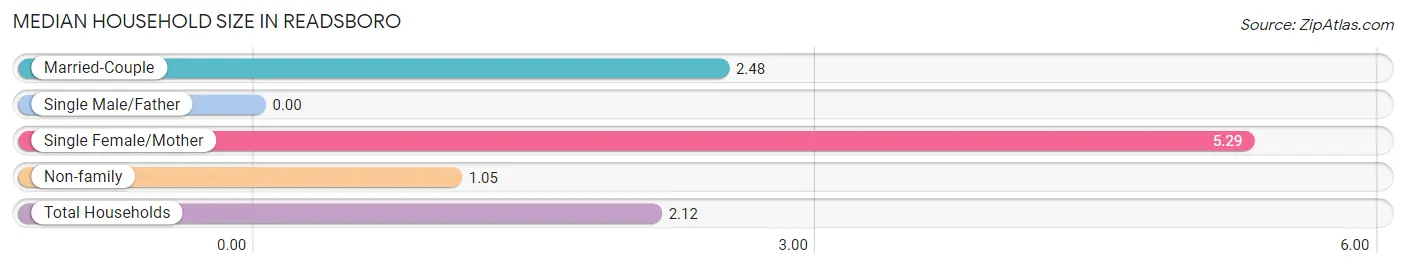
| Household Type | # Households | Household Size |
| Married-Couple | 29 (21.6%) | 2.48 |
| Single Male/Father | 0 (0.0%) | - |
| Single Female/Mother | 24 (17.9%) | 5.29 |
| Non-family | 81 (60.5%) | 1.05 |
| Total Households | 134 (100.0%) | 2.12 |
Household Size by Marriage Status in Readsboro
Out of a total of 134 households in Readsboro, 53 (39.6%) are family households, while 81 (60.5%) are nonfamily households. The most numerous type of family households are 2-person households, comprising 25, and the most common type of nonfamily households are 1-person households, comprising 77.
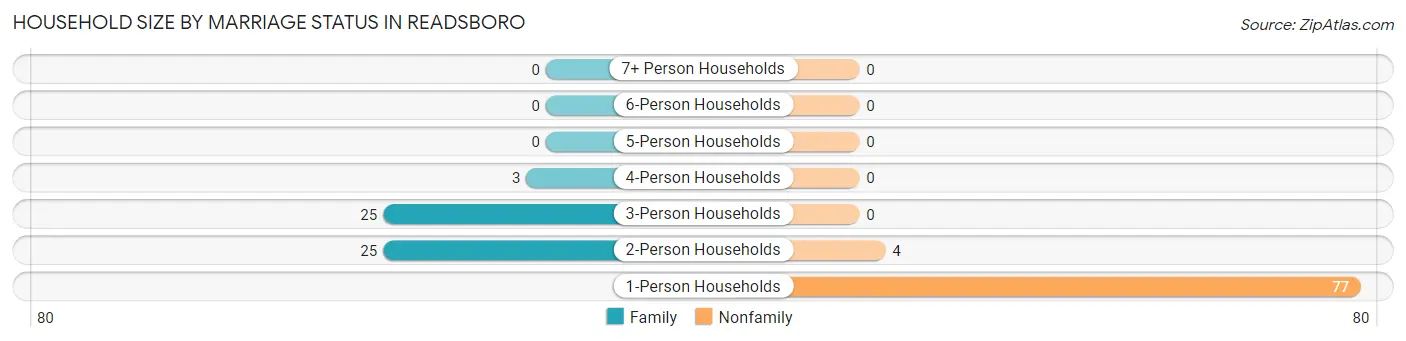
| Household Size | Family Households | Nonfamily Households |
| 1-Person Households | - | 77 (57.5%) |
| 2-Person Households | 25 (18.7%) | 4 (3.0%) |
| 3-Person Households | 25 (18.7%) | 0 (0.0%) |
| 4-Person Households | 3 (2.2%) | 0 (0.0%) |
| 5-Person Households | 0 (0.0%) | 0 (0.0%) |
| 6-Person Households | 0 (0.0%) | 0 (0.0%) |
| 7+ Person Households | 0 (0.0%) | 0 (0.0%) |
| Total | 53 (39.6%) | 81 (60.5%) |
Female Fertility in Readsboro
Fertility by Age in Readsboro
| Age Bracket | Women with Births | Births / 1,000 Women |
| 15 to 19 years | 0 (0.0%) | 0.0 |
| 20 to 34 years | 0 (0.0%) | 0.0 |
| 35 to 50 years | 0 (0.0%) | 0.0 |
| Total | 0 (0.0%) | 0.0 |
Fertility by Age by Marriage Status in Readsboro
| Age Bracket | Married | Unmarried |
| 15 to 19 years | 0 (0.0%) | 0 (0.0%) |
| 20 to 34 years | 0 (0.0%) | 0 (0.0%) |
| 35 to 50 years | 0 (0.0%) | 0 (0.0%) |
| Total | 0 (0.0%) | 0 (0.0%) |
Fertility by Education in Readsboro
| Educational Attainment | Women with Births | Births / 1,000 Women |
| Less than High School | 0 (0.0%) | 0.0 |
| High School Diploma | 0 (0.0%) | 0.0 |
| College or Associate's Degree | 0 (0.0%) | 0.0 |
| Bachelor's Degree | 0 (0.0%) | 0.0 |
| Graduate Degree | 0 (0.0%) | 0.0 |
| Total | 0 (0.0%) | 0.0 |
Fertility by Education by Marriage Status in Readsboro
| Educational Attainment | Married | Unmarried |
| Less than High School | 0 (0.0%) | 0 (0.0%) |
| High School Diploma | 0 (0.0%) | 0 (0.0%) |
| College or Associate's Degree | 0 (0.0%) | 0 (0.0%) |
| Bachelor's Degree | 0 (0.0%) | 0 (0.0%) |
| Graduate Degree | 0 (0.0%) | 0 (0.0%) |
| Total | 0 (0.0%) | 0 (0.0%) |
Employment Characteristics in Readsboro
Employment by Class of Employer in Readsboro
Among the 189 employed individuals in Readsboro, private company employees (139 | 73.5%), federal government employees (21 | 11.1%), and self-employed (not incorporated) (15 | 7.9%) make up the most common classes of employment.
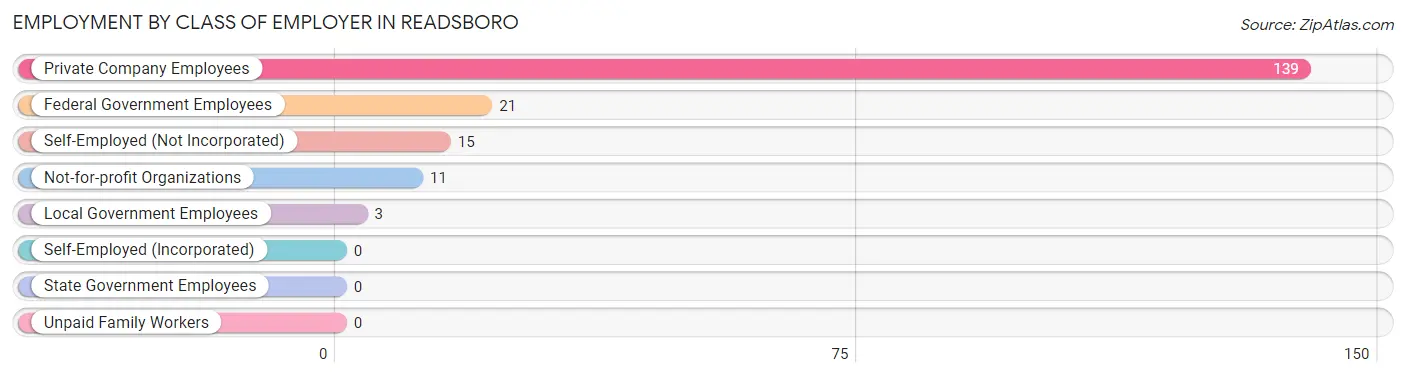
| Employer Class | # Employees | % Employees |
| Private Company Employees | 139 | 73.5% |
| Self-Employed (Incorporated) | 0 | 0.0% |
| Self-Employed (Not Incorporated) | 15 | 7.9% |
| Not-for-profit Organizations | 11 | 5.8% |
| Local Government Employees | 3 | 1.6% |
| State Government Employees | 0 | 0.0% |
| Federal Government Employees | 21 | 11.1% |
| Unpaid Family Workers | 0 | 0.0% |
| Total | 189 | 100.0% |
Employment Status by Age in Readsboro
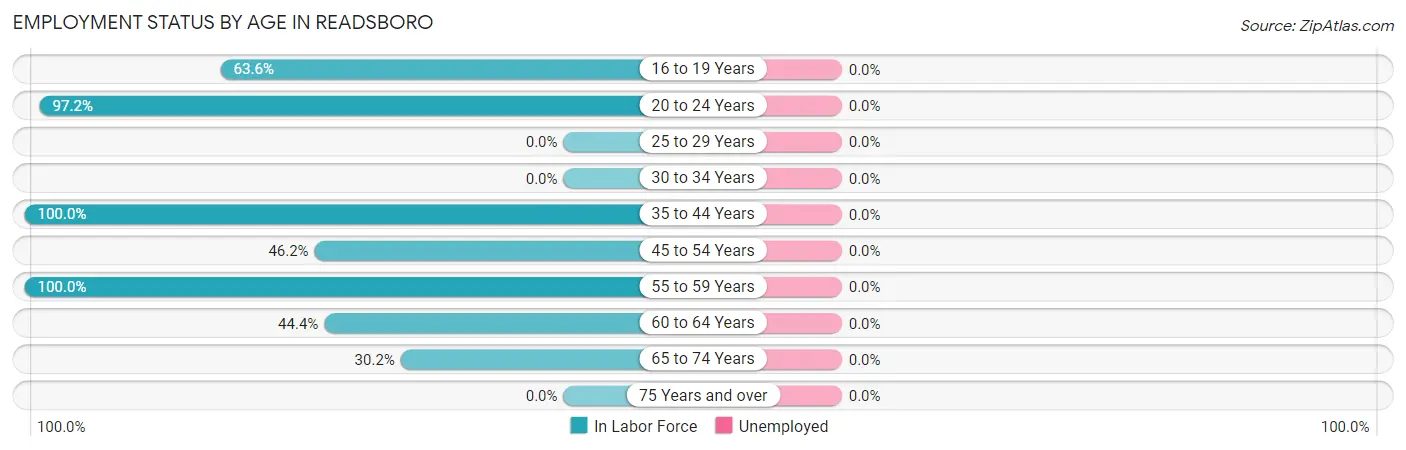
| Age Bracket | In Labor Force | Unemployed |
| 16 to 19 Years | 7 (63.6%) | 0 (0.0%) |
| 20 to 24 Years | 104 (97.2%) | 0 (0.0%) |
| 25 to 29 Years | 0 (0.0%) | 0 (0.0%) |
| 30 to 34 Years | 0 (0.0%) | 0 (0.0%) |
| 35 to 44 Years | 8 (100.0%) | 0 (0.0%) |
| 45 to 54 Years | 12 (46.2%) | 0 (0.0%) |
| 55 to 59 Years | 30 (100.0%) | 0 (0.0%) |
| 60 to 64 Years | 12 (44.4%) | 0 (0.0%) |
| 65 to 74 Years | 16 (30.2%) | 0 (0.0%) |
| 75 Years and over | 0 (0.0%) | 0 (0.0%) |
| Total | 189 (66.5%) | 0 (0.0%) |
Employment Status by Educational Attainment in Readsboro
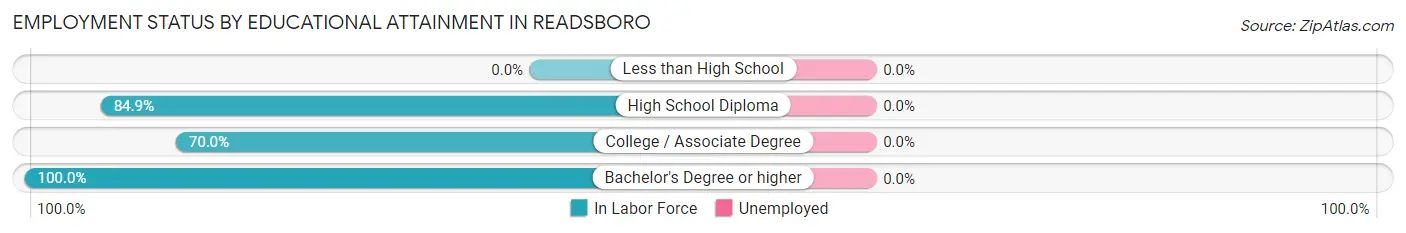
| Educational Attainment | In Labor Force | Unemployed |
| Less than High School | 0 (0.0%) | 0 (0.0%) |
| High School Diploma | 45 (84.9%) | 0 (0.0%) |
| College / Associate Degree | 14 (70.0%) | 0 (0.0%) |
| Bachelor's Degree or higher | 3 (100.0%) | 0 (0.0%) |
| Total | 62 (68.1%) | 0 (0.0%) |
Employment Occupations by Sex in Readsboro
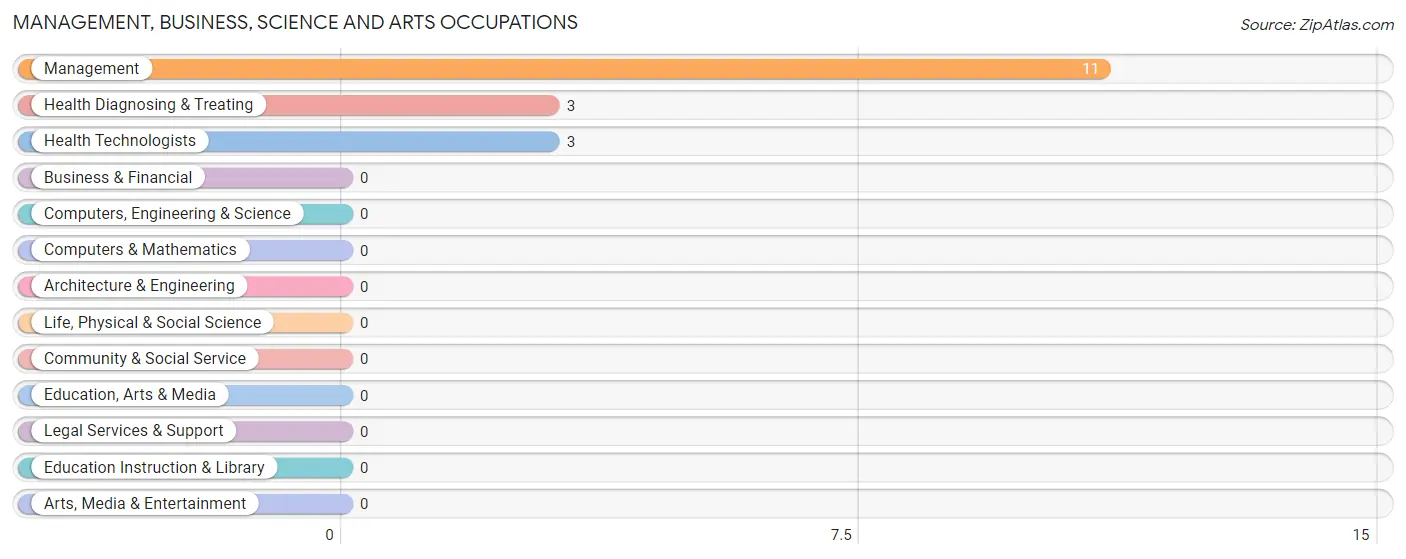
Management, Business, Science and Arts Occupations
The most common Management, Business, Science and Arts occupations in Readsboro are Management (11 | 5.8%), Health Diagnosing & Treating (3 | 1.6%), and Health Technologists (3 | 1.6%).
Management, Business, Science and Arts Occupations by Sex
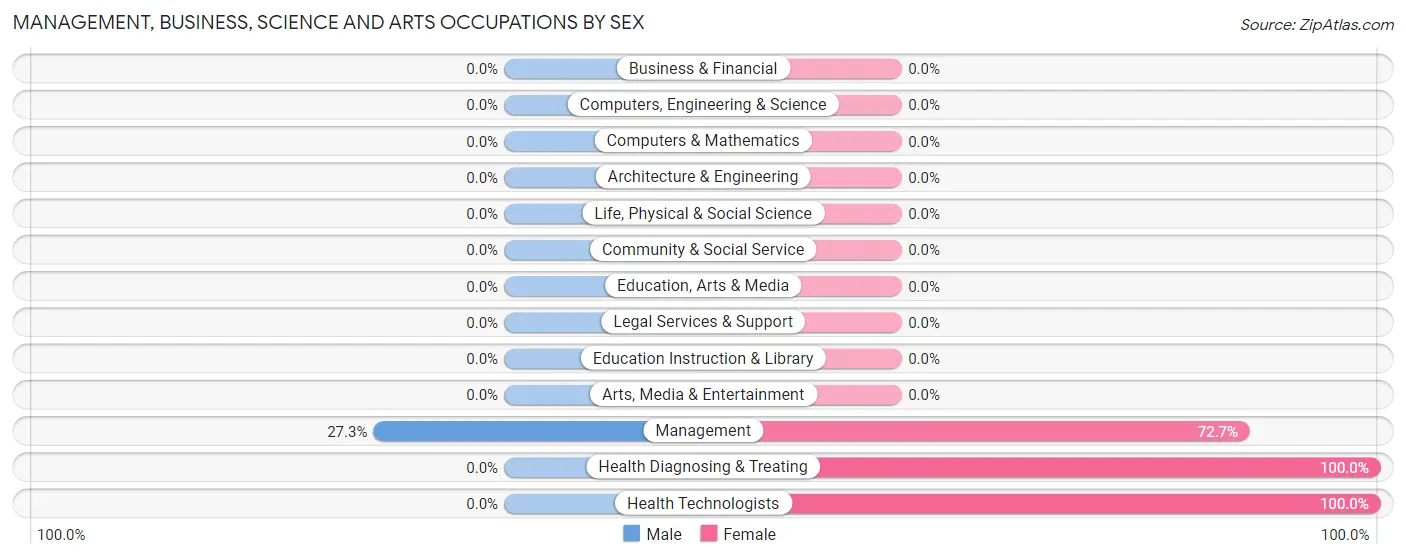
| Occupation | Male | Female |
| Management | 3 (27.3%) | 8 (72.7%) |
| Business & Financial | 0 (0.0%) | 0 (0.0%) |
| Computers, Engineering & Science | 0 (0.0%) | 0 (0.0%) |
| Computers & Mathematics | 0 (0.0%) | 0 (0.0%) |
| Architecture & Engineering | 0 (0.0%) | 0 (0.0%) |
| Life, Physical & Social Science | 0 (0.0%) | 0 (0.0%) |
| Community & Social Service | 0 (0.0%) | 0 (0.0%) |
| Education, Arts & Media | 0 (0.0%) | 0 (0.0%) |
| Legal Services & Support | 0 (0.0%) | 0 (0.0%) |
| Education Instruction & Library | 0 (0.0%) | 0 (0.0%) |
| Arts, Media & Entertainment | 0 (0.0%) | 0 (0.0%) |
| Health Diagnosing & Treating | 0 (0.0%) | 3 (100.0%) |
| Health Technologists | 0 (0.0%) | 3 (100.0%) |
| Total (Category) | 3 (21.4%) | 11 (78.6%) |
| Total (Overall) | 35 (18.5%) | 154 (81.5%) |
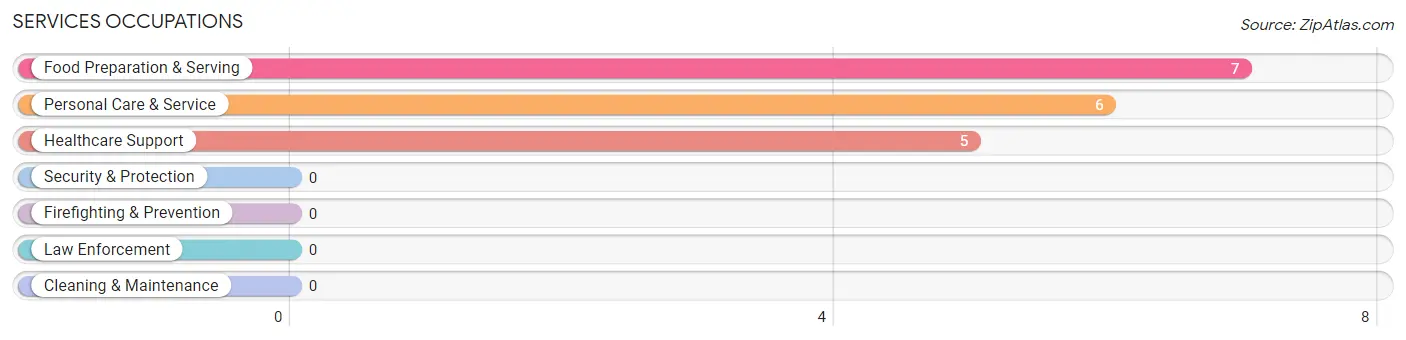
Services Occupations
The most common Services occupations in Readsboro are Food Preparation & Serving (7 | 3.7%), Personal Care & Service (6 | 3.2%), and Healthcare Support (5 | 2.6%).
Services Occupations by Sex
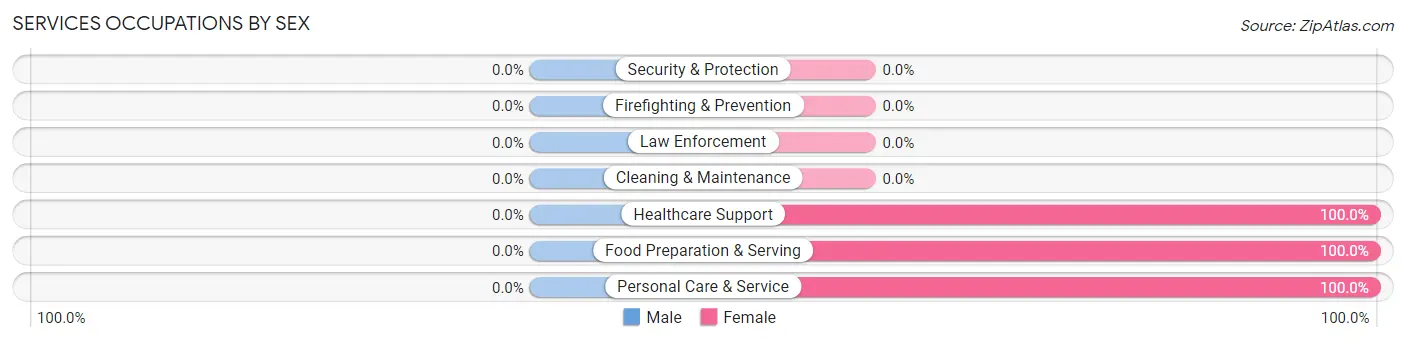
| Occupation | Male | Female |
| Healthcare Support | 0 (0.0%) | 5 (100.0%) |
| Security & Protection | 0 (0.0%) | 0 (0.0%) |
| Firefighting & Prevention | 0 (0.0%) | 0 (0.0%) |
| Law Enforcement | 0 (0.0%) | 0 (0.0%) |
| Food Preparation & Serving | 0 (0.0%) | 7 (100.0%) |
| Cleaning & Maintenance | 0 (0.0%) | 0 (0.0%) |
| Personal Care & Service | 0 (0.0%) | 6 (100.0%) |
| Total (Category) | 0 (0.0%) | 18 (100.0%) |
| Total (Overall) | 35 (18.5%) | 154 (81.5%) |
Sales and Office Occupations
The most common Sales and Office occupations in Readsboro are Sales & Related (102 | 54.0%), and Office & Administration (23 | 12.2%).
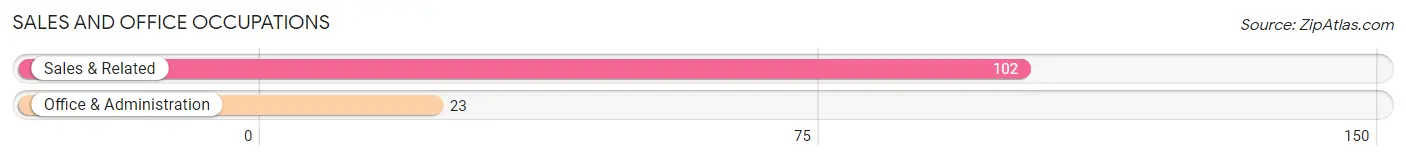
Sales and Office Occupations by Sex
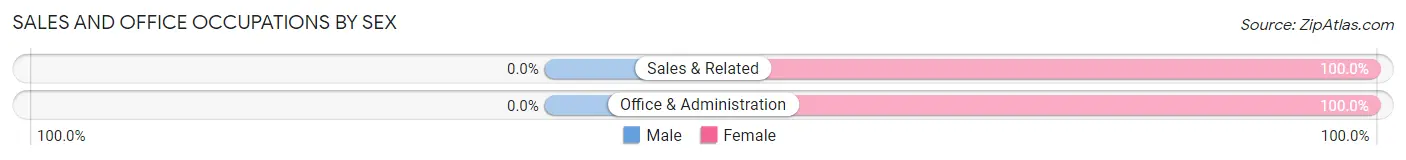
| Occupation | Male | Female |
| Sales & Related | 0 (0.0%) | 102 (100.0%) |
| Office & Administration | 0 (0.0%) | 23 (100.0%) |
| Total (Category) | 0 (0.0%) | 125 (100.0%) |
| Total (Overall) | 35 (18.5%) | 154 (81.5%) |
Natural Resources, Construction and Maintenance Occupations
The most common Natural Resources, Construction and Maintenance occupations in Readsboro are , and Construction & Extraction (6 | 3.2%).
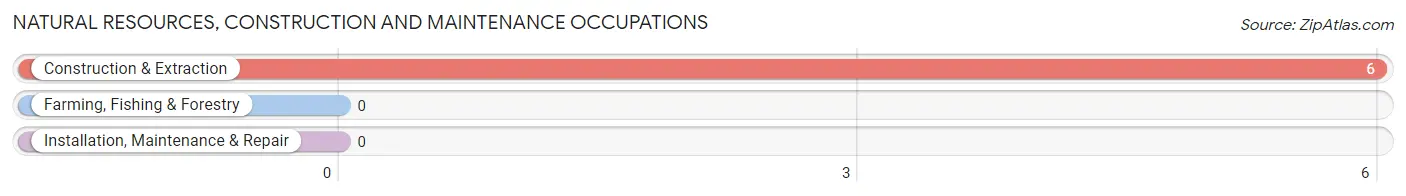
Natural Resources, Construction and Maintenance Occupations by Sex
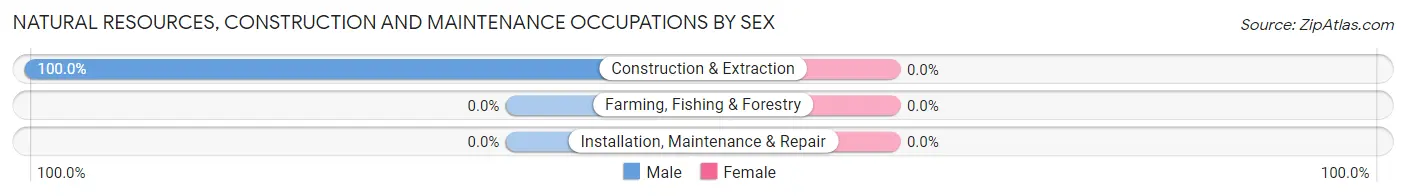
| Occupation | Male | Female |
| Farming, Fishing & Forestry | 0 (0.0%) | 0 (0.0%) |
| Construction & Extraction | 6 (100.0%) | 0 (0.0%) |
| Installation, Maintenance & Repair | 0 (0.0%) | 0 (0.0%) |
| Total (Category) | 6 (100.0%) | 0 (0.0%) |
| Total (Overall) | 35 (18.5%) | 154 (81.5%) |
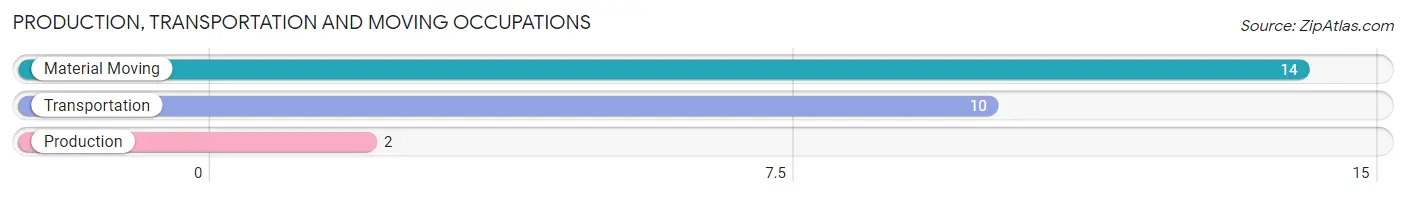
Production, Transportation and Moving Occupations
The most common Production, Transportation and Moving occupations in Readsboro are Material Moving (14 | 7.4%), Transportation (10 | 5.3%), and Production (2 | 1.1%).
Production, Transportation and Moving Occupations by Sex
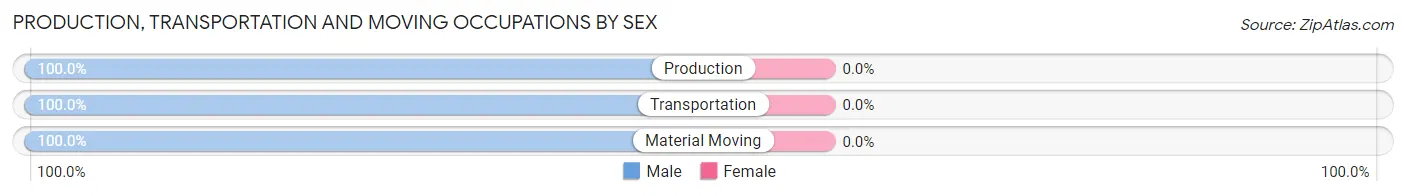
| Occupation | Male | Female |
| Production | 2 (100.0%) | 0 (0.0%) |
| Transportation | 10 (100.0%) | 0 (0.0%) |
| Material Moving | 14 (100.0%) | 0 (0.0%) |
| Total (Category) | 26 (100.0%) | 0 (0.0%) |
| Total (Overall) | 35 (18.5%) | 154 (81.5%) |
Employment Industries by Sex in Readsboro
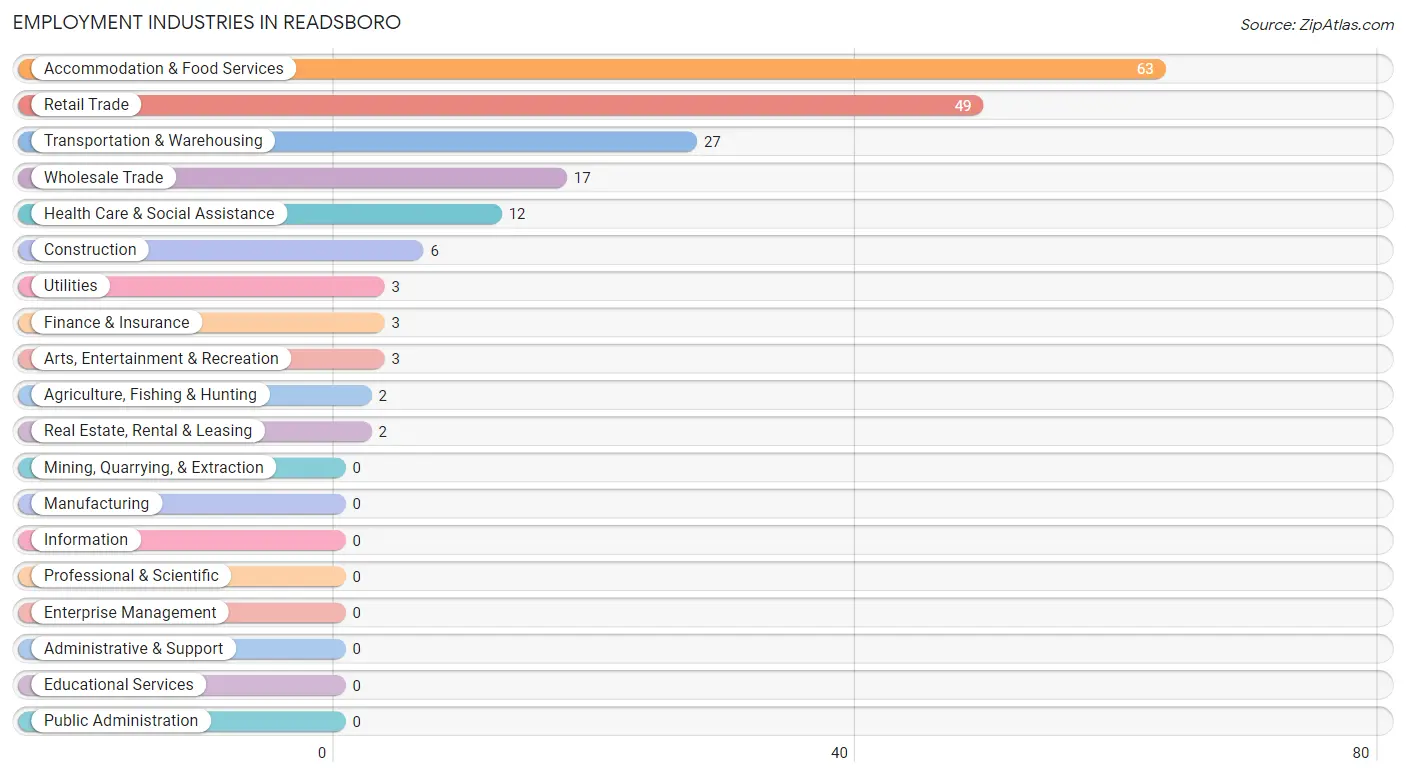
Employment Industries in Readsboro
The major employment industries in Readsboro include Accommodation & Food Services (63 | 33.3%), Retail Trade (49 | 25.9%), Transportation & Warehousing (27 | 14.3%), Wholesale Trade (17 | 9.0%), and Health Care & Social Assistance (12 | 6.4%).
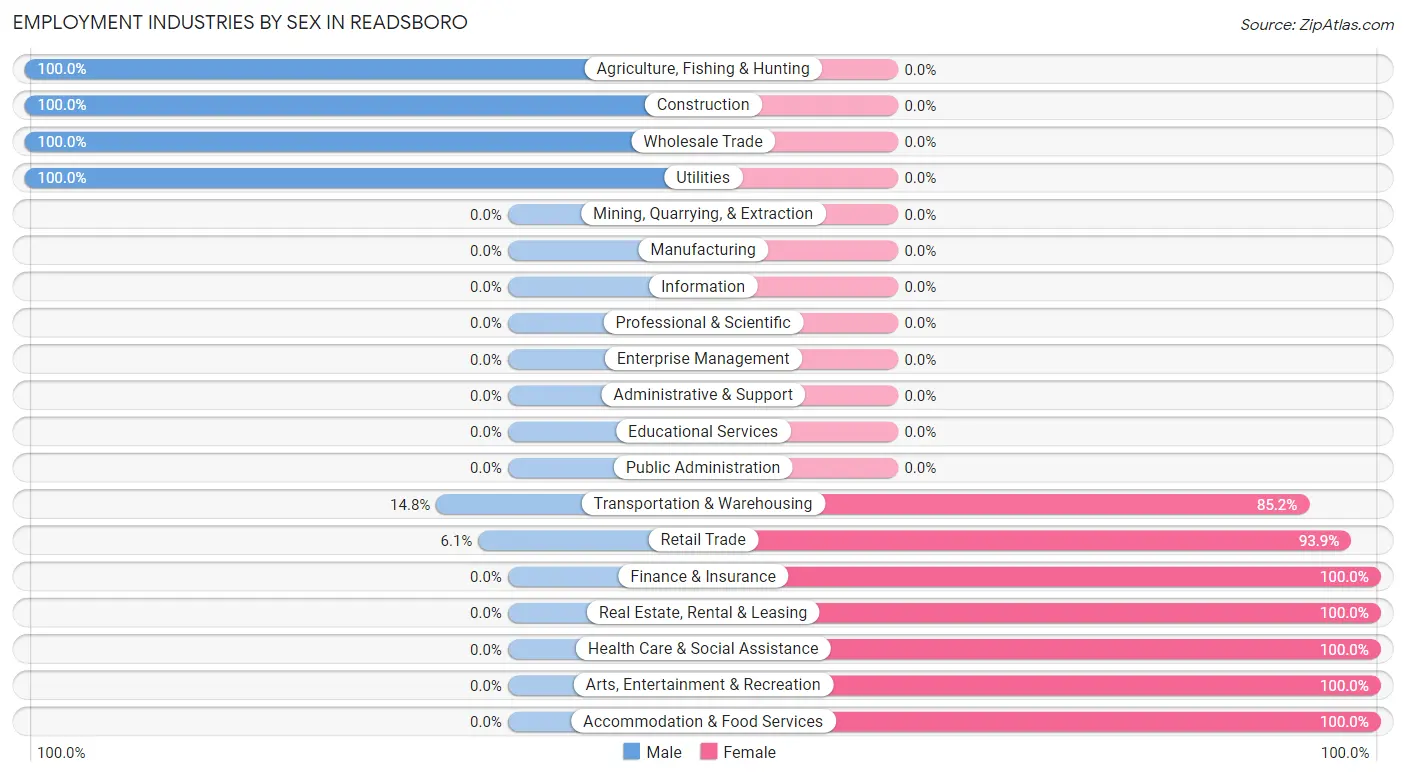
Employment Industries by Sex in Readsboro
The Readsboro industries that see more men than women are Agriculture, Fishing & Hunting (100.0%), Construction (100.0%), and Wholesale Trade (100.0%), whereas the industries that tend to have a higher number of women are Finance & Insurance (100.0%), Real Estate, Rental & Leasing (100.0%), and Health Care & Social Assistance (100.0%).
| Industry | Male | Female |
| Agriculture, Fishing & Hunting | 2 (100.0%) | 0 (0.0%) |
| Mining, Quarrying, & Extraction | 0 (0.0%) | 0 (0.0%) |
| Construction | 6 (100.0%) | 0 (0.0%) |
| Manufacturing | 0 (0.0%) | 0 (0.0%) |
| Wholesale Trade | 17 (100.0%) | 0 (0.0%) |
| Retail Trade | 3 (6.1%) | 46 (93.9%) |
| Transportation & Warehousing | 4 (14.8%) | 23 (85.2%) |
| Utilities | 3 (100.0%) | 0 (0.0%) |
| Information | 0 (0.0%) | 0 (0.0%) |
| Finance & Insurance | 0 (0.0%) | 3 (100.0%) |
| Real Estate, Rental & Leasing | 0 (0.0%) | 2 (100.0%) |
| Professional & Scientific | 0 (0.0%) | 0 (0.0%) |
| Enterprise Management | 0 (0.0%) | 0 (0.0%) |
| Administrative & Support | 0 (0.0%) | 0 (0.0%) |
| Educational Services | 0 (0.0%) | 0 (0.0%) |
| Health Care & Social Assistance | 0 (0.0%) | 12 (100.0%) |
| Arts, Entertainment & Recreation | 0 (0.0%) | 3 (100.0%) |
| Accommodation & Food Services | 0 (0.0%) | 63 (100.0%) |
| Public Administration | 0 (0.0%) | 0 (0.0%) |
| Total | 35 (18.5%) | 154 (81.5%) |
Education in Readsboro
School Enrollment in Readsboro
The most common levels of schooling among the 7 students in Readsboro are high school (4 | 57.1%), and college / undergraduate (3 | 42.9%).
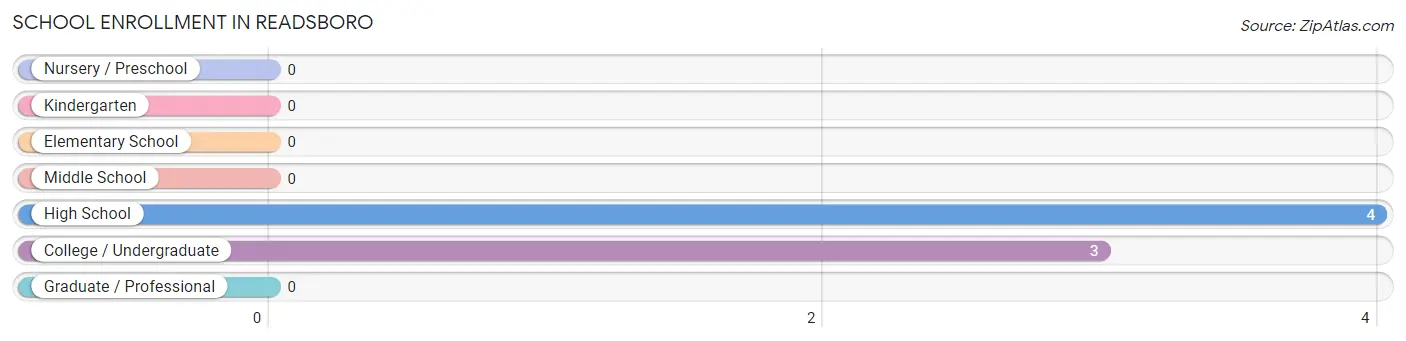
| School Level | # Students | % Students |
| Nursery / Preschool | 0 | 0.0% |
| Kindergarten | 0 | 0.0% |
| Elementary School | 0 | 0.0% |
| Middle School | 0 | 0.0% |
| High School | 4 | 57.1% |
| College / Undergraduate | 3 | 42.9% |
| Graduate / Professional | 0 | 0.0% |
| Total | 7 | 100.0% |
School Enrollment by Age by Funding Source in Readsboro
Out of a total of 7 students who are enrolled in schools in Readsboro, 4 (57.1%) attend a private institution, while the remaining 3 (42.9%) are enrolled in public schools. The age group of 18 to 19 year olds has the highest likelihood of being enrolled in private schools, with 4 (100.0% in the age bracket) enrolled. Conversely, the age group of 20 to 24 year olds has the lowest likelihood of being enrolled in a private school, with 3 (100.0% in the age bracket) attending a public institution.
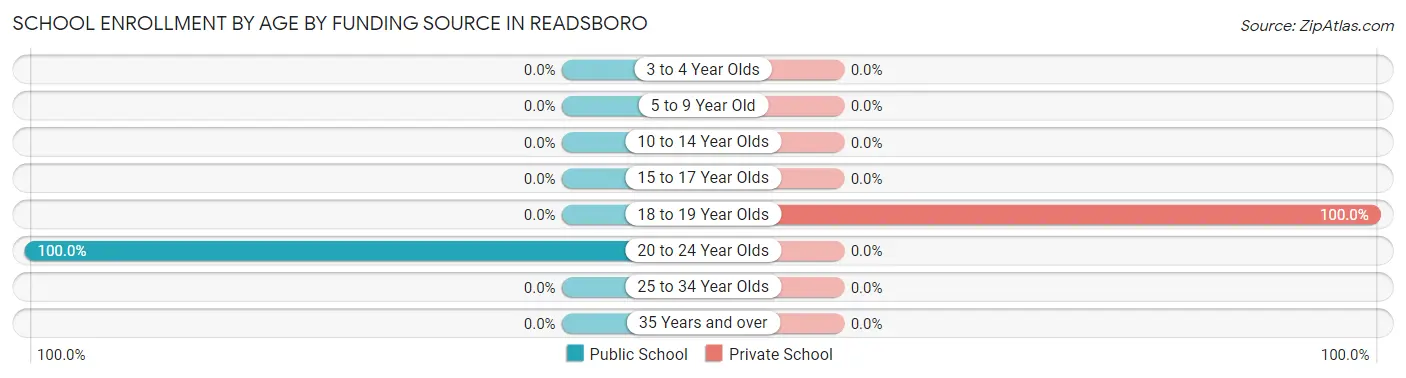
| Age Bracket | Public School | Private School |
| 3 to 4 Year Olds | 0 (0.0%) | 0 (0.0%) |
| 5 to 9 Year Old | 0 (0.0%) | 0 (0.0%) |
| 10 to 14 Year Olds | 0 (0.0%) | 0 (0.0%) |
| 15 to 17 Year Olds | 0 (0.0%) | 0 (0.0%) |
| 18 to 19 Year Olds | 0 (0.0%) | 4 (100.0%) |
| 20 to 24 Year Olds | 3 (100.0%) | 0 (0.0%) |
| 25 to 34 Year Olds | 0 (0.0%) | 0 (0.0%) |
| 35 Years and over | 0 (0.0%) | 0 (0.0%) |
| Total | 3 (42.9%) | 4 (57.1%) |
Educational Attainment by Field of Study in Readsboro
Science & technology (3 | 33.3%), business (3 | 33.3%), and arts & humanities (3 | 33.3%) are the most common fields of study among 9 individuals in Readsboro who have obtained a bachelor's degree or higher.
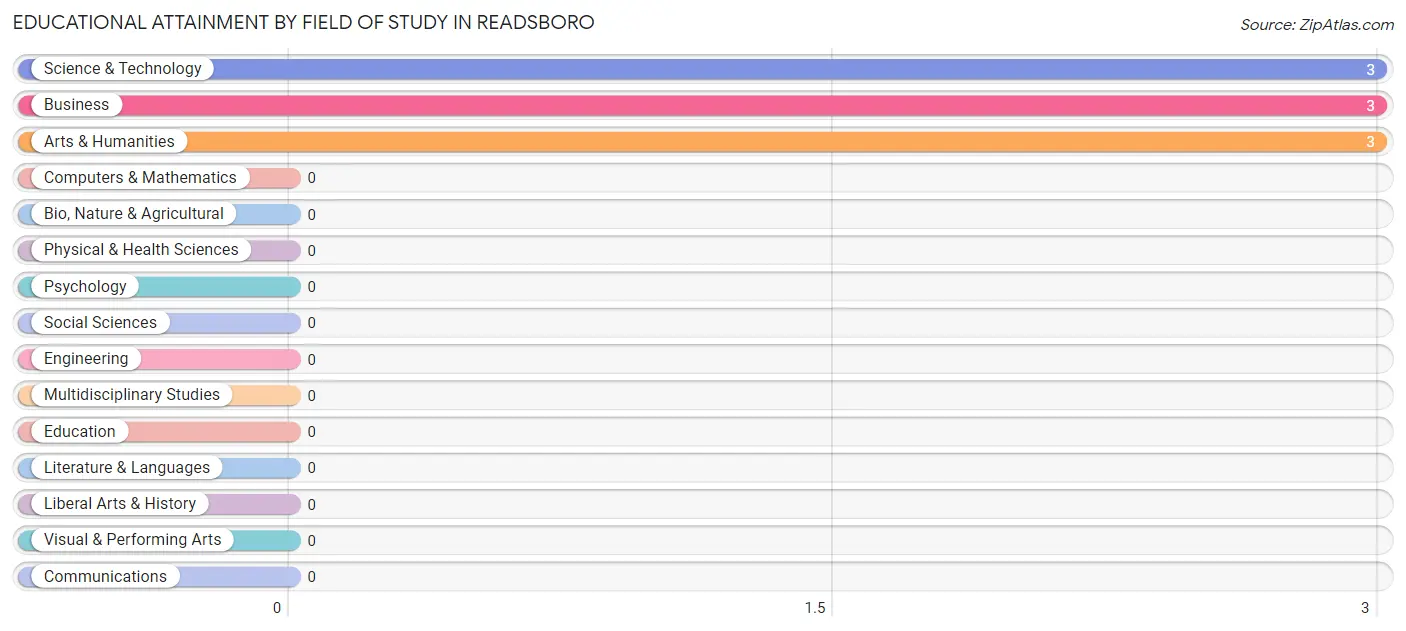
| Field of Study | # Graduates | % Graduates |
| Computers & Mathematics | 0 | 0.0% |
| Bio, Nature & Agricultural | 0 | 0.0% |
| Physical & Health Sciences | 0 | 0.0% |
| Psychology | 0 | 0.0% |
| Social Sciences | 0 | 0.0% |
| Engineering | 0 | 0.0% |
| Multidisciplinary Studies | 0 | 0.0% |
| Science & Technology | 3 | 33.3% |
| Business | 3 | 33.3% |
| Education | 0 | 0.0% |
| Literature & Languages | 0 | 0.0% |
| Liberal Arts & History | 0 | 0.0% |
| Visual & Performing Arts | 0 | 0.0% |
| Communications | 0 | 0.0% |
| Arts & Humanities | 3 | 33.3% |
| Total | 9 | 100.0% |
Transportation & Commute in Readsboro
Vehicle Availability by Sex in Readsboro
The most prevalent vehicle ownership categories in Readsboro are males with 1 vehicle (14, accounting for 40.0%) and females with 1 vehicle (12, making up 9.1%).
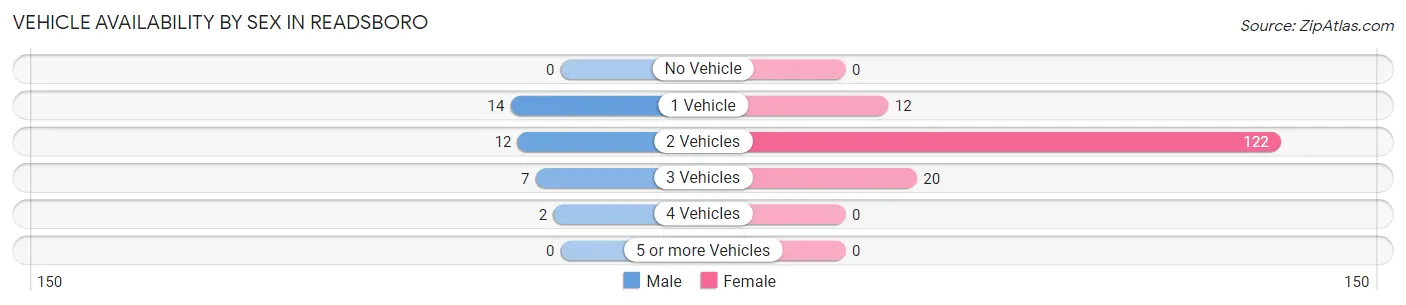
| Vehicles Available | Male | Female |
| No Vehicle | 0 (0.0%) | 0 (0.0%) |
| 1 Vehicle | 14 (40.0%) | 12 (7.8%) |
| 2 Vehicles | 12 (34.3%) | 122 (79.2%) |
| 3 Vehicles | 7 (20.0%) | 20 (13.0%) |
| 4 Vehicles | 2 (5.7%) | 0 (0.0%) |
| 5 or more Vehicles | 0 (0.0%) | 0 (0.0%) |
| Total | 35 (100.0%) | 154 (100.0%) |
Commute Time in Readsboro
The most frequently occuring commute durations in Readsboro are 10 to 14 minutes (56 commuters, 30.1%), 20 to 24 minutes (44 commuters, 23.7%), and 40 to 44 minutes (33 commuters, 17.7%).
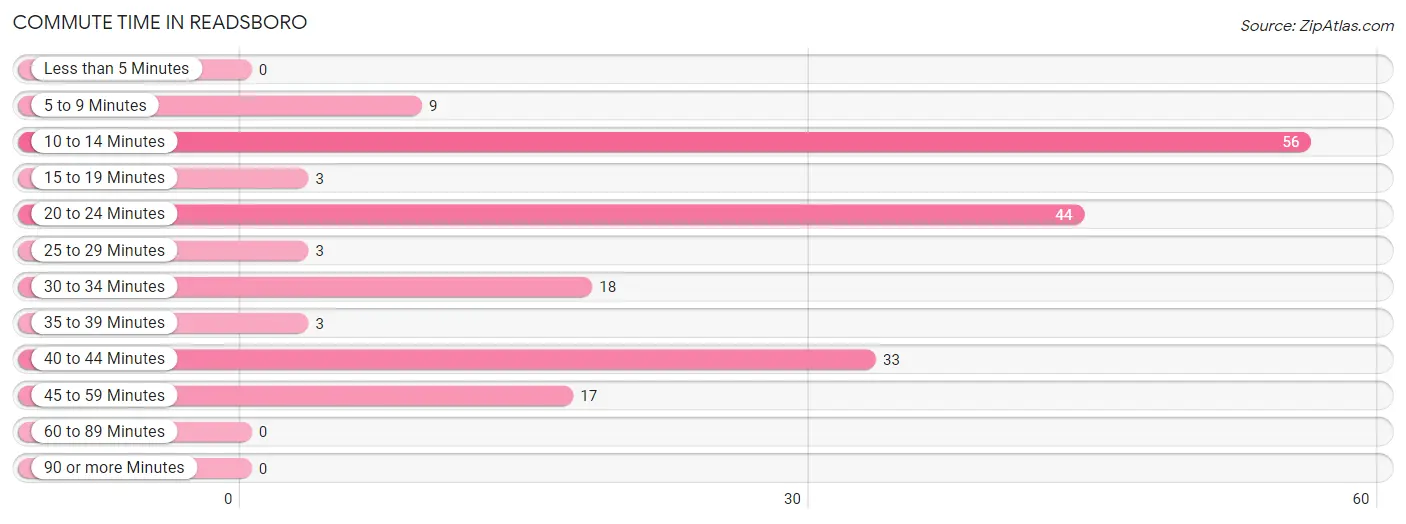
| Commute Time | # Commuters | % Commuters |
| Less than 5 Minutes | 0 | 0.0% |
| 5 to 9 Minutes | 9 | 4.8% |
| 10 to 14 Minutes | 56 | 30.1% |
| 15 to 19 Minutes | 3 | 1.6% |
| 20 to 24 Minutes | 44 | 23.7% |
| 25 to 29 Minutes | 3 | 1.6% |
| 30 to 34 Minutes | 18 | 9.7% |
| 35 to 39 Minutes | 3 | 1.6% |
| 40 to 44 Minutes | 33 | 17.7% |
| 45 to 59 Minutes | 17 | 9.1% |
| 60 to 89 Minutes | 0 | 0.0% |
| 90 or more Minutes | 0 | 0.0% |
Commute Time by Sex in Readsboro
The most common commute times in Readsboro are 45 to 59 minutes (17 commuters, 48.6%) for males and 10 to 14 minutes (56 commuters, 37.1%) for females.
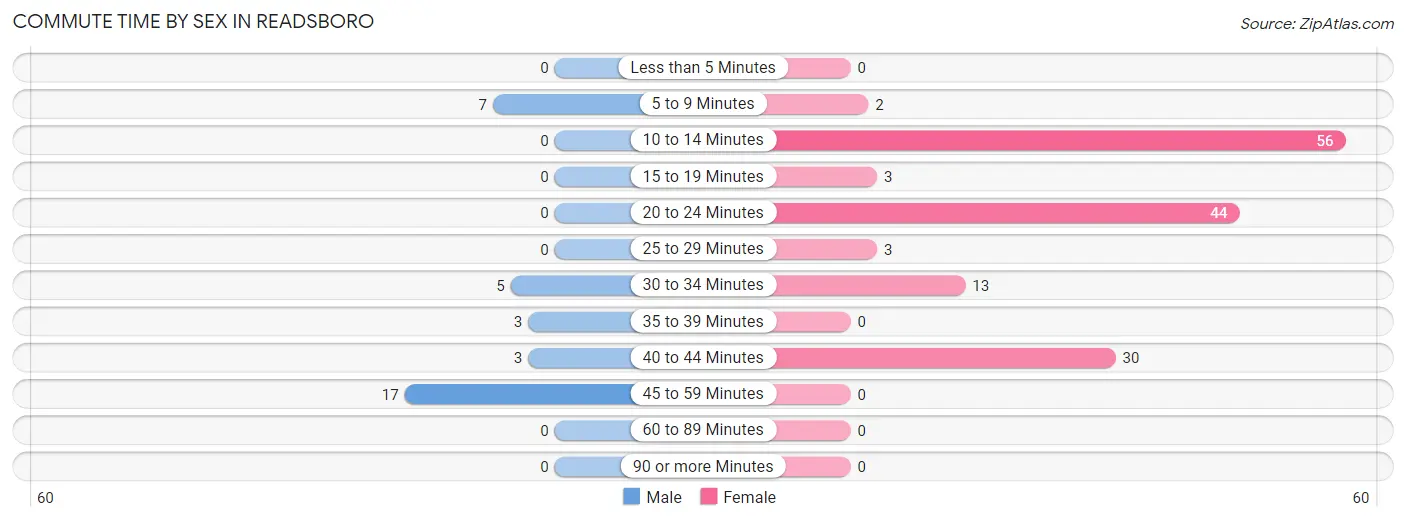
| Commute Time | Male | Female |
| Less than 5 Minutes | 0 (0.0%) | 0 (0.0%) |
| 5 to 9 Minutes | 7 (20.0%) | 2 (1.3%) |
| 10 to 14 Minutes | 0 (0.0%) | 56 (37.1%) |
| 15 to 19 Minutes | 0 (0.0%) | 3 (2.0%) |
| 20 to 24 Minutes | 0 (0.0%) | 44 (29.1%) |
| 25 to 29 Minutes | 0 (0.0%) | 3 (2.0%) |
| 30 to 34 Minutes | 5 (14.3%) | 13 (8.6%) |
| 35 to 39 Minutes | 3 (8.6%) | 0 (0.0%) |
| 40 to 44 Minutes | 3 (8.6%) | 30 (19.9%) |
| 45 to 59 Minutes | 17 (48.6%) | 0 (0.0%) |
| 60 to 89 Minutes | 0 (0.0%) | 0 (0.0%) |
| 90 or more Minutes | 0 (0.0%) | 0 (0.0%) |
Time of Departure to Work by Sex in Readsboro
The most frequent times of departure to work in Readsboro are 6:00 AM to 6:29 AM (19, 54.3%) for males and 8:00 AM to 8:29 AM (85, 56.3%) for females.
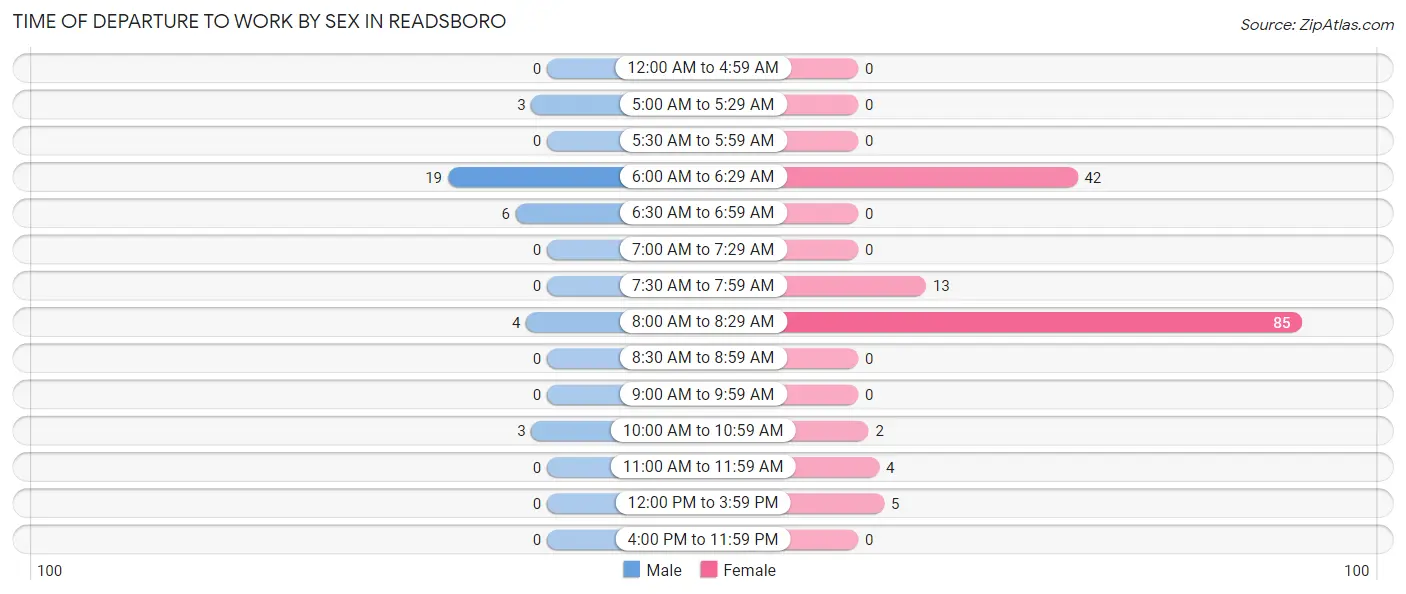
| Time of Departure | Male | Female |
| 12:00 AM to 4:59 AM | 0 (0.0%) | 0 (0.0%) |
| 5:00 AM to 5:29 AM | 3 (8.6%) | 0 (0.0%) |
| 5:30 AM to 5:59 AM | 0 (0.0%) | 0 (0.0%) |
| 6:00 AM to 6:29 AM | 19 (54.3%) | 42 (27.8%) |
| 6:30 AM to 6:59 AM | 6 (17.1%) | 0 (0.0%) |
| 7:00 AM to 7:29 AM | 0 (0.0%) | 0 (0.0%) |
| 7:30 AM to 7:59 AM | 0 (0.0%) | 13 (8.6%) |
| 8:00 AM to 8:29 AM | 4 (11.4%) | 85 (56.3%) |
| 8:30 AM to 8:59 AM | 0 (0.0%) | 0 (0.0%) |
| 9:00 AM to 9:59 AM | 0 (0.0%) | 0 (0.0%) |
| 10:00 AM to 10:59 AM | 3 (8.6%) | 2 (1.3%) |
| 11:00 AM to 11:59 AM | 0 (0.0%) | 4 (2.6%) |
| 12:00 PM to 3:59 PM | 0 (0.0%) | 5 (3.3%) |
| 4:00 PM to 11:59 PM | 0 (0.0%) | 0 (0.0%) |
| Total | 35 (100.0%) | 151 (100.0%) |
Housing Occupancy in Readsboro
Occupancy by Ownership in Readsboro
Of the total 134 dwellings in Readsboro, owner-occupied units account for 73 (54.5%), while renter-occupied units make up 61 (45.5%).
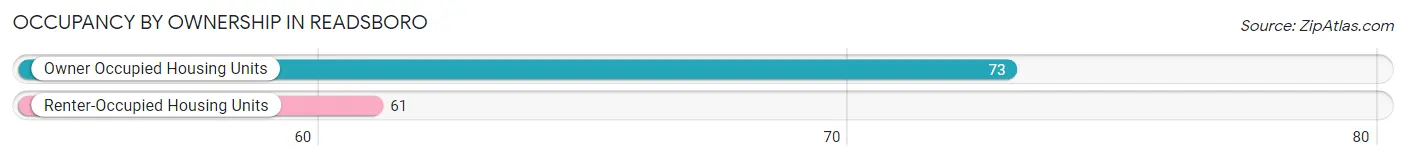
| Occupancy | # Housing Units | % Housing Units |
| Owner Occupied Housing Units | 73 | 54.5% |
| Renter-Occupied Housing Units | 61 | 45.5% |
| Total Occupied Housing Units | 134 | 100.0% |
Occupancy by Household Size in Readsboro
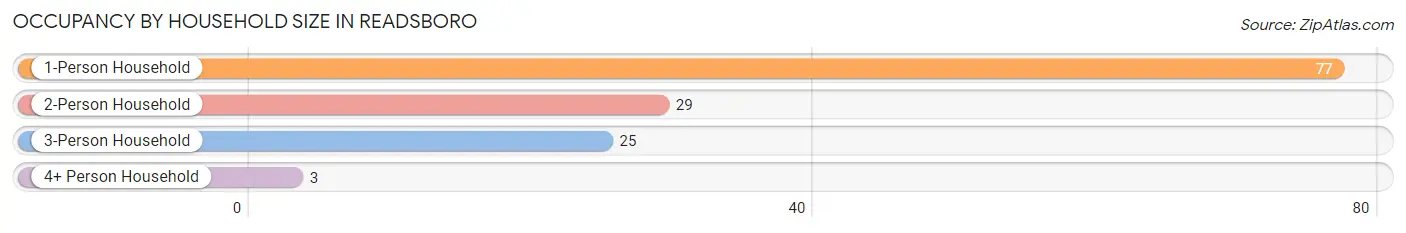
| Household Size | # Housing Units | % Housing Units |
| 1-Person Household | 77 | 57.5% |
| 2-Person Household | 29 | 21.6% |
| 3-Person Household | 25 | 18.7% |
| 4+ Person Household | 3 | 2.2% |
| Total Housing Units | 134 | 100.0% |
Occupancy by Ownership by Household Size in Readsboro
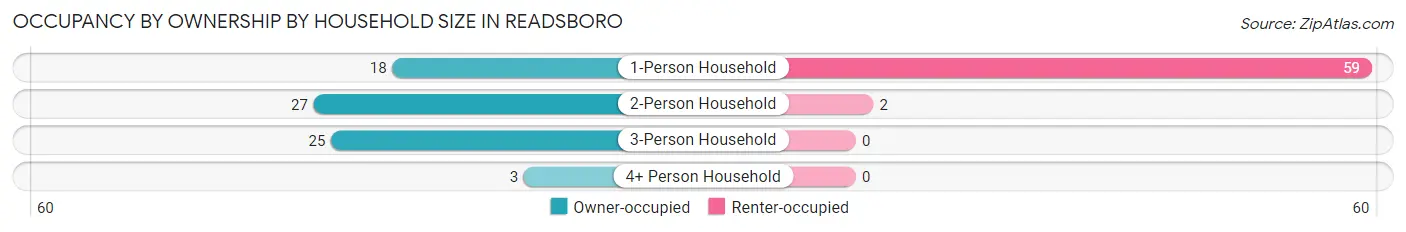
| Household Size | Owner-occupied | Renter-occupied |
| 1-Person Household | 18 (23.4%) | 59 (76.6%) |
| 2-Person Household | 27 (93.1%) | 2 (6.9%) |
| 3-Person Household | 25 (100.0%) | 0 (0.0%) |
| 4+ Person Household | 3 (100.0%) | 0 (0.0%) |
| Total Housing Units | 73 (54.5%) | 61 (45.5%) |
Occupancy by Educational Attainment in Readsboro
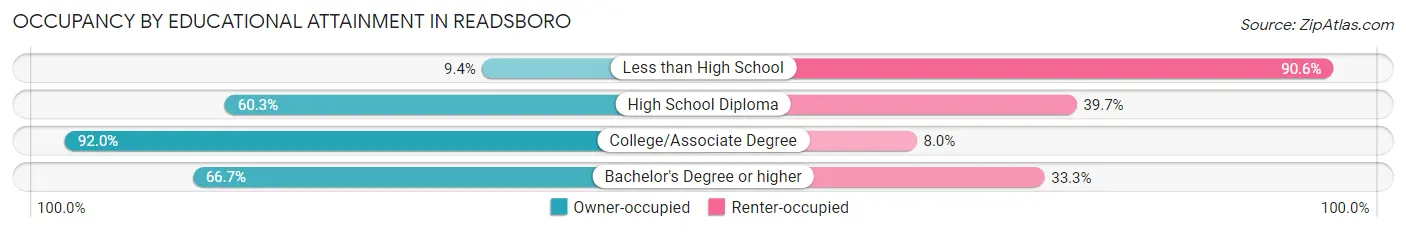
| Household Size | Owner-occupied | Renter-occupied |
| Less than High School | 3 (9.4%) | 29 (90.6%) |
| High School Diploma | 41 (60.3%) | 27 (39.7%) |
| College/Associate Degree | 23 (92.0%) | 2 (8.0%) |
| Bachelor's Degree or higher | 6 (66.7%) | 3 (33.3%) |
Occupancy by Age of Householder in Readsboro
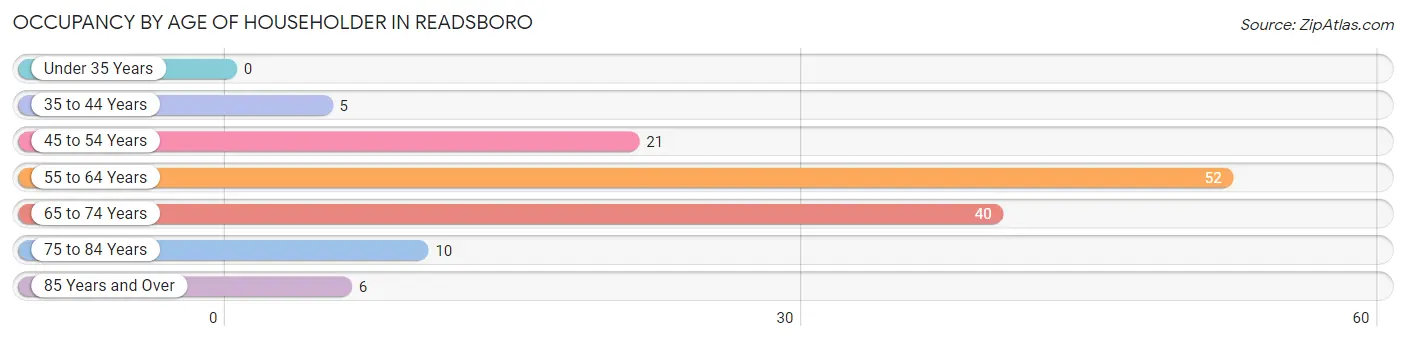
| Age Bracket | # Households | % Households |
| Under 35 Years | 0 | 0.0% |
| 35 to 44 Years | 5 | 3.7% |
| 45 to 54 Years | 21 | 15.7% |
| 55 to 64 Years | 52 | 38.8% |
| 65 to 74 Years | 40 | 29.8% |
| 75 to 84 Years | 10 | 7.5% |
| 85 Years and Over | 6 | 4.5% |
| Total | 134 | 100.0% |
Housing Finances in Readsboro
Median Income by Occupancy in Readsboro
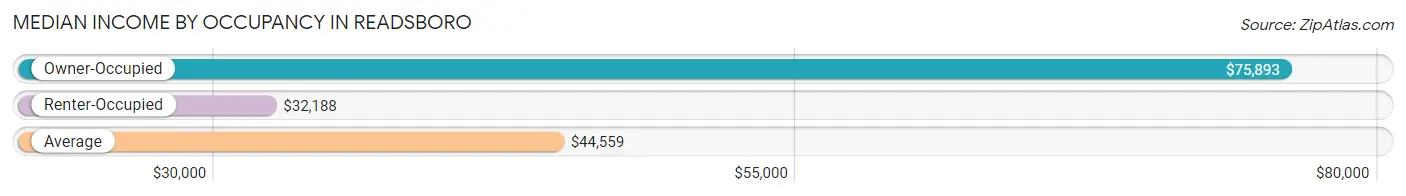
| Occupancy Type | # Households | Median Income |
| Owner-Occupied | 73 (54.5%) | $75,893 |
| Renter-Occupied | 61 (45.5%) | $32,188 |
| Average | 134 (100.0%) | $44,559 |
Occupancy by Householder Income Bracket in Readsboro
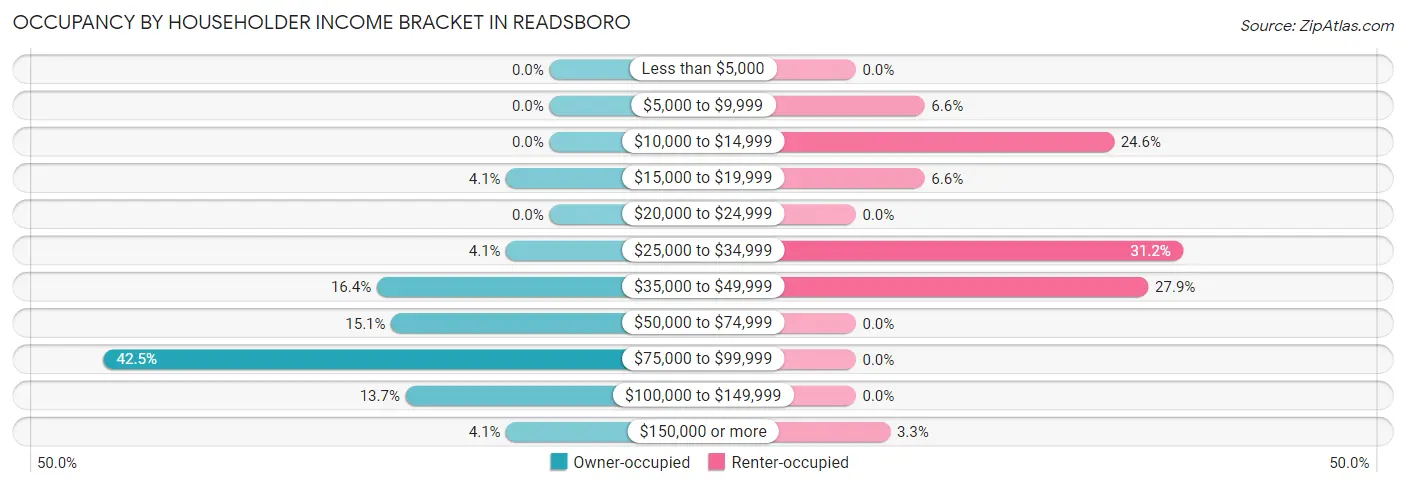
| Income Bracket | Owner-occupied | Renter-occupied |
| Less than $5,000 | 0 (0.0%) | 0 (0.0%) |
| $5,000 to $9,999 | 0 (0.0%) | 4 (6.6%) |
| $10,000 to $14,999 | 0 (0.0%) | 15 (24.6%) |
| $15,000 to $19,999 | 3 (4.1%) | 4 (6.6%) |
| $20,000 to $24,999 | 0 (0.0%) | 0 (0.0%) |
| $25,000 to $34,999 | 3 (4.1%) | 19 (31.1%) |
| $35,000 to $49,999 | 12 (16.4%) | 17 (27.9%) |
| $50,000 to $74,999 | 11 (15.1%) | 0 (0.0%) |
| $75,000 to $99,999 | 31 (42.5%) | 0 (0.0%) |
| $100,000 to $149,999 | 10 (13.7%) | 0 (0.0%) |
| $150,000 or more | 3 (4.1%) | 2 (3.3%) |
| Total | 73 (100.0%) | 61 (100.0%) |
Monthly Housing Cost Tiers in Readsboro
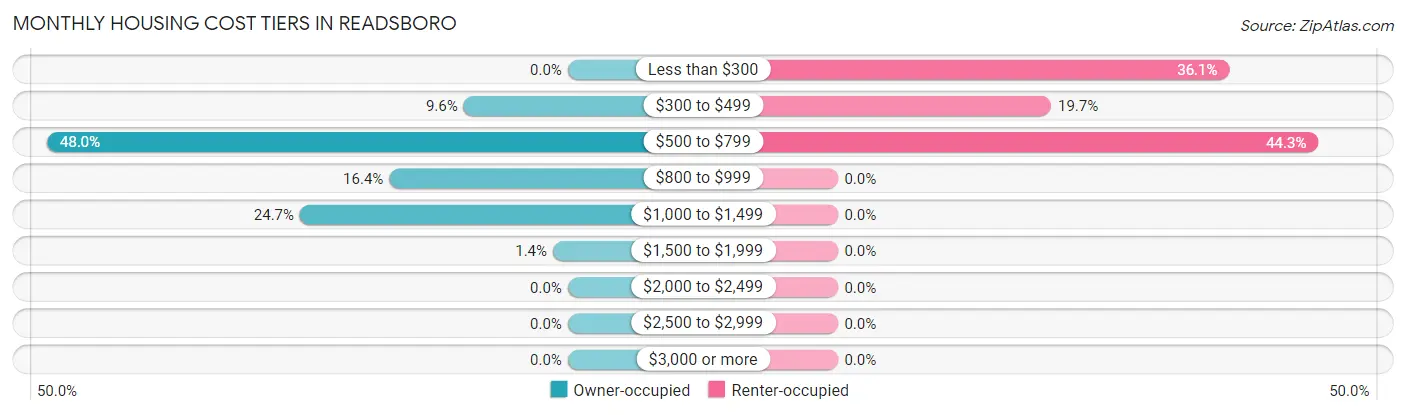
| Monthly Cost | Owner-occupied | Renter-occupied |
| Less than $300 | 0 (0.0%) | 22 (36.1%) |
| $300 to $499 | 7 (9.6%) | 12 (19.7%) |
| $500 to $799 | 35 (47.9%) | 27 (44.3%) |
| $800 to $999 | 12 (16.4%) | 0 (0.0%) |
| $1,000 to $1,499 | 18 (24.7%) | 0 (0.0%) |
| $1,500 to $1,999 | 1 (1.4%) | 0 (0.0%) |
| $2,000 to $2,499 | 0 (0.0%) | 0 (0.0%) |
| $2,500 to $2,999 | 0 (0.0%) | 0 (0.0%) |
| $3,000 or more | 0 (0.0%) | 0 (0.0%) |
| Total | 73 (100.0%) | 61 (100.0%) |
Physical Housing Characteristics in Readsboro
Housing Structures in Readsboro
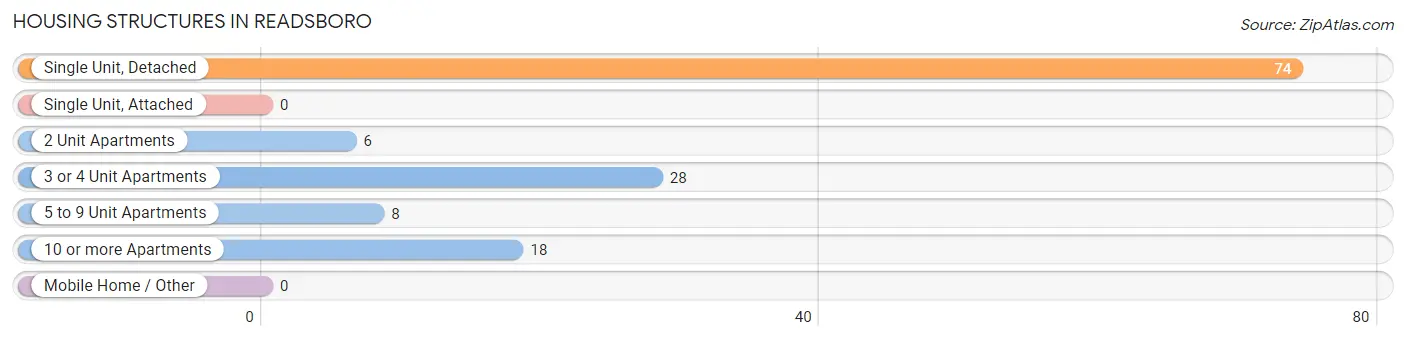
| Structure Type | # Housing Units | % Housing Units |
| Single Unit, Detached | 74 | 55.2% |
| Single Unit, Attached | 0 | 0.0% |
| 2 Unit Apartments | 6 | 4.5% |
| 3 or 4 Unit Apartments | 28 | 20.9% |
| 5 to 9 Unit Apartments | 8 | 6.0% |
| 10 or more Apartments | 18 | 13.4% |
| Mobile Home / Other | 0 | 0.0% |
| Total | 134 | 100.0% |
Housing Structures by Occupancy in Readsboro
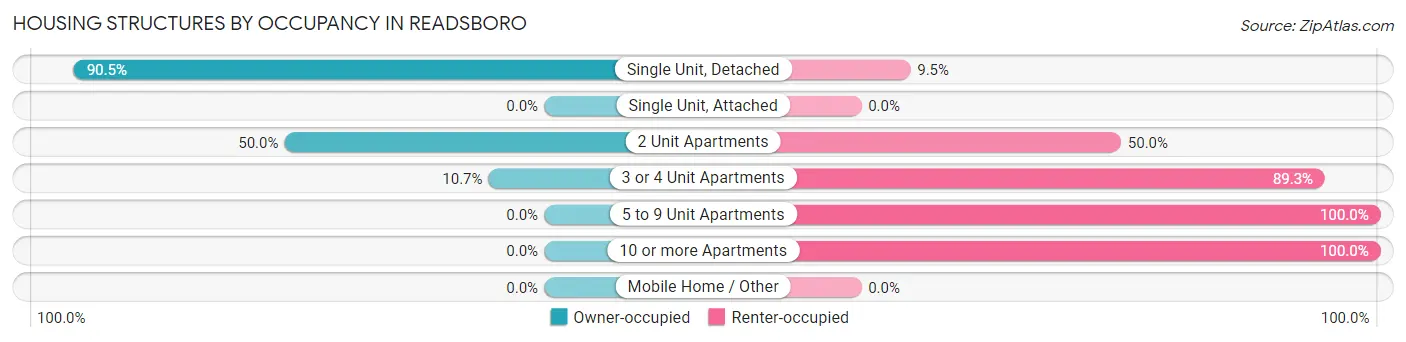
| Structure Type | Owner-occupied | Renter-occupied |
| Single Unit, Detached | 67 (90.5%) | 7 (9.5%) |
| Single Unit, Attached | 0 (0.0%) | 0 (0.0%) |
| 2 Unit Apartments | 3 (50.0%) | 3 (50.0%) |
| 3 or 4 Unit Apartments | 3 (10.7%) | 25 (89.3%) |
| 5 to 9 Unit Apartments | 0 (0.0%) | 8 (100.0%) |
| 10 or more Apartments | 0 (0.0%) | 18 (100.0%) |
| Mobile Home / Other | 0 (0.0%) | 0 (0.0%) |
| Total | 73 (54.5%) | 61 (45.5%) |
Housing Structures by Number of Rooms in Readsboro
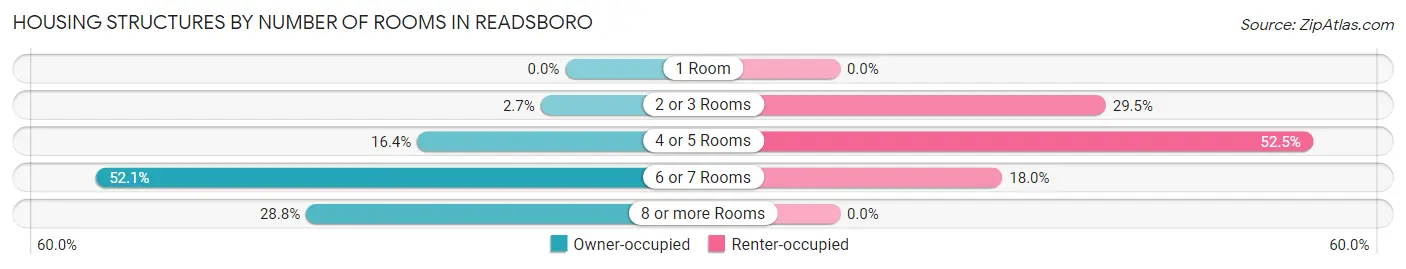
| Number of Rooms | Owner-occupied | Renter-occupied |
| 1 Room | 0 (0.0%) | 0 (0.0%) |
| 2 or 3 Rooms | 2 (2.7%) | 18 (29.5%) |
| 4 or 5 Rooms | 12 (16.4%) | 32 (52.5%) |
| 6 or 7 Rooms | 38 (52.0%) | 11 (18.0%) |
| 8 or more Rooms | 21 (28.8%) | 0 (0.0%) |
| Total | 73 (100.0%) | 61 (100.0%) |
Housing Structure by Heating Type in Readsboro
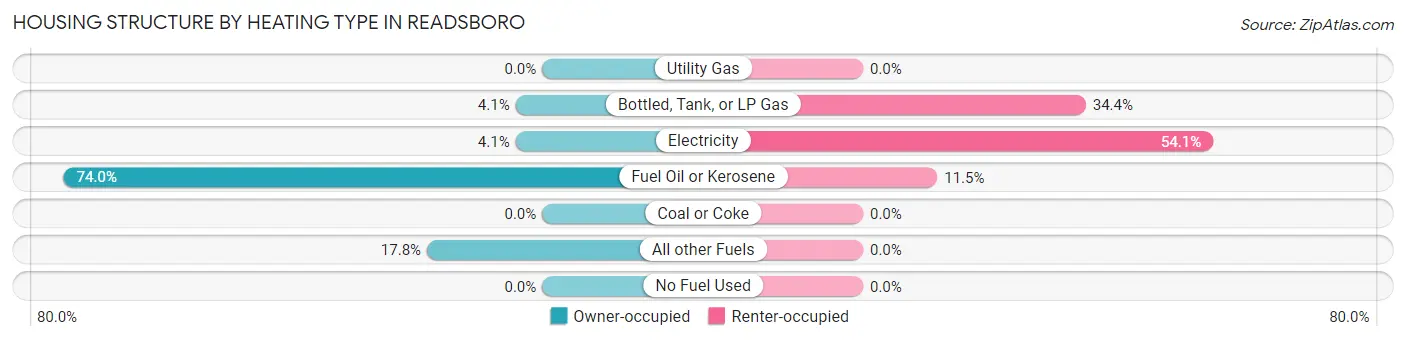
| Heating Type | Owner-occupied | Renter-occupied |
| Utility Gas | 0 (0.0%) | 0 (0.0%) |
| Bottled, Tank, or LP Gas | 3 (4.1%) | 21 (34.4%) |
| Electricity | 3 (4.1%) | 33 (54.1%) |
| Fuel Oil or Kerosene | 54 (74.0%) | 7 (11.5%) |
| Coal or Coke | 0 (0.0%) | 0 (0.0%) |
| All other Fuels | 13 (17.8%) | 0 (0.0%) |
| No Fuel Used | 0 (0.0%) | 0 (0.0%) |
| Total | 73 (100.0%) | 61 (100.0%) |
Household Vehicle Usage in Readsboro
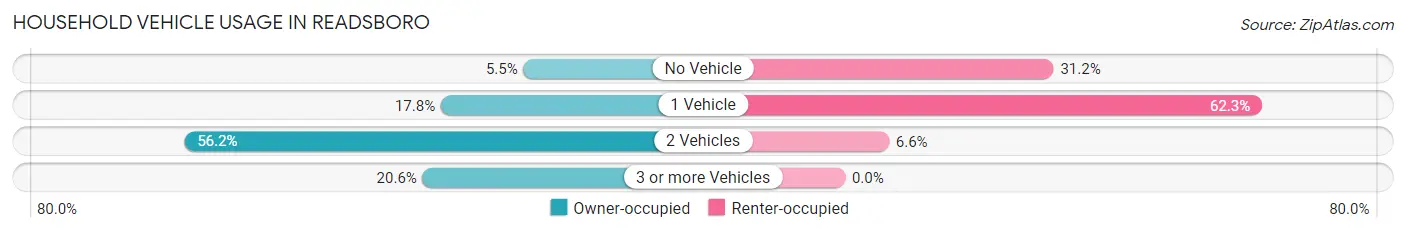
| Vehicles per Household | Owner-occupied | Renter-occupied |
| No Vehicle | 4 (5.5%) | 19 (31.1%) |
| 1 Vehicle | 13 (17.8%) | 38 (62.3%) |
| 2 Vehicles | 41 (56.2%) | 4 (6.6%) |
| 3 or more Vehicles | 15 (20.5%) | 0 (0.0%) |
| Total | 73 (100.0%) | 61 (100.0%) |
Real Estate & Mortgages in Readsboro
Real Estate and Mortgage Overview in Readsboro
| Characteristic | Without Mortgage | With Mortgage |
| Housing Units | 51 | 22 |
| Median Property Value | - | - |
| Median Household Income | $74,583 | $3 |
| Monthly Housing Costs | $662 | $0 |
| Real Estate Taxes | $2,641 | $0 |
Property Value by Mortgage Status in Readsboro
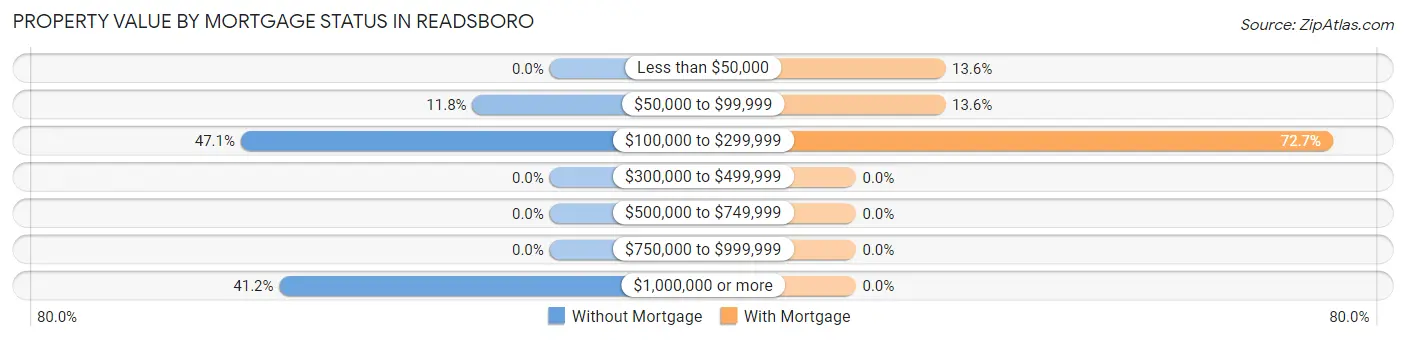
| Property Value | Without Mortgage | With Mortgage |
| Less than $50,000 | 0 (0.0%) | 3 (13.6%) |
| $50,000 to $99,999 | 6 (11.8%) | 3 (13.6%) |
| $100,000 to $299,999 | 24 (47.1%) | 16 (72.7%) |
| $300,000 to $499,999 | 0 (0.0%) | 0 (0.0%) |
| $500,000 to $749,999 | 0 (0.0%) | 0 (0.0%) |
| $750,000 to $999,999 | 0 (0.0%) | 0 (0.0%) |
| $1,000,000 or more | 21 (41.2%) | 0 (0.0%) |
| Total | 51 (100.0%) | 22 (100.0%) |
Household Income by Mortgage Status in Readsboro
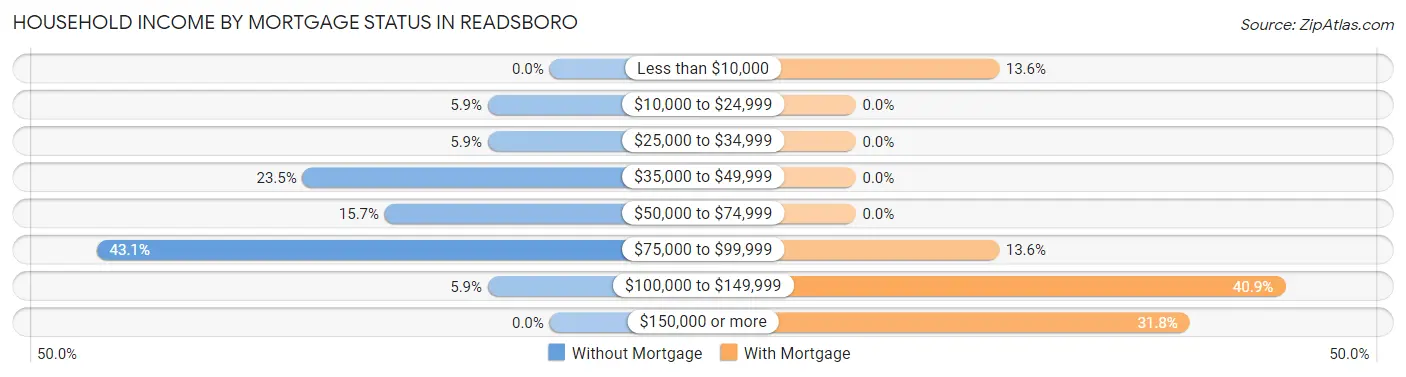
| Household Income | Without Mortgage | With Mortgage |
| Less than $10,000 | 0 (0.0%) | 3 (13.6%) |
| $10,000 to $24,999 | 3 (5.9%) | 0 (0.0%) |
| $25,000 to $34,999 | 3 (5.9%) | 0 (0.0%) |
| $35,000 to $49,999 | 12 (23.5%) | 0 (0.0%) |
| $50,000 to $74,999 | 8 (15.7%) | 0 (0.0%) |
| $75,000 to $99,999 | 22 (43.1%) | 3 (13.6%) |
| $100,000 to $149,999 | 3 (5.9%) | 9 (40.9%) |
| $150,000 or more | 0 (0.0%) | 7 (31.8%) |
| Total | 51 (100.0%) | 22 (100.0%) |
Property Value to Household Income Ratio in Readsboro
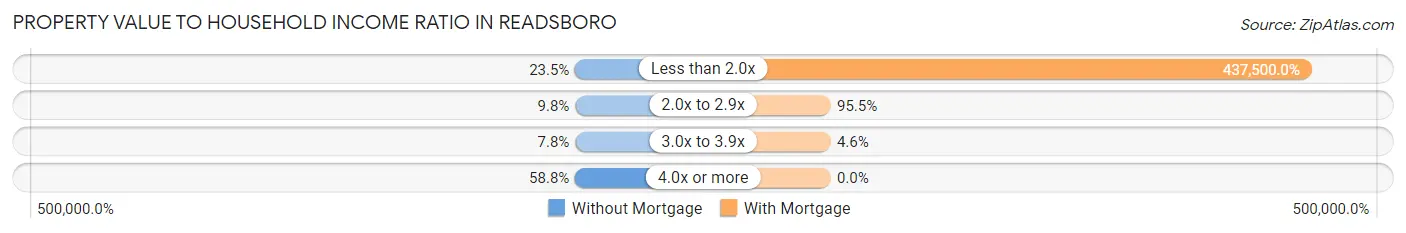
| Value-to-Income Ratio | Without Mortgage | With Mortgage |
| Less than 2.0x | 12 (23.5%) | 96,250 (437,500.0%) |
| 2.0x to 2.9x | 5 (9.8%) | 21 (95.5%) |
| 3.0x to 3.9x | 4 (7.8%) | 1 (4.5%) |
| 4.0x or more | 30 (58.8%) | 0 (0.0%) |
| Total | 51 (100.0%) | 22 (100.0%) |
Real Estate Taxes by Mortgage Status in Readsboro
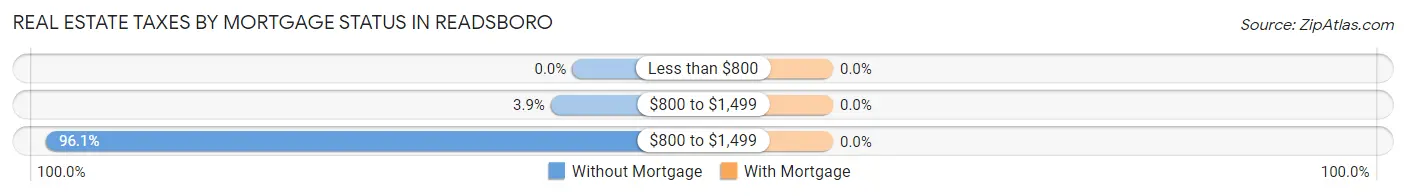
| Property Taxes | Without Mortgage | With Mortgage |
| Less than $800 | 0 (0.0%) | 0 (0.0%) |
| $800 to $1,499 | 2 (3.9%) | 0 (0.0%) |
| $800 to $1,499 | 49 (96.1%) | 0 (0.0%) |
| Total | 51 (100.0%) | 22 (100.0%) |
Health & Disability in Readsboro
Health Insurance Coverage by Age in Readsboro
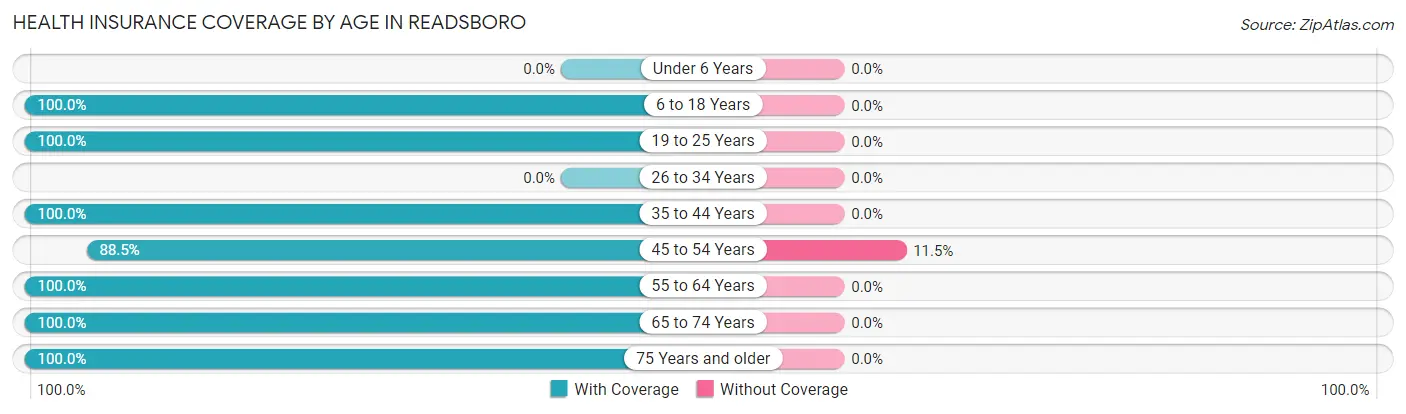
| Age Bracket | With Coverage | Without Coverage |
| Under 6 Years | 0 (0.0%) | 0 (0.0%) |
| 6 to 18 Years | 4 (100.0%) | 0 (0.0%) |
| 19 to 25 Years | 114 (100.0%) | 0 (0.0%) |
| 26 to 34 Years | 0 (0.0%) | 0 (0.0%) |
| 35 to 44 Years | 8 (100.0%) | 0 (0.0%) |
| 45 to 54 Years | 23 (88.5%) | 3 (11.5%) |
| 55 to 64 Years | 57 (100.0%) | 0 (0.0%) |
| 65 to 74 Years | 53 (100.0%) | 0 (0.0%) |
| 75 Years and older | 22 (100.0%) | 0 (0.0%) |
| Total | 281 (98.9%) | 3 (1.1%) |
Health Insurance Coverage by Citizenship Status in Readsboro
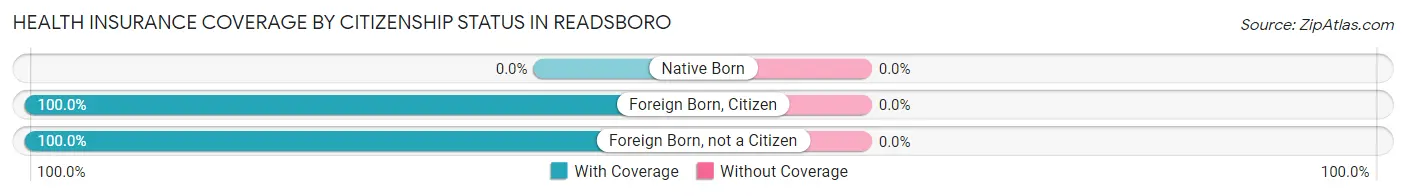
| Citizenship Status | With Coverage | Without Coverage |
| Native Born | 0 (0.0%) | 0 (0.0%) |
| Foreign Born, Citizen | 4 (100.0%) | 0 (0.0%) |
| Foreign Born, not a Citizen | 114 (100.0%) | 0 (0.0%) |
Health Insurance Coverage by Household Income in Readsboro
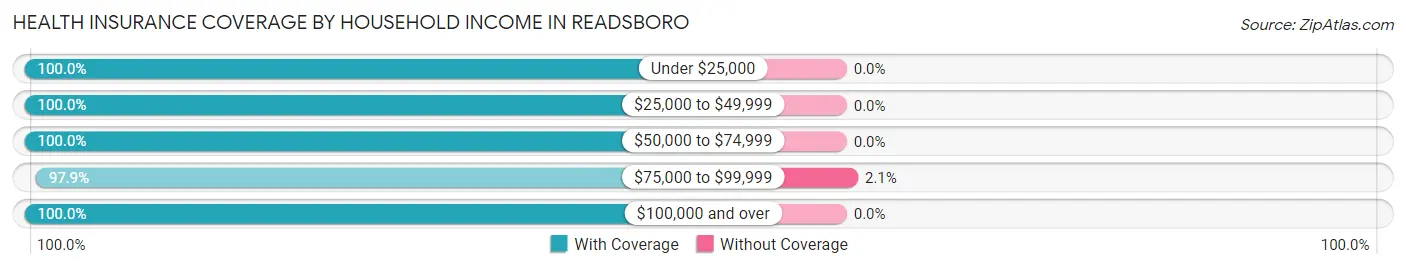
| Household Income | With Coverage | Without Coverage |
| Under $25,000 | 26 (100.0%) | 0 (0.0%) |
| $25,000 to $49,999 | 57 (100.0%) | 0 (0.0%) |
| $50,000 to $74,999 | 22 (100.0%) | 0 (0.0%) |
| $75,000 to $99,999 | 139 (97.9%) | 3 (2.1%) |
| $100,000 and over | 37 (100.0%) | 0 (0.0%) |
Public vs Private Health Insurance Coverage by Age in Readsboro
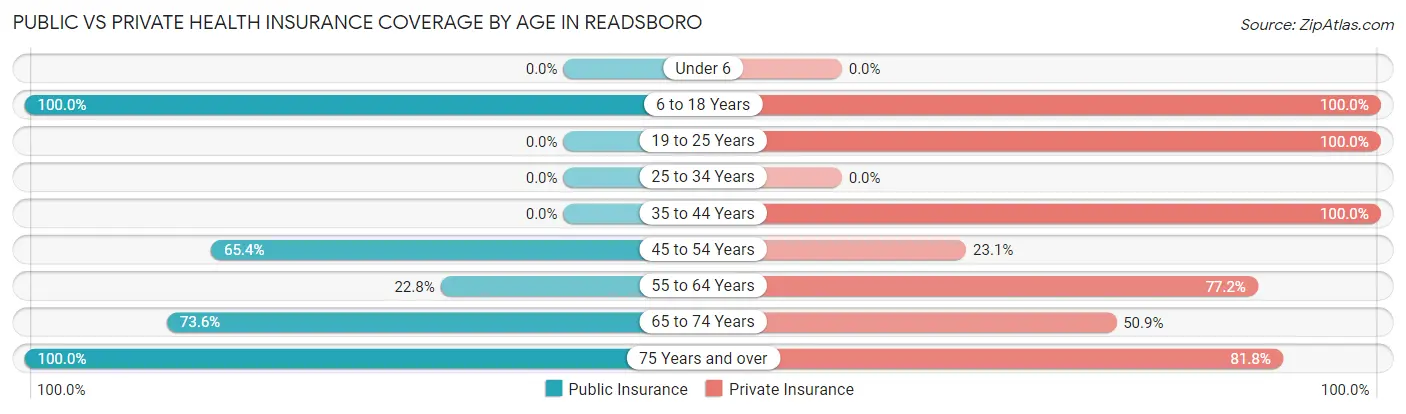
| Age Bracket | Public Insurance | Private Insurance |
| Under 6 | 0 (0.0%) | 0 (0.0%) |
| 6 to 18 Years | 4 (100.0%) | 4 (100.0%) |
| 19 to 25 Years | 0 (0.0%) | 114 (100.0%) |
| 25 to 34 Years | 0 (0.0%) | 0 (0.0%) |
| 35 to 44 Years | 0 (0.0%) | 8 (100.0%) |
| 45 to 54 Years | 17 (65.4%) | 6 (23.1%) |
| 55 to 64 Years | 13 (22.8%) | 44 (77.2%) |
| 65 to 74 Years | 39 (73.6%) | 27 (50.9%) |
| 75 Years and over | 22 (100.0%) | 18 (81.8%) |
| Total | 95 (33.5%) | 221 (77.8%) |
Disability Status by Sex by Age in Readsboro
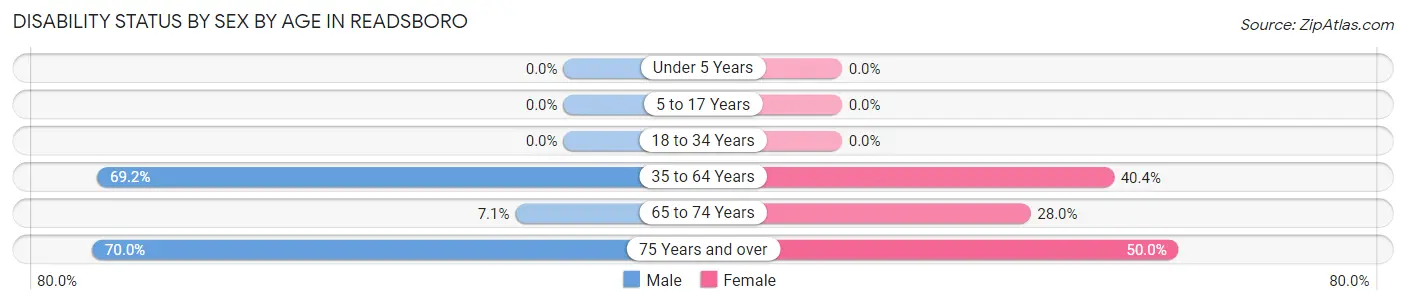
| Age Bracket | Male | Female |
| Under 5 Years | 0 (0.0%) | 0 (0.0%) |
| 5 to 17 Years | 0 (0.0%) | 0 (0.0%) |
| 18 to 34 Years | 0 (0.0%) | 0 (0.0%) |
| 35 to 64 Years | 27 (69.2%) | 21 (40.4%) |
| 65 to 74 Years | 2 (7.1%) | 7 (28.0%) |
| 75 Years and over | 7 (70.0%) | 6 (50.0%) |
Disability Class by Sex by Age in Readsboro
Disability Class: Hearing Difficulty
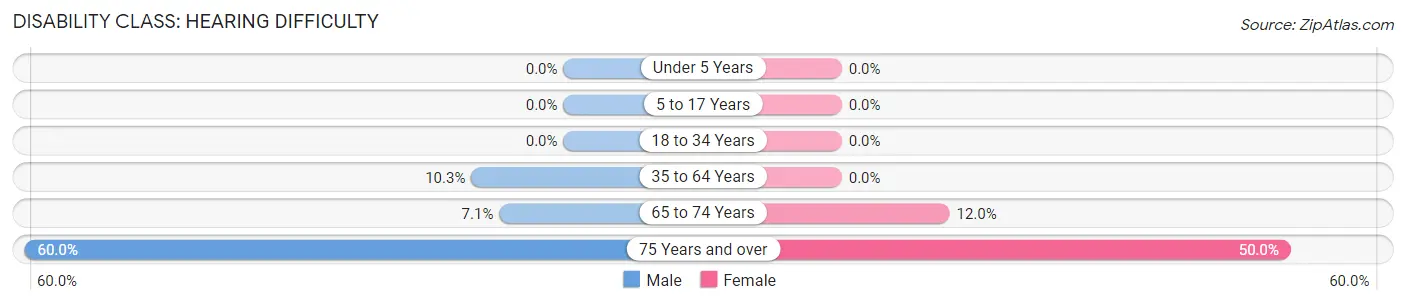
| Age Bracket | Male | Female |
| Under 5 Years | 0 (0.0%) | 0 (0.0%) |
| 5 to 17 Years | 0 (0.0%) | 0 (0.0%) |
| 18 to 34 Years | 0 (0.0%) | 0 (0.0%) |
| 35 to 64 Years | 4 (10.3%) | 0 (0.0%) |
| 65 to 74 Years | 2 (7.1%) | 3 (12.0%) |
| 75 Years and over | 6 (60.0%) | 6 (50.0%) |
Disability Class: Vision Difficulty
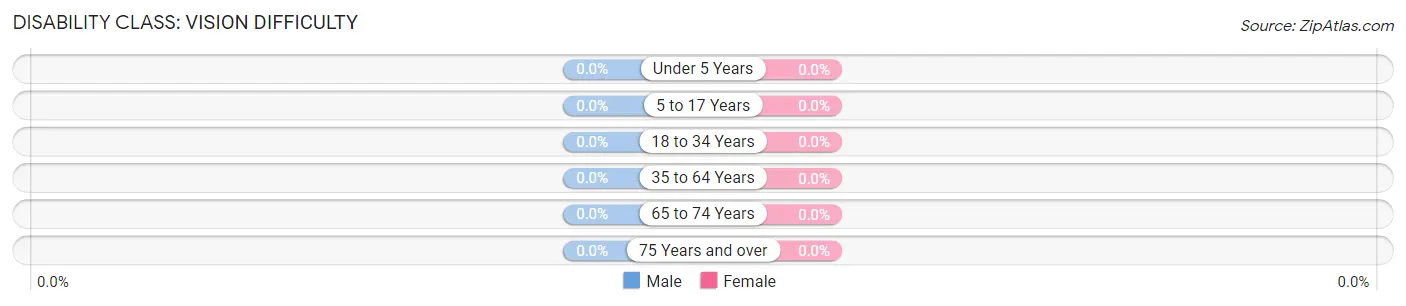
| Age Bracket | Male | Female |
| Under 5 Years | 0 (0.0%) | 0 (0.0%) |
| 5 to 17 Years | 0 (0.0%) | 0 (0.0%) |
| 18 to 34 Years | 0 (0.0%) | 0 (0.0%) |
| 35 to 64 Years | 0 (0.0%) | 0 (0.0%) |
| 65 to 74 Years | 0 (0.0%) | 0 (0.0%) |
| 75 Years and over | 0 (0.0%) | 0 (0.0%) |
Disability Class: Cognitive Difficulty
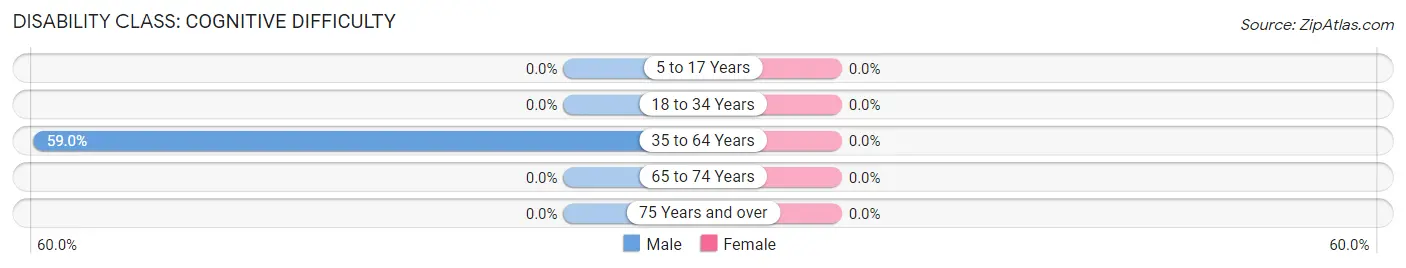
| Age Bracket | Male | Female |
| 5 to 17 Years | 0 (0.0%) | 0 (0.0%) |
| 18 to 34 Years | 0 (0.0%) | 0 (0.0%) |
| 35 to 64 Years | 23 (59.0%) | 0 (0.0%) |
| 65 to 74 Years | 0 (0.0%) | 0 (0.0%) |
| 75 Years and over | 0 (0.0%) | 0 (0.0%) |
Disability Class: Ambulatory Difficulty
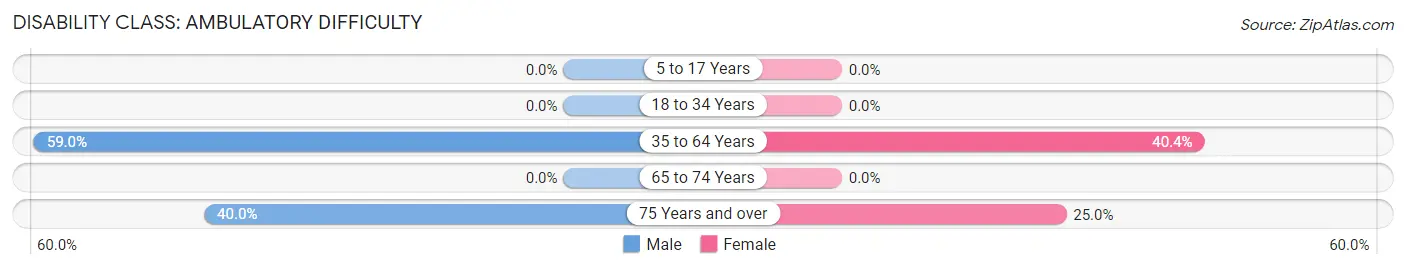
| Age Bracket | Male | Female |
| 5 to 17 Years | 0 (0.0%) | 0 (0.0%) |
| 18 to 34 Years | 0 (0.0%) | 0 (0.0%) |
| 35 to 64 Years | 23 (59.0%) | 21 (40.4%) |
| 65 to 74 Years | 0 (0.0%) | 0 (0.0%) |
| 75 Years and over | 4 (40.0%) | 3 (25.0%) |
Disability Class: Self-Care Difficulty
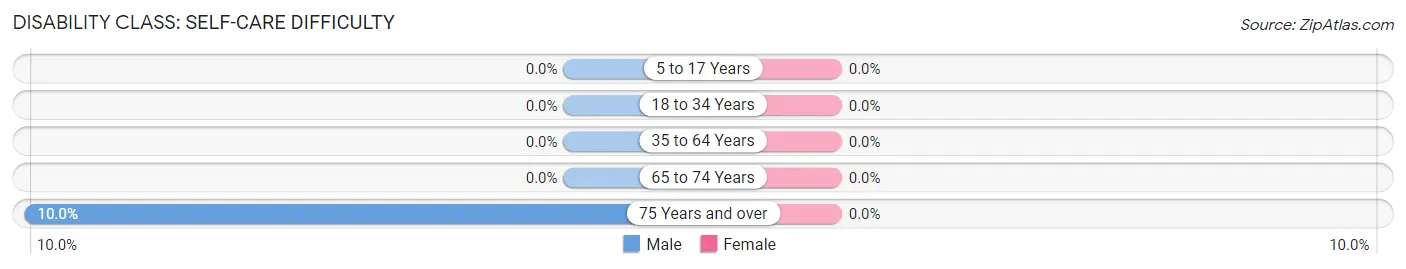
| Age Bracket | Male | Female |
| 5 to 17 Years | 0 (0.0%) | 0 (0.0%) |
| 18 to 34 Years | 0 (0.0%) | 0 (0.0%) |
| 35 to 64 Years | 0 (0.0%) | 0 (0.0%) |
| 65 to 74 Years | 0 (0.0%) | 0 (0.0%) |
| 75 Years and over | 1 (10.0%) | 0 (0.0%) |
Technology Access in Readsboro
Computing Device Access in Readsboro
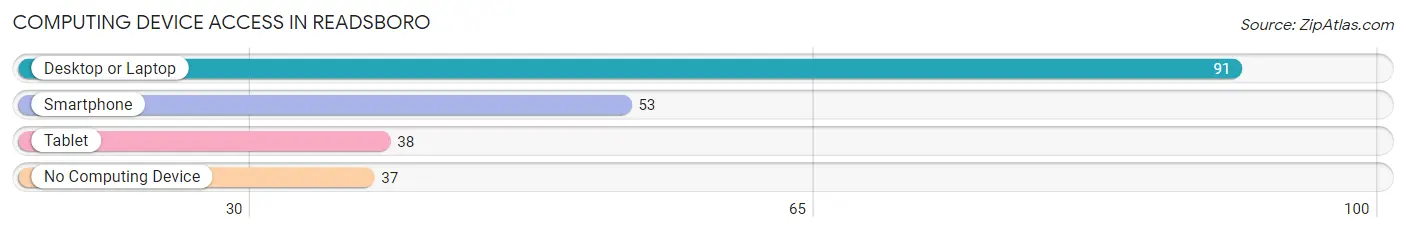
| Device Type | # Households | % Households |
| Desktop or Laptop | 91 | 67.9% |
| Smartphone | 53 | 39.6% |
| Tablet | 38 | 28.4% |
| No Computing Device | 37 | 27.6% |
| Total | 134 | 100.0% |
Internet Access in Readsboro
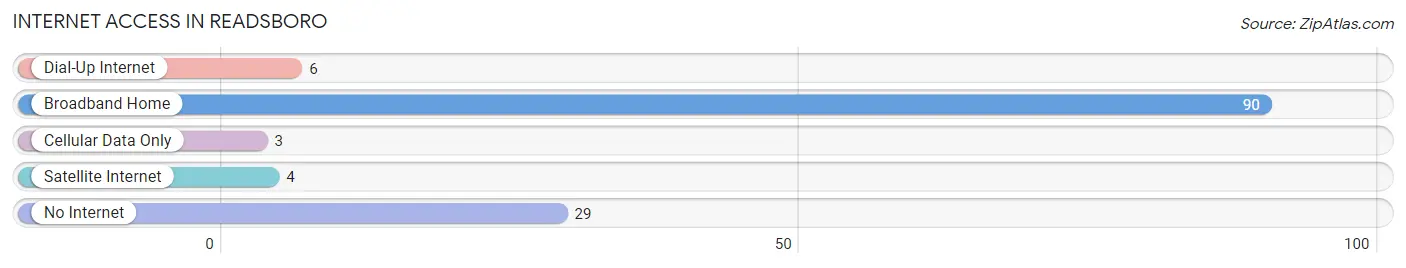
| Internet Type | # Households | % Households |
| Dial-Up Internet | 6 | 4.5% |
| Broadband Home | 90 | 67.2% |
| Cellular Data Only | 3 | 2.2% |
| Satellite Internet | 4 | 3.0% |
| No Internet | 29 | 21.6% |
| Total | 134 | 100.0% |
Readsboro Summary
Readsboro is a small town located in the southwestern corner of Vermont, in Bennington County. It is situated in the Green Mountains, and is bordered by the towns of Searsburg, Whitingham, and Stamford. The town has a population of approximately 590 people, and covers an area of about 11.5 square miles.
History
Readsboro was first settled in 1780 by a group of settlers from Massachusetts. The town was named after the Read family, who were among the first settlers. The town was incorporated in 1782, and the first town meeting was held in 1783.
In the early 19th century, Readsboro was a thriving agricultural community. The town was home to several sawmills, gristmills, and a tannery. The town also had a thriving lumber industry, and was home to several sawmills.
In the late 19th century, the town began to decline as the lumber industry declined. The town was also affected by the Great Depression, and many of the town’s businesses closed.
In the late 20th century, the town began to experience a resurgence. The town was home to several small businesses, and the town’s population began to grow.
Geography
Readsboro is located in the southwestern corner of Vermont, in Bennington County. The town is situated in the Green Mountains, and is bordered by the towns of Searsburg, Whitingham, and Stamford. The town is located at the intersection of Vermont Route 100 and Vermont Route 8.
The town is located in a mountainous region, and is home to several small mountains, including Mount Readsboro, which is the highest point in the town. The town is also home to several small streams, including the Deerfield River, which flows through the town.
Economy
The economy of Readsboro is largely based on tourism. The town is home to several small businesses, including restaurants, shops, and lodging. The town is also home to several small farms, and is a popular destination for outdoor recreation.
The town is also home to several small manufacturing businesses, including a furniture factory and a woodworking shop. The town is also home to several small businesses, including a grocery store, a hardware store, and a gas station.
Demographics
As of the 2010 census, the population of Readsboro was 590 people. The town has a population density of 52.2 people per square mile. The median age of the population is 44.7 years, and the median household income is $41,250.
The town is predominantly white, with 95.3% of the population identifying as white. The town is also home to a small Hispanic population, with 4.7% of the population identifying as Hispanic or Latino.
The town is home to several churches, including the Readsboro United Methodist Church, the Readsboro Baptist Church, and the Readsboro Congregational Church. The town is also home to a public library, and a post office.
Common Questions
What is Per Capita Income in Readsboro?
Per Capita income in Readsboro is $37,779.
What is the Median Family Income in Readsboro?
Median Family Income in Readsboro is $54,345.
What is the Median Household income in Readsboro?
Median Household Income in Readsboro is $44,559.
What is Income or Wage Gap in Readsboro?
Income or Wage Gap in Readsboro is 55.2%.
Women in Readsboro earn 44.8 cents for every dollar earned by a man.
What is Inequality or Gini Index in Readsboro?
Inequality or Gini Index in Readsboro is 0.50.
What is the Total Population of Readsboro?
Total Population of Readsboro is 284.
What is the Total Male Population of Readsboro?
Total Male Population of Readsboro is 84.
What is the Total Female Population of Readsboro?
Total Female Population of Readsboro is 200.
What is the Ratio of Males per 100 Females in Readsboro?
There are 42.00 Males per 100 Females in Readsboro.
What is the Ratio of Females per 100 Males in Readsboro?
There are 238.10 Females per 100 Males in Readsboro.
What is the Median Population Age in Readsboro?
Median Population Age in Readsboro is 50.5 Years.
What is the Average Family Size in Readsboro
Average Family Size in Readsboro is 2.9 People.
What is the Average Household Size in Readsboro
Average Household Size in Readsboro is 2.1 People.
How Large is the Labor Force in Readsboro?
There are 189 People in the Labor Forcein in Readsboro.
What is the Percentage of People in the Labor Force in Readsboro?
66.5% of People are in the Labor Force in Readsboro.