Jefferson, OH Map & Demographics
Jefferson Map
Jefferson Overview
$33,180
PER CAPITA INCOME
$82,566
AVG FAMILY INCOME
$45,547
AVG HOUSEHOLD INCOME
31.3%
WAGE / INCOME GAP [ % ]
68.7¢/ $1
WAGE / INCOME GAP [ $ ]
0.47
INEQUALITY / GINI INDEX
3,319
TOTAL POPULATION
1,722
MALE POPULATION
1,597
FEMALE POPULATION
107.83
MALES / 100 FEMALES
92.74
FEMALES / 100 MALES
44.6
MEDIAN AGE
3.3
AVG FAMILY SIZE
2.0
AVG HOUSEHOLD SIZE
1,783
LABOR FORCE [ PEOPLE ]
61.9%
PERCENT IN LABOR FORCE
2.7%
UNEMPLOYMENT RATE
Jefferson Zip Codes
Jefferson Area Codes
Income in Jefferson
Income Overview in Jefferson
Per Capita Income in Jefferson is $33,180, while median incomes of families and households are $82,566 and $45,547 respectively.
| Characteristic | Number | Measure |
| Per Capita Income | 3,319 | $33,180 |
| Median Family Income | 576 | $82,566 |
| Mean Family Income | 576 | $102,030 |
| Median Household Income | 1,559 | $45,547 |
| Mean Household Income | 1,559 | $69,260 |
| Income Deficit | 576 | $0 |
| Wage / Income Gap (%) | 3,319 | 31.27% |
| Wage / Income Gap ($) | 3,319 | 68.73¢ per $1 |
| Gini / Inequality Index | 3,319 | 0.47 |
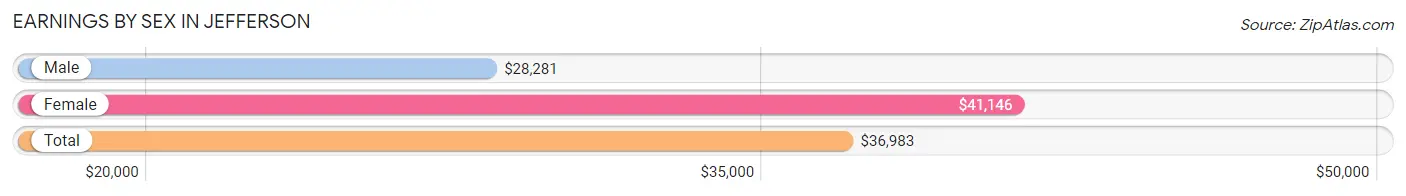
Earnings by Sex in Jefferson
Average Earnings in Jefferson are $36,983, $28,281 for men and $41,146 for women, a difference of 31.3%.
| Sex | Number | Average Earnings |
| Male | 1,148 (61.4%) | $28,281 |
| Female | 722 (38.6%) | $41,146 |
| Total | 1,870 (100.0%) | $36,983 |
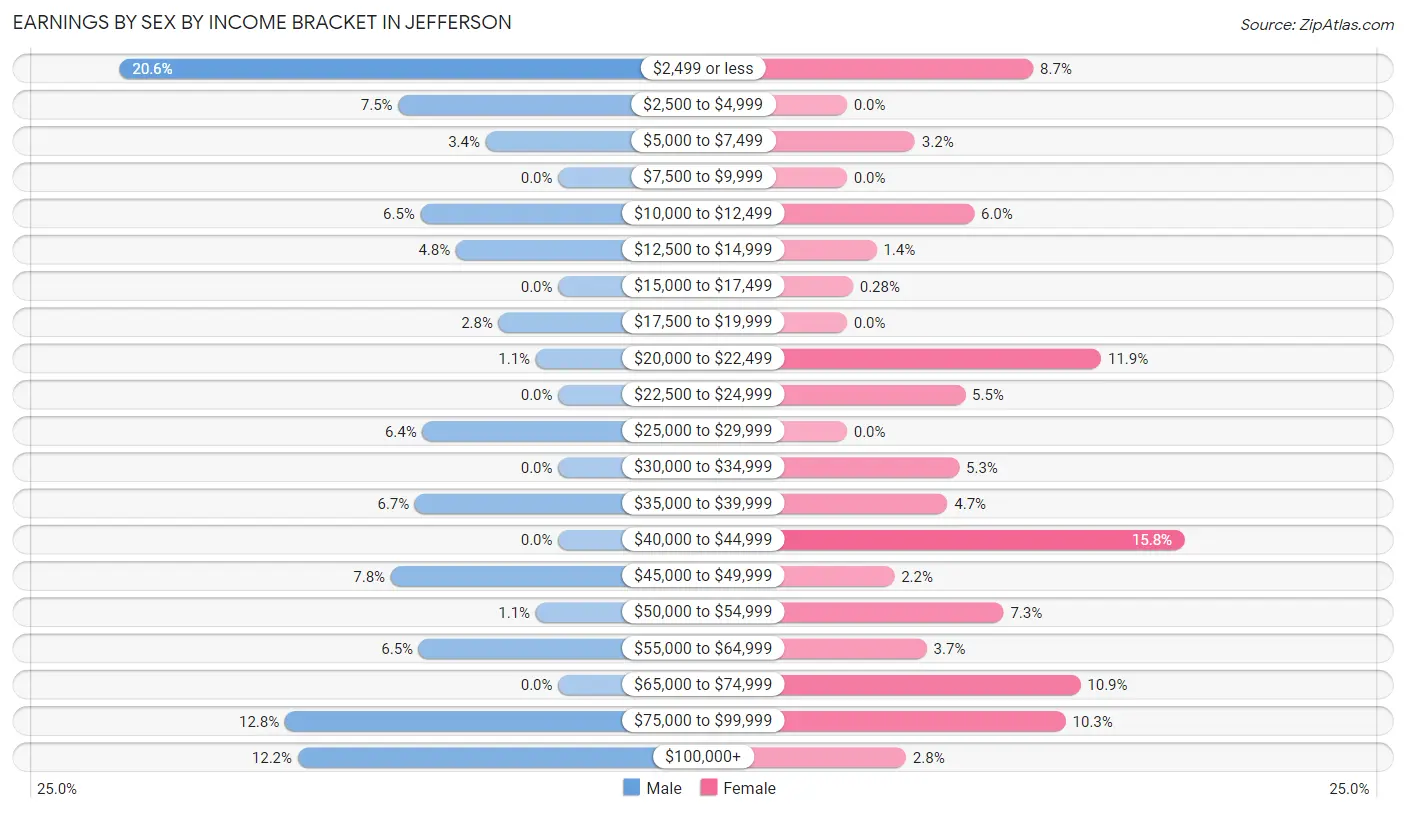
Earnings by Sex by Income Bracket in Jefferson
The most common earnings brackets in Jefferson are $2,499 or less for men (236 | 20.6%) and $40,000 to $44,999 for women (114 | 15.8%).
| Income | Male | Female |
| $2,499 or less | 236 (20.6%) | 63 (8.7%) |
| $2,500 to $4,999 | 86 (7.5%) | 0 (0.0%) |
| $5,000 to $7,499 | 39 (3.4%) | 23 (3.2%) |
| $7,500 to $9,999 | 0 (0.0%) | 0 (0.0%) |
| $10,000 to $12,499 | 74 (6.5%) | 43 (6.0%) |
| $12,500 to $14,999 | 55 (4.8%) | 10 (1.4%) |
| $15,000 to $17,499 | 0 (0.0%) | 2 (0.3%) |
| $17,500 to $19,999 | 32 (2.8%) | 0 (0.0%) |
| $20,000 to $22,499 | 12 (1.1%) | 86 (11.9%) |
| $22,500 to $24,999 | 0 (0.0%) | 40 (5.5%) |
| $25,000 to $29,999 | 73 (6.4%) | 0 (0.0%) |
| $30,000 to $34,999 | 0 (0.0%) | 38 (5.3%) |
| $35,000 to $39,999 | 77 (6.7%) | 34 (4.7%) |
| $40,000 to $44,999 | 0 (0.0%) | 114 (15.8%) |
| $45,000 to $49,999 | 90 (7.8%) | 16 (2.2%) |
| $50,000 to $54,999 | 12 (1.1%) | 53 (7.3%) |
| $55,000 to $64,999 | 75 (6.5%) | 27 (3.7%) |
| $65,000 to $74,999 | 0 (0.0%) | 79 (10.9%) |
| $75,000 to $99,999 | 147 (12.8%) | 74 (10.2%) |
| $100,000+ | 140 (12.2%) | 20 (2.8%) |
| Total | 1,148 (100.0%) | 722 (100.0%) |
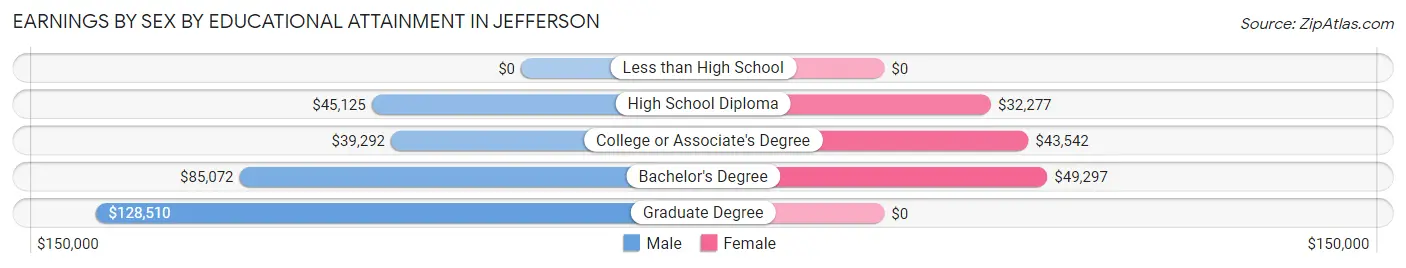
Earnings by Sex by Educational Attainment in Jefferson
Average earnings in Jefferson are $60,457 for men and $43,314 for women, a difference of 28.4%. Men with an educational attainment of graduate degree enjoy the highest average annual earnings of $128,510, while those with college or associate's degree education earn the least with $39,292. Women with an educational attainment of bachelor's degree earn the most with the average annual earnings of $49,297, while those with high school diploma education have the smallest earnings of $32,277.
| Educational Attainment | Male Income | Female Income |
| Less than High School | - | - |
| High School Diploma | $45,125 | $32,277 |
| College or Associate's Degree | $39,292 | $43,542 |
| Bachelor's Degree | $85,072 | $49,297 |
| Graduate Degree | $128,510 | $0 |
| Total | $60,457 | $43,314 |
Family Income in Jefferson
Family Income Brackets in Jefferson
According to the Jefferson family income data, there are 166 families falling into the $75,000 to $99,999 income range, which is the most common income bracket and makes up 28.8% of all families. Conversely, the $25,000 to $34,999 income bracket is the least frequent group with only 2 families (0.4%) belonging to this category.
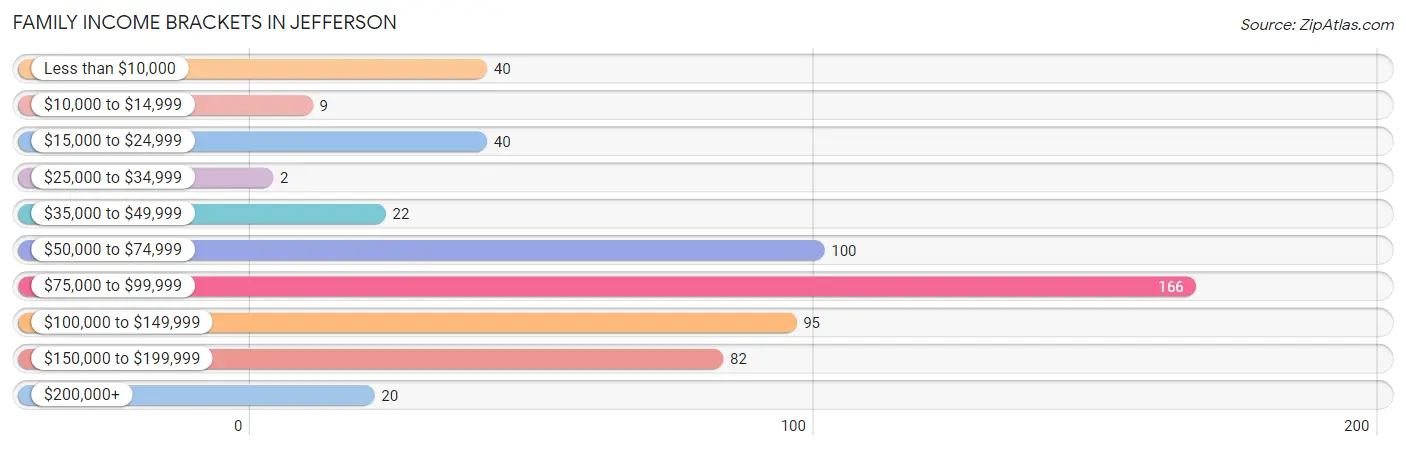
| Income Bracket | # Families | % Families |
| Less than $10,000 | 40 | 6.9% |
| $10,000 to $14,999 | 9 | 1.6% |
| $15,000 to $24,999 | 40 | 6.9% |
| $25,000 to $34,999 | 2 | 0.3% |
| $35,000 to $49,999 | 22 | 3.8% |
| $50,000 to $74,999 | 100 | 17.4% |
| $75,000 to $99,999 | 166 | 28.8% |
| $100,000 to $149,999 | 95 | 16.5% |
| $150,000 to $199,999 | 82 | 14.2% |
| $200,000+ | 20 | 3.5% |
Family Income by Famaliy Size in Jefferson
2-person families (376 | 65.3%) account for the highest median family income in Jefferson with $82,358 per family, while 2-person families (376 | 65.3%) have the highest median income of $41,179 per family member.
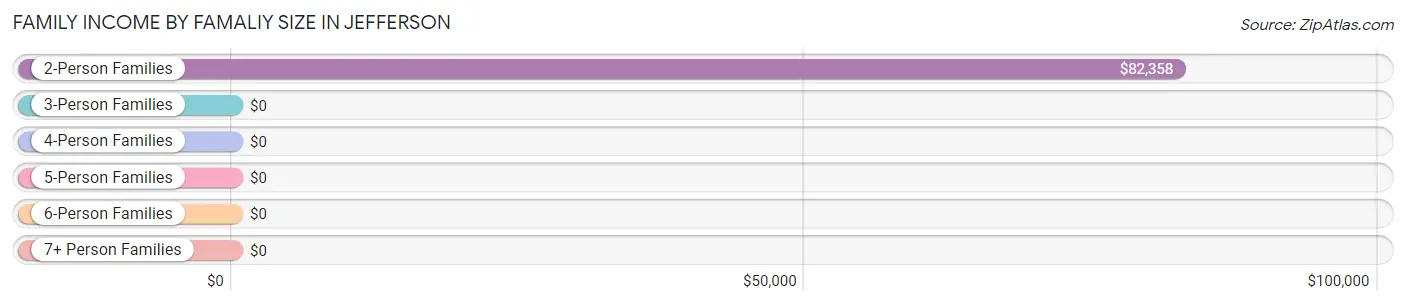
| Income Bracket | # Families | Median Income |
| 2-Person Families | 376 (65.3%) | $82,358 |
| 3-Person Families | 13 (2.3%) | $0 |
| 4-Person Families | 104 (18.1%) | $0 |
| 5-Person Families | 0 (0.0%) | $0 |
| 6-Person Families | 56 (9.7%) | $0 |
| 7+ Person Families | 27 (4.7%) | $0 |
| Total | 576 (100.0%) | $82,566 |
Family Income by Number of Earners in Jefferson
The median family income in Jefferson is $82,566, with families comprising 3+ earners (110) having the highest median family income of $156,154, while families with no earners (66) have the lowest median family income of $49,318, accounting for 19.1% and 11.5% of families, respectively.
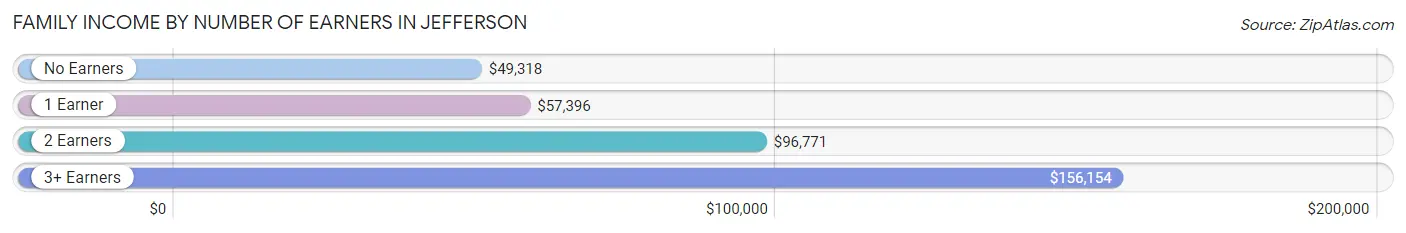
| Number of Earners | # Families | Median Income |
| No Earners | 66 (11.5%) | $49,318 |
| 1 Earner | 249 (43.2%) | $57,396 |
| 2 Earners | 151 (26.2%) | $96,771 |
| 3+ Earners | 110 (19.1%) | $156,154 |
| Total | 576 (100.0%) | $82,566 |
Household Income in Jefferson
Household Income Brackets in Jefferson
With 288 households falling in the category, the $15,000 to $24,999 income range is the most frequent in Jefferson, accounting for 18.5% of all households. In contrast, only 45 households (2.9%) fall into the $200,000+ income bracket, making it the least populous group.
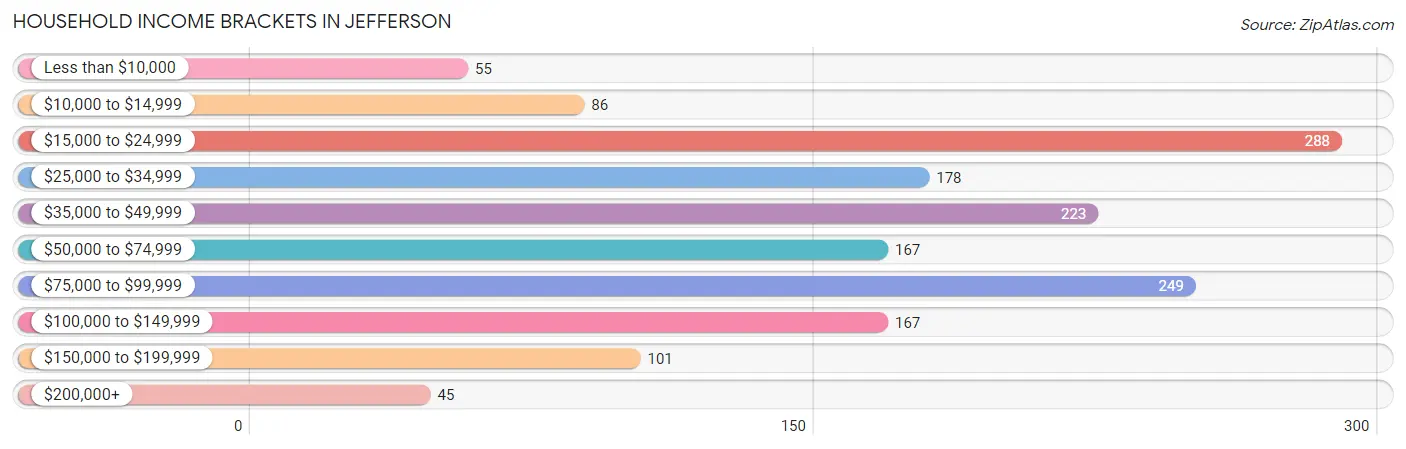
| Income Bracket | # Households | % Households |
| Less than $10,000 | 55 | 3.5% |
| $10,000 to $14,999 | 86 | 5.5% |
| $15,000 to $24,999 | 288 | 18.5% |
| $25,000 to $34,999 | 178 | 11.4% |
| $35,000 to $49,999 | 223 | 14.3% |
| $50,000 to $74,999 | 167 | 10.7% |
| $75,000 to $99,999 | 249 | 16.0% |
| $100,000 to $149,999 | 167 | 10.7% |
| $150,000 to $199,999 | 101 | 6.5% |
| $200,000+ | 45 | 2.9% |
Household Income by Householder Age in Jefferson
The median household income in Jefferson is $45,547, with the highest median household income of $100,463 found in the 25 to 44 years age bracket for the primary householder. A total of 288 households (18.5%) fall into this category. Meanwhile, the 15 to 24 years age bracket for the primary householder has the lowest median household income of $0, with 58 households (3.7%) in this group.
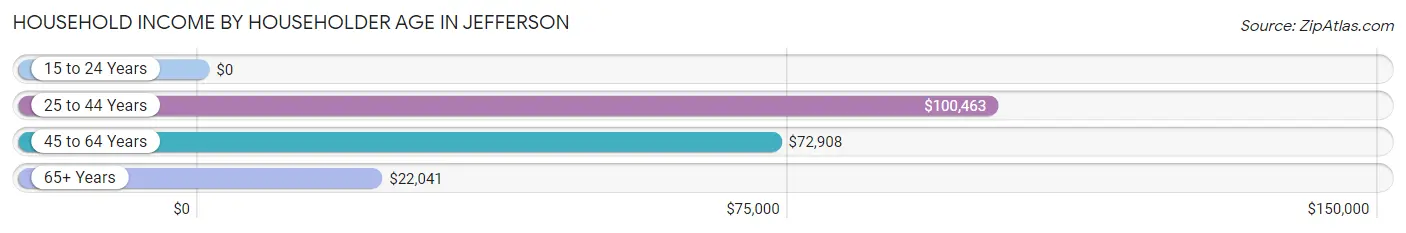
| Income Bracket | # Households | Median Income |
| 15 to 24 Years | 58 (3.7%) | $0 |
| 25 to 44 Years | 288 (18.5%) | $100,463 |
| 45 to 64 Years | 624 (40.0%) | $72,908 |
| 65+ Years | 589 (37.8%) | $22,041 |
| Total | 1,559 (100.0%) | $45,547 |
Poverty in Jefferson
Income Below Poverty by Sex and Age in Jefferson
With 22.4% poverty level for males and 13.5% for females among the residents of Jefferson, 18 to 24 year old males and 5 year old females are the most vulnerable to poverty, with 173 males (66.5%) and 19 females (100.0%) in their respective age groups living below the poverty level.
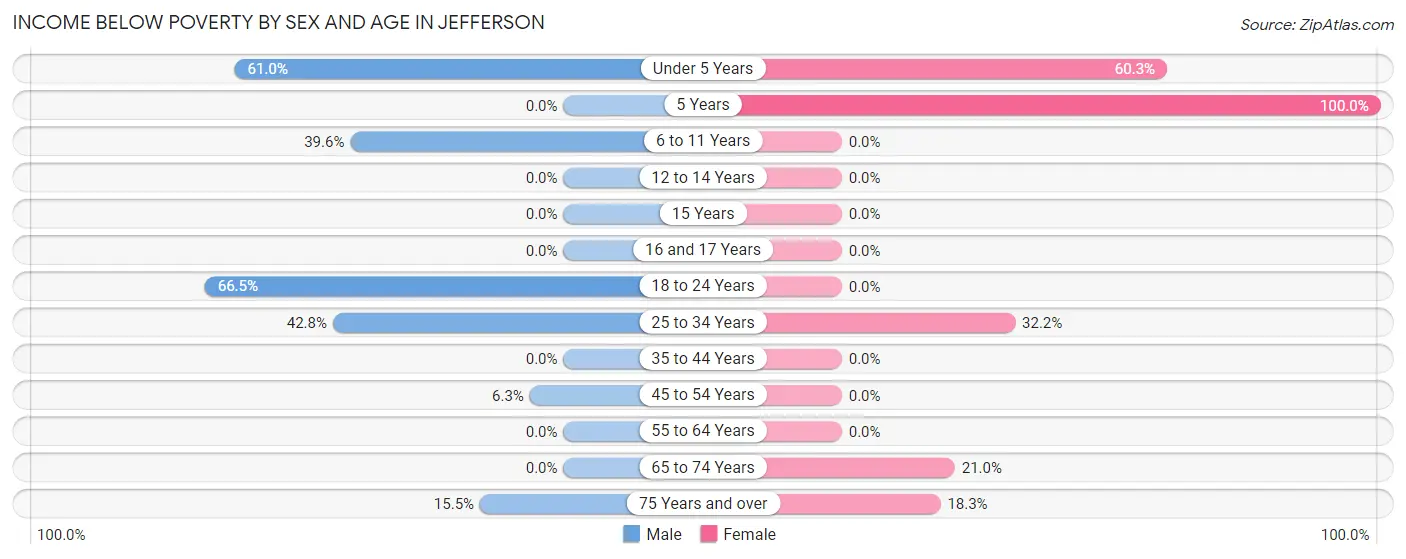
| Age Bracket | Male | Female |
| Under 5 Years | 36 (61.0%) | 35 (60.3%) |
| 5 Years | 0 (0.0%) | 19 (100.0%) |
| 6 to 11 Years | 36 (39.6%) | 0 (0.0%) |
| 12 to 14 Years | 0 (0.0%) | 0 (0.0%) |
| 15 Years | 0 (0.0%) | 0 (0.0%) |
| 16 and 17 Years | 0 (0.0%) | 0 (0.0%) |
| 18 to 24 Years | 173 (66.5%) | 0 (0.0%) |
| 25 to 34 Years | 98 (42.8%) | 37 (32.2%) |
| 35 to 44 Years | 0 (0.0%) | 0 (0.0%) |
| 45 to 54 Years | 15 (6.2%) | 0 (0.0%) |
| 55 to 64 Years | 0 (0.0%) | 0 (0.0%) |
| 65 to 74 Years | 0 (0.0%) | 65 (21.0%) |
| 75 Years and over | 11 (15.5%) | 54 (18.3%) |
| Total | 369 (22.4%) | 210 (13.5%) |
Income Above Poverty by Sex and Age in Jefferson
According to the poverty statistics in Jefferson, males aged 12 to 14 years and females aged 6 to 11 years are the age groups that are most secure financially, with 100.0% of males and 100.0% of females in these age groups living above the poverty line.
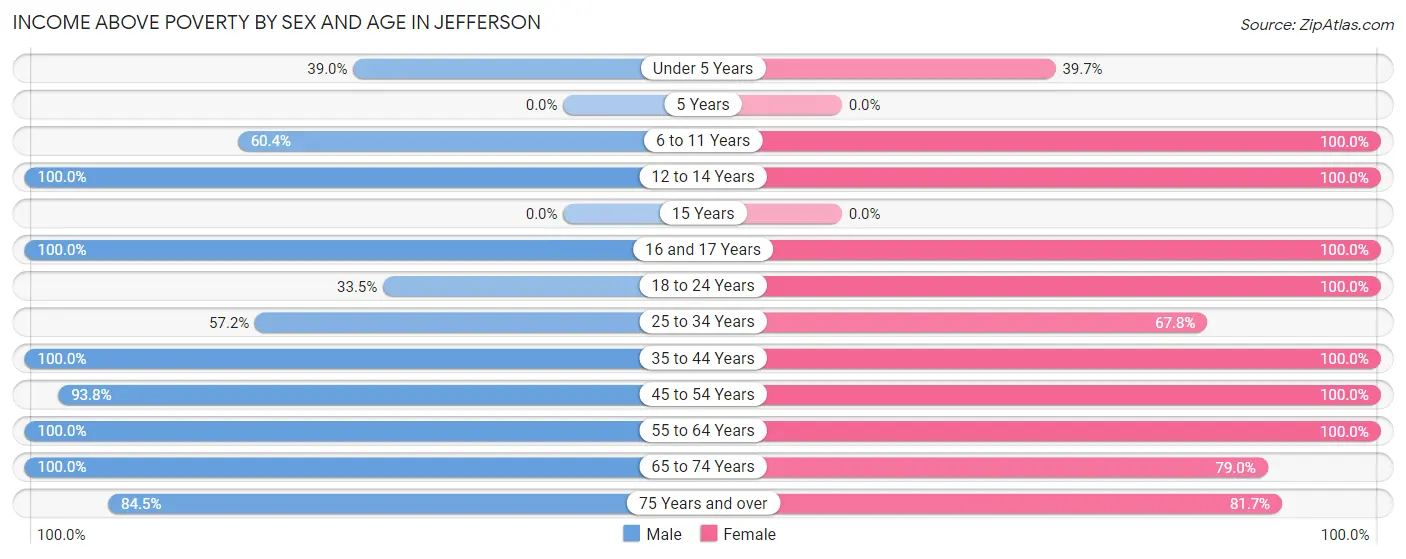
| Age Bracket | Male | Female |
| Under 5 Years | 23 (39.0%) | 23 (39.7%) |
| 5 Years | 0 (0.0%) | 0 (0.0%) |
| 6 to 11 Years | 55 (60.4%) | 14 (100.0%) |
| 12 to 14 Years | 125 (100.0%) | 72 (100.0%) |
| 15 Years | 0 (0.0%) | 0 (0.0%) |
| 16 and 17 Years | 214 (100.0%) | 27 (100.0%) |
| 18 to 24 Years | 87 (33.5%) | 68 (100.0%) |
| 25 to 34 Years | 131 (57.2%) | 78 (67.8%) |
| 35 to 44 Years | 169 (100.0%) | 110 (100.0%) |
| 45 to 54 Years | 225 (93.8%) | 91 (100.0%) |
| 55 to 64 Years | 97 (100.0%) | 375 (100.0%) |
| 65 to 74 Years | 95 (100.0%) | 245 (79.0%) |
| 75 Years and over | 60 (84.5%) | 241 (81.7%) |
| Total | 1,281 (77.6%) | 1,344 (86.5%) |
Income Below Poverty Among Married-Couple Families in Jefferson
The poverty statistics for married-couple families in Jefferson show that 8.9% or 39 of the total 440 families live below the poverty line. Families with 1 or 2 children have the highest poverty rate of 27.7%, comprising of 28 families. On the other hand, families with 3 or 4 children have the lowest poverty rate of 0.0%, which includes 0 families.
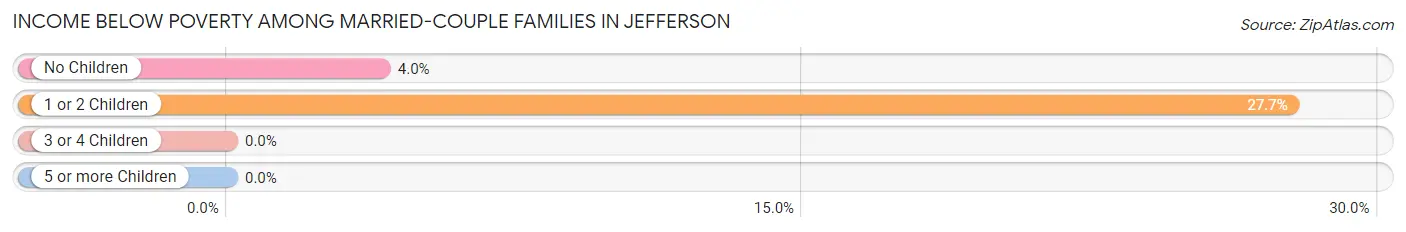
| Children | Above Poverty | Below Poverty |
| No Children | 265 (96.0%) | 11 (4.0%) |
| 1 or 2 Children | 73 (72.3%) | 28 (27.7%) |
| 3 or 4 Children | 63 (100.0%) | 0 (0.0%) |
| 5 or more Children | 0 (0.0%) | 0 (0.0%) |
| Total | 401 (91.1%) | 39 (8.9%) |
Income Below Poverty Among Single-Parent Households in Jefferson
According to the poverty data in Jefferson, 50.9% or 29 single-father households and 11.4% or 9 single-mother households are living below the poverty line. Among single-father households, those with 1 or 2 children have the highest poverty rate, with 29 households (50.9%) experiencing poverty. Likewise, among single-mother households, those with 1 or 2 children have the highest poverty rate, with 9 households (16.7%) falling below the poverty line.
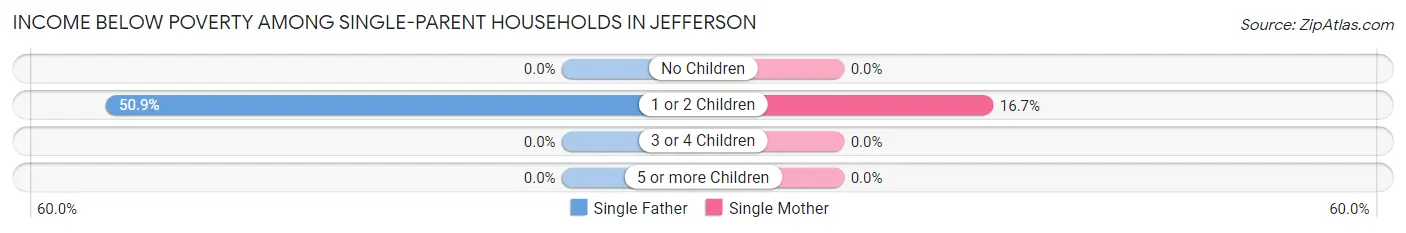
| Children | Single Father | Single Mother |
| No Children | 0 (0.0%) | 0 (0.0%) |
| 1 or 2 Children | 29 (50.9%) | 9 (16.7%) |
| 3 or 4 Children | 0 (0.0%) | 0 (0.0%) |
| 5 or more Children | 0 (0.0%) | 0 (0.0%) |
| Total | 29 (50.9%) | 9 (11.4%) |
Income Below Poverty Among Married-Couple vs Single-Parent Households in Jefferson
The poverty data for Jefferson shows that 39 of the married-couple family households (8.9%) and 38 of the single-parent households (27.9%) are living below the poverty level. Within the married-couple family households, those with 1 or 2 children have the highest poverty rate, with 28 households (27.7%) falling below the poverty line. Among the single-parent households, those with 1 or 2 children have the highest poverty rate, with 38 household (34.2%) living below poverty.
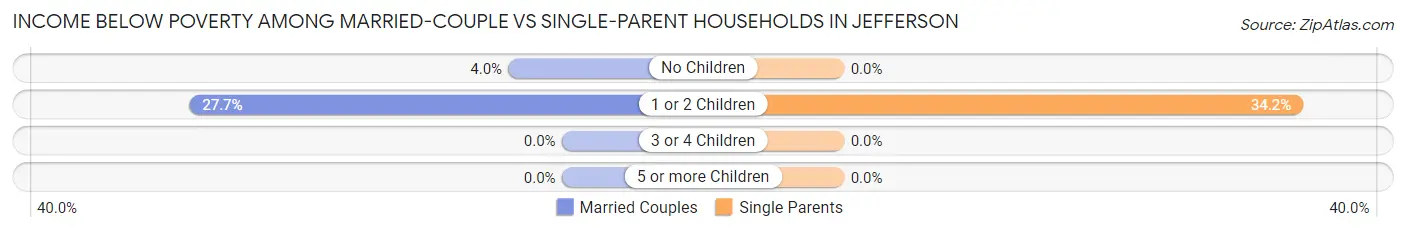
| Children | Married-Couple Families | Single-Parent Households |
| No Children | 11 (4.0%) | 0 (0.0%) |
| 1 or 2 Children | 28 (27.7%) | 38 (34.2%) |
| 3 or 4 Children | 0 (0.0%) | 0 (0.0%) |
| 5 or more Children | 0 (0.0%) | 0 (0.0%) |
| Total | 39 (8.9%) | 38 (27.9%) |
Race in Jefferson
The most populous races in Jefferson are White / Caucasian (3,108 | 93.6%), Hispanic or Latino (226 | 6.8%), and Two or more Races (92 | 2.8%).
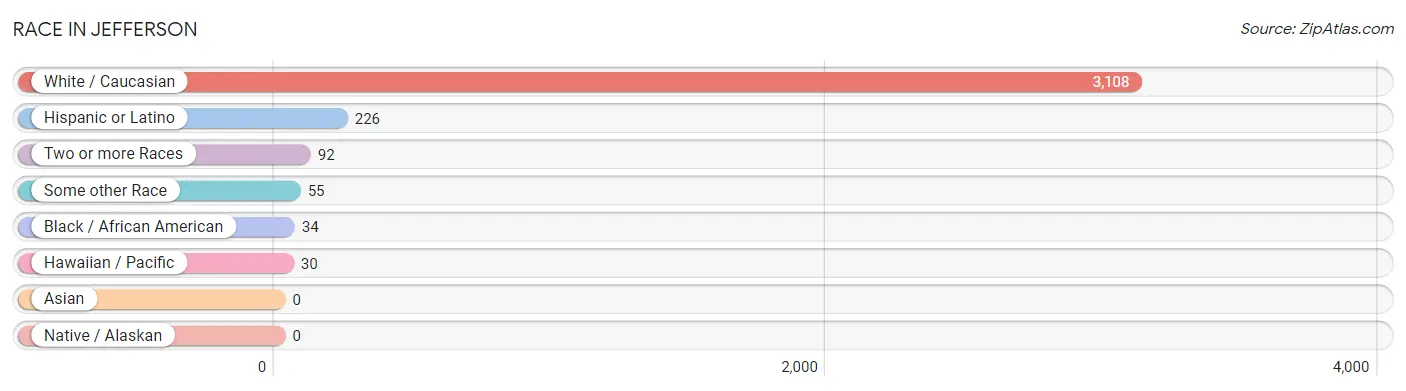
| Race | # Population | % Population |
| Asian | 0 | 0.0% |
| Black / African American | 34 | 1.0% |
| Hawaiian / Pacific | 30 | 0.9% |
| Hispanic or Latino | 226 | 6.8% |
| Native / Alaskan | 0 | 0.0% |
| White / Caucasian | 3,108 | 93.6% |
| Two or more Races | 92 | 2.8% |
| Some other Race | 55 | 1.7% |
| Total | 3,319 | 100.0% |
Ancestry in Jefferson
The most populous ancestries reported in Jefferson are German (970 | 29.2%), Irish (773 | 23.3%), English (481 | 14.5%), American (312 | 9.4%), and Italian (309 | 9.3%), together accounting for 85.7% of all Jefferson residents.
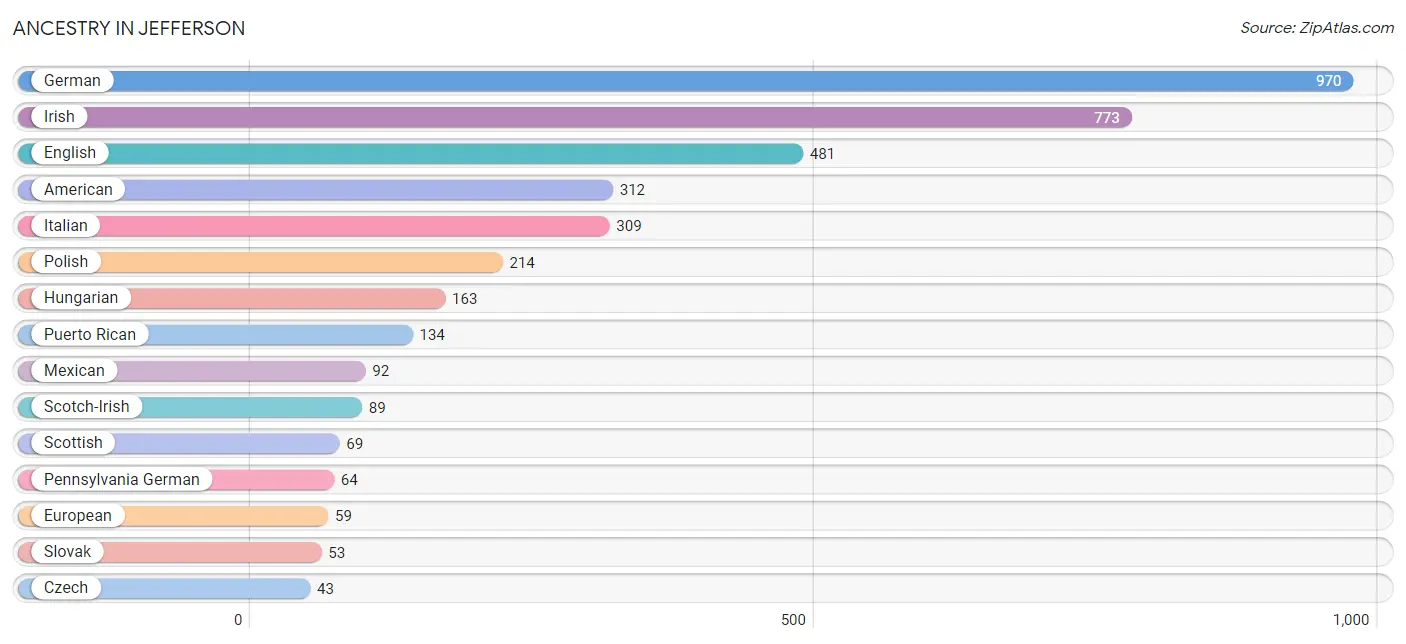
| Ancestry | # Population | % Population |
| American | 312 | 9.4% |
| British | 9 | 0.3% |
| Czech | 43 | 1.3% |
| English | 481 | 14.5% |
| European | 59 | 1.8% |
| Finnish | 34 | 1.0% |
| French | 25 | 0.7% |
| German | 970 | 29.2% |
| Hungarian | 163 | 4.9% |
| Irish | 773 | 23.3% |
| Italian | 309 | 9.3% |
| Jamaican | 2 | 0.1% |
| Mexican | 92 | 2.8% |
| Pennsylvania German | 64 | 1.9% |
| Polish | 214 | 6.5% |
| Puerto Rican | 134 | 4.0% |
| Samoan | 30 | 0.9% |
| Scandinavian | 10 | 0.3% |
| Scotch-Irish | 89 | 2.7% |
| Scottish | 69 | 2.1% |
| Slovak | 53 | 1.6% |
| Swiss | 11 | 0.3% | View All 22 Rows |
Immigrants in Jefferson
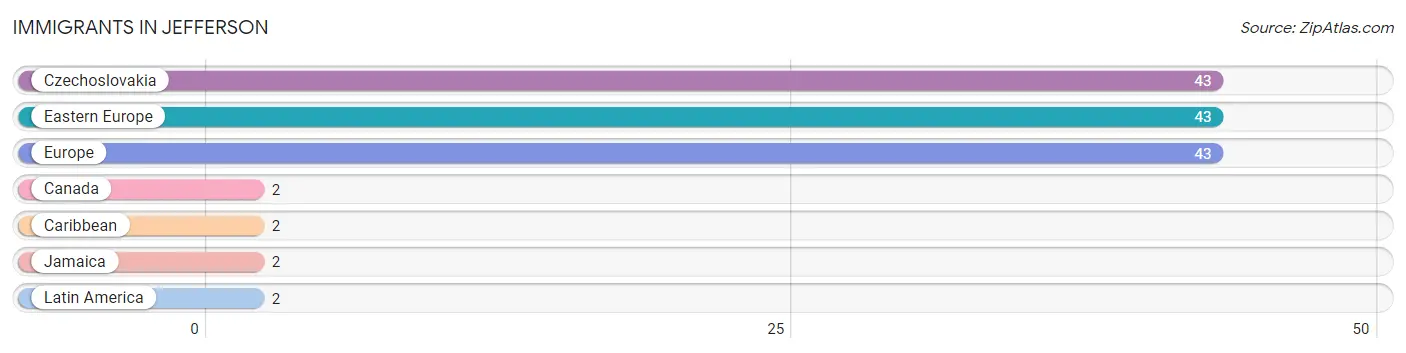
The most numerous immigrant groups reported in Jefferson came from Czechoslovakia (43 | 1.3%), Eastern Europe (43 | 1.3%), Europe (43 | 1.3%), Canada (2 | 0.1%), and Caribbean (2 | 0.1%), together accounting for 4.0% of all Jefferson residents.
| Immigration Origin | # Population | % Population |
| Canada | 2 | 0.1% |
| Caribbean | 2 | 0.1% |
| Czechoslovakia | 43 | 1.3% |
| Eastern Europe | 43 | 1.3% |
| Europe | 43 | 1.3% |
| Jamaica | 2 | 0.1% |
| Latin America | 2 | 0.1% | View All 7 Rows |
Sex and Age in Jefferson
Sex and Age in Jefferson
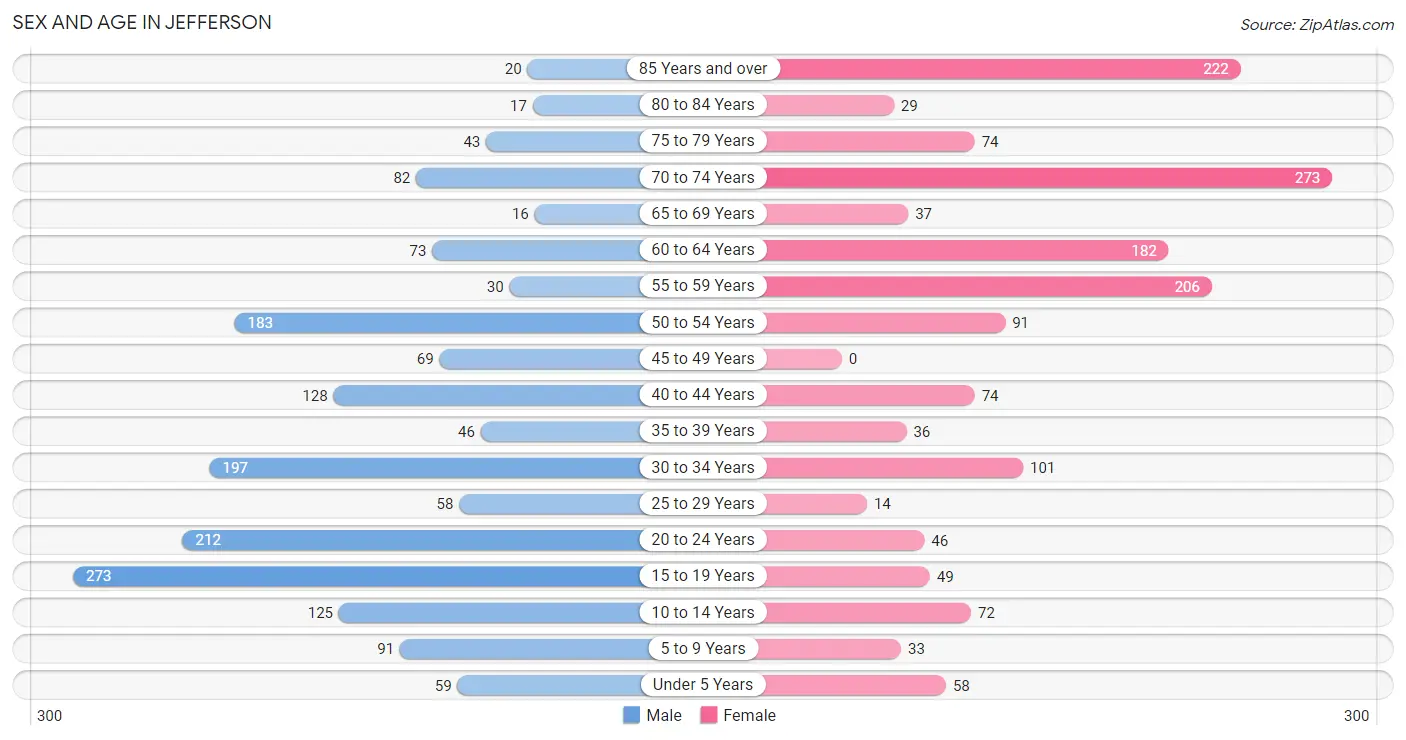
The most populous age groups in Jefferson are 15 to 19 Years (273 | 15.9%) for men and 70 to 74 Years (273 | 17.1%) for women.
| Age Bracket | Male | Female |
| Under 5 Years | 59 (3.4%) | 58 (3.6%) |
| 5 to 9 Years | 91 (5.3%) | 33 (2.1%) |
| 10 to 14 Years | 125 (7.3%) | 72 (4.5%) |
| 15 to 19 Years | 273 (15.9%) | 49 (3.1%) |
| 20 to 24 Years | 212 (12.3%) | 46 (2.9%) |
| 25 to 29 Years | 58 (3.4%) | 14 (0.9%) |
| 30 to 34 Years | 197 (11.4%) | 101 (6.3%) |
| 35 to 39 Years | 46 (2.7%) | 36 (2.2%) |
| 40 to 44 Years | 128 (7.4%) | 74 (4.6%) |
| 45 to 49 Years | 69 (4.0%) | 0 (0.0%) |
| 50 to 54 Years | 183 (10.6%) | 91 (5.7%) |
| 55 to 59 Years | 30 (1.7%) | 206 (12.9%) |
| 60 to 64 Years | 73 (4.2%) | 182 (11.4%) |
| 65 to 69 Years | 16 (0.9%) | 37 (2.3%) |
| 70 to 74 Years | 82 (4.8%) | 273 (17.1%) |
| 75 to 79 Years | 43 (2.5%) | 74 (4.6%) |
| 80 to 84 Years | 17 (1.0%) | 29 (1.8%) |
| 85 Years and over | 20 (1.2%) | 222 (13.9%) |
| Total | 1,722 (100.0%) | 1,597 (100.0%) |
Families and Households in Jefferson
Median Family Size in Jefferson
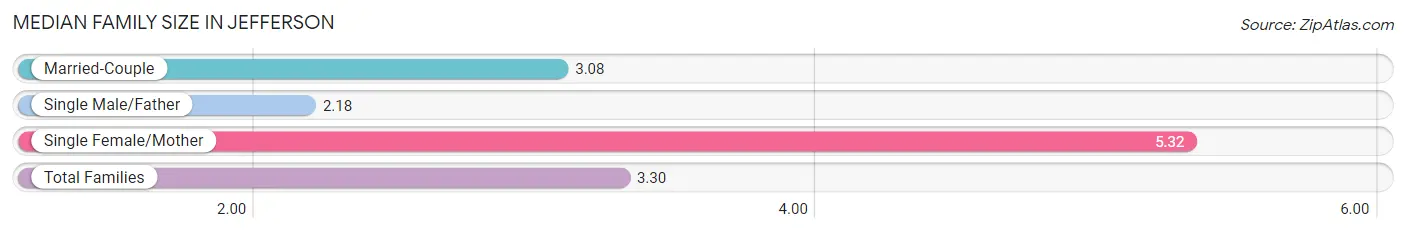
The median family size in Jefferson is 3.30 persons per family, with single female/mother families (79 | 13.7%) accounting for the largest median family size of 5.32 persons per family. On the other hand, single male/father families (57 | 9.9%) represent the smallest median family size with 2.18 persons per family.
| Family Type | # Families | Family Size |
| Married-Couple | 440 (76.4%) | 3.08 |
| Single Male/Father | 57 (9.9%) | 2.18 |
| Single Female/Mother | 79 (13.7%) | 5.32 |
| Total Families | 576 (100.0%) | 3.30 |
Median Household Size in Jefferson
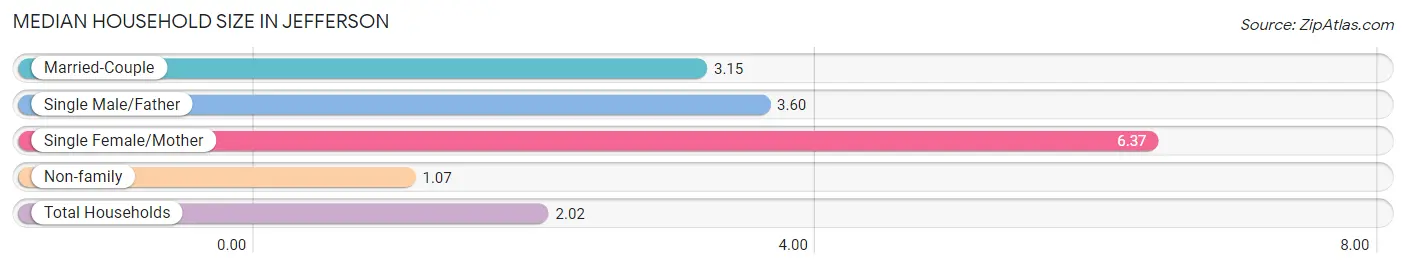
The median household size in Jefferson is 2.02 persons per household, with single female/mother households (79 | 5.1%) accounting for the largest median household size of 6.37 persons per household. non-family households (983 | 63.0%) represent the smallest median household size with 1.07 persons per household.
| Household Type | # Households | Household Size |
| Married-Couple | 440 (28.2%) | 3.15 |
| Single Male/Father | 57 (3.7%) | 3.60 |
| Single Female/Mother | 79 (5.1%) | 6.37 |
| Non-family | 983 (63.0%) | 1.07 |
| Total Households | 1,559 (100.0%) | 2.02 |
Household Size by Marriage Status in Jefferson
Out of a total of 1,559 households in Jefferson, 576 (36.9%) are family households, while 983 (63.0%) are nonfamily households. The most numerous type of family households are 2-person households, comprising 314, and the most common type of nonfamily households are 1-person households, comprising 937.
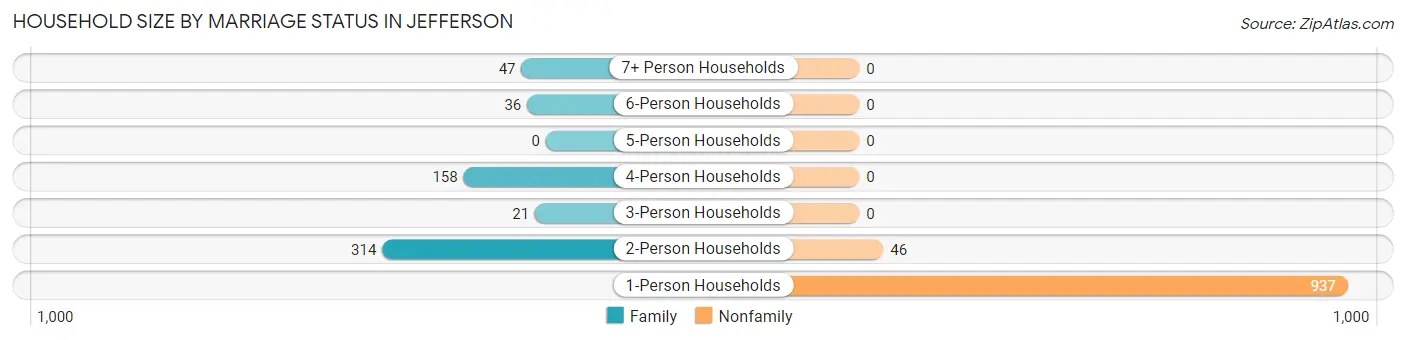
| Household Size | Family Households | Nonfamily Households |
| 1-Person Households | - | 937 (60.1%) |
| 2-Person Households | 314 (20.1%) | 46 (2.9%) |
| 3-Person Households | 21 (1.3%) | 0 (0.0%) |
| 4-Person Households | 158 (10.1%) | 0 (0.0%) |
| 5-Person Households | 0 (0.0%) | 0 (0.0%) |
| 6-Person Households | 36 (2.3%) | 0 (0.0%) |
| 7+ Person Households | 47 (3.0%) | 0 (0.0%) |
| Total | 576 (36.9%) | 983 (63.0%) |
Female Fertility in Jefferson
Fertility by Age in Jefferson
Average fertility rate in Jefferson is 59.0 births per 1,000 women. Women in the age bracket of 35 to 50 years have the highest fertility rate with 173.0 births per 1,000 women. Women in the age bracket of 35 to 50 years acount for 100.0% of all women with births.
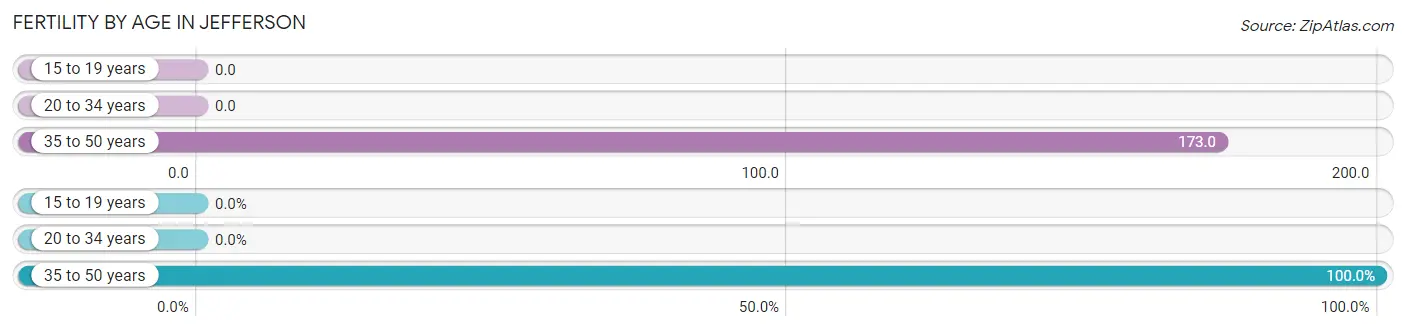
| Age Bracket | Women with Births | Births / 1,000 Women |
| 15 to 19 years | 0 (0.0%) | 0.0 |
| 20 to 34 years | 0 (0.0%) | 0.0 |
| 35 to 50 years | 19 (100.0%) | 173.0 |
| Total | 19 (100.0%) | 59.0 |
Fertility by Age by Marriage Status in Jefferson
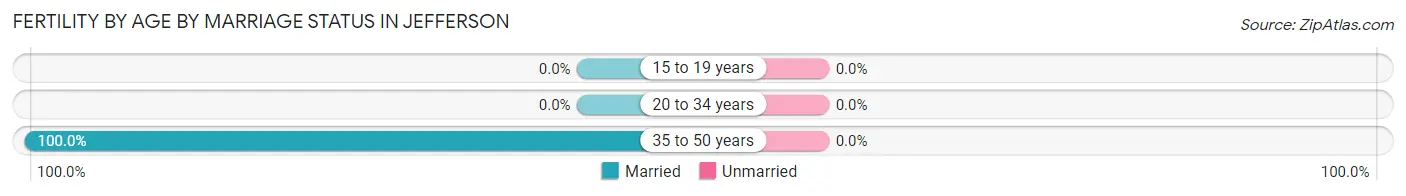
| Age Bracket | Married | Unmarried |
| 15 to 19 years | 0 (0.0%) | 0 (0.0%) |
| 20 to 34 years | 0 (0.0%) | 0 (0.0%) |
| 35 to 50 years | 19 (100.0%) | 0 (0.0%) |
| Total | 19 (100.0%) | 0 (0.0%) |
Fertility by Education in Jefferson
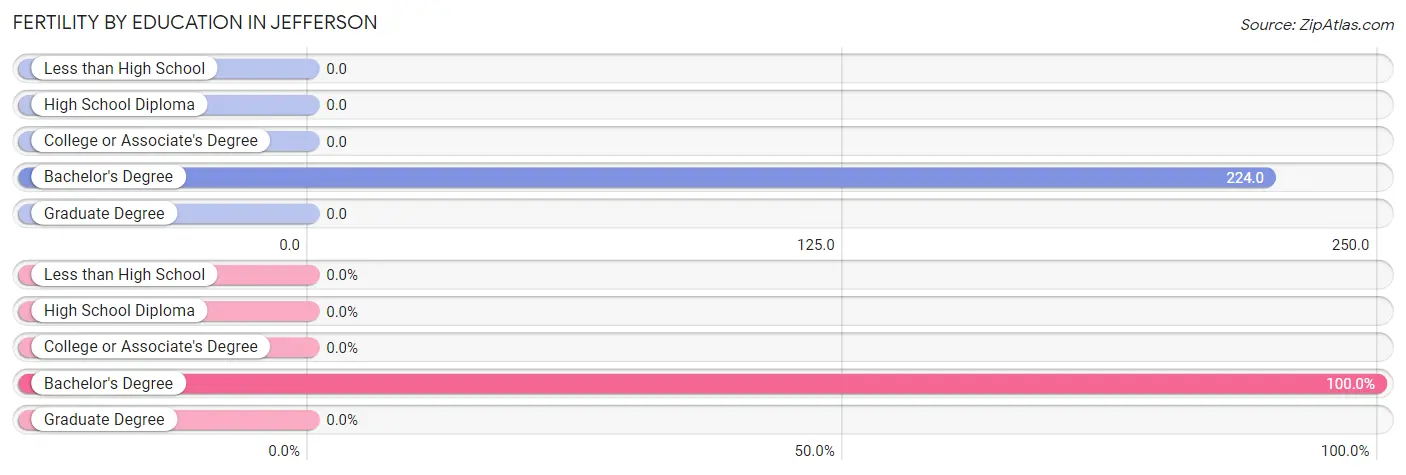
| Educational Attainment | Women with Births | Births / 1,000 Women |
| Less than High School | 0 (0.0%) | 0.0 |
| High School Diploma | 0 (0.0%) | 0.0 |
| College or Associate's Degree | 0 (0.0%) | 0.0 |
| Bachelor's Degree | 19 (100.0%) | 224.0 |
| Graduate Degree | 0 (0.0%) | 0.0 |
| Total | 19 (100.0%) | 59.0 |
Fertility by Education by Marriage Status in Jefferson
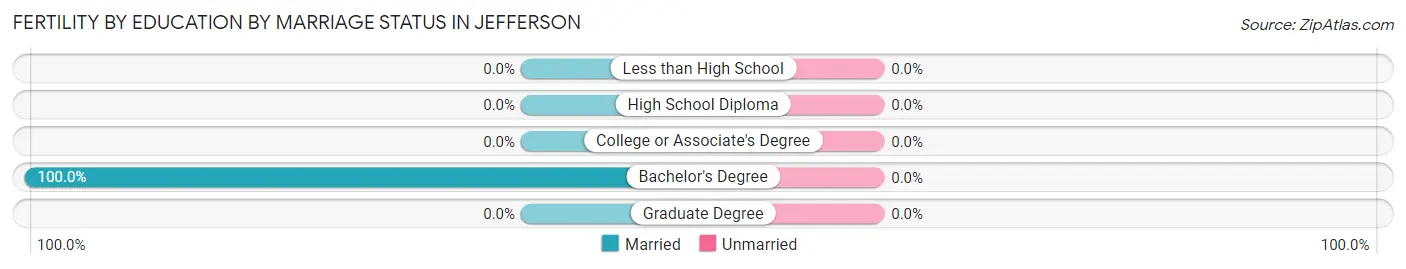
| Educational Attainment | Married | Unmarried |
| Less than High School | 0 (0.0%) | 0 (0.0%) |
| High School Diploma | 0 (0.0%) | 0 (0.0%) |
| College or Associate's Degree | 0 (0.0%) | 0 (0.0%) |
| Bachelor's Degree | 19 (100.0%) | 0 (0.0%) |
| Graduate Degree | 0 (0.0%) | 0 (0.0%) |
| Total | 19 (100.0%) | 0 (0.0%) |
Employment Characteristics in Jefferson
Employment by Class of Employer in Jefferson
Among the 1,695 employed individuals in Jefferson, private company employees (1,276 | 75.3%), not-for-profit organizations (258 | 15.2%), and self-employed (not incorporated) (92 | 5.4%) make up the most common classes of employment.
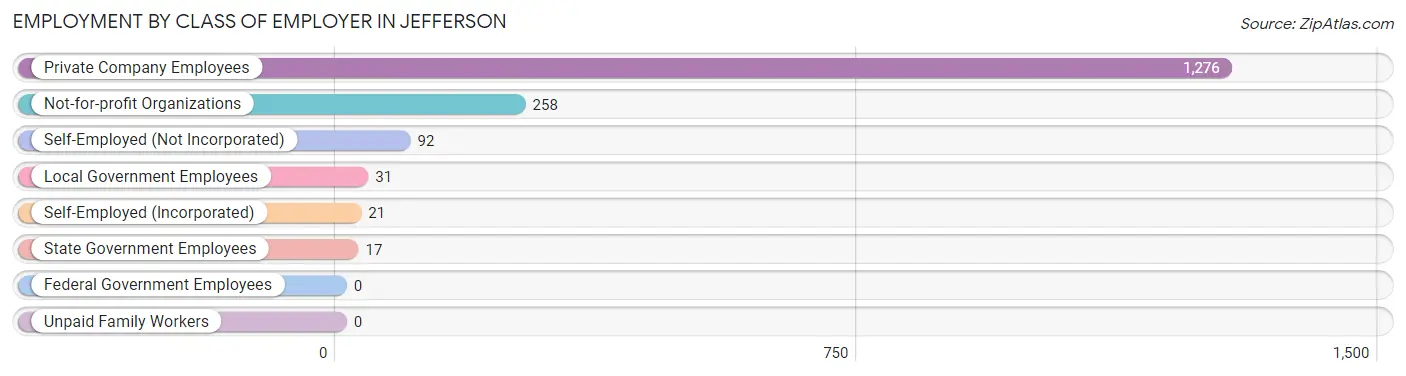
| Employer Class | # Employees | % Employees |
| Private Company Employees | 1,276 | 75.3% |
| Self-Employed (Incorporated) | 21 | 1.2% |
| Self-Employed (Not Incorporated) | 92 | 5.4% |
| Not-for-profit Organizations | 258 | 15.2% |
| Local Government Employees | 31 | 1.8% |
| State Government Employees | 17 | 1.0% |
| Federal Government Employees | 0 | 0.0% |
| Unpaid Family Workers | 0 | 0.0% |
| Total | 1,695 | 100.0% |
Employment Status by Age in Jefferson
According to the labor force statistics for Jefferson, out of the total population over 16 years of age (2,881), 61.9% or 1,783 individuals are in the labor force, with 2.7% or 48 of them unemployed. The age group with the highest labor force participation rate is 55 to 59 years, with 97.5% or 230 individuals in the labor force. Within the labor force, the 30 to 34 years age range has the highest percentage of unemployed individuals, with 12.9% or 24 of them being unemployed.
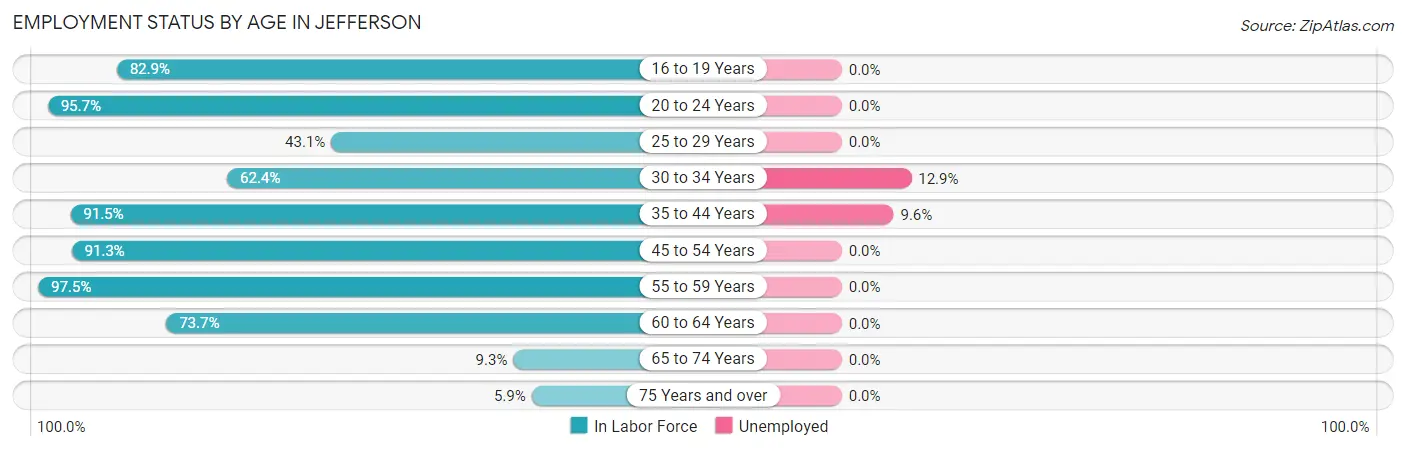
| Age Bracket | In Labor Force | Unemployed |
| 16 to 19 Years | 267 (82.9%) | 0 (0.0%) |
| 20 to 24 Years | 247 (95.7%) | 0 (0.0%) |
| 25 to 29 Years | 31 (43.1%) | 0 (0.0%) |
| 30 to 34 Years | 186 (62.4%) | 24 (12.9%) |
| 35 to 44 Years | 260 (91.5%) | 25 (9.6%) |
| 45 to 54 Years | 313 (91.3%) | 0 (0.0%) |
| 55 to 59 Years | 230 (97.5%) | 0 (0.0%) |
| 60 to 64 Years | 188 (73.7%) | 0 (0.0%) |
| 65 to 74 Years | 38 (9.3%) | 0 (0.0%) |
| 75 Years and over | 24 (5.9%) | 0 (0.0%) |
| Total | 1,783 (61.9%) | 48 (2.7%) |
Employment Status by Educational Attainment in Jefferson
According to labor force statistics for Jefferson, 81.2% of individuals (1,208) out of the total population between 25 and 64 years of age (1,488) are in the labor force, with 4.1% or 50 of them being unemployed. The group with the highest labor force participation rate are those with the educational attainment of bachelor's degree or higher, with 90.1% or 355 individuals in the labor force. Within the labor force, individuals with college / associate degree education have the highest percentage of unemployment, with 11.1% or 49 of them being unemployed.
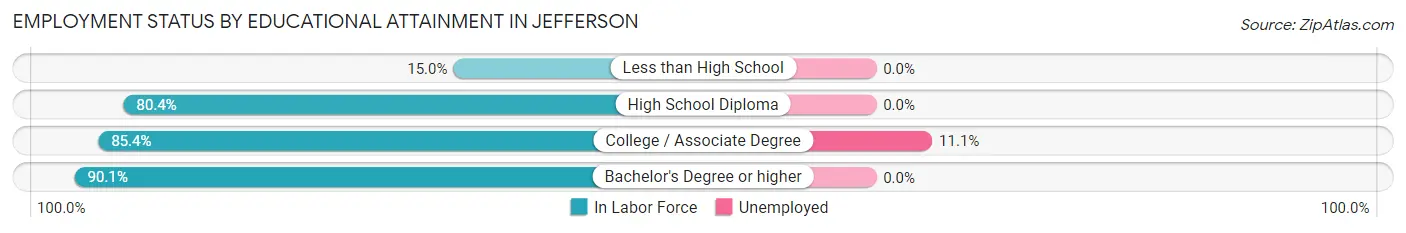
| Educational Attainment | In Labor Force | Unemployed |
| Less than High School | 12 (15.0%) | 0 (0.0%) |
| High School Diploma | 398 (80.4%) | 0 (0.0%) |
| College / Associate Degree | 443 (85.4%) | 58 (11.1%) |
| Bachelor's Degree or higher | 355 (90.1%) | 0 (0.0%) |
| Total | 1,208 (81.2%) | 61 (4.1%) |
Employment Occupations by Sex in Jefferson
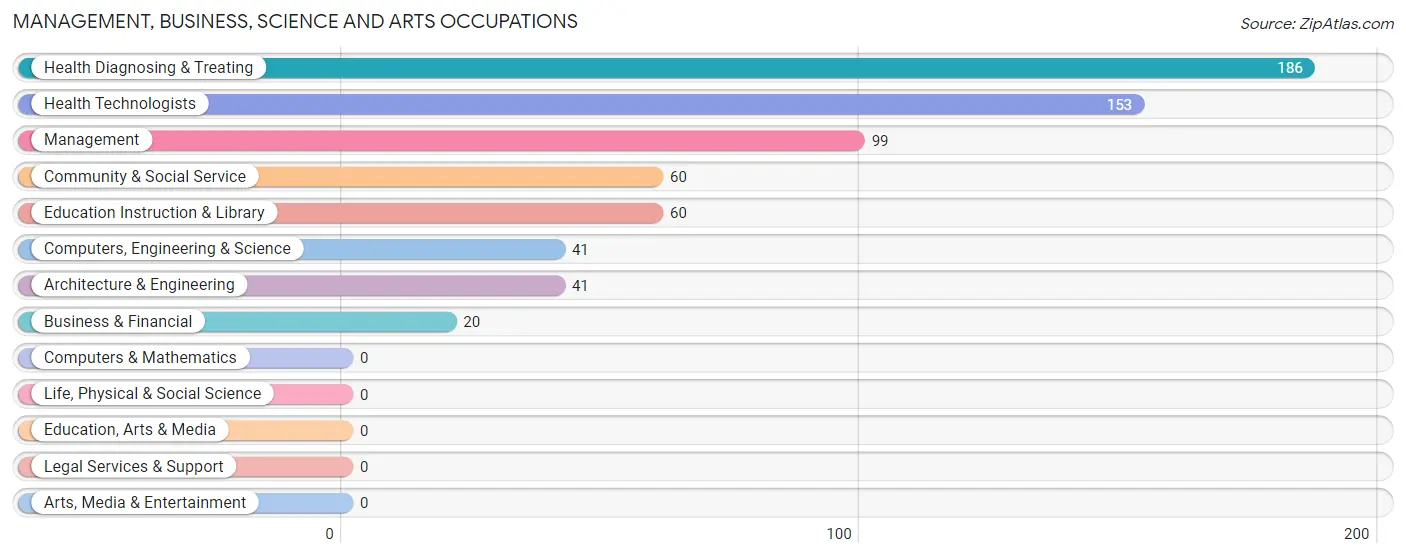
Management, Business, Science and Arts Occupations
The most common Management, Business, Science and Arts occupations in Jefferson are Health Diagnosing & Treating (186 | 10.7%), Health Technologists (153 | 8.8%), Management (99 | 5.7%), Community & Social Service (60 | 3.5%), and Education Instruction & Library (60 | 3.5%).
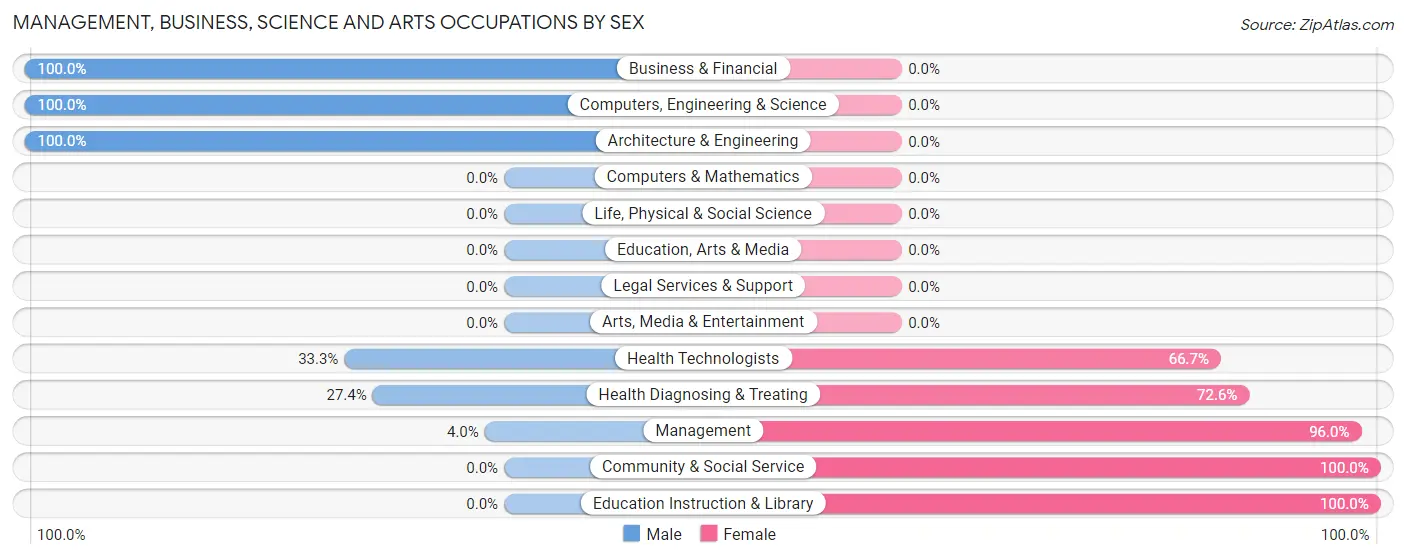
Management, Business, Science and Arts Occupations by Sex
Within the Management, Business, Science and Arts occupations in Jefferson, the most male-oriented occupations are Business & Financial (100.0%), Computers, Engineering & Science (100.0%), and Architecture & Engineering (100.0%), while the most female-oriented occupations are Community & Social Service (100.0%), Education Instruction & Library (100.0%), and Management (96.0%).
| Occupation | Male | Female |
| Management | 4 (4.0%) | 95 (96.0%) |
| Business & Financial | 20 (100.0%) | 0 (0.0%) |
| Computers, Engineering & Science | 41 (100.0%) | 0 (0.0%) |
| Computers & Mathematics | 0 (0.0%) | 0 (0.0%) |
| Architecture & Engineering | 41 (100.0%) | 0 (0.0%) |
| Life, Physical & Social Science | 0 (0.0%) | 0 (0.0%) |
| Community & Social Service | 0 (0.0%) | 60 (100.0%) |
| Education, Arts & Media | 0 (0.0%) | 0 (0.0%) |
| Legal Services & Support | 0 (0.0%) | 0 (0.0%) |
| Education Instruction & Library | 0 (0.0%) | 60 (100.0%) |
| Arts, Media & Entertainment | 0 (0.0%) | 0 (0.0%) |
| Health Diagnosing & Treating | 51 (27.4%) | 135 (72.6%) |
| Health Technologists | 51 (33.3%) | 102 (66.7%) |
| Total (Category) | 116 (28.6%) | 290 (71.4%) |
| Total (Overall) | 1,042 (60.1%) | 693 (39.9%) |
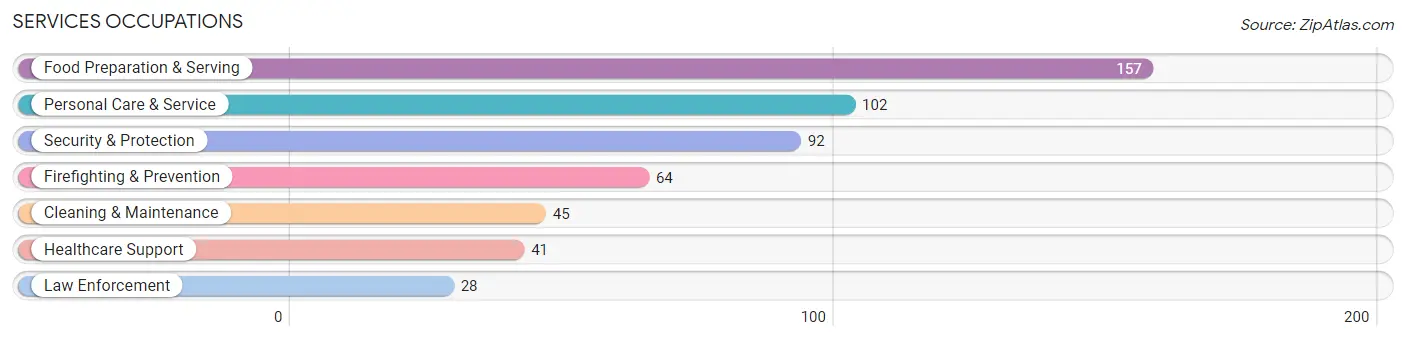
Services Occupations
The most common Services occupations in Jefferson are Food Preparation & Serving (157 | 9.0%), Personal Care & Service (102 | 5.9%), Security & Protection (92 | 5.3%), Firefighting & Prevention (64 | 3.7%), and Cleaning & Maintenance (45 | 2.6%).
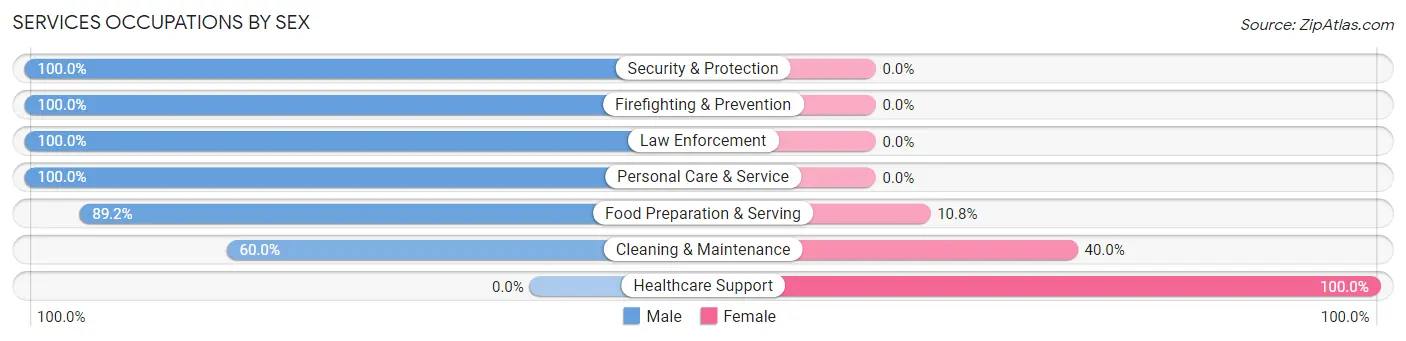
Services Occupations by Sex
Within the Services occupations in Jefferson, the most male-oriented occupations are Security & Protection (100.0%), Firefighting & Prevention (100.0%), and Law Enforcement (100.0%), while the most female-oriented occupations are Healthcare Support (100.0%), Cleaning & Maintenance (40.0%), and Food Preparation & Serving (10.8%).
| Occupation | Male | Female |
| Healthcare Support | 0 (0.0%) | 41 (100.0%) |
| Security & Protection | 92 (100.0%) | 0 (0.0%) |
| Firefighting & Prevention | 64 (100.0%) | 0 (0.0%) |
| Law Enforcement | 28 (100.0%) | 0 (0.0%) |
| Food Preparation & Serving | 140 (89.2%) | 17 (10.8%) |
| Cleaning & Maintenance | 27 (60.0%) | 18 (40.0%) |
| Personal Care & Service | 102 (100.0%) | 0 (0.0%) |
| Total (Category) | 361 (82.6%) | 76 (17.4%) |
| Total (Overall) | 1,042 (60.1%) | 693 (39.9%) |
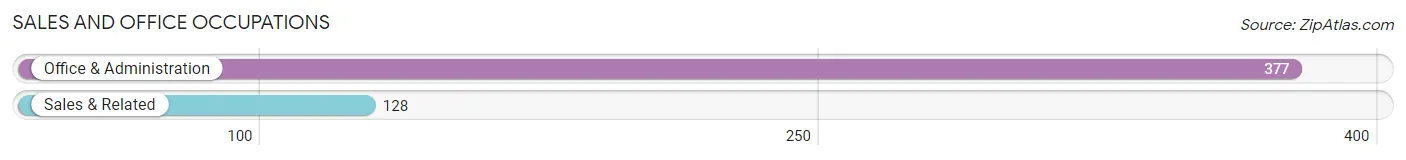
Sales and Office Occupations
The most common Sales and Office occupations in Jefferson are Office & Administration (377 | 21.7%), and Sales & Related (128 | 7.4%).
Sales and Office Occupations by Sex
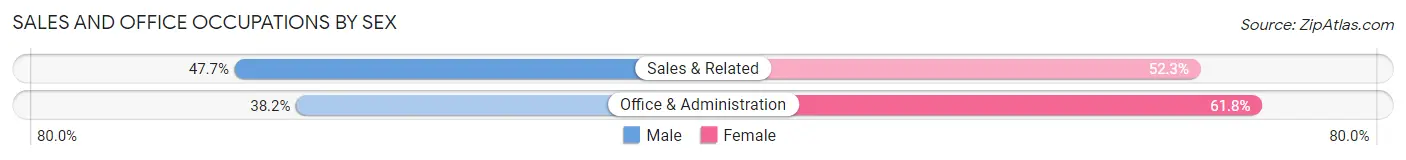
| Occupation | Male | Female |
| Sales & Related | 61 (47.7%) | 67 (52.3%) |
| Office & Administration | 144 (38.2%) | 233 (61.8%) |
| Total (Category) | 205 (40.6%) | 300 (59.4%) |
| Total (Overall) | 1,042 (60.1%) | 693 (39.9%) |
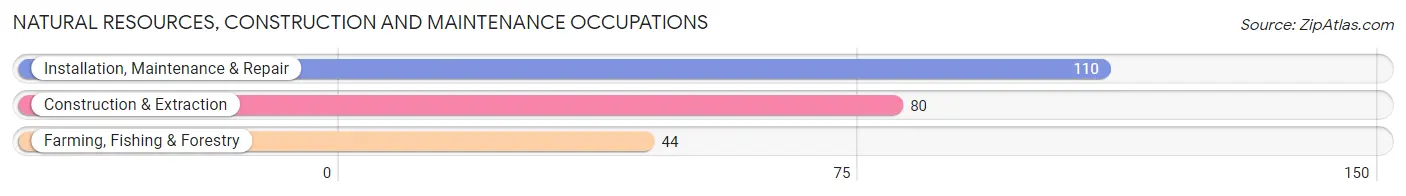
Natural Resources, Construction and Maintenance Occupations
The most common Natural Resources, Construction and Maintenance occupations in Jefferson are Installation, Maintenance & Repair (110 | 6.3%), Construction & Extraction (80 | 4.6%), and Farming, Fishing & Forestry (44 | 2.5%).
Natural Resources, Construction and Maintenance Occupations by Sex
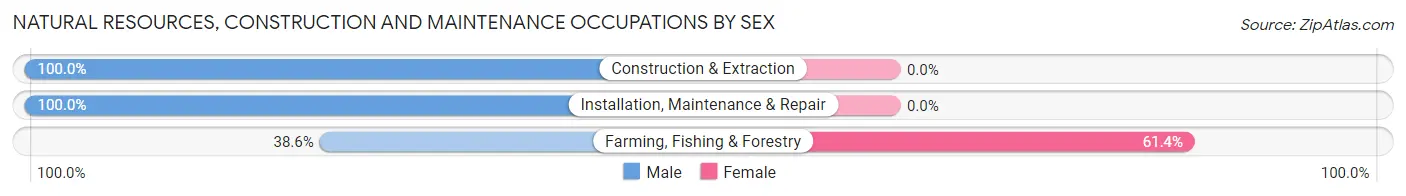
| Occupation | Male | Female |
| Farming, Fishing & Forestry | 17 (38.6%) | 27 (61.4%) |
| Construction & Extraction | 80 (100.0%) | 0 (0.0%) |
| Installation, Maintenance & Repair | 110 (100.0%) | 0 (0.0%) |
| Total (Category) | 207 (88.5%) | 27 (11.5%) |
| Total (Overall) | 1,042 (60.1%) | 693 (39.9%) |
Production, Transportation and Moving Occupations
The most common Production, Transportation and Moving occupations in Jefferson are Production (135 | 7.8%), and Transportation (18 | 1.0%).
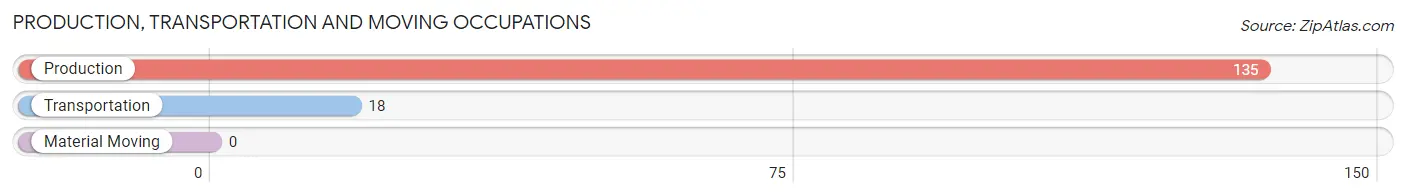
Production, Transportation and Moving Occupations by Sex
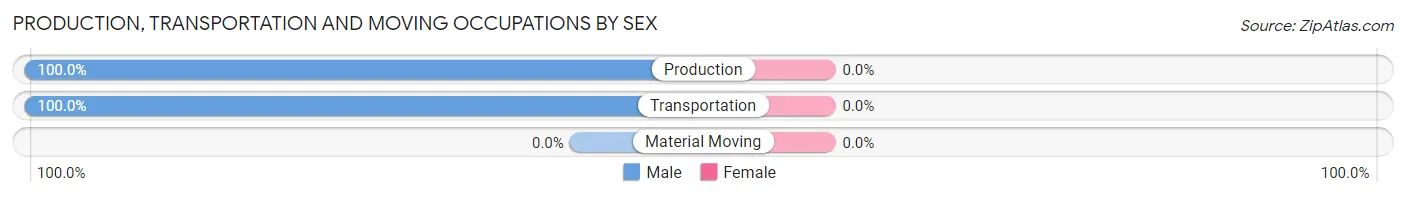
| Occupation | Male | Female |
| Production | 135 (100.0%) | 0 (0.0%) |
| Transportation | 18 (100.0%) | 0 (0.0%) |
| Material Moving | 0 (0.0%) | 0 (0.0%) |
| Total (Category) | 153 (100.0%) | 0 (0.0%) |
| Total (Overall) | 1,042 (60.1%) | 693 (39.9%) |
Employment Industries by Sex in Jefferson
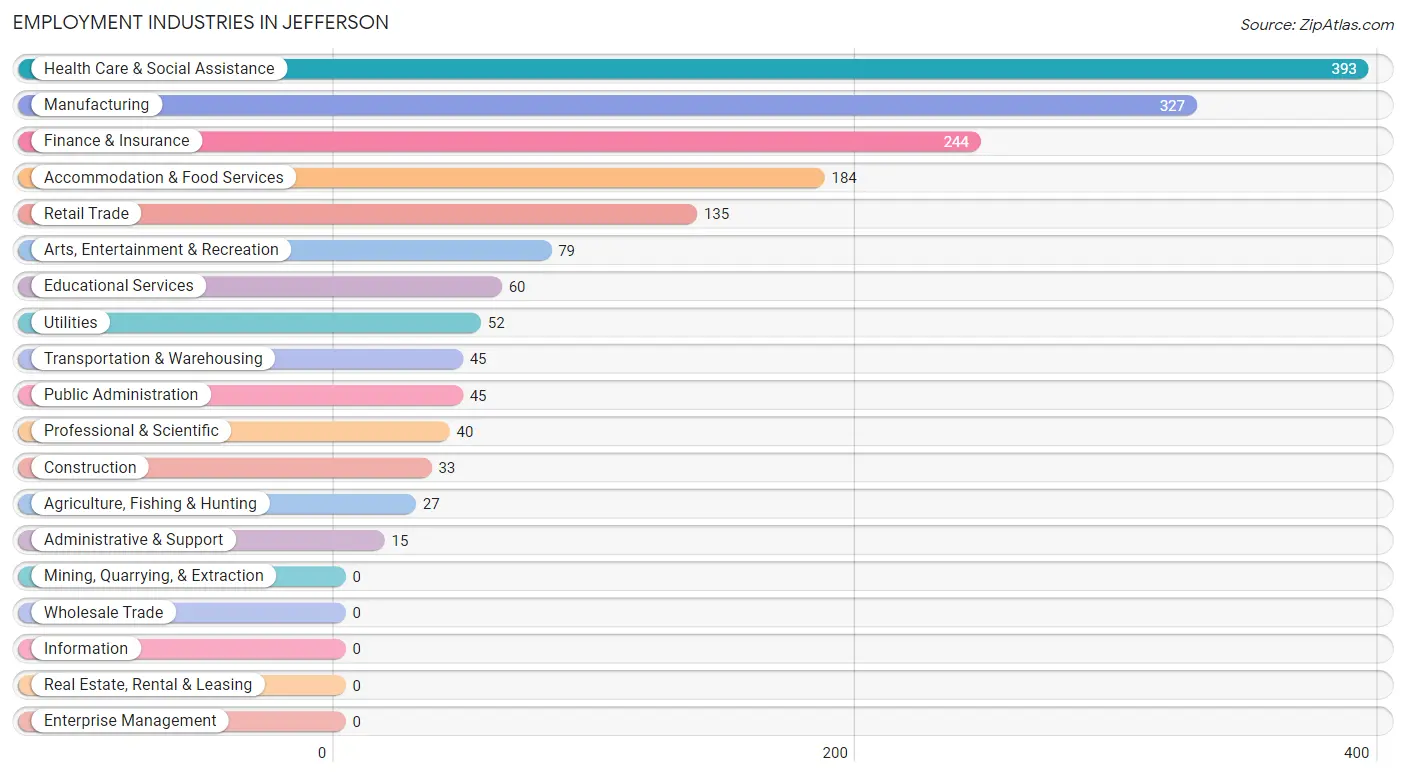
Employment Industries in Jefferson
The major employment industries in Jefferson include Health Care & Social Assistance (393 | 22.7%), Manufacturing (327 | 18.9%), Finance & Insurance (244 | 14.1%), Accommodation & Food Services (184 | 10.6%), and Retail Trade (135 | 7.8%).
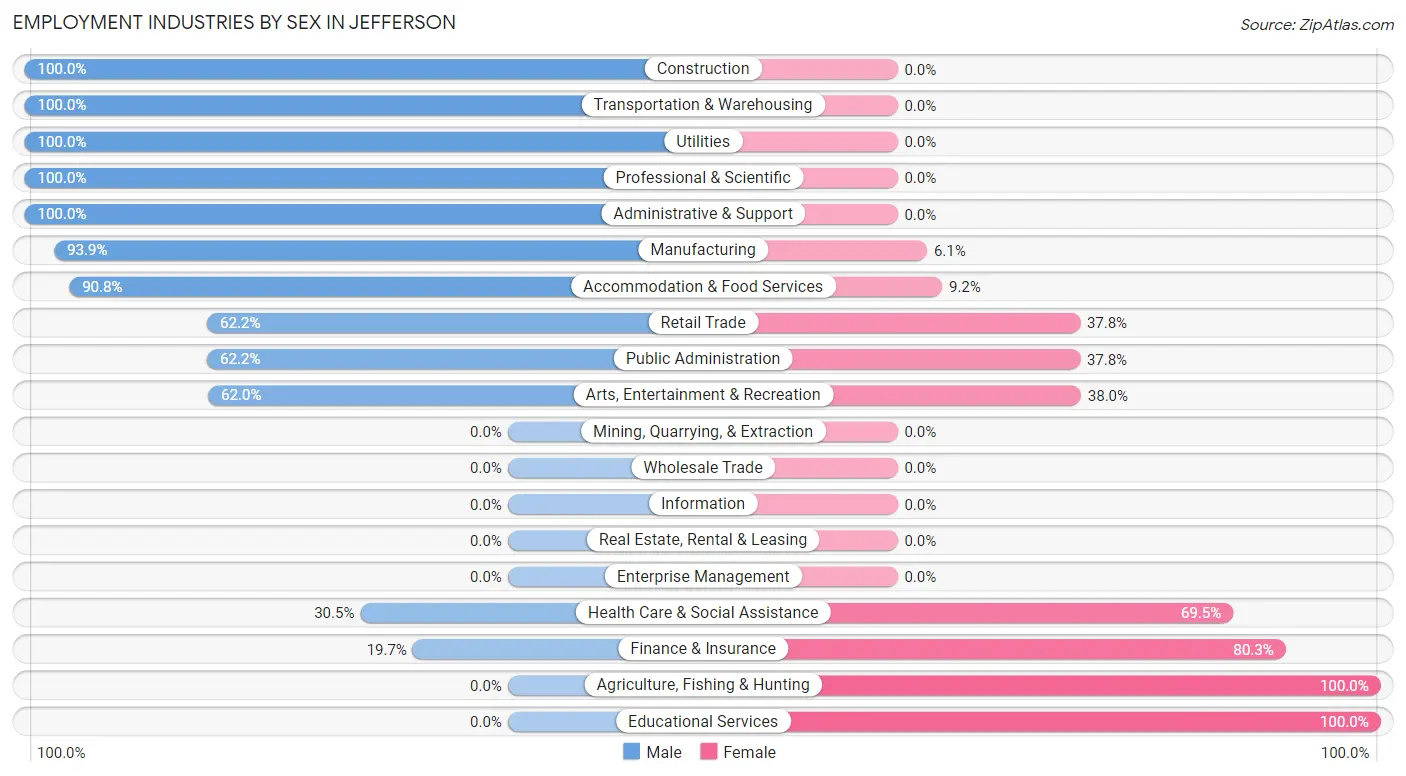
Employment Industries by Sex in Jefferson
The Jefferson industries that see more men than women are Construction (100.0%), Transportation & Warehousing (100.0%), and Utilities (100.0%), whereas the industries that tend to have a higher number of women are Agriculture, Fishing & Hunting (100.0%), Educational Services (100.0%), and Finance & Insurance (80.3%).
| Industry | Male | Female |
| Agriculture, Fishing & Hunting | 0 (0.0%) | 27 (100.0%) |
| Mining, Quarrying, & Extraction | 0 (0.0%) | 0 (0.0%) |
| Construction | 33 (100.0%) | 0 (0.0%) |
| Manufacturing | 307 (93.9%) | 20 (6.1%) |
| Wholesale Trade | 0 (0.0%) | 0 (0.0%) |
| Retail Trade | 84 (62.2%) | 51 (37.8%) |
| Transportation & Warehousing | 45 (100.0%) | 0 (0.0%) |
| Utilities | 52 (100.0%) | 0 (0.0%) |
| Information | 0 (0.0%) | 0 (0.0%) |
| Finance & Insurance | 48 (19.7%) | 196 (80.3%) |
| Real Estate, Rental & Leasing | 0 (0.0%) | 0 (0.0%) |
| Professional & Scientific | 40 (100.0%) | 0 (0.0%) |
| Enterprise Management | 0 (0.0%) | 0 (0.0%) |
| Administrative & Support | 15 (100.0%) | 0 (0.0%) |
| Educational Services | 0 (0.0%) | 60 (100.0%) |
| Health Care & Social Assistance | 120 (30.5%) | 273 (69.5%) |
| Arts, Entertainment & Recreation | 49 (62.0%) | 30 (38.0%) |
| Accommodation & Food Services | 167 (90.8%) | 17 (9.2%) |
| Public Administration | 28 (62.2%) | 17 (37.8%) |
| Total | 1,042 (60.1%) | 693 (39.9%) |
Education in Jefferson
School Enrollment in Jefferson
The most common levels of schooling among the 898 students in Jefferson are high school (340 | 37.9%), college / undergraduate (267 | 29.7%), and middle school (153 | 17.0%).
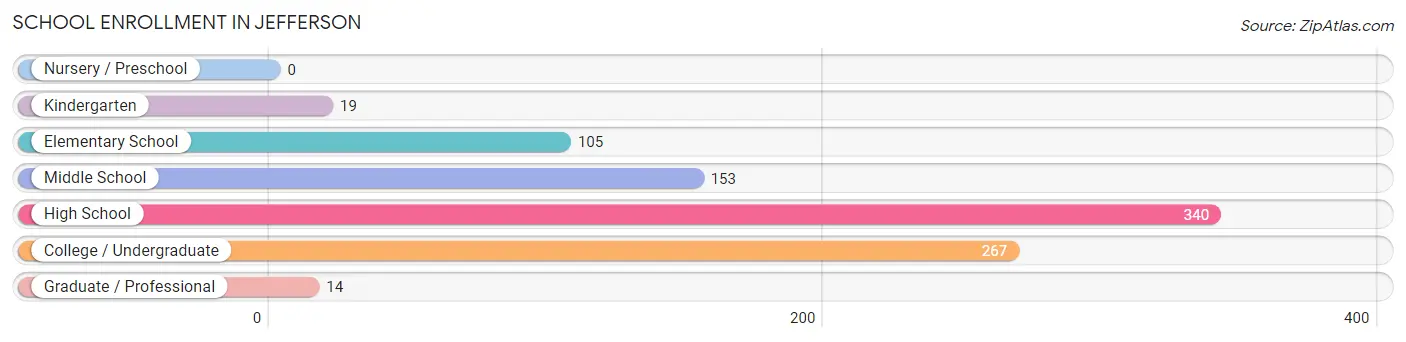
| School Level | # Students | % Students |
| Nursery / Preschool | 0 | 0.0% |
| Kindergarten | 19 | 2.1% |
| Elementary School | 105 | 11.7% |
| Middle School | 153 | 17.0% |
| High School | 340 | 37.9% |
| College / Undergraduate | 267 | 29.7% |
| Graduate / Professional | 14 | 1.6% |
| Total | 898 | 100.0% |
School Enrollment by Age by Funding Source in Jefferson
Out of a total of 898 students who are enrolled in schools in Jefferson, 265 (29.5%) attend a private institution, while the remaining 633 (70.5%) are enrolled in public schools. The age group of 35 years and over has the highest likelihood of being enrolled in private schools, with 60 (95.2% in the age bracket) enrolled. Conversely, the age group of 15 to 17 year olds has the lowest likelihood of being enrolled in a private school, with 241 (100.0% in the age bracket) attending a public institution.
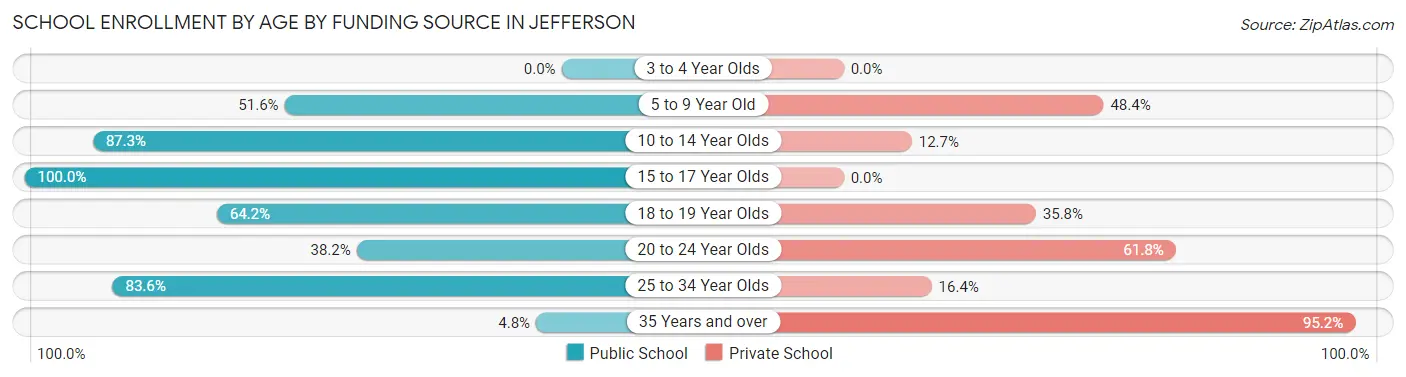
| Age Bracket | Public School | Private School |
| 3 to 4 Year Olds | 0 (0.0%) | 0 (0.0%) |
| 5 to 9 Year Old | 64 (51.6%) | 60 (48.4%) |
| 10 to 14 Year Olds | 172 (87.3%) | 25 (12.7%) |
| 15 to 17 Year Olds | 241 (100.0%) | 0 (0.0%) |
| 18 to 19 Year Olds | 52 (64.2%) | 29 (35.8%) |
| 20 to 24 Year Olds | 50 (38.2%) | 81 (61.8%) |
| 25 to 34 Year Olds | 51 (83.6%) | 10 (16.4%) |
| 35 Years and over | 3 (4.8%) | 60 (95.2%) |
| Total | 633 (70.5%) | 265 (29.5%) |
Educational Attainment by Field of Study in Jefferson
Science & technology (125 | 27.8%), business (99 | 22.0%), arts & humanities (97 | 21.6%), education (56 | 12.4%), and psychology (27 | 6.0%) are the most common fields of study among 450 individuals in Jefferson who have obtained a bachelor's degree or higher.
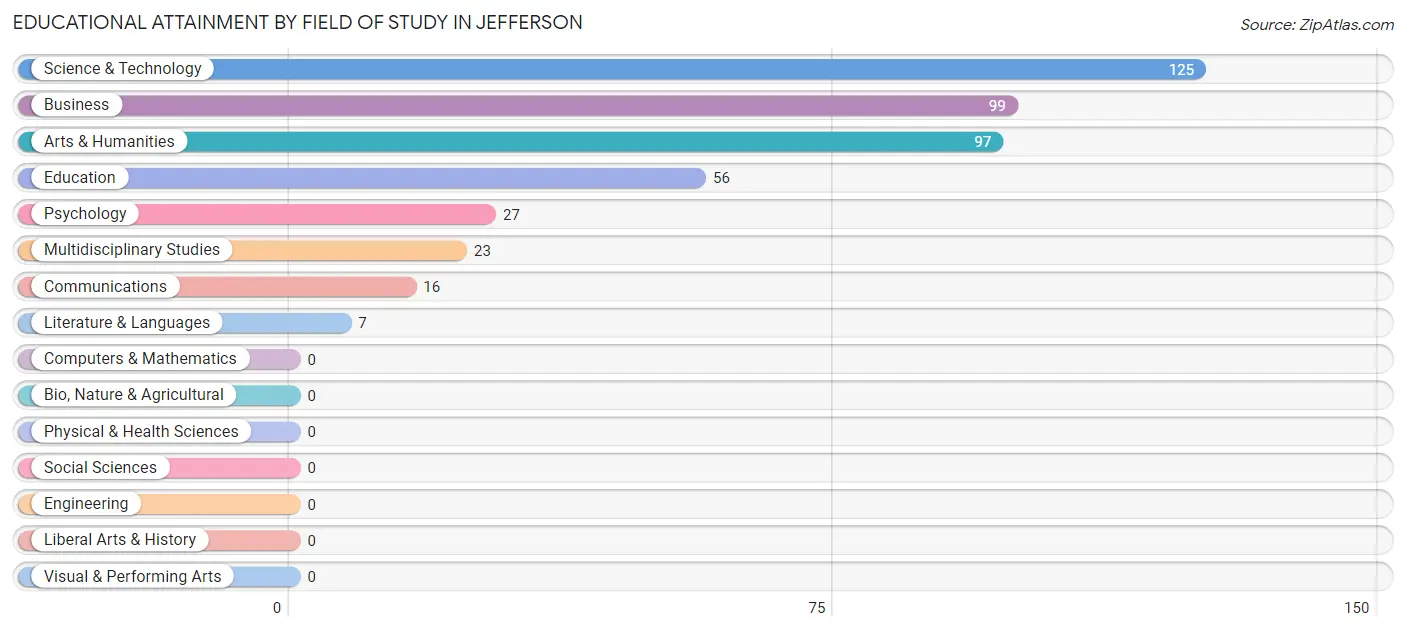
| Field of Study | # Graduates | % Graduates |
| Computers & Mathematics | 0 | 0.0% |
| Bio, Nature & Agricultural | 0 | 0.0% |
| Physical & Health Sciences | 0 | 0.0% |
| Psychology | 27 | 6.0% |
| Social Sciences | 0 | 0.0% |
| Engineering | 0 | 0.0% |
| Multidisciplinary Studies | 23 | 5.1% |
| Science & Technology | 125 | 27.8% |
| Business | 99 | 22.0% |
| Education | 56 | 12.4% |
| Literature & Languages | 7 | 1.6% |
| Liberal Arts & History | 0 | 0.0% |
| Visual & Performing Arts | 0 | 0.0% |
| Communications | 16 | 3.6% |
| Arts & Humanities | 97 | 21.6% |
| Total | 450 | 100.0% |
Transportation & Commute in Jefferson
Vehicle Availability by Sex in Jefferson
The most prevalent vehicle ownership categories in Jefferson are males with 2 vehicles (385, accounting for 36.9%) and females with 2 vehicles (145, making up 59.0%).

| Vehicles Available | Male | Female |
| No Vehicle | 0 (0.0%) | 20 (3.1%) |
| 1 Vehicle | 239 (22.9%) | 340 (52.1%) |
| 2 Vehicles | 385 (36.9%) | 145 (22.2%) |
| 3 Vehicles | 259 (24.9%) | 50 (7.7%) |
| 4 Vehicles | 4 (0.4%) | 0 (0.0%) |
| 5 or more Vehicles | 155 (14.9%) | 98 (15.0%) |
| Total | 1,042 (100.0%) | 653 (100.0%) |
Commute Time in Jefferson
The most frequently occuring commute durations in Jefferson are 20 to 24 minutes (521 commuters, 31.6%), 10 to 14 minutes (230 commuters, 14.0%), and 15 to 19 minutes (186 commuters, 11.3%).
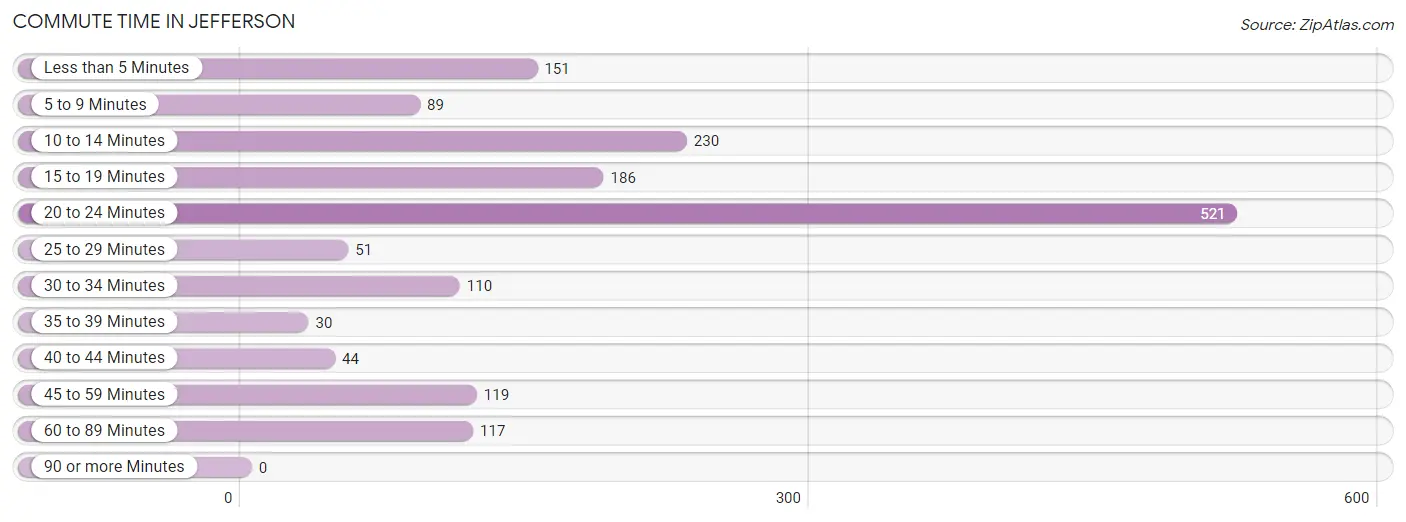
| Commute Time | # Commuters | % Commuters |
| Less than 5 Minutes | 151 | 9.2% |
| 5 to 9 Minutes | 89 | 5.4% |
| 10 to 14 Minutes | 230 | 14.0% |
| 15 to 19 Minutes | 186 | 11.3% |
| 20 to 24 Minutes | 521 | 31.6% |
| 25 to 29 Minutes | 51 | 3.1% |
| 30 to 34 Minutes | 110 | 6.7% |
| 35 to 39 Minutes | 30 | 1.8% |
| 40 to 44 Minutes | 44 | 2.7% |
| 45 to 59 Minutes | 119 | 7.2% |
| 60 to 89 Minutes | 117 | 7.1% |
| 90 or more Minutes | 0 | 0.0% |
Commute Time by Sex in Jefferson
The most common commute times in Jefferson are 20 to 24 minutes (451 commuters, 43.3%) for males and 10 to 14 minutes (203 commuters, 33.5%) for females.
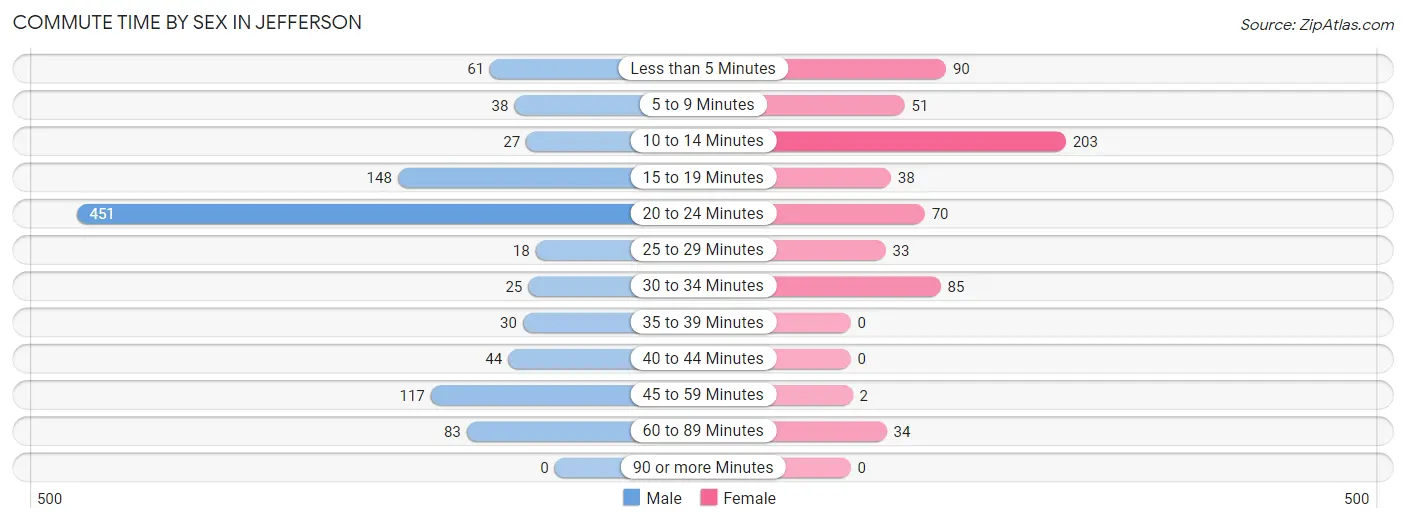
| Commute Time | Male | Female |
| Less than 5 Minutes | 61 (5.9%) | 90 (14.8%) |
| 5 to 9 Minutes | 38 (3.6%) | 51 (8.4%) |
| 10 to 14 Minutes | 27 (2.6%) | 203 (33.5%) |
| 15 to 19 Minutes | 148 (14.2%) | 38 (6.3%) |
| 20 to 24 Minutes | 451 (43.3%) | 70 (11.6%) |
| 25 to 29 Minutes | 18 (1.7%) | 33 (5.4%) |
| 30 to 34 Minutes | 25 (2.4%) | 85 (14.0%) |
| 35 to 39 Minutes | 30 (2.9%) | 0 (0.0%) |
| 40 to 44 Minutes | 44 (4.2%) | 0 (0.0%) |
| 45 to 59 Minutes | 117 (11.2%) | 2 (0.3%) |
| 60 to 89 Minutes | 83 (8.0%) | 34 (5.6%) |
| 90 or more Minutes | 0 (0.0%) | 0 (0.0%) |
Time of Departure to Work by Sex in Jefferson
The most frequent times of departure to work in Jefferson are 8:00 AM to 8:29 AM (158, 15.2%) for males and 7:30 AM to 7:59 AM (224, 37.0%) for females.
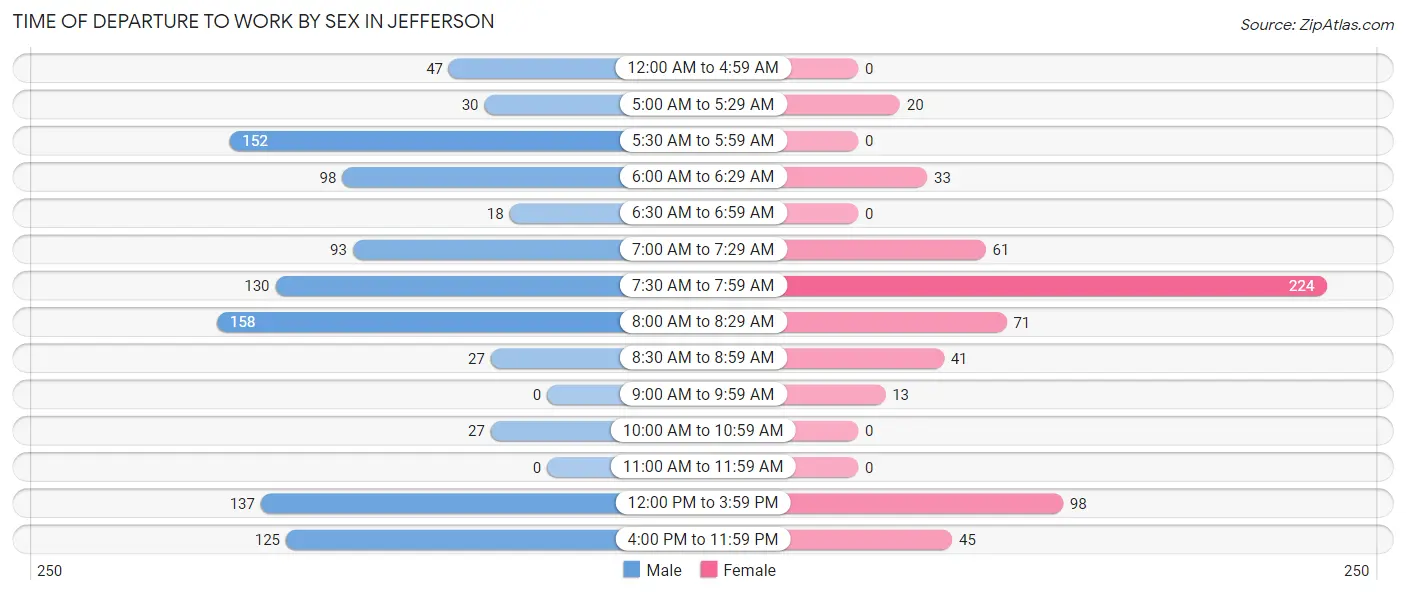
| Time of Departure | Male | Female |
| 12:00 AM to 4:59 AM | 47 (4.5%) | 0 (0.0%) |
| 5:00 AM to 5:29 AM | 30 (2.9%) | 20 (3.3%) |
| 5:30 AM to 5:59 AM | 152 (14.6%) | 0 (0.0%) |
| 6:00 AM to 6:29 AM | 98 (9.4%) | 33 (5.4%) |
| 6:30 AM to 6:59 AM | 18 (1.7%) | 0 (0.0%) |
| 7:00 AM to 7:29 AM | 93 (8.9%) | 61 (10.1%) |
| 7:30 AM to 7:59 AM | 130 (12.5%) | 224 (37.0%) |
| 8:00 AM to 8:29 AM | 158 (15.2%) | 71 (11.7%) |
| 8:30 AM to 8:59 AM | 27 (2.6%) | 41 (6.8%) |
| 9:00 AM to 9:59 AM | 0 (0.0%) | 13 (2.1%) |
| 10:00 AM to 10:59 AM | 27 (2.6%) | 0 (0.0%) |
| 11:00 AM to 11:59 AM | 0 (0.0%) | 0 (0.0%) |
| 12:00 PM to 3:59 PM | 137 (13.2%) | 98 (16.2%) |
| 4:00 PM to 11:59 PM | 125 (12.0%) | 45 (7.4%) |
| Total | 1,042 (100.0%) | 606 (100.0%) |
Housing Occupancy in Jefferson
Occupancy by Ownership in Jefferson
Of the total 1,559 dwellings in Jefferson, owner-occupied units account for 1,088 (69.8%), while renter-occupied units make up 471 (30.2%).
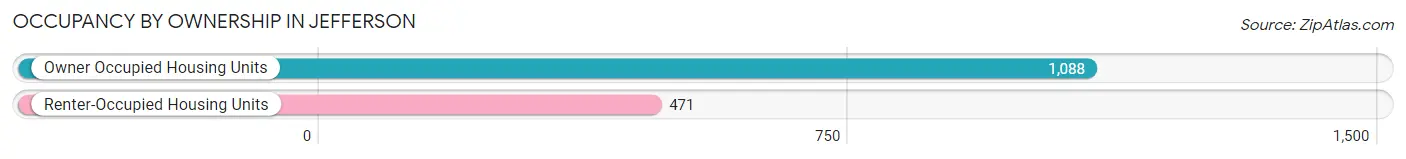
| Occupancy | # Housing Units | % Housing Units |
| Owner Occupied Housing Units | 1,088 | 69.8% |
| Renter-Occupied Housing Units | 471 | 30.2% |
| Total Occupied Housing Units | 1,559 | 100.0% |
Occupancy by Household Size in Jefferson
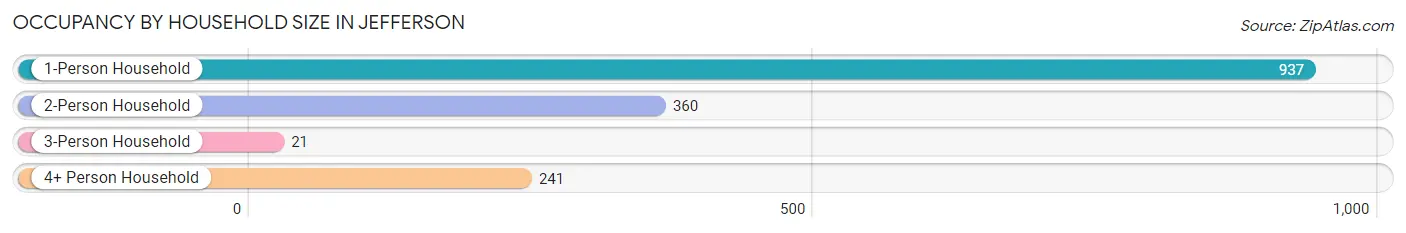
| Household Size | # Housing Units | % Housing Units |
| 1-Person Household | 937 | 60.1% |
| 2-Person Household | 360 | 23.1% |
| 3-Person Household | 21 | 1.3% |
| 4+ Person Household | 241 | 15.5% |
| Total Housing Units | 1,559 | 100.0% |
Occupancy by Ownership by Household Size in Jefferson
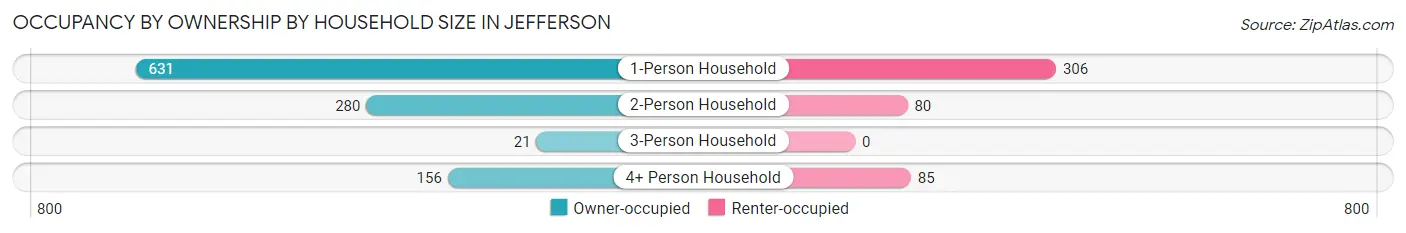
| Household Size | Owner-occupied | Renter-occupied |
| 1-Person Household | 631 (67.3%) | 306 (32.7%) |
| 2-Person Household | 280 (77.8%) | 80 (22.2%) |
| 3-Person Household | 21 (100.0%) | 0 (0.0%) |
| 4+ Person Household | 156 (64.7%) | 85 (35.3%) |
| Total Housing Units | 1,088 (69.8%) | 471 (30.2%) |
Occupancy by Educational Attainment in Jefferson
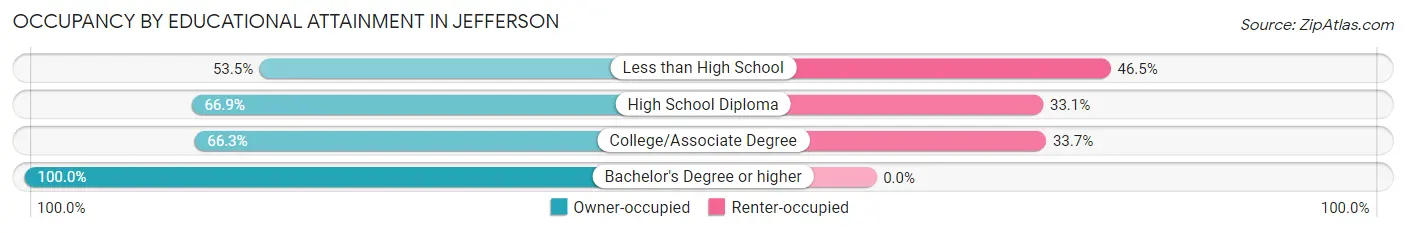
| Household Size | Owner-occupied | Renter-occupied |
| Less than High School | 91 (53.5%) | 79 (46.5%) |
| High School Diploma | 455 (66.9%) | 225 (33.1%) |
| College/Associate Degree | 329 (66.3%) | 167 (33.7%) |
| Bachelor's Degree or higher | 213 (100.0%) | 0 (0.0%) |
Occupancy by Age of Householder in Jefferson
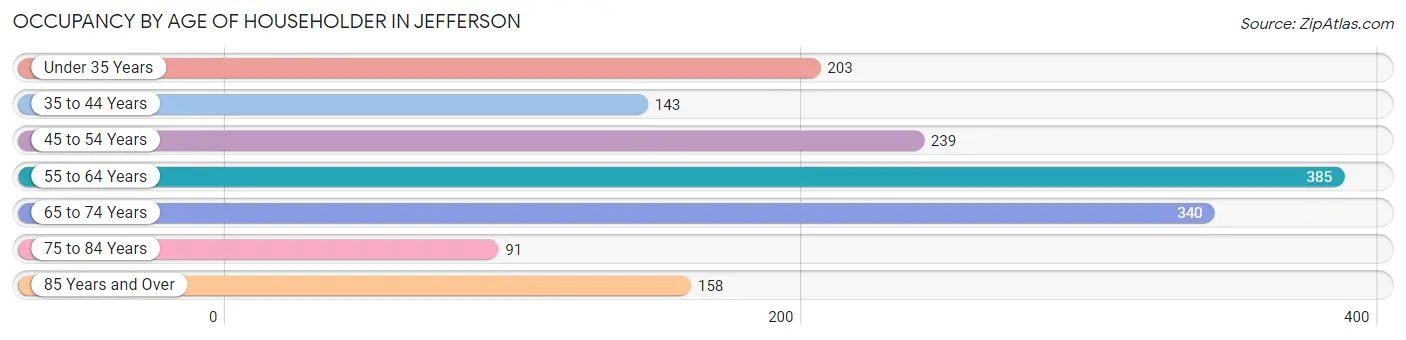
| Age Bracket | # Households | % Households |
| Under 35 Years | 203 | 13.0% |
| 35 to 44 Years | 143 | 9.2% |
| 45 to 54 Years | 239 | 15.3% |
| 55 to 64 Years | 385 | 24.7% |
| 65 to 74 Years | 340 | 21.8% |
| 75 to 84 Years | 91 | 5.8% |
| 85 Years and Over | 158 | 10.1% |
| Total | 1,559 | 100.0% |
Housing Finances in Jefferson
Median Income by Occupancy in Jefferson
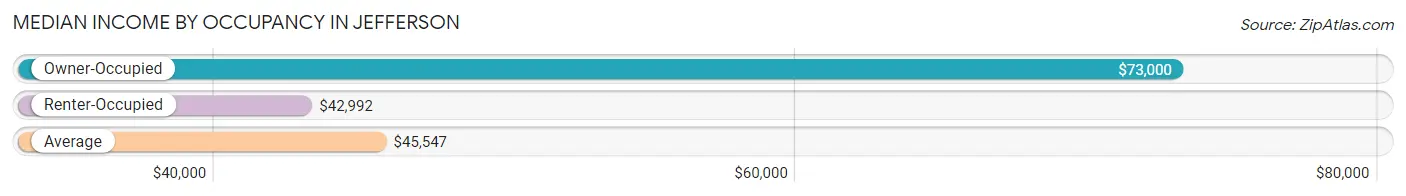
| Occupancy Type | # Households | Median Income |
| Owner-Occupied | 1,088 (69.8%) | $73,000 |
| Renter-Occupied | 471 (30.2%) | $42,992 |
| Average | 1,559 (100.0%) | $45,547 |
Occupancy by Householder Income Bracket in Jefferson
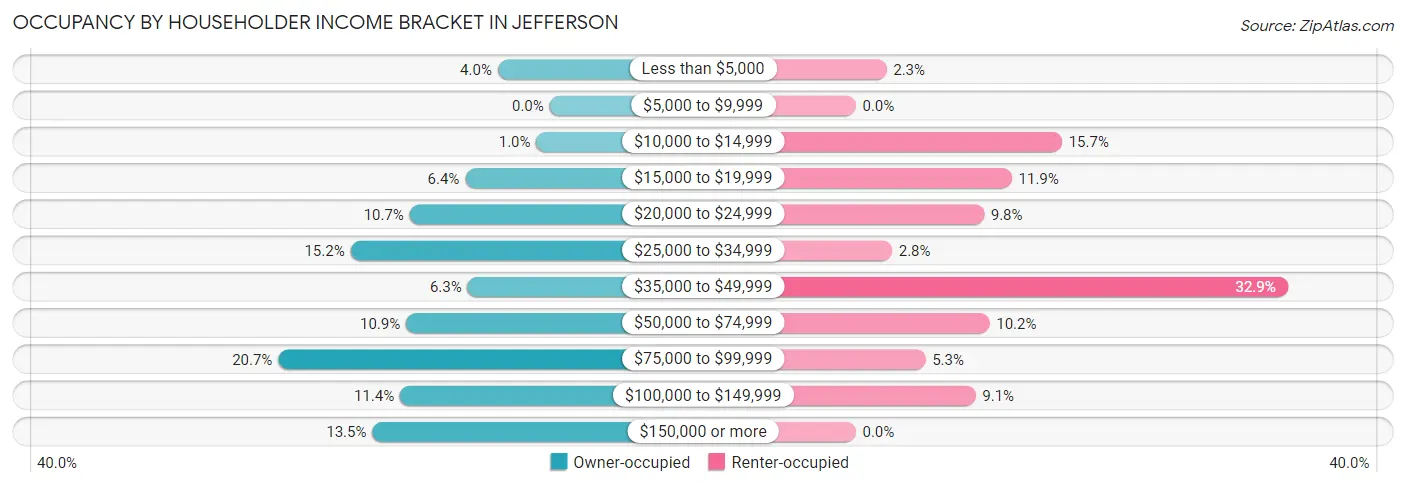
| Income Bracket | Owner-occupied | Renter-occupied |
| Less than $5,000 | 43 (4.0%) | 11 (2.3%) |
| $5,000 to $9,999 | 0 (0.0%) | 0 (0.0%) |
| $10,000 to $14,999 | 11 (1.0%) | 74 (15.7%) |
| $15,000 to $19,999 | 70 (6.4%) | 56 (11.9%) |
| $20,000 to $24,999 | 116 (10.7%) | 46 (9.8%) |
| $25,000 to $34,999 | 165 (15.2%) | 13 (2.8%) |
| $35,000 to $49,999 | 68 (6.2%) | 155 (32.9%) |
| $50,000 to $74,999 | 119 (10.9%) | 48 (10.2%) |
| $75,000 to $99,999 | 225 (20.7%) | 25 (5.3%) |
| $100,000 to $149,999 | 124 (11.4%) | 43 (9.1%) |
| $150,000 or more | 147 (13.5%) | 0 (0.0%) |
| Total | 1,088 (100.0%) | 471 (100.0%) |
Monthly Housing Cost Tiers in Jefferson
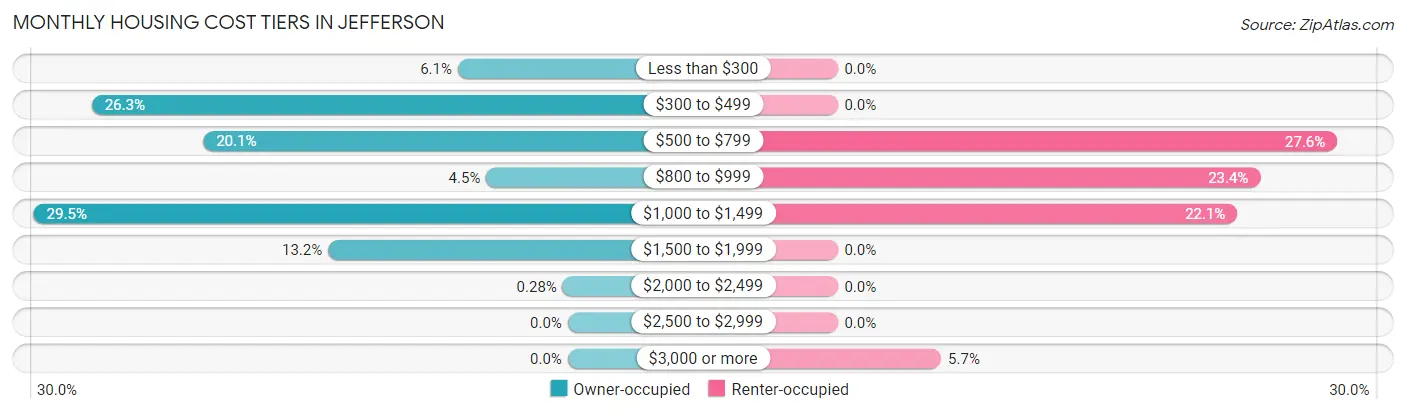
| Monthly Cost | Owner-occupied | Renter-occupied |
| Less than $300 | 66 (6.1%) | 0 (0.0%) |
| $300 to $499 | 286 (26.3%) | 0 (0.0%) |
| $500 to $799 | 219 (20.1%) | 130 (27.6%) |
| $800 to $999 | 49 (4.5%) | 110 (23.4%) |
| $1,000 to $1,499 | 321 (29.5%) | 104 (22.1%) |
| $1,500 to $1,999 | 144 (13.2%) | 0 (0.0%) |
| $2,000 to $2,499 | 3 (0.3%) | 0 (0.0%) |
| $2,500 to $2,999 | 0 (0.0%) | 0 (0.0%) |
| $3,000 or more | 0 (0.0%) | 27 (5.7%) |
| Total | 1,088 (100.0%) | 471 (100.0%) |
Physical Housing Characteristics in Jefferson
Housing Structures in Jefferson
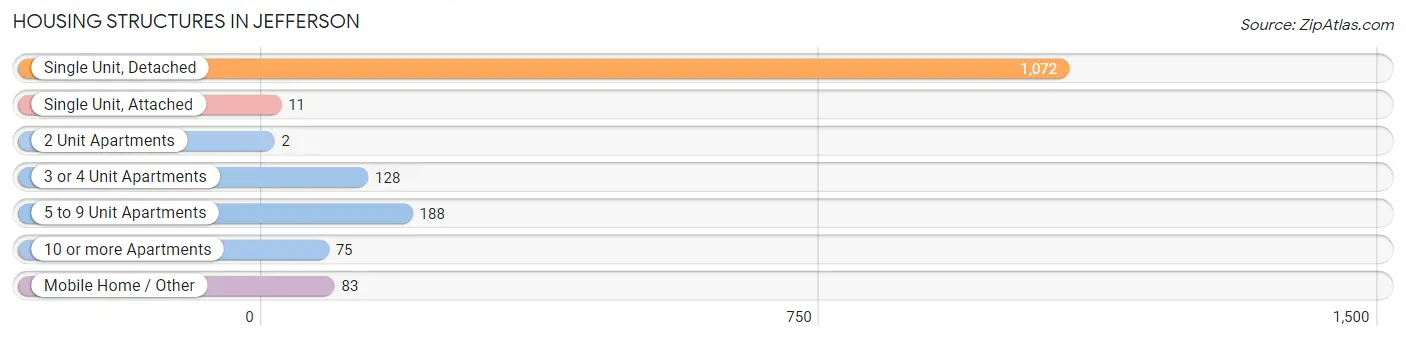
| Structure Type | # Housing Units | % Housing Units |
| Single Unit, Detached | 1,072 | 68.8% |
| Single Unit, Attached | 11 | 0.7% |
| 2 Unit Apartments | 2 | 0.1% |
| 3 or 4 Unit Apartments | 128 | 8.2% |
| 5 to 9 Unit Apartments | 188 | 12.1% |
| 10 or more Apartments | 75 | 4.8% |
| Mobile Home / Other | 83 | 5.3% |
| Total | 1,559 | 100.0% |
Housing Structures by Occupancy in Jefferson
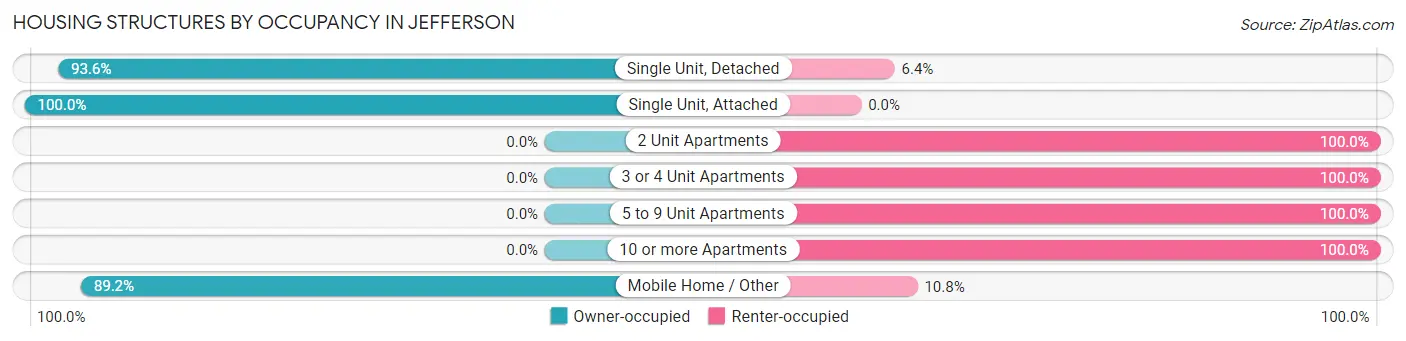
| Structure Type | Owner-occupied | Renter-occupied |
| Single Unit, Detached | 1,003 (93.6%) | 69 (6.4%) |
| Single Unit, Attached | 11 (100.0%) | 0 (0.0%) |
| 2 Unit Apartments | 0 (0.0%) | 2 (100.0%) |
| 3 or 4 Unit Apartments | 0 (0.0%) | 128 (100.0%) |
| 5 to 9 Unit Apartments | 0 (0.0%) | 188 (100.0%) |
| 10 or more Apartments | 0 (0.0%) | 75 (100.0%) |
| Mobile Home / Other | 74 (89.2%) | 9 (10.8%) |
| Total | 1,088 (69.8%) | 471 (30.2%) |
Housing Structures by Number of Rooms in Jefferson
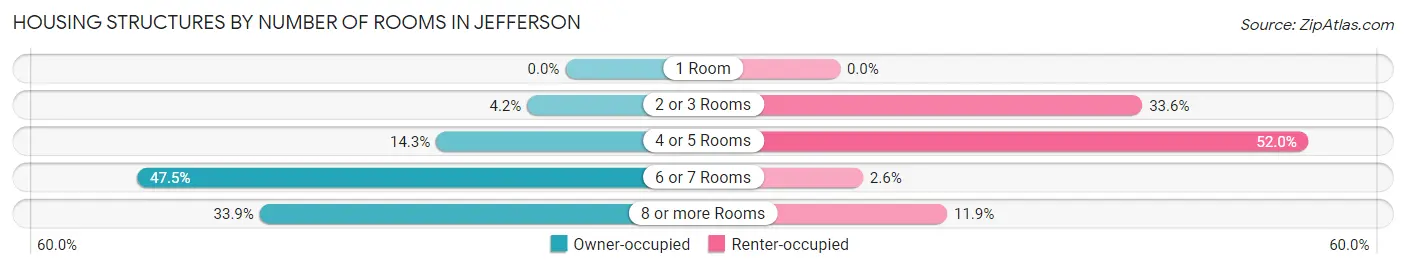
| Number of Rooms | Owner-occupied | Renter-occupied |
| 1 Room | 0 (0.0%) | 0 (0.0%) |
| 2 or 3 Rooms | 46 (4.2%) | 158 (33.6%) |
| 4 or 5 Rooms | 156 (14.3%) | 245 (52.0%) |
| 6 or 7 Rooms | 517 (47.5%) | 12 (2.5%) |
| 8 or more Rooms | 369 (33.9%) | 56 (11.9%) |
| Total | 1,088 (100.0%) | 471 (100.0%) |
Housing Structure by Heating Type in Jefferson
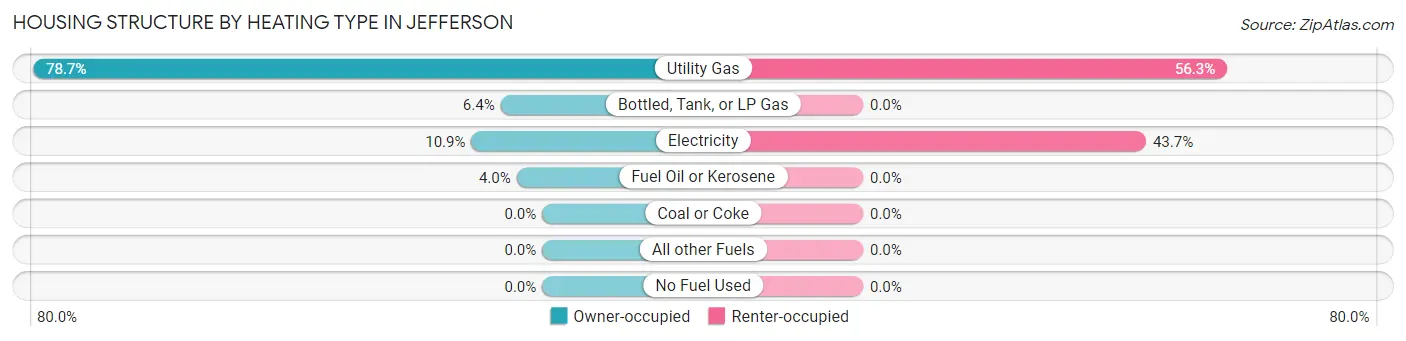
| Heating Type | Owner-occupied | Renter-occupied |
| Utility Gas | 856 (78.7%) | 265 (56.3%) |
| Bottled, Tank, or LP Gas | 70 (6.4%) | 0 (0.0%) |
| Electricity | 119 (10.9%) | 206 (43.7%) |
| Fuel Oil or Kerosene | 43 (4.0%) | 0 (0.0%) |
| Coal or Coke | 0 (0.0%) | 0 (0.0%) |
| All other Fuels | 0 (0.0%) | 0 (0.0%) |
| No Fuel Used | 0 (0.0%) | 0 (0.0%) |
| Total | 1,088 (100.0%) | 471 (100.0%) |
Household Vehicle Usage in Jefferson
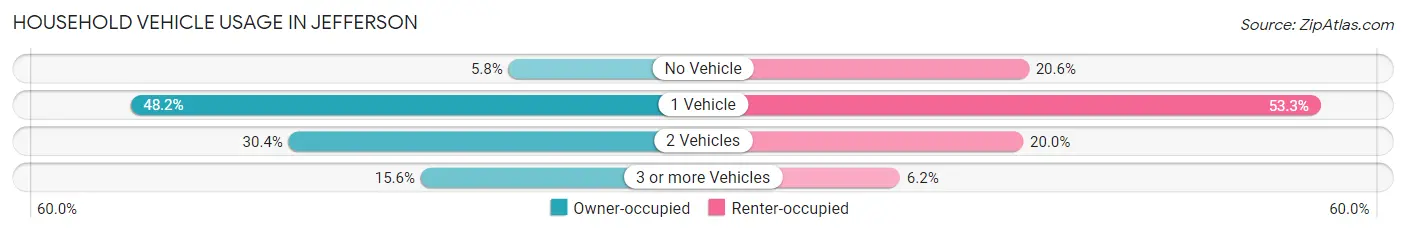
| Vehicles per Household | Owner-occupied | Renter-occupied |
| No Vehicle | 63 (5.8%) | 97 (20.6%) |
| 1 Vehicle | 524 (48.2%) | 251 (53.3%) |
| 2 Vehicles | 331 (30.4%) | 94 (20.0%) |
| 3 or more Vehicles | 170 (15.6%) | 29 (6.2%) |
| Total | 1,088 (100.0%) | 471 (100.0%) |
Real Estate & Mortgages in Jefferson
Real Estate and Mortgage Overview in Jefferson
| Characteristic | Without Mortgage | With Mortgage |
| Housing Units | 536 | 552 |
| Median Property Value | $192,600 | $169,900 |
| Median Household Income | $26,859 | $80 |
| Monthly Housing Costs | $416 | $0 |
| Real Estate Taxes | $2,370 | $0 |
Property Value by Mortgage Status in Jefferson
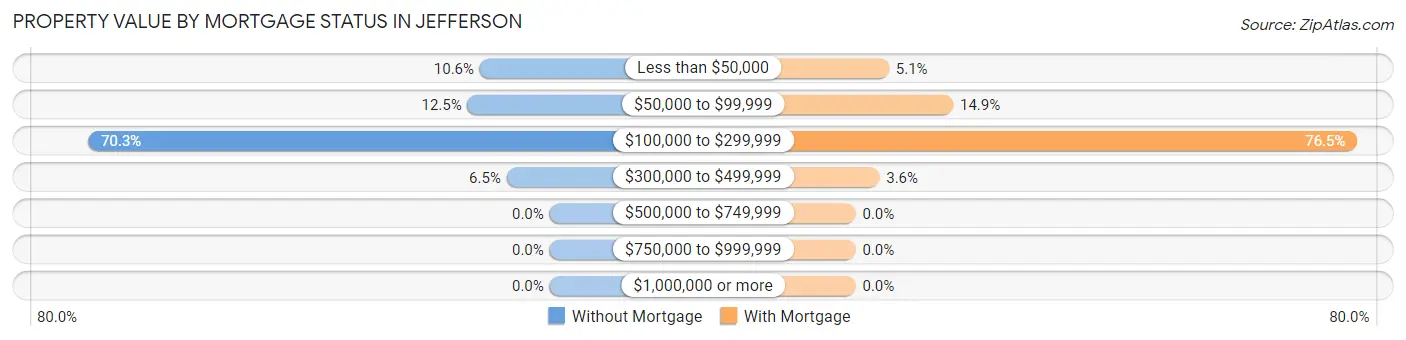
| Property Value | Without Mortgage | With Mortgage |
| Less than $50,000 | 57 (10.6%) | 28 (5.1%) |
| $50,000 to $99,999 | 67 (12.5%) | 82 (14.9%) |
| $100,000 to $299,999 | 377 (70.3%) | 422 (76.4%) |
| $300,000 to $499,999 | 35 (6.5%) | 20 (3.6%) |
| $500,000 to $749,999 | 0 (0.0%) | 0 (0.0%) |
| $750,000 to $999,999 | 0 (0.0%) | 0 (0.0%) |
| $1,000,000 or more | 0 (0.0%) | 0 (0.0%) |
| Total | 536 (100.0%) | 552 (100.0%) |
Household Income by Mortgage Status in Jefferson
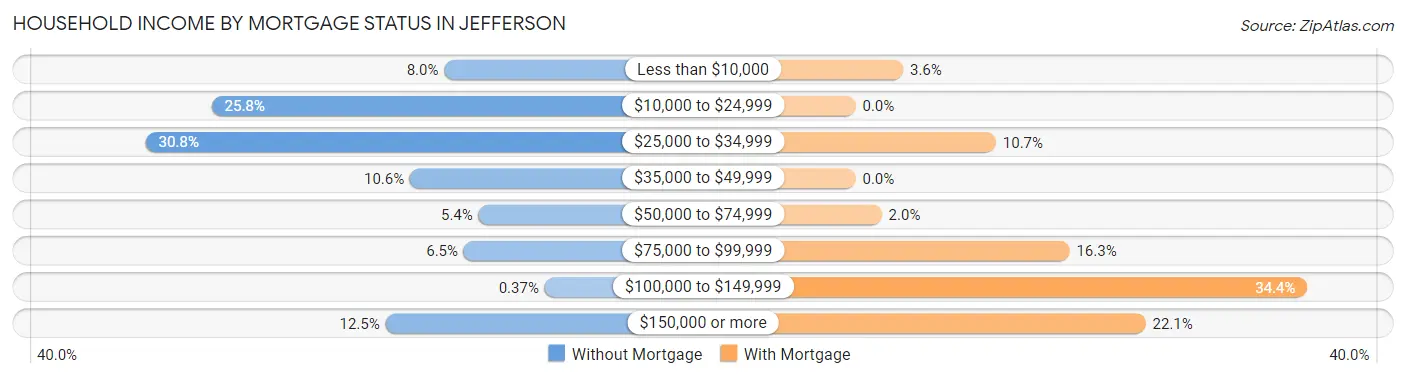
| Household Income | Without Mortgage | With Mortgage |
| Less than $10,000 | 43 (8.0%) | 20 (3.6%) |
| $10,000 to $24,999 | 138 (25.8%) | 0 (0.0%) |
| $25,000 to $34,999 | 165 (30.8%) | 59 (10.7%) |
| $35,000 to $49,999 | 57 (10.6%) | 0 (0.0%) |
| $50,000 to $74,999 | 29 (5.4%) | 11 (2.0%) |
| $75,000 to $99,999 | 35 (6.5%) | 90 (16.3%) |
| $100,000 to $149,999 | 2 (0.4%) | 190 (34.4%) |
| $150,000 or more | 67 (12.5%) | 122 (22.1%) |
| Total | 536 (100.0%) | 552 (100.0%) |
Property Value to Household Income Ratio in Jefferson
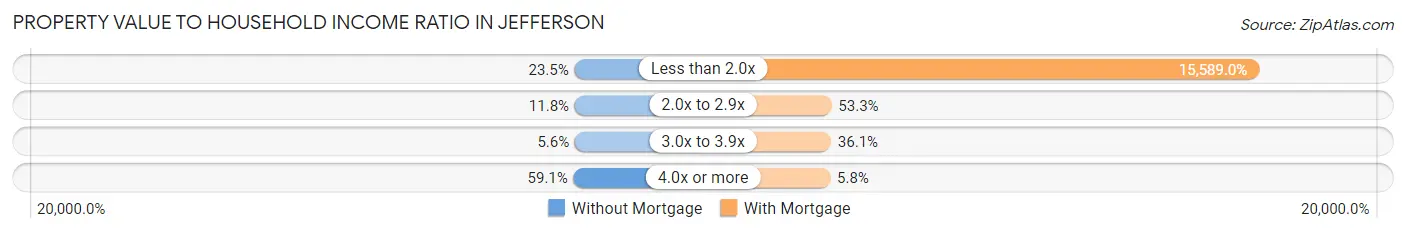
| Value-to-Income Ratio | Without Mortgage | With Mortgage |
| Less than 2.0x | 126 (23.5%) | 86,051 (15,588.9%) |
| 2.0x to 2.9x | 63 (11.7%) | 294 (53.3%) |
| 3.0x to 3.9x | 30 (5.6%) | 199 (36.0%) |
| 4.0x or more | 317 (59.1%) | 32 (5.8%) |
| Total | 536 (100.0%) | 552 (100.0%) |
Real Estate Taxes by Mortgage Status in Jefferson
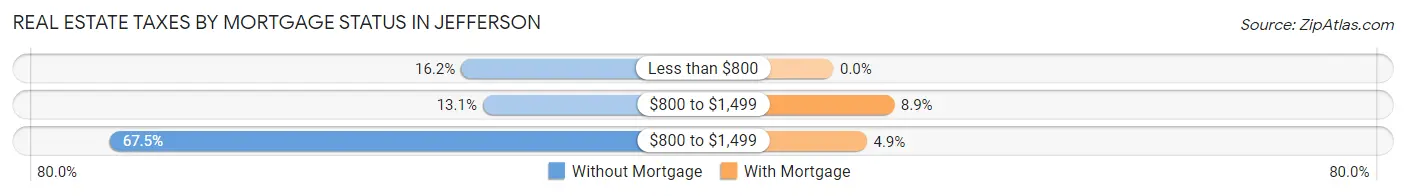
| Property Taxes | Without Mortgage | With Mortgage |
| Less than $800 | 87 (16.2%) | 0 (0.0%) |
| $800 to $1,499 | 70 (13.1%) | 49 (8.9%) |
| $800 to $1,499 | 362 (67.5%) | 27 (4.9%) |
| Total | 536 (100.0%) | 552 (100.0%) |
Health & Disability in Jefferson
Health Insurance Coverage by Age in Jefferson
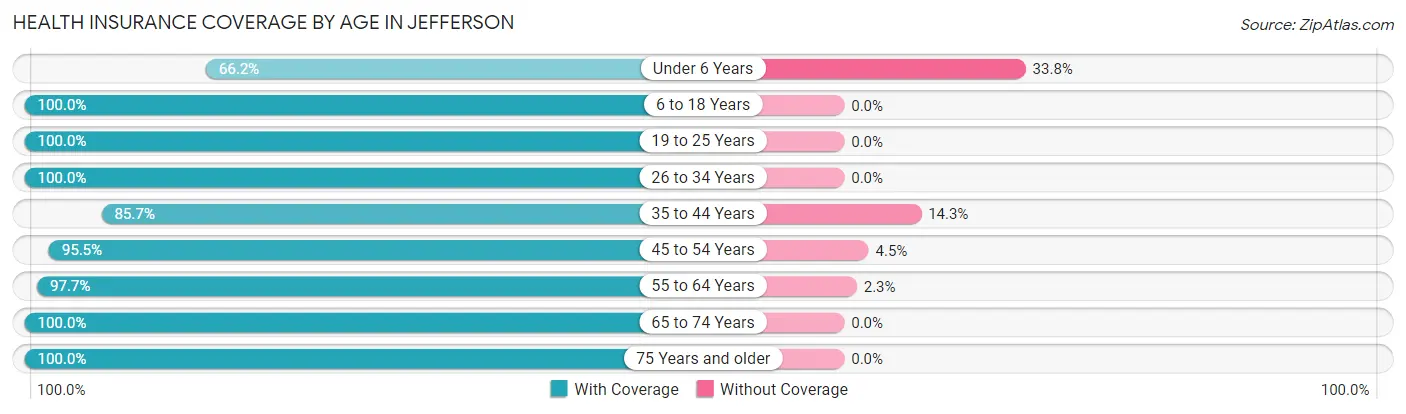
| Age Bracket | With Coverage | Without Coverage |
| Under 6 Years | 90 (66.2%) | 46 (33.8%) |
| 6 to 18 Years | 573 (100.0%) | 0 (0.0%) |
| 19 to 25 Years | 298 (100.0%) | 0 (0.0%) |
| 26 to 34 Years | 344 (100.0%) | 0 (0.0%) |
| 35 to 44 Years | 239 (85.7%) | 40 (14.3%) |
| 45 to 54 Years | 316 (95.5%) | 15 (4.5%) |
| 55 to 64 Years | 461 (97.7%) | 11 (2.3%) |
| 65 to 74 Years | 405 (100.0%) | 0 (0.0%) |
| 75 Years and older | 366 (100.0%) | 0 (0.0%) |
| Total | 3,092 (96.5%) | 112 (3.5%) |
Health Insurance Coverage by Citizenship Status in Jefferson
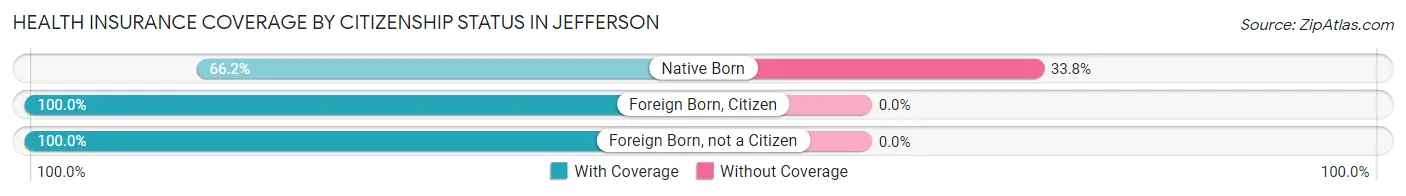
| Citizenship Status | With Coverage | Without Coverage |
| Native Born | 90 (66.2%) | 46 (33.8%) |
| Foreign Born, Citizen | 573 (100.0%) | 0 (0.0%) |
| Foreign Born, not a Citizen | 298 (100.0%) | 0 (0.0%) |
Health Insurance Coverage by Household Income in Jefferson
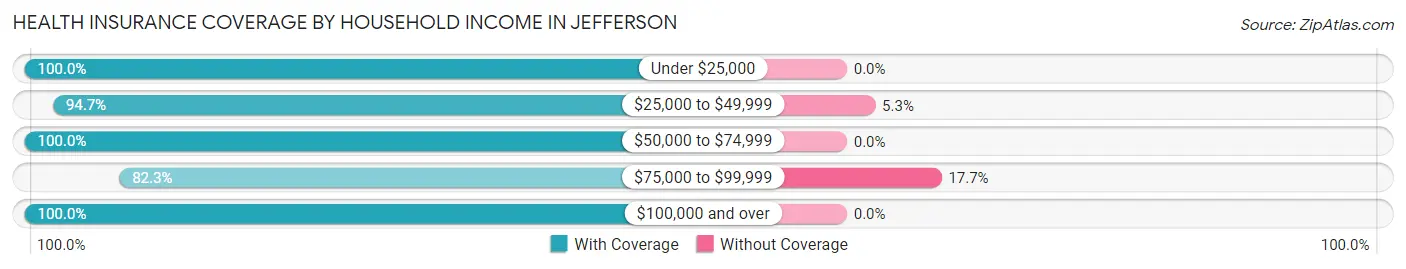
| Household Income | With Coverage | Without Coverage |
| Under $25,000 | 690 (100.0%) | 0 (0.0%) |
| $25,000 to $49,999 | 464 (94.7%) | 26 (5.3%) |
| $50,000 to $74,999 | 400 (100.0%) | 0 (0.0%) |
| $75,000 to $99,999 | 399 (82.3%) | 86 (17.7%) |
| $100,000 and over | 1,077 (100.0%) | 0 (0.0%) |
Public vs Private Health Insurance Coverage by Age in Jefferson
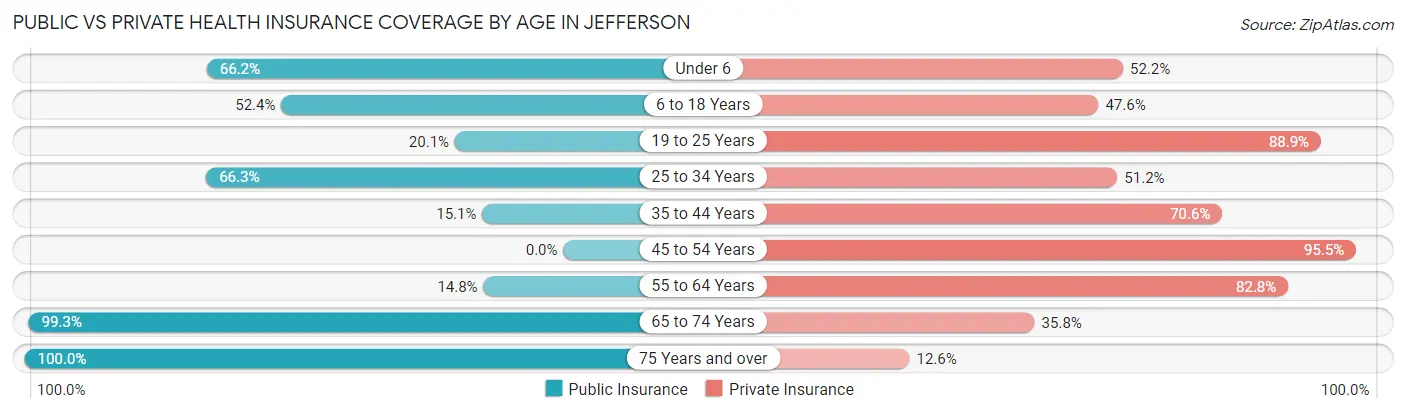
| Age Bracket | Public Insurance | Private Insurance |
| Under 6 | 90 (66.2%) | 71 (52.2%) |
| 6 to 18 Years | 300 (52.4%) | 273 (47.6%) |
| 19 to 25 Years | 60 (20.1%) | 265 (88.9%) |
| 25 to 34 Years | 228 (66.3%) | 176 (51.2%) |
| 35 to 44 Years | 42 (15.0%) | 197 (70.6%) |
| 45 to 54 Years | 0 (0.0%) | 316 (95.5%) |
| 55 to 64 Years | 70 (14.8%) | 391 (82.8%) |
| 65 to 74 Years | 402 (99.3%) | 145 (35.8%) |
| 75 Years and over | 366 (100.0%) | 46 (12.6%) |
| Total | 1,558 (48.6%) | 1,880 (58.7%) |
Disability Status by Sex by Age in Jefferson
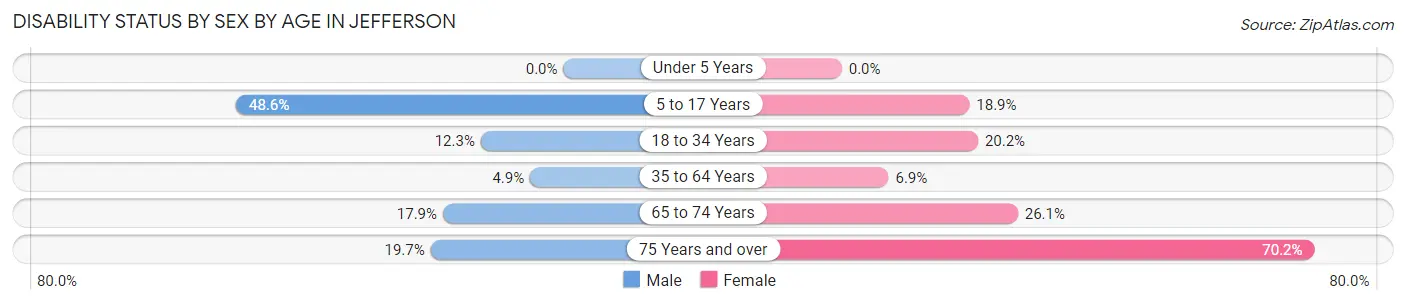
| Age Bracket | Male | Female |
| Under 5 Years | 0 (0.0%) | 0 (0.0%) |
| 5 to 17 Years | 209 (48.6%) | 25 (18.9%) |
| 18 to 34 Years | 60 (12.3%) | 37 (20.2%) |
| 35 to 64 Years | 25 (4.9%) | 40 (6.9%) |
| 65 to 74 Years | 17 (17.9%) | 81 (26.1%) |
| 75 Years and over | 14 (19.7%) | 207 (70.2%) |
Disability Class by Sex by Age in Jefferson
Disability Class: Hearing Difficulty
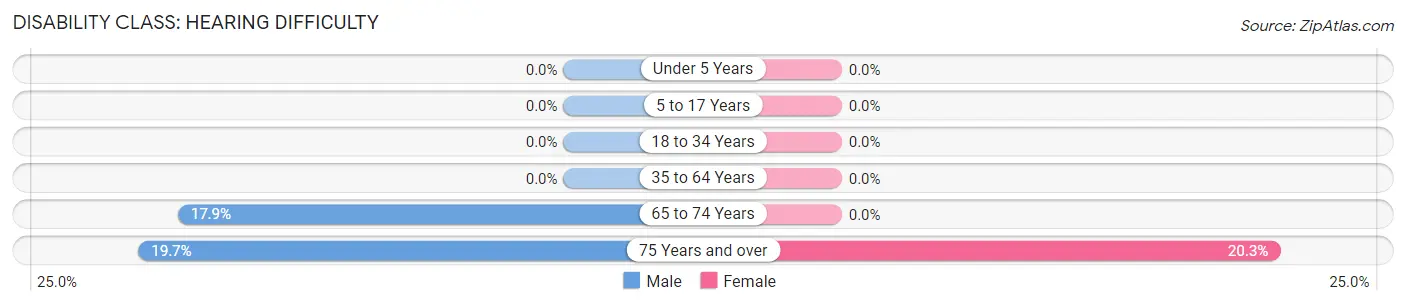
| Age Bracket | Male | Female |
| Under 5 Years | 0 (0.0%) | 0 (0.0%) |
| 5 to 17 Years | 0 (0.0%) | 0 (0.0%) |
| 18 to 34 Years | 0 (0.0%) | 0 (0.0%) |
| 35 to 64 Years | 0 (0.0%) | 0 (0.0%) |
| 65 to 74 Years | 17 (17.9%) | 0 (0.0%) |
| 75 Years and over | 14 (19.7%) | 60 (20.3%) |
Disability Class: Vision Difficulty
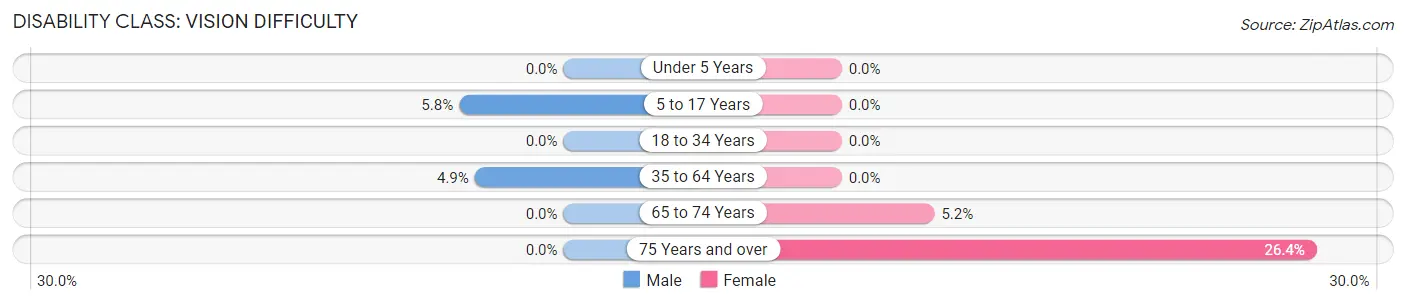
| Age Bracket | Male | Female |
| Under 5 Years | 0 (0.0%) | 0 (0.0%) |
| 5 to 17 Years | 25 (5.8%) | 0 (0.0%) |
| 18 to 34 Years | 0 (0.0%) | 0 (0.0%) |
| 35 to 64 Years | 25 (4.9%) | 0 (0.0%) |
| 65 to 74 Years | 0 (0.0%) | 16 (5.2%) |
| 75 Years and over | 0 (0.0%) | 78 (26.4%) |
Disability Class: Cognitive Difficulty
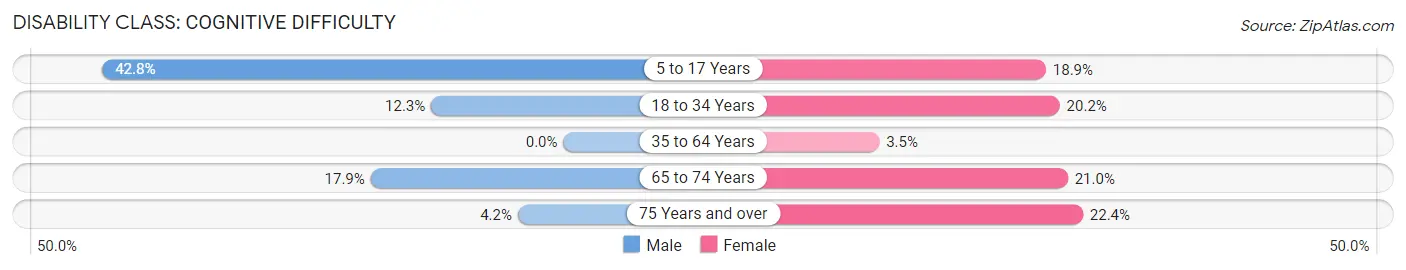
| Age Bracket | Male | Female |
| 5 to 17 Years | 184 (42.8%) | 25 (18.9%) |
| 18 to 34 Years | 60 (12.3%) | 37 (20.2%) |
| 35 to 64 Years | 0 (0.0%) | 20 (3.5%) |
| 65 to 74 Years | 17 (17.9%) | 65 (21.0%) |
| 75 Years and over | 3 (4.2%) | 66 (22.4%) |
Disability Class: Ambulatory Difficulty
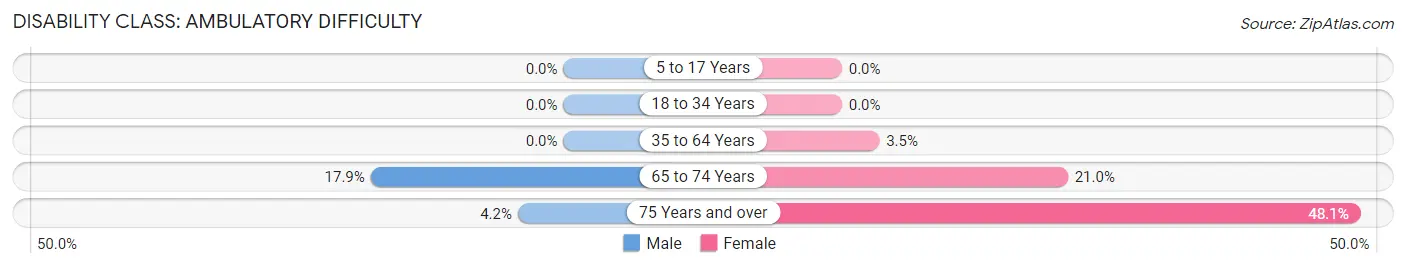
| Age Bracket | Male | Female |
| 5 to 17 Years | 0 (0.0%) | 0 (0.0%) |
| 18 to 34 Years | 0 (0.0%) | 0 (0.0%) |
| 35 to 64 Years | 0 (0.0%) | 20 (3.5%) |
| 65 to 74 Years | 17 (17.9%) | 65 (21.0%) |
| 75 Years and over | 3 (4.2%) | 142 (48.1%) |
Disability Class: Self-Care Difficulty
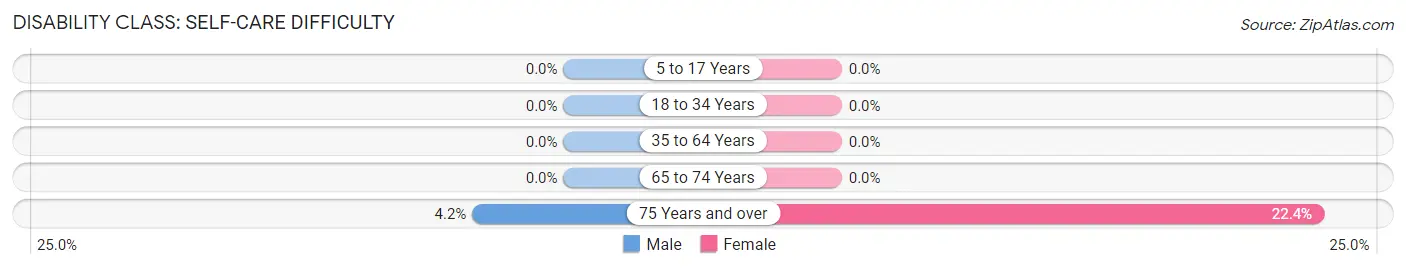
| Age Bracket | Male | Female |
| 5 to 17 Years | 0 (0.0%) | 0 (0.0%) |
| 18 to 34 Years | 0 (0.0%) | 0 (0.0%) |
| 35 to 64 Years | 0 (0.0%) | 0 (0.0%) |
| 65 to 74 Years | 0 (0.0%) | 0 (0.0%) |
| 75 Years and over | 3 (4.2%) | 66 (22.4%) |
Technology Access in Jefferson
Computing Device Access in Jefferson
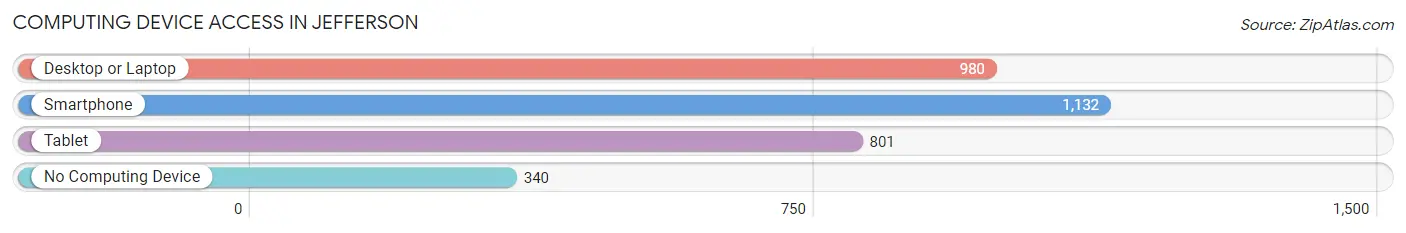
| Device Type | # Households | % Households |
| Desktop or Laptop | 980 | 62.9% |
| Smartphone | 1,132 | 72.6% |
| Tablet | 801 | 51.4% |
| No Computing Device | 340 | 21.8% |
| Total | 1,559 | 100.0% |
Internet Access in Jefferson
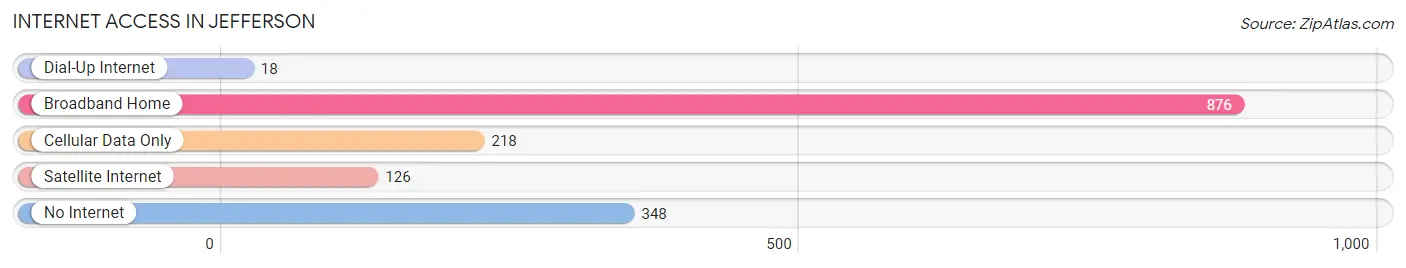
| Internet Type | # Households | % Households |
| Dial-Up Internet | 18 | 1.1% |
| Broadband Home | 876 | 56.2% |
| Cellular Data Only | 218 | 14.0% |
| Satellite Internet | 126 | 8.1% |
| No Internet | 348 | 22.3% |
| Total | 1,559 | 100.0% |
Jefferson Summary
Jefferson, Ohio is a small city located in Ashtabula County in the northeastern part of the state. It is situated on the banks of the Grand River, about 30 miles east of Cleveland. The city has a population of approximately 8,000 people and is part of the larger Ashtabula-Jefferson Metropolitan Statistical Area.
History
Jefferson was founded in 1806 by settlers from Connecticut. The city was named after Thomas Jefferson, the third president of the United States. The city was incorporated in 1837 and has since grown to become the largest city in Ashtabula County.
Geography
Jefferson is located in the northeastern part of Ohio, about 30 miles east of Cleveland. The city is situated on the banks of the Grand River and is surrounded by rolling hills and farmland. The city has a total area of 4.2 square miles, all of which is land.
Economy
Jefferson’s economy is largely based on manufacturing and agriculture. The city is home to several factories, including a steel mill, a paper mill, and a plastics plant. Agriculture is also an important part of the local economy, with corn, soybeans, and wheat being the main crops.
Demographics
As of the 2010 census, Jefferson had a population of 8,000 people. The racial makeup of the city was 95.2% White, 1.2% African American, 0.3% Native American, 0.7% Asian, 0.1% Pacific Islander, and 2.5% from other races. The median household income was $37,000 and the median family income was $45,000.
Conclusion
Jefferson, Ohio is a small city located in Ashtabula County in the northeastern part of the state. It was founded in 1806 and has since grown to become the largest city in the county. The city’s economy is largely based on manufacturing and agriculture, and its population is mostly white. Jefferson is a great place to live and work, and it offers a variety of activities and attractions for residents and visitors alike.
Common Questions
What is Per Capita Income in Jefferson?
Per Capita income in Jefferson is $33,180.
What is the Median Family Income in Jefferson?
Median Family Income in Jefferson is $82,566.
What is the Median Household income in Jefferson?
Median Household Income in Jefferson is $45,547.
What is Income or Wage Gap in Jefferson?
Income or Wage Gap in Jefferson is 31.3%.
Women in Jefferson earn 68.7 cents for every dollar earned by a man.
What is Inequality or Gini Index in Jefferson?
Inequality or Gini Index in Jefferson is 0.47.
What is the Total Population of Jefferson?
Total Population of Jefferson is 3,319.
What is the Total Male Population of Jefferson?
Total Male Population of Jefferson is 1,722.
What is the Total Female Population of Jefferson?
Total Female Population of Jefferson is 1,597.
What is the Ratio of Males per 100 Females in Jefferson?
There are 107.83 Males per 100 Females in Jefferson.
What is the Ratio of Females per 100 Males in Jefferson?
There are 92.74 Females per 100 Males in Jefferson.
What is the Median Population Age in Jefferson?
Median Population Age in Jefferson is 44.6 Years.
What is the Average Family Size in Jefferson
Average Family Size in Jefferson is 3.3 People.
What is the Average Household Size in Jefferson
Average Household Size in Jefferson is 2.0 People.
How Large is the Labor Force in Jefferson?
There are 1,783 People in the Labor Forcein in Jefferson.
What is the Percentage of People in the Labor Force in Jefferson?
61.9% of People are in the Labor Force in Jefferson.
What is the Unemployment Rate in Jefferson?
Unemployment Rate in Jefferson is 2.7%.