Wilhoit, AZ Map & Demographics
Wilhoit Map
Wilhoit Overview
$28,074
PER CAPITA INCOME
$74,861
AVG FAMILY INCOME
$43,882
AVG HOUSEHOLD INCOME
38.5%
WAGE / INCOME GAP [ % ]
61.5¢/ $1
WAGE / INCOME GAP [ $ ]
0.42
INEQUALITY / GINI INDEX
1,009
TOTAL POPULATION
555
MALE POPULATION
454
FEMALE POPULATION
122.25
MALES / 100 FEMALES
81.80
FEMALES / 100 MALES
52.8
MEDIAN AGE
2.8
AVG FAMILY SIZE
2.2
AVG HOUSEHOLD SIZE
360
LABOR FORCE [ PEOPLE ]
45.3%
PERCENT IN LABOR FORCE
Income in Wilhoit
Income Overview in Wilhoit
Per Capita Income in Wilhoit is $28,074, while median incomes of families and households are $74,861 and $43,882 respectively.
| Characteristic | Number | Measure |
| Per Capita Income | 1,009 | $28,074 |
| Median Family Income | 245 | $74,861 |
| Mean Family Income | 245 | $79,132 |
| Median Household Income | 465 | $43,882 |
| Mean Household Income | 465 | $58,815 |
| Income Deficit | 245 | $0 |
| Wage / Income Gap (%) | 1,009 | 38.47% |
| Wage / Income Gap ($) | 1,009 | 61.53¢ per $1 |
| Gini / Inequality Index | 1,009 | 0.42 |
Earnings by Sex in Wilhoit
Average Earnings in Wilhoit are $38,594, $49,000 for men and $30,152 for women, a difference of 38.5%.
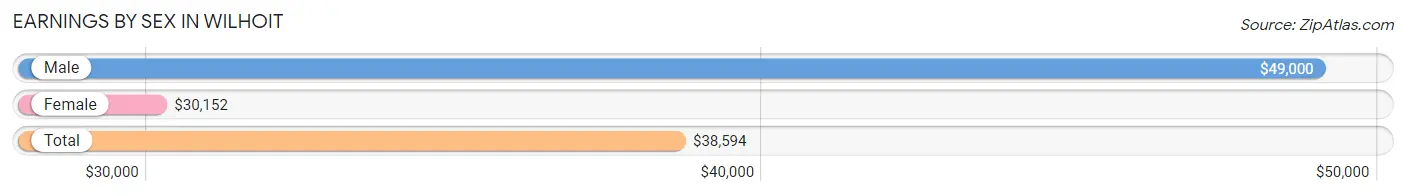
| Sex | Number | Average Earnings |
| Male | 184 (48.4%) | $49,000 |
| Female | 196 (51.6%) | $30,152 |
| Total | 380 (100.0%) | $38,594 |
Earnings by Sex by Income Bracket in Wilhoit
The most common earnings brackets in Wilhoit are $65,000 to $74,999 for men (29 | 15.8%) and $30,000 to $34,999 for women (33 | 16.8%).
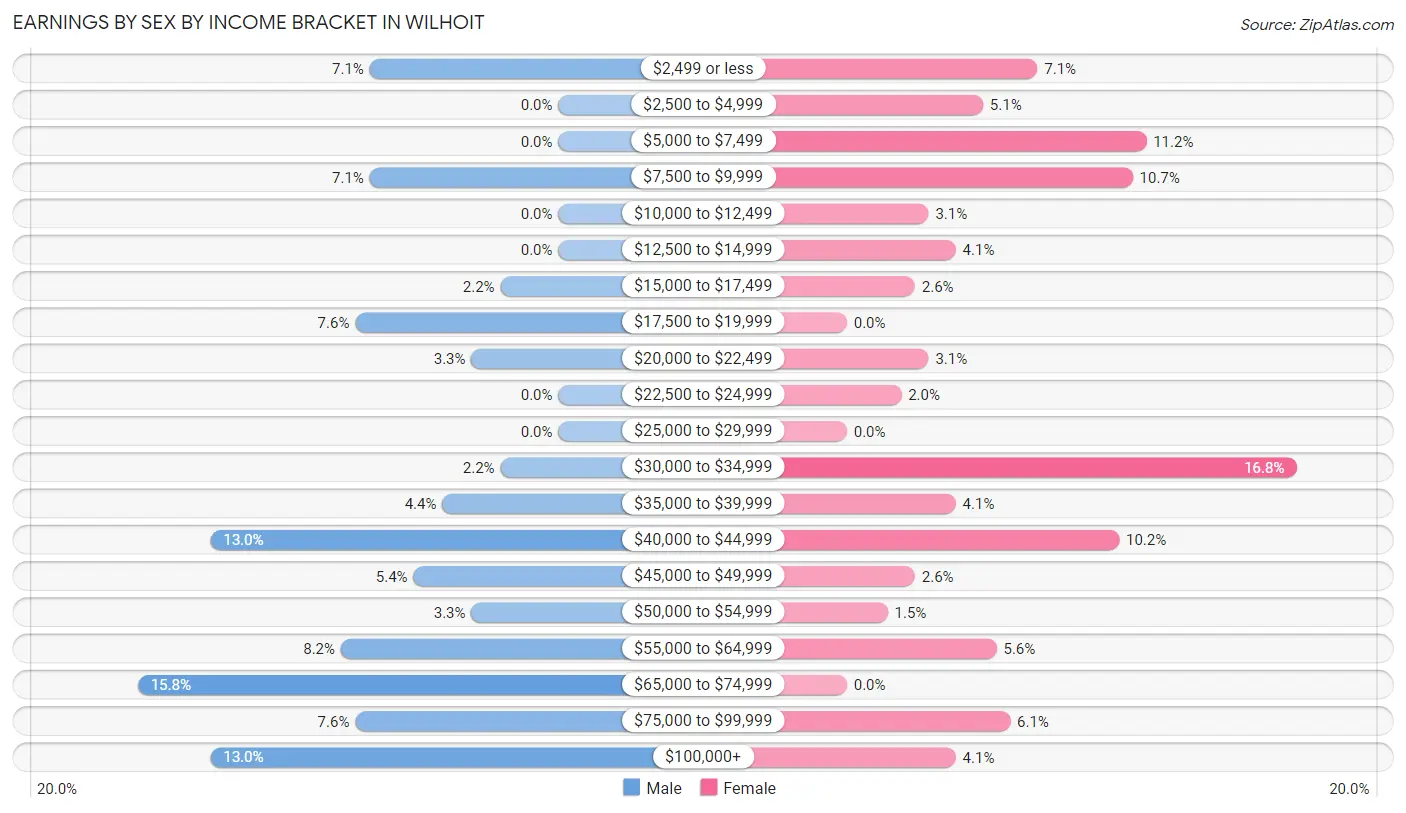
| Income | Male | Female |
| $2,499 or less | 13 (7.1%) | 14 (7.1%) |
| $2,500 to $4,999 | 0 (0.0%) | 10 (5.1%) |
| $5,000 to $7,499 | 0 (0.0%) | 22 (11.2%) |
| $7,500 to $9,999 | 13 (7.1%) | 21 (10.7%) |
| $10,000 to $12,499 | 0 (0.0%) | 6 (3.1%) |
| $12,500 to $14,999 | 0 (0.0%) | 8 (4.1%) |
| $15,000 to $17,499 | 4 (2.2%) | 5 (2.5%) |
| $17,500 to $19,999 | 14 (7.6%) | 0 (0.0%) |
| $20,000 to $22,499 | 6 (3.3%) | 6 (3.1%) |
| $22,500 to $24,999 | 0 (0.0%) | 4 (2.0%) |
| $25,000 to $29,999 | 0 (0.0%) | 0 (0.0%) |
| $30,000 to $34,999 | 4 (2.2%) | 33 (16.8%) |
| $35,000 to $39,999 | 8 (4.3%) | 8 (4.1%) |
| $40,000 to $44,999 | 24 (13.0%) | 20 (10.2%) |
| $45,000 to $49,999 | 10 (5.4%) | 5 (2.5%) |
| $50,000 to $54,999 | 6 (3.3%) | 3 (1.5%) |
| $55,000 to $64,999 | 15 (8.2%) | 11 (5.6%) |
| $65,000 to $74,999 | 29 (15.8%) | 0 (0.0%) |
| $75,000 to $99,999 | 14 (7.6%) | 12 (6.1%) |
| $100,000+ | 24 (13.0%) | 8 (4.1%) |
| Total | 184 (100.0%) | 196 (100.0%) |
Earnings by Sex by Educational Attainment in Wilhoit
Average earnings in Wilhoit are $49,750 for men and $30,379 for women, a difference of 38.9%. Men with an educational attainment of college or associate's degree enjoy the highest average annual earnings of $76,500, while those with high school diploma education earn the least with $49,625. Women with an educational attainment of bachelor's degree earn the most with the average annual earnings of $31,625, while those with bachelor's degree education have the smallest earnings of $31,625.
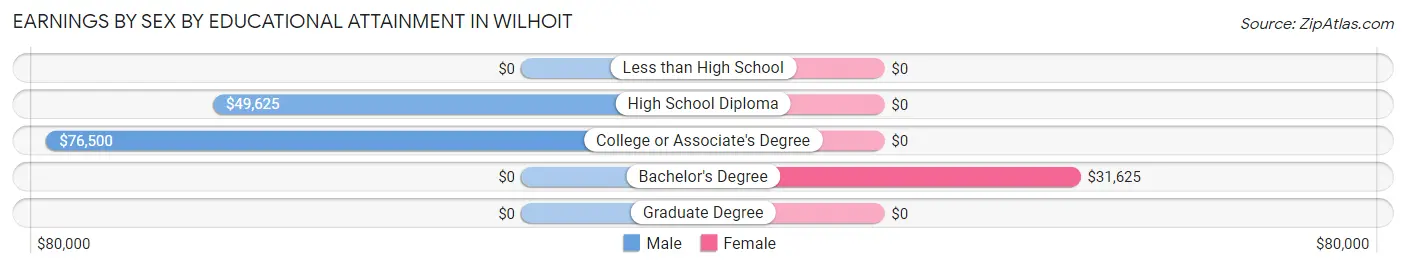
| Educational Attainment | Male Income | Female Income |
| Less than High School | - | - |
| High School Diploma | $49,625 | $0 |
| College or Associate's Degree | $76,500 | $0 |
| Bachelor's Degree | - | - |
| Graduate Degree | - | - |
| Total | $49,750 | $30,379 |
Family Income in Wilhoit
Family Income Brackets in Wilhoit
According to the Wilhoit family income data, there are 60 families falling into the $75,000 to $99,999 income range, which is the most common income bracket and makes up 24.5% of all families. Conversely, the $10,000 to $14,999 income bracket is the least frequent group with only 5 families (2.0%) belonging to this category.
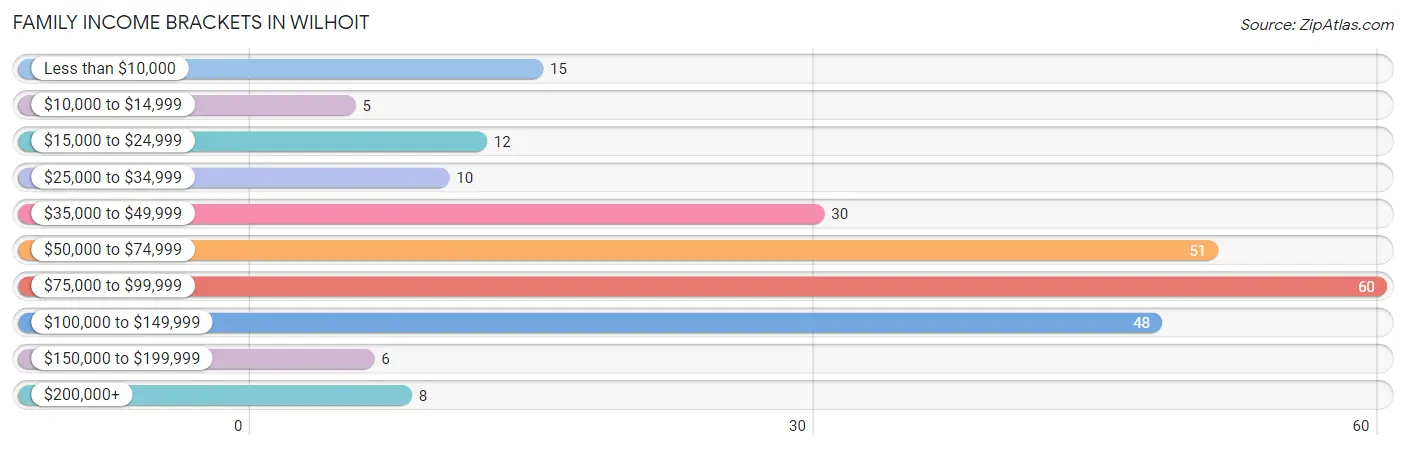
| Income Bracket | # Families | % Families |
| Less than $10,000 | 15 | 6.1% |
| $10,000 to $14,999 | 5 | 2.0% |
| $15,000 to $24,999 | 12 | 4.9% |
| $25,000 to $34,999 | 10 | 4.1% |
| $35,000 to $49,999 | 30 | 12.2% |
| $50,000 to $74,999 | 51 | 20.8% |
| $75,000 to $99,999 | 60 | 24.5% |
| $100,000 to $149,999 | 48 | 19.6% |
| $150,000 to $199,999 | 6 | 2.4% |
| $200,000+ | 8 | 3.3% |
Family Income by Famaliy Size in Wilhoit
3-person families (16 | 6.5%) account for the highest median family income in Wilhoit with $84,167 per family, while 2-person families (164 | 66.9%) have the highest median income of $31,058 per family member.
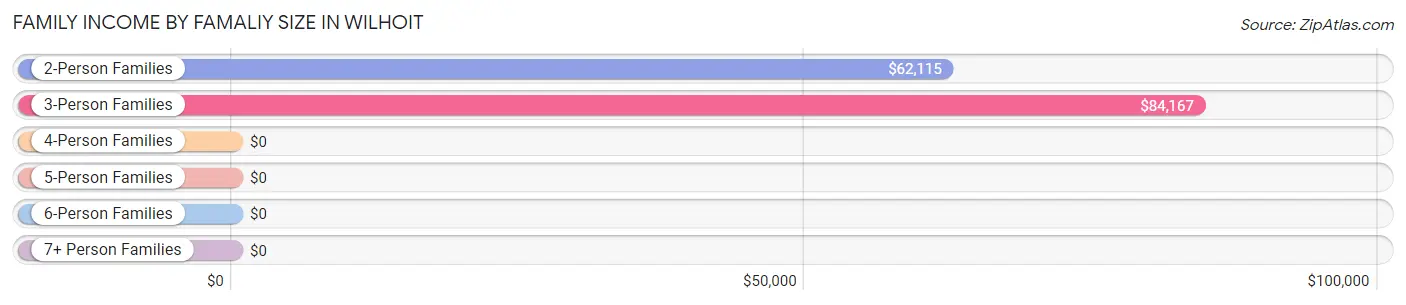
| Income Bracket | # Families | Median Income |
| 2-Person Families | 164 (66.9%) | $62,115 |
| 3-Person Families | 16 (6.5%) | $84,167 |
| 4-Person Families | 48 (19.6%) | $0 |
| 5-Person Families | 12 (4.9%) | $0 |
| 6-Person Families | 5 (2.0%) | $0 |
| 7+ Person Families | 0 (0.0%) | $0 |
| Total | 245 (100.0%) | $74,861 |
Family Income by Number of Earners in Wilhoit
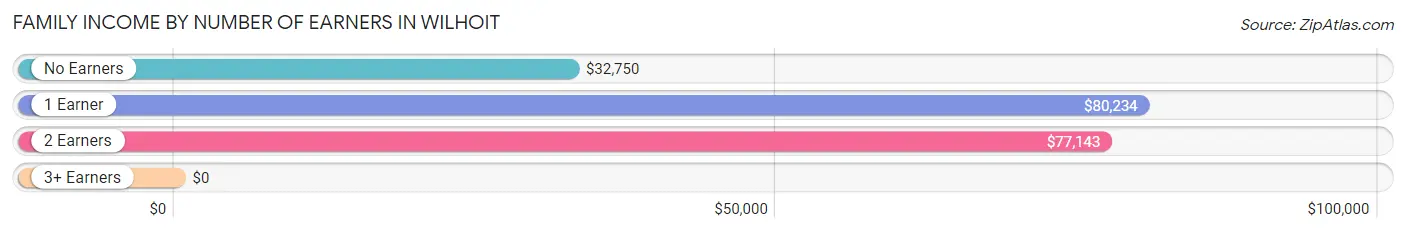
| Number of Earners | # Families | Median Income |
| No Earners | 55 (22.5%) | $32,750 |
| 1 Earner | 89 (36.3%) | $80,234 |
| 2 Earners | 98 (40.0%) | $77,143 |
| 3+ Earners | 3 (1.2%) | $0 |
| Total | 245 (100.0%) | $74,861 |
Household Income in Wilhoit
Household Income Brackets in Wilhoit
With 72 households falling in the category, the $75,000 to $99,999 income range is the most frequent in Wilhoit, accounting for 15.5% of all households. In contrast, only 6 households (1.3%) fall into the $150,000 to $199,999 income bracket, making it the least populous group.
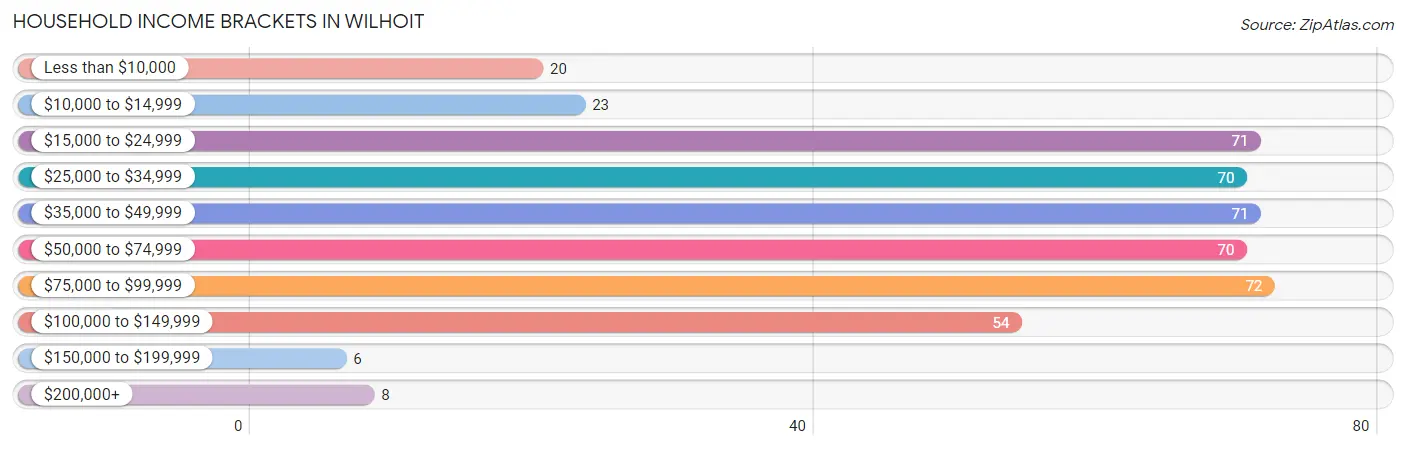
| Income Bracket | # Households | % Households |
| Less than $10,000 | 20 | 4.3% |
| $10,000 to $14,999 | 23 | 4.9% |
| $15,000 to $24,999 | 71 | 15.3% |
| $25,000 to $34,999 | 70 | 15.1% |
| $35,000 to $49,999 | 71 | 15.3% |
| $50,000 to $74,999 | 70 | 15.1% |
| $75,000 to $99,999 | 72 | 15.5% |
| $100,000 to $149,999 | 54 | 11.6% |
| $150,000 to $199,999 | 6 | 1.3% |
| $200,000+ | 8 | 1.7% |
Household Income by Householder Age in Wilhoit
The median household income in Wilhoit is $43,882, with the highest median household income of $75,119 found in the 45 to 64 years age bracket for the primary householder. A total of 172 households (37.0%) fall into this category.
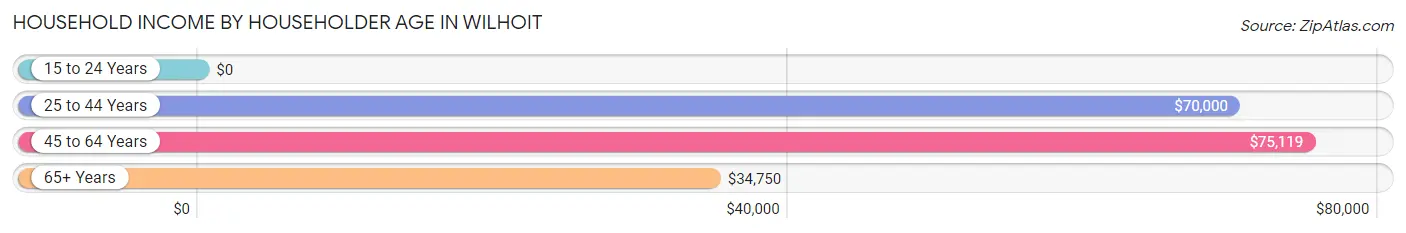
| Income Bracket | # Households | Median Income |
| 15 to 24 Years | 0 (0.0%) | $0 |
| 25 to 44 Years | 64 (13.8%) | $70,000 |
| 45 to 64 Years | 172 (37.0%) | $75,119 |
| 65+ Years | 229 (49.2%) | $34,750 |
| Total | 465 (100.0%) | $43,882 |
Poverty in Wilhoit
Income Below Poverty by Sex and Age in Wilhoit
With 20.4% poverty level for males and 20.3% for females among the residents of Wilhoit, 15 year old males and 16 and 17 year old females are the most vulnerable to poverty, with 6 males (100.0%) and 6 females (100.0%) in their respective age groups living below the poverty level.
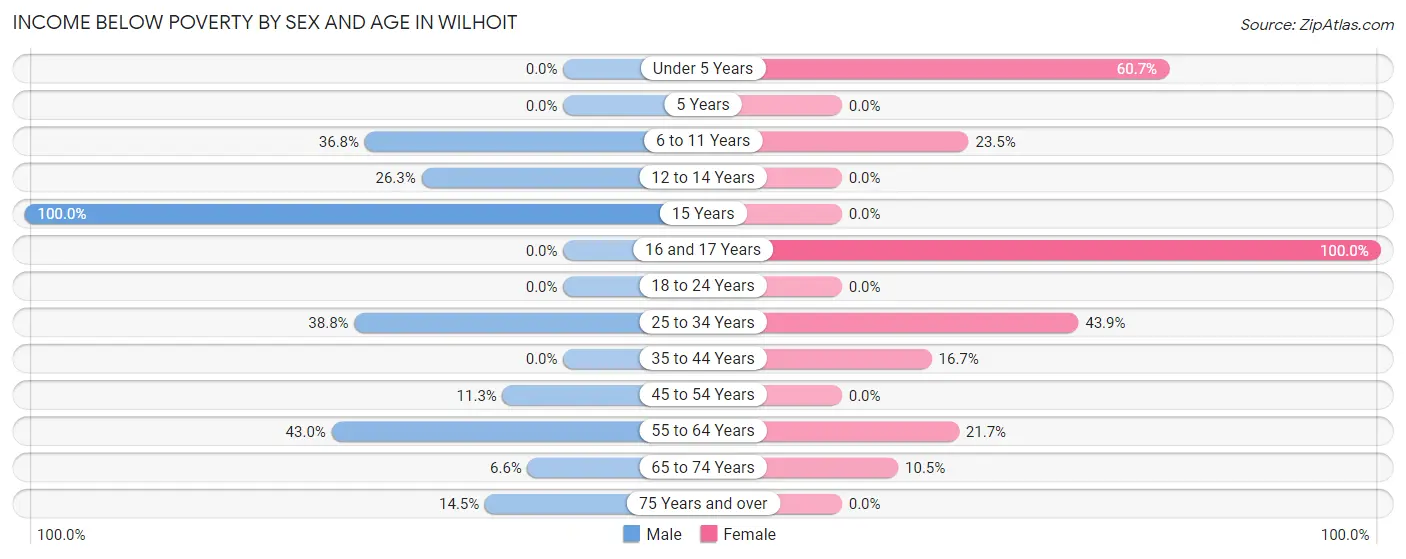
| Age Bracket | Male | Female |
| Under 5 Years | 0 (0.0%) | 17 (60.7%) |
| 5 Years | 0 (0.0%) | 0 (0.0%) |
| 6 to 11 Years | 14 (36.8%) | 8 (23.5%) |
| 12 to 14 Years | 5 (26.3%) | 0 (0.0%) |
| 15 Years | 6 (100.0%) | 0 (0.0%) |
| 16 and 17 Years | 0 (0.0%) | 6 (100.0%) |
| 18 to 24 Years | 0 (0.0%) | 0 (0.0%) |
| 25 to 34 Years | 19 (38.8%) | 18 (43.9%) |
| 35 to 44 Years | 0 (0.0%) | 8 (16.7%) |
| 45 to 54 Years | 8 (11.3%) | 0 (0.0%) |
| 55 to 64 Years | 40 (43.0%) | 25 (21.7%) |
| 65 to 74 Years | 9 (6.6%) | 7 (10.4%) |
| 75 Years and over | 9 (14.5%) | 0 (0.0%) |
| Total | 110 (20.4%) | 89 (20.3%) |
Income Above Poverty by Sex and Age in Wilhoit
According to the poverty statistics in Wilhoit, males aged under 5 years and females aged 12 to 14 years are the age groups that are most secure financially, with 100.0% of males and 100.0% of females in these age groups living above the poverty line.
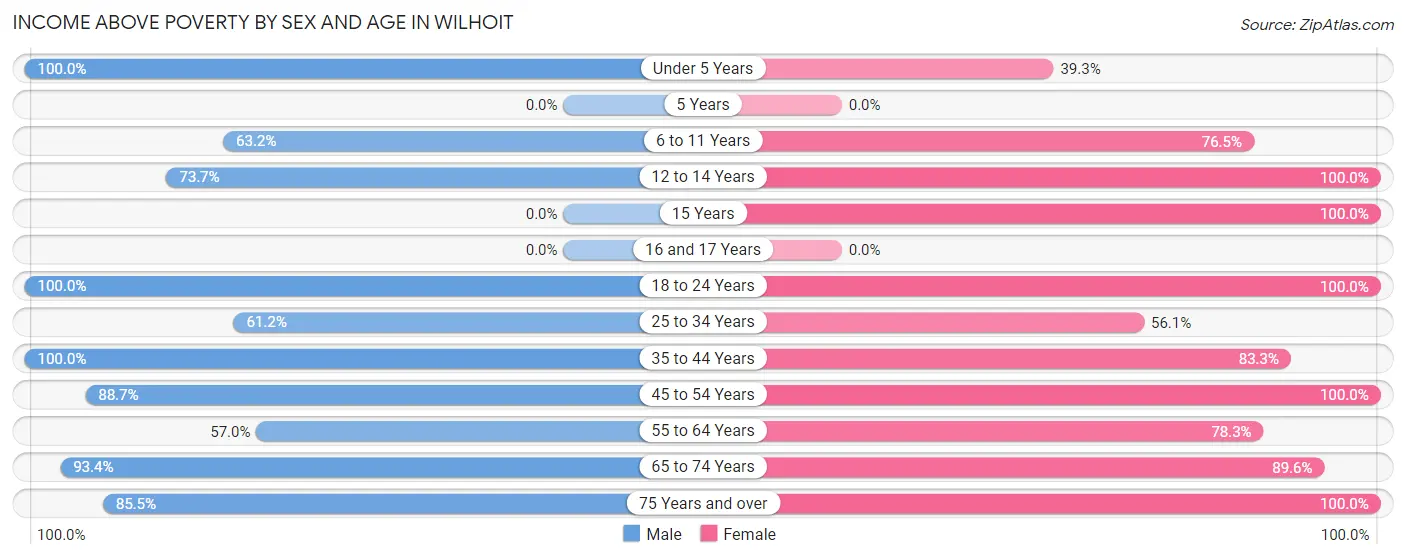
| Age Bracket | Male | Female |
| Under 5 Years | 28 (100.0%) | 11 (39.3%) |
| 5 Years | 0 (0.0%) | 0 (0.0%) |
| 6 to 11 Years | 24 (63.2%) | 26 (76.5%) |
| 12 to 14 Years | 14 (73.7%) | 23 (100.0%) |
| 15 Years | 0 (0.0%) | 6 (100.0%) |
| 16 and 17 Years | 0 (0.0%) | 0 (0.0%) |
| 18 to 24 Years | 6 (100.0%) | 6 (100.0%) |
| 25 to 34 Years | 30 (61.2%) | 23 (56.1%) |
| 35 to 44 Years | 30 (100.0%) | 40 (83.3%) |
| 45 to 54 Years | 63 (88.7%) | 43 (100.0%) |
| 55 to 64 Years | 53 (57.0%) | 90 (78.3%) |
| 65 to 74 Years | 127 (93.4%) | 60 (89.5%) |
| 75 Years and over | 53 (85.5%) | 22 (100.0%) |
| Total | 428 (79.5%) | 350 (79.7%) |
Income Below Poverty Among Married-Couple Families in Wilhoit
The poverty statistics for married-couple families in Wilhoit show that 11.1% or 19 of the total 172 families live below the poverty line. Families with 3 or 4 children have the highest poverty rate of 29.4%, comprising of 5 families. On the other hand, families with no children have the lowest poverty rate of 4.3%, which includes 5 families.
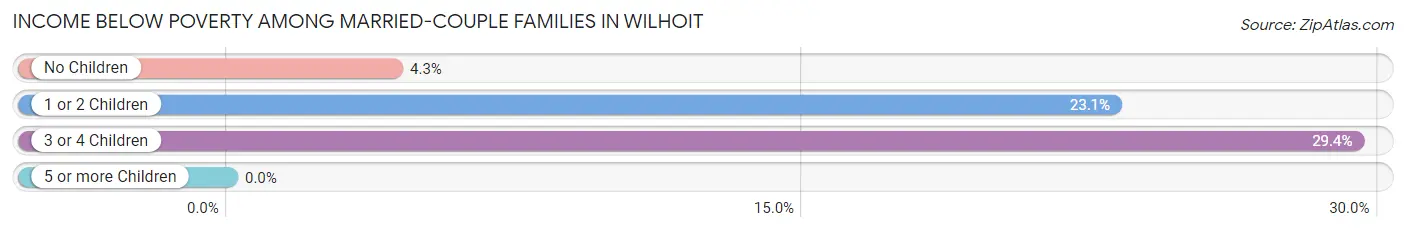
| Children | Above Poverty | Below Poverty |
| No Children | 111 (95.7%) | 5 (4.3%) |
| 1 or 2 Children | 30 (76.9%) | 9 (23.1%) |
| 3 or 4 Children | 12 (70.6%) | 5 (29.4%) |
| 5 or more Children | 0 (0.0%) | 0 (0.0%) |
| Total | 153 (88.9%) | 19 (11.1%) |
Income Below Poverty Among Single-Parent Households in Wilhoit
According to the poverty data in Wilhoit, 27.8% or 5 single-father households and 18.2% or 10 single-mother households are living below the poverty line. Among single-father households, those with no children have the highest poverty rate, with 5 households (62.5%) experiencing poverty. Likewise, among single-mother households, those with 3 or 4 children have the highest poverty rate, with 10 households (100.0%) falling below the poverty line.
| Children | Single Father | Single Mother |
| No Children | 5 (62.5%) | 0 (0.0%) |
| 1 or 2 Children | 0 (0.0%) | 0 (0.0%) |
| 3 or 4 Children | 0 (0.0%) | 10 (100.0%) |
| 5 or more Children | 0 (0.0%) | 0 (0.0%) |
| Total | 5 (27.8%) | 10 (18.2%) |
Income Below Poverty Among Married-Couple vs Single-Parent Households in Wilhoit
The poverty data for Wilhoit shows that 19 of the married-couple family households (11.1%) and 15 of the single-parent households (20.5%) are living below the poverty level. Within the married-couple family households, those with 3 or 4 children have the highest poverty rate, with 5 households (29.4%) falling below the poverty line. Among the single-parent households, those with 3 or 4 children have the highest poverty rate, with 10 household (100.0%) living below poverty.
| Children | Married-Couple Families | Single-Parent Households |
| No Children | 5 (4.3%) | 5 (12.2%) |
| 1 or 2 Children | 9 (23.1%) | 0 (0.0%) |
| 3 or 4 Children | 5 (29.4%) | 10 (100.0%) |
| 5 or more Children | 0 (0.0%) | 0 (0.0%) |
| Total | 19 (11.1%) | 15 (20.5%) |
Race in Wilhoit
The most populous races in Wilhoit are White / Caucasian (926 | 91.8%), Hispanic or Latino (109 | 10.8%), and Two or more Races (81 | 8.0%).
| Race | # Population | % Population |
| Asian | 0 | 0.0% |
| Black / African American | 0 | 0.0% |
| Hawaiian / Pacific | 0 | 0.0% |
| Hispanic or Latino | 109 | 10.8% |
| Native / Alaskan | 0 | 0.0% |
| White / Caucasian | 926 | 91.8% |
| Two or more Races | 81 | 8.0% |
| Some other Race | 2 | 0.2% |
| Total | 1,009 | 100.0% |
Ancestry in Wilhoit
The most populous ancestries reported in Wilhoit are Irish (178 | 17.6%), English (138 | 13.7%), American (120 | 11.9%), Mexican (109 | 10.8%), and German (104 | 10.3%), together accounting for 64.3% of all Wilhoit residents.
| Ancestry | # Population | % Population |
| American | 120 | 11.9% |
| Blackfeet | 3 | 0.3% |
| British | 17 | 1.7% |
| Canadian | 5 | 0.5% |
| Cherokee | 33 | 3.3% |
| Chippewa | 13 | 1.3% |
| Choctaw | 27 | 2.7% |
| Czech | 27 | 2.7% |
| Dutch | 16 | 1.6% |
| Eastern European | 4 | 0.4% |
| English | 138 | 13.7% |
| European | 12 | 1.2% |
| French Canadian | 2 | 0.2% |
| German | 104 | 10.3% |
| Hungarian | 13 | 1.3% |
| Irish | 178 | 17.6% |
| Italian | 14 | 1.4% |
| Mexican | 109 | 10.8% |
| Polish | 3 | 0.3% |
| Scandinavian | 9 | 0.9% |
| Scotch-Irish | 35 | 3.5% |
| Swedish | 3 | 0.3% |
| Welsh | 4 | 0.4% | View All 23 Rows |
Immigrants in Wilhoit
The most numerous immigrant groups reported in Wilhoit came from Europe (36 | 3.6%), Czechoslovakia (32 | 3.2%), Eastern Europe (32 | 3.2%), Central America (5 | 0.5%), and Latin America (5 | 0.5%), together accounting for 10.9% of all Wilhoit residents.
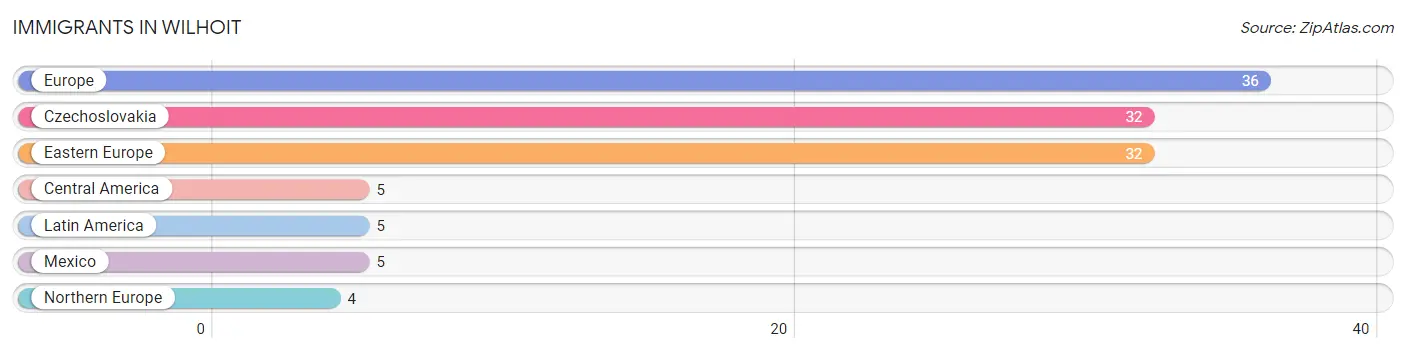
| Immigration Origin | # Population | % Population |
| Central America | 5 | 0.5% |
| Czechoslovakia | 32 | 3.2% |
| Eastern Europe | 32 | 3.2% |
| Europe | 36 | 3.6% |
| Latin America | 5 | 0.5% |
| Mexico | 5 | 0.5% |
| Northern Europe | 4 | 0.4% | View All 7 Rows |
Sex and Age in Wilhoit
Sex and Age in Wilhoit
The most populous age groups in Wilhoit are 70 to 74 Years (79 | 14.2%) for men and 55 to 59 Years (83 | 18.3%) for women.
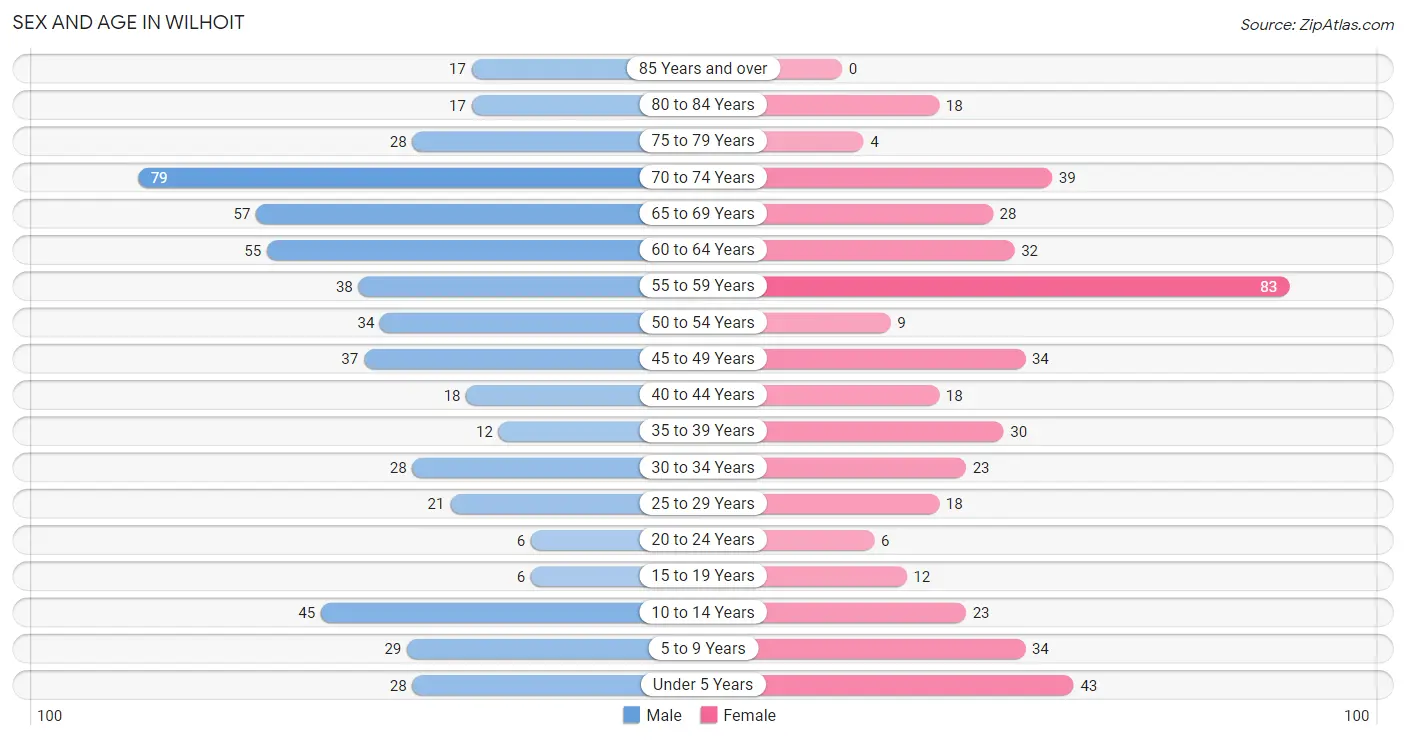
| Age Bracket | Male | Female |
| Under 5 Years | 28 (5.1%) | 43 (9.5%) |
| 5 to 9 Years | 29 (5.2%) | 34 (7.5%) |
| 10 to 14 Years | 45 (8.1%) | 23 (5.1%) |
| 15 to 19 Years | 6 (1.1%) | 12 (2.6%) |
| 20 to 24 Years | 6 (1.1%) | 6 (1.3%) |
| 25 to 29 Years | 21 (3.8%) | 18 (4.0%) |
| 30 to 34 Years | 28 (5.1%) | 23 (5.1%) |
| 35 to 39 Years | 12 (2.2%) | 30 (6.6%) |
| 40 to 44 Years | 18 (3.2%) | 18 (4.0%) |
| 45 to 49 Years | 37 (6.7%) | 34 (7.5%) |
| 50 to 54 Years | 34 (6.1%) | 9 (2.0%) |
| 55 to 59 Years | 38 (6.9%) | 83 (18.3%) |
| 60 to 64 Years | 55 (9.9%) | 32 (7.0%) |
| 65 to 69 Years | 57 (10.3%) | 28 (6.2%) |
| 70 to 74 Years | 79 (14.2%) | 39 (8.6%) |
| 75 to 79 Years | 28 (5.1%) | 4 (0.9%) |
| 80 to 84 Years | 17 (3.1%) | 18 (4.0%) |
| 85 Years and over | 17 (3.1%) | 0 (0.0%) |
| Total | 555 (100.0%) | 454 (100.0%) |
Families and Households in Wilhoit
Median Family Size in Wilhoit
The median family size in Wilhoit is 2.82 persons per family, with married-couple families (172 | 70.2%) accounting for the largest median family size of 2.92 persons per family. On the other hand, single male/father families (18 | 7.3%) represent the smallest median family size with 2.11 persons per family.
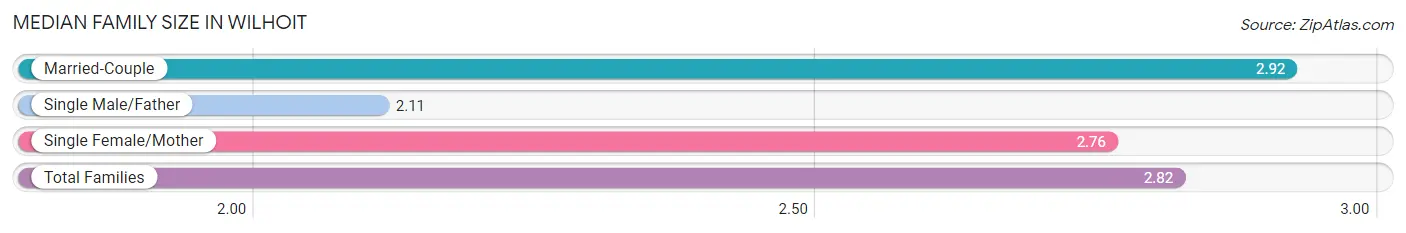
| Family Type | # Families | Family Size |
| Married-Couple | 172 (70.2%) | 2.92 |
| Single Male/Father | 18 (7.3%) | 2.11 |
| Single Female/Mother | 55 (22.5%) | 2.76 |
| Total Families | 245 (100.0%) | 2.82 |
Median Household Size in Wilhoit
The median household size in Wilhoit is 2.17 persons per household, with single male/father households (18 | 3.9%) accounting for the largest median household size of 4.78 persons per household. non-family households (220 | 47.3%) represent the smallest median household size with 1.15 persons per household.
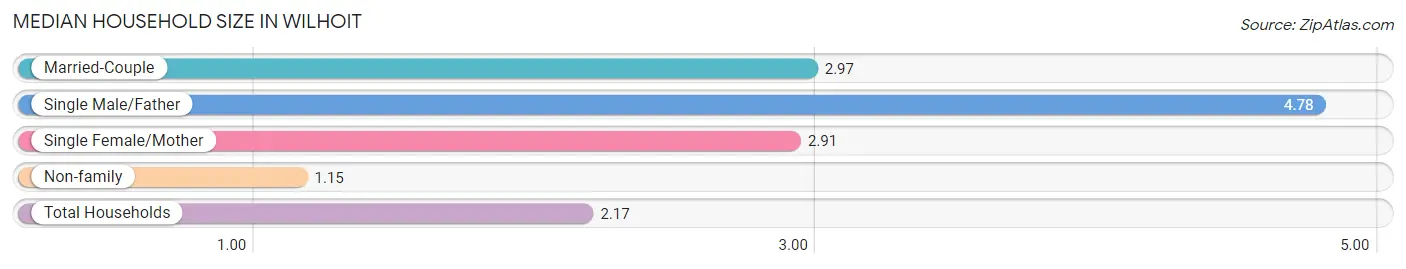
| Household Type | # Households | Household Size |
| Married-Couple | 172 (37.0%) | 2.97 |
| Single Male/Father | 18 (3.9%) | 4.78 |
| Single Female/Mother | 55 (11.8%) | 2.91 |
| Non-family | 220 (47.3%) | 1.15 |
| Total Households | 465 (100.0%) | 2.17 |
Household Size by Marriage Status in Wilhoit
Out of a total of 465 households in Wilhoit, 245 (52.7%) are family households, while 220 (47.3%) are nonfamily households. The most numerous type of family households are 2-person households, comprising 154, and the most common type of nonfamily households are 1-person households, comprising 184.
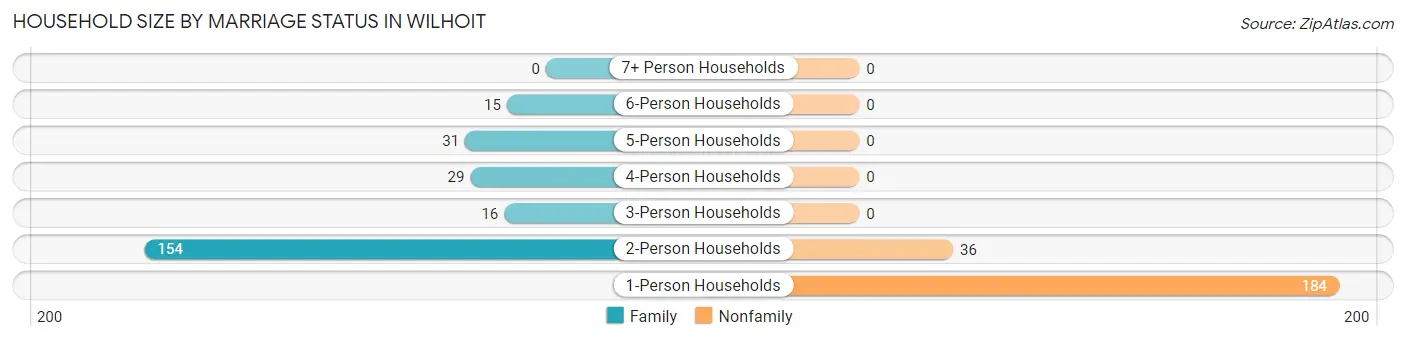
| Household Size | Family Households | Nonfamily Households |
| 1-Person Households | - | 184 (39.6%) |
| 2-Person Households | 154 (33.1%) | 36 (7.7%) |
| 3-Person Households | 16 (3.4%) | 0 (0.0%) |
| 4-Person Households | 29 (6.2%) | 0 (0.0%) |
| 5-Person Households | 31 (6.7%) | 0 (0.0%) |
| 6-Person Households | 15 (3.2%) | 0 (0.0%) |
| 7+ Person Households | 0 (0.0%) | 0 (0.0%) |
| Total | 245 (52.7%) | 220 (47.3%) |
Female Fertility in Wilhoit
Fertility by Age in Wilhoit
| Age Bracket | Women with Births | Births / 1,000 Women |
| 15 to 19 years | 0 (0.0%) | 0.0 |
| 20 to 34 years | 0 (0.0%) | 0.0 |
| 35 to 50 years | 0 (0.0%) | 0.0 |
| Total | 0 (0.0%) | 0.0 |
Fertility by Age by Marriage Status in Wilhoit
| Age Bracket | Married | Unmarried |
| 15 to 19 years | 0 (0.0%) | 0 (0.0%) |
| 20 to 34 years | 0 (0.0%) | 0 (0.0%) |
| 35 to 50 years | 0 (0.0%) | 0 (0.0%) |
| Total | 0 (0.0%) | 0 (0.0%) |
Fertility by Education in Wilhoit
| Educational Attainment | Women with Births | Births / 1,000 Women |
| Less than High School | 0 (0.0%) | 0.0 |
| High School Diploma | 0 (0.0%) | 0.0 |
| College or Associate's Degree | 0 (0.0%) | 0.0 |
| Bachelor's Degree | 0 (0.0%) | 0.0 |
| Graduate Degree | 0 (0.0%) | 0.0 |
| Total | 0 (0.0%) | 0.0 |
Fertility by Education by Marriage Status in Wilhoit
| Educational Attainment | Married | Unmarried |
| Less than High School | 0 (0.0%) | 0 (0.0%) |
| High School Diploma | 0 (0.0%) | 0 (0.0%) |
| College or Associate's Degree | 0 (0.0%) | 0 (0.0%) |
| Bachelor's Degree | 0 (0.0%) | 0 (0.0%) |
| Graduate Degree | 0 (0.0%) | 0 (0.0%) |
| Total | 0 (0.0%) | 0 (0.0%) |
Employment Characteristics in Wilhoit
Employment by Class of Employer in Wilhoit
Among the 355 employed individuals in Wilhoit, private company employees (218 | 61.4%), not-for-profit organizations (53 | 14.9%), and self-employed (not incorporated) (24 | 6.8%) make up the most common classes of employment.
| Employer Class | # Employees | % Employees |
| Private Company Employees | 218 | 61.4% |
| Self-Employed (Incorporated) | 3 | 0.9% |
| Self-Employed (Not Incorporated) | 24 | 6.8% |
| Not-for-profit Organizations | 53 | 14.9% |
| Local Government Employees | 15 | 4.2% |
| State Government Employees | 15 | 4.2% |
| Federal Government Employees | 19 | 5.3% |
| Unpaid Family Workers | 8 | 2.2% |
| Total | 355 | 100.0% |
Employment Status by Age in Wilhoit
| Age Bracket | In Labor Force | Unemployed |
| 16 to 19 Years | 0 (0.0%) | 0 (0.0%) |
| 20 to 24 Years | 12 (100.0%) | 0 (0.0%) |
| 25 to 29 Years | 28 (71.8%) | 0 (0.0%) |
| 30 to 34 Years | 51 (100.0%) | 0 (0.0%) |
| 35 to 44 Years | 57 (73.1%) | 0 (0.0%) |
| 45 to 54 Years | 110 (96.5%) | 0 (0.0%) |
| 55 to 59 Years | 32 (26.4%) | 0 (0.0%) |
| 60 to 64 Years | 39 (44.8%) | 0 (0.0%) |
| 65 to 74 Years | 31 (15.3%) | 0 (0.0%) |
| 75 Years and over | 0 (0.0%) | 0 (0.0%) |
| Total | 360 (45.3%) | 0 (0.0%) |
Employment Status by Educational Attainment in Wilhoit
| Educational Attainment | In Labor Force | Unemployed |
| Less than High School | 41 (42.7%) | 0 (0.0%) |
| High School Diploma | 116 (67.8%) | 0 (0.0%) |
| College / Associate Degree | 114 (70.8%) | 0 (0.0%) |
| Bachelor's Degree or higher | 46 (74.2%) | 0 (0.0%) |
| Total | 317 (64.7%) | 0 (0.0%) |
Employment Occupations by Sex in Wilhoit
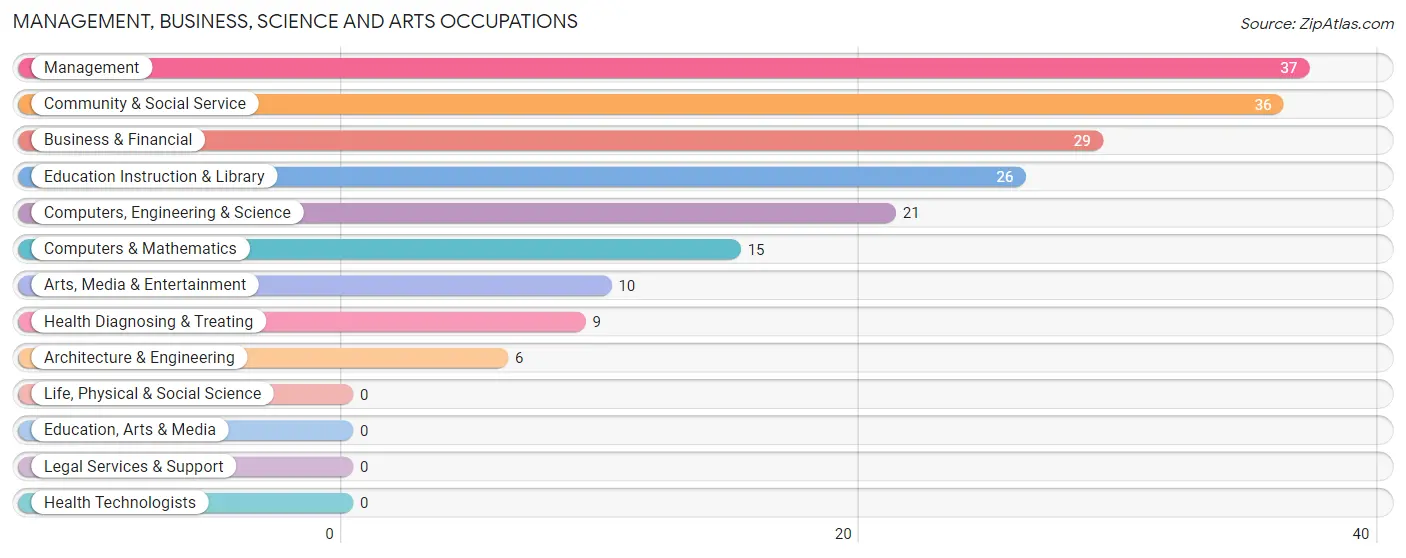
Management, Business, Science and Arts Occupations
The most common Management, Business, Science and Arts occupations in Wilhoit are Management (37 | 10.3%), Community & Social Service (36 | 10.0%), Business & Financial (29 | 8.1%), Education Instruction & Library (26 | 7.2%), and Computers, Engineering & Science (21 | 5.8%).
Management, Business, Science and Arts Occupations by Sex
Within the Management, Business, Science and Arts occupations in Wilhoit, the most male-oriented occupations are Architecture & Engineering (100.0%), Management (64.9%), and Education Instruction & Library (57.7%), while the most female-oriented occupations are Health Diagnosing & Treating (100.0%), Computers & Mathematics (60.0%), and Arts, Media & Entertainment (60.0%).
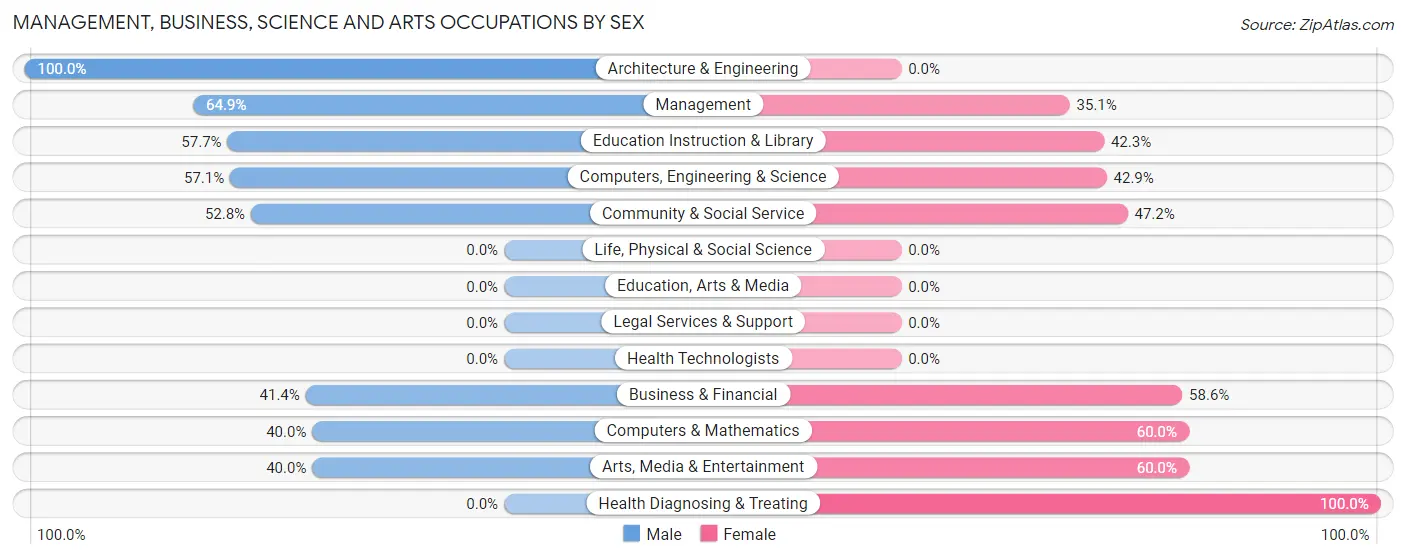
| Occupation | Male | Female |
| Management | 24 (64.9%) | 13 (35.1%) |
| Business & Financial | 12 (41.4%) | 17 (58.6%) |
| Computers, Engineering & Science | 12 (57.1%) | 9 (42.9%) |
| Computers & Mathematics | 6 (40.0%) | 9 (60.0%) |
| Architecture & Engineering | 6 (100.0%) | 0 (0.0%) |
| Life, Physical & Social Science | 0 (0.0%) | 0 (0.0%) |
| Community & Social Service | 19 (52.8%) | 17 (47.2%) |
| Education, Arts & Media | 0 (0.0%) | 0 (0.0%) |
| Legal Services & Support | 0 (0.0%) | 0 (0.0%) |
| Education Instruction & Library | 15 (57.7%) | 11 (42.3%) |
| Arts, Media & Entertainment | 4 (40.0%) | 6 (60.0%) |
| Health Diagnosing & Treating | 0 (0.0%) | 9 (100.0%) |
| Health Technologists | 0 (0.0%) | 0 (0.0%) |
| Total (Category) | 67 (50.8%) | 65 (49.2%) |
| Total (Overall) | 184 (51.1%) | 176 (48.9%) |
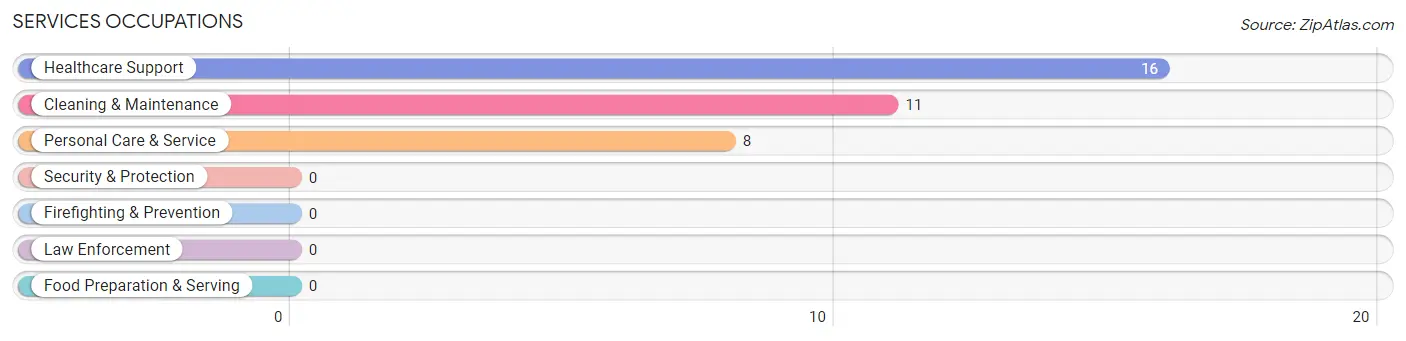
Services Occupations
The most common Services occupations in Wilhoit are Healthcare Support (16 | 4.4%), Cleaning & Maintenance (11 | 3.1%), and Personal Care & Service (8 | 2.2%).
Services Occupations by Sex
Within the Services occupations in Wilhoit, the most male-oriented occupations are Personal Care & Service (100.0%), and Cleaning & Maintenance (45.5%), while the most female-oriented occupations are Healthcare Support (100.0%), and Cleaning & Maintenance (54.5%).
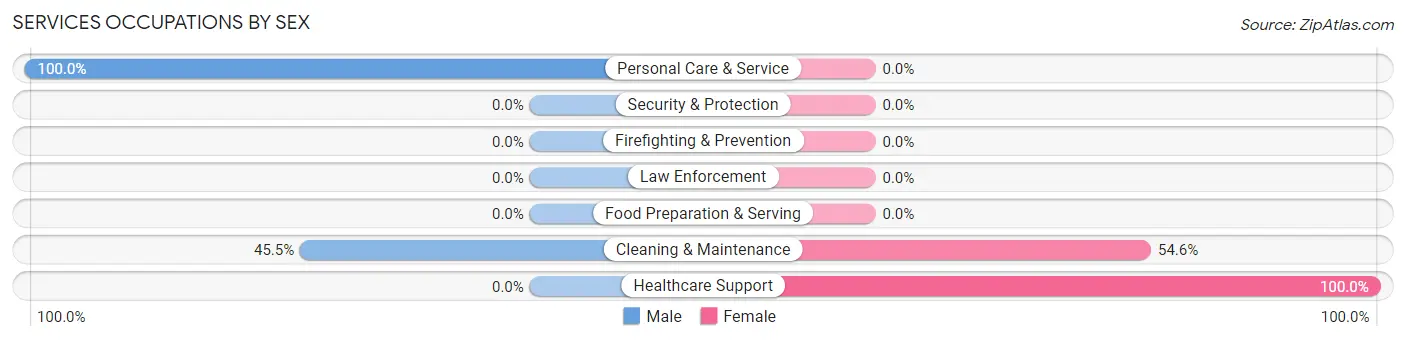
| Occupation | Male | Female |
| Healthcare Support | 0 (0.0%) | 16 (100.0%) |
| Security & Protection | 0 (0.0%) | 0 (0.0%) |
| Firefighting & Prevention | 0 (0.0%) | 0 (0.0%) |
| Law Enforcement | 0 (0.0%) | 0 (0.0%) |
| Food Preparation & Serving | 0 (0.0%) | 0 (0.0%) |
| Cleaning & Maintenance | 5 (45.5%) | 6 (54.5%) |
| Personal Care & Service | 8 (100.0%) | 0 (0.0%) |
| Total (Category) | 13 (37.1%) | 22 (62.9%) |
| Total (Overall) | 184 (51.1%) | 176 (48.9%) |
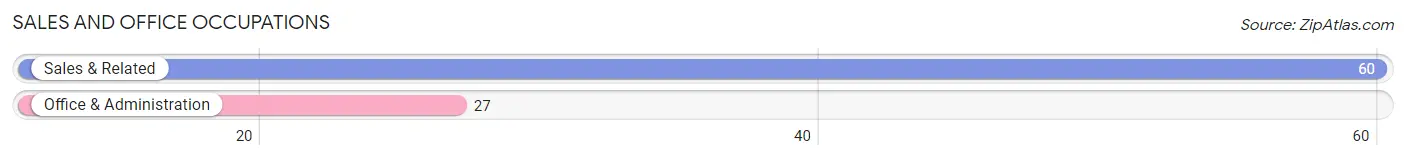
Sales and Office Occupations
The most common Sales and Office occupations in Wilhoit are Sales & Related (60 | 16.7%), and Office & Administration (27 | 7.5%).
Sales and Office Occupations by Sex
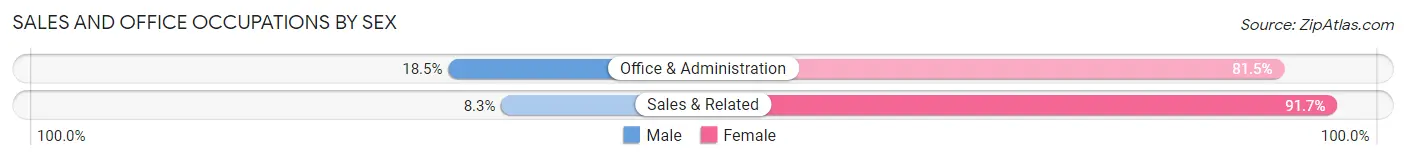
| Occupation | Male | Female |
| Sales & Related | 5 (8.3%) | 55 (91.7%) |
| Office & Administration | 5 (18.5%) | 22 (81.5%) |
| Total (Category) | 10 (11.5%) | 77 (88.5%) |
| Total (Overall) | 184 (51.1%) | 176 (48.9%) |
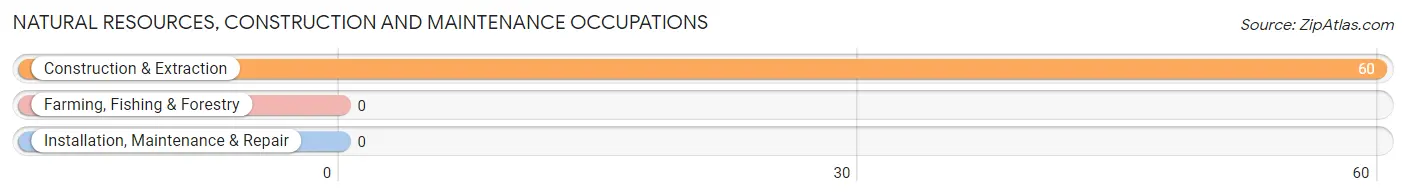
Natural Resources, Construction and Maintenance Occupations
The most common Natural Resources, Construction and Maintenance occupations in Wilhoit are , and Construction & Extraction (60 | 16.7%).
Natural Resources, Construction and Maintenance Occupations by Sex
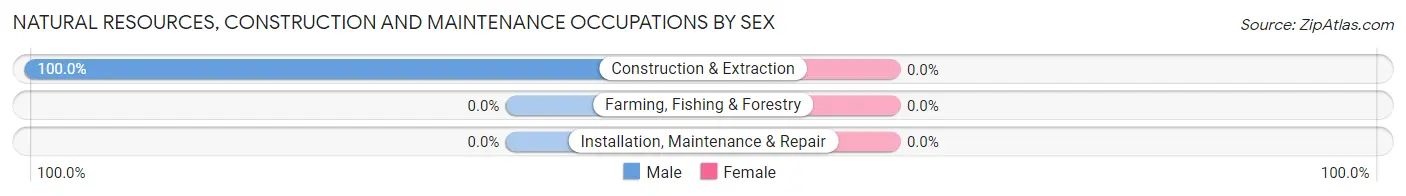
| Occupation | Male | Female |
| Farming, Fishing & Forestry | 0 (0.0%) | 0 (0.0%) |
| Construction & Extraction | 60 (100.0%) | 0 (0.0%) |
| Installation, Maintenance & Repair | 0 (0.0%) | 0 (0.0%) |
| Total (Category) | 60 (100.0%) | 0 (0.0%) |
| Total (Overall) | 184 (51.1%) | 176 (48.9%) |
Production, Transportation and Moving Occupations
The most common Production, Transportation and Moving occupations in Wilhoit are Transportation (28 | 7.8%), and Material Moving (18 | 5.0%).
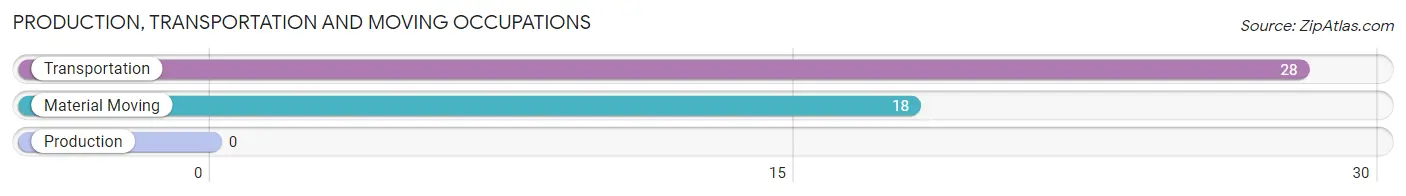
Production, Transportation and Moving Occupations by Sex
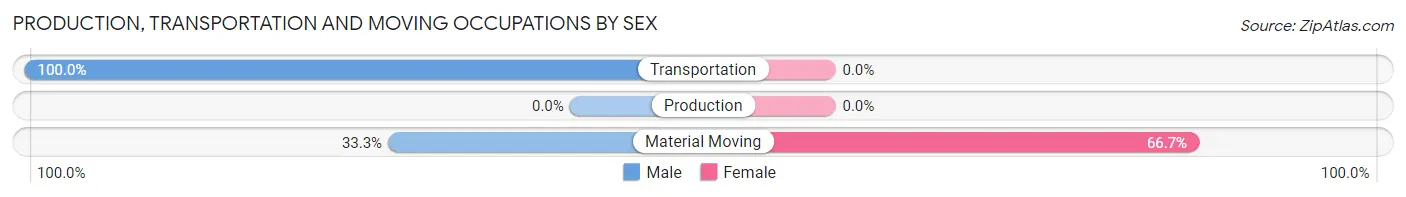
| Occupation | Male | Female |
| Production | 0 (0.0%) | 0 (0.0%) |
| Transportation | 28 (100.0%) | 0 (0.0%) |
| Material Moving | 6 (33.3%) | 12 (66.7%) |
| Total (Category) | 34 (73.9%) | 12 (26.1%) |
| Total (Overall) | 184 (51.1%) | 176 (48.9%) |
Employment Industries by Sex in Wilhoit
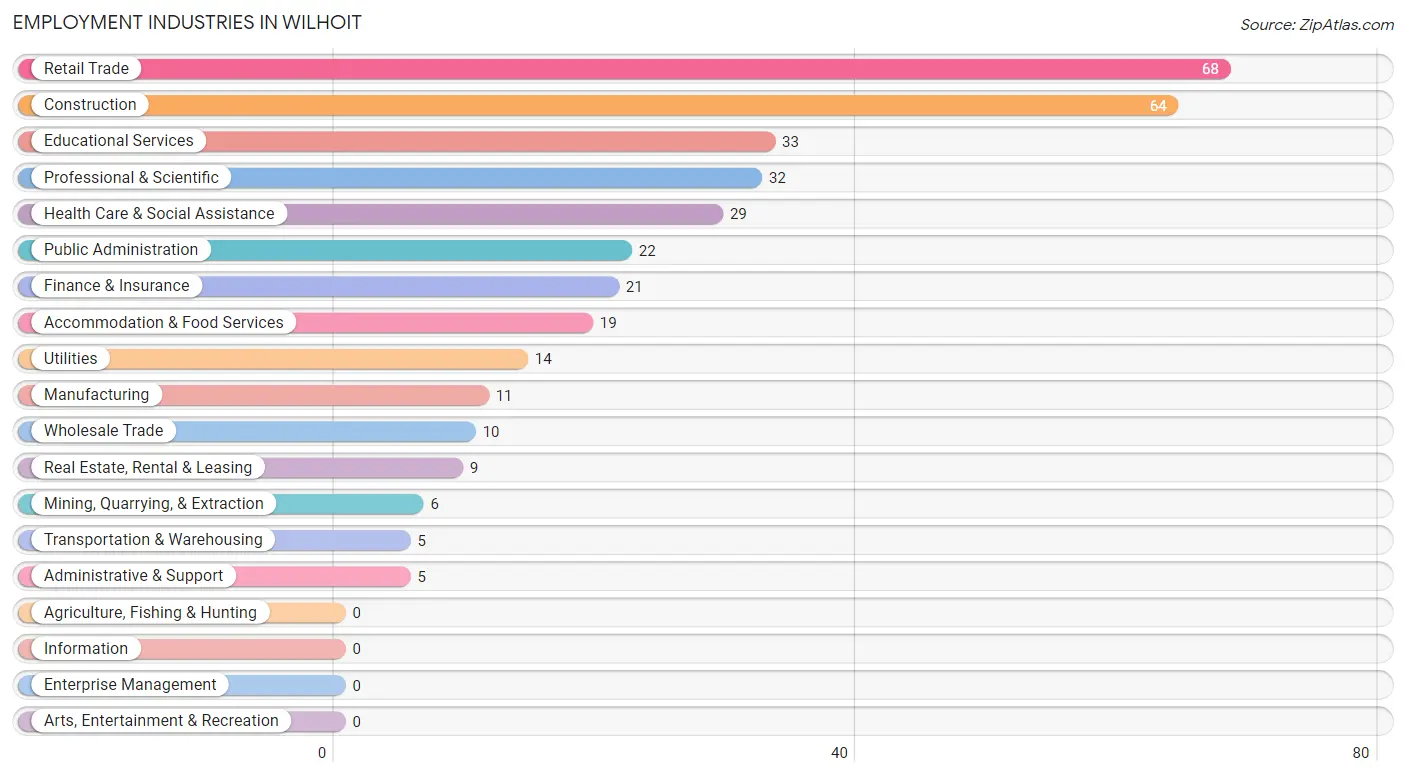
Employment Industries in Wilhoit
The major employment industries in Wilhoit include Retail Trade (68 | 18.9%), Construction (64 | 17.8%), Educational Services (33 | 9.2%), Professional & Scientific (32 | 8.9%), and Health Care & Social Assistance (29 | 8.1%).
Employment Industries by Sex in Wilhoit
The Wilhoit industries that see more men than women are Mining, Quarrying, & Extraction (100.0%), Construction (100.0%), and Wholesale Trade (100.0%), whereas the industries that tend to have a higher number of women are Finance & Insurance (100.0%), Real Estate, Rental & Leasing (100.0%), and Accommodation & Food Services (100.0%).
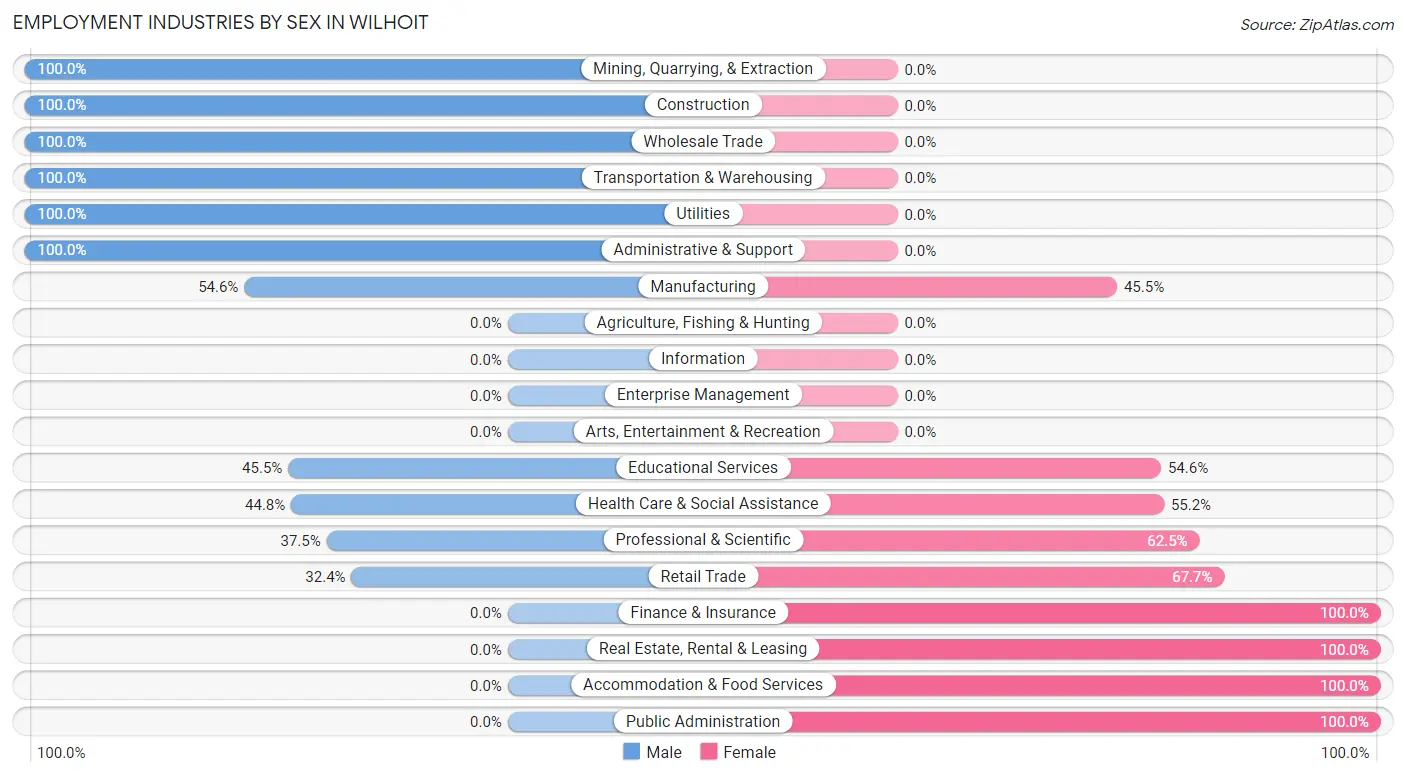
| Industry | Male | Female |
| Agriculture, Fishing & Hunting | 0 (0.0%) | 0 (0.0%) |
| Mining, Quarrying, & Extraction | 6 (100.0%) | 0 (0.0%) |
| Construction | 64 (100.0%) | 0 (0.0%) |
| Manufacturing | 6 (54.5%) | 5 (45.5%) |
| Wholesale Trade | 10 (100.0%) | 0 (0.0%) |
| Retail Trade | 22 (32.4%) | 46 (67.6%) |
| Transportation & Warehousing | 5 (100.0%) | 0 (0.0%) |
| Utilities | 14 (100.0%) | 0 (0.0%) |
| Information | 0 (0.0%) | 0 (0.0%) |
| Finance & Insurance | 0 (0.0%) | 21 (100.0%) |
| Real Estate, Rental & Leasing | 0 (0.0%) | 9 (100.0%) |
| Professional & Scientific | 12 (37.5%) | 20 (62.5%) |
| Enterprise Management | 0 (0.0%) | 0 (0.0%) |
| Administrative & Support | 5 (100.0%) | 0 (0.0%) |
| Educational Services | 15 (45.5%) | 18 (54.5%) |
| Health Care & Social Assistance | 13 (44.8%) | 16 (55.2%) |
| Arts, Entertainment & Recreation | 0 (0.0%) | 0 (0.0%) |
| Accommodation & Food Services | 0 (0.0%) | 19 (100.0%) |
| Public Administration | 0 (0.0%) | 22 (100.0%) |
| Total | 184 (51.1%) | 176 (48.9%) |
Education in Wilhoit
School Enrollment in Wilhoit
The most common levels of schooling among the 168 students in Wilhoit are middle school (68 | 40.5%), elementary school (35 | 20.8%), and nursery / preschool (23 | 13.7%).
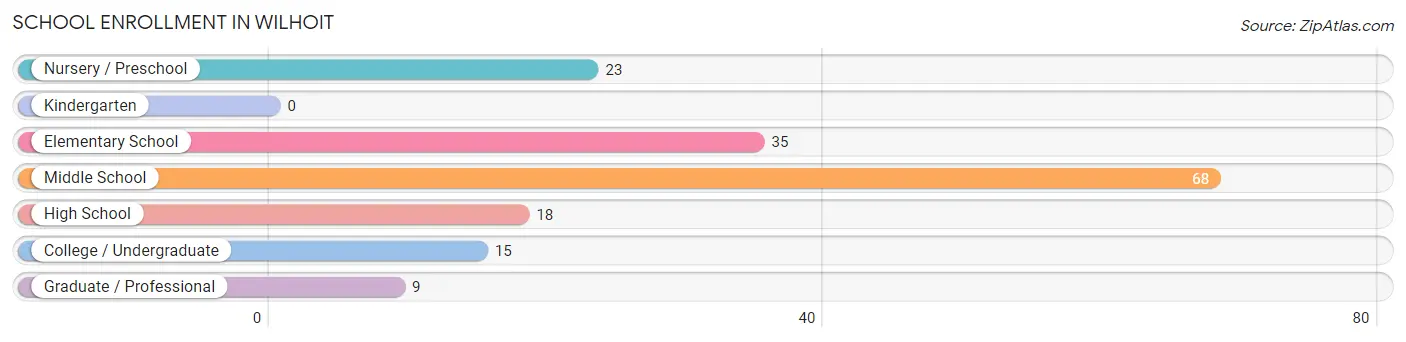
| School Level | # Students | % Students |
| Nursery / Preschool | 23 | 13.7% |
| Kindergarten | 0 | 0.0% |
| Elementary School | 35 | 20.8% |
| Middle School | 68 | 40.5% |
| High School | 18 | 10.7% |
| College / Undergraduate | 15 | 8.9% |
| Graduate / Professional | 9 | 5.4% |
| Total | 168 | 100.0% |
School Enrollment by Age by Funding Source in Wilhoit
Out of a total of 168 students who are enrolled in schools in Wilhoit, 26 (15.5%) attend a private institution, while the remaining 142 (84.5%) are enrolled in public schools. The age group of 3 to 4 year olds has the highest likelihood of being enrolled in private schools, with 15 (65.2% in the age bracket) enrolled. Conversely, the age group of 5 to 9 year old has the lowest likelihood of being enrolled in a private school, with 35 (100.0% in the age bracket) attending a public institution.
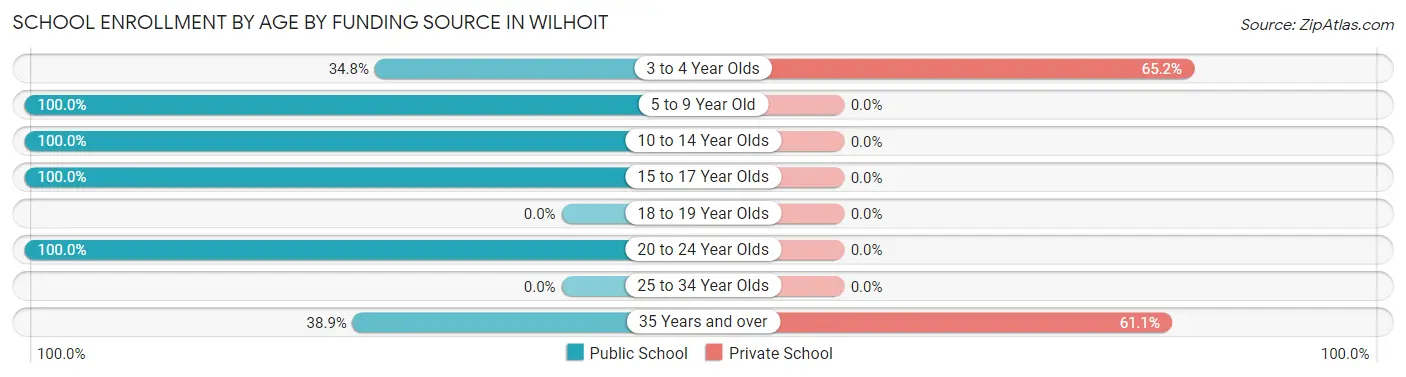
| Age Bracket | Public School | Private School |
| 3 to 4 Year Olds | 8 (34.8%) | 15 (65.2%) |
| 5 to 9 Year Old | 35 (100.0%) | 0 (0.0%) |
| 10 to 14 Year Olds | 68 (100.0%) | 0 (0.0%) |
| 15 to 17 Year Olds | 18 (100.0%) | 0 (0.0%) |
| 18 to 19 Year Olds | 0 (0.0%) | 0 (0.0%) |
| 20 to 24 Year Olds | 6 (100.0%) | 0 (0.0%) |
| 25 to 34 Year Olds | 0 (0.0%) | 0 (0.0%) |
| 35 Years and over | 7 (38.9%) | 11 (61.1%) |
| Total | 142 (84.5%) | 26 (15.5%) |
Educational Attainment by Field of Study in Wilhoit
Science & technology (33 | 32.4%), computers & mathematics (29 | 28.4%), business (25 | 24.5%), engineering (10 | 9.8%), and social sciences (3 | 2.9%) are the most common fields of study among 102 individuals in Wilhoit who have obtained a bachelor's degree or higher.
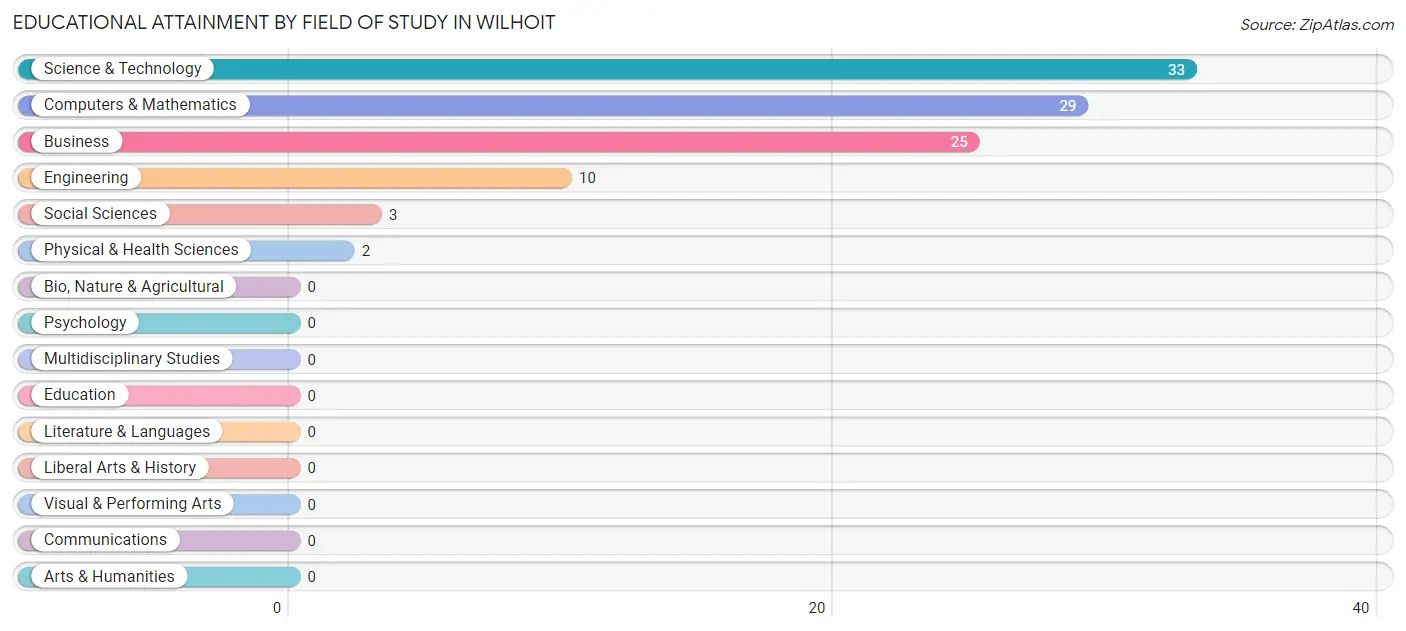
| Field of Study | # Graduates | % Graduates |
| Computers & Mathematics | 29 | 28.4% |
| Bio, Nature & Agricultural | 0 | 0.0% |
| Physical & Health Sciences | 2 | 2.0% |
| Psychology | 0 | 0.0% |
| Social Sciences | 3 | 2.9% |
| Engineering | 10 | 9.8% |
| Multidisciplinary Studies | 0 | 0.0% |
| Science & Technology | 33 | 32.4% |
| Business | 25 | 24.5% |
| Education | 0 | 0.0% |
| Literature & Languages | 0 | 0.0% |
| Liberal Arts & History | 0 | 0.0% |
| Visual & Performing Arts | 0 | 0.0% |
| Communications | 0 | 0.0% |
| Arts & Humanities | 0 | 0.0% |
| Total | 102 | 100.0% |
Transportation & Commute in Wilhoit
Vehicle Availability by Sex in Wilhoit
The most prevalent vehicle ownership categories in Wilhoit are males with 2 vehicles (79, accounting for 44.1%) and females with 2 vehicles (68, making up 44.9%).
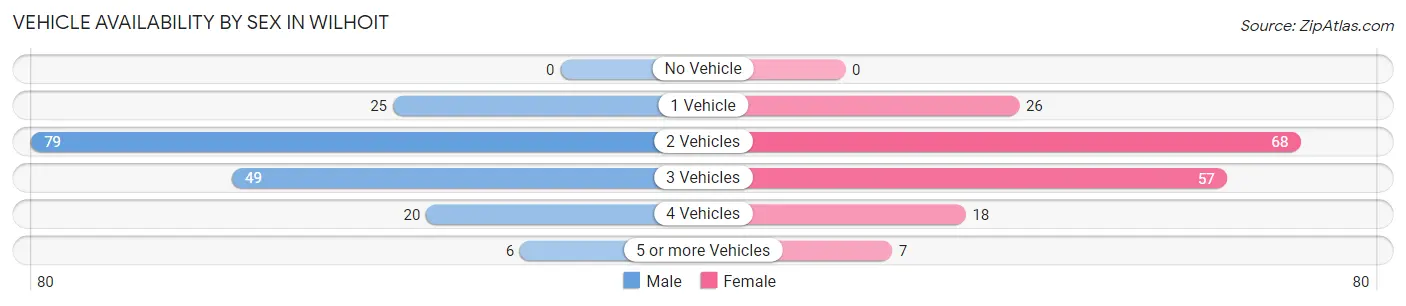
| Vehicles Available | Male | Female |
| No Vehicle | 0 (0.0%) | 0 (0.0%) |
| 1 Vehicle | 25 (14.0%) | 26 (14.8%) |
| 2 Vehicles | 79 (44.1%) | 68 (38.6%) |
| 3 Vehicles | 49 (27.4%) | 57 (32.4%) |
| 4 Vehicles | 20 (11.2%) | 18 (10.2%) |
| 5 or more Vehicles | 6 (3.4%) | 7 (4.0%) |
| Total | 179 (100.0%) | 176 (100.0%) |
Commute Time in Wilhoit
The most frequently occuring commute durations in Wilhoit are 45 to 59 minutes (82 commuters, 25.0%), 30 to 34 minutes (51 commuters, 15.5%), and 40 to 44 minutes (49 commuters, 14.9%).
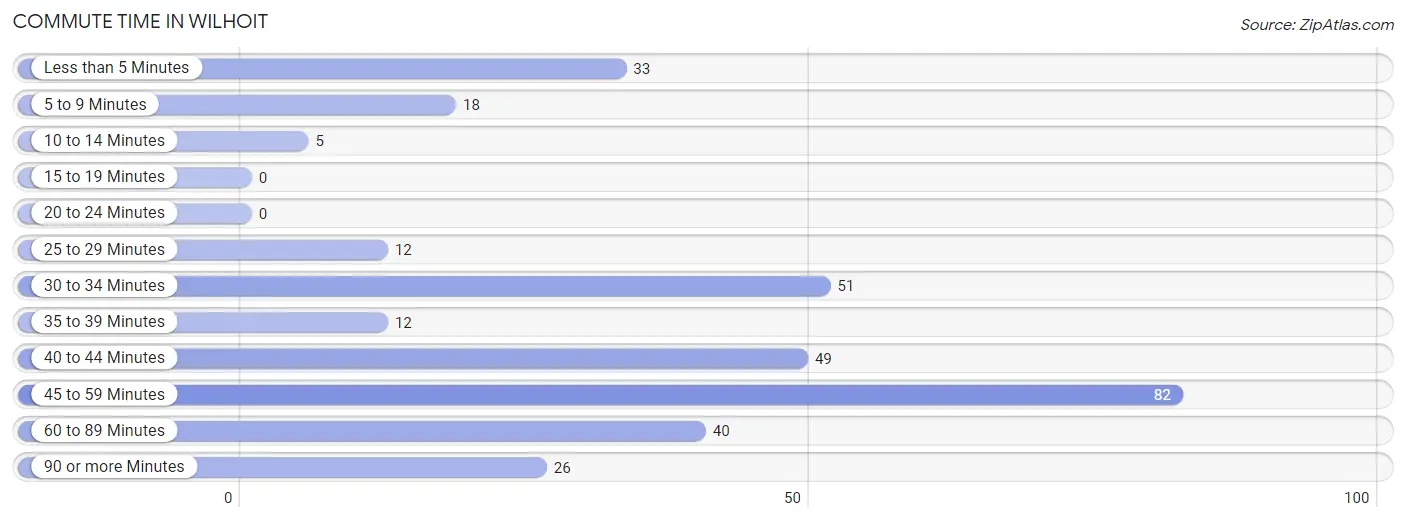
| Commute Time | # Commuters | % Commuters |
| Less than 5 Minutes | 33 | 10.1% |
| 5 to 9 Minutes | 18 | 5.5% |
| 10 to 14 Minutes | 5 | 1.5% |
| 15 to 19 Minutes | 0 | 0.0% |
| 20 to 24 Minutes | 0 | 0.0% |
| 25 to 29 Minutes | 12 | 3.7% |
| 30 to 34 Minutes | 51 | 15.5% |
| 35 to 39 Minutes | 12 | 3.7% |
| 40 to 44 Minutes | 49 | 14.9% |
| 45 to 59 Minutes | 82 | 25.0% |
| 60 to 89 Minutes | 40 | 12.2% |
| 90 or more Minutes | 26 | 7.9% |
Commute Time by Sex in Wilhoit
The most common commute times in Wilhoit are 45 to 59 minutes (50 commuters, 31.1%) for males and less than 5 minutes (33 commuters, 19.8%) for females.
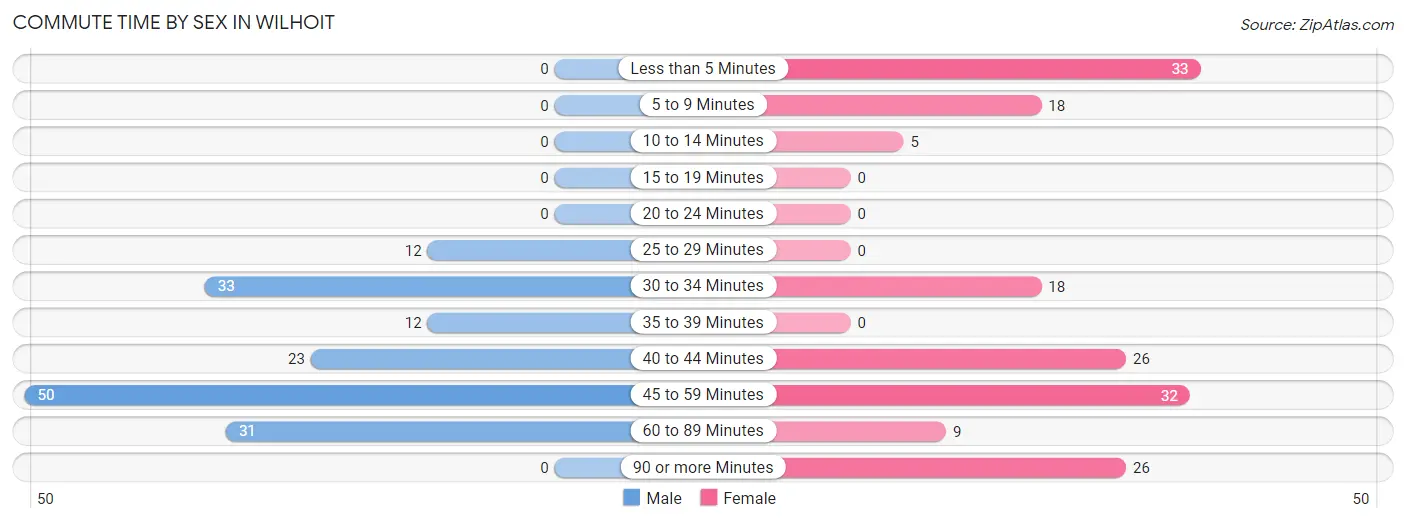
| Commute Time | Male | Female |
| Less than 5 Minutes | 0 (0.0%) | 33 (19.8%) |
| 5 to 9 Minutes | 0 (0.0%) | 18 (10.8%) |
| 10 to 14 Minutes | 0 (0.0%) | 5 (3.0%) |
| 15 to 19 Minutes | 0 (0.0%) | 0 (0.0%) |
| 20 to 24 Minutes | 0 (0.0%) | 0 (0.0%) |
| 25 to 29 Minutes | 12 (7.4%) | 0 (0.0%) |
| 30 to 34 Minutes | 33 (20.5%) | 18 (10.8%) |
| 35 to 39 Minutes | 12 (7.4%) | 0 (0.0%) |
| 40 to 44 Minutes | 23 (14.3%) | 26 (15.6%) |
| 45 to 59 Minutes | 50 (31.1%) | 32 (19.2%) |
| 60 to 89 Minutes | 31 (19.3%) | 9 (5.4%) |
| 90 or more Minutes | 0 (0.0%) | 26 (15.6%) |
Time of Departure to Work by Sex in Wilhoit
The most frequent times of departure to work in Wilhoit are 6:00 AM to 6:29 AM (34, 21.1%) for males and 7:00 AM to 7:29 AM (51, 30.5%) for females.
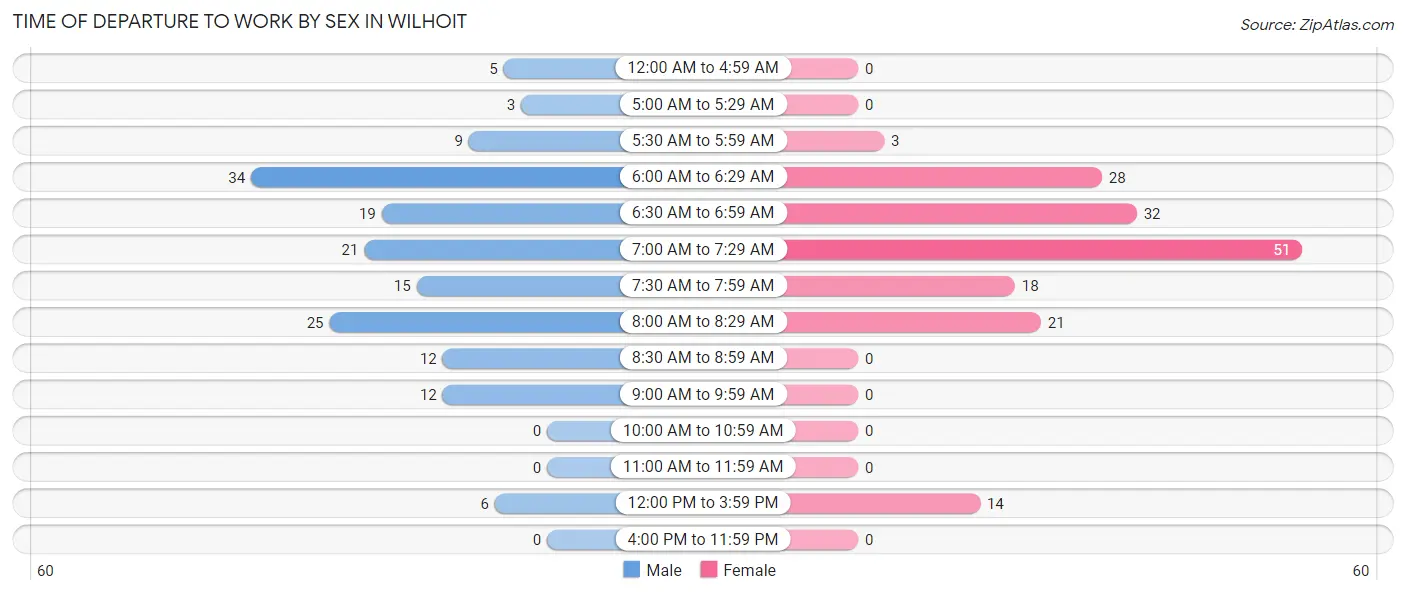
| Time of Departure | Male | Female |
| 12:00 AM to 4:59 AM | 5 (3.1%) | 0 (0.0%) |
| 5:00 AM to 5:29 AM | 3 (1.9%) | 0 (0.0%) |
| 5:30 AM to 5:59 AM | 9 (5.6%) | 3 (1.8%) |
| 6:00 AM to 6:29 AM | 34 (21.1%) | 28 (16.8%) |
| 6:30 AM to 6:59 AM | 19 (11.8%) | 32 (19.2%) |
| 7:00 AM to 7:29 AM | 21 (13.0%) | 51 (30.5%) |
| 7:30 AM to 7:59 AM | 15 (9.3%) | 18 (10.8%) |
| 8:00 AM to 8:29 AM | 25 (15.5%) | 21 (12.6%) |
| 8:30 AM to 8:59 AM | 12 (7.4%) | 0 (0.0%) |
| 9:00 AM to 9:59 AM | 12 (7.4%) | 0 (0.0%) |
| 10:00 AM to 10:59 AM | 0 (0.0%) | 0 (0.0%) |
| 11:00 AM to 11:59 AM | 0 (0.0%) | 0 (0.0%) |
| 12:00 PM to 3:59 PM | 6 (3.7%) | 14 (8.4%) |
| 4:00 PM to 11:59 PM | 0 (0.0%) | 0 (0.0%) |
| Total | 161 (100.0%) | 167 (100.0%) |
Housing Occupancy in Wilhoit
Occupancy by Ownership in Wilhoit
Of the total 465 dwellings in Wilhoit, owner-occupied units account for 424 (91.2%), while renter-occupied units make up 41 (8.8%).
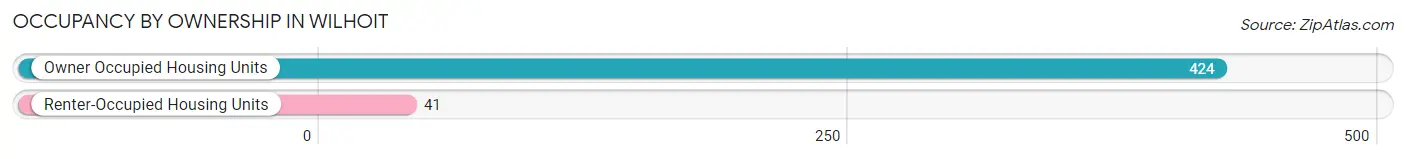
| Occupancy | # Housing Units | % Housing Units |
| Owner Occupied Housing Units | 424 | 91.2% |
| Renter-Occupied Housing Units | 41 | 8.8% |
| Total Occupied Housing Units | 465 | 100.0% |
Occupancy by Household Size in Wilhoit
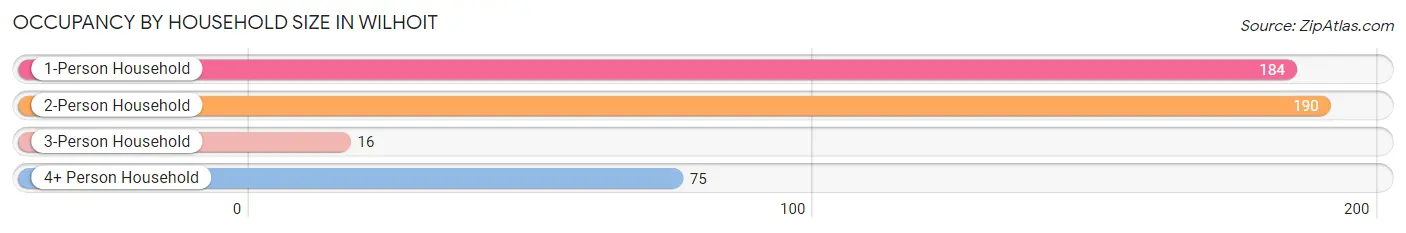
| Household Size | # Housing Units | % Housing Units |
| 1-Person Household | 184 | 39.6% |
| 2-Person Household | 190 | 40.9% |
| 3-Person Household | 16 | 3.4% |
| 4+ Person Household | 75 | 16.1% |
| Total Housing Units | 465 | 100.0% |
Occupancy by Ownership by Household Size in Wilhoit
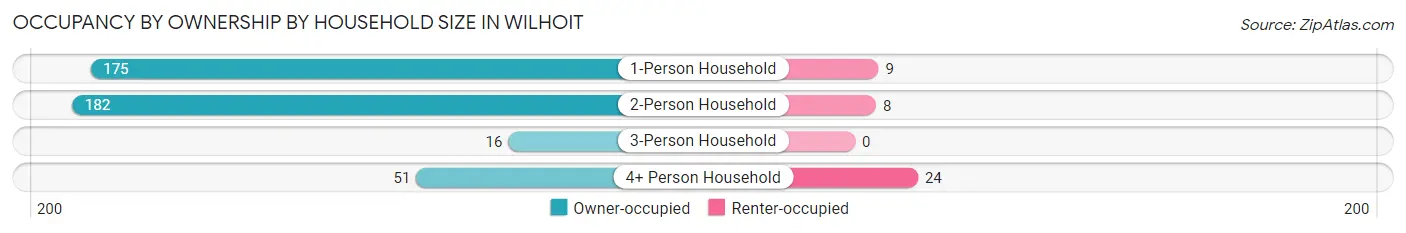
| Household Size | Owner-occupied | Renter-occupied |
| 1-Person Household | 175 (95.1%) | 9 (4.9%) |
| 2-Person Household | 182 (95.8%) | 8 (4.2%) |
| 3-Person Household | 16 (100.0%) | 0 (0.0%) |
| 4+ Person Household | 51 (68.0%) | 24 (32.0%) |
| Total Housing Units | 424 (91.2%) | 41 (8.8%) |
Occupancy by Educational Attainment in Wilhoit
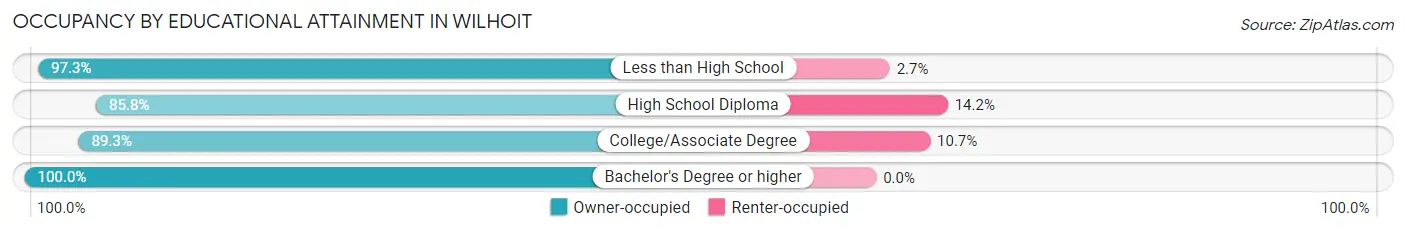
| Household Size | Owner-occupied | Renter-occupied |
| Less than High School | 109 (97.3%) | 3 (2.7%) |
| High School Diploma | 127 (85.8%) | 21 (14.2%) |
| College/Associate Degree | 142 (89.3%) | 17 (10.7%) |
| Bachelor's Degree or higher | 46 (100.0%) | 0 (0.0%) |
Occupancy by Age of Householder in Wilhoit
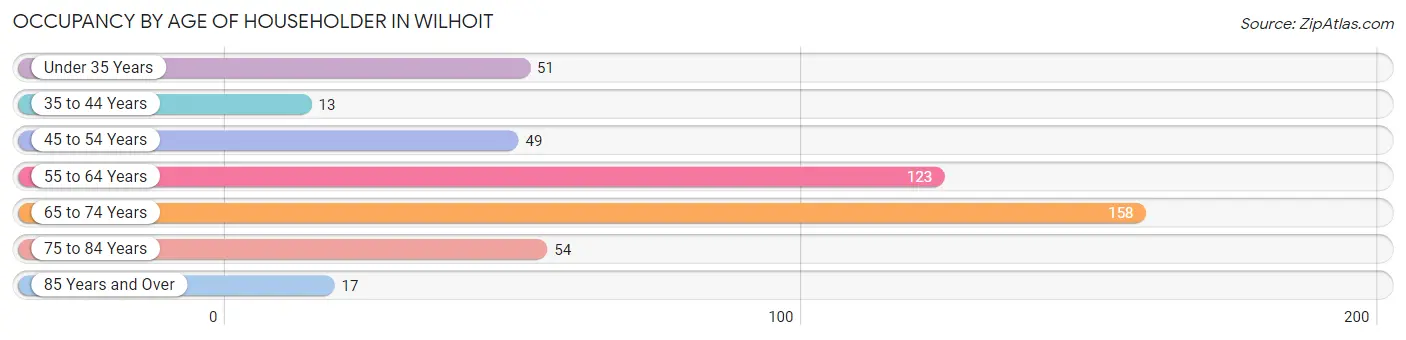
| Age Bracket | # Households | % Households |
| Under 35 Years | 51 | 11.0% |
| 35 to 44 Years | 13 | 2.8% |
| 45 to 54 Years | 49 | 10.5% |
| 55 to 64 Years | 123 | 26.5% |
| 65 to 74 Years | 158 | 34.0% |
| 75 to 84 Years | 54 | 11.6% |
| 85 Years and Over | 17 | 3.7% |
| Total | 465 | 100.0% |
Housing Finances in Wilhoit
Median Income by Occupancy in Wilhoit
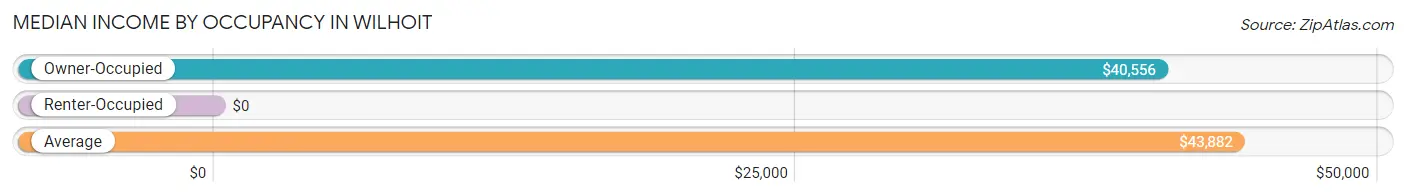
| Occupancy Type | # Households | Median Income |
| Owner-Occupied | 424 (91.2%) | $40,556 |
| Renter-Occupied | 41 (8.8%) | $0 |
| Average | 465 (100.0%) | $43,882 |
Occupancy by Householder Income Bracket in Wilhoit
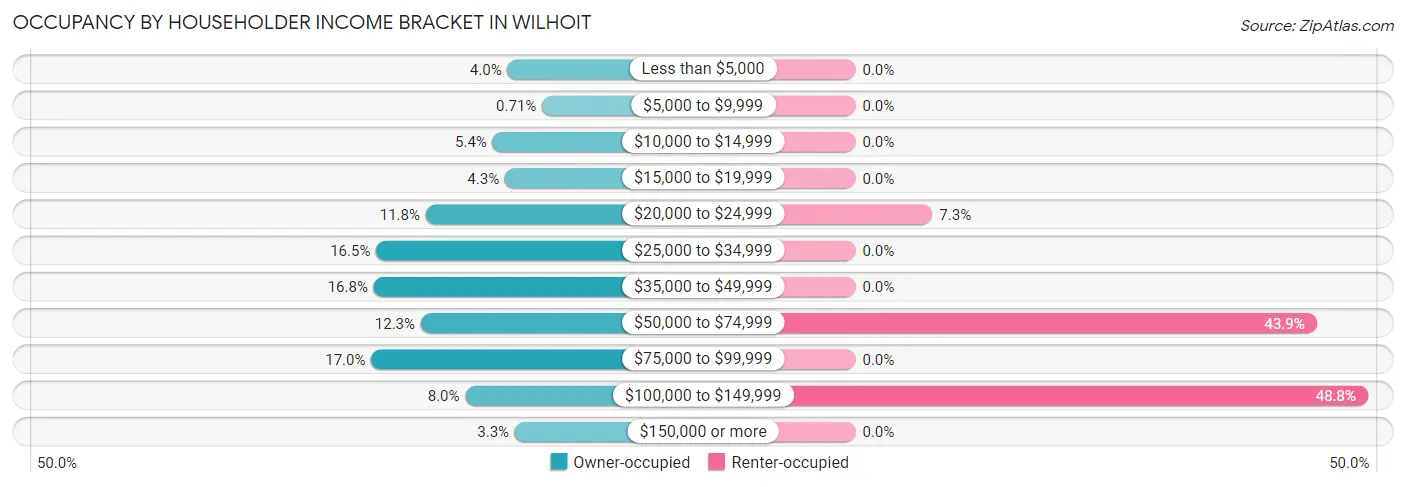
| Income Bracket | Owner-occupied | Renter-occupied |
| Less than $5,000 | 17 (4.0%) | 0 (0.0%) |
| $5,000 to $9,999 | 3 (0.7%) | 0 (0.0%) |
| $10,000 to $14,999 | 23 (5.4%) | 0 (0.0%) |
| $15,000 to $19,999 | 18 (4.3%) | 0 (0.0%) |
| $20,000 to $24,999 | 50 (11.8%) | 3 (7.3%) |
| $25,000 to $34,999 | 70 (16.5%) | 0 (0.0%) |
| $35,000 to $49,999 | 71 (16.8%) | 0 (0.0%) |
| $50,000 to $74,999 | 52 (12.3%) | 18 (43.9%) |
| $75,000 to $99,999 | 72 (17.0%) | 0 (0.0%) |
| $100,000 to $149,999 | 34 (8.0%) | 20 (48.8%) |
| $150,000 or more | 14 (3.3%) | 0 (0.0%) |
| Total | 424 (100.0%) | 41 (100.0%) |
Monthly Housing Cost Tiers in Wilhoit
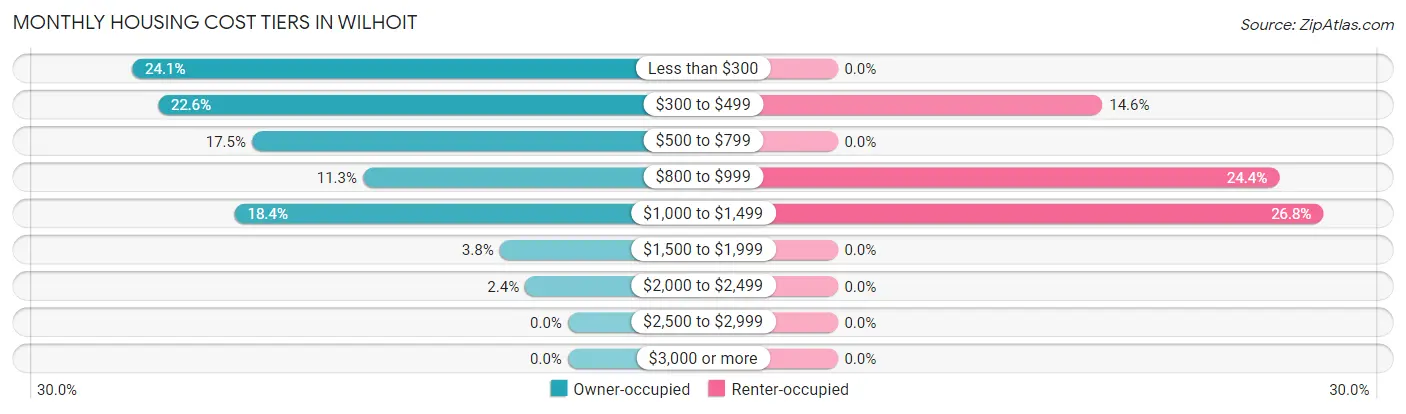
| Monthly Cost | Owner-occupied | Renter-occupied |
| Less than $300 | 102 (24.1%) | 0 (0.0%) |
| $300 to $499 | 96 (22.6%) | 6 (14.6%) |
| $500 to $799 | 74 (17.4%) | 0 (0.0%) |
| $800 to $999 | 48 (11.3%) | 10 (24.4%) |
| $1,000 to $1,499 | 78 (18.4%) | 11 (26.8%) |
| $1,500 to $1,999 | 16 (3.8%) | 0 (0.0%) |
| $2,000 to $2,499 | 10 (2.4%) | 0 (0.0%) |
| $2,500 to $2,999 | 0 (0.0%) | 0 (0.0%) |
| $3,000 or more | 0 (0.0%) | 0 (0.0%) |
| Total | 424 (100.0%) | 41 (100.0%) |
Physical Housing Characteristics in Wilhoit
Housing Structures in Wilhoit
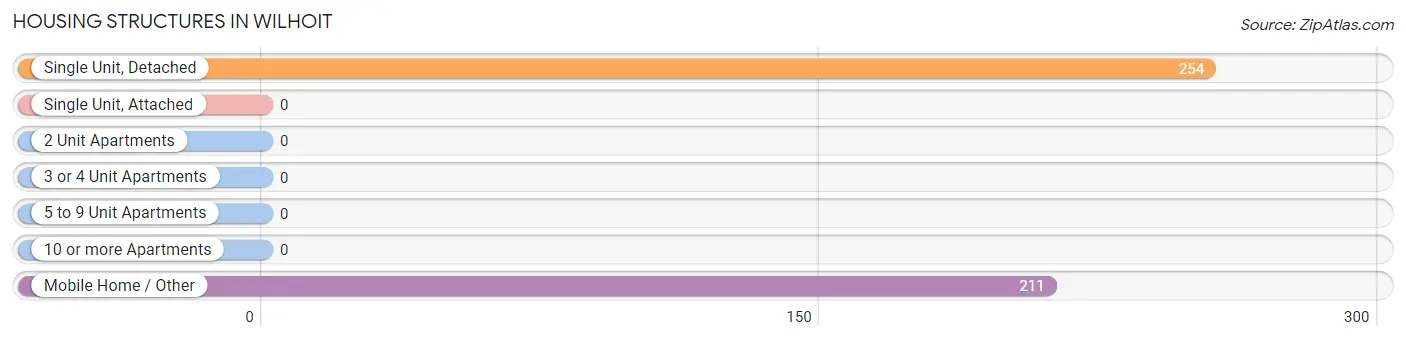
| Structure Type | # Housing Units | % Housing Units |
| Single Unit, Detached | 254 | 54.6% |
| Single Unit, Attached | 0 | 0.0% |
| 2 Unit Apartments | 0 | 0.0% |
| 3 or 4 Unit Apartments | 0 | 0.0% |
| 5 to 9 Unit Apartments | 0 | 0.0% |
| 10 or more Apartments | 0 | 0.0% |
| Mobile Home / Other | 211 | 45.4% |
| Total | 465 | 100.0% |
Housing Structures by Occupancy in Wilhoit
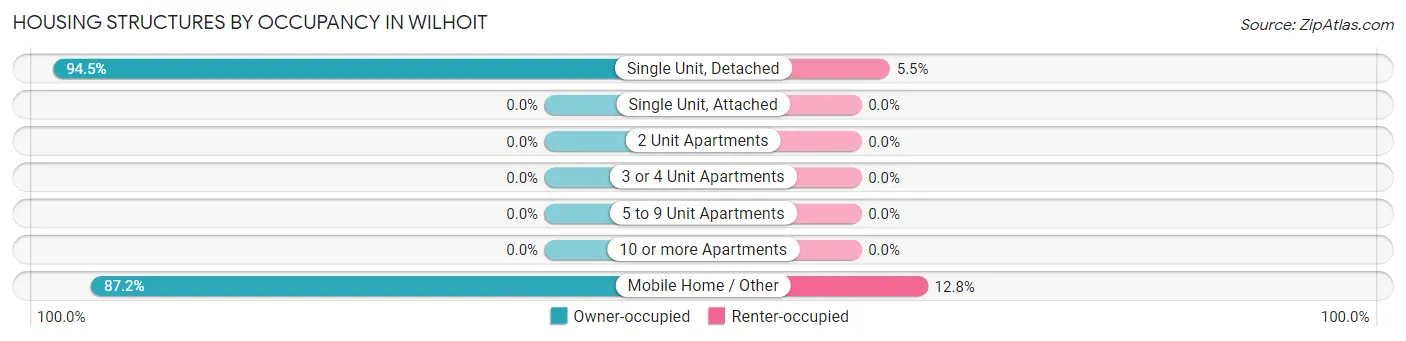
| Structure Type | Owner-occupied | Renter-occupied |
| Single Unit, Detached | 240 (94.5%) | 14 (5.5%) |
| Single Unit, Attached | 0 (0.0%) | 0 (0.0%) |
| 2 Unit Apartments | 0 (0.0%) | 0 (0.0%) |
| 3 or 4 Unit Apartments | 0 (0.0%) | 0 (0.0%) |
| 5 to 9 Unit Apartments | 0 (0.0%) | 0 (0.0%) |
| 10 or more Apartments | 0 (0.0%) | 0 (0.0%) |
| Mobile Home / Other | 184 (87.2%) | 27 (12.8%) |
| Total | 424 (91.2%) | 41 (8.8%) |
Housing Structures by Number of Rooms in Wilhoit
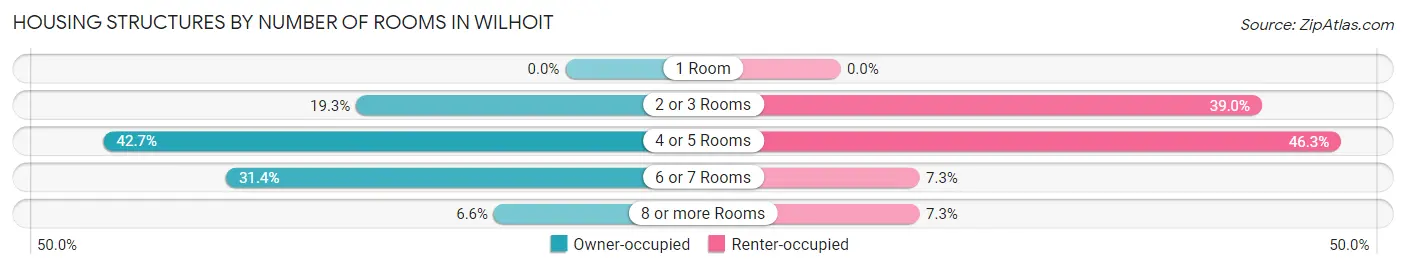
| Number of Rooms | Owner-occupied | Renter-occupied |
| 1 Room | 0 (0.0%) | 0 (0.0%) |
| 2 or 3 Rooms | 82 (19.3%) | 16 (39.0%) |
| 4 or 5 Rooms | 181 (42.7%) | 19 (46.3%) |
| 6 or 7 Rooms | 133 (31.4%) | 3 (7.3%) |
| 8 or more Rooms | 28 (6.6%) | 3 (7.3%) |
| Total | 424 (100.0%) | 41 (100.0%) |
Housing Structure by Heating Type in Wilhoit
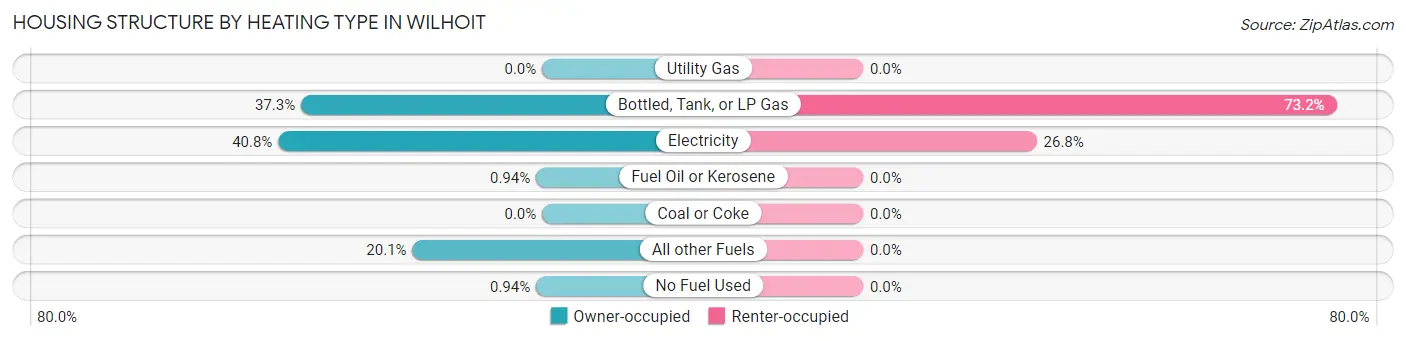
| Heating Type | Owner-occupied | Renter-occupied |
| Utility Gas | 0 (0.0%) | 0 (0.0%) |
| Bottled, Tank, or LP Gas | 158 (37.3%) | 30 (73.2%) |
| Electricity | 173 (40.8%) | 11 (26.8%) |
| Fuel Oil or Kerosene | 4 (0.9%) | 0 (0.0%) |
| Coal or Coke | 0 (0.0%) | 0 (0.0%) |
| All other Fuels | 85 (20.1%) | 0 (0.0%) |
| No Fuel Used | 4 (0.9%) | 0 (0.0%) |
| Total | 424 (100.0%) | 41 (100.0%) |
Household Vehicle Usage in Wilhoit
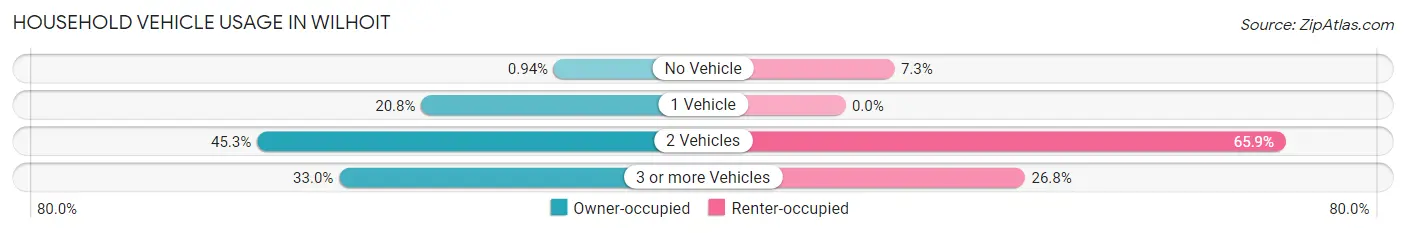
| Vehicles per Household | Owner-occupied | Renter-occupied |
| No Vehicle | 4 (0.9%) | 3 (7.3%) |
| 1 Vehicle | 88 (20.7%) | 0 (0.0%) |
| 2 Vehicles | 192 (45.3%) | 27 (65.8%) |
| 3 or more Vehicles | 140 (33.0%) | 11 (26.8%) |
| Total | 424 (100.0%) | 41 (100.0%) |
Real Estate & Mortgages in Wilhoit
Real Estate and Mortgage Overview in Wilhoit
| Characteristic | Without Mortgage | With Mortgage |
| Housing Units | 230 | 194 |
| Median Property Value | $205,600 | $214,300 |
| Median Household Income | $33,750 | $8 |
| Monthly Housing Costs | $320 | $0 |
| Real Estate Taxes | $683 | $24 |
Property Value by Mortgage Status in Wilhoit
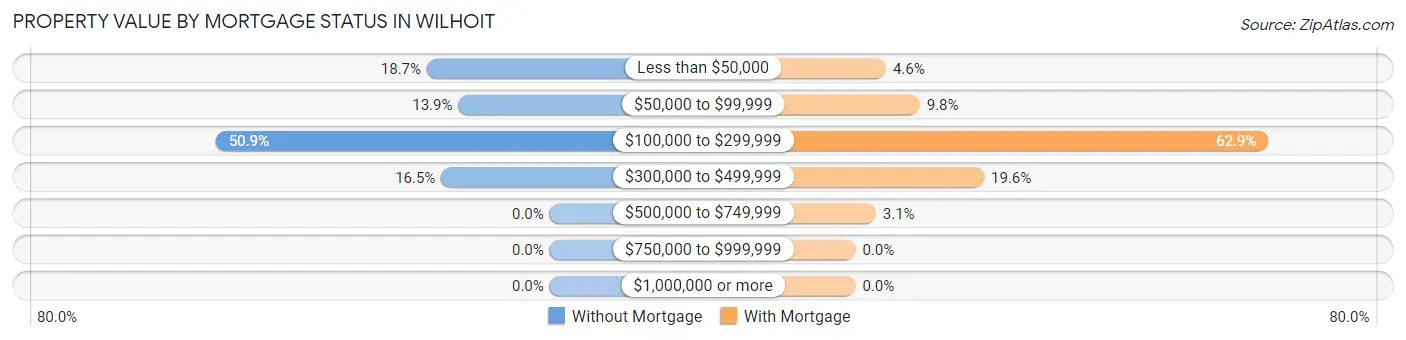
| Property Value | Without Mortgage | With Mortgage |
| Less than $50,000 | 43 (18.7%) | 9 (4.6%) |
| $50,000 to $99,999 | 32 (13.9%) | 19 (9.8%) |
| $100,000 to $299,999 | 117 (50.9%) | 122 (62.9%) |
| $300,000 to $499,999 | 38 (16.5%) | 38 (19.6%) |
| $500,000 to $749,999 | 0 (0.0%) | 6 (3.1%) |
| $750,000 to $999,999 | 0 (0.0%) | 0 (0.0%) |
| $1,000,000 or more | 0 (0.0%) | 0 (0.0%) |
| Total | 230 (100.0%) | 194 (100.0%) |
Household Income by Mortgage Status in Wilhoit
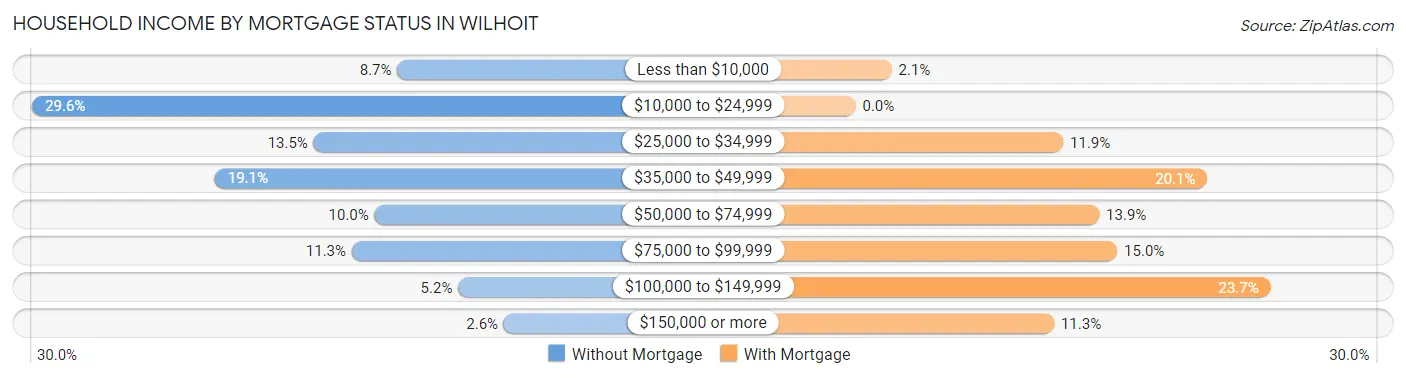
| Household Income | Without Mortgage | With Mortgage |
| Less than $10,000 | 20 (8.7%) | 4 (2.1%) |
| $10,000 to $24,999 | 68 (29.6%) | 0 (0.0%) |
| $25,000 to $34,999 | 31 (13.5%) | 23 (11.9%) |
| $35,000 to $49,999 | 44 (19.1%) | 39 (20.1%) |
| $50,000 to $74,999 | 23 (10.0%) | 27 (13.9%) |
| $75,000 to $99,999 | 26 (11.3%) | 29 (14.9%) |
| $100,000 to $149,999 | 12 (5.2%) | 46 (23.7%) |
| $150,000 or more | 6 (2.6%) | 22 (11.3%) |
| Total | 230 (100.0%) | 194 (100.0%) |
Property Value to Household Income Ratio in Wilhoit
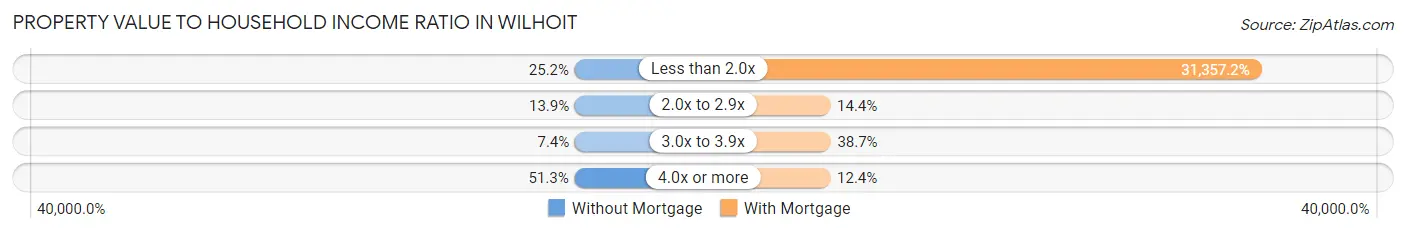
| Value-to-Income Ratio | Without Mortgage | With Mortgage |
| Less than 2.0x | 58 (25.2%) | 60,833 (31,357.2%) |
| 2.0x to 2.9x | 32 (13.9%) | 28 (14.4%) |
| 3.0x to 3.9x | 17 (7.4%) | 75 (38.7%) |
| 4.0x or more | 118 (51.3%) | 24 (12.4%) |
| Total | 230 (100.0%) | 194 (100.0%) |
Real Estate Taxes by Mortgage Status in Wilhoit
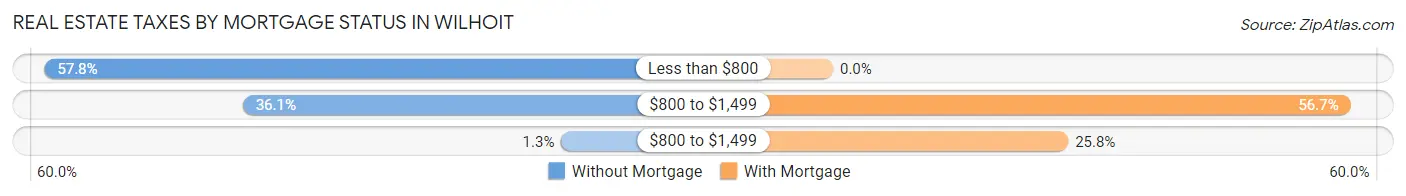
| Property Taxes | Without Mortgage | With Mortgage |
| Less than $800 | 133 (57.8%) | 0 (0.0%) |
| $800 to $1,499 | 83 (36.1%) | 110 (56.7%) |
| $800 to $1,499 | 3 (1.3%) | 50 (25.8%) |
| Total | 230 (100.0%) | 194 (100.0%) |
Health & Disability in Wilhoit
Health Insurance Coverage by Age in Wilhoit
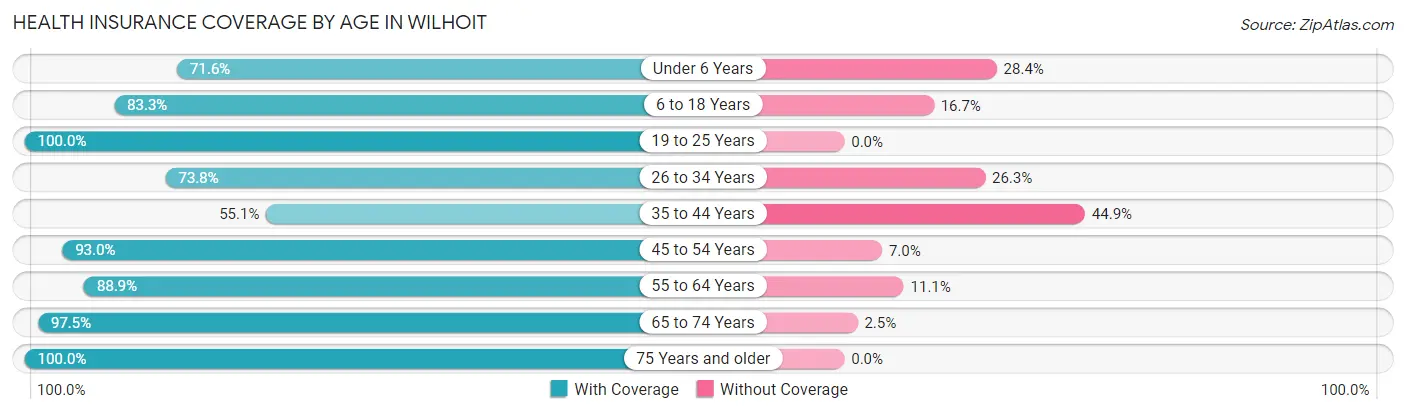
| Age Bracket | With Coverage | Without Coverage |
| Under 6 Years | 63 (71.6%) | 25 (28.4%) |
| 6 to 18 Years | 110 (83.3%) | 22 (16.7%) |
| 19 to 25 Years | 22 (100.0%) | 0 (0.0%) |
| 26 to 34 Years | 59 (73.8%) | 21 (26.3%) |
| 35 to 44 Years | 43 (55.1%) | 35 (44.9%) |
| 45 to 54 Years | 106 (93.0%) | 8 (7.0%) |
| 55 to 64 Years | 185 (88.9%) | 23 (11.1%) |
| 65 to 74 Years | 198 (97.5%) | 5 (2.5%) |
| 75 Years and older | 84 (100.0%) | 0 (0.0%) |
| Total | 870 (86.2%) | 139 (13.8%) |
Health Insurance Coverage by Citizenship Status in Wilhoit
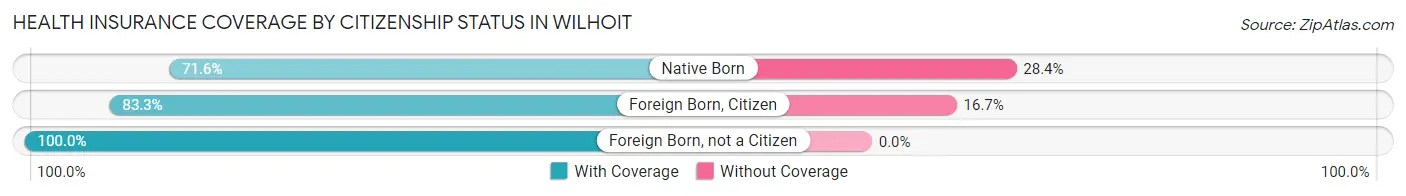
| Citizenship Status | With Coverage | Without Coverage |
| Native Born | 63 (71.6%) | 25 (28.4%) |
| Foreign Born, Citizen | 110 (83.3%) | 22 (16.7%) |
| Foreign Born, not a Citizen | 22 (100.0%) | 0 (0.0%) |
Health Insurance Coverage by Household Income in Wilhoit
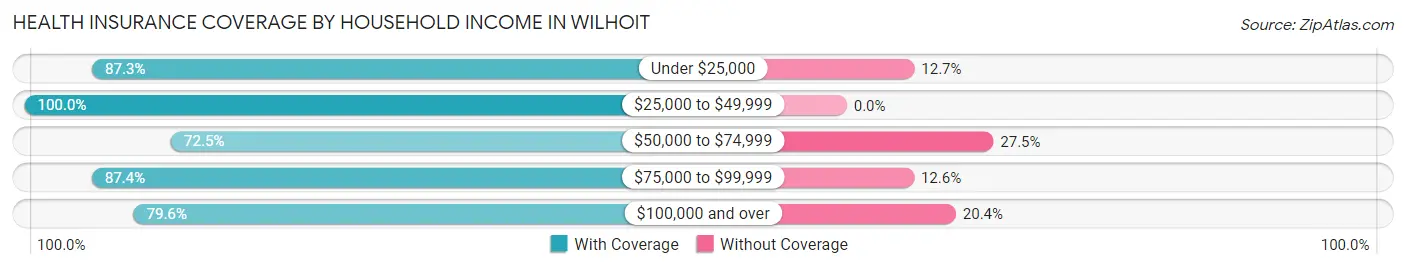
| Household Income | With Coverage | Without Coverage |
| Under $25,000 | 138 (87.3%) | 20 (12.7%) |
| $25,000 to $49,999 | 280 (100.0%) | 0 (0.0%) |
| $50,000 to $74,999 | 140 (72.5%) | 53 (27.5%) |
| $75,000 to $99,999 | 125 (87.4%) | 18 (12.6%) |
| $100,000 and over | 187 (79.6%) | 48 (20.4%) |
Public vs Private Health Insurance Coverage by Age in Wilhoit
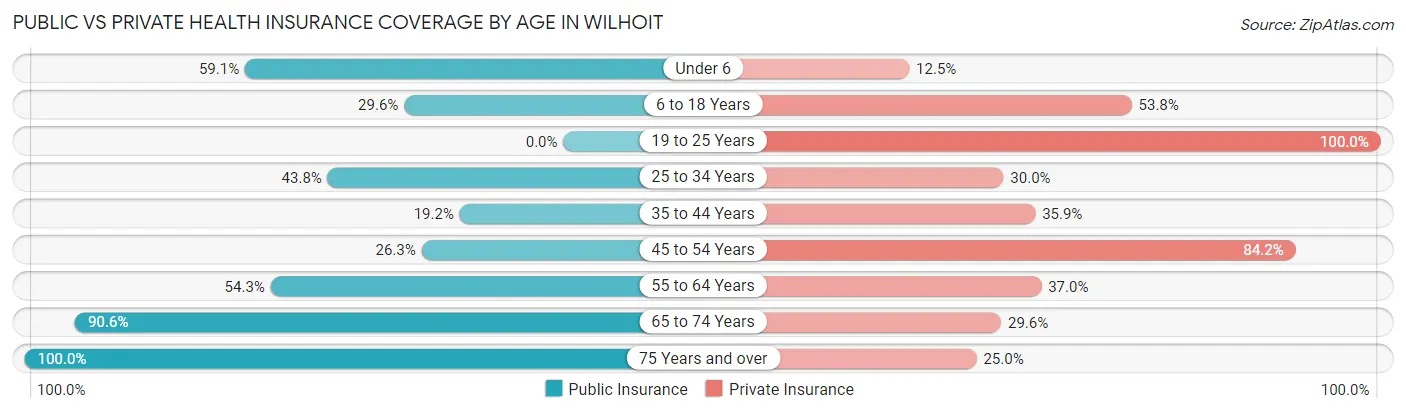
| Age Bracket | Public Insurance | Private Insurance |
| Under 6 | 52 (59.1%) | 11 (12.5%) |
| 6 to 18 Years | 39 (29.5%) | 71 (53.8%) |
| 19 to 25 Years | 0 (0.0%) | 22 (100.0%) |
| 25 to 34 Years | 35 (43.8%) | 24 (30.0%) |
| 35 to 44 Years | 15 (19.2%) | 28 (35.9%) |
| 45 to 54 Years | 30 (26.3%) | 96 (84.2%) |
| 55 to 64 Years | 113 (54.3%) | 77 (37.0%) |
| 65 to 74 Years | 184 (90.6%) | 60 (29.6%) |
| 75 Years and over | 84 (100.0%) | 21 (25.0%) |
| Total | 552 (54.7%) | 410 (40.6%) |
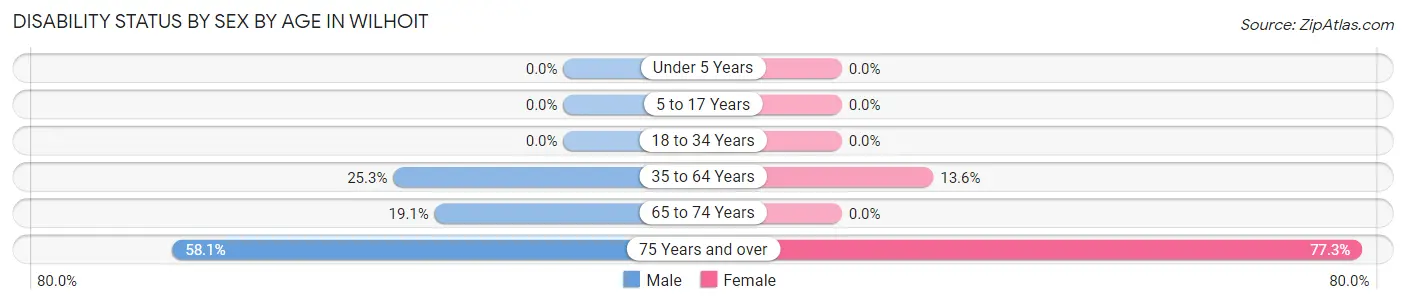
Disability Status by Sex by Age in Wilhoit
| Age Bracket | Male | Female |
| Under 5 Years | 0 (0.0%) | 0 (0.0%) |
| 5 to 17 Years | 0 (0.0%) | 0 (0.0%) |
| 18 to 34 Years | 0 (0.0%) | 0 (0.0%) |
| 35 to 64 Years | 49 (25.3%) | 28 (13.6%) |
| 65 to 74 Years | 26 (19.1%) | 0 (0.0%) |
| 75 Years and over | 36 (58.1%) | 17 (77.3%) |
Disability Class by Sex by Age in Wilhoit
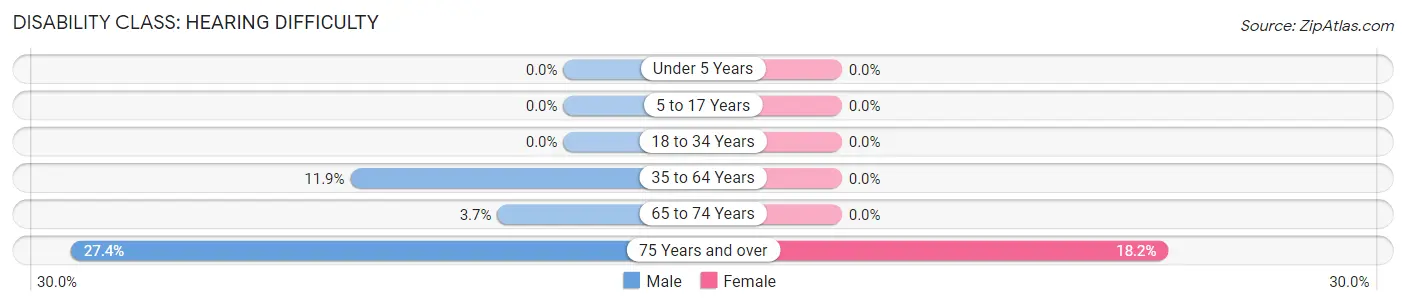
Disability Class: Hearing Difficulty
| Age Bracket | Male | Female |
| Under 5 Years | 0 (0.0%) | 0 (0.0%) |
| 5 to 17 Years | 0 (0.0%) | 0 (0.0%) |
| 18 to 34 Years | 0 (0.0%) | 0 (0.0%) |
| 35 to 64 Years | 23 (11.9%) | 0 (0.0%) |
| 65 to 74 Years | 5 (3.7%) | 0 (0.0%) |
| 75 Years and over | 17 (27.4%) | 4 (18.2%) |
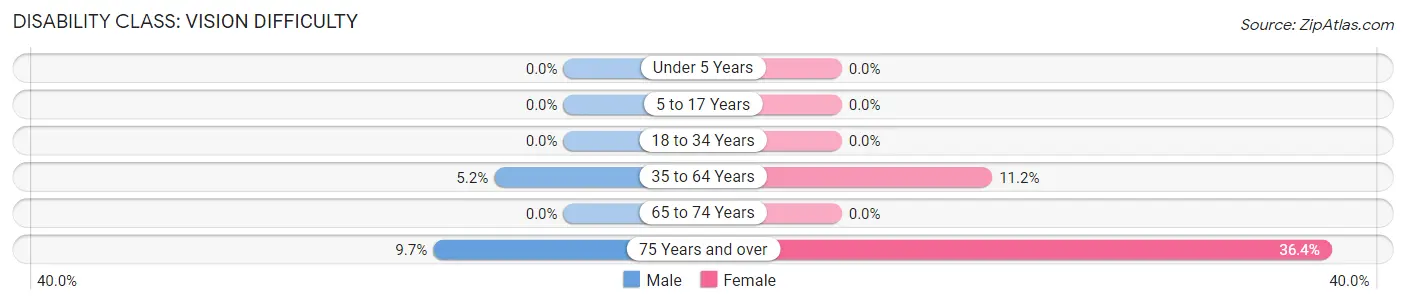
Disability Class: Vision Difficulty
| Age Bracket | Male | Female |
| Under 5 Years | 0 (0.0%) | 0 (0.0%) |
| 5 to 17 Years | 0 (0.0%) | 0 (0.0%) |
| 18 to 34 Years | 0 (0.0%) | 0 (0.0%) |
| 35 to 64 Years | 10 (5.1%) | 23 (11.2%) |
| 65 to 74 Years | 0 (0.0%) | 0 (0.0%) |
| 75 Years and over | 6 (9.7%) | 8 (36.4%) |
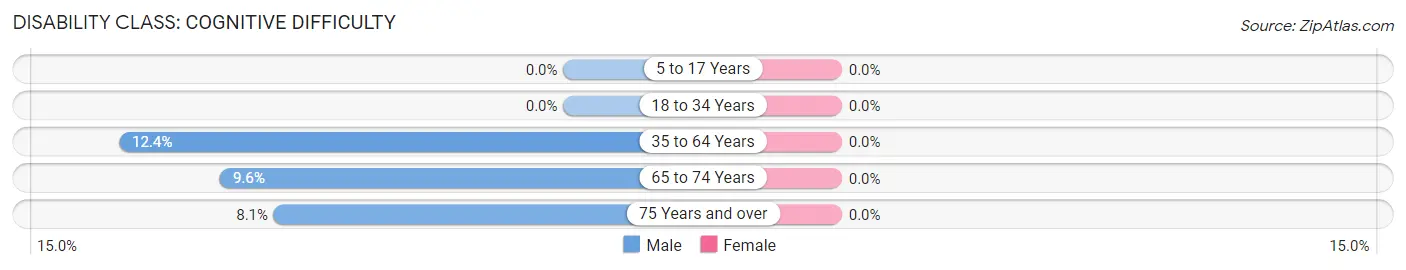
Disability Class: Cognitive Difficulty
| Age Bracket | Male | Female |
| 5 to 17 Years | 0 (0.0%) | 0 (0.0%) |
| 18 to 34 Years | 0 (0.0%) | 0 (0.0%) |
| 35 to 64 Years | 24 (12.4%) | 0 (0.0%) |
| 65 to 74 Years | 13 (9.6%) | 0 (0.0%) |
| 75 Years and over | 5 (8.1%) | 0 (0.0%) |
Disability Class: Ambulatory Difficulty
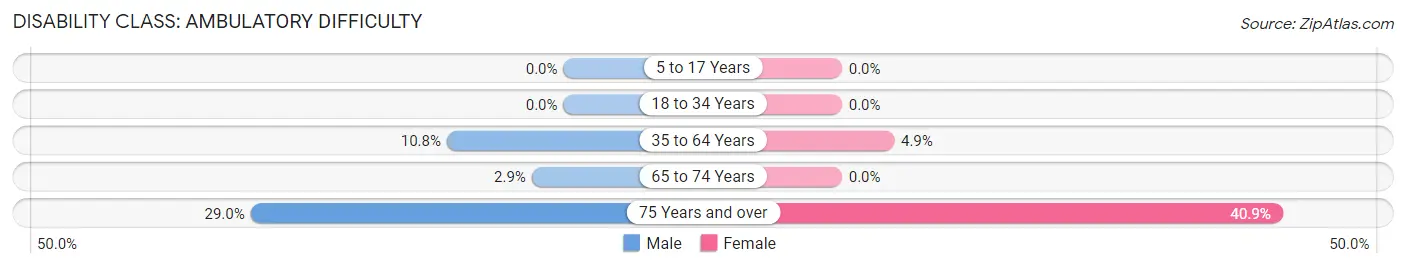
| Age Bracket | Male | Female |
| 5 to 17 Years | 0 (0.0%) | 0 (0.0%) |
| 18 to 34 Years | 0 (0.0%) | 0 (0.0%) |
| 35 to 64 Years | 21 (10.8%) | 10 (4.9%) |
| 65 to 74 Years | 4 (2.9%) | 0 (0.0%) |
| 75 Years and over | 18 (29.0%) | 9 (40.9%) |
Disability Class: Self-Care Difficulty
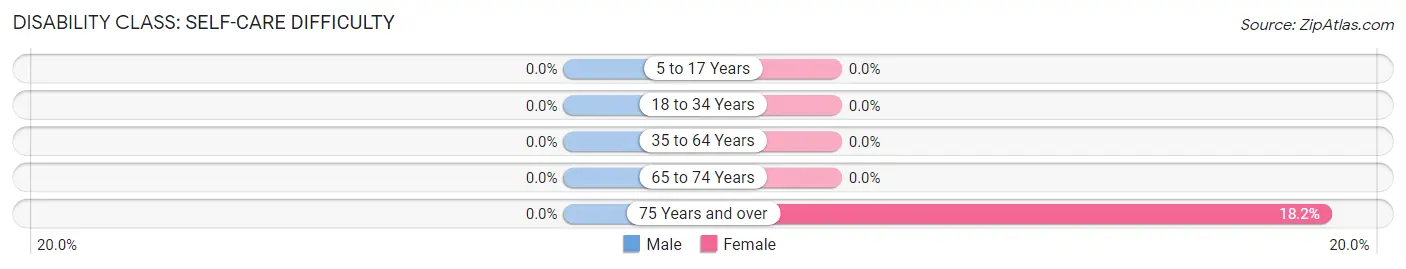
| Age Bracket | Male | Female |
| 5 to 17 Years | 0 (0.0%) | 0 (0.0%) |
| 18 to 34 Years | 0 (0.0%) | 0 (0.0%) |
| 35 to 64 Years | 0 (0.0%) | 0 (0.0%) |
| 65 to 74 Years | 0 (0.0%) | 0 (0.0%) |
| 75 Years and over | 0 (0.0%) | 4 (18.2%) |
Technology Access in Wilhoit
Computing Device Access in Wilhoit
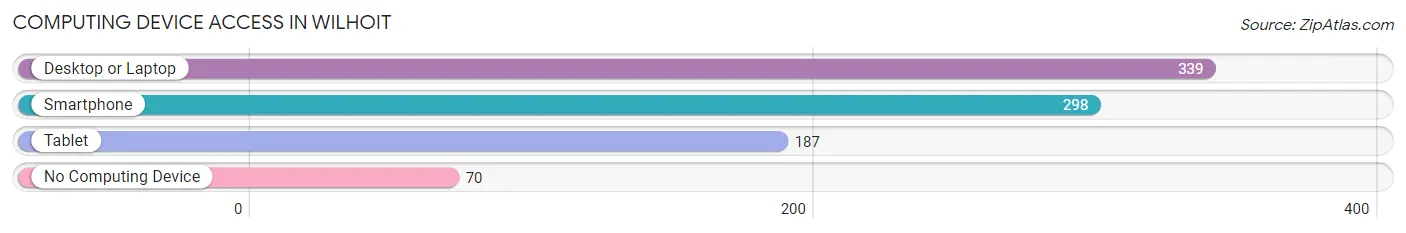
| Device Type | # Households | % Households |
| Desktop or Laptop | 339 | 72.9% |
| Smartphone | 298 | 64.1% |
| Tablet | 187 | 40.2% |
| No Computing Device | 70 | 15.0% |
| Total | 465 | 100.0% |
Internet Access in Wilhoit
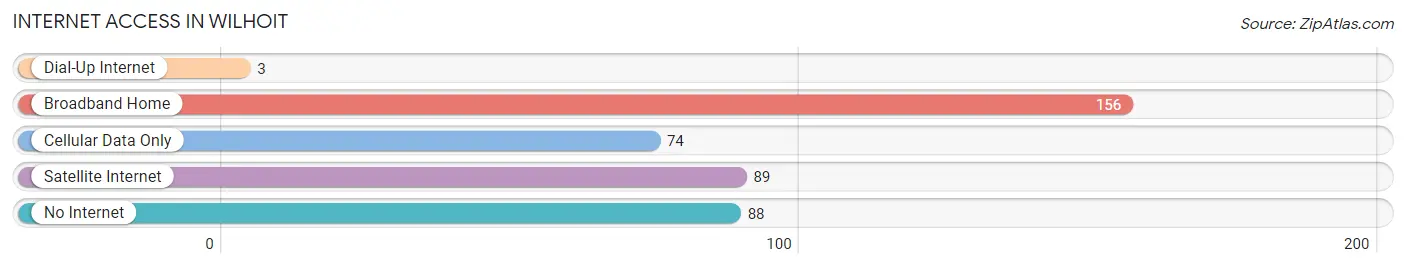
| Internet Type | # Households | % Households |
| Dial-Up Internet | 3 | 0.6% |
| Broadband Home | 156 | 33.6% |
| Cellular Data Only | 74 | 15.9% |
| Satellite Internet | 89 | 19.1% |
| No Internet | 88 | 18.9% |
| Total | 465 | 100.0% |
Wilhoit Summary
The small town of Wilhoit, Arizona is located in Yavapai County, in the northern part of the state. It is situated in the Bradshaw Mountains, about 25 miles northwest of Prescott. Wilhoit is a rural community with a population of just over 500 people, according to the 2010 census.
Geography
Wilhoit is located in the Bradshaw Mountains, which are part of the larger mountain range known as the Mogollon Rim. The town is situated at an elevation of 4,890 feet, and is surrounded by rolling hills and pine forests. The area is known for its mild climate, with temperatures rarely reaching above 90 degrees in the summer and rarely dropping below freezing in the winter.
The town is located near the confluence of the Agua Fria and Verde Rivers, which provide a source of water for the area. Wilhoit is also home to several small lakes, including Lake Pleasant, which is a popular destination for fishing and boating.
Economy
The economy of Wilhoit is largely based on agriculture and ranching. The town is home to several small farms and ranches, which produce a variety of crops and livestock. The area is also known for its production of pecans, which are sold locally and shipped to other parts of the state.
In addition to agriculture, Wilhoit is home to several small businesses, including a general store, a gas station, and a few restaurants. The town is also home to a small airport, which serves as a hub for private pilots and recreational aircraft.
Demographics
According to the 2010 census, Wilhoit had a population of 514 people. The population is predominantly white, with a small percentage of Hispanic and Native American residents. The median age of the population is 44 years old, and the median household income is $41,250.
The town is served by the Chino Valley Unified School District, which includes two elementary schools, a middle school, and a high school. The town is also home to a small library, which offers a variety of books and other resources.
Conclusion
Wilhoit, Arizona is a small rural town located in the Bradshaw Mountains of Yavapai County. The town is home to a population of just over 500 people, and is largely supported by agriculture and ranching. The town is also home to several small businesses, and is served by the Chino Valley Unified School District. Wilhoit is known for its mild climate and its proximity to several small lakes, making it a popular destination for outdoor recreation.
Common Questions
What is Per Capita Income in Wilhoit?
Per Capita income in Wilhoit is $28,074.
What is the Median Family Income in Wilhoit?
Median Family Income in Wilhoit is $74,861.
What is the Median Household income in Wilhoit?
Median Household Income in Wilhoit is $43,882.
What is Income or Wage Gap in Wilhoit?
Income or Wage Gap in Wilhoit is 38.5%.
Women in Wilhoit earn 61.5 cents for every dollar earned by a man.
What is Inequality or Gini Index in Wilhoit?
Inequality or Gini Index in Wilhoit is 0.42.
What is the Total Population of Wilhoit?
Total Population of Wilhoit is 1,009.
What is the Total Male Population of Wilhoit?
Total Male Population of Wilhoit is 555.
What is the Total Female Population of Wilhoit?
Total Female Population of Wilhoit is 454.
What is the Ratio of Males per 100 Females in Wilhoit?
There are 122.25 Males per 100 Females in Wilhoit.
What is the Ratio of Females per 100 Males in Wilhoit?
There are 81.80 Females per 100 Males in Wilhoit.
What is the Median Population Age in Wilhoit?
Median Population Age in Wilhoit is 52.8 Years.
What is the Average Family Size in Wilhoit
Average Family Size in Wilhoit is 2.8 People.
What is the Average Household Size in Wilhoit
Average Household Size in Wilhoit is 2.2 People.
How Large is the Labor Force in Wilhoit?
There are 360 People in the Labor Forcein in Wilhoit.
What is the Percentage of People in the Labor Force in Wilhoit?
45.3% of People are in the Labor Force in Wilhoit.