Lankin, ND Map & Demographics
Lankin Map
Lankin Overview
$35,041
PER CAPITA INCOME
52.9%
WAGE / INCOME GAP [ % ]
47.1¢/ $1
WAGE / INCOME GAP [ $ ]
0.40
INEQUALITY / GINI INDEX
115
TOTAL POPULATION
64
MALE POPULATION
51
FEMALE POPULATION
125.49
MALES / 100 FEMALES
79.69
FEMALES / 100 MALES
52.4
MEDIAN AGE
3.5
AVG FAMILY SIZE
1.9
AVG HOUSEHOLD SIZE
45
LABOR FORCE [ PEOPLE ]
45.0%
PERCENT IN LABOR FORCE
Lankin Zip Codes
Lankin Area Codes
Income in Lankin
Income Overview in Lankin
| Characteristic | Number | Measure |
| Per Capita Income | 115 | $35,041 |
| Median Family Income | 21 | $0 |
| Mean Family Income | 21 | $61,686 |
| Median Household Income | 61 | $0 |
| Mean Household Income | 61 | $64,328 |
| Income Deficit | 21 | $0 |
| Wage / Income Gap (%) | 115 | 52.86% |
| Wage / Income Gap ($) | 115 | 47.14¢ per $1 |
| Gini / Inequality Index | 115 | 0.40 |
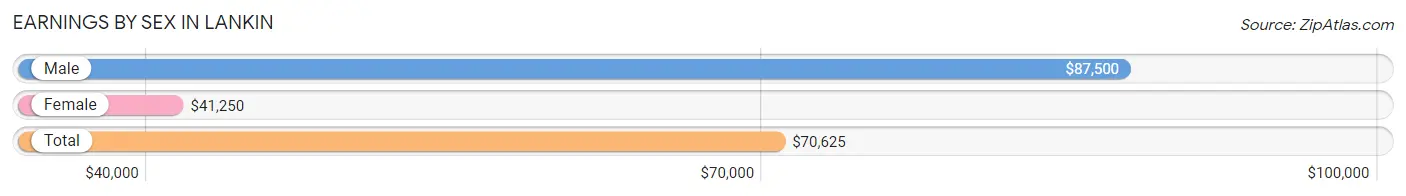
Earnings by Sex in Lankin
Average Earnings in Lankin are $70,625, $87,500 for men and $41,250 for women, a difference of 52.9%.
| Sex | Number | Average Earnings |
| Male | 42 (85.7%) | $87,500 |
| Female | 7 (14.3%) | $41,250 |
| Total | 49 (100.0%) | $70,625 |
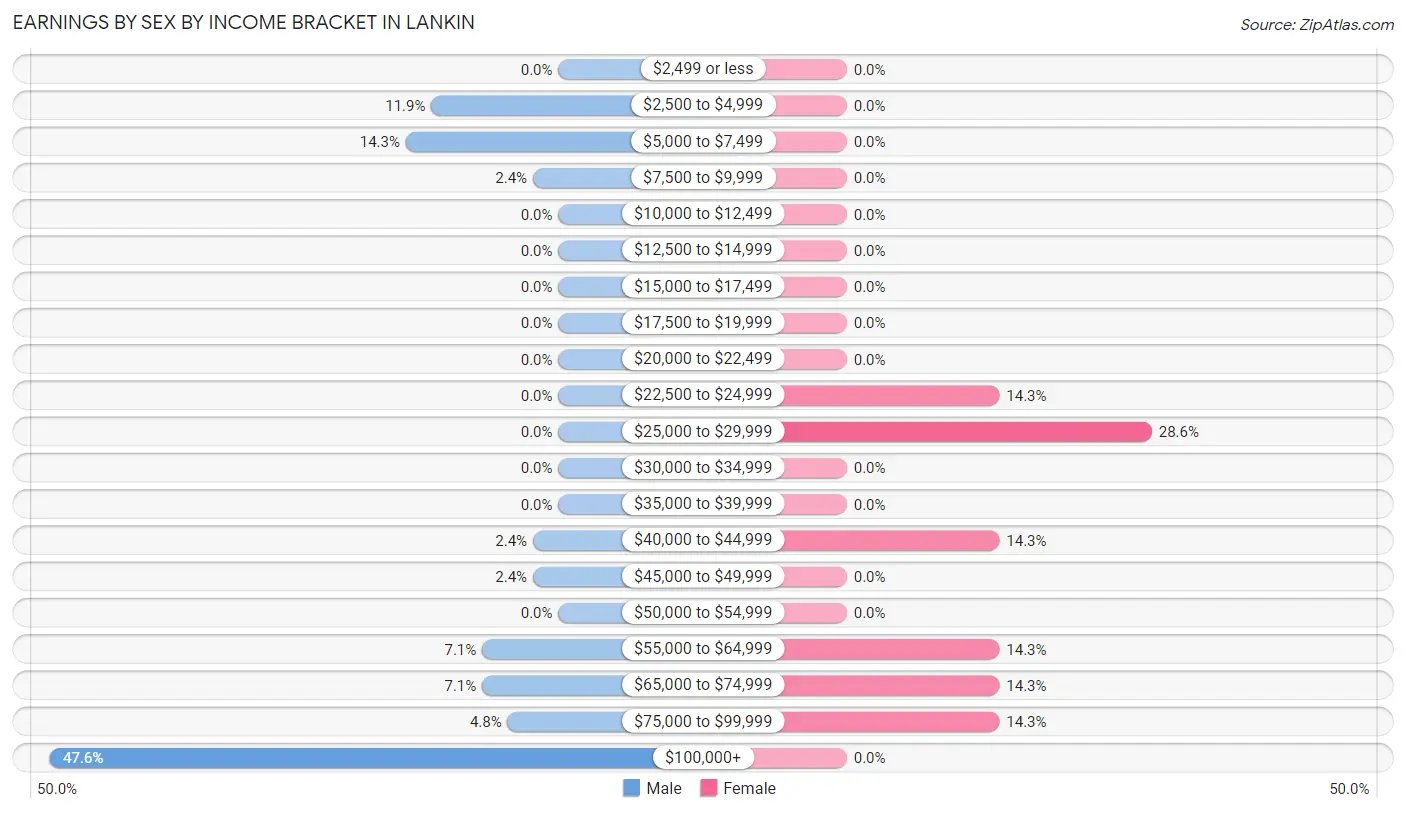
Earnings by Sex by Income Bracket in Lankin
The most common earnings brackets in Lankin are $100,000+ for men (20 | 47.6%) and $25,000 to $29,999 for women (2 | 28.6%).
| Income | Male | Female |
| $2,499 or less | 0 (0.0%) | 0 (0.0%) |
| $2,500 to $4,999 | 5 (11.9%) | 0 (0.0%) |
| $5,000 to $7,499 | 6 (14.3%) | 0 (0.0%) |
| $7,500 to $9,999 | 1 (2.4%) | 0 (0.0%) |
| $10,000 to $12,499 | 0 (0.0%) | 0 (0.0%) |
| $12,500 to $14,999 | 0 (0.0%) | 0 (0.0%) |
| $15,000 to $17,499 | 0 (0.0%) | 0 (0.0%) |
| $17,500 to $19,999 | 0 (0.0%) | 0 (0.0%) |
| $20,000 to $22,499 | 0 (0.0%) | 0 (0.0%) |
| $22,500 to $24,999 | 0 (0.0%) | 1 (14.3%) |
| $25,000 to $29,999 | 0 (0.0%) | 2 (28.6%) |
| $30,000 to $34,999 | 0 (0.0%) | 0 (0.0%) |
| $35,000 to $39,999 | 0 (0.0%) | 0 (0.0%) |
| $40,000 to $44,999 | 1 (2.4%) | 1 (14.3%) |
| $45,000 to $49,999 | 1 (2.4%) | 0 (0.0%) |
| $50,000 to $54,999 | 0 (0.0%) | 0 (0.0%) |
| $55,000 to $64,999 | 3 (7.1%) | 1 (14.3%) |
| $65,000 to $74,999 | 3 (7.1%) | 1 (14.3%) |
| $75,000 to $99,999 | 2 (4.8%) | 1 (14.3%) |
| $100,000+ | 20 (47.6%) | 0 (0.0%) |
| Total | 42 (100.0%) | 7 (100.0%) |
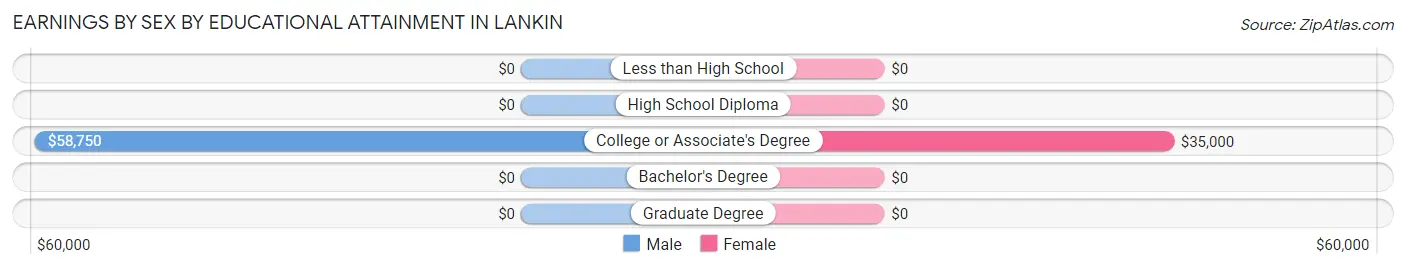
Earnings by Sex by Educational Attainment in Lankin
| Educational Attainment | Male Income | Female Income |
| Less than High School | - | - |
| High School Diploma | - | - |
| College or Associate's Degree | $58,750 | $35,000 |
| Bachelor's Degree | - | - |
| Graduate Degree | - | - |
| Total | - | - |
Family Income in Lankin
Family Income Brackets in Lankin
According to the Lankin family income data, there are 5 families falling into the $35,000 to $49,999 income range, which is the most common income bracket and makes up 23.8% of all families.
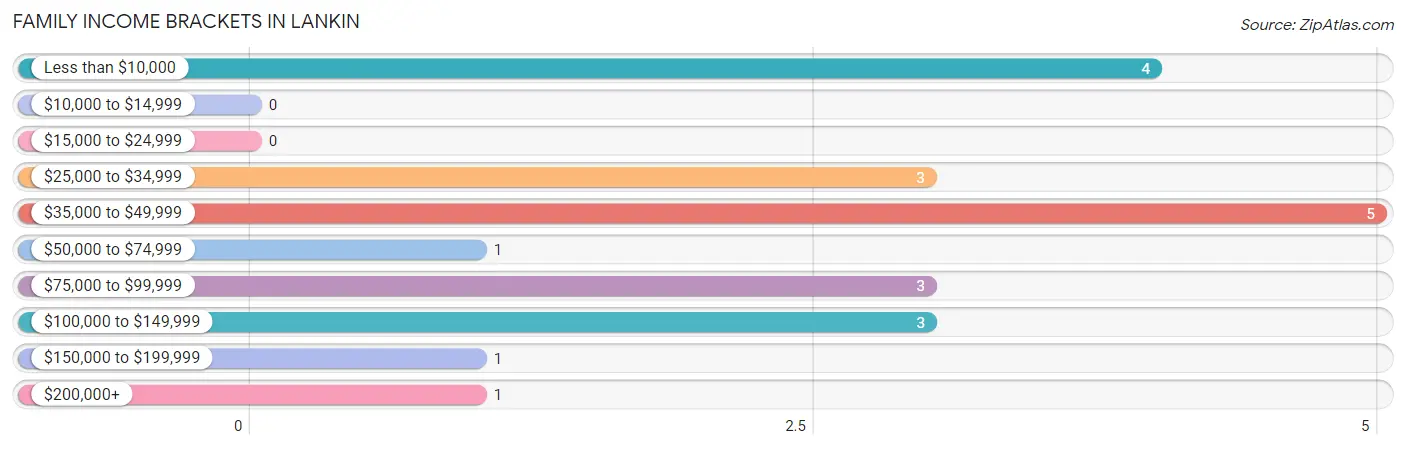
| Income Bracket | # Families | % Families |
| Less than $10,000 | 4 | 19.0% |
| $10,000 to $14,999 | 0 | 0.0% |
| $15,000 to $24,999 | 0 | 0.0% |
| $25,000 to $34,999 | 3 | 14.3% |
| $35,000 to $49,999 | 5 | 23.8% |
| $50,000 to $74,999 | 1 | 4.8% |
| $75,000 to $99,999 | 3 | 14.3% |
| $100,000 to $149,999 | 3 | 14.3% |
| $150,000 to $199,999 | 1 | 4.8% |
| $200,000+ | 1 | 4.8% |
Family Income by Famaliy Size in Lankin
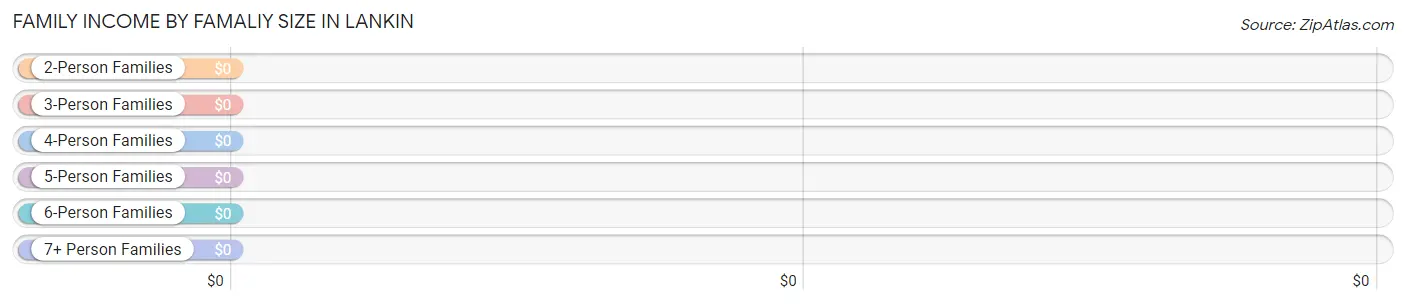
| Income Bracket | # Families | Median Income |
| 2-Person Families | 12 (57.1%) | $0 |
| 3-Person Families | 3 (14.3%) | $0 |
| 4-Person Families | 0 (0.0%) | $0 |
| 5-Person Families | 4 (19.1%) | $0 |
| 6-Person Families | 2 (9.5%) | $0 |
| 7+ Person Families | 0 (0.0%) | $0 |
| Total | 21 (100.0%) | $0 |
Family Income by Number of Earners in Lankin
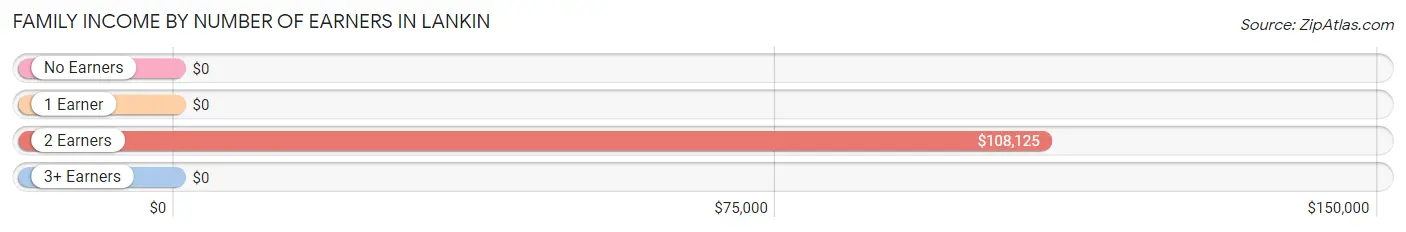
| Number of Earners | # Families | Median Income |
| No Earners | 7 (33.3%) | $0 |
| 1 Earner | 8 (38.1%) | $0 |
| 2 Earners | 5 (23.8%) | $108,125 |
| 3+ Earners | 1 (4.8%) | $0 |
| Total | 21 (100.0%) | $0 |
Household Income in Lankin
Household Income Brackets in Lankin
With 24 households falling in the category, the $100,000 to $149,999 income range is the most frequent in Lankin, accounting for 39.3% of all households. In contrast, only 1 households (1.6%) fall into the $50,000 to $74,999 income bracket, making it the least populous group.
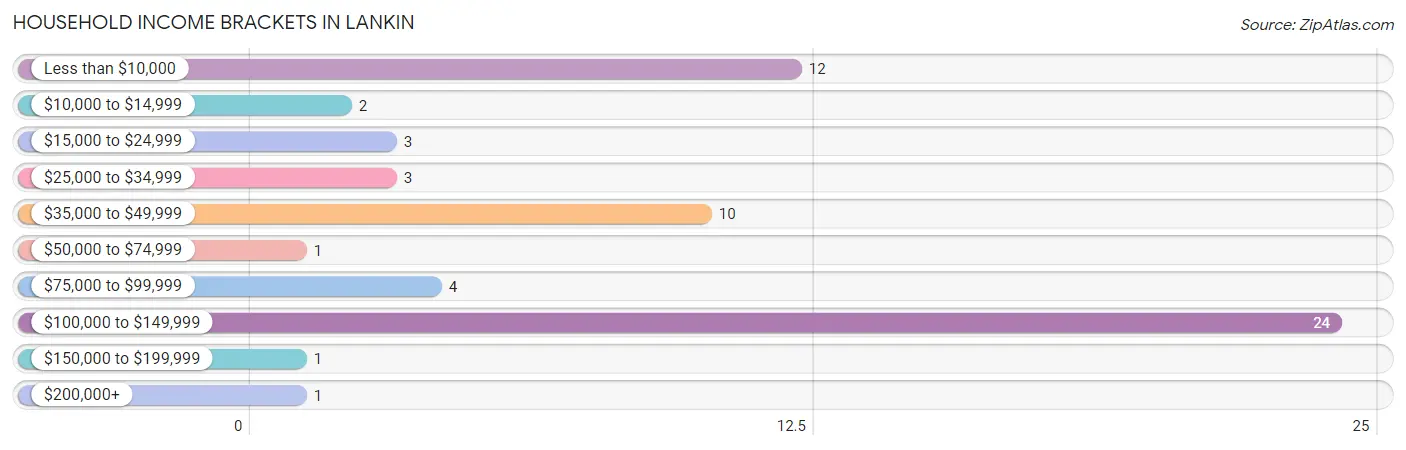
| Income Bracket | # Households | % Households |
| Less than $10,000 | 12 | 19.7% |
| $10,000 to $14,999 | 2 | 3.3% |
| $15,000 to $24,999 | 3 | 4.9% |
| $25,000 to $34,999 | 3 | 4.9% |
| $35,000 to $49,999 | 10 | 16.4% |
| $50,000 to $74,999 | 1 | 1.6% |
| $75,000 to $99,999 | 4 | 6.6% |
| $100,000 to $149,999 | 24 | 39.3% |
| $150,000 to $199,999 | 1 | 1.6% |
| $200,000+ | 1 | 1.6% |
Household Income by Householder Age in Lankin
The median household income in Lankin is $0, with the highest median household income of $108,750 found in the 25 to 44 years age bracket for the primary householder. A total of 4 households (6.6%) fall into this category. Meanwhile, the 15 to 24 years age bracket for the primary householder has the lowest median household income of $0, with 20 households (32.8%) in this group.
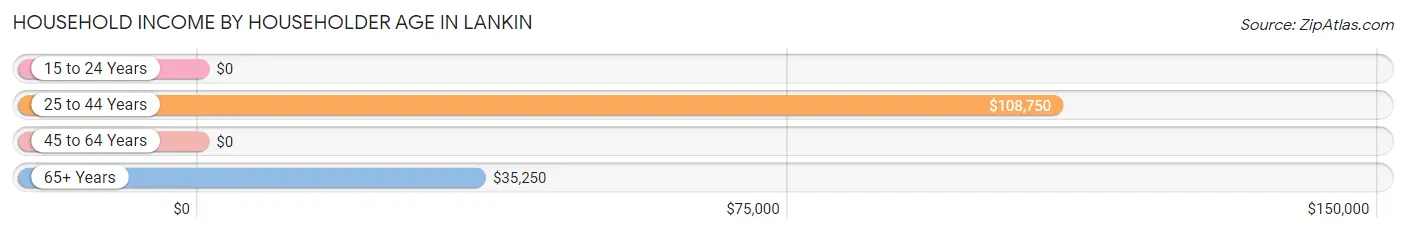
| Income Bracket | # Households | Median Income |
| 15 to 24 Years | 20 (32.8%) | $0 |
| 25 to 44 Years | 4 (6.6%) | $108,750 |
| 45 to 64 Years | 20 (32.8%) | $0 |
| 65+ Years | 17 (27.9%) | $35,250 |
| Total | 61 (100.0%) | $0 |
Poverty in Lankin
Income Below Poverty by Sex and Age in Lankin
With 28.1% poverty level for males and 19.6% for females among the residents of Lankin, 16 and 17 year old males and 18 to 24 year old females are the most vulnerable to poverty, with 3 males (100.0%) and 4 females (100.0%) in their respective age groups living below the poverty level.
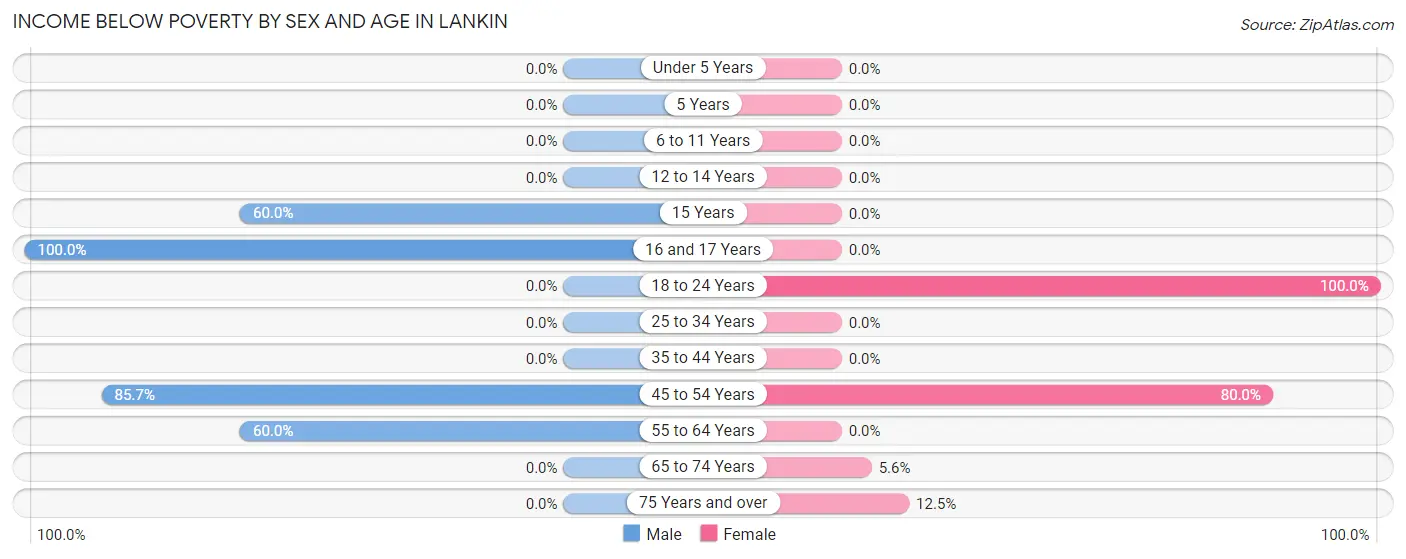
| Age Bracket | Male | Female |
| Under 5 Years | 0 (0.0%) | 0 (0.0%) |
| 5 Years | 0 (0.0%) | 0 (0.0%) |
| 6 to 11 Years | 0 (0.0%) | 0 (0.0%) |
| 12 to 14 Years | 0 (0.0%) | 0 (0.0%) |
| 15 Years | 3 (60.0%) | 0 (0.0%) |
| 16 and 17 Years | 3 (100.0%) | 0 (0.0%) |
| 18 to 24 Years | 0 (0.0%) | 4 (100.0%) |
| 25 to 34 Years | 0 (0.0%) | 0 (0.0%) |
| 35 to 44 Years | 0 (0.0%) | 0 (0.0%) |
| 45 to 54 Years | 6 (85.7%) | 4 (80.0%) |
| 55 to 64 Years | 6 (60.0%) | 0 (0.0%) |
| 65 to 74 Years | 0 (0.0%) | 1 (5.6%) |
| 75 Years and over | 0 (0.0%) | 1 (12.5%) |
| Total | 18 (28.1%) | 10 (19.6%) |
Income Above Poverty by Sex and Age in Lankin
According to the poverty statistics in Lankin, males aged 6 to 11 years and females aged under 5 years are the age groups that are most secure financially, with 100.0% of males and 100.0% of females in these age groups living above the poverty line.
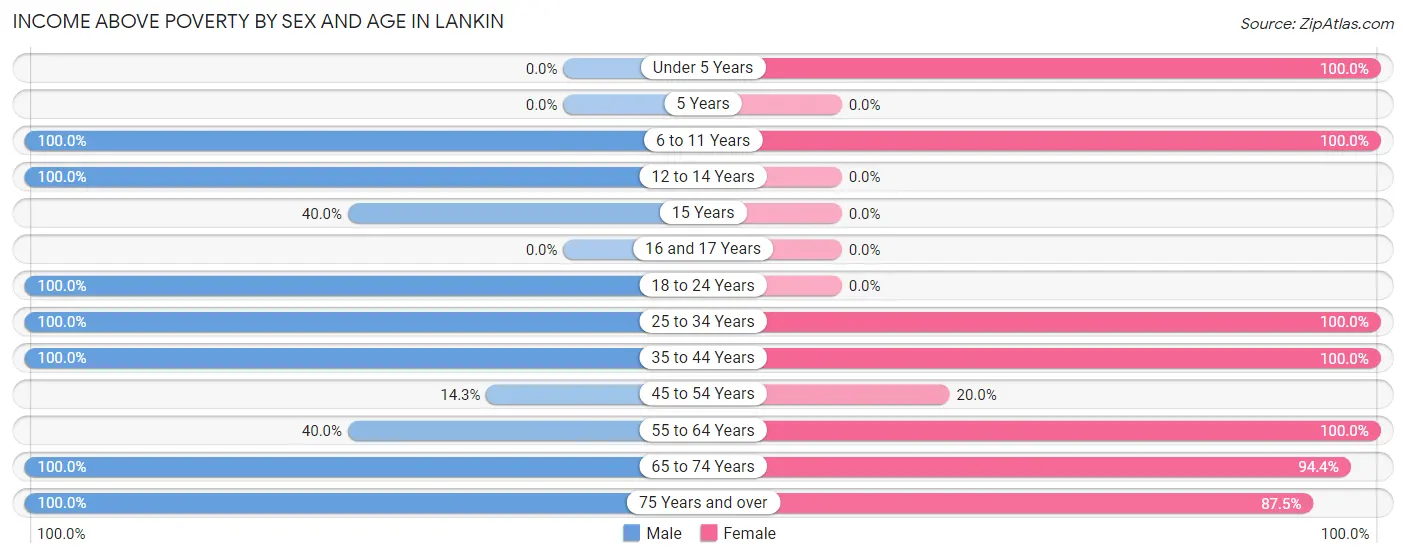
| Age Bracket | Male | Female |
| Under 5 Years | 0 (0.0%) | 3 (100.0%) |
| 5 Years | 0 (0.0%) | 0 (0.0%) |
| 6 to 11 Years | 2 (100.0%) | 3 (100.0%) |
| 12 to 14 Years | 2 (100.0%) | 0 (0.0%) |
| 15 Years | 2 (40.0%) | 0 (0.0%) |
| 16 and 17 Years | 0 (0.0%) | 0 (0.0%) |
| 18 to 24 Years | 21 (100.0%) | 0 (0.0%) |
| 25 to 34 Years | 2 (100.0%) | 2 (100.0%) |
| 35 to 44 Years | 2 (100.0%) | 1 (100.0%) |
| 45 to 54 Years | 1 (14.3%) | 1 (20.0%) |
| 55 to 64 Years | 4 (40.0%) | 7 (100.0%) |
| 65 to 74 Years | 2 (100.0%) | 17 (94.4%) |
| 75 Years and over | 8 (100.0%) | 7 (87.5%) |
| Total | 46 (71.9%) | 41 (80.4%) |
Income Below Poverty Among Married-Couple Families in Lankin
The poverty statistics for married-couple families in Lankin show that 19.1% or 4 of the total 21 families live below the poverty line. Families with 1 or 2 children have the highest poverty rate of 66.7%, comprising of 4 families. On the other hand, families with no children have the lowest poverty rate of 0.0%, which includes 0 families.
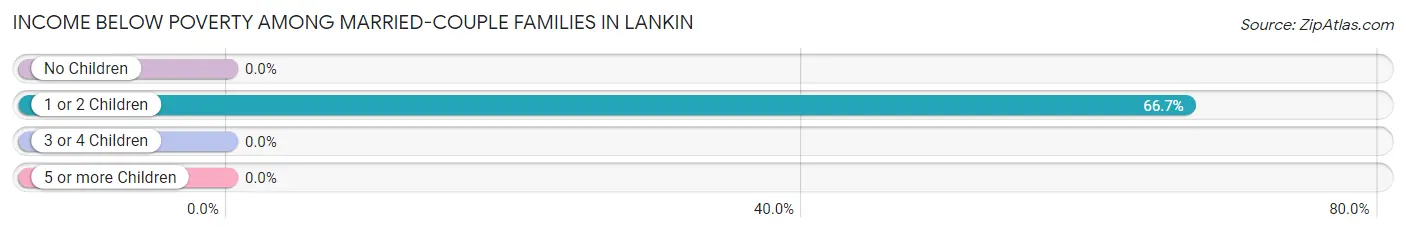
| Children | Above Poverty | Below Poverty |
| No Children | 13 (100.0%) | 0 (0.0%) |
| 1 or 2 Children | 2 (33.3%) | 4 (66.7%) |
| 3 or 4 Children | 2 (100.0%) | 0 (0.0%) |
| 5 or more Children | 0 (0.0%) | 0 (0.0%) |
| Total | 17 (80.9%) | 4 (19.1%) |
Income Below Poverty Among Single-Parent Households in Lankin
| Children | Single Father | Single Mother |
| No Children | 0 (0.0%) | 0 (0.0%) |
| 1 or 2 Children | 0 (0.0%) | 0 (0.0%) |
| 3 or 4 Children | 0 (0.0%) | 0 (0.0%) |
| 5 or more Children | 0 (0.0%) | 0 (0.0%) |
| Total | 0 (0.0%) | 0 (0.0%) |
Income Below Poverty Among Married-Couple vs Single-Parent Households in Lankin
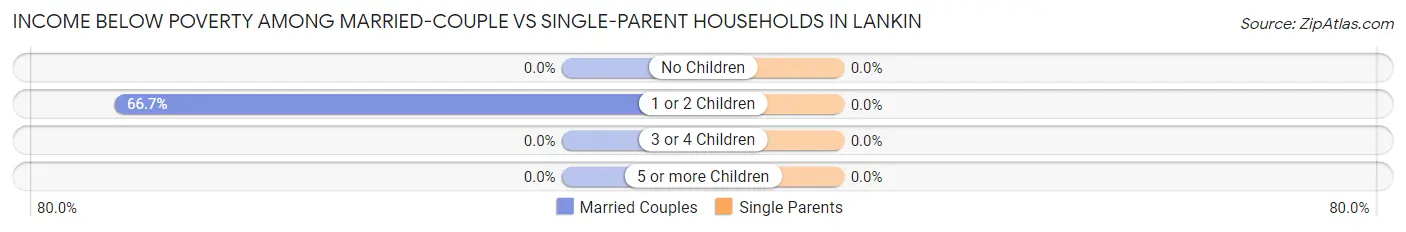
| Children | Married-Couple Families | Single-Parent Households |
| No Children | 0 (0.0%) | 0 (0.0%) |
| 1 or 2 Children | 4 (66.7%) | 0 (0.0%) |
| 3 or 4 Children | 0 (0.0%) | 0 (0.0%) |
| 5 or more Children | 0 (0.0%) | 0 (0.0%) |
| Total | 4 (19.1%) | 0 (0.0%) |
Race in Lankin
The most populous races in Lankin are , and White / Caucasian (115 | 100.0%).
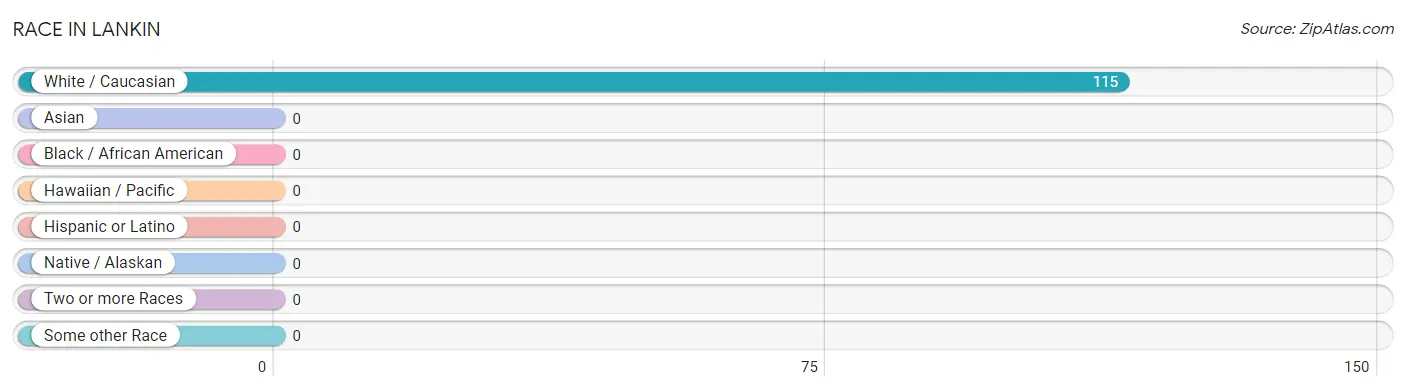
| Race | # Population | % Population |
| Asian | 0 | 0.0% |
| Black / African American | 0 | 0.0% |
| Hawaiian / Pacific | 0 | 0.0% |
| Hispanic or Latino | 0 | 0.0% |
| Native / Alaskan | 0 | 0.0% |
| White / Caucasian | 115 | 100.0% |
| Two or more Races | 0 | 0.0% |
| Some other Race | 0 | 0.0% |
| Total | 115 | 100.0% |
Ancestry in Lankin
The most populous ancestries reported in Lankin are Czech (47 | 40.9%), Irish (22 | 19.1%), French (18 | 15.7%), Norwegian (18 | 15.7%), and German (16 | 13.9%), together accounting for 105.2% of all Lankin residents.
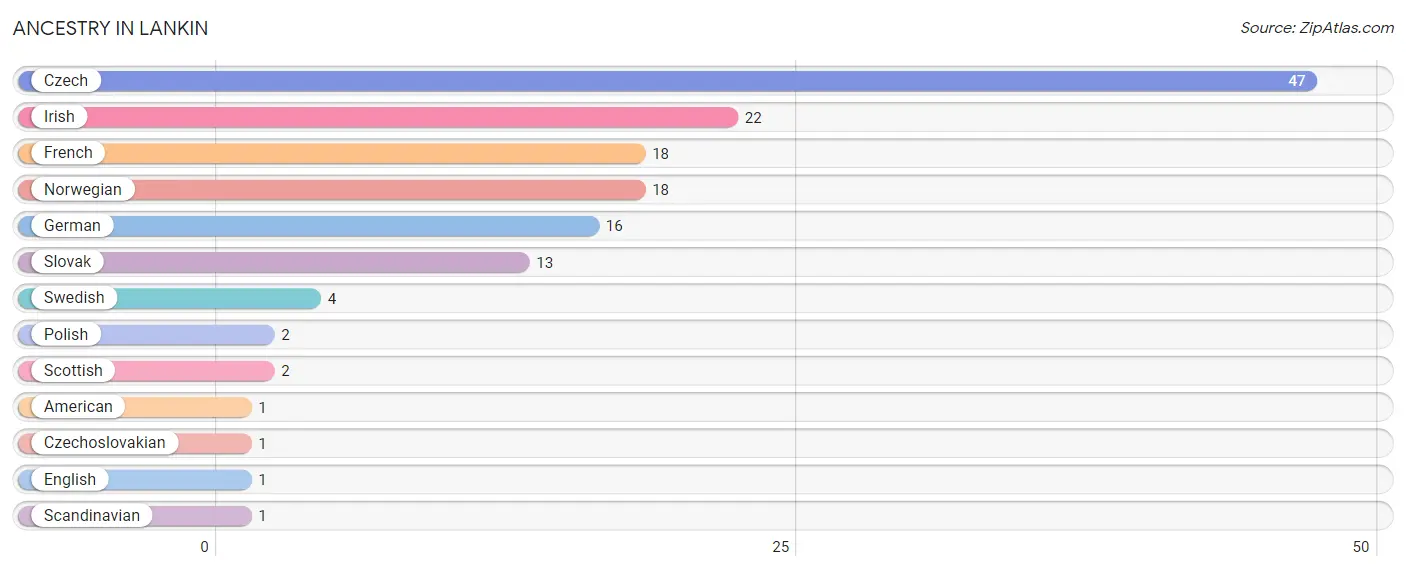
| Ancestry | # Population | % Population |
| American | 1 | 0.9% |
| Czech | 47 | 40.9% |
| Czechoslovakian | 1 | 0.9% |
| English | 1 | 0.9% |
| French | 18 | 15.7% |
| German | 16 | 13.9% |
| Irish | 22 | 19.1% |
| Norwegian | 18 | 15.7% |
| Polish | 2 | 1.7% |
| Scandinavian | 1 | 0.9% |
| Scottish | 2 | 1.7% |
| Slovak | 13 | 11.3% |
| Swedish | 4 | 3.5% | View All 13 Rows |
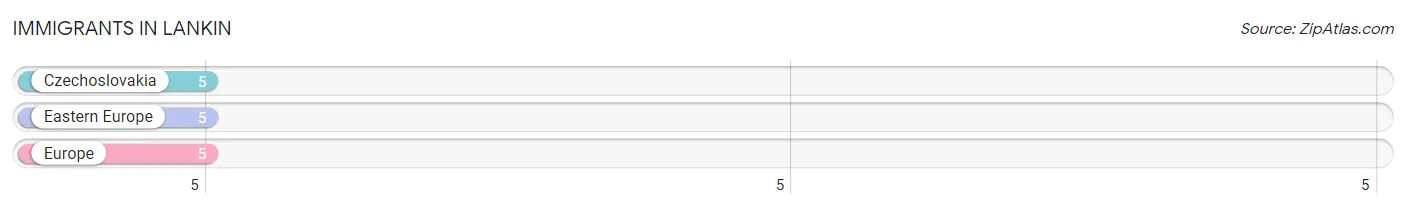
Immigrants in Lankin
The most numerous immigrant groups reported in Lankin came from Czechoslovakia (5 | 4.3%), Eastern Europe (5 | 4.3%), and Europe (5 | 4.3%), together accounting for 13.1% of all Lankin residents.
| Immigration Origin | # Population | % Population |
| Czechoslovakia | 5 | 4.3% |
| Eastern Europe | 5 | 4.3% |
| Europe | 5 | 4.3% | View All 3 Rows |
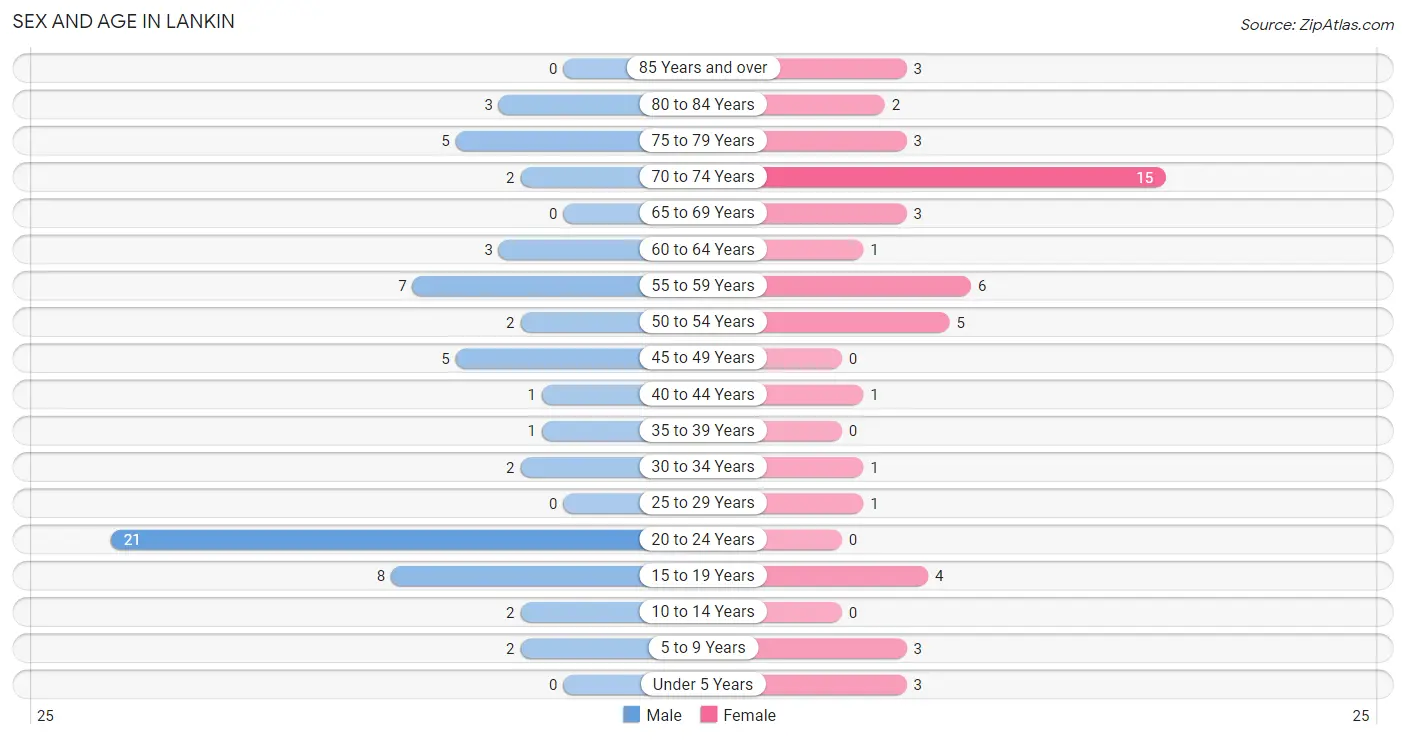
Sex and Age in Lankin
Sex and Age in Lankin
The most populous age groups in Lankin are 20 to 24 Years (21 | 32.8%) for men and 70 to 74 Years (15 | 29.4%) for women.
| Age Bracket | Male | Female |
| Under 5 Years | 0 (0.0%) | 3 (5.9%) |
| 5 to 9 Years | 2 (3.1%) | 3 (5.9%) |
| 10 to 14 Years | 2 (3.1%) | 0 (0.0%) |
| 15 to 19 Years | 8 (12.5%) | 4 (7.8%) |
| 20 to 24 Years | 21 (32.8%) | 0 (0.0%) |
| 25 to 29 Years | 0 (0.0%) | 1 (2.0%) |
| 30 to 34 Years | 2 (3.1%) | 1 (2.0%) |
| 35 to 39 Years | 1 (1.6%) | 0 (0.0%) |
| 40 to 44 Years | 1 (1.6%) | 1 (2.0%) |
| 45 to 49 Years | 5 (7.8%) | 0 (0.0%) |
| 50 to 54 Years | 2 (3.1%) | 5 (9.8%) |
| 55 to 59 Years | 7 (10.9%) | 6 (11.8%) |
| 60 to 64 Years | 3 (4.7%) | 1 (2.0%) |
| 65 to 69 Years | 0 (0.0%) | 3 (5.9%) |
| 70 to 74 Years | 2 (3.1%) | 15 (29.4%) |
| 75 to 79 Years | 5 (7.8%) | 3 (5.9%) |
| 80 to 84 Years | 3 (4.7%) | 2 (3.9%) |
| 85 Years and over | 0 (0.0%) | 3 (5.9%) |
| Total | 64 (100.0%) | 51 (100.0%) |
Families and Households in Lankin
Median Family Size in Lankin
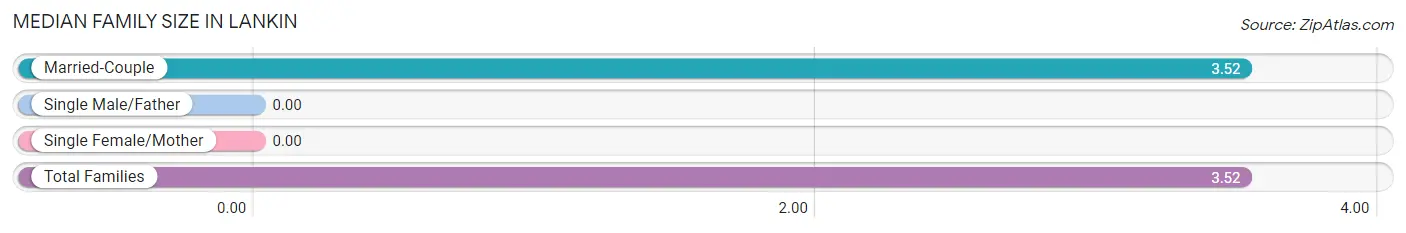
| Family Type | # Families | Family Size |
| Married-Couple | 21 (100.0%) | 3.52 |
| Single Male/Father | 0 (0.0%) | - |
| Single Female/Mother | 0 (0.0%) | - |
| Total Families | 21 (100.0%) | 3.52 |
Median Household Size in Lankin
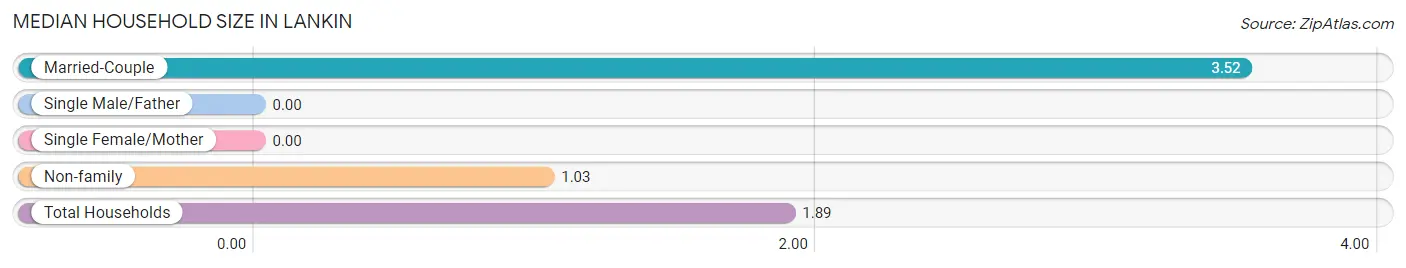
| Household Type | # Households | Household Size |
| Married-Couple | 21 (34.4%) | 3.52 |
| Single Male/Father | 0 (0.0%) | - |
| Single Female/Mother | 0 (0.0%) | - |
| Non-family | 40 (65.6%) | 1.03 |
| Total Households | 61 (100.0%) | 1.89 |
Household Size by Marriage Status in Lankin
Out of a total of 61 households in Lankin, 21 (34.4%) are family households, while 40 (65.6%) are nonfamily households. The most numerous type of family households are 2-person households, comprising 12, and the most common type of nonfamily households are 1-person households, comprising 39.
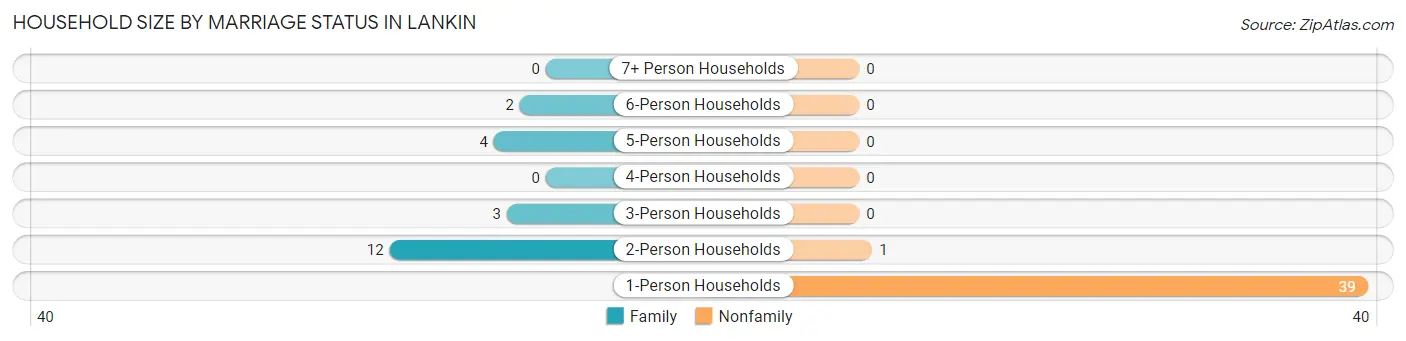
| Household Size | Family Households | Nonfamily Households |
| 1-Person Households | - | 39 (63.9%) |
| 2-Person Households | 12 (19.7%) | 1 (1.6%) |
| 3-Person Households | 3 (4.9%) | 0 (0.0%) |
| 4-Person Households | 0 (0.0%) | 0 (0.0%) |
| 5-Person Households | 4 (6.6%) | 0 (0.0%) |
| 6-Person Households | 2 (3.3%) | 0 (0.0%) |
| 7+ Person Households | 0 (0.0%) | 0 (0.0%) |
| Total | 21 (34.4%) | 40 (65.6%) |
Female Fertility in Lankin
Fertility by Age in Lankin
| Age Bracket | Women with Births | Births / 1,000 Women |
| 15 to 19 years | 0 (0.0%) | 0.0 |
| 20 to 34 years | 0 (0.0%) | 0.0 |
| 35 to 50 years | 0 (0.0%) | 0.0 |
| Total | 0 (0.0%) | 0.0 |
Fertility by Age by Marriage Status in Lankin
| Age Bracket | Married | Unmarried |
| 15 to 19 years | 0 (0.0%) | 0 (0.0%) |
| 20 to 34 years | 0 (0.0%) | 0 (0.0%) |
| 35 to 50 years | 0 (0.0%) | 0 (0.0%) |
| Total | 0 (0.0%) | 0 (0.0%) |
Fertility by Education in Lankin
| Educational Attainment | Women with Births | Births / 1,000 Women |
| Less than High School | 0 (0.0%) | 0.0 |
| High School Diploma | 0 (0.0%) | 0.0 |
| College or Associate's Degree | 0 (0.0%) | 0.0 |
| Bachelor's Degree | 0 (0.0%) | 0.0 |
| Graduate Degree | 0 (0.0%) | 0.0 |
| Total | 0 (0.0%) | 0.0 |
Fertility by Education by Marriage Status in Lankin
| Educational Attainment | Married | Unmarried |
| Less than High School | 0 (0.0%) | 0 (0.0%) |
| High School Diploma | 0 (0.0%) | 0 (0.0%) |
| College or Associate's Degree | 0 (0.0%) | 0 (0.0%) |
| Bachelor's Degree | 0 (0.0%) | 0 (0.0%) |
| Graduate Degree | 0 (0.0%) | 0 (0.0%) |
| Total | 0 (0.0%) | 0 (0.0%) |
Employment Characteristics in Lankin
Employment by Class of Employer in Lankin
Among the 45 employed individuals in Lankin, private company employees (30 | 66.7%), self-employed (not incorporated) (5 | 11.1%), and unpaid family workers (5 | 11.1%) make up the most common classes of employment.
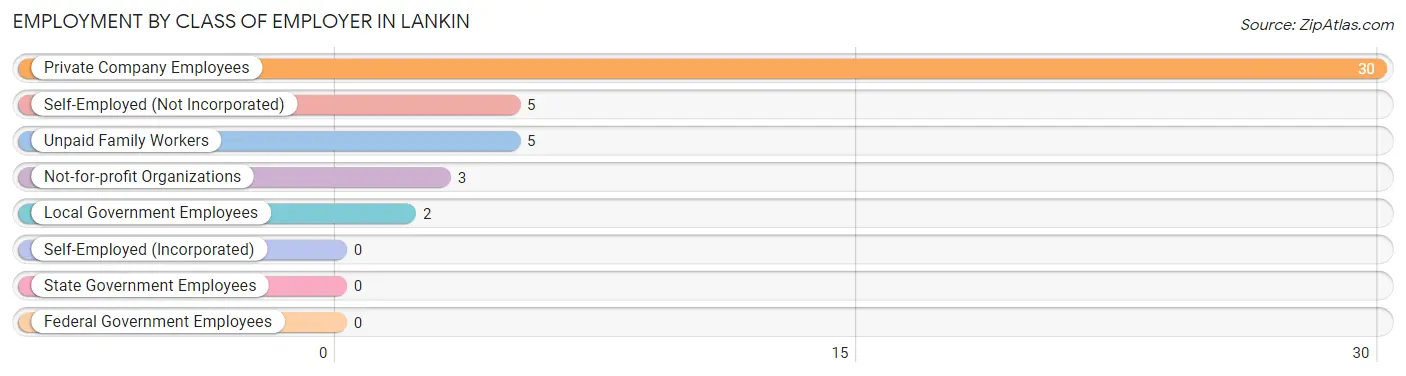
| Employer Class | # Employees | % Employees |
| Private Company Employees | 30 | 66.7% |
| Self-Employed (Incorporated) | 0 | 0.0% |
| Self-Employed (Not Incorporated) | 5 | 11.1% |
| Not-for-profit Organizations | 3 | 6.7% |
| Local Government Employees | 2 | 4.4% |
| State Government Employees | 0 | 0.0% |
| Federal Government Employees | 0 | 0.0% |
| Unpaid Family Workers | 5 | 11.1% |
| Total | 45 | 100.0% |
Employment Status by Age in Lankin
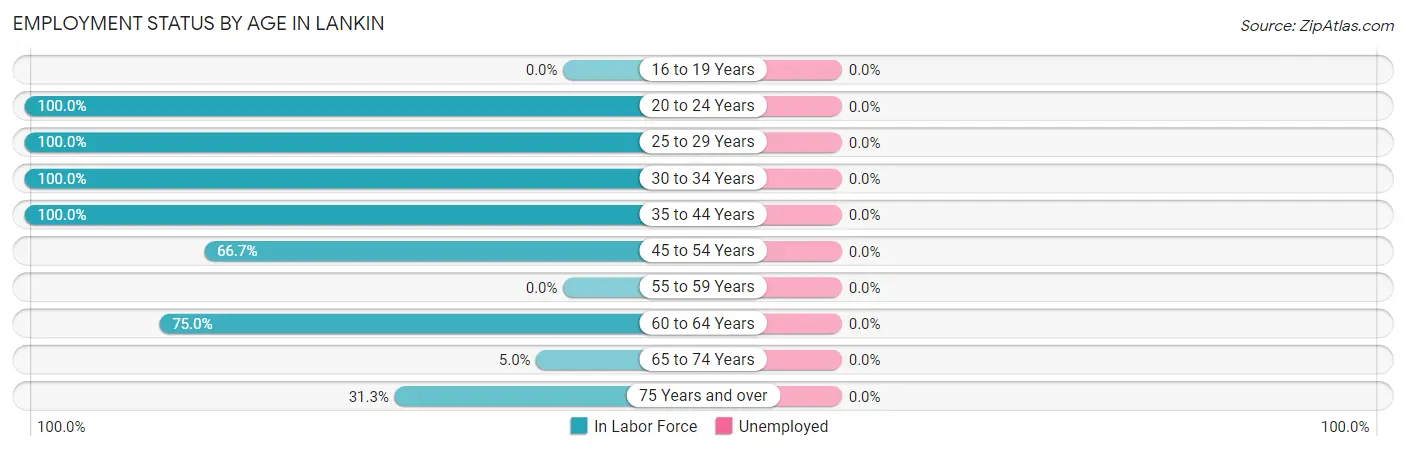
| Age Bracket | In Labor Force | Unemployed |
| 16 to 19 Years | 0 (0.0%) | 0 (0.0%) |
| 20 to 24 Years | 21 (100.0%) | 0 (0.0%) |
| 25 to 29 Years | 1 (100.0%) | 0 (0.0%) |
| 30 to 34 Years | 3 (100.0%) | 0 (0.0%) |
| 35 to 44 Years | 3 (100.0%) | 0 (0.0%) |
| 45 to 54 Years | 8 (66.7%) | 0 (0.0%) |
| 55 to 59 Years | 0 (0.0%) | 0 (0.0%) |
| 60 to 64 Years | 3 (75.0%) | 0 (0.0%) |
| 65 to 74 Years | 1 (5.0%) | 0 (0.0%) |
| 75 Years and over | 5 (31.3%) | 0 (0.0%) |
| Total | 45 (45.0%) | 0 (0.0%) |
Employment Status by Educational Attainment in Lankin
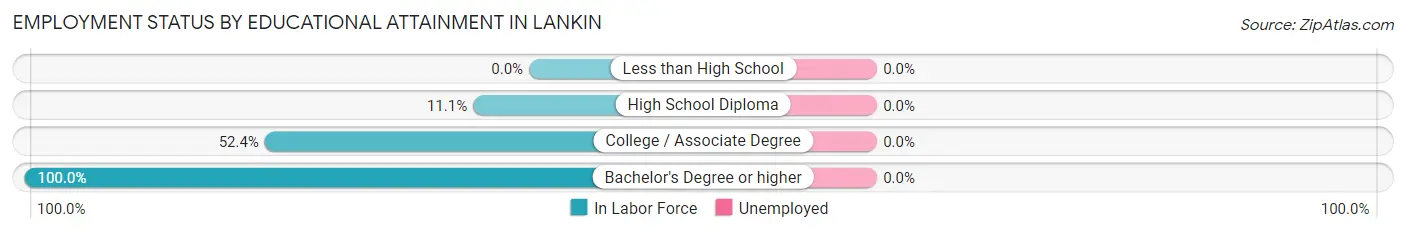
| Educational Attainment | In Labor Force | Unemployed |
| Less than High School | 0 (0.0%) | 0 (0.0%) |
| High School Diploma | 1 (11.1%) | 0 (0.0%) |
| College / Associate Degree | 11 (52.4%) | 0 (0.0%) |
| Bachelor's Degree or higher | 6 (100.0%) | 0 (0.0%) |
| Total | 18 (50.0%) | 0 (0.0%) |
Employment Occupations by Sex in Lankin
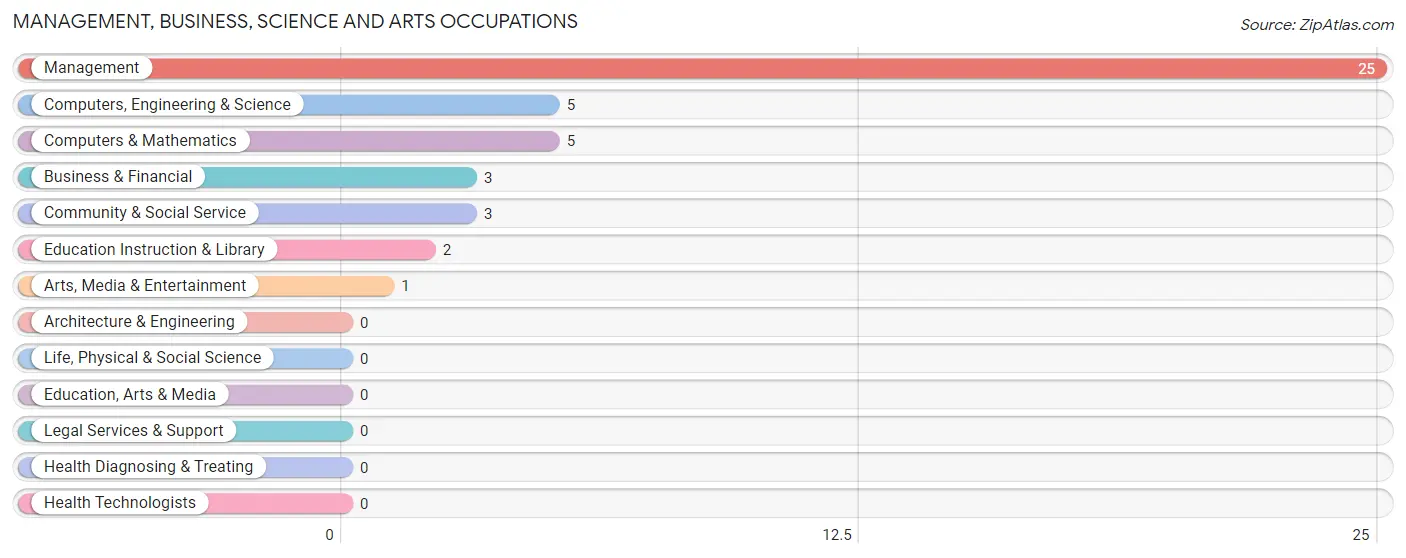
Management, Business, Science and Arts Occupations
The most common Management, Business, Science and Arts occupations in Lankin are Management (25 | 55.6%), Computers, Engineering & Science (5 | 11.1%), Computers & Mathematics (5 | 11.1%), Business & Financial (3 | 6.7%), and Community & Social Service (3 | 6.7%).
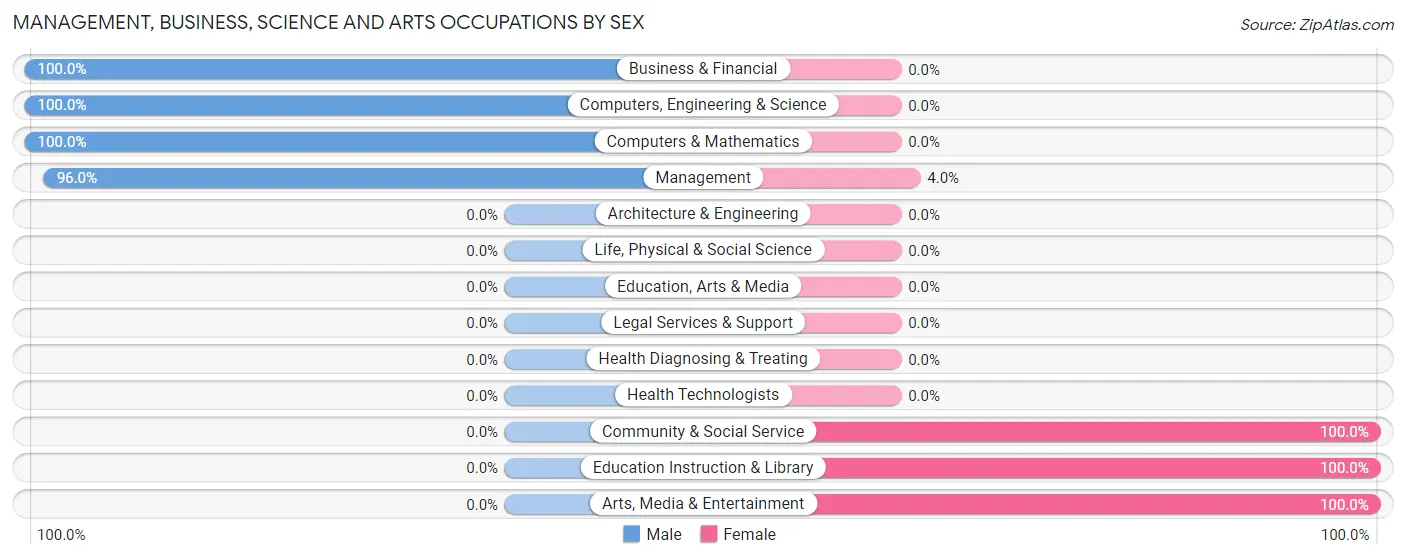
Management, Business, Science and Arts Occupations by Sex
Within the Management, Business, Science and Arts occupations in Lankin, the most male-oriented occupations are Business & Financial (100.0%), Computers, Engineering & Science (100.0%), and Computers & Mathematics (100.0%), while the most female-oriented occupations are Community & Social Service (100.0%), Education Instruction & Library (100.0%), and Arts, Media & Entertainment (100.0%).
| Occupation | Male | Female |
| Management | 24 (96.0%) | 1 (4.0%) |
| Business & Financial | 3 (100.0%) | 0 (0.0%) |
| Computers, Engineering & Science | 5 (100.0%) | 0 (0.0%) |
| Computers & Mathematics | 5 (100.0%) | 0 (0.0%) |
| Architecture & Engineering | 0 (0.0%) | 0 (0.0%) |
| Life, Physical & Social Science | 0 (0.0%) | 0 (0.0%) |
| Community & Social Service | 0 (0.0%) | 3 (100.0%) |
| Education, Arts & Media | 0 (0.0%) | 0 (0.0%) |
| Legal Services & Support | 0 (0.0%) | 0 (0.0%) |
| Education Instruction & Library | 0 (0.0%) | 2 (100.0%) |
| Arts, Media & Entertainment | 0 (0.0%) | 1 (100.0%) |
| Health Diagnosing & Treating | 0 (0.0%) | 0 (0.0%) |
| Health Technologists | 0 (0.0%) | 0 (0.0%) |
| Total (Category) | 32 (88.9%) | 4 (11.1%) |
| Total (Overall) | 40 (88.9%) | 5 (11.1%) |
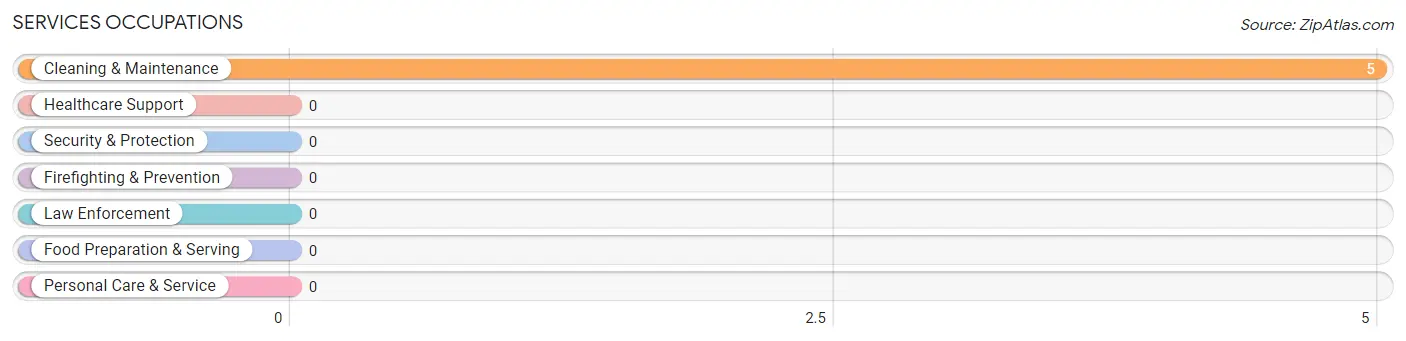
Services Occupations
The most common Services occupations in Lankin are , and Cleaning & Maintenance (5 | 11.1%).
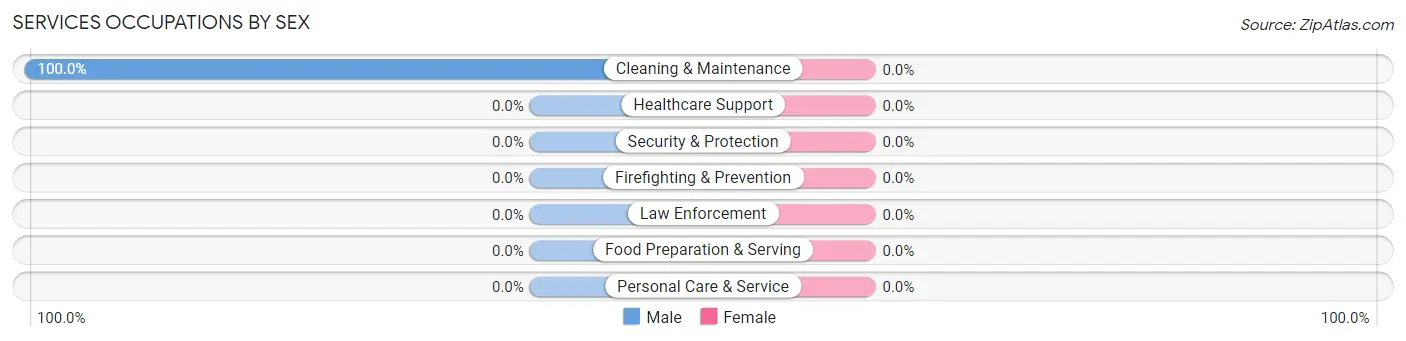
Services Occupations by Sex
| Occupation | Male | Female |
| Healthcare Support | 0 (0.0%) | 0 (0.0%) |
| Security & Protection | 0 (0.0%) | 0 (0.0%) |
| Firefighting & Prevention | 0 (0.0%) | 0 (0.0%) |
| Law Enforcement | 0 (0.0%) | 0 (0.0%) |
| Food Preparation & Serving | 0 (0.0%) | 0 (0.0%) |
| Cleaning & Maintenance | 5 (100.0%) | 0 (0.0%) |
| Personal Care & Service | 0 (0.0%) | 0 (0.0%) |
| Total (Category) | 5 (100.0%) | 0 (0.0%) |
| Total (Overall) | 40 (88.9%) | 5 (11.1%) |
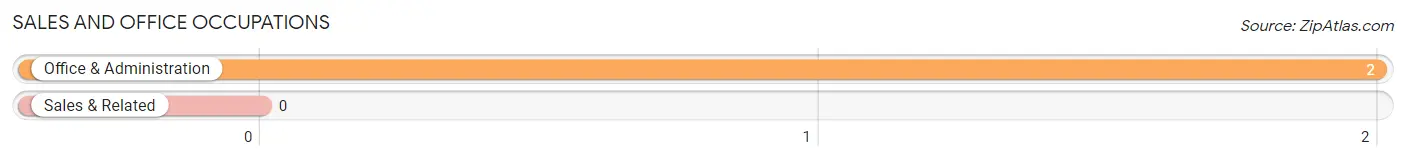
Sales and Office Occupations
The most common Sales and Office occupations in Lankin are , and Office & Administration (2 | 4.4%).
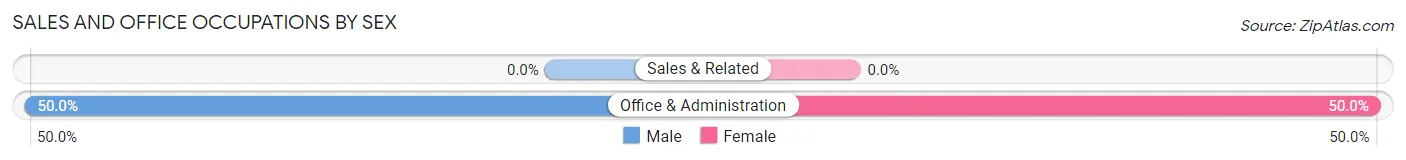
Sales and Office Occupations by Sex
| Occupation | Male | Female |
| Sales & Related | 0 (0.0%) | 0 (0.0%) |
| Office & Administration | 1 (50.0%) | 1 (50.0%) |
| Total (Category) | 1 (50.0%) | 1 (50.0%) |
| Total (Overall) | 40 (88.9%) | 5 (11.1%) |
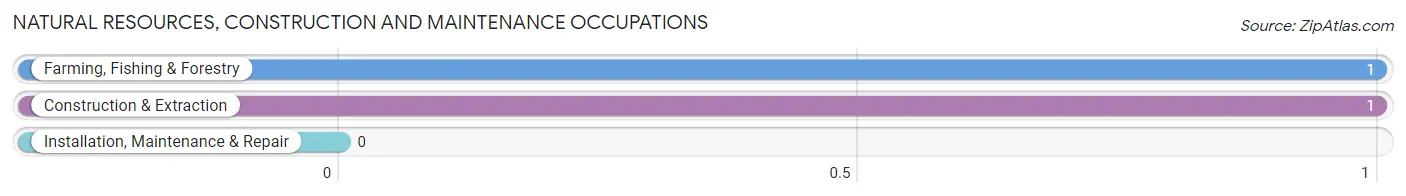
Natural Resources, Construction and Maintenance Occupations
The most common Natural Resources, Construction and Maintenance occupations in Lankin are Farming, Fishing & Forestry (1 | 2.2%), and Construction & Extraction (1 | 2.2%).
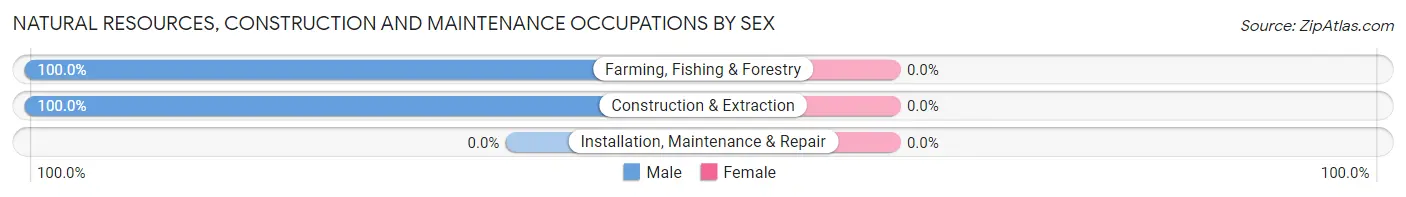
Natural Resources, Construction and Maintenance Occupations by Sex
| Occupation | Male | Female |
| Farming, Fishing & Forestry | 1 (100.0%) | 0 (0.0%) |
| Construction & Extraction | 1 (100.0%) | 0 (0.0%) |
| Installation, Maintenance & Repair | 0 (0.0%) | 0 (0.0%) |
| Total (Category) | 2 (100.0%) | 0 (0.0%) |
| Total (Overall) | 40 (88.9%) | 5 (11.1%) |
Production, Transportation and Moving Occupations
Production, Transportation and Moving Occupations by Sex
| Occupation | Male | Female |
| Production | 0 (0.0%) | 0 (0.0%) |
| Transportation | 0 (0.0%) | 0 (0.0%) |
| Material Moving | 0 (0.0%) | 0 (0.0%) |
| Total (Category) | 0 (0.0%) | 0 (0.0%) |
| Total (Overall) | 40 (88.9%) | 5 (11.1%) |
Employment Industries by Sex in Lankin
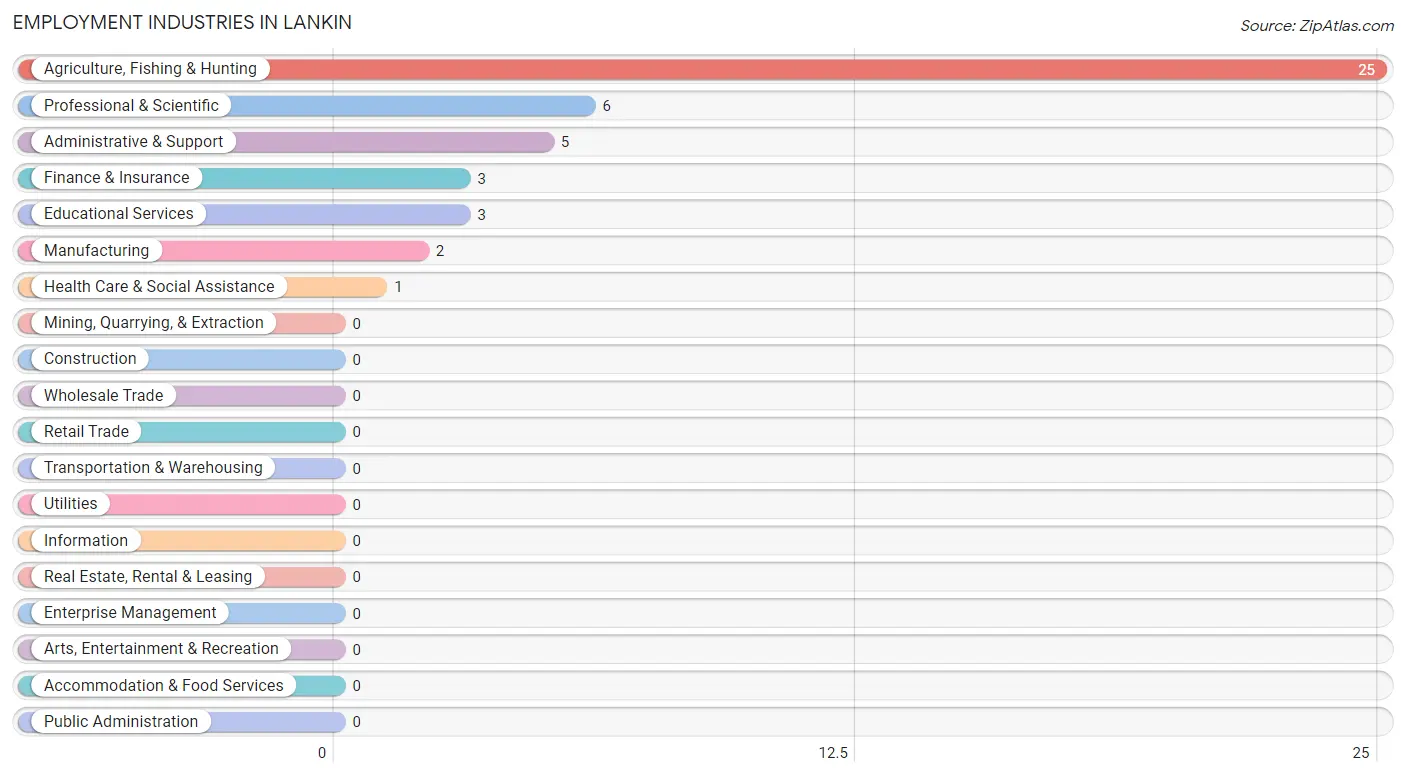
Employment Industries in Lankin
The major employment industries in Lankin include Agriculture, Fishing & Hunting (25 | 55.6%), Professional & Scientific (6 | 13.3%), Administrative & Support (5 | 11.1%), Finance & Insurance (3 | 6.7%), and Educational Services (3 | 6.7%).
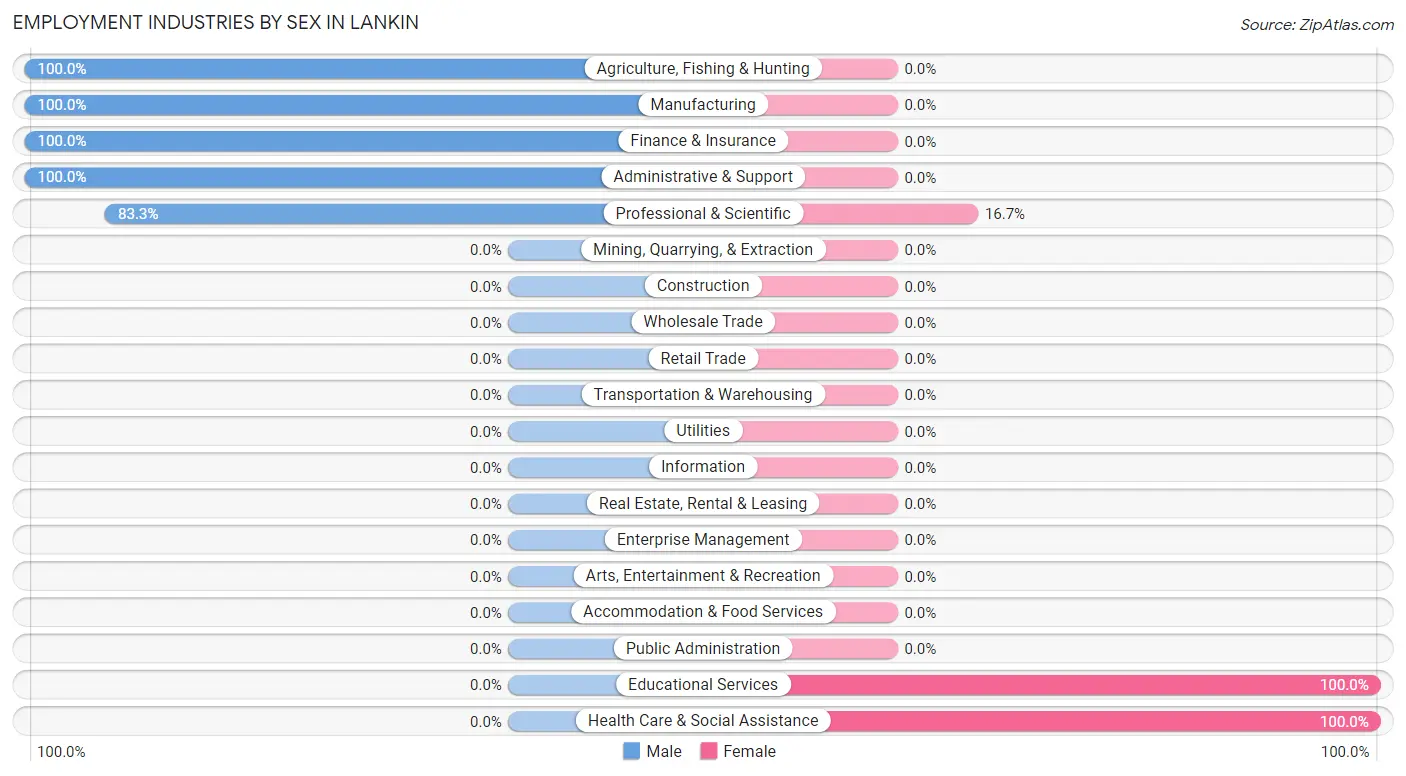
Employment Industries by Sex in Lankin
The Lankin industries that see more men than women are Agriculture, Fishing & Hunting (100.0%), Manufacturing (100.0%), and Finance & Insurance (100.0%), whereas the industries that tend to have a higher number of women are Educational Services (100.0%), Health Care & Social Assistance (100.0%), and Professional & Scientific (16.7%).
| Industry | Male | Female |
| Agriculture, Fishing & Hunting | 25 (100.0%) | 0 (0.0%) |
| Mining, Quarrying, & Extraction | 0 (0.0%) | 0 (0.0%) |
| Construction | 0 (0.0%) | 0 (0.0%) |
| Manufacturing | 2 (100.0%) | 0 (0.0%) |
| Wholesale Trade | 0 (0.0%) | 0 (0.0%) |
| Retail Trade | 0 (0.0%) | 0 (0.0%) |
| Transportation & Warehousing | 0 (0.0%) | 0 (0.0%) |
| Utilities | 0 (0.0%) | 0 (0.0%) |
| Information | 0 (0.0%) | 0 (0.0%) |
| Finance & Insurance | 3 (100.0%) | 0 (0.0%) |
| Real Estate, Rental & Leasing | 0 (0.0%) | 0 (0.0%) |
| Professional & Scientific | 5 (83.3%) | 1 (16.7%) |
| Enterprise Management | 0 (0.0%) | 0 (0.0%) |
| Administrative & Support | 5 (100.0%) | 0 (0.0%) |
| Educational Services | 0 (0.0%) | 3 (100.0%) |
| Health Care & Social Assistance | 0 (0.0%) | 1 (100.0%) |
| Arts, Entertainment & Recreation | 0 (0.0%) | 0 (0.0%) |
| Accommodation & Food Services | 0 (0.0%) | 0 (0.0%) |
| Public Administration | 0 (0.0%) | 0 (0.0%) |
| Total | 40 (88.9%) | 5 (11.1%) |
Education in Lankin
School Enrollment in Lankin
The most common levels of schooling among the 13 students in Lankin are high school (6 | 46.2%), elementary school (4 | 30.8%), and middle school (2 | 15.4%).
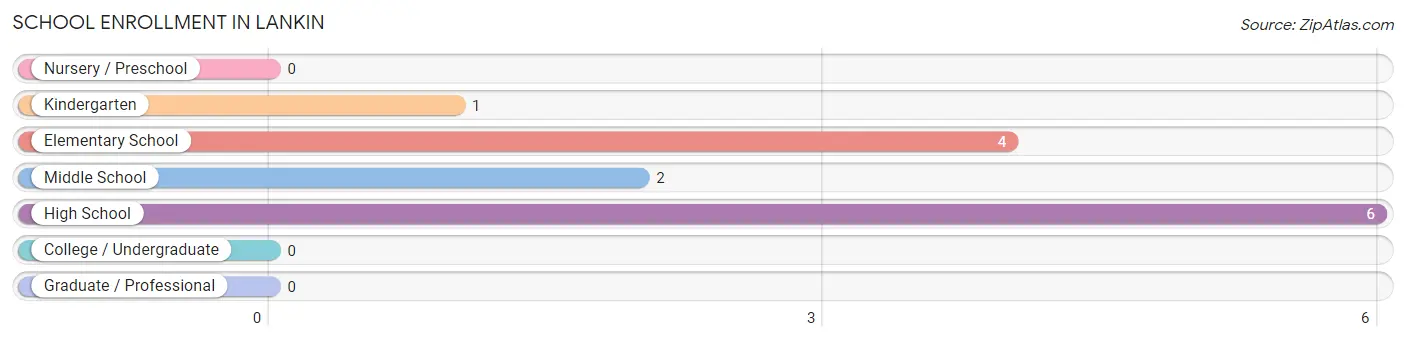
| School Level | # Students | % Students |
| Nursery / Preschool | 0 | 0.0% |
| Kindergarten | 1 | 7.7% |
| Elementary School | 4 | 30.8% |
| Middle School | 2 | 15.4% |
| High School | 6 | 46.2% |
| College / Undergraduate | 0 | 0.0% |
| Graduate / Professional | 0 | 0.0% |
| Total | 13 | 100.0% |
School Enrollment by Age by Funding Source in Lankin
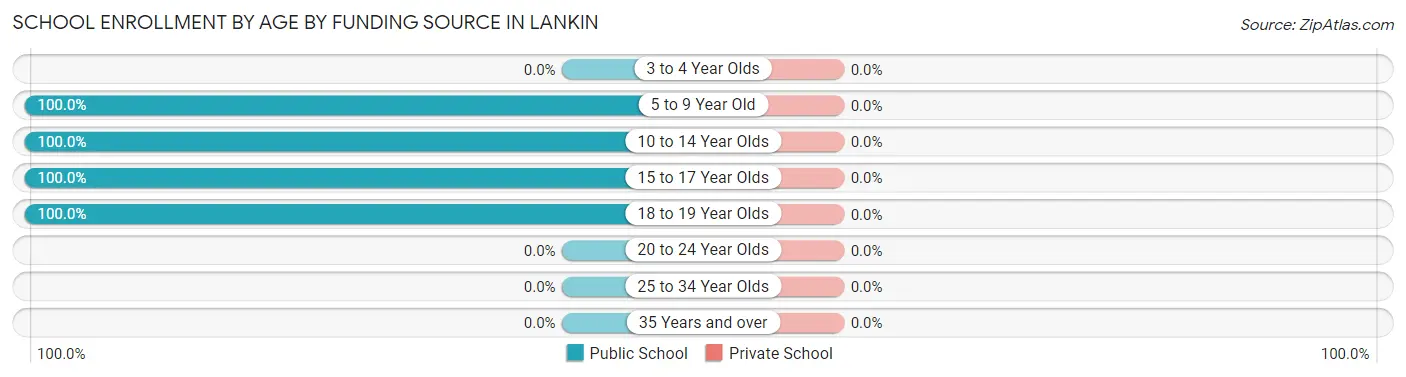
| Age Bracket | Public School | Private School |
| 3 to 4 Year Olds | 0 (0.0%) | 0 (0.0%) |
| 5 to 9 Year Old | 5 (100.0%) | 0 (0.0%) |
| 10 to 14 Year Olds | 2 (100.0%) | 0 (0.0%) |
| 15 to 17 Year Olds | 2 (100.0%) | 0 (0.0%) |
| 18 to 19 Year Olds | 4 (100.0%) | 0 (0.0%) |
| 20 to 24 Year Olds | 0 (0.0%) | 0 (0.0%) |
| 25 to 34 Year Olds | 0 (0.0%) | 0 (0.0%) |
| 35 Years and over | 0 (0.0%) | 0 (0.0%) |
| Total | 13 (100.0%) | 0 (0.0%) |
Educational Attainment by Field of Study in Lankin
Social sciences (5 | 71.4%), psychology (1 | 14.3%), and business (1 | 14.3%) are the most common fields of study among 7 individuals in Lankin who have obtained a bachelor's degree or higher.
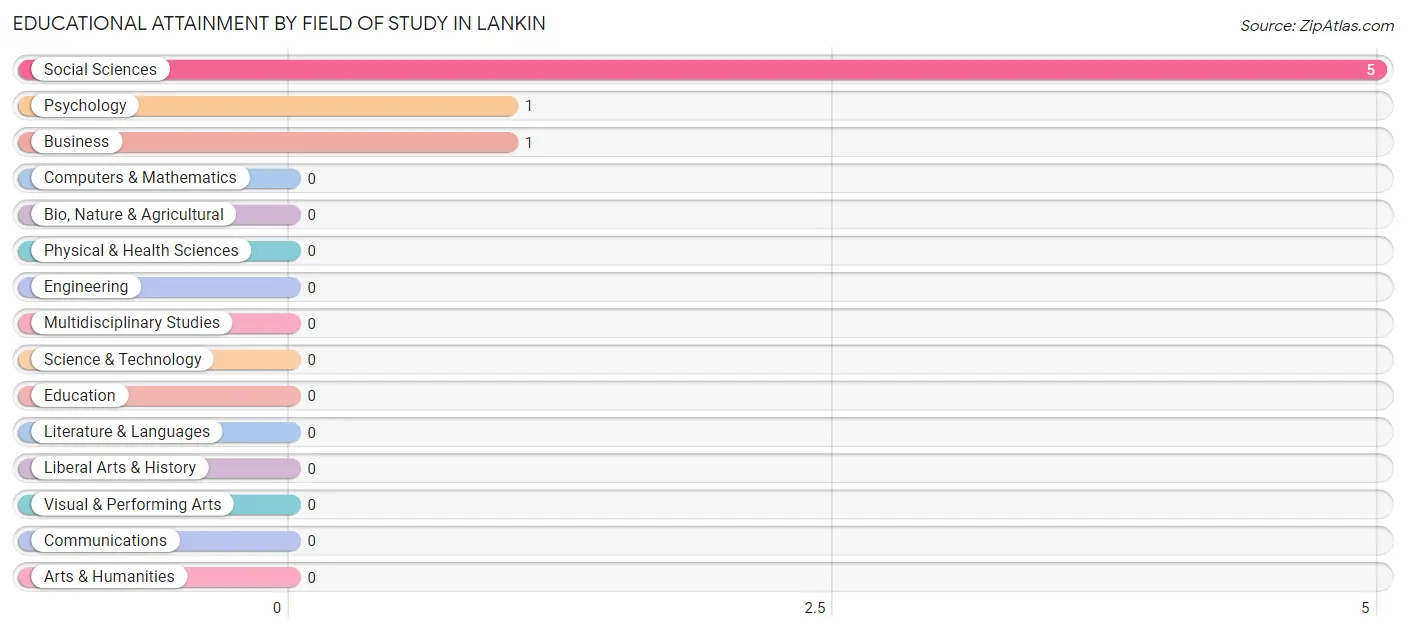
| Field of Study | # Graduates | % Graduates |
| Computers & Mathematics | 0 | 0.0% |
| Bio, Nature & Agricultural | 0 | 0.0% |
| Physical & Health Sciences | 0 | 0.0% |
| Psychology | 1 | 14.3% |
| Social Sciences | 5 | 71.4% |
| Engineering | 0 | 0.0% |
| Multidisciplinary Studies | 0 | 0.0% |
| Science & Technology | 0 | 0.0% |
| Business | 1 | 14.3% |
| Education | 0 | 0.0% |
| Literature & Languages | 0 | 0.0% |
| Liberal Arts & History | 0 | 0.0% |
| Visual & Performing Arts | 0 | 0.0% |
| Communications | 0 | 0.0% |
| Arts & Humanities | 0 | 0.0% |
| Total | 7 | 100.0% |
Transportation & Commute in Lankin
Vehicle Availability by Sex in Lankin
The most prevalent vehicle ownership categories in Lankin are males with 2 vehicles (29, accounting for 72.5%) and females with 2 vehicles (1, making up 580.0%).
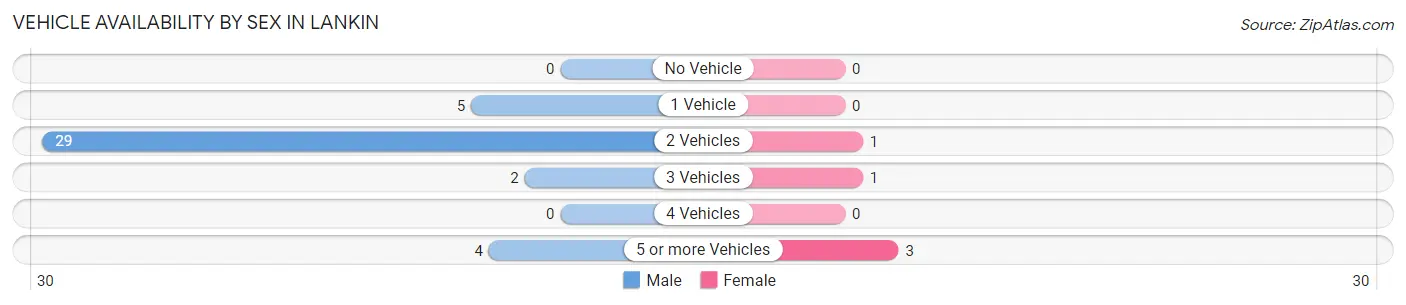
| Vehicles Available | Male | Female |
| No Vehicle | 0 (0.0%) | 0 (0.0%) |
| 1 Vehicle | 5 (12.5%) | 0 (0.0%) |
| 2 Vehicles | 29 (72.5%) | 1 (20.0%) |
| 3 Vehicles | 2 (5.0%) | 1 (20.0%) |
| 4 Vehicles | 0 (0.0%) | 0 (0.0%) |
| 5 or more Vehicles | 4 (10.0%) | 3 (60.0%) |
| Total | 40 (100.0%) | 5 (100.0%) |
Commute Time in Lankin
The most frequently occuring commute durations in Lankin are 10 to 14 minutes (24 commuters, 61.5%), 5 to 9 minutes (7 commuters, 17.9%), and 15 to 19 minutes (3 commuters, 7.7%).
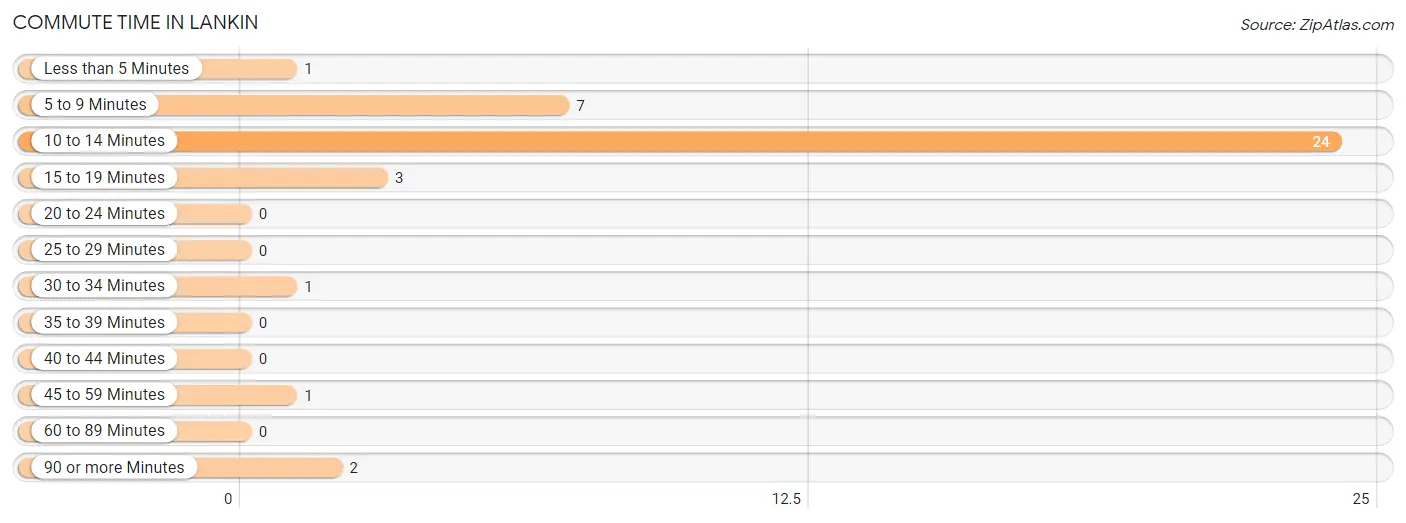
| Commute Time | # Commuters | % Commuters |
| Less than 5 Minutes | 1 | 2.6% |
| 5 to 9 Minutes | 7 | 17.9% |
| 10 to 14 Minutes | 24 | 61.5% |
| 15 to 19 Minutes | 3 | 7.7% |
| 20 to 24 Minutes | 0 | 0.0% |
| 25 to 29 Minutes | 0 | 0.0% |
| 30 to 34 Minutes | 1 | 2.6% |
| 35 to 39 Minutes | 0 | 0.0% |
| 40 to 44 Minutes | 0 | 0.0% |
| 45 to 59 Minutes | 1 | 2.6% |
| 60 to 89 Minutes | 0 | 0.0% |
| 90 or more Minutes | 2 | 5.1% |
Commute Time by Sex in Lankin
The most common commute times in Lankin are 10 to 14 minutes (23 commuters, 65.7%) for males and 15 to 19 minutes (3 commuters, 75.0%) for females.
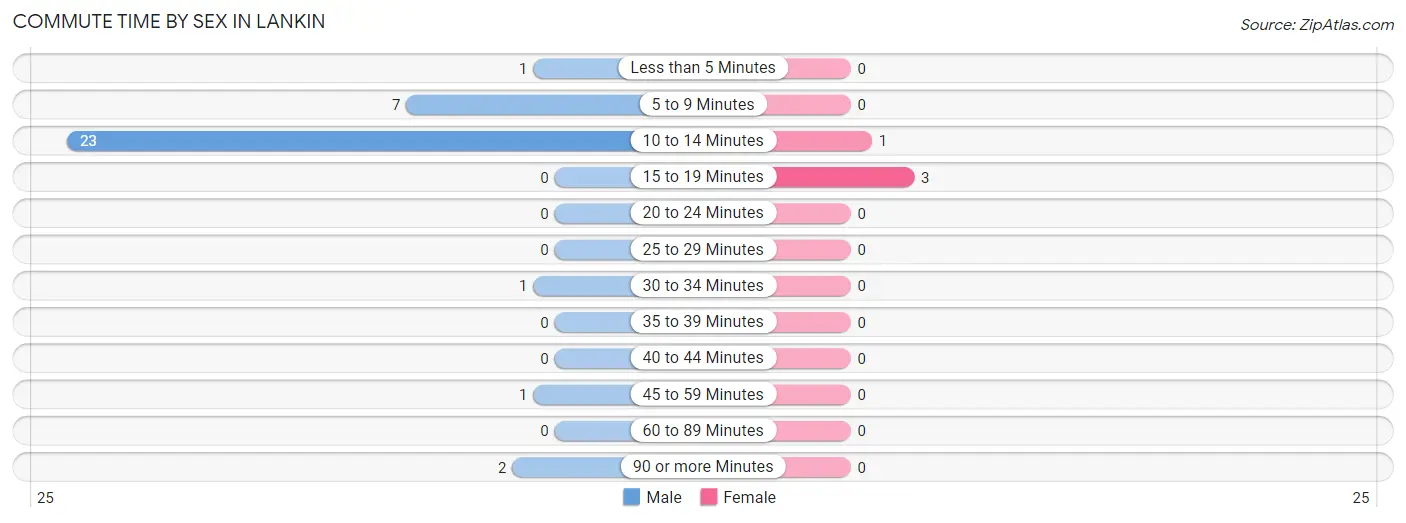
| Commute Time | Male | Female |
| Less than 5 Minutes | 1 (2.9%) | 0 (0.0%) |
| 5 to 9 Minutes | 7 (20.0%) | 0 (0.0%) |
| 10 to 14 Minutes | 23 (65.7%) | 1 (25.0%) |
| 15 to 19 Minutes | 0 (0.0%) | 3 (75.0%) |
| 20 to 24 Minutes | 0 (0.0%) | 0 (0.0%) |
| 25 to 29 Minutes | 0 (0.0%) | 0 (0.0%) |
| 30 to 34 Minutes | 1 (2.9%) | 0 (0.0%) |
| 35 to 39 Minutes | 0 (0.0%) | 0 (0.0%) |
| 40 to 44 Minutes | 0 (0.0%) | 0 (0.0%) |
| 45 to 59 Minutes | 1 (2.9%) | 0 (0.0%) |
| 60 to 89 Minutes | 0 (0.0%) | 0 (0.0%) |
| 90 or more Minutes | 2 (5.7%) | 0 (0.0%) |
Time of Departure to Work by Sex in Lankin
The most frequent times of departure to work in Lankin are 7:00 AM to 7:29 AM (22, 62.9%) for males and 7:30 AM to 7:59 AM (2, 50.0%) for females.
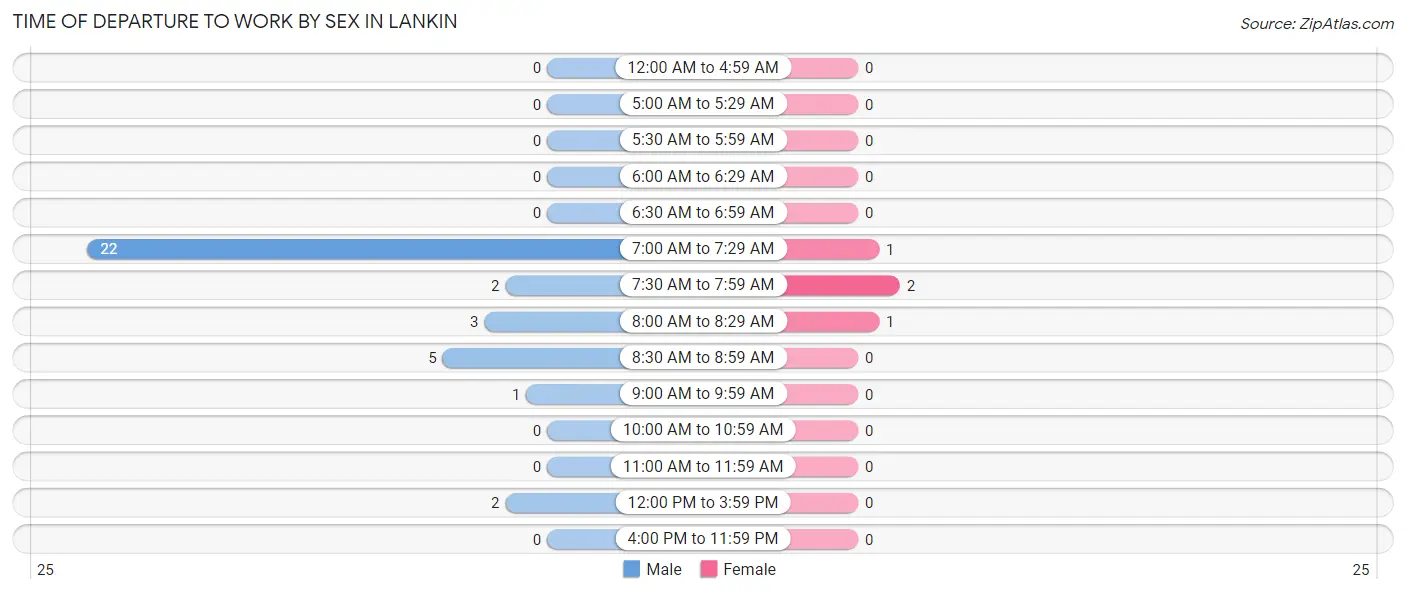
| Time of Departure | Male | Female |
| 12:00 AM to 4:59 AM | 0 (0.0%) | 0 (0.0%) |
| 5:00 AM to 5:29 AM | 0 (0.0%) | 0 (0.0%) |
| 5:30 AM to 5:59 AM | 0 (0.0%) | 0 (0.0%) |
| 6:00 AM to 6:29 AM | 0 (0.0%) | 0 (0.0%) |
| 6:30 AM to 6:59 AM | 0 (0.0%) | 0 (0.0%) |
| 7:00 AM to 7:29 AM | 22 (62.9%) | 1 (25.0%) |
| 7:30 AM to 7:59 AM | 2 (5.7%) | 2 (50.0%) |
| 8:00 AM to 8:29 AM | 3 (8.6%) | 1 (25.0%) |
| 8:30 AM to 8:59 AM | 5 (14.3%) | 0 (0.0%) |
| 9:00 AM to 9:59 AM | 1 (2.9%) | 0 (0.0%) |
| 10:00 AM to 10:59 AM | 0 (0.0%) | 0 (0.0%) |
| 11:00 AM to 11:59 AM | 0 (0.0%) | 0 (0.0%) |
| 12:00 PM to 3:59 PM | 2 (5.7%) | 0 (0.0%) |
| 4:00 PM to 11:59 PM | 0 (0.0%) | 0 (0.0%) |
| Total | 35 (100.0%) | 4 (100.0%) |
Housing Occupancy in Lankin
Occupancy by Ownership in Lankin
Of the total 61 dwellings in Lankin, owner-occupied units account for 39 (63.9%), while renter-occupied units make up 22 (36.1%).
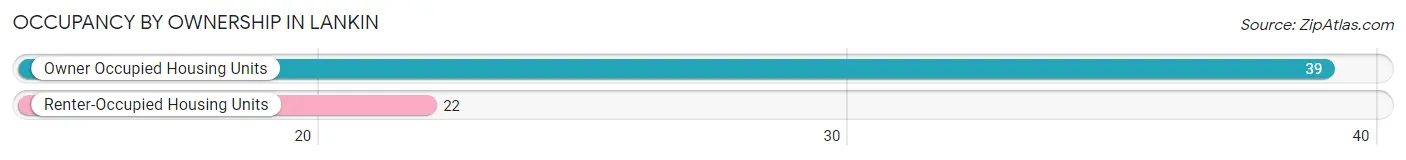
| Occupancy | # Housing Units | % Housing Units |
| Owner Occupied Housing Units | 39 | 63.9% |
| Renter-Occupied Housing Units | 22 | 36.1% |
| Total Occupied Housing Units | 61 | 100.0% |
Occupancy by Household Size in Lankin
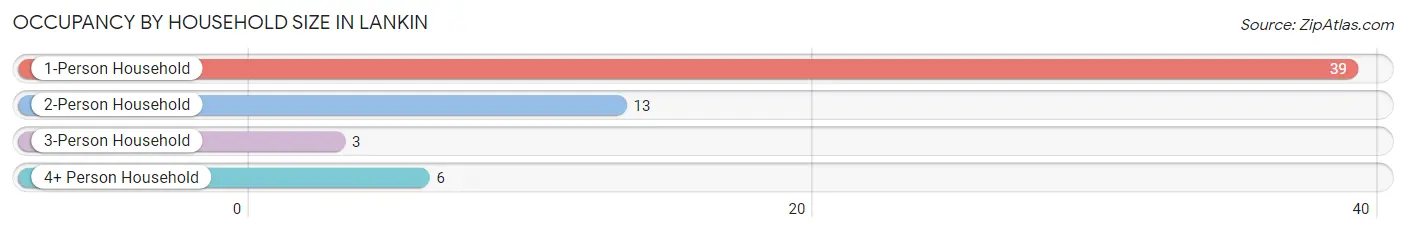
| Household Size | # Housing Units | % Housing Units |
| 1-Person Household | 39 | 63.9% |
| 2-Person Household | 13 | 21.3% |
| 3-Person Household | 3 | 4.9% |
| 4+ Person Household | 6 | 9.8% |
| Total Housing Units | 61 | 100.0% |
Occupancy by Ownership by Household Size in Lankin
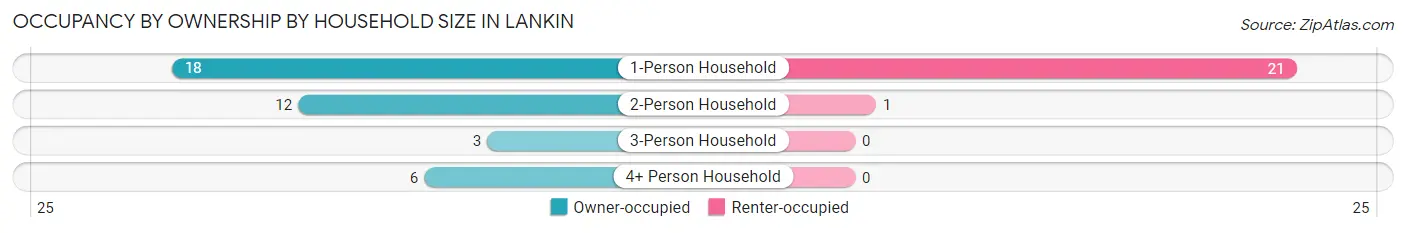
| Household Size | Owner-occupied | Renter-occupied |
| 1-Person Household | 18 (46.2%) | 21 (53.8%) |
| 2-Person Household | 12 (92.3%) | 1 (7.7%) |
| 3-Person Household | 3 (100.0%) | 0 (0.0%) |
| 4+ Person Household | 6 (100.0%) | 0 (0.0%) |
| Total Housing Units | 39 (63.9%) | 22 (36.1%) |
Occupancy by Educational Attainment in Lankin
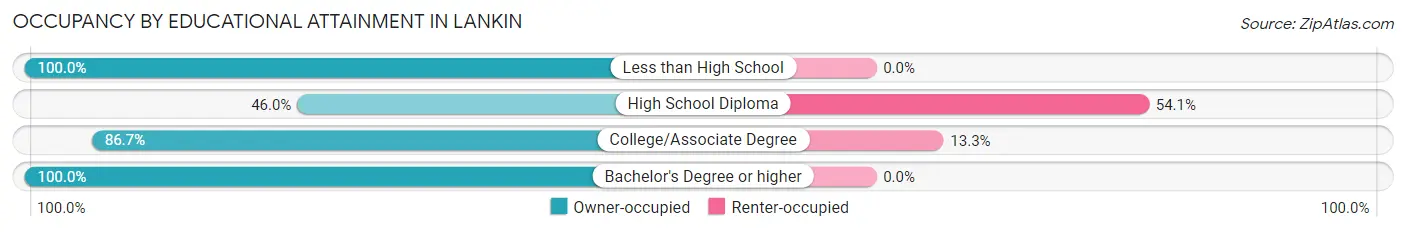
| Household Size | Owner-occupied | Renter-occupied |
| Less than High School | 3 (100.0%) | 0 (0.0%) |
| High School Diploma | 17 (46.0%) | 20 (54.0%) |
| College/Associate Degree | 13 (86.7%) | 2 (13.3%) |
| Bachelor's Degree or higher | 6 (100.0%) | 0 (0.0%) |
Occupancy by Age of Householder in Lankin
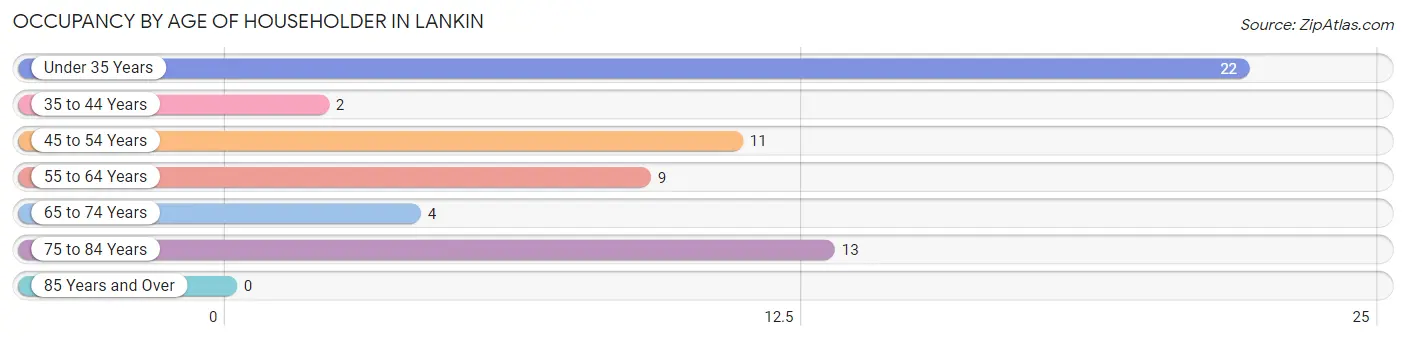
| Age Bracket | # Households | % Households |
| Under 35 Years | 22 | 36.1% |
| 35 to 44 Years | 2 | 3.3% |
| 45 to 54 Years | 11 | 18.0% |
| 55 to 64 Years | 9 | 14.7% |
| 65 to 74 Years | 4 | 6.6% |
| 75 to 84 Years | 13 | 21.3% |
| 85 Years and Over | 0 | 0.0% |
| Total | 61 | 100.0% |
Housing Finances in Lankin
Median Income by Occupancy in Lankin
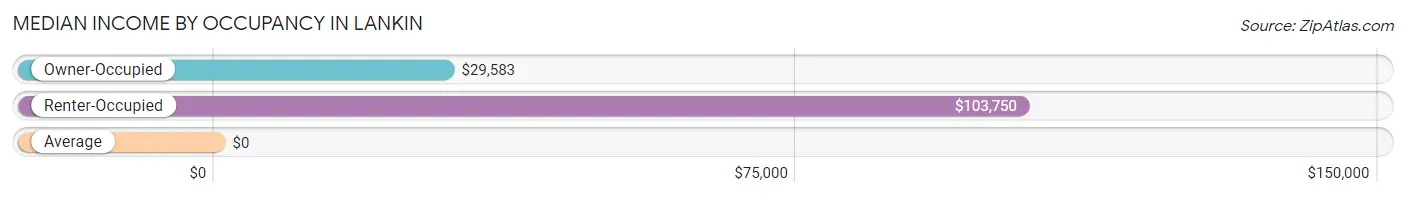
| Occupancy Type | # Households | Median Income |
| Owner-Occupied | 39 (63.9%) | $29,583 |
| Renter-Occupied | 22 (36.1%) | $103,750 |
| Average | 61 (100.0%) | $0 |
Occupancy by Householder Income Bracket in Lankin
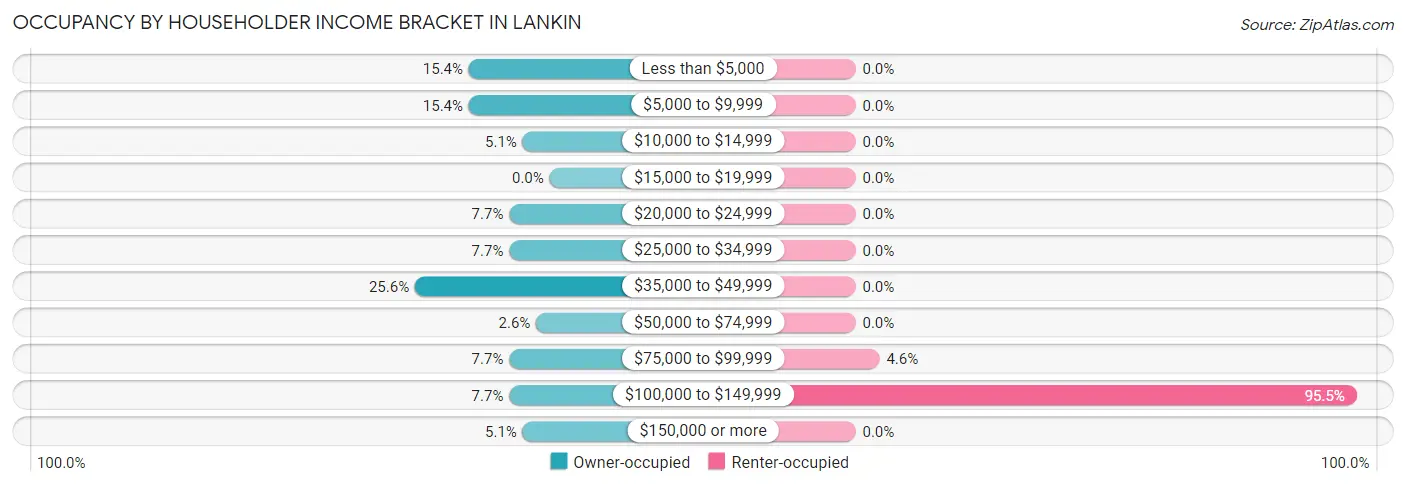
| Income Bracket | Owner-occupied | Renter-occupied |
| Less than $5,000 | 6 (15.4%) | 0 (0.0%) |
| $5,000 to $9,999 | 6 (15.4%) | 0 (0.0%) |
| $10,000 to $14,999 | 2 (5.1%) | 0 (0.0%) |
| $15,000 to $19,999 | 0 (0.0%) | 0 (0.0%) |
| $20,000 to $24,999 | 3 (7.7%) | 0 (0.0%) |
| $25,000 to $34,999 | 3 (7.7%) | 0 (0.0%) |
| $35,000 to $49,999 | 10 (25.6%) | 0 (0.0%) |
| $50,000 to $74,999 | 1 (2.6%) | 0 (0.0%) |
| $75,000 to $99,999 | 3 (7.7%) | 1 (4.5%) |
| $100,000 to $149,999 | 3 (7.7%) | 21 (95.5%) |
| $150,000 or more | 2 (5.1%) | 0 (0.0%) |
| Total | 39 (100.0%) | 22 (100.0%) |
Monthly Housing Cost Tiers in Lankin
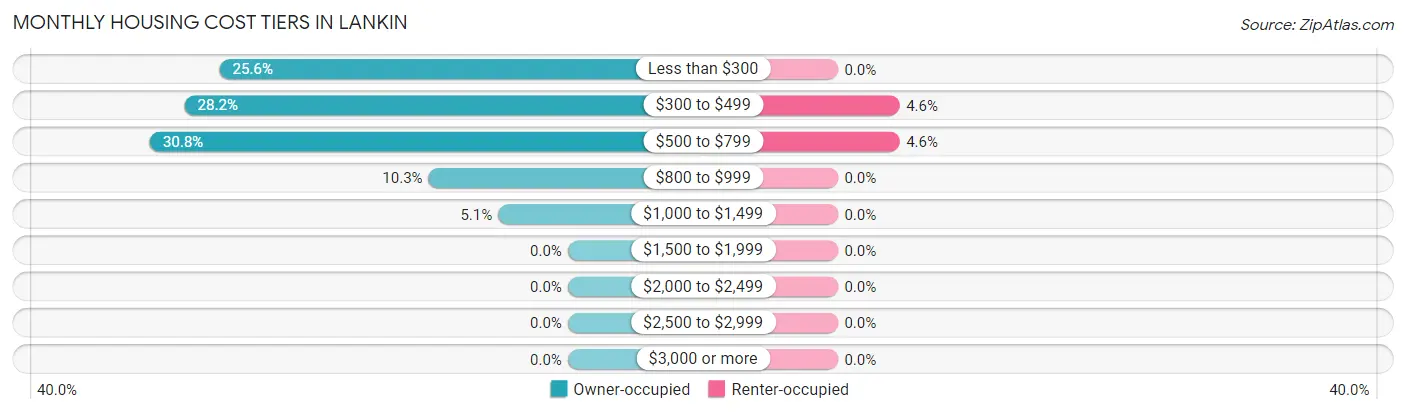
| Monthly Cost | Owner-occupied | Renter-occupied |
| Less than $300 | 10 (25.6%) | 0 (0.0%) |
| $300 to $499 | 11 (28.2%) | 1 (4.5%) |
| $500 to $799 | 12 (30.8%) | 1 (4.5%) |
| $800 to $999 | 4 (10.3%) | 0 (0.0%) |
| $1,000 to $1,499 | 2 (5.1%) | 0 (0.0%) |
| $1,500 to $1,999 | 0 (0.0%) | 0 (0.0%) |
| $2,000 to $2,499 | 0 (0.0%) | 0 (0.0%) |
| $2,500 to $2,999 | 0 (0.0%) | 0 (0.0%) |
| $3,000 or more | 0 (0.0%) | 0 (0.0%) |
| Total | 39 (100.0%) | 22 (100.0%) |
Physical Housing Characteristics in Lankin
Housing Structures in Lankin
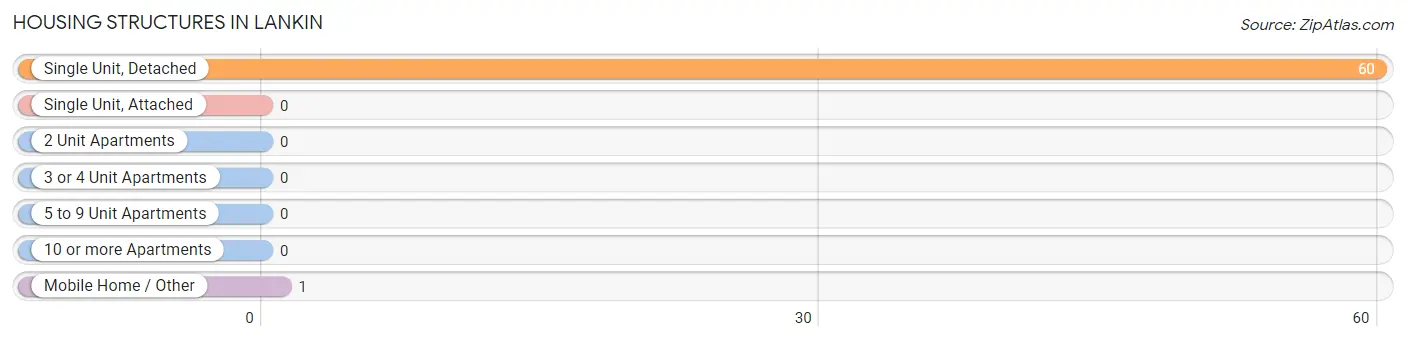
| Structure Type | # Housing Units | % Housing Units |
| Single Unit, Detached | 60 | 98.4% |
| Single Unit, Attached | 0 | 0.0% |
| 2 Unit Apartments | 0 | 0.0% |
| 3 or 4 Unit Apartments | 0 | 0.0% |
| 5 to 9 Unit Apartments | 0 | 0.0% |
| 10 or more Apartments | 0 | 0.0% |
| Mobile Home / Other | 1 | 1.6% |
| Total | 61 | 100.0% |
Housing Structures by Occupancy in Lankin
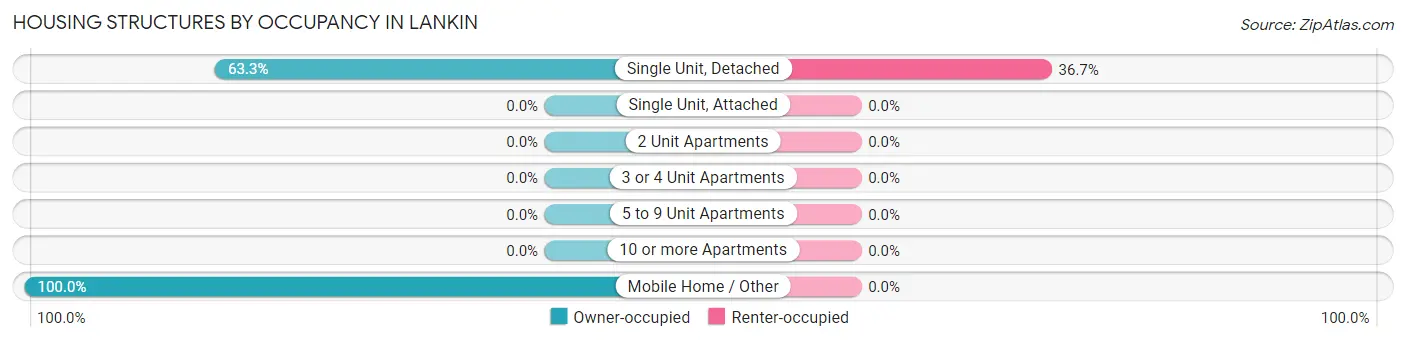
| Structure Type | Owner-occupied | Renter-occupied |
| Single Unit, Detached | 38 (63.3%) | 22 (36.7%) |
| Single Unit, Attached | 0 (0.0%) | 0 (0.0%) |
| 2 Unit Apartments | 0 (0.0%) | 0 (0.0%) |
| 3 or 4 Unit Apartments | 0 (0.0%) | 0 (0.0%) |
| 5 to 9 Unit Apartments | 0 (0.0%) | 0 (0.0%) |
| 10 or more Apartments | 0 (0.0%) | 0 (0.0%) |
| Mobile Home / Other | 1 (100.0%) | 0 (0.0%) |
| Total | 39 (63.9%) | 22 (36.1%) |
Housing Structures by Number of Rooms in Lankin
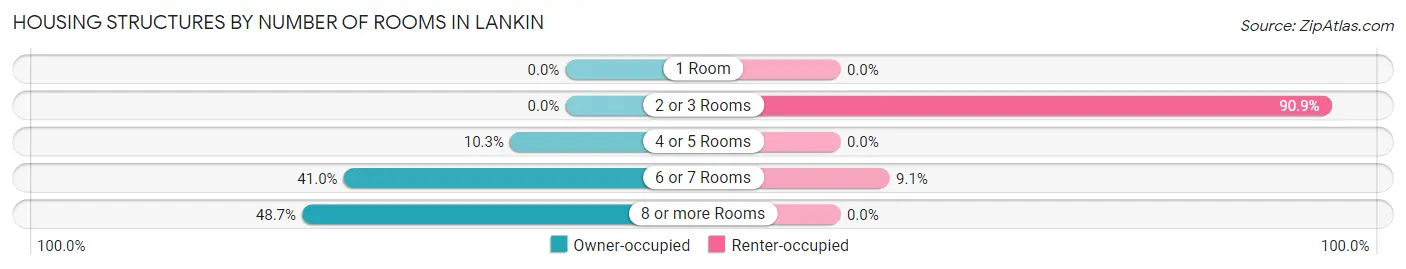
| Number of Rooms | Owner-occupied | Renter-occupied |
| 1 Room | 0 (0.0%) | 0 (0.0%) |
| 2 or 3 Rooms | 0 (0.0%) | 20 (90.9%) |
| 4 or 5 Rooms | 4 (10.3%) | 0 (0.0%) |
| 6 or 7 Rooms | 16 (41.0%) | 2 (9.1%) |
| 8 or more Rooms | 19 (48.7%) | 0 (0.0%) |
| Total | 39 (100.0%) | 22 (100.0%) |
Housing Structure by Heating Type in Lankin
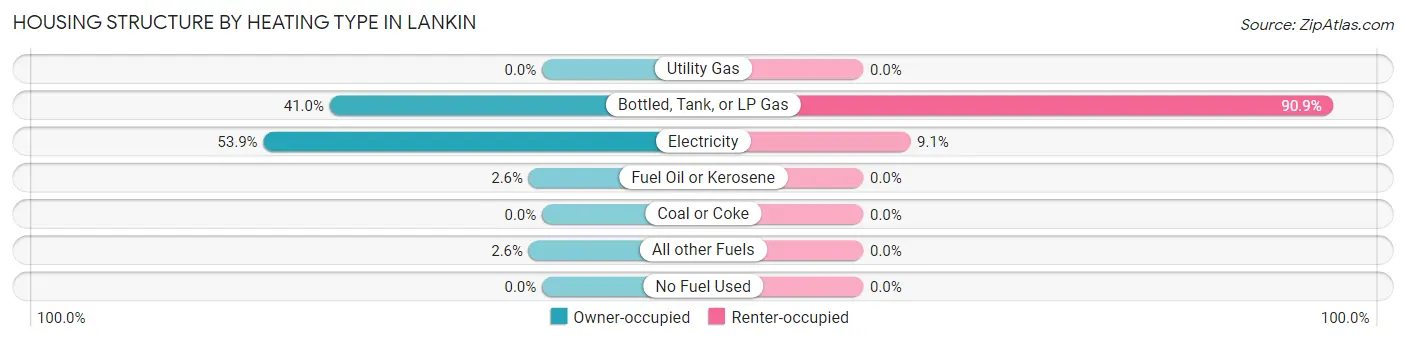
| Heating Type | Owner-occupied | Renter-occupied |
| Utility Gas | 0 (0.0%) | 0 (0.0%) |
| Bottled, Tank, or LP Gas | 16 (41.0%) | 20 (90.9%) |
| Electricity | 21 (53.8%) | 2 (9.1%) |
| Fuel Oil or Kerosene | 1 (2.6%) | 0 (0.0%) |
| Coal or Coke | 0 (0.0%) | 0 (0.0%) |
| All other Fuels | 1 (2.6%) | 0 (0.0%) |
| No Fuel Used | 0 (0.0%) | 0 (0.0%) |
| Total | 39 (100.0%) | 22 (100.0%) |
Household Vehicle Usage in Lankin
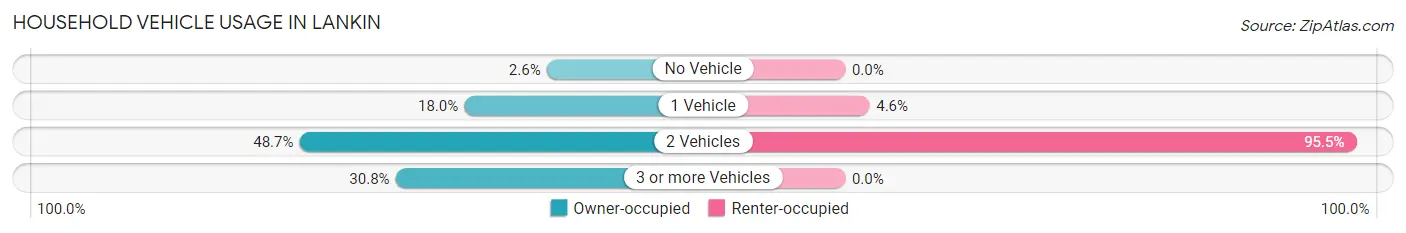
| Vehicles per Household | Owner-occupied | Renter-occupied |
| No Vehicle | 1 (2.6%) | 0 (0.0%) |
| 1 Vehicle | 7 (17.9%) | 1 (4.5%) |
| 2 Vehicles | 19 (48.7%) | 21 (95.5%) |
| 3 or more Vehicles | 12 (30.8%) | 0 (0.0%) |
| Total | 39 (100.0%) | 22 (100.0%) |
Real Estate & Mortgages in Lankin
Real Estate and Mortgage Overview in Lankin
| Characteristic | Without Mortgage | With Mortgage |
| Housing Units | 35 | 4 |
| Median Property Value | $68,800 | $0 |
| Median Household Income | $29,583 | $0 |
| Monthly Housing Costs | $461 | $0 |
| Real Estate Taxes | $667 | $0 |
Property Value by Mortgage Status in Lankin
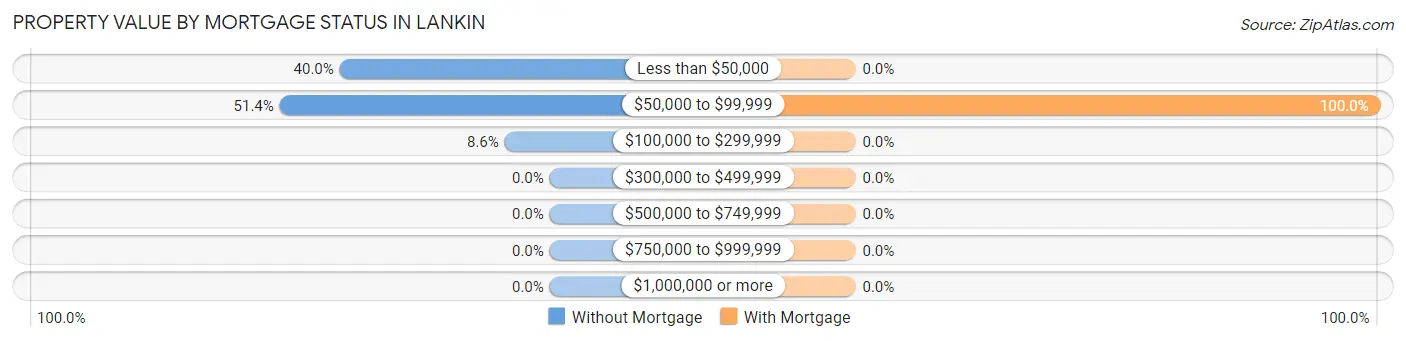
| Property Value | Without Mortgage | With Mortgage |
| Less than $50,000 | 14 (40.0%) | 0 (0.0%) |
| $50,000 to $99,999 | 18 (51.4%) | 4 (100.0%) |
| $100,000 to $299,999 | 3 (8.6%) | 0 (0.0%) |
| $300,000 to $499,999 | 0 (0.0%) | 0 (0.0%) |
| $500,000 to $749,999 | 0 (0.0%) | 0 (0.0%) |
| $750,000 to $999,999 | 0 (0.0%) | 0 (0.0%) |
| $1,000,000 or more | 0 (0.0%) | 0 (0.0%) |
| Total | 35 (100.0%) | 4 (100.0%) |
Household Income by Mortgage Status in Lankin
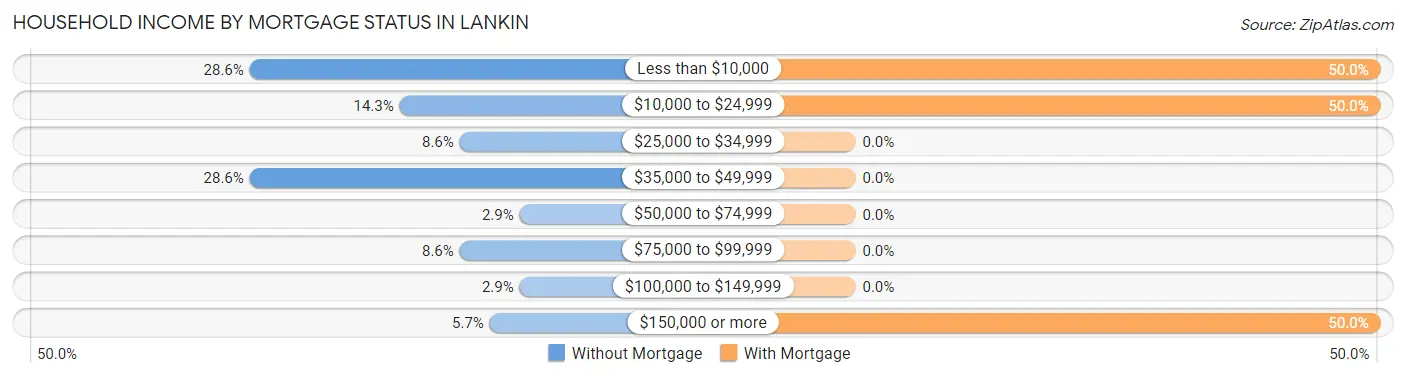
| Household Income | Without Mortgage | With Mortgage |
| Less than $10,000 | 10 (28.6%) | 2 (50.0%) |
| $10,000 to $24,999 | 5 (14.3%) | 2 (50.0%) |
| $25,000 to $34,999 | 3 (8.6%) | 0 (0.0%) |
| $35,000 to $49,999 | 10 (28.6%) | 0 (0.0%) |
| $50,000 to $74,999 | 1 (2.9%) | 0 (0.0%) |
| $75,000 to $99,999 | 3 (8.6%) | 0 (0.0%) |
| $100,000 to $149,999 | 1 (2.9%) | 0 (0.0%) |
| $150,000 or more | 2 (5.7%) | 2 (50.0%) |
| Total | 35 (100.0%) | 4 (100.0%) |
Property Value to Household Income Ratio in Lankin
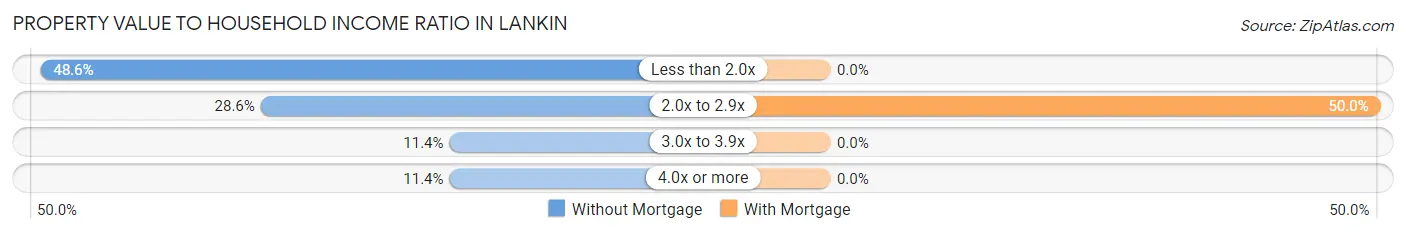
| Value-to-Income Ratio | Without Mortgage | With Mortgage |
| Less than 2.0x | 17 (48.6%) | 0 (0.0%) |
| 2.0x to 2.9x | 10 (28.6%) | 2 (50.0%) |
| 3.0x to 3.9x | 4 (11.4%) | 0 (0.0%) |
| 4.0x or more | 4 (11.4%) | 0 (0.0%) |
| Total | 35 (100.0%) | 4 (100.0%) |
Real Estate Taxes by Mortgage Status in Lankin
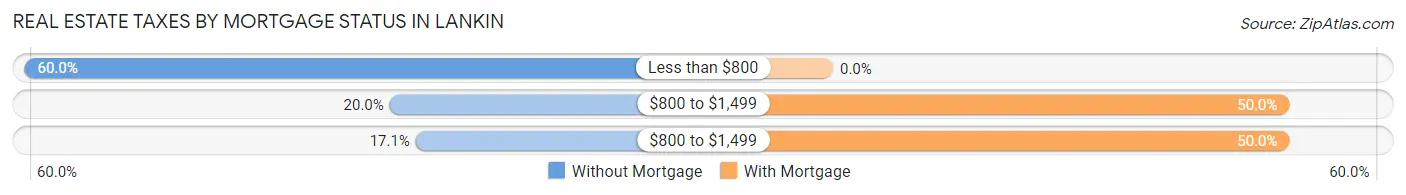
| Property Taxes | Without Mortgage | With Mortgage |
| Less than $800 | 21 (60.0%) | 0 (0.0%) |
| $800 to $1,499 | 7 (20.0%) | 2 (50.0%) |
| $800 to $1,499 | 6 (17.1%) | 2 (50.0%) |
| Total | 35 (100.0%) | 4 (100.0%) |
Health & Disability in Lankin
Health Insurance Coverage by Age in Lankin
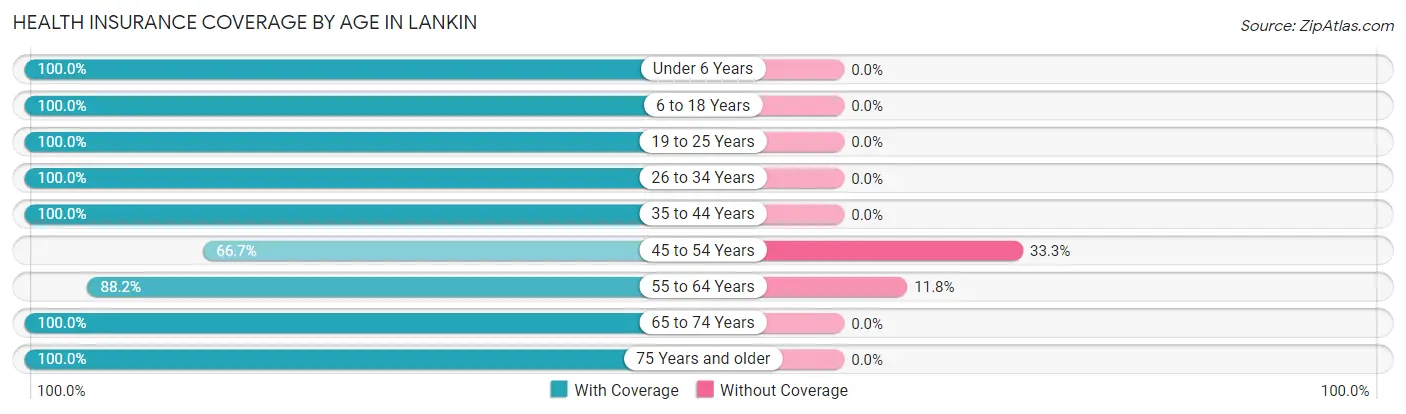
| Age Bracket | With Coverage | Without Coverage |
| Under 6 Years | 3 (100.0%) | 0 (0.0%) |
| 6 to 18 Years | 19 (100.0%) | 0 (0.0%) |
| 19 to 25 Years | 21 (100.0%) | 0 (0.0%) |
| 26 to 34 Years | 4 (100.0%) | 0 (0.0%) |
| 35 to 44 Years | 3 (100.0%) | 0 (0.0%) |
| 45 to 54 Years | 8 (66.7%) | 4 (33.3%) |
| 55 to 64 Years | 15 (88.2%) | 2 (11.8%) |
| 65 to 74 Years | 20 (100.0%) | 0 (0.0%) |
| 75 Years and older | 16 (100.0%) | 0 (0.0%) |
| Total | 109 (94.8%) | 6 (5.2%) |
Health Insurance Coverage by Citizenship Status in Lankin
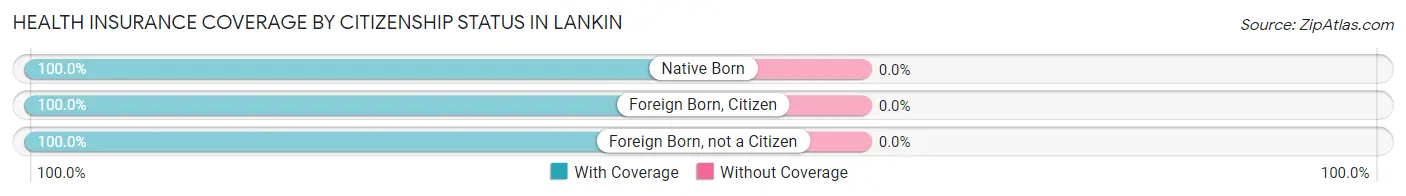
| Citizenship Status | With Coverage | Without Coverage |
| Native Born | 3 (100.0%) | 0 (0.0%) |
| Foreign Born, Citizen | 19 (100.0%) | 0 (0.0%) |
| Foreign Born, not a Citizen | 21 (100.0%) | 0 (0.0%) |
Health Insurance Coverage by Household Income in Lankin
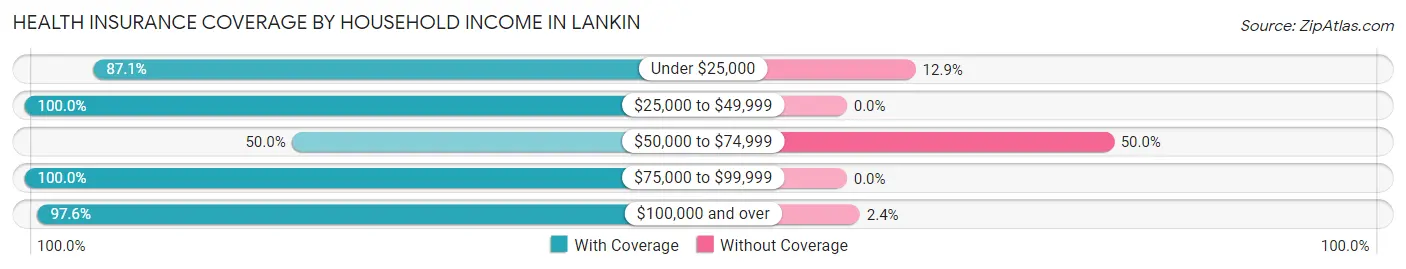
| Household Income | With Coverage | Without Coverage |
| Under $25,000 | 27 (87.1%) | 4 (12.9%) |
| $25,000 to $49,999 | 29 (100.0%) | 0 (0.0%) |
| $50,000 to $74,999 | 1 (50.0%) | 1 (50.0%) |
| $75,000 to $99,999 | 12 (100.0%) | 0 (0.0%) |
| $100,000 and over | 40 (97.6%) | 1 (2.4%) |
Public vs Private Health Insurance Coverage by Age in Lankin
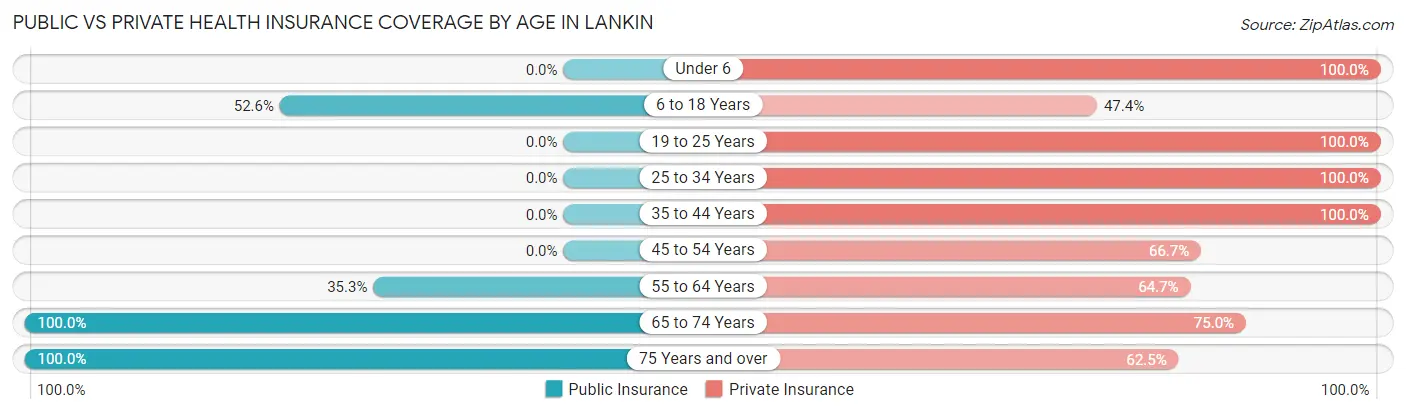
| Age Bracket | Public Insurance | Private Insurance |
| Under 6 | 0 (0.0%) | 3 (100.0%) |
| 6 to 18 Years | 10 (52.6%) | 9 (47.4%) |
| 19 to 25 Years | 0 (0.0%) | 21 (100.0%) |
| 25 to 34 Years | 0 (0.0%) | 4 (100.0%) |
| 35 to 44 Years | 0 (0.0%) | 3 (100.0%) |
| 45 to 54 Years | 0 (0.0%) | 8 (66.7%) |
| 55 to 64 Years | 6 (35.3%) | 11 (64.7%) |
| 65 to 74 Years | 20 (100.0%) | 15 (75.0%) |
| 75 Years and over | 16 (100.0%) | 10 (62.5%) |
| Total | 52 (45.2%) | 84 (73.0%) |
Disability Status by Sex by Age in Lankin
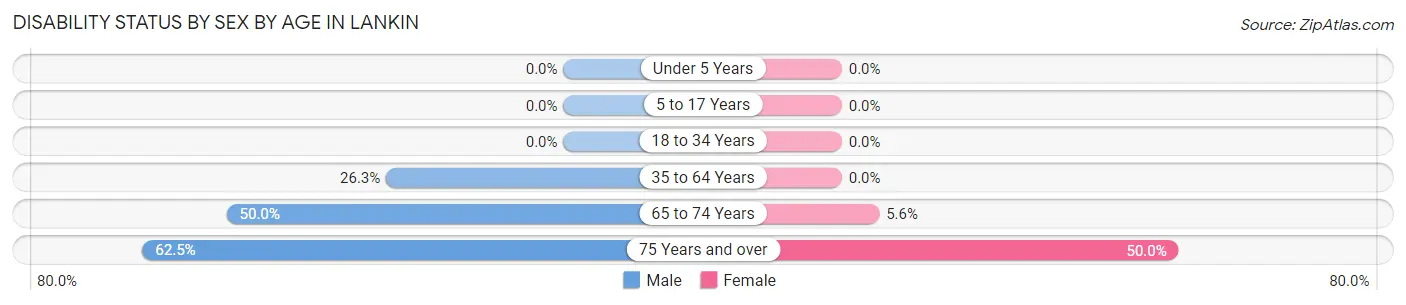
| Age Bracket | Male | Female |
| Under 5 Years | 0 (0.0%) | 0 (0.0%) |
| 5 to 17 Years | 0 (0.0%) | 0 (0.0%) |
| 18 to 34 Years | 0 (0.0%) | 0 (0.0%) |
| 35 to 64 Years | 5 (26.3%) | 0 (0.0%) |
| 65 to 74 Years | 1 (50.0%) | 1 (5.6%) |
| 75 Years and over | 5 (62.5%) | 4 (50.0%) |
Disability Class by Sex by Age in Lankin
Disability Class: Hearing Difficulty
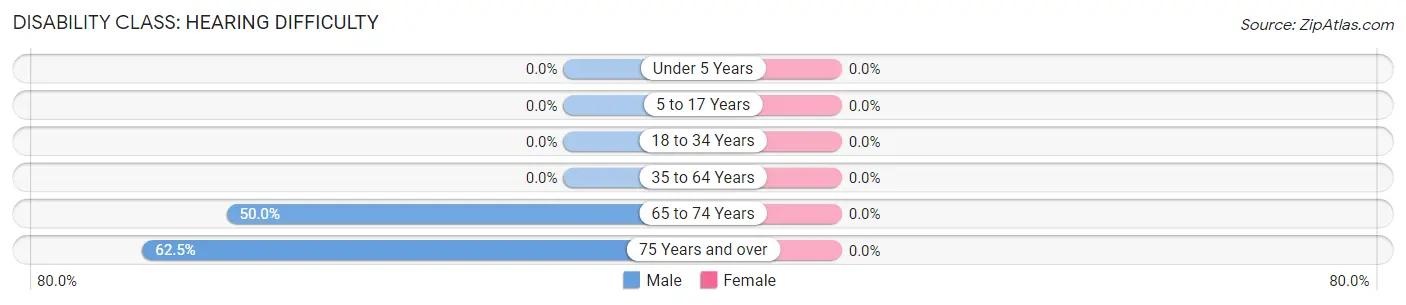
| Age Bracket | Male | Female |
| Under 5 Years | 0 (0.0%) | 0 (0.0%) |
| 5 to 17 Years | 0 (0.0%) | 0 (0.0%) |
| 18 to 34 Years | 0 (0.0%) | 0 (0.0%) |
| 35 to 64 Years | 0 (0.0%) | 0 (0.0%) |
| 65 to 74 Years | 1 (50.0%) | 0 (0.0%) |
| 75 Years and over | 5 (62.5%) | 0 (0.0%) |
Disability Class: Vision Difficulty
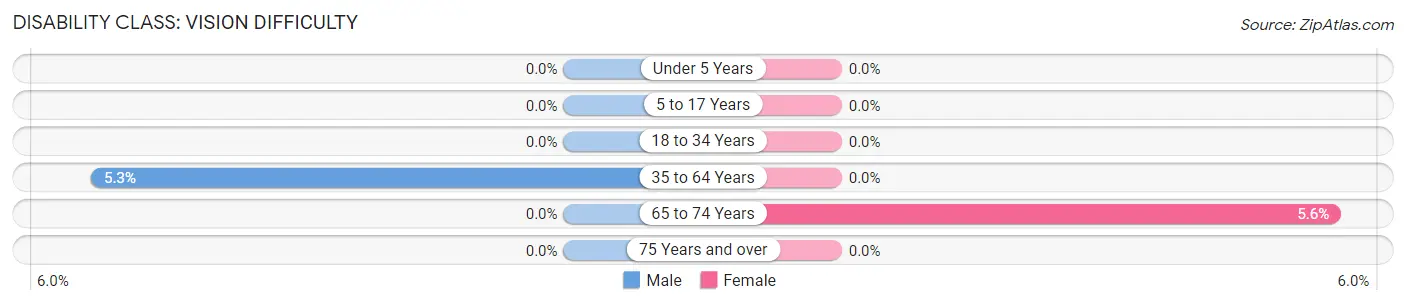
| Age Bracket | Male | Female |
| Under 5 Years | 0 (0.0%) | 0 (0.0%) |
| 5 to 17 Years | 0 (0.0%) | 0 (0.0%) |
| 18 to 34 Years | 0 (0.0%) | 0 (0.0%) |
| 35 to 64 Years | 1 (5.3%) | 0 (0.0%) |
| 65 to 74 Years | 0 (0.0%) | 1 (5.6%) |
| 75 Years and over | 0 (0.0%) | 0 (0.0%) |
Disability Class: Cognitive Difficulty
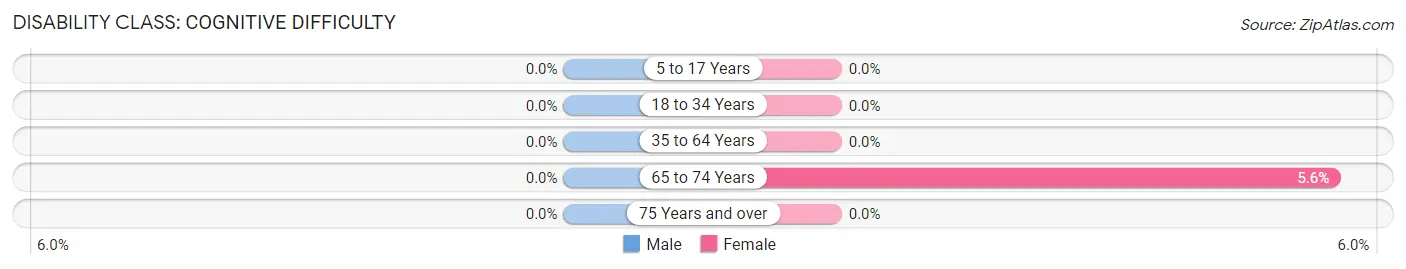
| Age Bracket | Male | Female |
| 5 to 17 Years | 0 (0.0%) | 0 (0.0%) |
| 18 to 34 Years | 0 (0.0%) | 0 (0.0%) |
| 35 to 64 Years | 0 (0.0%) | 0 (0.0%) |
| 65 to 74 Years | 0 (0.0%) | 1 (5.6%) |
| 75 Years and over | 0 (0.0%) | 0 (0.0%) |
Disability Class: Ambulatory Difficulty
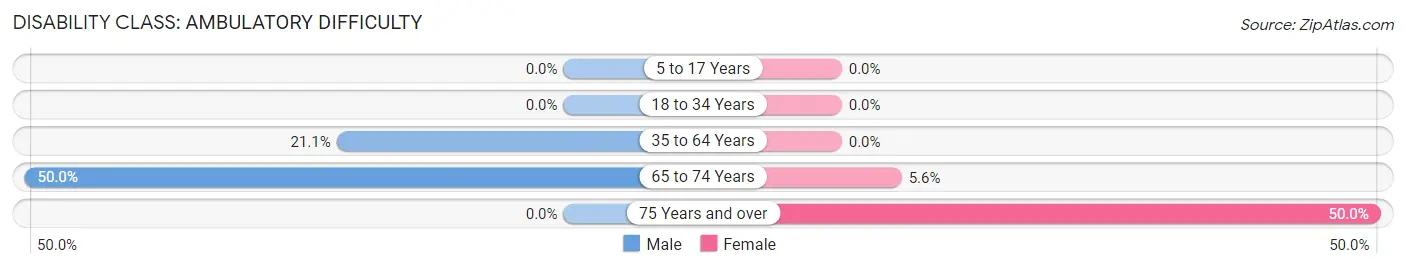
| Age Bracket | Male | Female |
| 5 to 17 Years | 0 (0.0%) | 0 (0.0%) |
| 18 to 34 Years | 0 (0.0%) | 0 (0.0%) |
| 35 to 64 Years | 4 (21.0%) | 0 (0.0%) |
| 65 to 74 Years | 1 (50.0%) | 1 (5.6%) |
| 75 Years and over | 0 (0.0%) | 4 (50.0%) |
Disability Class: Self-Care Difficulty
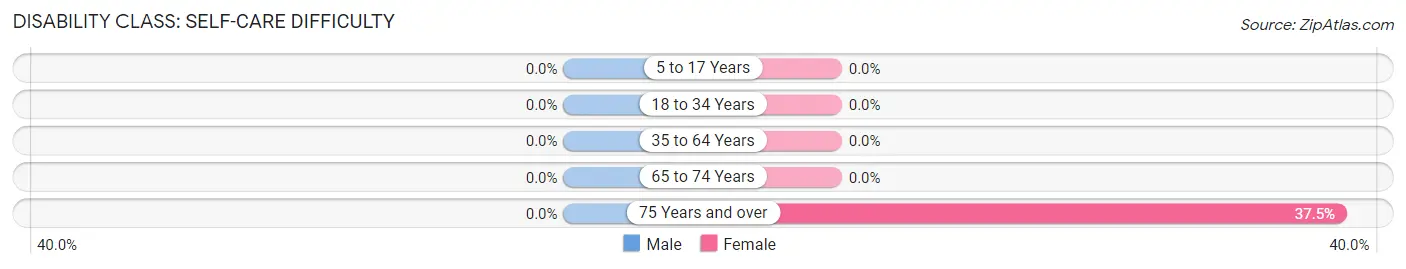
| Age Bracket | Male | Female |
| 5 to 17 Years | 0 (0.0%) | 0 (0.0%) |
| 18 to 34 Years | 0 (0.0%) | 0 (0.0%) |
| 35 to 64 Years | 0 (0.0%) | 0 (0.0%) |
| 65 to 74 Years | 0 (0.0%) | 0 (0.0%) |
| 75 Years and over | 0 (0.0%) | 3 (37.5%) |
Technology Access in Lankin
Computing Device Access in Lankin
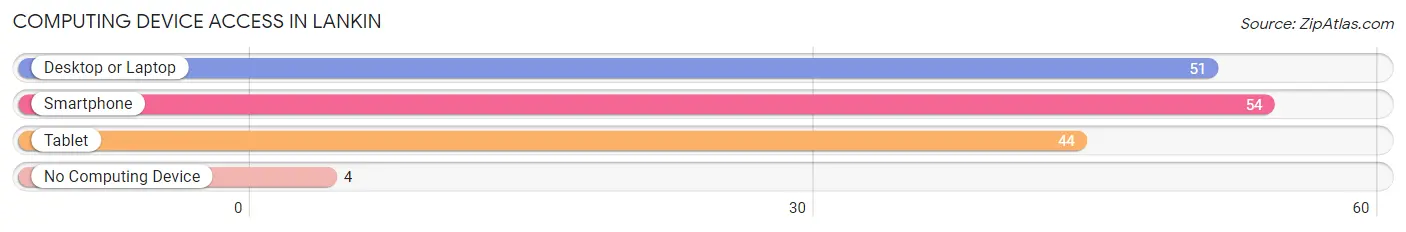
| Device Type | # Households | % Households |
| Desktop or Laptop | 51 | 83.6% |
| Smartphone | 54 | 88.5% |
| Tablet | 44 | 72.1% |
| No Computing Device | 4 | 6.6% |
| Total | 61 | 100.0% |
Internet Access in Lankin
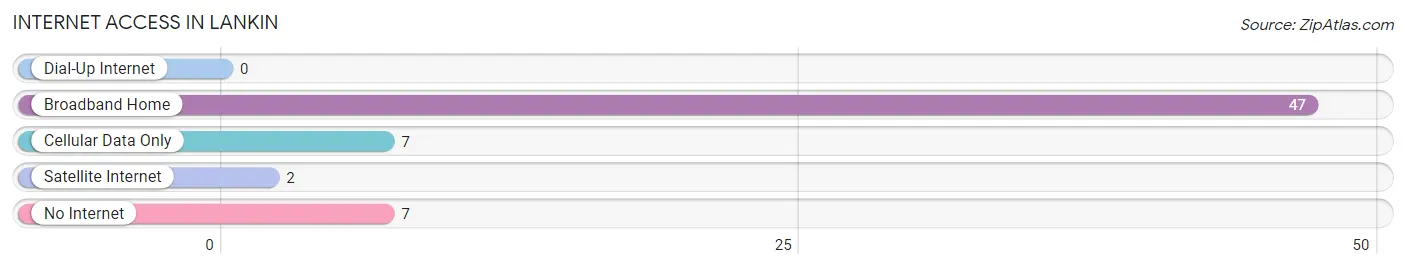
| Internet Type | # Households | % Households |
| Dial-Up Internet | 0 | 0.0% |
| Broadband Home | 47 | 77.0% |
| Cellular Data Only | 7 | 11.5% |
| Satellite Internet | 2 | 3.3% |
| No Internet | 7 | 11.5% |
| Total | 61 | 100.0% |
Lankin Summary
Lankin is a small city located in the northeastern corner of North Dakota, in the county of Walsh. It is situated on the banks of the Red River of the North, and is part of the Grand Forks metropolitan area. The city has a population of approximately 1,000 people, and is the county seat of Walsh County.
History
Lankin was founded in 1881 by a group of settlers from Norway. The city was named after the Norwegian town of Lånken, which was the hometown of the settlers. The city was incorporated in 1883, and the first post office was established in 1884.
The city grew rapidly in the late 19th and early 20th centuries, and by 1910, the population had grown to over 1,000 people. The city was a major center for the lumber industry, and the local economy was largely based on the lumber industry.
In the early 20th century, the city was also a major center for the railroad industry, and the Great Northern Railway had a major presence in the city. The city was also home to a number of other businesses, including a flour mill, a creamery, and a brickyard.
Geography
Lankin is located in the northeastern corner of North Dakota, in the county of Walsh. The city is situated on the banks of the Red River of the North, and is part of the Grand Forks metropolitan area. The city is located at an elevation of 1,072 feet (326 m) above sea level.
The city is located in a region of rolling hills and prairies, and is surrounded by farmland. The climate in Lankin is continental, with cold winters and hot summers. The average annual temperature is 45°F (7°C), and the average annual precipitation is 22 inches (56 cm).
Economy
The economy of Lankin is largely based on agriculture and manufacturing. The city is home to a number of manufacturing companies, including a flour mill, a creamery, and a brickyard. The city is also home to a number of agricultural businesses, including dairy farms, grain elevators, and livestock farms.
The city is also home to a number of retail businesses, including grocery stores, restaurants, and clothing stores. The city is also home to a number of service businesses, including banks, insurance companies, and medical offices.
Demographics
As of the 2010 census, the population of Lankin was 1,000 people. The racial makeup of the city was 97.2% White, 0.7% Native American, 0.3% Asian, 0.2% African American, and 1.6% from other races. The median household income in Lankin was $41,250, and the median family income was $50,000.
The city has a large Norwegian-American population, and the city is home to a number of Norwegian-American organizations, including the Norwegian-American Historical Association and the Norwegian-American Genealogical Society. The city is also home to a number of churches, including the Lutheran Church of the Redeemer and the United Methodist Church.
Common Questions
What is Per Capita Income in Lankin?
Per Capita income in Lankin is $35,041.
What is Income or Wage Gap in Lankin?
Income or Wage Gap in Lankin is 52.9%.
Women in Lankin earn 47.1 cents for every dollar earned by a man.
What is Inequality or Gini Index in Lankin?
Inequality or Gini Index in Lankin is 0.40.
What is the Total Population of Lankin?
Total Population of Lankin is 115.
What is the Total Male Population of Lankin?
Total Male Population of Lankin is 64.
What is the Total Female Population of Lankin?
Total Female Population of Lankin is 51.
What is the Ratio of Males per 100 Females in Lankin?
There are 125.49 Males per 100 Females in Lankin.
What is the Ratio of Females per 100 Males in Lankin?
There are 79.69 Females per 100 Males in Lankin.
What is the Median Population Age in Lankin?
Median Population Age in Lankin is 52.4 Years.
What is the Average Family Size in Lankin
Average Family Size in Lankin is 3.5 People.
What is the Average Household Size in Lankin
Average Household Size in Lankin is 1.9 People.
How Large is the Labor Force in Lankin?
There are 45 People in the Labor Forcein in Lankin.
What is the Percentage of People in the Labor Force in Lankin?
45.0% of People are in the Labor Force in Lankin.