Harrisville, MI Map & Demographics
Harrisville Map
Harrisville Overview
$26,803
PER CAPITA INCOME
$58,333
AVG FAMILY INCOME
$35,375
AVG HOUSEHOLD INCOME
13.0%
WAGE / INCOME GAP [ % ]
87.0¢/ $1
WAGE / INCOME GAP [ $ ]
$5,323
FAMILY INCOME DEFICIT
0.49
INEQUALITY / GINI INDEX
500
TOTAL POPULATION
234
MALE POPULATION
266
FEMALE POPULATION
87.97
MALES / 100 FEMALES
113.68
FEMALES / 100 MALES
54.1
MEDIAN AGE
2.7
AVG FAMILY SIZE
2.0
AVG HOUSEHOLD SIZE
170
LABOR FORCE [ PEOPLE ]
40.8%
PERCENT IN LABOR FORCE
2.9%
UNEMPLOYMENT RATE
Harrisville Zip Codes
Harrisville Area Codes
Income in Harrisville
Income Overview in Harrisville
Per Capita Income in Harrisville is $26,803, while median incomes of families and households are $58,333 and $35,375 respectively.
| Characteristic | Number | Measure |
| Per Capita Income | 500 | $26,803 |
| Median Family Income | 122 | $58,333 |
| Mean Family Income | 122 | $79,248 |
| Median Household Income | 225 | $35,375 |
| Mean Household Income | 225 | $57,813 |
| Income Deficit | 122 | $5,323 |
| Wage / Income Gap (%) | 500 | 13.03% |
| Wage / Income Gap ($) | 500 | 86.97¢ per $1 |
| Gini / Inequality Index | 500 | 0.49 |
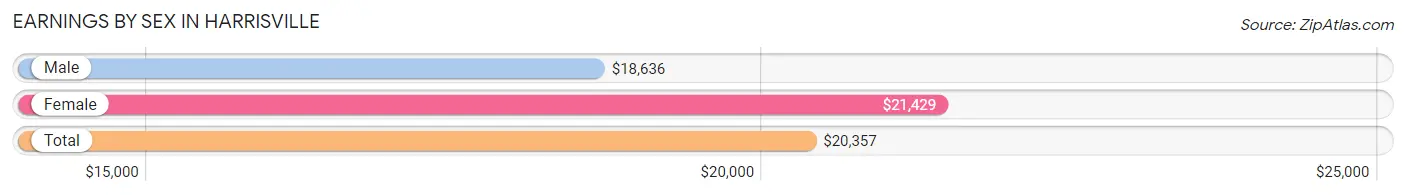
Earnings by Sex in Harrisville
Average Earnings in Harrisville are $20,357, $18,636 for men and $21,429 for women, a difference of 13.0%.
| Sex | Number | Average Earnings |
| Male | 90 (46.4%) | $18,636 |
| Female | 104 (53.6%) | $21,429 |
| Total | 194 (100.0%) | $20,357 |
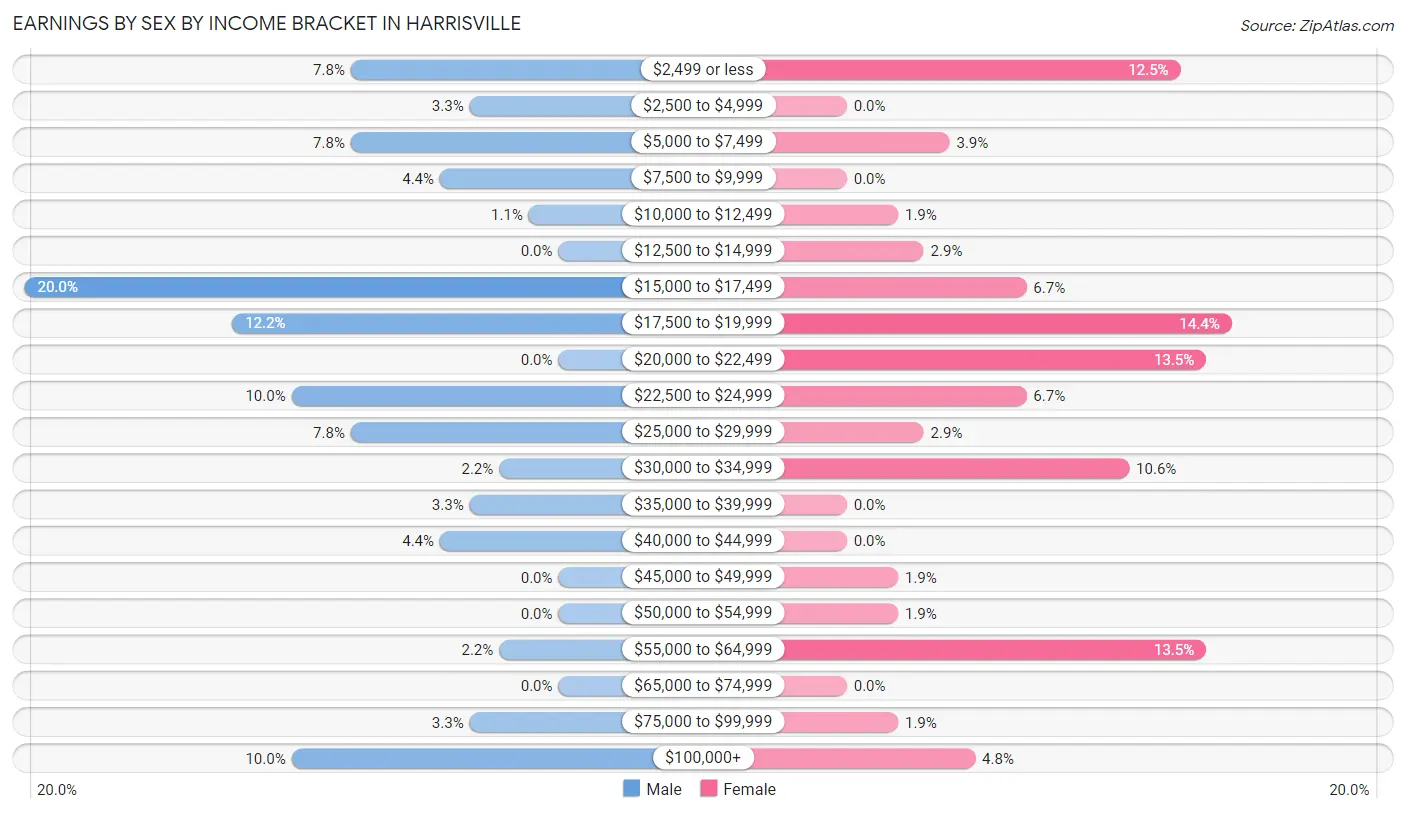
Earnings by Sex by Income Bracket in Harrisville
The most common earnings brackets in Harrisville are $15,000 to $17,499 for men (18 | 20.0%) and $17,500 to $19,999 for women (15 | 14.4%).
| Income | Male | Female |
| $2,499 or less | 7 (7.8%) | 13 (12.5%) |
| $2,500 to $4,999 | 3 (3.3%) | 0 (0.0%) |
| $5,000 to $7,499 | 7 (7.8%) | 4 (3.8%) |
| $7,500 to $9,999 | 4 (4.4%) | 0 (0.0%) |
| $10,000 to $12,499 | 1 (1.1%) | 2 (1.9%) |
| $12,500 to $14,999 | 0 (0.0%) | 3 (2.9%) |
| $15,000 to $17,499 | 18 (20.0%) | 7 (6.7%) |
| $17,500 to $19,999 | 11 (12.2%) | 15 (14.4%) |
| $20,000 to $22,499 | 0 (0.0%) | 14 (13.5%) |
| $22,500 to $24,999 | 9 (10.0%) | 7 (6.7%) |
| $25,000 to $29,999 | 7 (7.8%) | 3 (2.9%) |
| $30,000 to $34,999 | 2 (2.2%) | 11 (10.6%) |
| $35,000 to $39,999 | 3 (3.3%) | 0 (0.0%) |
| $40,000 to $44,999 | 4 (4.4%) | 0 (0.0%) |
| $45,000 to $49,999 | 0 (0.0%) | 2 (1.9%) |
| $50,000 to $54,999 | 0 (0.0%) | 2 (1.9%) |
| $55,000 to $64,999 | 2 (2.2%) | 14 (13.5%) |
| $65,000 to $74,999 | 0 (0.0%) | 0 (0.0%) |
| $75,000 to $99,999 | 3 (3.3%) | 2 (1.9%) |
| $100,000+ | 9 (10.0%) | 5 (4.8%) |
| Total | 90 (100.0%) | 104 (100.0%) |
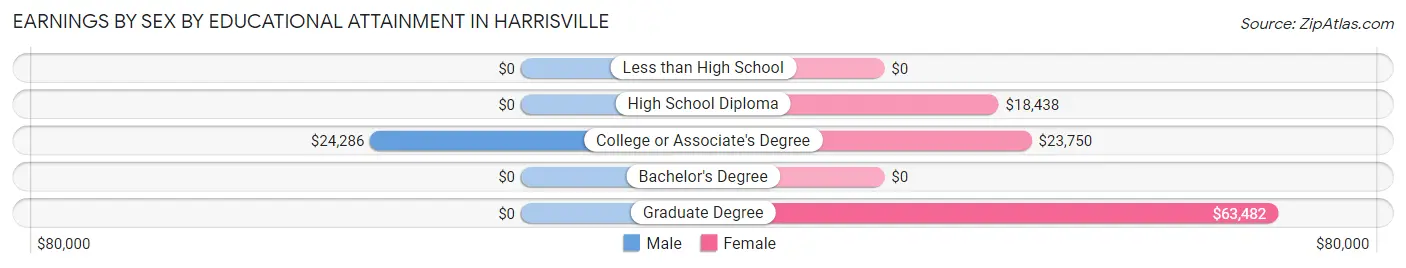
Earnings by Sex by Educational Attainment in Harrisville
Average earnings in Harrisville are $23,056 for men and $21,607 for women, a difference of 6.3%. Men with an educational attainment of college or associate's degree enjoy the highest average annual earnings of $24,286, while those with college or associate's degree education earn the least with $24,286. Women with an educational attainment of graduate degree earn the most with the average annual earnings of $63,482, while those with high school diploma education have the smallest earnings of $18,438.
| Educational Attainment | Male Income | Female Income |
| Less than High School | - | - |
| High School Diploma | - | - |
| College or Associate's Degree | $24,286 | $23,750 |
| Bachelor's Degree | - | - |
| Graduate Degree | - | - |
| Total | $23,056 | $21,607 |
Family Income in Harrisville
Family Income Brackets in Harrisville
According to the Harrisville family income data, there are 28 families falling into the $50,000 to $74,999 income range, which is the most common income bracket and makes up 23.0% of all families. Conversely, the $150,000 to $199,999 income bracket is the least frequent group with only 4 families (3.3%) belonging to this category.
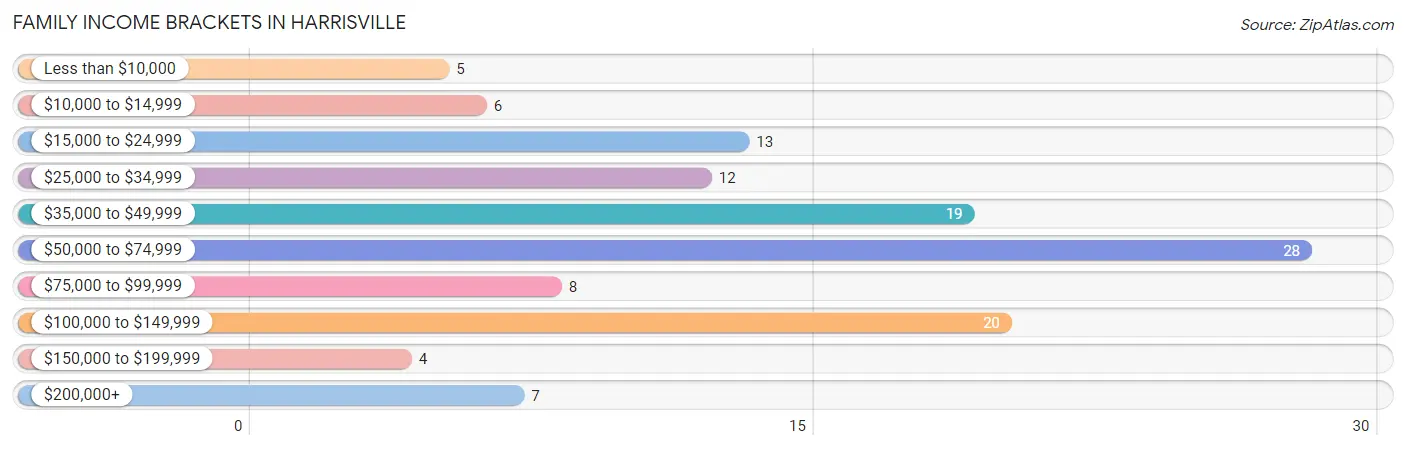
| Income Bracket | # Families | % Families |
| Less than $10,000 | 5 | 4.1% |
| $10,000 to $14,999 | 6 | 4.9% |
| $15,000 to $24,999 | 13 | 10.7% |
| $25,000 to $34,999 | 12 | 9.8% |
| $35,000 to $49,999 | 19 | 15.6% |
| $50,000 to $74,999 | 28 | 23.0% |
| $75,000 to $99,999 | 8 | 6.6% |
| $100,000 to $149,999 | 20 | 16.4% |
| $150,000 to $199,999 | 4 | 3.3% |
| $200,000+ | 7 | 5.7% |
Family Income by Famaliy Size in Harrisville
3-person families (29 | 23.8%) account for the highest median family income in Harrisville with $92,250 per family, while 3-person families (29 | 23.8%) have the highest median income of $30,750 per family member.
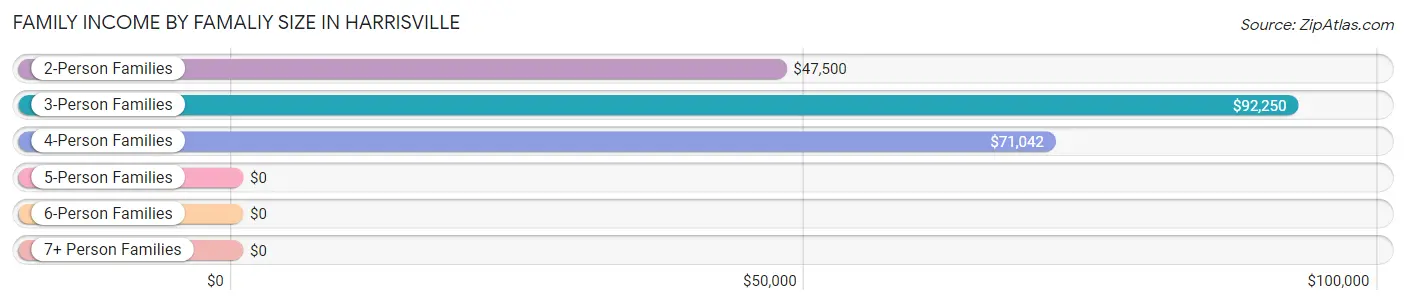
| Income Bracket | # Families | Median Income |
| 2-Person Families | 66 (54.1%) | $47,500 |
| 3-Person Families | 29 (23.8%) | $92,250 |
| 4-Person Families | 27 (22.1%) | $71,042 |
| 5-Person Families | 0 (0.0%) | $0 |
| 6-Person Families | 0 (0.0%) | $0 |
| 7+ Person Families | 0 (0.0%) | $0 |
| Total | 122 (100.0%) | $58,333 |
Family Income by Number of Earners in Harrisville
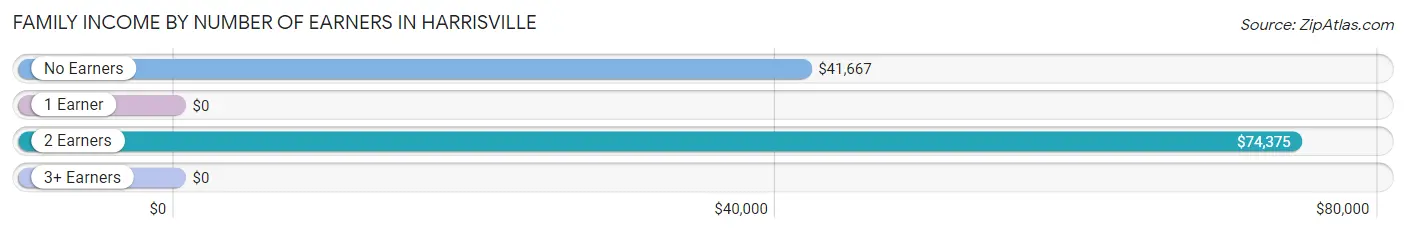
| Number of Earners | # Families | Median Income |
| No Earners | 42 (34.4%) | $41,667 |
| 1 Earner | 44 (36.1%) | $0 |
| 2 Earners | 33 (27.1%) | $74,375 |
| 3+ Earners | 3 (2.5%) | $0 |
| Total | 122 (100.0%) | $58,333 |
Household Income in Harrisville
Household Income Brackets in Harrisville
With 53 households falling in the category, the $25,000 to $34,999 income range is the most frequent in Harrisville, accounting for 23.6% of all households. In contrast, only 4 households (1.8%) fall into the $150,000 to $199,999 income bracket, making it the least populous group.
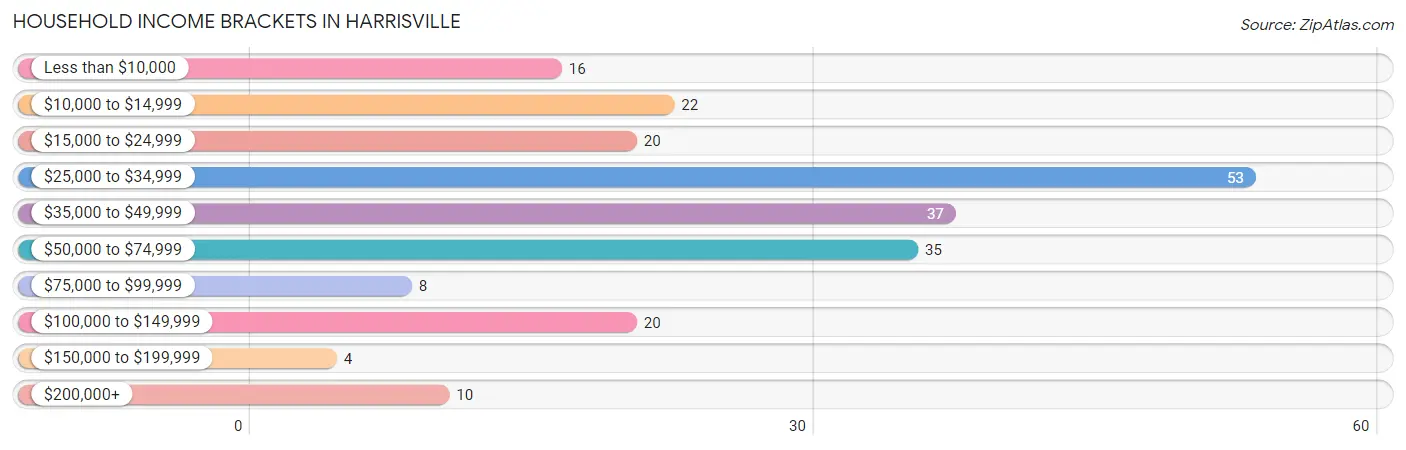
| Income Bracket | # Households | % Households |
| Less than $10,000 | 16 | 7.1% |
| $10,000 to $14,999 | 22 | 9.8% |
| $15,000 to $24,999 | 20 | 8.9% |
| $25,000 to $34,999 | 53 | 23.6% |
| $35,000 to $49,999 | 37 | 16.4% |
| $50,000 to $74,999 | 35 | 15.6% |
| $75,000 to $99,999 | 8 | 3.6% |
| $100,000 to $149,999 | 20 | 8.9% |
| $150,000 to $199,999 | 4 | 1.8% |
| $200,000+ | 10 | 4.4% |
Household Income by Householder Age in Harrisville
The median household income in Harrisville is $35,375, with the highest median household income of $115,089 found in the 45 to 64 years age bracket for the primary householder. A total of 55 households (24.4%) fall into this category. Meanwhile, the 15 to 24 years age bracket for the primary householder has the lowest median household income of $0, with 3 households (1.3%) in this group.
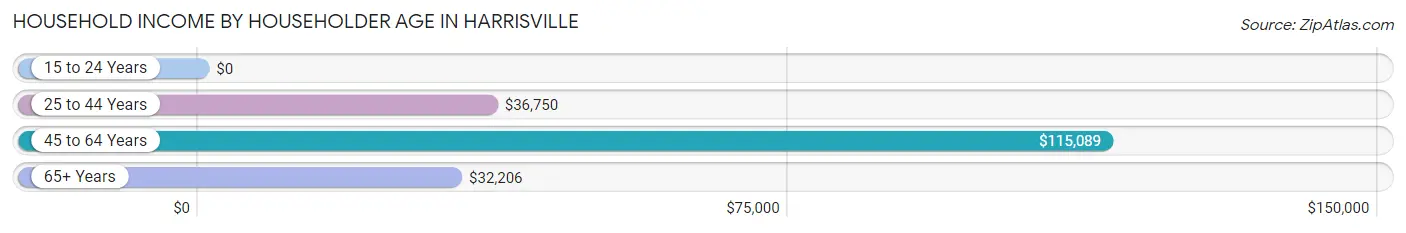
| Income Bracket | # Households | Median Income |
| 15 to 24 Years | 3 (1.3%) | $0 |
| 25 to 44 Years | 47 (20.9%) | $36,750 |
| 45 to 64 Years | 55 (24.4%) | $115,089 |
| 65+ Years | 120 (53.3%) | $32,206 |
| Total | 225 (100.0%) | $35,375 |
Poverty in Harrisville
Income Below Poverty by Sex and Age in Harrisville
With 13.7% poverty level for males and 30.9% for females among the residents of Harrisville, 6 to 11 year old males and 18 to 24 year old females are the most vulnerable to poverty, with 4 males (80.0%) and 2 females (100.0%) in their respective age groups living below the poverty level.
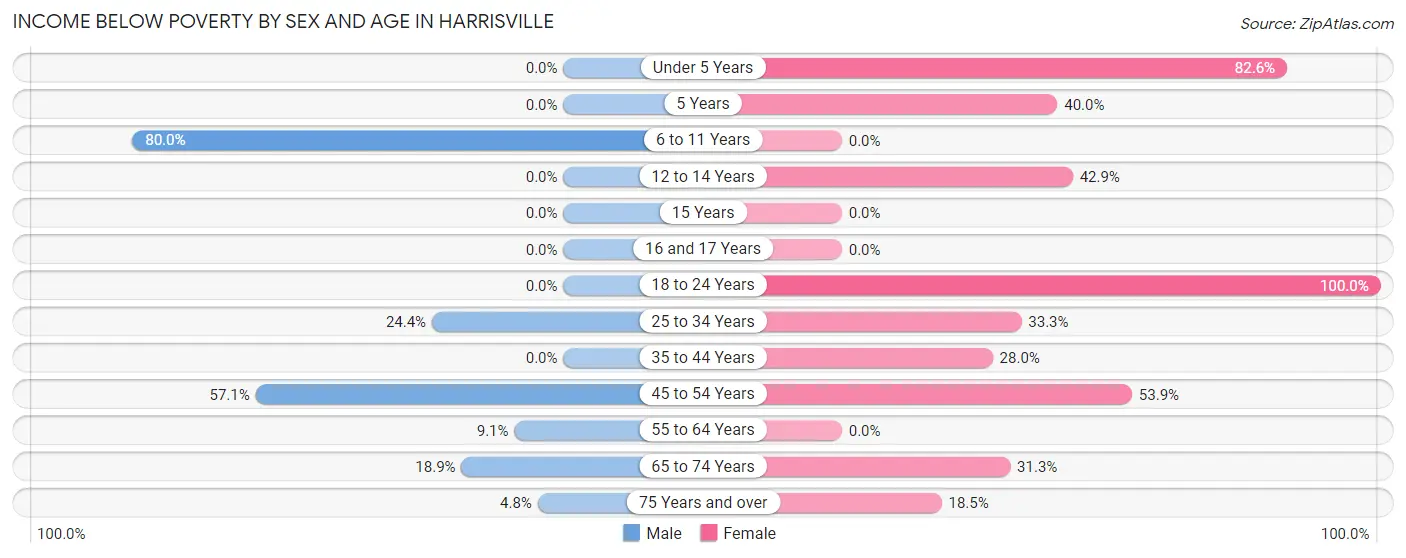
| Age Bracket | Male | Female |
| Under 5 Years | 0 (0.0%) | 19 (82.6%) |
| 5 Years | 0 (0.0%) | 2 (40.0%) |
| 6 to 11 Years | 4 (80.0%) | 0 (0.0%) |
| 12 to 14 Years | 0 (0.0%) | 6 (42.9%) |
| 15 Years | 0 (0.0%) | 0 (0.0%) |
| 16 and 17 Years | 0 (0.0%) | 0 (0.0%) |
| 18 to 24 Years | 0 (0.0%) | 2 (100.0%) |
| 25 to 34 Years | 10 (24.4%) | 6 (33.3%) |
| 35 to 44 Years | 0 (0.0%) | 7 (28.0%) |
| 45 to 54 Years | 4 (57.1%) | 14 (53.8%) |
| 55 to 64 Years | 2 (9.1%) | 0 (0.0%) |
| 65 to 74 Years | 7 (18.9%) | 15 (31.2%) |
| 75 Years and over | 2 (4.8%) | 10 (18.5%) |
| Total | 29 (13.7%) | 81 (30.9%) |
Income Above Poverty by Sex and Age in Harrisville
According to the poverty statistics in Harrisville, males aged under 5 years and females aged 6 to 11 years are the age groups that are most secure financially, with 100.0% of males and 100.0% of females in these age groups living above the poverty line.
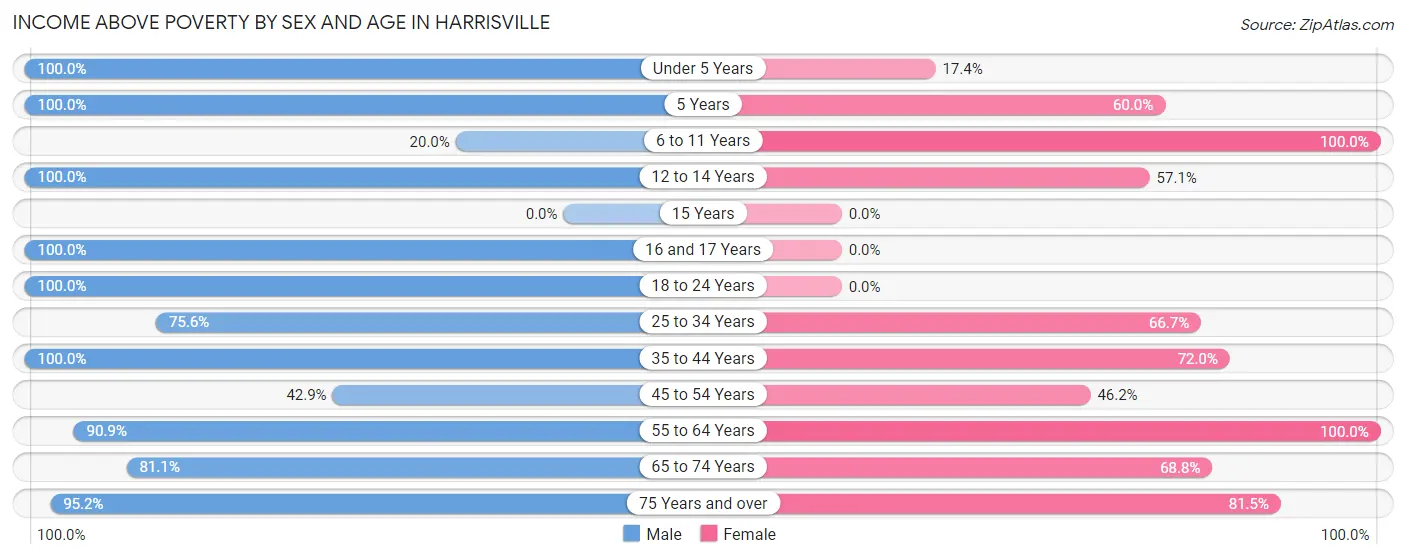
| Age Bracket | Male | Female |
| Under 5 Years | 11 (100.0%) | 4 (17.4%) |
| 5 Years | 6 (100.0%) | 3 (60.0%) |
| 6 to 11 Years | 1 (20.0%) | 10 (100.0%) |
| 12 to 14 Years | 9 (100.0%) | 8 (57.1%) |
| 15 Years | 0 (0.0%) | 0 (0.0%) |
| 16 and 17 Years | 3 (100.0%) | 0 (0.0%) |
| 18 to 24 Years | 13 (100.0%) | 0 (0.0%) |
| 25 to 34 Years | 31 (75.6%) | 12 (66.7%) |
| 35 to 44 Years | 15 (100.0%) | 18 (72.0%) |
| 45 to 54 Years | 3 (42.9%) | 12 (46.2%) |
| 55 to 64 Years | 20 (90.9%) | 37 (100.0%) |
| 65 to 74 Years | 30 (81.1%) | 33 (68.8%) |
| 75 Years and over | 40 (95.2%) | 44 (81.5%) |
| Total | 182 (86.3%) | 181 (69.1%) |
Income Below Poverty Among Married-Couple Families in Harrisville
The poverty statistics for married-couple families in Harrisville show that 6.3% or 6 of the total 95 families live below the poverty line. Families with 1 or 2 children have the highest poverty rate of 10.7%, comprising of 3 families. On the other hand, families with no children have the lowest poverty rate of 4.5%, which includes 3 families.
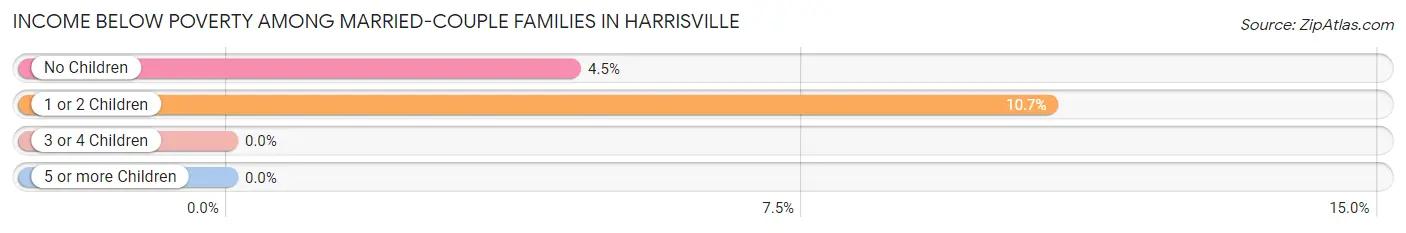
| Children | Above Poverty | Below Poverty |
| No Children | 64 (95.5%) | 3 (4.5%) |
| 1 or 2 Children | 25 (89.3%) | 3 (10.7%) |
| 3 or 4 Children | 0 (0.0%) | 0 (0.0%) |
| 5 or more Children | 0 (0.0%) | 0 (0.0%) |
| Total | 89 (93.7%) | 6 (6.3%) |
Income Below Poverty Among Single-Parent Households in Harrisville
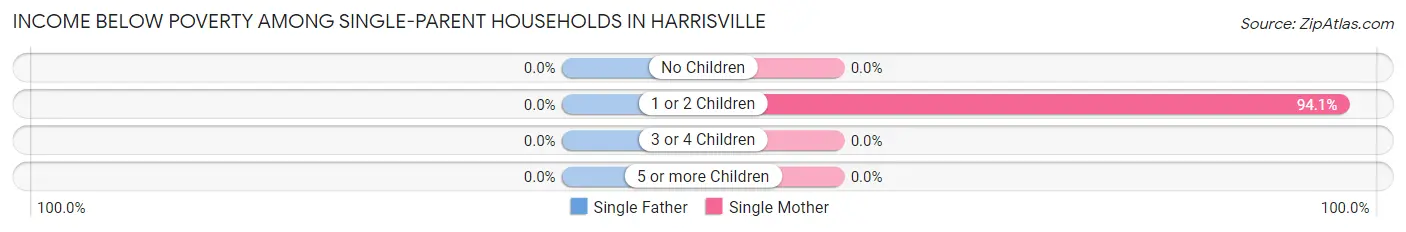
| Children | Single Father | Single Mother |
| No Children | 0 (0.0%) | 0 (0.0%) |
| 1 or 2 Children | 0 (0.0%) | 16 (94.1%) |
| 3 or 4 Children | 0 (0.0%) | 0 (0.0%) |
| 5 or more Children | 0 (0.0%) | 0 (0.0%) |
| Total | 0 (0.0%) | 16 (59.3%) |
Income Below Poverty Among Married-Couple vs Single-Parent Households in Harrisville
The poverty data for Harrisville shows that 6 of the married-couple family households (6.3%) and 16 of the single-parent households (59.3%) are living below the poverty level. Within the married-couple family households, those with 1 or 2 children have the highest poverty rate, with 3 households (10.7%) falling below the poverty line. Among the single-parent households, those with 1 or 2 children have the highest poverty rate, with 16 household (94.1%) living below poverty.
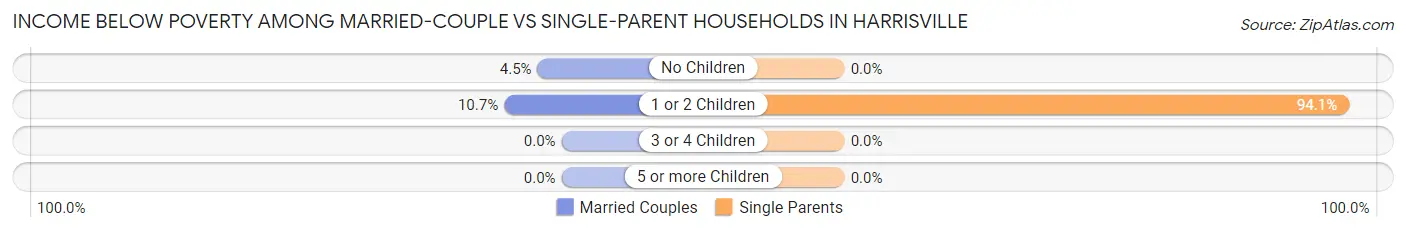
| Children | Married-Couple Families | Single-Parent Households |
| No Children | 3 (4.5%) | 0 (0.0%) |
| 1 or 2 Children | 3 (10.7%) | 16 (94.1%) |
| 3 or 4 Children | 0 (0.0%) | 0 (0.0%) |
| 5 or more Children | 0 (0.0%) | 0 (0.0%) |
| Total | 6 (6.3%) | 16 (59.3%) |
Race in Harrisville
The most populous races in Harrisville are White / Caucasian (488 | 97.6%), Hispanic or Latino (31 | 6.2%), and Two or more Races (11 | 2.2%).
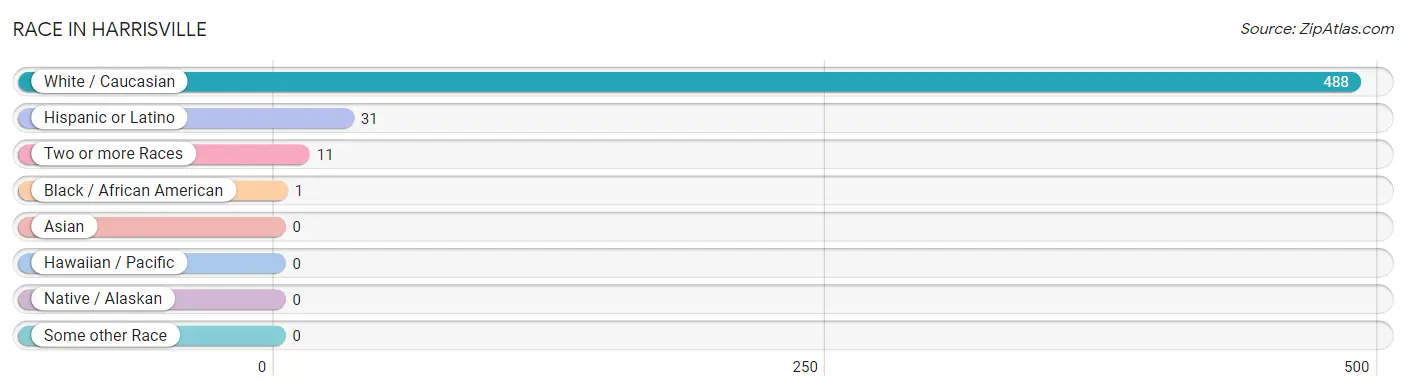
| Race | # Population | % Population |
| Asian | 0 | 0.0% |
| Black / African American | 1 | 0.2% |
| Hawaiian / Pacific | 0 | 0.0% |
| Hispanic or Latino | 31 | 6.2% |
| Native / Alaskan | 0 | 0.0% |
| White / Caucasian | 488 | 97.6% |
| Two or more Races | 11 | 2.2% |
| Some other Race | 0 | 0.0% |
| Total | 500 | 100.0% |
Ancestry in Harrisville
The most populous ancestries reported in Harrisville are English (129 | 25.8%), German (113 | 22.6%), Irish (109 | 21.8%), Polish (46 | 9.2%), and Scottish (32 | 6.4%), together accounting for 85.8% of all Harrisville residents.
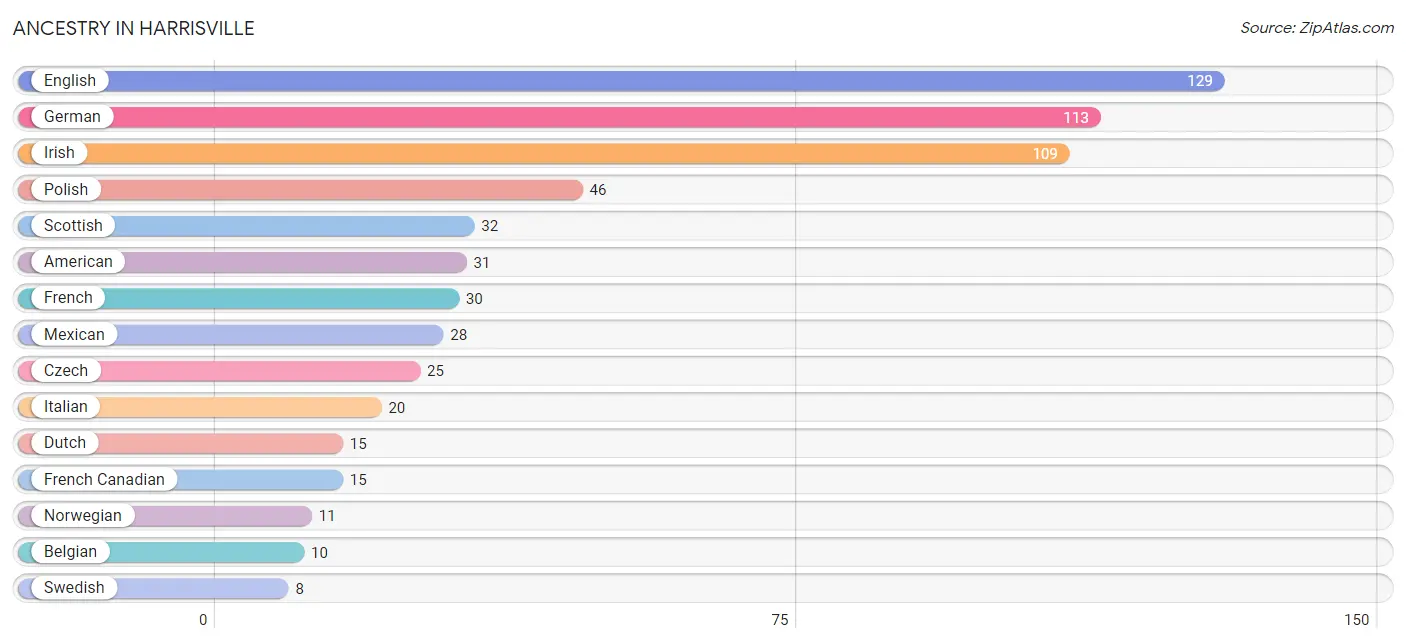
| Ancestry | # Population | % Population |
| African | 2 | 0.4% |
| American | 31 | 6.2% |
| Arab | 1 | 0.2% |
| Australian | 3 | 0.6% |
| Belgian | 10 | 2.0% |
| Blackfeet | 4 | 0.8% |
| British | 2 | 0.4% |
| Cuban | 3 | 0.6% |
| Czech | 25 | 5.0% |
| Danish | 2 | 0.4% |
| Dutch | 15 | 3.0% |
| Eastern European | 2 | 0.4% |
| English | 129 | 25.8% |
| European | 5 | 1.0% |
| French | 30 | 6.0% |
| French Canadian | 15 | 3.0% |
| German | 113 | 22.6% |
| Greek | 3 | 0.6% |
| Hungarian | 5 | 1.0% |
| Irish | 109 | 21.8% |
| Italian | 20 | 4.0% |
| Lebanese | 1 | 0.2% |
| Mexican | 28 | 5.6% |
| Native Hawaiian | 2 | 0.4% |
| Northern European | 4 | 0.8% |
| Norwegian | 11 | 2.2% |
| Polish | 46 | 9.2% |
| Russian | 2 | 0.4% |
| Scandinavian | 2 | 0.4% |
| Scotch-Irish | 2 | 0.4% |
| Scottish | 32 | 6.4% |
| Slavic | 7 | 1.4% |
| Subsaharan African | 2 | 0.4% |
| Swedish | 8 | 1.6% |
| Swiss | 2 | 0.4% | View All 35 Rows |
Immigrants in Harrisville
The most numerous immigrant groups reported in Harrisville came from Czechoslovakia (7 | 1.4%), Eastern Europe (7 | 1.4%), Europe (7 | 1.4%), Caribbean (3 | 0.6%), and Cuba (3 | 0.6%), together accounting for 5.4% of all Harrisville residents.
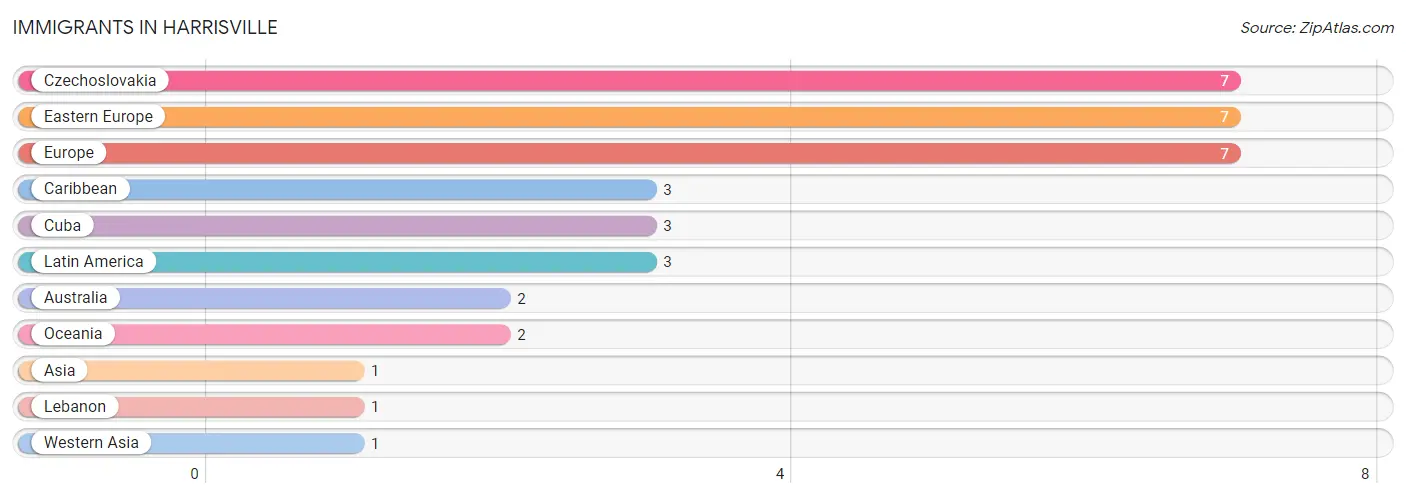
| Immigration Origin | # Population | % Population |
| Asia | 1 | 0.2% |
| Australia | 2 | 0.4% |
| Caribbean | 3 | 0.6% |
| Cuba | 3 | 0.6% |
| Czechoslovakia | 7 | 1.4% |
| Eastern Europe | 7 | 1.4% |
| Europe | 7 | 1.4% |
| Latin America | 3 | 0.6% |
| Lebanon | 1 | 0.2% |
| Oceania | 2 | 0.4% |
| Western Asia | 1 | 0.2% | View All 11 Rows |
Sex and Age in Harrisville
Sex and Age in Harrisville
The most populous age groups in Harrisville are 70 to 74 Years (30 | 12.8%) for men and 70 to 74 Years (34 | 12.8%) for women.
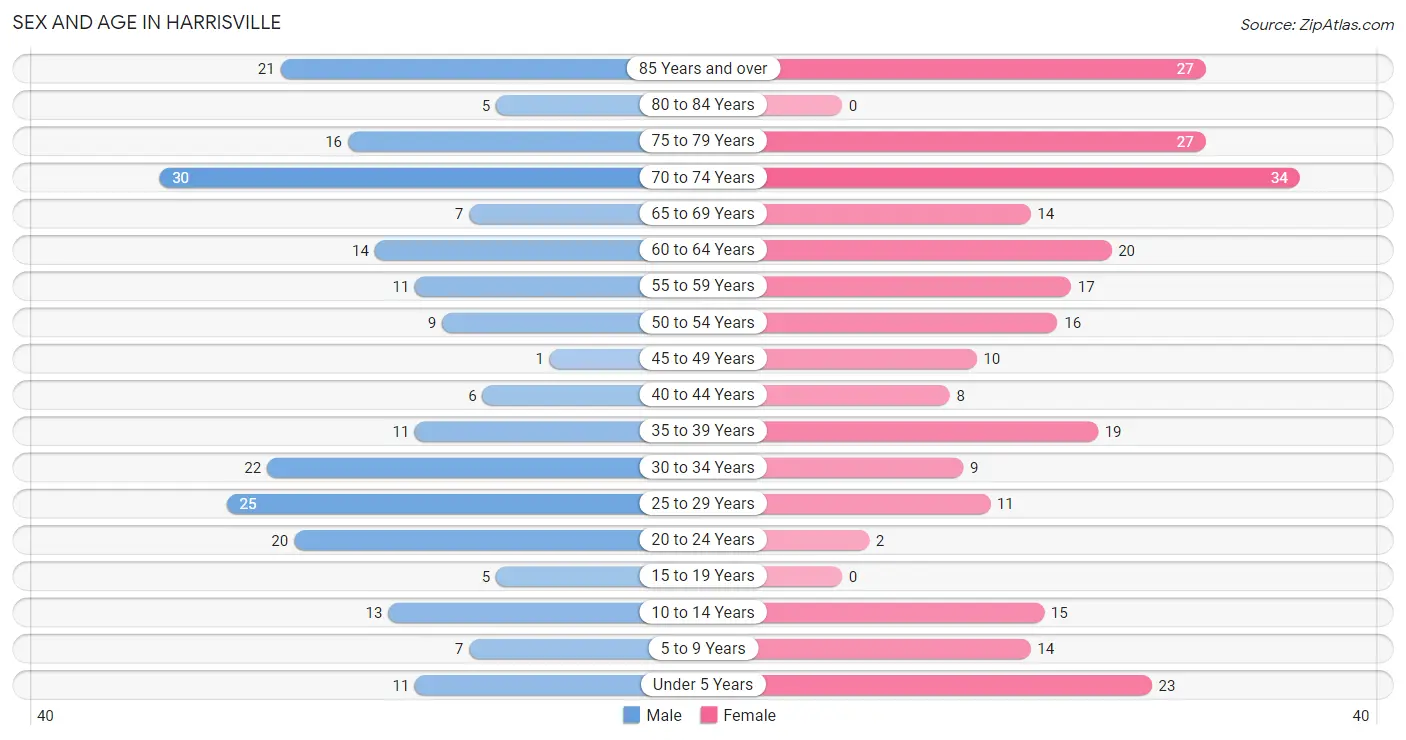
| Age Bracket | Male | Female |
| Under 5 Years | 11 (4.7%) | 23 (8.6%) |
| 5 to 9 Years | 7 (3.0%) | 14 (5.3%) |
| 10 to 14 Years | 13 (5.6%) | 15 (5.6%) |
| 15 to 19 Years | 5 (2.1%) | 0 (0.0%) |
| 20 to 24 Years | 20 (8.6%) | 2 (0.7%) |
| 25 to 29 Years | 25 (10.7%) | 11 (4.1%) |
| 30 to 34 Years | 22 (9.4%) | 9 (3.4%) |
| 35 to 39 Years | 11 (4.7%) | 19 (7.1%) |
| 40 to 44 Years | 6 (2.6%) | 8 (3.0%) |
| 45 to 49 Years | 1 (0.4%) | 10 (3.8%) |
| 50 to 54 Years | 9 (3.8%) | 16 (6.0%) |
| 55 to 59 Years | 11 (4.7%) | 17 (6.4%) |
| 60 to 64 Years | 14 (6.0%) | 20 (7.5%) |
| 65 to 69 Years | 7 (3.0%) | 14 (5.3%) |
| 70 to 74 Years | 30 (12.8%) | 34 (12.8%) |
| 75 to 79 Years | 16 (6.8%) | 27 (10.2%) |
| 80 to 84 Years | 5 (2.1%) | 0 (0.0%) |
| 85 Years and over | 21 (9.0%) | 27 (10.2%) |
| Total | 234 (100.0%) | 266 (100.0%) |
Families and Households in Harrisville
Median Family Size in Harrisville
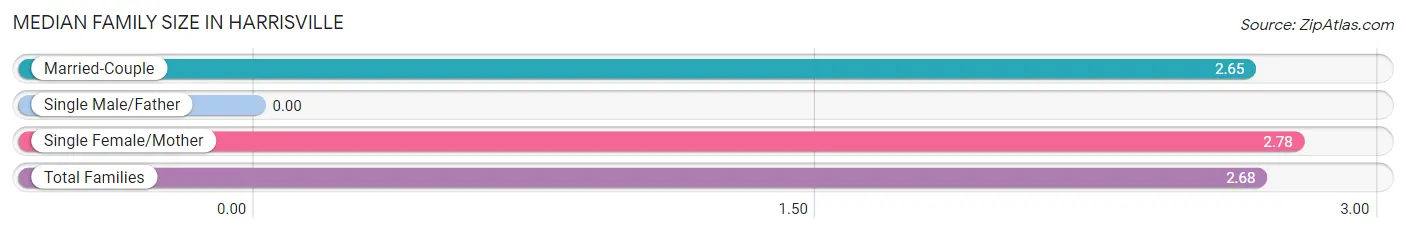
| Family Type | # Families | Family Size |
| Married-Couple | 95 (77.9%) | 2.65 |
| Single Male/Father | 0 (0.0%) | - |
| Single Female/Mother | 27 (22.1%) | 2.78 |
| Total Families | 122 (100.0%) | 2.68 |
Median Household Size in Harrisville
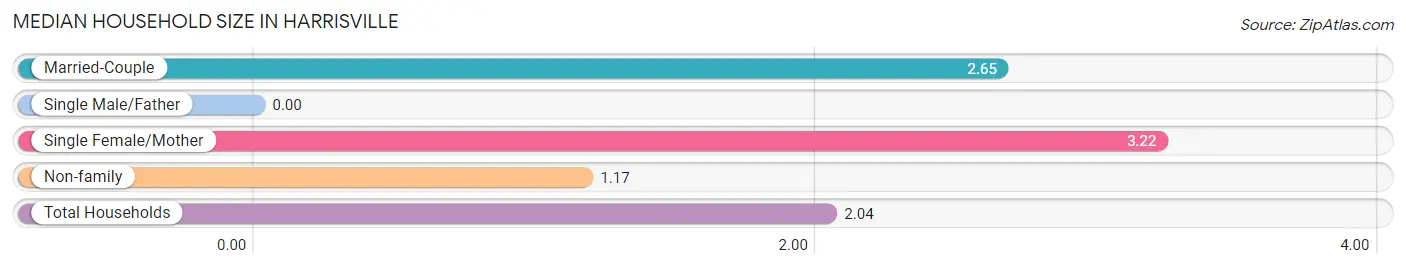
| Household Type | # Households | Household Size |
| Married-Couple | 95 (42.2%) | 2.65 |
| Single Male/Father | 0 (0.0%) | - |
| Single Female/Mother | 27 (12.0%) | 3.22 |
| Non-family | 103 (45.8%) | 1.17 |
| Total Households | 225 (100.0%) | 2.04 |
Household Size by Marriage Status in Harrisville
Out of a total of 225 households in Harrisville, 122 (54.2%) are family households, while 103 (45.8%) are nonfamily households. The most numerous type of family households are 2-person households, comprising 61, and the most common type of nonfamily households are 1-person households, comprising 94.
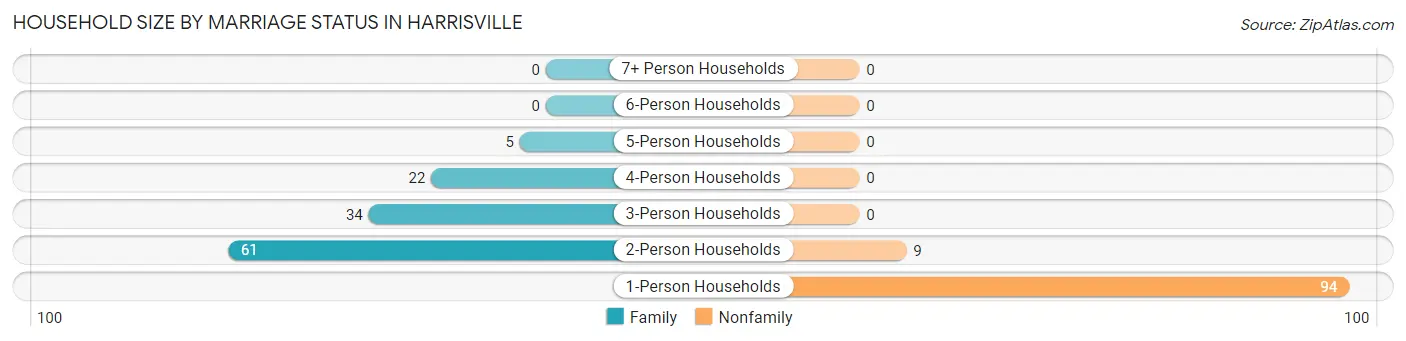
| Household Size | Family Households | Nonfamily Households |
| 1-Person Households | - | 94 (41.8%) |
| 2-Person Households | 61 (27.1%) | 9 (4.0%) |
| 3-Person Households | 34 (15.1%) | 0 (0.0%) |
| 4-Person Households | 22 (9.8%) | 0 (0.0%) |
| 5-Person Households | 5 (2.2%) | 0 (0.0%) |
| 6-Person Households | 0 (0.0%) | 0 (0.0%) |
| 7+ Person Households | 0 (0.0%) | 0 (0.0%) |
| Total | 122 (54.2%) | 103 (45.8%) |
Female Fertility in Harrisville
Fertility by Age in Harrisville
Average fertility rate in Harrisville is 63.0 births per 1,000 women. Women in the age bracket of 20 to 34 years have the highest fertility rate with 182.0 births per 1,000 women. Women in the age bracket of 20 to 34 years acount for 100.0% of all women with births.
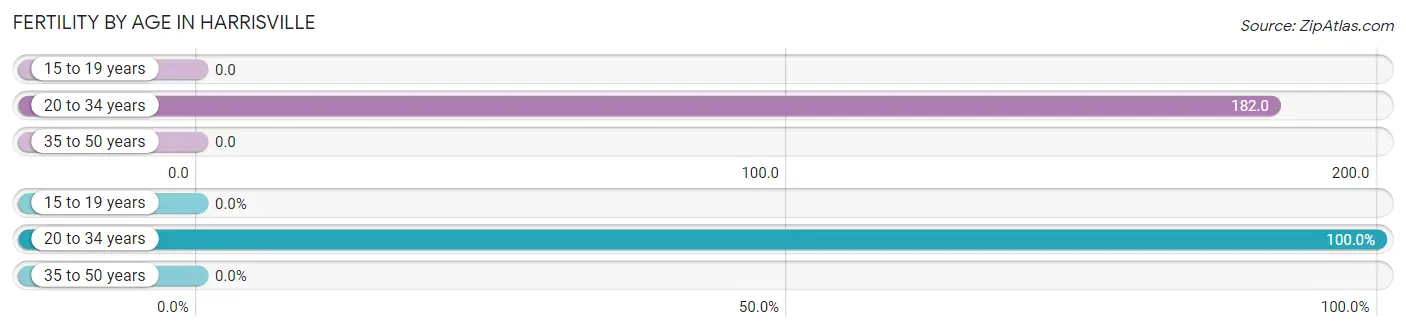
| Age Bracket | Women with Births | Births / 1,000 Women |
| 15 to 19 years | 0 (0.0%) | 0.0 |
| 20 to 34 years | 4 (100.0%) | 182.0 |
| 35 to 50 years | 0 (0.0%) | 0.0 |
| Total | 4 (100.0%) | 63.0 |
Fertility by Age by Marriage Status in Harrisville
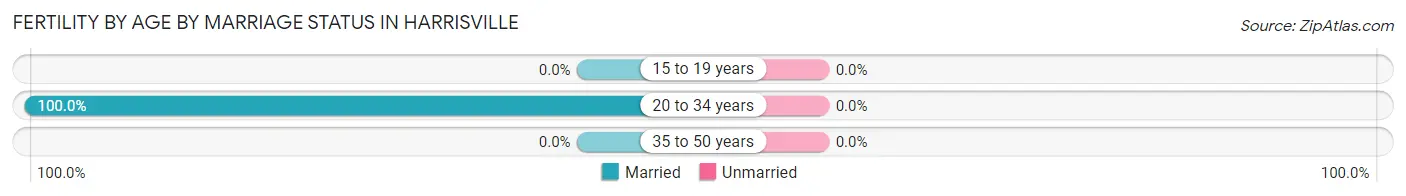
| Age Bracket | Married | Unmarried |
| 15 to 19 years | 0 (0.0%) | 0 (0.0%) |
| 20 to 34 years | 4 (100.0%) | 0 (0.0%) |
| 35 to 50 years | 0 (0.0%) | 0 (0.0%) |
| Total | 4 (100.0%) | 0 (0.0%) |
Fertility by Education in Harrisville
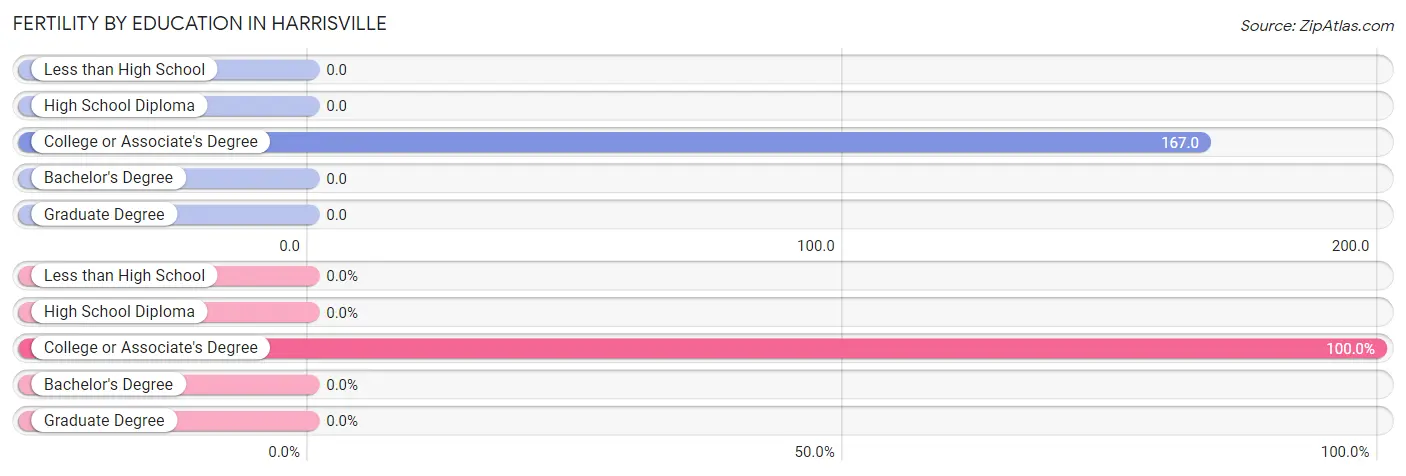
| Educational Attainment | Women with Births | Births / 1,000 Women |
| Less than High School | 0 (0.0%) | 0.0 |
| High School Diploma | 0 (0.0%) | 0.0 |
| College or Associate's Degree | 4 (100.0%) | 167.0 |
| Bachelor's Degree | 0 (0.0%) | 0.0 |
| Graduate Degree | 0 (0.0%) | 0.0 |
| Total | 4 (100.0%) | 63.0 |
Fertility by Education by Marriage Status in Harrisville
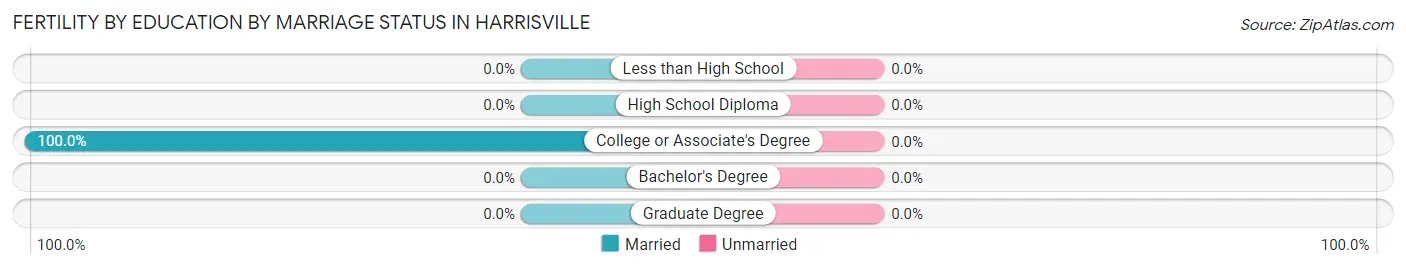
| Educational Attainment | Married | Unmarried |
| Less than High School | 0 (0.0%) | 0 (0.0%) |
| High School Diploma | 0 (0.0%) | 0 (0.0%) |
| College or Associate's Degree | 4 (100.0%) | 0 (0.0%) |
| Bachelor's Degree | 0 (0.0%) | 0 (0.0%) |
| Graduate Degree | 0 (0.0%) | 0 (0.0%) |
| Total | 4 (100.0%) | 0 (0.0%) |
Employment Characteristics in Harrisville
Employment by Class of Employer in Harrisville
Among the 159 employed individuals in Harrisville, private company employees (72 | 45.3%), not-for-profit organizations (26 | 16.4%), and local government employees (19 | 11.9%) make up the most common classes of employment.
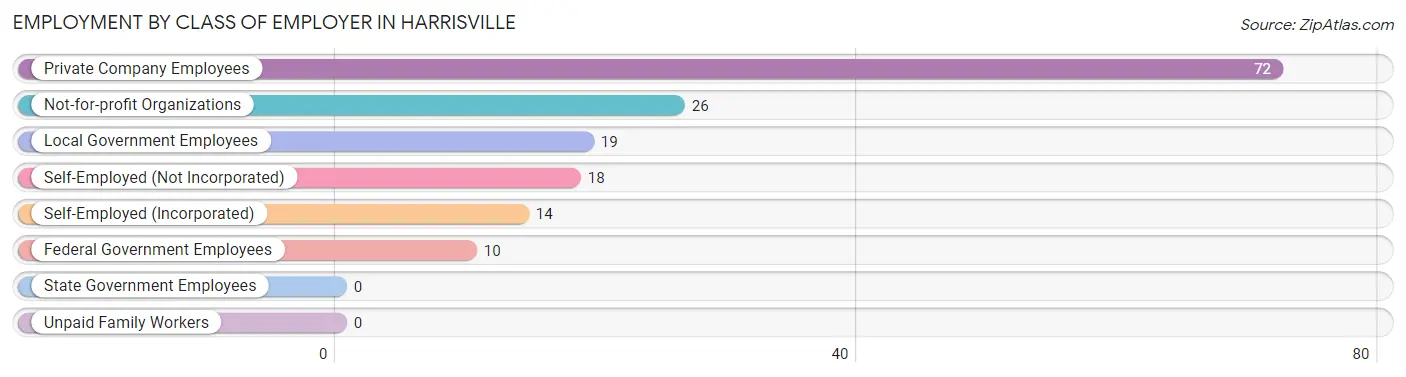
| Employer Class | # Employees | % Employees |
| Private Company Employees | 72 | 45.3% |
| Self-Employed (Incorporated) | 14 | 8.8% |
| Self-Employed (Not Incorporated) | 18 | 11.3% |
| Not-for-profit Organizations | 26 | 16.4% |
| Local Government Employees | 19 | 11.9% |
| State Government Employees | 0 | 0.0% |
| Federal Government Employees | 10 | 6.3% |
| Unpaid Family Workers | 0 | 0.0% |
| Total | 159 | 100.0% |
Employment Status by Age in Harrisville
According to the labor force statistics for Harrisville, out of the total population over 16 years of age (417), 40.8% or 170 individuals are in the labor force, with 2.9% or 5 of them unemployed. The age group with the highest labor force participation rate is 35 to 44 years, with 90.9% or 40 individuals in the labor force. Within the labor force, the 30 to 34 years age range has the highest percentage of unemployed individuals, with 15.0% or 3 of them being unemployed.
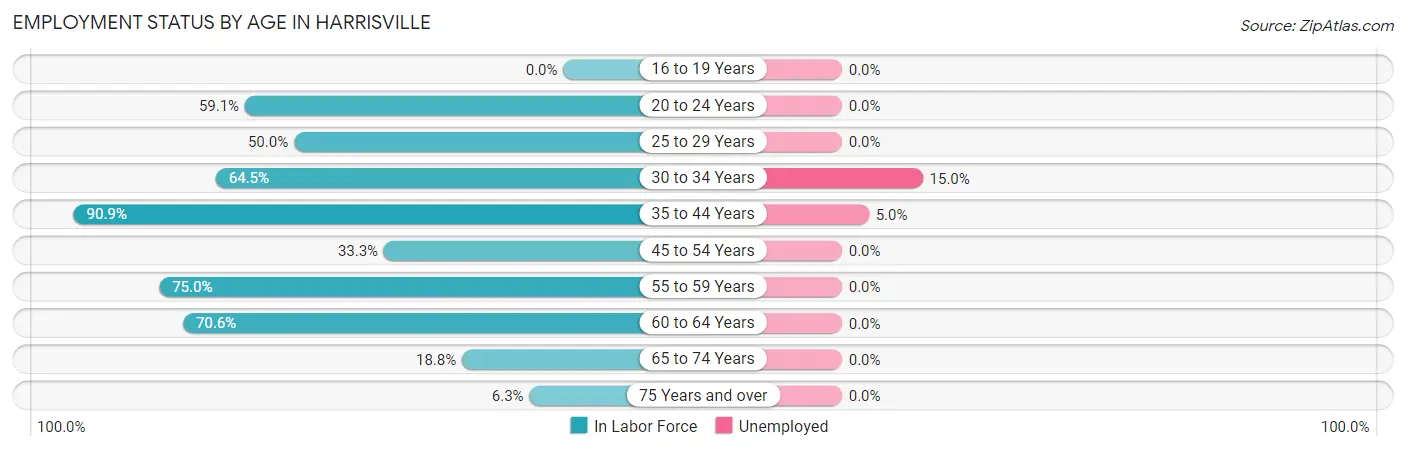
| Age Bracket | In Labor Force | Unemployed |
| 16 to 19 Years | 0 (0.0%) | 0 (0.0%) |
| 20 to 24 Years | 13 (59.1%) | 0 (0.0%) |
| 25 to 29 Years | 18 (50.0%) | 0 (0.0%) |
| 30 to 34 Years | 20 (64.5%) | 3 (15.0%) |
| 35 to 44 Years | 40 (90.9%) | 2 (5.0%) |
| 45 to 54 Years | 12 (33.3%) | 0 (0.0%) |
| 55 to 59 Years | 21 (75.0%) | 0 (0.0%) |
| 60 to 64 Years | 24 (70.6%) | 0 (0.0%) |
| 65 to 74 Years | 16 (18.8%) | 0 (0.0%) |
| 75 Years and over | 6 (6.3%) | 0 (0.0%) |
| Total | 170 (40.8%) | 5 (2.9%) |
Employment Status by Educational Attainment in Harrisville
According to labor force statistics for Harrisville, 64.6% of individuals (135) out of the total population between 25 and 64 years of age (209) are in the labor force, with 3.7% or 5 of them being unemployed. The group with the highest labor force participation rate are those with the educational attainment of bachelor's degree or higher, with 95.3% or 41 individuals in the labor force. Within the labor force, individuals with high school diploma education have the highest percentage of unemployment, with 9.7% or 3 of them being unemployed.
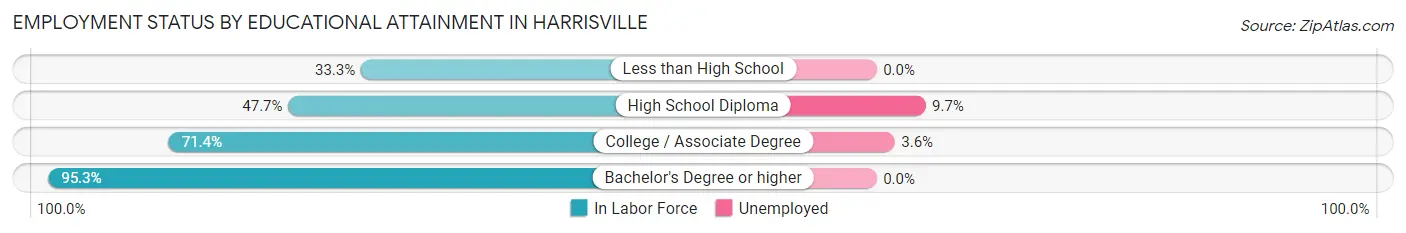
| Educational Attainment | In Labor Force | Unemployed |
| Less than High School | 8 (33.3%) | 0 (0.0%) |
| High School Diploma | 31 (47.7%) | 6 (9.7%) |
| College / Associate Degree | 55 (71.4%) | 3 (3.6%) |
| Bachelor's Degree or higher | 41 (95.3%) | 0 (0.0%) |
| Total | 135 (64.6%) | 8 (3.7%) |
Employment Occupations by Sex in Harrisville
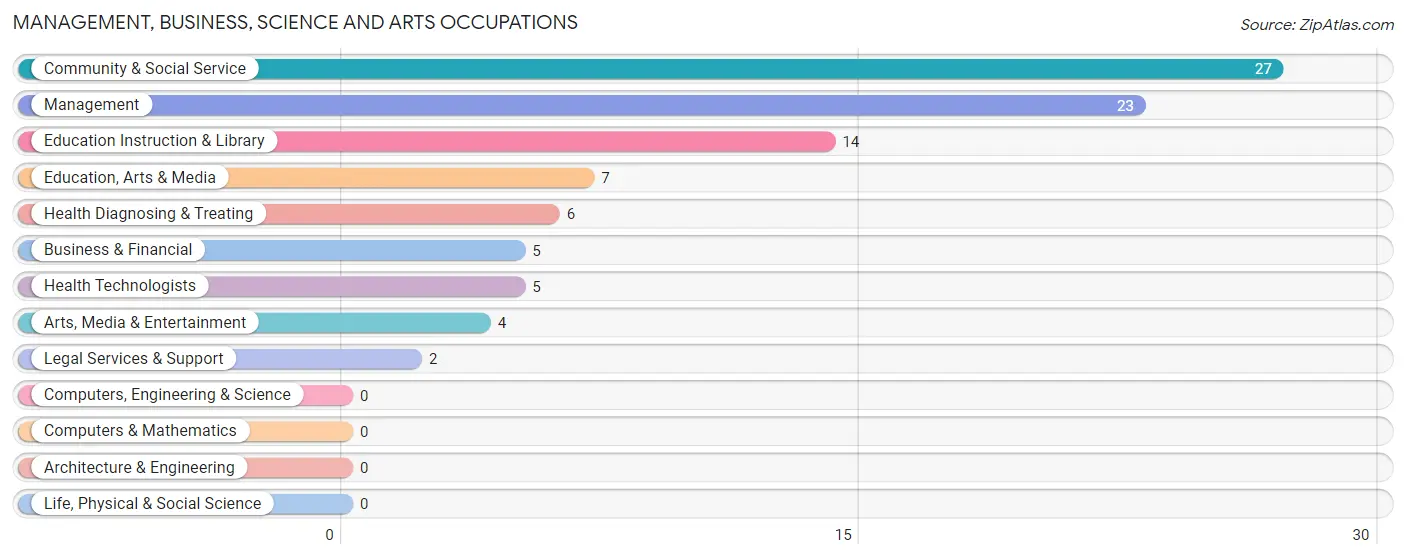
Management, Business, Science and Arts Occupations
The most common Management, Business, Science and Arts occupations in Harrisville are Community & Social Service (27 | 16.4%), Management (23 | 13.9%), Education Instruction & Library (14 | 8.5%), Education, Arts & Media (7 | 4.2%), and Health Diagnosing & Treating (6 | 3.6%).
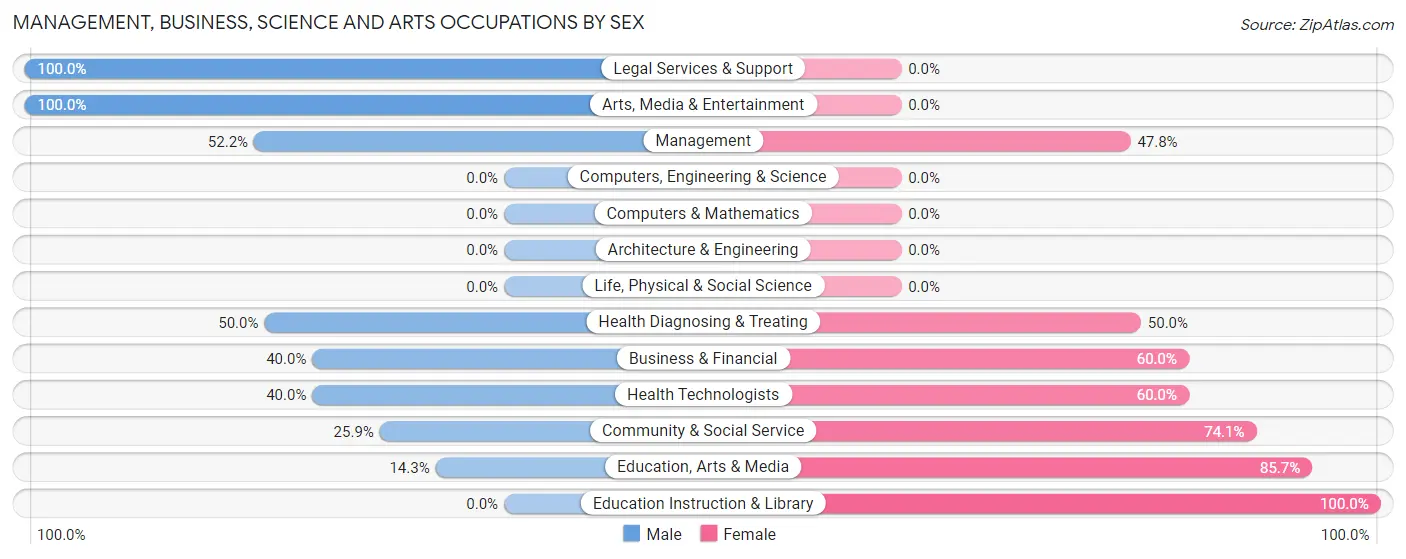
Management, Business, Science and Arts Occupations by Sex
Within the Management, Business, Science and Arts occupations in Harrisville, the most male-oriented occupations are Legal Services & Support (100.0%), Arts, Media & Entertainment (100.0%), and Management (52.2%), while the most female-oriented occupations are Education Instruction & Library (100.0%), Education, Arts & Media (85.7%), and Community & Social Service (74.1%).
| Occupation | Male | Female |
| Management | 12 (52.2%) | 11 (47.8%) |
| Business & Financial | 2 (40.0%) | 3 (60.0%) |
| Computers, Engineering & Science | 0 (0.0%) | 0 (0.0%) |
| Computers & Mathematics | 0 (0.0%) | 0 (0.0%) |
| Architecture & Engineering | 0 (0.0%) | 0 (0.0%) |
| Life, Physical & Social Science | 0 (0.0%) | 0 (0.0%) |
| Community & Social Service | 7 (25.9%) | 20 (74.1%) |
| Education, Arts & Media | 1 (14.3%) | 6 (85.7%) |
| Legal Services & Support | 2 (100.0%) | 0 (0.0%) |
| Education Instruction & Library | 0 (0.0%) | 14 (100.0%) |
| Arts, Media & Entertainment | 4 (100.0%) | 0 (0.0%) |
| Health Diagnosing & Treating | 3 (50.0%) | 3 (50.0%) |
| Health Technologists | 2 (40.0%) | 3 (60.0%) |
| Total (Category) | 24 (39.3%) | 37 (60.7%) |
| Total (Overall) | 68 (41.2%) | 97 (58.8%) |
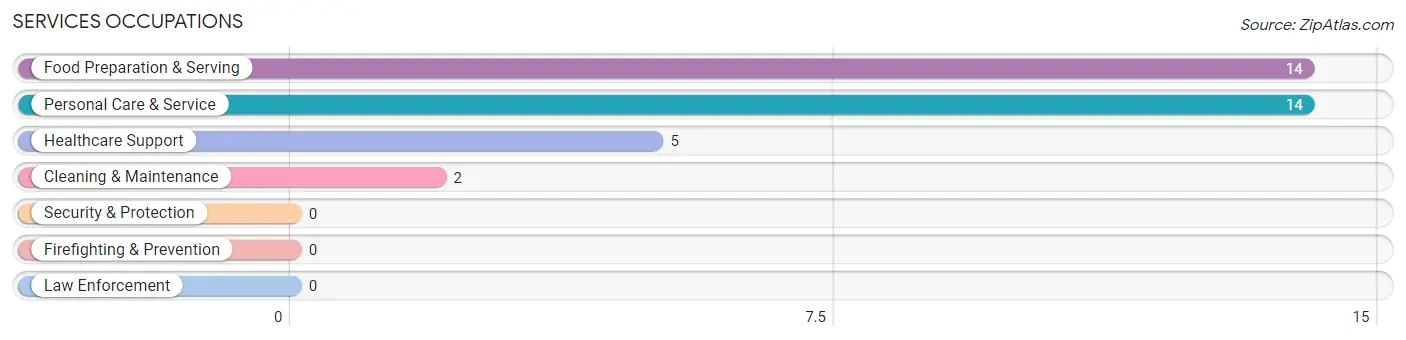
Services Occupations
The most common Services occupations in Harrisville are Food Preparation & Serving (14 | 8.5%), Personal Care & Service (14 | 8.5%), Healthcare Support (5 | 3.0%), and Cleaning & Maintenance (2 | 1.2%).
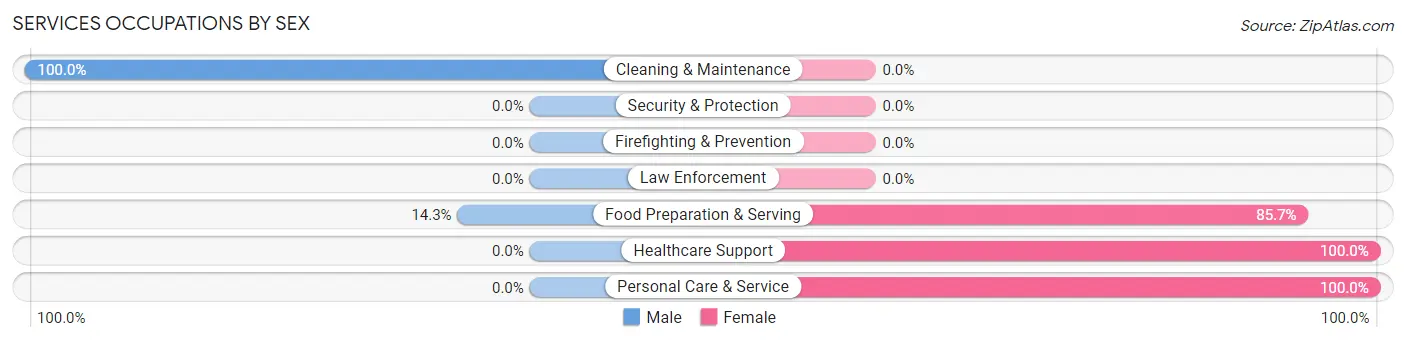
Services Occupations by Sex
Within the Services occupations in Harrisville, the most male-oriented occupations are Cleaning & Maintenance (100.0%), and Food Preparation & Serving (14.3%), while the most female-oriented occupations are Healthcare Support (100.0%), Personal Care & Service (100.0%), and Food Preparation & Serving (85.7%).
| Occupation | Male | Female |
| Healthcare Support | 0 (0.0%) | 5 (100.0%) |
| Security & Protection | 0 (0.0%) | 0 (0.0%) |
| Firefighting & Prevention | 0 (0.0%) | 0 (0.0%) |
| Law Enforcement | 0 (0.0%) | 0 (0.0%) |
| Food Preparation & Serving | 2 (14.3%) | 12 (85.7%) |
| Cleaning & Maintenance | 2 (100.0%) | 0 (0.0%) |
| Personal Care & Service | 0 (0.0%) | 14 (100.0%) |
| Total (Category) | 4 (11.4%) | 31 (88.6%) |
| Total (Overall) | 68 (41.2%) | 97 (58.8%) |
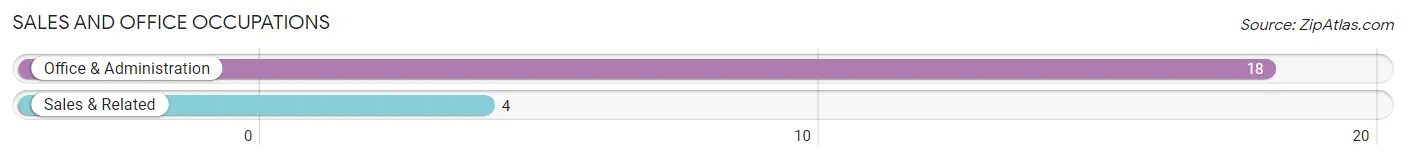
Sales and Office Occupations
The most common Sales and Office occupations in Harrisville are Office & Administration (18 | 10.9%), and Sales & Related (4 | 2.4%).
Sales and Office Occupations by Sex
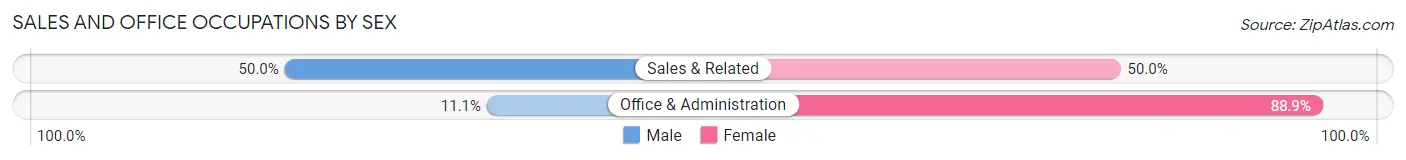
| Occupation | Male | Female |
| Sales & Related | 2 (50.0%) | 2 (50.0%) |
| Office & Administration | 2 (11.1%) | 16 (88.9%) |
| Total (Category) | 4 (18.2%) | 18 (81.8%) |
| Total (Overall) | 68 (41.2%) | 97 (58.8%) |
Natural Resources, Construction and Maintenance Occupations
The most common Natural Resources, Construction and Maintenance occupations in Harrisville are Construction & Extraction (21 | 12.7%), and Installation, Maintenance & Repair (6 | 3.6%).

Natural Resources, Construction and Maintenance Occupations by Sex
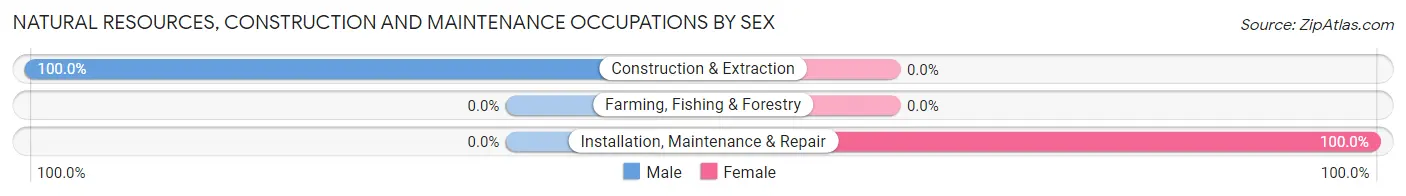
| Occupation | Male | Female |
| Farming, Fishing & Forestry | 0 (0.0%) | 0 (0.0%) |
| Construction & Extraction | 21 (100.0%) | 0 (0.0%) |
| Installation, Maintenance & Repair | 0 (0.0%) | 6 (100.0%) |
| Total (Category) | 21 (77.8%) | 6 (22.2%) |
| Total (Overall) | 68 (41.2%) | 97 (58.8%) |
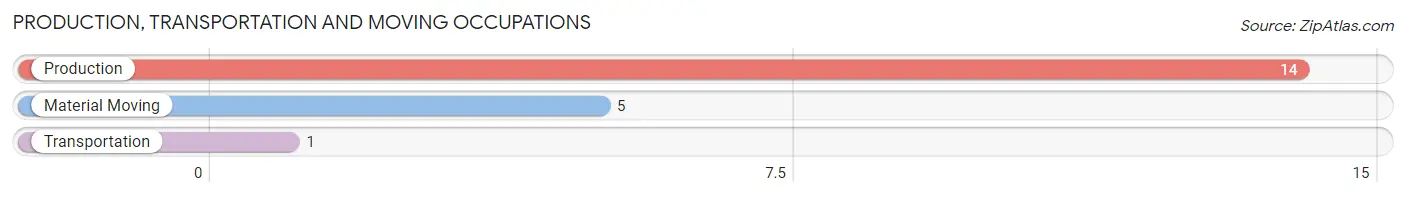
Production, Transportation and Moving Occupations
The most common Production, Transportation and Moving occupations in Harrisville are Production (14 | 8.5%), Material Moving (5 | 3.0%), and Transportation (1 | 0.6%).
Production, Transportation and Moving Occupations by Sex
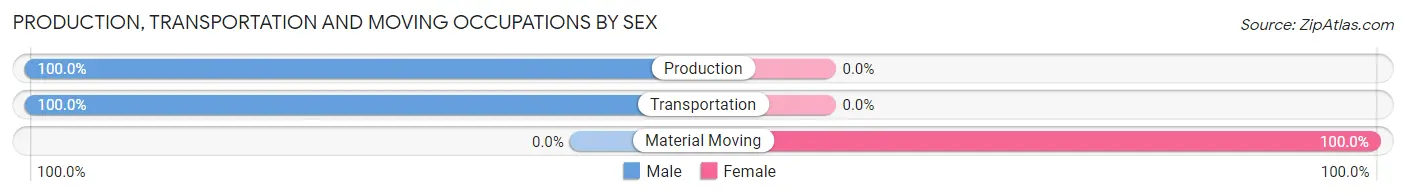
| Occupation | Male | Female |
| Production | 14 (100.0%) | 0 (0.0%) |
| Transportation | 1 (100.0%) | 0 (0.0%) |
| Material Moving | 0 (0.0%) | 5 (100.0%) |
| Total (Category) | 15 (75.0%) | 5 (25.0%) |
| Total (Overall) | 68 (41.2%) | 97 (58.8%) |
Employment Industries by Sex in Harrisville
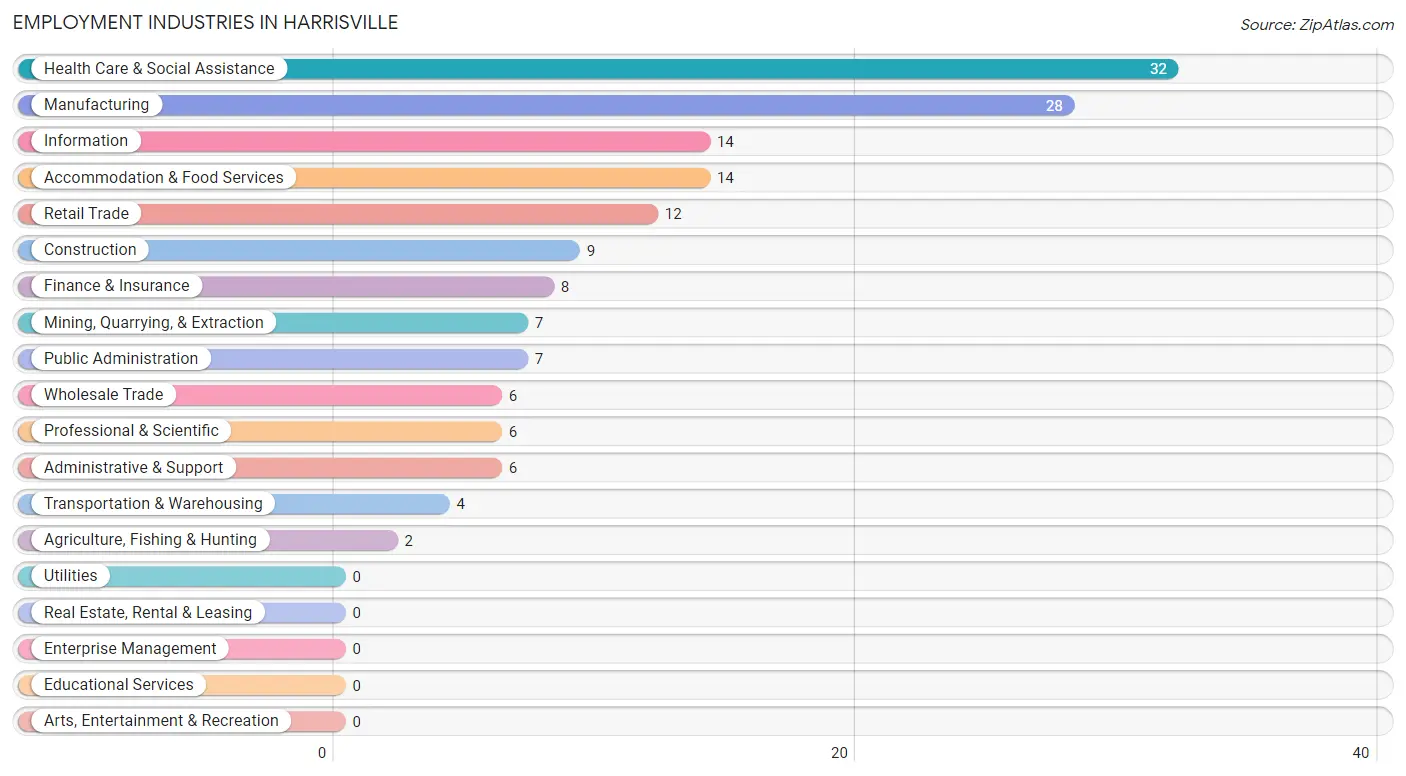
Employment Industries in Harrisville
The major employment industries in Harrisville include Health Care & Social Assistance (32 | 19.4%), Manufacturing (28 | 17.0%), Information (14 | 8.5%), Accommodation & Food Services (14 | 8.5%), and Retail Trade (12 | 7.3%).
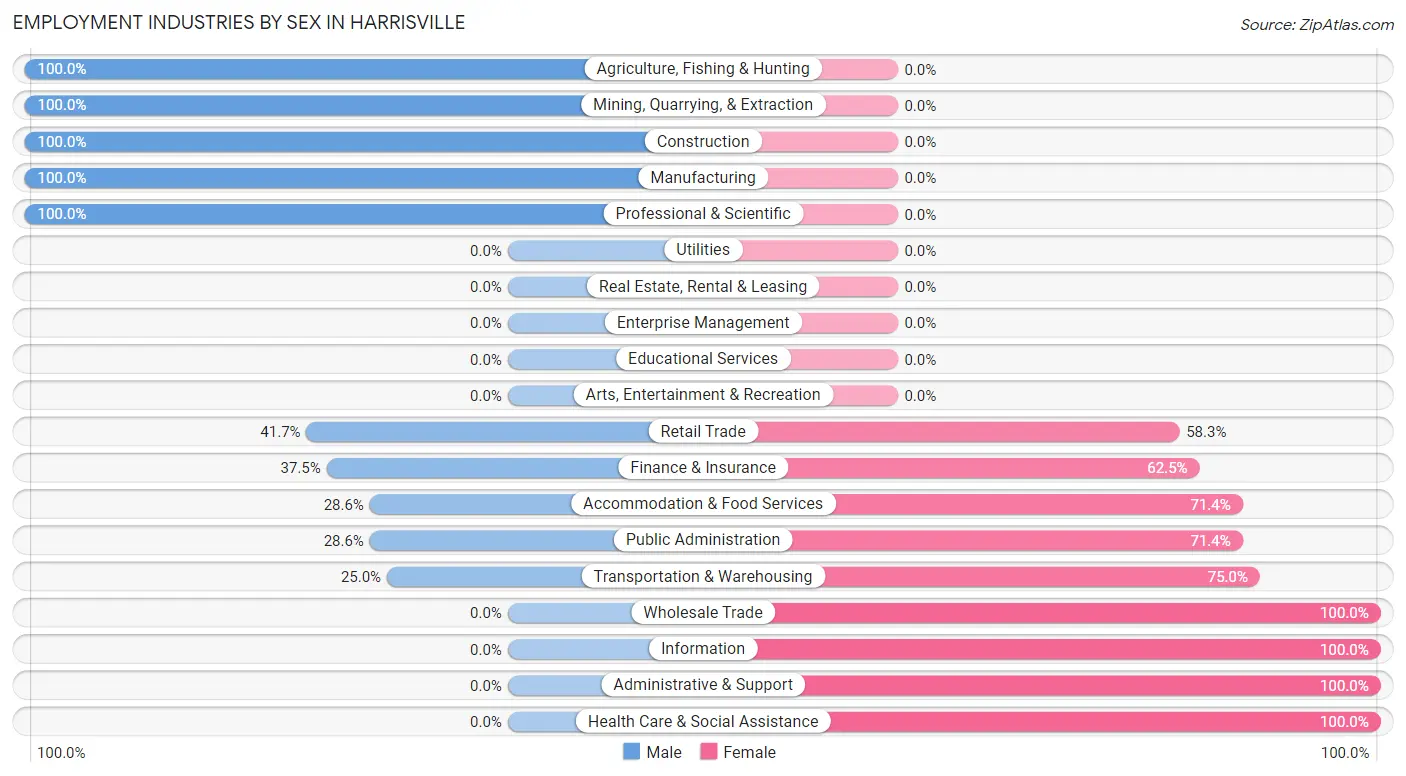
Employment Industries by Sex in Harrisville
The Harrisville industries that see more men than women are Agriculture, Fishing & Hunting (100.0%), Mining, Quarrying, & Extraction (100.0%), and Construction (100.0%), whereas the industries that tend to have a higher number of women are Wholesale Trade (100.0%), Information (100.0%), and Administrative & Support (100.0%).
| Industry | Male | Female |
| Agriculture, Fishing & Hunting | 2 (100.0%) | 0 (0.0%) |
| Mining, Quarrying, & Extraction | 7 (100.0%) | 0 (0.0%) |
| Construction | 9 (100.0%) | 0 (0.0%) |
| Manufacturing | 28 (100.0%) | 0 (0.0%) |
| Wholesale Trade | 0 (0.0%) | 6 (100.0%) |
| Retail Trade | 5 (41.7%) | 7 (58.3%) |
| Transportation & Warehousing | 1 (25.0%) | 3 (75.0%) |
| Utilities | 0 (0.0%) | 0 (0.0%) |
| Information | 0 (0.0%) | 14 (100.0%) |
| Finance & Insurance | 3 (37.5%) | 5 (62.5%) |
| Real Estate, Rental & Leasing | 0 (0.0%) | 0 (0.0%) |
| Professional & Scientific | 6 (100.0%) | 0 (0.0%) |
| Enterprise Management | 0 (0.0%) | 0 (0.0%) |
| Administrative & Support | 0 (0.0%) | 6 (100.0%) |
| Educational Services | 0 (0.0%) | 0 (0.0%) |
| Health Care & Social Assistance | 0 (0.0%) | 32 (100.0%) |
| Arts, Entertainment & Recreation | 0 (0.0%) | 0 (0.0%) |
| Accommodation & Food Services | 4 (28.6%) | 10 (71.4%) |
| Public Administration | 2 (28.6%) | 5 (71.4%) |
| Total | 68 (41.2%) | 97 (58.8%) |
Education in Harrisville
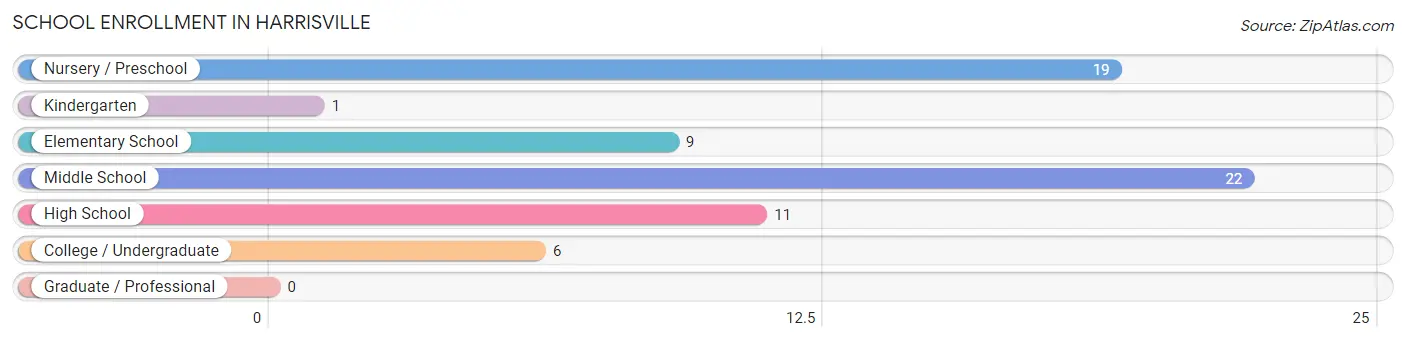
School Enrollment in Harrisville
The most common levels of schooling among the 68 students in Harrisville are middle school (22 | 32.4%), nursery / preschool (19 | 27.9%), and high school (11 | 16.2%).
| School Level | # Students | % Students |
| Nursery / Preschool | 19 | 27.9% |
| Kindergarten | 1 | 1.5% |
| Elementary School | 9 | 13.2% |
| Middle School | 22 | 32.4% |
| High School | 11 | 16.2% |
| College / Undergraduate | 6 | 8.8% |
| Graduate / Professional | 0 | 0.0% |
| Total | 68 | 100.0% |
School Enrollment by Age by Funding Source in Harrisville
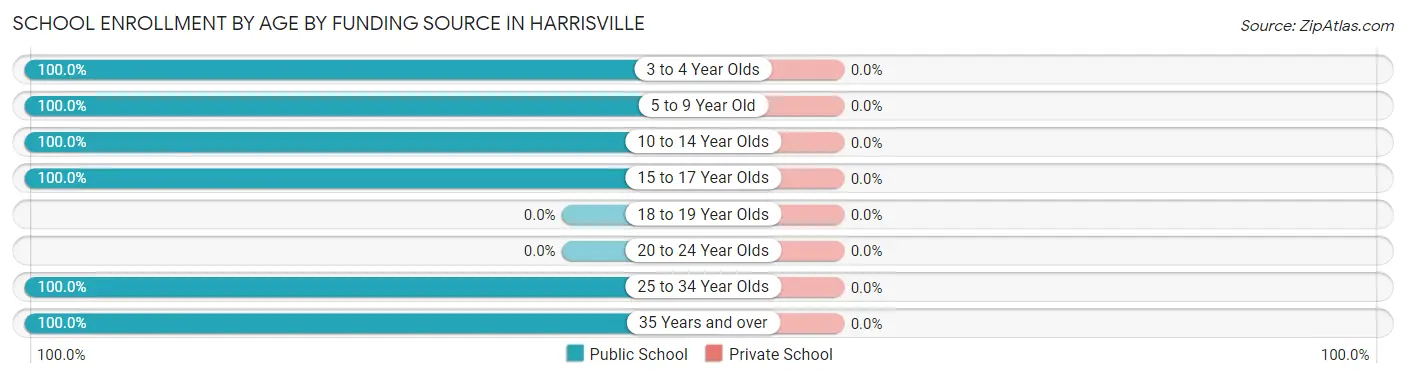
| Age Bracket | Public School | Private School |
| 3 to 4 Year Olds | 8 (100.0%) | 0 (0.0%) |
| 5 to 9 Year Old | 21 (100.0%) | 0 (0.0%) |
| 10 to 14 Year Olds | 28 (100.0%) | 0 (0.0%) |
| 15 to 17 Year Olds | 5 (100.0%) | 0 (0.0%) |
| 18 to 19 Year Olds | 0 (0.0%) | 0 (0.0%) |
| 20 to 24 Year Olds | 0 (0.0%) | 0 (0.0%) |
| 25 to 34 Year Olds | 5 (100.0%) | 0 (0.0%) |
| 35 Years and over | 1 (100.0%) | 0 (0.0%) |
| Total | 68 (100.0%) | 0 (0.0%) |
Educational Attainment by Field of Study in Harrisville
Social sciences (27 | 26.7%), communications (16 | 15.8%), science & technology (13 | 12.9%), education (11 | 10.9%), and literature & languages (8 | 7.9%) are the most common fields of study among 101 individuals in Harrisville who have obtained a bachelor's degree or higher.
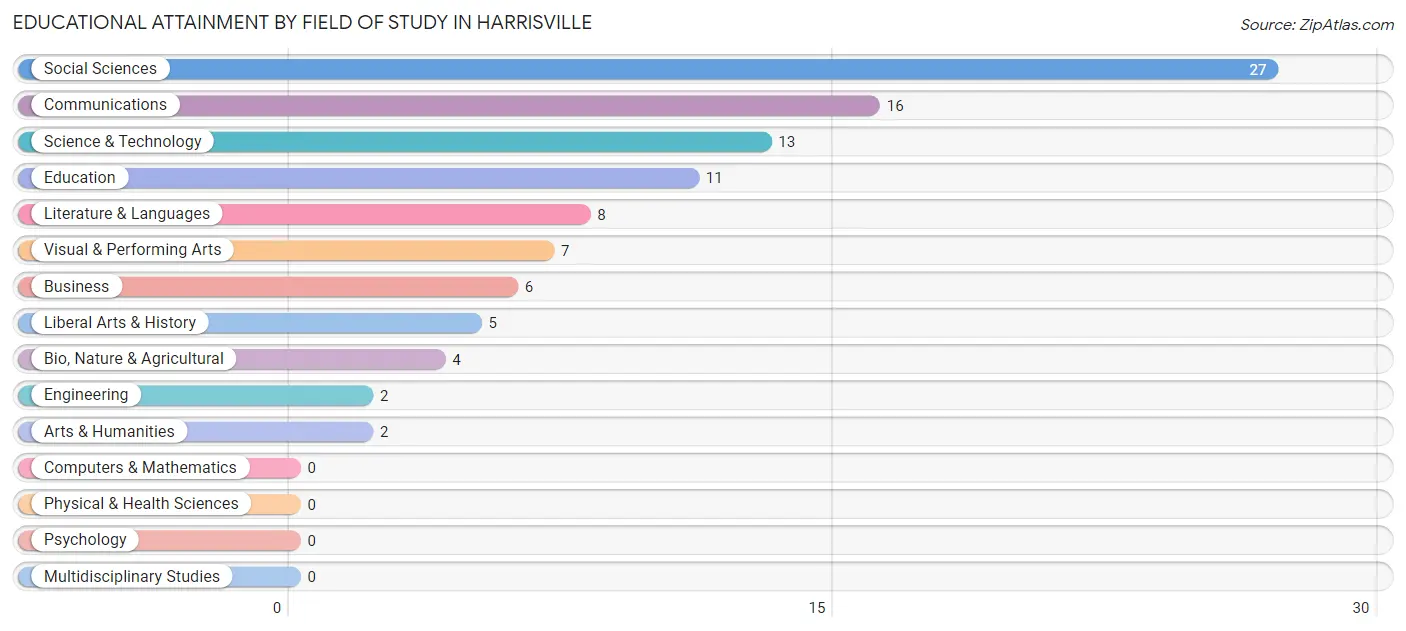
| Field of Study | # Graduates | % Graduates |
| Computers & Mathematics | 0 | 0.0% |
| Bio, Nature & Agricultural | 4 | 4.0% |
| Physical & Health Sciences | 0 | 0.0% |
| Psychology | 0 | 0.0% |
| Social Sciences | 27 | 26.7% |
| Engineering | 2 | 2.0% |
| Multidisciplinary Studies | 0 | 0.0% |
| Science & Technology | 13 | 12.9% |
| Business | 6 | 5.9% |
| Education | 11 | 10.9% |
| Literature & Languages | 8 | 7.9% |
| Liberal Arts & History | 5 | 5.0% |
| Visual & Performing Arts | 7 | 6.9% |
| Communications | 16 | 15.8% |
| Arts & Humanities | 2 | 2.0% |
| Total | 101 | 100.0% |
Transportation & Commute in Harrisville
Vehicle Availability by Sex in Harrisville
The most prevalent vehicle ownership categories in Harrisville are males with 2 vehicles (33, accounting for 49.2%) and females with 2 vehicles (19, making up 36.3%).
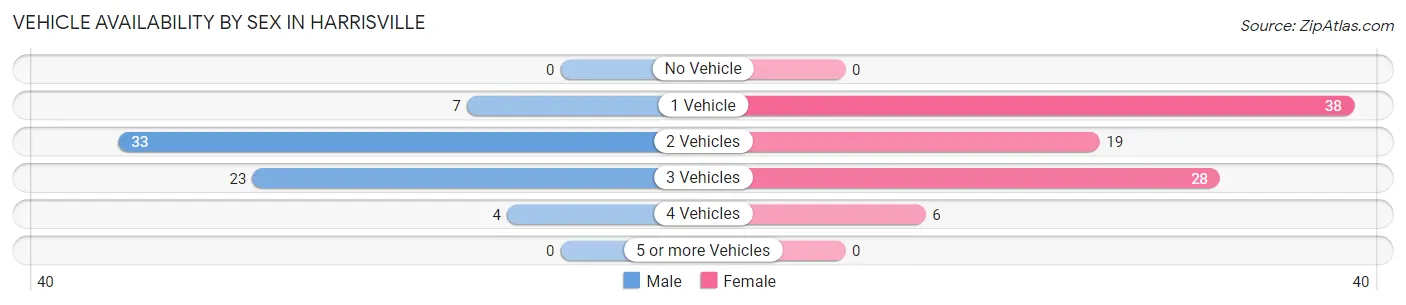
| Vehicles Available | Male | Female |
| No Vehicle | 0 (0.0%) | 0 (0.0%) |
| 1 Vehicle | 7 (10.4%) | 38 (41.8%) |
| 2 Vehicles | 33 (49.2%) | 19 (20.9%) |
| 3 Vehicles | 23 (34.3%) | 28 (30.8%) |
| 4 Vehicles | 4 (6.0%) | 6 (6.6%) |
| 5 or more Vehicles | 0 (0.0%) | 0 (0.0%) |
| Total | 67 (100.0%) | 91 (100.0%) |
Commute Time in Harrisville
The most frequently occuring commute durations in Harrisville are 5 to 9 minutes (26 commuters, 19.7%), less than 5 minutes (17 commuters, 12.9%), and 10 to 14 minutes (14 commuters, 10.6%).
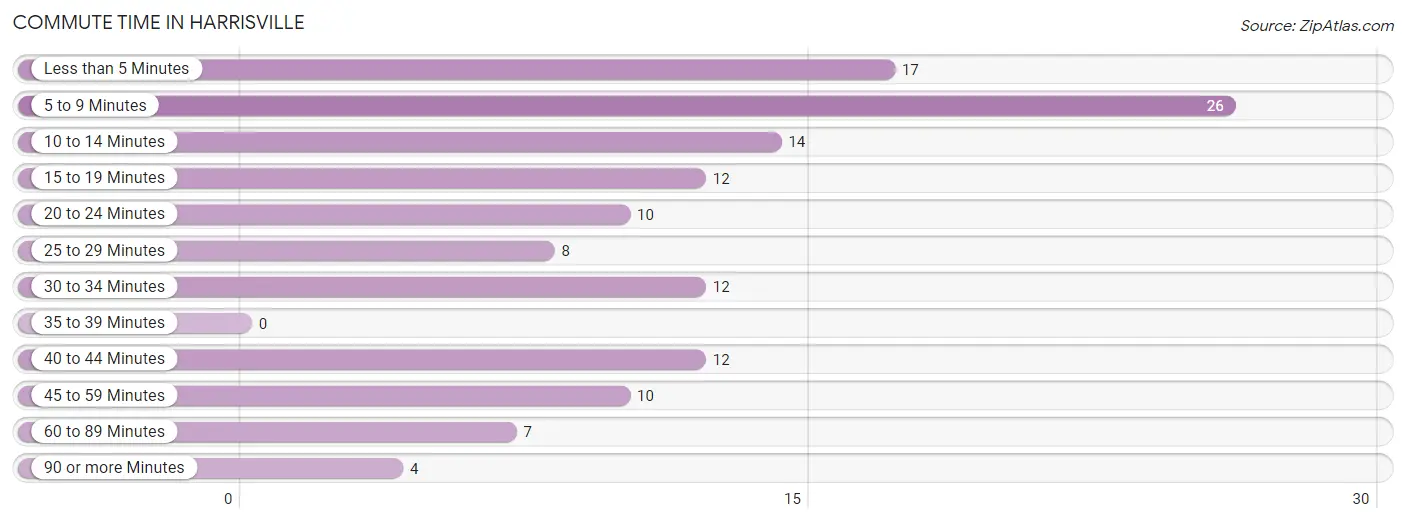
| Commute Time | # Commuters | % Commuters |
| Less than 5 Minutes | 17 | 12.9% |
| 5 to 9 Minutes | 26 | 19.7% |
| 10 to 14 Minutes | 14 | 10.6% |
| 15 to 19 Minutes | 12 | 9.1% |
| 20 to 24 Minutes | 10 | 7.6% |
| 25 to 29 Minutes | 8 | 6.1% |
| 30 to 34 Minutes | 12 | 9.1% |
| 35 to 39 Minutes | 0 | 0.0% |
| 40 to 44 Minutes | 12 | 9.1% |
| 45 to 59 Minutes | 10 | 7.6% |
| 60 to 89 Minutes | 7 | 5.3% |
| 90 or more Minutes | 4 | 3.0% |
Commute Time by Sex in Harrisville
The most common commute times in Harrisville are 5 to 9 minutes (14 commuters, 22.6%) for males and less than 5 minutes (17 commuters, 24.3%) for females.
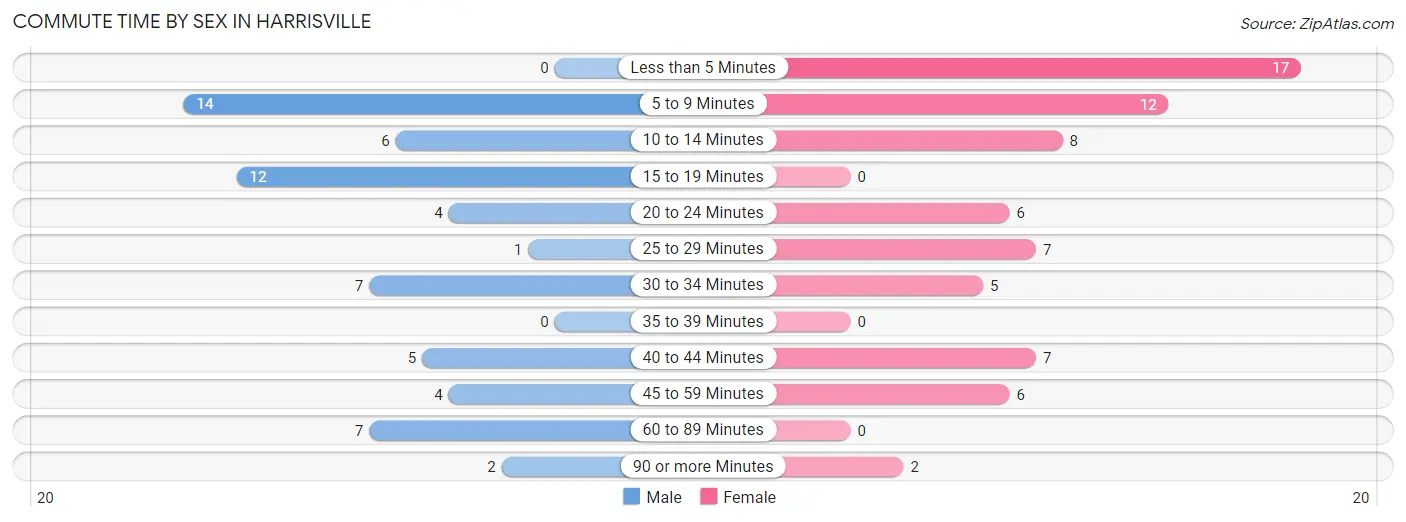
| Commute Time | Male | Female |
| Less than 5 Minutes | 0 (0.0%) | 17 (24.3%) |
| 5 to 9 Minutes | 14 (22.6%) | 12 (17.1%) |
| 10 to 14 Minutes | 6 (9.7%) | 8 (11.4%) |
| 15 to 19 Minutes | 12 (19.4%) | 0 (0.0%) |
| 20 to 24 Minutes | 4 (6.5%) | 6 (8.6%) |
| 25 to 29 Minutes | 1 (1.6%) | 7 (10.0%) |
| 30 to 34 Minutes | 7 (11.3%) | 5 (7.1%) |
| 35 to 39 Minutes | 0 (0.0%) | 0 (0.0%) |
| 40 to 44 Minutes | 5 (8.1%) | 7 (10.0%) |
| 45 to 59 Minutes | 4 (6.5%) | 6 (8.6%) |
| 60 to 89 Minutes | 7 (11.3%) | 0 (0.0%) |
| 90 or more Minutes | 2 (3.2%) | 2 (2.9%) |
Time of Departure to Work by Sex in Harrisville
The most frequent times of departure to work in Harrisville are 7:30 AM to 7:59 AM (16, 25.8%) for males and 9:00 AM to 9:59 AM (25, 35.7%) for females.
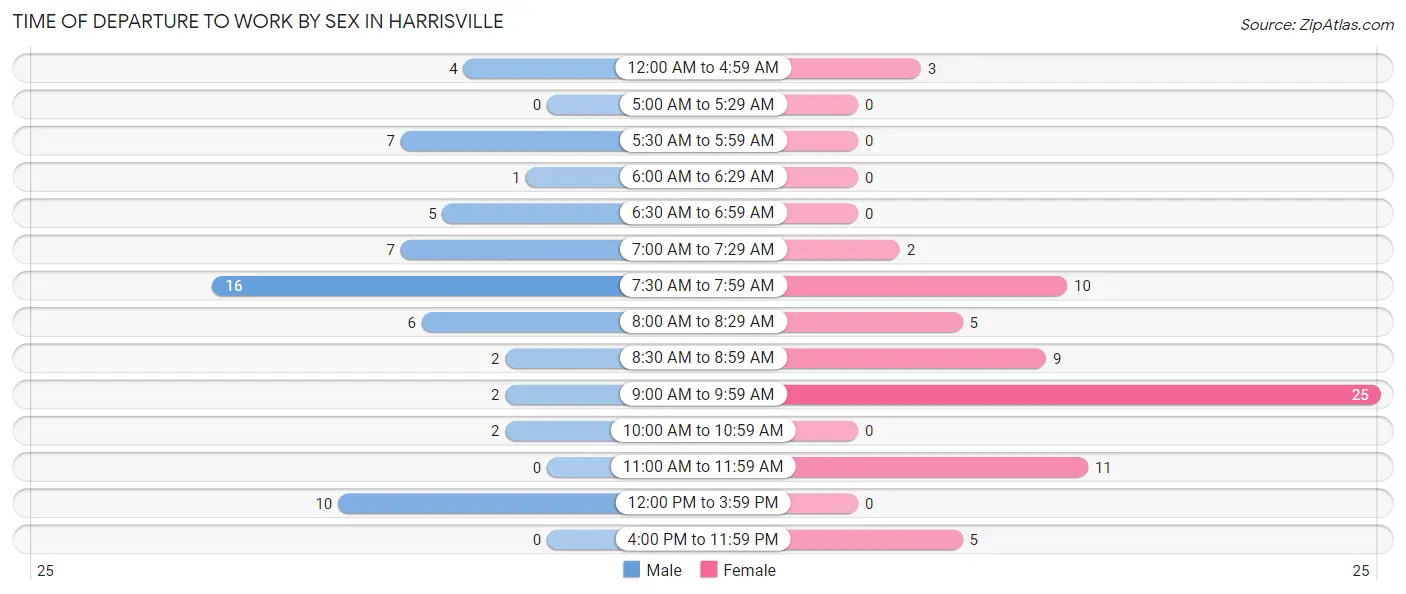
| Time of Departure | Male | Female |
| 12:00 AM to 4:59 AM | 4 (6.5%) | 3 (4.3%) |
| 5:00 AM to 5:29 AM | 0 (0.0%) | 0 (0.0%) |
| 5:30 AM to 5:59 AM | 7 (11.3%) | 0 (0.0%) |
| 6:00 AM to 6:29 AM | 1 (1.6%) | 0 (0.0%) |
| 6:30 AM to 6:59 AM | 5 (8.1%) | 0 (0.0%) |
| 7:00 AM to 7:29 AM | 7 (11.3%) | 2 (2.9%) |
| 7:30 AM to 7:59 AM | 16 (25.8%) | 10 (14.3%) |
| 8:00 AM to 8:29 AM | 6 (9.7%) | 5 (7.1%) |
| 8:30 AM to 8:59 AM | 2 (3.2%) | 9 (12.9%) |
| 9:00 AM to 9:59 AM | 2 (3.2%) | 25 (35.7%) |
| 10:00 AM to 10:59 AM | 2 (3.2%) | 0 (0.0%) |
| 11:00 AM to 11:59 AM | 0 (0.0%) | 11 (15.7%) |
| 12:00 PM to 3:59 PM | 10 (16.1%) | 0 (0.0%) |
| 4:00 PM to 11:59 PM | 0 (0.0%) | 5 (7.1%) |
| Total | 62 (100.0%) | 70 (100.0%) |
Housing Occupancy in Harrisville
Occupancy by Ownership in Harrisville
Of the total 225 dwellings in Harrisville, owner-occupied units account for 166 (73.8%), while renter-occupied units make up 59 (26.2%).
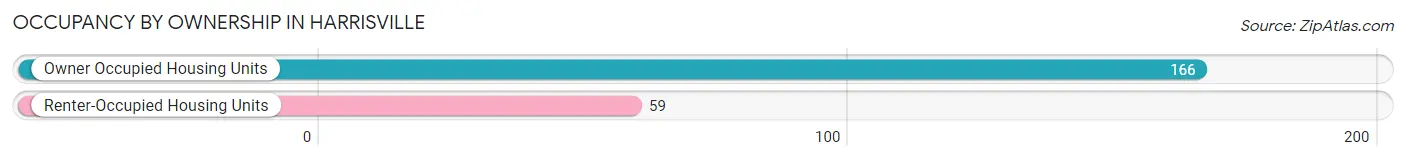
| Occupancy | # Housing Units | % Housing Units |
| Owner Occupied Housing Units | 166 | 73.8% |
| Renter-Occupied Housing Units | 59 | 26.2% |
| Total Occupied Housing Units | 225 | 100.0% |
Occupancy by Household Size in Harrisville
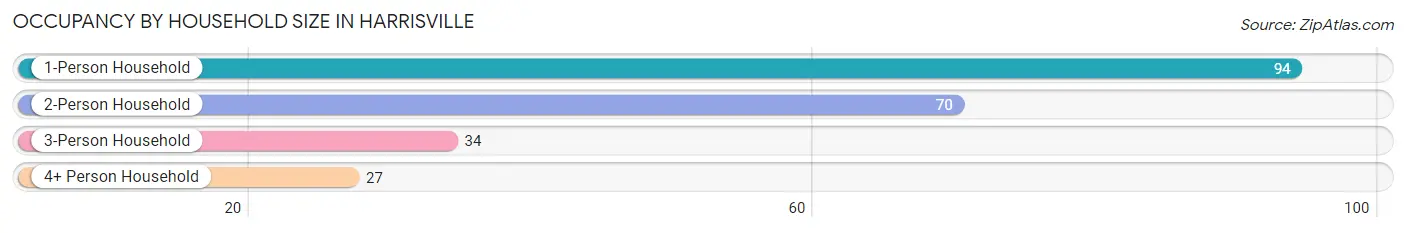
| Household Size | # Housing Units | % Housing Units |
| 1-Person Household | 94 | 41.8% |
| 2-Person Household | 70 | 31.1% |
| 3-Person Household | 34 | 15.1% |
| 4+ Person Household | 27 | 12.0% |
| Total Housing Units | 225 | 100.0% |
Occupancy by Ownership by Household Size in Harrisville
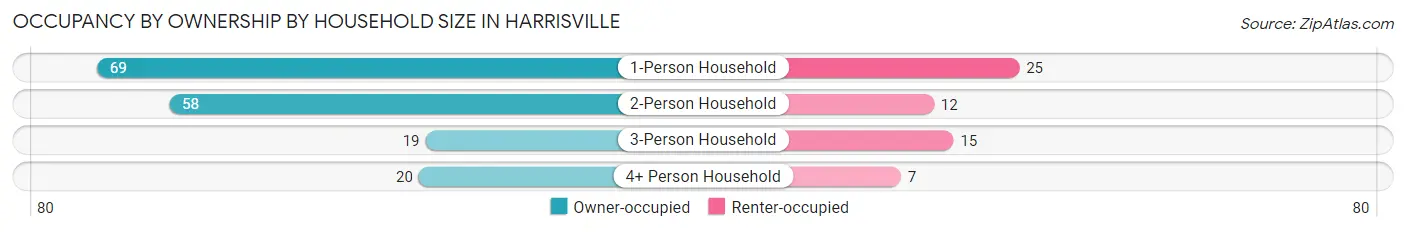
| Household Size | Owner-occupied | Renter-occupied |
| 1-Person Household | 69 (73.4%) | 25 (26.6%) |
| 2-Person Household | 58 (82.9%) | 12 (17.1%) |
| 3-Person Household | 19 (55.9%) | 15 (44.1%) |
| 4+ Person Household | 20 (74.1%) | 7 (25.9%) |
| Total Housing Units | 166 (73.8%) | 59 (26.2%) |
Occupancy by Educational Attainment in Harrisville
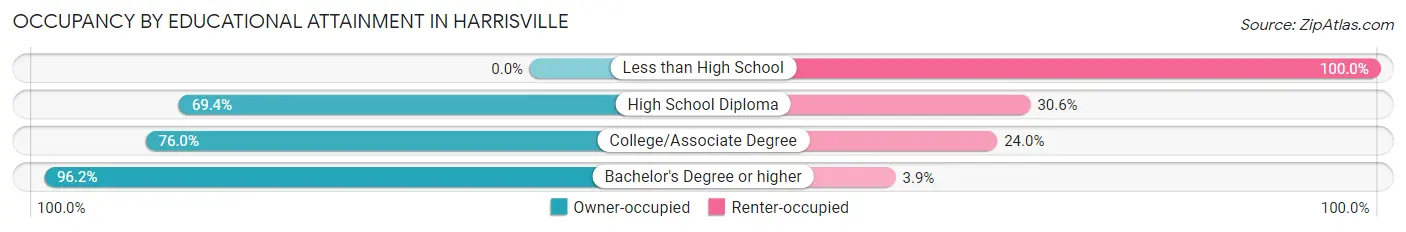
| Household Size | Owner-occupied | Renter-occupied |
| Less than High School | 0 (0.0%) | 13 (100.0%) |
| High School Diploma | 59 (69.4%) | 26 (30.6%) |
| College/Associate Degree | 57 (76.0%) | 18 (24.0%) |
| Bachelor's Degree or higher | 50 (96.2%) | 2 (3.8%) |
Occupancy by Age of Householder in Harrisville
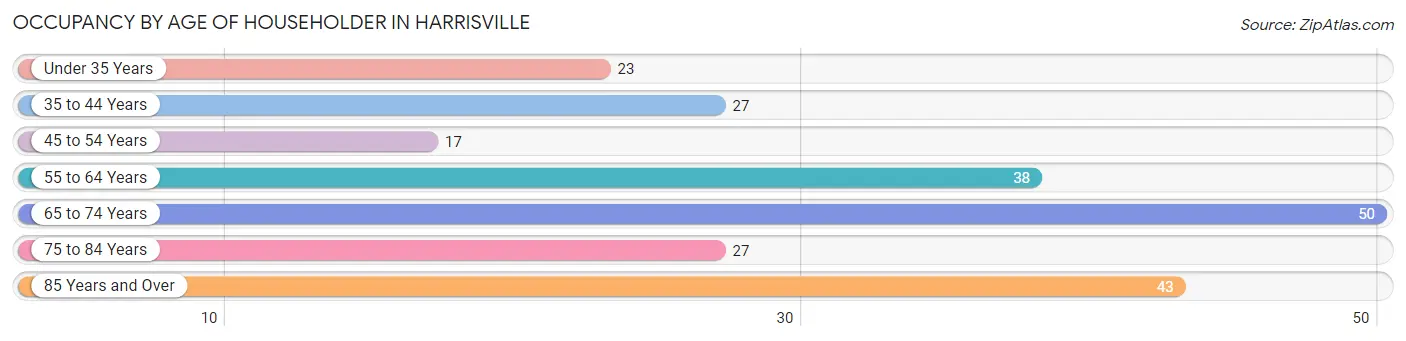
| Age Bracket | # Households | % Households |
| Under 35 Years | 23 | 10.2% |
| 35 to 44 Years | 27 | 12.0% |
| 45 to 54 Years | 17 | 7.6% |
| 55 to 64 Years | 38 | 16.9% |
| 65 to 74 Years | 50 | 22.2% |
| 75 to 84 Years | 27 | 12.0% |
| 85 Years and Over | 43 | 19.1% |
| Total | 225 | 100.0% |
Housing Finances in Harrisville
Median Income by Occupancy in Harrisville
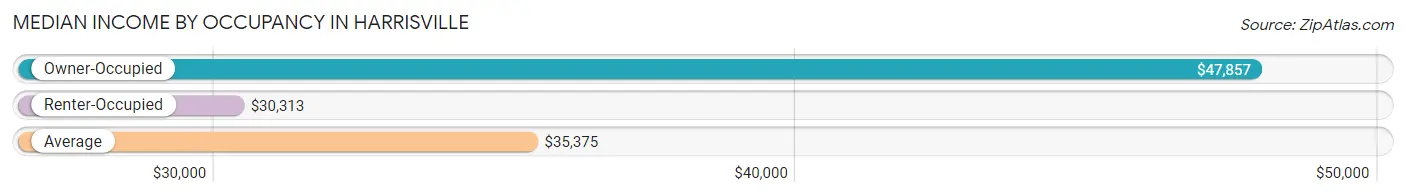
| Occupancy Type | # Households | Median Income |
| Owner-Occupied | 166 (73.8%) | $47,857 |
| Renter-Occupied | 59 (26.2%) | $30,313 |
| Average | 225 (100.0%) | $35,375 |
Occupancy by Householder Income Bracket in Harrisville
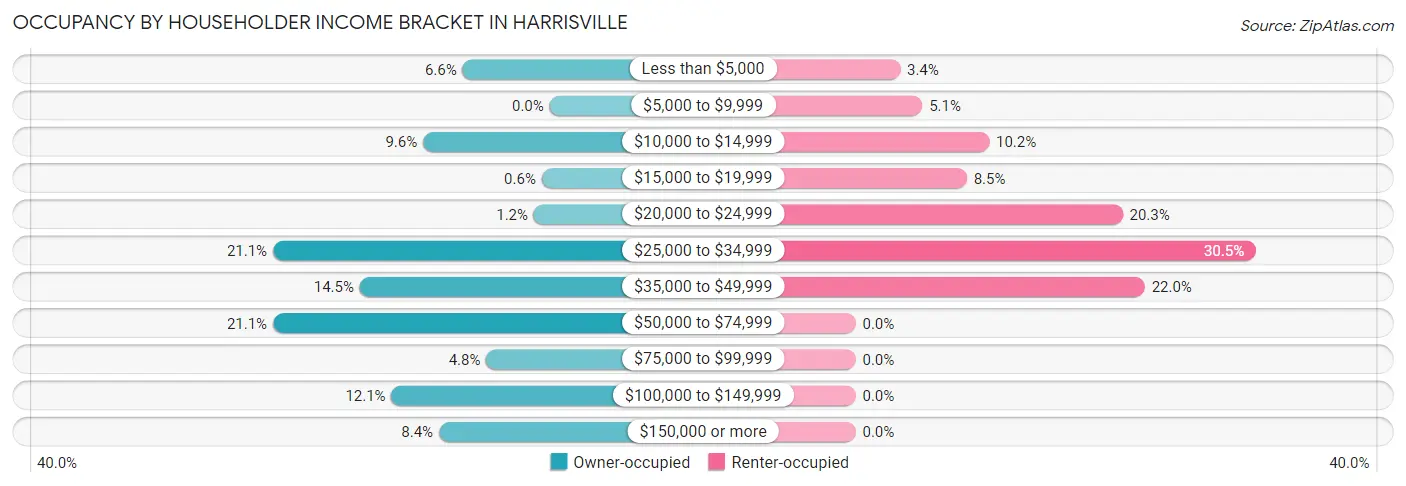
| Income Bracket | Owner-occupied | Renter-occupied |
| Less than $5,000 | 11 (6.6%) | 2 (3.4%) |
| $5,000 to $9,999 | 0 (0.0%) | 3 (5.1%) |
| $10,000 to $14,999 | 16 (9.6%) | 6 (10.2%) |
| $15,000 to $19,999 | 1 (0.6%) | 5 (8.5%) |
| $20,000 to $24,999 | 2 (1.2%) | 12 (20.3%) |
| $25,000 to $34,999 | 35 (21.1%) | 18 (30.5%) |
| $35,000 to $49,999 | 24 (14.5%) | 13 (22.0%) |
| $50,000 to $74,999 | 35 (21.1%) | 0 (0.0%) |
| $75,000 to $99,999 | 8 (4.8%) | 0 (0.0%) |
| $100,000 to $149,999 | 20 (12.0%) | 0 (0.0%) |
| $150,000 or more | 14 (8.4%) | 0 (0.0%) |
| Total | 166 (100.0%) | 59 (100.0%) |
Monthly Housing Cost Tiers in Harrisville
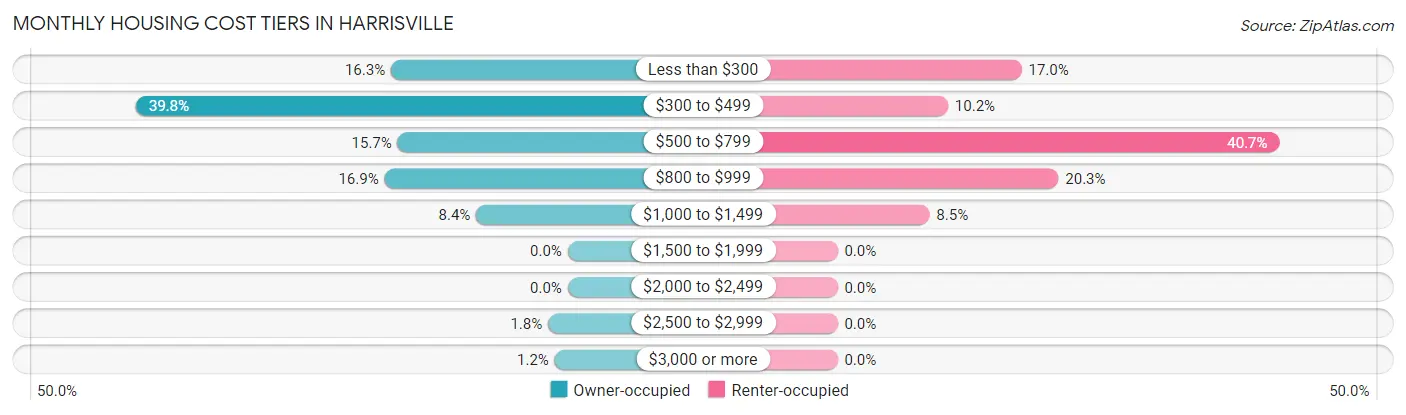
| Monthly Cost | Owner-occupied | Renter-occupied |
| Less than $300 | 27 (16.3%) | 10 (17.0%) |
| $300 to $499 | 66 (39.8%) | 6 (10.2%) |
| $500 to $799 | 26 (15.7%) | 24 (40.7%) |
| $800 to $999 | 28 (16.9%) | 12 (20.3%) |
| $1,000 to $1,499 | 14 (8.4%) | 5 (8.5%) |
| $1,500 to $1,999 | 0 (0.0%) | 0 (0.0%) |
| $2,000 to $2,499 | 0 (0.0%) | 0 (0.0%) |
| $2,500 to $2,999 | 3 (1.8%) | 0 (0.0%) |
| $3,000 or more | 2 (1.2%) | 0 (0.0%) |
| Total | 166 (100.0%) | 59 (100.0%) |
Physical Housing Characteristics in Harrisville
Housing Structures in Harrisville
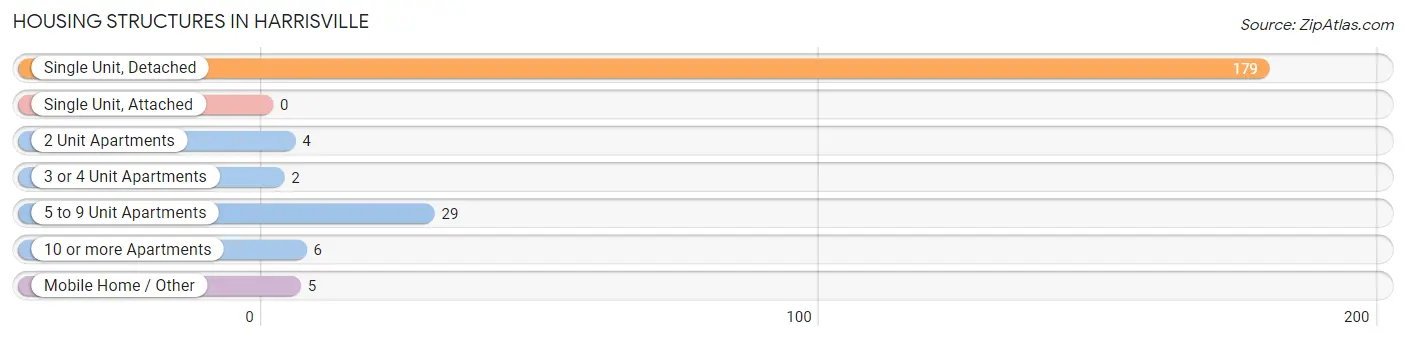
| Structure Type | # Housing Units | % Housing Units |
| Single Unit, Detached | 179 | 79.6% |
| Single Unit, Attached | 0 | 0.0% |
| 2 Unit Apartments | 4 | 1.8% |
| 3 or 4 Unit Apartments | 2 | 0.9% |
| 5 to 9 Unit Apartments | 29 | 12.9% |
| 10 or more Apartments | 6 | 2.7% |
| Mobile Home / Other | 5 | 2.2% |
| Total | 225 | 100.0% |
Housing Structures by Occupancy in Harrisville
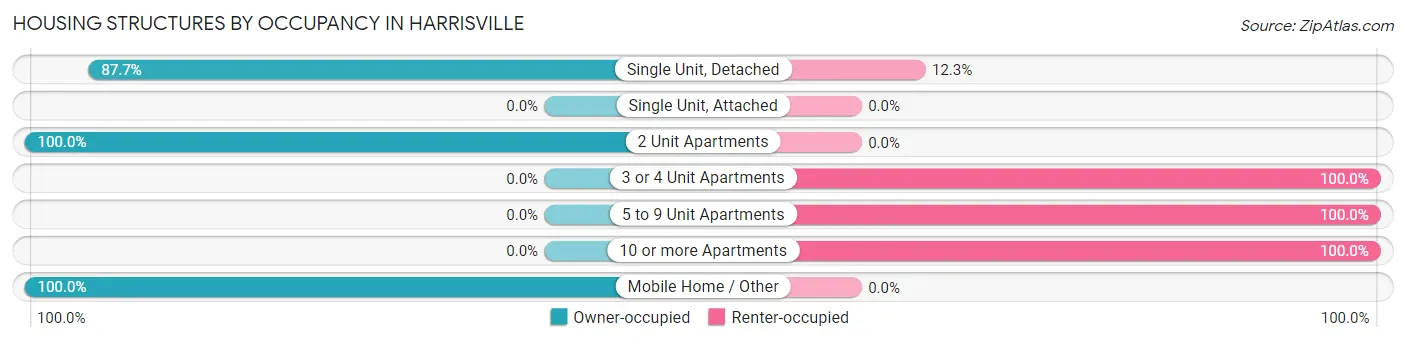
| Structure Type | Owner-occupied | Renter-occupied |
| Single Unit, Detached | 157 (87.7%) | 22 (12.3%) |
| Single Unit, Attached | 0 (0.0%) | 0 (0.0%) |
| 2 Unit Apartments | 4 (100.0%) | 0 (0.0%) |
| 3 or 4 Unit Apartments | 0 (0.0%) | 2 (100.0%) |
| 5 to 9 Unit Apartments | 0 (0.0%) | 29 (100.0%) |
| 10 or more Apartments | 0 (0.0%) | 6 (100.0%) |
| Mobile Home / Other | 5 (100.0%) | 0 (0.0%) |
| Total | 166 (73.8%) | 59 (26.2%) |
Housing Structures by Number of Rooms in Harrisville
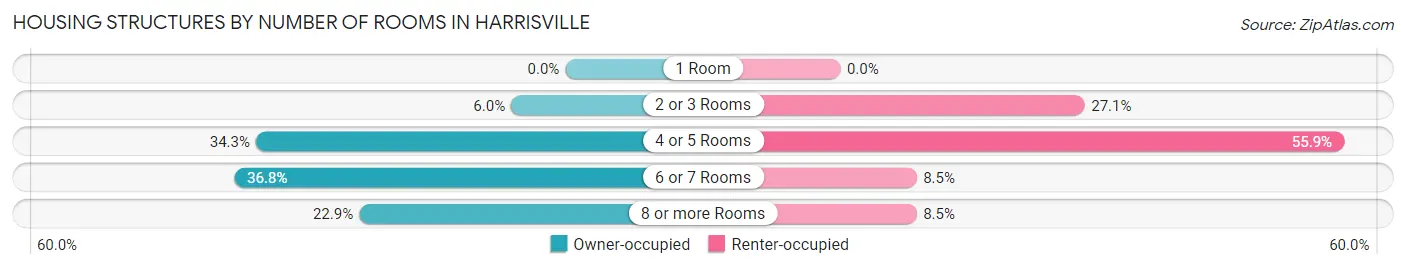
| Number of Rooms | Owner-occupied | Renter-occupied |
| 1 Room | 0 (0.0%) | 0 (0.0%) |
| 2 or 3 Rooms | 10 (6.0%) | 16 (27.1%) |
| 4 or 5 Rooms | 57 (34.3%) | 33 (55.9%) |
| 6 or 7 Rooms | 61 (36.7%) | 5 (8.5%) |
| 8 or more Rooms | 38 (22.9%) | 5 (8.5%) |
| Total | 166 (100.0%) | 59 (100.0%) |
Housing Structure by Heating Type in Harrisville
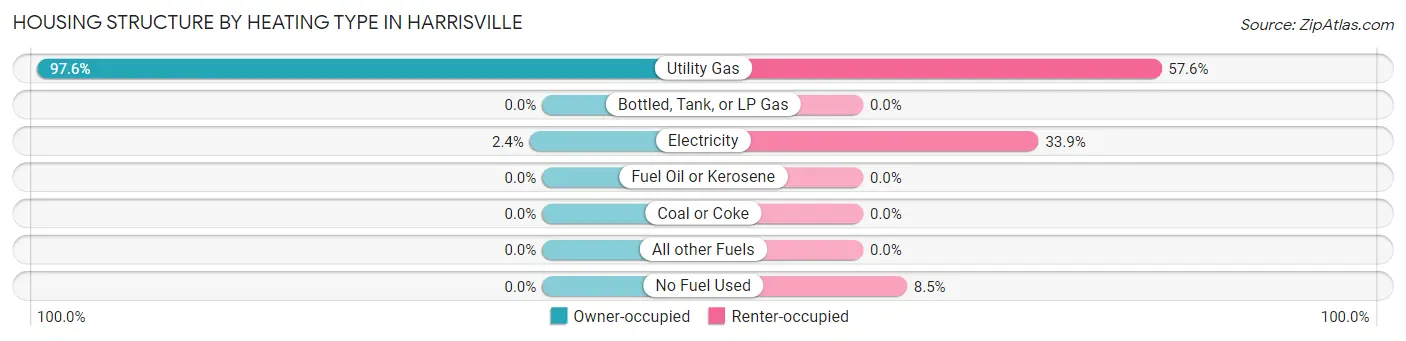
| Heating Type | Owner-occupied | Renter-occupied |
| Utility Gas | 162 (97.6%) | 34 (57.6%) |
| Bottled, Tank, or LP Gas | 0 (0.0%) | 0 (0.0%) |
| Electricity | 4 (2.4%) | 20 (33.9%) |
| Fuel Oil or Kerosene | 0 (0.0%) | 0 (0.0%) |
| Coal or Coke | 0 (0.0%) | 0 (0.0%) |
| All other Fuels | 0 (0.0%) | 0 (0.0%) |
| No Fuel Used | 0 (0.0%) | 5 (8.5%) |
| Total | 166 (100.0%) | 59 (100.0%) |
Household Vehicle Usage in Harrisville
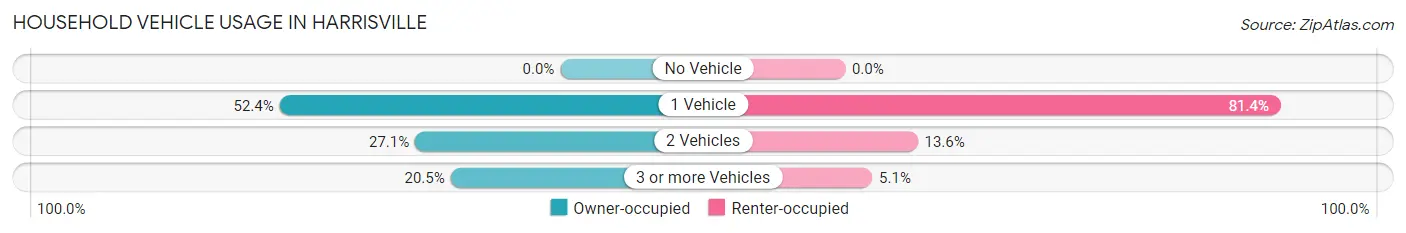
| Vehicles per Household | Owner-occupied | Renter-occupied |
| No Vehicle | 0 (0.0%) | 0 (0.0%) |
| 1 Vehicle | 87 (52.4%) | 48 (81.4%) |
| 2 Vehicles | 45 (27.1%) | 8 (13.6%) |
| 3 or more Vehicles | 34 (20.5%) | 3 (5.1%) |
| Total | 166 (100.0%) | 59 (100.0%) |
Real Estate & Mortgages in Harrisville
Real Estate and Mortgage Overview in Harrisville
| Characteristic | Without Mortgage | With Mortgage |
| Housing Units | 98 | 68 |
| Median Property Value | $117,200 | $96,800 |
| Median Household Income | $34,792 | $7 |
| Monthly Housing Costs | $330 | $2 |
| Real Estate Taxes | $1,219 | $0 |
Property Value by Mortgage Status in Harrisville
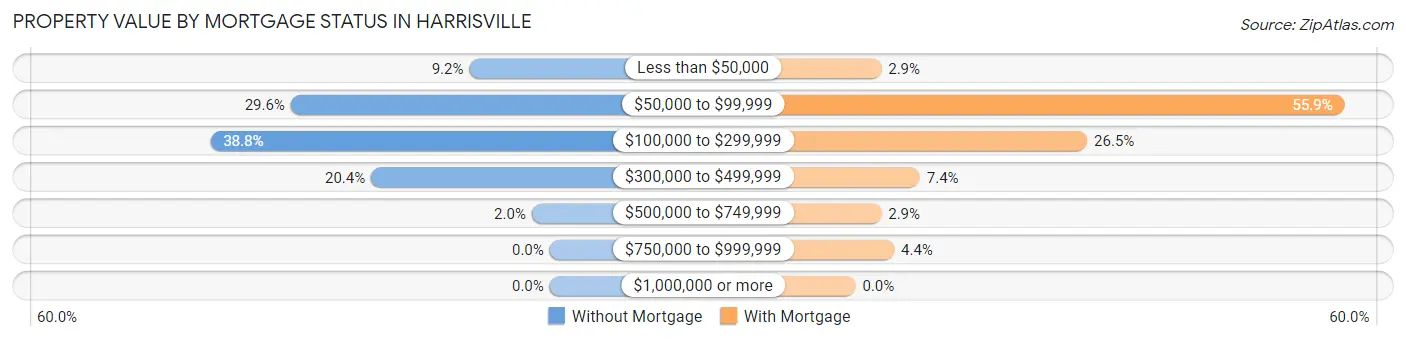
| Property Value | Without Mortgage | With Mortgage |
| Less than $50,000 | 9 (9.2%) | 2 (2.9%) |
| $50,000 to $99,999 | 29 (29.6%) | 38 (55.9%) |
| $100,000 to $299,999 | 38 (38.8%) | 18 (26.5%) |
| $300,000 to $499,999 | 20 (20.4%) | 5 (7.3%) |
| $500,000 to $749,999 | 2 (2.0%) | 2 (2.9%) |
| $750,000 to $999,999 | 0 (0.0%) | 3 (4.4%) |
| $1,000,000 or more | 0 (0.0%) | 0 (0.0%) |
| Total | 98 (100.0%) | 68 (100.0%) |
Household Income by Mortgage Status in Harrisville
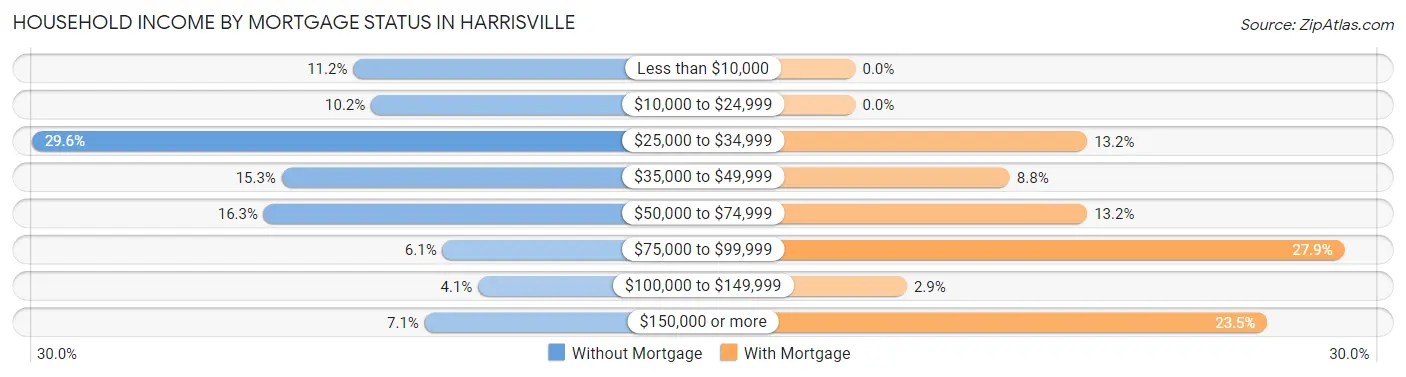
| Household Income | Without Mortgage | With Mortgage |
| Less than $10,000 | 11 (11.2%) | 0 (0.0%) |
| $10,000 to $24,999 | 10 (10.2%) | 0 (0.0%) |
| $25,000 to $34,999 | 29 (29.6%) | 9 (13.2%) |
| $35,000 to $49,999 | 15 (15.3%) | 6 (8.8%) |
| $50,000 to $74,999 | 16 (16.3%) | 9 (13.2%) |
| $75,000 to $99,999 | 6 (6.1%) | 19 (27.9%) |
| $100,000 to $149,999 | 4 (4.1%) | 2 (2.9%) |
| $150,000 or more | 7 (7.1%) | 16 (23.5%) |
| Total | 98 (100.0%) | 68 (100.0%) |
Property Value to Household Income Ratio in Harrisville
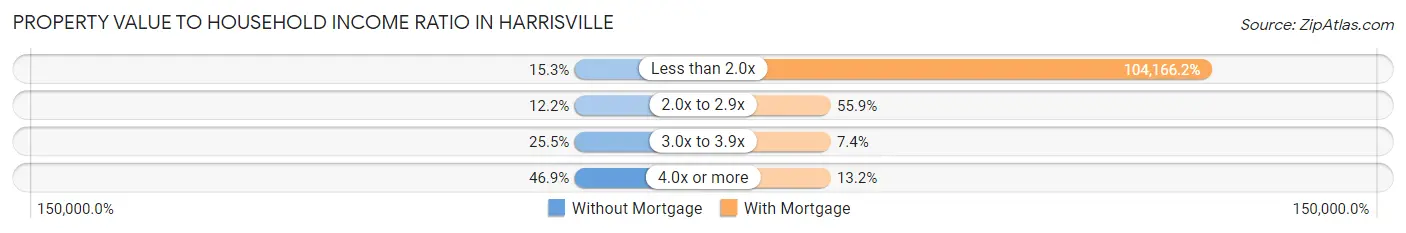
| Value-to-Income Ratio | Without Mortgage | With Mortgage |
| Less than 2.0x | 15 (15.3%) | 70,833 (104,166.2%) |
| 2.0x to 2.9x | 12 (12.2%) | 38 (55.9%) |
| 3.0x to 3.9x | 25 (25.5%) | 5 (7.3%) |
| 4.0x or more | 46 (46.9%) | 9 (13.2%) |
| Total | 98 (100.0%) | 68 (100.0%) |
Real Estate Taxes by Mortgage Status in Harrisville
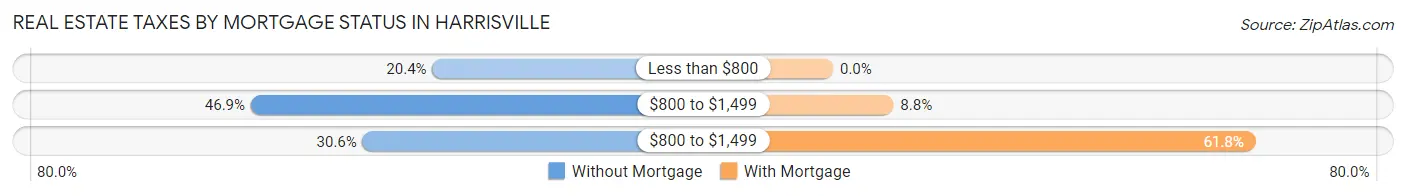
| Property Taxes | Without Mortgage | With Mortgage |
| Less than $800 | 20 (20.4%) | 0 (0.0%) |
| $800 to $1,499 | 46 (46.9%) | 6 (8.8%) |
| $800 to $1,499 | 30 (30.6%) | 42 (61.8%) |
| Total | 98 (100.0%) | 68 (100.0%) |
Health & Disability in Harrisville
Health Insurance Coverage by Age in Harrisville
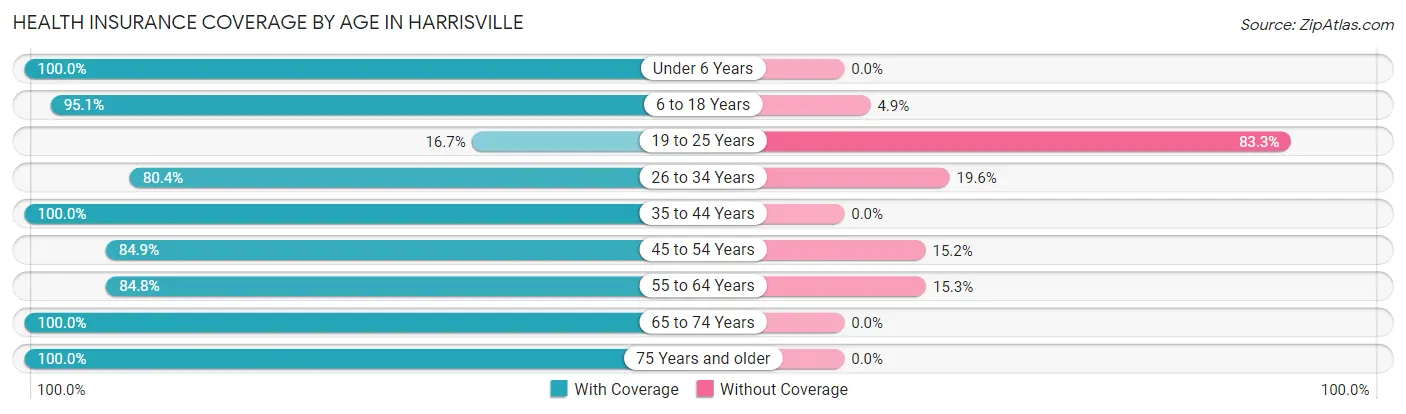
| Age Bracket | With Coverage | Without Coverage |
| Under 6 Years | 45 (100.0%) | 0 (0.0%) |
| 6 to 18 Years | 39 (95.1%) | 2 (4.9%) |
| 19 to 25 Years | 3 (16.7%) | 15 (83.3%) |
| 26 to 34 Years | 45 (80.4%) | 11 (19.6%) |
| 35 to 44 Years | 40 (100.0%) | 0 (0.0%) |
| 45 to 54 Years | 28 (84.9%) | 5 (15.1%) |
| 55 to 64 Years | 50 (84.8%) | 9 (15.2%) |
| 65 to 74 Years | 85 (100.0%) | 0 (0.0%) |
| 75 Years and older | 96 (100.0%) | 0 (0.0%) |
| Total | 431 (91.1%) | 42 (8.9%) |
Health Insurance Coverage by Citizenship Status in Harrisville
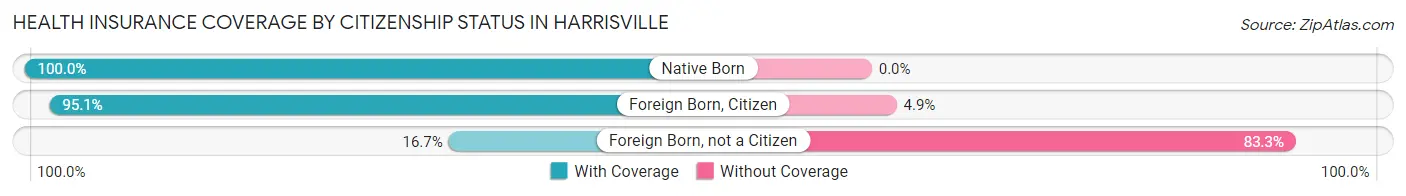
| Citizenship Status | With Coverage | Without Coverage |
| Native Born | 45 (100.0%) | 0 (0.0%) |
| Foreign Born, Citizen | 39 (95.1%) | 2 (4.9%) |
| Foreign Born, not a Citizen | 3 (16.7%) | 15 (83.3%) |
Health Insurance Coverage by Household Income in Harrisville
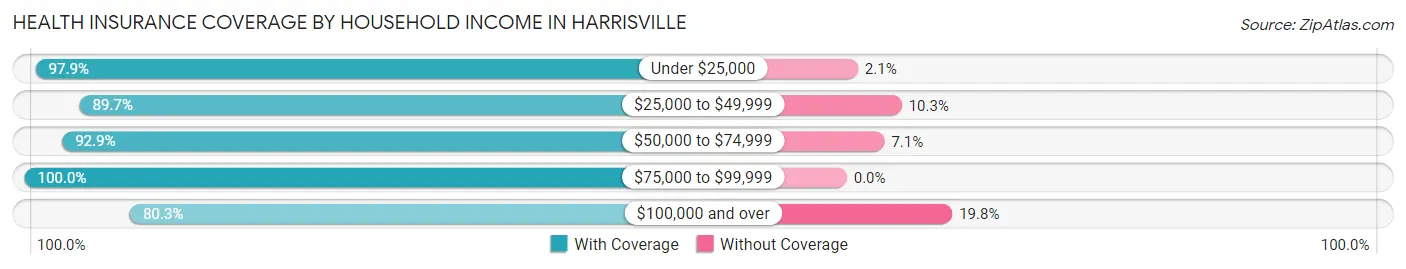
| Household Income | With Coverage | Without Coverage |
| Under $25,000 | 94 (97.9%) | 2 (2.1%) |
| $25,000 to $49,999 | 157 (89.7%) | 18 (10.3%) |
| $50,000 to $74,999 | 79 (92.9%) | 6 (7.1%) |
| $75,000 to $99,999 | 22 (100.0%) | 0 (0.0%) |
| $100,000 and over | 65 (80.2%) | 16 (19.8%) |
Public vs Private Health Insurance Coverage by Age in Harrisville
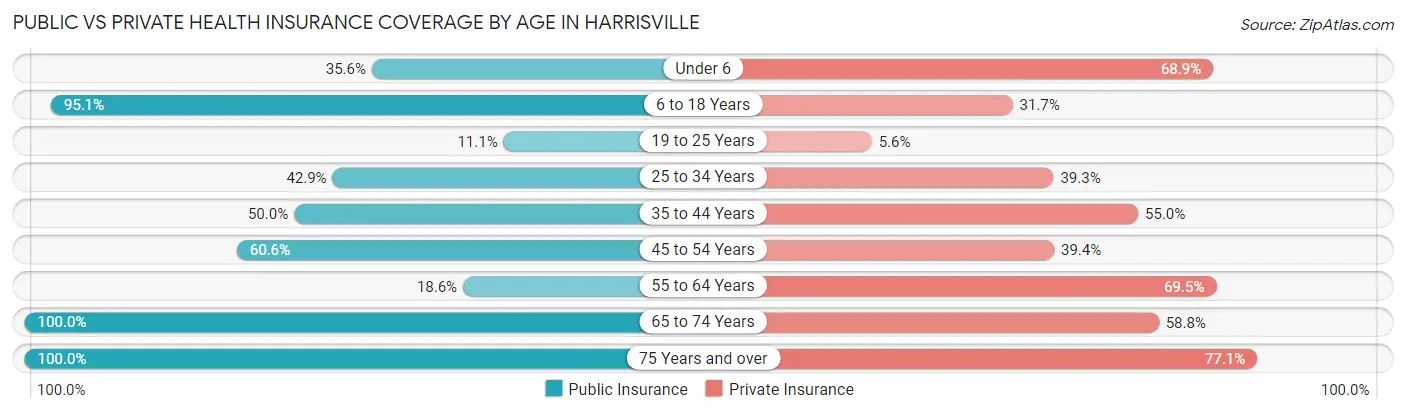
| Age Bracket | Public Insurance | Private Insurance |
| Under 6 | 16 (35.6%) | 31 (68.9%) |
| 6 to 18 Years | 39 (95.1%) | 13 (31.7%) |
| 19 to 25 Years | 2 (11.1%) | 1 (5.6%) |
| 25 to 34 Years | 24 (42.9%) | 22 (39.3%) |
| 35 to 44 Years | 20 (50.0%) | 22 (55.0%) |
| 45 to 54 Years | 20 (60.6%) | 13 (39.4%) |
| 55 to 64 Years | 11 (18.6%) | 41 (69.5%) |
| 65 to 74 Years | 85 (100.0%) | 50 (58.8%) |
| 75 Years and over | 96 (100.0%) | 74 (77.1%) |
| Total | 313 (66.2%) | 267 (56.5%) |
Disability Status by Sex by Age in Harrisville
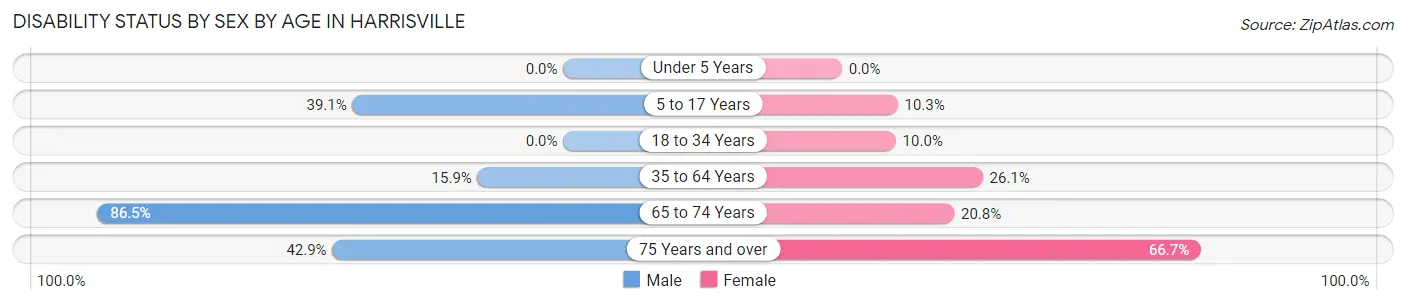
| Age Bracket | Male | Female |
| Under 5 Years | 0 (0.0%) | 0 (0.0%) |
| 5 to 17 Years | 9 (39.1%) | 3 (10.3%) |
| 18 to 34 Years | 0 (0.0%) | 2 (10.0%) |
| 35 to 64 Years | 7 (15.9%) | 23 (26.1%) |
| 65 to 74 Years | 32 (86.5%) | 10 (20.8%) |
| 75 Years and over | 18 (42.9%) | 36 (66.7%) |
Disability Class by Sex by Age in Harrisville
Disability Class: Hearing Difficulty
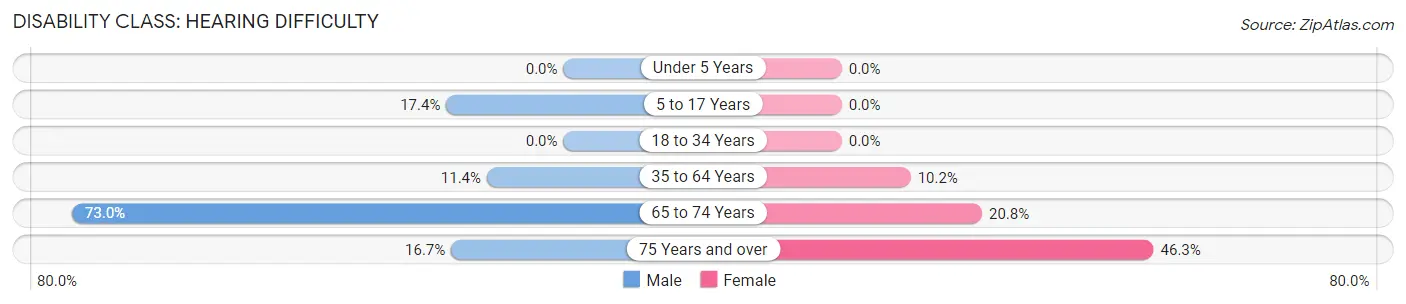
| Age Bracket | Male | Female |
| Under 5 Years | 0 (0.0%) | 0 (0.0%) |
| 5 to 17 Years | 4 (17.4%) | 0 (0.0%) |
| 18 to 34 Years | 0 (0.0%) | 0 (0.0%) |
| 35 to 64 Years | 5 (11.4%) | 9 (10.2%) |
| 65 to 74 Years | 27 (73.0%) | 10 (20.8%) |
| 75 Years and over | 7 (16.7%) | 25 (46.3%) |
Disability Class: Vision Difficulty
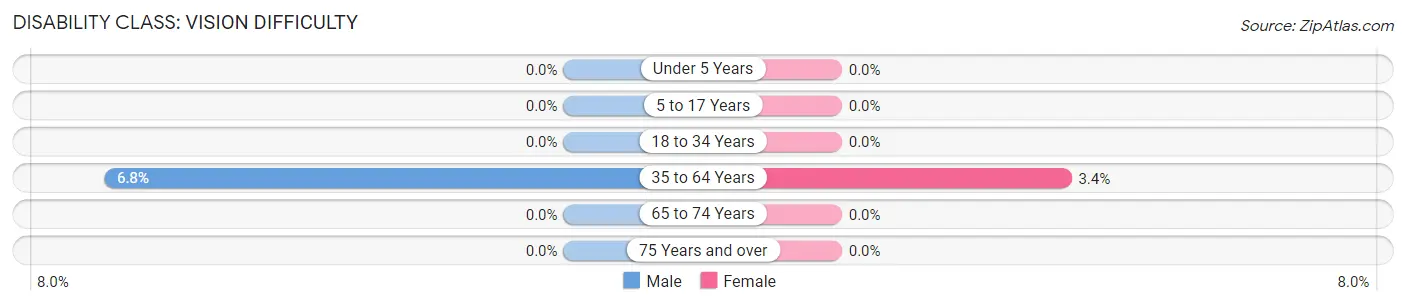
| Age Bracket | Male | Female |
| Under 5 Years | 0 (0.0%) | 0 (0.0%) |
| 5 to 17 Years | 0 (0.0%) | 0 (0.0%) |
| 18 to 34 Years | 0 (0.0%) | 0 (0.0%) |
| 35 to 64 Years | 3 (6.8%) | 3 (3.4%) |
| 65 to 74 Years | 0 (0.0%) | 0 (0.0%) |
| 75 Years and over | 0 (0.0%) | 0 (0.0%) |
Disability Class: Cognitive Difficulty
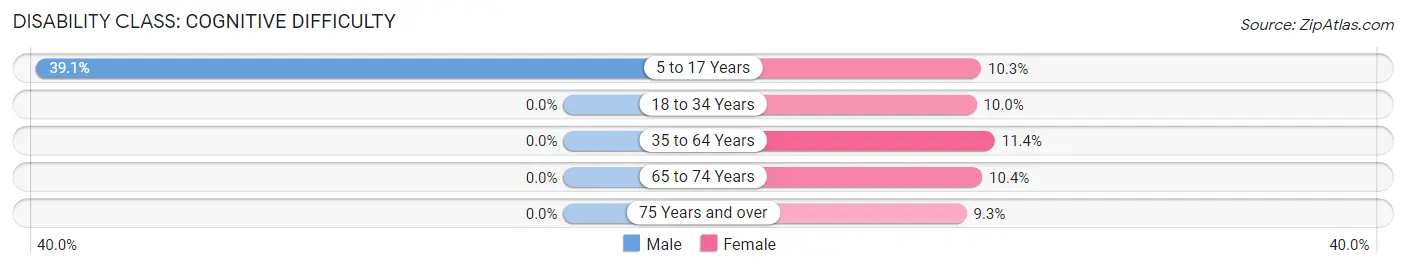
| Age Bracket | Male | Female |
| 5 to 17 Years | 9 (39.1%) | 3 (10.3%) |
| 18 to 34 Years | 0 (0.0%) | 2 (10.0%) |
| 35 to 64 Years | 0 (0.0%) | 10 (11.4%) |
| 65 to 74 Years | 0 (0.0%) | 5 (10.4%) |
| 75 Years and over | 0 (0.0%) | 5 (9.3%) |
Disability Class: Ambulatory Difficulty
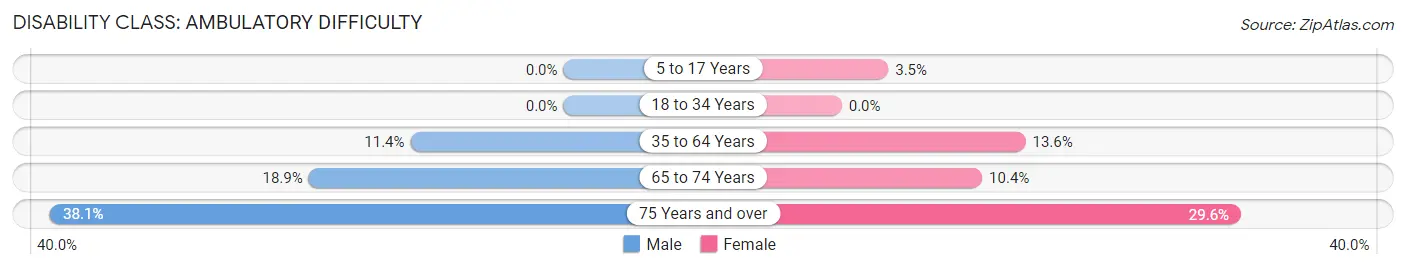
| Age Bracket | Male | Female |
| 5 to 17 Years | 0 (0.0%) | 1 (3.5%) |
| 18 to 34 Years | 0 (0.0%) | 0 (0.0%) |
| 35 to 64 Years | 5 (11.4%) | 12 (13.6%) |
| 65 to 74 Years | 7 (18.9%) | 5 (10.4%) |
| 75 Years and over | 16 (38.1%) | 16 (29.6%) |
Disability Class: Self-Care Difficulty
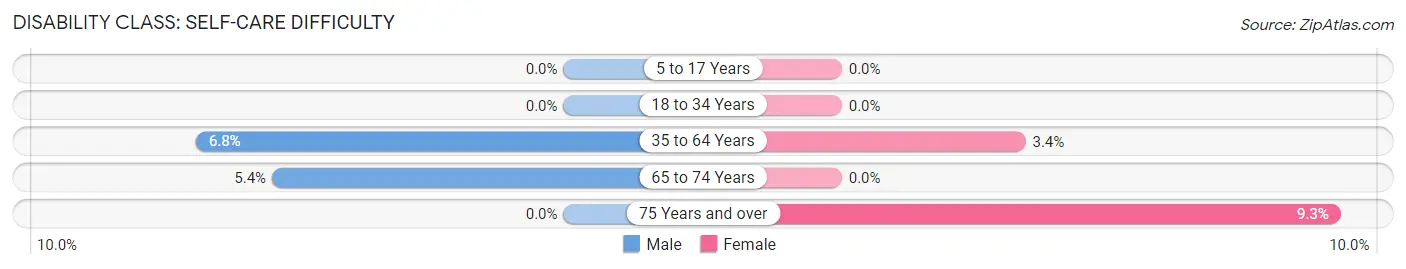
| Age Bracket | Male | Female |
| 5 to 17 Years | 0 (0.0%) | 0 (0.0%) |
| 18 to 34 Years | 0 (0.0%) | 0 (0.0%) |
| 35 to 64 Years | 3 (6.8%) | 3 (3.4%) |
| 65 to 74 Years | 2 (5.4%) | 0 (0.0%) |
| 75 Years and over | 0 (0.0%) | 5 (9.3%) |
Technology Access in Harrisville
Computing Device Access in Harrisville
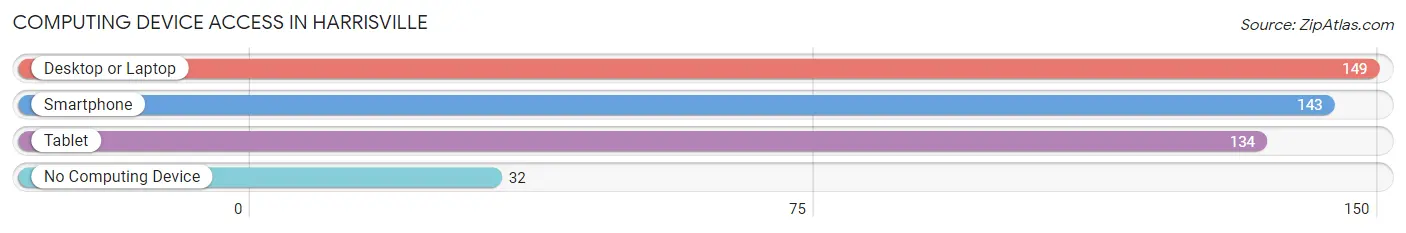
| Device Type | # Households | % Households |
| Desktop or Laptop | 149 | 66.2% |
| Smartphone | 143 | 63.6% |
| Tablet | 134 | 59.6% |
| No Computing Device | 32 | 14.2% |
| Total | 225 | 100.0% |
Internet Access in Harrisville
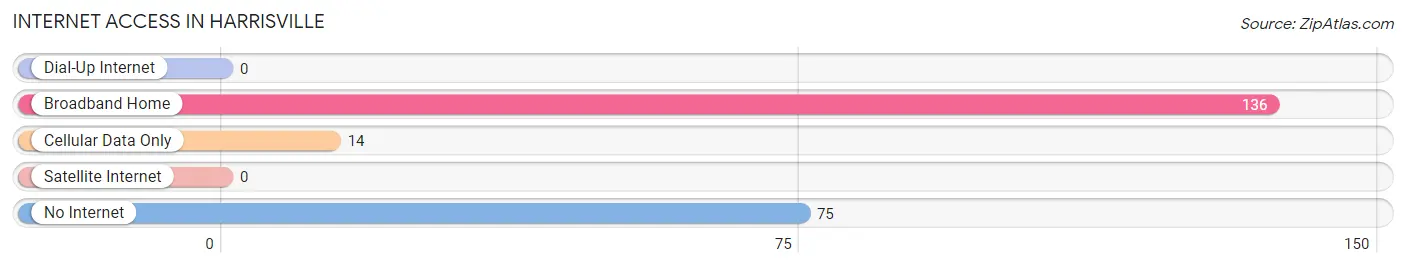
| Internet Type | # Households | % Households |
| Dial-Up Internet | 0 | 0.0% |
| Broadband Home | 136 | 60.4% |
| Cellular Data Only | 14 | 6.2% |
| Satellite Internet | 0 | 0.0% |
| No Internet | 75 | 33.3% |
| Total | 225 | 100.0% |
Harrisville Summary
Harville, Michigan is a small village located in the northern part of the state, in Alcona County. It is situated on the banks of the Thunder Bay River, and is surrounded by rolling hills and forests. The village has a population of just over 500 people, and is a popular destination for outdoor recreation.
History
Harville was first settled in the late 1800s by a group of lumberjacks and farmers. The village was originally known as “Harville’s Corners”, and was named after the first settler, William Harville. The village was incorporated in 1891, and the first post office was established in 1892.
The village grew slowly over the years, and by the early 1900s, it had become a popular destination for tourists and outdoor enthusiasts. The village was home to several resorts, and the Thunder Bay River was a popular spot for fishing and canoeing.
In the 1950s, the village began to decline as the lumber industry moved away from the area. The population dropped to just over 200 people by the 1970s, and the village was in danger of becoming a ghost town. However, in the 1980s, the village began to experience a resurgence as people began to move back to the area.
Geography
Harville is located in the northern part of Michigan, in Alcona County. It is situated on the banks of the Thunder Bay River, and is surrounded by rolling hills and forests. The village is located about 30 miles north of Alpena, and about 60 miles south of Sault Ste. Marie.
The village is located in a temperate climate, with warm summers and cold winters. The average temperature in the summer is around 70 degrees Fahrenheit, and the average temperature in the winter is around 20 degrees Fahrenheit.
Economy
The economy of Harville is largely based on tourism and outdoor recreation. The village is home to several resorts, and the Thunder Bay River is a popular spot for fishing and canoeing. The village also has several small businesses, including a grocery store, a hardware store, and a few restaurants.
The village is also home to a small manufacturing plant, which produces parts for the automotive industry. The plant employs about 50 people, and is one of the largest employers in the village.
Demographics
As of the 2010 census, the population of Harville was 514 people. The racial makeup of the village was 97.3% White, 0.6% African American, 0.2% Native American, 0.4% Asian, and 1.5% from other races. The median household income was $37,500, and the median age was 44.
Harville is a small, rural village with a close-knit community. The village is home to several churches, and the local school district serves about 200 students. The village is also home to a volunteer fire department, and a volunteer ambulance service.
Common Questions
What is Per Capita Income in Harrisville?
Per Capita income in Harrisville is $26,803.
What is the Median Family Income in Harrisville?
Median Family Income in Harrisville is $58,333.
What is the Median Household income in Harrisville?
Median Household Income in Harrisville is $35,375.
What is Income or Wage Gap in Harrisville?
Income or Wage Gap in Harrisville is 13.0%.
Women in Harrisville earn 87.0 cents for every dollar earned by a man.
What is Family Income Deficit in Harrisville?
Family Income Deficit in Harrisville is $5,323.
Families that are below poverty line in Harrisville earn $5,323 less on average than the poverty threshold level.
What is Inequality or Gini Index in Harrisville?
Inequality or Gini Index in Harrisville is 0.49.
What is the Total Population of Harrisville?
Total Population of Harrisville is 500.
What is the Total Male Population of Harrisville?
Total Male Population of Harrisville is 234.
What is the Total Female Population of Harrisville?
Total Female Population of Harrisville is 266.
What is the Ratio of Males per 100 Females in Harrisville?
There are 87.97 Males per 100 Females in Harrisville.
What is the Ratio of Females per 100 Males in Harrisville?
There are 113.68 Females per 100 Males in Harrisville.
What is the Median Population Age in Harrisville?
Median Population Age in Harrisville is 54.1 Years.
What is the Average Family Size in Harrisville
Average Family Size in Harrisville is 2.7 People.
What is the Average Household Size in Harrisville
Average Household Size in Harrisville is 2.0 People.
How Large is the Labor Force in Harrisville?
There are 170 People in the Labor Forcein in Harrisville.
What is the Percentage of People in the Labor Force in Harrisville?
40.8% of People are in the Labor Force in Harrisville.
What is the Unemployment Rate in Harrisville?
Unemployment Rate in Harrisville is 2.9%.