Le Grand, IA Map & Demographics
Le Grand Map
Le Grand Overview
$38,903
PER CAPITA INCOME
$85,278
AVG FAMILY INCOME
$70,208
AVG HOUSEHOLD INCOME
15.9%
WAGE / INCOME GAP [ % ]
84.1¢/ $1
WAGE / INCOME GAP [ $ ]
0.40
INEQUALITY / GINI INDEX
790
TOTAL POPULATION
358
MALE POPULATION
432
FEMALE POPULATION
82.87
MALES / 100 FEMALES
120.67
FEMALES / 100 MALES
48.7
MEDIAN AGE
2.5
AVG FAMILY SIZE
2.1
AVG HOUSEHOLD SIZE
414
LABOR FORCE [ PEOPLE ]
62.4%
PERCENT IN LABOR FORCE
2.4%
UNEMPLOYMENT RATE
Le Grand Zip Codes
Le Grand Area Codes
Income in Le Grand
Income Overview in Le Grand
Per Capita Income in Le Grand is $38,903, while median incomes of families and households are $85,278 and $70,208 respectively.
| Characteristic | Number | Measure |
| Per Capita Income | 790 | $38,903 |
| Median Family Income | 232 | $85,278 |
| Mean Family Income | 232 | $99,213 |
| Median Household Income | 371 | $70,208 |
| Mean Household Income | 371 | $85,505 |
| Income Deficit | 232 | $0 |
| Wage / Income Gap (%) | 790 | 15.85% |
| Wage / Income Gap ($) | 790 | 84.15¢ per $1 |
| Gini / Inequality Index | 790 | 0.40 |
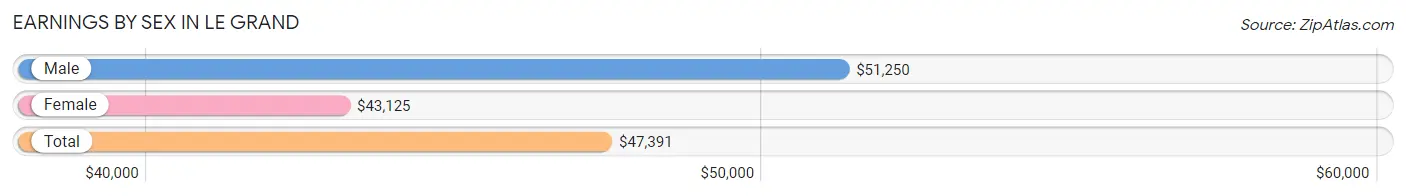
Earnings by Sex in Le Grand
Average Earnings in Le Grand are $47,391, $51,250 for men and $43,125 for women, a difference of 15.9%.
| Sex | Number | Average Earnings |
| Male | 197 (46.5%) | $51,250 |
| Female | 227 (53.5%) | $43,125 |
| Total | 424 (100.0%) | $47,391 |
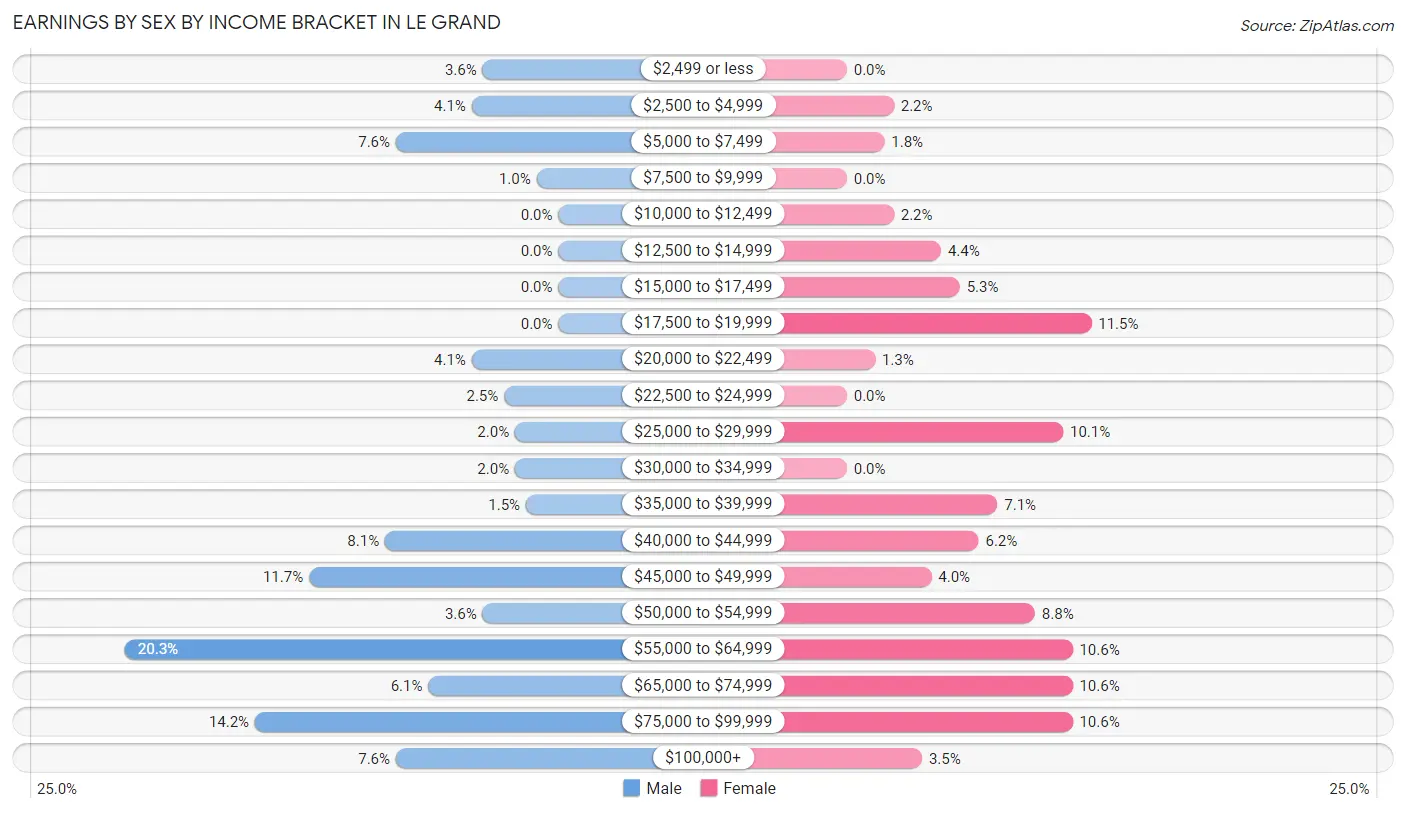
Earnings by Sex by Income Bracket in Le Grand
The most common earnings brackets in Le Grand are $55,000 to $64,999 for men (40 | 20.3%) and $17,500 to $19,999 for women (26 | 11.5%).
| Income | Male | Female |
| $2,499 or less | 7 (3.5%) | 0 (0.0%) |
| $2,500 to $4,999 | 8 (4.1%) | 5 (2.2%) |
| $5,000 to $7,499 | 15 (7.6%) | 4 (1.8%) |
| $7,500 to $9,999 | 2 (1.0%) | 0 (0.0%) |
| $10,000 to $12,499 | 0 (0.0%) | 5 (2.2%) |
| $12,500 to $14,999 | 0 (0.0%) | 10 (4.4%) |
| $15,000 to $17,499 | 0 (0.0%) | 12 (5.3%) |
| $17,500 to $19,999 | 0 (0.0%) | 26 (11.5%) |
| $20,000 to $22,499 | 8 (4.1%) | 3 (1.3%) |
| $22,500 to $24,999 | 5 (2.5%) | 0 (0.0%) |
| $25,000 to $29,999 | 4 (2.0%) | 23 (10.1%) |
| $30,000 to $34,999 | 4 (2.0%) | 0 (0.0%) |
| $35,000 to $39,999 | 3 (1.5%) | 16 (7.0%) |
| $40,000 to $44,999 | 16 (8.1%) | 14 (6.2%) |
| $45,000 to $49,999 | 23 (11.7%) | 9 (4.0%) |
| $50,000 to $54,999 | 7 (3.5%) | 20 (8.8%) |
| $55,000 to $64,999 | 40 (20.3%) | 24 (10.6%) |
| $65,000 to $74,999 | 12 (6.1%) | 24 (10.6%) |
| $75,000 to $99,999 | 28 (14.2%) | 24 (10.6%) |
| $100,000+ | 15 (7.6%) | 8 (3.5%) |
| Total | 197 (100.0%) | 227 (100.0%) |
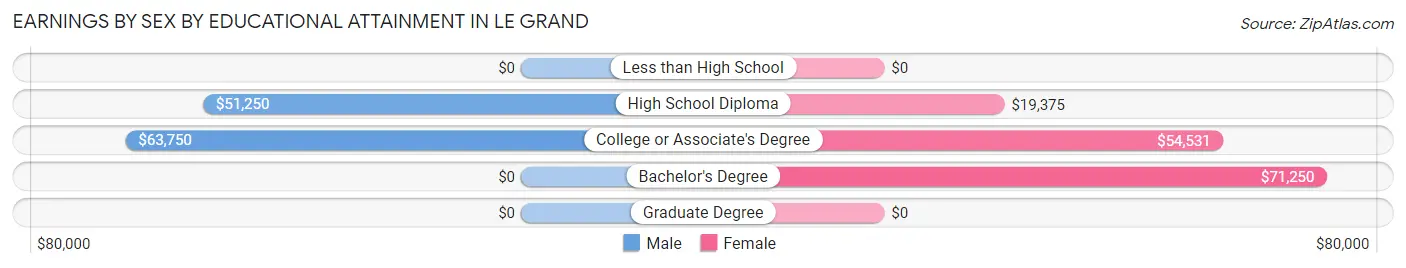
Earnings by Sex by Educational Attainment in Le Grand
Average earnings in Le Grand are $51,607 for men and $44,167 for women, a difference of 14.4%. Men with an educational attainment of college or associate's degree enjoy the highest average annual earnings of $63,750, while those with high school diploma education earn the least with $51,250. Women with an educational attainment of bachelor's degree earn the most with the average annual earnings of $71,250, while those with high school diploma education have the smallest earnings of $19,375.
| Educational Attainment | Male Income | Female Income |
| Less than High School | - | - |
| High School Diploma | $51,250 | $19,375 |
| College or Associate's Degree | $63,750 | $54,531 |
| Bachelor's Degree | - | - |
| Graduate Degree | - | - |
| Total | $51,607 | $44,167 |
Family Income in Le Grand
Family Income Brackets in Le Grand
According to the Le Grand family income data, there are 60 families falling into the $100,000 to $149,999 income range, which is the most common income bracket and makes up 25.9% of all families. Conversely, the less than $10,000 income bracket is the least frequent group with only 2 families (0.9%) belonging to this category.
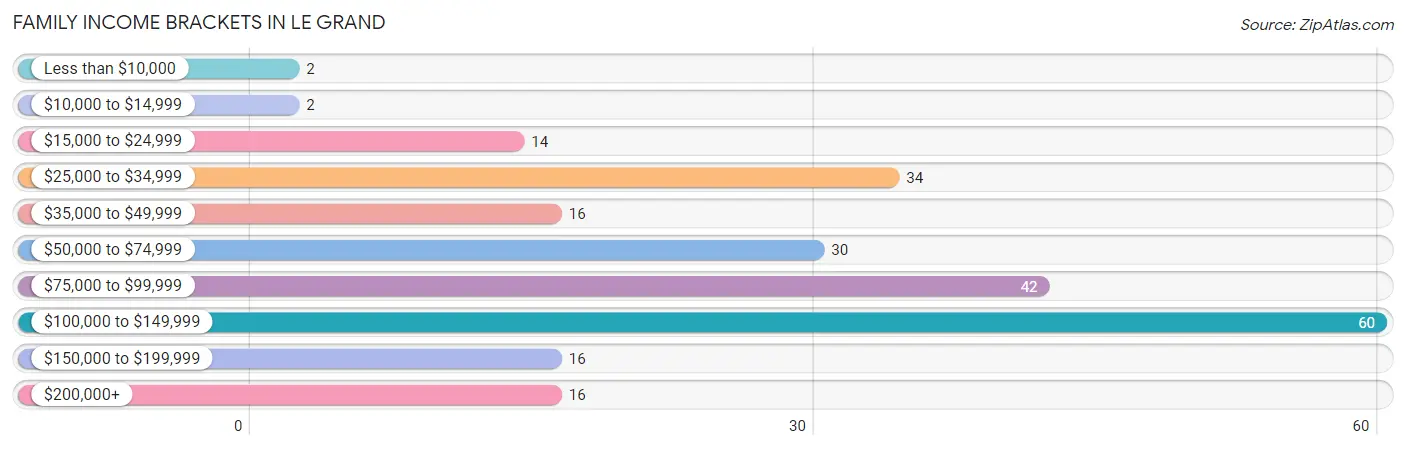
| Income Bracket | # Families | % Families |
| Less than $10,000 | 2 | 0.9% |
| $10,000 to $14,999 | 2 | 0.9% |
| $15,000 to $24,999 | 14 | 6.0% |
| $25,000 to $34,999 | 34 | 14.7% |
| $35,000 to $49,999 | 16 | 6.9% |
| $50,000 to $74,999 | 30 | 12.9% |
| $75,000 to $99,999 | 42 | 18.1% |
| $100,000 to $149,999 | 60 | 25.9% |
| $150,000 to $199,999 | 16 | 6.9% |
| $200,000+ | 16 | 6.9% |
Family Income by Famaliy Size in Le Grand
4-person families (28 | 12.1%) account for the highest median family income in Le Grand with $140,714 per family, while 2-person families (149 | 64.2%) have the highest median income of $36,146 per family member.
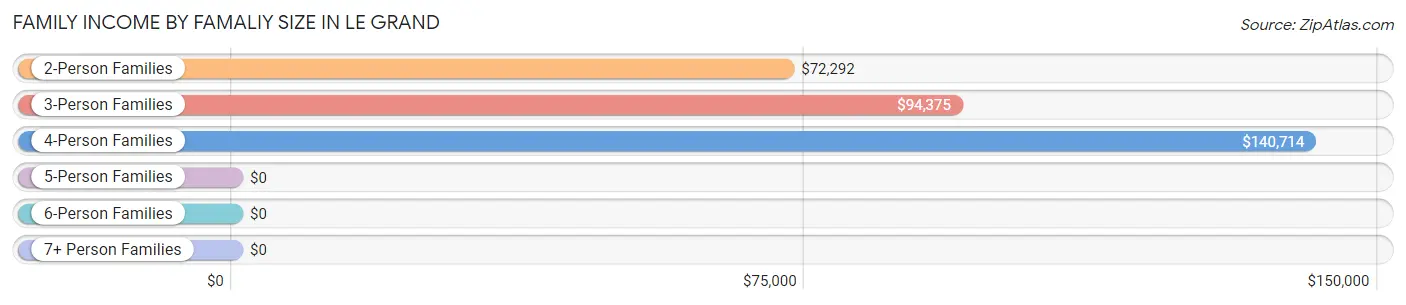
| Income Bracket | # Families | Median Income |
| 2-Person Families | 149 (64.2%) | $72,292 |
| 3-Person Families | 41 (17.7%) | $94,375 |
| 4-Person Families | 28 (12.1%) | $140,714 |
| 5-Person Families | 11 (4.7%) | $0 |
| 6-Person Families | 0 (0.0%) | $0 |
| 7+ Person Families | 3 (1.3%) | $0 |
| Total | 232 (100.0%) | $85,278 |
Family Income by Number of Earners in Le Grand
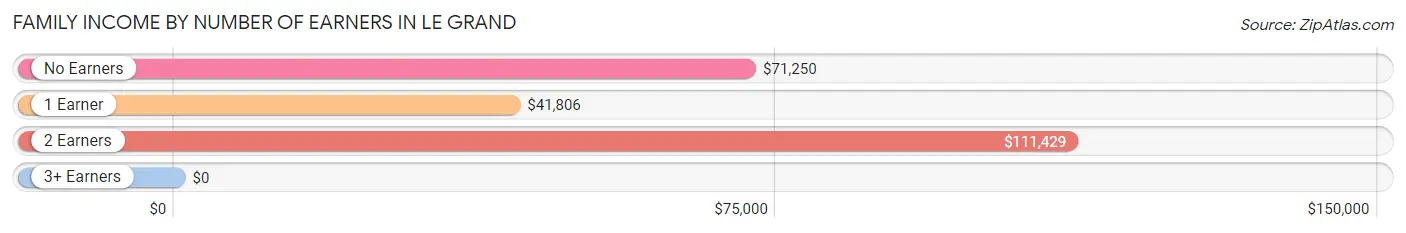
| Number of Earners | # Families | Median Income |
| No Earners | 42 (18.1%) | $71,250 |
| 1 Earner | 103 (44.4%) | $41,806 |
| 2 Earners | 68 (29.3%) | $111,429 |
| 3+ Earners | 19 (8.2%) | $0 |
| Total | 232 (100.0%) | $85,278 |
Household Income in Le Grand
Household Income Brackets in Le Grand
With 81 households falling in the category, the $100,000 to $149,999 income range is the most frequent in Le Grand, accounting for 21.8% of all households. In contrast, only 2 households (0.5%) fall into the less than $10,000 income bracket, making it the least populous group.
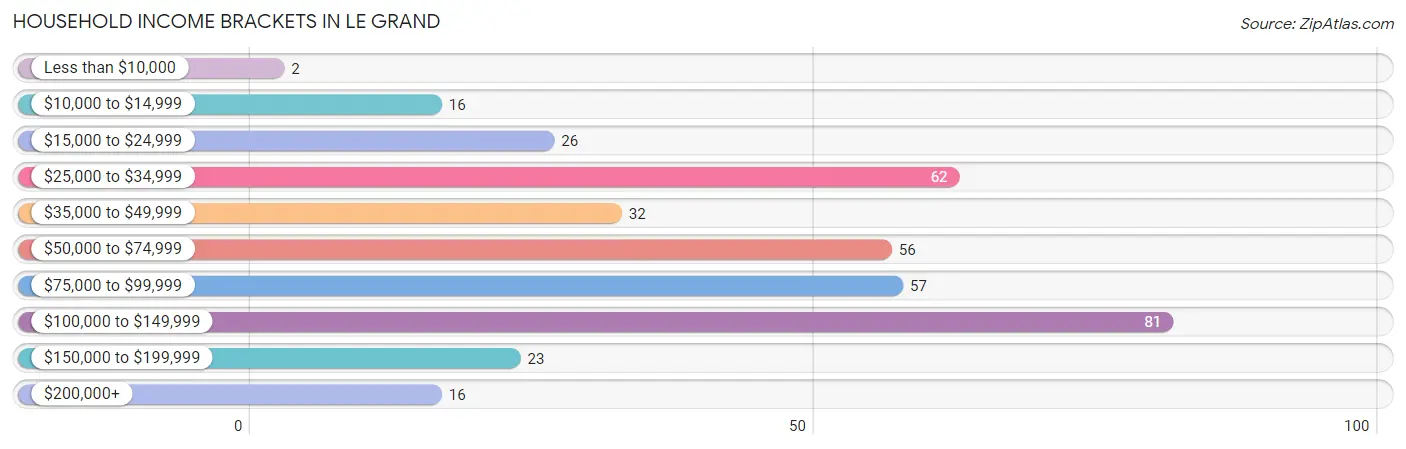
| Income Bracket | # Households | % Households |
| Less than $10,000 | 2 | 0.5% |
| $10,000 to $14,999 | 16 | 4.3% |
| $15,000 to $24,999 | 26 | 7.0% |
| $25,000 to $34,999 | 62 | 16.7% |
| $35,000 to $49,999 | 32 | 8.6% |
| $50,000 to $74,999 | 56 | 15.1% |
| $75,000 to $99,999 | 57 | 15.4% |
| $100,000 to $149,999 | 81 | 21.8% |
| $150,000 to $199,999 | 23 | 6.2% |
| $200,000+ | 16 | 4.3% |
Household Income by Householder Age in Le Grand
The median household income in Le Grand is $70,208, with the highest median household income of $95,938 found in the 45 to 64 years age bracket for the primary householder. A total of 137 households (36.9%) fall into this category. Meanwhile, the 15 to 24 years age bracket for the primary householder has the lowest median household income of $0, with 7 households (1.9%) in this group.
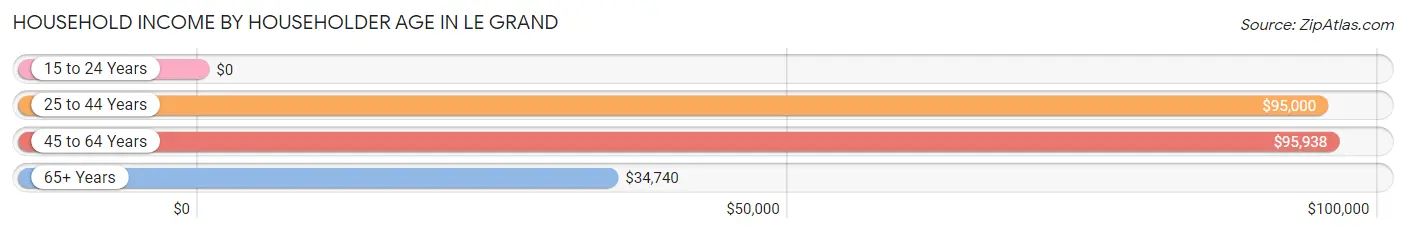
| Income Bracket | # Households | Median Income |
| 15 to 24 Years | 7 (1.9%) | $0 |
| 25 to 44 Years | 84 (22.6%) | $95,000 |
| 45 to 64 Years | 137 (36.9%) | $95,938 |
| 65+ Years | 143 (38.5%) | $34,740 |
| Total | 371 (100.0%) | $70,208 |
Poverty in Le Grand
Income Below Poverty by Sex and Age in Le Grand
With 14.9% poverty level for males and 7.9% for females among the residents of Le Grand, 6 to 11 year old males and 18 to 24 year old females are the most vulnerable to poverty, with 9 males (75.0%) and 8 females (53.3%) in their respective age groups living below the poverty level.
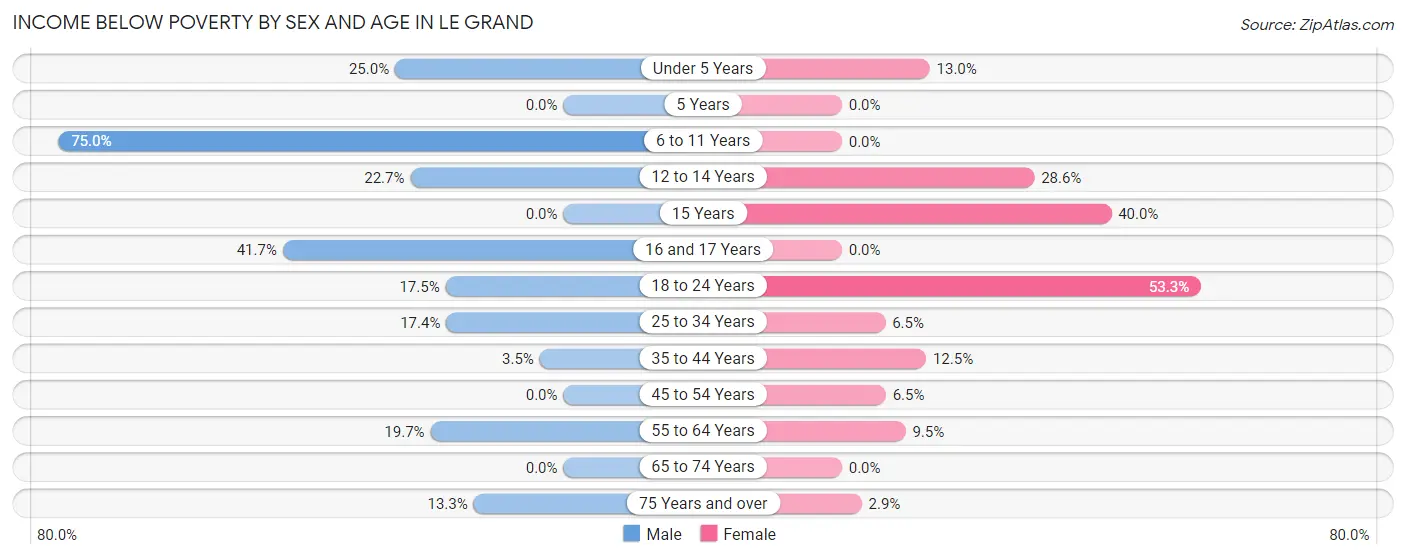
| Age Bracket | Male | Female |
| Under 5 Years | 3 (25.0%) | 3 (13.0%) |
| 5 Years | 0 (0.0%) | 0 (0.0%) |
| 6 to 11 Years | 9 (75.0%) | 0 (0.0%) |
| 12 to 14 Years | 5 (22.7%) | 2 (28.6%) |
| 15 Years | 0 (0.0%) | 2 (40.0%) |
| 16 and 17 Years | 5 (41.7%) | 0 (0.0%) |
| 18 to 24 Years | 7 (17.5%) | 8 (53.3%) |
| 25 to 34 Years | 4 (17.4%) | 2 (6.5%) |
| 35 to 44 Years | 2 (3.5%) | 6 (12.5%) |
| 45 to 54 Years | 0 (0.0%) | 3 (6.5%) |
| 55 to 64 Years | 15 (19.7%) | 7 (9.5%) |
| 65 to 74 Years | 0 (0.0%) | 0 (0.0%) |
| 75 Years and over | 2 (13.3%) | 1 (2.9%) |
| Total | 52 (14.9%) | 34 (7.9%) |
Income Above Poverty by Sex and Age in Le Grand
According to the poverty statistics in Le Grand, males aged 5 years and females aged 5 years are the age groups that are most secure financially, with 100.0% of males and 100.0% of females in these age groups living above the poverty line.
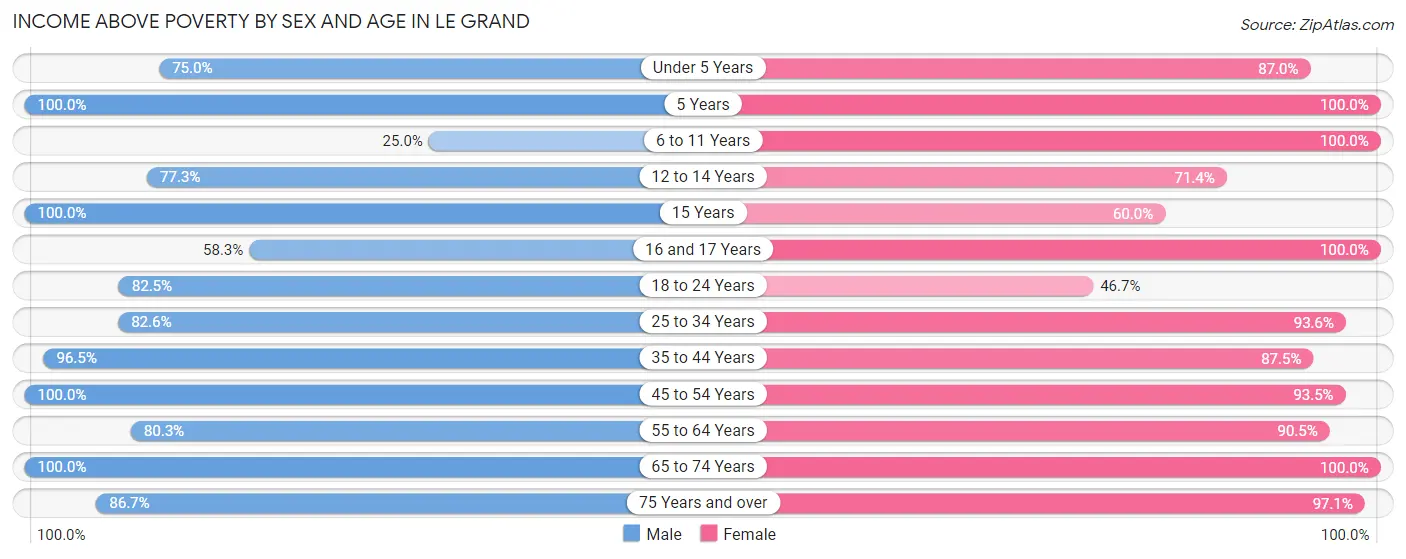
| Age Bracket | Male | Female |
| Under 5 Years | 9 (75.0%) | 20 (87.0%) |
| 5 Years | 2 (100.0%) | 3 (100.0%) |
| 6 to 11 Years | 3 (25.0%) | 25 (100.0%) |
| 12 to 14 Years | 17 (77.3%) | 5 (71.4%) |
| 15 Years | 6 (100.0%) | 3 (60.0%) |
| 16 and 17 Years | 7 (58.3%) | 8 (100.0%) |
| 18 to 24 Years | 33 (82.5%) | 7 (46.7%) |
| 25 to 34 Years | 19 (82.6%) | 29 (93.5%) |
| 35 to 44 Years | 55 (96.5%) | 42 (87.5%) |
| 45 to 54 Years | 33 (100.0%) | 43 (93.5%) |
| 55 to 64 Years | 61 (80.3%) | 67 (90.5%) |
| 65 to 74 Years | 40 (100.0%) | 111 (100.0%) |
| 75 Years and over | 13 (86.7%) | 33 (97.1%) |
| Total | 298 (85.1%) | 396 (92.1%) |
Income Below Poverty Among Married-Couple Families in Le Grand
The poverty statistics for married-couple families in Le Grand show that 1.1% or 2 of the total 188 families live below the poverty line. Families with no children have the highest poverty rate of 1.3%, comprising of 2 families. On the other hand, families with 1 or 2 children have the lowest poverty rate of 0.0%, which includes 0 families.
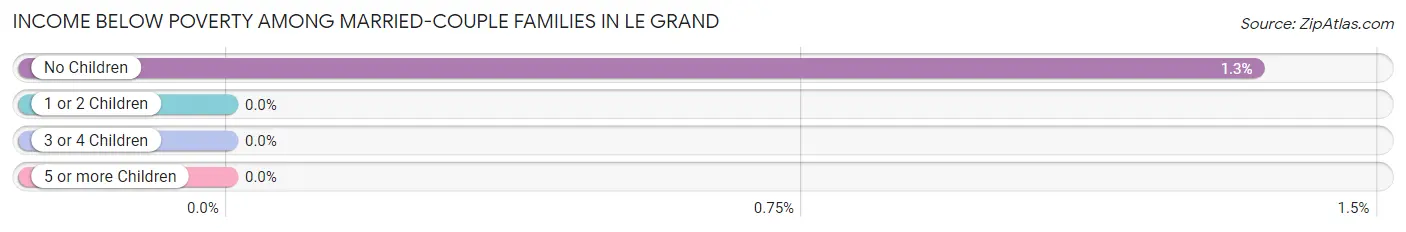
| Children | Above Poverty | Below Poverty |
| No Children | 147 (98.7%) | 2 (1.3%) |
| 1 or 2 Children | 28 (100.0%) | 0 (0.0%) |
| 3 or 4 Children | 11 (100.0%) | 0 (0.0%) |
| 5 or more Children | 0 (0.0%) | 0 (0.0%) |
| Total | 186 (98.9%) | 2 (1.1%) |
Income Below Poverty Among Single-Parent Households in Le Grand
According to the poverty data in Le Grand, 9.5% or 2 single-father households and 47.8% or 11 single-mother households are living below the poverty line. Among single-father households, those with no children have the highest poverty rate, with 2 households (50.0%) experiencing poverty. Likewise, among single-mother households, those with 5 or more children have the highest poverty rate, with 3 households (100.0%) falling below the poverty line.
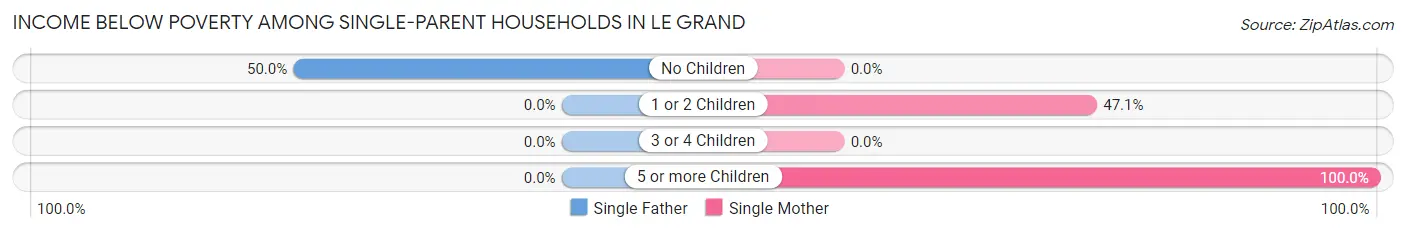
| Children | Single Father | Single Mother |
| No Children | 2 (50.0%) | 0 (0.0%) |
| 1 or 2 Children | 0 (0.0%) | 8 (47.1%) |
| 3 or 4 Children | 0 (0.0%) | 0 (0.0%) |
| 5 or more Children | 0 (0.0%) | 3 (100.0%) |
| Total | 2 (9.5%) | 11 (47.8%) |
Income Below Poverty Among Married-Couple vs Single-Parent Households in Le Grand
The poverty data for Le Grand shows that 2 of the married-couple family households (1.1%) and 13 of the single-parent households (29.5%) are living below the poverty level. Within the married-couple family households, those with no children have the highest poverty rate, with 2 households (1.3%) falling below the poverty line. Among the single-parent households, those with 5 or more children have the highest poverty rate, with 3 household (100.0%) living below poverty.
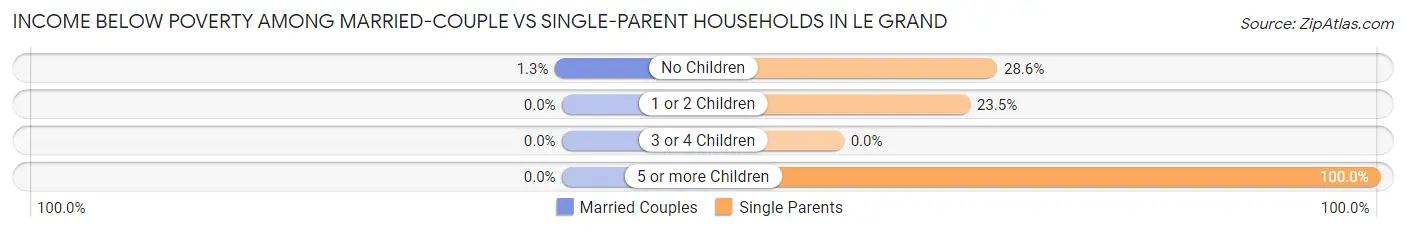
| Children | Married-Couple Families | Single-Parent Households |
| No Children | 2 (1.3%) | 2 (28.6%) |
| 1 or 2 Children | 0 (0.0%) | 8 (23.5%) |
| 3 or 4 Children | 0 (0.0%) | 0 (0.0%) |
| 5 or more Children | 0 (0.0%) | 3 (100.0%) |
| Total | 2 (1.1%) | 13 (29.5%) |
Race in Le Grand
The most populous races in Le Grand are White / Caucasian (755 | 95.6%), Hispanic or Latino (18 | 2.3%), and Black / African American (12 | 1.5%).
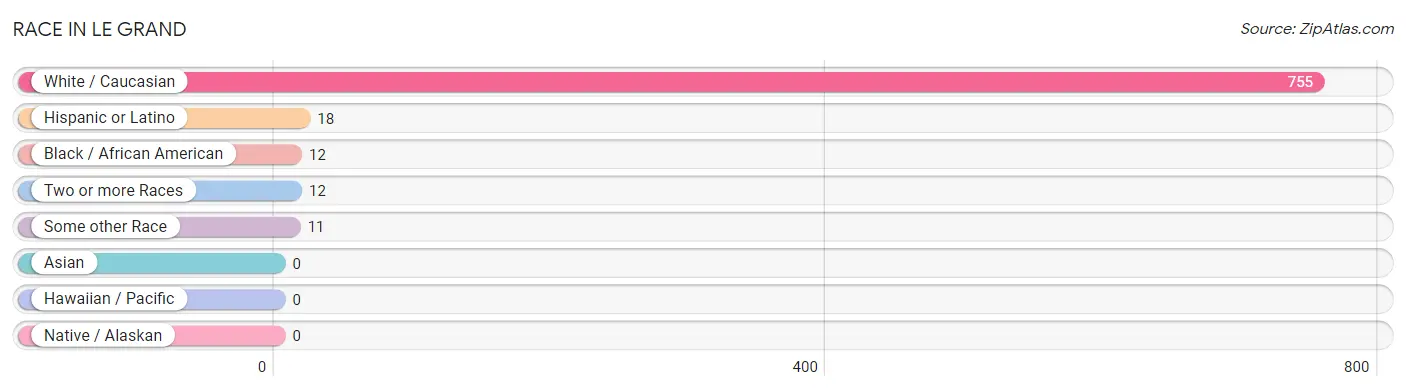
| Race | # Population | % Population |
| Asian | 0 | 0.0% |
| Black / African American | 12 | 1.5% |
| Hawaiian / Pacific | 0 | 0.0% |
| Hispanic or Latino | 18 | 2.3% |
| Native / Alaskan | 0 | 0.0% |
| White / Caucasian | 755 | 95.6% |
| Two or more Races | 12 | 1.5% |
| Some other Race | 11 | 1.4% |
| Total | 790 | 100.0% |
Ancestry in Le Grand
The most populous ancestries reported in Le Grand are German (203 | 25.7%), Irish (155 | 19.6%), Norwegian (65 | 8.2%), American (57 | 7.2%), and English (54 | 6.8%), together accounting for 67.6% of all Le Grand residents.
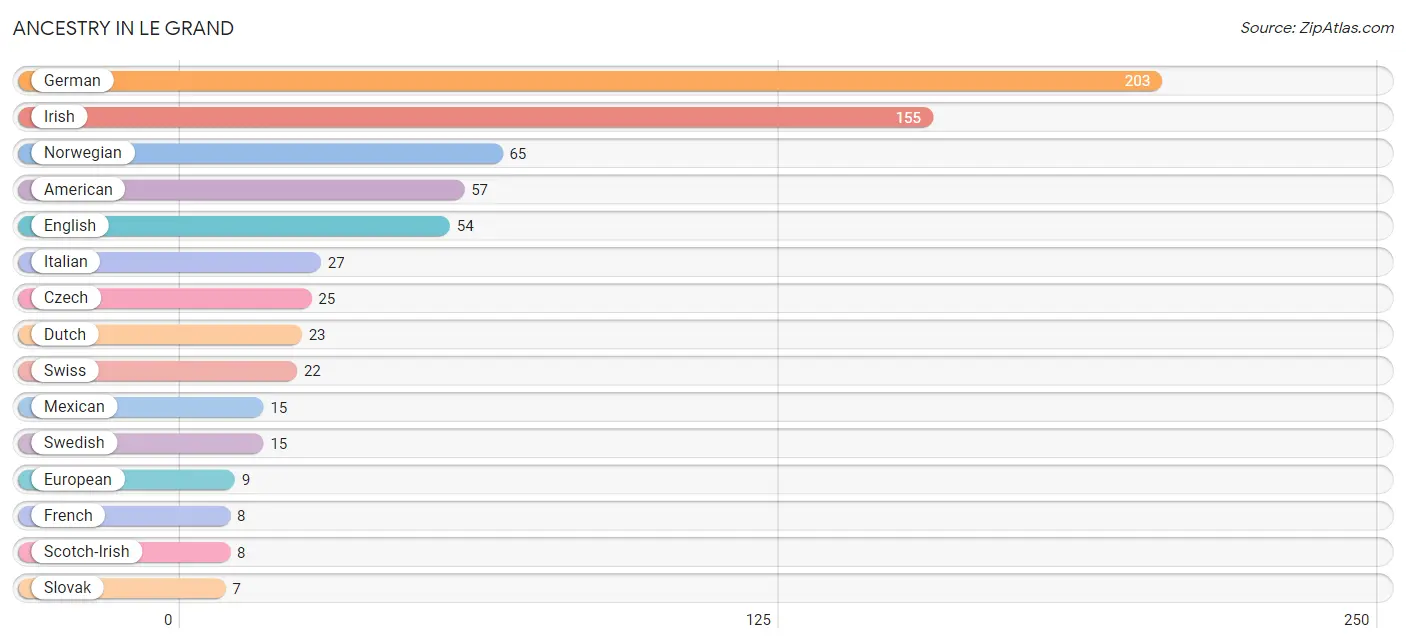
| Ancestry | # Population | % Population |
| American | 57 | 7.2% |
| Czech | 25 | 3.2% |
| Czechoslovakian | 4 | 0.5% |
| Danish | 4 | 0.5% |
| Dutch | 23 | 2.9% |
| English | 54 | 6.8% |
| European | 9 | 1.1% |
| French | 8 | 1.0% |
| German | 203 | 25.7% |
| Irish | 155 | 19.6% |
| Italian | 27 | 3.4% |
| Mexican | 15 | 1.9% |
| Norwegian | 65 | 8.2% |
| Pennsylvania German | 4 | 0.5% |
| Polish | 3 | 0.4% |
| Scotch-Irish | 8 | 1.0% |
| Scottish | 4 | 0.5% |
| Slovak | 7 | 0.9% |
| Swedish | 15 | 1.9% |
| Swiss | 22 | 2.8% | View All 20 Rows |
Immigrants in Le Grand
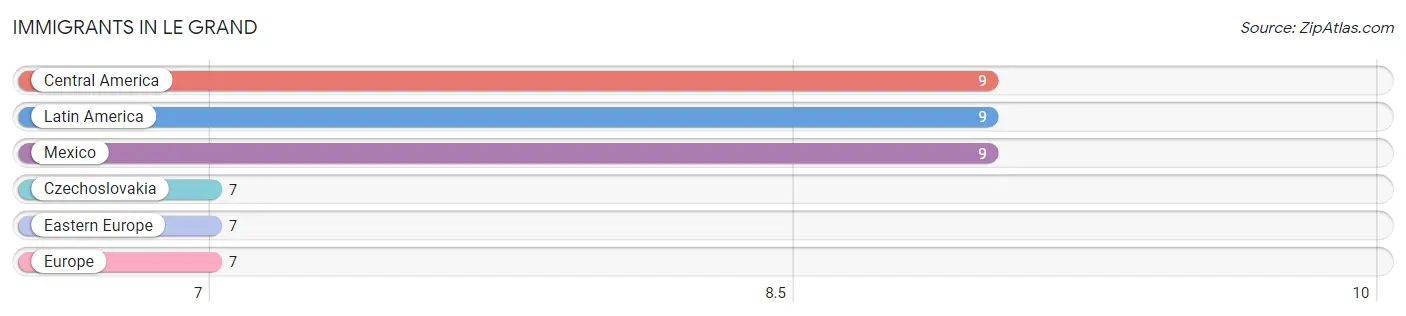
The most numerous immigrant groups reported in Le Grand came from Central America (9 | 1.1%), Latin America (9 | 1.1%), Mexico (9 | 1.1%), Czechoslovakia (7 | 0.9%), and Eastern Europe (7 | 0.9%), together accounting for 5.2% of all Le Grand residents.
| Immigration Origin | # Population | % Population |
| Central America | 9 | 1.1% |
| Czechoslovakia | 7 | 0.9% |
| Eastern Europe | 7 | 0.9% |
| Europe | 7 | 0.9% |
| Latin America | 9 | 1.1% |
| Mexico | 9 | 1.1% | View All 6 Rows |
Sex and Age in Le Grand
Sex and Age in Le Grand
The most populous age groups in Le Grand are 55 to 59 Years (46 | 12.9%) for men and 65 to 69 Years (80 | 18.5%) for women.
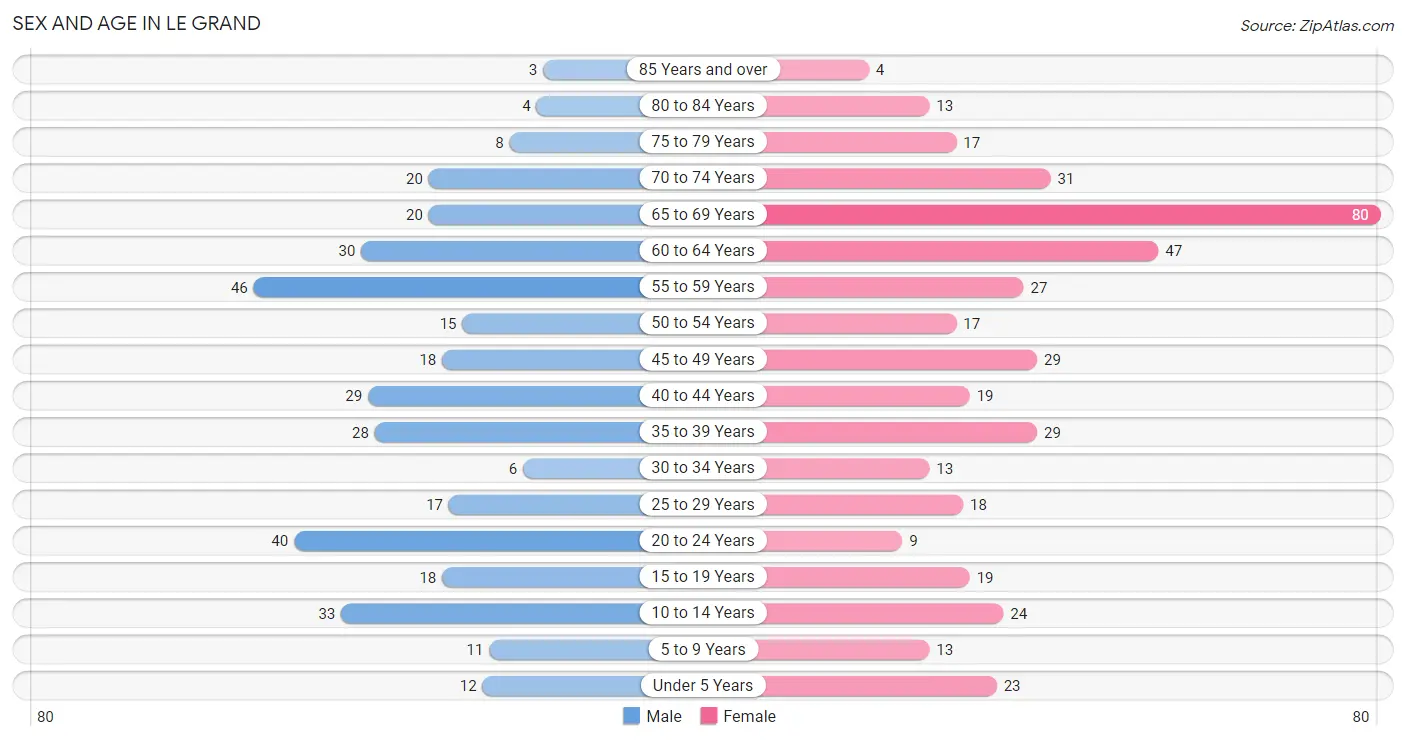
| Age Bracket | Male | Female |
| Under 5 Years | 12 (3.4%) | 23 (5.3%) |
| 5 to 9 Years | 11 (3.1%) | 13 (3.0%) |
| 10 to 14 Years | 33 (9.2%) | 24 (5.6%) |
| 15 to 19 Years | 18 (5.0%) | 19 (4.4%) |
| 20 to 24 Years | 40 (11.2%) | 9 (2.1%) |
| 25 to 29 Years | 17 (4.8%) | 18 (4.2%) |
| 30 to 34 Years | 6 (1.7%) | 13 (3.0%) |
| 35 to 39 Years | 28 (7.8%) | 29 (6.7%) |
| 40 to 44 Years | 29 (8.1%) | 19 (4.4%) |
| 45 to 49 Years | 18 (5.0%) | 29 (6.7%) |
| 50 to 54 Years | 15 (4.2%) | 17 (3.9%) |
| 55 to 59 Years | 46 (12.9%) | 27 (6.2%) |
| 60 to 64 Years | 30 (8.4%) | 47 (10.9%) |
| 65 to 69 Years | 20 (5.6%) | 80 (18.5%) |
| 70 to 74 Years | 20 (5.6%) | 31 (7.2%) |
| 75 to 79 Years | 8 (2.2%) | 17 (3.9%) |
| 80 to 84 Years | 4 (1.1%) | 13 (3.0%) |
| 85 Years and over | 3 (0.8%) | 4 (0.9%) |
| Total | 358 (100.0%) | 432 (100.0%) |
Families and Households in Le Grand
Median Family Size in Le Grand
The median family size in Le Grand is 2.50 persons per family, with single female/mother families (23 | 9.9%) accounting for the largest median family size of 3.3 persons per family. On the other hand, married-couple families (188 | 81.0%) represent the smallest median family size with 2.41 persons per family.
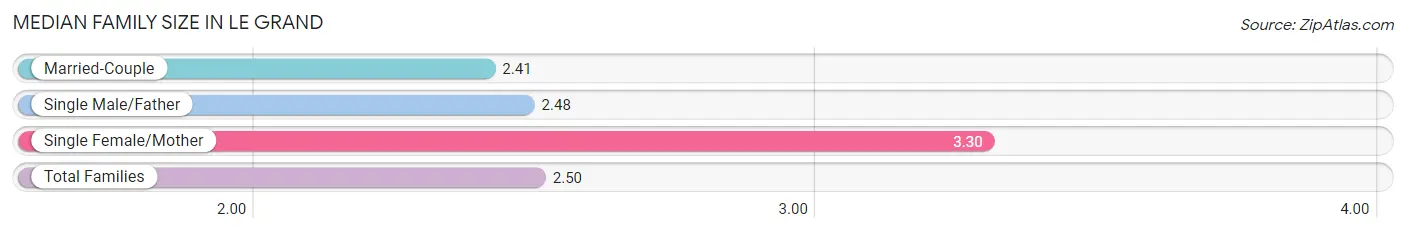
| Family Type | # Families | Family Size |
| Married-Couple | 188 (81.0%) | 2.41 |
| Single Male/Father | 21 (9.0%) | 2.48 |
| Single Female/Mother | 23 (9.9%) | 3.30 |
| Total Families | 232 (100.0%) | 2.50 |
Median Household Size in Le Grand
The median household size in Le Grand is 2.13 persons per household, with single female/mother households (23 | 6.2%) accounting for the largest median household size of 4.04 persons per household. non-family households (139 | 37.5%) represent the smallest median household size with 1.18 persons per household.
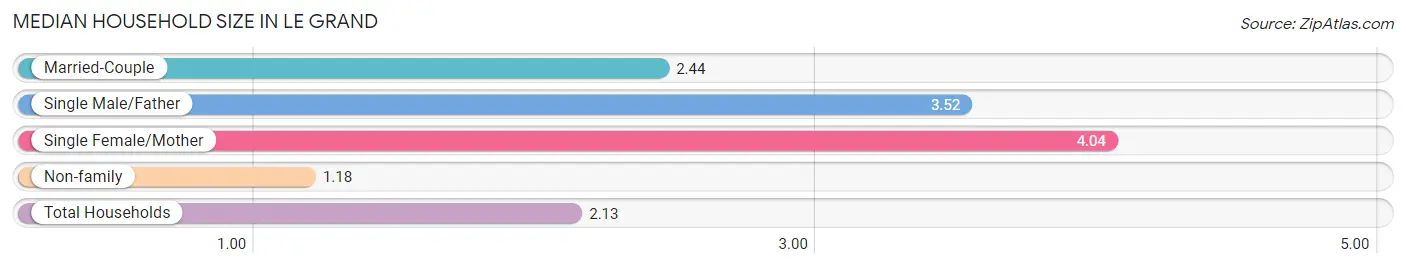
| Household Type | # Households | Household Size |
| Married-Couple | 188 (50.7%) | 2.44 |
| Single Male/Father | 21 (5.7%) | 3.52 |
| Single Female/Mother | 23 (6.2%) | 4.04 |
| Non-family | 139 (37.5%) | 1.18 |
| Total Households | 371 (100.0%) | 2.13 |
Household Size by Marriage Status in Le Grand
Out of a total of 371 households in Le Grand, 232 (62.5%) are family households, while 139 (37.5%) are nonfamily households. The most numerous type of family households are 2-person households, comprising 136, and the most common type of nonfamily households are 1-person households, comprising 117.
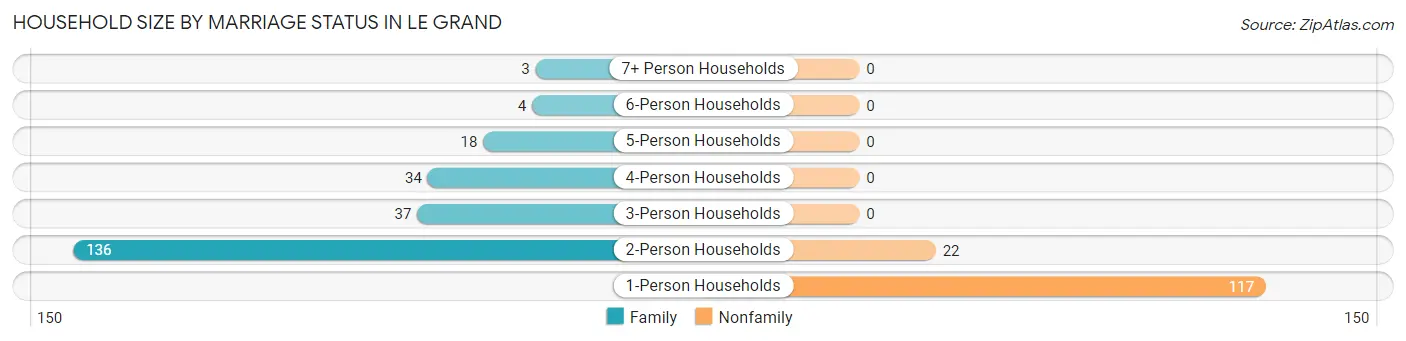
| Household Size | Family Households | Nonfamily Households |
| 1-Person Households | - | 117 (31.5%) |
| 2-Person Households | 136 (36.7%) | 22 (5.9%) |
| 3-Person Households | 37 (10.0%) | 0 (0.0%) |
| 4-Person Households | 34 (9.2%) | 0 (0.0%) |
| 5-Person Households | 18 (4.9%) | 0 (0.0%) |
| 6-Person Households | 4 (1.1%) | 0 (0.0%) |
| 7+ Person Households | 3 (0.8%) | 0 (0.0%) |
| Total | 232 (62.5%) | 139 (37.5%) |
Female Fertility in Le Grand
Fertility by Age in Le Grand
Average fertility rate in Le Grand is 66.0 births per 1,000 women. Women in the age bracket of 35 to 50 years have the highest fertility rate with 77.0 births per 1,000 women. Women in the age bracket of 35 to 50 years acount for 66.7% of all women with births.
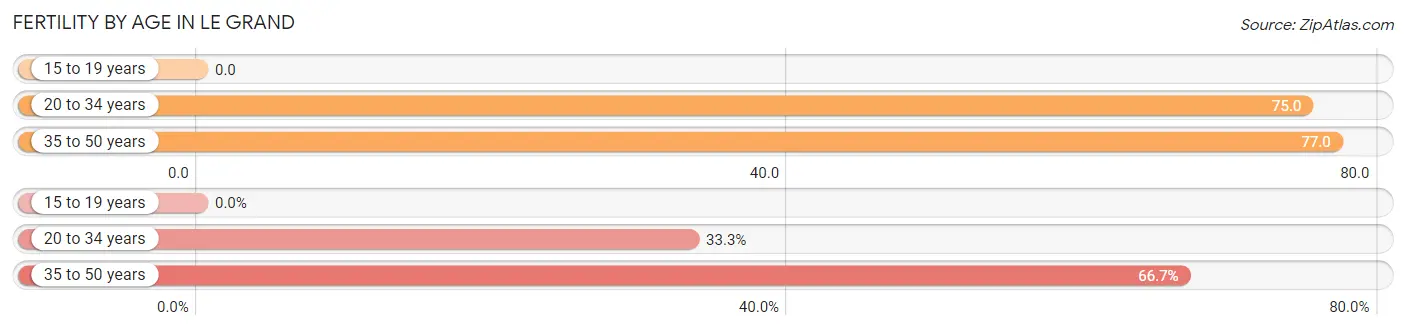
| Age Bracket | Women with Births | Births / 1,000 Women |
| 15 to 19 years | 0 (0.0%) | 0.0 |
| 20 to 34 years | 3 (33.3%) | 75.0 |
| 35 to 50 years | 6 (66.7%) | 77.0 |
| Total | 9 (100.0%) | 66.0 |
Fertility by Age by Marriage Status in Le Grand
55.6% of women with births (9) in Le Grand are married. The highest percentage of unmarried women with births falls into 35 to 50 years age bracket with 66.7% of them unmarried at the time of birth, while the lowest percentage of unmarried women with births belong to 20 to 34 years age bracket with 0.0% of them unmarried.
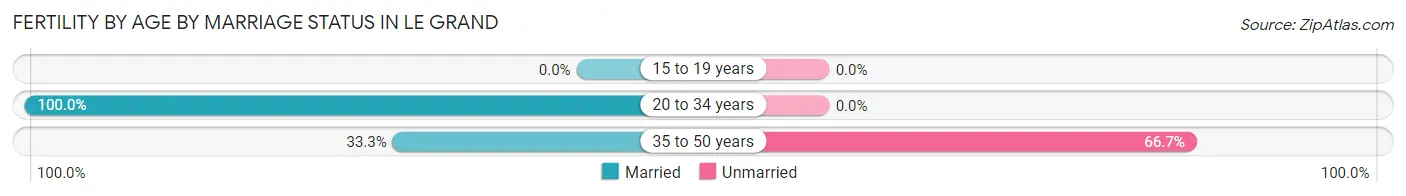
| Age Bracket | Married | Unmarried |
| 15 to 19 years | 0 (0.0%) | 0 (0.0%) |
| 20 to 34 years | 3 (100.0%) | 0 (0.0%) |
| 35 to 50 years | 2 (33.3%) | 4 (66.7%) |
| Total | 5 (55.6%) | 4 (44.4%) |
Fertility by Education in Le Grand
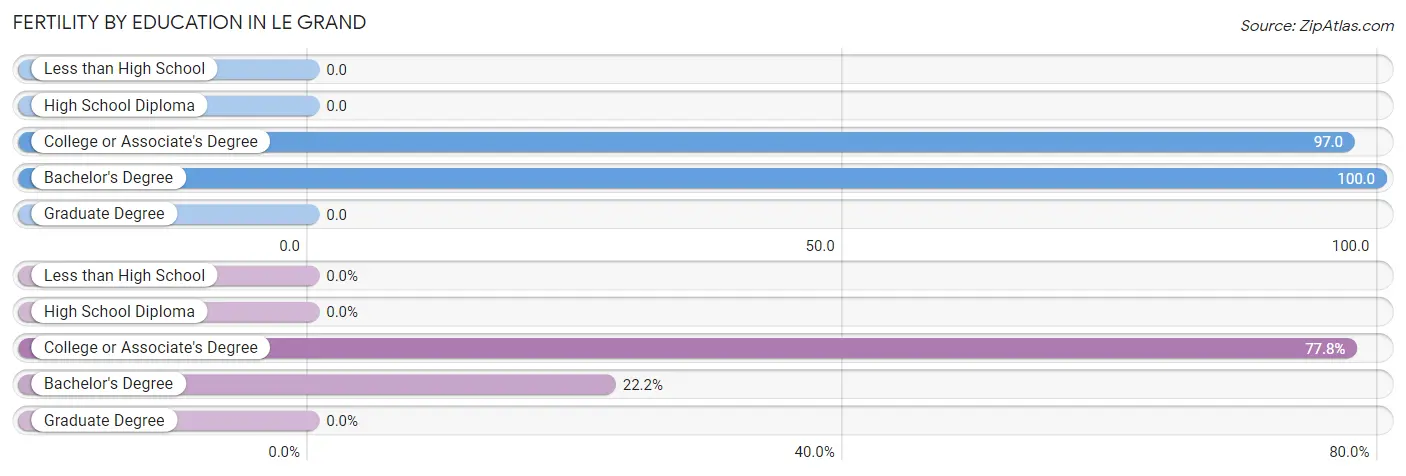
| Educational Attainment | Women with Births | Births / 1,000 Women |
| Less than High School | 0 (0.0%) | 0.0 |
| High School Diploma | 0 (0.0%) | 0.0 |
| College or Associate's Degree | 7 (77.8%) | 97.0 |
| Bachelor's Degree | 2 (22.2%) | 100.0 |
| Graduate Degree | 0 (0.0%) | 0.0 |
| Total | 9 (100.0%) | 66.0 |
Fertility by Education by Marriage Status in Le Grand
44.4% of women with births in Le Grand are unmarried. Women with the educational attainment of bachelor's degree are most likely to be married with 100.0% of them married at childbirth, while women with the educational attainment of college or associate's degree are least likely to be married with 57.1% of them unmarried at childbirth.
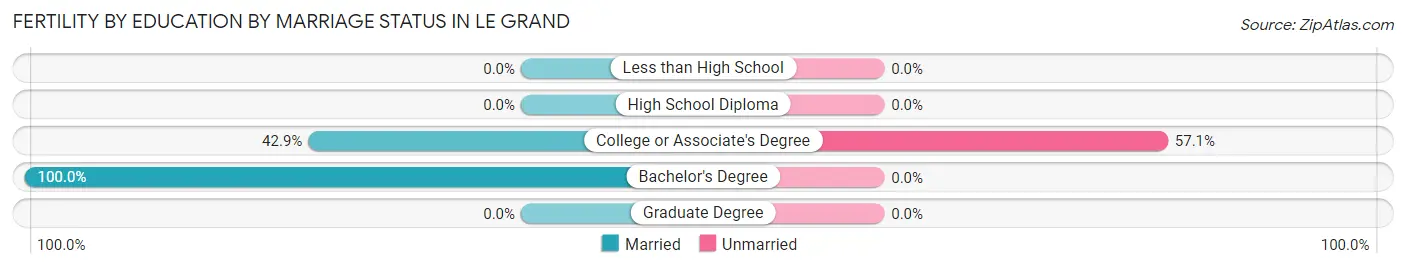
| Educational Attainment | Married | Unmarried |
| Less than High School | 0 (0.0%) | 0 (0.0%) |
| High School Diploma | 0 (0.0%) | 0 (0.0%) |
| College or Associate's Degree | 3 (42.9%) | 4 (57.1%) |
| Bachelor's Degree | 2 (100.0%) | 0 (0.0%) |
| Graduate Degree | 0 (0.0%) | 0 (0.0%) |
| Total | 5 (55.6%) | 4 (44.4%) |
Employment Characteristics in Le Grand
Employment by Class of Employer in Le Grand
Among the 402 employed individuals in Le Grand, private company employees (234 | 58.2%), not-for-profit organizations (62 | 15.4%), and local government employees (32 | 8.0%) make up the most common classes of employment.
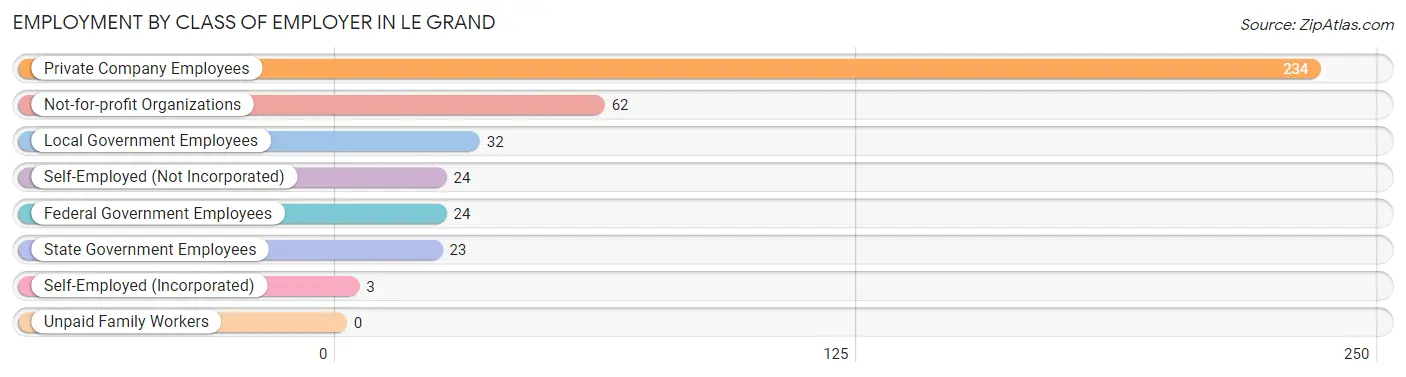
| Employer Class | # Employees | % Employees |
| Private Company Employees | 234 | 58.2% |
| Self-Employed (Incorporated) | 3 | 0.7% |
| Self-Employed (Not Incorporated) | 24 | 6.0% |
| Not-for-profit Organizations | 62 | 15.4% |
| Local Government Employees | 32 | 8.0% |
| State Government Employees | 23 | 5.7% |
| Federal Government Employees | 24 | 6.0% |
| Unpaid Family Workers | 0 | 0.0% |
| Total | 402 | 100.0% |
Employment Status by Age in Le Grand
According to the labor force statistics for Le Grand, out of the total population over 16 years of age (663), 62.4% or 414 individuals are in the labor force, with 2.4% or 10 of them unemployed. The age group with the highest labor force participation rate is 30 to 34 years, with 100.0% or 19 individuals in the labor force. Within the labor force, the 20 to 24 years age range has the highest percentage of unemployed individuals, with 24.4% or 10 of them being unemployed.
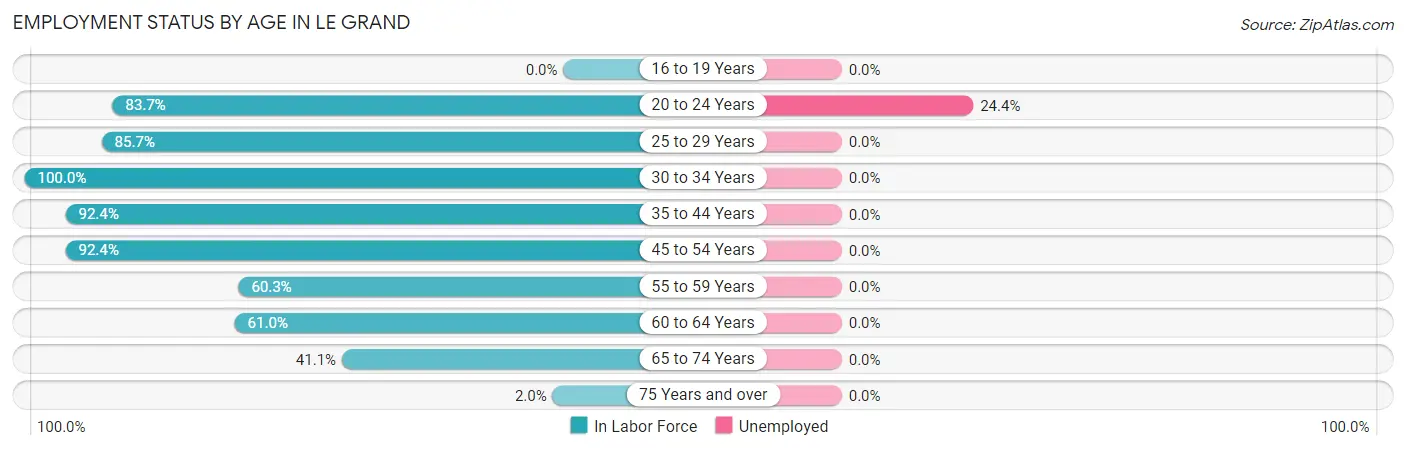
| Age Bracket | In Labor Force | Unemployed |
| 16 to 19 Years | 0 (0.0%) | 0 (0.0%) |
| 20 to 24 Years | 41 (83.7%) | 10 (24.4%) |
| 25 to 29 Years | 30 (85.7%) | 0 (0.0%) |
| 30 to 34 Years | 19 (100.0%) | 0 (0.0%) |
| 35 to 44 Years | 97 (92.4%) | 0 (0.0%) |
| 45 to 54 Years | 73 (92.4%) | 0 (0.0%) |
| 55 to 59 Years | 44 (60.3%) | 0 (0.0%) |
| 60 to 64 Years | 47 (61.0%) | 0 (0.0%) |
| 65 to 74 Years | 62 (41.1%) | 0 (0.0%) |
| 75 Years and over | 1 (2.0%) | 0 (0.0%) |
| Total | 414 (62.4%) | 10 (2.4%) |
Employment Status by Educational Attainment in Le Grand
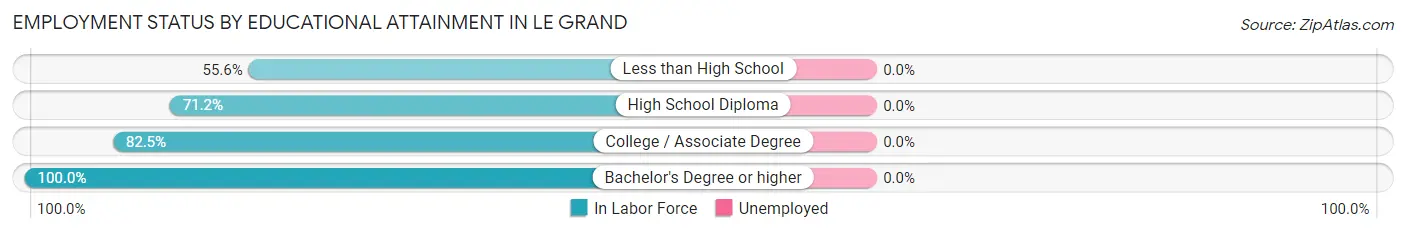
| Educational Attainment | In Labor Force | Unemployed |
| Less than High School | 10 (55.6%) | 0 (0.0%) |
| High School Diploma | 89 (71.2%) | 0 (0.0%) |
| College / Associate Degree | 160 (82.5%) | 0 (0.0%) |
| Bachelor's Degree or higher | 51 (100.0%) | 0 (0.0%) |
| Total | 310 (79.9%) | 0 (0.0%) |
Employment Occupations by Sex in Le Grand
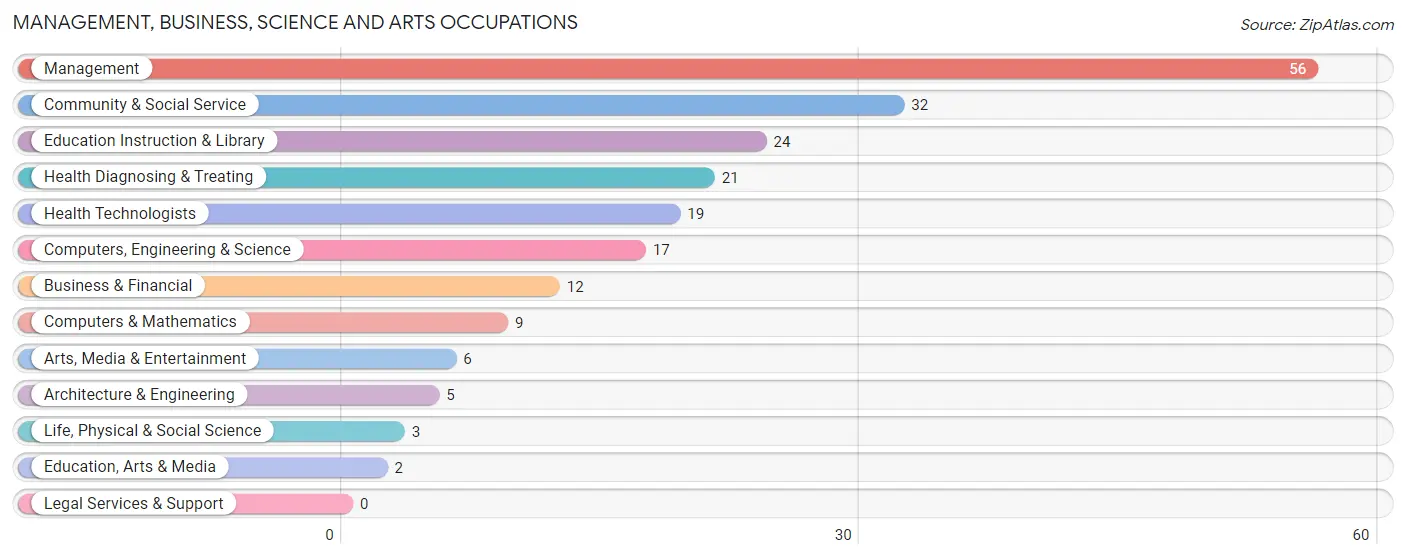
Management, Business, Science and Arts Occupations
The most common Management, Business, Science and Arts occupations in Le Grand are Management (56 | 13.9%), Community & Social Service (32 | 7.9%), Education Instruction & Library (24 | 5.9%), Health Diagnosing & Treating (21 | 5.2%), and Health Technologists (19 | 4.7%).
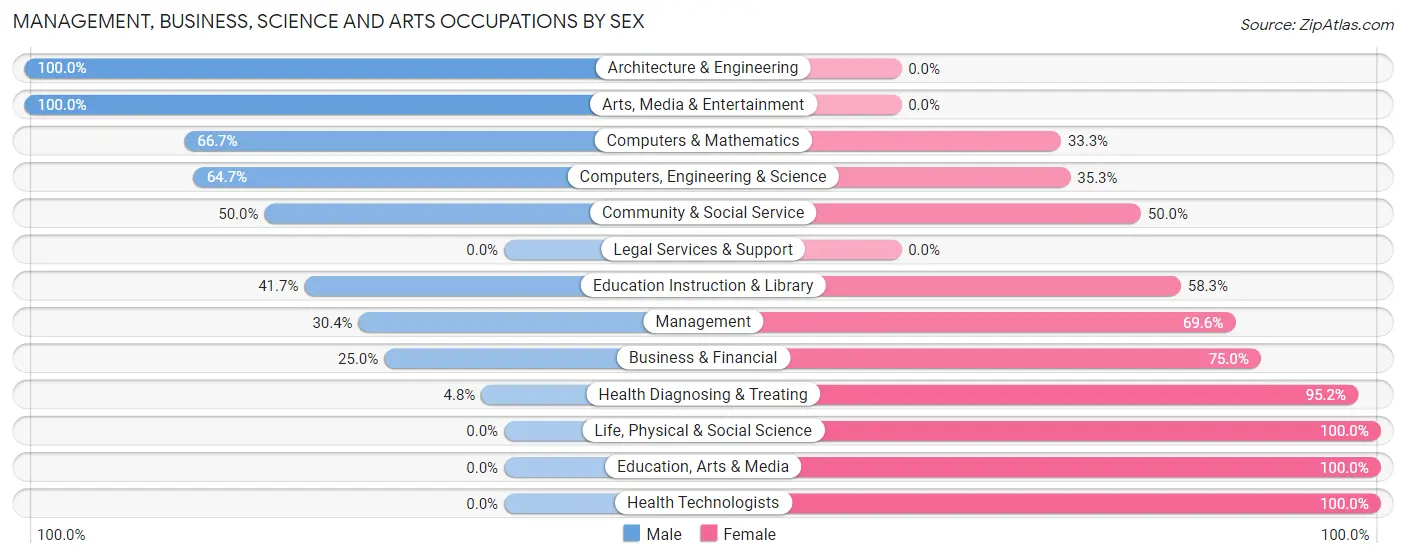
Management, Business, Science and Arts Occupations by Sex
Within the Management, Business, Science and Arts occupations in Le Grand, the most male-oriented occupations are Architecture & Engineering (100.0%), Arts, Media & Entertainment (100.0%), and Computers & Mathematics (66.7%), while the most female-oriented occupations are Life, Physical & Social Science (100.0%), Education, Arts & Media (100.0%), and Health Technologists (100.0%).
| Occupation | Male | Female |
| Management | 17 (30.4%) | 39 (69.6%) |
| Business & Financial | 3 (25.0%) | 9 (75.0%) |
| Computers, Engineering & Science | 11 (64.7%) | 6 (35.3%) |
| Computers & Mathematics | 6 (66.7%) | 3 (33.3%) |
| Architecture & Engineering | 5 (100.0%) | 0 (0.0%) |
| Life, Physical & Social Science | 0 (0.0%) | 3 (100.0%) |
| Community & Social Service | 16 (50.0%) | 16 (50.0%) |
| Education, Arts & Media | 0 (0.0%) | 2 (100.0%) |
| Legal Services & Support | 0 (0.0%) | 0 (0.0%) |
| Education Instruction & Library | 10 (41.7%) | 14 (58.3%) |
| Arts, Media & Entertainment | 6 (100.0%) | 0 (0.0%) |
| Health Diagnosing & Treating | 1 (4.8%) | 20 (95.2%) |
| Health Technologists | 0 (0.0%) | 19 (100.0%) |
| Total (Category) | 48 (34.8%) | 90 (65.2%) |
| Total (Overall) | 182 (45.1%) | 222 (54.9%) |
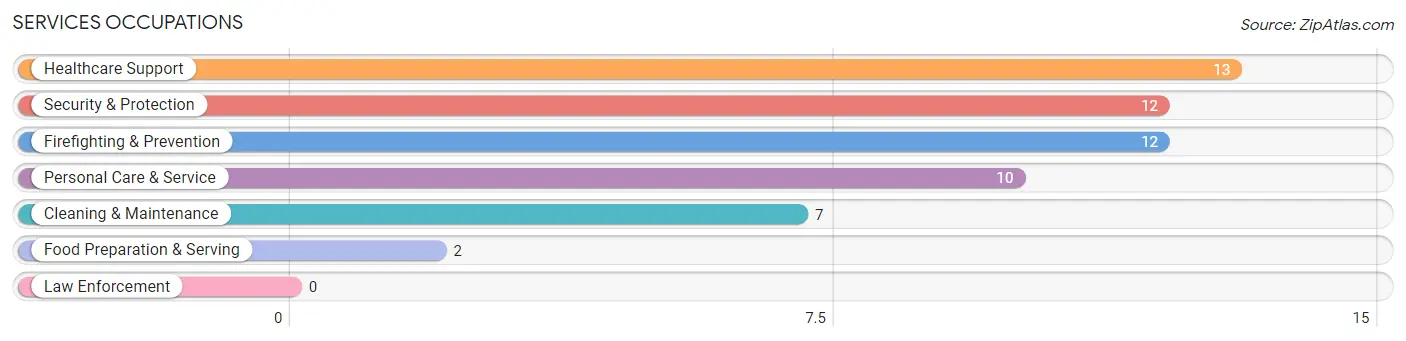
Services Occupations
The most common Services occupations in Le Grand are Healthcare Support (13 | 3.2%), Security & Protection (12 | 3.0%), Firefighting & Prevention (12 | 3.0%), Personal Care & Service (10 | 2.5%), and Cleaning & Maintenance (7 | 1.7%).
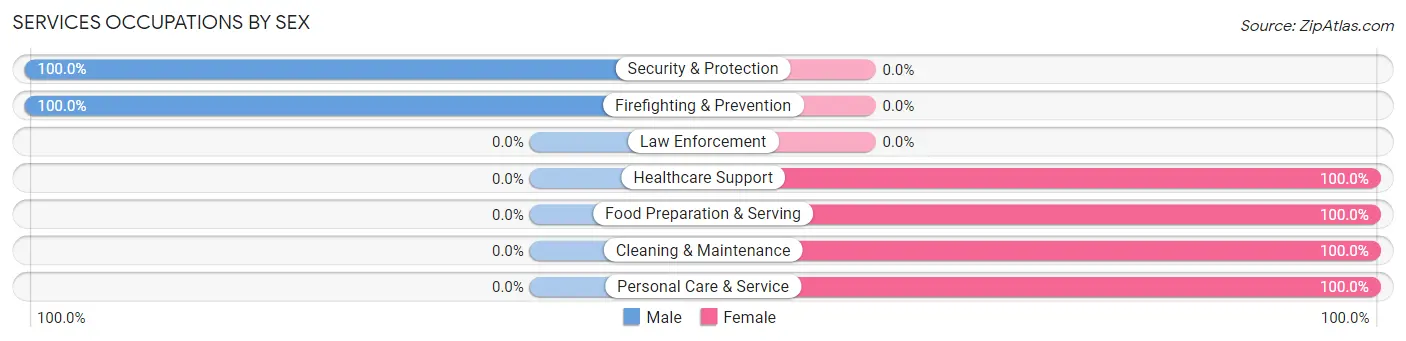
Services Occupations by Sex
Within the Services occupations in Le Grand, the most male-oriented occupations are Security & Protection (100.0%), and Firefighting & Prevention (100.0%), while the most female-oriented occupations are Healthcare Support (100.0%), Food Preparation & Serving (100.0%), and Cleaning & Maintenance (100.0%).
| Occupation | Male | Female |
| Healthcare Support | 0 (0.0%) | 13 (100.0%) |
| Security & Protection | 12 (100.0%) | 0 (0.0%) |
| Firefighting & Prevention | 12 (100.0%) | 0 (0.0%) |
| Law Enforcement | 0 (0.0%) | 0 (0.0%) |
| Food Preparation & Serving | 0 (0.0%) | 2 (100.0%) |
| Cleaning & Maintenance | 0 (0.0%) | 7 (100.0%) |
| Personal Care & Service | 0 (0.0%) | 10 (100.0%) |
| Total (Category) | 12 (27.3%) | 32 (72.7%) |
| Total (Overall) | 182 (45.1%) | 222 (54.9%) |
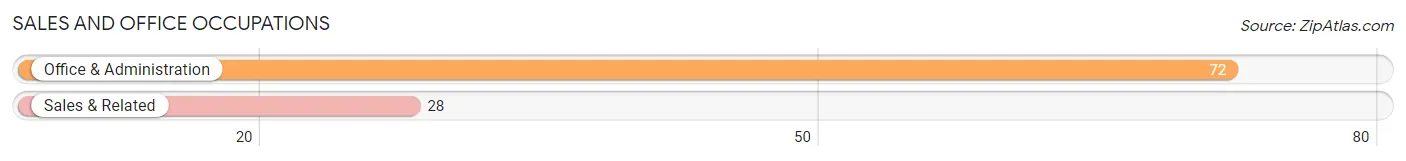
Sales and Office Occupations
The most common Sales and Office occupations in Le Grand are Office & Administration (72 | 17.8%), and Sales & Related (28 | 6.9%).
Sales and Office Occupations by Sex
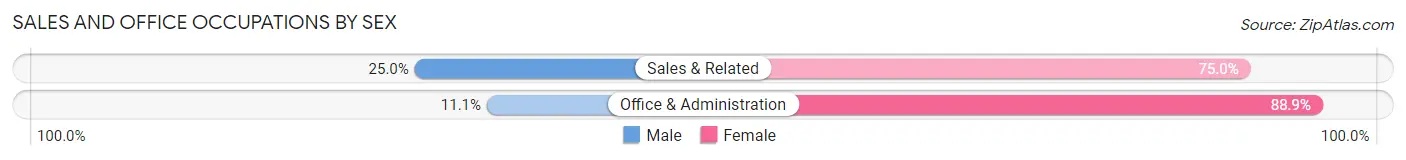
| Occupation | Male | Female |
| Sales & Related | 7 (25.0%) | 21 (75.0%) |
| Office & Administration | 8 (11.1%) | 64 (88.9%) |
| Total (Category) | 15 (15.0%) | 85 (85.0%) |
| Total (Overall) | 182 (45.1%) | 222 (54.9%) |
Natural Resources, Construction and Maintenance Occupations
The most common Natural Resources, Construction and Maintenance occupations in Le Grand are Construction & Extraction (31 | 7.7%), and Installation, Maintenance & Repair (12 | 3.0%).

Natural Resources, Construction and Maintenance Occupations by Sex
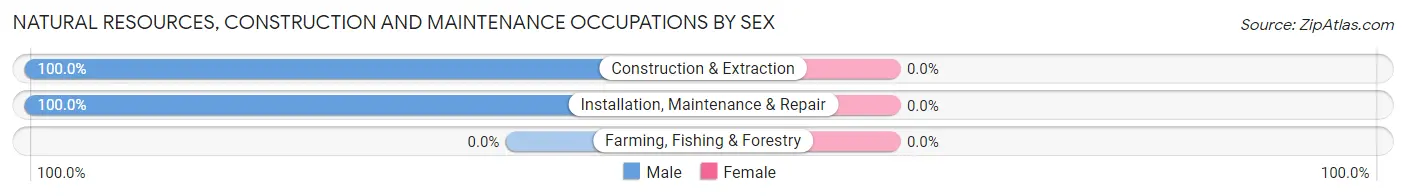
| Occupation | Male | Female |
| Farming, Fishing & Forestry | 0 (0.0%) | 0 (0.0%) |
| Construction & Extraction | 31 (100.0%) | 0 (0.0%) |
| Installation, Maintenance & Repair | 12 (100.0%) | 0 (0.0%) |
| Total (Category) | 43 (100.0%) | 0 (0.0%) |
| Total (Overall) | 182 (45.1%) | 222 (54.9%) |
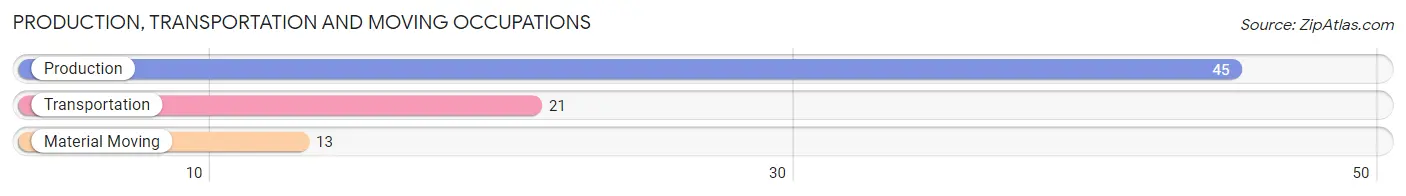
Production, Transportation and Moving Occupations
The most common Production, Transportation and Moving occupations in Le Grand are Production (45 | 11.1%), Transportation (21 | 5.2%), and Material Moving (13 | 3.2%).
Production, Transportation and Moving Occupations by Sex
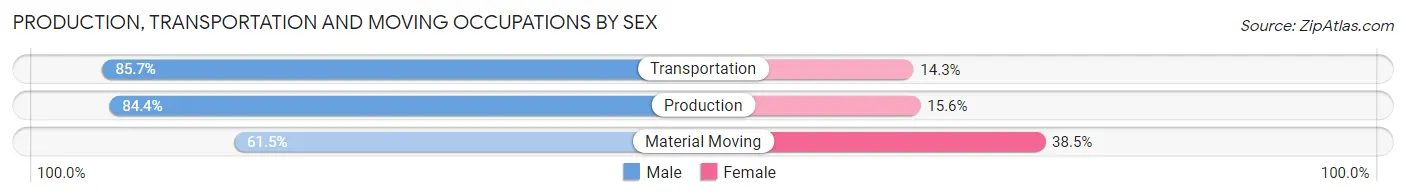
| Occupation | Male | Female |
| Production | 38 (84.4%) | 7 (15.6%) |
| Transportation | 18 (85.7%) | 3 (14.3%) |
| Material Moving | 8 (61.5%) | 5 (38.5%) |
| Total (Category) | 64 (81.0%) | 15 (19.0%) |
| Total (Overall) | 182 (45.1%) | 222 (54.9%) |
Employment Industries by Sex in Le Grand
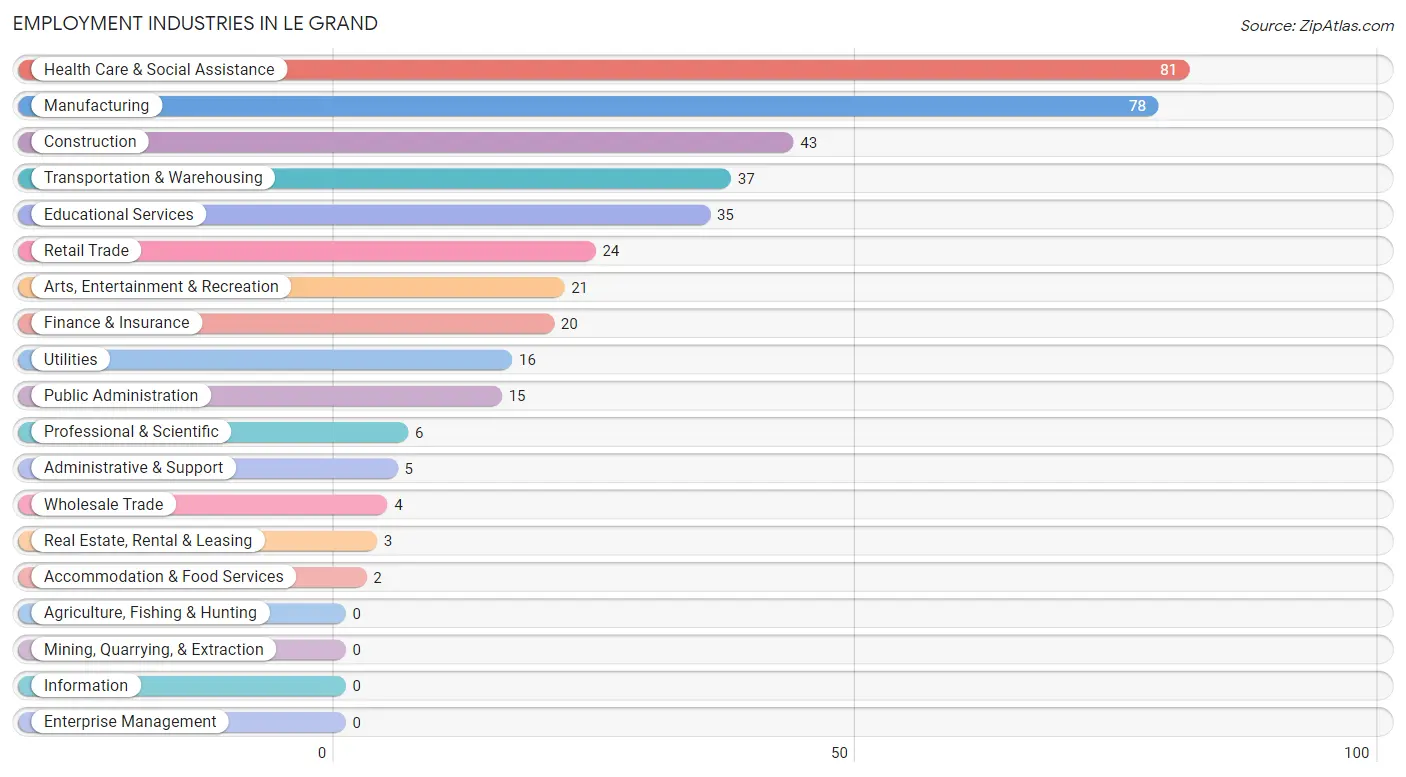
Employment Industries in Le Grand
The major employment industries in Le Grand include Health Care & Social Assistance (81 | 20.1%), Manufacturing (78 | 19.3%), Construction (43 | 10.6%), Transportation & Warehousing (37 | 9.2%), and Educational Services (35 | 8.7%).
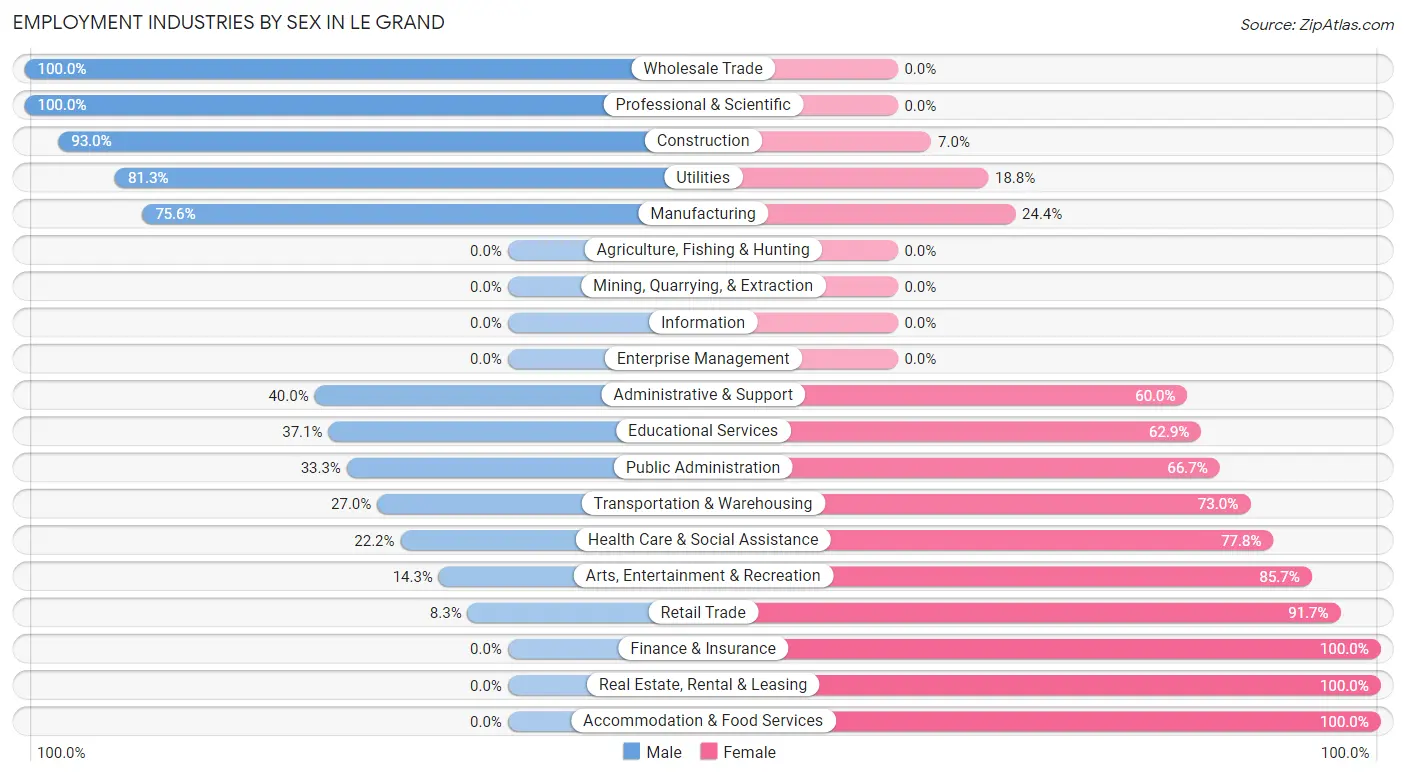
Employment Industries by Sex in Le Grand
The Le Grand industries that see more men than women are Wholesale Trade (100.0%), Professional & Scientific (100.0%), and Construction (93.0%), whereas the industries that tend to have a higher number of women are Finance & Insurance (100.0%), Real Estate, Rental & Leasing (100.0%), and Accommodation & Food Services (100.0%).
| Industry | Male | Female |
| Agriculture, Fishing & Hunting | 0 (0.0%) | 0 (0.0%) |
| Mining, Quarrying, & Extraction | 0 (0.0%) | 0 (0.0%) |
| Construction | 40 (93.0%) | 3 (7.0%) |
| Manufacturing | 59 (75.6%) | 19 (24.4%) |
| Wholesale Trade | 4 (100.0%) | 0 (0.0%) |
| Retail Trade | 2 (8.3%) | 22 (91.7%) |
| Transportation & Warehousing | 10 (27.0%) | 27 (73.0%) |
| Utilities | 13 (81.2%) | 3 (18.8%) |
| Information | 0 (0.0%) | 0 (0.0%) |
| Finance & Insurance | 0 (0.0%) | 20 (100.0%) |
| Real Estate, Rental & Leasing | 0 (0.0%) | 3 (100.0%) |
| Professional & Scientific | 6 (100.0%) | 0 (0.0%) |
| Enterprise Management | 0 (0.0%) | 0 (0.0%) |
| Administrative & Support | 2 (40.0%) | 3 (60.0%) |
| Educational Services | 13 (37.1%) | 22 (62.9%) |
| Health Care & Social Assistance | 18 (22.2%) | 63 (77.8%) |
| Arts, Entertainment & Recreation | 3 (14.3%) | 18 (85.7%) |
| Accommodation & Food Services | 0 (0.0%) | 2 (100.0%) |
| Public Administration | 5 (33.3%) | 10 (66.7%) |
| Total | 182 (45.1%) | 222 (54.9%) |
Education in Le Grand
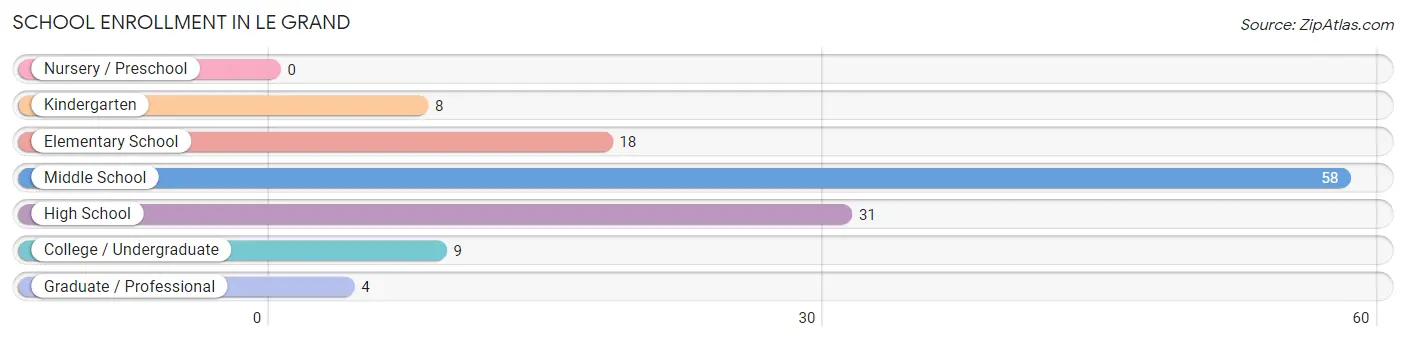
School Enrollment in Le Grand
The most common levels of schooling among the 128 students in Le Grand are middle school (58 | 45.3%), high school (31 | 24.2%), and elementary school (18 | 14.1%).
| School Level | # Students | % Students |
| Nursery / Preschool | 0 | 0.0% |
| Kindergarten | 8 | 6.2% |
| Elementary School | 18 | 14.1% |
| Middle School | 58 | 45.3% |
| High School | 31 | 24.2% |
| College / Undergraduate | 9 | 7.0% |
| Graduate / Professional | 4 | 3.1% |
| Total | 128 | 100.0% |
School Enrollment by Age by Funding Source in Le Grand
Out of a total of 128 students who are enrolled in schools in Le Grand, 15 (11.7%) attend a private institution, while the remaining 113 (88.3%) are enrolled in public schools. The age group of 25 to 34 year olds has the highest likelihood of being enrolled in private schools, with 1 (100.0% in the age bracket) enrolled. Conversely, the age group of 20 to 24 year olds has the lowest likelihood of being enrolled in a private school, with 9 (100.0% in the age bracket) attending a public institution.
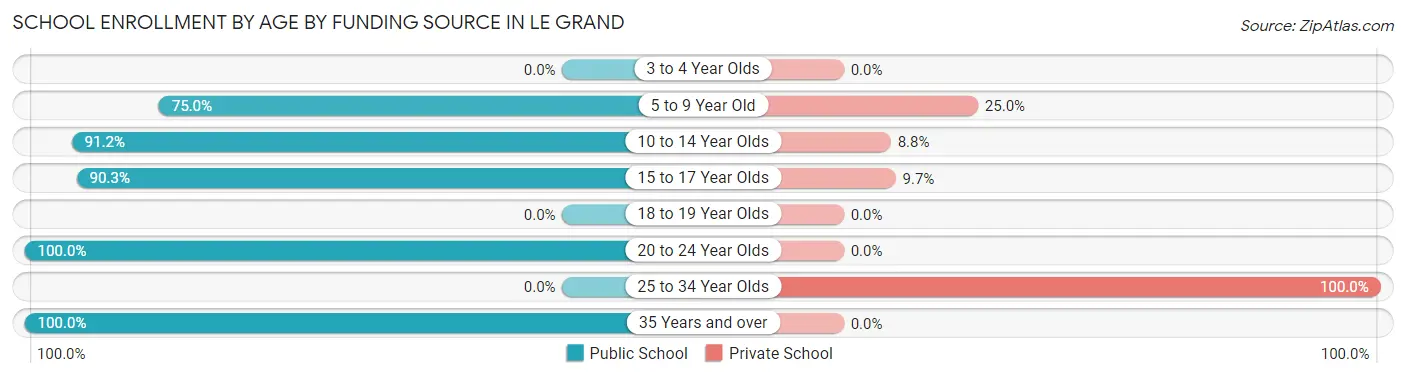
| Age Bracket | Public School | Private School |
| 3 to 4 Year Olds | 0 (0.0%) | 0 (0.0%) |
| 5 to 9 Year Old | 18 (75.0%) | 6 (25.0%) |
| 10 to 14 Year Olds | 52 (91.2%) | 5 (8.8%) |
| 15 to 17 Year Olds | 28 (90.3%) | 3 (9.7%) |
| 18 to 19 Year Olds | 0 (0.0%) | 0 (0.0%) |
| 20 to 24 Year Olds | 9 (100.0%) | 0 (0.0%) |
| 25 to 34 Year Olds | 0 (0.0%) | 1 (100.0%) |
| 35 Years and over | 6 (100.0%) | 0 (0.0%) |
| Total | 113 (88.3%) | 15 (11.7%) |
Educational Attainment by Field of Study in Le Grand
Education (51 | 47.2%), business (13 | 12.0%), science & technology (10 | 9.3%), communications (7 | 6.5%), and psychology (5 | 4.6%) are the most common fields of study among 108 individuals in Le Grand who have obtained a bachelor's degree or higher.
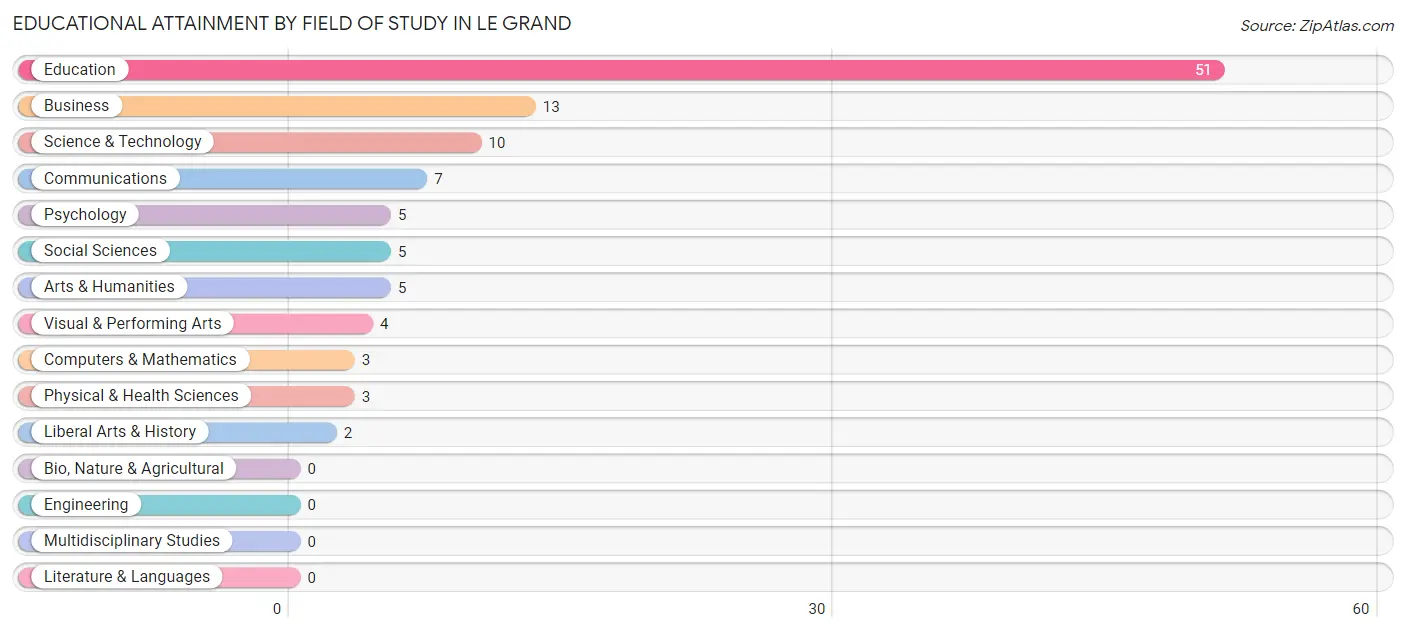
| Field of Study | # Graduates | % Graduates |
| Computers & Mathematics | 3 | 2.8% |
| Bio, Nature & Agricultural | 0 | 0.0% |
| Physical & Health Sciences | 3 | 2.8% |
| Psychology | 5 | 4.6% |
| Social Sciences | 5 | 4.6% |
| Engineering | 0 | 0.0% |
| Multidisciplinary Studies | 0 | 0.0% |
| Science & Technology | 10 | 9.3% |
| Business | 13 | 12.0% |
| Education | 51 | 47.2% |
| Literature & Languages | 0 | 0.0% |
| Liberal Arts & History | 2 | 1.8% |
| Visual & Performing Arts | 4 | 3.7% |
| Communications | 7 | 6.5% |
| Arts & Humanities | 5 | 4.6% |
| Total | 108 | 100.0% |
Transportation & Commute in Le Grand
Vehicle Availability by Sex in Le Grand
The most prevalent vehicle ownership categories in Le Grand are males with 3 vehicles (72, accounting for 39.6%) and females with 3 vehicles (54, making up 32.7%).
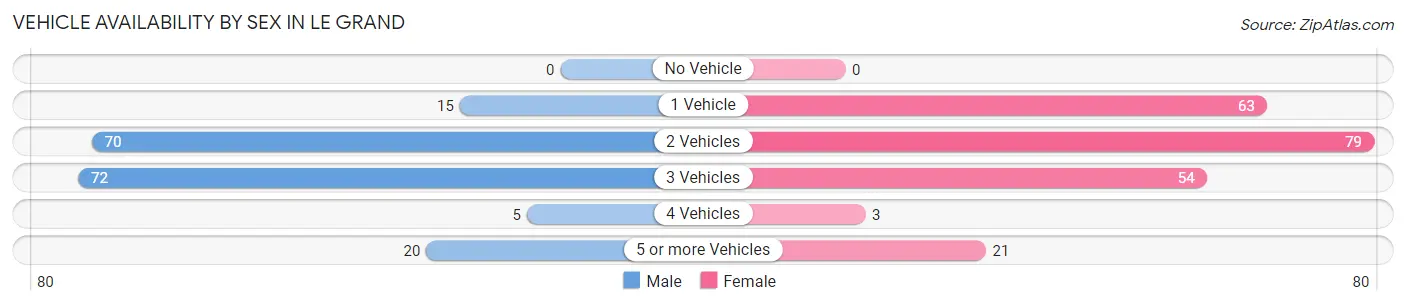
| Vehicles Available | Male | Female |
| No Vehicle | 0 (0.0%) | 0 (0.0%) |
| 1 Vehicle | 15 (8.2%) | 63 (28.6%) |
| 2 Vehicles | 70 (38.5%) | 79 (35.9%) |
| 3 Vehicles | 72 (39.6%) | 54 (24.5%) |
| 4 Vehicles | 5 (2.8%) | 3 (1.4%) |
| 5 or more Vehicles | 20 (11.0%) | 21 (9.6%) |
| Total | 182 (100.0%) | 220 (100.0%) |
Commute Time in Le Grand
The most frequently occuring commute durations in Le Grand are 15 to 19 minutes (108 commuters, 29.3%), 10 to 14 minutes (82 commuters, 22.3%), and 5 to 9 minutes (57 commuters, 15.5%).
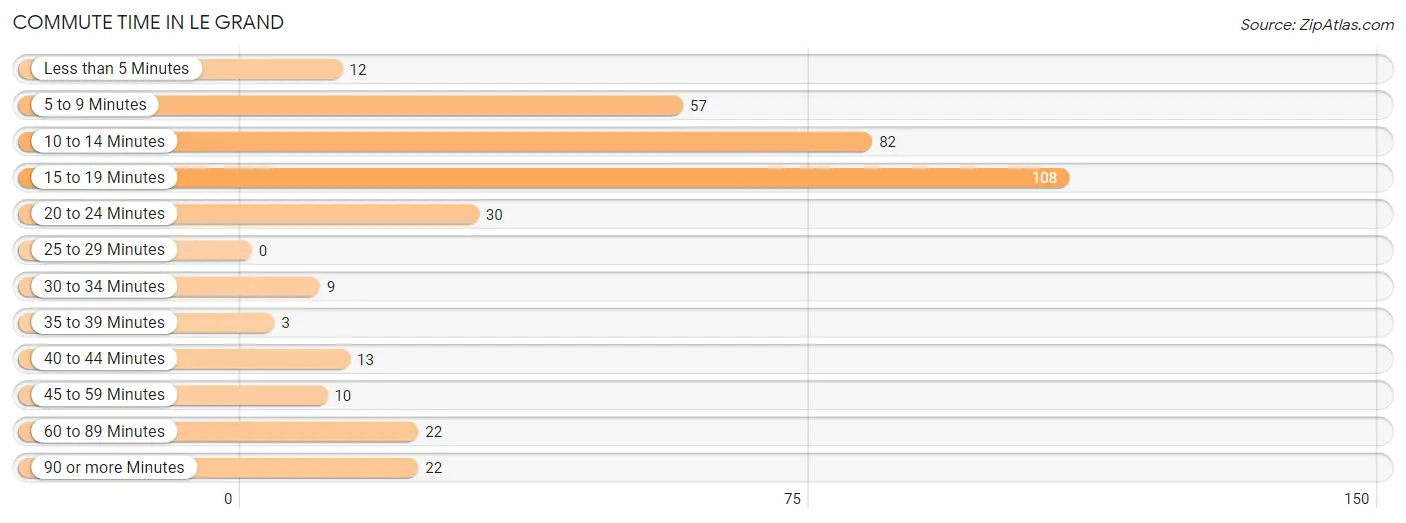
| Commute Time | # Commuters | % Commuters |
| Less than 5 Minutes | 12 | 3.3% |
| 5 to 9 Minutes | 57 | 15.5% |
| 10 to 14 Minutes | 82 | 22.3% |
| 15 to 19 Minutes | 108 | 29.3% |
| 20 to 24 Minutes | 30 | 8.2% |
| 25 to 29 Minutes | 0 | 0.0% |
| 30 to 34 Minutes | 9 | 2.5% |
| 35 to 39 Minutes | 3 | 0.8% |
| 40 to 44 Minutes | 13 | 3.5% |
| 45 to 59 Minutes | 10 | 2.7% |
| 60 to 89 Minutes | 22 | 6.0% |
| 90 or more Minutes | 22 | 6.0% |
Commute Time by Sex in Le Grand
The most common commute times in Le Grand are 10 to 14 minutes (43 commuters, 24.9%) for males and 15 to 19 minutes (66 commuters, 33.9%) for females.
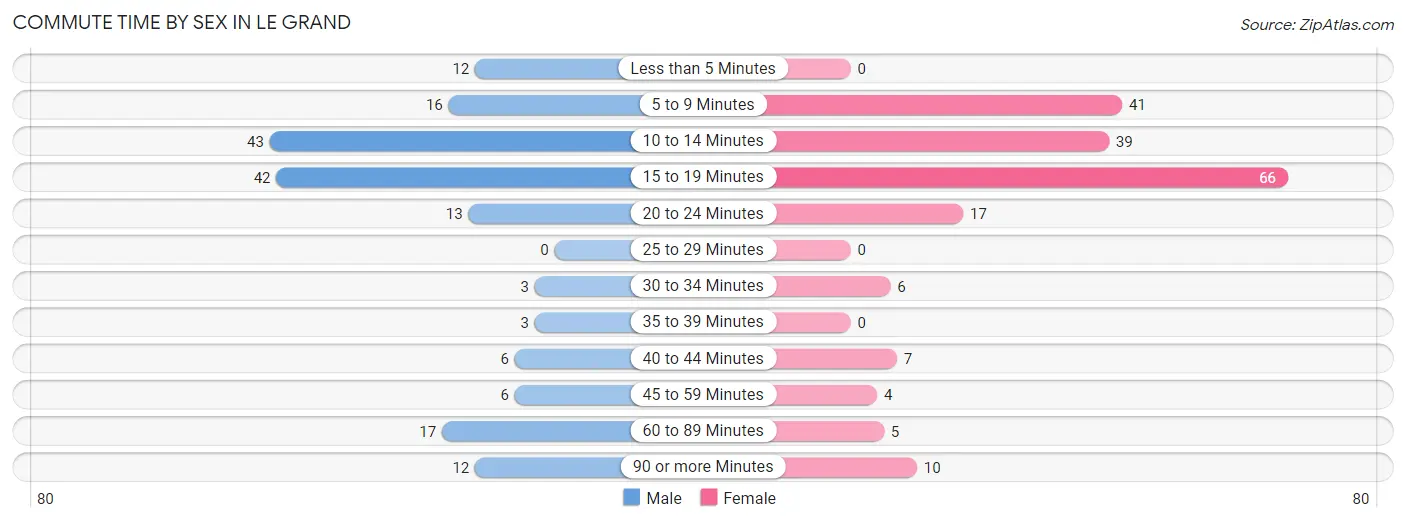
| Commute Time | Male | Female |
| Less than 5 Minutes | 12 (6.9%) | 0 (0.0%) |
| 5 to 9 Minutes | 16 (9.2%) | 41 (21.0%) |
| 10 to 14 Minutes | 43 (24.9%) | 39 (20.0%) |
| 15 to 19 Minutes | 42 (24.3%) | 66 (33.9%) |
| 20 to 24 Minutes | 13 (7.5%) | 17 (8.7%) |
| 25 to 29 Minutes | 0 (0.0%) | 0 (0.0%) |
| 30 to 34 Minutes | 3 (1.7%) | 6 (3.1%) |
| 35 to 39 Minutes | 3 (1.7%) | 0 (0.0%) |
| 40 to 44 Minutes | 6 (3.5%) | 7 (3.6%) |
| 45 to 59 Minutes | 6 (3.5%) | 4 (2.1%) |
| 60 to 89 Minutes | 17 (9.8%) | 5 (2.6%) |
| 90 or more Minutes | 12 (6.9%) | 10 (5.1%) |
Time of Departure to Work by Sex in Le Grand
The most frequent times of departure to work in Le Grand are 7:00 AM to 7:29 AM (37, 21.4%) for males and 7:30 AM to 7:59 AM (42, 21.5%) for females.
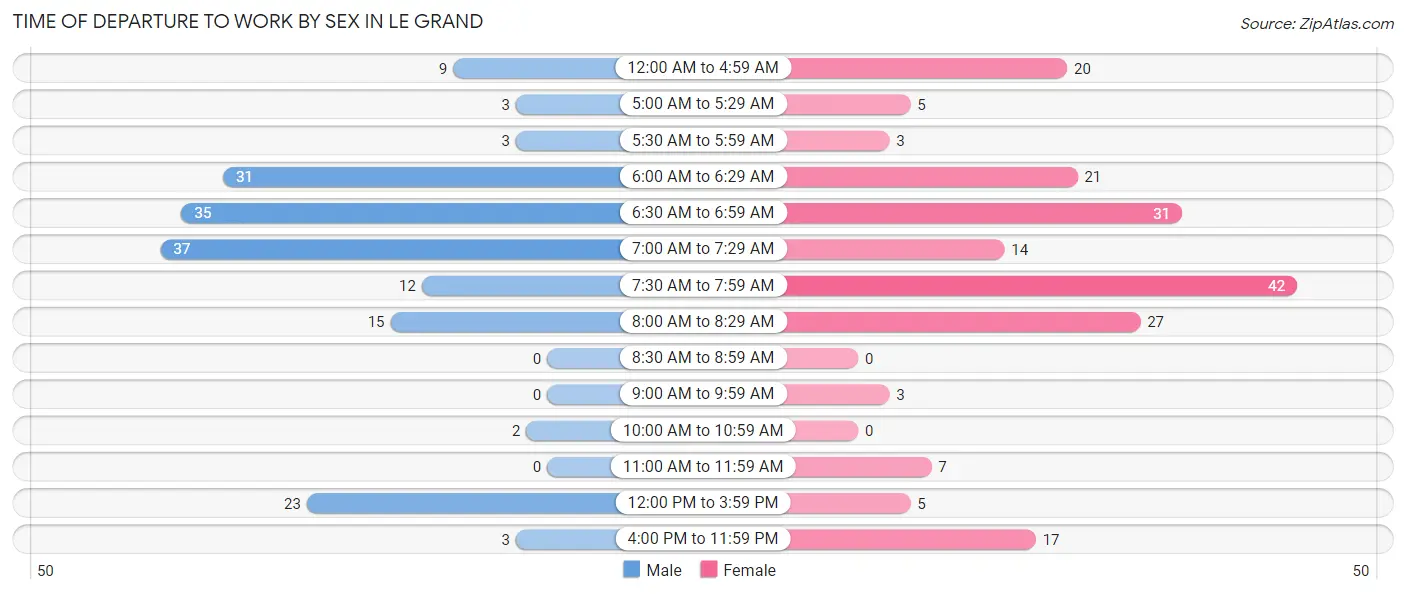
| Time of Departure | Male | Female |
| 12:00 AM to 4:59 AM | 9 (5.2%) | 20 (10.3%) |
| 5:00 AM to 5:29 AM | 3 (1.7%) | 5 (2.6%) |
| 5:30 AM to 5:59 AM | 3 (1.7%) | 3 (1.5%) |
| 6:00 AM to 6:29 AM | 31 (17.9%) | 21 (10.8%) |
| 6:30 AM to 6:59 AM | 35 (20.2%) | 31 (15.9%) |
| 7:00 AM to 7:29 AM | 37 (21.4%) | 14 (7.2%) |
| 7:30 AM to 7:59 AM | 12 (6.9%) | 42 (21.5%) |
| 8:00 AM to 8:29 AM | 15 (8.7%) | 27 (13.9%) |
| 8:30 AM to 8:59 AM | 0 (0.0%) | 0 (0.0%) |
| 9:00 AM to 9:59 AM | 0 (0.0%) | 3 (1.5%) |
| 10:00 AM to 10:59 AM | 2 (1.2%) | 0 (0.0%) |
| 11:00 AM to 11:59 AM | 0 (0.0%) | 7 (3.6%) |
| 12:00 PM to 3:59 PM | 23 (13.3%) | 5 (2.6%) |
| 4:00 PM to 11:59 PM | 3 (1.7%) | 17 (8.7%) |
| Total | 173 (100.0%) | 195 (100.0%) |
Housing Occupancy in Le Grand
Occupancy by Ownership in Le Grand
Of the total 371 dwellings in Le Grand, owner-occupied units account for 323 (87.1%), while renter-occupied units make up 48 (12.9%).
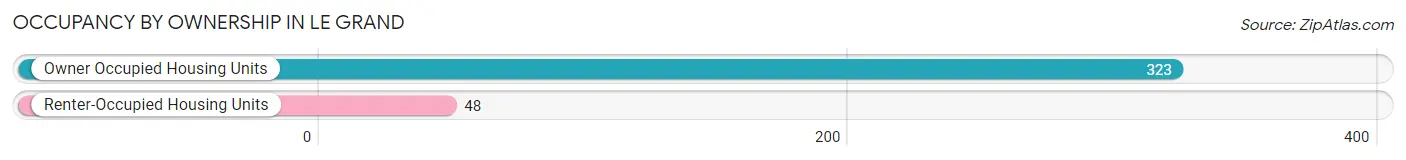
| Occupancy | # Housing Units | % Housing Units |
| Owner Occupied Housing Units | 323 | 87.1% |
| Renter-Occupied Housing Units | 48 | 12.9% |
| Total Occupied Housing Units | 371 | 100.0% |
Occupancy by Household Size in Le Grand
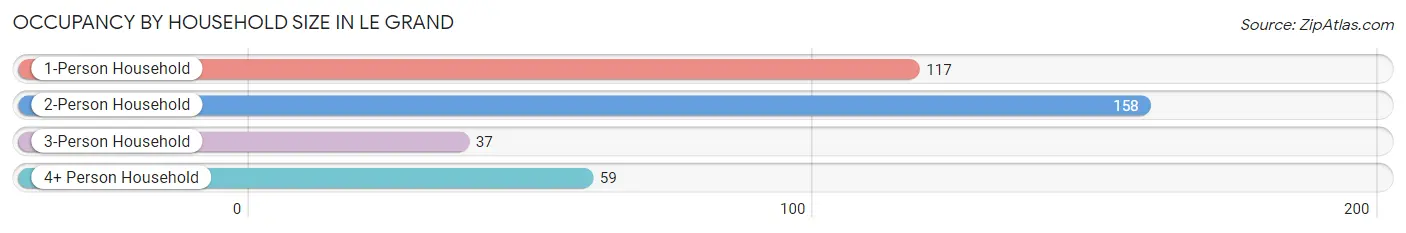
| Household Size | # Housing Units | % Housing Units |
| 1-Person Household | 117 | 31.5% |
| 2-Person Household | 158 | 42.6% |
| 3-Person Household | 37 | 10.0% |
| 4+ Person Household | 59 | 15.9% |
| Total Housing Units | 371 | 100.0% |
Occupancy by Ownership by Household Size in Le Grand
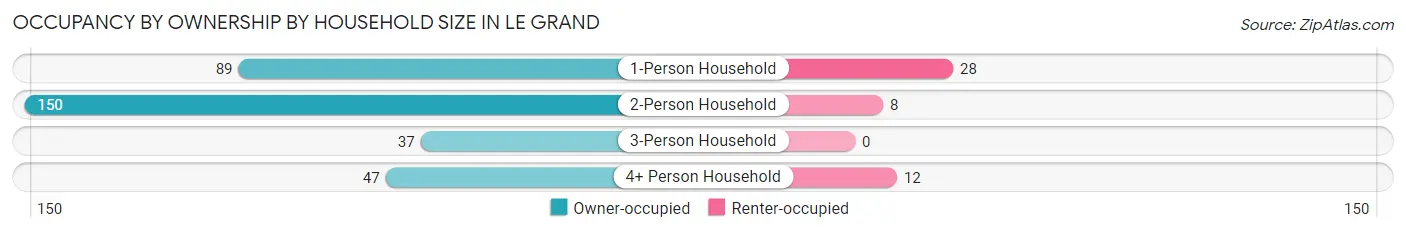
| Household Size | Owner-occupied | Renter-occupied |
| 1-Person Household | 89 (76.1%) | 28 (23.9%) |
| 2-Person Household | 150 (94.9%) | 8 (5.1%) |
| 3-Person Household | 37 (100.0%) | 0 (0.0%) |
| 4+ Person Household | 47 (79.7%) | 12 (20.3%) |
| Total Housing Units | 323 (87.1%) | 48 (12.9%) |
Occupancy by Educational Attainment in Le Grand
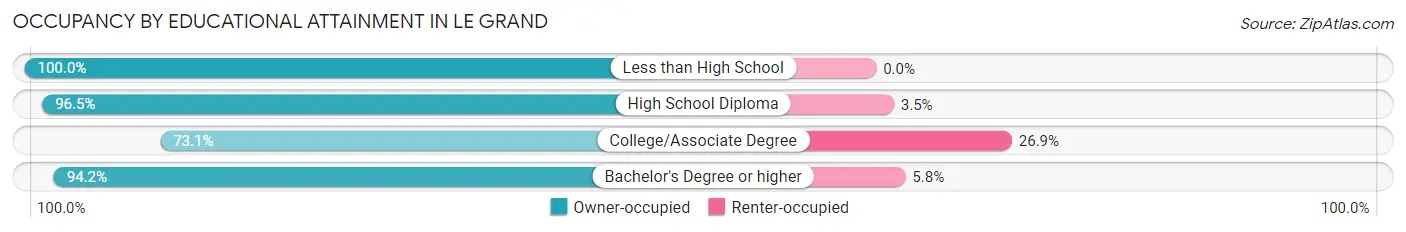
| Household Size | Owner-occupied | Renter-occupied |
| Less than High School | 14 (100.0%) | 0 (0.0%) |
| High School Diploma | 138 (96.5%) | 5 (3.5%) |
| College/Associate Degree | 106 (73.1%) | 39 (26.9%) |
| Bachelor's Degree or higher | 65 (94.2%) | 4 (5.8%) |
Occupancy by Age of Householder in Le Grand
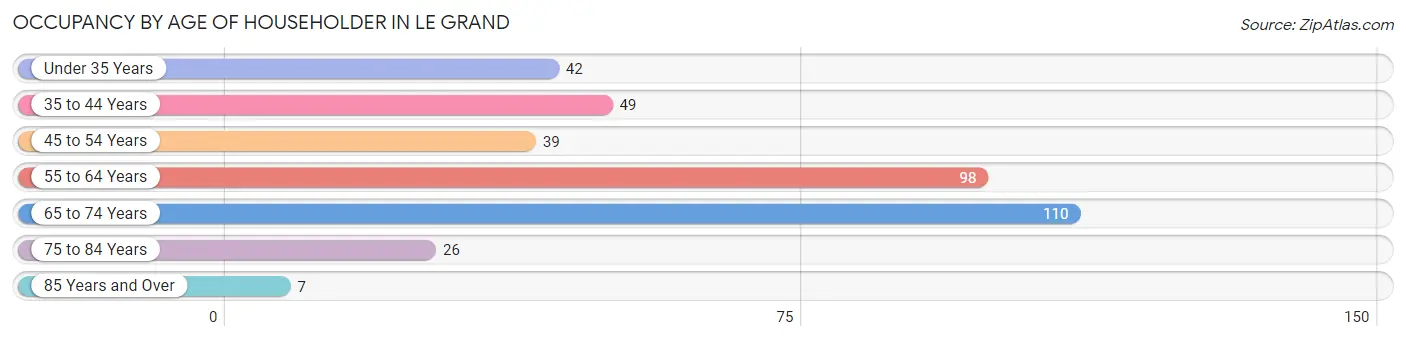
| Age Bracket | # Households | % Households |
| Under 35 Years | 42 | 11.3% |
| 35 to 44 Years | 49 | 13.2% |
| 45 to 54 Years | 39 | 10.5% |
| 55 to 64 Years | 98 | 26.4% |
| 65 to 74 Years | 110 | 29.6% |
| 75 to 84 Years | 26 | 7.0% |
| 85 Years and Over | 7 | 1.9% |
| Total | 371 | 100.0% |
Housing Finances in Le Grand
Median Income by Occupancy in Le Grand
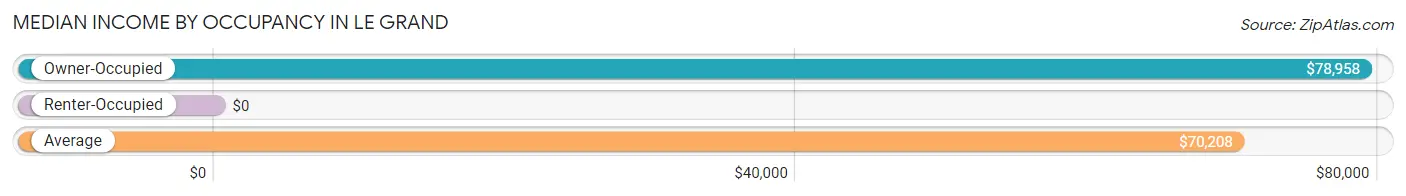
| Occupancy Type | # Households | Median Income |
| Owner-Occupied | 323 (87.1%) | $78,958 |
| Renter-Occupied | 48 (12.9%) | $0 |
| Average | 371 (100.0%) | $70,208 |
Occupancy by Householder Income Bracket in Le Grand
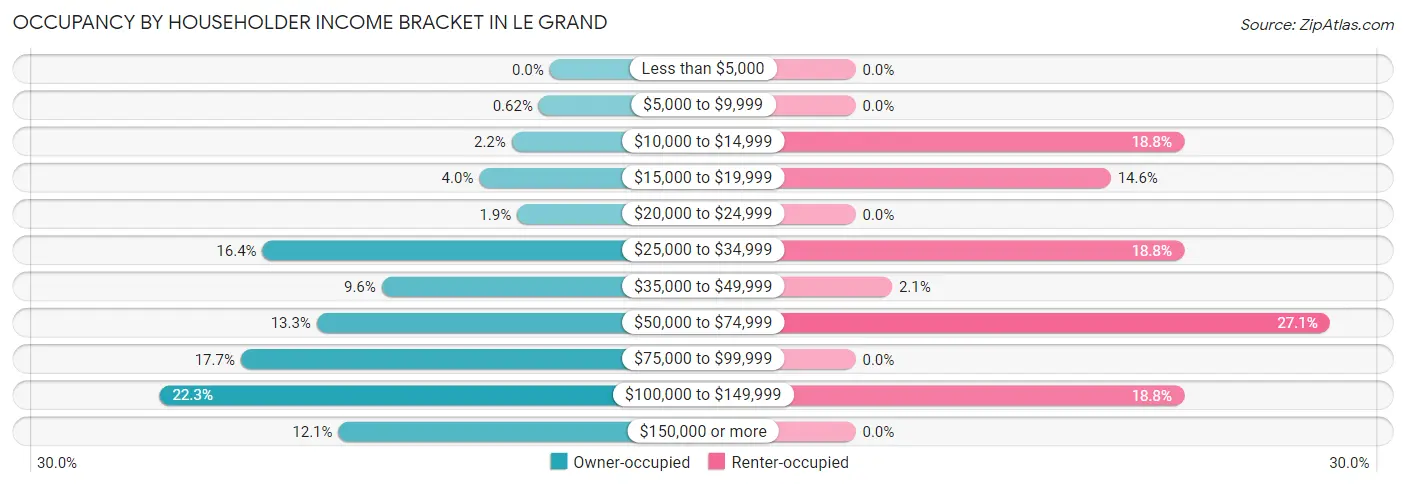
| Income Bracket | Owner-occupied | Renter-occupied |
| Less than $5,000 | 0 (0.0%) | 0 (0.0%) |
| $5,000 to $9,999 | 2 (0.6%) | 0 (0.0%) |
| $10,000 to $14,999 | 7 (2.2%) | 9 (18.8%) |
| $15,000 to $19,999 | 13 (4.0%) | 7 (14.6%) |
| $20,000 to $24,999 | 6 (1.9%) | 0 (0.0%) |
| $25,000 to $34,999 | 53 (16.4%) | 9 (18.8%) |
| $35,000 to $49,999 | 31 (9.6%) | 1 (2.1%) |
| $50,000 to $74,999 | 43 (13.3%) | 13 (27.1%) |
| $75,000 to $99,999 | 57 (17.6%) | 0 (0.0%) |
| $100,000 to $149,999 | 72 (22.3%) | 9 (18.8%) |
| $150,000 or more | 39 (12.1%) | 0 (0.0%) |
| Total | 323 (100.0%) | 48 (100.0%) |
Monthly Housing Cost Tiers in Le Grand
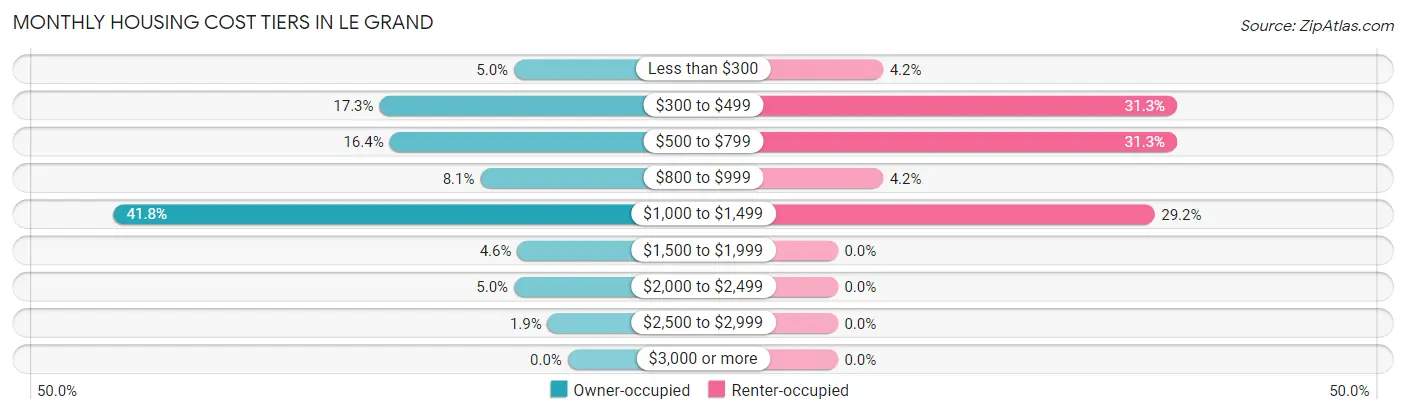
| Monthly Cost | Owner-occupied | Renter-occupied |
| Less than $300 | 16 (5.0%) | 2 (4.2%) |
| $300 to $499 | 56 (17.3%) | 15 (31.2%) |
| $500 to $799 | 53 (16.4%) | 15 (31.2%) |
| $800 to $999 | 26 (8.1%) | 2 (4.2%) |
| $1,000 to $1,499 | 135 (41.8%) | 14 (29.2%) |
| $1,500 to $1,999 | 15 (4.6%) | 0 (0.0%) |
| $2,000 to $2,499 | 16 (5.0%) | 0 (0.0%) |
| $2,500 to $2,999 | 6 (1.9%) | 0 (0.0%) |
| $3,000 or more | 0 (0.0%) | 0 (0.0%) |
| Total | 323 (100.0%) | 48 (100.0%) |
Physical Housing Characteristics in Le Grand
Housing Structures in Le Grand
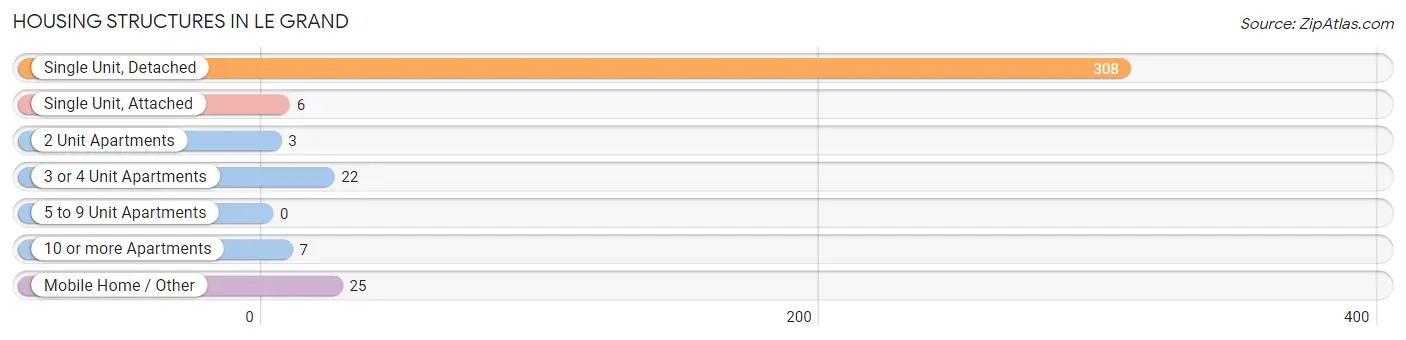
| Structure Type | # Housing Units | % Housing Units |
| Single Unit, Detached | 308 | 83.0% |
| Single Unit, Attached | 6 | 1.6% |
| 2 Unit Apartments | 3 | 0.8% |
| 3 or 4 Unit Apartments | 22 | 5.9% |
| 5 to 9 Unit Apartments | 0 | 0.0% |
| 10 or more Apartments | 7 | 1.9% |
| Mobile Home / Other | 25 | 6.7% |
| Total | 371 | 100.0% |
Housing Structures by Occupancy in Le Grand
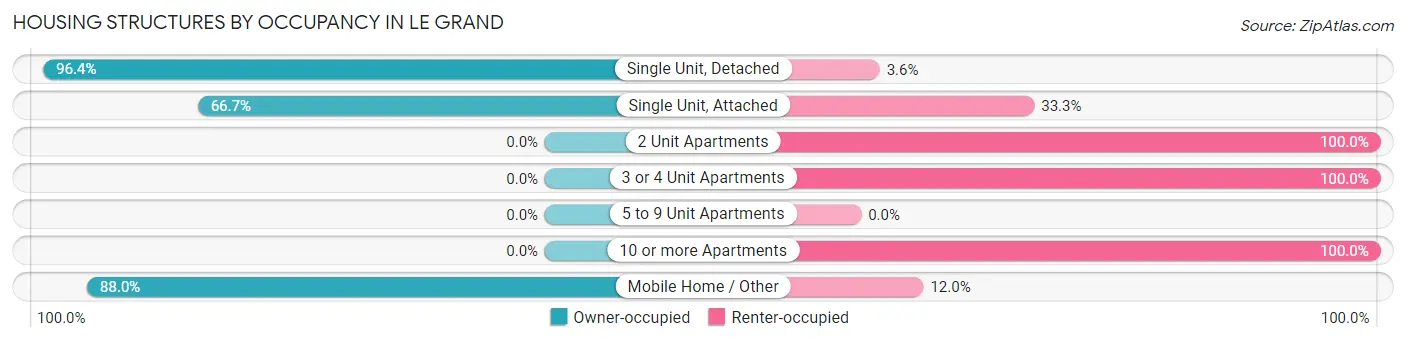
| Structure Type | Owner-occupied | Renter-occupied |
| Single Unit, Detached | 297 (96.4%) | 11 (3.6%) |
| Single Unit, Attached | 4 (66.7%) | 2 (33.3%) |
| 2 Unit Apartments | 0 (0.0%) | 3 (100.0%) |
| 3 or 4 Unit Apartments | 0 (0.0%) | 22 (100.0%) |
| 5 to 9 Unit Apartments | 0 (0.0%) | 0 (0.0%) |
| 10 or more Apartments | 0 (0.0%) | 7 (100.0%) |
| Mobile Home / Other | 22 (88.0%) | 3 (12.0%) |
| Total | 323 (87.1%) | 48 (12.9%) |
Housing Structures by Number of Rooms in Le Grand
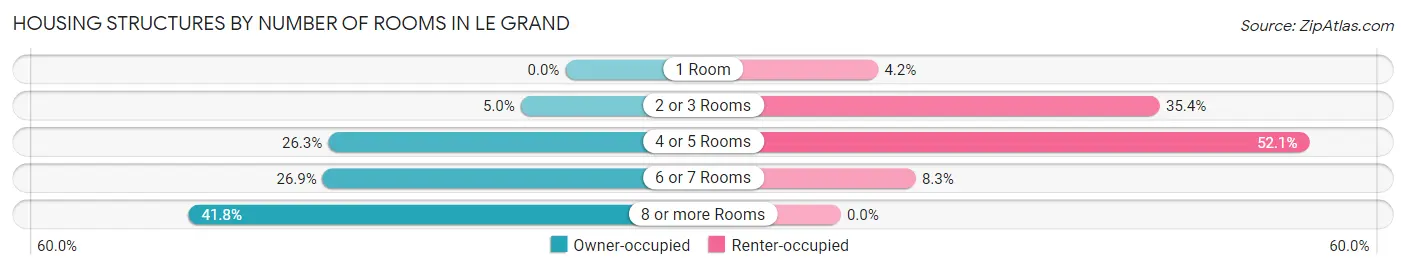
| Number of Rooms | Owner-occupied | Renter-occupied |
| 1 Room | 0 (0.0%) | 2 (4.2%) |
| 2 or 3 Rooms | 16 (5.0%) | 17 (35.4%) |
| 4 or 5 Rooms | 85 (26.3%) | 25 (52.1%) |
| 6 or 7 Rooms | 87 (26.9%) | 4 (8.3%) |
| 8 or more Rooms | 135 (41.8%) | 0 (0.0%) |
| Total | 323 (100.0%) | 48 (100.0%) |
Housing Structure by Heating Type in Le Grand
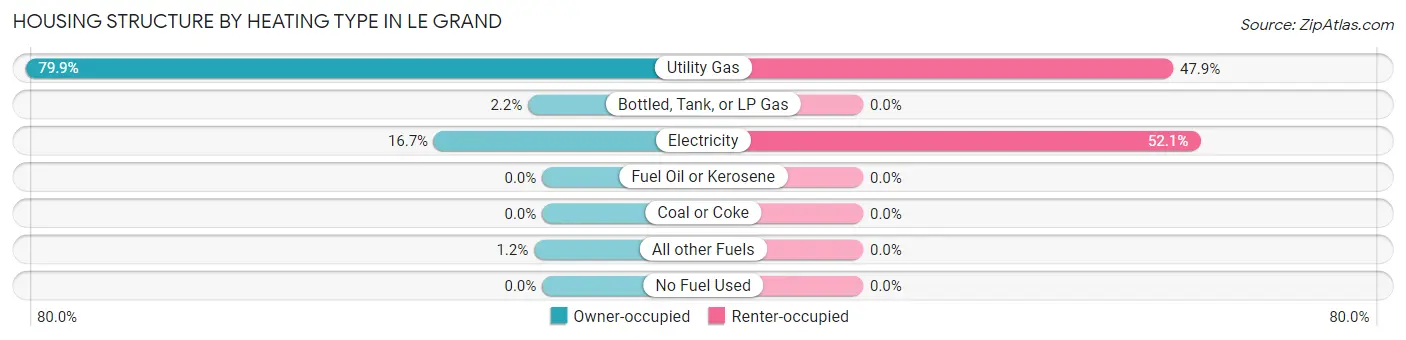
| Heating Type | Owner-occupied | Renter-occupied |
| Utility Gas | 258 (79.9%) | 23 (47.9%) |
| Bottled, Tank, or LP Gas | 7 (2.2%) | 0 (0.0%) |
| Electricity | 54 (16.7%) | 25 (52.1%) |
| Fuel Oil or Kerosene | 0 (0.0%) | 0 (0.0%) |
| Coal or Coke | 0 (0.0%) | 0 (0.0%) |
| All other Fuels | 4 (1.2%) | 0 (0.0%) |
| No Fuel Used | 0 (0.0%) | 0 (0.0%) |
| Total | 323 (100.0%) | 48 (100.0%) |
Household Vehicle Usage in Le Grand
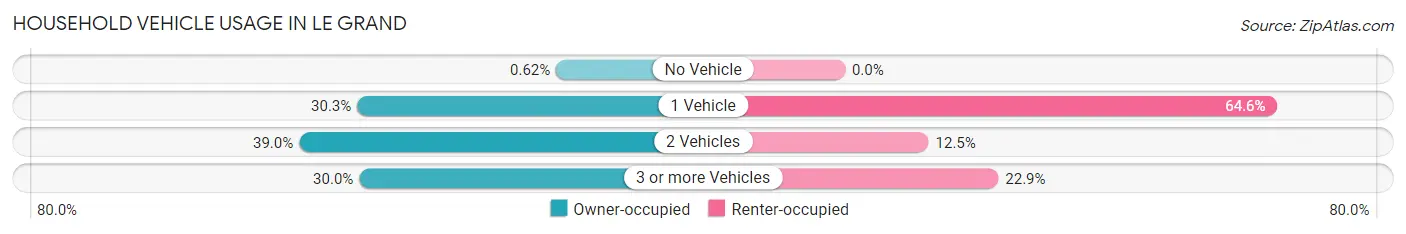
| Vehicles per Household | Owner-occupied | Renter-occupied |
| No Vehicle | 2 (0.6%) | 0 (0.0%) |
| 1 Vehicle | 98 (30.3%) | 31 (64.6%) |
| 2 Vehicles | 126 (39.0%) | 6 (12.5%) |
| 3 or more Vehicles | 97 (30.0%) | 11 (22.9%) |
| Total | 323 (100.0%) | 48 (100.0%) |
Real Estate & Mortgages in Le Grand
Real Estate and Mortgage Overview in Le Grand
| Characteristic | Without Mortgage | With Mortgage |
| Housing Units | 138 | 185 |
| Median Property Value | $133,300 | $149,200 |
| Median Household Income | $62,857 | $22 |
| Monthly Housing Costs | $497 | $0 |
| Real Estate Taxes | $1,934 | $0 |
Property Value by Mortgage Status in Le Grand
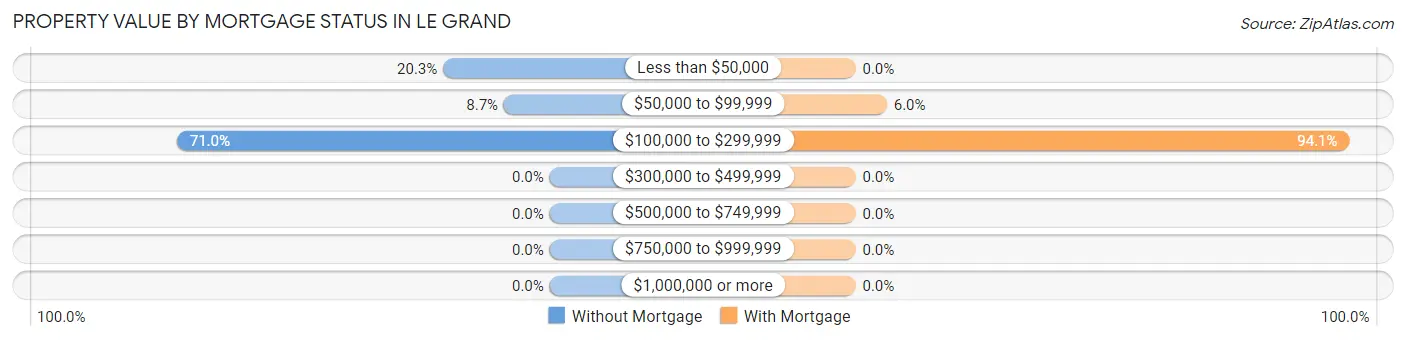
| Property Value | Without Mortgage | With Mortgage |
| Less than $50,000 | 28 (20.3%) | 0 (0.0%) |
| $50,000 to $99,999 | 12 (8.7%) | 11 (5.9%) |
| $100,000 to $299,999 | 98 (71.0%) | 174 (94.1%) |
| $300,000 to $499,999 | 0 (0.0%) | 0 (0.0%) |
| $500,000 to $749,999 | 0 (0.0%) | 0 (0.0%) |
| $750,000 to $999,999 | 0 (0.0%) | 0 (0.0%) |
| $1,000,000 or more | 0 (0.0%) | 0 (0.0%) |
| Total | 138 (100.0%) | 185 (100.0%) |
Household Income by Mortgage Status in Le Grand
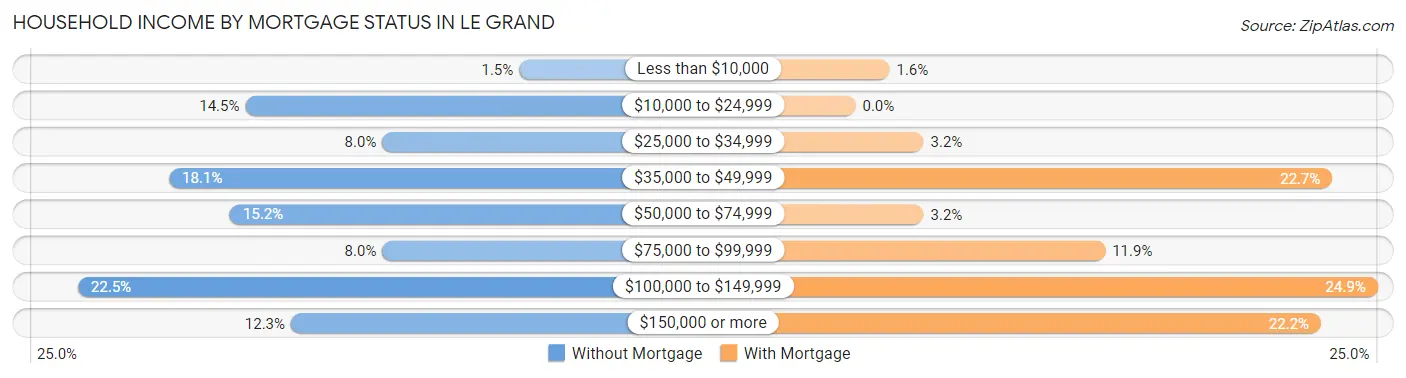
| Household Income | Without Mortgage | With Mortgage |
| Less than $10,000 | 2 (1.5%) | 3 (1.6%) |
| $10,000 to $24,999 | 20 (14.5%) | 0 (0.0%) |
| $25,000 to $34,999 | 11 (8.0%) | 6 (3.2%) |
| $35,000 to $49,999 | 25 (18.1%) | 42 (22.7%) |
| $50,000 to $74,999 | 21 (15.2%) | 6 (3.2%) |
| $75,000 to $99,999 | 11 (8.0%) | 22 (11.9%) |
| $100,000 to $149,999 | 31 (22.5%) | 46 (24.9%) |
| $150,000 or more | 17 (12.3%) | 41 (22.2%) |
| Total | 138 (100.0%) | 185 (100.0%) |
Property Value to Household Income Ratio in Le Grand
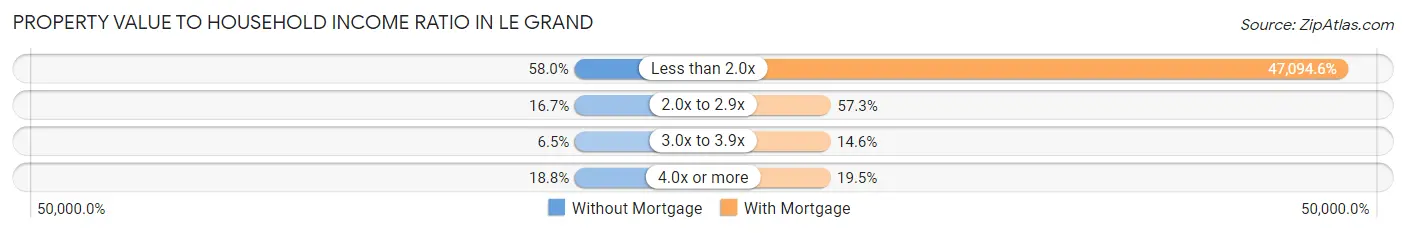
| Value-to-Income Ratio | Without Mortgage | With Mortgage |
| Less than 2.0x | 80 (58.0%) | 87,125 (47,094.6%) |
| 2.0x to 2.9x | 23 (16.7%) | 106 (57.3%) |
| 3.0x to 3.9x | 9 (6.5%) | 27 (14.6%) |
| 4.0x or more | 26 (18.8%) | 36 (19.5%) |
| Total | 138 (100.0%) | 185 (100.0%) |
Real Estate Taxes by Mortgage Status in Le Grand
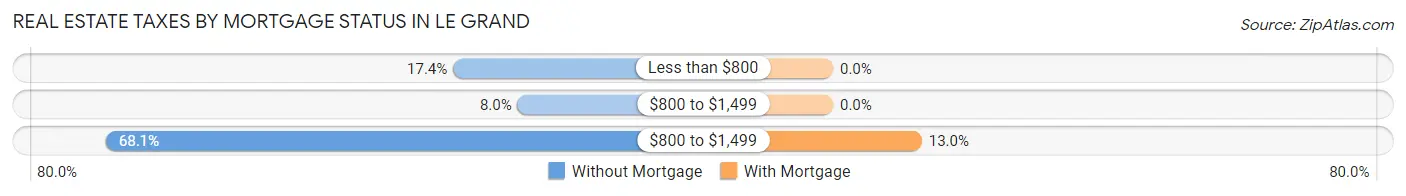
| Property Taxes | Without Mortgage | With Mortgage |
| Less than $800 | 24 (17.4%) | 0 (0.0%) |
| $800 to $1,499 | 11 (8.0%) | 0 (0.0%) |
| $800 to $1,499 | 94 (68.1%) | 24 (13.0%) |
| Total | 138 (100.0%) | 185 (100.0%) |
Health & Disability in Le Grand
Health Insurance Coverage by Age in Le Grand
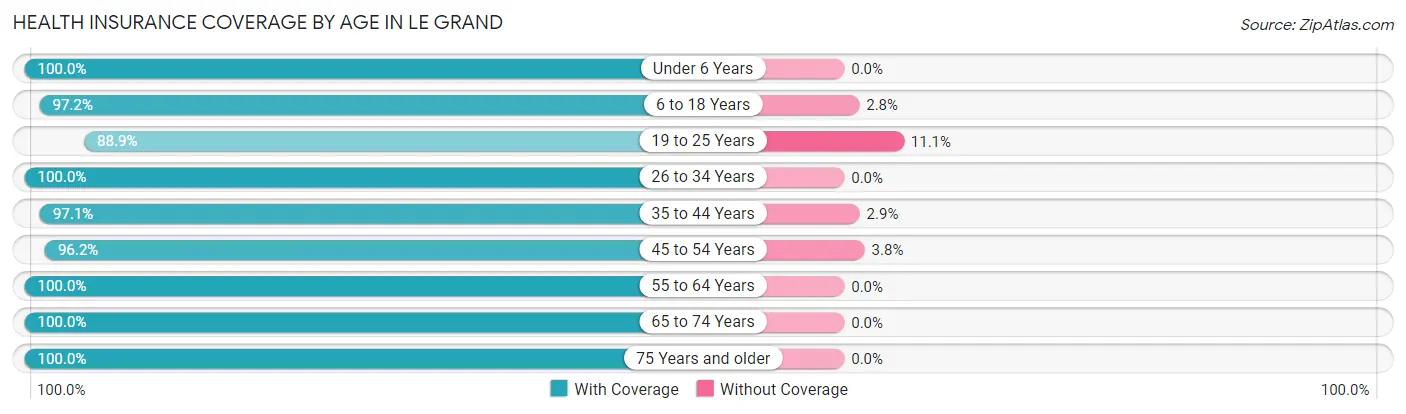
| Age Bracket | With Coverage | Without Coverage |
| Under 6 Years | 40 (100.0%) | 0 (0.0%) |
| 6 to 18 Years | 104 (97.2%) | 3 (2.8%) |
| 19 to 25 Years | 56 (88.9%) | 7 (11.1%) |
| 26 to 34 Years | 46 (100.0%) | 0 (0.0%) |
| 35 to 44 Years | 102 (97.1%) | 3 (2.9%) |
| 45 to 54 Years | 76 (96.2%) | 3 (3.8%) |
| 55 to 64 Years | 150 (100.0%) | 0 (0.0%) |
| 65 to 74 Years | 151 (100.0%) | 0 (0.0%) |
| 75 Years and older | 49 (100.0%) | 0 (0.0%) |
| Total | 774 (98.0%) | 16 (2.0%) |
Health Insurance Coverage by Citizenship Status in Le Grand
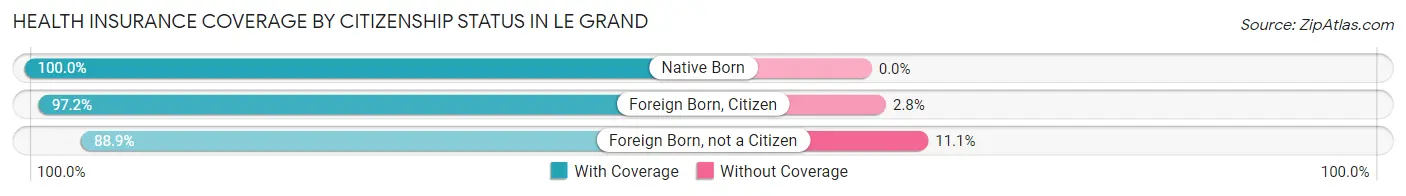
| Citizenship Status | With Coverage | Without Coverage |
| Native Born | 40 (100.0%) | 0 (0.0%) |
| Foreign Born, Citizen | 104 (97.2%) | 3 (2.8%) |
| Foreign Born, not a Citizen | 56 (88.9%) | 7 (11.1%) |
Health Insurance Coverage by Household Income in Le Grand
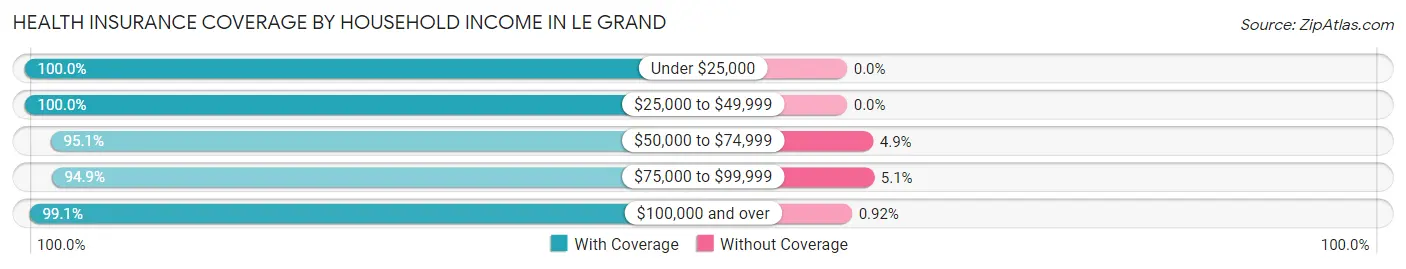
| Household Income | With Coverage | Without Coverage |
| Under $25,000 | 84 (100.0%) | 0 (0.0%) |
| $25,000 to $49,999 | 118 (100.0%) | 0 (0.0%) |
| $50,000 to $74,999 | 117 (95.1%) | 6 (4.9%) |
| $75,000 to $99,999 | 131 (94.9%) | 7 (5.1%) |
| $100,000 and over | 324 (99.1%) | 3 (0.9%) |
Public vs Private Health Insurance Coverage by Age in Le Grand
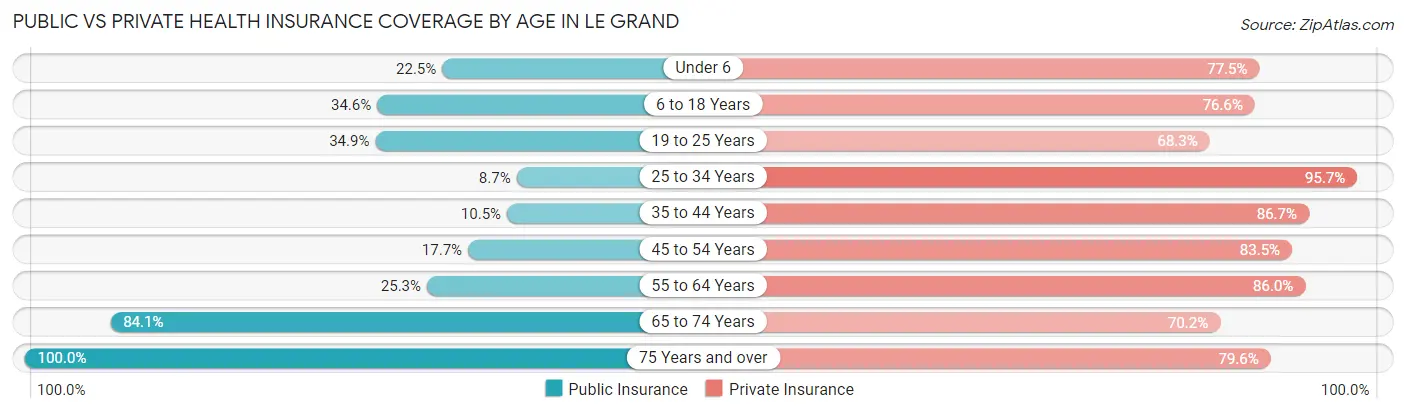
| Age Bracket | Public Insurance | Private Insurance |
| Under 6 | 9 (22.5%) | 31 (77.5%) |
| 6 to 18 Years | 37 (34.6%) | 82 (76.6%) |
| 19 to 25 Years | 22 (34.9%) | 43 (68.2%) |
| 25 to 34 Years | 4 (8.7%) | 44 (95.7%) |
| 35 to 44 Years | 11 (10.5%) | 91 (86.7%) |
| 45 to 54 Years | 14 (17.7%) | 66 (83.5%) |
| 55 to 64 Years | 38 (25.3%) | 129 (86.0%) |
| 65 to 74 Years | 127 (84.1%) | 106 (70.2%) |
| 75 Years and over | 49 (100.0%) | 39 (79.6%) |
| Total | 311 (39.4%) | 631 (79.9%) |
Disability Status by Sex by Age in Le Grand
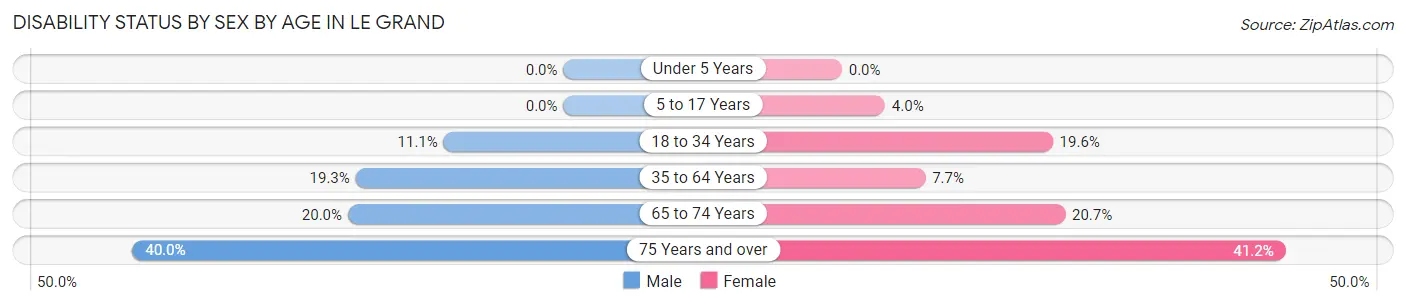
| Age Bracket | Male | Female |
| Under 5 Years | 0 (0.0%) | 0 (0.0%) |
| 5 to 17 Years | 0 (0.0%) | 2 (4.0%) |
| 18 to 34 Years | 7 (11.1%) | 9 (19.6%) |
| 35 to 64 Years | 32 (19.3%) | 13 (7.7%) |
| 65 to 74 Years | 8 (20.0%) | 23 (20.7%) |
| 75 Years and over | 6 (40.0%) | 14 (41.2%) |
Disability Class by Sex by Age in Le Grand
Disability Class: Hearing Difficulty
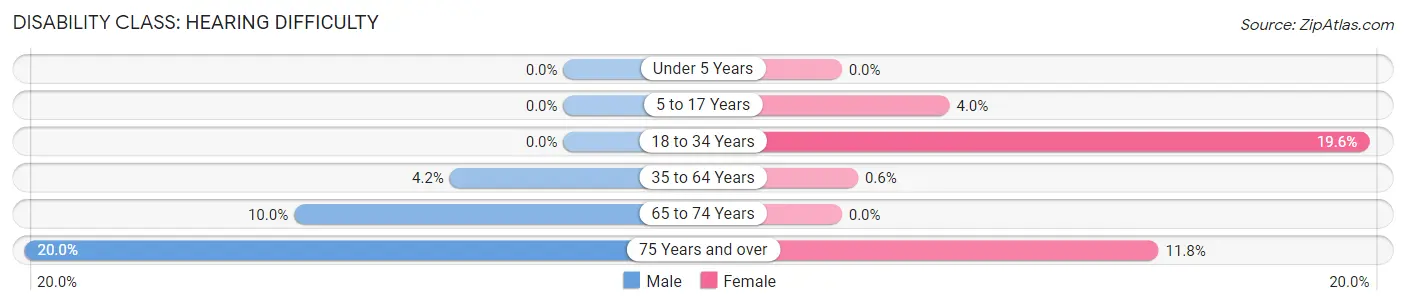
| Age Bracket | Male | Female |
| Under 5 Years | 0 (0.0%) | 0 (0.0%) |
| 5 to 17 Years | 0 (0.0%) | 2 (4.0%) |
| 18 to 34 Years | 0 (0.0%) | 9 (19.6%) |
| 35 to 64 Years | 7 (4.2%) | 1 (0.6%) |
| 65 to 74 Years | 4 (10.0%) | 0 (0.0%) |
| 75 Years and over | 3 (20.0%) | 4 (11.8%) |
Disability Class: Vision Difficulty
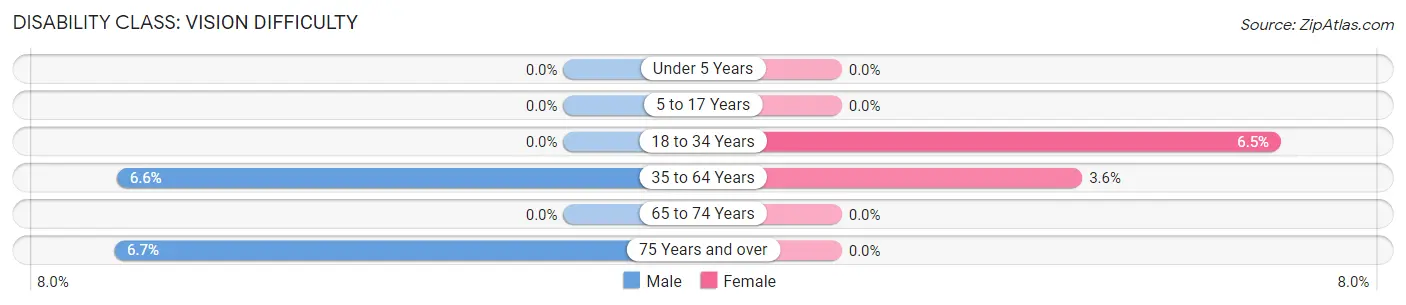
| Age Bracket | Male | Female |
| Under 5 Years | 0 (0.0%) | 0 (0.0%) |
| 5 to 17 Years | 0 (0.0%) | 0 (0.0%) |
| 18 to 34 Years | 0 (0.0%) | 3 (6.5%) |
| 35 to 64 Years | 11 (6.6%) | 6 (3.6%) |
| 65 to 74 Years | 0 (0.0%) | 0 (0.0%) |
| 75 Years and over | 1 (6.7%) | 0 (0.0%) |
Disability Class: Cognitive Difficulty
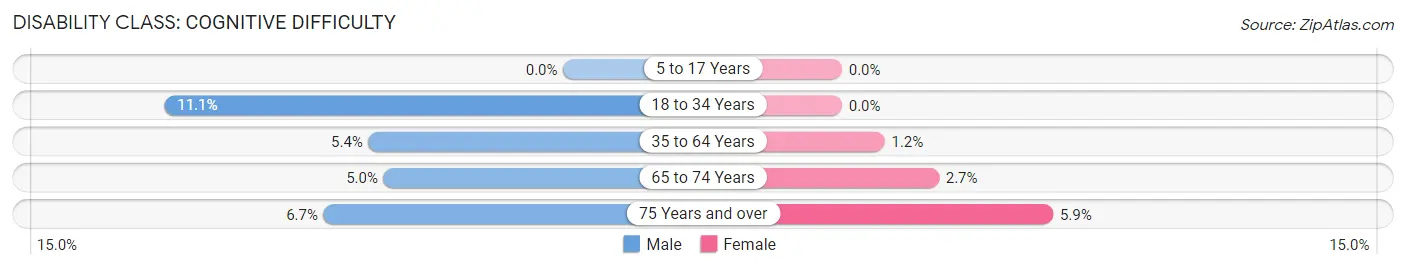
| Age Bracket | Male | Female |
| 5 to 17 Years | 0 (0.0%) | 0 (0.0%) |
| 18 to 34 Years | 7 (11.1%) | 0 (0.0%) |
| 35 to 64 Years | 9 (5.4%) | 2 (1.2%) |
| 65 to 74 Years | 2 (5.0%) | 3 (2.7%) |
| 75 Years and over | 1 (6.7%) | 2 (5.9%) |
Disability Class: Ambulatory Difficulty
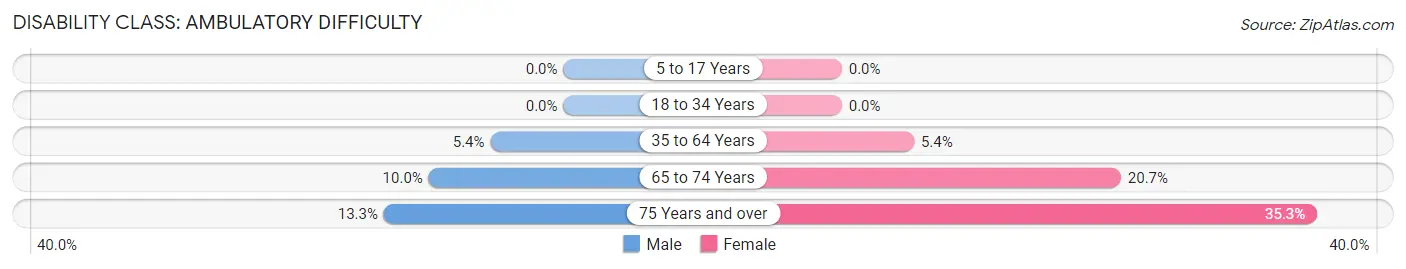
| Age Bracket | Male | Female |
| 5 to 17 Years | 0 (0.0%) | 0 (0.0%) |
| 18 to 34 Years | 0 (0.0%) | 0 (0.0%) |
| 35 to 64 Years | 9 (5.4%) | 9 (5.4%) |
| 65 to 74 Years | 4 (10.0%) | 23 (20.7%) |
| 75 Years and over | 2 (13.3%) | 12 (35.3%) |
Disability Class: Self-Care Difficulty
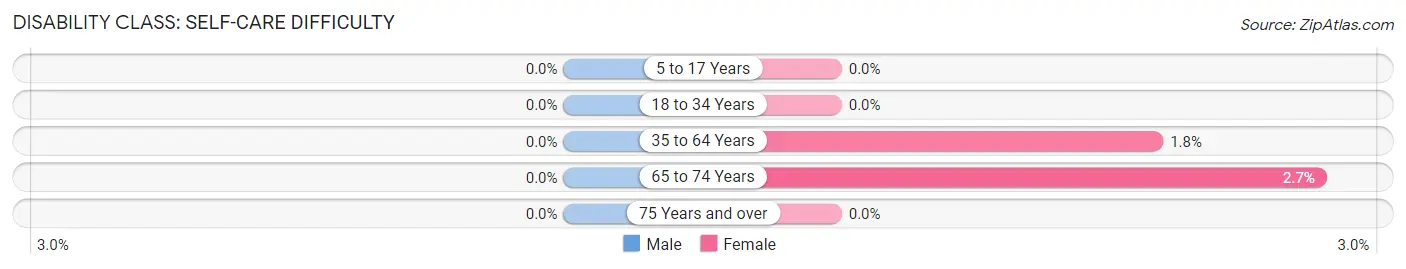
| Age Bracket | Male | Female |
| 5 to 17 Years | 0 (0.0%) | 0 (0.0%) |
| 18 to 34 Years | 0 (0.0%) | 0 (0.0%) |
| 35 to 64 Years | 0 (0.0%) | 3 (1.8%) |
| 65 to 74 Years | 0 (0.0%) | 3 (2.7%) |
| 75 Years and over | 0 (0.0%) | 0 (0.0%) |
Technology Access in Le Grand
Computing Device Access in Le Grand
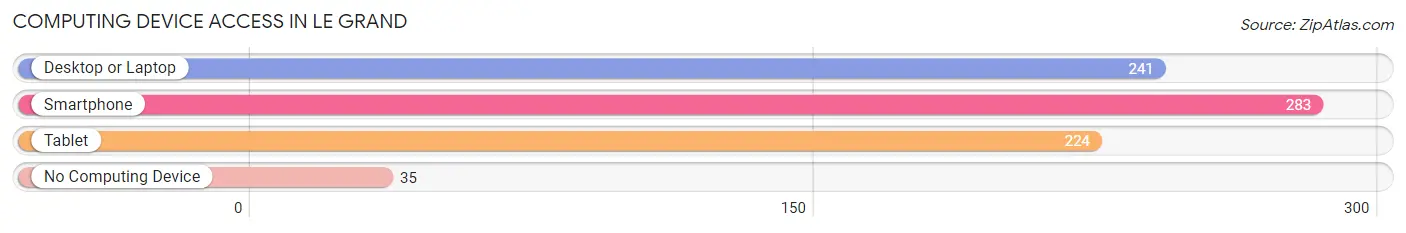
| Device Type | # Households | % Households |
| Desktop or Laptop | 241 | 65.0% |
| Smartphone | 283 | 76.3% |
| Tablet | 224 | 60.4% |
| No Computing Device | 35 | 9.4% |
| Total | 371 | 100.0% |
Internet Access in Le Grand
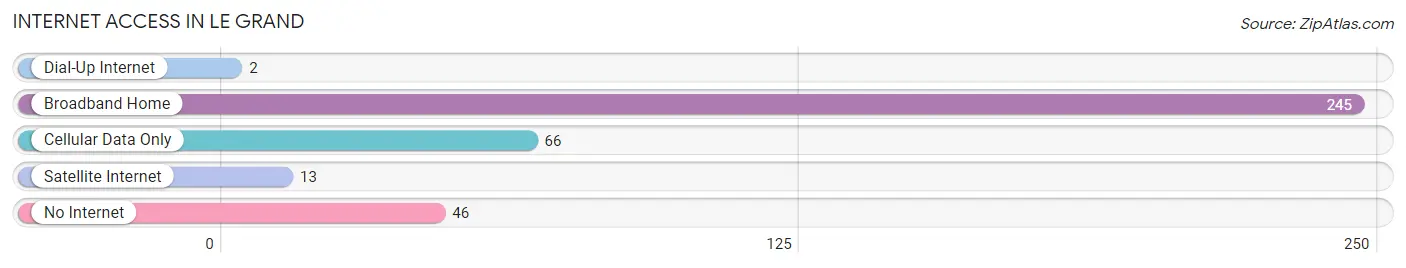
| Internet Type | # Households | % Households |
| Dial-Up Internet | 2 | 0.5% |
| Broadband Home | 245 | 66.0% |
| Cellular Data Only | 66 | 17.8% |
| Satellite Internet | 13 | 3.5% |
| No Internet | 46 | 12.4% |
| Total | 371 | 100.0% |
Le Grand Summary
History
Le Grand is a small town located in Marshall County, Iowa. It is situated on the banks of the Iowa River, about 10 miles south of Marshalltown. The town was founded in 1856 by a group of settlers from Ohio, led by William Le Grand. The town was named after William Le Grand, who was a prominent figure in the area.
The town was originally a farming community, with many of the settlers growing corn, wheat, and oats. The town also had a sawmill, a gristmill, and a blacksmith shop. In 1868, the town was incorporated and the first mayor was elected.
In the late 1800s, the town began to grow and prosper. The railroad came to town in 1881, and the town became a hub for shipping and receiving goods. The town also had a number of businesses, including a hotel, a bank, a general store, and a post office.
In the early 1900s, the town continued to grow and prosper. The population increased from about 500 in 1900 to over 1,000 in 1910. The town also had a number of churches, schools, and other businesses.
In the 1920s, the town began to decline. The railroad stopped running through town, and the population began to decline. By 1930, the population had dropped to about 500.
In the 1940s, the town began to experience a resurgence. The population increased to over 1,000 by 1950. The town also had a number of new businesses, including a grocery store, a hardware store, and a movie theater.
In the 1950s, the town continued to grow and prosper. The population increased to over 1,500 by 1960. The town also had a number of new businesses, including a bowling alley, a restaurant, and a library.
In the 1960s, the town experienced a decline. The population decreased to about 1,000 by 1970. The town also had a number of businesses close, including the movie theater and the bowling alley.
In the 1970s, the town began to experience a resurgence. The population increased to over 1,500 by 1980. The town also had a number of new businesses, including a grocery store, a hardware store, and a library.
In the 1980s, the town continued to grow and prosper. The population increased to over 2,000 by 1990. The town also had a number of new businesses, including a restaurant, a bank, and a post office.
In the 1990s, the town experienced a decline. The population decreased to about 1,500 by 2000. The town also had a number of businesses close, including the grocery store and the hardware store.
Geography
Le Grand is located in Marshall County, Iowa. It is situated on the banks of the Iowa River, about 10 miles south of Marshalltown. The town is located in a rural area, with rolling hills and farmland surrounding it. The town is also located near the Des Moines River, which provides a scenic backdrop.
The town has a total area of 0.7 square miles, all of which is land. The town has a humid continental climate, with hot summers and cold winters. The average temperature in the summer is around 75 degrees Fahrenheit, and the average temperature in the winter is around 25 degrees Fahrenheit.
Economy
Le Grand is a small town with a population of about 1,500 people. The town has a number of businesses, including a grocery store, a hardware store, a restaurant, a bank, and a post office. The town also has a number of churches, schools, and other businesses.
The town is also home to a number of small manufacturing companies, including a furniture manufacturer, a metal fabrication company, and a plastics manufacturer. The town also has a number of agricultural businesses, including a dairy farm, a hog farm, and a grain elevator.
Demographics
Le Grand is a small town with a population of about 1,500 people. The town has a diverse population, with people of various races, ethnicities, and religions. The town has a median age of 39.7 years, with about 48.7% of the population being under the age of 18.
The town has a median household income of $45,000, and the median home value is $125,000. The town has a poverty rate of about 11.3%, and about 8.3% of the population is unemployed. The town also has a high school graduation rate of about 87.5%.
Common Questions
What is Per Capita Income in Le Grand?
Per Capita income in Le Grand is $38,903.
What is the Median Family Income in Le Grand?
Median Family Income in Le Grand is $85,278.
What is the Median Household income in Le Grand?
Median Household Income in Le Grand is $70,208.
What is Income or Wage Gap in Le Grand?
Income or Wage Gap in Le Grand is 15.9%.
Women in Le Grand earn 84.1 cents for every dollar earned by a man.
What is Inequality or Gini Index in Le Grand?
Inequality or Gini Index in Le Grand is 0.40.
What is the Total Population of Le Grand?
Total Population of Le Grand is 790.
What is the Total Male Population of Le Grand?
Total Male Population of Le Grand is 358.
What is the Total Female Population of Le Grand?
Total Female Population of Le Grand is 432.
What is the Ratio of Males per 100 Females in Le Grand?
There are 82.87 Males per 100 Females in Le Grand.
What is the Ratio of Females per 100 Males in Le Grand?
There are 120.67 Females per 100 Males in Le Grand.
What is the Median Population Age in Le Grand?
Median Population Age in Le Grand is 48.7 Years.
What is the Average Family Size in Le Grand
Average Family Size in Le Grand is 2.5 People.
What is the Average Household Size in Le Grand
Average Household Size in Le Grand is 2.1 People.
How Large is the Labor Force in Le Grand?
There are 414 People in the Labor Forcein in Le Grand.
What is the Percentage of People in the Labor Force in Le Grand?
62.4% of People are in the Labor Force in Le Grand.
What is the Unemployment Rate in Le Grand?
Unemployment Rate in Le Grand is 2.4%.