Hamilton, MT Map & Demographics
Hamilton Map
Hamilton Overview
$33,691
PER CAPITA INCOME
$61,481
AVG FAMILY INCOME
$45,973
AVG HOUSEHOLD INCOME
16.5%
WAGE / INCOME GAP [ % ]
83.5¢/ $1
WAGE / INCOME GAP [ $ ]
0.45
INEQUALITY / GINI INDEX
4,806
TOTAL POPULATION
2,030
MALE POPULATION
2,776
FEMALE POPULATION
73.13
MALES / 100 FEMALES
136.75
FEMALES / 100 MALES
48.3
MEDIAN AGE
2.8
AVG FAMILY SIZE
1.8
AVG HOUSEHOLD SIZE
2,351
LABOR FORCE [ PEOPLE ]
57.6%
PERCENT IN LABOR FORCE
2.4%
UNEMPLOYMENT RATE
Hamilton Zip Codes
Hamilton Area Codes
Income in Hamilton
Income Overview in Hamilton
Per Capita Income in Hamilton is $33,691, while median incomes of families and households are $61,481 and $45,973 respectively.
| Characteristic | Number | Measure |
| Per Capita Income | 4,806 | $33,691 |
| Median Family Income | 1,032 | $61,481 |
| Mean Family Income | 1,032 | $89,386 |
| Median Household Income | 2,562 | $45,973 |
| Mean Household Income | 2,562 | $60,749 |
| Income Deficit | 1,032 | $0 |
| Wage / Income Gap (%) | 4,806 | 16.48% |
| Wage / Income Gap ($) | 4,806 | 83.52¢ per $1 |
| Gini / Inequality Index | 4,806 | 0.45 |
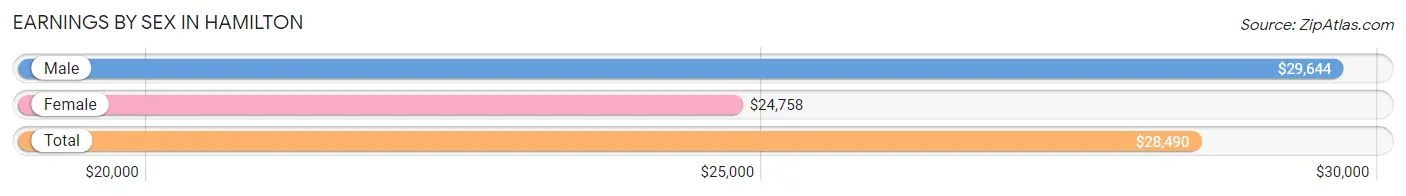
Earnings by Sex in Hamilton
Average Earnings in Hamilton are $28,490, $29,644 for men and $24,758 for women, a difference of 16.5%.
| Sex | Number | Average Earnings |
| Male | 1,145 (45.3%) | $29,644 |
| Female | 1,382 (54.7%) | $24,758 |
| Total | 2,527 (100.0%) | $28,490 |
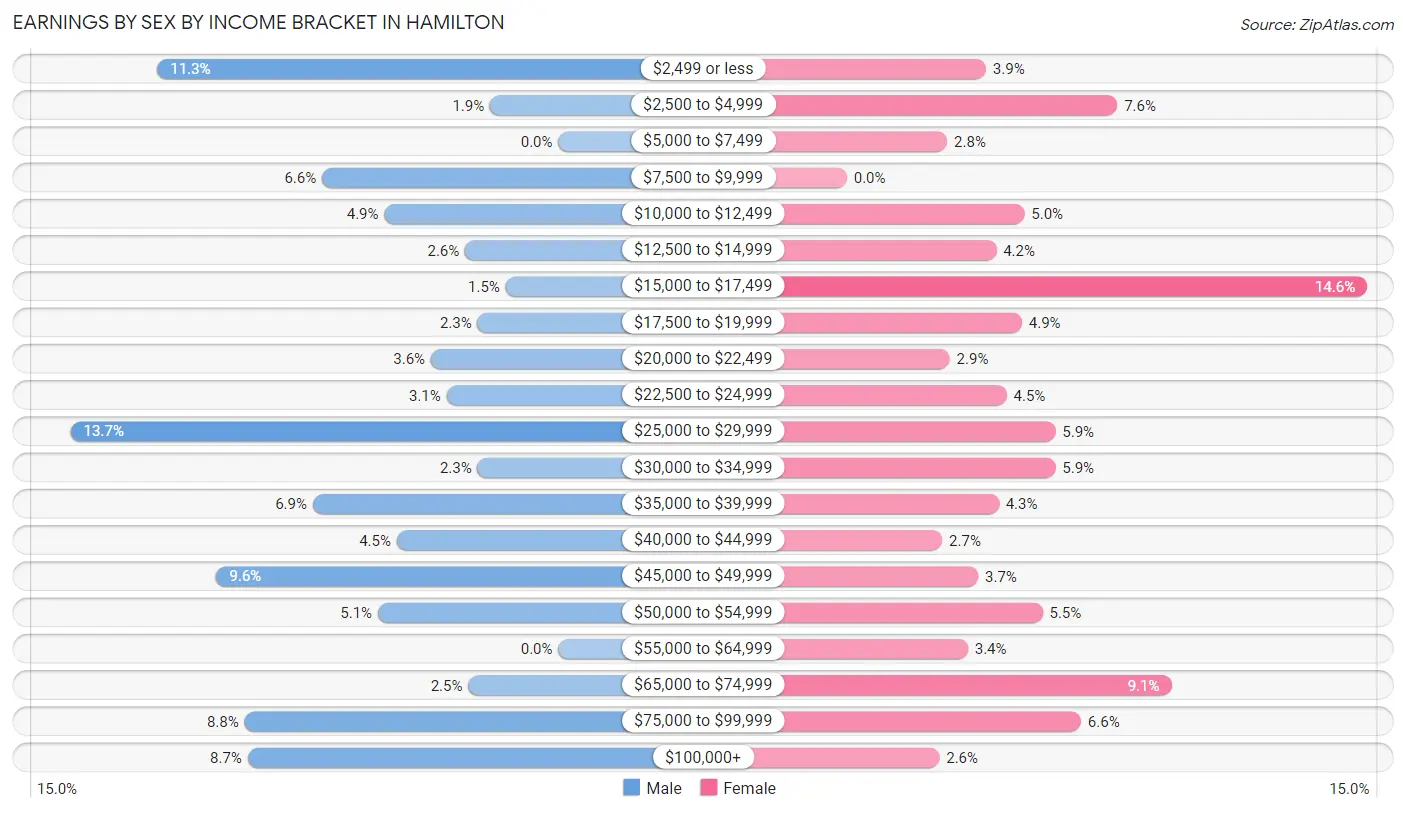
Earnings by Sex by Income Bracket in Hamilton
The most common earnings brackets in Hamilton are $25,000 to $29,999 for men (157 | 13.7%) and $15,000 to $17,499 for women (202 | 14.6%).
| Income | Male | Female |
| $2,499 or less | 129 (11.3%) | 54 (3.9%) |
| $2,500 to $4,999 | 22 (1.9%) | 105 (7.6%) |
| $5,000 to $7,499 | 0 (0.0%) | 39 (2.8%) |
| $7,500 to $9,999 | 76 (6.6%) | 0 (0.0%) |
| $10,000 to $12,499 | 56 (4.9%) | 69 (5.0%) |
| $12,500 to $14,999 | 30 (2.6%) | 58 (4.2%) |
| $15,000 to $17,499 | 17 (1.5%) | 202 (14.6%) |
| $17,500 to $19,999 | 26 (2.3%) | 68 (4.9%) |
| $20,000 to $22,499 | 41 (3.6%) | 40 (2.9%) |
| $22,500 to $24,999 | 36 (3.1%) | 62 (4.5%) |
| $25,000 to $29,999 | 157 (13.7%) | 81 (5.9%) |
| $30,000 to $34,999 | 26 (2.3%) | 81 (5.9%) |
| $35,000 to $39,999 | 79 (6.9%) | 59 (4.3%) |
| $40,000 to $44,999 | 52 (4.5%) | 37 (2.7%) |
| $45,000 to $49,999 | 110 (9.6%) | 51 (3.7%) |
| $50,000 to $54,999 | 58 (5.1%) | 76 (5.5%) |
| $55,000 to $64,999 | 0 (0.0%) | 47 (3.4%) |
| $65,000 to $74,999 | 29 (2.5%) | 126 (9.1%) |
| $75,000 to $99,999 | 101 (8.8%) | 91 (6.6%) |
| $100,000+ | 100 (8.7%) | 36 (2.6%) |
| Total | 1,145 (100.0%) | 1,382 (100.0%) |
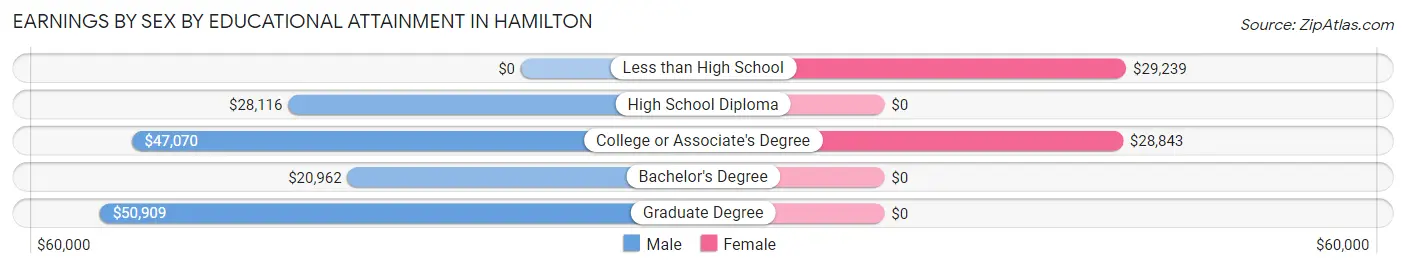
Earnings by Sex by Educational Attainment in Hamilton
Average earnings in Hamilton are $35,286 for men and $25,645 for women, a difference of 27.3%. Men with an educational attainment of graduate degree enjoy the highest average annual earnings of $50,909, while those with bachelor's degree education earn the least with $20,962. Women with an educational attainment of less than high school earn the most with the average annual earnings of $29,239, while those with college or associate's degree education have the smallest earnings of $28,843.
| Educational Attainment | Male Income | Female Income |
| Less than High School | - | - |
| High School Diploma | $28,116 | $0 |
| College or Associate's Degree | $47,070 | $28,843 |
| Bachelor's Degree | $20,962 | $0 |
| Graduate Degree | $50,909 | $0 |
| Total | $35,286 | $25,645 |
Family Income in Hamilton
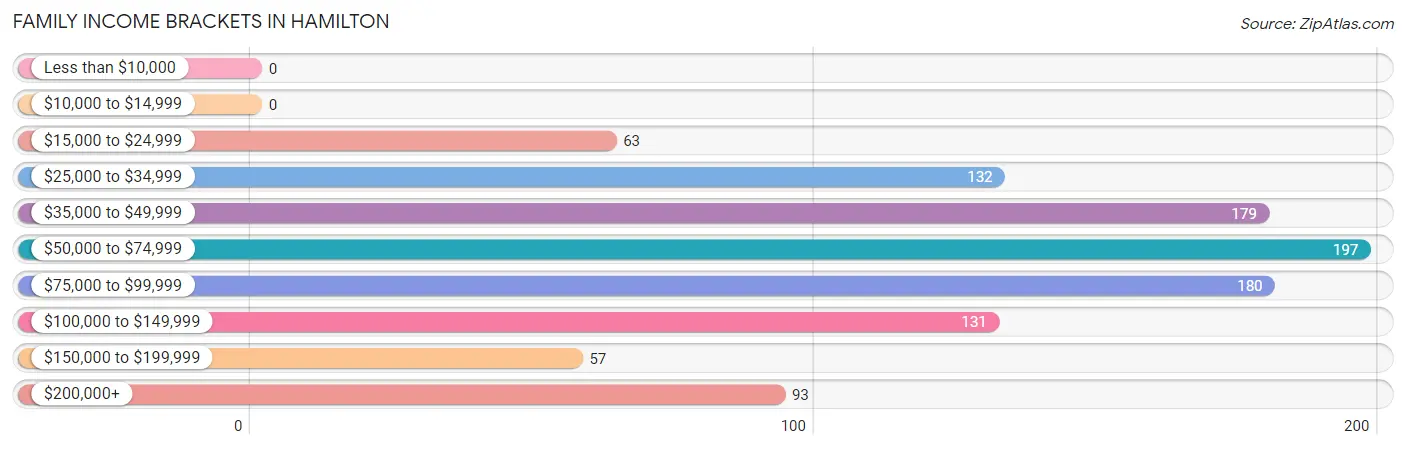
Family Income Brackets in Hamilton
According to the Hamilton family income data, there are 197 families falling into the $50,000 to $74,999 income range, which is the most common income bracket and makes up 19.1% of all families.
| Income Bracket | # Families | % Families |
| Less than $10,000 | 0 | 0.0% |
| $10,000 to $14,999 | 0 | 0.0% |
| $15,000 to $24,999 | 63 | 6.1% |
| $25,000 to $34,999 | 132 | 12.8% |
| $35,000 to $49,999 | 179 | 17.3% |
| $50,000 to $74,999 | 197 | 19.1% |
| $75,000 to $99,999 | 180 | 17.4% |
| $100,000 to $149,999 | 131 | 12.7% |
| $150,000 to $199,999 | 57 | 5.5% |
| $200,000+ | 93 | 9.0% |
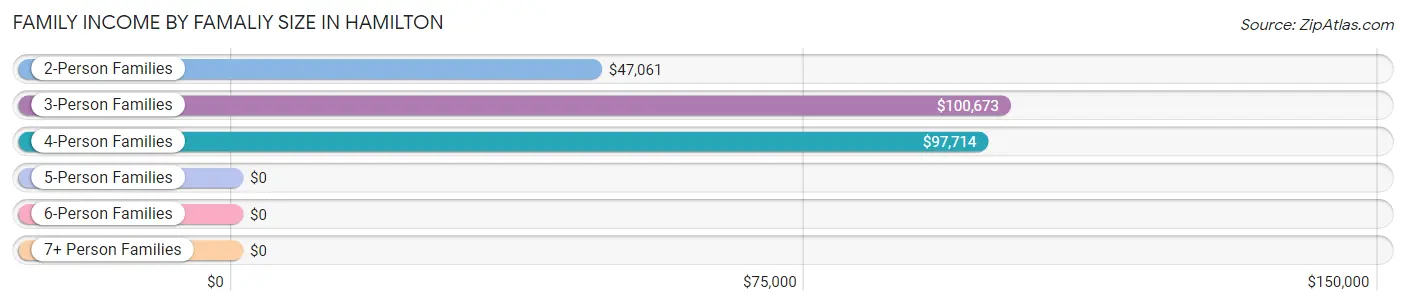
Family Income by Famaliy Size in Hamilton
3-person families (198 | 19.2%) account for the highest median family income in Hamilton with $100,673 per family, while 3-person families (198 | 19.2%) have the highest median income of $33,558 per family member.
| Income Bracket | # Families | Median Income |
| 2-Person Families | 582 (56.4%) | $47,061 |
| 3-Person Families | 198 (19.2%) | $100,673 |
| 4-Person Families | 152 (14.7%) | $97,714 |
| 5-Person Families | 64 (6.2%) | $0 |
| 6-Person Families | 36 (3.5%) | $0 |
| 7+ Person Families | 0 (0.0%) | $0 |
| Total | 1,032 (100.0%) | $61,481 |
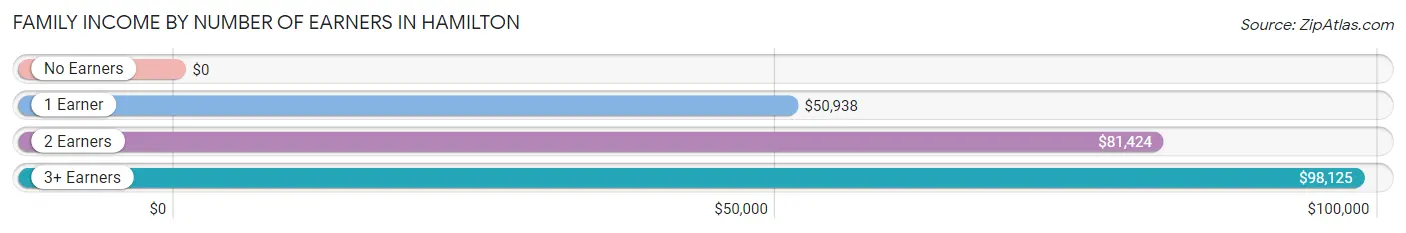
Family Income by Number of Earners in Hamilton
| Number of Earners | # Families | Median Income |
| No Earners | 165 (16.0%) | $0 |
| 1 Earner | 222 (21.5%) | $50,938 |
| 2 Earners | 595 (57.7%) | $81,424 |
| 3+ Earners | 50 (4.8%) | $98,125 |
| Total | 1,032 (100.0%) | $61,481 |
Household Income in Hamilton
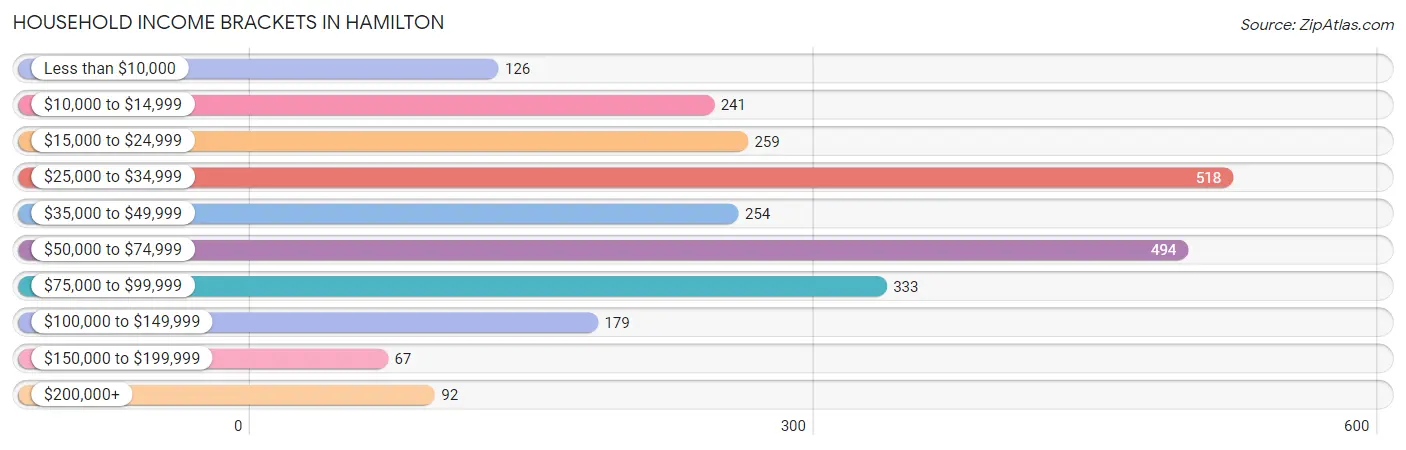
Household Income Brackets in Hamilton
With 518 households falling in the category, the $25,000 to $34,999 income range is the most frequent in Hamilton, accounting for 20.2% of all households. In contrast, only 67 households (2.6%) fall into the $150,000 to $199,999 income bracket, making it the least populous group.
| Income Bracket | # Households | % Households |
| Less than $10,000 | 126 | 4.9% |
| $10,000 to $14,999 | 241 | 9.4% |
| $15,000 to $24,999 | 259 | 10.1% |
| $25,000 to $34,999 | 518 | 20.2% |
| $35,000 to $49,999 | 254 | 9.9% |
| $50,000 to $74,999 | 494 | 19.3% |
| $75,000 to $99,999 | 333 | 13.0% |
| $100,000 to $149,999 | 179 | 7.0% |
| $150,000 to $199,999 | 67 | 2.6% |
| $200,000+ | 92 | 3.6% |
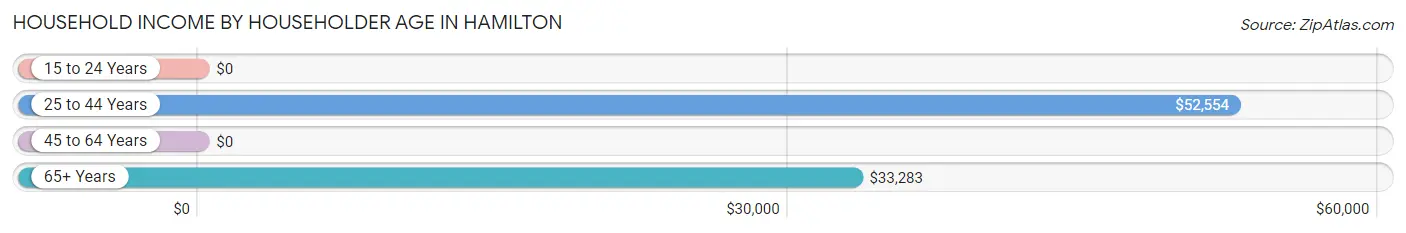
Household Income by Householder Age in Hamilton
The median household income in Hamilton is $45,973, with the highest median household income of $52,554 found in the 25 to 44 years age bracket for the primary householder. A total of 704 households (27.5%) fall into this category. Meanwhile, the 15 to 24 years age bracket for the primary householder has the lowest median household income of $0, with 45 households (1.8%) in this group.
| Income Bracket | # Households | Median Income |
| 15 to 24 Years | 45 (1.8%) | $0 |
| 25 to 44 Years | 704 (27.5%) | $52,554 |
| 45 to 64 Years | 684 (26.7%) | $0 |
| 65+ Years | 1,129 (44.1%) | $33,283 |
| Total | 2,562 (100.0%) | $45,973 |
Poverty in Hamilton
Income Below Poverty by Sex and Age in Hamilton
With 4.2% poverty level for males and 20.4% for females among the residents of Hamilton, 35 to 44 year old males and 18 to 24 year old females are the most vulnerable to poverty, with 38 males (12.2%) and 45 females (65.2%) in their respective age groups living below the poverty level.
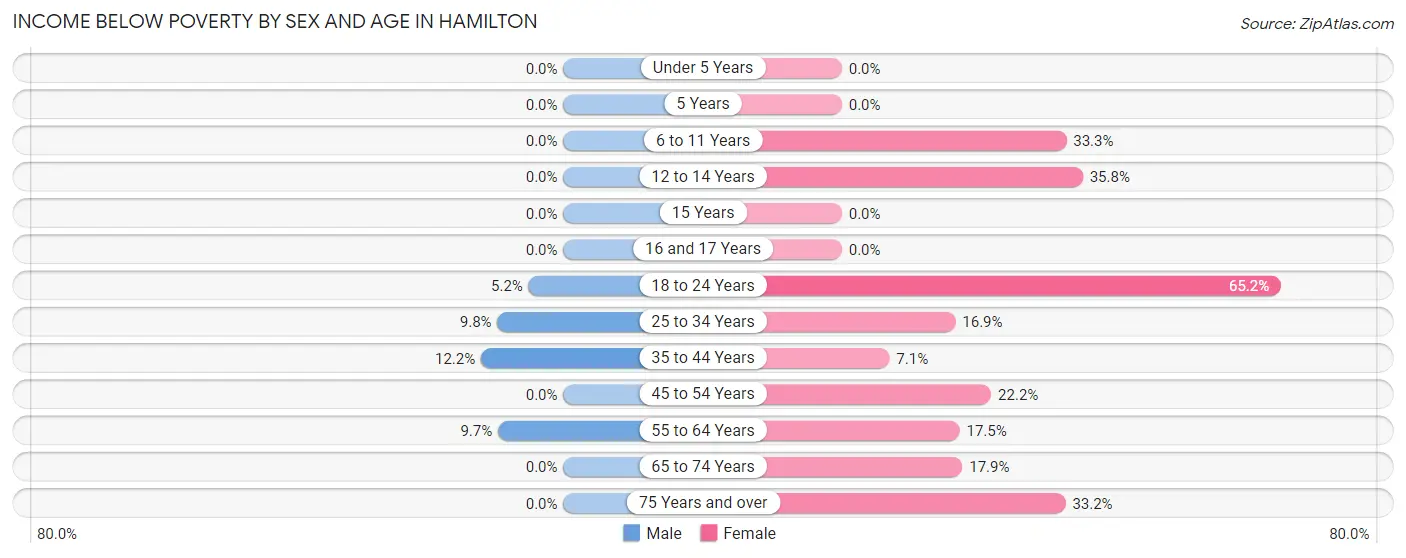
| Age Bracket | Male | Female |
| Under 5 Years | 0 (0.0%) | 0 (0.0%) |
| 5 Years | 0 (0.0%) | 0 (0.0%) |
| 6 to 11 Years | 0 (0.0%) | 20 (33.3%) |
| 12 to 14 Years | 0 (0.0%) | 39 (35.8%) |
| 15 Years | 0 (0.0%) | 0 (0.0%) |
| 16 and 17 Years | 0 (0.0%) | 0 (0.0%) |
| 18 to 24 Years | 5 (5.1%) | 45 (65.2%) |
| 25 to 34 Years | 23 (9.8%) | 57 (16.9%) |
| 35 to 44 Years | 38 (12.2%) | 26 (7.1%) |
| 45 to 54 Years | 0 (0.0%) | 55 (22.2%) |
| 55 to 64 Years | 16 (9.7%) | 64 (17.5%) |
| 65 to 74 Years | 0 (0.0%) | 56 (17.9%) |
| 75 Years and over | 0 (0.0%) | 183 (33.2%) |
| Total | 82 (4.2%) | 545 (20.4%) |
Income Above Poverty by Sex and Age in Hamilton
According to the poverty statistics in Hamilton, males aged under 5 years and females aged under 5 years are the age groups that are most secure financially, with 100.0% of males and 100.0% of females in these age groups living above the poverty line.
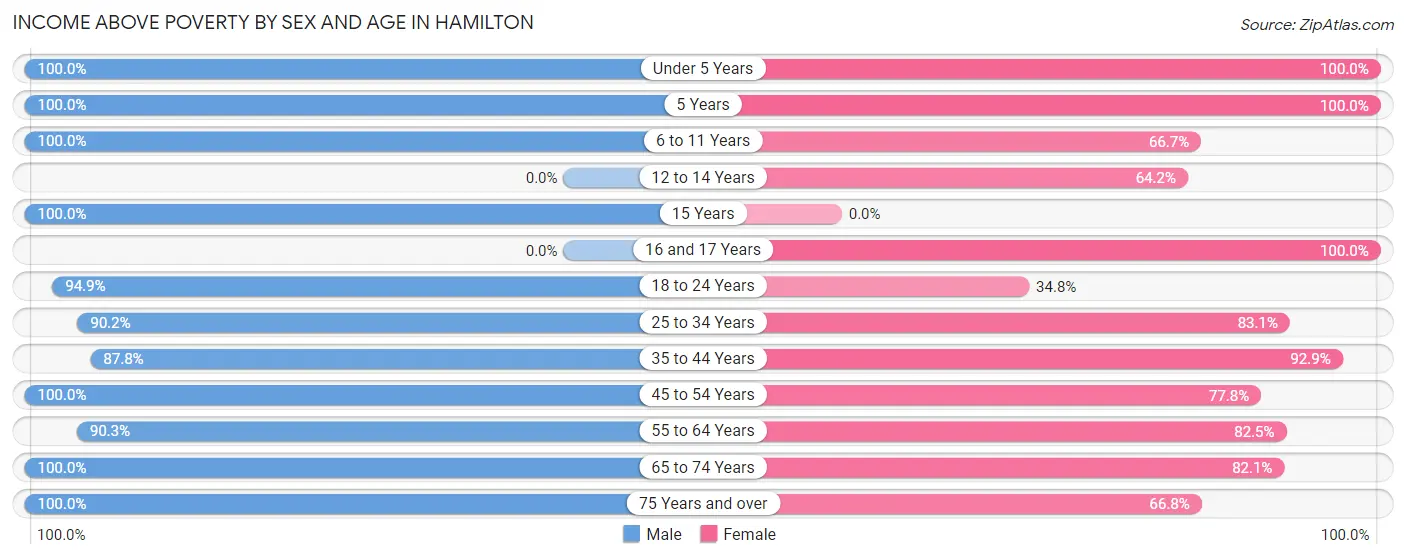
| Age Bracket | Male | Female |
| Under 5 Years | 137 (100.0%) | 174 (100.0%) |
| 5 Years | 21 (100.0%) | 34 (100.0%) |
| 6 to 11 Years | 125 (100.0%) | 40 (66.7%) |
| 12 to 14 Years | 0 (0.0%) | 70 (64.2%) |
| 15 Years | 62 (100.0%) | 0 (0.0%) |
| 16 and 17 Years | 0 (0.0%) | 37 (100.0%) |
| 18 to 24 Years | 92 (94.9%) | 24 (34.8%) |
| 25 to 34 Years | 212 (90.2%) | 281 (83.1%) |
| 35 to 44 Years | 273 (87.8%) | 342 (92.9%) |
| 45 to 54 Years | 300 (100.0%) | 193 (77.8%) |
| 55 to 64 Years | 149 (90.3%) | 302 (82.5%) |
| 65 to 74 Years | 341 (100.0%) | 257 (82.1%) |
| 75 Years and over | 171 (100.0%) | 368 (66.8%) |
| Total | 1,883 (95.8%) | 2,122 (79.6%) |
Income Below Poverty Among Married-Couple Families in Hamilton
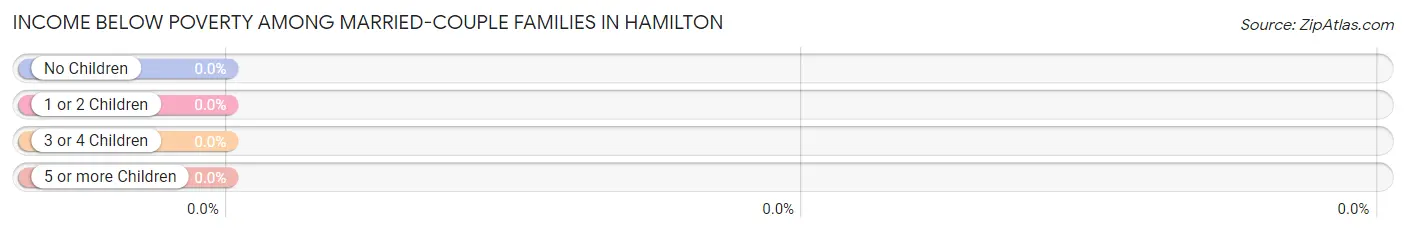
| Children | Above Poverty | Below Poverty |
| No Children | 422 (100.0%) | 0 (0.0%) |
| 1 or 2 Children | 277 (100.0%) | 0 (0.0%) |
| 3 or 4 Children | 82 (100.0%) | 0 (0.0%) |
| 5 or more Children | 0 (0.0%) | 0 (0.0%) |
| Total | 781 (100.0%) | 0 (0.0%) |
Income Below Poverty Among Single-Parent Households in Hamilton
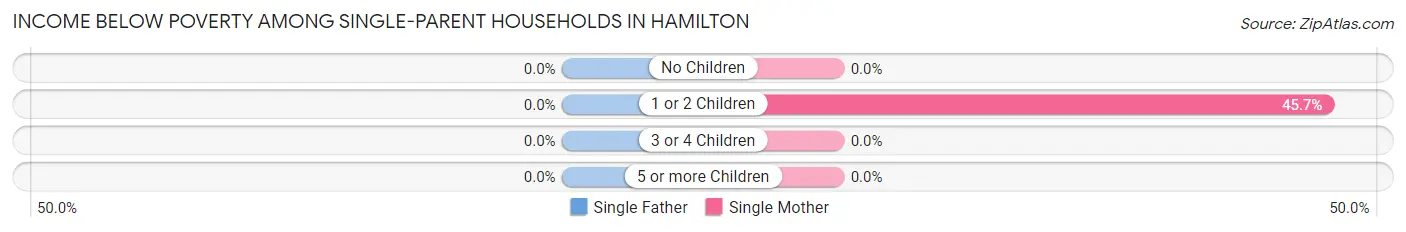
| Children | Single Father | Single Mother |
| No Children | 0 (0.0%) | 0 (0.0%) |
| 1 or 2 Children | 0 (0.0%) | 37 (45.7%) |
| 3 or 4 Children | 0 (0.0%) | 0 (0.0%) |
| 5 or more Children | 0 (0.0%) | 0 (0.0%) |
| Total | 0 (0.0%) | 37 (21.1%) |
Income Below Poverty Among Married-Couple vs Single-Parent Households in Hamilton
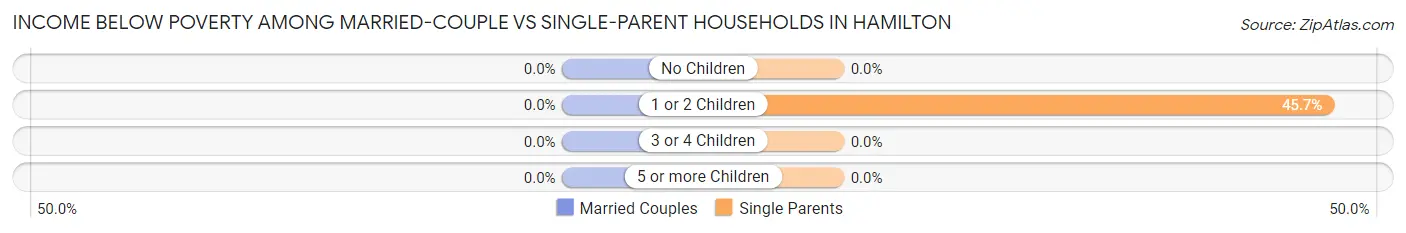
| Children | Married-Couple Families | Single-Parent Households |
| No Children | 0 (0.0%) | 0 (0.0%) |
| 1 or 2 Children | 0 (0.0%) | 37 (45.7%) |
| 3 or 4 Children | 0 (0.0%) | 0 (0.0%) |
| 5 or more Children | 0 (0.0%) | 0 (0.0%) |
| Total | 0 (0.0%) | 37 (14.7%) |
Race in Hamilton
The most populous races in Hamilton are White / Caucasian (4,536 | 94.4%), Two or more Races (193 | 4.0%), and Hispanic or Latino (147 | 3.1%).
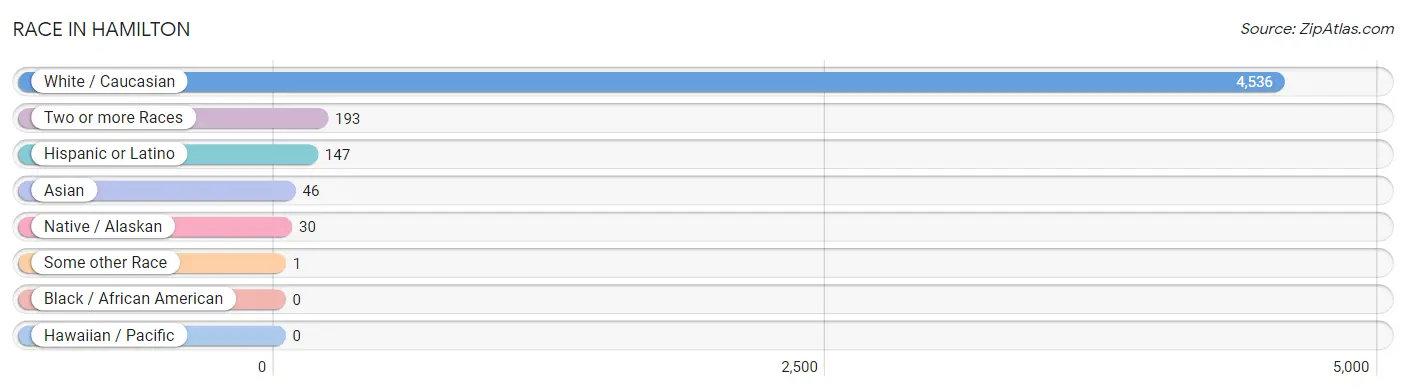
| Race | # Population | % Population |
| Asian | 46 | 1.0% |
| Black / African American | 0 | 0.0% |
| Hawaiian / Pacific | 0 | 0.0% |
| Hispanic or Latino | 147 | 3.1% |
| Native / Alaskan | 30 | 0.6% |
| White / Caucasian | 4,536 | 94.4% |
| Two or more Races | 193 | 4.0% |
| Some other Race | 1 | 0.0% |
| Total | 4,806 | 100.0% |
Ancestry in Hamilton
The most populous ancestries reported in Hamilton are German (1,053 | 21.9%), English (784 | 16.3%), Irish (440 | 9.2%), Norwegian (297 | 6.2%), and Swedish (248 | 5.2%), together accounting for 58.7% of all Hamilton residents.
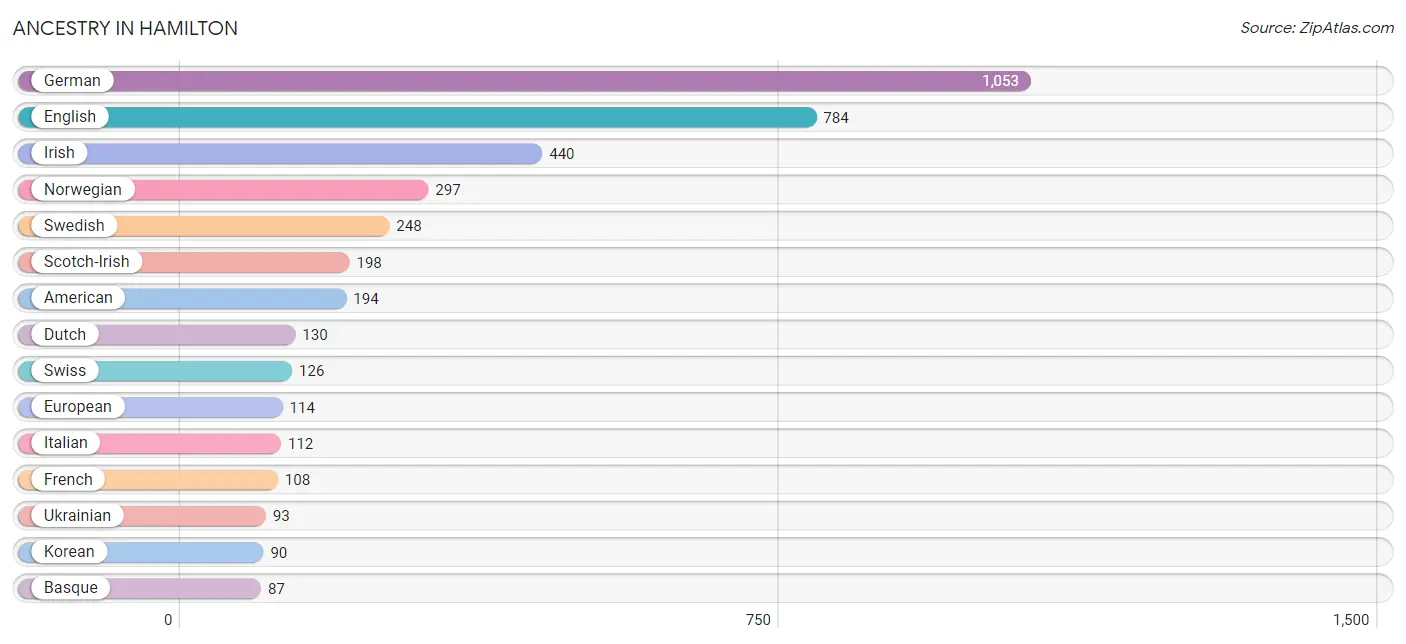
| Ancestry | # Population | % Population |
| American | 194 | 4.0% |
| Armenian | 13 | 0.3% |
| Austrian | 19 | 0.4% |
| Basque | 87 | 1.8% |
| Blackfeet | 1 | 0.0% |
| British | 36 | 0.7% |
| Chippewa | 31 | 0.6% |
| Choctaw | 35 | 0.7% |
| Czech | 85 | 1.8% |
| Danish | 79 | 1.6% |
| Dutch | 130 | 2.7% |
| Eastern European | 2 | 0.0% |
| English | 784 | 16.3% |
| European | 114 | 2.4% |
| Finnish | 39 | 0.8% |
| French | 108 | 2.2% |
| French Canadian | 13 | 0.3% |
| German | 1,053 | 21.9% |
| Hungarian | 9 | 0.2% |
| Indian (Asian) | 11 | 0.2% |
| Irish | 440 | 9.2% |
| Italian | 112 | 2.3% |
| Korean | 90 | 1.9% |
| Mexican | 81 | 1.7% |
| Norwegian | 297 | 6.2% |
| Polish | 50 | 1.0% |
| Puerto Rican | 51 | 1.1% |
| Romanian | 5 | 0.1% |
| Scandinavian | 25 | 0.5% |
| Scotch-Irish | 198 | 4.1% |
| Scottish | 70 | 1.5% |
| Slavic | 22 | 0.5% |
| Slovak | 33 | 0.7% |
| South African | 22 | 0.5% |
| Subsaharan African | 22 | 0.5% |
| Swedish | 248 | 5.2% |
| Swiss | 126 | 2.6% |
| Ukrainian | 93 | 1.9% | View All 38 Rows |
Immigrants in Hamilton
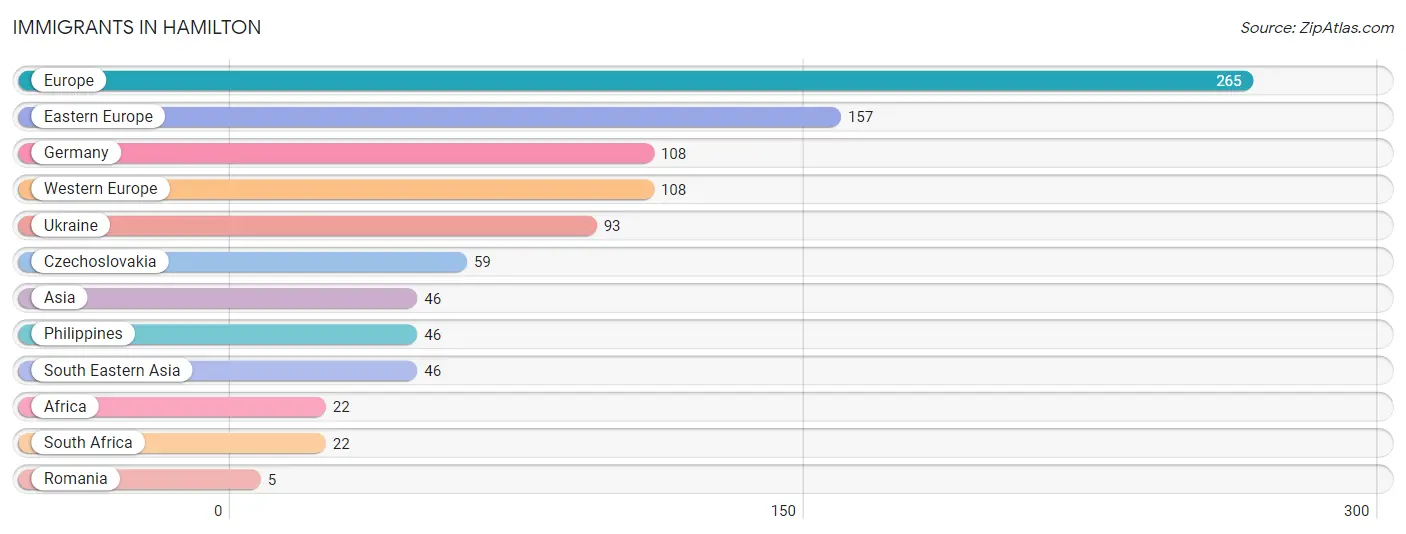
The most numerous immigrant groups reported in Hamilton came from Europe (265 | 5.5%), Eastern Europe (157 | 3.3%), Germany (108 | 2.2%), Western Europe (108 | 2.2%), and Ukraine (93 | 1.9%), together accounting for 15.2% of all Hamilton residents.
| Immigration Origin | # Population | % Population |
| Africa | 22 | 0.5% |
| Asia | 46 | 1.0% |
| Czechoslovakia | 59 | 1.2% |
| Eastern Europe | 157 | 3.3% |
| Europe | 265 | 5.5% |
| Germany | 108 | 2.2% |
| Philippines | 46 | 1.0% |
| Romania | 5 | 0.1% |
| South Africa | 22 | 0.5% |
| South Eastern Asia | 46 | 1.0% |
| Ukraine | 93 | 1.9% |
| Western Europe | 108 | 2.2% | View All 12 Rows |
Sex and Age in Hamilton
Sex and Age in Hamilton
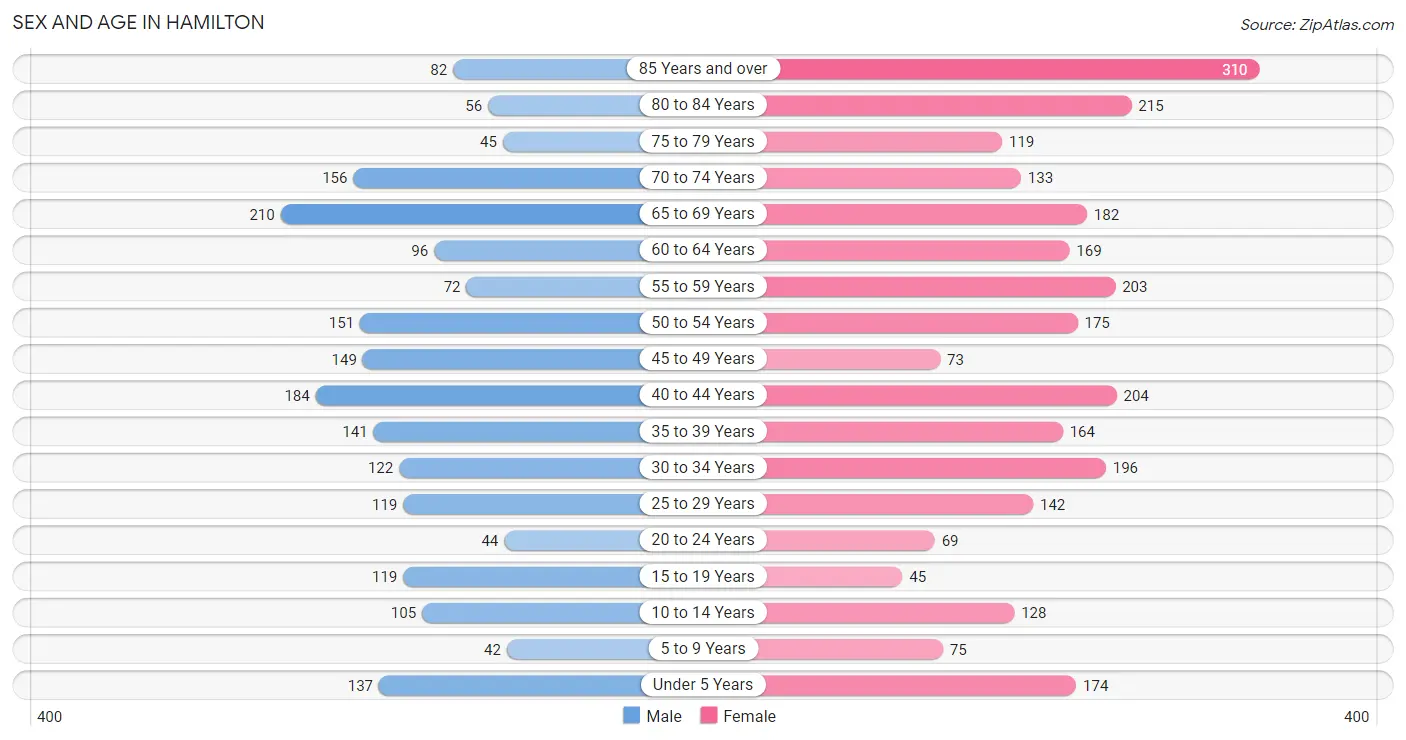
The most populous age groups in Hamilton are 65 to 69 Years (210 | 10.3%) for men and 85 Years and over (310 | 11.2%) for women.
| Age Bracket | Male | Female |
| Under 5 Years | 137 (6.8%) | 174 (6.3%) |
| 5 to 9 Years | 42 (2.1%) | 75 (2.7%) |
| 10 to 14 Years | 105 (5.2%) | 128 (4.6%) |
| 15 to 19 Years | 119 (5.9%) | 45 (1.6%) |
| 20 to 24 Years | 44 (2.2%) | 69 (2.5%) |
| 25 to 29 Years | 119 (5.9%) | 142 (5.1%) |
| 30 to 34 Years | 122 (6.0%) | 196 (7.1%) |
| 35 to 39 Years | 141 (7.0%) | 164 (5.9%) |
| 40 to 44 Years | 184 (9.1%) | 204 (7.3%) |
| 45 to 49 Years | 149 (7.3%) | 73 (2.6%) |
| 50 to 54 Years | 151 (7.4%) | 175 (6.3%) |
| 55 to 59 Years | 72 (3.5%) | 203 (7.3%) |
| 60 to 64 Years | 96 (4.7%) | 169 (6.1%) |
| 65 to 69 Years | 210 (10.3%) | 182 (6.6%) |
| 70 to 74 Years | 156 (7.7%) | 133 (4.8%) |
| 75 to 79 Years | 45 (2.2%) | 119 (4.3%) |
| 80 to 84 Years | 56 (2.8%) | 215 (7.7%) |
| 85 Years and over | 82 (4.0%) | 310 (11.2%) |
| Total | 2,030 (100.0%) | 2,776 (100.0%) |
Families and Households in Hamilton
Median Family Size in Hamilton
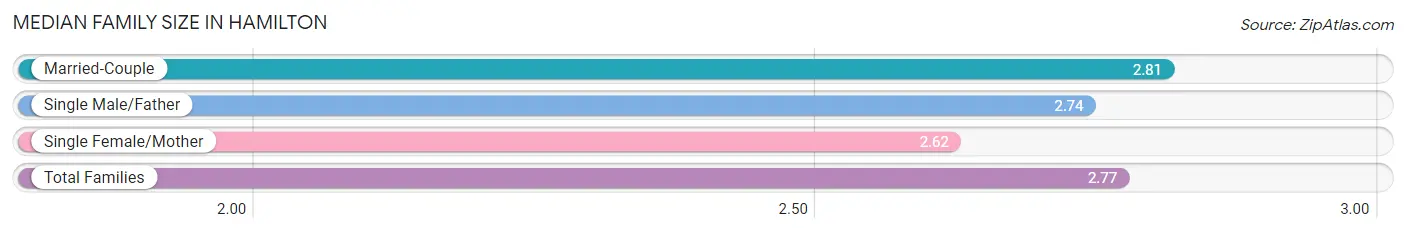
The median family size in Hamilton is 2.77 persons per family, with married-couple families (781 | 75.7%) accounting for the largest median family size of 2.81 persons per family. On the other hand, single female/mother families (175 | 17.0%) represent the smallest median family size with 2.62 persons per family.
| Family Type | # Families | Family Size |
| Married-Couple | 781 (75.7%) | 2.81 |
| Single Male/Father | 76 (7.4%) | 2.74 |
| Single Female/Mother | 175 (17.0%) | 2.62 |
| Total Families | 1,032 (100.0%) | 2.77 |
Median Household Size in Hamilton
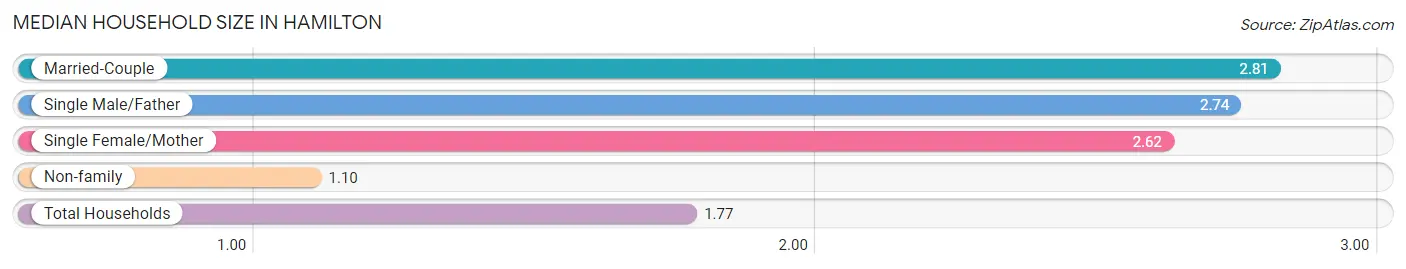
The median household size in Hamilton is 1.77 persons per household, with married-couple households (781 | 30.5%) accounting for the largest median household size of 2.81 persons per household. non-family households (1,530 | 59.7%) represent the smallest median household size with 1.10 persons per household.
| Household Type | # Households | Household Size |
| Married-Couple | 781 (30.5%) | 2.81 |
| Single Male/Father | 76 (3.0%) | 2.74 |
| Single Female/Mother | 175 (6.8%) | 2.62 |
| Non-family | 1,530 (59.7%) | 1.10 |
| Total Households | 2,562 (100.0%) | 1.77 |
Household Size by Marriage Status in Hamilton
Out of a total of 2,562 households in Hamilton, 1,032 (40.3%) are family households, while 1,530 (59.7%) are nonfamily households. The most numerous type of family households are 2-person households, comprising 582, and the most common type of nonfamily households are 1-person households, comprising 1,394.
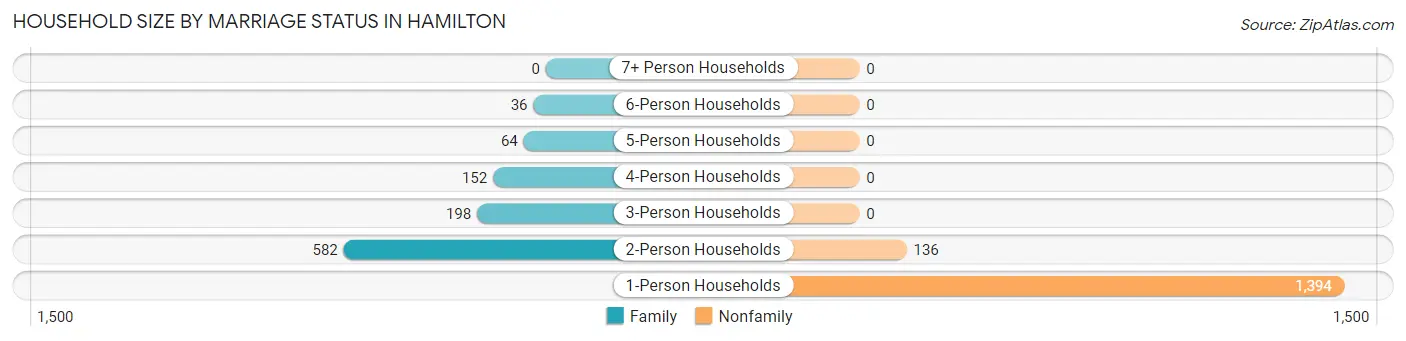
| Household Size | Family Households | Nonfamily Households |
| 1-Person Households | - | 1,394 (54.4%) |
| 2-Person Households | 582 (22.7%) | 136 (5.3%) |
| 3-Person Households | 198 (7.7%) | 0 (0.0%) |
| 4-Person Households | 152 (5.9%) | 0 (0.0%) |
| 5-Person Households | 64 (2.5%) | 0 (0.0%) |
| 6-Person Households | 36 (1.4%) | 0 (0.0%) |
| 7+ Person Households | 0 (0.0%) | 0 (0.0%) |
| Total | 1,032 (40.3%) | 1,530 (59.7%) |
Female Fertility in Hamilton
Fertility by Age in Hamilton
Average fertility rate in Hamilton is 94.0 births per 1,000 women. Women in the age bracket of 20 to 34 years have the highest fertility rate with 133.0 births per 1,000 women. Women in the age bracket of 20 to 34 years acount for 60.0% of all women with births.
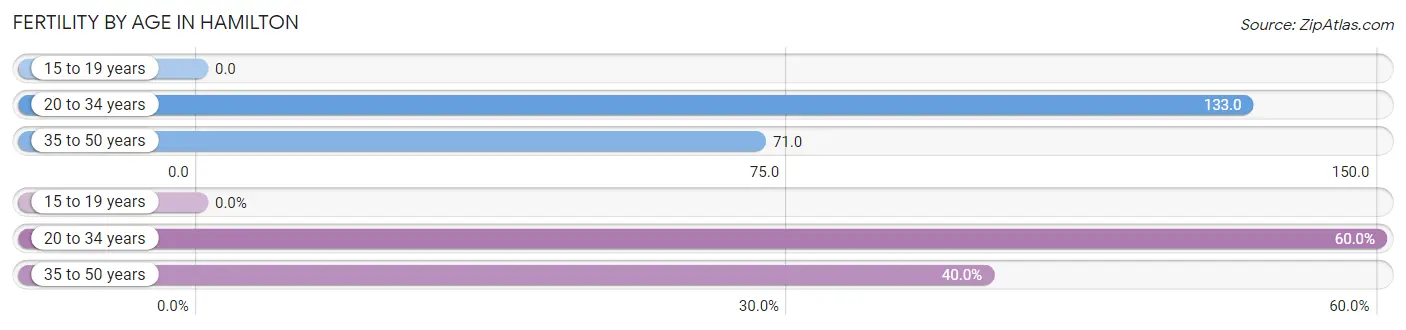
| Age Bracket | Women with Births | Births / 1,000 Women |
| 15 to 19 years | 0 (0.0%) | 0.0 |
| 20 to 34 years | 54 (60.0%) | 133.0 |
| 35 to 50 years | 36 (40.0%) | 71.0 |
| Total | 90 (100.0%) | 94.0 |
Fertility by Age by Marriage Status in Hamilton
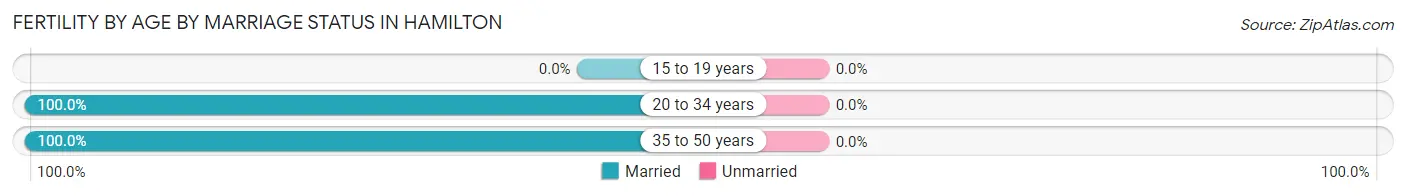
| Age Bracket | Married | Unmarried |
| 15 to 19 years | 0 (0.0%) | 0 (0.0%) |
| 20 to 34 years | 54 (100.0%) | 0 (0.0%) |
| 35 to 50 years | 36 (100.0%) | 0 (0.0%) |
| Total | 90 (100.0%) | 0 (0.0%) |
Fertility by Education in Hamilton
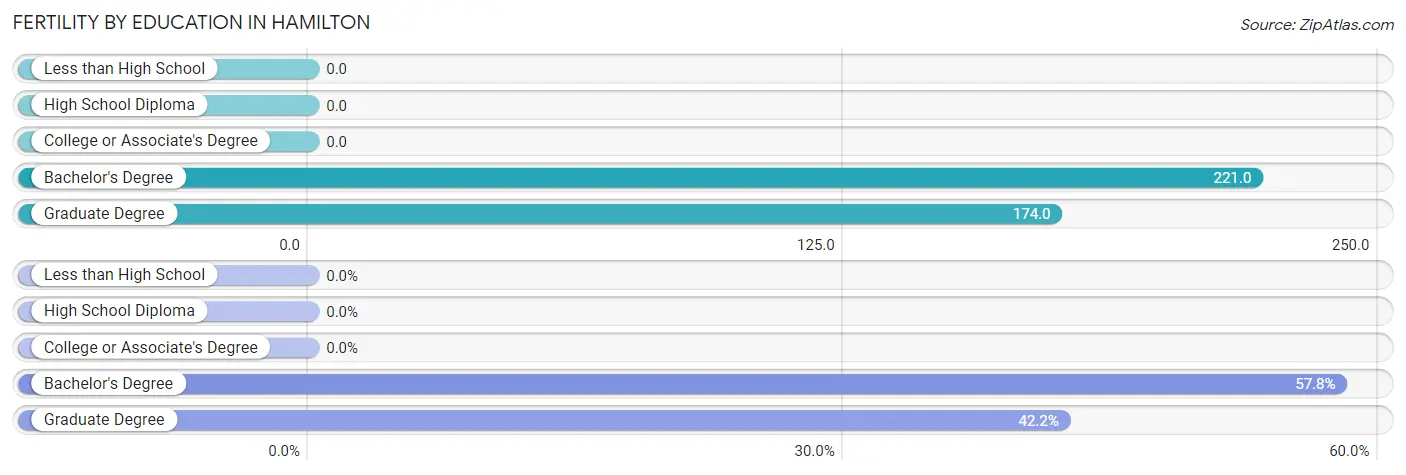
| Educational Attainment | Women with Births | Births / 1,000 Women |
| Less than High School | 0 (0.0%) | 0.0 |
| High School Diploma | 0 (0.0%) | 0.0 |
| College or Associate's Degree | 0 (0.0%) | 0.0 |
| Bachelor's Degree | 52 (57.8%) | 221.0 |
| Graduate Degree | 38 (42.2%) | 174.0 |
| Total | 90 (100.0%) | 94.0 |
Fertility by Education by Marriage Status in Hamilton
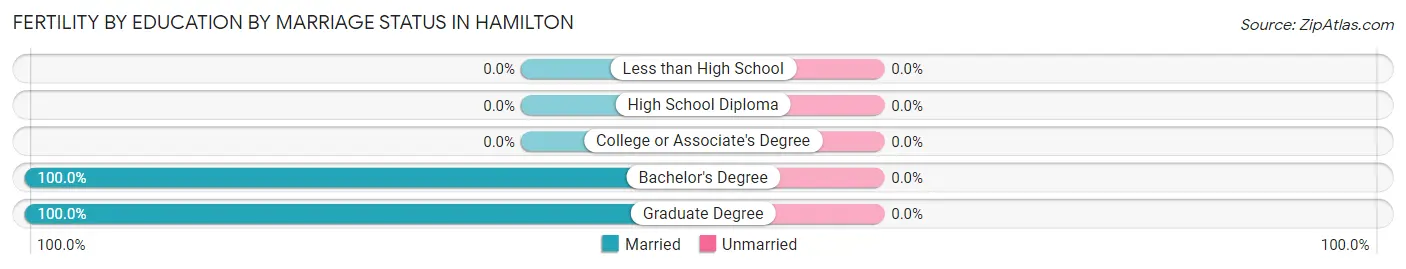
| Educational Attainment | Married | Unmarried |
| Less than High School | 0 (0.0%) | 0 (0.0%) |
| High School Diploma | 0 (0.0%) | 0 (0.0%) |
| College or Associate's Degree | 0 (0.0%) | 0 (0.0%) |
| Bachelor's Degree | 52 (100.0%) | 0 (0.0%) |
| Graduate Degree | 38 (100.0%) | 0 (0.0%) |
| Total | 90 (100.0%) | 0 (0.0%) |
Employment Characteristics in Hamilton
Employment by Class of Employer in Hamilton
Among the 2,083 employed individuals in Hamilton, private company employees (1,109 | 53.2%), not-for-profit organizations (481 | 23.1%), and self-employed (incorporated) (155 | 7.4%) make up the most common classes of employment.
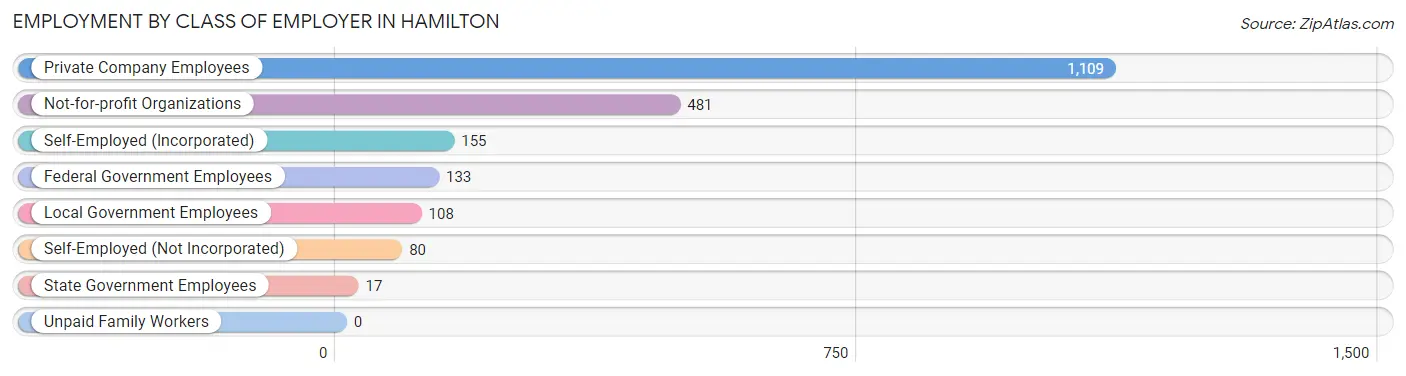
| Employer Class | # Employees | % Employees |
| Private Company Employees | 1,109 | 53.2% |
| Self-Employed (Incorporated) | 155 | 7.4% |
| Self-Employed (Not Incorporated) | 80 | 3.8% |
| Not-for-profit Organizations | 481 | 23.1% |
| Local Government Employees | 108 | 5.2% |
| State Government Employees | 17 | 0.8% |
| Federal Government Employees | 133 | 6.4% |
| Unpaid Family Workers | 0 | 0.0% |
| Total | 2,083 | 100.0% |
Employment Status by Age in Hamilton
According to the labor force statistics for Hamilton, out of the total population over 16 years of age (4,082), 57.6% or 2,351 individuals are in the labor force, with 2.4% or 56 of them unemployed. The age group with the highest labor force participation rate is 30 to 34 years, with 98.4% or 313 individuals in the labor force. Within the labor force, the 45 to 54 years age range has the highest percentage of unemployed individuals, with 8.4% or 37 of them being unemployed.
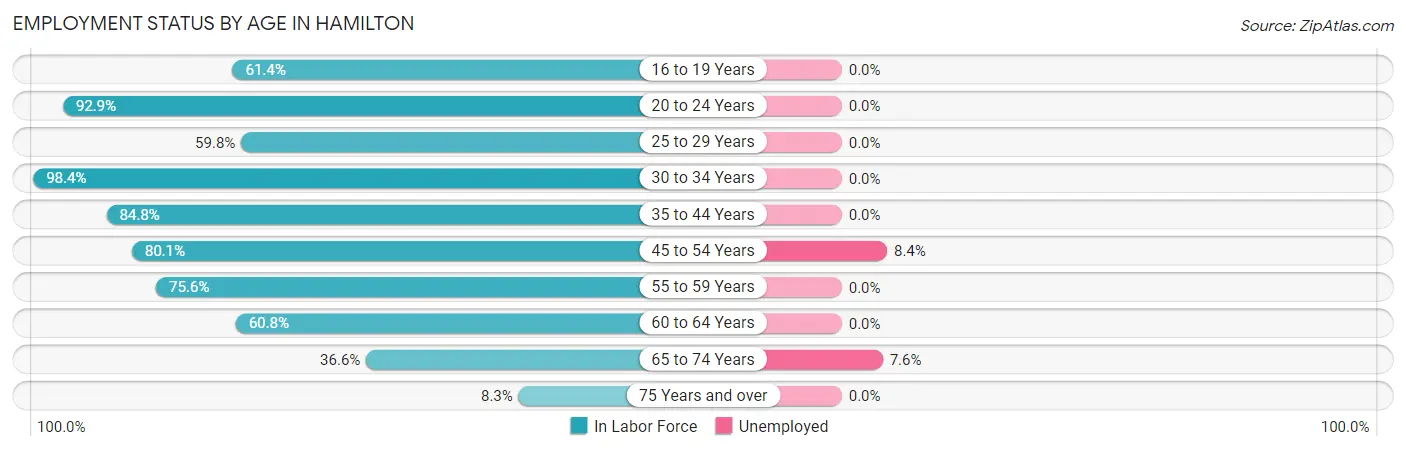
| Age Bracket | In Labor Force | Unemployed |
| 16 to 19 Years | 62 (61.4%) | 0 (0.0%) |
| 20 to 24 Years | 105 (92.9%) | 0 (0.0%) |
| 25 to 29 Years | 156 (59.8%) | 0 (0.0%) |
| 30 to 34 Years | 313 (98.4%) | 0 (0.0%) |
| 35 to 44 Years | 588 (84.8%) | 0 (0.0%) |
| 45 to 54 Years | 439 (80.1%) | 37 (8.4%) |
| 55 to 59 Years | 208 (75.6%) | 0 (0.0%) |
| 60 to 64 Years | 161 (60.8%) | 0 (0.0%) |
| 65 to 74 Years | 249 (36.6%) | 19 (7.6%) |
| 75 Years and over | 69 (8.3%) | 0 (0.0%) |
| Total | 2,351 (57.6%) | 56 (2.4%) |
Employment Status by Educational Attainment in Hamilton
According to labor force statistics for Hamilton, 79.0% of individuals (1,864) out of the total population between 25 and 64 years of age (2,360) are in the labor force, with 2.0% or 37 of them being unemployed. The group with the highest labor force participation rate are those with the educational attainment of bachelor's degree or higher, with 90.7% or 719 individuals in the labor force. Within the labor force, individuals with high school diploma education have the highest percentage of unemployment, with 7.9% or 37 of them being unemployed.
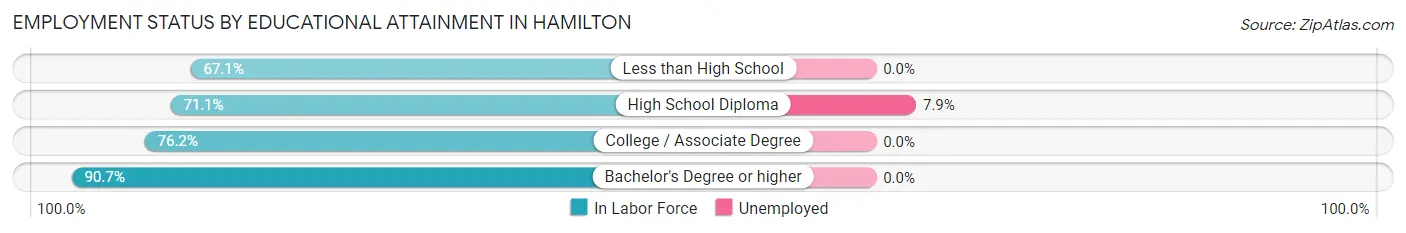
| Educational Attainment | In Labor Force | Unemployed |
| Less than High School | 106 (67.1%) | 0 (0.0%) |
| High School Diploma | 469 (71.1%) | 52 (7.9%) |
| College / Associate Degree | 571 (76.2%) | 0 (0.0%) |
| Bachelor's Degree or higher | 719 (90.7%) | 0 (0.0%) |
| Total | 1,864 (79.0%) | 47 (2.0%) |
Employment Occupations by Sex in Hamilton
Management, Business, Science and Arts Occupations
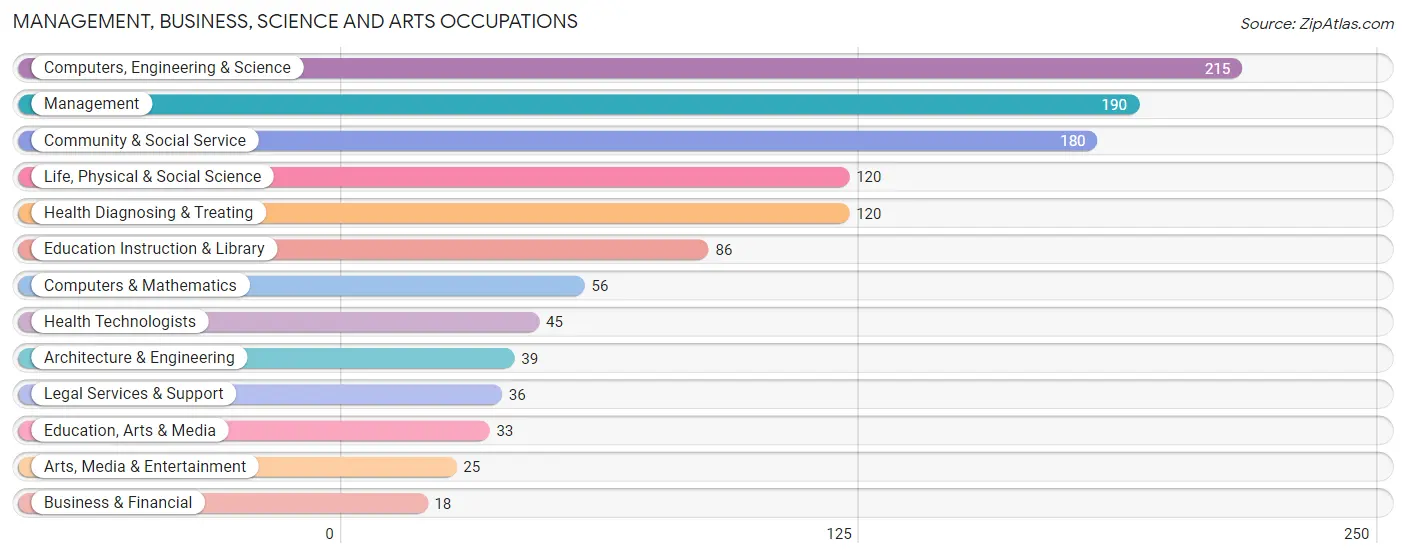
The most common Management, Business, Science and Arts occupations in Hamilton are Computers, Engineering & Science (215 | 9.4%), Management (190 | 8.3%), Community & Social Service (180 | 7.9%), Life, Physical & Social Science (120 | 5.2%), and Health Diagnosing & Treating (120 | 5.2%).
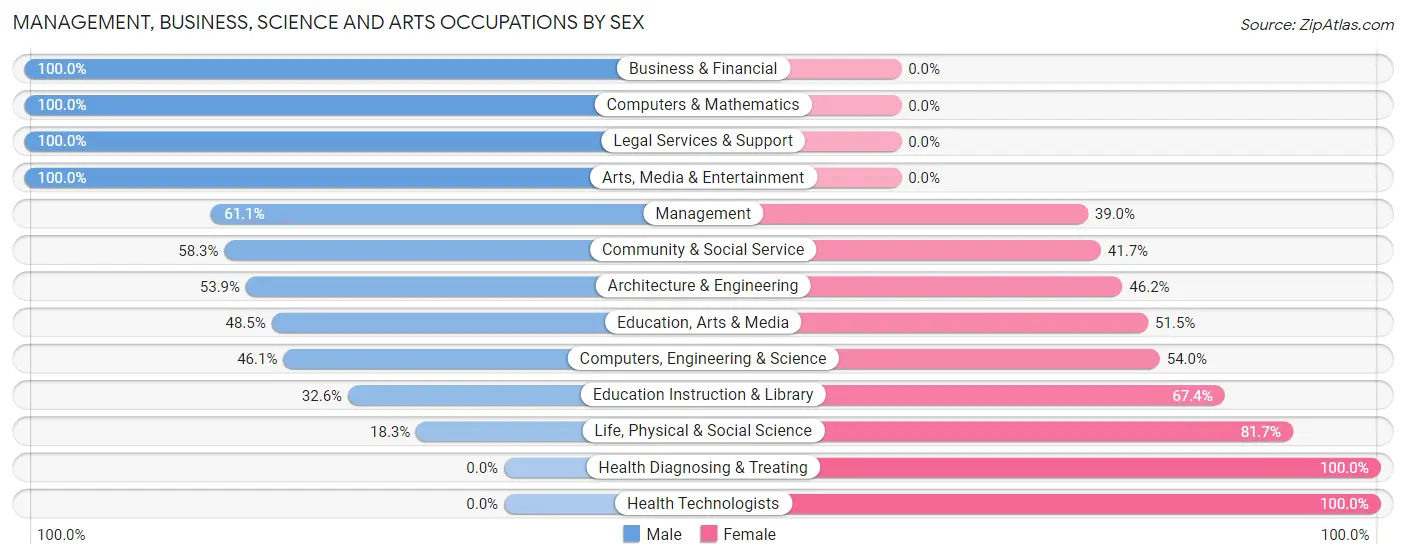
Management, Business, Science and Arts Occupations by Sex
Within the Management, Business, Science and Arts occupations in Hamilton, the most male-oriented occupations are Business & Financial (100.0%), Computers & Mathematics (100.0%), and Legal Services & Support (100.0%), while the most female-oriented occupations are Health Diagnosing & Treating (100.0%), Health Technologists (100.0%), and Life, Physical & Social Science (81.7%).
| Occupation | Male | Female |
| Management | 116 (61.1%) | 74 (39.0%) |
| Business & Financial | 18 (100.0%) | 0 (0.0%) |
| Computers, Engineering & Science | 99 (46.1%) | 116 (53.9%) |
| Computers & Mathematics | 56 (100.0%) | 0 (0.0%) |
| Architecture & Engineering | 21 (53.8%) | 18 (46.2%) |
| Life, Physical & Social Science | 22 (18.3%) | 98 (81.7%) |
| Community & Social Service | 105 (58.3%) | 75 (41.7%) |
| Education, Arts & Media | 16 (48.5%) | 17 (51.5%) |
| Legal Services & Support | 36 (100.0%) | 0 (0.0%) |
| Education Instruction & Library | 28 (32.6%) | 58 (67.4%) |
| Arts, Media & Entertainment | 25 (100.0%) | 0 (0.0%) |
| Health Diagnosing & Treating | 0 (0.0%) | 120 (100.0%) |
| Health Technologists | 0 (0.0%) | 45 (100.0%) |
| Total (Category) | 338 (46.8%) | 385 (53.2%) |
| Total (Overall) | 1,011 (44.1%) | 1,283 (55.9%) |
Services Occupations
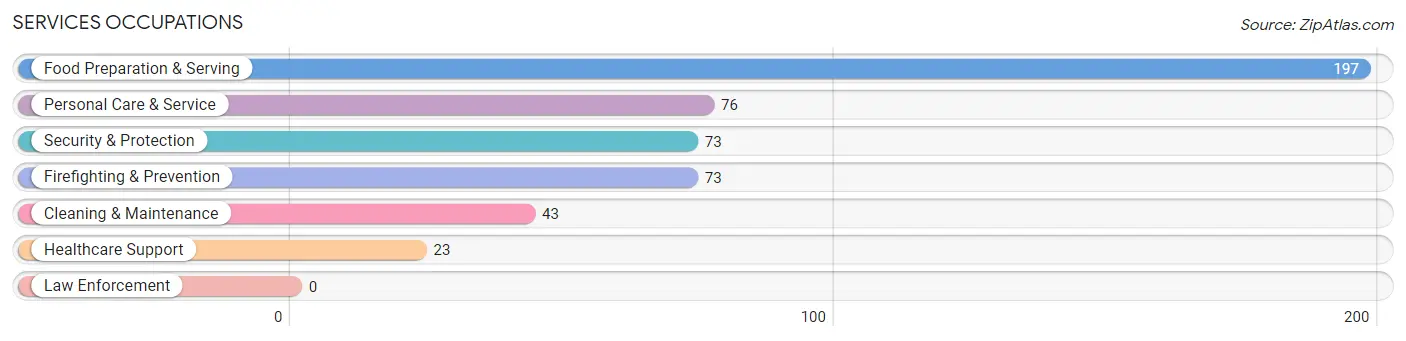
The most common Services occupations in Hamilton are Food Preparation & Serving (197 | 8.6%), Personal Care & Service (76 | 3.3%), Security & Protection (73 | 3.2%), Firefighting & Prevention (73 | 3.2%), and Cleaning & Maintenance (43 | 1.9%).
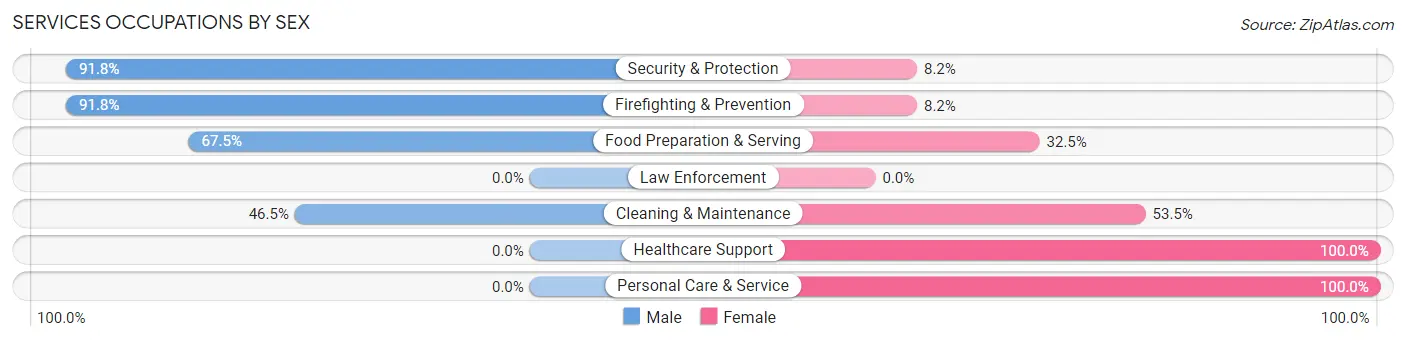
Services Occupations by Sex
Within the Services occupations in Hamilton, the most male-oriented occupations are Security & Protection (91.8%), Firefighting & Prevention (91.8%), and Food Preparation & Serving (67.5%), while the most female-oriented occupations are Healthcare Support (100.0%), Personal Care & Service (100.0%), and Cleaning & Maintenance (53.5%).
| Occupation | Male | Female |
| Healthcare Support | 0 (0.0%) | 23 (100.0%) |
| Security & Protection | 67 (91.8%) | 6 (8.2%) |
| Firefighting & Prevention | 67 (91.8%) | 6 (8.2%) |
| Law Enforcement | 0 (0.0%) | 0 (0.0%) |
| Food Preparation & Serving | 133 (67.5%) | 64 (32.5%) |
| Cleaning & Maintenance | 20 (46.5%) | 23 (53.5%) |
| Personal Care & Service | 0 (0.0%) | 76 (100.0%) |
| Total (Category) | 220 (53.4%) | 192 (46.6%) |
| Total (Overall) | 1,011 (44.1%) | 1,283 (55.9%) |
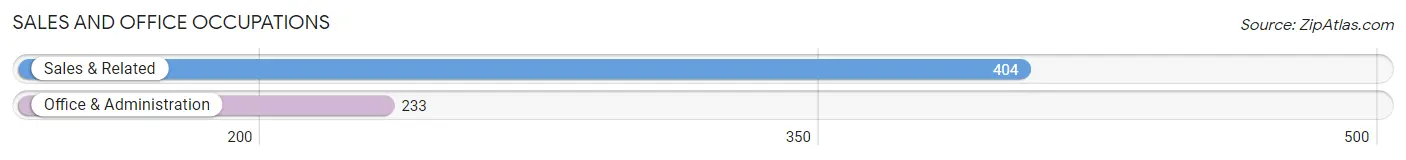
Sales and Office Occupations
The most common Sales and Office occupations in Hamilton are Sales & Related (404 | 17.6%), and Office & Administration (233 | 10.2%).
Sales and Office Occupations by Sex
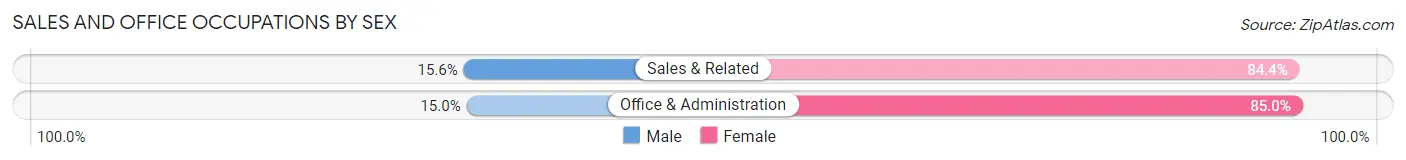
| Occupation | Male | Female |
| Sales & Related | 63 (15.6%) | 341 (84.4%) |
| Office & Administration | 35 (15.0%) | 198 (85.0%) |
| Total (Category) | 98 (15.4%) | 539 (84.6%) |
| Total (Overall) | 1,011 (44.1%) | 1,283 (55.9%) |
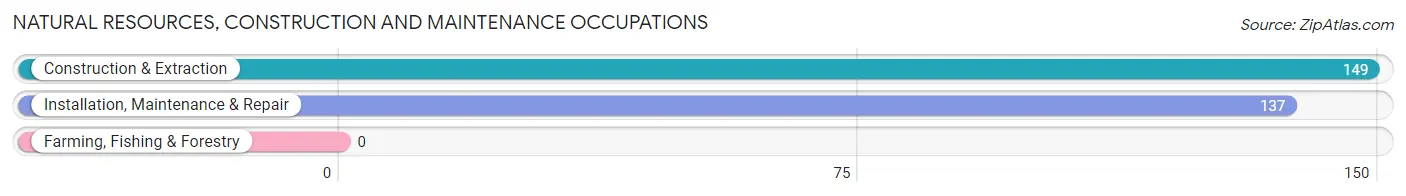
Natural Resources, Construction and Maintenance Occupations
The most common Natural Resources, Construction and Maintenance occupations in Hamilton are Construction & Extraction (149 | 6.5%), and Installation, Maintenance & Repair (137 | 6.0%).
Natural Resources, Construction and Maintenance Occupations by Sex
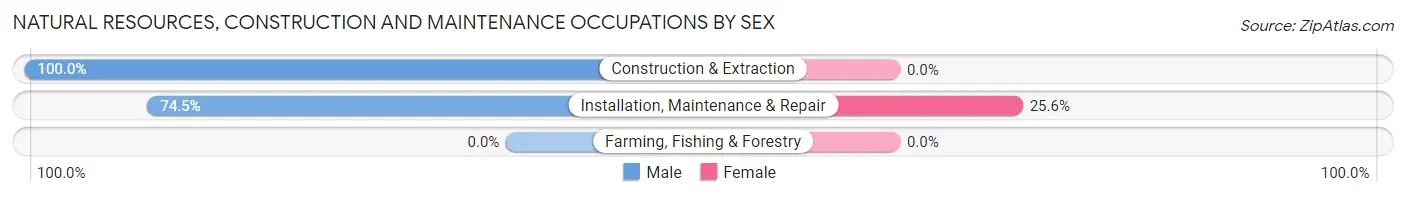
| Occupation | Male | Female |
| Farming, Fishing & Forestry | 0 (0.0%) | 0 (0.0%) |
| Construction & Extraction | 149 (100.0%) | 0 (0.0%) |
| Installation, Maintenance & Repair | 102 (74.5%) | 35 (25.6%) |
| Total (Category) | 251 (87.8%) | 35 (12.2%) |
| Total (Overall) | 1,011 (44.1%) | 1,283 (55.9%) |
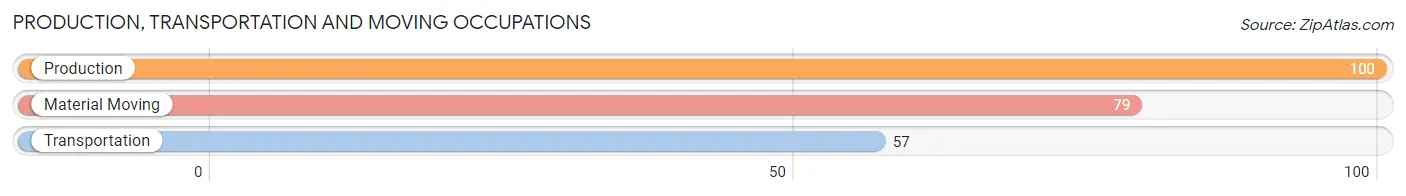
Production, Transportation and Moving Occupations
The most common Production, Transportation and Moving occupations in Hamilton are Production (100 | 4.4%), Material Moving (79 | 3.4%), and Transportation (57 | 2.5%).
Production, Transportation and Moving Occupations by Sex
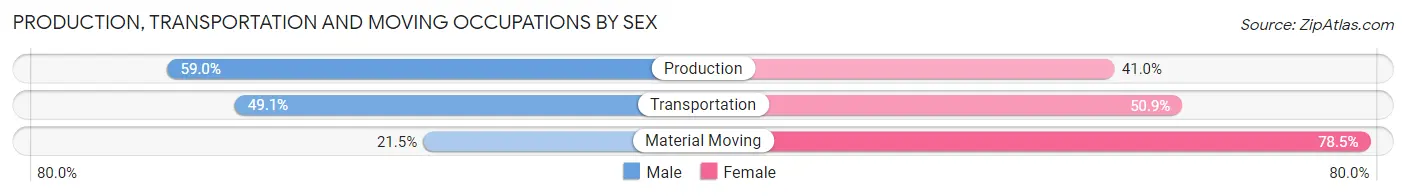
| Occupation | Male | Female |
| Production | 59 (59.0%) | 41 (41.0%) |
| Transportation | 28 (49.1%) | 29 (50.9%) |
| Material Moving | 17 (21.5%) | 62 (78.5%) |
| Total (Category) | 104 (44.1%) | 132 (55.9%) |
| Total (Overall) | 1,011 (44.1%) | 1,283 (55.9%) |
Employment Industries by Sex in Hamilton
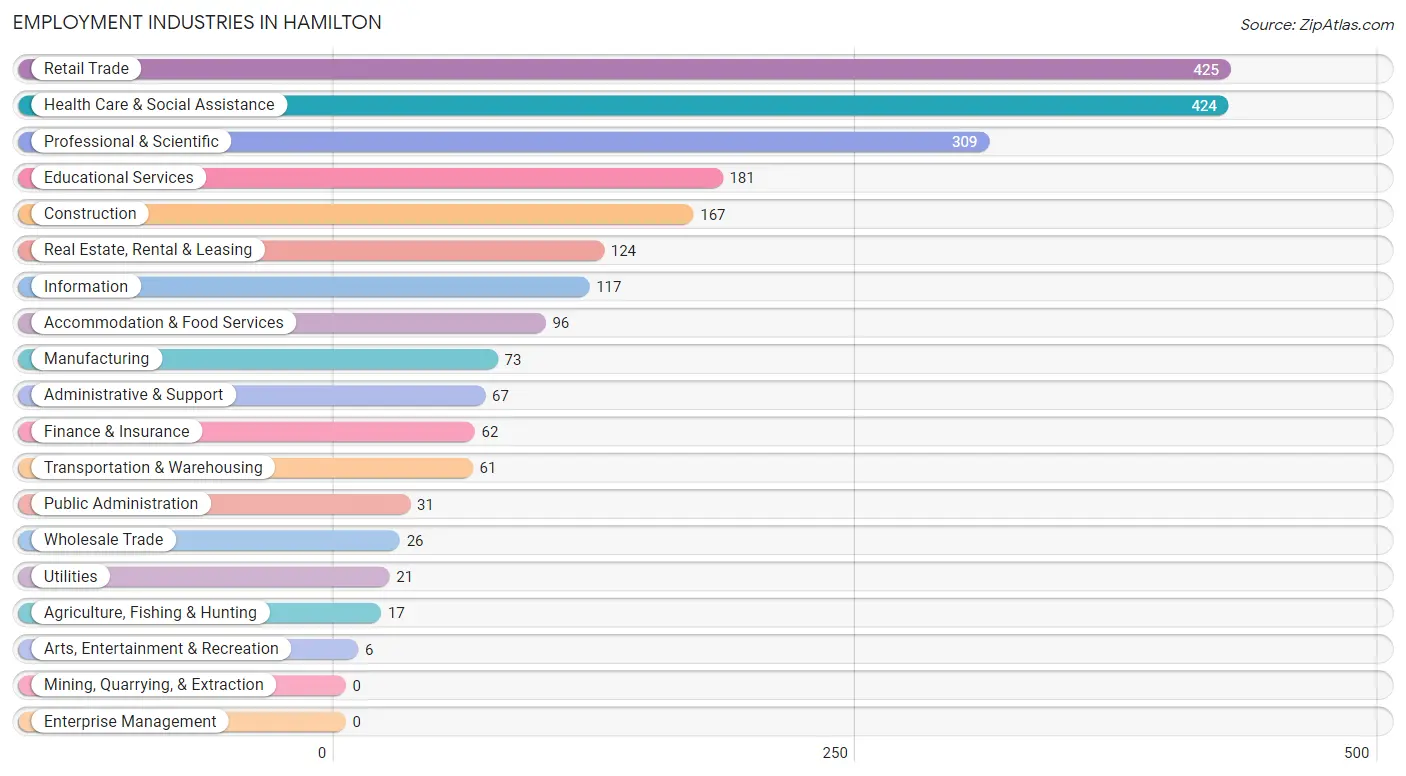
Employment Industries in Hamilton
The major employment industries in Hamilton include Retail Trade (425 | 18.5%), Health Care & Social Assistance (424 | 18.5%), Professional & Scientific (309 | 13.5%), Educational Services (181 | 7.9%), and Construction (167 | 7.3%).
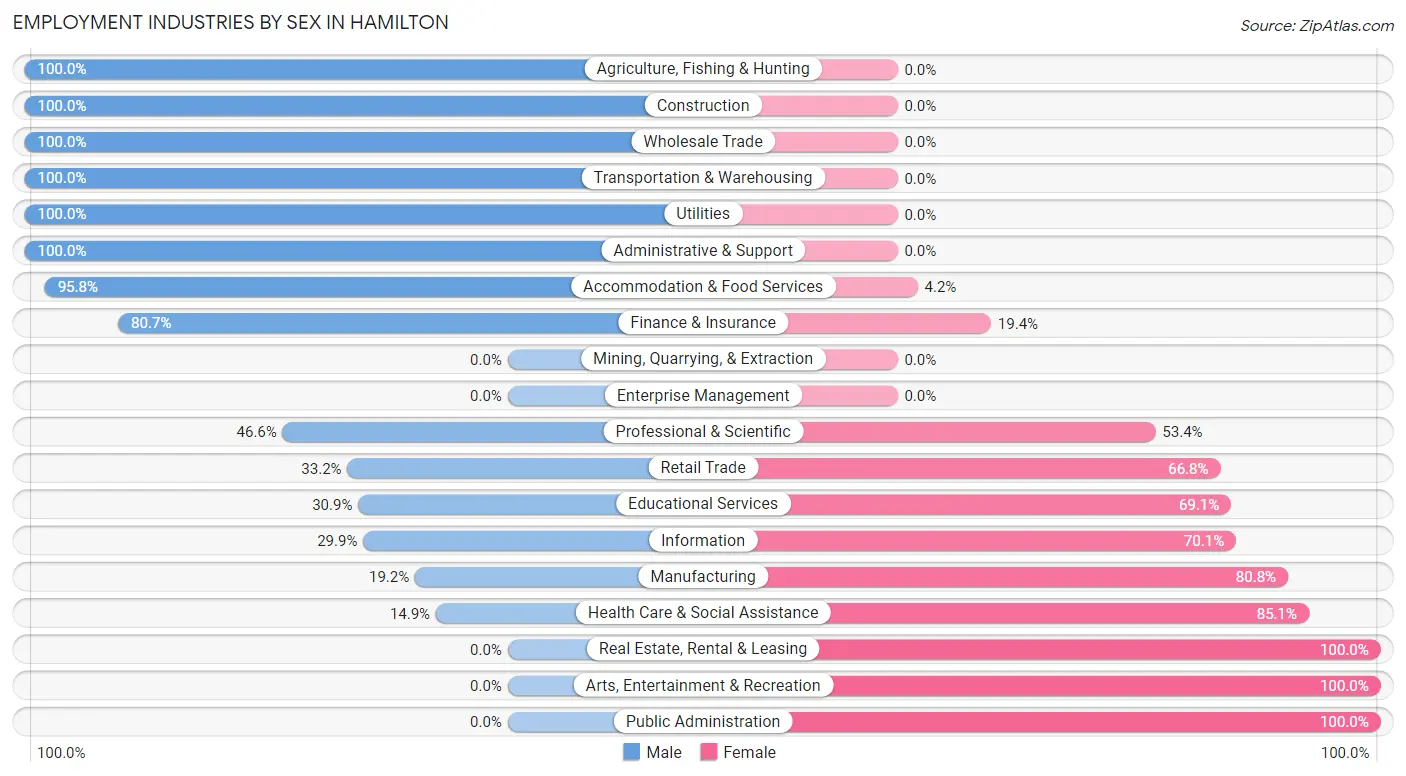
Employment Industries by Sex in Hamilton
The Hamilton industries that see more men than women are Agriculture, Fishing & Hunting (100.0%), Construction (100.0%), and Wholesale Trade (100.0%), whereas the industries that tend to have a higher number of women are Real Estate, Rental & Leasing (100.0%), Arts, Entertainment & Recreation (100.0%), and Public Administration (100.0%).
| Industry | Male | Female |
| Agriculture, Fishing & Hunting | 17 (100.0%) | 0 (0.0%) |
| Mining, Quarrying, & Extraction | 0 (0.0%) | 0 (0.0%) |
| Construction | 167 (100.0%) | 0 (0.0%) |
| Manufacturing | 14 (19.2%) | 59 (80.8%) |
| Wholesale Trade | 26 (100.0%) | 0 (0.0%) |
| Retail Trade | 141 (33.2%) | 284 (66.8%) |
| Transportation & Warehousing | 61 (100.0%) | 0 (0.0%) |
| Utilities | 21 (100.0%) | 0 (0.0%) |
| Information | 35 (29.9%) | 82 (70.1%) |
| Finance & Insurance | 50 (80.6%) | 12 (19.4%) |
| Real Estate, Rental & Leasing | 0 (0.0%) | 124 (100.0%) |
| Professional & Scientific | 144 (46.6%) | 165 (53.4%) |
| Enterprise Management | 0 (0.0%) | 0 (0.0%) |
| Administrative & Support | 67 (100.0%) | 0 (0.0%) |
| Educational Services | 56 (30.9%) | 125 (69.1%) |
| Health Care & Social Assistance | 63 (14.9%) | 361 (85.1%) |
| Arts, Entertainment & Recreation | 0 (0.0%) | 6 (100.0%) |
| Accommodation & Food Services | 92 (95.8%) | 4 (4.2%) |
| Public Administration | 0 (0.0%) | 31 (100.0%) |
| Total | 1,011 (44.1%) | 1,283 (55.9%) |
Education in Hamilton
School Enrollment in Hamilton
The most common levels of schooling among the 573 students in Hamilton are middle school (166 | 29.0%), high school (164 | 28.6%), and elementary school (88 | 15.4%).
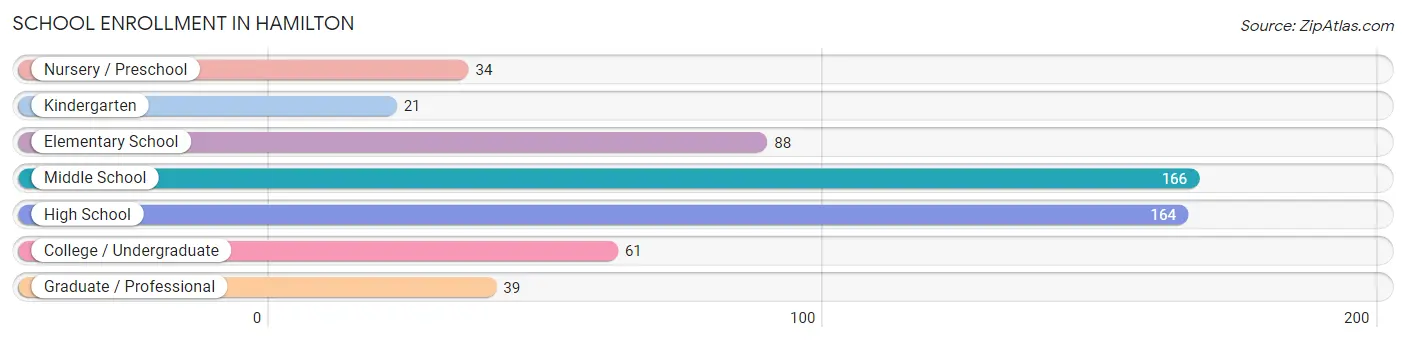
| School Level | # Students | % Students |
| Nursery / Preschool | 34 | 5.9% |
| Kindergarten | 21 | 3.7% |
| Elementary School | 88 | 15.4% |
| Middle School | 166 | 29.0% |
| High School | 164 | 28.6% |
| College / Undergraduate | 61 | 10.6% |
| Graduate / Professional | 39 | 6.8% |
| Total | 573 | 100.0% |
School Enrollment by Age by Funding Source in Hamilton
Out of a total of 573 students who are enrolled in schools in Hamilton, 111 (19.4%) attend a private institution, while the remaining 462 (80.6%) are enrolled in public schools. The age group of 3 to 4 year olds has the highest likelihood of being enrolled in private schools, with 15 (44.1% in the age bracket) enrolled. Conversely, the age group of 18 to 19 year olds has the lowest likelihood of being enrolled in a private school, with 56 (100.0% in the age bracket) attending a public institution.
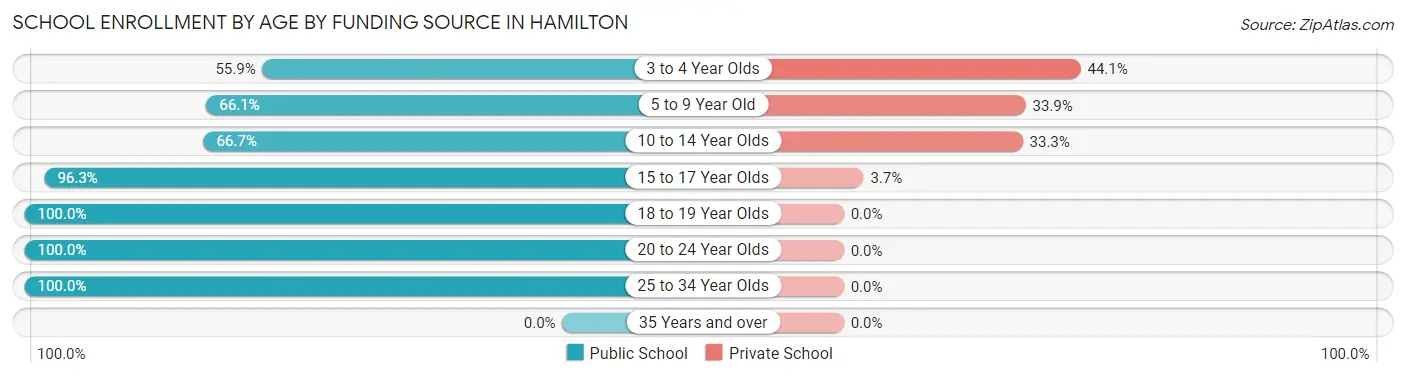
| Age Bracket | Public School | Private School |
| 3 to 4 Year Olds | 19 (55.9%) | 15 (44.1%) |
| 5 to 9 Year Old | 41 (66.1%) | 21 (33.9%) |
| 10 to 14 Year Olds | 142 (66.7%) | 71 (33.3%) |
| 15 to 17 Year Olds | 104 (96.3%) | 4 (3.7%) |
| 18 to 19 Year Olds | 56 (100.0%) | 0 (0.0%) |
| 20 to 24 Year Olds | 45 (100.0%) | 0 (0.0%) |
| 25 to 34 Year Olds | 55 (100.0%) | 0 (0.0%) |
| 35 Years and over | 0 (0.0%) | 0 (0.0%) |
| Total | 462 (80.6%) | 111 (19.4%) |
Educational Attainment by Field of Study in Hamilton
Liberal arts & history (248 | 21.3%), bio, nature & agricultural (133 | 11.4%), business (121 | 10.4%), visual & performing arts (114 | 9.8%), and psychology (103 | 8.8%) are the most common fields of study among 1,164 individuals in Hamilton who have obtained a bachelor's degree or higher.
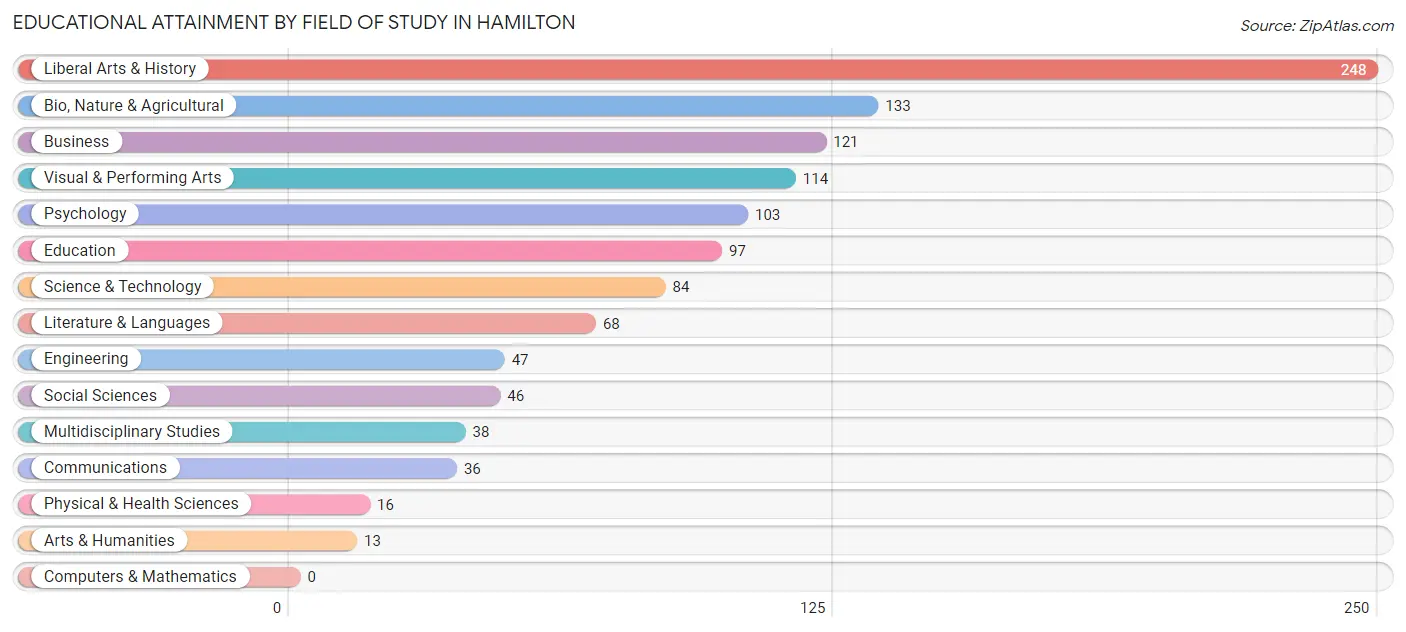
| Field of Study | # Graduates | % Graduates |
| Computers & Mathematics | 0 | 0.0% |
| Bio, Nature & Agricultural | 133 | 11.4% |
| Physical & Health Sciences | 16 | 1.4% |
| Psychology | 103 | 8.8% |
| Social Sciences | 46 | 4.0% |
| Engineering | 47 | 4.0% |
| Multidisciplinary Studies | 38 | 3.3% |
| Science & Technology | 84 | 7.2% |
| Business | 121 | 10.4% |
| Education | 97 | 8.3% |
| Literature & Languages | 68 | 5.8% |
| Liberal Arts & History | 248 | 21.3% |
| Visual & Performing Arts | 114 | 9.8% |
| Communications | 36 | 3.1% |
| Arts & Humanities | 13 | 1.1% |
| Total | 1,164 | 100.0% |
Transportation & Commute in Hamilton
Vehicle Availability by Sex in Hamilton
The most prevalent vehicle ownership categories in Hamilton are males with 2 vehicles (308, accounting for 34.1%) and females with 2 vehicles (358, making up 26.6%).
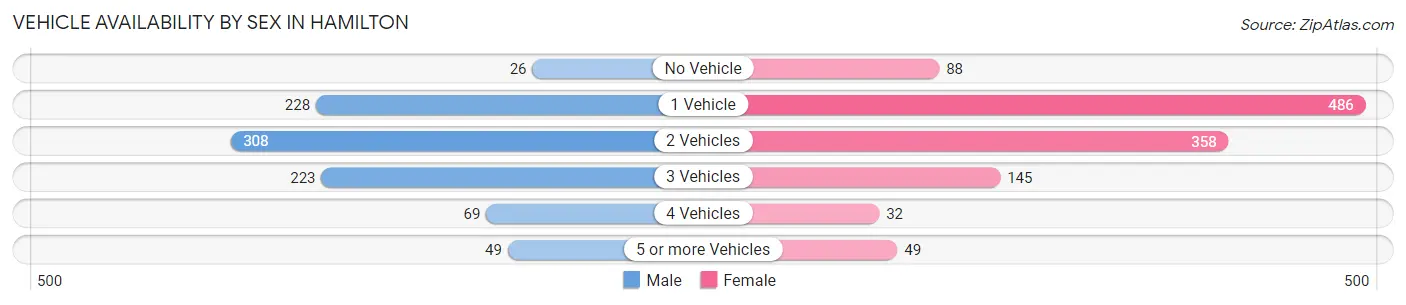
| Vehicles Available | Male | Female |
| No Vehicle | 26 (2.9%) | 88 (7.6%) |
| 1 Vehicle | 228 (25.3%) | 486 (42.0%) |
| 2 Vehicles | 308 (34.1%) | 358 (30.9%) |
| 3 Vehicles | 223 (24.7%) | 145 (12.5%) |
| 4 Vehicles | 69 (7.6%) | 32 (2.8%) |
| 5 or more Vehicles | 49 (5.4%) | 49 (4.2%) |
| Total | 903 (100.0%) | 1,158 (100.0%) |
Commute Time in Hamilton
The most frequently occuring commute durations in Hamilton are 5 to 9 minutes (735 commuters, 36.2%), 10 to 14 minutes (518 commuters, 25.5%), and 15 to 19 minutes (227 commuters, 11.2%).
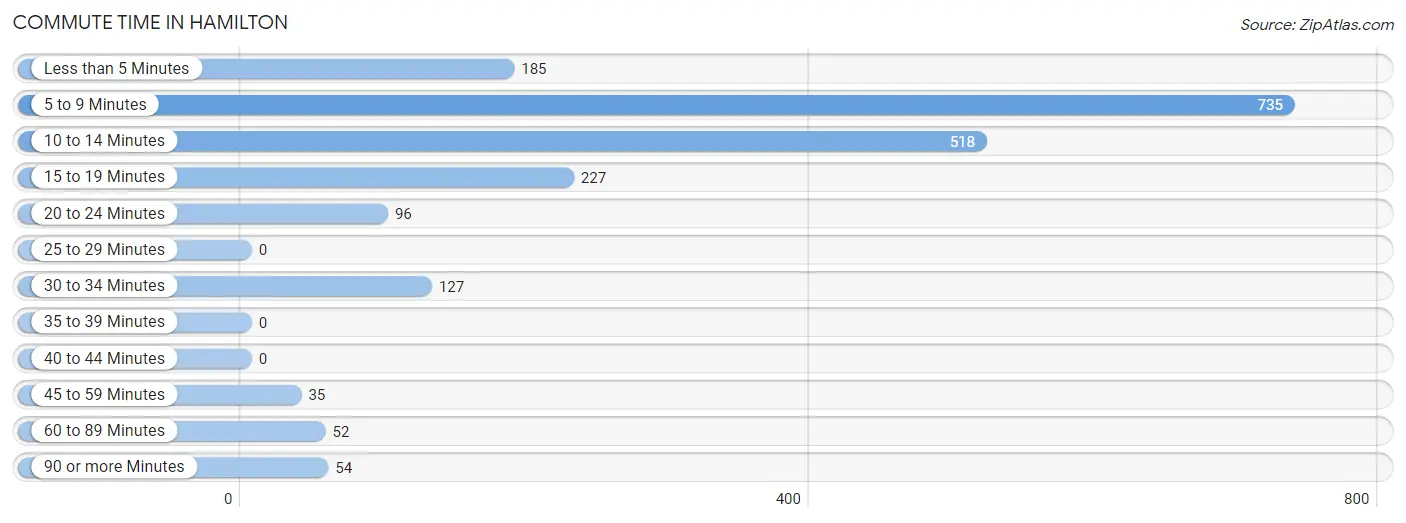
| Commute Time | # Commuters | % Commuters |
| Less than 5 Minutes | 185 | 9.1% |
| 5 to 9 Minutes | 735 | 36.2% |
| 10 to 14 Minutes | 518 | 25.5% |
| 15 to 19 Minutes | 227 | 11.2% |
| 20 to 24 Minutes | 96 | 4.7% |
| 25 to 29 Minutes | 0 | 0.0% |
| 30 to 34 Minutes | 127 | 6.3% |
| 35 to 39 Minutes | 0 | 0.0% |
| 40 to 44 Minutes | 0 | 0.0% |
| 45 to 59 Minutes | 35 | 1.7% |
| 60 to 89 Minutes | 52 | 2.6% |
| 90 or more Minutes | 54 | 2.7% |
Commute Time by Sex in Hamilton
The most common commute times in Hamilton are 5 to 9 minutes (321 commuters, 35.4%) for males and 5 to 9 minutes (414 commuters, 36.9%) for females.
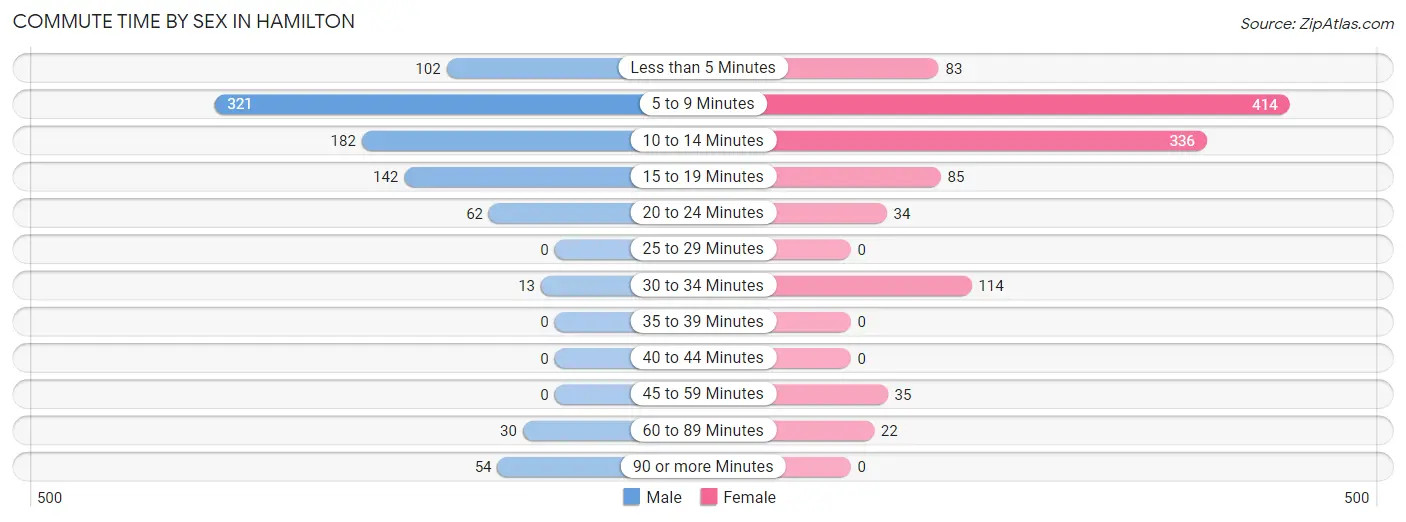
| Commute Time | Male | Female |
| Less than 5 Minutes | 102 (11.3%) | 83 (7.4%) |
| 5 to 9 Minutes | 321 (35.4%) | 414 (36.9%) |
| 10 to 14 Minutes | 182 (20.1%) | 336 (29.9%) |
| 15 to 19 Minutes | 142 (15.7%) | 85 (7.6%) |
| 20 to 24 Minutes | 62 (6.8%) | 34 (3.0%) |
| 25 to 29 Minutes | 0 (0.0%) | 0 (0.0%) |
| 30 to 34 Minutes | 13 (1.4%) | 114 (10.2%) |
| 35 to 39 Minutes | 0 (0.0%) | 0 (0.0%) |
| 40 to 44 Minutes | 0 (0.0%) | 0 (0.0%) |
| 45 to 59 Minutes | 0 (0.0%) | 35 (3.1%) |
| 60 to 89 Minutes | 30 (3.3%) | 22 (2.0%) |
| 90 or more Minutes | 54 (6.0%) | 0 (0.0%) |
Time of Departure to Work by Sex in Hamilton
The most frequent times of departure to work in Hamilton are 7:30 AM to 7:59 AM (166, 18.3%) for males and 7:30 AM to 7:59 AM (228, 20.3%) for females.
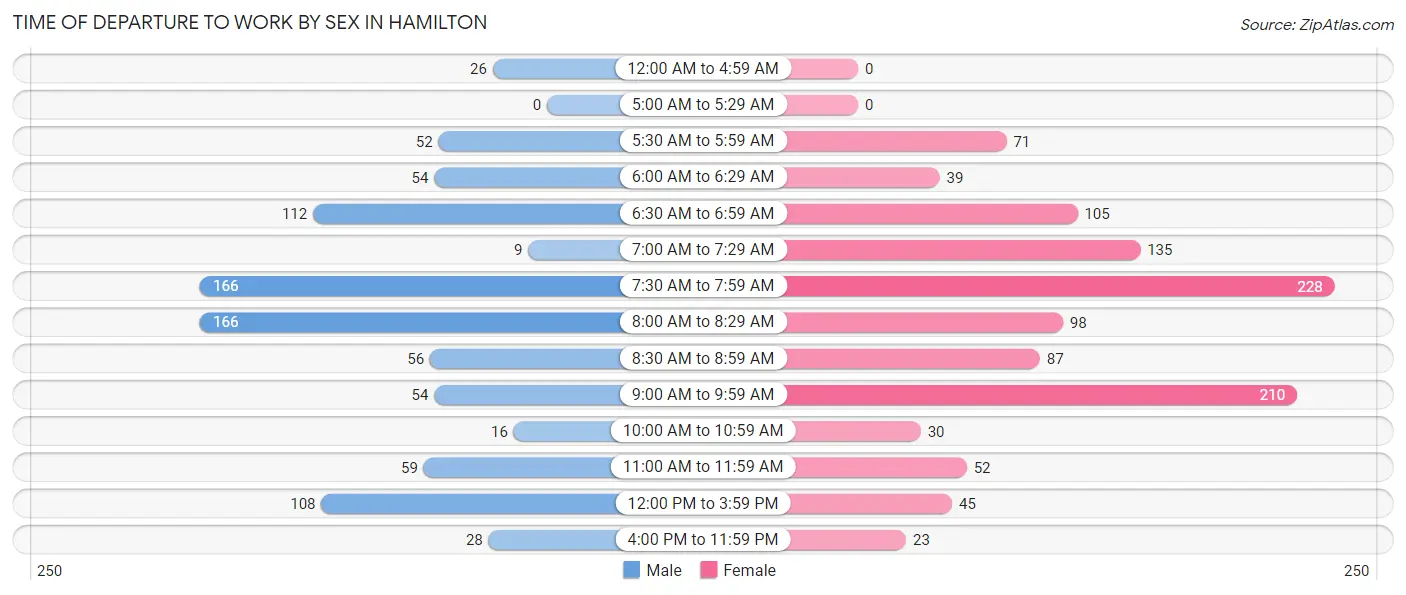
| Time of Departure | Male | Female |
| 12:00 AM to 4:59 AM | 26 (2.9%) | 0 (0.0%) |
| 5:00 AM to 5:29 AM | 0 (0.0%) | 0 (0.0%) |
| 5:30 AM to 5:59 AM | 52 (5.7%) | 71 (6.3%) |
| 6:00 AM to 6:29 AM | 54 (6.0%) | 39 (3.5%) |
| 6:30 AM to 6:59 AM | 112 (12.4%) | 105 (9.3%) |
| 7:00 AM to 7:29 AM | 9 (1.0%) | 135 (12.0%) |
| 7:30 AM to 7:59 AM | 166 (18.3%) | 228 (20.3%) |
| 8:00 AM to 8:29 AM | 166 (18.3%) | 98 (8.7%) |
| 8:30 AM to 8:59 AM | 56 (6.2%) | 87 (7.7%) |
| 9:00 AM to 9:59 AM | 54 (6.0%) | 210 (18.7%) |
| 10:00 AM to 10:59 AM | 16 (1.8%) | 30 (2.7%) |
| 11:00 AM to 11:59 AM | 59 (6.5%) | 52 (4.6%) |
| 12:00 PM to 3:59 PM | 108 (11.9%) | 45 (4.0%) |
| 4:00 PM to 11:59 PM | 28 (3.1%) | 23 (2.1%) |
| Total | 906 (100.0%) | 1,123 (100.0%) |
Housing Occupancy in Hamilton
Occupancy by Ownership in Hamilton
Of the total 2,562 dwellings in Hamilton, owner-occupied units account for 1,285 (50.2%), while renter-occupied units make up 1,277 (49.8%).
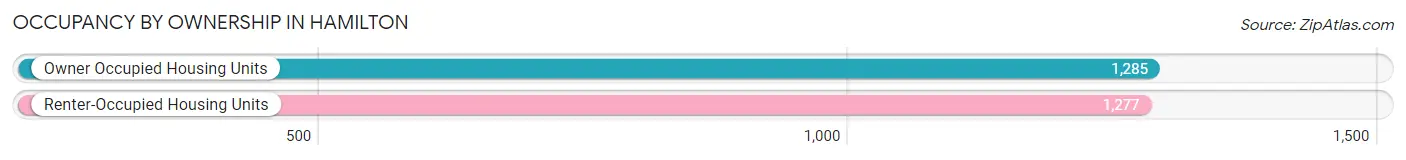
| Occupancy | # Housing Units | % Housing Units |
| Owner Occupied Housing Units | 1,285 | 50.2% |
| Renter-Occupied Housing Units | 1,277 | 49.8% |
| Total Occupied Housing Units | 2,562 | 100.0% |
Occupancy by Household Size in Hamilton
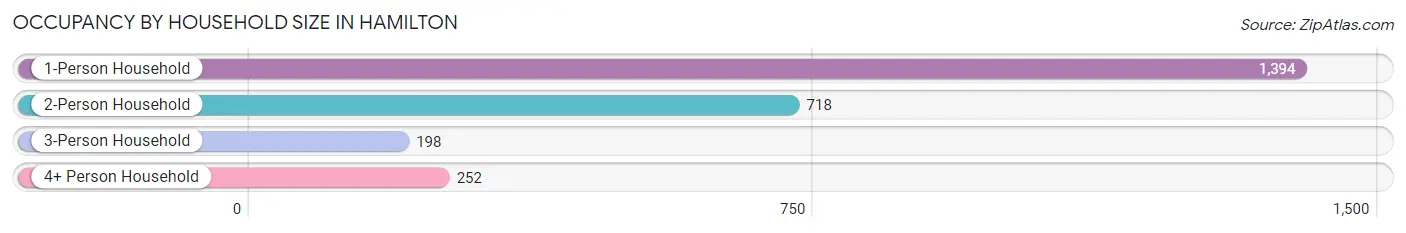
| Household Size | # Housing Units | % Housing Units |
| 1-Person Household | 1,394 | 54.4% |
| 2-Person Household | 718 | 28.0% |
| 3-Person Household | 198 | 7.7% |
| 4+ Person Household | 252 | 9.8% |
| Total Housing Units | 2,562 | 100.0% |
Occupancy by Ownership by Household Size in Hamilton
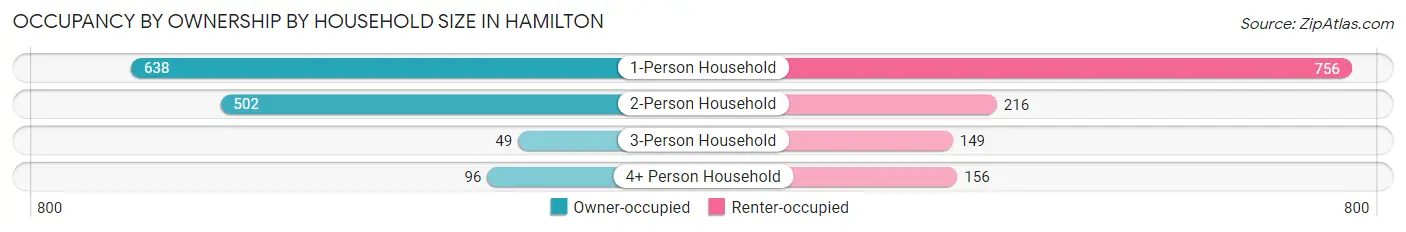
| Household Size | Owner-occupied | Renter-occupied |
| 1-Person Household | 638 (45.8%) | 756 (54.2%) |
| 2-Person Household | 502 (69.9%) | 216 (30.1%) |
| 3-Person Household | 49 (24.7%) | 149 (75.2%) |
| 4+ Person Household | 96 (38.1%) | 156 (61.9%) |
| Total Housing Units | 1,285 (50.2%) | 1,277 (49.8%) |
Occupancy by Educational Attainment in Hamilton
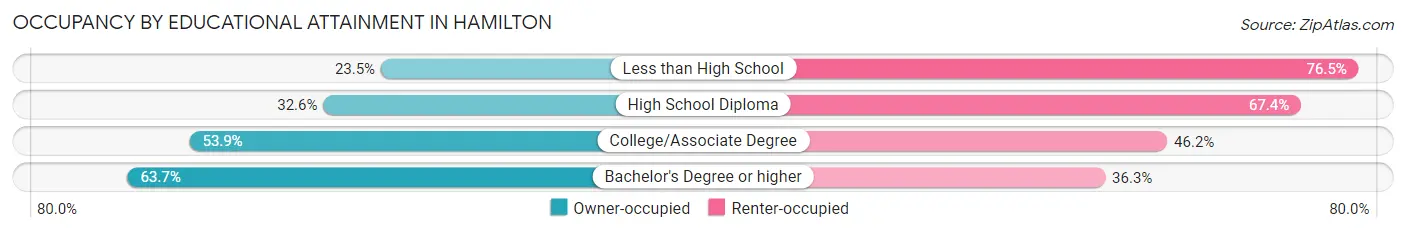
| Household Size | Owner-occupied | Renter-occupied |
| Less than High School | 31 (23.5%) | 101 (76.5%) |
| High School Diploma | 197 (32.6%) | 407 (67.4%) |
| College/Associate Degree | 580 (53.8%) | 497 (46.2%) |
| Bachelor's Degree or higher | 477 (63.7%) | 272 (36.3%) |
Occupancy by Age of Householder in Hamilton
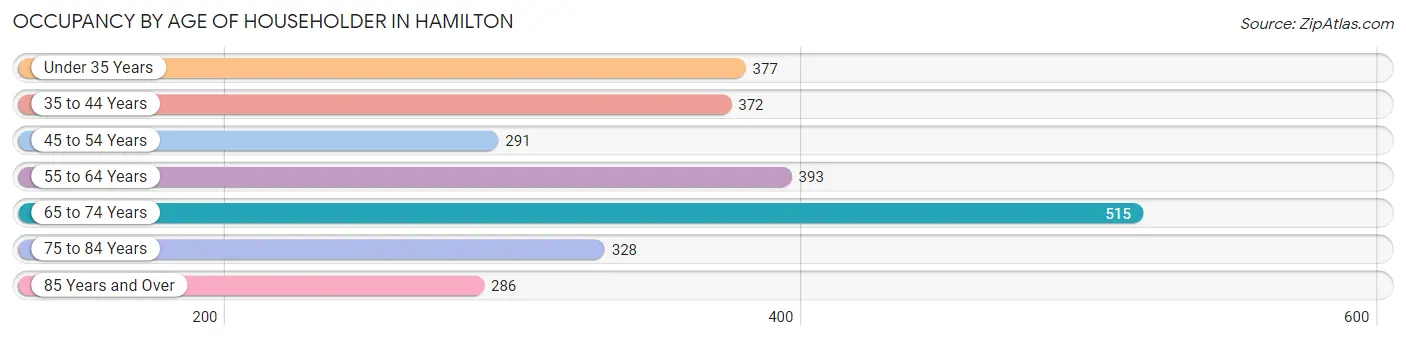
| Age Bracket | # Households | % Households |
| Under 35 Years | 377 | 14.7% |
| 35 to 44 Years | 372 | 14.5% |
| 45 to 54 Years | 291 | 11.4% |
| 55 to 64 Years | 393 | 15.3% |
| 65 to 74 Years | 515 | 20.1% |
| 75 to 84 Years | 328 | 12.8% |
| 85 Years and Over | 286 | 11.2% |
| Total | 2,562 | 100.0% |
Housing Finances in Hamilton
Median Income by Occupancy in Hamilton
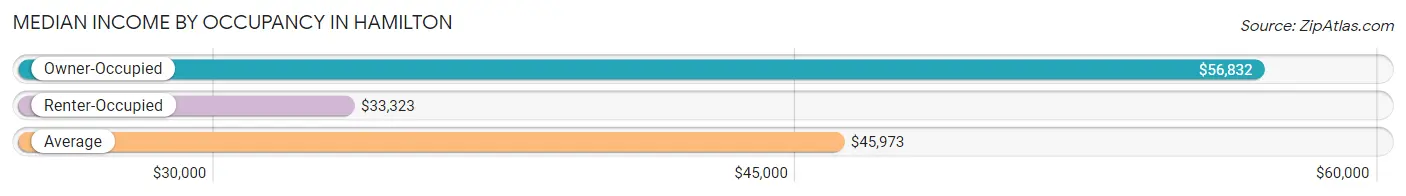
| Occupancy Type | # Households | Median Income |
| Owner-Occupied | 1,285 (50.2%) | $56,832 |
| Renter-Occupied | 1,277 (49.8%) | $33,323 |
| Average | 2,562 (100.0%) | $45,973 |
Occupancy by Householder Income Bracket in Hamilton
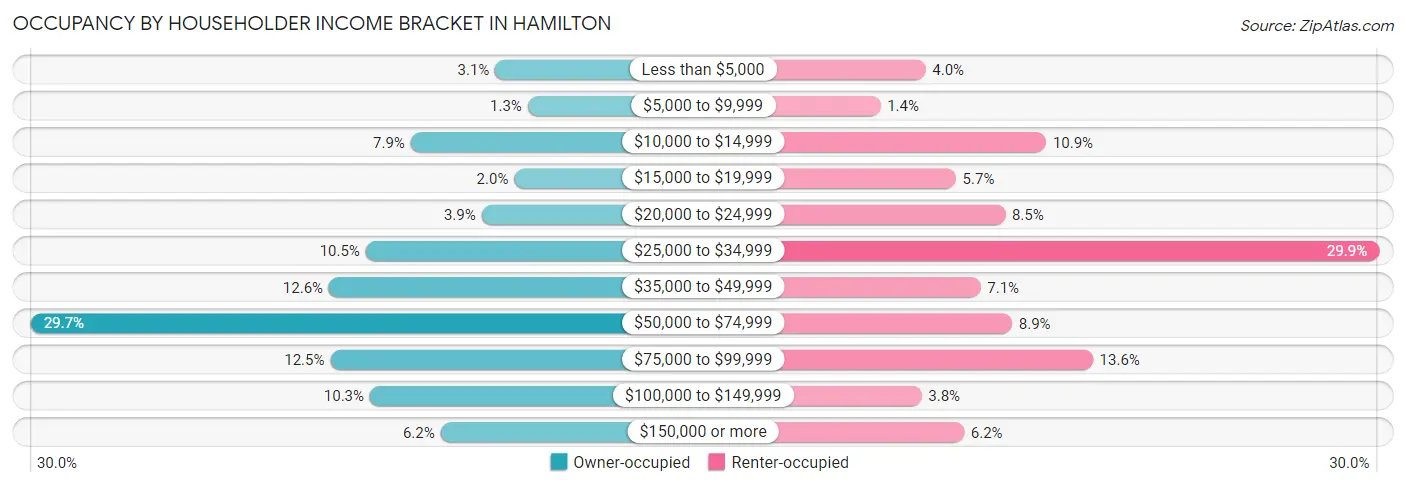
| Income Bracket | Owner-occupied | Renter-occupied |
| Less than $5,000 | 40 (3.1%) | 51 (4.0%) |
| $5,000 to $9,999 | 16 (1.3%) | 18 (1.4%) |
| $10,000 to $14,999 | 102 (7.9%) | 139 (10.9%) |
| $15,000 to $19,999 | 26 (2.0%) | 73 (5.7%) |
| $20,000 to $24,999 | 50 (3.9%) | 109 (8.5%) |
| $25,000 to $34,999 | 135 (10.5%) | 382 (29.9%) |
| $35,000 to $49,999 | 162 (12.6%) | 91 (7.1%) |
| $50,000 to $74,999 | 381 (29.6%) | 114 (8.9%) |
| $75,000 to $99,999 | 161 (12.5%) | 173 (13.6%) |
| $100,000 to $149,999 | 132 (10.3%) | 48 (3.8%) |
| $150,000 or more | 80 (6.2%) | 79 (6.2%) |
| Total | 1,285 (100.0%) | 1,277 (100.0%) |
Monthly Housing Cost Tiers in Hamilton
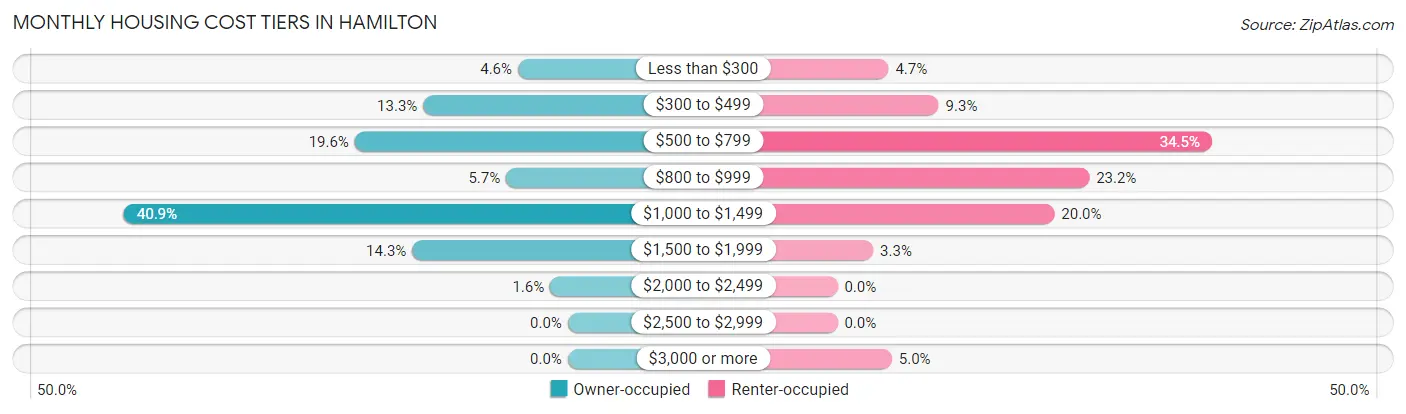
| Monthly Cost | Owner-occupied | Renter-occupied |
| Less than $300 | 59 (4.6%) | 60 (4.7%) |
| $300 to $499 | 171 (13.3%) | 119 (9.3%) |
| $500 to $799 | 252 (19.6%) | 440 (34.5%) |
| $800 to $999 | 73 (5.7%) | 296 (23.2%) |
| $1,000 to $1,499 | 525 (40.9%) | 255 (20.0%) |
| $1,500 to $1,999 | 184 (14.3%) | 42 (3.3%) |
| $2,000 to $2,499 | 21 (1.6%) | 0 (0.0%) |
| $2,500 to $2,999 | 0 (0.0%) | 0 (0.0%) |
| $3,000 or more | 0 (0.0%) | 64 (5.0%) |
| Total | 1,285 (100.0%) | 1,277 (100.0%) |
Physical Housing Characteristics in Hamilton
Housing Structures in Hamilton
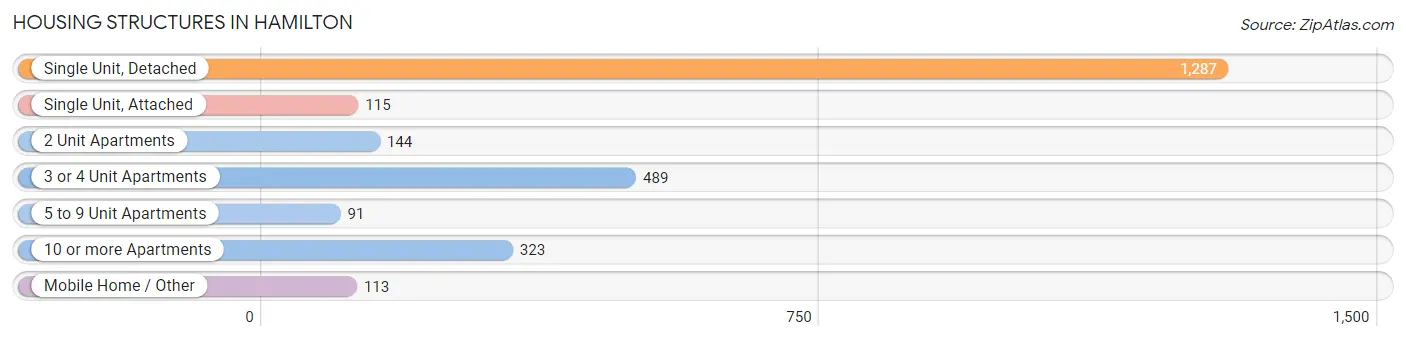
| Structure Type | # Housing Units | % Housing Units |
| Single Unit, Detached | 1,287 | 50.2% |
| Single Unit, Attached | 115 | 4.5% |
| 2 Unit Apartments | 144 | 5.6% |
| 3 or 4 Unit Apartments | 489 | 19.1% |
| 5 to 9 Unit Apartments | 91 | 3.5% |
| 10 or more Apartments | 323 | 12.6% |
| Mobile Home / Other | 113 | 4.4% |
| Total | 2,562 | 100.0% |
Housing Structures by Occupancy in Hamilton
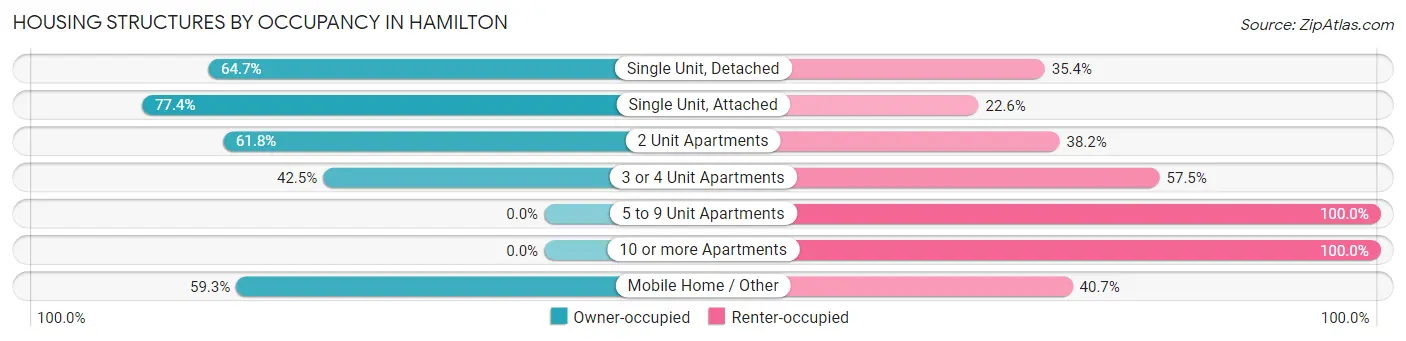
| Structure Type | Owner-occupied | Renter-occupied |
| Single Unit, Detached | 832 (64.6%) | 455 (35.3%) |
| Single Unit, Attached | 89 (77.4%) | 26 (22.6%) |
| 2 Unit Apartments | 89 (61.8%) | 55 (38.2%) |
| 3 or 4 Unit Apartments | 208 (42.5%) | 281 (57.5%) |
| 5 to 9 Unit Apartments | 0 (0.0%) | 91 (100.0%) |
| 10 or more Apartments | 0 (0.0%) | 323 (100.0%) |
| Mobile Home / Other | 67 (59.3%) | 46 (40.7%) |
| Total | 1,285 (50.2%) | 1,277 (49.8%) |
Housing Structures by Number of Rooms in Hamilton
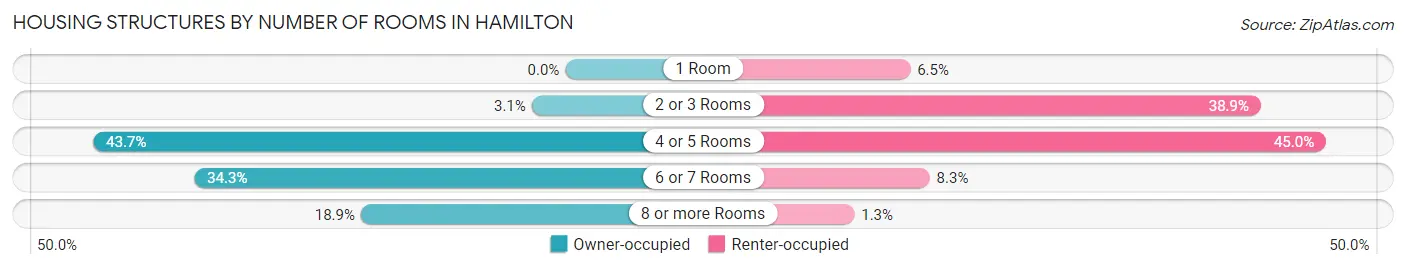
| Number of Rooms | Owner-occupied | Renter-occupied |
| 1 Room | 0 (0.0%) | 83 (6.5%) |
| 2 or 3 Rooms | 40 (3.1%) | 497 (38.9%) |
| 4 or 5 Rooms | 561 (43.7%) | 574 (45.0%) |
| 6 or 7 Rooms | 441 (34.3%) | 106 (8.3%) |
| 8 or more Rooms | 243 (18.9%) | 17 (1.3%) |
| Total | 1,285 (100.0%) | 1,277 (100.0%) |
Housing Structure by Heating Type in Hamilton
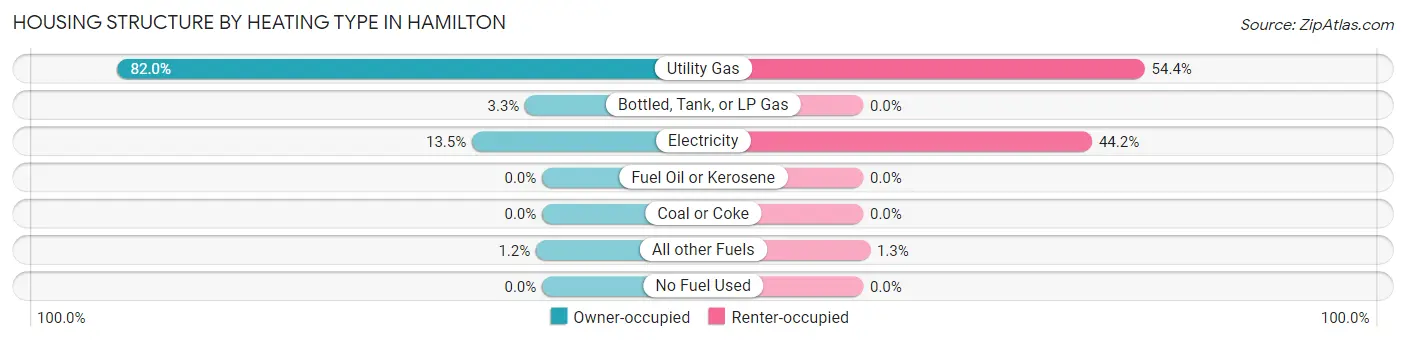
| Heating Type | Owner-occupied | Renter-occupied |
| Utility Gas | 1,054 (82.0%) | 695 (54.4%) |
| Bottled, Tank, or LP Gas | 42 (3.3%) | 0 (0.0%) |
| Electricity | 174 (13.5%) | 565 (44.2%) |
| Fuel Oil or Kerosene | 0 (0.0%) | 0 (0.0%) |
| Coal or Coke | 0 (0.0%) | 0 (0.0%) |
| All other Fuels | 15 (1.2%) | 17 (1.3%) |
| No Fuel Used | 0 (0.0%) | 0 (0.0%) |
| Total | 1,285 (100.0%) | 1,277 (100.0%) |
Household Vehicle Usage in Hamilton
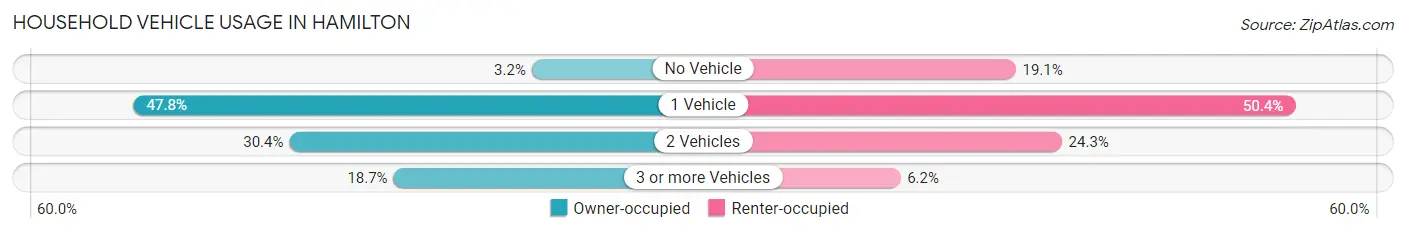
| Vehicles per Household | Owner-occupied | Renter-occupied |
| No Vehicle | 41 (3.2%) | 244 (19.1%) |
| 1 Vehicle | 614 (47.8%) | 644 (50.4%) |
| 2 Vehicles | 390 (30.3%) | 310 (24.3%) |
| 3 or more Vehicles | 240 (18.7%) | 79 (6.2%) |
| Total | 1,285 (100.0%) | 1,277 (100.0%) |
Real Estate & Mortgages in Hamilton
Real Estate and Mortgage Overview in Hamilton
| Characteristic | Without Mortgage | With Mortgage |
| Housing Units | 643 | 642 |
| Median Property Value | $308,100 | $275,700 |
| Median Household Income | $68,016 | $39 |
| Monthly Housing Costs | $623 | $0 |
| Real Estate Taxes | $2,219 | $0 |
Property Value by Mortgage Status in Hamilton
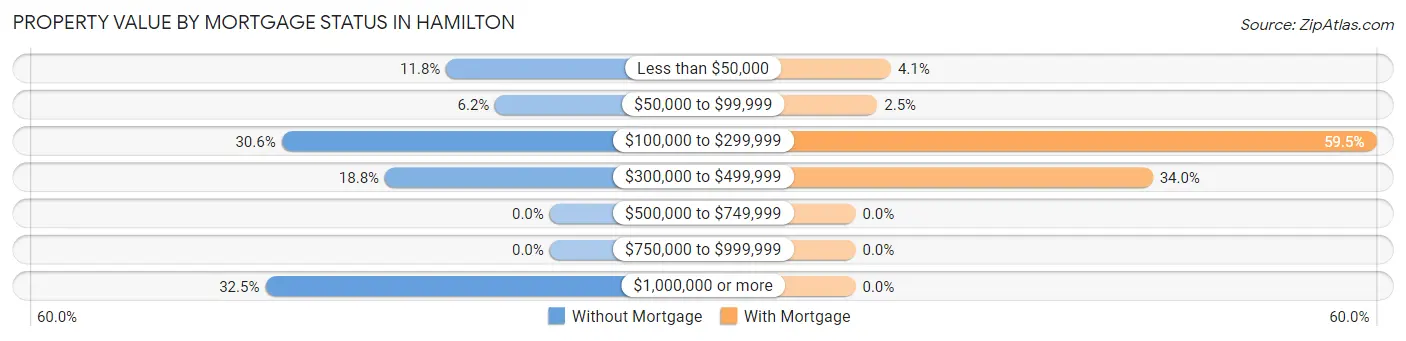
| Property Value | Without Mortgage | With Mortgage |
| Less than $50,000 | 76 (11.8%) | 26 (4.1%) |
| $50,000 to $99,999 | 40 (6.2%) | 16 (2.5%) |
| $100,000 to $299,999 | 197 (30.6%) | 382 (59.5%) |
| $300,000 to $499,999 | 121 (18.8%) | 218 (34.0%) |
| $500,000 to $749,999 | 0 (0.0%) | 0 (0.0%) |
| $750,000 to $999,999 | 0 (0.0%) | 0 (0.0%) |
| $1,000,000 or more | 209 (32.5%) | 0 (0.0%) |
| Total | 643 (100.0%) | 642 (100.0%) |
Household Income by Mortgage Status in Hamilton
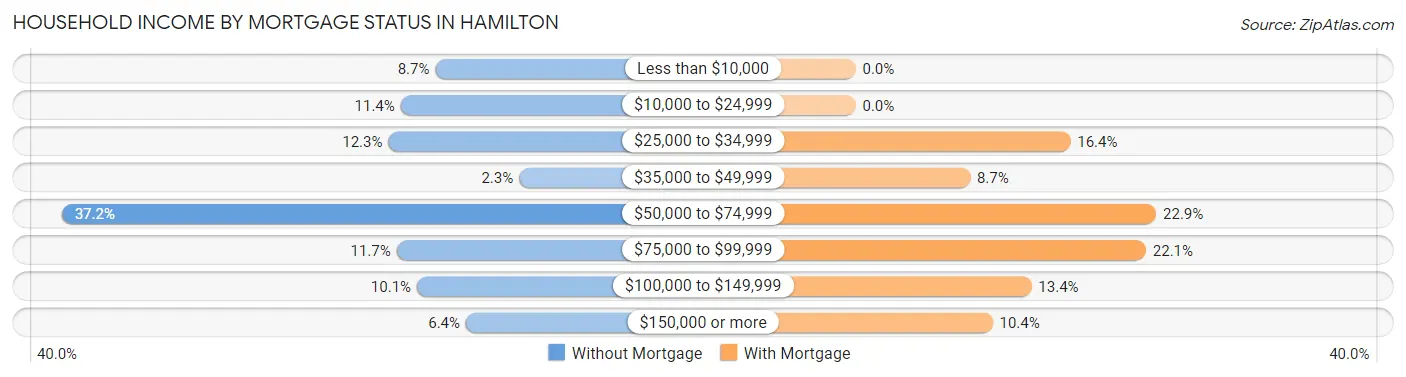
| Household Income | Without Mortgage | With Mortgage |
| Less than $10,000 | 56 (8.7%) | 0 (0.0%) |
| $10,000 to $24,999 | 73 (11.4%) | 0 (0.0%) |
| $25,000 to $34,999 | 79 (12.3%) | 105 (16.4%) |
| $35,000 to $49,999 | 15 (2.3%) | 56 (8.7%) |
| $50,000 to $74,999 | 239 (37.2%) | 147 (22.9%) |
| $75,000 to $99,999 | 75 (11.7%) | 142 (22.1%) |
| $100,000 to $149,999 | 65 (10.1%) | 86 (13.4%) |
| $150,000 or more | 41 (6.4%) | 67 (10.4%) |
| Total | 643 (100.0%) | 642 (100.0%) |
Property Value to Household Income Ratio in Hamilton
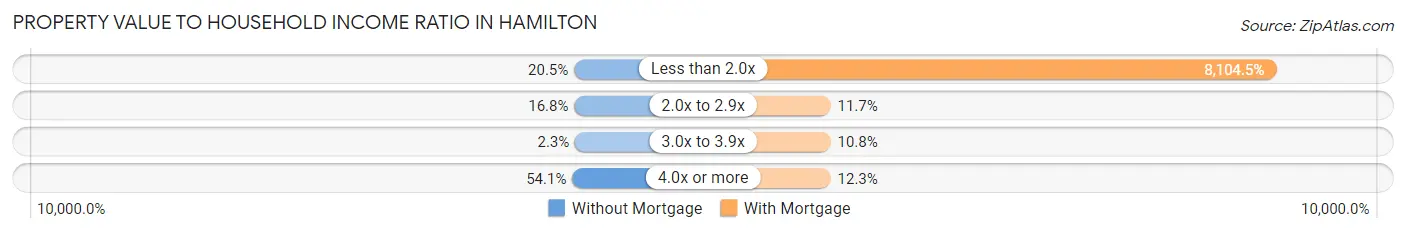
| Value-to-Income Ratio | Without Mortgage | With Mortgage |
| Less than 2.0x | 132 (20.5%) | 52,031 (8,104.5%) |
| 2.0x to 2.9x | 108 (16.8%) | 75 (11.7%) |
| 3.0x to 3.9x | 15 (2.3%) | 69 (10.7%) |
| 4.0x or more | 348 (54.1%) | 79 (12.3%) |
| Total | 643 (100.0%) | 642 (100.0%) |
Real Estate Taxes by Mortgage Status in Hamilton
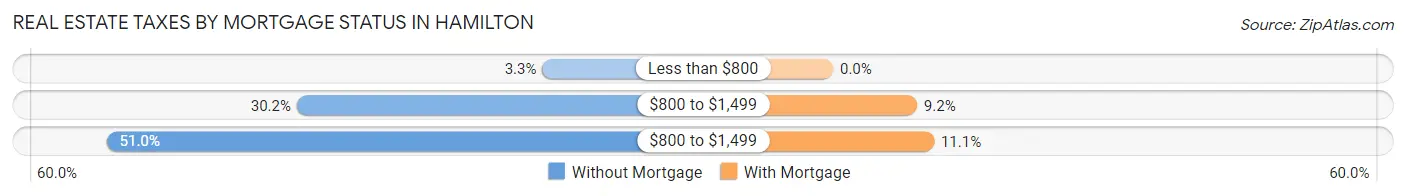
| Property Taxes | Without Mortgage | With Mortgage |
| Less than $800 | 21 (3.3%) | 0 (0.0%) |
| $800 to $1,499 | 194 (30.2%) | 59 (9.2%) |
| $800 to $1,499 | 328 (51.0%) | 71 (11.1%) |
| Total | 643 (100.0%) | 642 (100.0%) |
Health & Disability in Hamilton
Health Insurance Coverage by Age in Hamilton
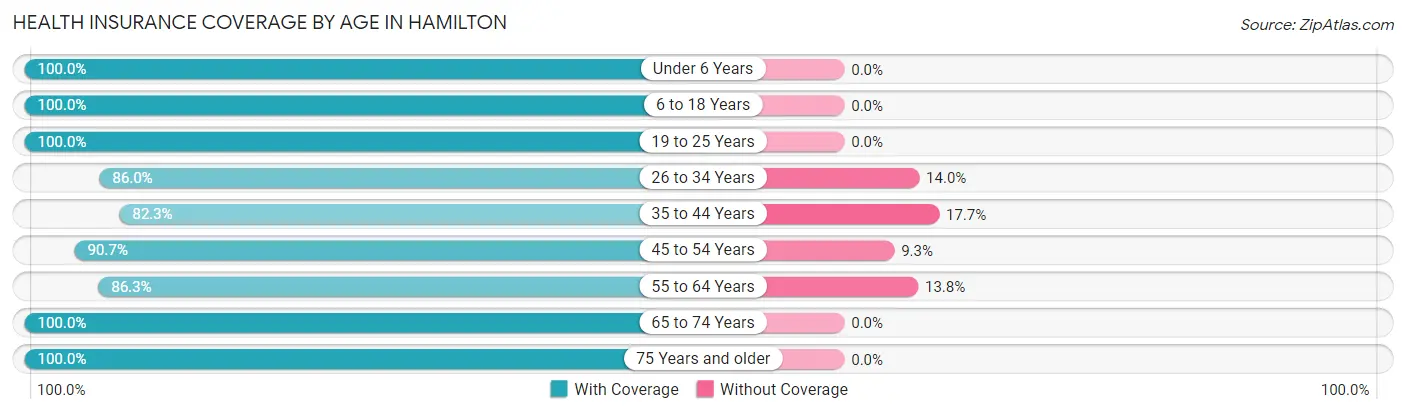
| Age Bracket | With Coverage | Without Coverage |
| Under 6 Years | 366 (100.0%) | 0 (0.0%) |
| 6 to 18 Years | 449 (100.0%) | 0 (0.0%) |
| 19 to 25 Years | 110 (100.0%) | 0 (0.0%) |
| 26 to 34 Years | 493 (86.0%) | 80 (14.0%) |
| 35 to 44 Years | 559 (82.3%) | 120 (17.7%) |
| 45 to 54 Years | 497 (90.7%) | 51 (9.3%) |
| 55 to 64 Years | 458 (86.3%) | 73 (13.8%) |
| 65 to 74 Years | 654 (100.0%) | 0 (0.0%) |
| 75 Years and older | 722 (100.0%) | 0 (0.0%) |
| Total | 4,308 (93.0%) | 324 (7.0%) |
Health Insurance Coverage by Citizenship Status in Hamilton
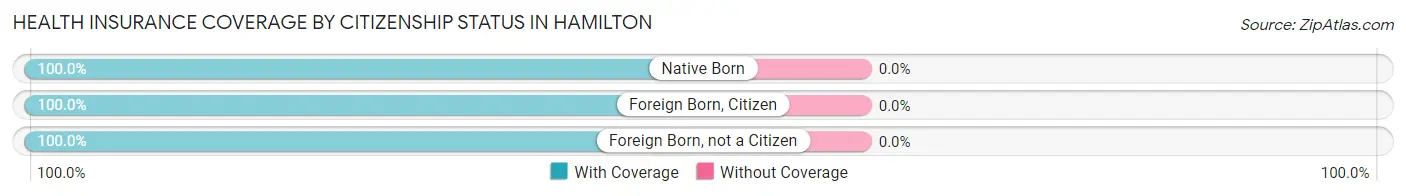
| Citizenship Status | With Coverage | Without Coverage |
| Native Born | 366 (100.0%) | 0 (0.0%) |
| Foreign Born, Citizen | 449 (100.0%) | 0 (0.0%) |
| Foreign Born, not a Citizen | 110 (100.0%) | 0 (0.0%) |
Health Insurance Coverage by Household Income in Hamilton
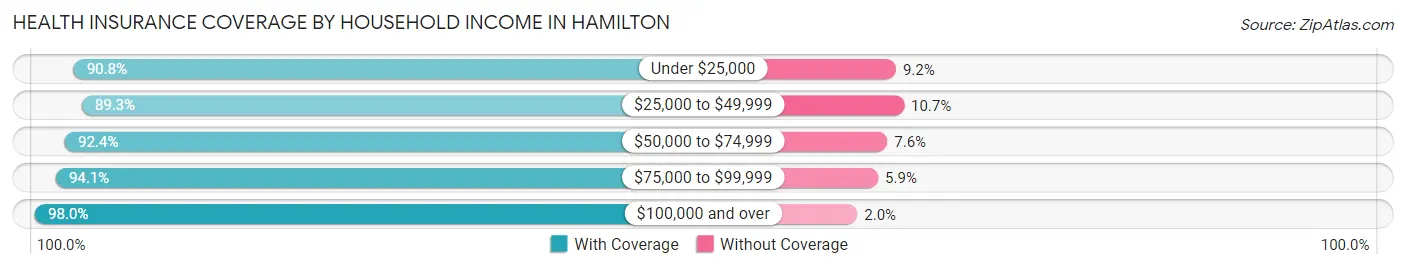
| Household Income | With Coverage | Without Coverage |
| Under $25,000 | 690 (90.8%) | 70 (9.2%) |
| $25,000 to $49,999 | 940 (89.3%) | 113 (10.7%) |
| $50,000 to $74,999 | 877 (92.4%) | 72 (7.6%) |
| $75,000 to $99,999 | 817 (94.1%) | 51 (5.9%) |
| $100,000 and over | 896 (98.0%) | 18 (2.0%) |
Public vs Private Health Insurance Coverage by Age in Hamilton
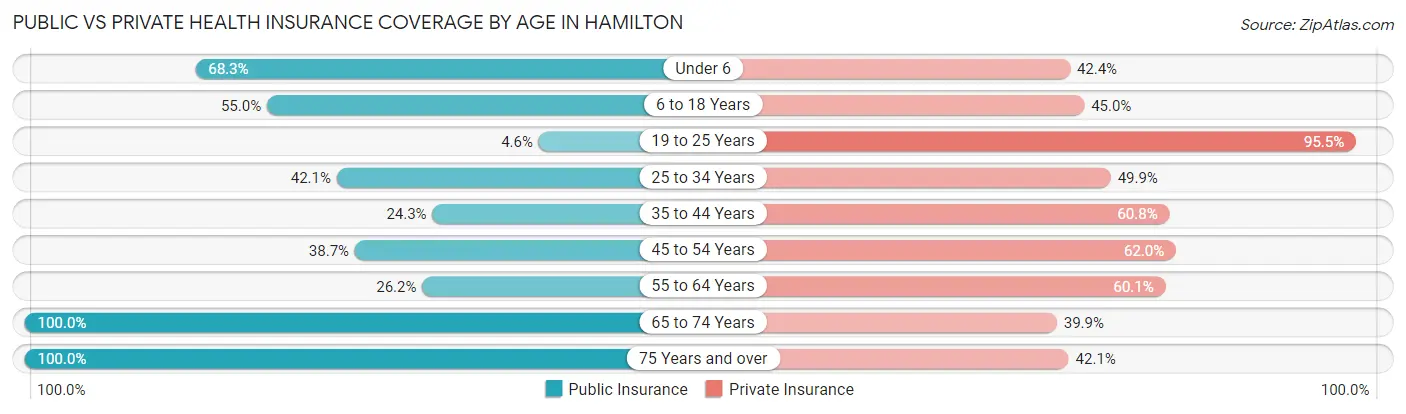
| Age Bracket | Public Insurance | Private Insurance |
| Under 6 | 250 (68.3%) | 155 (42.3%) |
| 6 to 18 Years | 247 (55.0%) | 202 (45.0%) |
| 19 to 25 Years | 5 (4.5%) | 105 (95.5%) |
| 25 to 34 Years | 241 (42.1%) | 286 (49.9%) |
| 35 to 44 Years | 165 (24.3%) | 413 (60.8%) |
| 45 to 54 Years | 212 (38.7%) | 340 (62.0%) |
| 55 to 64 Years | 139 (26.2%) | 319 (60.1%) |
| 65 to 74 Years | 654 (100.0%) | 261 (39.9%) |
| 75 Years and over | 722 (100.0%) | 304 (42.1%) |
| Total | 2,635 (56.9%) | 2,385 (51.5%) |
Disability Status by Sex by Age in Hamilton
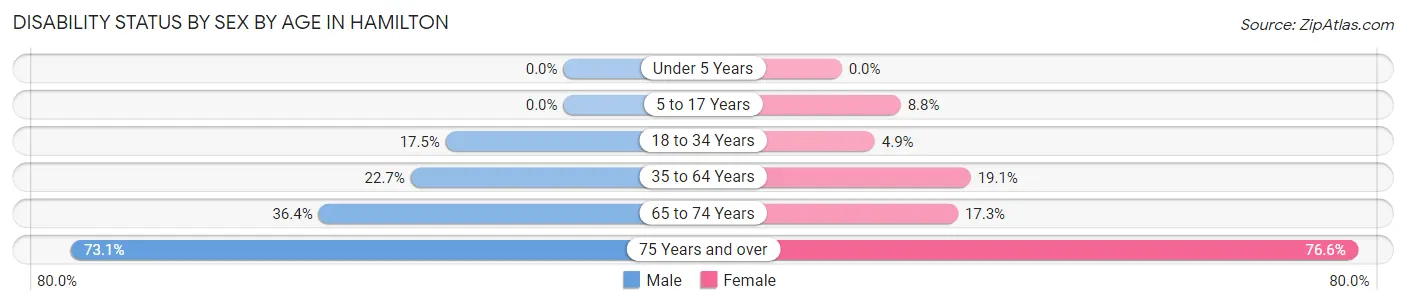
| Age Bracket | Male | Female |
| Under 5 Years | 0 (0.0%) | 0 (0.0%) |
| 5 to 17 Years | 0 (0.0%) | 21 (8.7%) |
| 18 to 34 Years | 58 (17.5%) | 20 (4.9%) |
| 35 to 64 Years | 176 (22.7%) | 188 (19.1%) |
| 65 to 74 Years | 124 (36.4%) | 54 (17.2%) |
| 75 Years and over | 125 (73.1%) | 422 (76.6%) |
Disability Class by Sex by Age in Hamilton
Disability Class: Hearing Difficulty
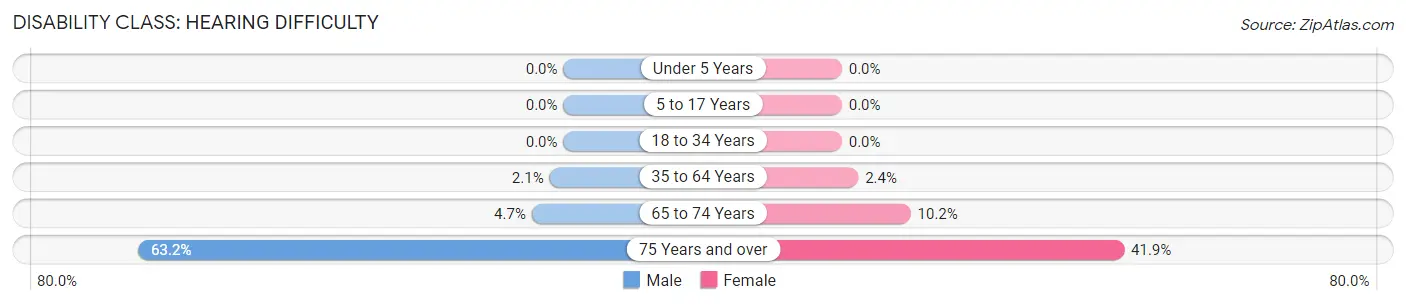
| Age Bracket | Male | Female |
| Under 5 Years | 0 (0.0%) | 0 (0.0%) |
| 5 to 17 Years | 0 (0.0%) | 0 (0.0%) |
| 18 to 34 Years | 0 (0.0%) | 0 (0.0%) |
| 35 to 64 Years | 16 (2.1%) | 24 (2.4%) |
| 65 to 74 Years | 16 (4.7%) | 32 (10.2%) |
| 75 Years and over | 108 (63.2%) | 231 (41.9%) |
Disability Class: Vision Difficulty
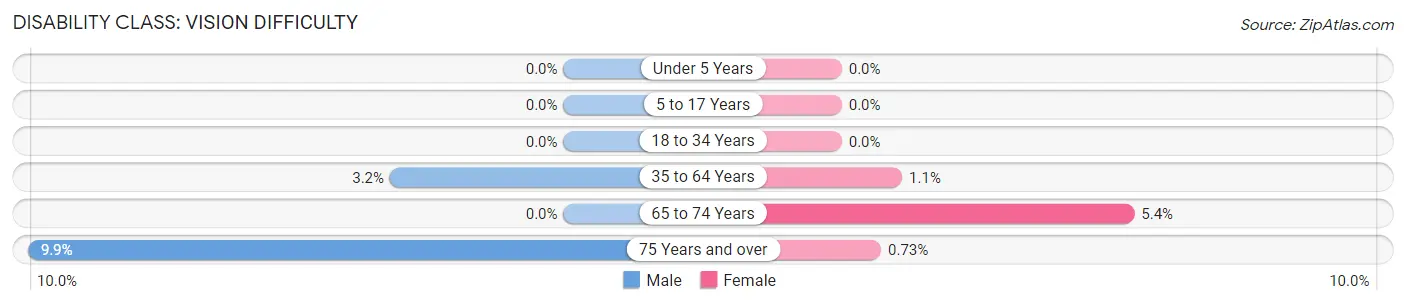
| Age Bracket | Male | Female |
| Under 5 Years | 0 (0.0%) | 0 (0.0%) |
| 5 to 17 Years | 0 (0.0%) | 0 (0.0%) |
| 18 to 34 Years | 0 (0.0%) | 0 (0.0%) |
| 35 to 64 Years | 25 (3.2%) | 11 (1.1%) |
| 65 to 74 Years | 0 (0.0%) | 17 (5.4%) |
| 75 Years and over | 17 (9.9%) | 4 (0.7%) |
Disability Class: Cognitive Difficulty
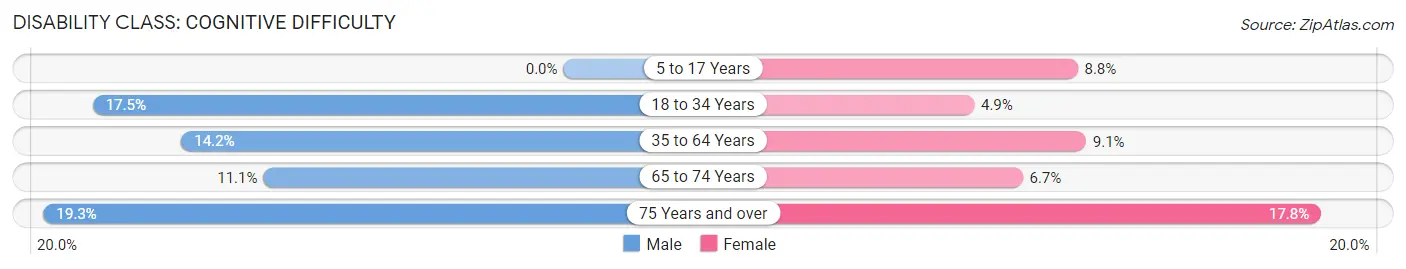
| Age Bracket | Male | Female |
| 5 to 17 Years | 0 (0.0%) | 21 (8.7%) |
| 18 to 34 Years | 58 (17.5%) | 20 (4.9%) |
| 35 to 64 Years | 110 (14.2%) | 89 (9.1%) |
| 65 to 74 Years | 38 (11.1%) | 21 (6.7%) |
| 75 Years and over | 33 (19.3%) | 98 (17.8%) |
Disability Class: Ambulatory Difficulty
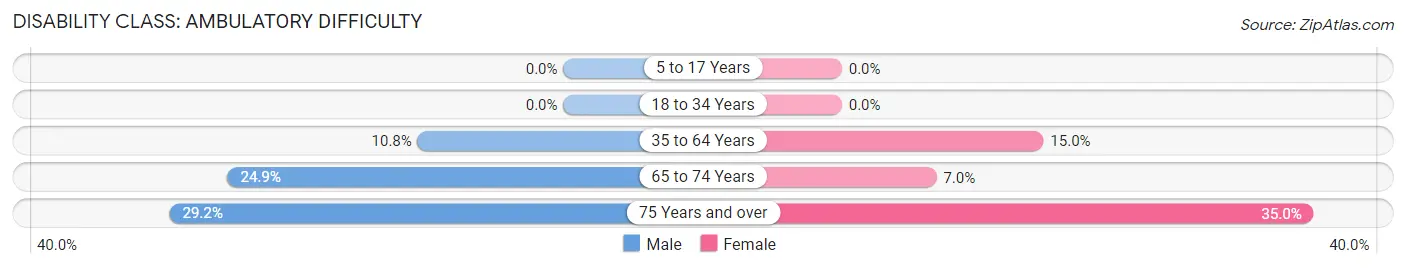
| Age Bracket | Male | Female |
| 5 to 17 Years | 0 (0.0%) | 0 (0.0%) |
| 18 to 34 Years | 0 (0.0%) | 0 (0.0%) |
| 35 to 64 Years | 84 (10.8%) | 147 (15.0%) |
| 65 to 74 Years | 85 (24.9%) | 22 (7.0%) |
| 75 Years and over | 50 (29.2%) | 193 (35.0%) |
Disability Class: Self-Care Difficulty
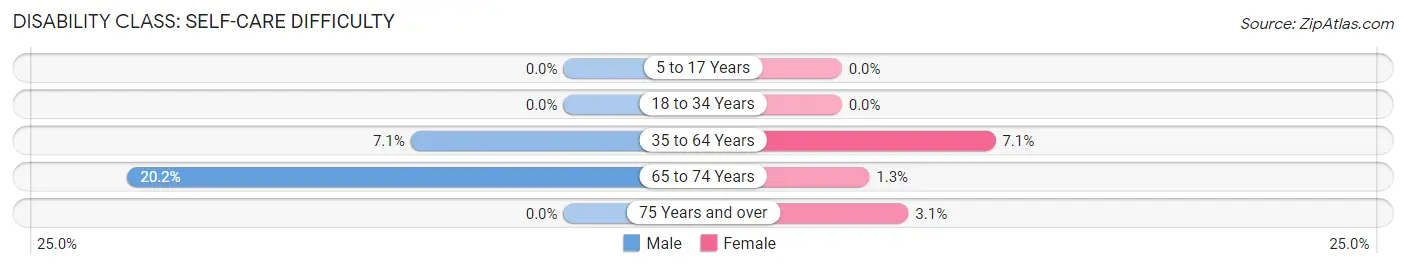
| Age Bracket | Male | Female |
| 5 to 17 Years | 0 (0.0%) | 0 (0.0%) |
| 18 to 34 Years | 0 (0.0%) | 0 (0.0%) |
| 35 to 64 Years | 55 (7.1%) | 70 (7.1%) |
| 65 to 74 Years | 69 (20.2%) | 4 (1.3%) |
| 75 Years and over | 0 (0.0%) | 17 (3.1%) |
Technology Access in Hamilton
Computing Device Access in Hamilton
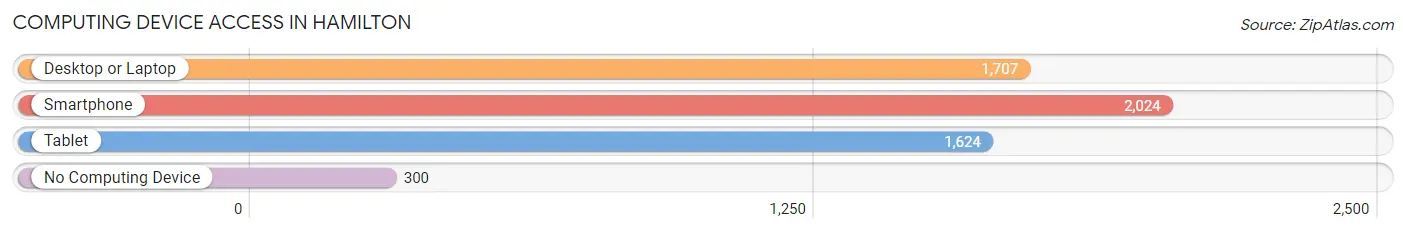
| Device Type | # Households | % Households |
| Desktop or Laptop | 1,707 | 66.6% |
| Smartphone | 2,024 | 79.0% |
| Tablet | 1,624 | 63.4% |
| No Computing Device | 300 | 11.7% |
| Total | 2,562 | 100.0% |
Internet Access in Hamilton
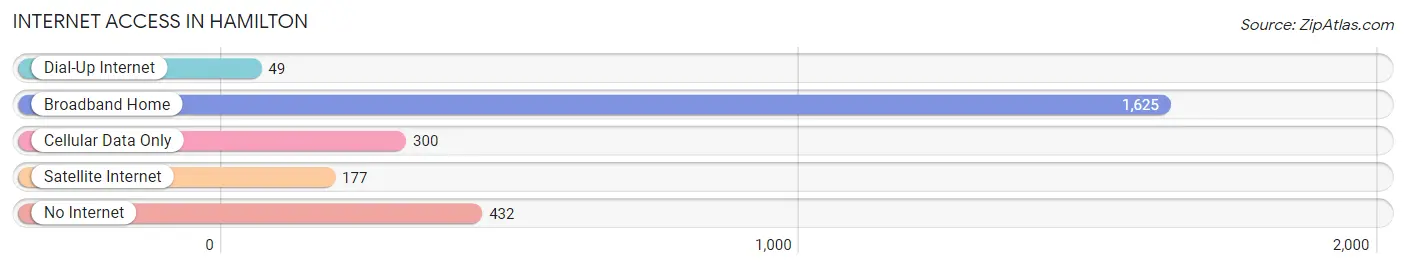
| Internet Type | # Households | % Households |
| Dial-Up Internet | 49 | 1.9% |
| Broadband Home | 1,625 | 63.4% |
| Cellular Data Only | 300 | 11.7% |
| Satellite Internet | 177 | 6.9% |
| No Internet | 432 | 16.9% |
| Total | 2,562 | 100.0% |
Hamilton Summary
Hamilton, Montana is a small city located in the Bitterroot Valley of the Rocky Mountains. It is the county seat of Ravalli County and is located in the southwestern part of the state. The city is situated at the confluence of the Bitterroot and the Clark Fork rivers, and is surrounded by the Bitterroot National Forest. The population of Hamilton was 4,923 at the 2010 census.
History
The area that is now Hamilton was first inhabited by the Salish Indians, who were later displaced by the Nez Perce and Flathead tribes. The first white settlers arrived in the area in the 1860s, and the town of Hamilton was founded in 1881. The town was named after J.W. Hamilton, a local rancher and businessman.
In the late 19th century, Hamilton was a bustling center of commerce and industry, with several sawmills, a flour mill, and a brickyard. The town was also home to several saloons, hotels, and other businesses.
Geography
Hamilton is located in the Bitterroot Valley of the Rocky Mountains, at an elevation of 3,400 feet. The city is situated at the confluence of the Bitterroot and the Clark Fork rivers. The Bitterroot Mountains are to the east, and the Sapphire Mountains are to the west.
The climate in Hamilton is semi-arid, with hot summers and cold winters. The average annual temperature is 48°F, and the average annual precipitation is 16.5 inches.
Economy
The economy of Hamilton is largely based on agriculture and tourism. The city is home to several farms and ranches, and is a popular destination for outdoor recreation. The city is also home to several manufacturing companies, including a wood products plant and a metal fabrication plant.
Demographics
As of the 2010 census, the population of Hamilton was 4,923. The racial makeup of the city was 94.3% White, 0.7% African American, 1.2% Native American, 0.7% Asian, 0.1% Pacific Islander, 1.2% from other races, and 1.7% from two or more races. Hispanic or Latino of any race were 4.2% of the population.
The median income for a household in Hamilton was $35,938, and the median income for a family was $41,944. The per capita income for the city was $19,945. About 11.2% of families and 14.2% of the population were below the poverty line, including 19.2% of those under age 18 and 8.2% of those age 65 or over.
Common Questions
What is Per Capita Income in Hamilton?
Per Capita income in Hamilton is $33,691.
What is the Median Family Income in Hamilton?
Median Family Income in Hamilton is $61,481.
What is the Median Household income in Hamilton?
Median Household Income in Hamilton is $45,973.
What is Income or Wage Gap in Hamilton?
Income or Wage Gap in Hamilton is 16.5%.
Women in Hamilton earn 83.5 cents for every dollar earned by a man.
What is Inequality or Gini Index in Hamilton?
Inequality or Gini Index in Hamilton is 0.45.
What is the Total Population of Hamilton?
Total Population of Hamilton is 4,806.
What is the Total Male Population of Hamilton?
Total Male Population of Hamilton is 2,030.
What is the Total Female Population of Hamilton?
Total Female Population of Hamilton is 2,776.
What is the Ratio of Males per 100 Females in Hamilton?
There are 73.13 Males per 100 Females in Hamilton.
What is the Ratio of Females per 100 Males in Hamilton?
There are 136.75 Females per 100 Males in Hamilton.
What is the Median Population Age in Hamilton?
Median Population Age in Hamilton is 48.3 Years.
What is the Average Family Size in Hamilton
Average Family Size in Hamilton is 2.8 People.
What is the Average Household Size in Hamilton
Average Household Size in Hamilton is 1.8 People.
How Large is the Labor Force in Hamilton?
There are 2,351 People in the Labor Forcein in Hamilton.
What is the Percentage of People in the Labor Force in Hamilton?
57.6% of People are in the Labor Force in Hamilton.
What is the Unemployment Rate in Hamilton?
Unemployment Rate in Hamilton is 2.4%.