Suttons Bay, MI Map & Demographics
Suttons Bay Map
Suttons Bay Overview
$60,945
PER CAPITA INCOME
$118,902
AVG FAMILY INCOME
$108,750
AVG HOUSEHOLD INCOME
50.2%
WAGE / INCOME GAP [ % ]
49.8¢/ $1
WAGE / INCOME GAP [ $ ]
0.43
INEQUALITY / GINI INDEX
642
TOTAL POPULATION
344
MALE POPULATION
298
FEMALE POPULATION
115.44
MALES / 100 FEMALES
86.63
FEMALES / 100 MALES
69.3
MEDIAN AGE
2.4
AVG FAMILY SIZE
1.9
AVG HOUSEHOLD SIZE
226
LABOR FORCE [ PEOPLE ]
37.1%
PERCENT IN LABOR FORCE
3.5%
UNEMPLOYMENT RATE
Suttons Bay Zip Codes
Suttons Bay Area Codes
Income in Suttons Bay
Income Overview in Suttons Bay
Per Capita Income in Suttons Bay is $60,945, while median incomes of families and households are $118,902 and $108,750 respectively.
| Characteristic | Number | Measure |
| Per Capita Income | 642 | $60,945 |
| Median Family Income | 188 | $118,902 |
| Mean Family Income | 188 | $157,372 |
| Median Household Income | 308 | $108,750 |
| Mean Household Income | 308 | $122,342 |
| Income Deficit | 188 | $0 |
| Wage / Income Gap (%) | 642 | 50.23% |
| Wage / Income Gap ($) | 642 | 49.77¢ per $1 |
| Gini / Inequality Index | 642 | 0.43 |
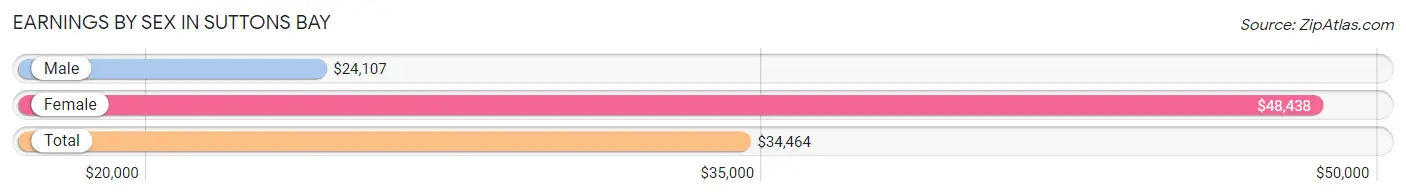
Earnings by Sex in Suttons Bay
Average Earnings in Suttons Bay are $34,464, $24,107 for men and $48,438 for women, a difference of 50.2%.
| Sex | Number | Average Earnings |
| Male | 163 (62.5%) | $24,107 |
| Female | 98 (37.6%) | $48,438 |
| Total | 261 (100.0%) | $34,464 |
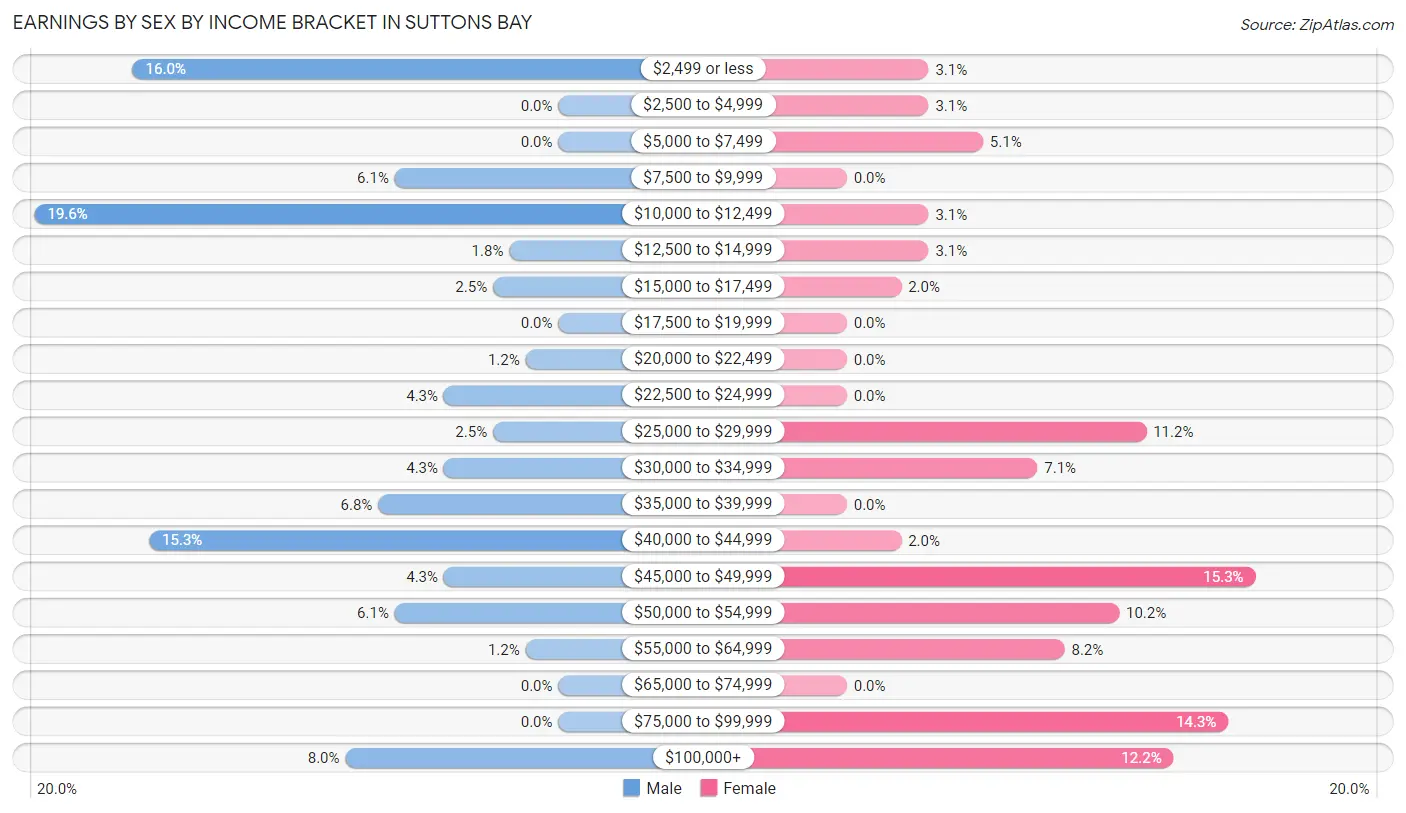
Earnings by Sex by Income Bracket in Suttons Bay
The most common earnings brackets in Suttons Bay are $10,000 to $12,499 for men (32 | 19.6%) and $45,000 to $49,999 for women (15 | 15.3%).
| Income | Male | Female |
| $2,499 or less | 26 (16.0%) | 3 (3.1%) |
| $2,500 to $4,999 | 0 (0.0%) | 3 (3.1%) |
| $5,000 to $7,499 | 0 (0.0%) | 5 (5.1%) |
| $7,500 to $9,999 | 10 (6.1%) | 0 (0.0%) |
| $10,000 to $12,499 | 32 (19.6%) | 3 (3.1%) |
| $12,500 to $14,999 | 3 (1.8%) | 3 (3.1%) |
| $15,000 to $17,499 | 4 (2.5%) | 2 (2.0%) |
| $17,500 to $19,999 | 0 (0.0%) | 0 (0.0%) |
| $20,000 to $22,499 | 2 (1.2%) | 0 (0.0%) |
| $22,500 to $24,999 | 7 (4.3%) | 0 (0.0%) |
| $25,000 to $29,999 | 4 (2.5%) | 11 (11.2%) |
| $30,000 to $34,999 | 7 (4.3%) | 7 (7.1%) |
| $35,000 to $39,999 | 11 (6.8%) | 0 (0.0%) |
| $40,000 to $44,999 | 25 (15.3%) | 2 (2.0%) |
| $45,000 to $49,999 | 7 (4.3%) | 15 (15.3%) |
| $50,000 to $54,999 | 10 (6.1%) | 10 (10.2%) |
| $55,000 to $64,999 | 2 (1.2%) | 8 (8.2%) |
| $65,000 to $74,999 | 0 (0.0%) | 0 (0.0%) |
| $75,000 to $99,999 | 0 (0.0%) | 14 (14.3%) |
| $100,000+ | 13 (8.0%) | 12 (12.2%) |
| Total | 163 (100.0%) | 98 (100.0%) |
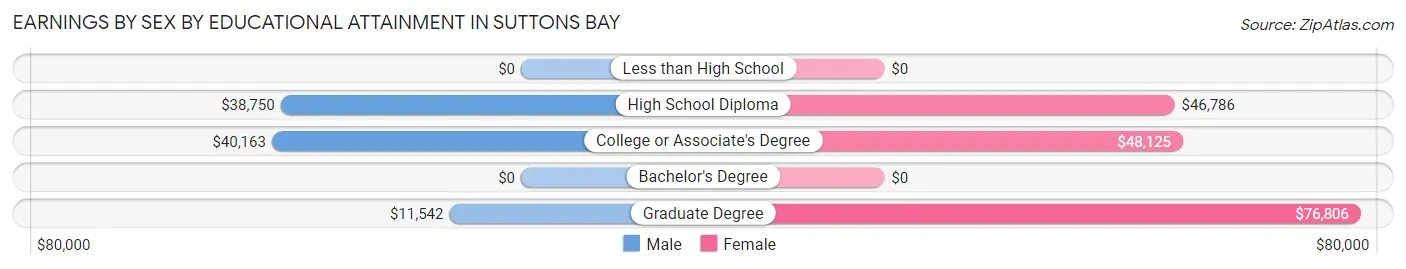
Earnings by Sex by Educational Attainment in Suttons Bay
Average earnings in Suttons Bay are $23,750 for men and $49,063 for women, a difference of 51.6%. Men with an educational attainment of college or associate's degree enjoy the highest average annual earnings of $40,163, while those with graduate degree education earn the least with $11,542. Women with an educational attainment of graduate degree earn the most with the average annual earnings of $76,806, while those with high school diploma education have the smallest earnings of $46,786.
| Educational Attainment | Male Income | Female Income |
| Less than High School | - | - |
| High School Diploma | $38,750 | $46,786 |
| College or Associate's Degree | $40,163 | $48,125 |
| Bachelor's Degree | - | - |
| Graduate Degree | $11,542 | $76,806 |
| Total | $23,750 | $49,063 |
Family Income in Suttons Bay
Family Income Brackets in Suttons Bay
According to the Suttons Bay family income data, there are 86 families falling into the $100,000 to $149,999 income range, which is the most common income bracket and makes up 45.7% of all families.
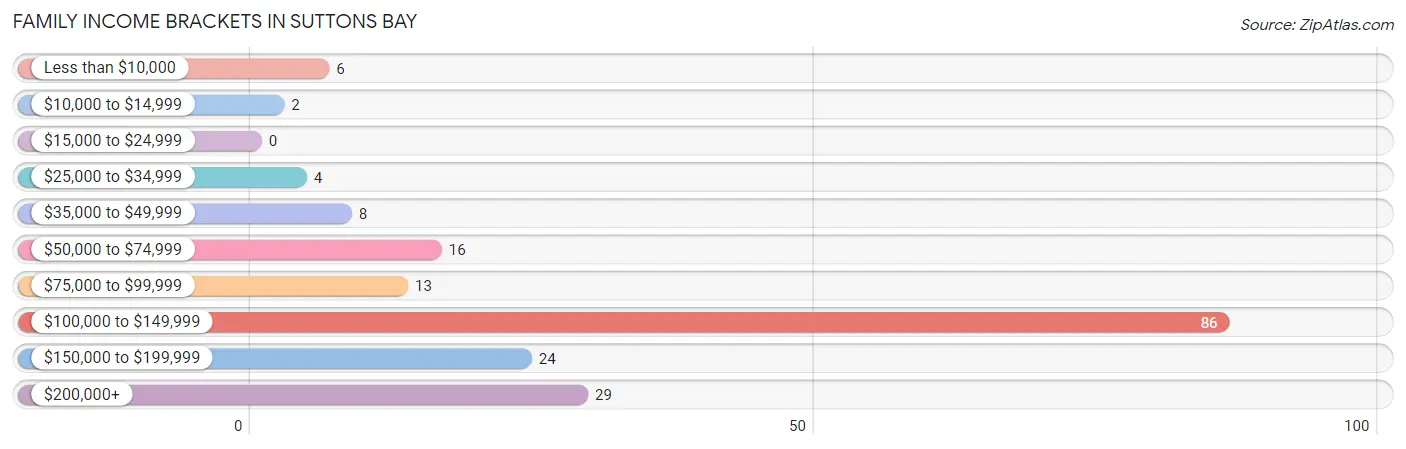
| Income Bracket | # Families | % Families |
| Less than $10,000 | 6 | 3.2% |
| $10,000 to $14,999 | 2 | 1.1% |
| $15,000 to $24,999 | 0 | 0.0% |
| $25,000 to $34,999 | 4 | 2.1% |
| $35,000 to $49,999 | 8 | 4.3% |
| $50,000 to $74,999 | 16 | 8.5% |
| $75,000 to $99,999 | 13 | 6.9% |
| $100,000 to $149,999 | 86 | 45.7% |
| $150,000 to $199,999 | 24 | 12.8% |
| $200,000+ | 29 | 15.4% |
Family Income by Famaliy Size in Suttons Bay
2-person families (163 | 86.7%) account for the highest median family income in Suttons Bay with $119,299 per family, while 2-person families (163 | 86.7%) have the highest median income of $59,650 per family member.
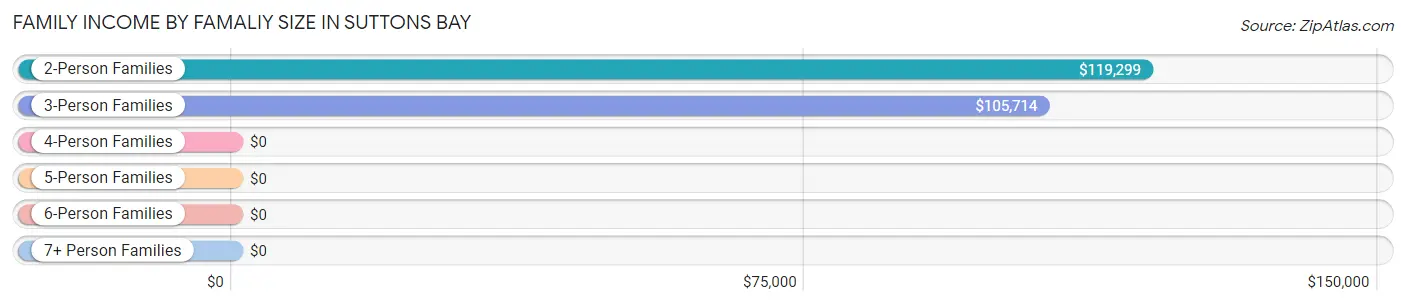
| Income Bracket | # Families | Median Income |
| 2-Person Families | 163 (86.7%) | $119,299 |
| 3-Person Families | 16 (8.5%) | $105,714 |
| 4-Person Families | 8 (4.3%) | $0 |
| 5-Person Families | 1 (0.5%) | $0 |
| 6-Person Families | 0 (0.0%) | $0 |
| 7+ Person Families | 0 (0.0%) | $0 |
| Total | 188 (100.0%) | $118,902 |
Family Income by Number of Earners in Suttons Bay
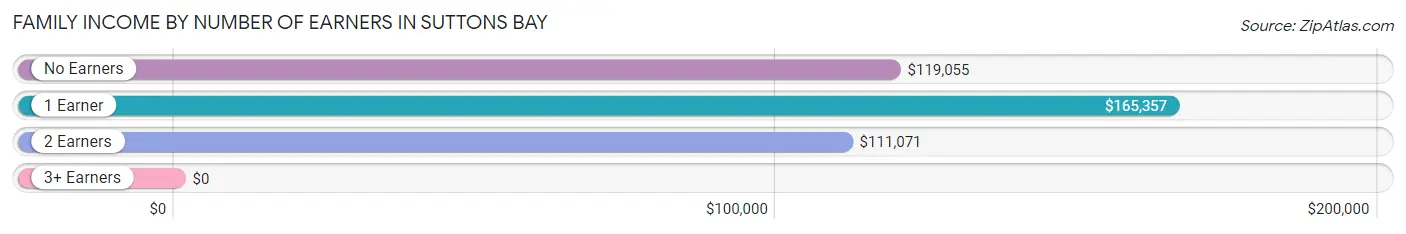
| Number of Earners | # Families | Median Income |
| No Earners | 107 (56.9%) | $119,055 |
| 1 Earner | 20 (10.6%) | $165,357 |
| 2 Earners | 60 (31.9%) | $111,071 |
| 3+ Earners | 1 (0.5%) | $0 |
| Total | 188 (100.0%) | $118,902 |
Household Income in Suttons Bay
Household Income Brackets in Suttons Bay
With 112 households falling in the category, the $100,000 to $149,999 income range is the most frequent in Suttons Bay, accounting for 36.4% of all households. In contrast, only 2 households (0.6%) fall into the $10,000 to $14,999 income bracket, making it the least populous group.
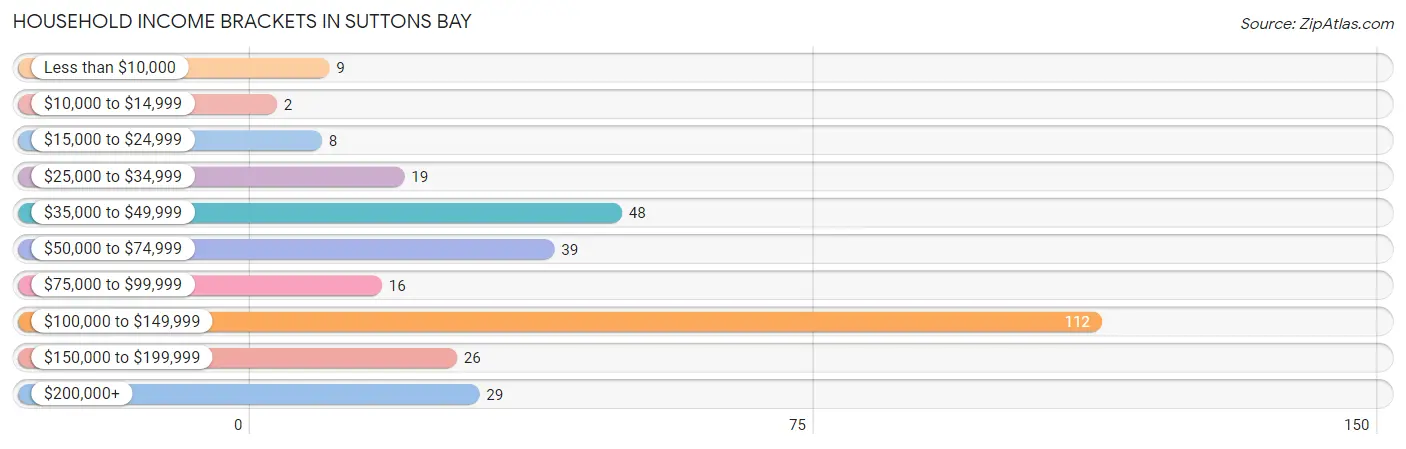
| Income Bracket | # Households | % Households |
| Less than $10,000 | 9 | 2.9% |
| $10,000 to $14,999 | 2 | 0.6% |
| $15,000 to $24,999 | 8 | 2.6% |
| $25,000 to $34,999 | 19 | 6.2% |
| $35,000 to $49,999 | 48 | 15.6% |
| $50,000 to $74,999 | 39 | 12.7% |
| $75,000 to $99,999 | 16 | 5.2% |
| $100,000 to $149,999 | 112 | 36.4% |
| $150,000 to $199,999 | 26 | 8.4% |
| $200,000+ | 29 | 9.4% |
Household Income by Householder Age in Suttons Bay
The median household income in Suttons Bay is $108,750, with the highest median household income of $118,079 found in the 65+ years age bracket for the primary householder. A total of 239 households (77.6%) fall into this category. Meanwhile, the 15 to 24 years age bracket for the primary householder has the lowest median household income of $0, with 4 households (1.3%) in this group.
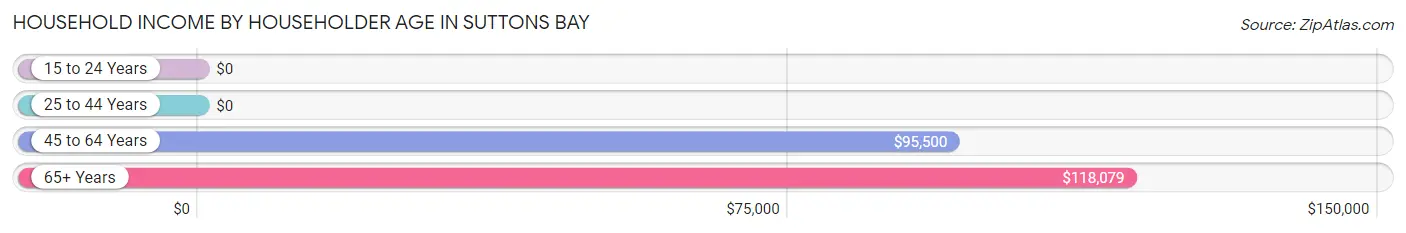
| Income Bracket | # Households | Median Income |
| 15 to 24 Years | 4 (1.3%) | $0 |
| 25 to 44 Years | 15 (4.9%) | $0 |
| 45 to 64 Years | 50 (16.2%) | $95,500 |
| 65+ Years | 239 (77.6%) | $118,079 |
| Total | 308 (100.0%) | $108,750 |
Poverty in Suttons Bay
Income Below Poverty by Sex and Age in Suttons Bay
With 4.5% poverty level for males and 5.8% for females among the residents of Suttons Bay, 45 to 54 year old males and 35 to 44 year old females are the most vulnerable to poverty, with 5 males (38.5%) and 3 females (75.0%) in their respective age groups living below the poverty level.
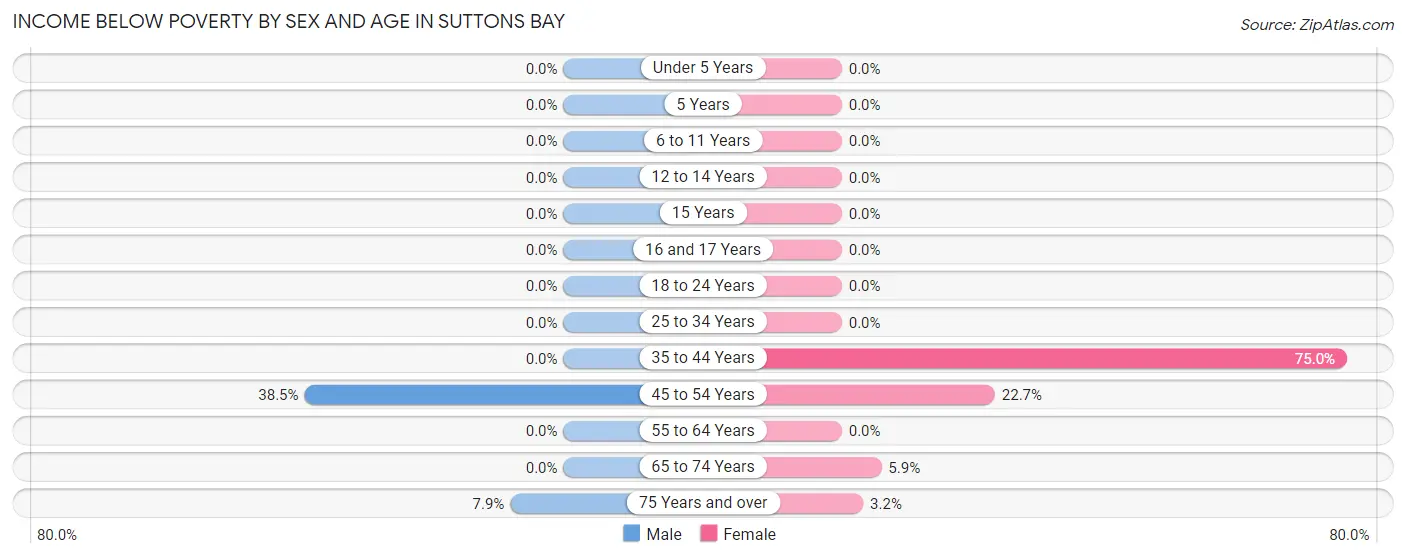
| Age Bracket | Male | Female |
| Under 5 Years | 0 (0.0%) | 0 (0.0%) |
| 5 Years | 0 (0.0%) | 0 (0.0%) |
| 6 to 11 Years | 0 (0.0%) | 0 (0.0%) |
| 12 to 14 Years | 0 (0.0%) | 0 (0.0%) |
| 15 Years | 0 (0.0%) | 0 (0.0%) |
| 16 and 17 Years | 0 (0.0%) | 0 (0.0%) |
| 18 to 24 Years | 0 (0.0%) | 0 (0.0%) |
| 25 to 34 Years | 0 (0.0%) | 0 (0.0%) |
| 35 to 44 Years | 0 (0.0%) | 3 (75.0%) |
| 45 to 54 Years | 5 (38.5%) | 5 (22.7%) |
| 55 to 64 Years | 0 (0.0%) | 0 (0.0%) |
| 65 to 74 Years | 0 (0.0%) | 5 (5.9%) |
| 75 Years and over | 9 (7.9%) | 2 (3.2%) |
| Total | 14 (4.5%) | 15 (5.8%) |
Income Above Poverty by Sex and Age in Suttons Bay
According to the poverty statistics in Suttons Bay, males aged 6 to 11 years and females aged 6 to 11 years are the age groups that are most secure financially, with 100.0% of males and 100.0% of females in these age groups living above the poverty line.
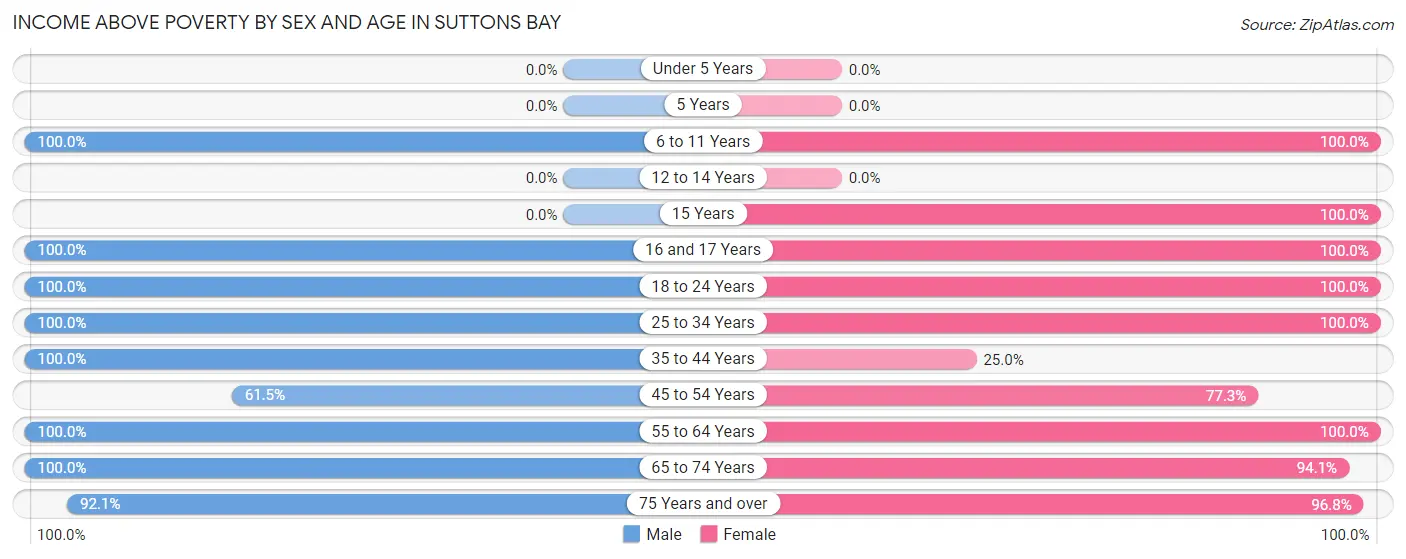
| Age Bracket | Male | Female |
| Under 5 Years | 0 (0.0%) | 0 (0.0%) |
| 5 Years | 0 (0.0%) | 0 (0.0%) |
| 6 to 11 Years | 12 (100.0%) | 6 (100.0%) |
| 12 to 14 Years | 0 (0.0%) | 0 (0.0%) |
| 15 Years | 0 (0.0%) | 12 (100.0%) |
| 16 and 17 Years | 4 (100.0%) | 2 (100.0%) |
| 18 to 24 Years | 14 (100.0%) | 4 (100.0%) |
| 25 to 34 Years | 16 (100.0%) | 12 (100.0%) |
| 35 to 44 Years | 23 (100.0%) | 1 (25.0%) |
| 45 to 54 Years | 8 (61.5%) | 17 (77.3%) |
| 55 to 64 Years | 17 (100.0%) | 49 (100.0%) |
| 65 to 74 Years | 101 (100.0%) | 80 (94.1%) |
| 75 Years and over | 105 (92.1%) | 61 (96.8%) |
| Total | 300 (95.5%) | 244 (94.2%) |
Income Below Poverty Among Married-Couple Families in Suttons Bay
The poverty statistics for married-couple families in Suttons Bay show that 3.5% or 6 of the total 171 families live below the poverty line. Families with no children have the highest poverty rate of 3.7%, comprising of 6 families. On the other hand, families with 1 or 2 children have the lowest poverty rate of 0.0%, which includes 0 families.
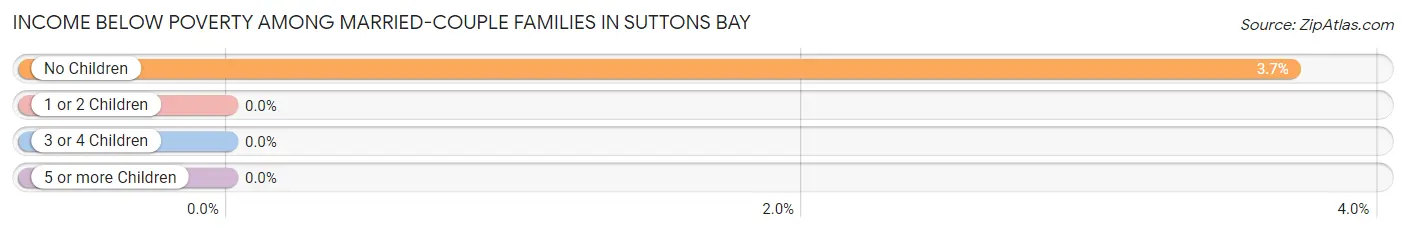
| Children | Above Poverty | Below Poverty |
| No Children | 156 (96.3%) | 6 (3.7%) |
| 1 or 2 Children | 8 (100.0%) | 0 (0.0%) |
| 3 or 4 Children | 1 (100.0%) | 0 (0.0%) |
| 5 or more Children | 0 (0.0%) | 0 (0.0%) |
| Total | 165 (96.5%) | 6 (3.5%) |
Income Below Poverty Among Single-Parent Households in Suttons Bay
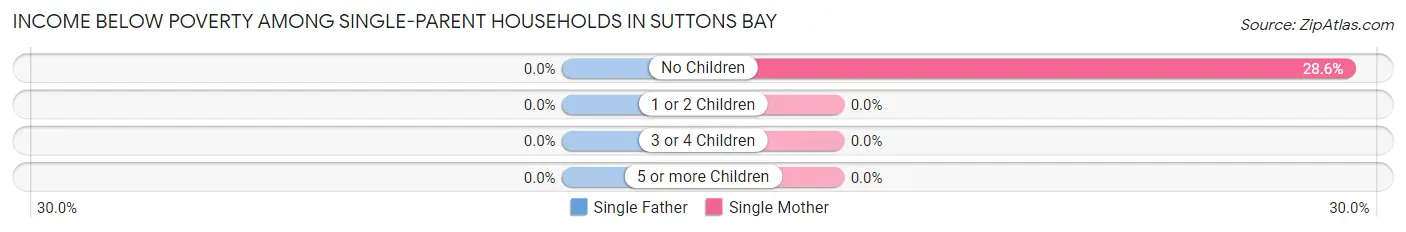
| Children | Single Father | Single Mother |
| No Children | 0 (0.0%) | 2 (28.6%) |
| 1 or 2 Children | 0 (0.0%) | 0 (0.0%) |
| 3 or 4 Children | 0 (0.0%) | 0 (0.0%) |
| 5 or more Children | 0 (0.0%) | 0 (0.0%) |
| Total | 0 (0.0%) | 2 (14.3%) |
Income Below Poverty Among Married-Couple vs Single-Parent Households in Suttons Bay
The poverty data for Suttons Bay shows that 6 of the married-couple family households (3.5%) and 2 of the single-parent households (11.8%) are living below the poverty level. Within the married-couple family households, those with no children have the highest poverty rate, with 6 households (3.7%) falling below the poverty line. Among the single-parent households, those with no children have the highest poverty rate, with 2 household (28.6%) living below poverty.
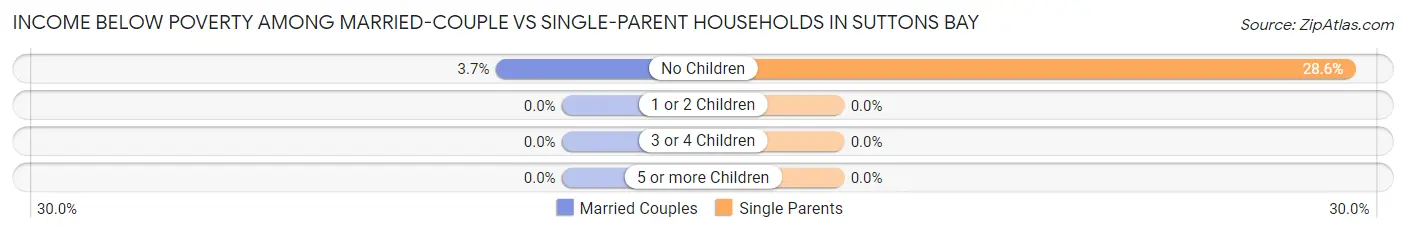
| Children | Married-Couple Families | Single-Parent Households |
| No Children | 6 (3.7%) | 2 (28.6%) |
| 1 or 2 Children | 0 (0.0%) | 0 (0.0%) |
| 3 or 4 Children | 0 (0.0%) | 0 (0.0%) |
| 5 or more Children | 0 (0.0%) | 0 (0.0%) |
| Total | 6 (3.5%) | 2 (11.8%) |
Race in Suttons Bay
The most populous races in Suttons Bay are White / Caucasian (560 | 87.2%), Two or more Races (48 | 7.5%), and Black / African American (34 | 5.3%).
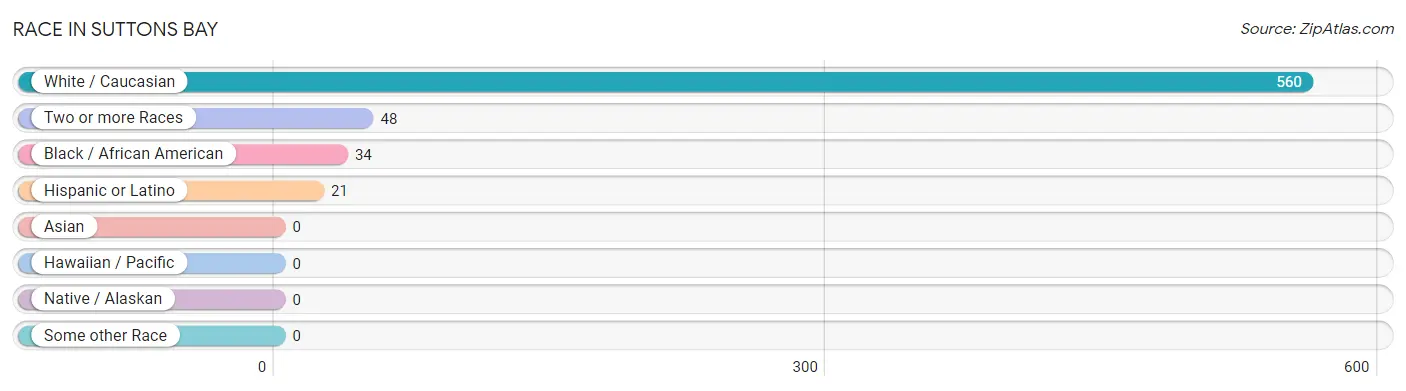
| Race | # Population | % Population |
| Asian | 0 | 0.0% |
| Black / African American | 34 | 5.3% |
| Hawaiian / Pacific | 0 | 0.0% |
| Hispanic or Latino | 21 | 3.3% |
| Native / Alaskan | 0 | 0.0% |
| White / Caucasian | 560 | 87.2% |
| Two or more Races | 48 | 7.5% |
| Some other Race | 0 | 0.0% |
| Total | 642 | 100.0% |
Ancestry in Suttons Bay
The most populous ancestries reported in Suttons Bay are German (125 | 19.5%), English (103 | 16.0%), Polish (70 | 10.9%), Dutch (54 | 8.4%), and Scottish (53 | 8.3%), together accounting for 63.1% of all Suttons Bay residents.
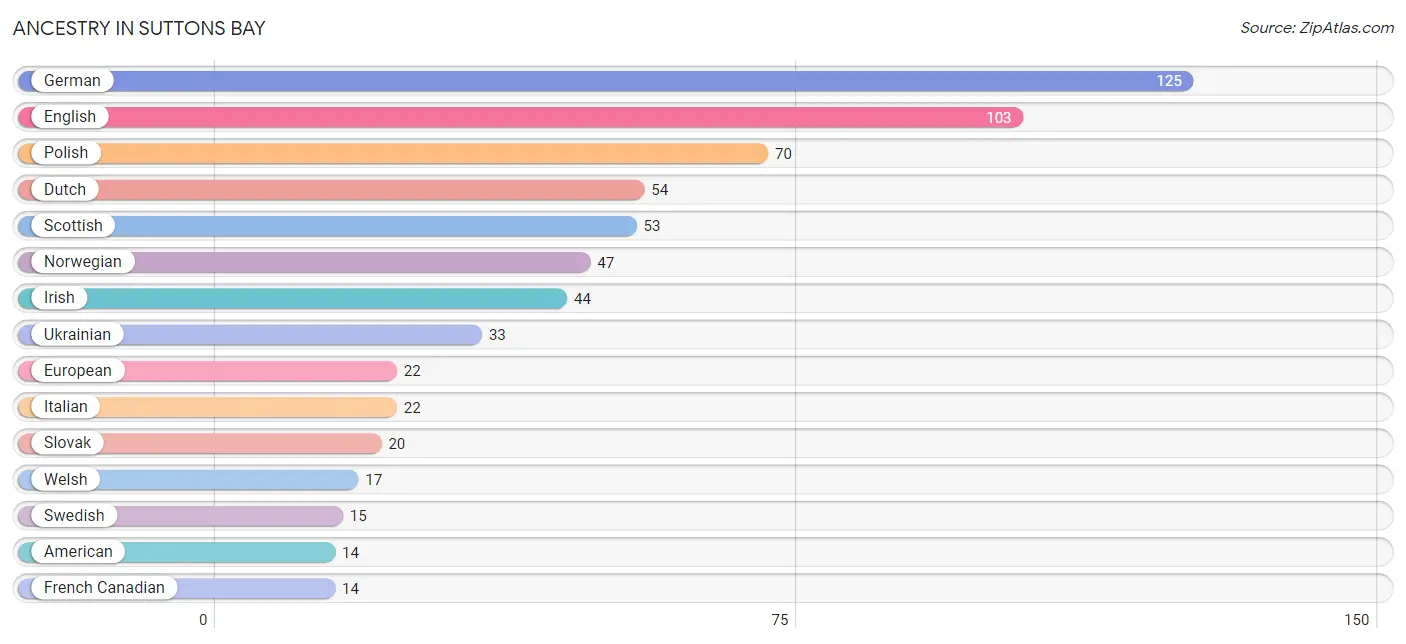
| Ancestry | # Population | % Population |
| African | 9 | 1.4% |
| American | 14 | 2.2% |
| British | 8 | 1.3% |
| Central American | 3 | 0.5% |
| Cherokee | 4 | 0.6% |
| Croatian | 3 | 0.5% |
| Danish | 2 | 0.3% |
| Dutch | 54 | 8.4% |
| English | 103 | 16.0% |
| European | 22 | 3.4% |
| French | 10 | 1.6% |
| French Canadian | 14 | 2.2% |
| German | 125 | 19.5% |
| Honduran | 3 | 0.5% |
| Irish | 44 | 6.9% |
| Italian | 22 | 3.4% |
| Mexican | 9 | 1.4% |
| Norwegian | 47 | 7.3% |
| Peruvian | 9 | 1.4% |
| Polish | 70 | 10.9% |
| Scotch-Irish | 5 | 0.8% |
| Scottish | 53 | 8.3% |
| Slovak | 20 | 3.1% |
| South American | 9 | 1.4% |
| Subsaharan African | 9 | 1.4% |
| Swedish | 15 | 2.3% |
| Swiss | 11 | 1.7% |
| Ukrainian | 33 | 5.1% |
| Welsh | 17 | 2.6% | View All 29 Rows |
Immigrants in Suttons Bay
The most numerous immigrant groups reported in Suttons Bay came from Europe (22 | 3.4%), Czechoslovakia (20 | 3.1%), Eastern Europe (20 | 3.1%), Germany (2 | 0.3%), and Western Europe (2 | 0.3%), together accounting for 10.3% of all Suttons Bay residents.
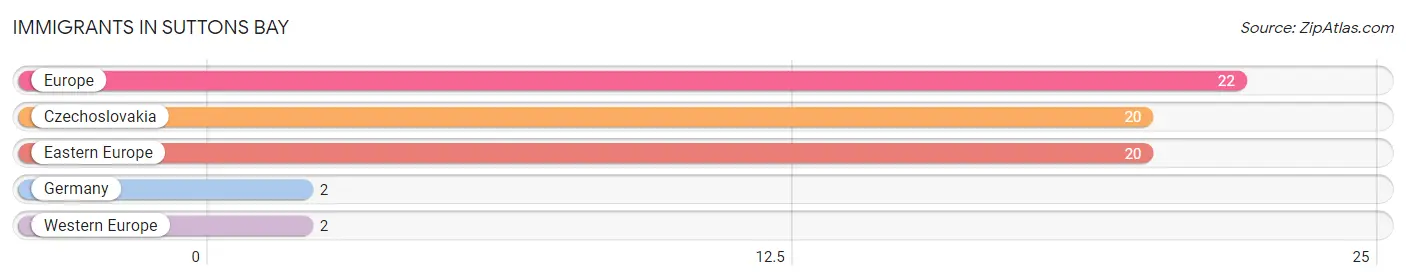
| Immigration Origin | # Population | % Population |
| Czechoslovakia | 20 | 3.1% |
| Eastern Europe | 20 | 3.1% |
| Europe | 22 | 3.4% |
| Germany | 2 | 0.3% |
| Western Europe | 2 | 0.3% | View All 5 Rows |
Sex and Age in Suttons Bay
Sex and Age in Suttons Bay
The most populous age groups in Suttons Bay are 75 to 79 Years (76 | 22.1%) for men and 70 to 74 Years (58 | 19.5%) for women.
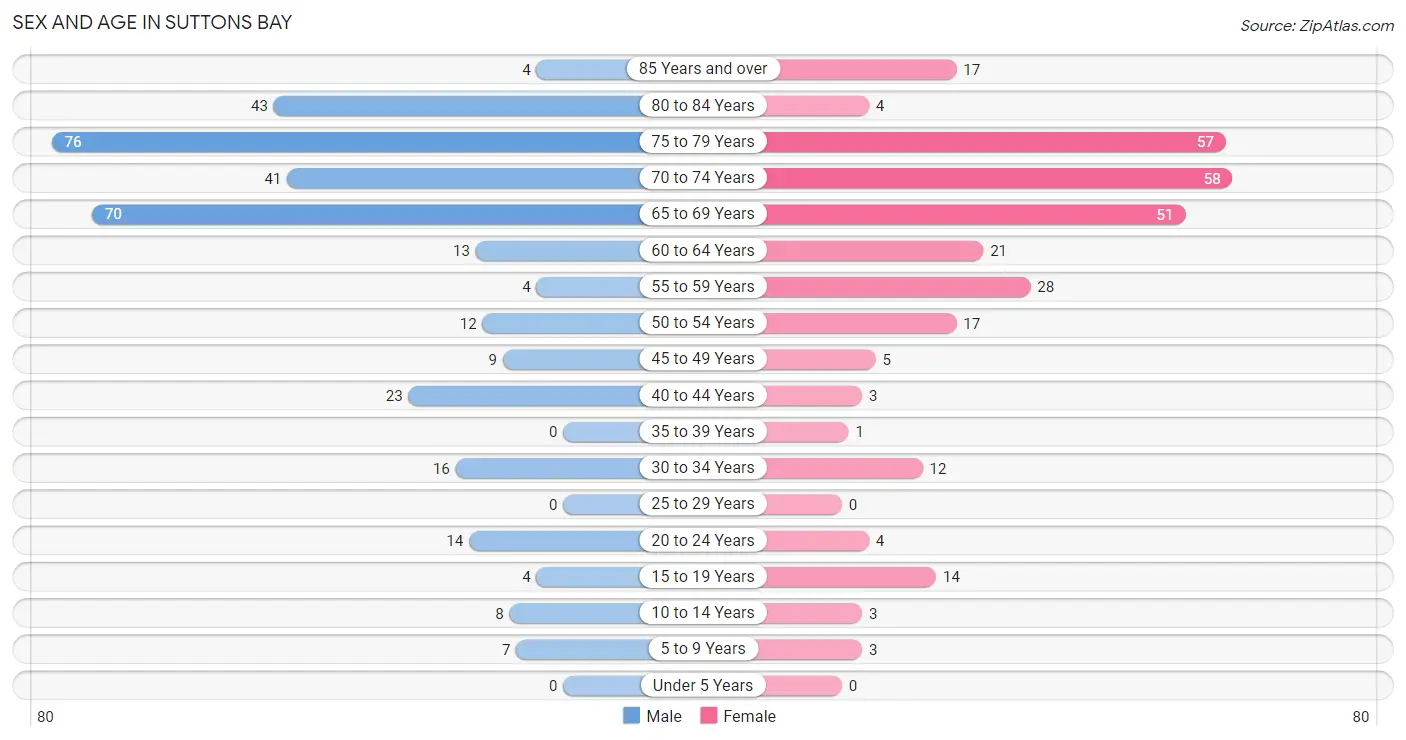
| Age Bracket | Male | Female |
| Under 5 Years | 0 (0.0%) | 0 (0.0%) |
| 5 to 9 Years | 7 (2.0%) | 3 (1.0%) |
| 10 to 14 Years | 8 (2.3%) | 3 (1.0%) |
| 15 to 19 Years | 4 (1.2%) | 14 (4.7%) |
| 20 to 24 Years | 14 (4.1%) | 4 (1.3%) |
| 25 to 29 Years | 0 (0.0%) | 0 (0.0%) |
| 30 to 34 Years | 16 (4.6%) | 12 (4.0%) |
| 35 to 39 Years | 0 (0.0%) | 1 (0.3%) |
| 40 to 44 Years | 23 (6.7%) | 3 (1.0%) |
| 45 to 49 Years | 9 (2.6%) | 5 (1.7%) |
| 50 to 54 Years | 12 (3.5%) | 17 (5.7%) |
| 55 to 59 Years | 4 (1.2%) | 28 (9.4%) |
| 60 to 64 Years | 13 (3.8%) | 21 (7.0%) |
| 65 to 69 Years | 70 (20.3%) | 51 (17.1%) |
| 70 to 74 Years | 41 (11.9%) | 58 (19.5%) |
| 75 to 79 Years | 76 (22.1%) | 57 (19.1%) |
| 80 to 84 Years | 43 (12.5%) | 4 (1.3%) |
| 85 Years and over | 4 (1.2%) | 17 (5.7%) |
| Total | 344 (100.0%) | 298 (100.0%) |
Families and Households in Suttons Bay
Median Family Size in Suttons Bay
The median family size in Suttons Bay is 2.36 persons per family, with single female/mother families (14 | 7.4%) accounting for the largest median family size of 2.93 persons per family. On the other hand, single male/father families (3 | 1.6%) represent the smallest median family size with 2.00 persons per family.
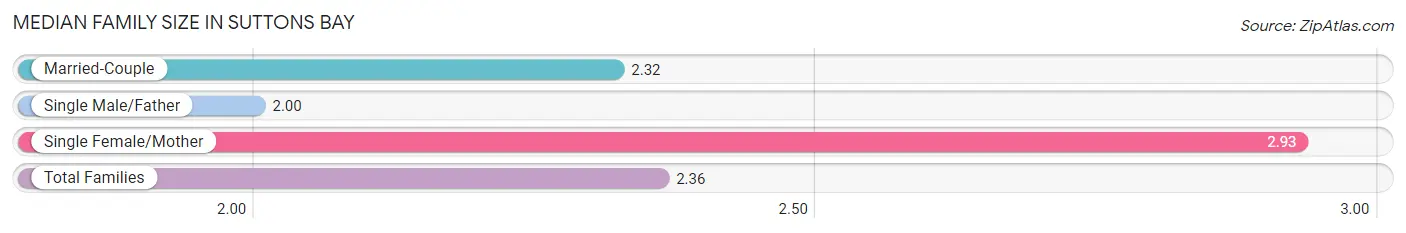
| Family Type | # Families | Family Size |
| Married-Couple | 171 (91.0%) | 2.32 |
| Single Male/Father | 3 (1.6%) | 2.00 |
| Single Female/Mother | 14 (7.4%) | 2.93 |
| Total Families | 188 (100.0%) | 2.36 |
Median Household Size in Suttons Bay
The median household size in Suttons Bay is 1.87 persons per household, with single male/father households (3 | 1.0%) accounting for the largest median household size of 3 persons per household. non-family households (120 | 39.0%) represent the smallest median household size with 1.05 persons per household.
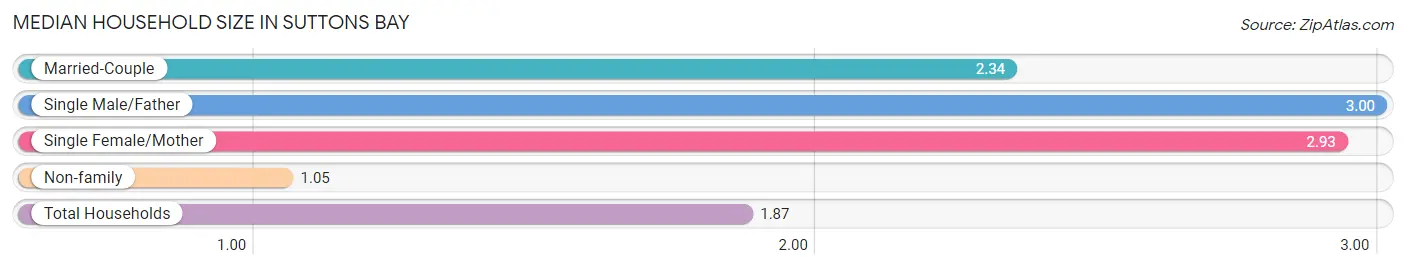
| Household Type | # Households | Household Size |
| Married-Couple | 171 (55.5%) | 2.34 |
| Single Male/Father | 3 (1.0%) | 3.00 |
| Single Female/Mother | 14 (4.5%) | 2.93 |
| Non-family | 120 (39.0%) | 1.05 |
| Total Households | 308 (100.0%) | 1.87 |
Household Size by Marriage Status in Suttons Bay
Out of a total of 308 households in Suttons Bay, 188 (61.0%) are family households, while 120 (39.0%) are nonfamily households. The most numerous type of family households are 2-person households, comprising 158, and the most common type of nonfamily households are 1-person households, comprising 114.
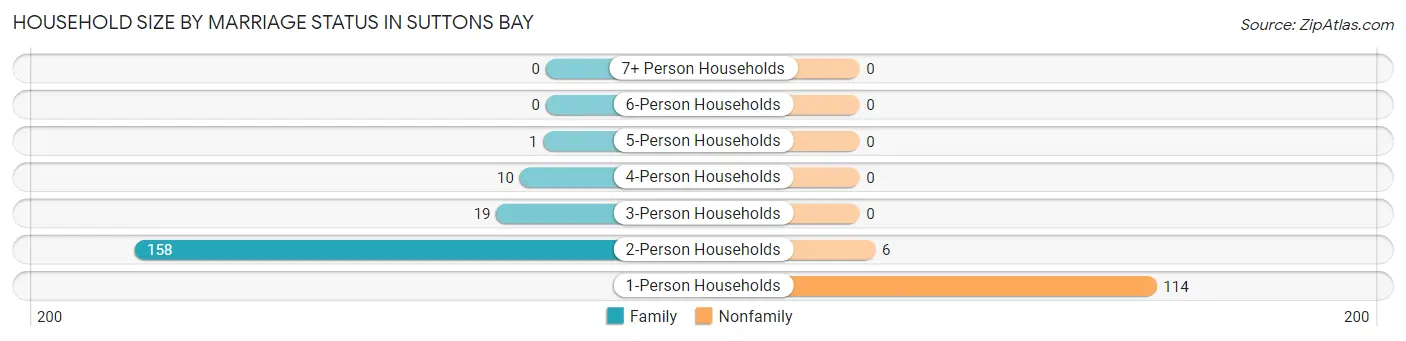
| Household Size | Family Households | Nonfamily Households |
| 1-Person Households | - | 114 (37.0%) |
| 2-Person Households | 158 (51.3%) | 6 (1.9%) |
| 3-Person Households | 19 (6.2%) | 0 (0.0%) |
| 4-Person Households | 10 (3.3%) | 0 (0.0%) |
| 5-Person Households | 1 (0.3%) | 0 (0.0%) |
| 6-Person Households | 0 (0.0%) | 0 (0.0%) |
| 7+ Person Households | 0 (0.0%) | 0 (0.0%) |
| Total | 188 (61.0%) | 120 (39.0%) |
Female Fertility in Suttons Bay
Fertility by Age in Suttons Bay
| Age Bracket | Women with Births | Births / 1,000 Women |
| 15 to 19 years | 0 (0.0%) | 0.0 |
| 20 to 34 years | 0 (0.0%) | 0.0 |
| 35 to 50 years | 0 (0.0%) | 0.0 |
| Total | 0 (0.0%) | 0.0 |
Fertility by Age by Marriage Status in Suttons Bay
| Age Bracket | Married | Unmarried |
| 15 to 19 years | 0 (0.0%) | 0 (0.0%) |
| 20 to 34 years | 0 (0.0%) | 0 (0.0%) |
| 35 to 50 years | 0 (0.0%) | 0 (0.0%) |
| Total | 0 (0.0%) | 0 (0.0%) |
Fertility by Education in Suttons Bay
| Educational Attainment | Women with Births | Births / 1,000 Women |
| Less than High School | 0 (0.0%) | 0.0 |
| High School Diploma | 0 (0.0%) | 0.0 |
| College or Associate's Degree | 0 (0.0%) | 0.0 |
| Bachelor's Degree | 0 (0.0%) | 0.0 |
| Graduate Degree | 0 (0.0%) | 0.0 |
| Total | 0 (0.0%) | 0.0 |
Fertility by Education by Marriage Status in Suttons Bay
| Educational Attainment | Married | Unmarried |
| Less than High School | 0 (0.0%) | 0 (0.0%) |
| High School Diploma | 0 (0.0%) | 0 (0.0%) |
| College or Associate's Degree | 0 (0.0%) | 0 (0.0%) |
| Bachelor's Degree | 0 (0.0%) | 0 (0.0%) |
| Graduate Degree | 0 (0.0%) | 0 (0.0%) |
| Total | 0 (0.0%) | 0 (0.0%) |
Employment Characteristics in Suttons Bay
Employment by Class of Employer in Suttons Bay
Among the 218 employed individuals in Suttons Bay, private company employees (114 | 52.3%), not-for-profit organizations (55 | 25.2%), and self-employed (not incorporated) (29 | 13.3%) make up the most common classes of employment.
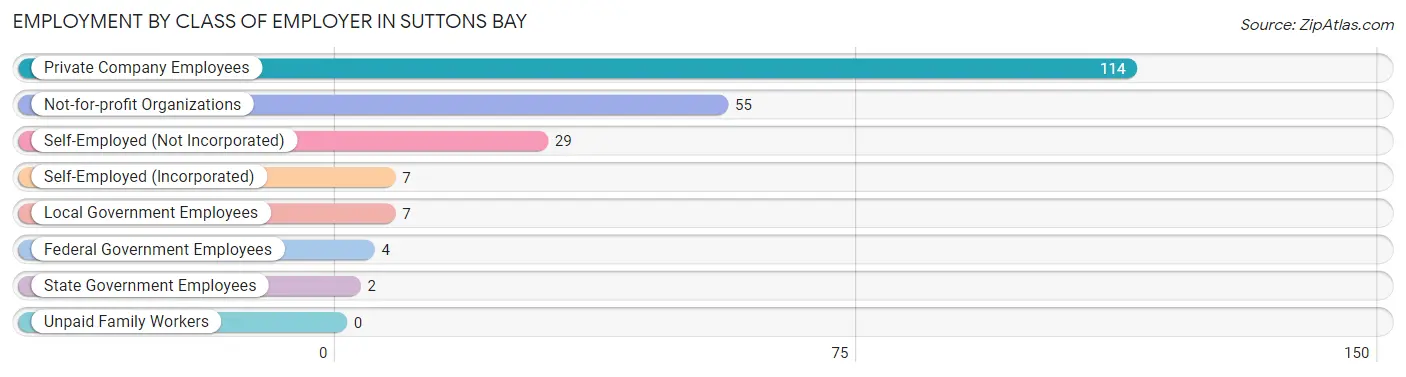
| Employer Class | # Employees | % Employees |
| Private Company Employees | 114 | 52.3% |
| Self-Employed (Incorporated) | 7 | 3.2% |
| Self-Employed (Not Incorporated) | 29 | 13.3% |
| Not-for-profit Organizations | 55 | 25.2% |
| Local Government Employees | 7 | 3.2% |
| State Government Employees | 2 | 0.9% |
| Federal Government Employees | 4 | 1.8% |
| Unpaid Family Workers | 0 | 0.0% |
| Total | 218 | 100.0% |
Employment Status by Age in Suttons Bay
According to the labor force statistics for Suttons Bay, out of the total population over 16 years of age (609), 37.1% or 226 individuals are in the labor force, with 3.5% or 8 of them unemployed. The age group with the highest labor force participation rate is 20 to 24 years, with 100.0% or 18 individuals in the labor force. Within the labor force, the 35 to 44 years age range has the highest percentage of unemployed individuals, with 14.3% or 1 of them being unemployed.
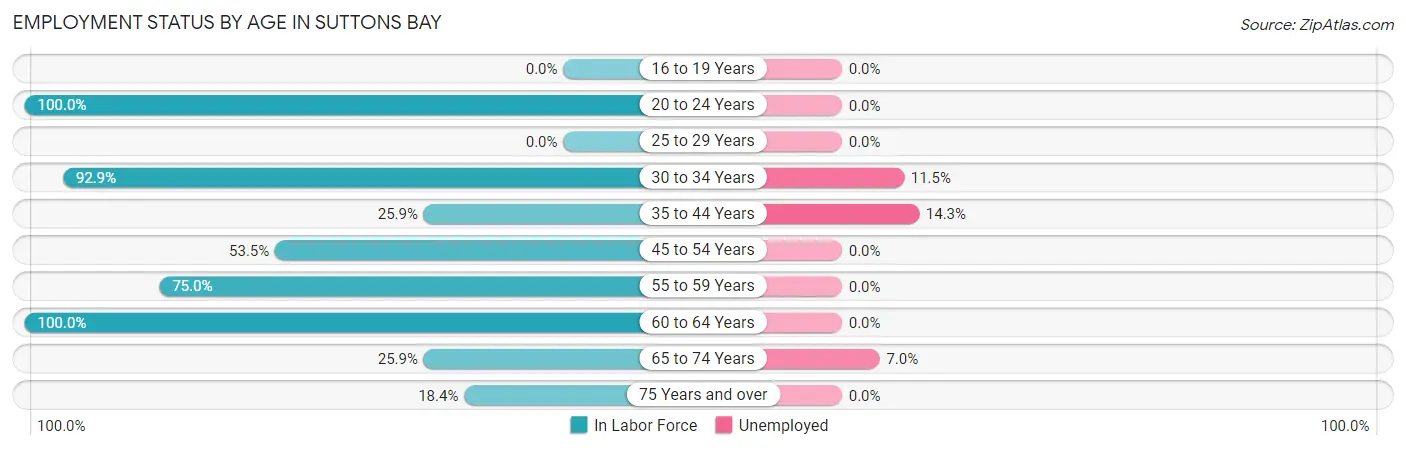
| Age Bracket | In Labor Force | Unemployed |
| 16 to 19 Years | 0 (0.0%) | 0 (0.0%) |
| 20 to 24 Years | 18 (100.0%) | 0 (0.0%) |
| 25 to 29 Years | 0 (0.0%) | 0 (0.0%) |
| 30 to 34 Years | 26 (92.9%) | 3 (11.5%) |
| 35 to 44 Years | 7 (25.9%) | 1 (14.3%) |
| 45 to 54 Years | 23 (53.5%) | 0 (0.0%) |
| 55 to 59 Years | 24 (75.0%) | 0 (0.0%) |
| 60 to 64 Years | 34 (100.0%) | 0 (0.0%) |
| 65 to 74 Years | 57 (25.9%) | 4 (7.0%) |
| 75 Years and over | 37 (18.4%) | 0 (0.0%) |
| Total | 226 (37.1%) | 8 (3.5%) |
Employment Status by Educational Attainment in Suttons Bay
According to labor force statistics for Suttons Bay, 69.5% of individuals (114) out of the total population between 25 and 64 years of age (164) are in the labor force, with 3.5% or 4 of them being unemployed. The group with the highest labor force participation rate are those with the educational attainment of college / associate degree, with 100.0% or 31 individuals in the labor force. Within the labor force, individuals with college / associate degree education have the highest percentage of unemployment, with 9.7% or 3 of them being unemployed.
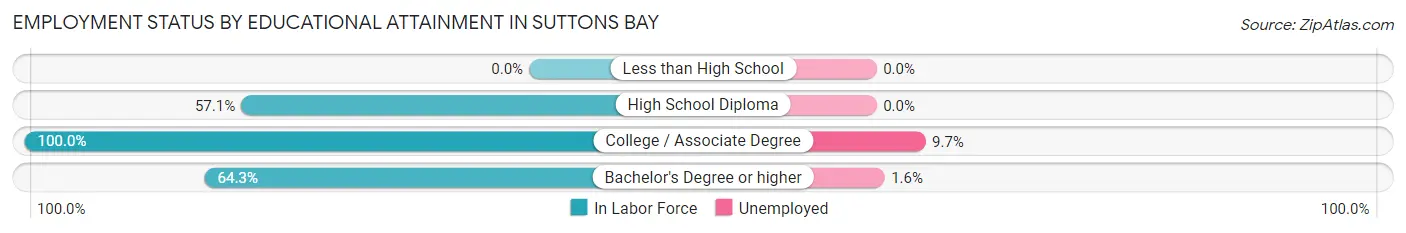
| Educational Attainment | In Labor Force | Unemployed |
| Less than High School | 0 (0.0%) | 0 (0.0%) |
| High School Diploma | 20 (57.1%) | 0 (0.0%) |
| College / Associate Degree | 31 (100.0%) | 3 (9.7%) |
| Bachelor's Degree or higher | 63 (64.3%) | 2 (1.6%) |
| Total | 114 (69.5%) | 6 (3.5%) |
Employment Occupations by Sex in Suttons Bay
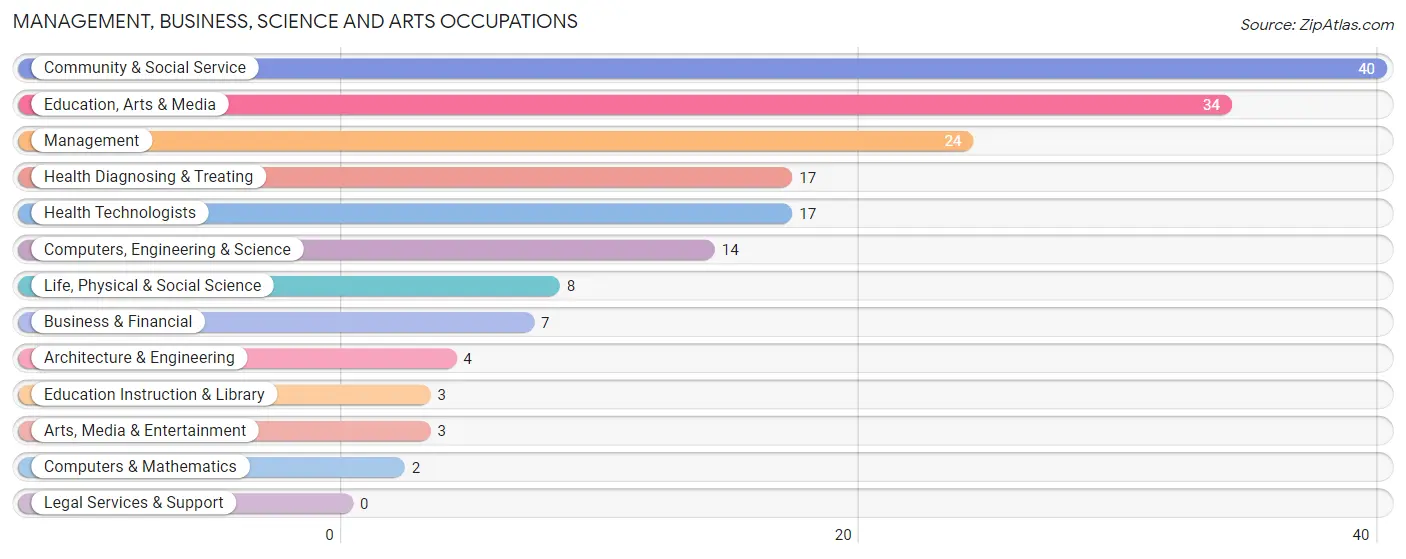
Management, Business, Science and Arts Occupations
The most common Management, Business, Science and Arts occupations in Suttons Bay are Community & Social Service (40 | 18.3%), Education, Arts & Media (34 | 15.6%), Management (24 | 11.0%), Health Diagnosing & Treating (17 | 7.8%), and Health Technologists (17 | 7.8%).
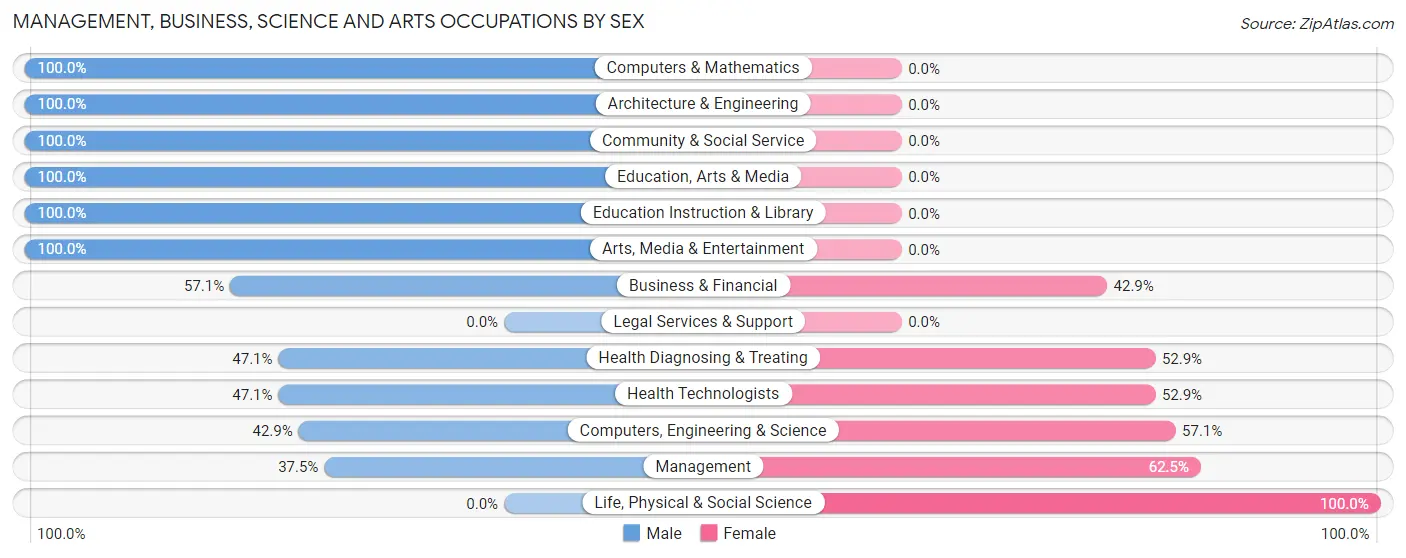
Management, Business, Science and Arts Occupations by Sex
Within the Management, Business, Science and Arts occupations in Suttons Bay, the most male-oriented occupations are Computers & Mathematics (100.0%), Architecture & Engineering (100.0%), and Community & Social Service (100.0%), while the most female-oriented occupations are Life, Physical & Social Science (100.0%), Management (62.5%), and Computers, Engineering & Science (57.1%).
| Occupation | Male | Female |
| Management | 9 (37.5%) | 15 (62.5%) |
| Business & Financial | 4 (57.1%) | 3 (42.9%) |
| Computers, Engineering & Science | 6 (42.9%) | 8 (57.1%) |
| Computers & Mathematics | 2 (100.0%) | 0 (0.0%) |
| Architecture & Engineering | 4 (100.0%) | 0 (0.0%) |
| Life, Physical & Social Science | 0 (0.0%) | 8 (100.0%) |
| Community & Social Service | 40 (100.0%) | 0 (0.0%) |
| Education, Arts & Media | 34 (100.0%) | 0 (0.0%) |
| Legal Services & Support | 0 (0.0%) | 0 (0.0%) |
| Education Instruction & Library | 3 (100.0%) | 0 (0.0%) |
| Arts, Media & Entertainment | 3 (100.0%) | 0 (0.0%) |
| Health Diagnosing & Treating | 8 (47.1%) | 9 (52.9%) |
| Health Technologists | 8 (47.1%) | 9 (52.9%) |
| Total (Category) | 67 (65.7%) | 35 (34.3%) |
| Total (Overall) | 139 (63.8%) | 79 (36.2%) |
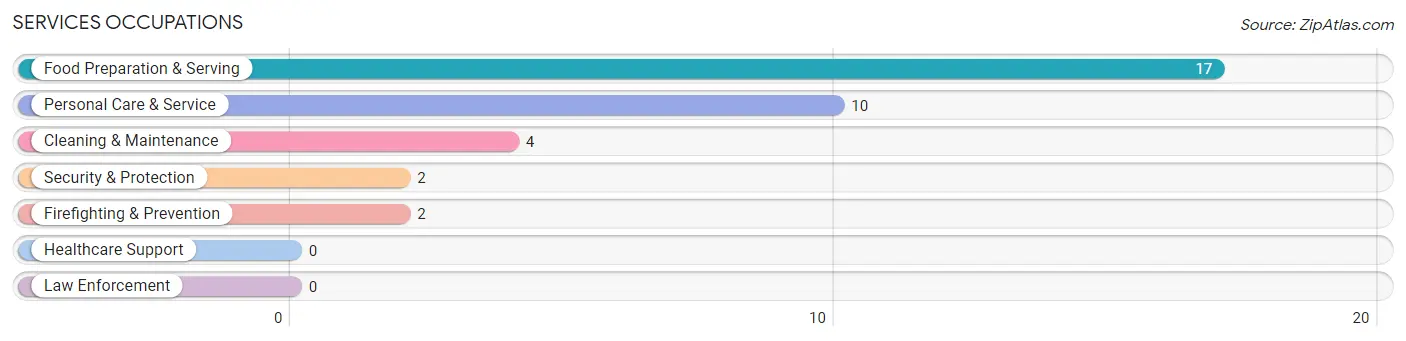
Services Occupations
The most common Services occupations in Suttons Bay are Food Preparation & Serving (17 | 7.8%), Personal Care & Service (10 | 4.6%), Cleaning & Maintenance (4 | 1.8%), Security & Protection (2 | 0.9%), and Firefighting & Prevention (2 | 0.9%).
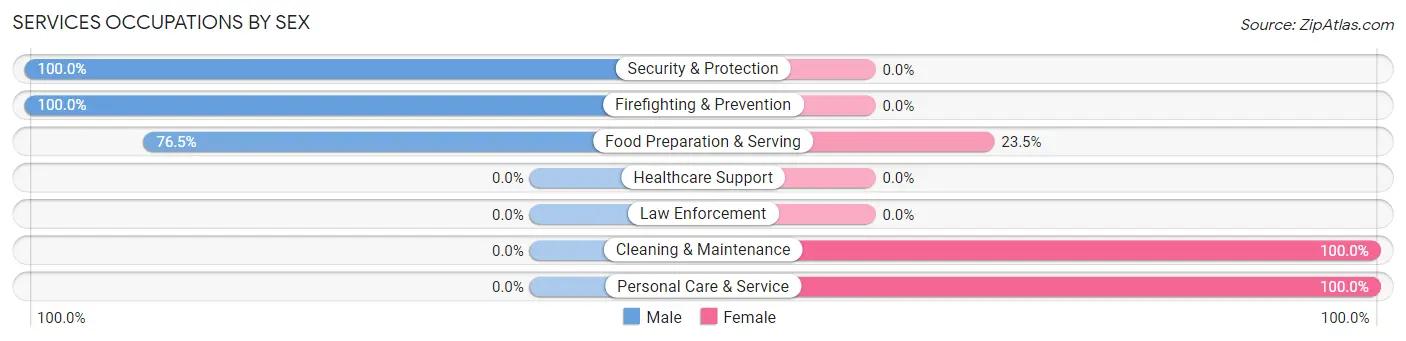
Services Occupations by Sex
Within the Services occupations in Suttons Bay, the most male-oriented occupations are Security & Protection (100.0%), Firefighting & Prevention (100.0%), and Food Preparation & Serving (76.5%), while the most female-oriented occupations are Cleaning & Maintenance (100.0%), Personal Care & Service (100.0%), and Food Preparation & Serving (23.5%).
| Occupation | Male | Female |
| Healthcare Support | 0 (0.0%) | 0 (0.0%) |
| Security & Protection | 2 (100.0%) | 0 (0.0%) |
| Firefighting & Prevention | 2 (100.0%) | 0 (0.0%) |
| Law Enforcement | 0 (0.0%) | 0 (0.0%) |
| Food Preparation & Serving | 13 (76.5%) | 4 (23.5%) |
| Cleaning & Maintenance | 0 (0.0%) | 4 (100.0%) |
| Personal Care & Service | 0 (0.0%) | 10 (100.0%) |
| Total (Category) | 15 (45.5%) | 18 (54.5%) |
| Total (Overall) | 139 (63.8%) | 79 (36.2%) |
Sales and Office Occupations
The most common Sales and Office occupations in Suttons Bay are Sales & Related (42 | 19.3%), and Office & Administration (20 | 9.2%).
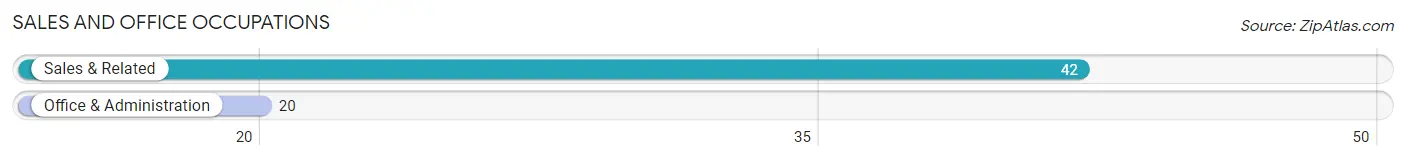
Sales and Office Occupations by Sex
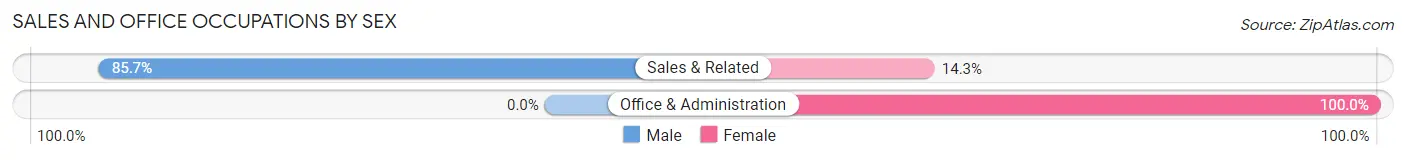
| Occupation | Male | Female |
| Sales & Related | 36 (85.7%) | 6 (14.3%) |
| Office & Administration | 0 (0.0%) | 20 (100.0%) |
| Total (Category) | 36 (58.1%) | 26 (41.9%) |
| Total (Overall) | 139 (63.8%) | 79 (36.2%) |
Natural Resources, Construction and Maintenance Occupations
The most common Natural Resources, Construction and Maintenance occupations in Suttons Bay are , and Farming, Fishing & Forestry (8 | 3.7%).
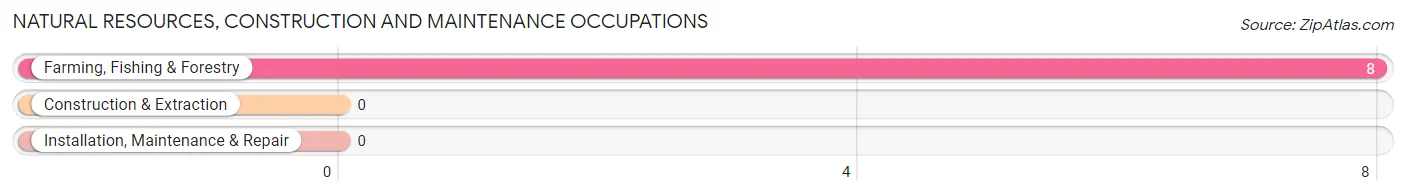
Natural Resources, Construction and Maintenance Occupations by Sex
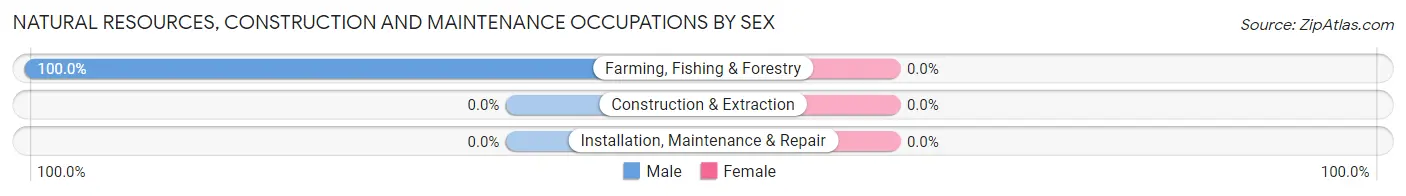
| Occupation | Male | Female |
| Farming, Fishing & Forestry | 8 (100.0%) | 0 (0.0%) |
| Construction & Extraction | 0 (0.0%) | 0 (0.0%) |
| Installation, Maintenance & Repair | 0 (0.0%) | 0 (0.0%) |
| Total (Category) | 8 (100.0%) | 0 (0.0%) |
| Total (Overall) | 139 (63.8%) | 79 (36.2%) |
Production, Transportation and Moving Occupations
The most common Production, Transportation and Moving occupations in Suttons Bay are Production (10 | 4.6%), and Transportation (3 | 1.4%).
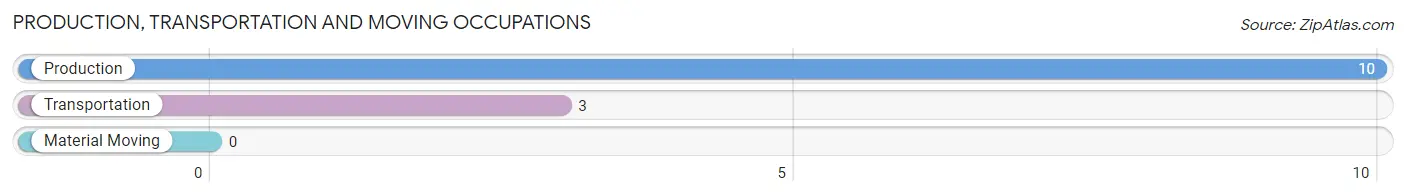
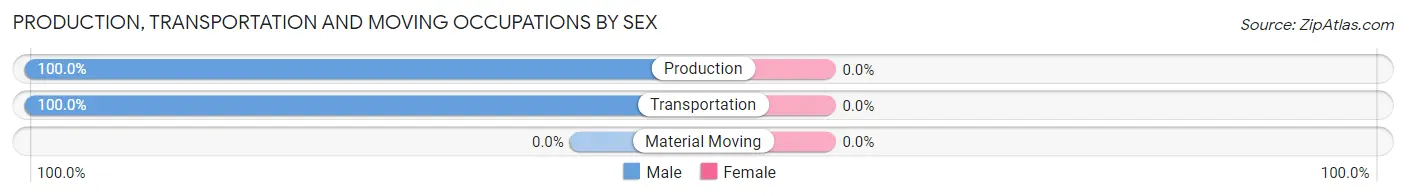
Production, Transportation and Moving Occupations by Sex
| Occupation | Male | Female |
| Production | 10 (100.0%) | 0 (0.0%) |
| Transportation | 3 (100.0%) | 0 (0.0%) |
| Material Moving | 0 (0.0%) | 0 (0.0%) |
| Total (Category) | 13 (100.0%) | 0 (0.0%) |
| Total (Overall) | 139 (63.8%) | 79 (36.2%) |
Employment Industries by Sex in Suttons Bay
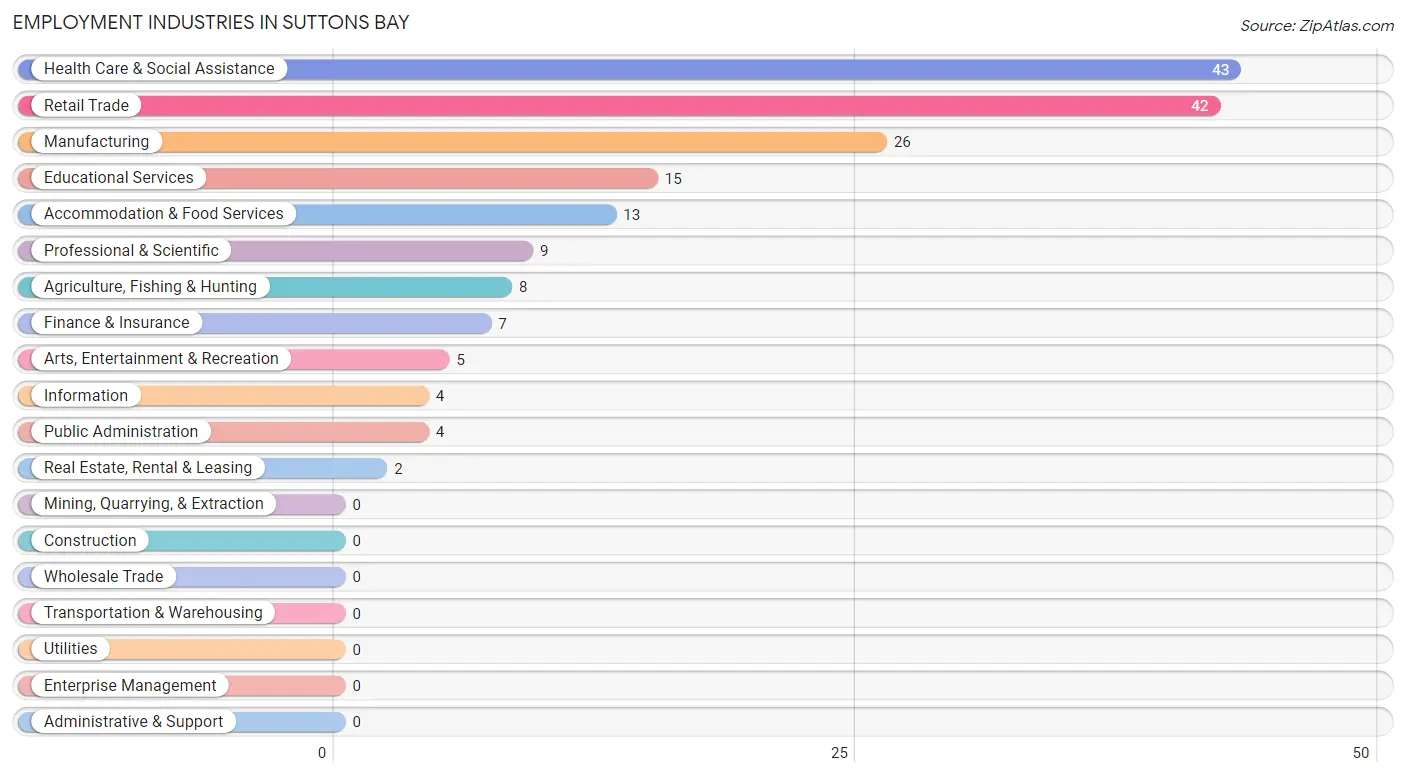
Employment Industries in Suttons Bay
The major employment industries in Suttons Bay include Health Care & Social Assistance (43 | 19.7%), Retail Trade (42 | 19.3%), Manufacturing (26 | 11.9%), Educational Services (15 | 6.9%), and Accommodation & Food Services (13 | 6.0%).
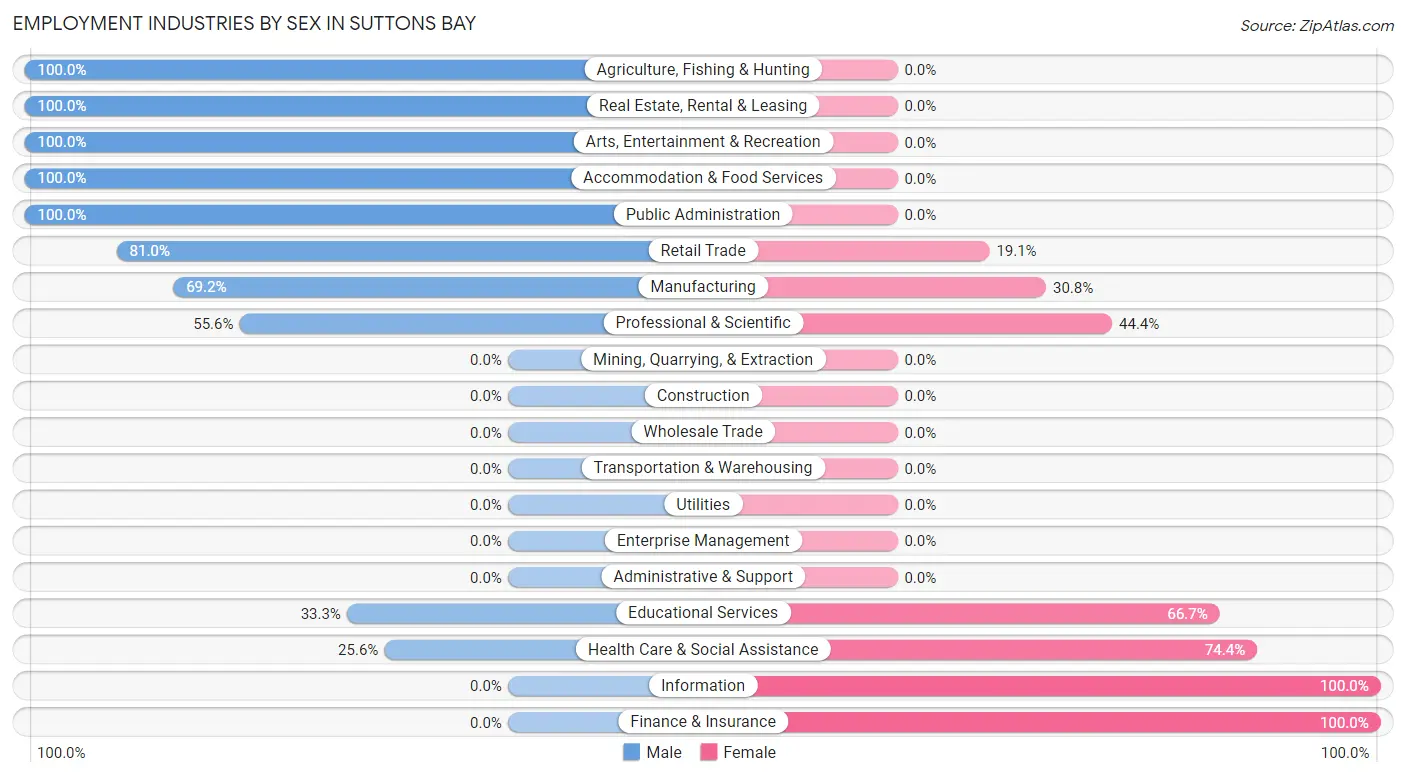
Employment Industries by Sex in Suttons Bay
The Suttons Bay industries that see more men than women are Agriculture, Fishing & Hunting (100.0%), Real Estate, Rental & Leasing (100.0%), and Arts, Entertainment & Recreation (100.0%), whereas the industries that tend to have a higher number of women are Information (100.0%), Finance & Insurance (100.0%), and Health Care & Social Assistance (74.4%).
| Industry | Male | Female |
| Agriculture, Fishing & Hunting | 8 (100.0%) | 0 (0.0%) |
| Mining, Quarrying, & Extraction | 0 (0.0%) | 0 (0.0%) |
| Construction | 0 (0.0%) | 0 (0.0%) |
| Manufacturing | 18 (69.2%) | 8 (30.8%) |
| Wholesale Trade | 0 (0.0%) | 0 (0.0%) |
| Retail Trade | 34 (80.9%) | 8 (19.1%) |
| Transportation & Warehousing | 0 (0.0%) | 0 (0.0%) |
| Utilities | 0 (0.0%) | 0 (0.0%) |
| Information | 0 (0.0%) | 4 (100.0%) |
| Finance & Insurance | 0 (0.0%) | 7 (100.0%) |
| Real Estate, Rental & Leasing | 2 (100.0%) | 0 (0.0%) |
| Professional & Scientific | 5 (55.6%) | 4 (44.4%) |
| Enterprise Management | 0 (0.0%) | 0 (0.0%) |
| Administrative & Support | 0 (0.0%) | 0 (0.0%) |
| Educational Services | 5 (33.3%) | 10 (66.7%) |
| Health Care & Social Assistance | 11 (25.6%) | 32 (74.4%) |
| Arts, Entertainment & Recreation | 5 (100.0%) | 0 (0.0%) |
| Accommodation & Food Services | 13 (100.0%) | 0 (0.0%) |
| Public Administration | 4 (100.0%) | 0 (0.0%) |
| Total | 139 (63.8%) | 79 (36.2%) |
Education in Suttons Bay
School Enrollment in Suttons Bay
The most common levels of schooling among the 42 students in Suttons Bay are high school (18 | 42.9%), elementary school (16 | 38.1%), and middle school (3 | 7.1%).
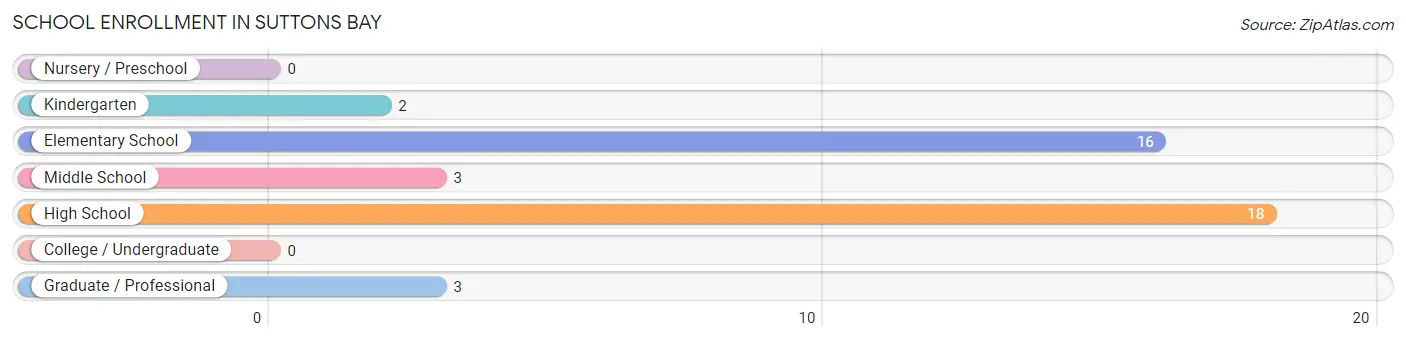
| School Level | # Students | % Students |
| Nursery / Preschool | 0 | 0.0% |
| Kindergarten | 2 | 4.8% |
| Elementary School | 16 | 38.1% |
| Middle School | 3 | 7.1% |
| High School | 18 | 42.9% |
| College / Undergraduate | 0 | 0.0% |
| Graduate / Professional | 3 | 7.1% |
| Total | 42 | 100.0% |
School Enrollment by Age by Funding Source in Suttons Bay
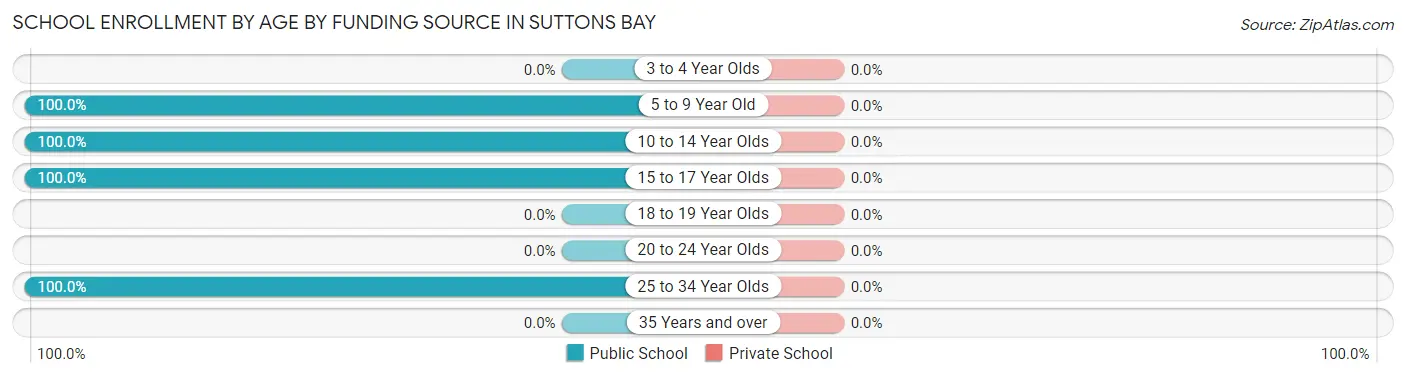
| Age Bracket | Public School | Private School |
| 3 to 4 Year Olds | 0 (0.0%) | 0 (0.0%) |
| 5 to 9 Year Old | 10 (100.0%) | 0 (0.0%) |
| 10 to 14 Year Olds | 11 (100.0%) | 0 (0.0%) |
| 15 to 17 Year Olds | 18 (100.0%) | 0 (0.0%) |
| 18 to 19 Year Olds | 0 (0.0%) | 0 (0.0%) |
| 20 to 24 Year Olds | 0 (0.0%) | 0 (0.0%) |
| 25 to 34 Year Olds | 3 (100.0%) | 0 (0.0%) |
| 35 Years and over | 0 (0.0%) | 0 (0.0%) |
| Total | 42 (100.0%) | 0 (0.0%) |
Educational Attainment by Field of Study in Suttons Bay
Education (139 | 33.6%), business (48 | 11.6%), social sciences (42 | 10.1%), science & technology (37 | 8.9%), and liberal arts & history (34 | 8.2%) are the most common fields of study among 414 individuals in Suttons Bay who have obtained a bachelor's degree or higher.
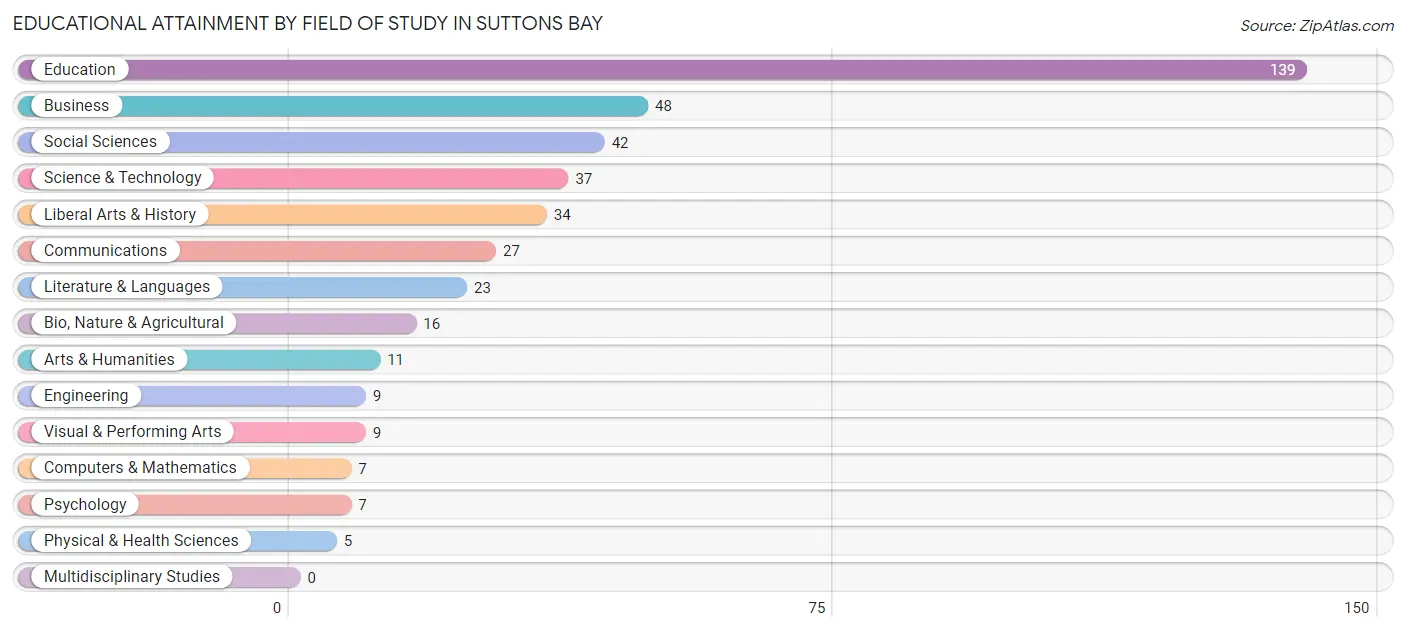
| Field of Study | # Graduates | % Graduates |
| Computers & Mathematics | 7 | 1.7% |
| Bio, Nature & Agricultural | 16 | 3.9% |
| Physical & Health Sciences | 5 | 1.2% |
| Psychology | 7 | 1.7% |
| Social Sciences | 42 | 10.1% |
| Engineering | 9 | 2.2% |
| Multidisciplinary Studies | 0 | 0.0% |
| Science & Technology | 37 | 8.9% |
| Business | 48 | 11.6% |
| Education | 139 | 33.6% |
| Literature & Languages | 23 | 5.6% |
| Liberal Arts & History | 34 | 8.2% |
| Visual & Performing Arts | 9 | 2.2% |
| Communications | 27 | 6.5% |
| Arts & Humanities | 11 | 2.7% |
| Total | 414 | 100.0% |
Transportation & Commute in Suttons Bay
Vehicle Availability by Sex in Suttons Bay
The most prevalent vehicle ownership categories in Suttons Bay are males with 1 vehicle (78, accounting for 56.1%) and females with 1 vehicle (18, making up 98.7%).
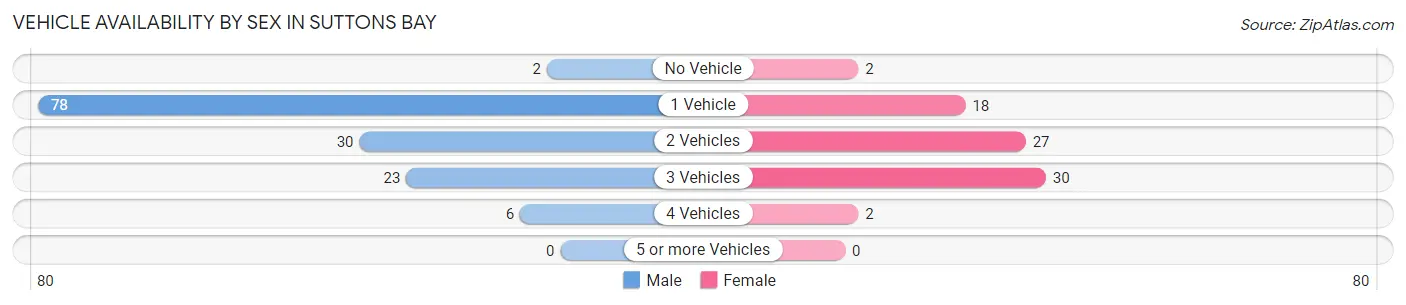
| Vehicles Available | Male | Female |
| No Vehicle | 2 (1.4%) | 2 (2.5%) |
| 1 Vehicle | 78 (56.1%) | 18 (22.8%) |
| 2 Vehicles | 30 (21.6%) | 27 (34.2%) |
| 3 Vehicles | 23 (16.6%) | 30 (38.0%) |
| 4 Vehicles | 6 (4.3%) | 2 (2.5%) |
| 5 or more Vehicles | 0 (0.0%) | 0 (0.0%) |
| Total | 139 (100.0%) | 79 (100.0%) |
Commute Time in Suttons Bay
The most frequently occuring commute durations in Suttons Bay are 10 to 14 minutes (47 commuters, 29.2%), 5 to 9 minutes (34 commuters, 21.1%), and less than 5 minutes (28 commuters, 17.4%).
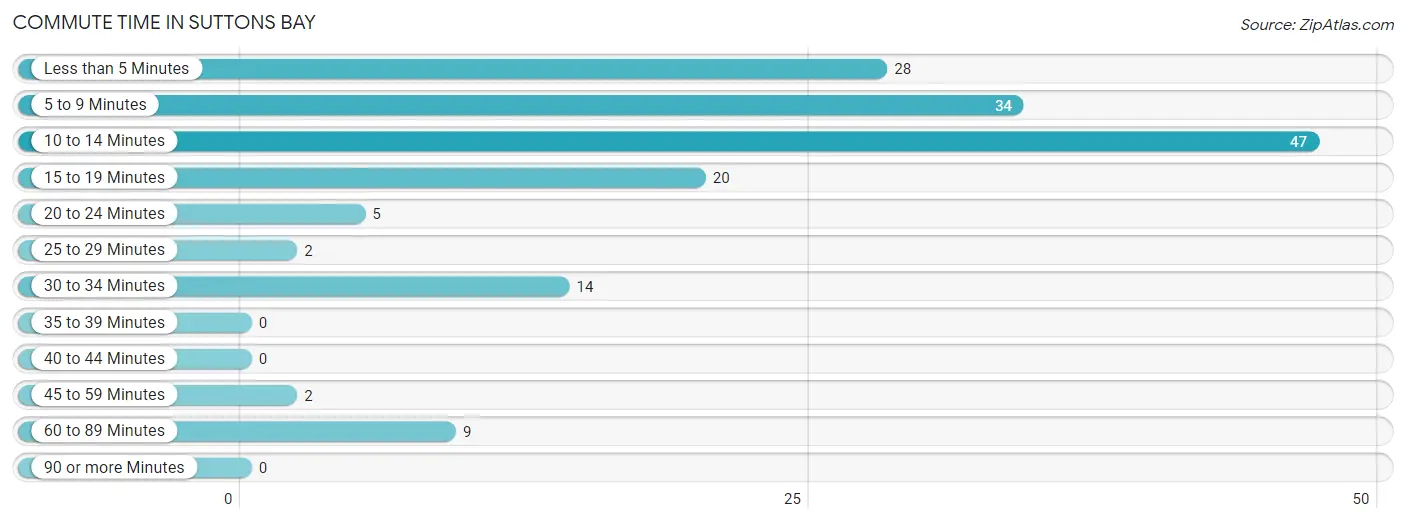
| Commute Time | # Commuters | % Commuters |
| Less than 5 Minutes | 28 | 17.4% |
| 5 to 9 Minutes | 34 | 21.1% |
| 10 to 14 Minutes | 47 | 29.2% |
| 15 to 19 Minutes | 20 | 12.4% |
| 20 to 24 Minutes | 5 | 3.1% |
| 25 to 29 Minutes | 2 | 1.2% |
| 30 to 34 Minutes | 14 | 8.7% |
| 35 to 39 Minutes | 0 | 0.0% |
| 40 to 44 Minutes | 0 | 0.0% |
| 45 to 59 Minutes | 2 | 1.2% |
| 60 to 89 Minutes | 9 | 5.6% |
| 90 or more Minutes | 0 | 0.0% |
Commute Time by Sex in Suttons Bay
The most common commute times in Suttons Bay are 10 to 14 minutes (41 commuters, 41.4%) for males and 5 to 9 minutes (17 commuters, 27.4%) for females.
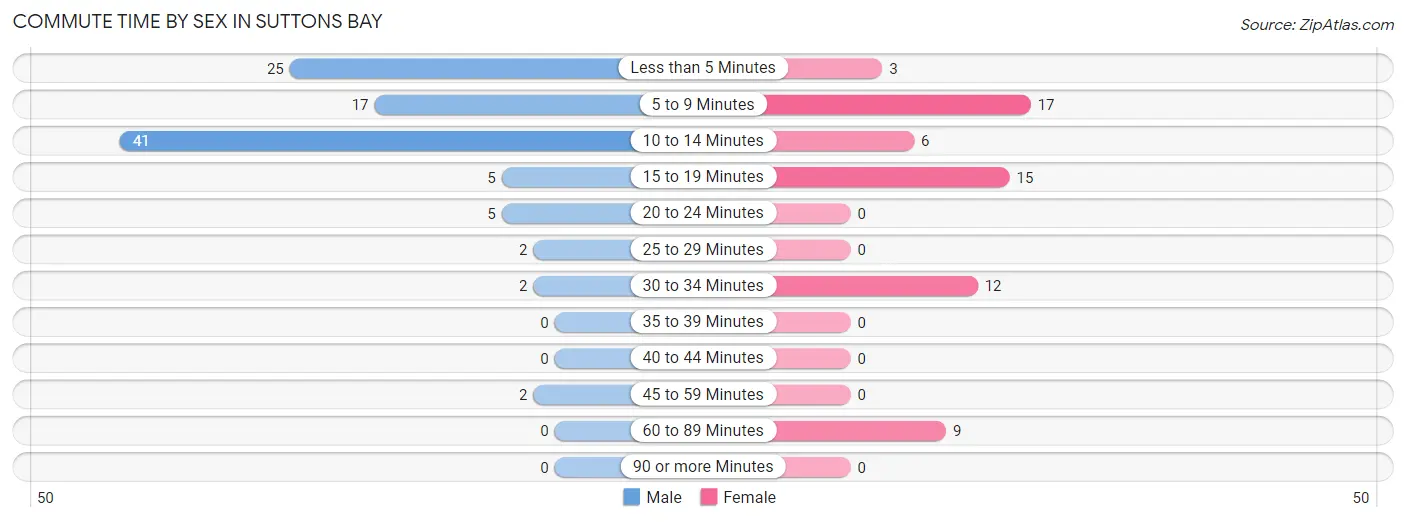
| Commute Time | Male | Female |
| Less than 5 Minutes | 25 (25.3%) | 3 (4.8%) |
| 5 to 9 Minutes | 17 (17.2%) | 17 (27.4%) |
| 10 to 14 Minutes | 41 (41.4%) | 6 (9.7%) |
| 15 to 19 Minutes | 5 (5.1%) | 15 (24.2%) |
| 20 to 24 Minutes | 5 (5.1%) | 0 (0.0%) |
| 25 to 29 Minutes | 2 (2.0%) | 0 (0.0%) |
| 30 to 34 Minutes | 2 (2.0%) | 12 (19.4%) |
| 35 to 39 Minutes | 0 (0.0%) | 0 (0.0%) |
| 40 to 44 Minutes | 0 (0.0%) | 0 (0.0%) |
| 45 to 59 Minutes | 2 (2.0%) | 0 (0.0%) |
| 60 to 89 Minutes | 0 (0.0%) | 9 (14.5%) |
| 90 or more Minutes | 0 (0.0%) | 0 (0.0%) |
Time of Departure to Work by Sex in Suttons Bay
The most frequent times of departure to work in Suttons Bay are 7:30 AM to 7:59 AM (39, 39.4%) for males and 7:00 AM to 7:29 AM (10, 16.1%) for females.
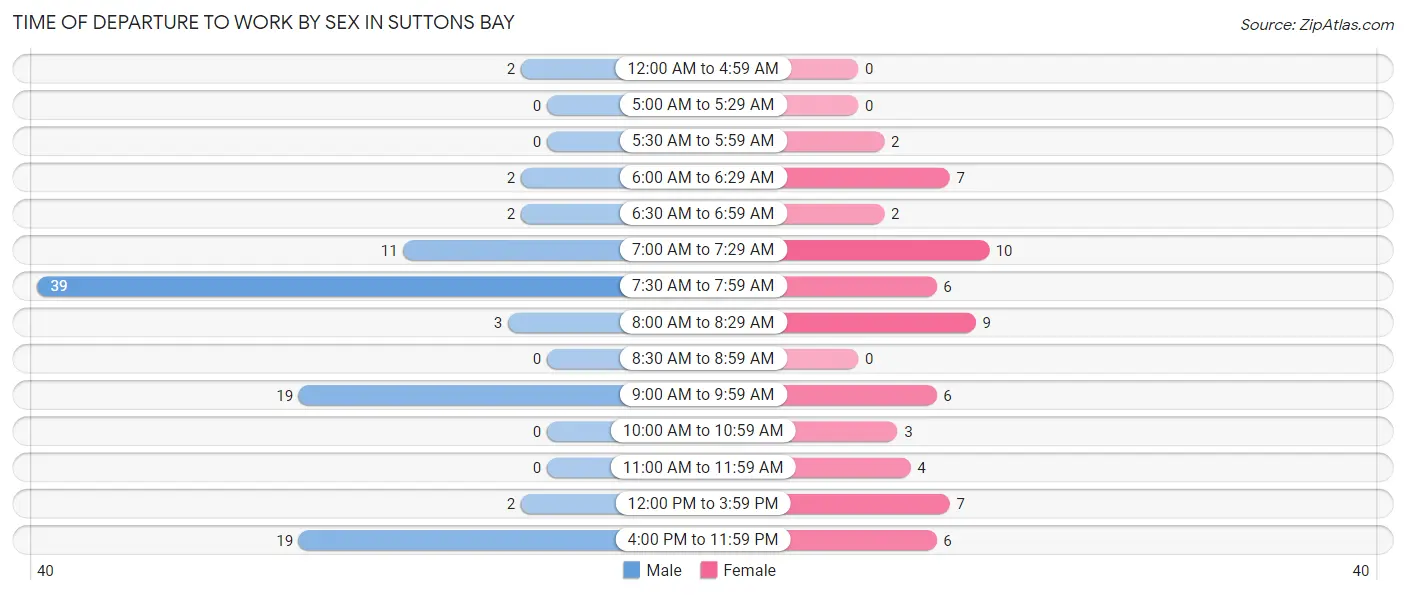
| Time of Departure | Male | Female |
| 12:00 AM to 4:59 AM | 2 (2.0%) | 0 (0.0%) |
| 5:00 AM to 5:29 AM | 0 (0.0%) | 0 (0.0%) |
| 5:30 AM to 5:59 AM | 0 (0.0%) | 2 (3.2%) |
| 6:00 AM to 6:29 AM | 2 (2.0%) | 7 (11.3%) |
| 6:30 AM to 6:59 AM | 2 (2.0%) | 2 (3.2%) |
| 7:00 AM to 7:29 AM | 11 (11.1%) | 10 (16.1%) |
| 7:30 AM to 7:59 AM | 39 (39.4%) | 6 (9.7%) |
| 8:00 AM to 8:29 AM | 3 (3.0%) | 9 (14.5%) |
| 8:30 AM to 8:59 AM | 0 (0.0%) | 0 (0.0%) |
| 9:00 AM to 9:59 AM | 19 (19.2%) | 6 (9.7%) |
| 10:00 AM to 10:59 AM | 0 (0.0%) | 3 (4.8%) |
| 11:00 AM to 11:59 AM | 0 (0.0%) | 4 (6.5%) |
| 12:00 PM to 3:59 PM | 2 (2.0%) | 7 (11.3%) |
| 4:00 PM to 11:59 PM | 19 (19.2%) | 6 (9.7%) |
| Total | 99 (100.0%) | 62 (100.0%) |
Housing Occupancy in Suttons Bay
Occupancy by Ownership in Suttons Bay
Of the total 308 dwellings in Suttons Bay, owner-occupied units account for 263 (85.4%), while renter-occupied units make up 45 (14.6%).
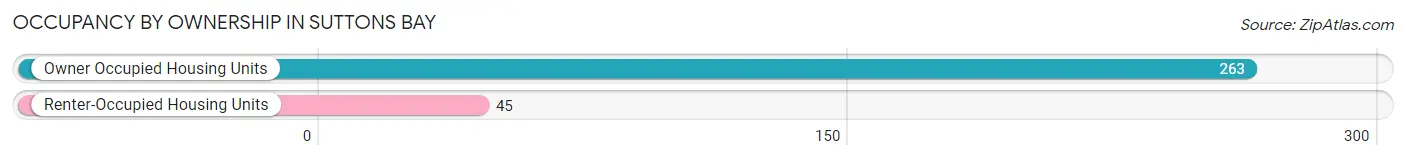
| Occupancy | # Housing Units | % Housing Units |
| Owner Occupied Housing Units | 263 | 85.4% |
| Renter-Occupied Housing Units | 45 | 14.6% |
| Total Occupied Housing Units | 308 | 100.0% |
Occupancy by Household Size in Suttons Bay
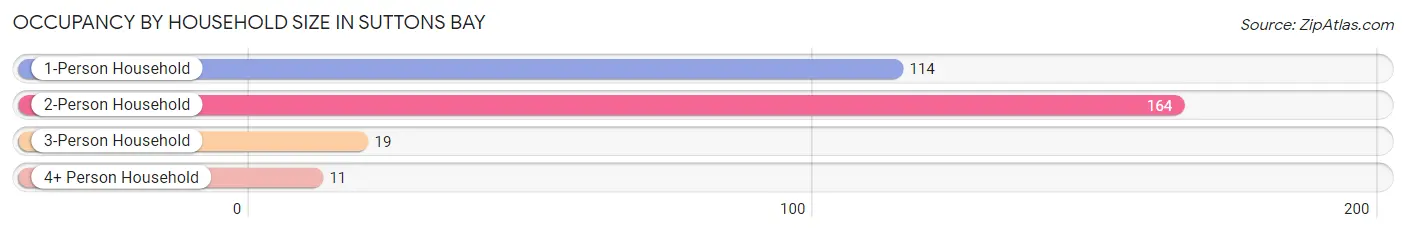
| Household Size | # Housing Units | % Housing Units |
| 1-Person Household | 114 | 37.0% |
| 2-Person Household | 164 | 53.2% |
| 3-Person Household | 19 | 6.2% |
| 4+ Person Household | 11 | 3.6% |
| Total Housing Units | 308 | 100.0% |
Occupancy by Ownership by Household Size in Suttons Bay
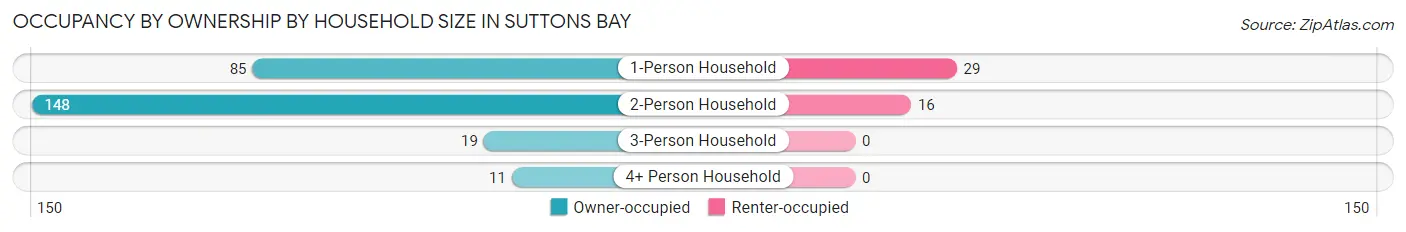
| Household Size | Owner-occupied | Renter-occupied |
| 1-Person Household | 85 (74.6%) | 29 (25.4%) |
| 2-Person Household | 148 (90.2%) | 16 (9.8%) |
| 3-Person Household | 19 (100.0%) | 0 (0.0%) |
| 4+ Person Household | 11 (100.0%) | 0 (0.0%) |
| Total Housing Units | 263 (85.4%) | 45 (14.6%) |
Occupancy by Educational Attainment in Suttons Bay
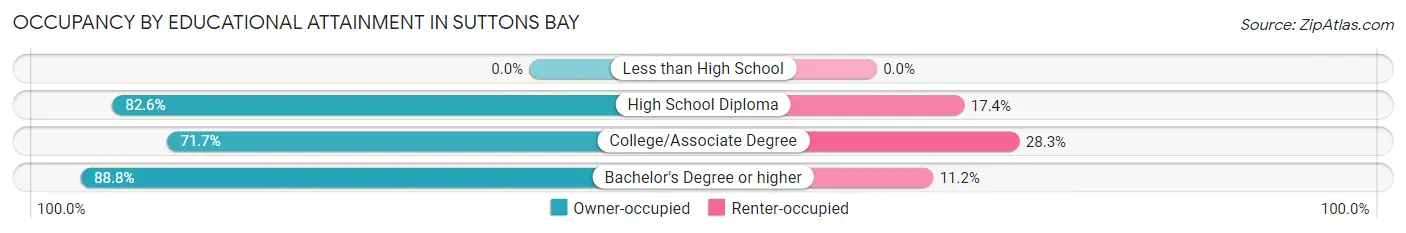
| Household Size | Owner-occupied | Renter-occupied |
| Less than High School | 0 (0.0%) | 0 (0.0%) |
| High School Diploma | 19 (82.6%) | 4 (17.4%) |
| College/Associate Degree | 38 (71.7%) | 15 (28.3%) |
| Bachelor's Degree or higher | 206 (88.8%) | 26 (11.2%) |
Occupancy by Age of Householder in Suttons Bay
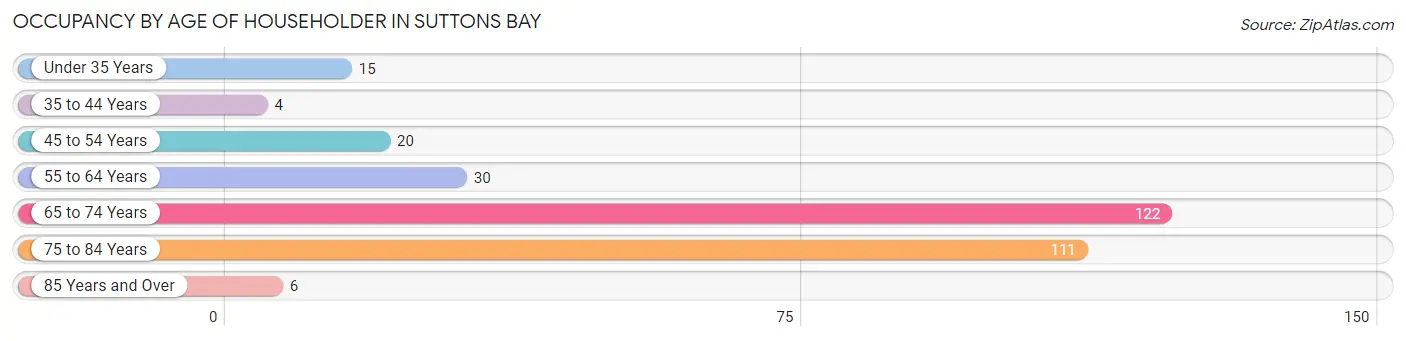
| Age Bracket | # Households | % Households |
| Under 35 Years | 15 | 4.9% |
| 35 to 44 Years | 4 | 1.3% |
| 45 to 54 Years | 20 | 6.5% |
| 55 to 64 Years | 30 | 9.7% |
| 65 to 74 Years | 122 | 39.6% |
| 75 to 84 Years | 111 | 36.0% |
| 85 Years and Over | 6 | 1.9% |
| Total | 308 | 100.0% |
Housing Finances in Suttons Bay
Median Income by Occupancy in Suttons Bay
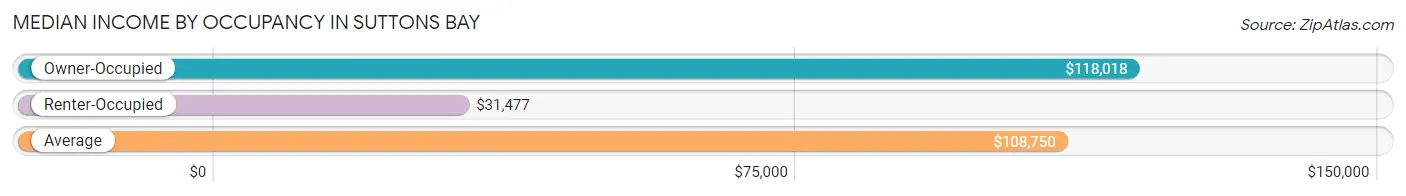
| Occupancy Type | # Households | Median Income |
| Owner-Occupied | 263 (85.4%) | $118,018 |
| Renter-Occupied | 45 (14.6%) | $31,477 |
| Average | 308 (100.0%) | $108,750 |
Occupancy by Householder Income Bracket in Suttons Bay
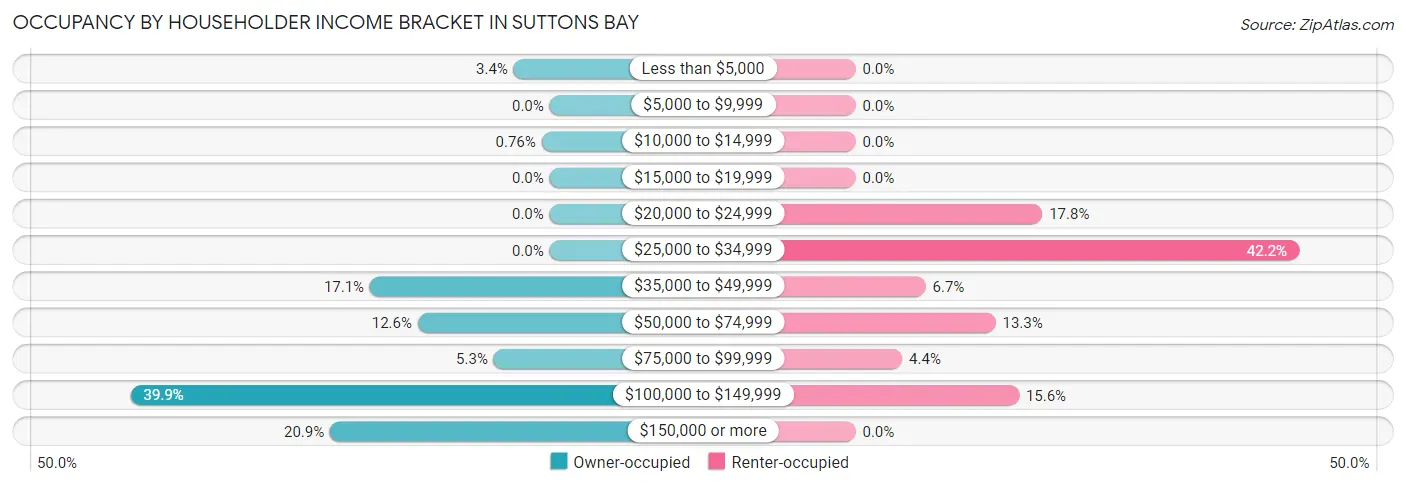
| Income Bracket | Owner-occupied | Renter-occupied |
| Less than $5,000 | 9 (3.4%) | 0 (0.0%) |
| $5,000 to $9,999 | 0 (0.0%) | 0 (0.0%) |
| $10,000 to $14,999 | 2 (0.8%) | 0 (0.0%) |
| $15,000 to $19,999 | 0 (0.0%) | 0 (0.0%) |
| $20,000 to $24,999 | 0 (0.0%) | 8 (17.8%) |
| $25,000 to $34,999 | 0 (0.0%) | 19 (42.2%) |
| $35,000 to $49,999 | 45 (17.1%) | 3 (6.7%) |
| $50,000 to $74,999 | 33 (12.6%) | 6 (13.3%) |
| $75,000 to $99,999 | 14 (5.3%) | 2 (4.4%) |
| $100,000 to $149,999 | 105 (39.9%) | 7 (15.6%) |
| $150,000 or more | 55 (20.9%) | 0 (0.0%) |
| Total | 263 (100.0%) | 45 (100.0%) |
Monthly Housing Cost Tiers in Suttons Bay
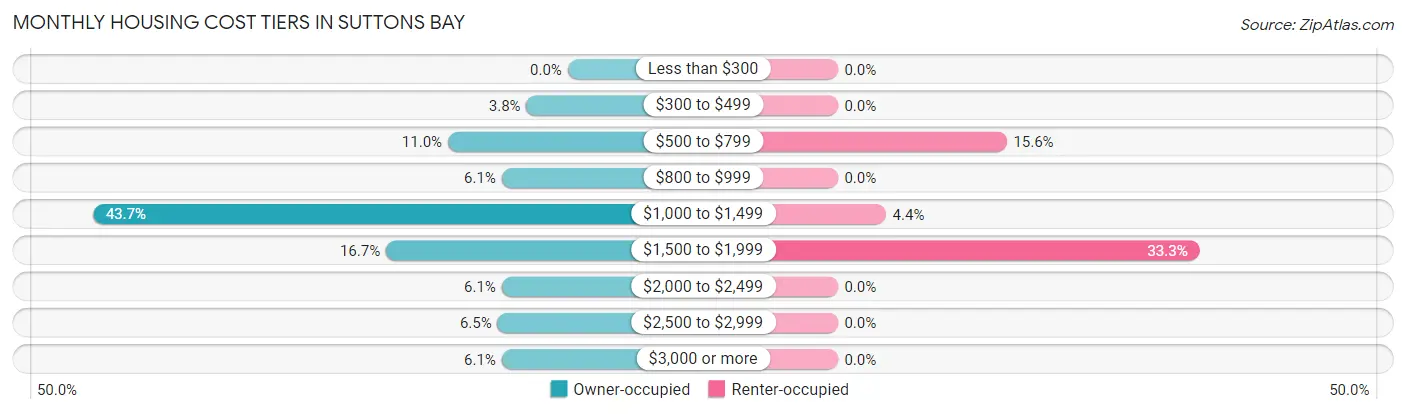
| Monthly Cost | Owner-occupied | Renter-occupied |
| Less than $300 | 0 (0.0%) | 0 (0.0%) |
| $300 to $499 | 10 (3.8%) | 0 (0.0%) |
| $500 to $799 | 29 (11.0%) | 7 (15.6%) |
| $800 to $999 | 16 (6.1%) | 0 (0.0%) |
| $1,000 to $1,499 | 115 (43.7%) | 2 (4.4%) |
| $1,500 to $1,999 | 44 (16.7%) | 15 (33.3%) |
| $2,000 to $2,499 | 16 (6.1%) | 0 (0.0%) |
| $2,500 to $2,999 | 17 (6.5%) | 0 (0.0%) |
| $3,000 or more | 16 (6.1%) | 0 (0.0%) |
| Total | 263 (100.0%) | 45 (100.0%) |
Physical Housing Characteristics in Suttons Bay
Housing Structures in Suttons Bay
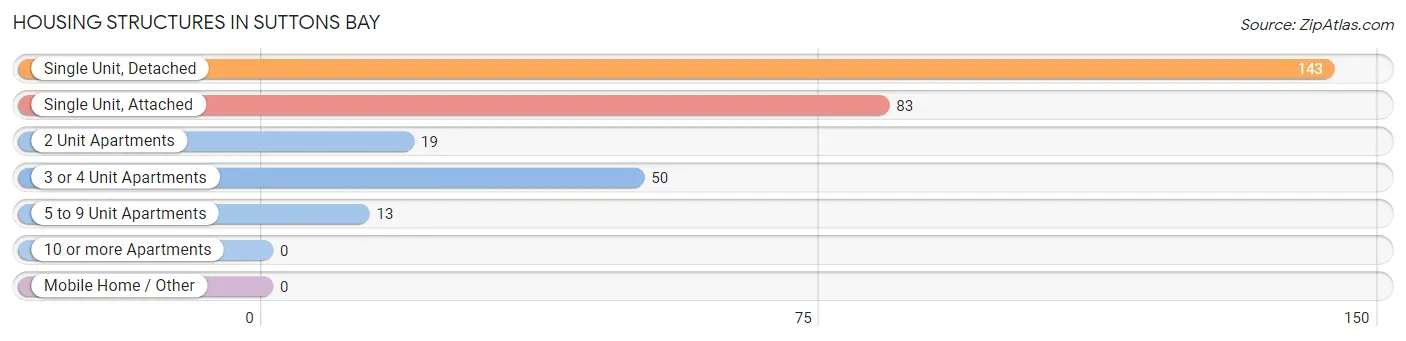
| Structure Type | # Housing Units | % Housing Units |
| Single Unit, Detached | 143 | 46.4% |
| Single Unit, Attached | 83 | 27.0% |
| 2 Unit Apartments | 19 | 6.2% |
| 3 or 4 Unit Apartments | 50 | 16.2% |
| 5 to 9 Unit Apartments | 13 | 4.2% |
| 10 or more Apartments | 0 | 0.0% |
| Mobile Home / Other | 0 | 0.0% |
| Total | 308 | 100.0% |
Housing Structures by Occupancy in Suttons Bay
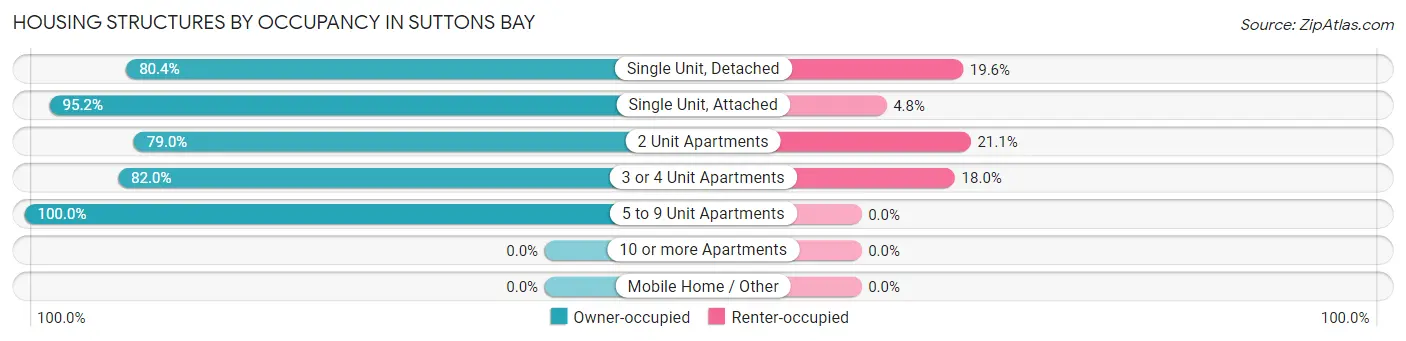
| Structure Type | Owner-occupied | Renter-occupied |
| Single Unit, Detached | 115 (80.4%) | 28 (19.6%) |
| Single Unit, Attached | 79 (95.2%) | 4 (4.8%) |
| 2 Unit Apartments | 15 (78.9%) | 4 (21.0%) |
| 3 or 4 Unit Apartments | 41 (82.0%) | 9 (18.0%) |
| 5 to 9 Unit Apartments | 13 (100.0%) | 0 (0.0%) |
| 10 or more Apartments | 0 (0.0%) | 0 (0.0%) |
| Mobile Home / Other | 0 (0.0%) | 0 (0.0%) |
| Total | 263 (85.4%) | 45 (14.6%) |
Housing Structures by Number of Rooms in Suttons Bay
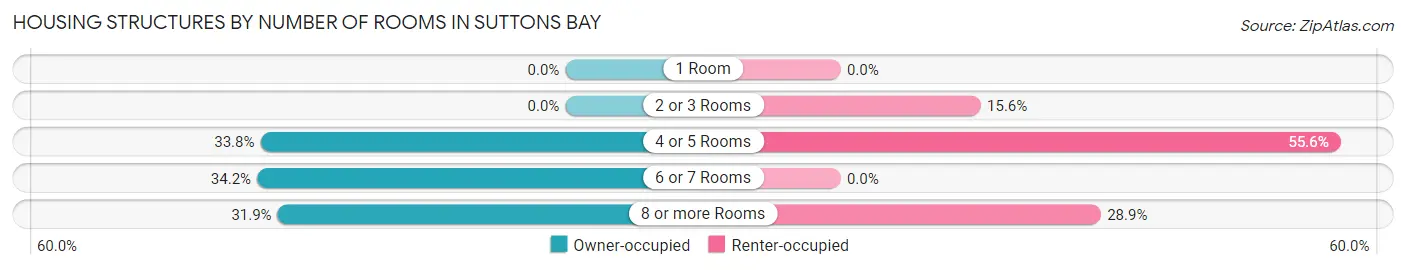
| Number of Rooms | Owner-occupied | Renter-occupied |
| 1 Room | 0 (0.0%) | 0 (0.0%) |
| 2 or 3 Rooms | 0 (0.0%) | 7 (15.6%) |
| 4 or 5 Rooms | 89 (33.8%) | 25 (55.6%) |
| 6 or 7 Rooms | 90 (34.2%) | 0 (0.0%) |
| 8 or more Rooms | 84 (31.9%) | 13 (28.9%) |
| Total | 263 (100.0%) | 45 (100.0%) |
Housing Structure by Heating Type in Suttons Bay
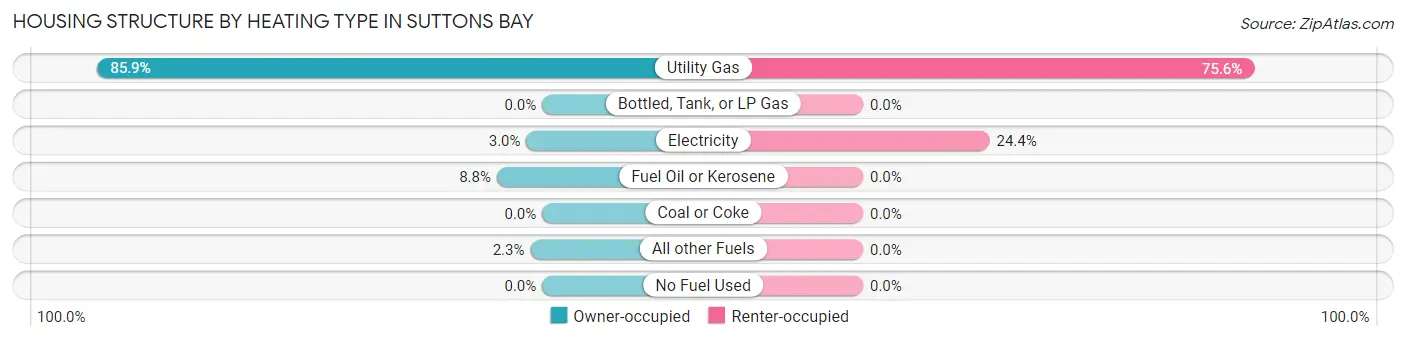
| Heating Type | Owner-occupied | Renter-occupied |
| Utility Gas | 226 (85.9%) | 34 (75.6%) |
| Bottled, Tank, or LP Gas | 0 (0.0%) | 0 (0.0%) |
| Electricity | 8 (3.0%) | 11 (24.4%) |
| Fuel Oil or Kerosene | 23 (8.7%) | 0 (0.0%) |
| Coal or Coke | 0 (0.0%) | 0 (0.0%) |
| All other Fuels | 6 (2.3%) | 0 (0.0%) |
| No Fuel Used | 0 (0.0%) | 0 (0.0%) |
| Total | 263 (100.0%) | 45 (100.0%) |
Household Vehicle Usage in Suttons Bay
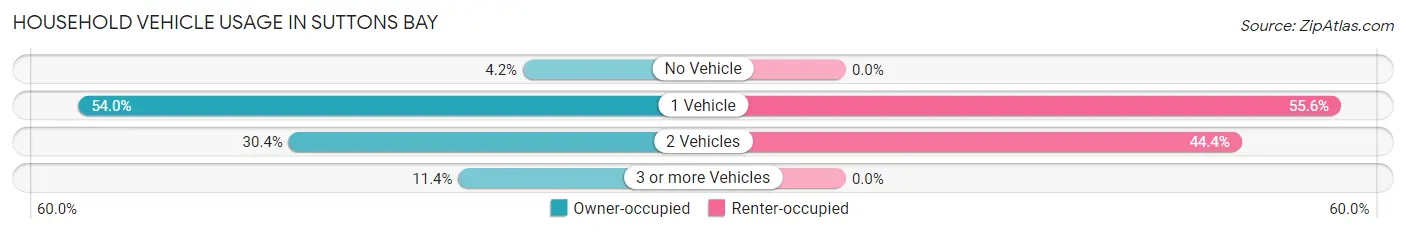
| Vehicles per Household | Owner-occupied | Renter-occupied |
| No Vehicle | 11 (4.2%) | 0 (0.0%) |
| 1 Vehicle | 142 (54.0%) | 25 (55.6%) |
| 2 Vehicles | 80 (30.4%) | 20 (44.4%) |
| 3 or more Vehicles | 30 (11.4%) | 0 (0.0%) |
| Total | 263 (100.0%) | 45 (100.0%) |
Real Estate & Mortgages in Suttons Bay
Real Estate and Mortgage Overview in Suttons Bay
| Characteristic | Without Mortgage | With Mortgage |
| Housing Units | 170 | 93 |
| Median Property Value | $393,800 | $528,100 |
| Median Household Income | $118,846 | $15 |
| Monthly Housing Costs | $1,197 | $16 |
| Real Estate Taxes | $3,703 | $0 |
Property Value by Mortgage Status in Suttons Bay
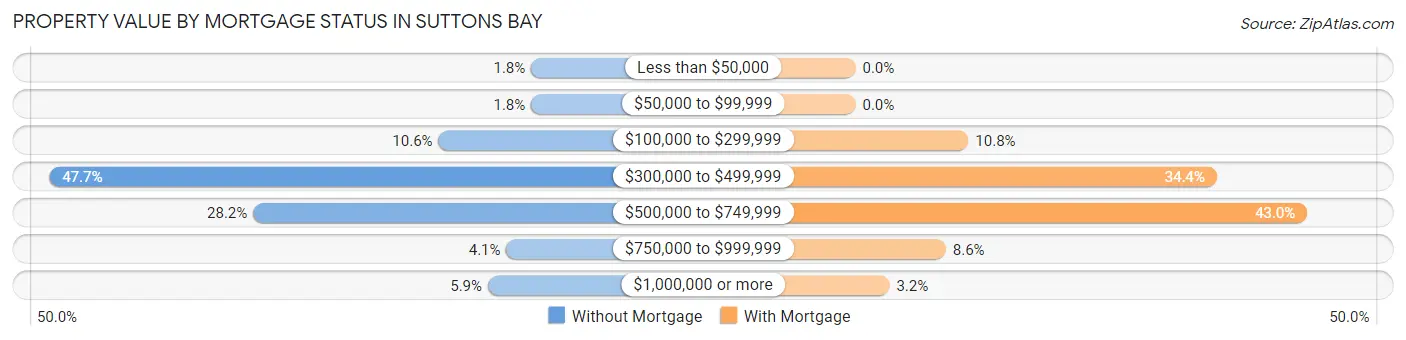
| Property Value | Without Mortgage | With Mortgage |
| Less than $50,000 | 3 (1.8%) | 0 (0.0%) |
| $50,000 to $99,999 | 3 (1.8%) | 0 (0.0%) |
| $100,000 to $299,999 | 18 (10.6%) | 10 (10.7%) |
| $300,000 to $499,999 | 81 (47.6%) | 32 (34.4%) |
| $500,000 to $749,999 | 48 (28.2%) | 40 (43.0%) |
| $750,000 to $999,999 | 7 (4.1%) | 8 (8.6%) |
| $1,000,000 or more | 10 (5.9%) | 3 (3.2%) |
| Total | 170 (100.0%) | 93 (100.0%) |
Household Income by Mortgage Status in Suttons Bay
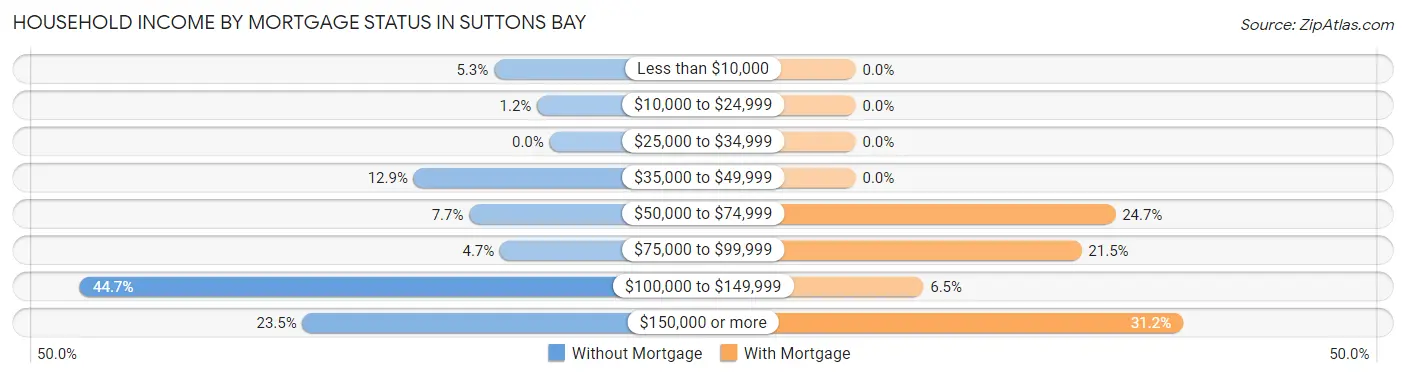
| Household Income | Without Mortgage | With Mortgage |
| Less than $10,000 | 9 (5.3%) | 0 (0.0%) |
| $10,000 to $24,999 | 2 (1.2%) | 0 (0.0%) |
| $25,000 to $34,999 | 0 (0.0%) | 0 (0.0%) |
| $35,000 to $49,999 | 22 (12.9%) | 0 (0.0%) |
| $50,000 to $74,999 | 13 (7.6%) | 23 (24.7%) |
| $75,000 to $99,999 | 8 (4.7%) | 20 (21.5%) |
| $100,000 to $149,999 | 76 (44.7%) | 6 (6.5%) |
| $150,000 or more | 40 (23.5%) | 29 (31.2%) |
| Total | 170 (100.0%) | 93 (100.0%) |
Property Value to Household Income Ratio in Suttons Bay
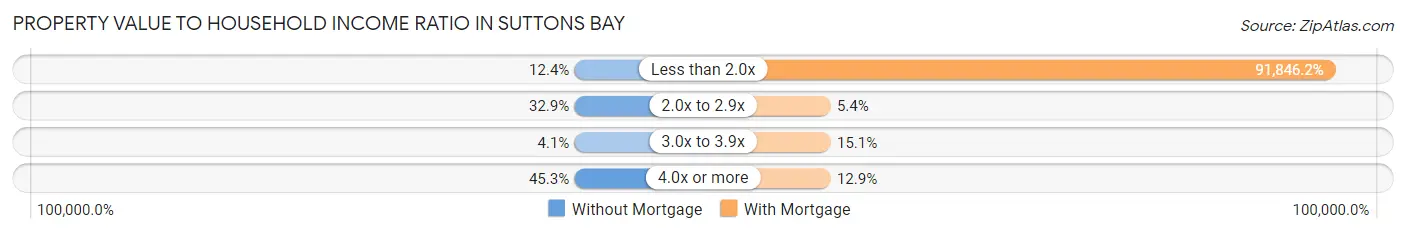
| Value-to-Income Ratio | Without Mortgage | With Mortgage |
| Less than 2.0x | 21 (12.3%) | 85,417 (91,846.2%) |
| 2.0x to 2.9x | 56 (32.9%) | 5 (5.4%) |
| 3.0x to 3.9x | 7 (4.1%) | 14 (15.0%) |
| 4.0x or more | 77 (45.3%) | 12 (12.9%) |
| Total | 170 (100.0%) | 93 (100.0%) |
Real Estate Taxes by Mortgage Status in Suttons Bay
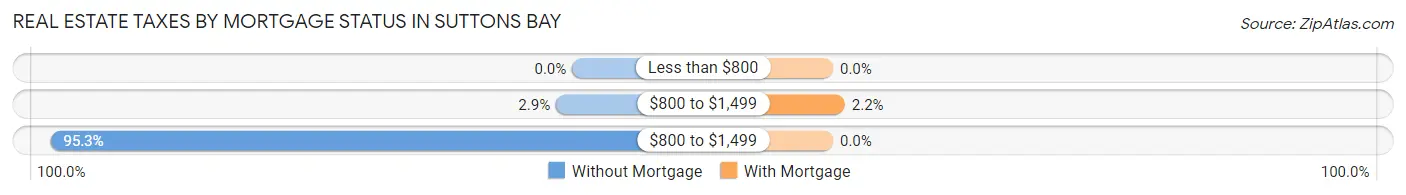
| Property Taxes | Without Mortgage | With Mortgage |
| Less than $800 | 0 (0.0%) | 0 (0.0%) |
| $800 to $1,499 | 5 (2.9%) | 2 (2.1%) |
| $800 to $1,499 | 162 (95.3%) | 0 (0.0%) |
| Total | 170 (100.0%) | 93 (100.0%) |
Health & Disability in Suttons Bay
Health Insurance Coverage by Age in Suttons Bay
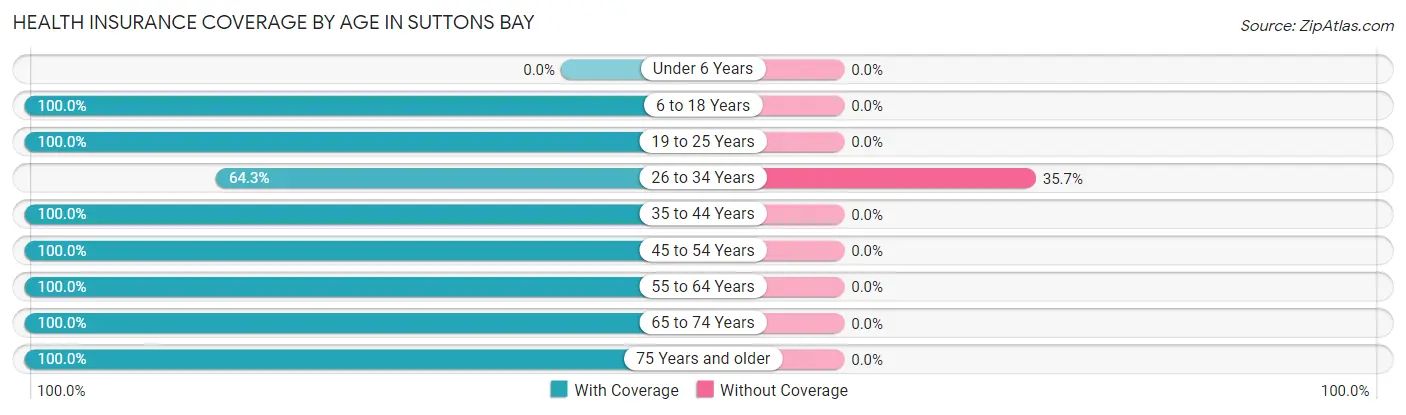
| Age Bracket | With Coverage | Without Coverage |
| Under 6 Years | 0 (0.0%) | 0 (0.0%) |
| 6 to 18 Years | 39 (100.0%) | 0 (0.0%) |
| 19 to 25 Years | 18 (100.0%) | 0 (0.0%) |
| 26 to 34 Years | 18 (64.3%) | 10 (35.7%) |
| 35 to 44 Years | 27 (100.0%) | 0 (0.0%) |
| 45 to 54 Years | 35 (100.0%) | 0 (0.0%) |
| 55 to 64 Years | 66 (100.0%) | 0 (0.0%) |
| 65 to 74 Years | 186 (100.0%) | 0 (0.0%) |
| 75 Years and older | 177 (100.0%) | 0 (0.0%) |
| Total | 566 (98.3%) | 10 (1.7%) |
Health Insurance Coverage by Citizenship Status in Suttons Bay
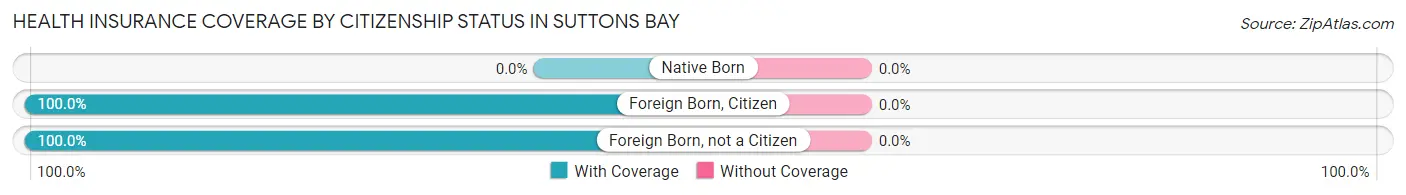
| Citizenship Status | With Coverage | Without Coverage |
| Native Born | 0 (0.0%) | 0 (0.0%) |
| Foreign Born, Citizen | 39 (100.0%) | 0 (0.0%) |
| Foreign Born, not a Citizen | 18 (100.0%) | 0 (0.0%) |
Health Insurance Coverage by Household Income in Suttons Bay
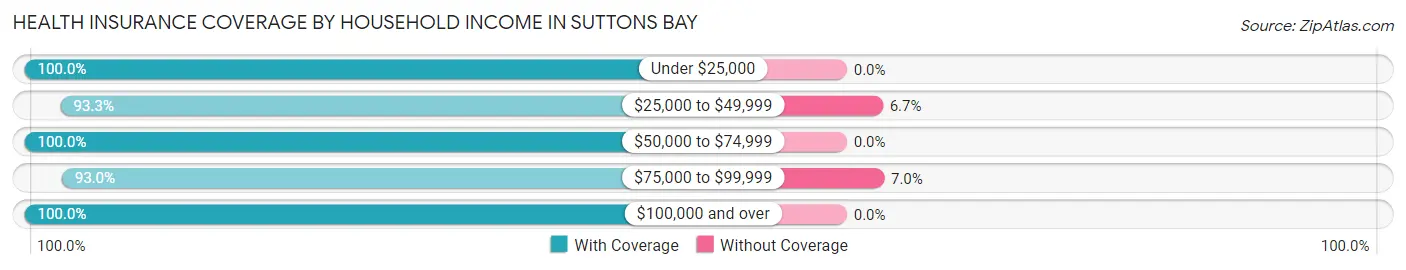
| Household Income | With Coverage | Without Coverage |
| Under $25,000 | 37 (100.0%) | 0 (0.0%) |
| $25,000 to $49,999 | 97 (93.3%) | 7 (6.7%) |
| $50,000 to $74,999 | 58 (100.0%) | 0 (0.0%) |
| $75,000 to $99,999 | 40 (93.0%) | 3 (7.0%) |
| $100,000 and over | 334 (100.0%) | 0 (0.0%) |
Public vs Private Health Insurance Coverage by Age in Suttons Bay
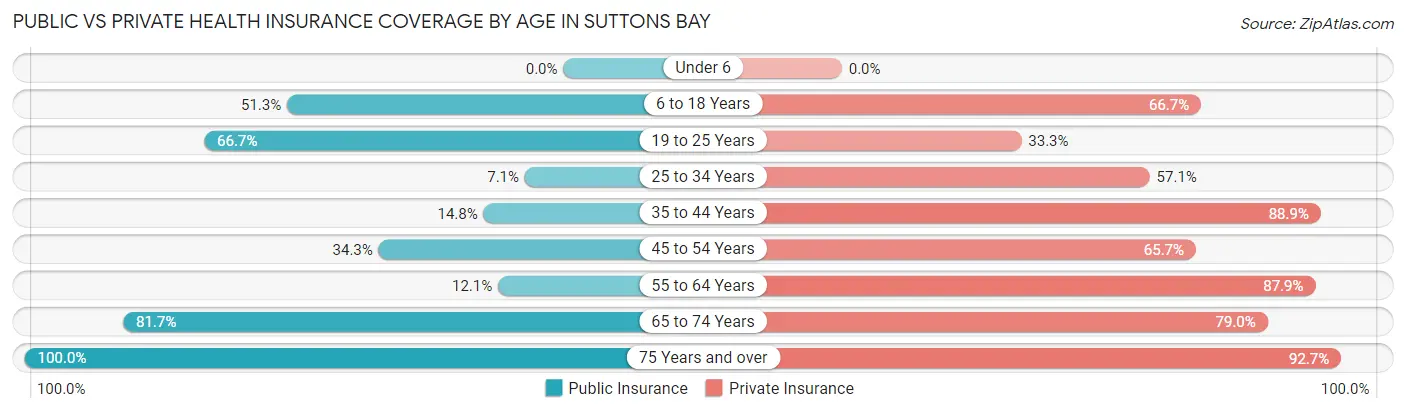
| Age Bracket | Public Insurance | Private Insurance |
| Under 6 | 0 (0.0%) | 0 (0.0%) |
| 6 to 18 Years | 20 (51.3%) | 26 (66.7%) |
| 19 to 25 Years | 12 (66.7%) | 6 (33.3%) |
| 25 to 34 Years | 2 (7.1%) | 16 (57.1%) |
| 35 to 44 Years | 4 (14.8%) | 24 (88.9%) |
| 45 to 54 Years | 12 (34.3%) | 23 (65.7%) |
| 55 to 64 Years | 8 (12.1%) | 58 (87.9%) |
| 65 to 74 Years | 152 (81.7%) | 147 (79.0%) |
| 75 Years and over | 177 (100.0%) | 164 (92.7%) |
| Total | 387 (67.2%) | 464 (80.6%) |
Disability Status by Sex by Age in Suttons Bay
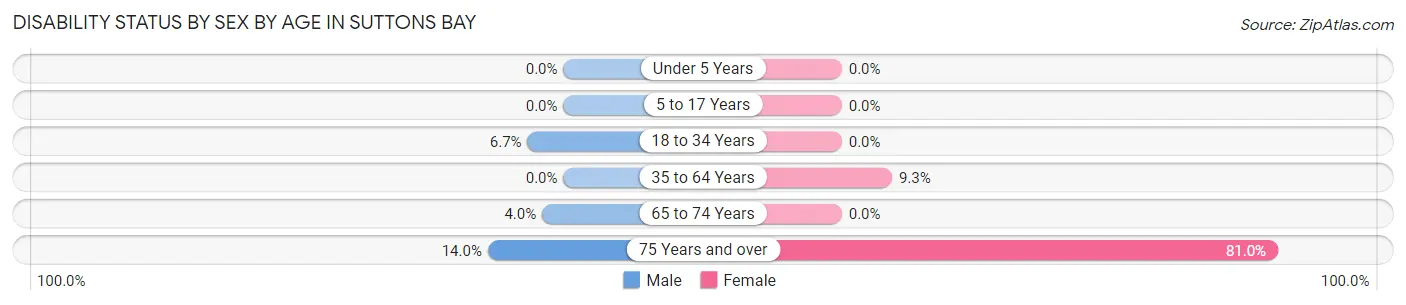
| Age Bracket | Male | Female |
| Under 5 Years | 0 (0.0%) | 0 (0.0%) |
| 5 to 17 Years | 0 (0.0%) | 0 (0.0%) |
| 18 to 34 Years | 2 (6.7%) | 0 (0.0%) |
| 35 to 64 Years | 0 (0.0%) | 7 (9.3%) |
| 65 to 74 Years | 4 (4.0%) | 0 (0.0%) |
| 75 Years and over | 16 (14.0%) | 51 (80.9%) |
Disability Class by Sex by Age in Suttons Bay
Disability Class: Hearing Difficulty
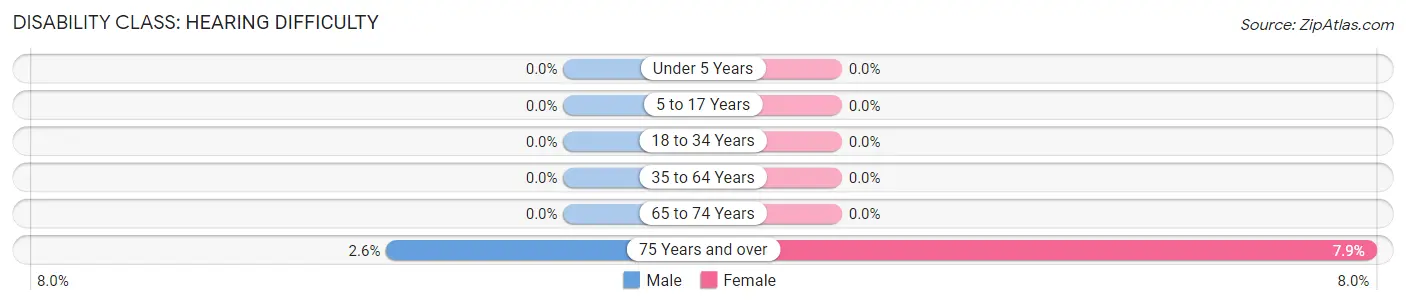
| Age Bracket | Male | Female |
| Under 5 Years | 0 (0.0%) | 0 (0.0%) |
| 5 to 17 Years | 0 (0.0%) | 0 (0.0%) |
| 18 to 34 Years | 0 (0.0%) | 0 (0.0%) |
| 35 to 64 Years | 0 (0.0%) | 0 (0.0%) |
| 65 to 74 Years | 0 (0.0%) | 0 (0.0%) |
| 75 Years and over | 3 (2.6%) | 5 (7.9%) |
Disability Class: Vision Difficulty
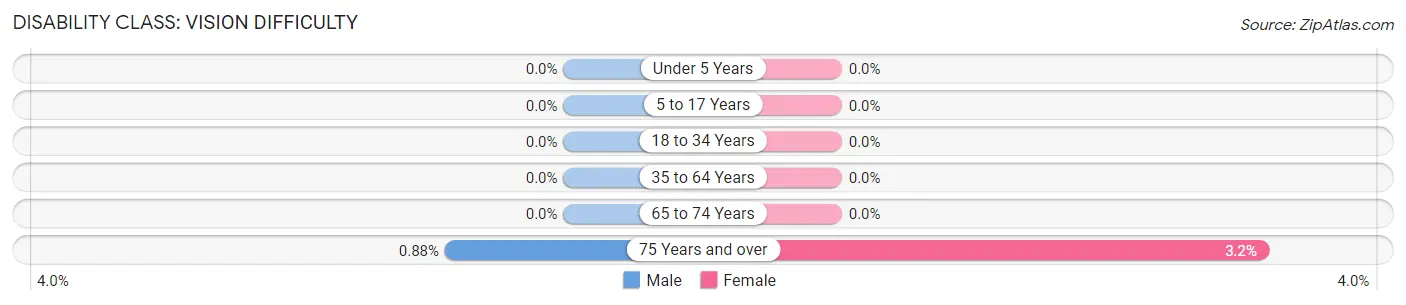
| Age Bracket | Male | Female |
| Under 5 Years | 0 (0.0%) | 0 (0.0%) |
| 5 to 17 Years | 0 (0.0%) | 0 (0.0%) |
| 18 to 34 Years | 0 (0.0%) | 0 (0.0%) |
| 35 to 64 Years | 0 (0.0%) | 0 (0.0%) |
| 65 to 74 Years | 0 (0.0%) | 0 (0.0%) |
| 75 Years and over | 1 (0.9%) | 2 (3.2%) |
Disability Class: Cognitive Difficulty
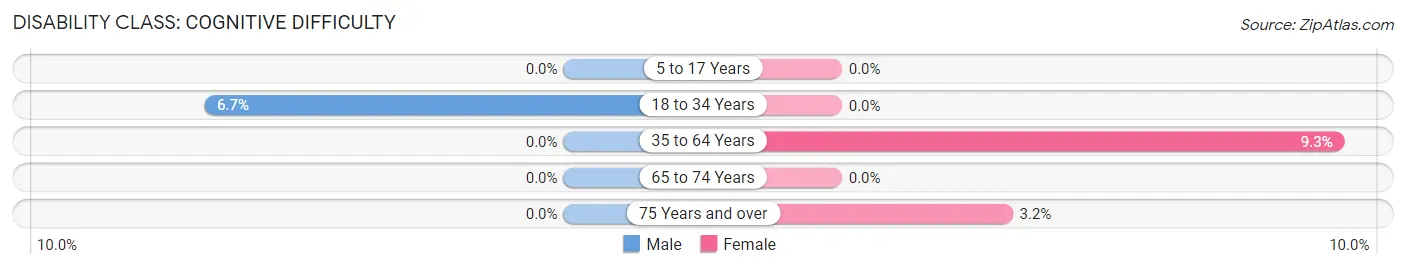
| Age Bracket | Male | Female |
| 5 to 17 Years | 0 (0.0%) | 0 (0.0%) |
| 18 to 34 Years | 2 (6.7%) | 0 (0.0%) |
| 35 to 64 Years | 0 (0.0%) | 7 (9.3%) |
| 65 to 74 Years | 0 (0.0%) | 0 (0.0%) |
| 75 Years and over | 0 (0.0%) | 2 (3.2%) |
Disability Class: Ambulatory Difficulty
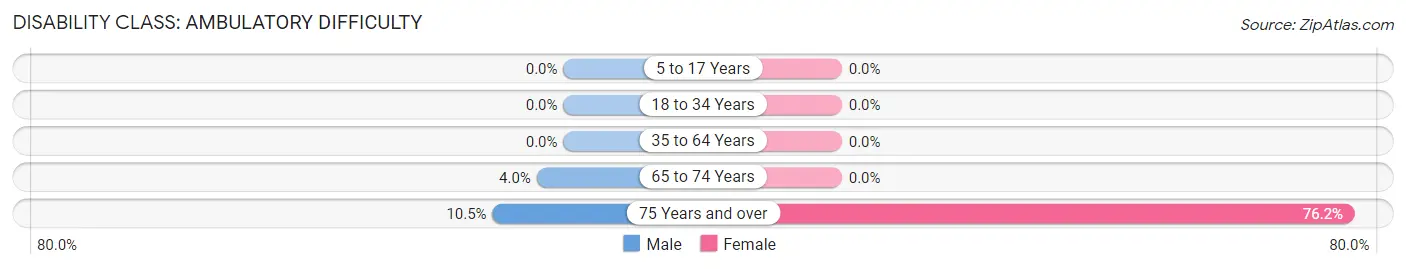
| Age Bracket | Male | Female |
| 5 to 17 Years | 0 (0.0%) | 0 (0.0%) |
| 18 to 34 Years | 0 (0.0%) | 0 (0.0%) |
| 35 to 64 Years | 0 (0.0%) | 0 (0.0%) |
| 65 to 74 Years | 4 (4.0%) | 0 (0.0%) |
| 75 Years and over | 12 (10.5%) | 48 (76.2%) |
Disability Class: Self-Care Difficulty
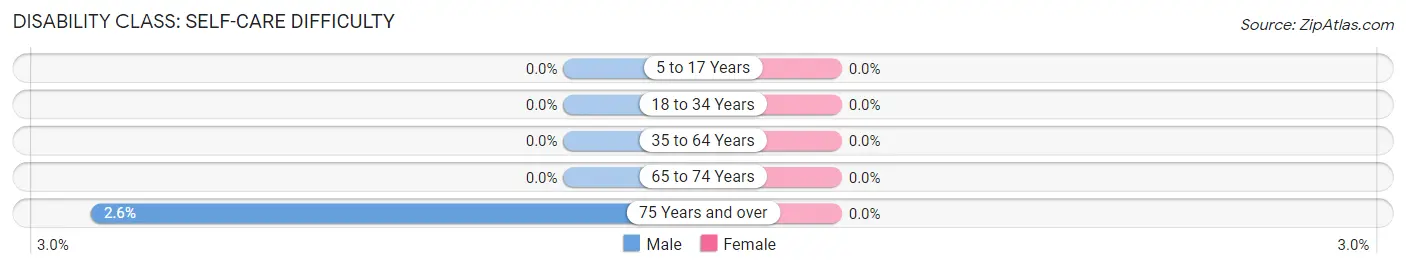
| Age Bracket | Male | Female |
| 5 to 17 Years | 0 (0.0%) | 0 (0.0%) |
| 18 to 34 Years | 0 (0.0%) | 0 (0.0%) |
| 35 to 64 Years | 0 (0.0%) | 0 (0.0%) |
| 65 to 74 Years | 0 (0.0%) | 0 (0.0%) |
| 75 Years and over | 3 (2.6%) | 0 (0.0%) |
Technology Access in Suttons Bay
Computing Device Access in Suttons Bay
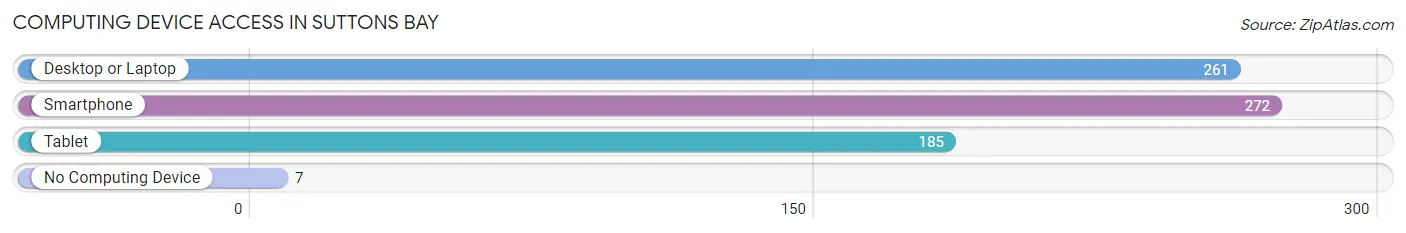
| Device Type | # Households | % Households |
| Desktop or Laptop | 261 | 84.7% |
| Smartphone | 272 | 88.3% |
| Tablet | 185 | 60.1% |
| No Computing Device | 7 | 2.3% |
| Total | 308 | 100.0% |
Internet Access in Suttons Bay
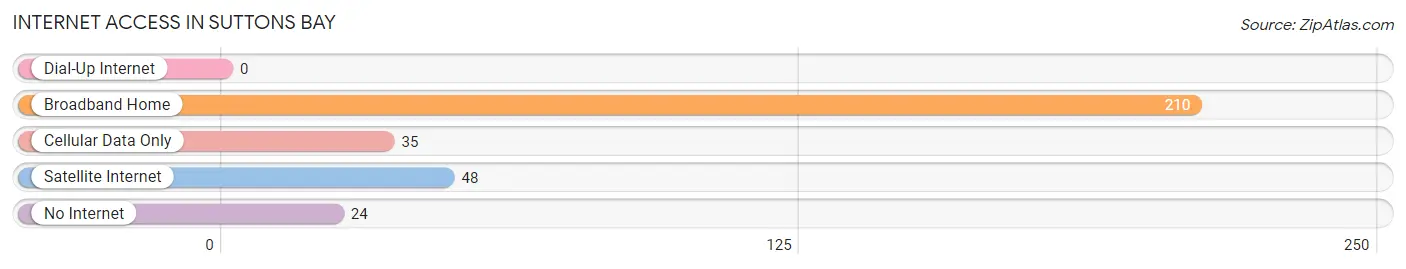
| Internet Type | # Households | % Households |
| Dial-Up Internet | 0 | 0.0% |
| Broadband Home | 210 | 68.2% |
| Cellular Data Only | 35 | 11.4% |
| Satellite Internet | 48 | 15.6% |
| No Internet | 24 | 7.8% |
| Total | 308 | 100.0% |
Suttons Bay Summary
Suttons Bay is a village located in Leelanau County, Michigan, United States. It is situated on the eastern shore of the Leelanau Peninsula, which is part of the larger Grand Traverse Bay. The village is located approximately 20 miles (32 km) north of Traverse City and is part of the Traverse City Micropolitan Statistical Area. As of the 2010 census, the village had a population of 876.
History
The area that is now Suttons Bay was first inhabited by the Anishinaabe people, who were part of the larger Ojibwe Nation. The first European settlers arrived in the area in the mid-1800s, and the village was officially incorporated in 1891. The village was named after William Sutton, who was an early settler in the area.
Geography
Suttons Bay is located at the northern tip of the Leelanau Peninsula, which is part of the larger Grand Traverse Bay. The village is situated on the eastern shore of the bay, and is approximately 20 miles (32 km) north of Traverse City. The village is surrounded by rolling hills and forests, and is located near several lakes, including Suttons Bay, Northport Bay, and Grand Traverse Bay.
The village has a total area of 1.2 square miles (3.2 km2), all of which is land. The village is located at an elevation of 602 feet (183 m).
Economy
The economy of Suttons Bay is largely based on tourism and agriculture. The village is a popular destination for visitors, who come to enjoy the area's natural beauty and recreational activities. The village is also home to several wineries, which attract visitors from around the region.
Agriculture is also an important part of the local economy. The area is known for its cherry and apple orchards, as well as its vineyards. The village is also home to several farms, which produce a variety of fruits and vegetables.
Demographics
As of the 2010 census, there were 876 people, 393 households, and 233 families residing in the village. The population density was 725.0 people per square mile (280.3/km2). There were 441 housing units at an average density of 369.2 per square mile (142.7/km2). The racial makeup of the village was 97.2% White, 0.3% African American, 0.3% Native American, 0.3% Asian, 0.1% Pacific Islander, 0.6% from other races, and 1.2% from two or more races. Hispanic or Latino of any race were 1.7% of the population.
There were 393 households, out of which 24.3% had children under the age of 18 living with them, 48.1% were married couples living together, 8.2% had a female householder with no husband present, and 39.7% were non-families. 33.3% of all households were made up of individuals, and 14.2% had someone living alone who was 65 years of age or older. The average household size was 2.23 and the average family size was 2.83.
In the village, the population was spread out, with 21.2% under the age of 18, 5.7% from 18 to 24, 24.2% from 25 to 44, 28.2% from 45 to 64, and 20.7% who were 65 years of age or older. The median age was 44 years. For every 100 females, there were 91.2 males. For every 100 females age 18 and over, there were 88.2 males.
The median income for a household in the village was $41,250, and the median income for a family was $50,000. Males had a median income of $35,000 versus $25,000 for females. The per capita income for the village was $22,917. About 4.2% of families and 8.2% of the population were below the poverty line, including 8.3% of those under age 18 and 6.3% of those age 65 or over.
Common Questions
What is Per Capita Income in Suttons Bay?
Per Capita income in Suttons Bay is $60,945.
What is the Median Family Income in Suttons Bay?
Median Family Income in Suttons Bay is $118,902.
What is the Median Household income in Suttons Bay?
Median Household Income in Suttons Bay is $108,750.
What is Income or Wage Gap in Suttons Bay?
Income or Wage Gap in Suttons Bay is 50.2%.
Women in Suttons Bay earn 49.8 cents for every dollar earned by a man.
What is Inequality or Gini Index in Suttons Bay?
Inequality or Gini Index in Suttons Bay is 0.43.
What is the Total Population of Suttons Bay?
Total Population of Suttons Bay is 642.
What is the Total Male Population of Suttons Bay?
Total Male Population of Suttons Bay is 344.
What is the Total Female Population of Suttons Bay?
Total Female Population of Suttons Bay is 298.
What is the Ratio of Males per 100 Females in Suttons Bay?
There are 115.44 Males per 100 Females in Suttons Bay.
What is the Ratio of Females per 100 Males in Suttons Bay?
There are 86.63 Females per 100 Males in Suttons Bay.
What is the Median Population Age in Suttons Bay?
Median Population Age in Suttons Bay is 69.3 Years.
What is the Average Family Size in Suttons Bay
Average Family Size in Suttons Bay is 2.4 People.
What is the Average Household Size in Suttons Bay
Average Household Size in Suttons Bay is 1.9 People.
How Large is the Labor Force in Suttons Bay?
There are 226 People in the Labor Forcein in Suttons Bay.
What is the Percentage of People in the Labor Force in Suttons Bay?
37.1% of People are in the Labor Force in Suttons Bay.
What is the Unemployment Rate in Suttons Bay?
Unemployment Rate in Suttons Bay is 3.5%.