Long Lake, IL Map & Demographics
Long Lake Map
Long Lake Overview
$33,884
PER CAPITA INCOME
$95,375
AVG FAMILY INCOME
$95,950
AVG HOUSEHOLD INCOME
28.8%
WAGE / INCOME GAP [ % ]
71.2¢/ $1
WAGE / INCOME GAP [ $ ]
0.33
INEQUALITY / GINI INDEX
2,939
TOTAL POPULATION
1,841
MALE POPULATION
1,098
FEMALE POPULATION
167.67
MALES / 100 FEMALES
59.64
FEMALES / 100 MALES
39.1
MEDIAN AGE
3.5
AVG FAMILY SIZE
3.0
AVG HOUSEHOLD SIZE
1,667
LABOR FORCE [ PEOPLE ]
70.9%
PERCENT IN LABOR FORCE
12.6%
UNEMPLOYMENT RATE
Income in Long Lake
Income Overview in Long Lake
Per Capita Income in Long Lake is $33,884, while median incomes of families and households are $95,375 and $95,950 respectively.
| Characteristic | Number | Measure |
| Per Capita Income | 2,939 | $33,884 |
| Median Family Income | 683 | $95,375 |
| Mean Family Income | 683 | $94,292 |
| Median Household Income | 992 | $95,950 |
| Mean Household Income | 992 | $99,388 |
| Income Deficit | 683 | $0 |
| Wage / Income Gap (%) | 2,939 | 28.80% |
| Wage / Income Gap ($) | 2,939 | 71.20¢ per $1 |
| Gini / Inequality Index | 2,939 | 0.33 |
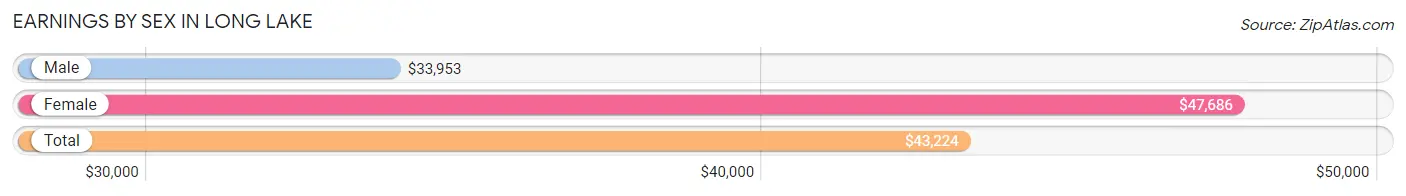
Earnings by Sex in Long Lake
Average Earnings in Long Lake are $43,224, $33,953 for men and $47,686 for women, a difference of 28.8%.
| Sex | Number | Average Earnings |
| Male | 1,114 (63.3%) | $33,953 |
| Female | 647 (36.7%) | $47,686 |
| Total | 1,761 (100.0%) | $43,224 |
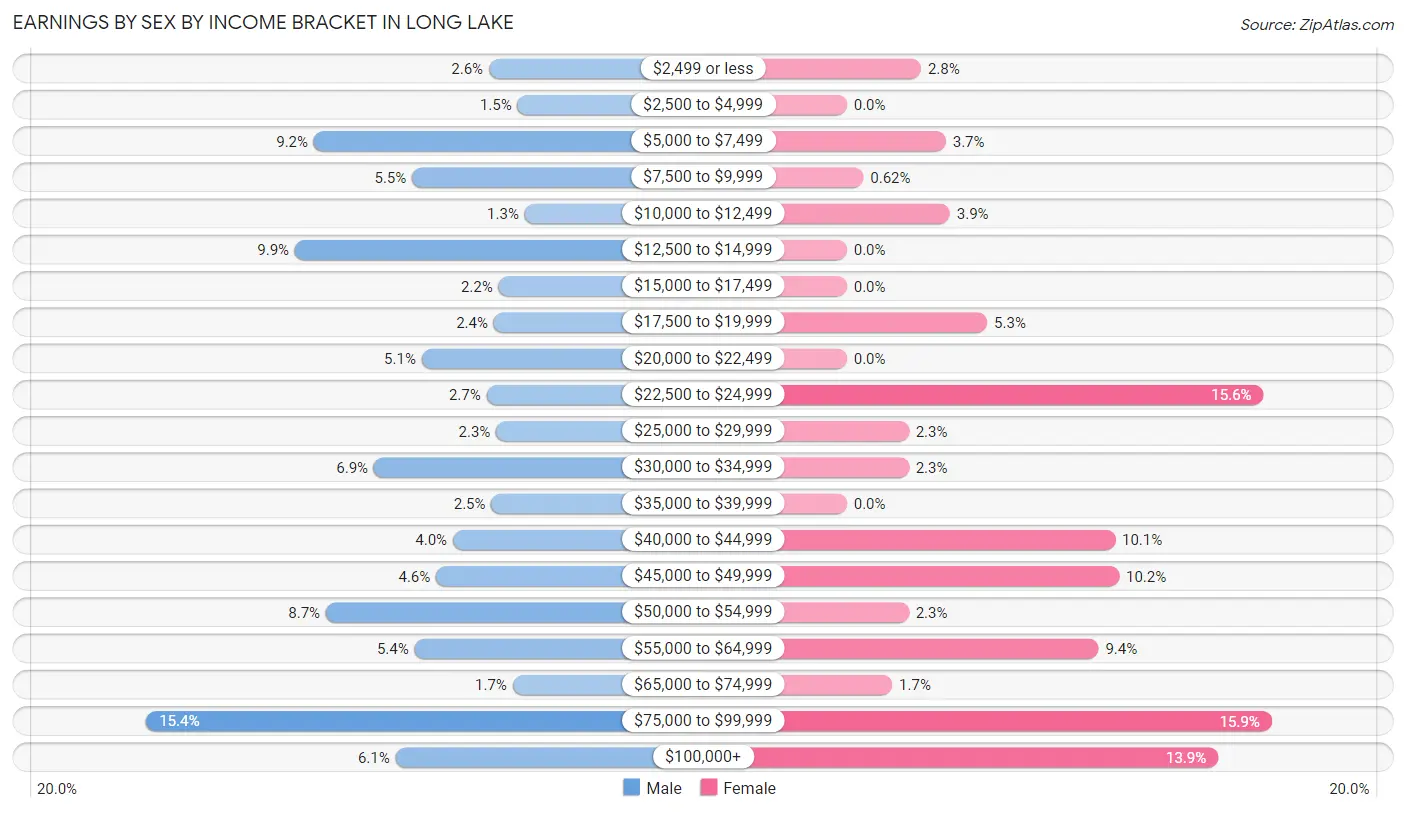
Earnings by Sex by Income Bracket in Long Lake
The most common earnings brackets in Long Lake are $75,000 to $99,999 for men (172 | 15.4%) and $75,000 to $99,999 for women (103 | 15.9%).
| Income | Male | Female |
| $2,499 or less | 29 (2.6%) | 18 (2.8%) |
| $2,500 to $4,999 | 17 (1.5%) | 0 (0.0%) |
| $5,000 to $7,499 | 102 (9.2%) | 24 (3.7%) |
| $7,500 to $9,999 | 61 (5.5%) | 4 (0.6%) |
| $10,000 to $12,499 | 14 (1.3%) | 25 (3.9%) |
| $12,500 to $14,999 | 110 (9.9%) | 0 (0.0%) |
| $15,000 to $17,499 | 25 (2.2%) | 0 (0.0%) |
| $17,500 to $19,999 | 27 (2.4%) | 34 (5.3%) |
| $20,000 to $22,499 | 57 (5.1%) | 0 (0.0%) |
| $22,500 to $24,999 | 30 (2.7%) | 101 (15.6%) |
| $25,000 to $29,999 | 26 (2.3%) | 15 (2.3%) |
| $30,000 to $34,999 | 77 (6.9%) | 15 (2.3%) |
| $35,000 to $39,999 | 28 (2.5%) | 0 (0.0%) |
| $40,000 to $44,999 | 44 (4.0%) | 65 (10.1%) |
| $45,000 to $49,999 | 51 (4.6%) | 66 (10.2%) |
| $50,000 to $54,999 | 97 (8.7%) | 15 (2.3%) |
| $55,000 to $64,999 | 60 (5.4%) | 61 (9.4%) |
| $65,000 to $74,999 | 19 (1.7%) | 11 (1.7%) |
| $75,000 to $99,999 | 172 (15.4%) | 103 (15.9%) |
| $100,000+ | 68 (6.1%) | 90 (13.9%) |
| Total | 1,114 (100.0%) | 647 (100.0%) |
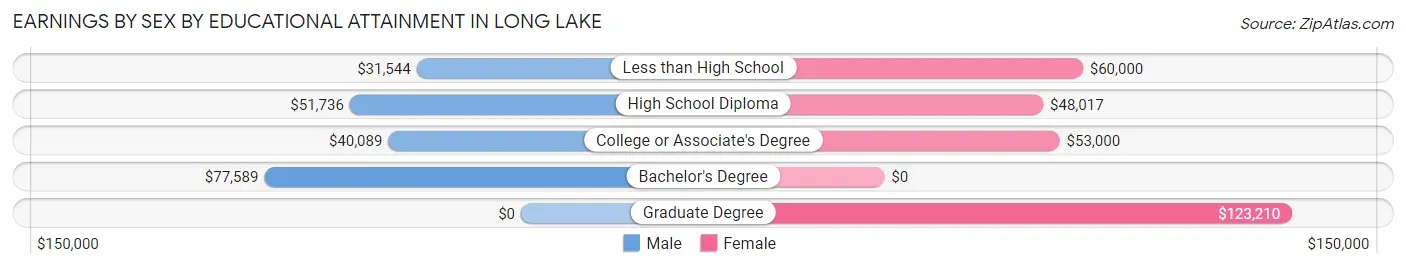
Earnings by Sex by Educational Attainment in Long Lake
Average earnings in Long Lake are $48,750 for men and $49,973 for women, a difference of 2.5%. Men with an educational attainment of bachelor's degree enjoy the highest average annual earnings of $77,589, while those with less than high school education earn the least with $31,544. Women with an educational attainment of graduate degree earn the most with the average annual earnings of $123,210, while those with high school diploma education have the smallest earnings of $48,017.
| Educational Attainment | Male Income | Female Income |
| Less than High School | $31,544 | $60,000 |
| High School Diploma | $51,736 | $48,017 |
| College or Associate's Degree | $40,089 | $53,000 |
| Bachelor's Degree | $77,589 | $0 |
| Graduate Degree | - | - |
| Total | $48,750 | $49,973 |
Family Income in Long Lake
Family Income Brackets in Long Lake
According to the Long Lake family income data, there are 214 families falling into the $100,000 to $149,999 income range, which is the most common income bracket and makes up 31.3% of all families.
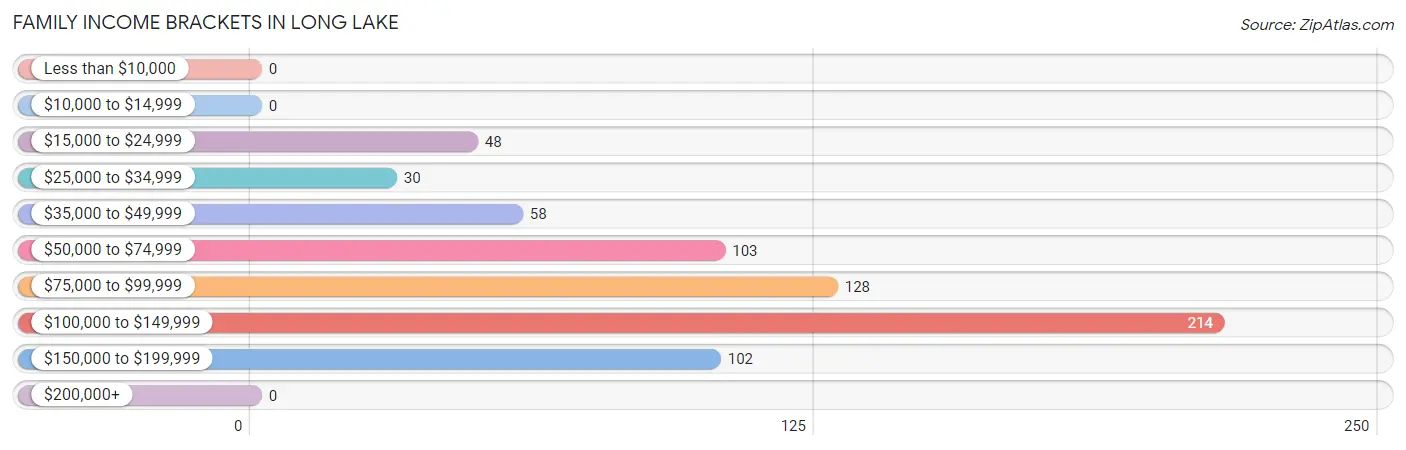
| Income Bracket | # Families | % Families |
| Less than $10,000 | 0 | 0.0% |
| $10,000 to $14,999 | 0 | 0.0% |
| $15,000 to $24,999 | 48 | 7.0% |
| $25,000 to $34,999 | 30 | 4.4% |
| $35,000 to $49,999 | 58 | 8.5% |
| $50,000 to $74,999 | 103 | 15.1% |
| $75,000 to $99,999 | 128 | 18.7% |
| $100,000 to $149,999 | 214 | 31.3% |
| $150,000 to $199,999 | 102 | 14.9% |
| $200,000+ | 0 | 0.0% |
Family Income by Famaliy Size in Long Lake
3-person families (191 | 28.0%) account for the highest median family income in Long Lake with $97,458 per family, while 2-person families (243 | 35.6%) have the highest median income of $42,456 per family member.
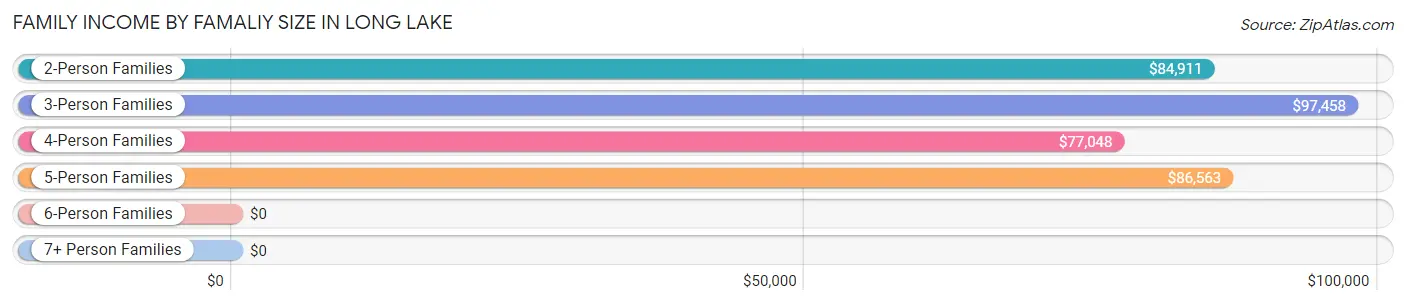
| Income Bracket | # Families | Median Income |
| 2-Person Families | 243 (35.6%) | $84,911 |
| 3-Person Families | 191 (28.0%) | $97,458 |
| 4-Person Families | 99 (14.5%) | $77,048 |
| 5-Person Families | 75 (11.0%) | $86,563 |
| 6-Person Families | 71 (10.4%) | $0 |
| 7+ Person Families | 4 (0.6%) | $0 |
| Total | 683 (100.0%) | $95,375 |
Family Income by Number of Earners in Long Lake

| Number of Earners | # Families | Median Income |
| No Earners | 55 (8.1%) | $0 |
| 1 Earner | 179 (26.2%) | $56,964 |
| 2 Earners | 303 (44.4%) | $95,625 |
| 3+ Earners | 146 (21.4%) | $125,658 |
| Total | 683 (100.0%) | $95,375 |
Household Income in Long Lake
Household Income Brackets in Long Lake
With 331 households falling in the category, the $100,000 to $149,999 income range is the most frequent in Long Lake, accounting for 33.4% of all households. In contrast, only 6 households (0.6%) fall into the less than $10,000 income bracket, making it the least populous group.
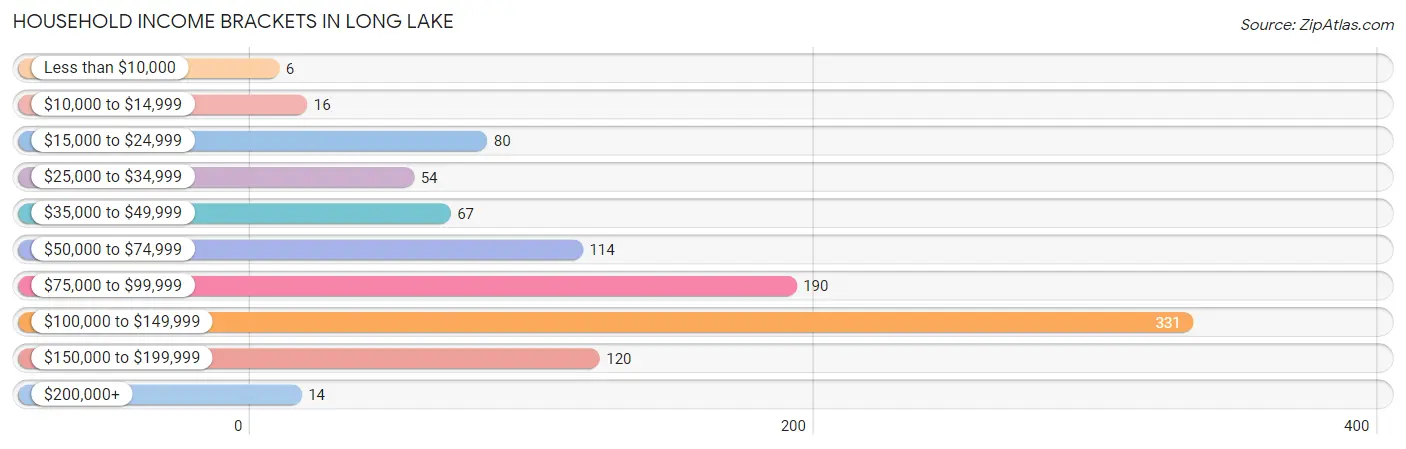
| Income Bracket | # Households | % Households |
| Less than $10,000 | 6 | 0.6% |
| $10,000 to $14,999 | 16 | 1.6% |
| $15,000 to $24,999 | 80 | 8.1% |
| $25,000 to $34,999 | 54 | 5.4% |
| $35,000 to $49,999 | 67 | 6.8% |
| $50,000 to $74,999 | 114 | 11.5% |
| $75,000 to $99,999 | 190 | 19.2% |
| $100,000 to $149,999 | 331 | 33.4% |
| $150,000 to $199,999 | 120 | 12.1% |
| $200,000+ | 14 | 1.4% |
Household Income by Householder Age in Long Lake
The median household income in Long Lake is $95,950, with the highest median household income of $100,625 found in the 25 to 44 years age bracket for the primary householder. A total of 271 households (27.3%) fall into this category. Meanwhile, the 15 to 24 years age bracket for the primary householder has the lowest median household income of $0, with 42 households (4.2%) in this group.
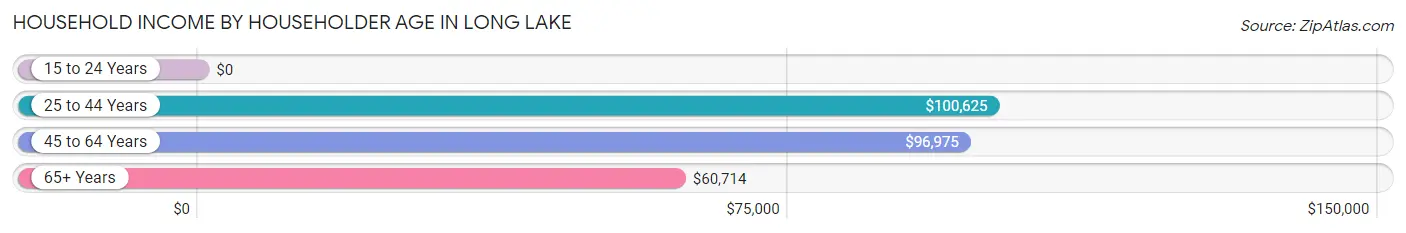
| Income Bracket | # Households | Median Income |
| 15 to 24 Years | 42 (4.2%) | $0 |
| 25 to 44 Years | 271 (27.3%) | $100,625 |
| 45 to 64 Years | 523 (52.7%) | $96,975 |
| 65+ Years | 156 (15.7%) | $60,714 |
| Total | 992 (100.0%) | $95,950 |
Poverty in Long Lake
Income Below Poverty by Sex and Age in Long Lake
With 3.3% poverty level for males and 8.9% for females among the residents of Long Lake, 75 year old and over males and 15 year old females are the most vulnerable to poverty, with 6 males (12.5%) and 18 females (100.0%) in their respective age groups living below the poverty level.
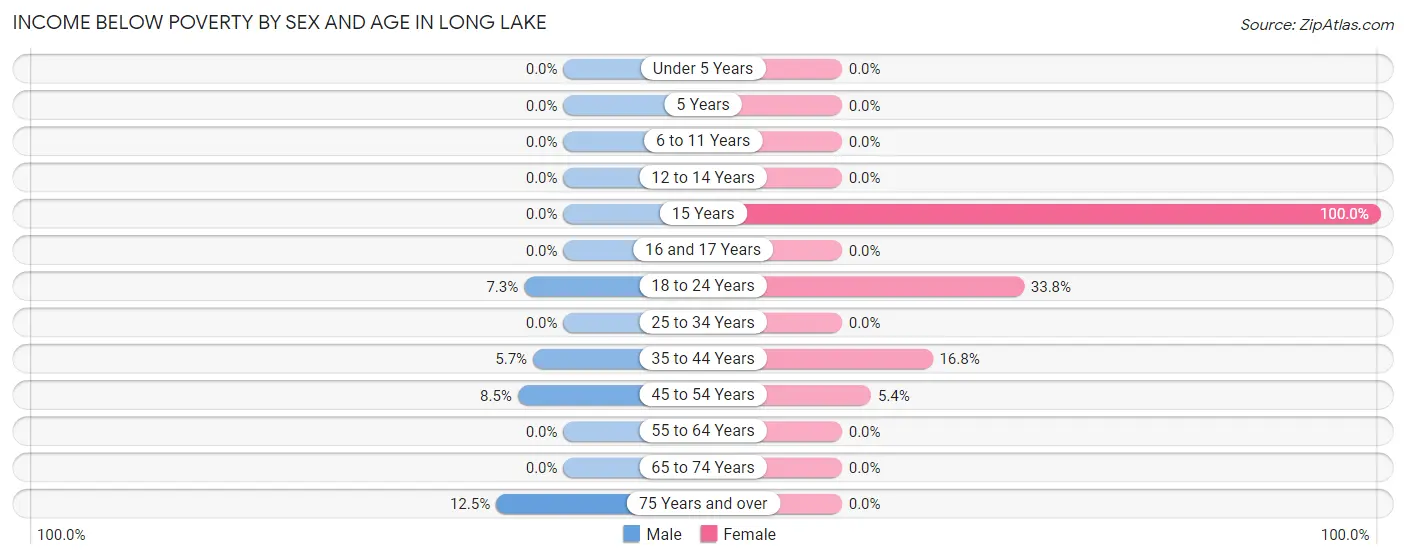
| Age Bracket | Male | Female |
| Under 5 Years | 0 (0.0%) | 0 (0.0%) |
| 5 Years | 0 (0.0%) | 0 (0.0%) |
| 6 to 11 Years | 0 (0.0%) | 0 (0.0%) |
| 12 to 14 Years | 0 (0.0%) | 0 (0.0%) |
| 15 Years | 0 (0.0%) | 18 (100.0%) |
| 16 and 17 Years | 0 (0.0%) | 0 (0.0%) |
| 18 to 24 Years | 24 (7.3%) | 49 (33.8%) |
| 25 to 34 Years | 0 (0.0%) | 0 (0.0%) |
| 35 to 44 Years | 16 (5.7%) | 17 (16.8%) |
| 45 to 54 Years | 15 (8.5%) | 14 (5.4%) |
| 55 to 64 Years | 0 (0.0%) | 0 (0.0%) |
| 65 to 74 Years | 0 (0.0%) | 0 (0.0%) |
| 75 Years and over | 6 (12.5%) | 0 (0.0%) |
| Total | 61 (3.3%) | 98 (8.9%) |
Income Above Poverty by Sex and Age in Long Lake
According to the poverty statistics in Long Lake, males aged under 5 years and females aged under 5 years are the age groups that are most secure financially, with 100.0% of males and 100.0% of females in these age groups living above the poverty line.
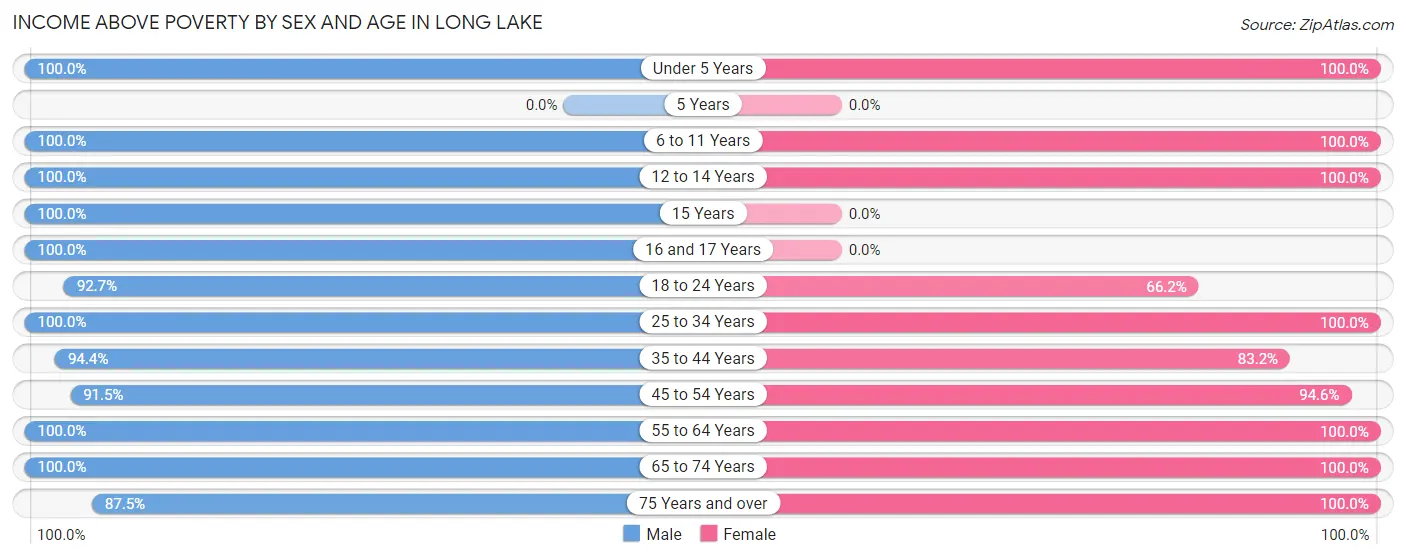
| Age Bracket | Male | Female |
| Under 5 Years | 34 (100.0%) | 39 (100.0%) |
| 5 Years | 0 (0.0%) | 0 (0.0%) |
| 6 to 11 Years | 163 (100.0%) | 104 (100.0%) |
| 12 to 14 Years | 99 (100.0%) | 30 (100.0%) |
| 15 Years | 101 (100.0%) | 0 (0.0%) |
| 16 and 17 Years | 68 (100.0%) | 0 (0.0%) |
| 18 to 24 Years | 305 (92.7%) | 96 (66.2%) |
| 25 to 34 Years | 165 (100.0%) | 92 (100.0%) |
| 35 to 44 Years | 267 (94.4%) | 84 (83.2%) |
| 45 to 54 Years | 162 (91.5%) | 244 (94.6%) |
| 55 to 64 Years | 266 (100.0%) | 200 (100.0%) |
| 65 to 74 Years | 108 (100.0%) | 61 (100.0%) |
| 75 Years and over | 42 (87.5%) | 50 (100.0%) |
| Total | 1,780 (96.7%) | 1,000 (91.1%) |
Income Below Poverty Among Married-Couple Families in Long Lake
The poverty statistics for married-couple families in Long Lake show that 2.9% or 15 of the total 524 families live below the poverty line. Families with no children have the highest poverty rate of 5.3%, comprising of 15 families. On the other hand, families with 1 or 2 children have the lowest poverty rate of 0.0%, which includes 0 families.
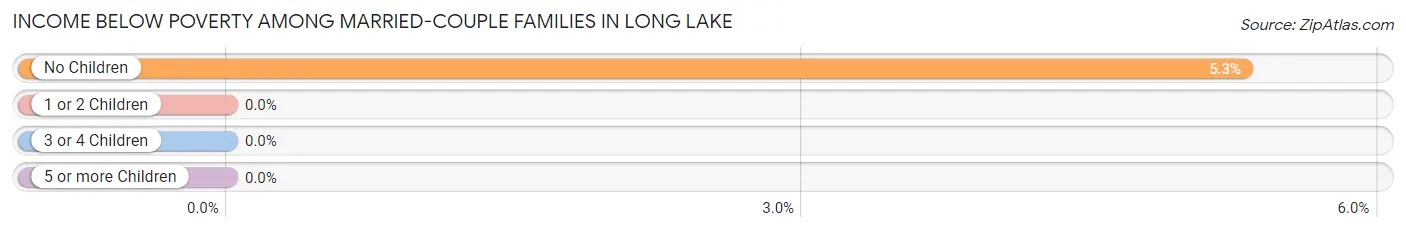
| Children | Above Poverty | Below Poverty |
| No Children | 268 (94.7%) | 15 (5.3%) |
| 1 or 2 Children | 195 (100.0%) | 0 (0.0%) |
| 3 or 4 Children | 42 (100.0%) | 0 (0.0%) |
| 5 or more Children | 4 (100.0%) | 0 (0.0%) |
| Total | 509 (97.1%) | 15 (2.9%) |
Income Below Poverty Among Single-Parent Households in Long Lake
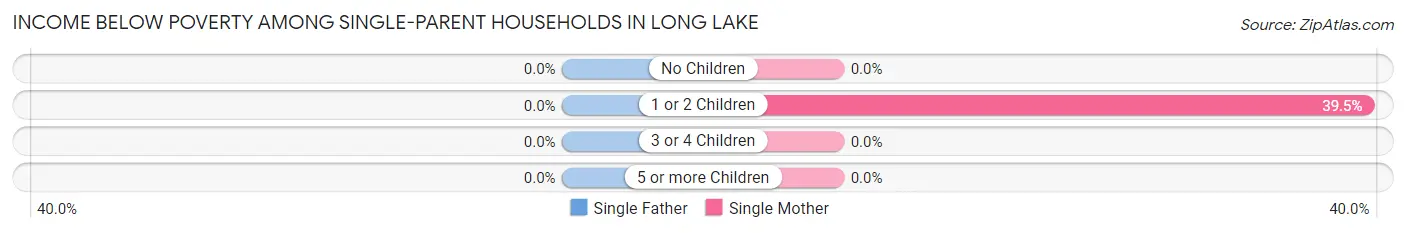
| Children | Single Father | Single Mother |
| No Children | 0 (0.0%) | 0 (0.0%) |
| 1 or 2 Children | 0 (0.0%) | 17 (39.5%) |
| 3 or 4 Children | 0 (0.0%) | 0 (0.0%) |
| 5 or more Children | 0 (0.0%) | 0 (0.0%) |
| Total | 0 (0.0%) | 17 (15.7%) |
Income Below Poverty Among Married-Couple vs Single-Parent Households in Long Lake
The poverty data for Long Lake shows that 15 of the married-couple family households (2.9%) and 17 of the single-parent households (10.7%) are living below the poverty level. Within the married-couple family households, those with no children have the highest poverty rate, with 15 households (5.3%) falling below the poverty line. Among the single-parent households, those with 1 or 2 children have the highest poverty rate, with 17 household (21.5%) living below poverty.
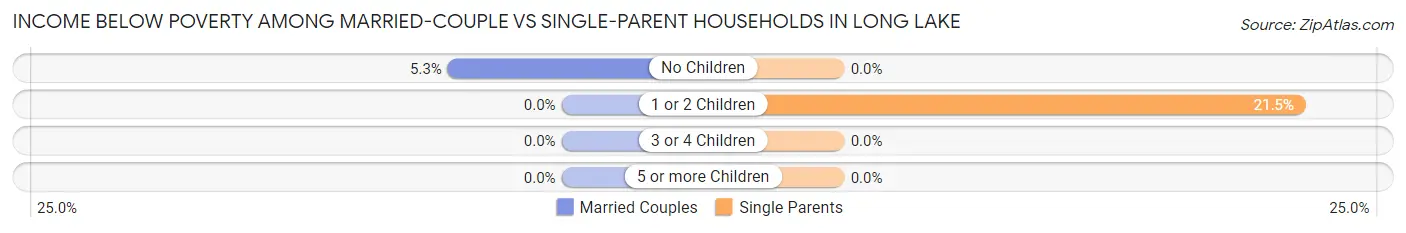
| Children | Married-Couple Families | Single-Parent Households |
| No Children | 15 (5.3%) | 0 (0.0%) |
| 1 or 2 Children | 0 (0.0%) | 17 (21.5%) |
| 3 or 4 Children | 0 (0.0%) | 0 (0.0%) |
| 5 or more Children | 0 (0.0%) | 0 (0.0%) |
| Total | 15 (2.9%) | 17 (10.7%) |
Race in Long Lake
The most populous races in Long Lake are White / Caucasian (2,256 | 76.8%), Hispanic or Latino (1,072 | 36.5%), and Some other Race (441 | 15.0%).
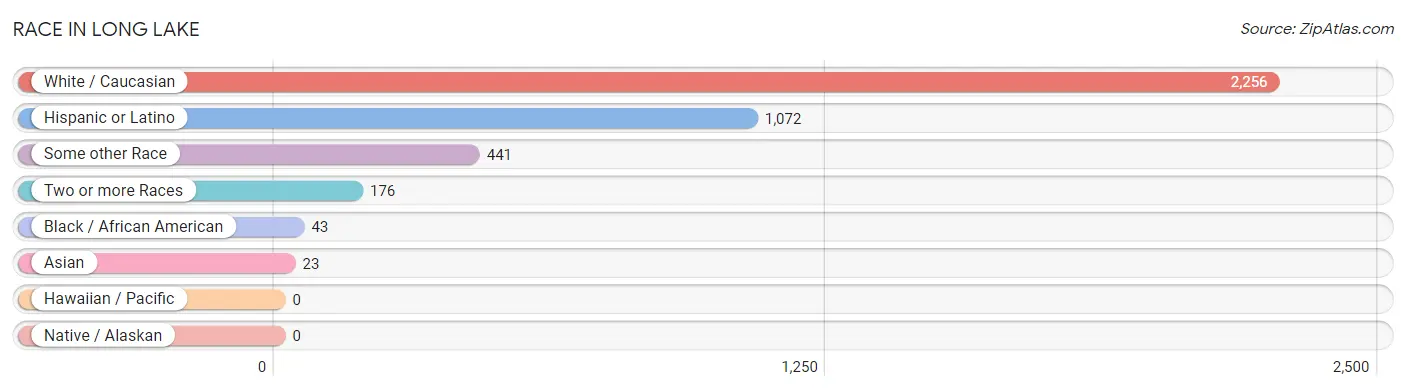
| Race | # Population | % Population |
| Asian | 23 | 0.8% |
| Black / African American | 43 | 1.5% |
| Hawaiian / Pacific | 0 | 0.0% |
| Hispanic or Latino | 1,072 | 36.5% |
| Native / Alaskan | 0 | 0.0% |
| White / Caucasian | 2,256 | 76.8% |
| Two or more Races | 176 | 6.0% |
| Some other Race | 441 | 15.0% |
| Total | 2,939 | 100.0% |
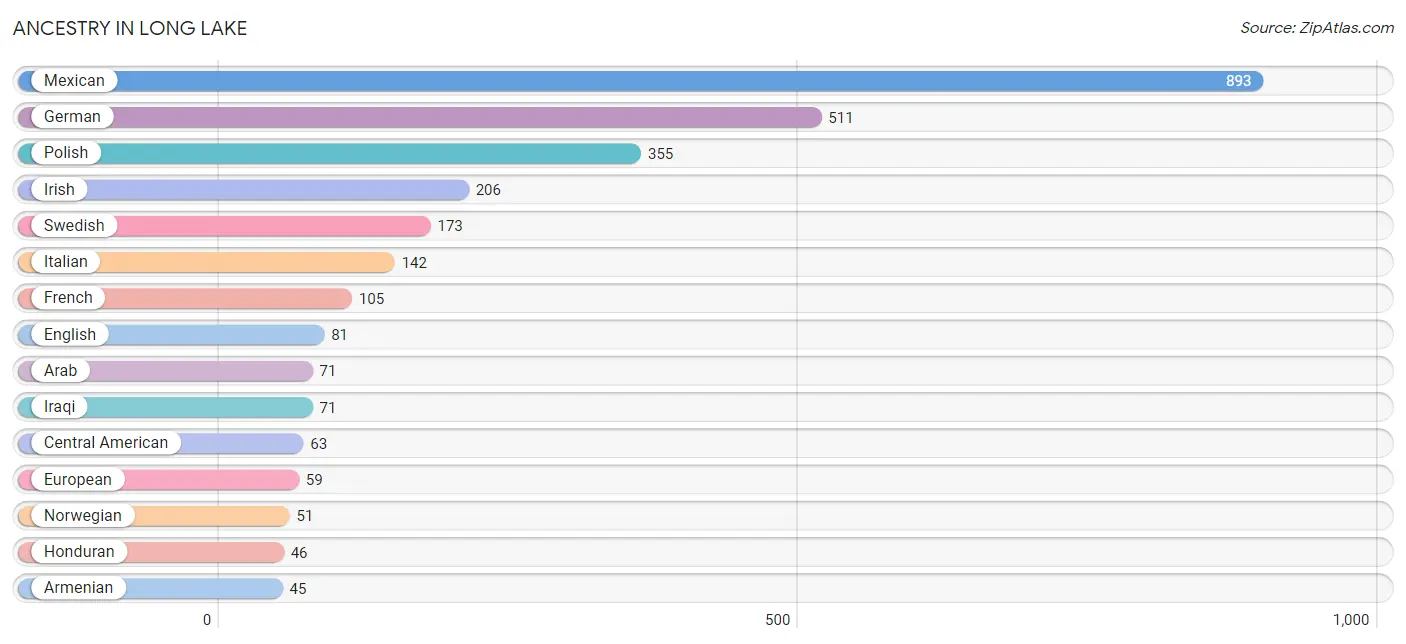
Ancestry in Long Lake
The most populous ancestries reported in Long Lake are Mexican (893 | 30.4%), German (511 | 17.4%), Polish (355 | 12.1%), Irish (206 | 7.0%), and Swedish (173 | 5.9%), together accounting for 72.8% of all Long Lake residents.
| Ancestry | # Population | % Population |
| American | 33 | 1.1% |
| Arab | 71 | 2.4% |
| Armenian | 45 | 1.5% |
| Austrian | 44 | 1.5% |
| British | 4 | 0.1% |
| Central American | 63 | 2.1% |
| Colombian | 10 | 0.3% |
| Cuban | 40 | 1.4% |
| Czech | 28 | 0.9% |
| Danish | 24 | 0.8% |
| Dutch | 14 | 0.5% |
| English | 81 | 2.8% |
| European | 59 | 2.0% |
| French | 105 | 3.6% |
| French Canadian | 22 | 0.7% |
| German | 511 | 17.4% |
| Guatemalan | 17 | 0.6% |
| Honduran | 46 | 1.6% |
| Iranian | 17 | 0.6% |
| Iraqi | 71 | 2.4% |
| Irish | 206 | 7.0% |
| Italian | 142 | 4.8% |
| Jamaican | 19 | 0.6% |
| Korean | 23 | 0.8% |
| Mexican | 893 | 30.4% |
| Norwegian | 51 | 1.7% |
| Polish | 355 | 12.1% |
| Russian | 18 | 0.6% |
| Scandinavian | 13 | 0.4% |
| Scotch-Irish | 26 | 0.9% |
| Scottish | 40 | 1.4% |
| South American | 10 | 0.3% |
| Swedish | 173 | 5.9% |
| Ukrainian | 4 | 0.1% | View All 34 Rows |
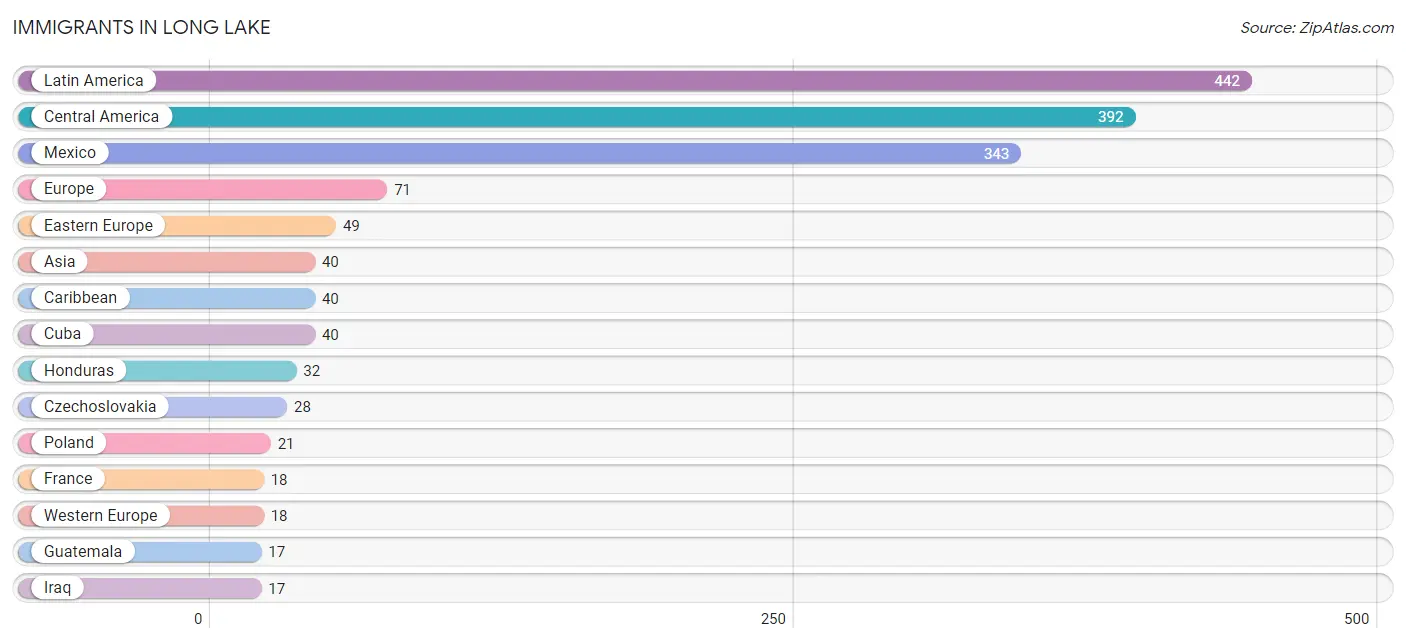
Immigrants in Long Lake
The most numerous immigrant groups reported in Long Lake came from Latin America (442 | 15.0%), Central America (392 | 13.3%), Mexico (343 | 11.7%), Europe (71 | 2.4%), and Eastern Europe (49 | 1.7%), together accounting for 44.1% of all Long Lake residents.
| Immigration Origin | # Population | % Population |
| Asia | 40 | 1.4% |
| Caribbean | 40 | 1.4% |
| Central America | 392 | 13.3% |
| Colombia | 10 | 0.3% |
| Cuba | 40 | 1.4% |
| Czechoslovakia | 28 | 0.9% |
| Eastern Europe | 49 | 1.7% |
| Europe | 71 | 2.4% |
| France | 18 | 0.6% |
| Guatemala | 17 | 0.6% |
| Honduras | 32 | 1.1% |
| India | 7 | 0.2% |
| Iraq | 17 | 0.6% |
| Italy | 4 | 0.1% |
| Latin America | 442 | 15.0% |
| Mexico | 343 | 11.7% |
| Philippines | 16 | 0.5% |
| Poland | 21 | 0.7% |
| South America | 10 | 0.3% |
| South Central Asia | 7 | 0.2% |
| South Eastern Asia | 16 | 0.5% |
| Southern Europe | 4 | 0.1% |
| Western Asia | 17 | 0.6% |
| Western Europe | 18 | 0.6% | View All 24 Rows |
Sex and Age in Long Lake
Sex and Age in Long Lake
The most populous age groups in Long Lake are 15 to 19 Years (301 | 16.4%) for men and 45 to 49 Years (184 | 16.8%) for women.
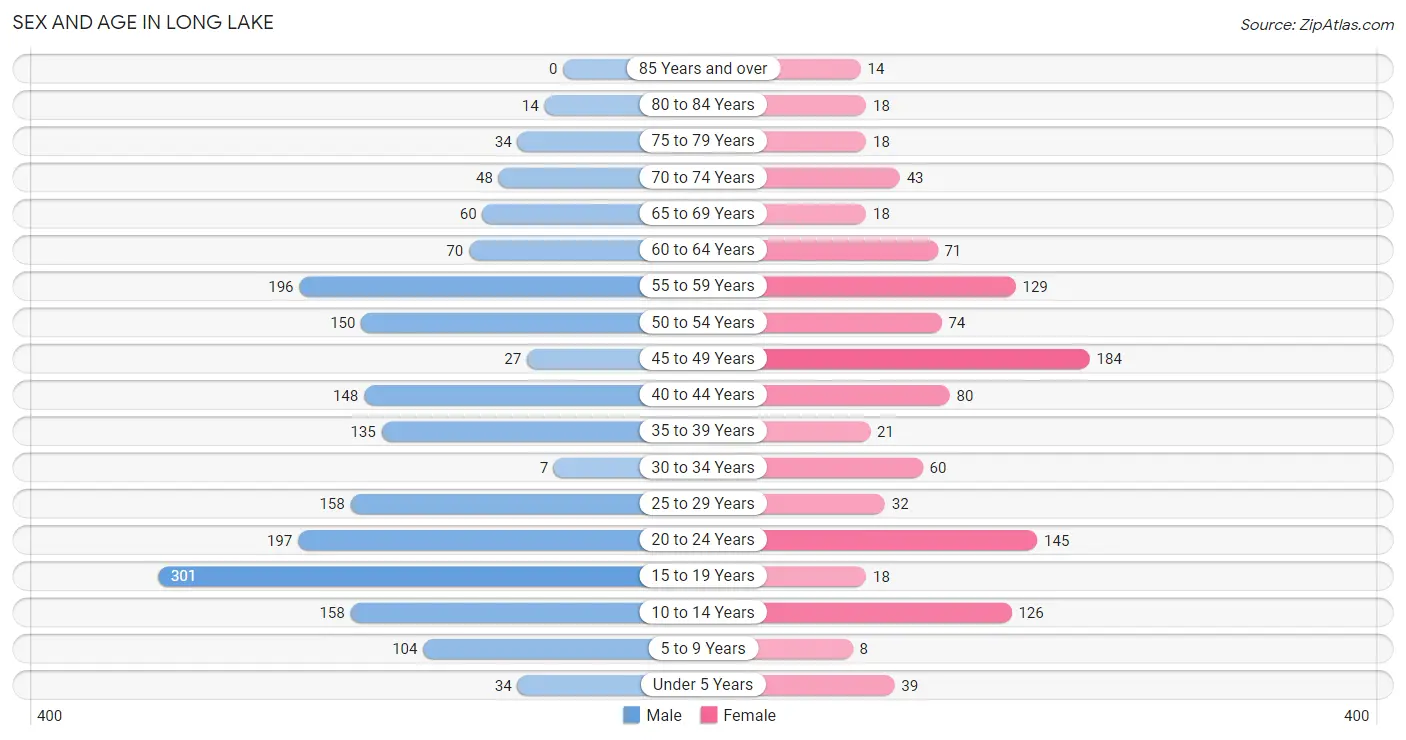
| Age Bracket | Male | Female |
| Under 5 Years | 34 (1.8%) | 39 (3.5%) |
| 5 to 9 Years | 104 (5.7%) | 8 (0.7%) |
| 10 to 14 Years | 158 (8.6%) | 126 (11.5%) |
| 15 to 19 Years | 301 (16.4%) | 18 (1.6%) |
| 20 to 24 Years | 197 (10.7%) | 145 (13.2%) |
| 25 to 29 Years | 158 (8.6%) | 32 (2.9%) |
| 30 to 34 Years | 7 (0.4%) | 60 (5.5%) |
| 35 to 39 Years | 135 (7.3%) | 21 (1.9%) |
| 40 to 44 Years | 148 (8.0%) | 80 (7.3%) |
| 45 to 49 Years | 27 (1.5%) | 184 (16.8%) |
| 50 to 54 Years | 150 (8.2%) | 74 (6.7%) |
| 55 to 59 Years | 196 (10.6%) | 129 (11.7%) |
| 60 to 64 Years | 70 (3.8%) | 71 (6.5%) |
| 65 to 69 Years | 60 (3.3%) | 18 (1.6%) |
| 70 to 74 Years | 48 (2.6%) | 43 (3.9%) |
| 75 to 79 Years | 34 (1.8%) | 18 (1.6%) |
| 80 to 84 Years | 14 (0.8%) | 18 (1.6%) |
| 85 Years and over | 0 (0.0%) | 14 (1.3%) |
| Total | 1,841 (100.0%) | 1,098 (100.0%) |
Families and Households in Long Lake
Median Family Size in Long Lake
The median family size in Long Lake is 3.55 persons per family, with single male/father families (51 | 7.5%) accounting for the largest median family size of 3.84 persons per family. On the other hand, single female/mother families (108 | 15.8%) represent the smallest median family size with 3.17 persons per family.
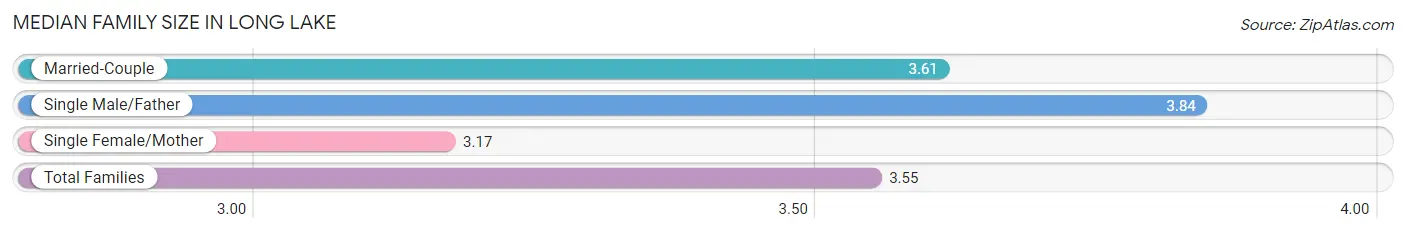
| Family Type | # Families | Family Size |
| Married-Couple | 524 (76.7%) | 3.61 |
| Single Male/Father | 51 (7.5%) | 3.84 |
| Single Female/Mother | 108 (15.8%) | 3.17 |
| Total Families | 683 (100.0%) | 3.55 |
Median Household Size in Long Lake
The median household size in Long Lake is 2.96 persons per household, with single female/mother households (108 | 10.9%) accounting for the largest median household size of 4.24 persons per household. non-family households (309 | 31.1%) represent the smallest median household size with 1.28 persons per household.
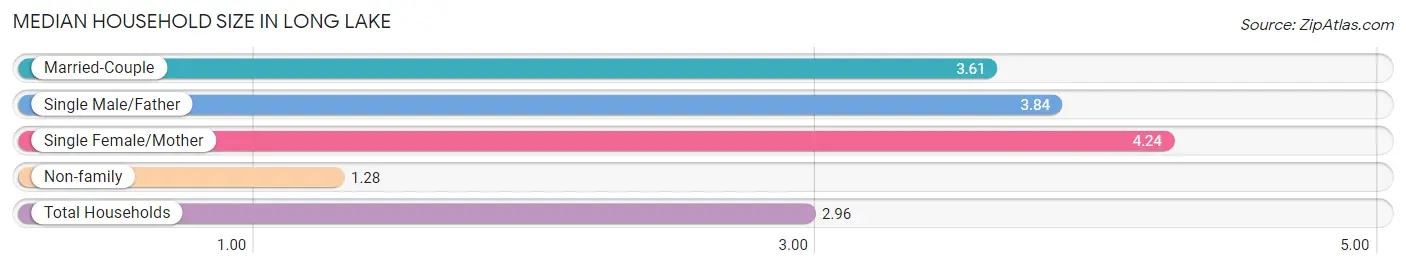
| Household Type | # Households | Household Size |
| Married-Couple | 524 (52.8%) | 3.61 |
| Single Male/Father | 51 (5.1%) | 3.84 |
| Single Female/Mother | 108 (10.9%) | 4.24 |
| Non-family | 309 (31.1%) | 1.28 |
| Total Households | 992 (100.0%) | 2.96 |
Household Size by Marriage Status in Long Lake
Out of a total of 992 households in Long Lake, 683 (68.9%) are family households, while 309 (31.1%) are nonfamily households. The most numerous type of family households are 2-person households, comprising 208, and the most common type of nonfamily households are 1-person households, comprising 219.
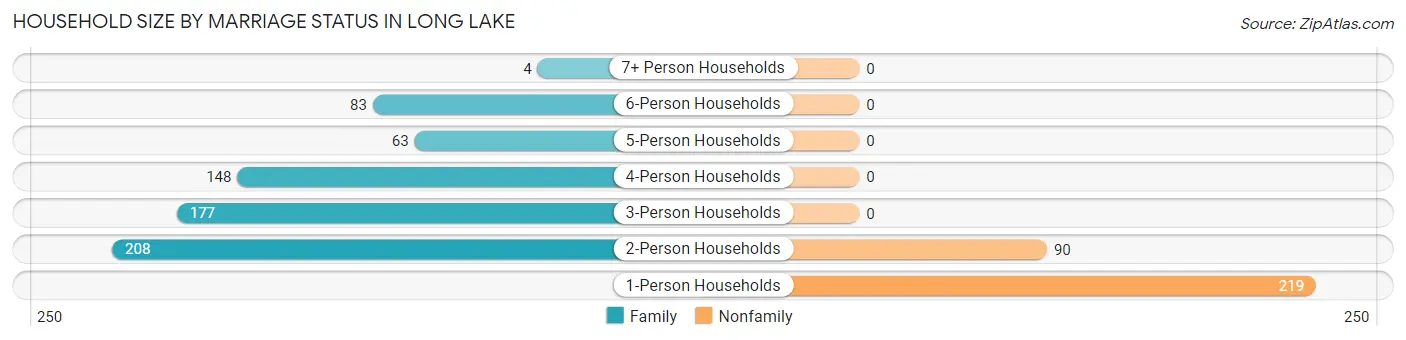
| Household Size | Family Households | Nonfamily Households |
| 1-Person Households | - | 219 (22.1%) |
| 2-Person Households | 208 (21.0%) | 90 (9.1%) |
| 3-Person Households | 177 (17.8%) | 0 (0.0%) |
| 4-Person Households | 148 (14.9%) | 0 (0.0%) |
| 5-Person Households | 63 (6.4%) | 0 (0.0%) |
| 6-Person Households | 83 (8.4%) | 0 (0.0%) |
| 7+ Person Households | 4 (0.4%) | 0 (0.0%) |
| Total | 683 (68.9%) | 309 (31.1%) |
Female Fertility in Long Lake
Fertility by Age in Long Lake
Average fertility rate in Long Lake is 40.0 births per 1,000 women. Women in the age bracket of 20 to 34 years have the highest fertility rate with 93.0 births per 1,000 women. Women in the age bracket of 20 to 34 years acount for 100.0% of all women with births.
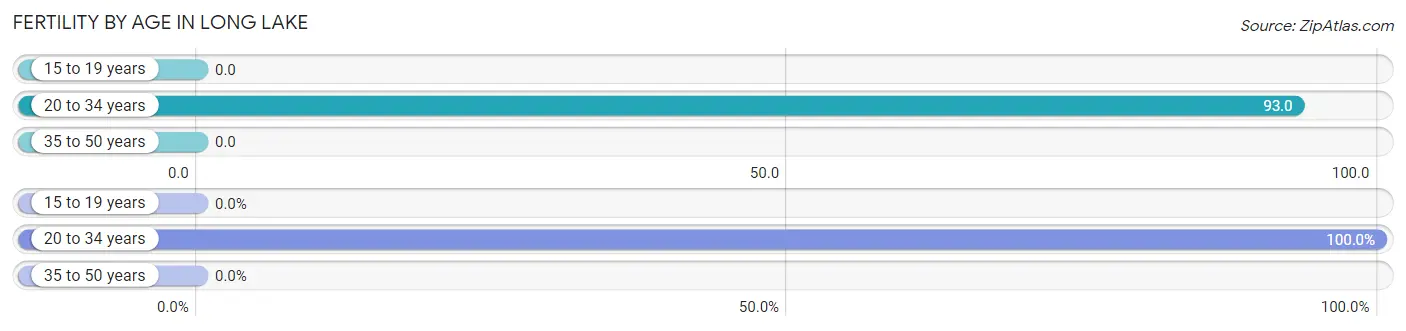
| Age Bracket | Women with Births | Births / 1,000 Women |
| 15 to 19 years | 0 (0.0%) | 0.0 |
| 20 to 34 years | 22 (100.0%) | 93.0 |
| 35 to 50 years | 0 (0.0%) | 0.0 |
| Total | 22 (100.0%) | 40.0 |
Fertility by Age by Marriage Status in Long Lake
77.3% of women with births (22) in Long Lake are married. The highest percentage of unmarried women with births falls into 20 to 34 years age bracket with 22.7% of them unmarried at the time of birth, while the lowest percentage of unmarried women with births belong to 20 to 34 years age bracket with 22.7% of them unmarried.
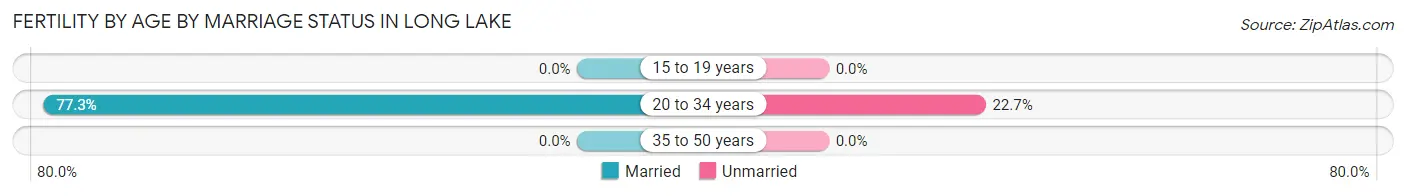
| Age Bracket | Married | Unmarried |
| 15 to 19 years | 0 (0.0%) | 0 (0.0%) |
| 20 to 34 years | 17 (77.3%) | 5 (22.7%) |
| 35 to 50 years | 0 (0.0%) | 0 (0.0%) |
| Total | 17 (77.3%) | 5 (22.7%) |
Fertility by Education in Long Lake
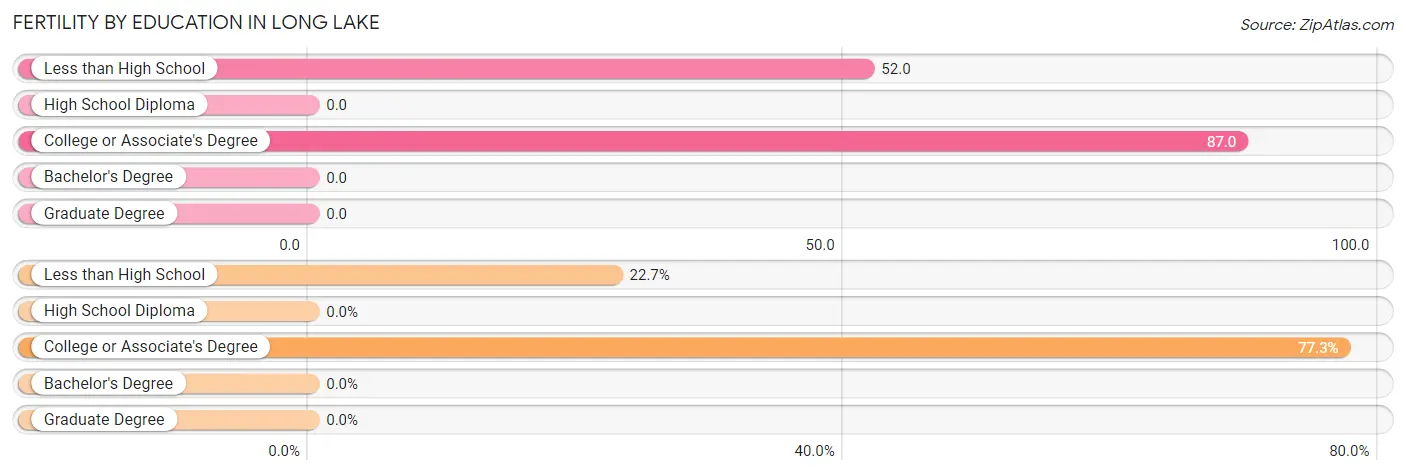
| Educational Attainment | Women with Births | Births / 1,000 Women |
| Less than High School | 5 (22.7%) | 52.0 |
| High School Diploma | 0 (0.0%) | 0.0 |
| College or Associate's Degree | 17 (77.3%) | 87.0 |
| Bachelor's Degree | 0 (0.0%) | 0.0 |
| Graduate Degree | 0 (0.0%) | 0.0 |
| Total | 22 (100.0%) | 40.0 |
Fertility by Education by Marriage Status in Long Lake
22.7% of women with births in Long Lake are unmarried. Women with the educational attainment of college or associate's degree are most likely to be married with 100.0% of them married at childbirth, while women with the educational attainment of less than high school are least likely to be married with 100.0% of them unmarried at childbirth.
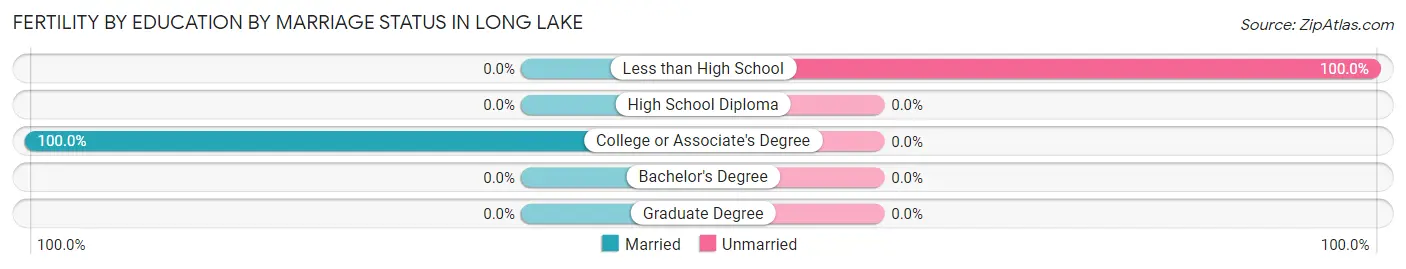
| Educational Attainment | Married | Unmarried |
| Less than High School | 0 (0.0%) | 5 (100.0%) |
| High School Diploma | 0 (0.0%) | 0 (0.0%) |
| College or Associate's Degree | 17 (100.0%) | 0 (0.0%) |
| Bachelor's Degree | 0 (0.0%) | 0 (0.0%) |
| Graduate Degree | 0 (0.0%) | 0 (0.0%) |
| Total | 17 (77.3%) | 5 (22.7%) |
Employment Characteristics in Long Lake
Employment by Class of Employer in Long Lake
Among the 1,420 employed individuals in Long Lake, private company employees (1,117 | 78.7%), self-employed (incorporated) (102 | 7.2%), and self-employed (not incorporated) (78 | 5.5%) make up the most common classes of employment.
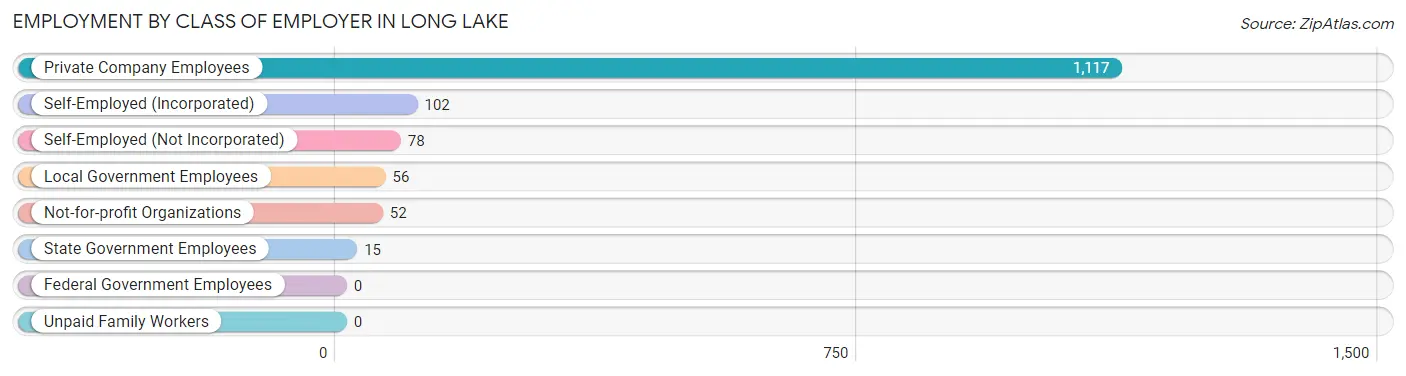
| Employer Class | # Employees | % Employees |
| Private Company Employees | 1,117 | 78.7% |
| Self-Employed (Incorporated) | 102 | 7.2% |
| Self-Employed (Not Incorporated) | 78 | 5.5% |
| Not-for-profit Organizations | 52 | 3.7% |
| Local Government Employees | 56 | 3.9% |
| State Government Employees | 15 | 1.1% |
| Federal Government Employees | 0 | 0.0% |
| Unpaid Family Workers | 0 | 0.0% |
| Total | 1,420 | 100.0% |
Employment Status by Age in Long Lake
According to the labor force statistics for Long Lake, out of the total population over 16 years of age (2,351), 70.9% or 1,667 individuals are in the labor force, with 12.6% or 210 of them unemployed. The age group with the highest labor force participation rate is 20 to 24 years, with 93.9% or 321 individuals in the labor force. Within the labor force, the 30 to 34 years age range has the highest percentage of unemployed individuals, with 71.0% or 44 of them being unemployed.
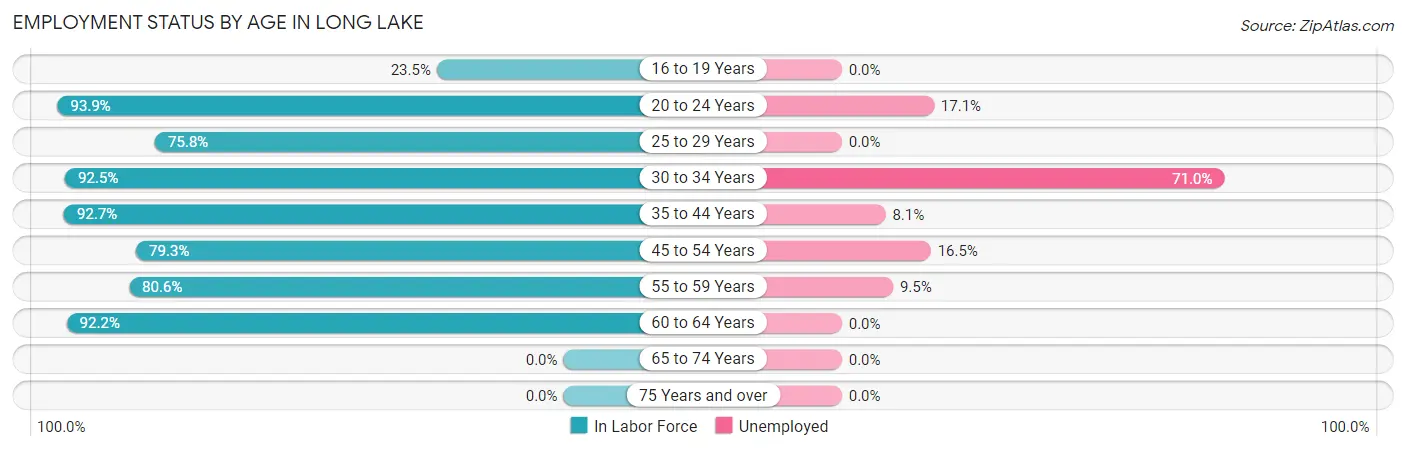
| Age Bracket | In Labor Force | Unemployed |
| 16 to 19 Years | 47 (23.5%) | 0 (0.0%) |
| 20 to 24 Years | 321 (93.9%) | 55 (17.1%) |
| 25 to 29 Years | 144 (75.8%) | 0 (0.0%) |
| 30 to 34 Years | 62 (92.5%) | 44 (71.0%) |
| 35 to 44 Years | 356 (92.7%) | 29 (8.1%) |
| 45 to 54 Years | 345 (79.3%) | 57 (16.5%) |
| 55 to 59 Years | 262 (80.6%) | 25 (9.5%) |
| 60 to 64 Years | 130 (92.2%) | 0 (0.0%) |
| 65 to 74 Years | 0 (0.0%) | 0 (0.0%) |
| 75 Years and over | 0 (0.0%) | 0 (0.0%) |
| Total | 1,667 (70.9%) | 210 (12.6%) |
Employment Status by Educational Attainment in Long Lake
According to labor force statistics for Long Lake, 84.2% of individuals (1,298) out of the total population between 25 and 64 years of age (1,542) are in the labor force, with 11.9% or 154 of them being unemployed. The group with the highest labor force participation rate are those with the educational attainment of bachelor's degree or higher, with 98.7% or 312 individuals in the labor force. Within the labor force, individuals with bachelor's degree or higher education have the highest percentage of unemployment, with 33.3% or 104 of them being unemployed.
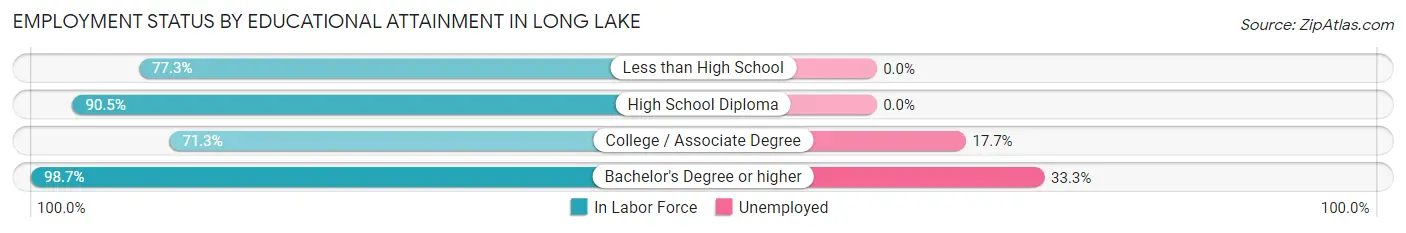
| Educational Attainment | In Labor Force | Unemployed |
| Less than High School | 262 (77.3%) | 0 (0.0%) |
| High School Diploma | 437 (90.5%) | 0 (0.0%) |
| College / Associate Degree | 288 (71.3%) | 72 (17.7%) |
| Bachelor's Degree or higher | 312 (98.7%) | 105 (33.3%) |
| Total | 1,298 (84.2%) | 183 (11.9%) |
Employment Occupations by Sex in Long Lake
Management, Business, Science and Arts Occupations
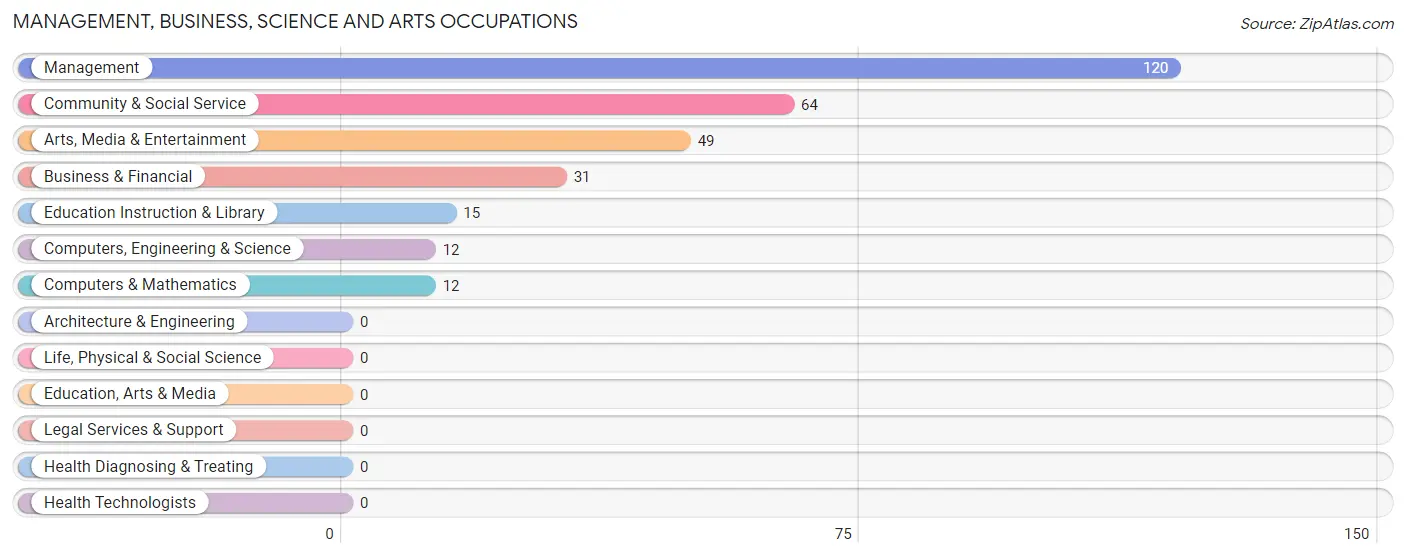
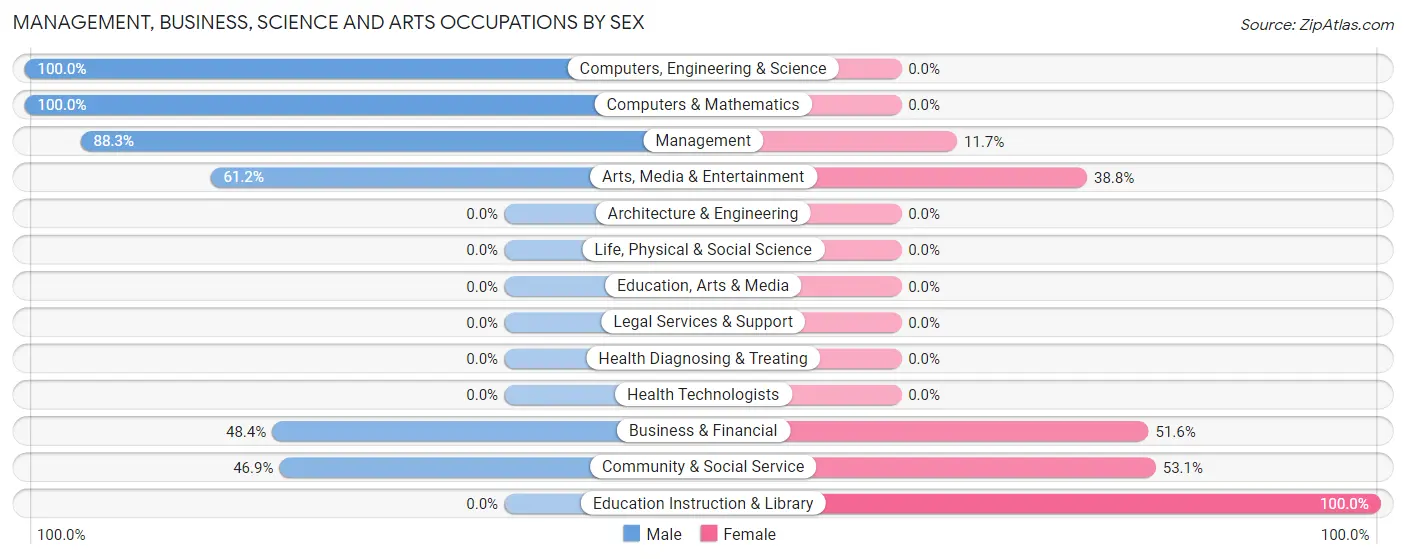
The most common Management, Business, Science and Arts occupations in Long Lake are Management (120 | 8.2%), Community & Social Service (64 | 4.4%), Arts, Media & Entertainment (49 | 3.4%), Business & Financial (31 | 2.1%), and Education Instruction & Library (15 | 1.0%).
Management, Business, Science and Arts Occupations by Sex
Within the Management, Business, Science and Arts occupations in Long Lake, the most male-oriented occupations are Computers, Engineering & Science (100.0%), Computers & Mathematics (100.0%), and Management (88.3%), while the most female-oriented occupations are Education Instruction & Library (100.0%), Community & Social Service (53.1%), and Business & Financial (51.6%).
| Occupation | Male | Female |
| Management | 106 (88.3%) | 14 (11.7%) |
| Business & Financial | 15 (48.4%) | 16 (51.6%) |
| Computers, Engineering & Science | 12 (100.0%) | 0 (0.0%) |
| Computers & Mathematics | 12 (100.0%) | 0 (0.0%) |
| Architecture & Engineering | 0 (0.0%) | 0 (0.0%) |
| Life, Physical & Social Science | 0 (0.0%) | 0 (0.0%) |
| Community & Social Service | 30 (46.9%) | 34 (53.1%) |
| Education, Arts & Media | 0 (0.0%) | 0 (0.0%) |
| Legal Services & Support | 0 (0.0%) | 0 (0.0%) |
| Education Instruction & Library | 0 (0.0%) | 15 (100.0%) |
| Arts, Media & Entertainment | 30 (61.2%) | 19 (38.8%) |
| Health Diagnosing & Treating | 0 (0.0%) | 0 (0.0%) |
| Health Technologists | 0 (0.0%) | 0 (0.0%) |
| Total (Category) | 163 (71.8%) | 64 (28.2%) |
| Total (Overall) | 986 (67.7%) | 471 (32.3%) |
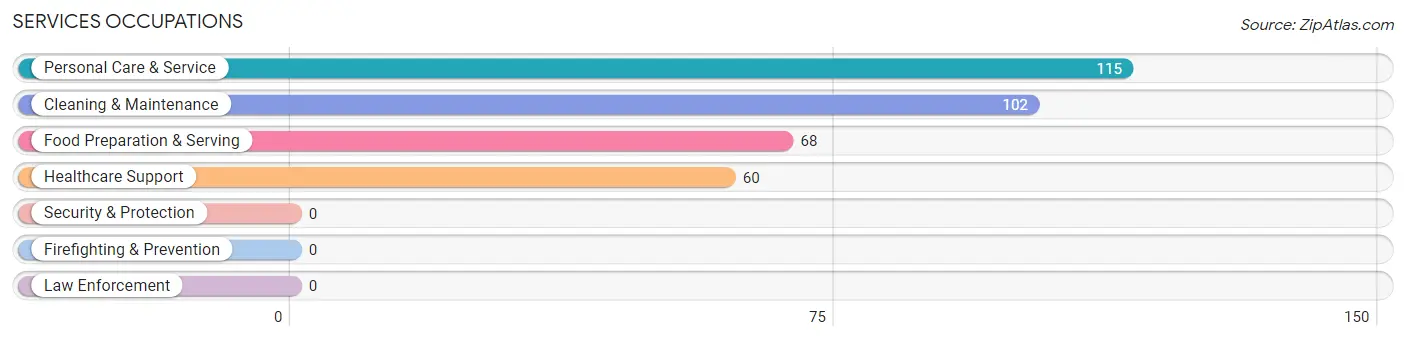
Services Occupations
The most common Services occupations in Long Lake are Personal Care & Service (115 | 7.9%), Cleaning & Maintenance (102 | 7.0%), Food Preparation & Serving (68 | 4.7%), and Healthcare Support (60 | 4.1%).
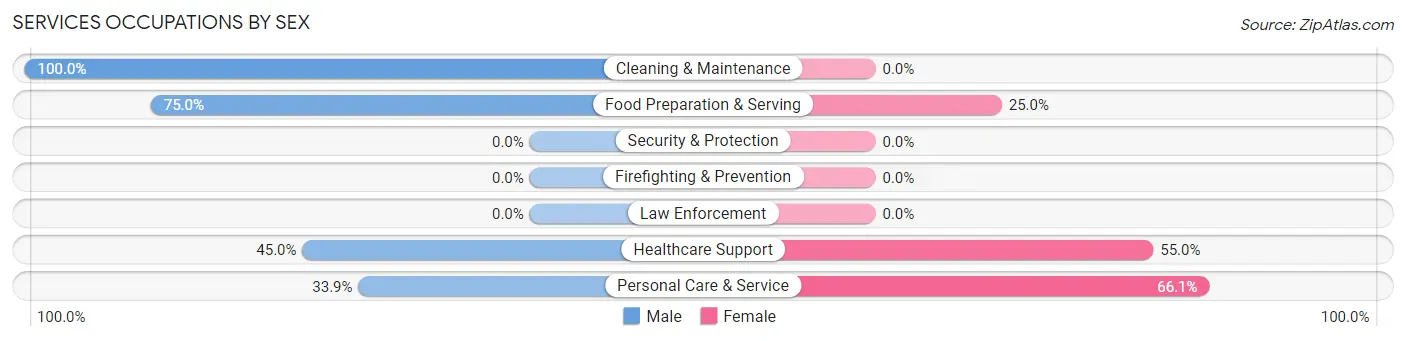
Services Occupations by Sex
Within the Services occupations in Long Lake, the most male-oriented occupations are Cleaning & Maintenance (100.0%), Food Preparation & Serving (75.0%), and Healthcare Support (45.0%), while the most female-oriented occupations are Personal Care & Service (66.1%), Healthcare Support (55.0%), and Food Preparation & Serving (25.0%).
| Occupation | Male | Female |
| Healthcare Support | 27 (45.0%) | 33 (55.0%) |
| Security & Protection | 0 (0.0%) | 0 (0.0%) |
| Firefighting & Prevention | 0 (0.0%) | 0 (0.0%) |
| Law Enforcement | 0 (0.0%) | 0 (0.0%) |
| Food Preparation & Serving | 51 (75.0%) | 17 (25.0%) |
| Cleaning & Maintenance | 102 (100.0%) | 0 (0.0%) |
| Personal Care & Service | 39 (33.9%) | 76 (66.1%) |
| Total (Category) | 219 (63.5%) | 126 (36.5%) |
| Total (Overall) | 986 (67.7%) | 471 (32.3%) |
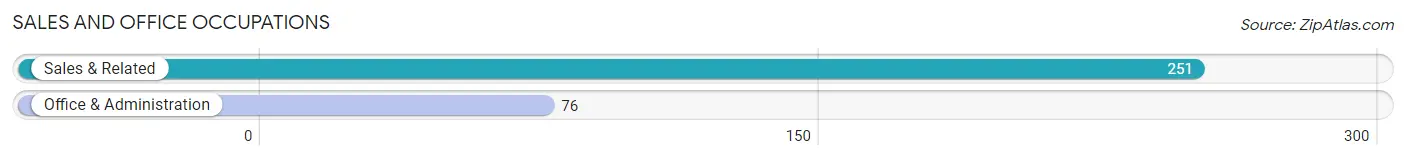
Sales and Office Occupations
The most common Sales and Office occupations in Long Lake are Sales & Related (251 | 17.2%), and Office & Administration (76 | 5.2%).
Sales and Office Occupations by Sex
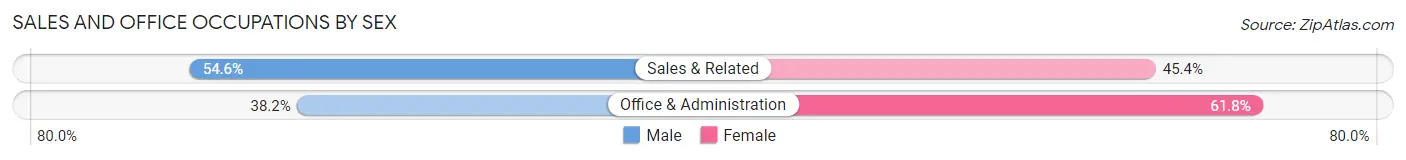
| Occupation | Male | Female |
| Sales & Related | 137 (54.6%) | 114 (45.4%) |
| Office & Administration | 29 (38.2%) | 47 (61.8%) |
| Total (Category) | 166 (50.8%) | 161 (49.2%) |
| Total (Overall) | 986 (67.7%) | 471 (32.3%) |
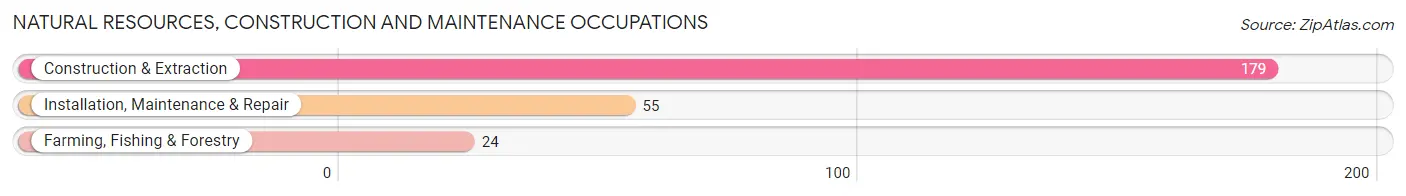
Natural Resources, Construction and Maintenance Occupations
The most common Natural Resources, Construction and Maintenance occupations in Long Lake are Construction & Extraction (179 | 12.3%), Installation, Maintenance & Repair (55 | 3.8%), and Farming, Fishing & Forestry (24 | 1.7%).
Natural Resources, Construction and Maintenance Occupations by Sex
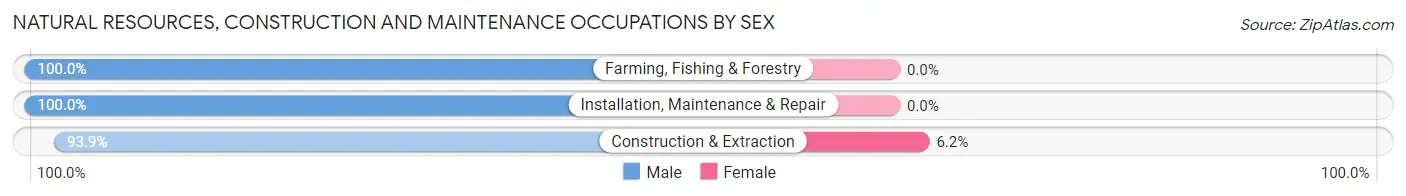
| Occupation | Male | Female |
| Farming, Fishing & Forestry | 24 (100.0%) | 0 (0.0%) |
| Construction & Extraction | 168 (93.9%) | 11 (6.1%) |
| Installation, Maintenance & Repair | 55 (100.0%) | 0 (0.0%) |
| Total (Category) | 247 (95.7%) | 11 (4.3%) |
| Total (Overall) | 986 (67.7%) | 471 (32.3%) |
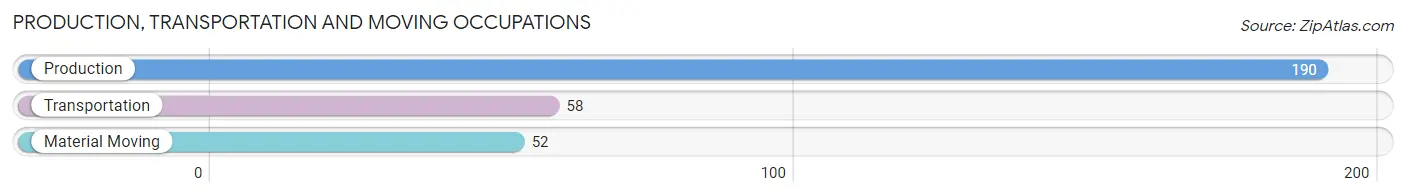
Production, Transportation and Moving Occupations
The most common Production, Transportation and Moving occupations in Long Lake are Production (190 | 13.0%), Transportation (58 | 4.0%), and Material Moving (52 | 3.6%).
Production, Transportation and Moving Occupations by Sex
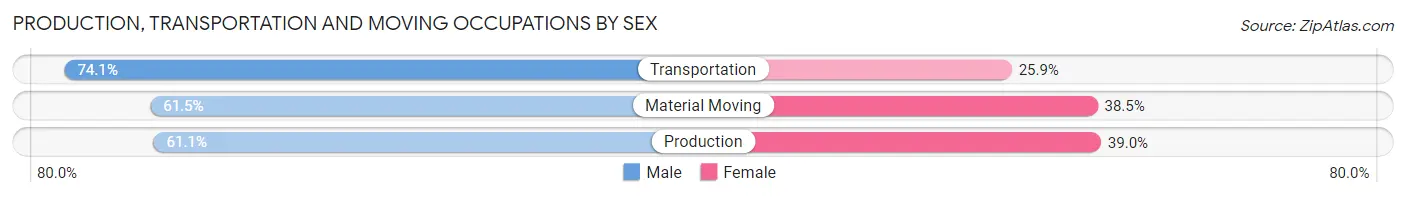
| Occupation | Male | Female |
| Production | 116 (61.1%) | 74 (39.0%) |
| Transportation | 43 (74.1%) | 15 (25.9%) |
| Material Moving | 32 (61.5%) | 20 (38.5%) |
| Total (Category) | 191 (63.7%) | 109 (36.3%) |
| Total (Overall) | 986 (67.7%) | 471 (32.3%) |
Employment Industries by Sex in Long Lake
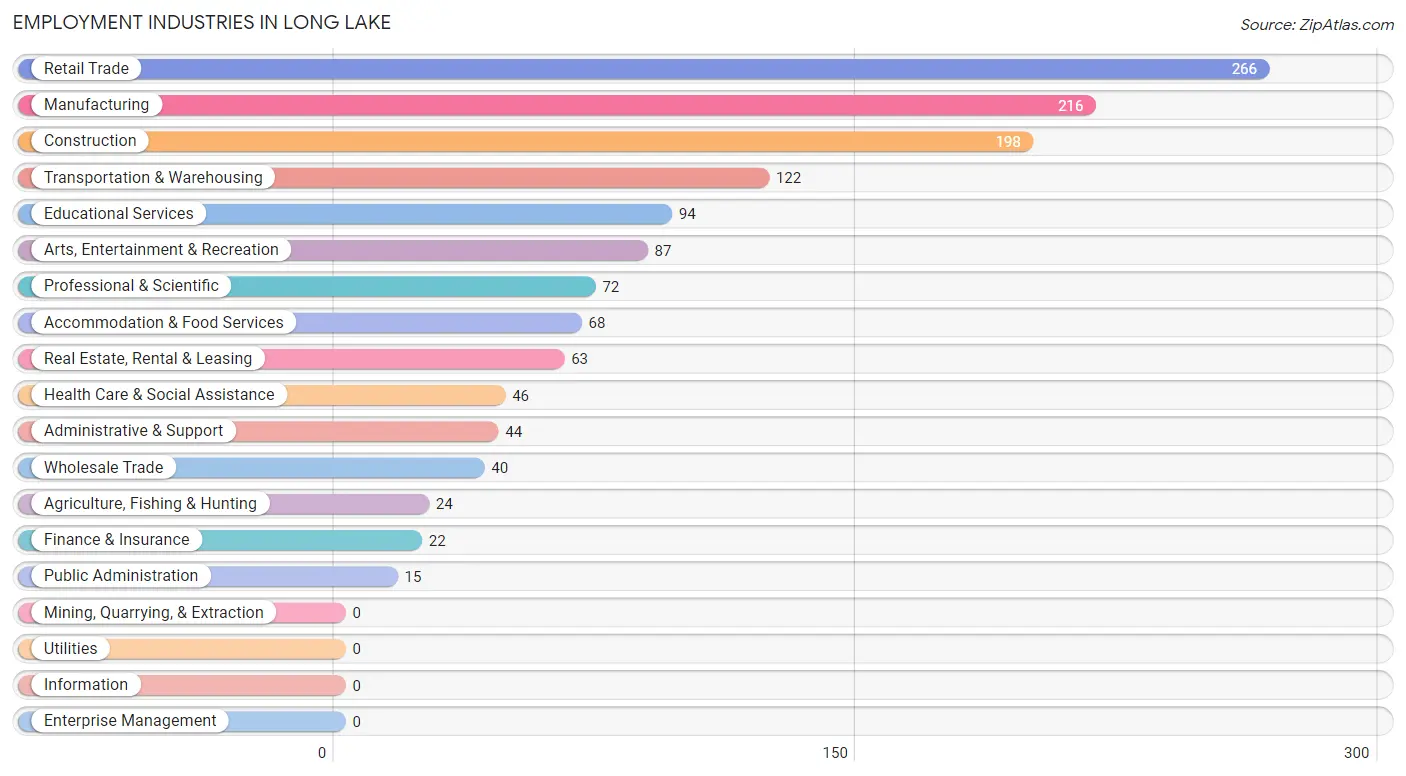
Employment Industries in Long Lake
The major employment industries in Long Lake include Retail Trade (266 | 18.3%), Manufacturing (216 | 14.8%), Construction (198 | 13.6%), Transportation & Warehousing (122 | 8.4%), and Educational Services (94 | 6.5%).
Employment Industries by Sex in Long Lake
The Long Lake industries that see more men than women are Agriculture, Fishing & Hunting (100.0%), Construction (100.0%), and Finance & Insurance (100.0%), whereas the industries that tend to have a higher number of women are Wholesale Trade (100.0%), Public Administration (100.0%), and Educational Services (68.1%).
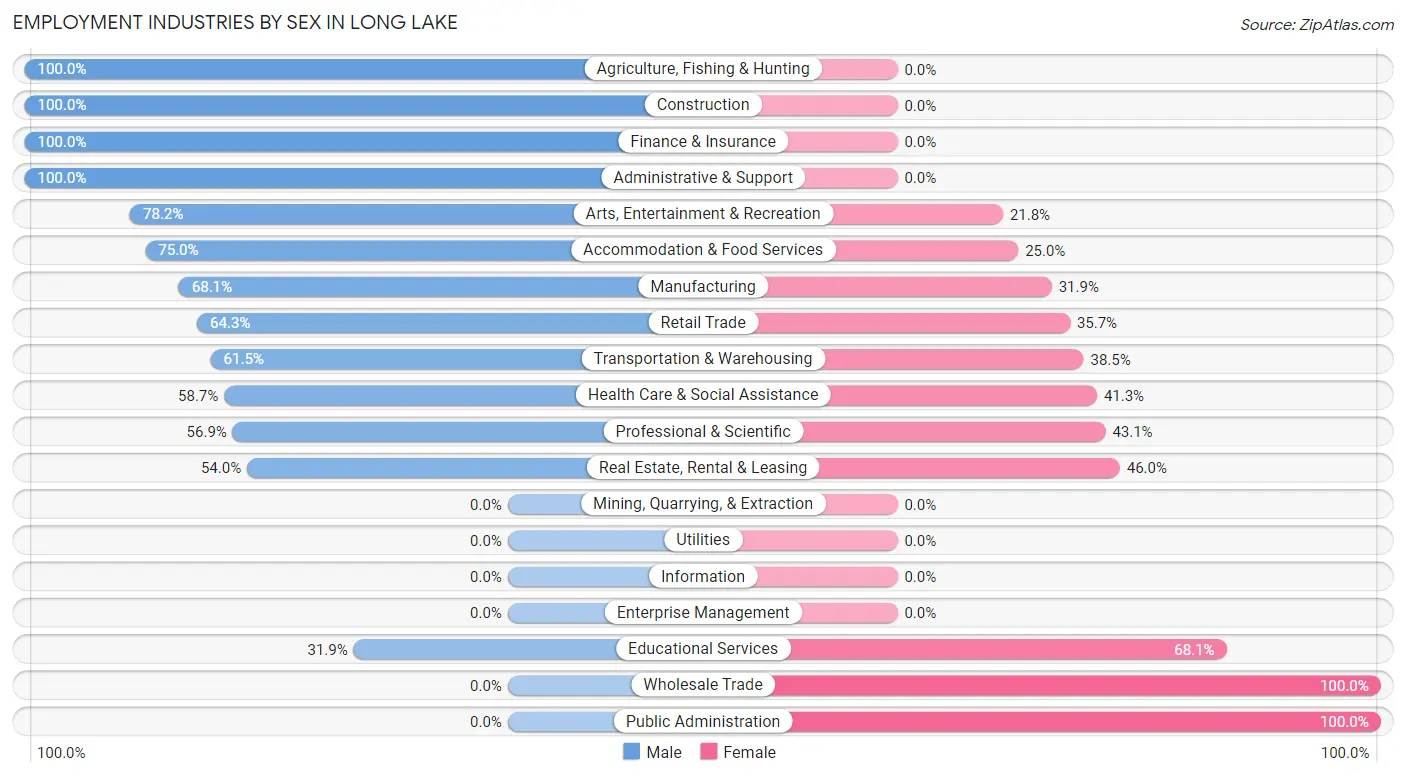
| Industry | Male | Female |
| Agriculture, Fishing & Hunting | 24 (100.0%) | 0 (0.0%) |
| Mining, Quarrying, & Extraction | 0 (0.0%) | 0 (0.0%) |
| Construction | 198 (100.0%) | 0 (0.0%) |
| Manufacturing | 147 (68.1%) | 69 (31.9%) |
| Wholesale Trade | 0 (0.0%) | 40 (100.0%) |
| Retail Trade | 171 (64.3%) | 95 (35.7%) |
| Transportation & Warehousing | 75 (61.5%) | 47 (38.5%) |
| Utilities | 0 (0.0%) | 0 (0.0%) |
| Information | 0 (0.0%) | 0 (0.0%) |
| Finance & Insurance | 22 (100.0%) | 0 (0.0%) |
| Real Estate, Rental & Leasing | 34 (54.0%) | 29 (46.0%) |
| Professional & Scientific | 41 (56.9%) | 31 (43.1%) |
| Enterprise Management | 0 (0.0%) | 0 (0.0%) |
| Administrative & Support | 44 (100.0%) | 0 (0.0%) |
| Educational Services | 30 (31.9%) | 64 (68.1%) |
| Health Care & Social Assistance | 27 (58.7%) | 19 (41.3%) |
| Arts, Entertainment & Recreation | 68 (78.2%) | 19 (21.8%) |
| Accommodation & Food Services | 51 (75.0%) | 17 (25.0%) |
| Public Administration | 0 (0.0%) | 15 (100.0%) |
| Total | 986 (67.7%) | 471 (32.3%) |
Education in Long Lake
School Enrollment in Long Lake
The most common levels of schooling among the 829 students in Long Lake are high school (274 | 33.1%), middle school (243 | 29.3%), and college / undergraduate (152 | 18.3%).
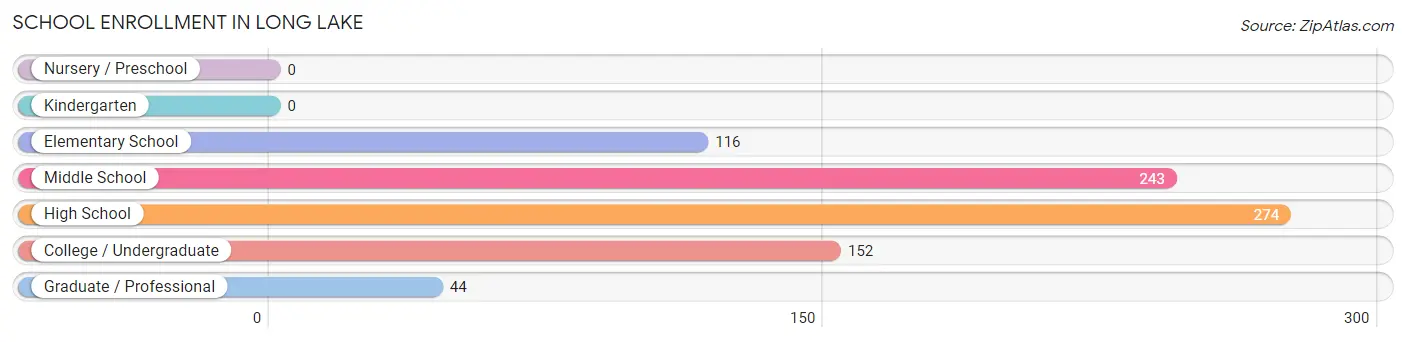
| School Level | # Students | % Students |
| Nursery / Preschool | 0 | 0.0% |
| Kindergarten | 0 | 0.0% |
| Elementary School | 116 | 14.0% |
| Middle School | 243 | 29.3% |
| High School | 274 | 33.1% |
| College / Undergraduate | 152 | 18.3% |
| Graduate / Professional | 44 | 5.3% |
| Total | 829 | 100.0% |
School Enrollment by Age by Funding Source in Long Lake
Out of a total of 829 students who are enrolled in schools in Long Lake, 44 (5.3%) attend a private institution, while the remaining 785 (94.7%) are enrolled in public schools. The age group of 35 years and over has the highest likelihood of being enrolled in private schools, with 44 (91.7% in the age bracket) enrolled. Conversely, the age group of 5 to 9 year old has the lowest likelihood of being enrolled in a private school, with 112 (100.0% in the age bracket) attending a public institution.
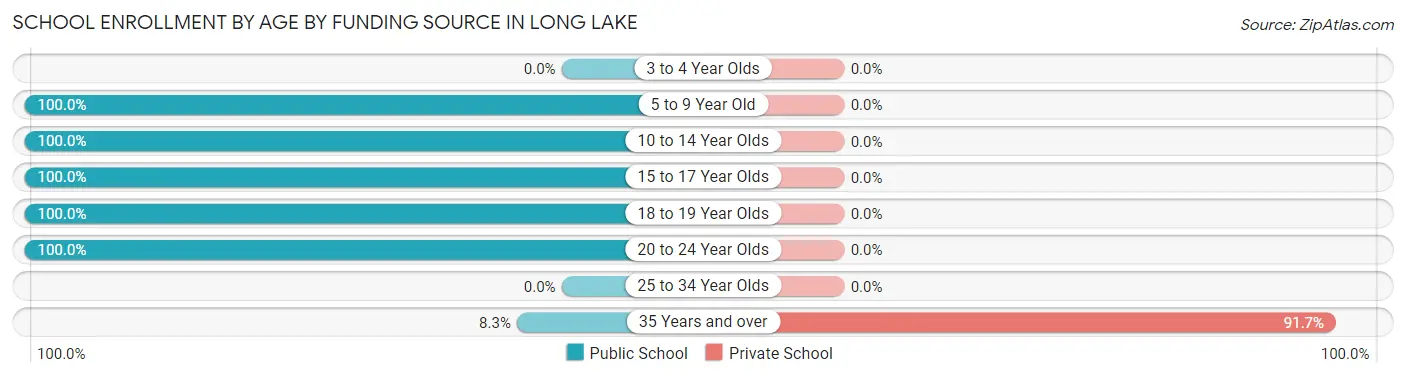
| Age Bracket | Public School | Private School |
| 3 to 4 Year Olds | 0 (0.0%) | 0 (0.0%) |
| 5 to 9 Year Old | 112 (100.0%) | 0 (0.0%) |
| 10 to 14 Year Olds | 278 (100.0%) | 0 (0.0%) |
| 15 to 17 Year Olds | 187 (100.0%) | 0 (0.0%) |
| 18 to 19 Year Olds | 72 (100.0%) | 0 (0.0%) |
| 20 to 24 Year Olds | 132 (100.0%) | 0 (0.0%) |
| 25 to 34 Year Olds | 0 (0.0%) | 0 (0.0%) |
| 35 Years and over | 4 (8.3%) | 44 (91.7%) |
| Total | 785 (94.7%) | 44 (5.3%) |
Educational Attainment by Field of Study in Long Lake
Business (142 | 39.2%), social sciences (79 | 21.8%), arts & humanities (55 | 15.2%), science & technology (30 | 8.3%), and engineering (23 | 6.4%) are the most common fields of study among 362 individuals in Long Lake who have obtained a bachelor's degree or higher.
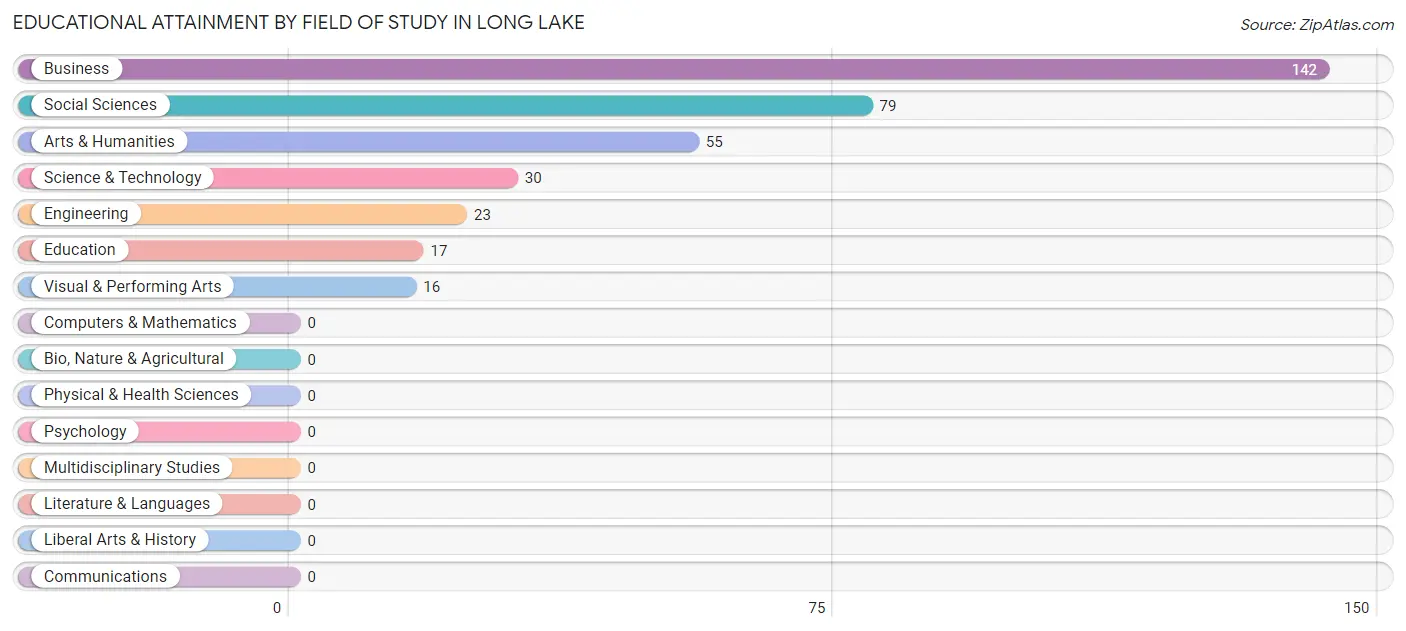
| Field of Study | # Graduates | % Graduates |
| Computers & Mathematics | 0 | 0.0% |
| Bio, Nature & Agricultural | 0 | 0.0% |
| Physical & Health Sciences | 0 | 0.0% |
| Psychology | 0 | 0.0% |
| Social Sciences | 79 | 21.8% |
| Engineering | 23 | 6.4% |
| Multidisciplinary Studies | 0 | 0.0% |
| Science & Technology | 30 | 8.3% |
| Business | 142 | 39.2% |
| Education | 17 | 4.7% |
| Literature & Languages | 0 | 0.0% |
| Liberal Arts & History | 0 | 0.0% |
| Visual & Performing Arts | 16 | 4.4% |
| Communications | 0 | 0.0% |
| Arts & Humanities | 55 | 15.2% |
| Total | 362 | 100.0% |
Transportation & Commute in Long Lake
Vehicle Availability by Sex in Long Lake
The most prevalent vehicle ownership categories in Long Lake are males with 3 vehicles (369, accounting for 38.3%) and females with 3 vehicles (123, making up 80.9%).
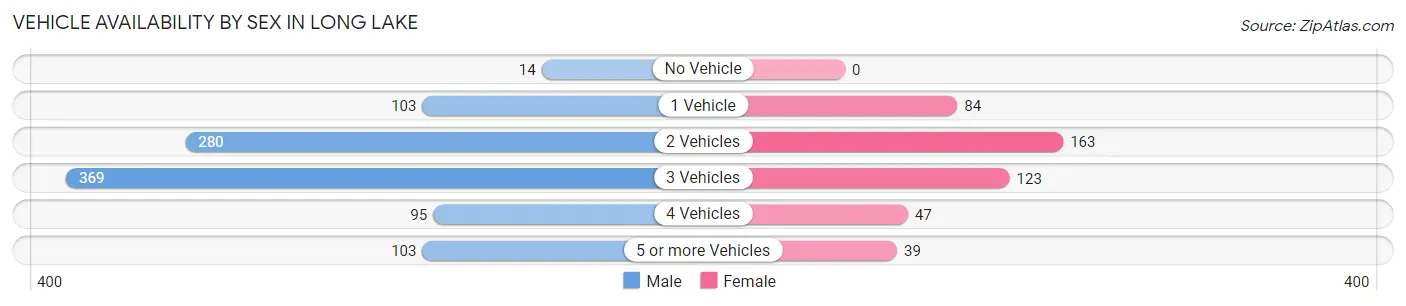
| Vehicles Available | Male | Female |
| No Vehicle | 14 (1.5%) | 0 (0.0%) |
| 1 Vehicle | 103 (10.7%) | 84 (18.4%) |
| 2 Vehicles | 280 (29.0%) | 163 (35.7%) |
| 3 Vehicles | 369 (38.3%) | 123 (27.0%) |
| 4 Vehicles | 95 (9.9%) | 47 (10.3%) |
| 5 or more Vehicles | 103 (10.7%) | 39 (8.6%) |
| Total | 964 (100.0%) | 456 (100.0%) |
Commute Time in Long Lake
The most frequently occuring commute durations in Long Lake are 30 to 34 minutes (200 commuters, 15.0%), 10 to 14 minutes (191 commuters, 14.3%), and 40 to 44 minutes (130 commuters, 9.7%).
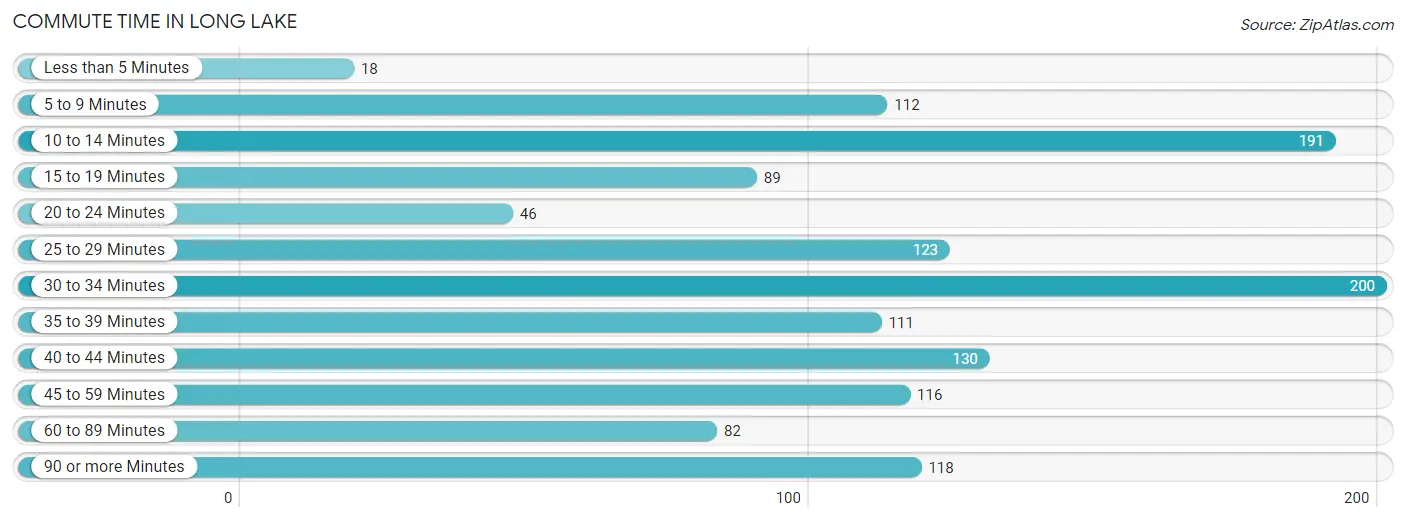
| Commute Time | # Commuters | % Commuters |
| Less than 5 Minutes | 18 | 1.3% |
| 5 to 9 Minutes | 112 | 8.4% |
| 10 to 14 Minutes | 191 | 14.3% |
| 15 to 19 Minutes | 89 | 6.7% |
| 20 to 24 Minutes | 46 | 3.4% |
| 25 to 29 Minutes | 123 | 9.2% |
| 30 to 34 Minutes | 200 | 15.0% |
| 35 to 39 Minutes | 111 | 8.3% |
| 40 to 44 Minutes | 130 | 9.7% |
| 45 to 59 Minutes | 116 | 8.7% |
| 60 to 89 Minutes | 82 | 6.1% |
| 90 or more Minutes | 118 | 8.8% |
Commute Time by Sex in Long Lake
The most common commute times in Long Lake are 10 to 14 minutes (148 commuters, 16.3%) for males and 30 to 34 minutes (67 commuters, 15.8%) for females.
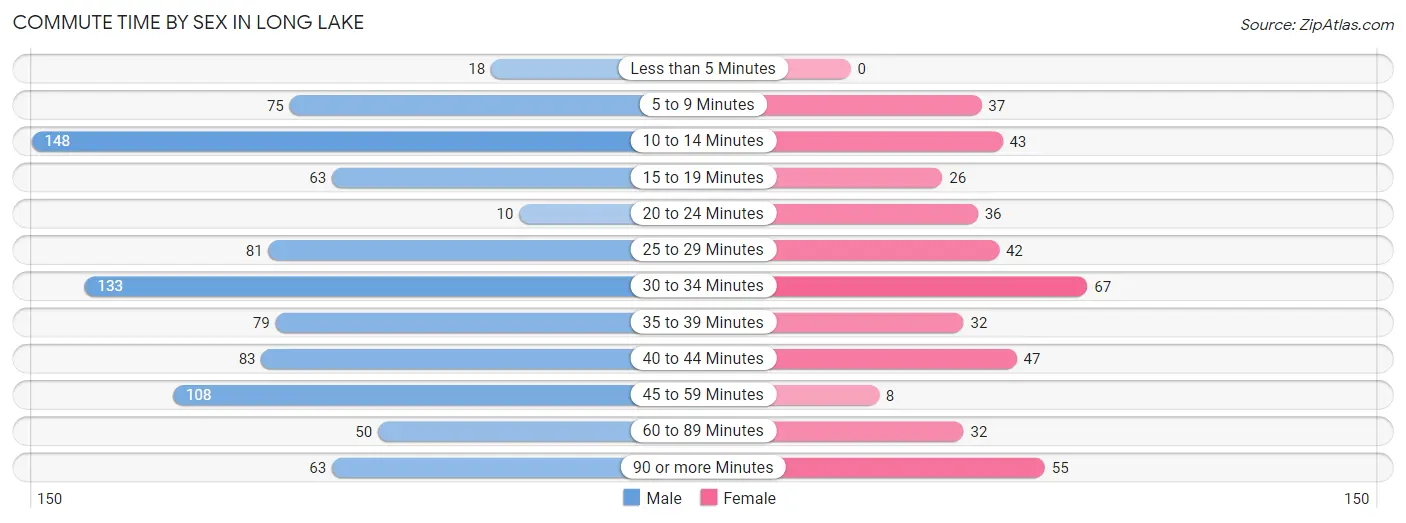
| Commute Time | Male | Female |
| Less than 5 Minutes | 18 (2.0%) | 0 (0.0%) |
| 5 to 9 Minutes | 75 (8.2%) | 37 (8.7%) |
| 10 to 14 Minutes | 148 (16.3%) | 43 (10.1%) |
| 15 to 19 Minutes | 63 (6.9%) | 26 (6.1%) |
| 20 to 24 Minutes | 10 (1.1%) | 36 (8.5%) |
| 25 to 29 Minutes | 81 (8.9%) | 42 (9.9%) |
| 30 to 34 Minutes | 133 (14.6%) | 67 (15.8%) |
| 35 to 39 Minutes | 79 (8.7%) | 32 (7.5%) |
| 40 to 44 Minutes | 83 (9.1%) | 47 (11.1%) |
| 45 to 59 Minutes | 108 (11.9%) | 8 (1.9%) |
| 60 to 89 Minutes | 50 (5.5%) | 32 (7.5%) |
| 90 or more Minutes | 63 (6.9%) | 55 (12.9%) |
Time of Departure to Work by Sex in Long Lake
The most frequent times of departure to work in Long Lake are 6:00 AM to 6:29 AM (212, 23.3%) for males and 5:30 AM to 5:59 AM (71, 16.7%) for females.
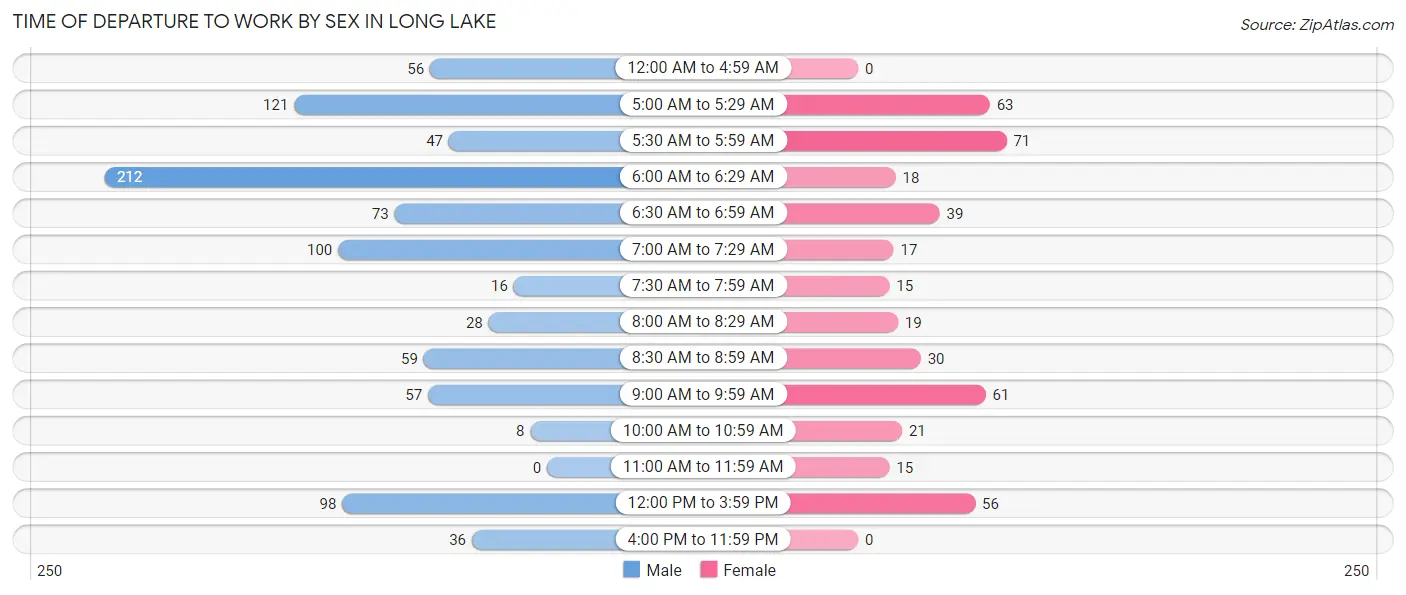
| Time of Departure | Male | Female |
| 12:00 AM to 4:59 AM | 56 (6.1%) | 0 (0.0%) |
| 5:00 AM to 5:29 AM | 121 (13.3%) | 63 (14.8%) |
| 5:30 AM to 5:59 AM | 47 (5.2%) | 71 (16.7%) |
| 6:00 AM to 6:29 AM | 212 (23.3%) | 18 (4.2%) |
| 6:30 AM to 6:59 AM | 73 (8.0%) | 39 (9.2%) |
| 7:00 AM to 7:29 AM | 100 (11.0%) | 17 (4.0%) |
| 7:30 AM to 7:59 AM | 16 (1.8%) | 15 (3.5%) |
| 8:00 AM to 8:29 AM | 28 (3.1%) | 19 (4.5%) |
| 8:30 AM to 8:59 AM | 59 (6.5%) | 30 (7.1%) |
| 9:00 AM to 9:59 AM | 57 (6.3%) | 61 (14.3%) |
| 10:00 AM to 10:59 AM | 8 (0.9%) | 21 (4.9%) |
| 11:00 AM to 11:59 AM | 0 (0.0%) | 15 (3.5%) |
| 12:00 PM to 3:59 PM | 98 (10.8%) | 56 (13.2%) |
| 4:00 PM to 11:59 PM | 36 (4.0%) | 0 (0.0%) |
| Total | 911 (100.0%) | 425 (100.0%) |
Housing Occupancy in Long Lake
Occupancy by Ownership in Long Lake
Of the total 992 dwellings in Long Lake, owner-occupied units account for 738 (74.4%), while renter-occupied units make up 254 (25.6%).
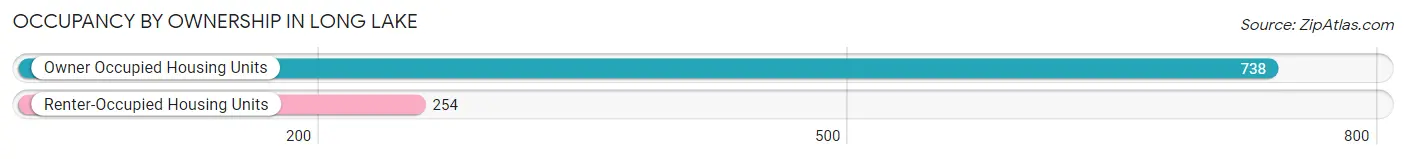
| Occupancy | # Housing Units | % Housing Units |
| Owner Occupied Housing Units | 738 | 74.4% |
| Renter-Occupied Housing Units | 254 | 25.6% |
| Total Occupied Housing Units | 992 | 100.0% |
Occupancy by Household Size in Long Lake
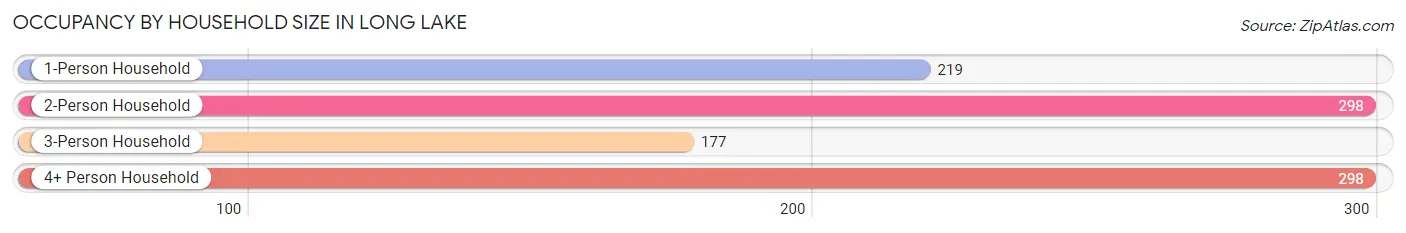
| Household Size | # Housing Units | % Housing Units |
| 1-Person Household | 219 | 22.1% |
| 2-Person Household | 298 | 30.0% |
| 3-Person Household | 177 | 17.8% |
| 4+ Person Household | 298 | 30.0% |
| Total Housing Units | 992 | 100.0% |
Occupancy by Ownership by Household Size in Long Lake
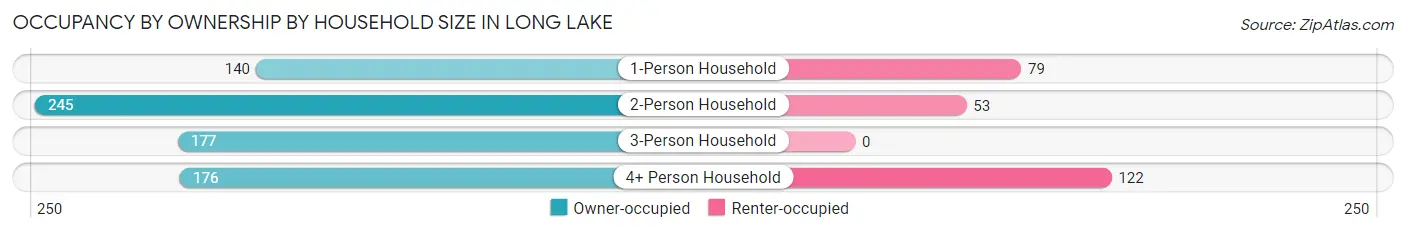
| Household Size | Owner-occupied | Renter-occupied |
| 1-Person Household | 140 (63.9%) | 79 (36.1%) |
| 2-Person Household | 245 (82.2%) | 53 (17.8%) |
| 3-Person Household | 177 (100.0%) | 0 (0.0%) |
| 4+ Person Household | 176 (59.1%) | 122 (40.9%) |
| Total Housing Units | 738 (74.4%) | 254 (25.6%) |
Occupancy by Educational Attainment in Long Lake
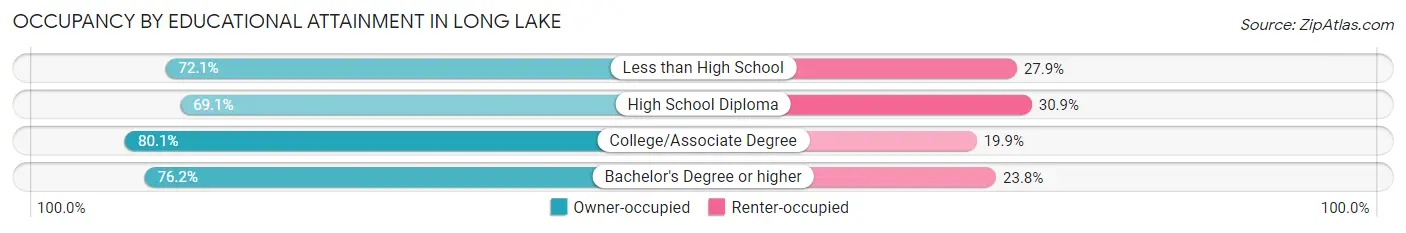
| Household Size | Owner-occupied | Renter-occupied |
| Less than High School | 124 (72.1%) | 48 (27.9%) |
| High School Diploma | 224 (69.1%) | 100 (30.9%) |
| College/Associate Degree | 249 (80.1%) | 62 (19.9%) |
| Bachelor's Degree or higher | 141 (76.2%) | 44 (23.8%) |
Occupancy by Age of Householder in Long Lake
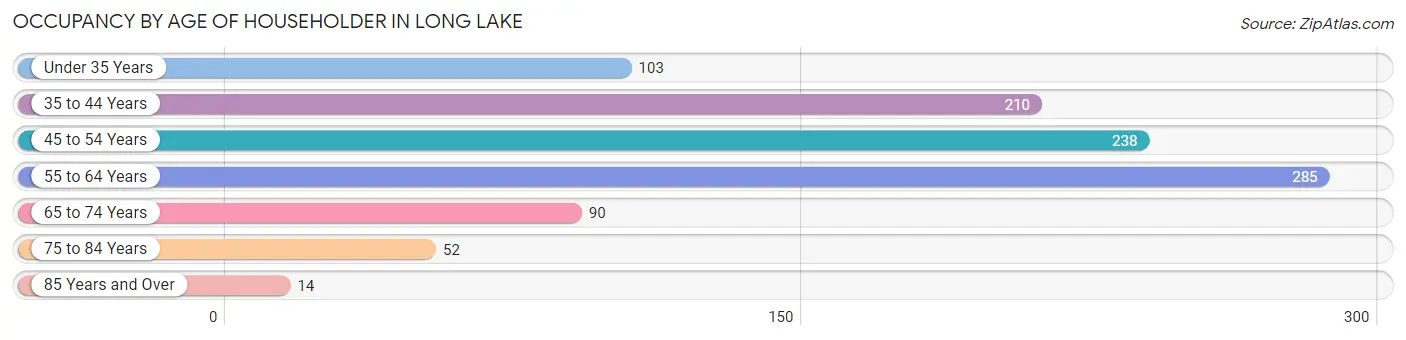
| Age Bracket | # Households | % Households |
| Under 35 Years | 103 | 10.4% |
| 35 to 44 Years | 210 | 21.2% |
| 45 to 54 Years | 238 | 24.0% |
| 55 to 64 Years | 285 | 28.7% |
| 65 to 74 Years | 90 | 9.1% |
| 75 to 84 Years | 52 | 5.2% |
| 85 Years and Over | 14 | 1.4% |
| Total | 992 | 100.0% |
Housing Finances in Long Lake
Median Income by Occupancy in Long Lake
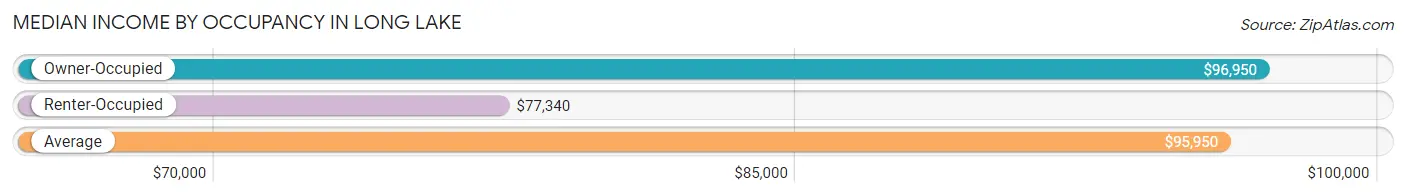
| Occupancy Type | # Households | Median Income |
| Owner-Occupied | 738 (74.4%) | $96,950 |
| Renter-Occupied | 254 (25.6%) | $77,340 |
| Average | 992 (100.0%) | $95,950 |
Occupancy by Householder Income Bracket in Long Lake
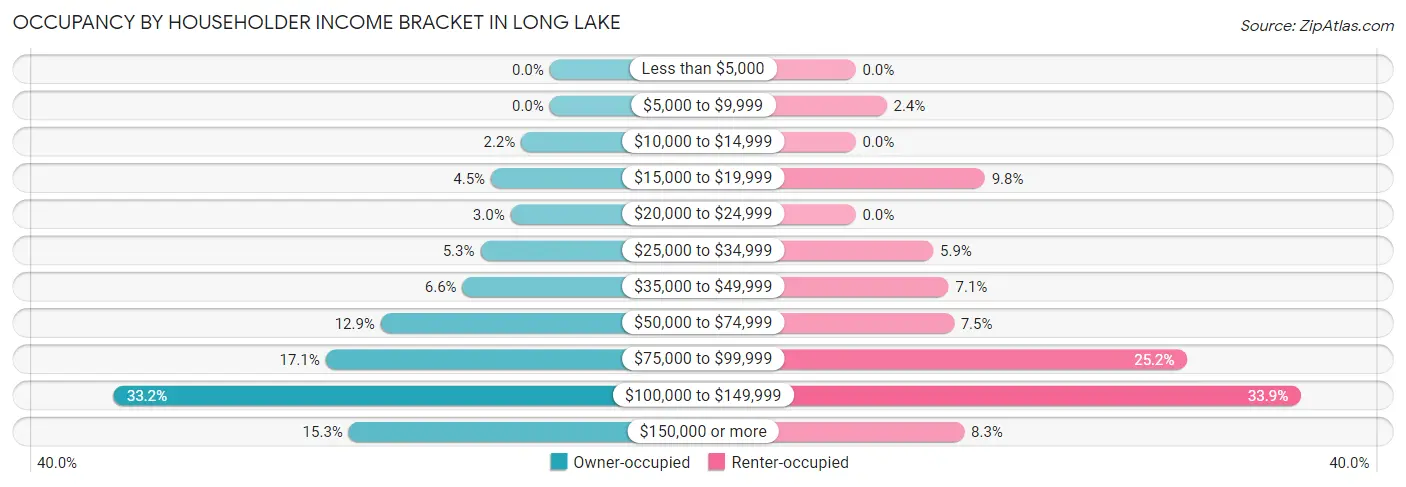
| Income Bracket | Owner-occupied | Renter-occupied |
| Less than $5,000 | 0 (0.0%) | 0 (0.0%) |
| $5,000 to $9,999 | 0 (0.0%) | 6 (2.4%) |
| $10,000 to $14,999 | 16 (2.2%) | 0 (0.0%) |
| $15,000 to $19,999 | 33 (4.5%) | 25 (9.8%) |
| $20,000 to $24,999 | 22 (3.0%) | 0 (0.0%) |
| $25,000 to $34,999 | 39 (5.3%) | 15 (5.9%) |
| $35,000 to $49,999 | 49 (6.6%) | 18 (7.1%) |
| $50,000 to $74,999 | 95 (12.9%) | 19 (7.5%) |
| $75,000 to $99,999 | 126 (17.1%) | 64 (25.2%) |
| $100,000 to $149,999 | 245 (33.2%) | 86 (33.9%) |
| $150,000 or more | 113 (15.3%) | 21 (8.3%) |
| Total | 738 (100.0%) | 254 (100.0%) |
Monthly Housing Cost Tiers in Long Lake
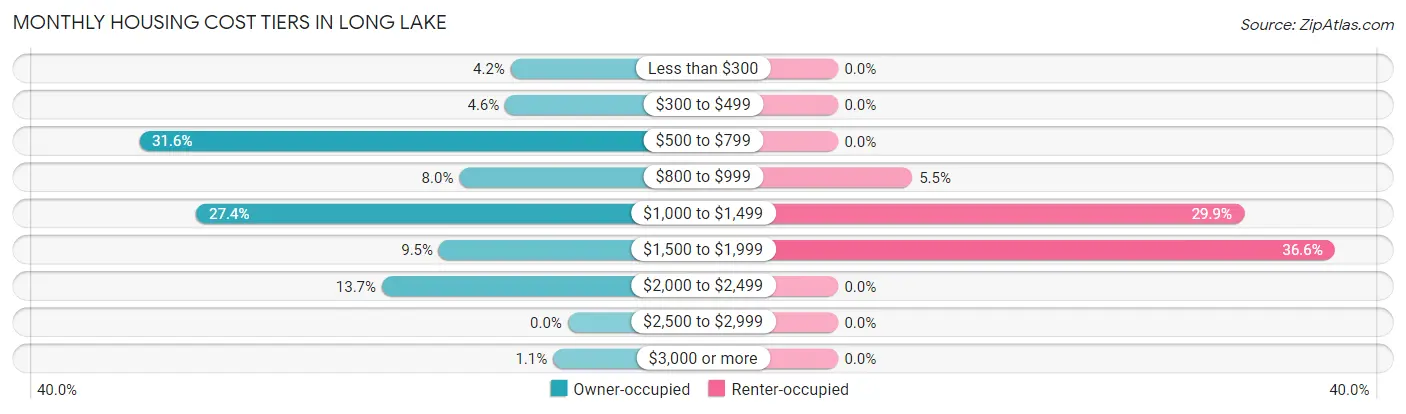
| Monthly Cost | Owner-occupied | Renter-occupied |
| Less than $300 | 31 (4.2%) | 0 (0.0%) |
| $300 to $499 | 34 (4.6%) | 0 (0.0%) |
| $500 to $799 | 233 (31.6%) | 0 (0.0%) |
| $800 to $999 | 59 (8.0%) | 14 (5.5%) |
| $1,000 to $1,499 | 202 (27.4%) | 76 (29.9%) |
| $1,500 to $1,999 | 70 (9.5%) | 93 (36.6%) |
| $2,000 to $2,499 | 101 (13.7%) | 0 (0.0%) |
| $2,500 to $2,999 | 0 (0.0%) | 0 (0.0%) |
| $3,000 or more | 8 (1.1%) | 0 (0.0%) |
| Total | 738 (100.0%) | 254 (100.0%) |
Physical Housing Characteristics in Long Lake
Housing Structures in Long Lake
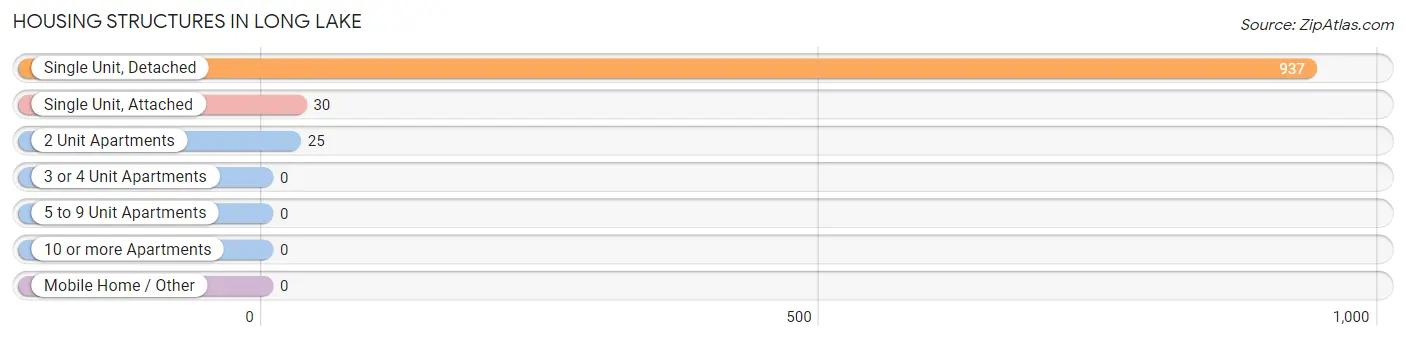
| Structure Type | # Housing Units | % Housing Units |
| Single Unit, Detached | 937 | 94.5% |
| Single Unit, Attached | 30 | 3.0% |
| 2 Unit Apartments | 25 | 2.5% |
| 3 or 4 Unit Apartments | 0 | 0.0% |
| 5 to 9 Unit Apartments | 0 | 0.0% |
| 10 or more Apartments | 0 | 0.0% |
| Mobile Home / Other | 0 | 0.0% |
| Total | 992 | 100.0% |
Housing Structures by Occupancy in Long Lake
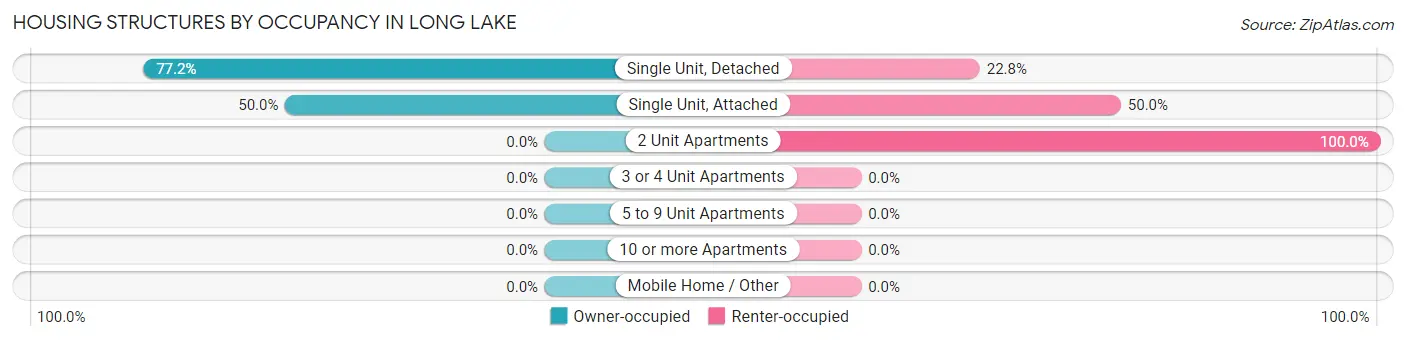
| Structure Type | Owner-occupied | Renter-occupied |
| Single Unit, Detached | 723 (77.2%) | 214 (22.8%) |
| Single Unit, Attached | 15 (50.0%) | 15 (50.0%) |
| 2 Unit Apartments | 0 (0.0%) | 25 (100.0%) |
| 3 or 4 Unit Apartments | 0 (0.0%) | 0 (0.0%) |
| 5 to 9 Unit Apartments | 0 (0.0%) | 0 (0.0%) |
| 10 or more Apartments | 0 (0.0%) | 0 (0.0%) |
| Mobile Home / Other | 0 (0.0%) | 0 (0.0%) |
| Total | 738 (74.4%) | 254 (25.6%) |
Housing Structures by Number of Rooms in Long Lake
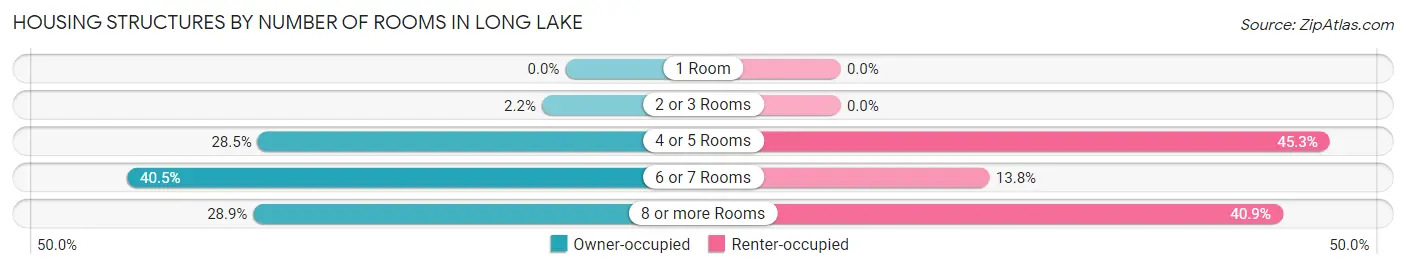
| Number of Rooms | Owner-occupied | Renter-occupied |
| 1 Room | 0 (0.0%) | 0 (0.0%) |
| 2 or 3 Rooms | 16 (2.2%) | 0 (0.0%) |
| 4 or 5 Rooms | 210 (28.5%) | 115 (45.3%) |
| 6 or 7 Rooms | 299 (40.5%) | 35 (13.8%) |
| 8 or more Rooms | 213 (28.9%) | 104 (40.9%) |
| Total | 738 (100.0%) | 254 (100.0%) |
Housing Structure by Heating Type in Long Lake
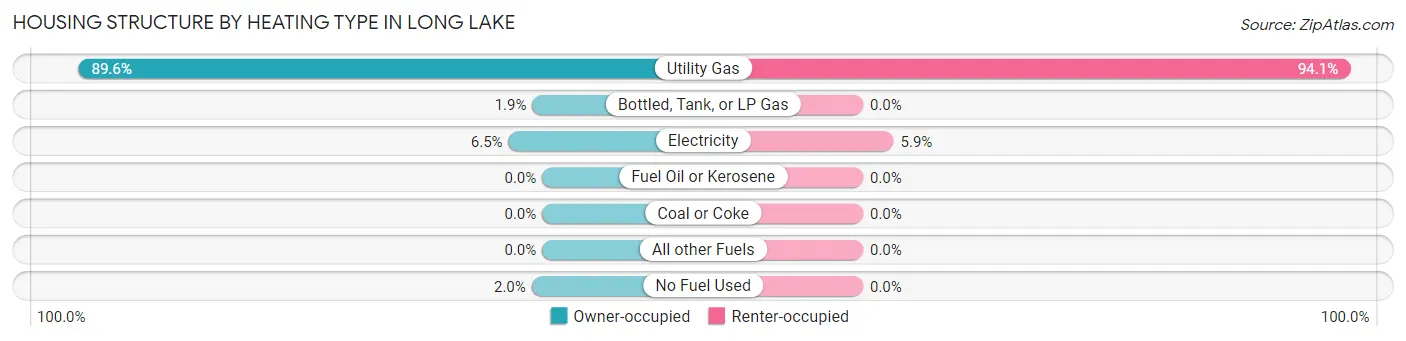
| Heating Type | Owner-occupied | Renter-occupied |
| Utility Gas | 661 (89.6%) | 239 (94.1%) |
| Bottled, Tank, or LP Gas | 14 (1.9%) | 0 (0.0%) |
| Electricity | 48 (6.5%) | 15 (5.9%) |
| Fuel Oil or Kerosene | 0 (0.0%) | 0 (0.0%) |
| Coal or Coke | 0 (0.0%) | 0 (0.0%) |
| All other Fuels | 0 (0.0%) | 0 (0.0%) |
| No Fuel Used | 15 (2.0%) | 0 (0.0%) |
| Total | 738 (100.0%) | 254 (100.0%) |
Household Vehicle Usage in Long Lake
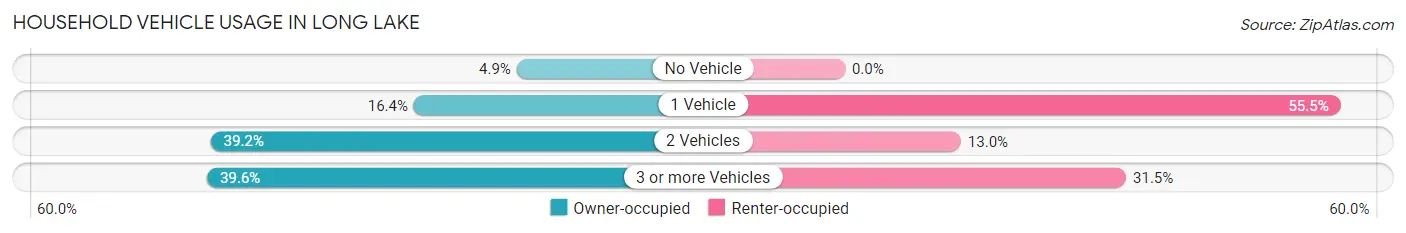
| Vehicles per Household | Owner-occupied | Renter-occupied |
| No Vehicle | 36 (4.9%) | 0 (0.0%) |
| 1 Vehicle | 121 (16.4%) | 141 (55.5%) |
| 2 Vehicles | 289 (39.2%) | 33 (13.0%) |
| 3 or more Vehicles | 292 (39.6%) | 80 (31.5%) |
| Total | 738 (100.0%) | 254 (100.0%) |
Real Estate & Mortgages in Long Lake
Real Estate and Mortgage Overview in Long Lake
| Characteristic | Without Mortgage | With Mortgage |
| Housing Units | 327 | 411 |
| Median Property Value | $177,100 | $168,000 |
| Median Household Income | $76,761 | $59 |
| Monthly Housing Costs | $721 | $8 |
| Real Estate Taxes | $4,678 | $0 |
Property Value by Mortgage Status in Long Lake
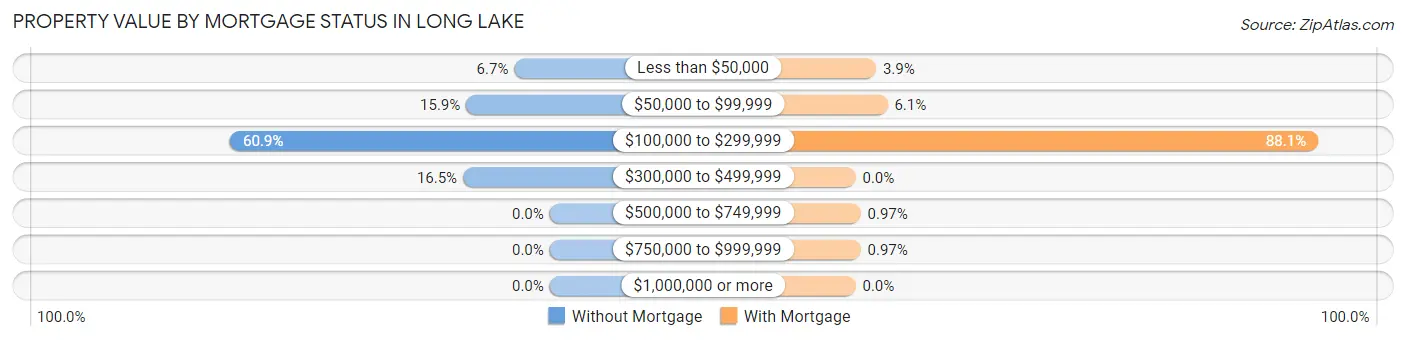
| Property Value | Without Mortgage | With Mortgage |
| Less than $50,000 | 22 (6.7%) | 16 (3.9%) |
| $50,000 to $99,999 | 52 (15.9%) | 25 (6.1%) |
| $100,000 to $299,999 | 199 (60.9%) | 362 (88.1%) |
| $300,000 to $499,999 | 54 (16.5%) | 0 (0.0%) |
| $500,000 to $749,999 | 0 (0.0%) | 4 (1.0%) |
| $750,000 to $999,999 | 0 (0.0%) | 4 (1.0%) |
| $1,000,000 or more | 0 (0.0%) | 0 (0.0%) |
| Total | 327 (100.0%) | 411 (100.0%) |
Household Income by Mortgage Status in Long Lake
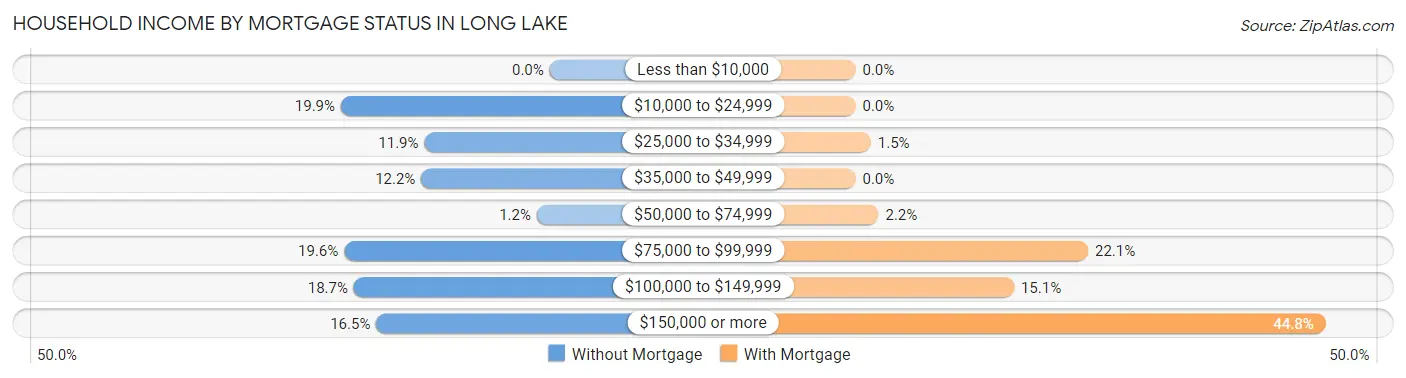
| Household Income | Without Mortgage | With Mortgage |
| Less than $10,000 | 0 (0.0%) | 0 (0.0%) |
| $10,000 to $24,999 | 65 (19.9%) | 0 (0.0%) |
| $25,000 to $34,999 | 39 (11.9%) | 6 (1.5%) |
| $35,000 to $49,999 | 40 (12.2%) | 0 (0.0%) |
| $50,000 to $74,999 | 4 (1.2%) | 9 (2.2%) |
| $75,000 to $99,999 | 64 (19.6%) | 91 (22.1%) |
| $100,000 to $149,999 | 61 (18.6%) | 62 (15.1%) |
| $150,000 or more | 54 (16.5%) | 184 (44.8%) |
| Total | 327 (100.0%) | 411 (100.0%) |
Property Value to Household Income Ratio in Long Lake
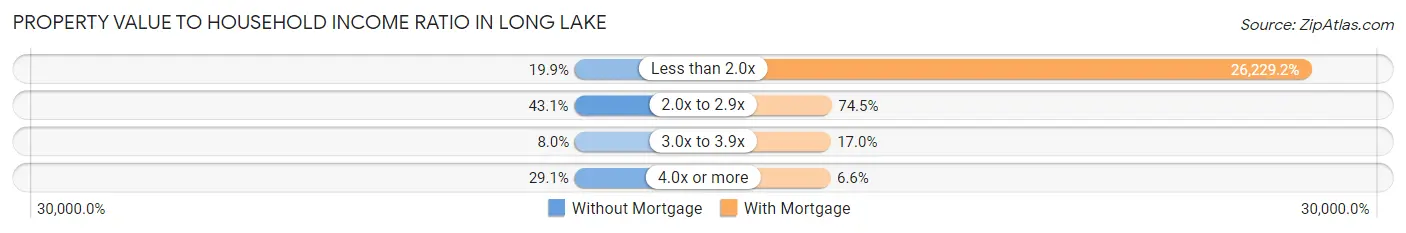
| Value-to-Income Ratio | Without Mortgage | With Mortgage |
| Less than 2.0x | 65 (19.9%) | 107,802 (26,229.2%) |
| 2.0x to 2.9x | 141 (43.1%) | 306 (74.5%) |
| 3.0x to 3.9x | 26 (8.0%) | 70 (17.0%) |
| 4.0x or more | 95 (29.0%) | 27 (6.6%) |
| Total | 327 (100.0%) | 411 (100.0%) |
Real Estate Taxes by Mortgage Status in Long Lake
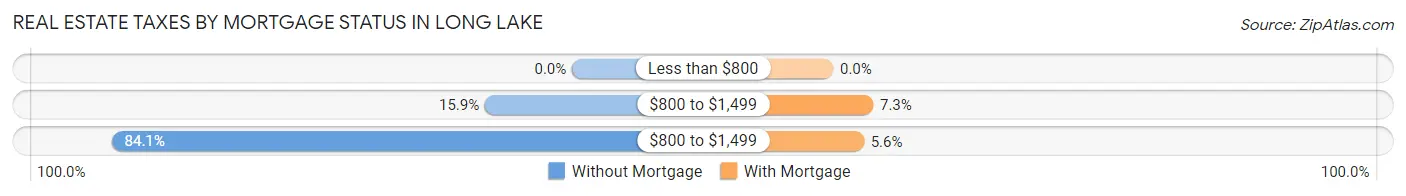
| Property Taxes | Without Mortgage | With Mortgage |
| Less than $800 | 0 (0.0%) | 0 (0.0%) |
| $800 to $1,499 | 52 (15.9%) | 30 (7.3%) |
| $800 to $1,499 | 275 (84.1%) | 23 (5.6%) |
| Total | 327 (100.0%) | 411 (100.0%) |
Health & Disability in Long Lake
Health Insurance Coverage by Age in Long Lake
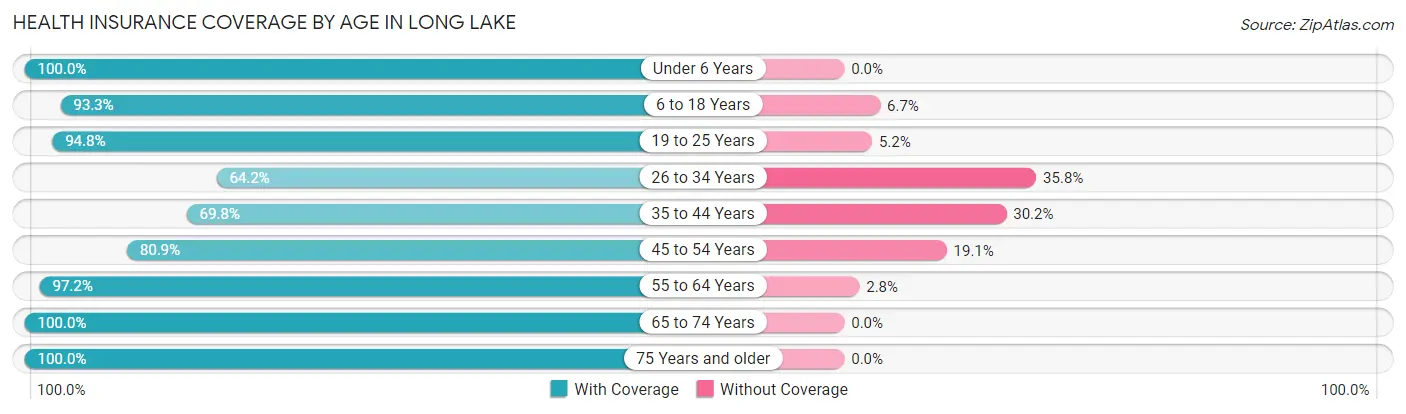
| Age Bracket | With Coverage | Without Coverage |
| Under 6 Years | 73 (100.0%) | 0 (0.0%) |
| 6 to 18 Years | 602 (93.3%) | 43 (6.7%) |
| 19 to 25 Years | 441 (94.8%) | 24 (5.2%) |
| 26 to 34 Years | 131 (64.2%) | 73 (35.8%) |
| 35 to 44 Years | 268 (69.8%) | 116 (30.2%) |
| 45 to 54 Years | 352 (80.9%) | 83 (19.1%) |
| 55 to 64 Years | 453 (97.2%) | 13 (2.8%) |
| 65 to 74 Years | 169 (100.0%) | 0 (0.0%) |
| 75 Years and older | 98 (100.0%) | 0 (0.0%) |
| Total | 2,587 (88.0%) | 352 (12.0%) |
Health Insurance Coverage by Citizenship Status in Long Lake
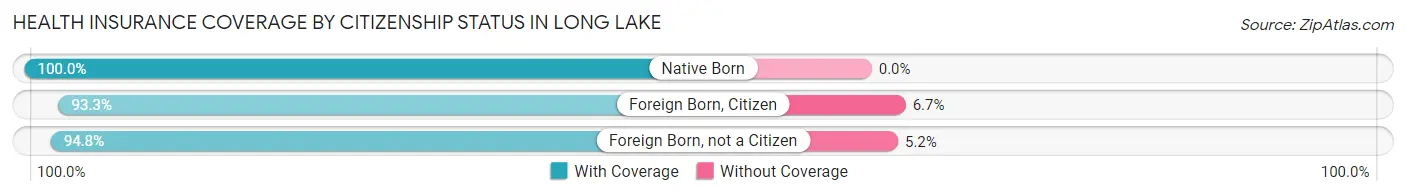
| Citizenship Status | With Coverage | Without Coverage |
| Native Born | 73 (100.0%) | 0 (0.0%) |
| Foreign Born, Citizen | 602 (93.3%) | 43 (6.7%) |
| Foreign Born, not a Citizen | 441 (94.8%) | 24 (5.2%) |
Health Insurance Coverage by Household Income in Long Lake
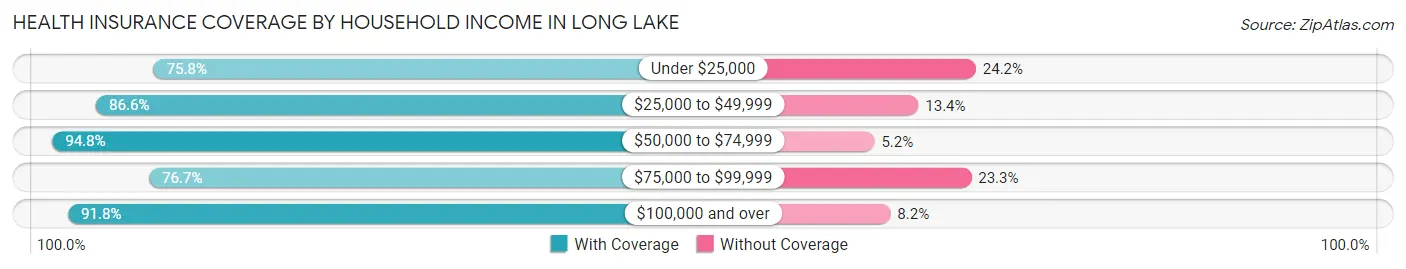
| Household Income | With Coverage | Without Coverage |
| Under $25,000 | 116 (75.8%) | 37 (24.2%) |
| $25,000 to $49,999 | 310 (86.6%) | 48 (13.4%) |
| $50,000 to $74,999 | 402 (94.8%) | 22 (5.2%) |
| $75,000 to $99,999 | 411 (76.7%) | 125 (23.3%) |
| $100,000 and over | 1,348 (91.8%) | 120 (8.2%) |
Public vs Private Health Insurance Coverage by Age in Long Lake
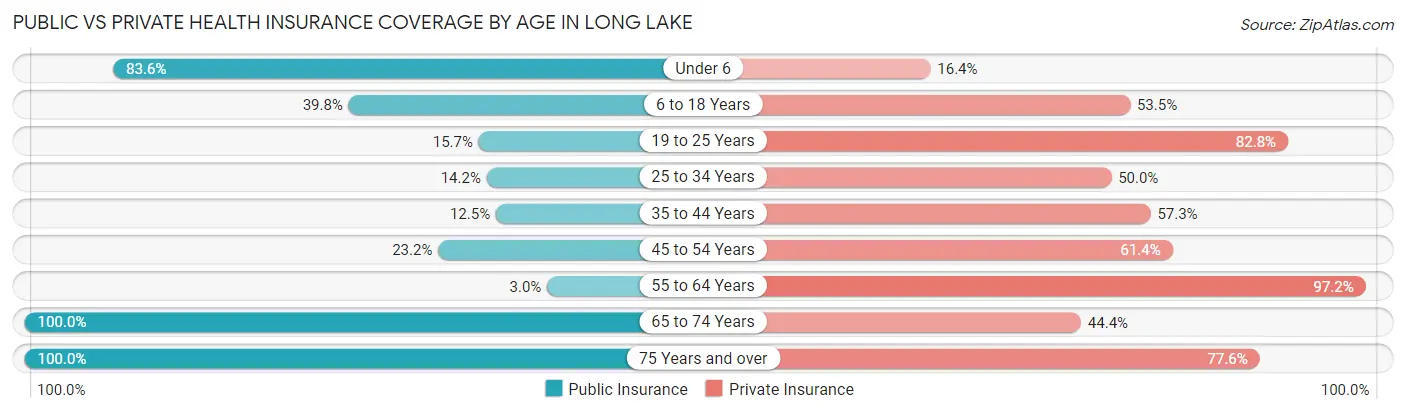
| Age Bracket | Public Insurance | Private Insurance |
| Under 6 | 61 (83.6%) | 12 (16.4%) |
| 6 to 18 Years | 257 (39.8%) | 345 (53.5%) |
| 19 to 25 Years | 73 (15.7%) | 385 (82.8%) |
| 25 to 34 Years | 29 (14.2%) | 102 (50.0%) |
| 35 to 44 Years | 48 (12.5%) | 220 (57.3%) |
| 45 to 54 Years | 101 (23.2%) | 267 (61.4%) |
| 55 to 64 Years | 14 (3.0%) | 453 (97.2%) |
| 65 to 74 Years | 169 (100.0%) | 75 (44.4%) |
| 75 Years and over | 98 (100.0%) | 76 (77.5%) |
| Total | 850 (28.9%) | 1,935 (65.8%) |
Disability Status by Sex by Age in Long Lake
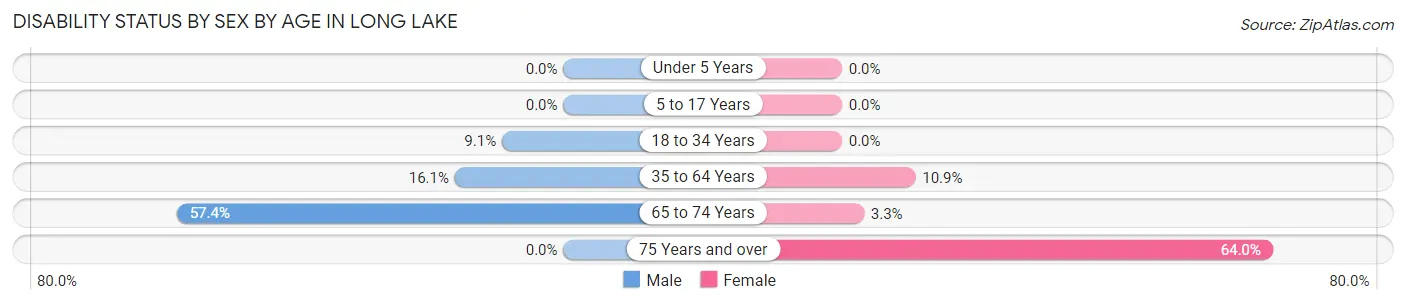
| Age Bracket | Male | Female |
| Under 5 Years | 0 (0.0%) | 0 (0.0%) |
| 5 to 17 Years | 0 (0.0%) | 0 (0.0%) |
| 18 to 34 Years | 45 (9.1%) | 0 (0.0%) |
| 35 to 64 Years | 117 (16.1%) | 61 (10.9%) |
| 65 to 74 Years | 62 (57.4%) | 2 (3.3%) |
| 75 Years and over | 0 (0.0%) | 32 (64.0%) |
Disability Class by Sex by Age in Long Lake
Disability Class: Hearing Difficulty
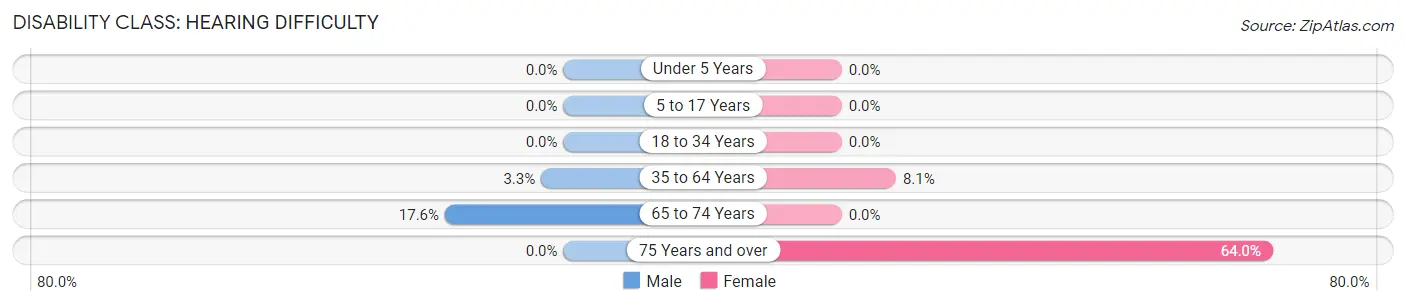
| Age Bracket | Male | Female |
| Under 5 Years | 0 (0.0%) | 0 (0.0%) |
| 5 to 17 Years | 0 (0.0%) | 0 (0.0%) |
| 18 to 34 Years | 0 (0.0%) | 0 (0.0%) |
| 35 to 64 Years | 24 (3.3%) | 45 (8.1%) |
| 65 to 74 Years | 19 (17.6%) | 0 (0.0%) |
| 75 Years and over | 0 (0.0%) | 32 (64.0%) |
Disability Class: Vision Difficulty
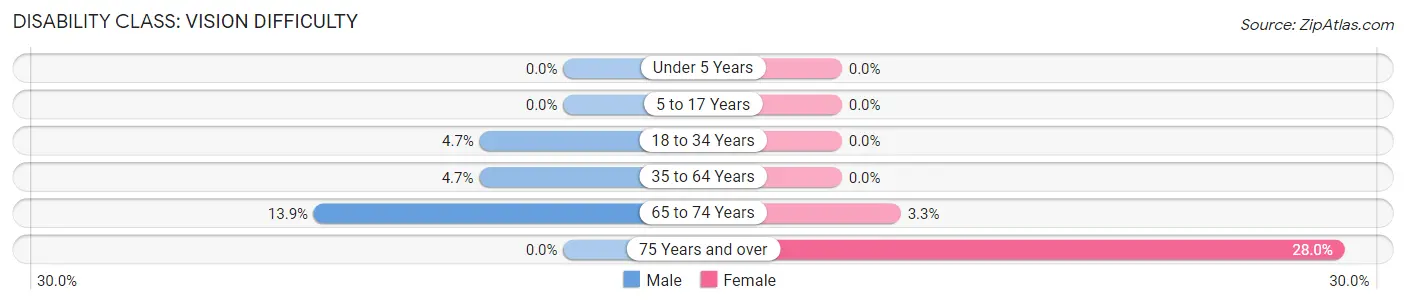
| Age Bracket | Male | Female |
| Under 5 Years | 0 (0.0%) | 0 (0.0%) |
| 5 to 17 Years | 0 (0.0%) | 0 (0.0%) |
| 18 to 34 Years | 23 (4.7%) | 0 (0.0%) |
| 35 to 64 Years | 34 (4.7%) | 0 (0.0%) |
| 65 to 74 Years | 15 (13.9%) | 2 (3.3%) |
| 75 Years and over | 0 (0.0%) | 14 (28.0%) |
Disability Class: Cognitive Difficulty
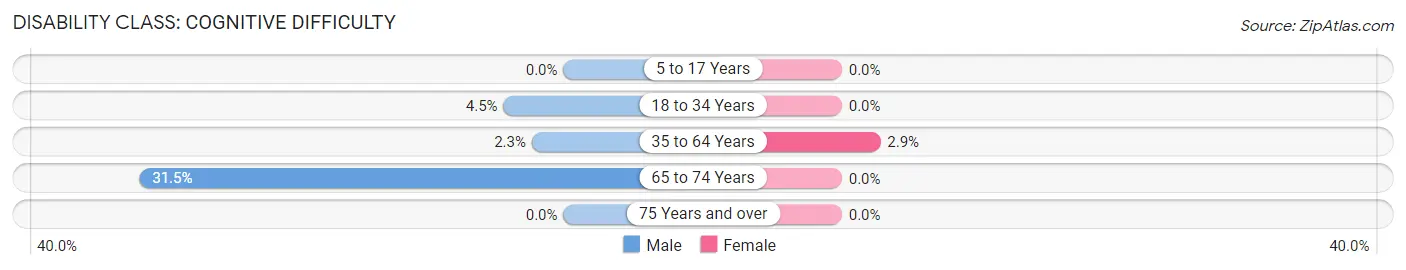
| Age Bracket | Male | Female |
| 5 to 17 Years | 0 (0.0%) | 0 (0.0%) |
| 18 to 34 Years | 22 (4.4%) | 0 (0.0%) |
| 35 to 64 Years | 17 (2.3%) | 16 (2.9%) |
| 65 to 74 Years | 34 (31.5%) | 0 (0.0%) |
| 75 Years and over | 0 (0.0%) | 0 (0.0%) |
Disability Class: Ambulatory Difficulty
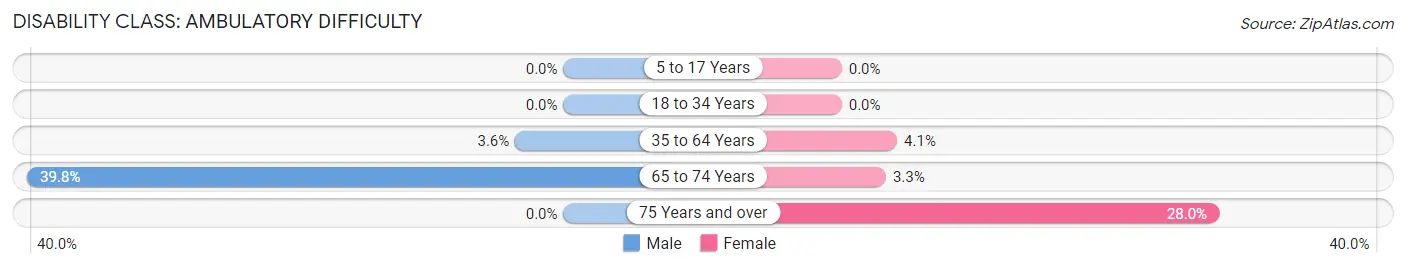
| Age Bracket | Male | Female |
| 5 to 17 Years | 0 (0.0%) | 0 (0.0%) |
| 18 to 34 Years | 0 (0.0%) | 0 (0.0%) |
| 35 to 64 Years | 26 (3.6%) | 23 (4.1%) |
| 65 to 74 Years | 43 (39.8%) | 2 (3.3%) |
| 75 Years and over | 0 (0.0%) | 14 (28.0%) |
Disability Class: Self-Care Difficulty
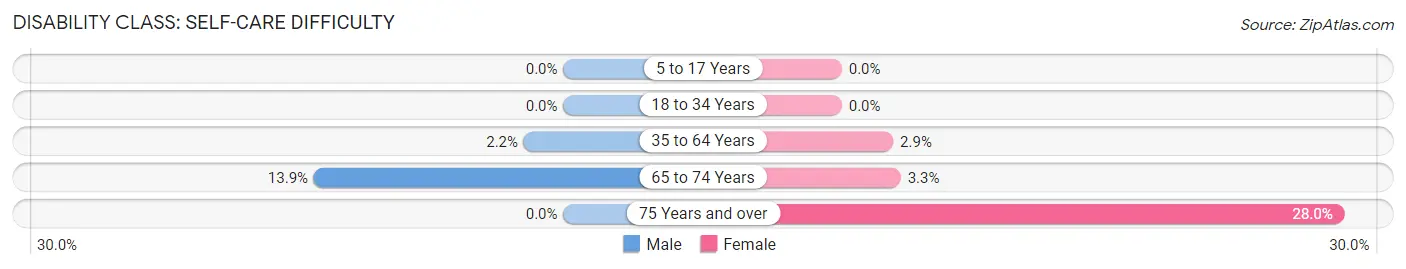
| Age Bracket | Male | Female |
| 5 to 17 Years | 0 (0.0%) | 0 (0.0%) |
| 18 to 34 Years | 0 (0.0%) | 0 (0.0%) |
| 35 to 64 Years | 16 (2.2%) | 16 (2.9%) |
| 65 to 74 Years | 15 (13.9%) | 2 (3.3%) |
| 75 Years and over | 0 (0.0%) | 14 (28.0%) |
Technology Access in Long Lake
Computing Device Access in Long Lake
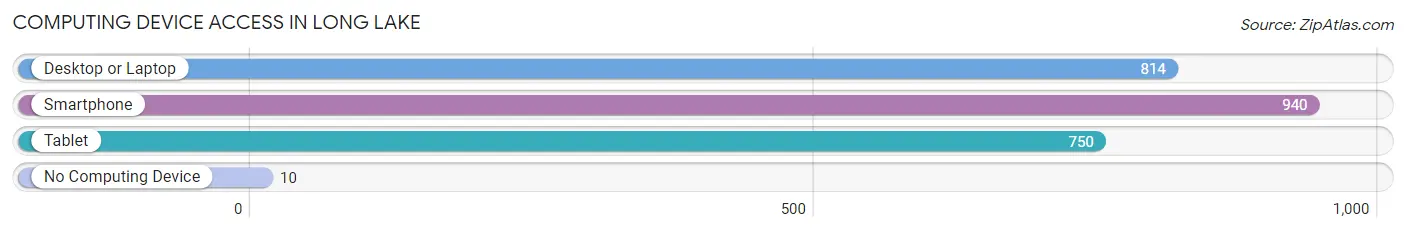
| Device Type | # Households | % Households |
| Desktop or Laptop | 814 | 82.1% |
| Smartphone | 940 | 94.8% |
| Tablet | 750 | 75.6% |
| No Computing Device | 10 | 1.0% |
| Total | 992 | 100.0% |
Internet Access in Long Lake
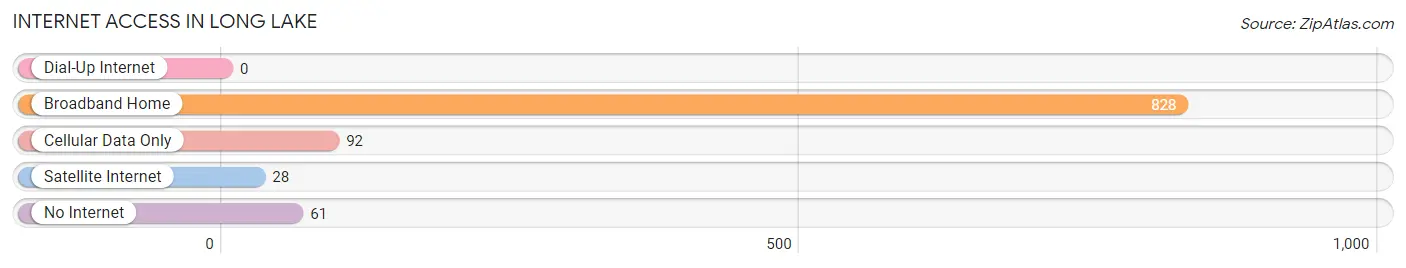
| Internet Type | # Households | % Households |
| Dial-Up Internet | 0 | 0.0% |
| Broadband Home | 828 | 83.5% |
| Cellular Data Only | 92 | 9.3% |
| Satellite Internet | 28 | 2.8% |
| No Internet | 61 | 6.1% |
| Total | 992 | 100.0% |
Long Lake Summary
Long Lake, Illinois is a small village located in Lake County, Illinois. It is situated on the western shore of Lake Michigan, about 40 miles north of Chicago. The village has a population of about 1,000 people and covers an area of 0.6 square miles.
Long Lake was first settled in the early 1800s by settlers from New England. The village was originally known as “Long Lake Settlement” and was incorporated in 1872. The village was named after the nearby lake, which is the longest natural lake in Illinois.
Long Lake is a popular destination for tourists and outdoor enthusiasts. The village is home to several parks, including the Long Lake State Park, which offers camping, fishing, and hiking. The village also has a marina, which provides access to the lake for boaters.
The economy of Long Lake is largely based on tourism and recreation. The village is home to several restaurants, bars, and shops, as well as a few small businesses. The village also has a small industrial park, which is home to a few manufacturing companies.
The demographics of Long Lake are largely white, with a small percentage of African Americans and Hispanics. The median household income is around $50,000, and the median home value is around $200,000. The village has a low crime rate and is considered a safe place to live.
Long Lake is a great place to live and visit. The village has a small-town feel, with plenty of outdoor activities and attractions. The village is also close to Chicago, making it a great place to live for those who want to be close to the city but still enjoy the peace and quiet of a small town.
Common Questions
What is Per Capita Income in Long Lake?
Per Capita income in Long Lake is $33,884.
What is the Median Family Income in Long Lake?
Median Family Income in Long Lake is $95,375.
What is the Median Household income in Long Lake?
Median Household Income in Long Lake is $95,950.
What is Income or Wage Gap in Long Lake?
Income or Wage Gap in Long Lake is 28.8%.
Women in Long Lake earn 71.2 cents for every dollar earned by a man.
What is Inequality or Gini Index in Long Lake?
Inequality or Gini Index in Long Lake is 0.33.
What is the Total Population of Long Lake?
Total Population of Long Lake is 2,939.
What is the Total Male Population of Long Lake?
Total Male Population of Long Lake is 1,841.
What is the Total Female Population of Long Lake?
Total Female Population of Long Lake is 1,098.
What is the Ratio of Males per 100 Females in Long Lake?
There are 167.67 Males per 100 Females in Long Lake.
What is the Ratio of Females per 100 Males in Long Lake?
There are 59.64 Females per 100 Males in Long Lake.
What is the Median Population Age in Long Lake?
Median Population Age in Long Lake is 39.1 Years.
What is the Average Family Size in Long Lake
Average Family Size in Long Lake is 3.5 People.
What is the Average Household Size in Long Lake
Average Household Size in Long Lake is 3.0 People.
How Large is the Labor Force in Long Lake?
There are 1,667 People in the Labor Forcein in Long Lake.
What is the Percentage of People in the Labor Force in Long Lake?
70.9% of People are in the Labor Force in Long Lake.
What is the Unemployment Rate in Long Lake?
Unemployment Rate in Long Lake is 12.6%.