Holland, MA Map & Demographics
Holland Map
Holland Overview
$52,972
PER CAPITA INCOME
$78,250
AVG FAMILY INCOME
$78,462
AVG HOUSEHOLD INCOME
10.3%
WAGE / INCOME GAP [ % ]
89.7¢/ $1
WAGE / INCOME GAP [ $ ]
0.46
INEQUALITY / GINI INDEX
1,452
TOTAL POPULATION
747
MALE POPULATION
705
FEMALE POPULATION
105.96
MALES / 100 FEMALES
94.38
FEMALES / 100 MALES
51.4
MEDIAN AGE
2.7
AVG FAMILY SIZE
2.1
AVG HOUSEHOLD SIZE
803
LABOR FORCE [ PEOPLE ]
64.0%
PERCENT IN LABOR FORCE
3.1%
UNEMPLOYMENT RATE
Holland Zip Codes
Holland Area Codes
Income in Holland
Income Overview in Holland
Per Capita Income in Holland is $52,972, while median incomes of families and households are $78,250 and $78,462 respectively.
| Characteristic | Number | Measure |
| Per Capita Income | 1,452 | $52,972 |
| Median Family Income | 401 | $78,250 |
| Mean Family Income | 401 | $138,195 |
| Median Household Income | 692 | $78,462 |
| Mean Household Income | 692 | $111,655 |
| Income Deficit | 401 | $0 |
| Wage / Income Gap (%) | 1,452 | 10.28% |
| Wage / Income Gap ($) | 1,452 | 89.72¢ per $1 |
| Gini / Inequality Index | 1,452 | 0.46 |
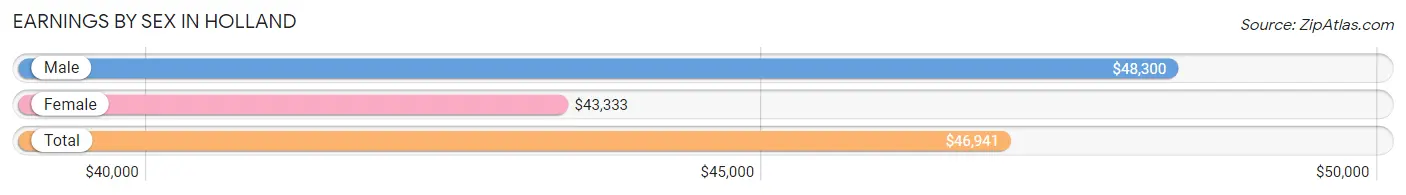
Earnings by Sex in Holland
Average Earnings in Holland are $46,941, $48,300 for men and $43,333 for women, a difference of 10.3%.
| Sex | Number | Average Earnings |
| Male | 434 (50.6%) | $48,300 |
| Female | 424 (49.4%) | $43,333 |
| Total | 858 (100.0%) | $46,941 |
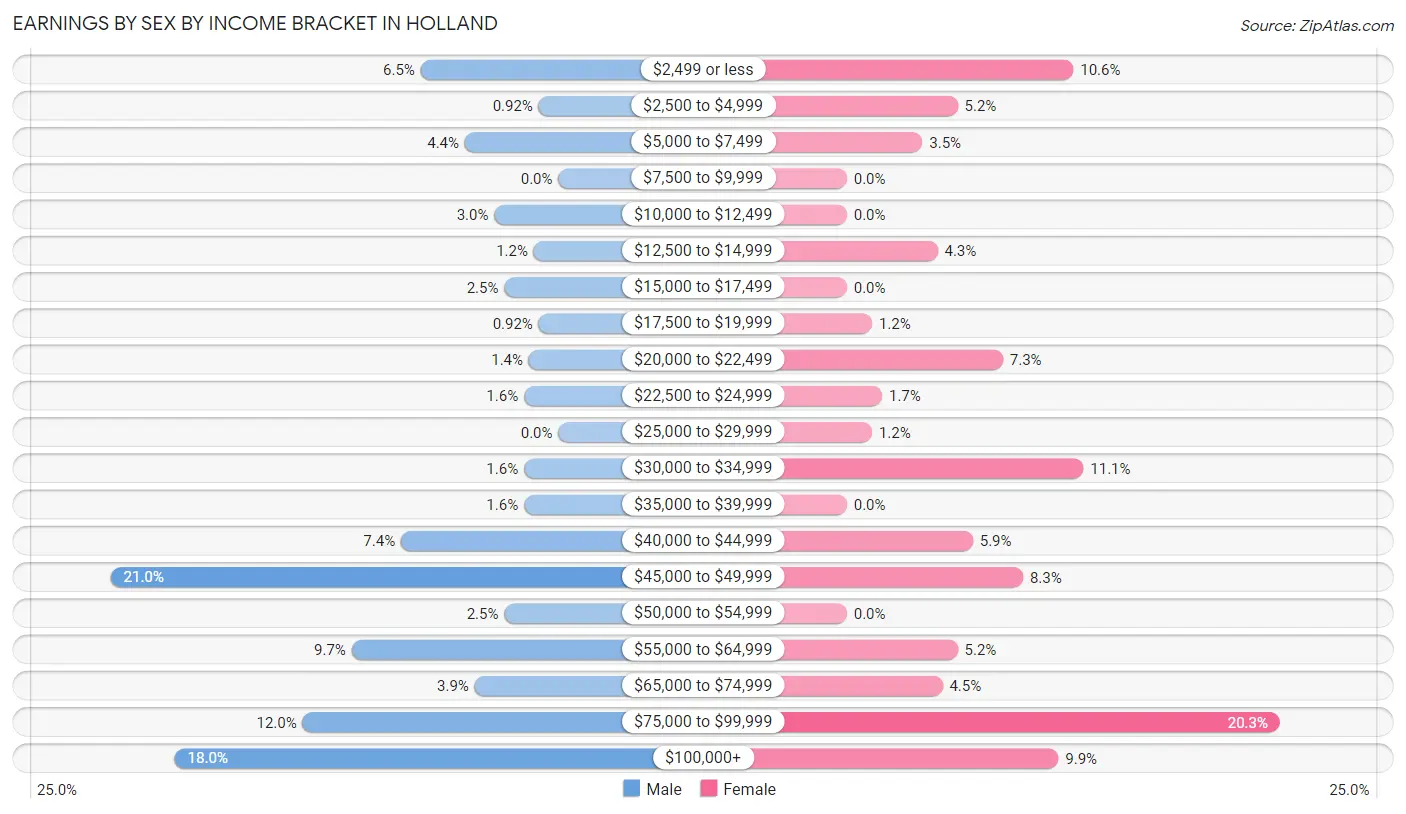
Earnings by Sex by Income Bracket in Holland
The most common earnings brackets in Holland are $45,000 to $49,999 for men (91 | 21.0%) and $75,000 to $99,999 for women (86 | 20.3%).
| Income | Male | Female |
| $2,499 or less | 28 (6.5%) | 45 (10.6%) |
| $2,500 to $4,999 | 4 (0.9%) | 22 (5.2%) |
| $5,000 to $7,499 | 19 (4.4%) | 15 (3.5%) |
| $7,500 to $9,999 | 0 (0.0%) | 0 (0.0%) |
| $10,000 to $12,499 | 13 (3.0%) | 0 (0.0%) |
| $12,500 to $14,999 | 5 (1.1%) | 18 (4.3%) |
| $15,000 to $17,499 | 11 (2.5%) | 0 (0.0%) |
| $17,500 to $19,999 | 4 (0.9%) | 5 (1.2%) |
| $20,000 to $22,499 | 6 (1.4%) | 31 (7.3%) |
| $22,500 to $24,999 | 7 (1.6%) | 7 (1.7%) |
| $25,000 to $29,999 | 0 (0.0%) | 5 (1.2%) |
| $30,000 to $34,999 | 7 (1.6%) | 47 (11.1%) |
| $35,000 to $39,999 | 7 (1.6%) | 0 (0.0%) |
| $40,000 to $44,999 | 32 (7.4%) | 25 (5.9%) |
| $45,000 to $49,999 | 91 (21.0%) | 35 (8.3%) |
| $50,000 to $54,999 | 11 (2.5%) | 0 (0.0%) |
| $55,000 to $64,999 | 42 (9.7%) | 22 (5.2%) |
| $65,000 to $74,999 | 17 (3.9%) | 19 (4.5%) |
| $75,000 to $99,999 | 52 (12.0%) | 86 (20.3%) |
| $100,000+ | 78 (18.0%) | 42 (9.9%) |
| Total | 434 (100.0%) | 424 (100.0%) |
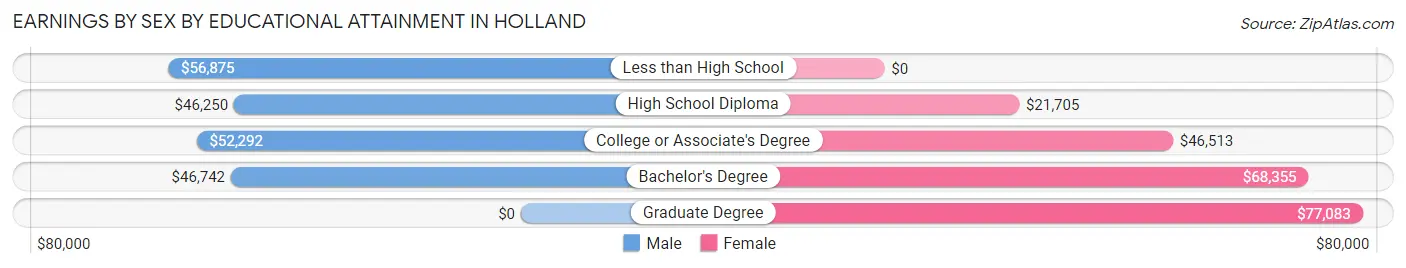
Earnings by Sex by Educational Attainment in Holland
Average earnings in Holland are $49,700 for men and $47,578 for women, a difference of 4.3%. Men with an educational attainment of less than high school enjoy the highest average annual earnings of $56,875, while those with high school diploma education earn the least with $46,250. Women with an educational attainment of graduate degree earn the most with the average annual earnings of $77,083, while those with high school diploma education have the smallest earnings of $21,705.
| Educational Attainment | Male Income | Female Income |
| Less than High School | $56,875 | $0 |
| High School Diploma | $46,250 | $21,705 |
| College or Associate's Degree | $52,292 | $46,513 |
| Bachelor's Degree | $46,742 | $68,355 |
| Graduate Degree | - | - |
| Total | $49,700 | $47,578 |
Family Income in Holland
Family Income Brackets in Holland
According to the Holland family income data, there are 107 families falling into the $50,000 to $74,999 income range, which is the most common income bracket and makes up 26.7% of all families.
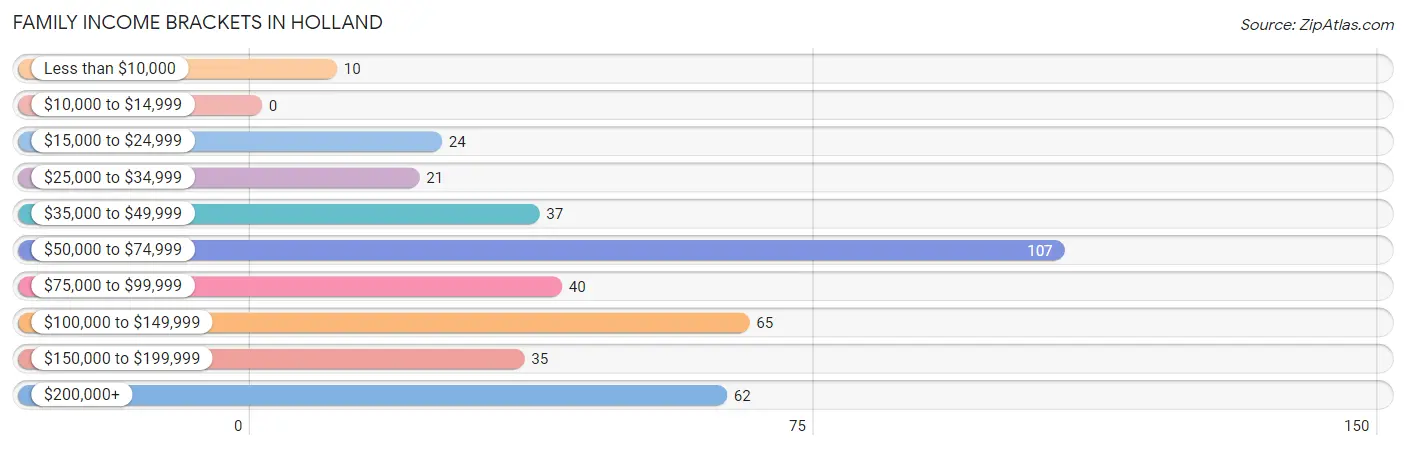
| Income Bracket | # Families | % Families |
| Less than $10,000 | 10 | 2.5% |
| $10,000 to $14,999 | 0 | 0.0% |
| $15,000 to $24,999 | 24 | 6.0% |
| $25,000 to $34,999 | 21 | 5.2% |
| $35,000 to $49,999 | 37 | 9.2% |
| $50,000 to $74,999 | 107 | 26.7% |
| $75,000 to $99,999 | 40 | 10.0% |
| $100,000 to $149,999 | 65 | 16.2% |
| $150,000 to $199,999 | 35 | 8.7% |
| $200,000+ | 62 | 15.5% |
Family Income by Famaliy Size in Holland
3-person families (40 | 10.0%) account for the highest median family income in Holland with $143,750 per family, while 3-person families (40 | 10.0%) have the highest median income of $47,917 per family member.
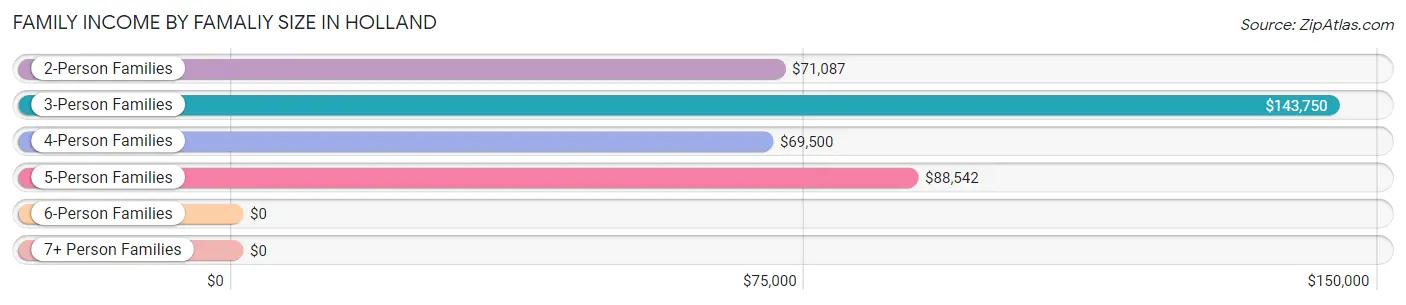
| Income Bracket | # Families | Median Income |
| 2-Person Families | 244 (60.9%) | $71,087 |
| 3-Person Families | 40 (10.0%) | $143,750 |
| 4-Person Families | 96 (23.9%) | $69,500 |
| 5-Person Families | 17 (4.2%) | $88,542 |
| 6-Person Families | 4 (1.0%) | $0 |
| 7+ Person Families | 0 (0.0%) | $0 |
| Total | 401 (100.0%) | $78,250 |
Family Income by Number of Earners in Holland
The median family income in Holland is $78,250, with families comprising 2 earners (132) having the highest median family income of $138,571, while families with no earners (90) have the lowest median family income of $33,810, accounting for 32.9% and 22.4% of families, respectively.
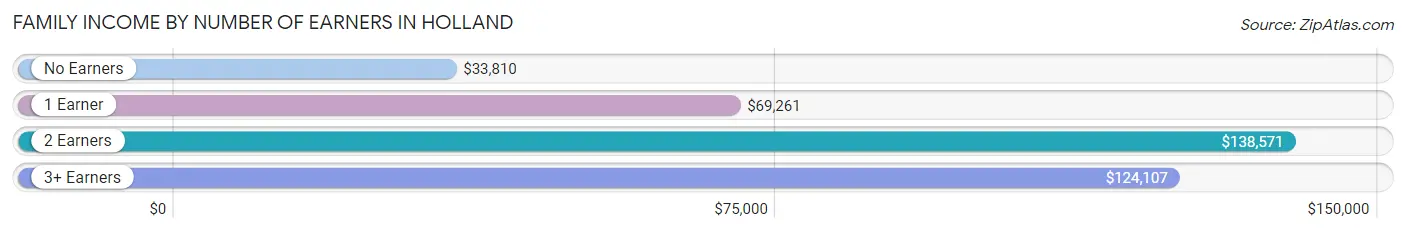
| Number of Earners | # Families | Median Income |
| No Earners | 90 (22.4%) | $33,810 |
| 1 Earner | 128 (31.9%) | $69,261 |
| 2 Earners | 132 (32.9%) | $138,571 |
| 3+ Earners | 51 (12.7%) | $124,107 |
| Total | 401 (100.0%) | $78,250 |
Household Income in Holland
Household Income Brackets in Holland
With 154 households falling in the category, the $75,000 to $99,999 income range is the most frequent in Holland, accounting for 22.3% of all households. In contrast, only 11 households (1.6%) fall into the $10,000 to $14,999 income bracket, making it the least populous group.
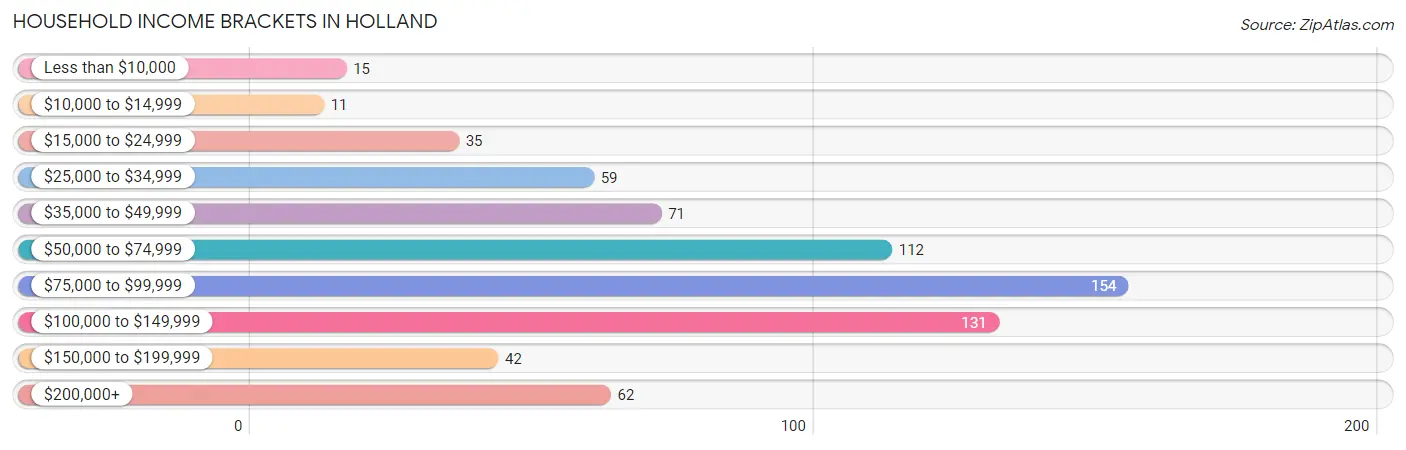
| Income Bracket | # Households | % Households |
| Less than $10,000 | 15 | 2.2% |
| $10,000 to $14,999 | 11 | 1.6% |
| $15,000 to $24,999 | 35 | 5.1% |
| $25,000 to $34,999 | 59 | 8.5% |
| $35,000 to $49,999 | 71 | 10.3% |
| $50,000 to $74,999 | 112 | 16.2% |
| $75,000 to $99,999 | 154 | 22.3% |
| $100,000 to $149,999 | 131 | 18.9% |
| $150,000 to $199,999 | 42 | 6.1% |
| $200,000+ | 62 | 9.0% |
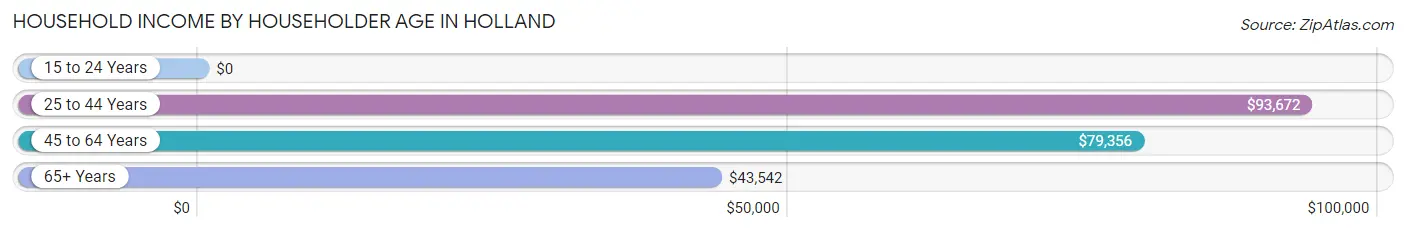
Household Income by Householder Age in Holland
The median household income in Holland is $78,462, with the highest median household income of $93,672 found in the 25 to 44 years age bracket for the primary householder. A total of 185 households (26.7%) fall into this category. Meanwhile, the 15 to 24 years age bracket for the primary householder has the lowest median household income of $0, with 7 households (1.0%) in this group.
| Income Bracket | # Households | Median Income |
| 15 to 24 Years | 7 (1.0%) | $0 |
| 25 to 44 Years | 185 (26.7%) | $93,672 |
| 45 to 64 Years | 300 (43.3%) | $79,356 |
| 65+ Years | 200 (28.9%) | $43,542 |
| Total | 692 (100.0%) | $78,462 |
Poverty in Holland
Income Below Poverty by Sex and Age in Holland
With 6.2% poverty level for males and 5.4% for females among the residents of Holland, 75 year old and over males and 25 to 34 year old females are the most vulnerable to poverty, with 11 males (19.0%) and 8 females (16.0%) in their respective age groups living below the poverty level.
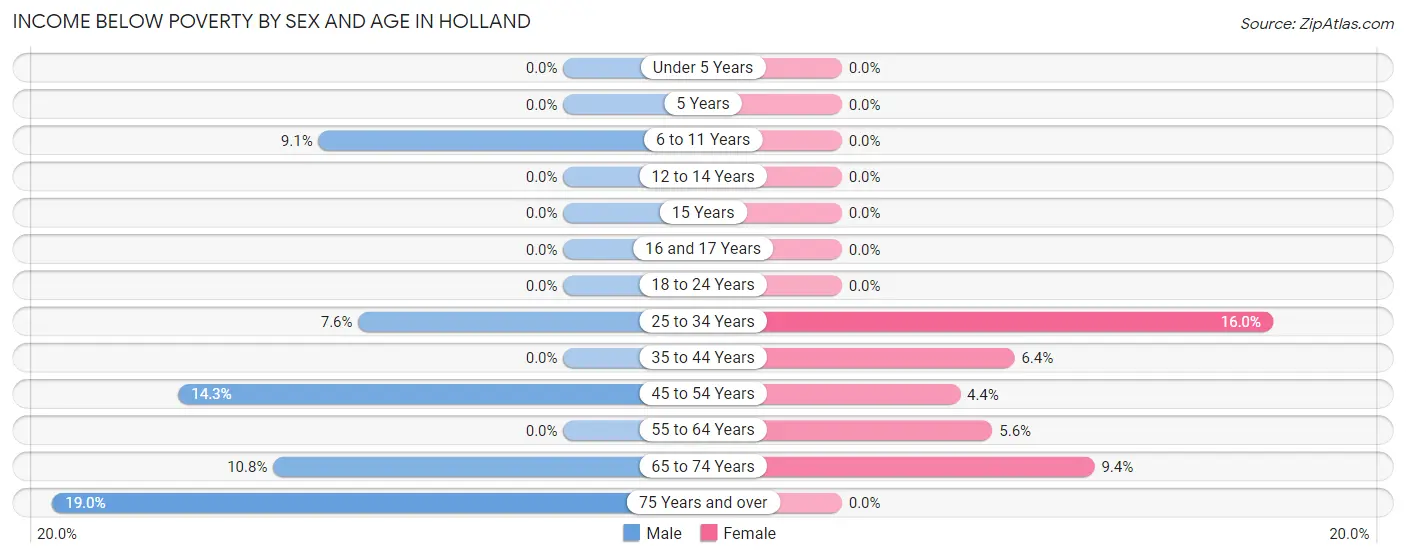
| Age Bracket | Male | Female |
| Under 5 Years | 0 (0.0%) | 0 (0.0%) |
| 5 Years | 0 (0.0%) | 0 (0.0%) |
| 6 to 11 Years | 6 (9.1%) | 0 (0.0%) |
| 12 to 14 Years | 0 (0.0%) | 0 (0.0%) |
| 15 Years | 0 (0.0%) | 0 (0.0%) |
| 16 and 17 Years | 0 (0.0%) | 0 (0.0%) |
| 18 to 24 Years | 0 (0.0%) | 0 (0.0%) |
| 25 to 34 Years | 7 (7.6%) | 8 (16.0%) |
| 35 to 44 Years | 0 (0.0%) | 5 (6.4%) |
| 45 to 54 Years | 8 (14.3%) | 5 (4.4%) |
| 55 to 64 Years | 0 (0.0%) | 8 (5.6%) |
| 65 to 74 Years | 14 (10.8%) | 12 (9.4%) |
| 75 Years and over | 11 (19.0%) | 0 (0.0%) |
| Total | 46 (6.2%) | 38 (5.4%) |
Income Above Poverty by Sex and Age in Holland
According to the poverty statistics in Holland, males aged under 5 years and females aged under 5 years are the age groups that are most secure financially, with 100.0% of males and 100.0% of females in these age groups living above the poverty line.
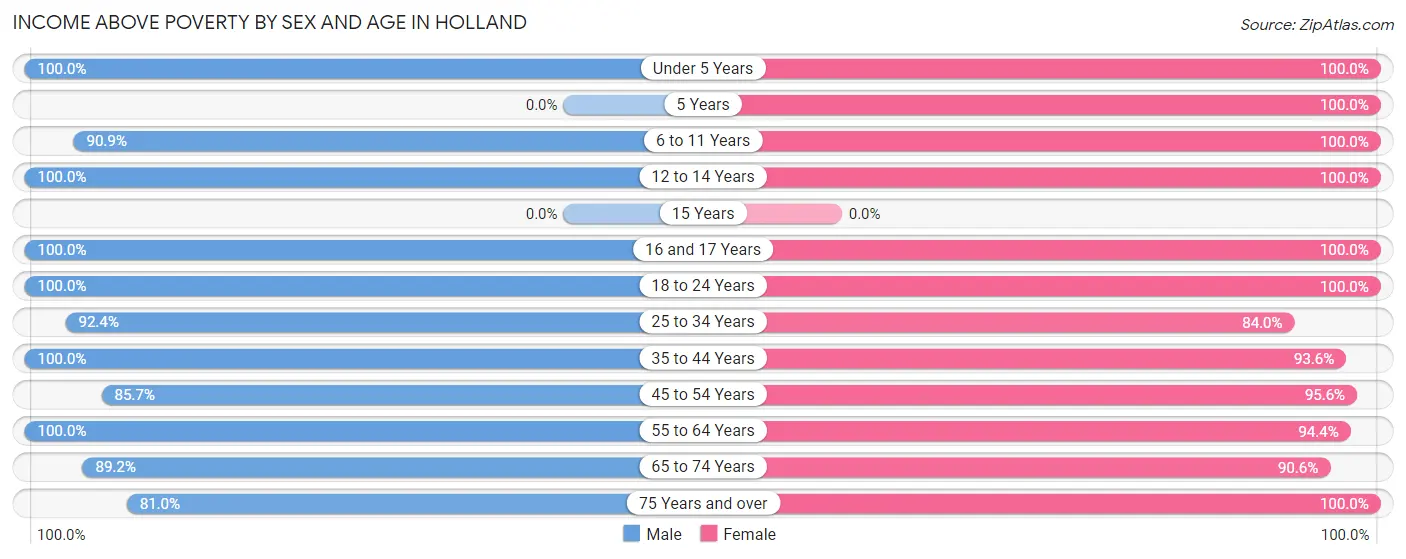
| Age Bracket | Male | Female |
| Under 5 Years | 16 (100.0%) | 16 (100.0%) |
| 5 Years | 0 (0.0%) | 9 (100.0%) |
| 6 to 11 Years | 60 (90.9%) | 51 (100.0%) |
| 12 to 14 Years | 26 (100.0%) | 13 (100.0%) |
| 15 Years | 0 (0.0%) | 0 (0.0%) |
| 16 and 17 Years | 37 (100.0%) | 33 (100.0%) |
| 18 to 24 Years | 45 (100.0%) | 35 (100.0%) |
| 25 to 34 Years | 85 (92.4%) | 42 (84.0%) |
| 35 to 44 Years | 60 (100.0%) | 73 (93.6%) |
| 45 to 54 Years | 48 (85.7%) | 109 (95.6%) |
| 55 to 64 Years | 161 (100.0%) | 135 (94.4%) |
| 65 to 74 Years | 116 (89.2%) | 116 (90.6%) |
| 75 Years and over | 47 (81.0%) | 35 (100.0%) |
| Total | 701 (93.8%) | 667 (94.6%) |
Income Below Poverty Among Married-Couple Families in Holland
The poverty statistics for married-couple families in Holland show that 1.7% or 5 of the total 292 families live below the poverty line. Families with no children have the highest poverty rate of 2.4%, comprising of 5 families. On the other hand, families with 1 or 2 children have the lowest poverty rate of 0.0%, which includes 0 families.
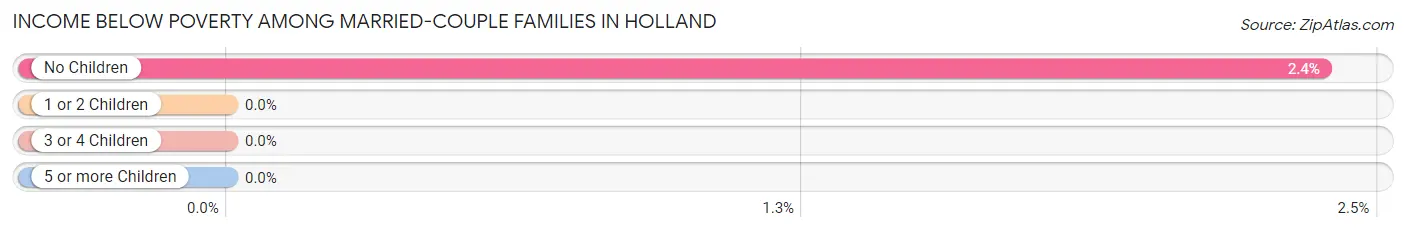
| Children | Above Poverty | Below Poverty |
| No Children | 205 (97.6%) | 5 (2.4%) |
| 1 or 2 Children | 70 (100.0%) | 0 (0.0%) |
| 3 or 4 Children | 12 (100.0%) | 0 (0.0%) |
| 5 or more Children | 0 (0.0%) | 0 (0.0%) |
| Total | 287 (98.3%) | 5 (1.7%) |
Income Below Poverty Among Single-Parent Households in Holland
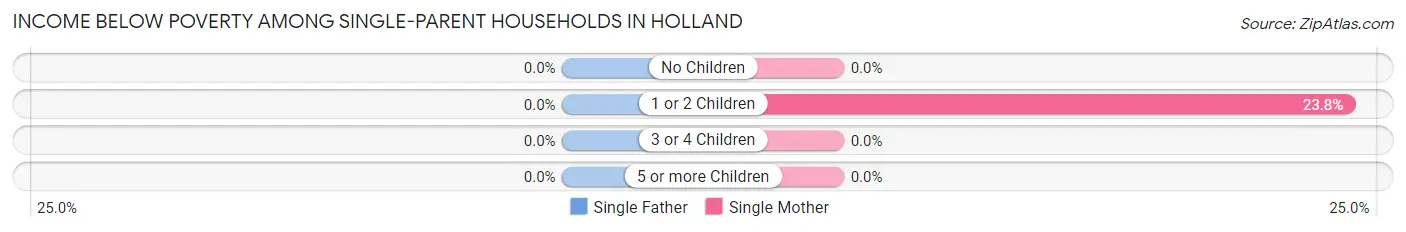
| Children | Single Father | Single Mother |
| No Children | 0 (0.0%) | 0 (0.0%) |
| 1 or 2 Children | 0 (0.0%) | 5 (23.8%) |
| 3 or 4 Children | 0 (0.0%) | 0 (0.0%) |
| 5 or more Children | 0 (0.0%) | 0 (0.0%) |
| Total | 0 (0.0%) | 5 (7.1%) |
Income Below Poverty Among Married-Couple vs Single-Parent Households in Holland
The poverty data for Holland shows that 5 of the married-couple family households (1.7%) and 5 of the single-parent households (4.6%) are living below the poverty level. Within the married-couple family households, those with no children have the highest poverty rate, with 5 households (2.4%) falling below the poverty line. Among the single-parent households, those with 1 or 2 children have the highest poverty rate, with 5 household (17.9%) living below poverty.
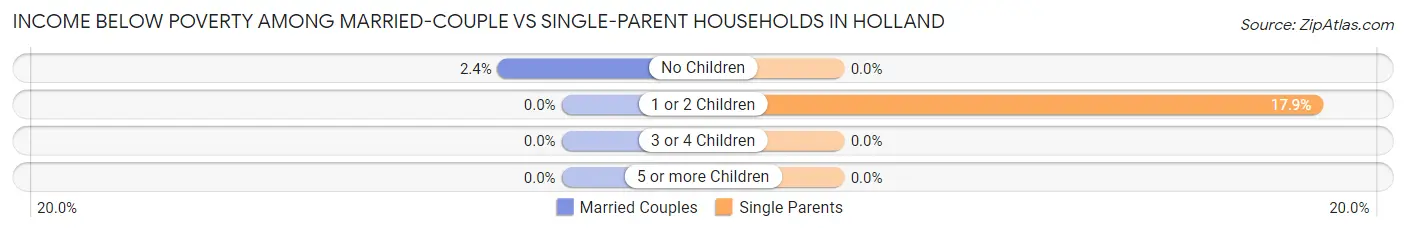
| Children | Married-Couple Families | Single-Parent Households |
| No Children | 5 (2.4%) | 0 (0.0%) |
| 1 or 2 Children | 0 (0.0%) | 5 (17.9%) |
| 3 or 4 Children | 0 (0.0%) | 0 (0.0%) |
| 5 or more Children | 0 (0.0%) | 0 (0.0%) |
| Total | 5 (1.7%) | 5 (4.6%) |
Race in Holland
The most populous races in Holland are White / Caucasian (1,362 | 93.8%), Hispanic or Latino (48 | 3.3%), and Two or more Races (38 | 2.6%).
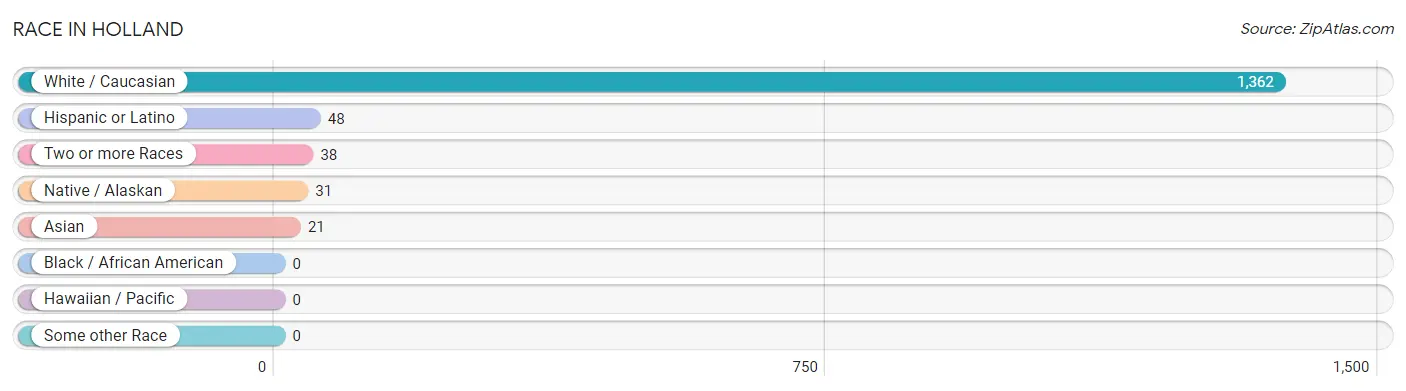
| Race | # Population | % Population |
| Asian | 21 | 1.5% |
| Black / African American | 0 | 0.0% |
| Hawaiian / Pacific | 0 | 0.0% |
| Hispanic or Latino | 48 | 3.3% |
| Native / Alaskan | 31 | 2.1% |
| White / Caucasian | 1,362 | 93.8% |
| Two or more Races | 38 | 2.6% |
| Some other Race | 0 | 0.0% |
| Total | 1,452 | 100.0% |
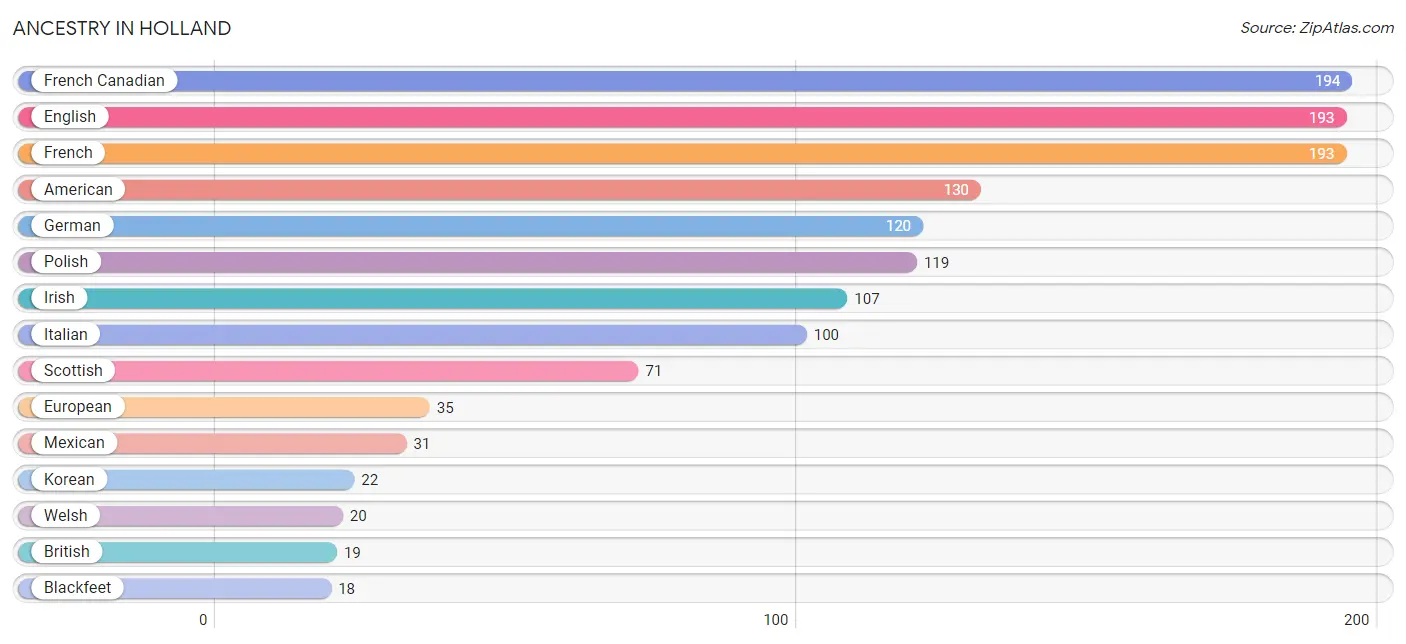
Ancestry in Holland
The most populous ancestries reported in Holland are French Canadian (194 | 13.4%), English (193 | 13.3%), French (193 | 13.3%), American (130 | 8.9%), and German (120 | 8.3%), together accounting for 57.2% of all Holland residents.
| Ancestry | # Population | % Population |
| American | 130 | 8.9% |
| Austrian | 6 | 0.4% |
| Blackfeet | 18 | 1.2% |
| British | 19 | 1.3% |
| Canadian | 5 | 0.3% |
| Central American | 17 | 1.2% |
| Central American Indian | 17 | 1.2% |
| Czech | 18 | 1.2% |
| Danish | 7 | 0.5% |
| Dutch | 10 | 0.7% |
| Eastern European | 6 | 0.4% |
| English | 193 | 13.3% |
| European | 35 | 2.4% |
| Finnish | 6 | 0.4% |
| French | 193 | 13.3% |
| French Canadian | 194 | 13.4% |
| German | 120 | 8.3% |
| Guatemalan | 17 | 1.2% |
| Irish | 107 | 7.4% |
| Italian | 100 | 6.9% |
| Korean | 22 | 1.5% |
| Mexican | 31 | 2.1% |
| Polish | 119 | 8.2% |
| Portuguese | 10 | 0.7% |
| Scotch-Irish | 11 | 0.8% |
| Scottish | 71 | 4.9% |
| Swedish | 12 | 0.8% |
| Swiss | 2 | 0.1% |
| Welsh | 20 | 1.4% | View All 29 Rows |
Immigrants in Holland
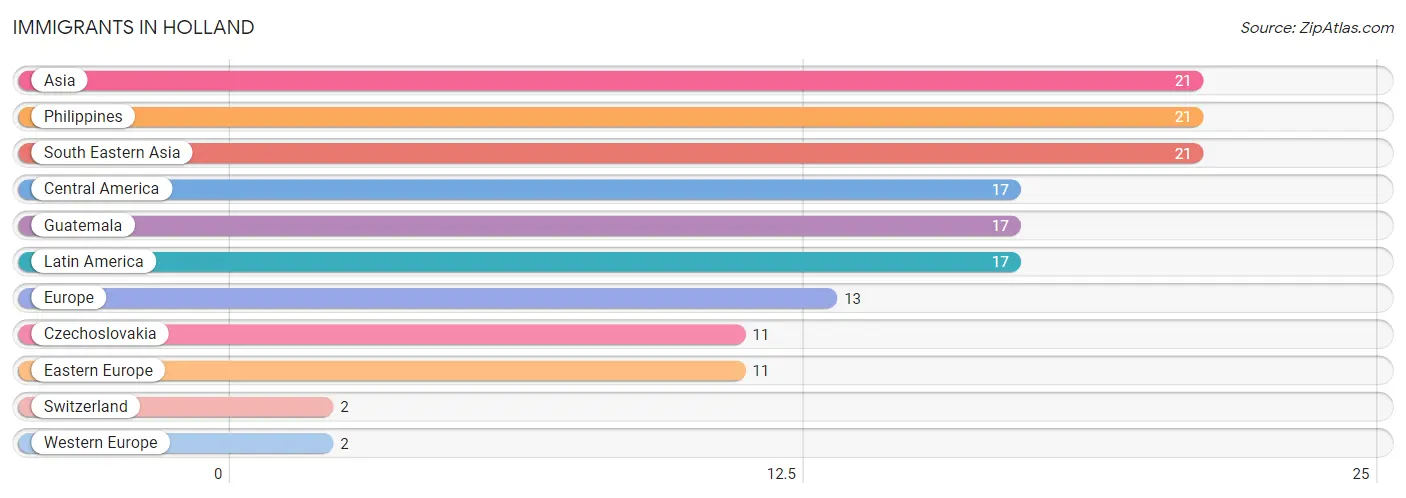
The most numerous immigrant groups reported in Holland came from Asia (21 | 1.5%), Philippines (21 | 1.5%), South Eastern Asia (21 | 1.5%), Central America (17 | 1.2%), and Guatemala (17 | 1.2%), together accounting for 6.7% of all Holland residents.
| Immigration Origin | # Population | % Population |
| Asia | 21 | 1.5% |
| Central America | 17 | 1.2% |
| Czechoslovakia | 11 | 0.8% |
| Eastern Europe | 11 | 0.8% |
| Europe | 13 | 0.9% |
| Guatemala | 17 | 1.2% |
| Latin America | 17 | 1.2% |
| Philippines | 21 | 1.5% |
| South Eastern Asia | 21 | 1.5% |
| Switzerland | 2 | 0.1% |
| Western Europe | 2 | 0.1% | View All 11 Rows |
Sex and Age in Holland
Sex and Age in Holland
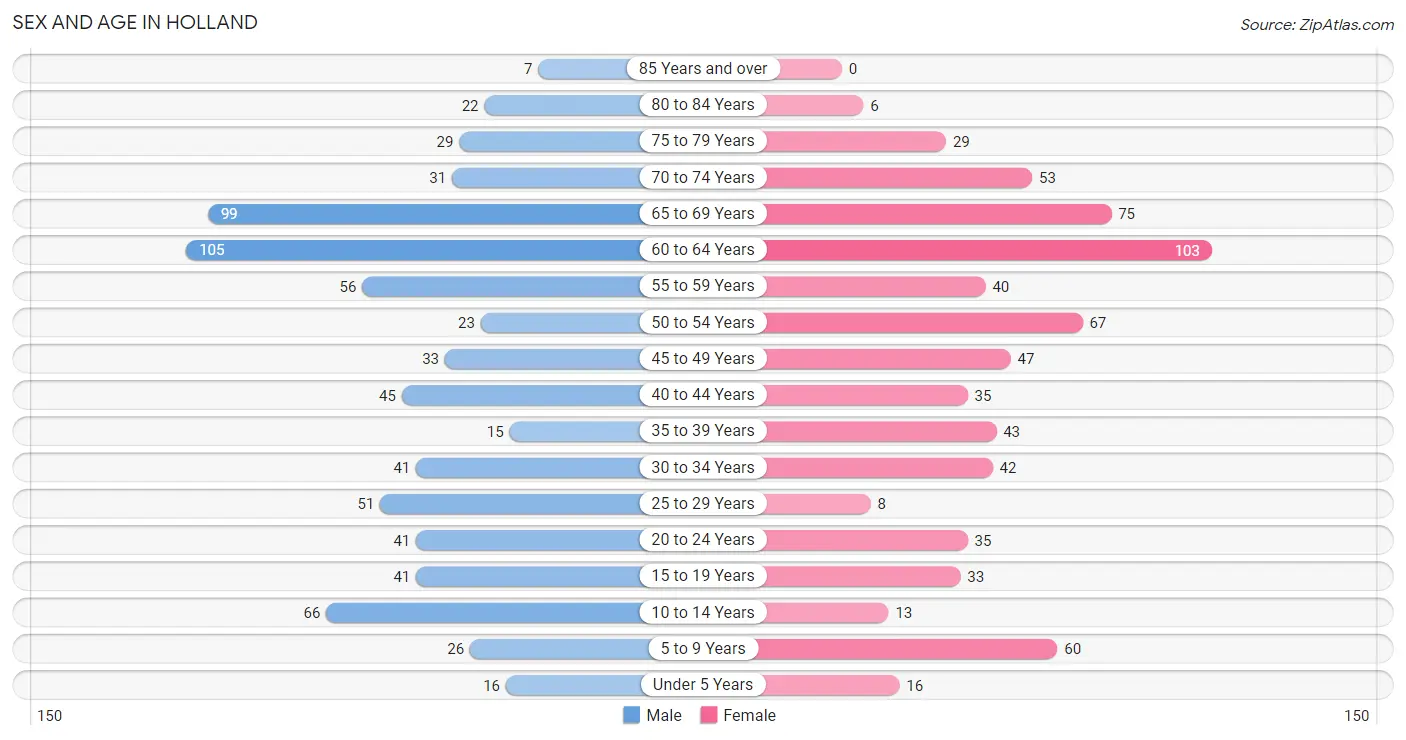
The most populous age groups in Holland are 60 to 64 Years (105 | 14.1%) for men and 60 to 64 Years (103 | 14.6%) for women.
| Age Bracket | Male | Female |
| Under 5 Years | 16 (2.1%) | 16 (2.3%) |
| 5 to 9 Years | 26 (3.5%) | 60 (8.5%) |
| 10 to 14 Years | 66 (8.8%) | 13 (1.8%) |
| 15 to 19 Years | 41 (5.5%) | 33 (4.7%) |
| 20 to 24 Years | 41 (5.5%) | 35 (5.0%) |
| 25 to 29 Years | 51 (6.8%) | 8 (1.1%) |
| 30 to 34 Years | 41 (5.5%) | 42 (6.0%) |
| 35 to 39 Years | 15 (2.0%) | 43 (6.1%) |
| 40 to 44 Years | 45 (6.0%) | 35 (5.0%) |
| 45 to 49 Years | 33 (4.4%) | 47 (6.7%) |
| 50 to 54 Years | 23 (3.1%) | 67 (9.5%) |
| 55 to 59 Years | 56 (7.5%) | 40 (5.7%) |
| 60 to 64 Years | 105 (14.1%) | 103 (14.6%) |
| 65 to 69 Years | 99 (13.3%) | 75 (10.6%) |
| 70 to 74 Years | 31 (4.2%) | 53 (7.5%) |
| 75 to 79 Years | 29 (3.9%) | 29 (4.1%) |
| 80 to 84 Years | 22 (2.9%) | 6 (0.9%) |
| 85 Years and over | 7 (0.9%) | 0 (0.0%) |
| Total | 747 (100.0%) | 705 (100.0%) |
Families and Households in Holland
Median Family Size in Holland
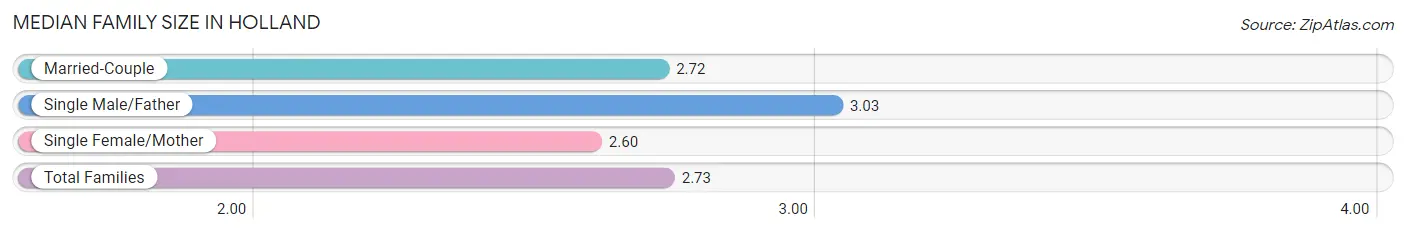
The median family size in Holland is 2.73 persons per family, with single male/father families (39 | 9.7%) accounting for the largest median family size of 3.03 persons per family. On the other hand, single female/mother families (70 | 17.5%) represent the smallest median family size with 2.60 persons per family.
| Family Type | # Families | Family Size |
| Married-Couple | 292 (72.8%) | 2.72 |
| Single Male/Father | 39 (9.7%) | 3.03 |
| Single Female/Mother | 70 (17.5%) | 2.60 |
| Total Families | 401 (100.0%) | 2.73 |
Median Household Size in Holland
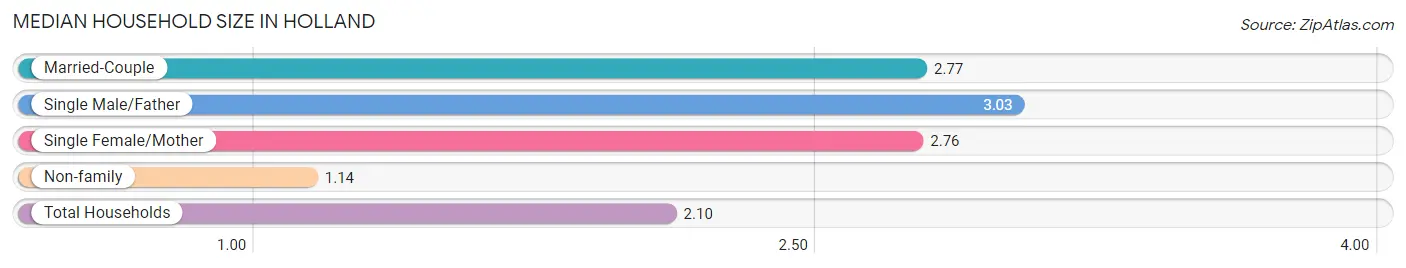
The median household size in Holland is 2.10 persons per household, with single male/father households (39 | 5.6%) accounting for the largest median household size of 3.03 persons per household. non-family households (291 | 42.0%) represent the smallest median household size with 1.14 persons per household.
| Household Type | # Households | Household Size |
| Married-Couple | 292 (42.2%) | 2.77 |
| Single Male/Father | 39 (5.6%) | 3.03 |
| Single Female/Mother | 70 (10.1%) | 2.76 |
| Non-family | 291 (42.0%) | 1.14 |
| Total Households | 692 (100.0%) | 2.10 |
Household Size by Marriage Status in Holland
Out of a total of 692 households in Holland, 401 (58.0%) are family households, while 291 (42.0%) are nonfamily households. The most numerous type of family households are 2-person households, comprising 232, and the most common type of nonfamily households are 1-person households, comprising 248.
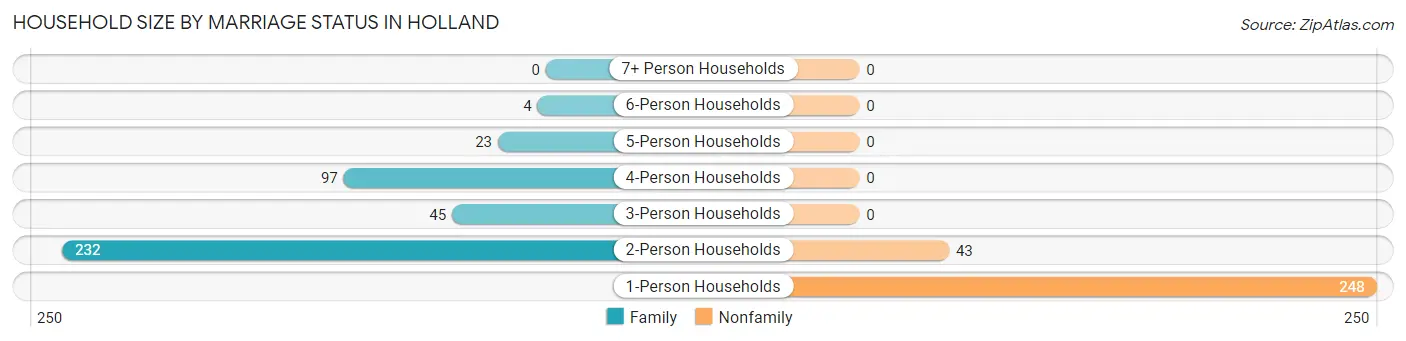
| Household Size | Family Households | Nonfamily Households |
| 1-Person Households | - | 248 (35.8%) |
| 2-Person Households | 232 (33.5%) | 43 (6.2%) |
| 3-Person Households | 45 (6.5%) | 0 (0.0%) |
| 4-Person Households | 97 (14.0%) | 0 (0.0%) |
| 5-Person Households | 23 (3.3%) | 0 (0.0%) |
| 6-Person Households | 4 (0.6%) | 0 (0.0%) |
| 7+ Person Households | 0 (0.0%) | 0 (0.0%) |
| Total | 401 (58.0%) | 291 (42.0%) |
Female Fertility in Holland
Fertility by Age in Holland
Average fertility rate in Holland is 25.0 births per 1,000 women. Women in the age bracket of 20 to 34 years have the highest fertility rate with 71.0 births per 1,000 women. Women in the age bracket of 20 to 34 years acount for 100.0% of all women with births.
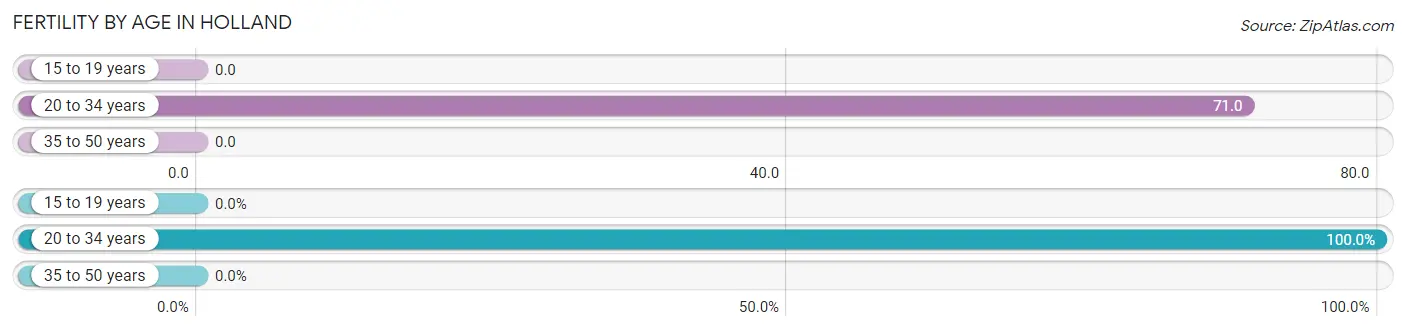
| Age Bracket | Women with Births | Births / 1,000 Women |
| 15 to 19 years | 0 (0.0%) | 0.0 |
| 20 to 34 years | 6 (100.0%) | 71.0 |
| 35 to 50 years | 0 (0.0%) | 0.0 |
| Total | 6 (100.0%) | 25.0 |
Fertility by Age by Marriage Status in Holland
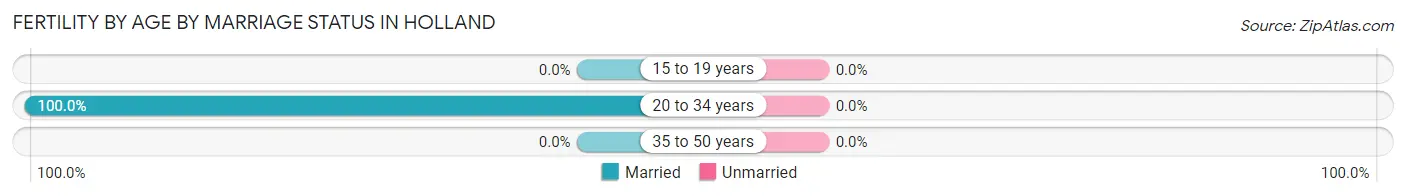
| Age Bracket | Married | Unmarried |
| 15 to 19 years | 0 (0.0%) | 0 (0.0%) |
| 20 to 34 years | 6 (100.0%) | 0 (0.0%) |
| 35 to 50 years | 0 (0.0%) | 0 (0.0%) |
| Total | 6 (100.0%) | 0 (0.0%) |
Fertility by Education in Holland
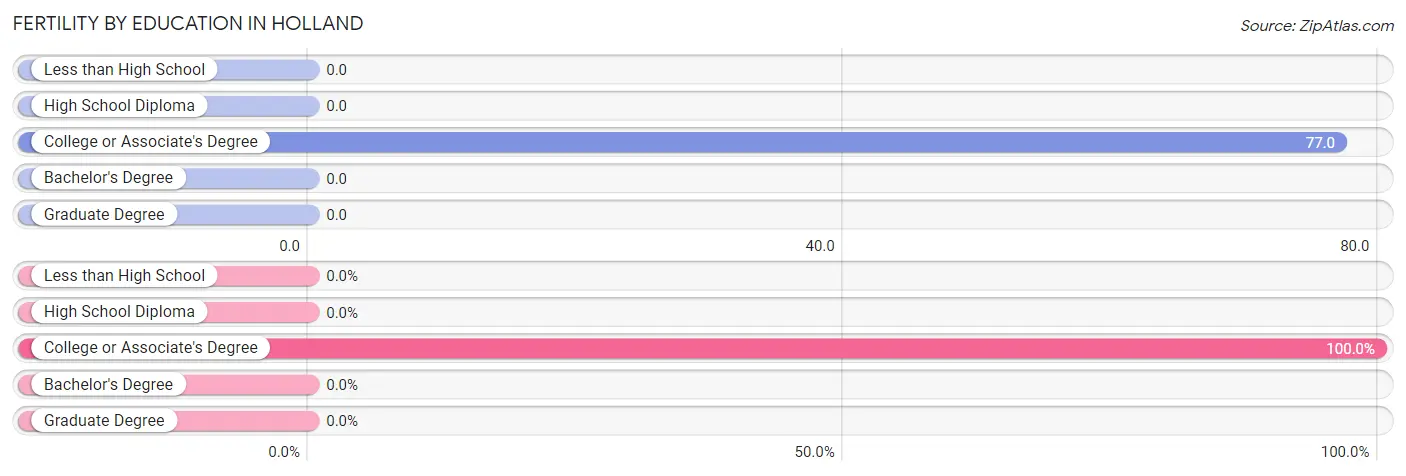
| Educational Attainment | Women with Births | Births / 1,000 Women |
| Less than High School | 0 (0.0%) | 0.0 |
| High School Diploma | 0 (0.0%) | 0.0 |
| College or Associate's Degree | 6 (100.0%) | 77.0 |
| Bachelor's Degree | 0 (0.0%) | 0.0 |
| Graduate Degree | 0 (0.0%) | 0.0 |
| Total | 6 (100.0%) | 25.0 |
Fertility by Education by Marriage Status in Holland
| Educational Attainment | Married | Unmarried |
| Less than High School | 0 (0.0%) | 0 (0.0%) |
| High School Diploma | 0 (0.0%) | 0 (0.0%) |
| College or Associate's Degree | 6 (100.0%) | 0 (0.0%) |
| Bachelor's Degree | 0 (0.0%) | 0 (0.0%) |
| Graduate Degree | 0 (0.0%) | 0 (0.0%) |
| Total | 6 (100.0%) | 0 (0.0%) |
Employment Characteristics in Holland
Employment by Class of Employer in Holland
Among the 754 employed individuals in Holland, private company employees (392 | 52.0%), not-for-profit organizations (120 | 15.9%), and federal government employees (80 | 10.6%) make up the most common classes of employment.
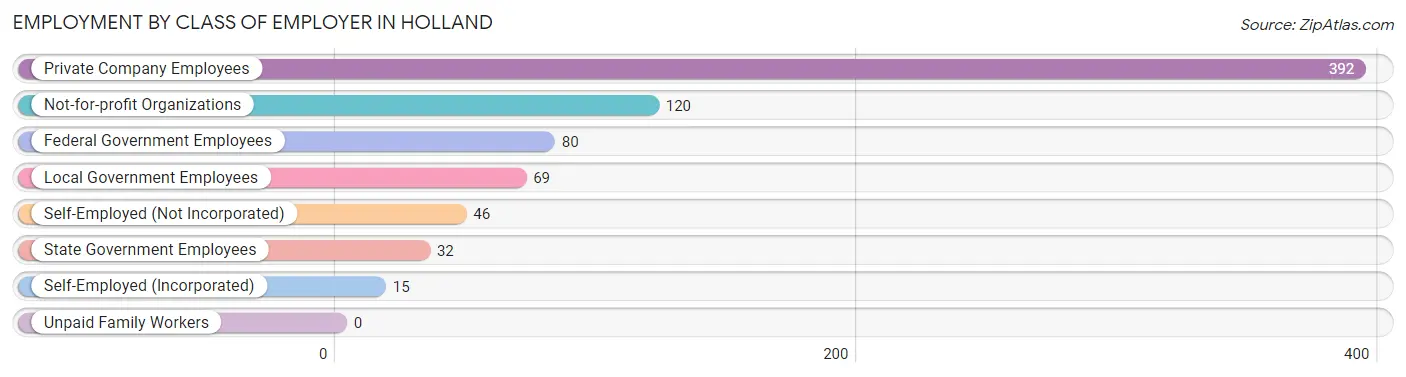
| Employer Class | # Employees | % Employees |
| Private Company Employees | 392 | 52.0% |
| Self-Employed (Incorporated) | 15 | 2.0% |
| Self-Employed (Not Incorporated) | 46 | 6.1% |
| Not-for-profit Organizations | 120 | 15.9% |
| Local Government Employees | 69 | 9.1% |
| State Government Employees | 32 | 4.2% |
| Federal Government Employees | 80 | 10.6% |
| Unpaid Family Workers | 0 | 0.0% |
| Total | 754 | 100.0% |
Employment Status by Age in Holland
According to the labor force statistics for Holland, out of the total population over 16 years of age (1,255), 64.0% or 803 individuals are in the labor force, with 3.1% or 25 of them unemployed. The age group with the highest labor force participation rate is 55 to 59 years, with 96.9% or 93 individuals in the labor force. Within the labor force, the 16 to 19 years age range has the highest percentage of unemployed individuals, with 35.5% or 11 of them being unemployed.
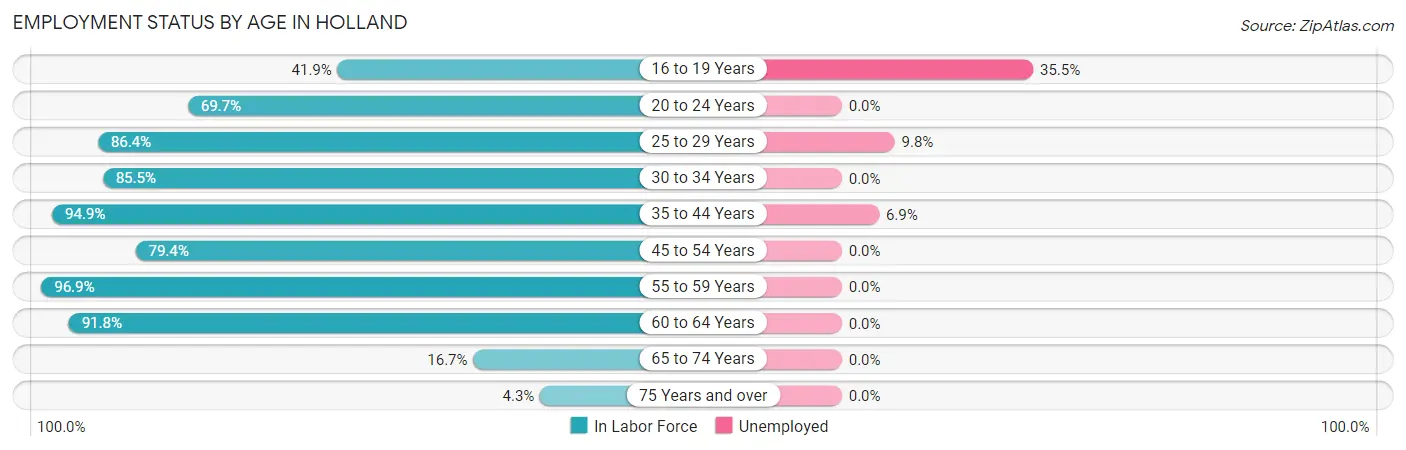
| Age Bracket | In Labor Force | Unemployed |
| 16 to 19 Years | 31 (41.9%) | 11 (35.5%) |
| 20 to 24 Years | 53 (69.7%) | 0 (0.0%) |
| 25 to 29 Years | 51 (86.4%) | 5 (9.8%) |
| 30 to 34 Years | 71 (85.5%) | 0 (0.0%) |
| 35 to 44 Years | 131 (94.9%) | 9 (6.9%) |
| 45 to 54 Years | 135 (79.4%) | 0 (0.0%) |
| 55 to 59 Years | 93 (96.9%) | 0 (0.0%) |
| 60 to 64 Years | 191 (91.8%) | 0 (0.0%) |
| 65 to 74 Years | 43 (16.7%) | 0 (0.0%) |
| 75 Years and over | 4 (4.3%) | 0 (0.0%) |
| Total | 803 (64.0%) | 25 (3.1%) |
Employment Status by Educational Attainment in Holland
According to labor force statistics for Holland, 89.1% of individuals (672) out of the total population between 25 and 64 years of age (754) are in the labor force, with 2.1% or 14 of them being unemployed. The group with the highest labor force participation rate are those with the educational attainment of less than high school, with 100.0% or 45 individuals in the labor force. Within the labor force, individuals with less than high school education have the highest percentage of unemployment, with 11.1% or 5 of them being unemployed.
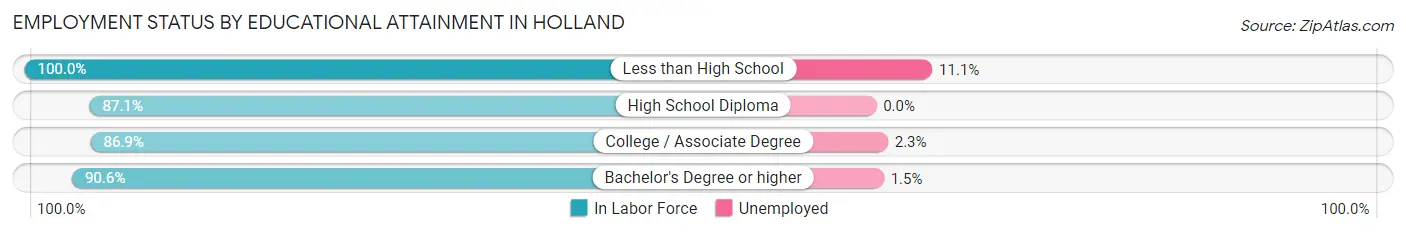
| Educational Attainment | In Labor Force | Unemployed |
| Less than High School | 45 (100.0%) | 5 (11.1%) |
| High School Diploma | 155 (87.1%) | 0 (0.0%) |
| College / Associate Degree | 213 (86.9%) | 6 (2.3%) |
| Bachelor's Degree or higher | 259 (90.6%) | 4 (1.5%) |
| Total | 672 (89.1%) | 16 (2.1%) |
Employment Occupations by Sex in Holland
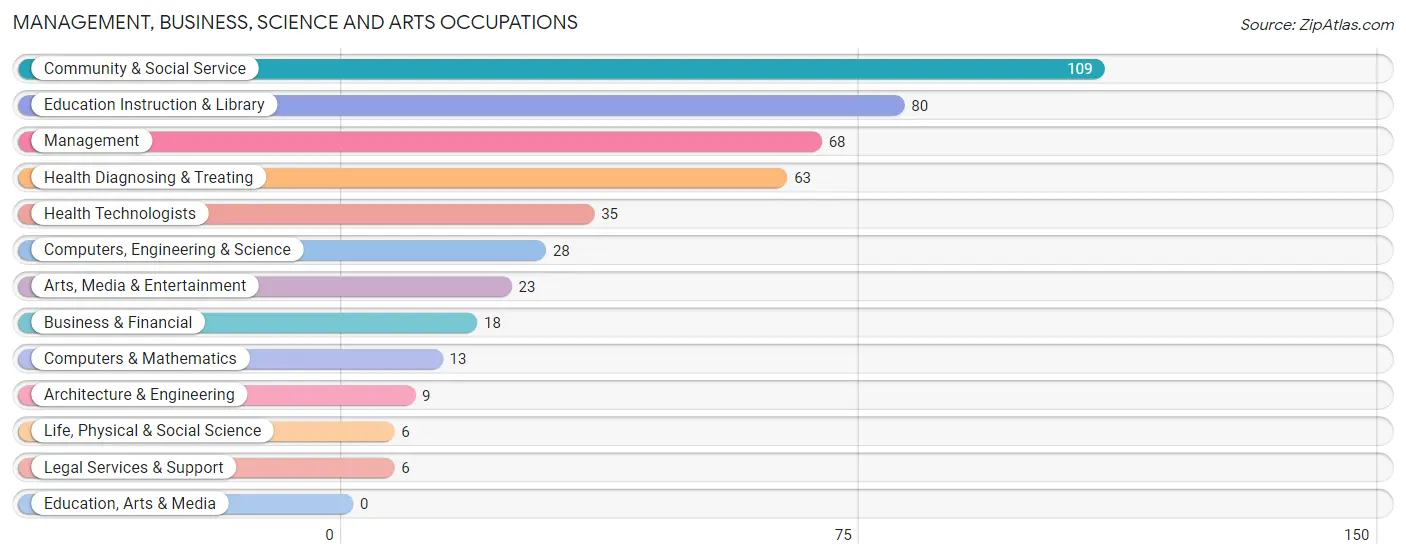
Management, Business, Science and Arts Occupations
The most common Management, Business, Science and Arts occupations in Holland are Community & Social Service (109 | 14.0%), Education Instruction & Library (80 | 10.3%), Management (68 | 8.7%), Health Diagnosing & Treating (63 | 8.1%), and Health Technologists (35 | 4.5%).
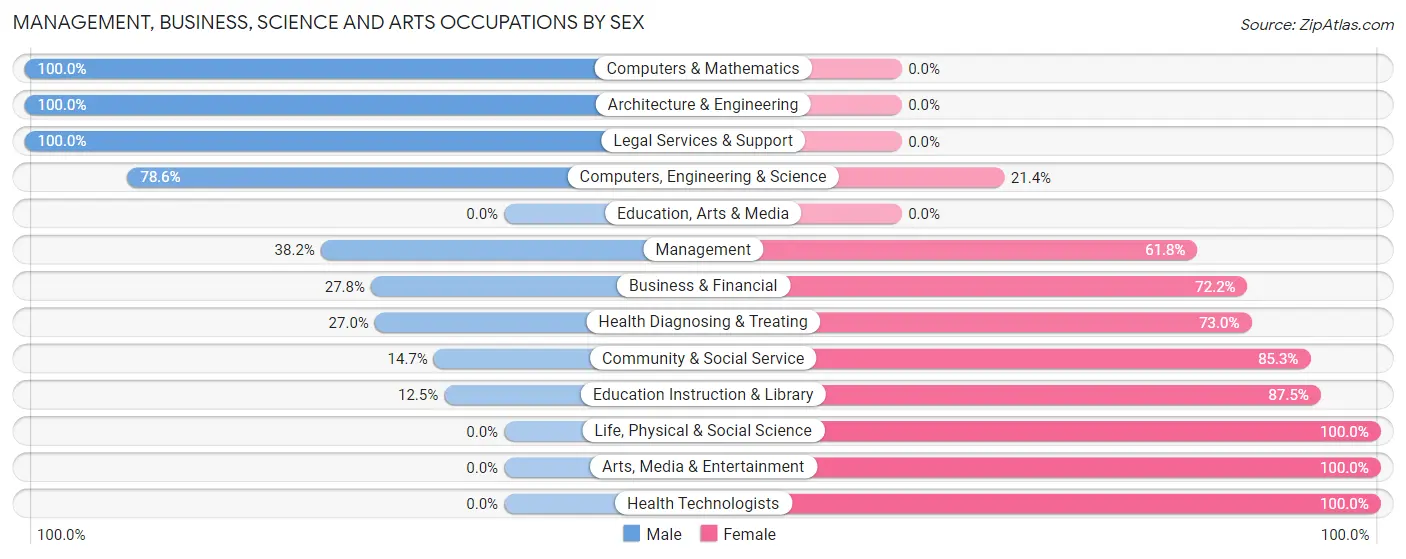
Management, Business, Science and Arts Occupations by Sex
Within the Management, Business, Science and Arts occupations in Holland, the most male-oriented occupations are Computers & Mathematics (100.0%), Architecture & Engineering (100.0%), and Legal Services & Support (100.0%), while the most female-oriented occupations are Life, Physical & Social Science (100.0%), Arts, Media & Entertainment (100.0%), and Health Technologists (100.0%).
| Occupation | Male | Female |
| Management | 26 (38.2%) | 42 (61.8%) |
| Business & Financial | 5 (27.8%) | 13 (72.2%) |
| Computers, Engineering & Science | 22 (78.6%) | 6 (21.4%) |
| Computers & Mathematics | 13 (100.0%) | 0 (0.0%) |
| Architecture & Engineering | 9 (100.0%) | 0 (0.0%) |
| Life, Physical & Social Science | 0 (0.0%) | 6 (100.0%) |
| Community & Social Service | 16 (14.7%) | 93 (85.3%) |
| Education, Arts & Media | 0 (0.0%) | 0 (0.0%) |
| Legal Services & Support | 6 (100.0%) | 0 (0.0%) |
| Education Instruction & Library | 10 (12.5%) | 70 (87.5%) |
| Arts, Media & Entertainment | 0 (0.0%) | 23 (100.0%) |
| Health Diagnosing & Treating | 17 (27.0%) | 46 (73.0%) |
| Health Technologists | 0 (0.0%) | 35 (100.0%) |
| Total (Category) | 86 (30.1%) | 200 (69.9%) |
| Total (Overall) | 397 (51.0%) | 381 (49.0%) |
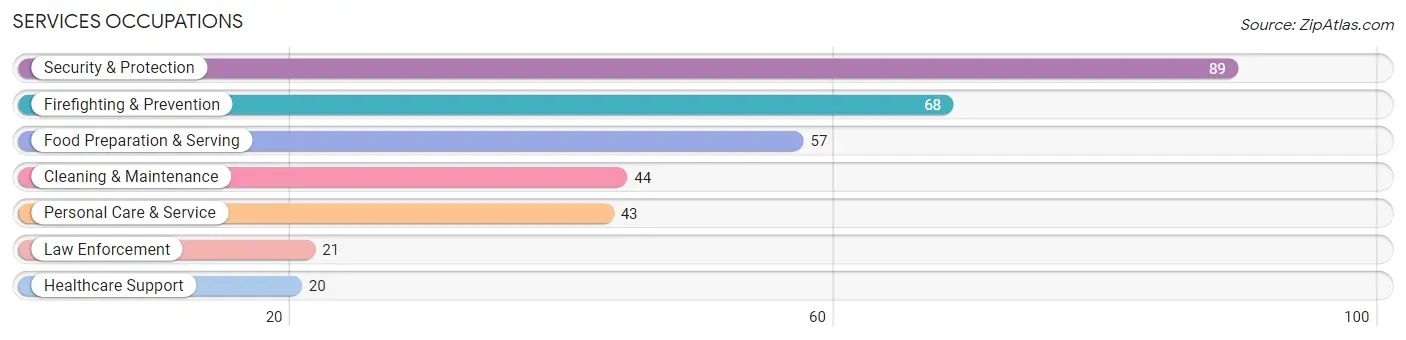
Services Occupations
The most common Services occupations in Holland are Security & Protection (89 | 11.4%), Firefighting & Prevention (68 | 8.7%), Food Preparation & Serving (57 | 7.3%), Cleaning & Maintenance (44 | 5.7%), and Personal Care & Service (43 | 5.5%).
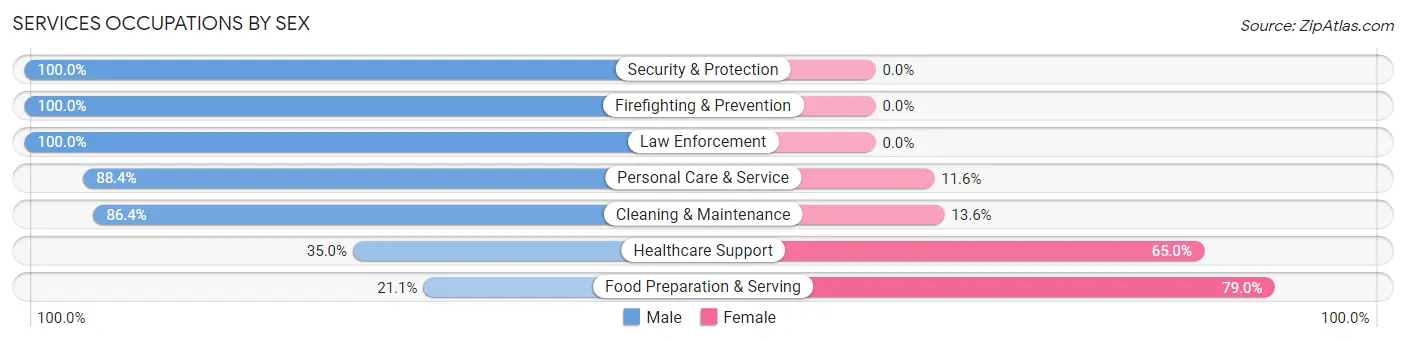
Services Occupations by Sex
Within the Services occupations in Holland, the most male-oriented occupations are Security & Protection (100.0%), Firefighting & Prevention (100.0%), and Law Enforcement (100.0%), while the most female-oriented occupations are Food Preparation & Serving (78.9%), Healthcare Support (65.0%), and Cleaning & Maintenance (13.6%).
| Occupation | Male | Female |
| Healthcare Support | 7 (35.0%) | 13 (65.0%) |
| Security & Protection | 89 (100.0%) | 0 (0.0%) |
| Firefighting & Prevention | 68 (100.0%) | 0 (0.0%) |
| Law Enforcement | 21 (100.0%) | 0 (0.0%) |
| Food Preparation & Serving | 12 (21.0%) | 45 (78.9%) |
| Cleaning & Maintenance | 38 (86.4%) | 6 (13.6%) |
| Personal Care & Service | 38 (88.4%) | 5 (11.6%) |
| Total (Category) | 184 (72.7%) | 69 (27.3%) |
| Total (Overall) | 397 (51.0%) | 381 (49.0%) |
Sales and Office Occupations
The most common Sales and Office occupations in Holland are Office & Administration (72 | 9.2%), and Sales & Related (40 | 5.1%).

Sales and Office Occupations by Sex
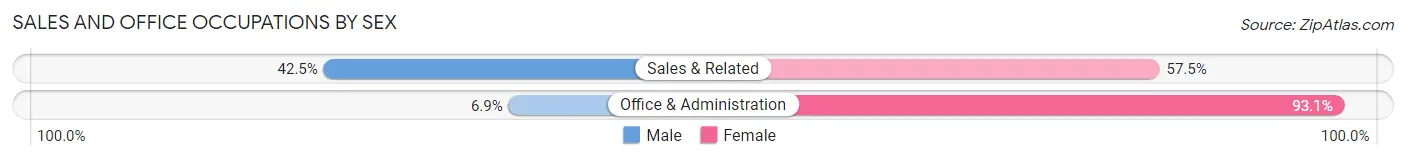
| Occupation | Male | Female |
| Sales & Related | 17 (42.5%) | 23 (57.5%) |
| Office & Administration | 5 (6.9%) | 67 (93.1%) |
| Total (Category) | 22 (19.6%) | 90 (80.4%) |
| Total (Overall) | 397 (51.0%) | 381 (49.0%) |
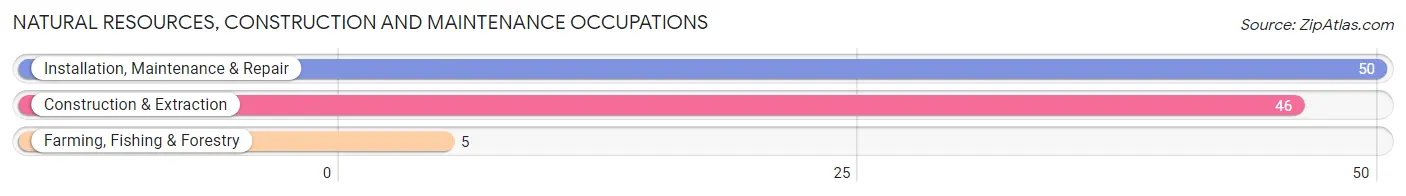
Natural Resources, Construction and Maintenance Occupations
The most common Natural Resources, Construction and Maintenance occupations in Holland are Installation, Maintenance & Repair (50 | 6.4%), Construction & Extraction (46 | 5.9%), and Farming, Fishing & Forestry (5 | 0.6%).
Natural Resources, Construction and Maintenance Occupations by Sex
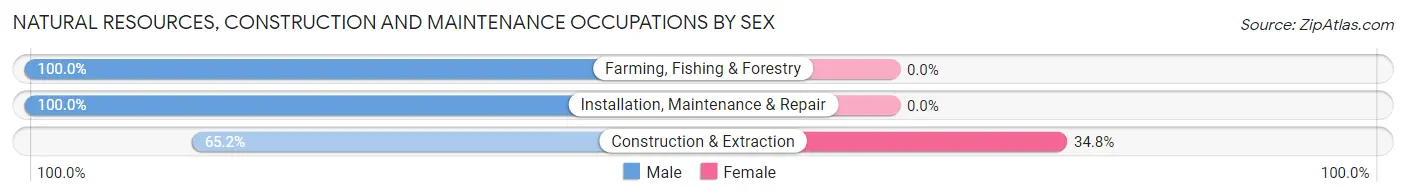
| Occupation | Male | Female |
| Farming, Fishing & Forestry | 5 (100.0%) | 0 (0.0%) |
| Construction & Extraction | 30 (65.2%) | 16 (34.8%) |
| Installation, Maintenance & Repair | 50 (100.0%) | 0 (0.0%) |
| Total (Category) | 85 (84.2%) | 16 (15.8%) |
| Total (Overall) | 397 (51.0%) | 381 (49.0%) |
Production, Transportation and Moving Occupations
The most common Production, Transportation and Moving occupations in Holland are Production (21 | 2.7%), and Transportation (5 | 0.6%).
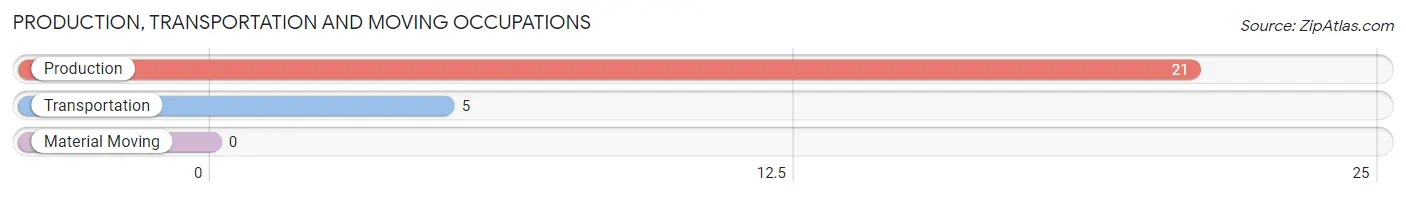
Production, Transportation and Moving Occupations by Sex
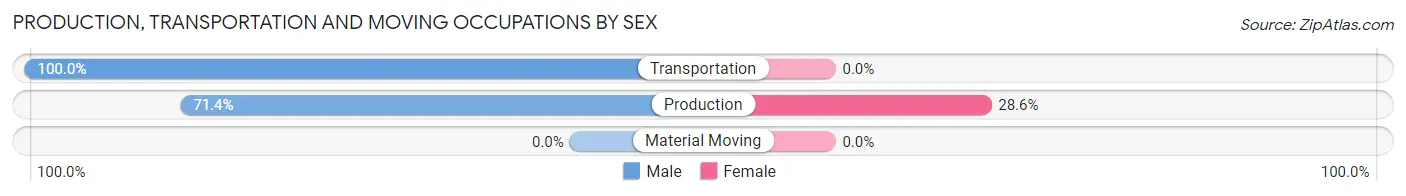
| Occupation | Male | Female |
| Production | 15 (71.4%) | 6 (28.6%) |
| Transportation | 5 (100.0%) | 0 (0.0%) |
| Material Moving | 0 (0.0%) | 0 (0.0%) |
| Total (Category) | 20 (76.9%) | 6 (23.1%) |
| Total (Overall) | 397 (51.0%) | 381 (49.0%) |
Employment Industries by Sex in Holland
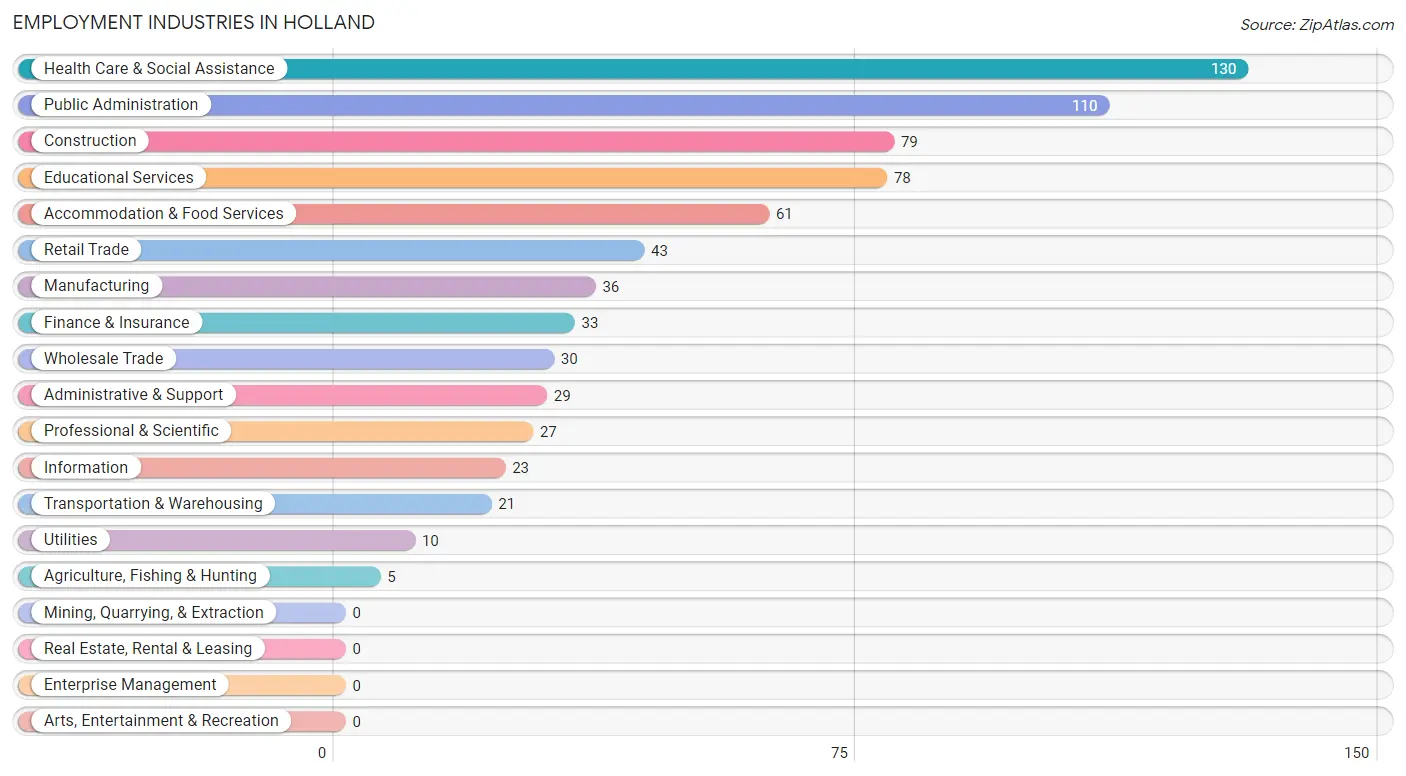
Employment Industries in Holland
The major employment industries in Holland include Health Care & Social Assistance (130 | 16.7%), Public Administration (110 | 14.1%), Construction (79 | 10.2%), Educational Services (78 | 10.0%), and Accommodation & Food Services (61 | 7.8%).
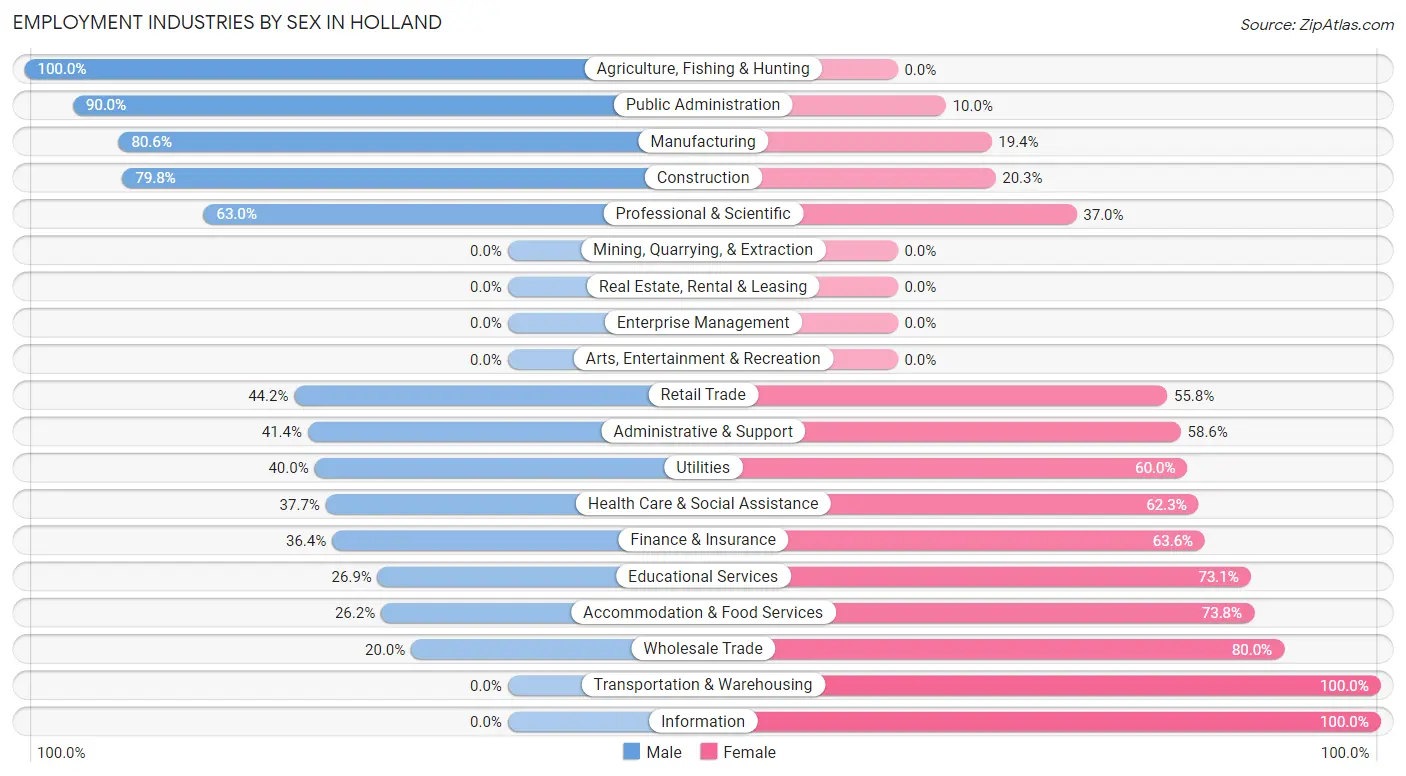
Employment Industries by Sex in Holland
The Holland industries that see more men than women are Agriculture, Fishing & Hunting (100.0%), Public Administration (90.0%), and Manufacturing (80.6%), whereas the industries that tend to have a higher number of women are Transportation & Warehousing (100.0%), Information (100.0%), and Wholesale Trade (80.0%).
| Industry | Male | Female |
| Agriculture, Fishing & Hunting | 5 (100.0%) | 0 (0.0%) |
| Mining, Quarrying, & Extraction | 0 (0.0%) | 0 (0.0%) |
| Construction | 63 (79.7%) | 16 (20.3%) |
| Manufacturing | 29 (80.6%) | 7 (19.4%) |
| Wholesale Trade | 6 (20.0%) | 24 (80.0%) |
| Retail Trade | 19 (44.2%) | 24 (55.8%) |
| Transportation & Warehousing | 0 (0.0%) | 21 (100.0%) |
| Utilities | 4 (40.0%) | 6 (60.0%) |
| Information | 0 (0.0%) | 23 (100.0%) |
| Finance & Insurance | 12 (36.4%) | 21 (63.6%) |
| Real Estate, Rental & Leasing | 0 (0.0%) | 0 (0.0%) |
| Professional & Scientific | 17 (63.0%) | 10 (37.0%) |
| Enterprise Management | 0 (0.0%) | 0 (0.0%) |
| Administrative & Support | 12 (41.4%) | 17 (58.6%) |
| Educational Services | 21 (26.9%) | 57 (73.1%) |
| Health Care & Social Assistance | 49 (37.7%) | 81 (62.3%) |
| Arts, Entertainment & Recreation | 0 (0.0%) | 0 (0.0%) |
| Accommodation & Food Services | 16 (26.2%) | 45 (73.8%) |
| Public Administration | 99 (90.0%) | 11 (10.0%) |
| Total | 397 (51.0%) | 381 (49.0%) |
Education in Holland
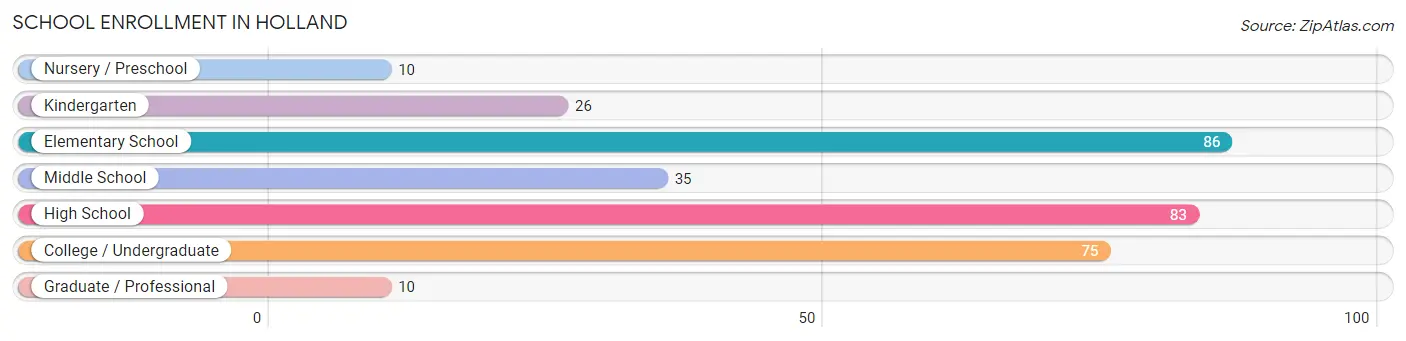
School Enrollment in Holland
The most common levels of schooling among the 325 students in Holland are elementary school (86 | 26.5%), high school (83 | 25.5%), and college / undergraduate (75 | 23.1%).
| School Level | # Students | % Students |
| Nursery / Preschool | 10 | 3.1% |
| Kindergarten | 26 | 8.0% |
| Elementary School | 86 | 26.5% |
| Middle School | 35 | 10.8% |
| High School | 83 | 25.5% |
| College / Undergraduate | 75 | 23.1% |
| Graduate / Professional | 10 | 3.1% |
| Total | 325 | 100.0% |
School Enrollment by Age by Funding Source in Holland
Out of a total of 325 students who are enrolled in schools in Holland, 59 (18.2%) attend a private institution, while the remaining 266 (81.8%) are enrolled in public schools. The age group of 18 to 19 year olds has the highest likelihood of being enrolled in private schools, with 4 (100.0% in the age bracket) enrolled. Conversely, the age group of 3 to 4 year olds has the lowest likelihood of being enrolled in a private school, with 10 (100.0% in the age bracket) attending a public institution.
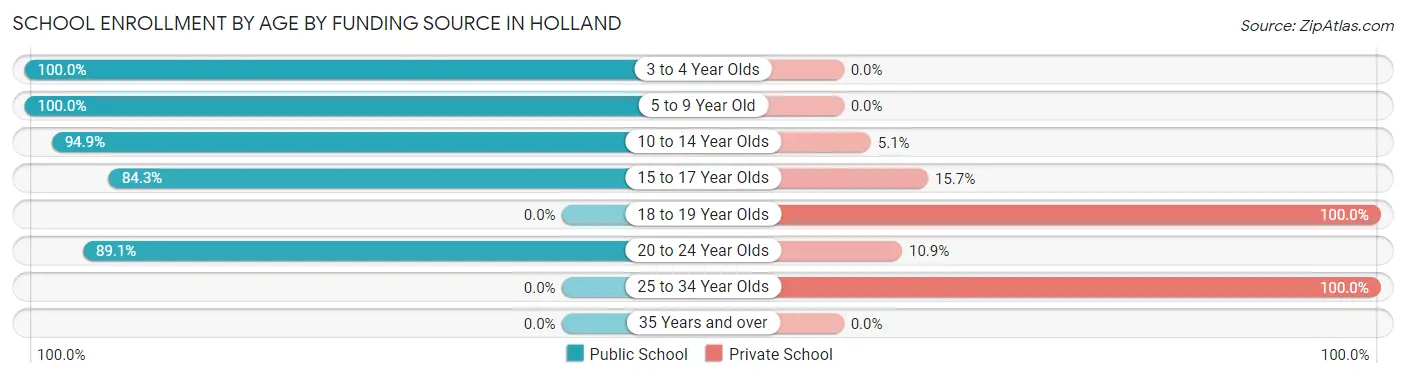
| Age Bracket | Public School | Private School |
| 3 to 4 Year Olds | 10 (100.0%) | 0 (0.0%) |
| 5 to 9 Year Old | 81 (100.0%) | 0 (0.0%) |
| 10 to 14 Year Olds | 75 (94.9%) | 4 (5.1%) |
| 15 to 17 Year Olds | 59 (84.3%) | 11 (15.7%) |
| 18 to 19 Year Olds | 0 (0.0%) | 4 (100.0%) |
| 20 to 24 Year Olds | 41 (89.1%) | 5 (10.9%) |
| 25 to 34 Year Olds | 0 (0.0%) | 35 (100.0%) |
| 35 Years and over | 0 (0.0%) | 0 (0.0%) |
| Total | 266 (81.8%) | 59 (18.2%) |
Educational Attainment by Field of Study in Holland
Computers & mathematics (85 | 21.0%), science & technology (76 | 18.8%), business (67 | 16.6%), arts & humanities (42 | 10.4%), and bio, nature & agricultural (21 | 5.2%) are the most common fields of study among 404 individuals in Holland who have obtained a bachelor's degree or higher.
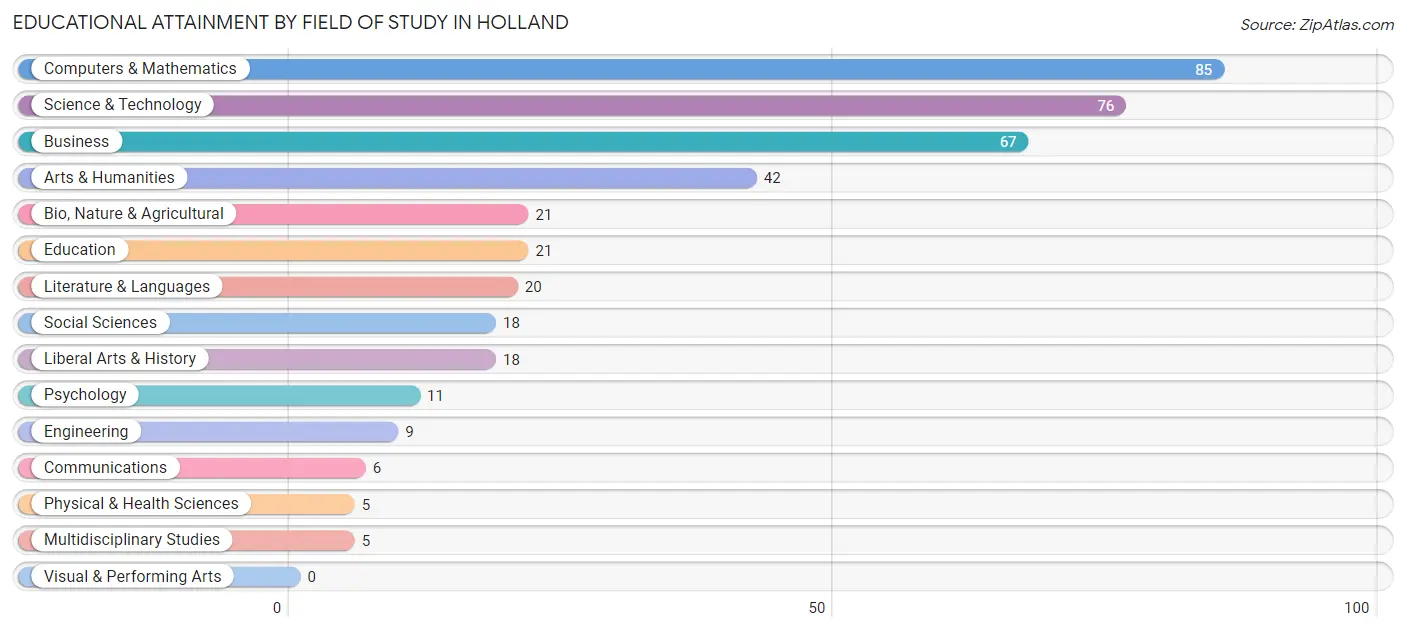
| Field of Study | # Graduates | % Graduates |
| Computers & Mathematics | 85 | 21.0% |
| Bio, Nature & Agricultural | 21 | 5.2% |
| Physical & Health Sciences | 5 | 1.2% |
| Psychology | 11 | 2.7% |
| Social Sciences | 18 | 4.5% |
| Engineering | 9 | 2.2% |
| Multidisciplinary Studies | 5 | 1.2% |
| Science & Technology | 76 | 18.8% |
| Business | 67 | 16.6% |
| Education | 21 | 5.2% |
| Literature & Languages | 20 | 5.0% |
| Liberal Arts & History | 18 | 4.5% |
| Visual & Performing Arts | 0 | 0.0% |
| Communications | 6 | 1.5% |
| Arts & Humanities | 42 | 10.4% |
| Total | 404 | 100.0% |
Transportation & Commute in Holland
Vehicle Availability by Sex in Holland
The most prevalent vehicle ownership categories in Holland are males with 2 vehicles (251, accounting for 66.2%) and females with 2 vehicles (161, making up 66.9%).
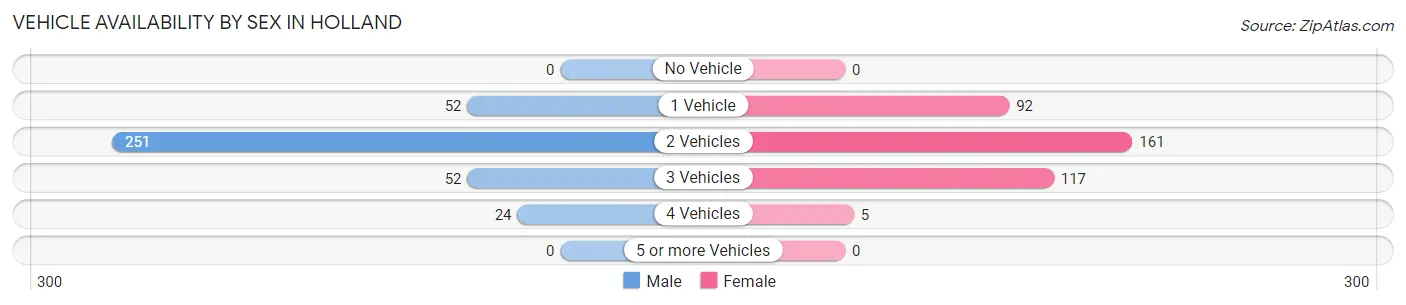
| Vehicles Available | Male | Female |
| No Vehicle | 0 (0.0%) | 0 (0.0%) |
| 1 Vehicle | 52 (13.7%) | 92 (24.5%) |
| 2 Vehicles | 251 (66.2%) | 161 (42.9%) |
| 3 Vehicles | 52 (13.7%) | 117 (31.2%) |
| 4 Vehicles | 24 (6.3%) | 5 (1.3%) |
| 5 or more Vehicles | 0 (0.0%) | 0 (0.0%) |
| Total | 379 (100.0%) | 375 (100.0%) |
Commute Time in Holland
The most frequently occuring commute durations in Holland are 45 to 59 minutes (178 commuters, 24.5%), 15 to 19 minutes (132 commuters, 18.2%), and 20 to 24 minutes (105 commuters, 14.5%).
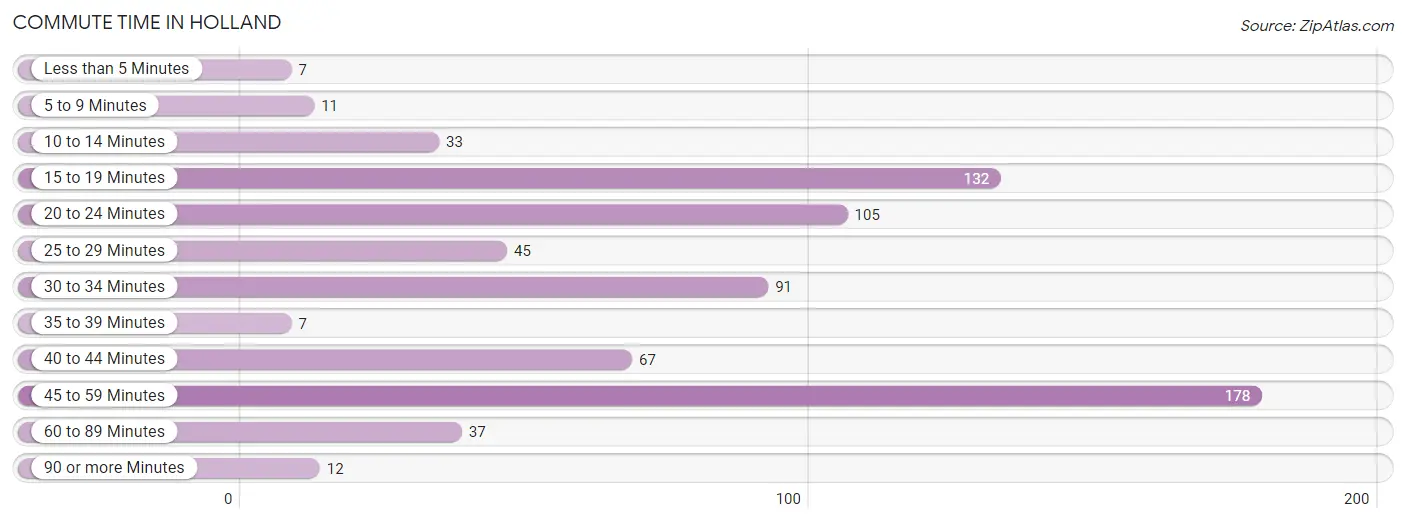
| Commute Time | # Commuters | % Commuters |
| Less than 5 Minutes | 7 | 1.0% |
| 5 to 9 Minutes | 11 | 1.5% |
| 10 to 14 Minutes | 33 | 4.5% |
| 15 to 19 Minutes | 132 | 18.2% |
| 20 to 24 Minutes | 105 | 14.5% |
| 25 to 29 Minutes | 45 | 6.2% |
| 30 to 34 Minutes | 91 | 12.6% |
| 35 to 39 Minutes | 7 | 1.0% |
| 40 to 44 Minutes | 67 | 9.2% |
| 45 to 59 Minutes | 178 | 24.5% |
| 60 to 89 Minutes | 37 | 5.1% |
| 90 or more Minutes | 12 | 1.7% |
Commute Time by Sex in Holland
The most common commute times in Holland are 45 to 59 minutes (102 commuters, 27.8%) for males and 20 to 24 minutes (78 commuters, 21.8%) for females.
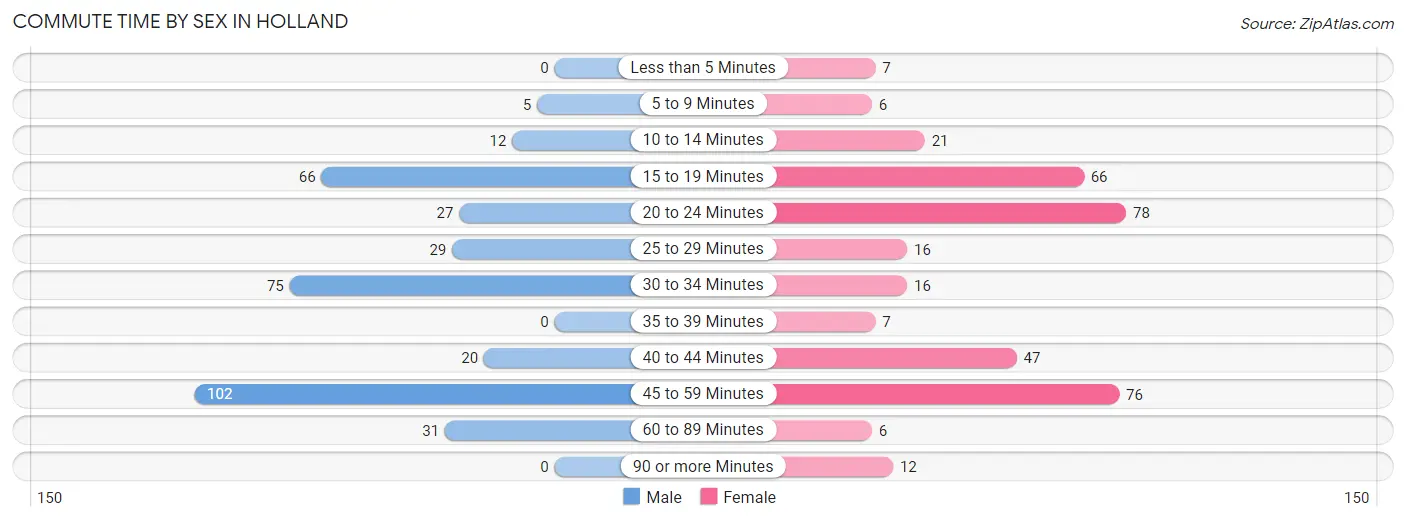
| Commute Time | Male | Female |
| Less than 5 Minutes | 0 (0.0%) | 7 (2.0%) |
| 5 to 9 Minutes | 5 (1.4%) | 6 (1.7%) |
| 10 to 14 Minutes | 12 (3.3%) | 21 (5.9%) |
| 15 to 19 Minutes | 66 (18.0%) | 66 (18.4%) |
| 20 to 24 Minutes | 27 (7.4%) | 78 (21.8%) |
| 25 to 29 Minutes | 29 (7.9%) | 16 (4.5%) |
| 30 to 34 Minutes | 75 (20.4%) | 16 (4.5%) |
| 35 to 39 Minutes | 0 (0.0%) | 7 (2.0%) |
| 40 to 44 Minutes | 20 (5.4%) | 47 (13.1%) |
| 45 to 59 Minutes | 102 (27.8%) | 76 (21.2%) |
| 60 to 89 Minutes | 31 (8.5%) | 6 (1.7%) |
| 90 or more Minutes | 0 (0.0%) | 12 (3.4%) |
Time of Departure to Work by Sex in Holland
The most frequent times of departure to work in Holland are 11:00 AM to 11:59 AM (91, 24.8%) for males and 12:00 PM to 3:59 PM (68, 19.0%) for females.
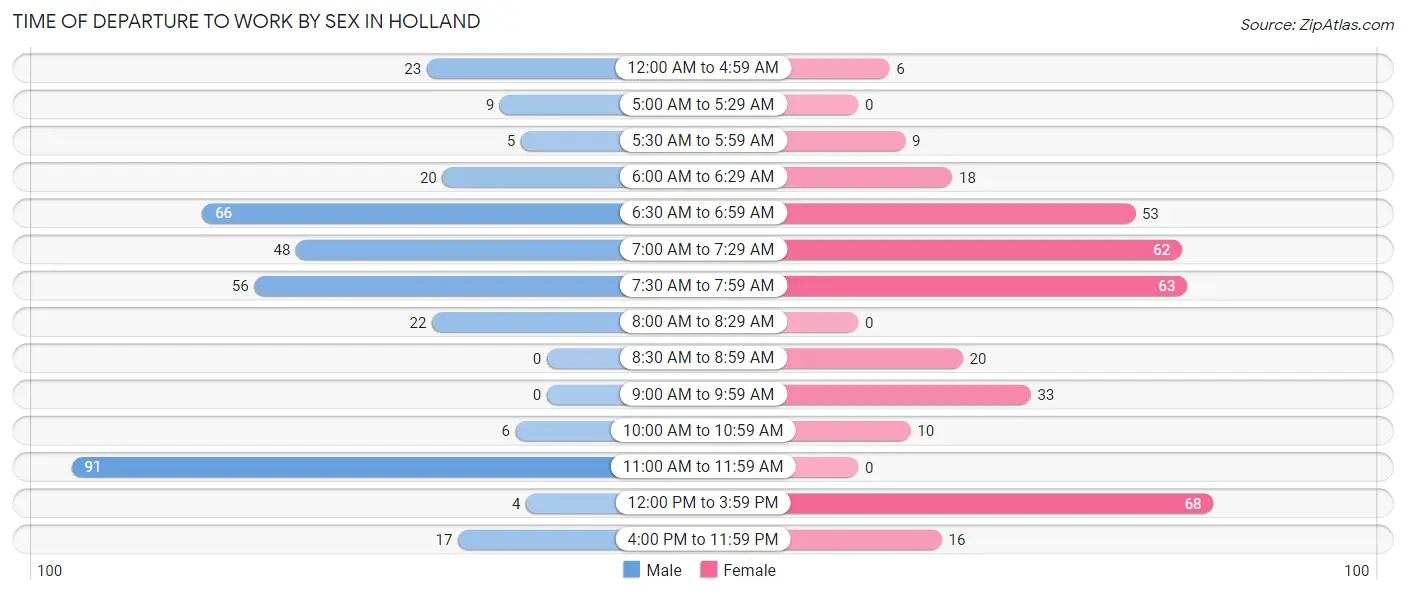
| Time of Departure | Male | Female |
| 12:00 AM to 4:59 AM | 23 (6.3%) | 6 (1.7%) |
| 5:00 AM to 5:29 AM | 9 (2.5%) | 0 (0.0%) |
| 5:30 AM to 5:59 AM | 5 (1.4%) | 9 (2.5%) |
| 6:00 AM to 6:29 AM | 20 (5.4%) | 18 (5.0%) |
| 6:30 AM to 6:59 AM | 66 (18.0%) | 53 (14.8%) |
| 7:00 AM to 7:29 AM | 48 (13.1%) | 62 (17.3%) |
| 7:30 AM to 7:59 AM | 56 (15.3%) | 63 (17.6%) |
| 8:00 AM to 8:29 AM | 22 (6.0%) | 0 (0.0%) |
| 8:30 AM to 8:59 AM | 0 (0.0%) | 20 (5.6%) |
| 9:00 AM to 9:59 AM | 0 (0.0%) | 33 (9.2%) |
| 10:00 AM to 10:59 AM | 6 (1.6%) | 10 (2.8%) |
| 11:00 AM to 11:59 AM | 91 (24.8%) | 0 (0.0%) |
| 12:00 PM to 3:59 PM | 4 (1.1%) | 68 (19.0%) |
| 4:00 PM to 11:59 PM | 17 (4.6%) | 16 (4.5%) |
| Total | 367 (100.0%) | 358 (100.0%) |
Housing Occupancy in Holland
Occupancy by Ownership in Holland
Of the total 692 dwellings in Holland, owner-occupied units account for 651 (94.1%), while renter-occupied units make up 41 (5.9%).
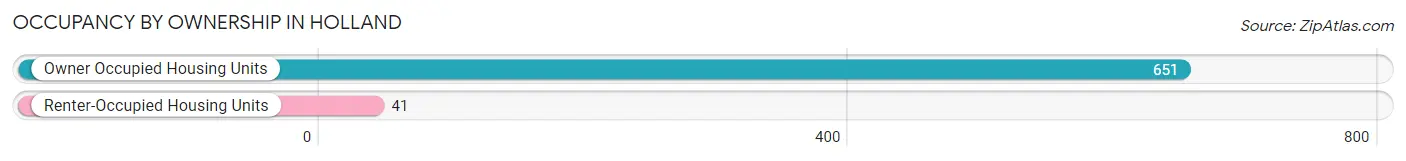
| Occupancy | # Housing Units | % Housing Units |
| Owner Occupied Housing Units | 651 | 94.1% |
| Renter-Occupied Housing Units | 41 | 5.9% |
| Total Occupied Housing Units | 692 | 100.0% |
Occupancy by Household Size in Holland
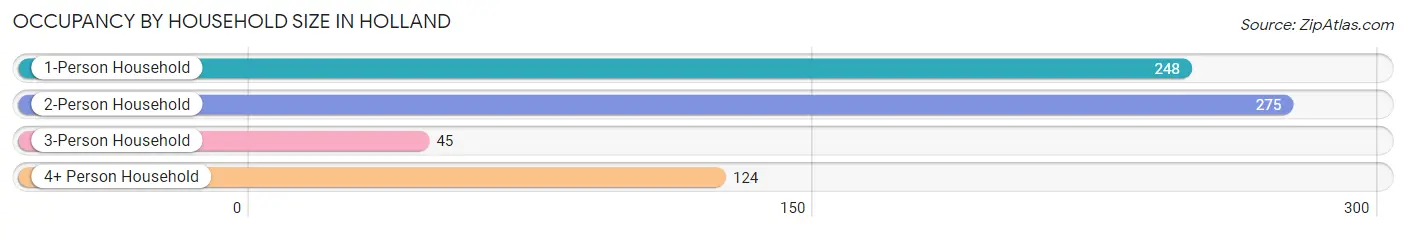
| Household Size | # Housing Units | % Housing Units |
| 1-Person Household | 248 | 35.8% |
| 2-Person Household | 275 | 39.7% |
| 3-Person Household | 45 | 6.5% |
| 4+ Person Household | 124 | 17.9% |
| Total Housing Units | 692 | 100.0% |
Occupancy by Ownership by Household Size in Holland
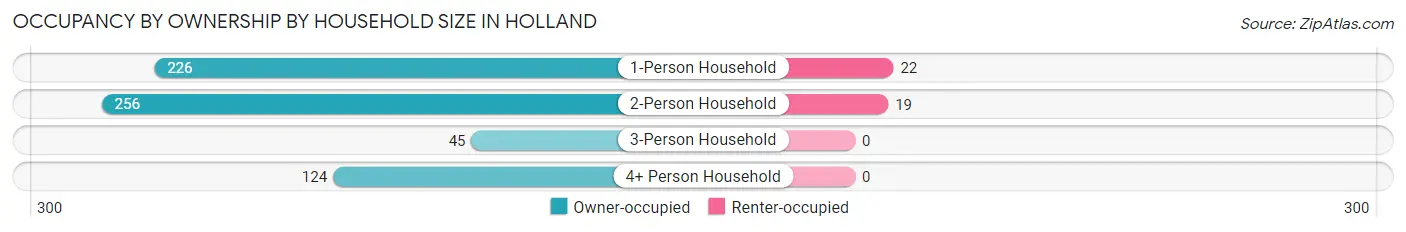
| Household Size | Owner-occupied | Renter-occupied |
| 1-Person Household | 226 (91.1%) | 22 (8.9%) |
| 2-Person Household | 256 (93.1%) | 19 (6.9%) |
| 3-Person Household | 45 (100.0%) | 0 (0.0%) |
| 4+ Person Household | 124 (100.0%) | 0 (0.0%) |
| Total Housing Units | 651 (94.1%) | 41 (5.9%) |
Occupancy by Educational Attainment in Holland
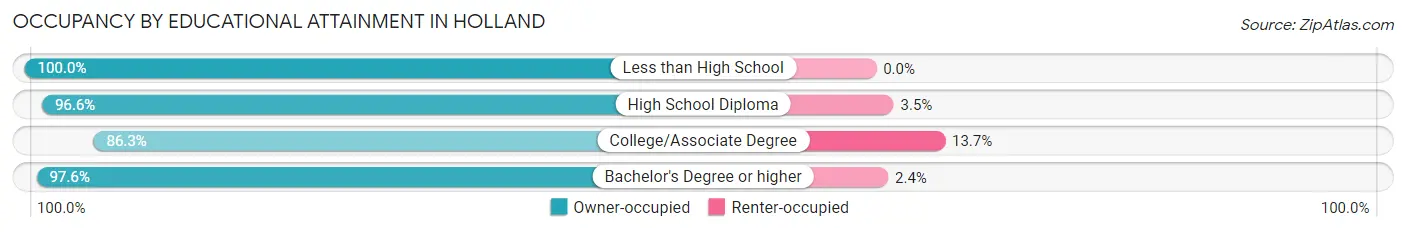
| Household Size | Owner-occupied | Renter-occupied |
| Less than High School | 17 (100.0%) | 0 (0.0%) |
| High School Diploma | 168 (96.6%) | 6 (3.5%) |
| College/Associate Degree | 177 (86.3%) | 28 (13.7%) |
| Bachelor's Degree or higher | 289 (97.6%) | 7 (2.4%) |
Occupancy by Age of Householder in Holland
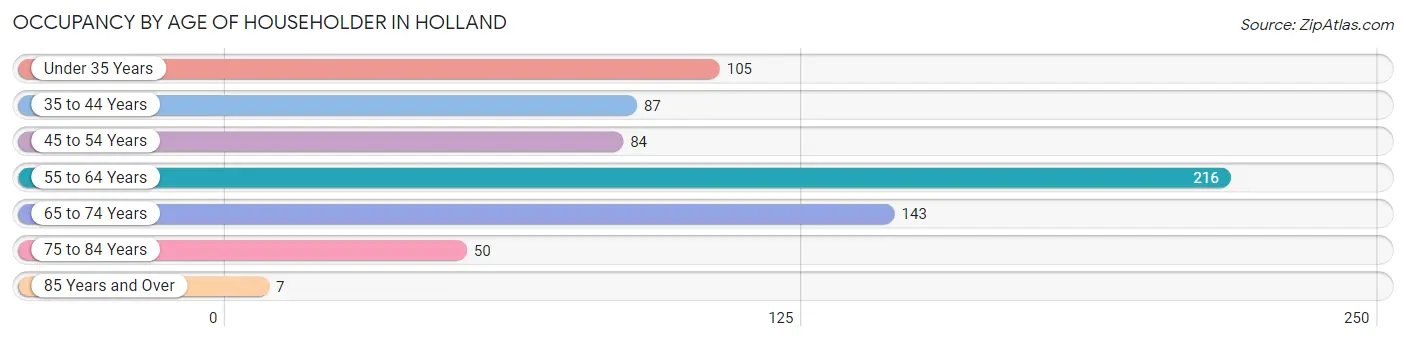
| Age Bracket | # Households | % Households |
| Under 35 Years | 105 | 15.2% |
| 35 to 44 Years | 87 | 12.6% |
| 45 to 54 Years | 84 | 12.1% |
| 55 to 64 Years | 216 | 31.2% |
| 65 to 74 Years | 143 | 20.7% |
| 75 to 84 Years | 50 | 7.2% |
| 85 Years and Over | 7 | 1.0% |
| Total | 692 | 100.0% |
Housing Finances in Holland
Median Income by Occupancy in Holland
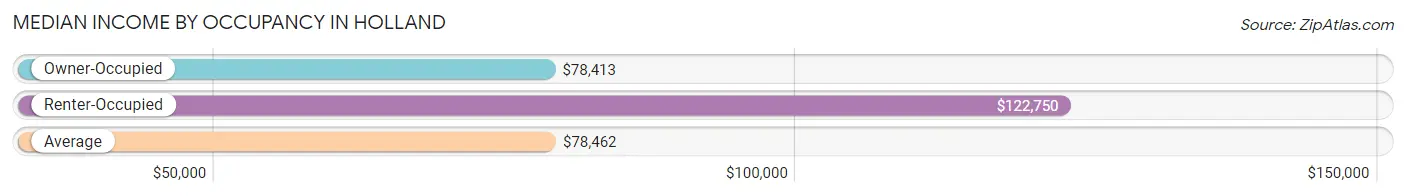
| Occupancy Type | # Households | Median Income |
| Owner-Occupied | 651 (94.1%) | $78,413 |
| Renter-Occupied | 41 (5.9%) | $122,750 |
| Average | 692 (100.0%) | $78,462 |
Occupancy by Householder Income Bracket in Holland
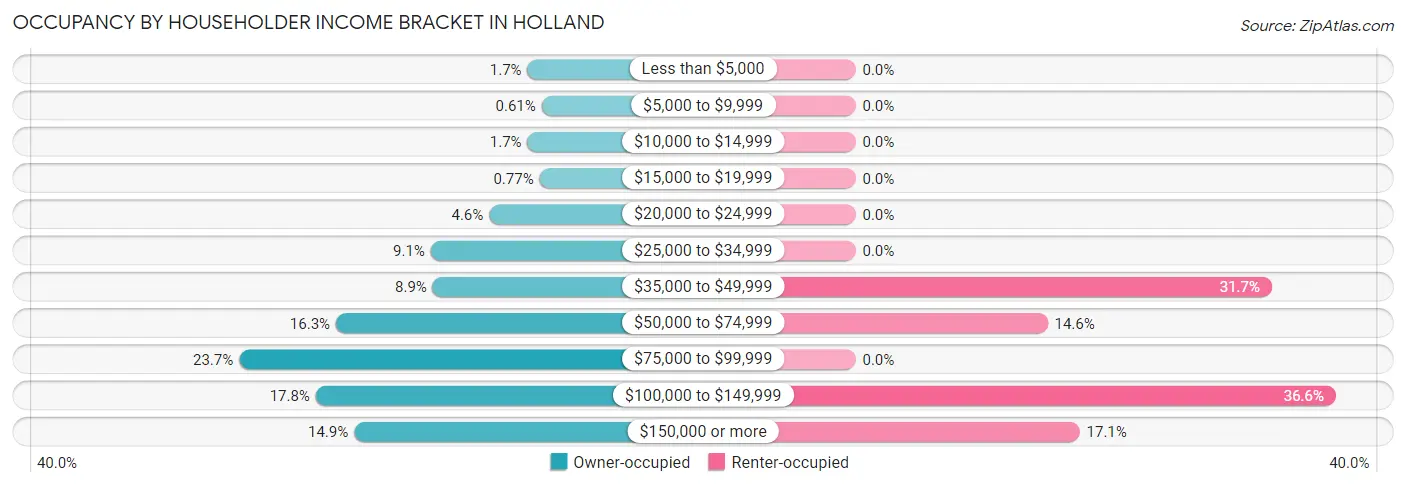
| Income Bracket | Owner-occupied | Renter-occupied |
| Less than $5,000 | 11 (1.7%) | 0 (0.0%) |
| $5,000 to $9,999 | 4 (0.6%) | 0 (0.0%) |
| $10,000 to $14,999 | 11 (1.7%) | 0 (0.0%) |
| $15,000 to $19,999 | 5 (0.8%) | 0 (0.0%) |
| $20,000 to $24,999 | 30 (4.6%) | 0 (0.0%) |
| $25,000 to $34,999 | 59 (9.1%) | 0 (0.0%) |
| $35,000 to $49,999 | 58 (8.9%) | 13 (31.7%) |
| $50,000 to $74,999 | 106 (16.3%) | 6 (14.6%) |
| $75,000 to $99,999 | 154 (23.7%) | 0 (0.0%) |
| $100,000 to $149,999 | 116 (17.8%) | 15 (36.6%) |
| $150,000 or more | 97 (14.9%) | 7 (17.1%) |
| Total | 651 (100.0%) | 41 (100.0%) |
Monthly Housing Cost Tiers in Holland
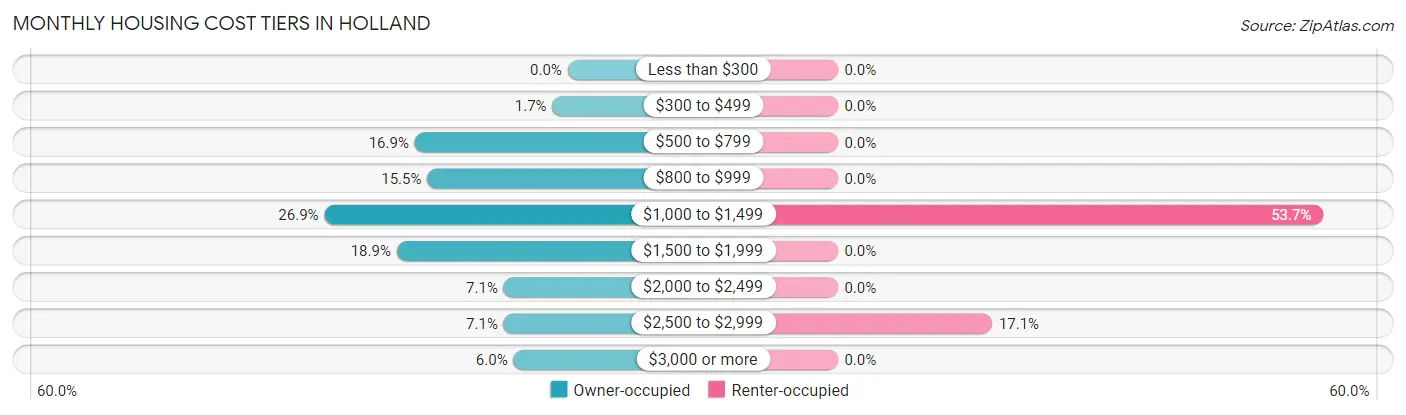
| Monthly Cost | Owner-occupied | Renter-occupied |
| Less than $300 | 0 (0.0%) | 0 (0.0%) |
| $300 to $499 | 11 (1.7%) | 0 (0.0%) |
| $500 to $799 | 110 (16.9%) | 0 (0.0%) |
| $800 to $999 | 101 (15.5%) | 0 (0.0%) |
| $1,000 to $1,499 | 175 (26.9%) | 22 (53.7%) |
| $1,500 to $1,999 | 123 (18.9%) | 0 (0.0%) |
| $2,000 to $2,499 | 46 (7.1%) | 0 (0.0%) |
| $2,500 to $2,999 | 46 (7.1%) | 7 (17.1%) |
| $3,000 or more | 39 (6.0%) | 0 (0.0%) |
| Total | 651 (100.0%) | 41 (100.0%) |
Physical Housing Characteristics in Holland
Housing Structures in Holland
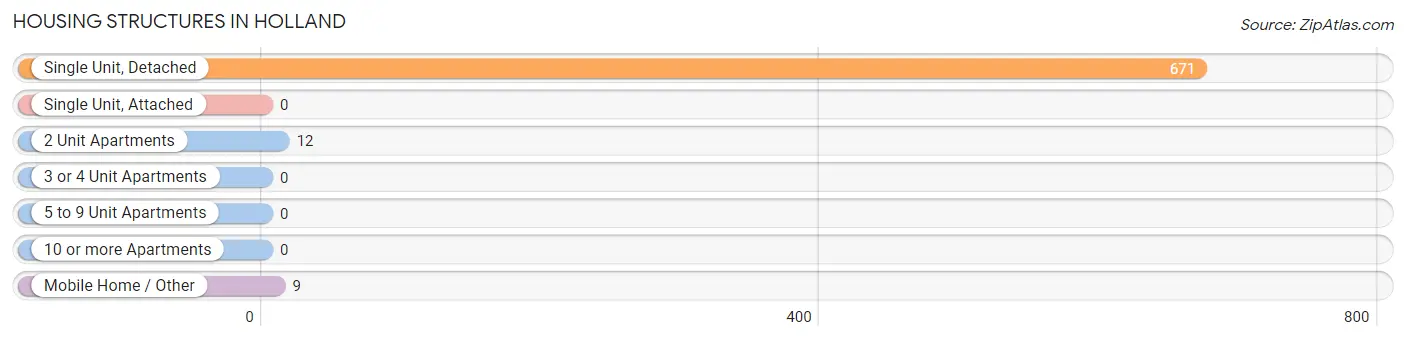
| Structure Type | # Housing Units | % Housing Units |
| Single Unit, Detached | 671 | 97.0% |
| Single Unit, Attached | 0 | 0.0% |
| 2 Unit Apartments | 12 | 1.7% |
| 3 or 4 Unit Apartments | 0 | 0.0% |
| 5 to 9 Unit Apartments | 0 | 0.0% |
| 10 or more Apartments | 0 | 0.0% |
| Mobile Home / Other | 9 | 1.3% |
| Total | 692 | 100.0% |
Housing Structures by Occupancy in Holland
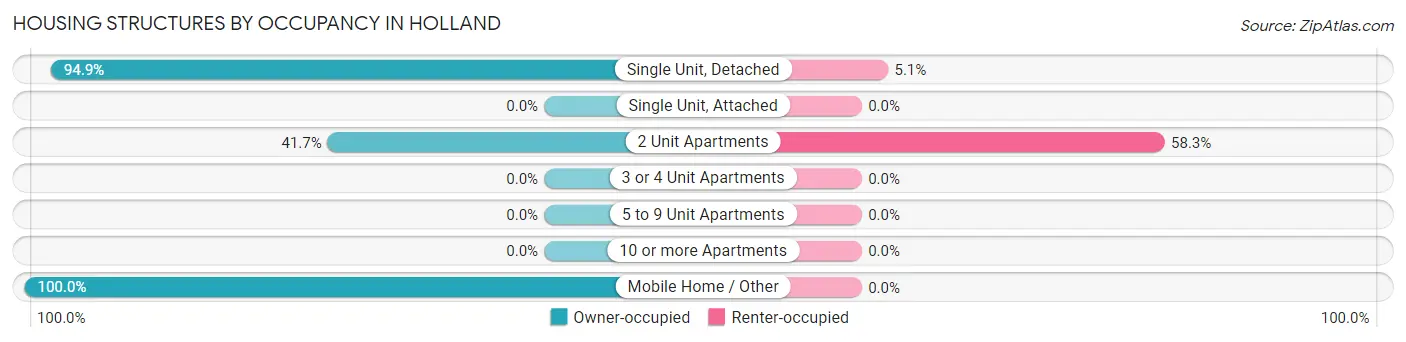
| Structure Type | Owner-occupied | Renter-occupied |
| Single Unit, Detached | 637 (94.9%) | 34 (5.1%) |
| Single Unit, Attached | 0 (0.0%) | 0 (0.0%) |
| 2 Unit Apartments | 5 (41.7%) | 7 (58.3%) |
| 3 or 4 Unit Apartments | 0 (0.0%) | 0 (0.0%) |
| 5 to 9 Unit Apartments | 0 (0.0%) | 0 (0.0%) |
| 10 or more Apartments | 0 (0.0%) | 0 (0.0%) |
| Mobile Home / Other | 9 (100.0%) | 0 (0.0%) |
| Total | 651 (94.1%) | 41 (5.9%) |
Housing Structures by Number of Rooms in Holland
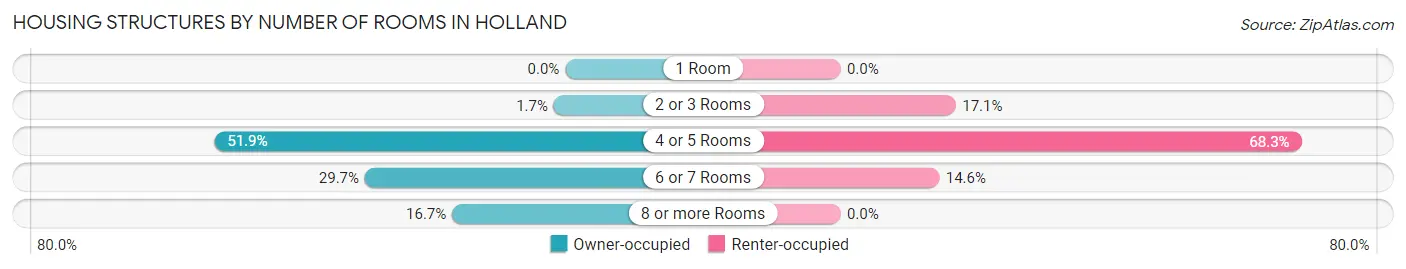
| Number of Rooms | Owner-occupied | Renter-occupied |
| 1 Room | 0 (0.0%) | 0 (0.0%) |
| 2 or 3 Rooms | 11 (1.7%) | 7 (17.1%) |
| 4 or 5 Rooms | 338 (51.9%) | 28 (68.3%) |
| 6 or 7 Rooms | 193 (29.6%) | 6 (14.6%) |
| 8 or more Rooms | 109 (16.7%) | 0 (0.0%) |
| Total | 651 (100.0%) | 41 (100.0%) |
Housing Structure by Heating Type in Holland
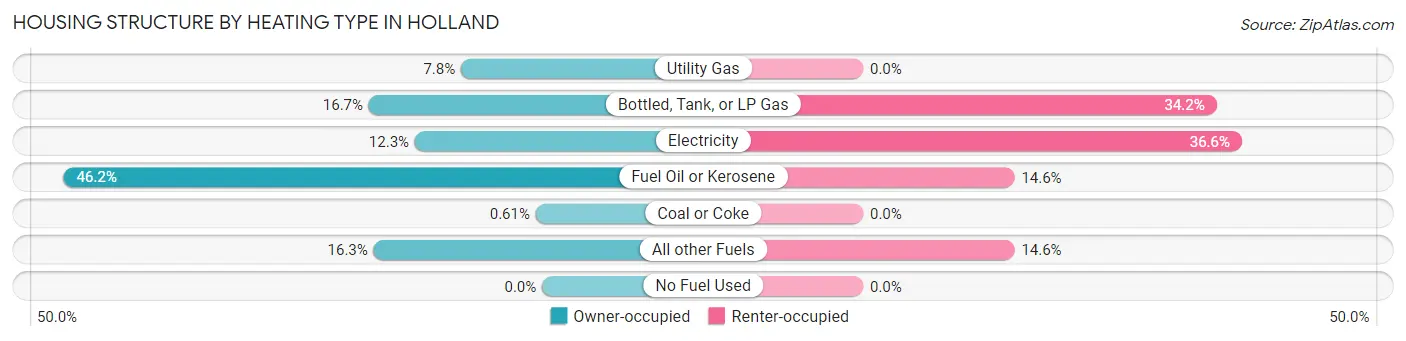
| Heating Type | Owner-occupied | Renter-occupied |
| Utility Gas | 51 (7.8%) | 0 (0.0%) |
| Bottled, Tank, or LP Gas | 109 (16.7%) | 14 (34.2%) |
| Electricity | 80 (12.3%) | 15 (36.6%) |
| Fuel Oil or Kerosene | 301 (46.2%) | 6 (14.6%) |
| Coal or Coke | 4 (0.6%) | 0 (0.0%) |
| All other Fuels | 106 (16.3%) | 6 (14.6%) |
| No Fuel Used | 0 (0.0%) | 0 (0.0%) |
| Total | 651 (100.0%) | 41 (100.0%) |
Household Vehicle Usage in Holland
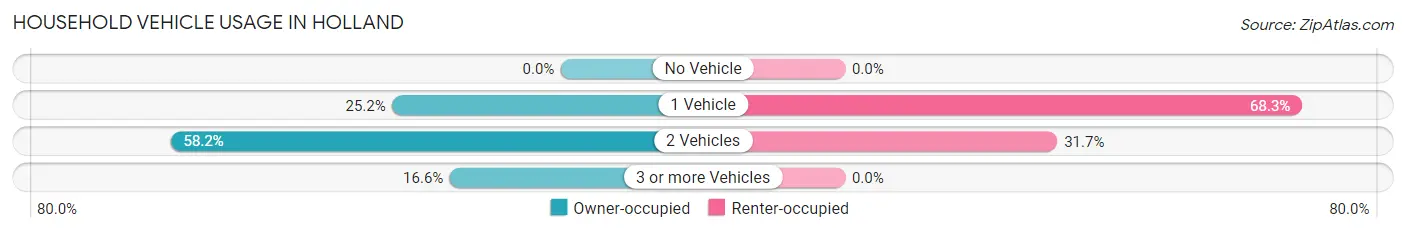
| Vehicles per Household | Owner-occupied | Renter-occupied |
| No Vehicle | 0 (0.0%) | 0 (0.0%) |
| 1 Vehicle | 164 (25.2%) | 28 (68.3%) |
| 2 Vehicles | 379 (58.2%) | 13 (31.7%) |
| 3 or more Vehicles | 108 (16.6%) | 0 (0.0%) |
| Total | 651 (100.0%) | 41 (100.0%) |
Real Estate & Mortgages in Holland
Real Estate and Mortgage Overview in Holland
| Characteristic | Without Mortgage | With Mortgage |
| Housing Units | 204 | 447 |
| Median Property Value | $295,000 | $273,900 |
| Median Household Income | $60,000 | $66 |
| Monthly Housing Costs | $728 | $39 |
| Real Estate Taxes | $3,900 | $0 |
Property Value by Mortgage Status in Holland
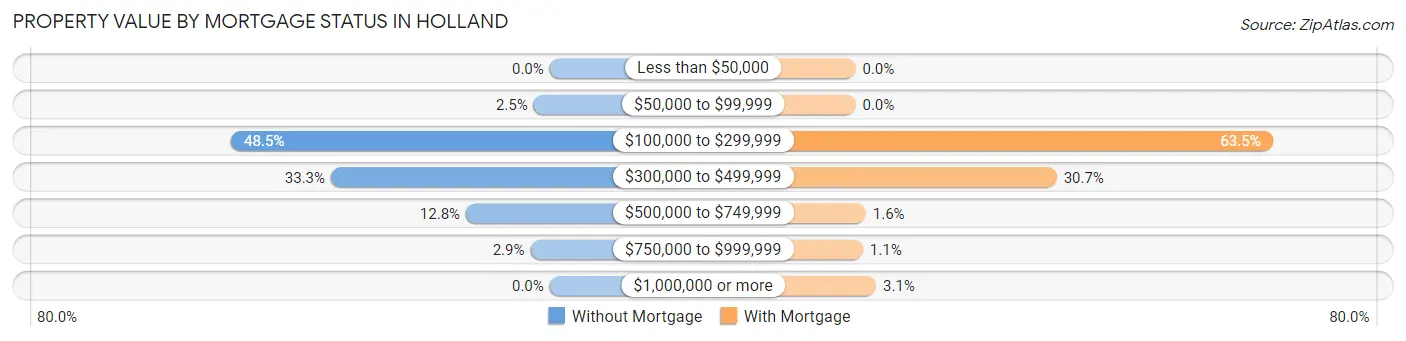
| Property Value | Without Mortgage | With Mortgage |
| Less than $50,000 | 0 (0.0%) | 0 (0.0%) |
| $50,000 to $99,999 | 5 (2.5%) | 0 (0.0%) |
| $100,000 to $299,999 | 99 (48.5%) | 284 (63.5%) |
| $300,000 to $499,999 | 68 (33.3%) | 137 (30.6%) |
| $500,000 to $749,999 | 26 (12.8%) | 7 (1.6%) |
| $750,000 to $999,999 | 6 (2.9%) | 5 (1.1%) |
| $1,000,000 or more | 0 (0.0%) | 14 (3.1%) |
| Total | 204 (100.0%) | 447 (100.0%) |
Household Income by Mortgage Status in Holland
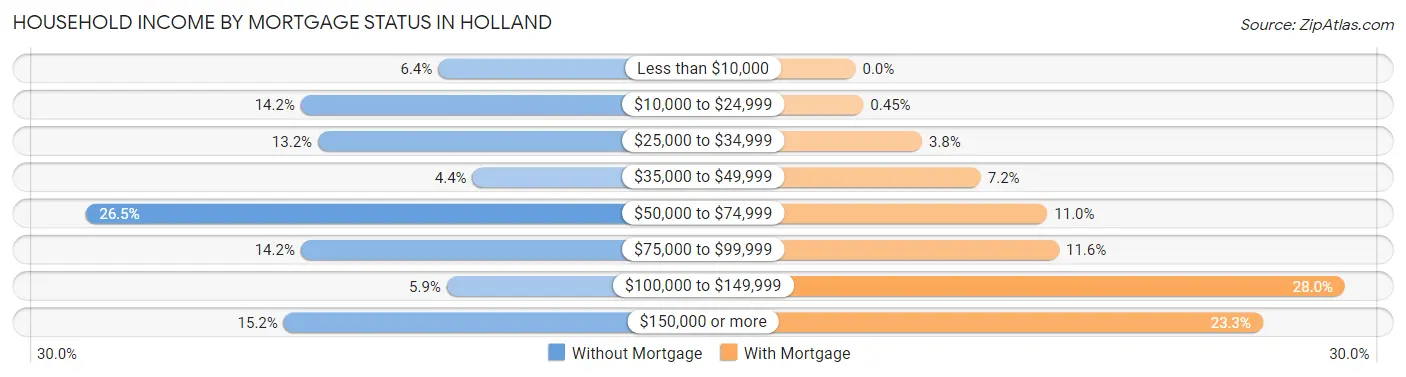
| Household Income | Without Mortgage | With Mortgage |
| Less than $10,000 | 13 (6.4%) | 0 (0.0%) |
| $10,000 to $24,999 | 29 (14.2%) | 2 (0.4%) |
| $25,000 to $34,999 | 27 (13.2%) | 17 (3.8%) |
| $35,000 to $49,999 | 9 (4.4%) | 32 (7.2%) |
| $50,000 to $74,999 | 54 (26.5%) | 49 (11.0%) |
| $75,000 to $99,999 | 29 (14.2%) | 52 (11.6%) |
| $100,000 to $149,999 | 12 (5.9%) | 125 (28.0%) |
| $150,000 or more | 31 (15.2%) | 104 (23.3%) |
| Total | 204 (100.0%) | 447 (100.0%) |
Property Value to Household Income Ratio in Holland
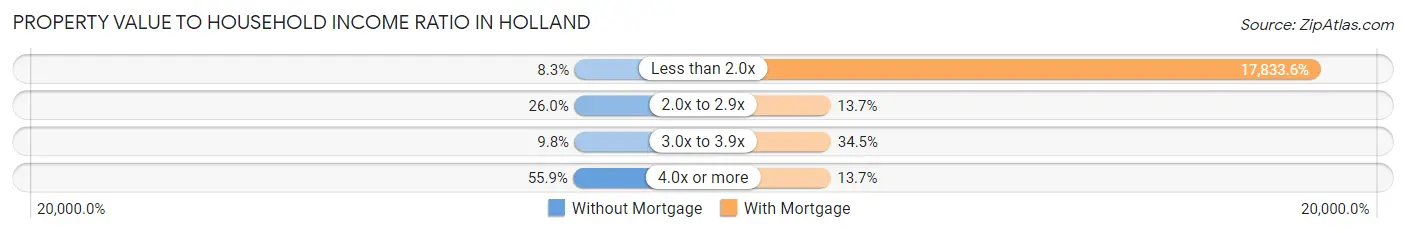
| Value-to-Income Ratio | Without Mortgage | With Mortgage |
| Less than 2.0x | 17 (8.3%) | 79,716 (17,833.6%) |
| 2.0x to 2.9x | 53 (26.0%) | 61 (13.7%) |
| 3.0x to 3.9x | 20 (9.8%) | 154 (34.4%) |
| 4.0x or more | 114 (55.9%) | 61 (13.7%) |
| Total | 204 (100.0%) | 447 (100.0%) |
Real Estate Taxes by Mortgage Status in Holland
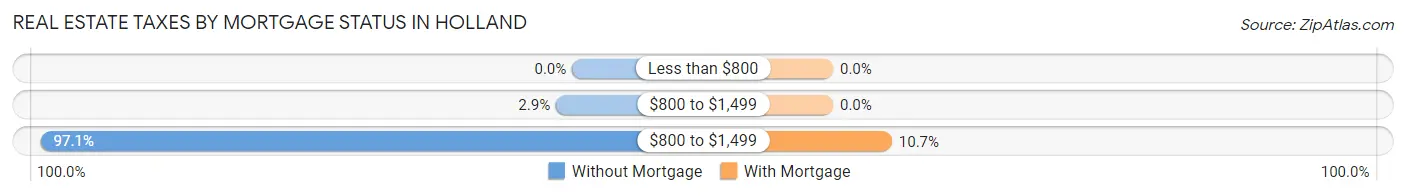
| Property Taxes | Without Mortgage | With Mortgage |
| Less than $800 | 0 (0.0%) | 0 (0.0%) |
| $800 to $1,499 | 6 (2.9%) | 0 (0.0%) |
| $800 to $1,499 | 198 (97.1%) | 48 (10.7%) |
| Total | 204 (100.0%) | 447 (100.0%) |
Health & Disability in Holland
Health Insurance Coverage by Age in Holland
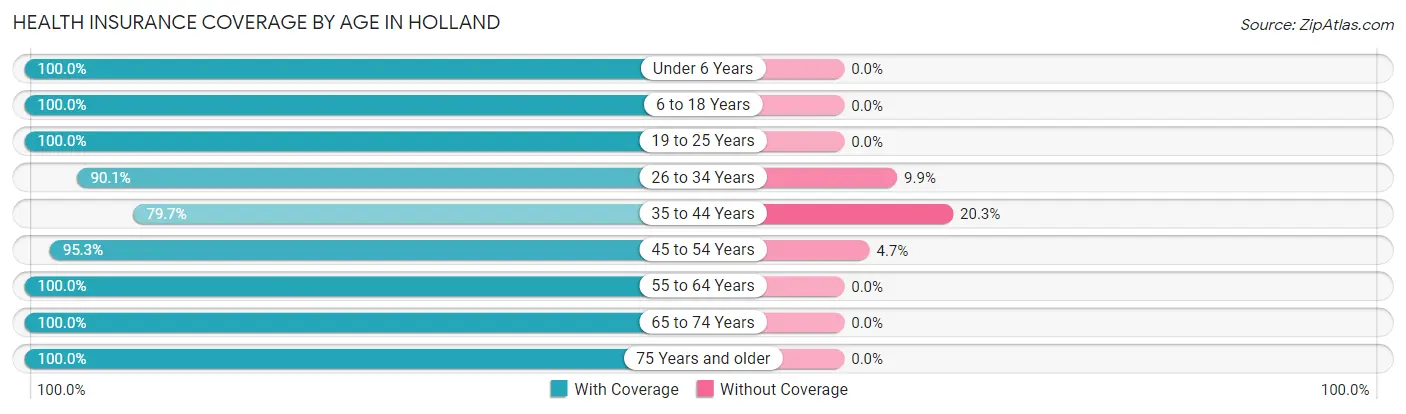
| Age Bracket | With Coverage | Without Coverage |
| Under 6 Years | 41 (100.0%) | 0 (0.0%) |
| 6 to 18 Years | 226 (100.0%) | 0 (0.0%) |
| 19 to 25 Years | 80 (100.0%) | 0 (0.0%) |
| 26 to 34 Years | 128 (90.1%) | 14 (9.9%) |
| 35 to 44 Years | 110 (79.7%) | 28 (20.3%) |
| 45 to 54 Years | 162 (95.3%) | 8 (4.7%) |
| 55 to 64 Years | 304 (100.0%) | 0 (0.0%) |
| 65 to 74 Years | 258 (100.0%) | 0 (0.0%) |
| 75 Years and older | 93 (100.0%) | 0 (0.0%) |
| Total | 1,402 (96.6%) | 50 (3.4%) |
Health Insurance Coverage by Citizenship Status in Holland
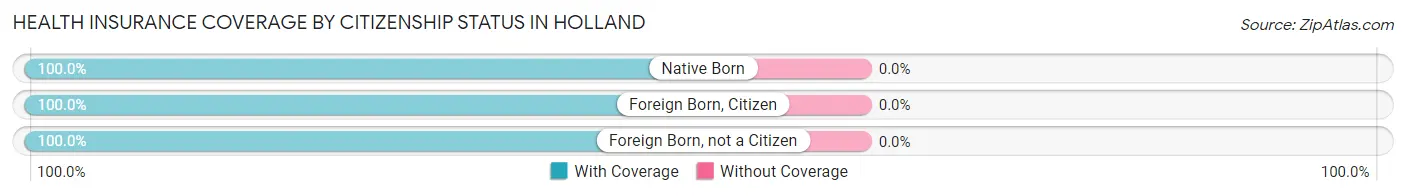
| Citizenship Status | With Coverage | Without Coverage |
| Native Born | 41 (100.0%) | 0 (0.0%) |
| Foreign Born, Citizen | 226 (100.0%) | 0 (0.0%) |
| Foreign Born, not a Citizen | 80 (100.0%) | 0 (0.0%) |
Health Insurance Coverage by Household Income in Holland
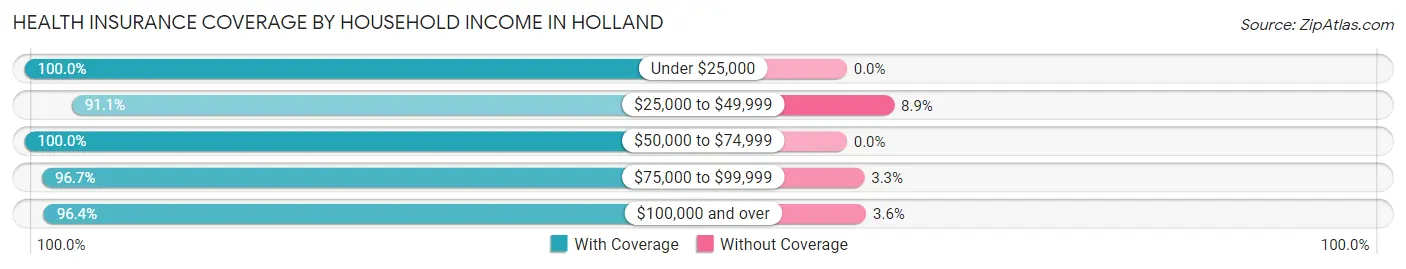
| Household Income | With Coverage | Without Coverage |
| Under $25,000 | 108 (100.0%) | 0 (0.0%) |
| $25,000 to $49,999 | 216 (91.1%) | 21 (8.9%) |
| $50,000 to $74,999 | 281 (100.0%) | 0 (0.0%) |
| $75,000 to $99,999 | 236 (96.7%) | 8 (3.3%) |
| $100,000 and over | 561 (96.4%) | 21 (3.6%) |
Public vs Private Health Insurance Coverage by Age in Holland
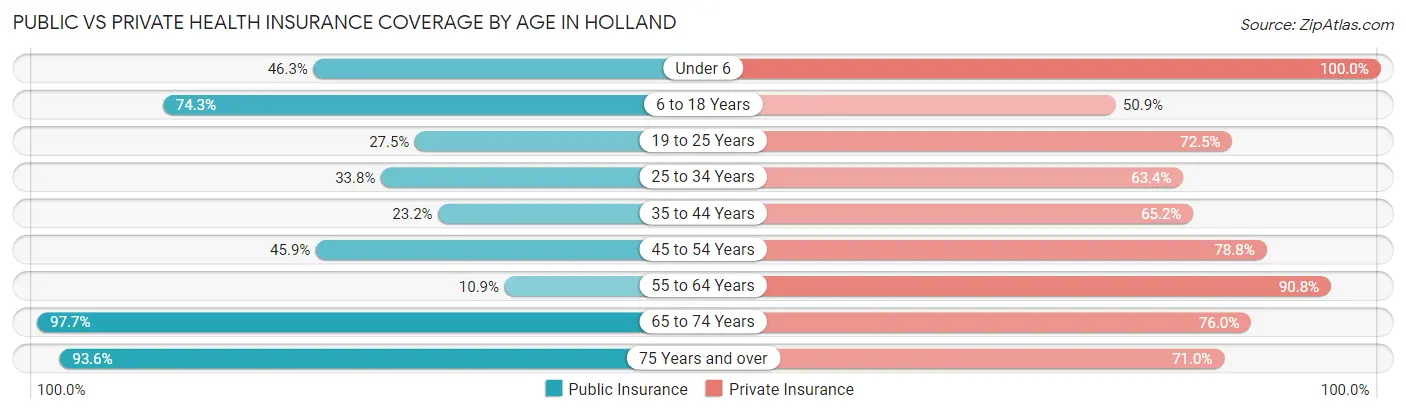
| Age Bracket | Public Insurance | Private Insurance |
| Under 6 | 19 (46.3%) | 41 (100.0%) |
| 6 to 18 Years | 168 (74.3%) | 115 (50.9%) |
| 19 to 25 Years | 22 (27.5%) | 58 (72.5%) |
| 25 to 34 Years | 48 (33.8%) | 90 (63.4%) |
| 35 to 44 Years | 32 (23.2%) | 90 (65.2%) |
| 45 to 54 Years | 78 (45.9%) | 134 (78.8%) |
| 55 to 64 Years | 33 (10.9%) | 276 (90.8%) |
| 65 to 74 Years | 252 (97.7%) | 196 (76.0%) |
| 75 Years and over | 87 (93.5%) | 66 (71.0%) |
| Total | 739 (50.9%) | 1,066 (73.4%) |
Disability Status by Sex by Age in Holland
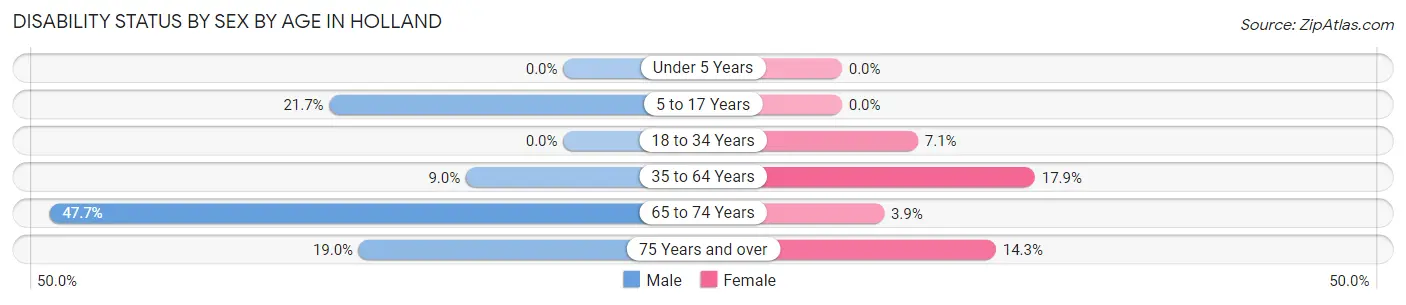
| Age Bracket | Male | Female |
| Under 5 Years | 0 (0.0%) | 0 (0.0%) |
| 5 to 17 Years | 28 (21.7%) | 0 (0.0%) |
| 18 to 34 Years | 0 (0.0%) | 6 (7.1%) |
| 35 to 64 Years | 25 (9.0%) | 60 (17.9%) |
| 65 to 74 Years | 62 (47.7%) | 5 (3.9%) |
| 75 Years and over | 11 (19.0%) | 5 (14.3%) |
Disability Class by Sex by Age in Holland
Disability Class: Hearing Difficulty
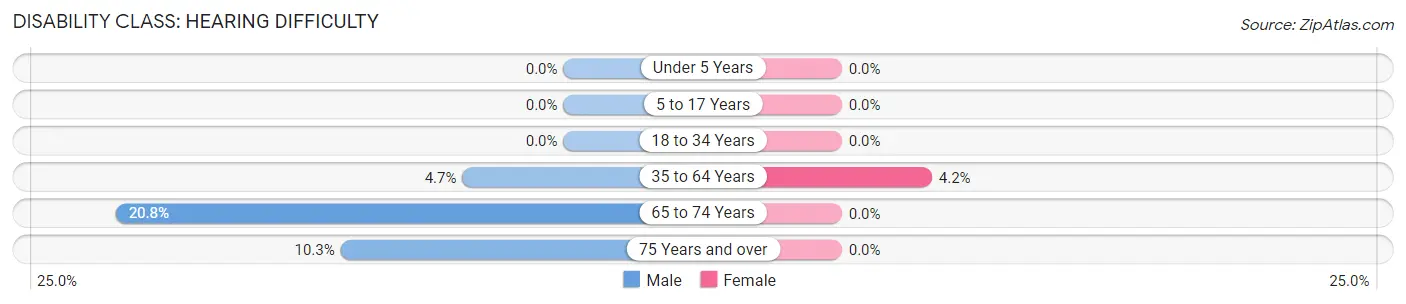
| Age Bracket | Male | Female |
| Under 5 Years | 0 (0.0%) | 0 (0.0%) |
| 5 to 17 Years | 0 (0.0%) | 0 (0.0%) |
| 18 to 34 Years | 0 (0.0%) | 0 (0.0%) |
| 35 to 64 Years | 13 (4.7%) | 14 (4.2%) |
| 65 to 74 Years | 27 (20.8%) | 0 (0.0%) |
| 75 Years and over | 6 (10.3%) | 0 (0.0%) |
Disability Class: Vision Difficulty
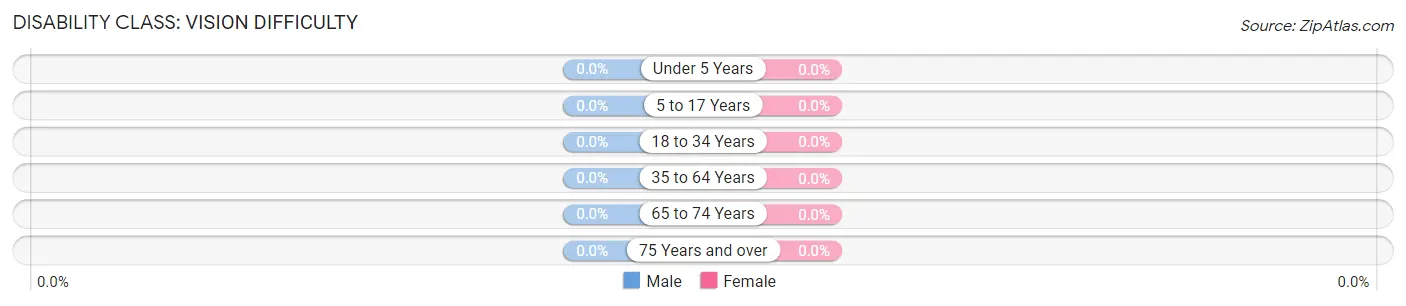
| Age Bracket | Male | Female |
| Under 5 Years | 0 (0.0%) | 0 (0.0%) |
| 5 to 17 Years | 0 (0.0%) | 0 (0.0%) |
| 18 to 34 Years | 0 (0.0%) | 0 (0.0%) |
| 35 to 64 Years | 0 (0.0%) | 0 (0.0%) |
| 65 to 74 Years | 0 (0.0%) | 0 (0.0%) |
| 75 Years and over | 0 (0.0%) | 0 (0.0%) |
Disability Class: Cognitive Difficulty
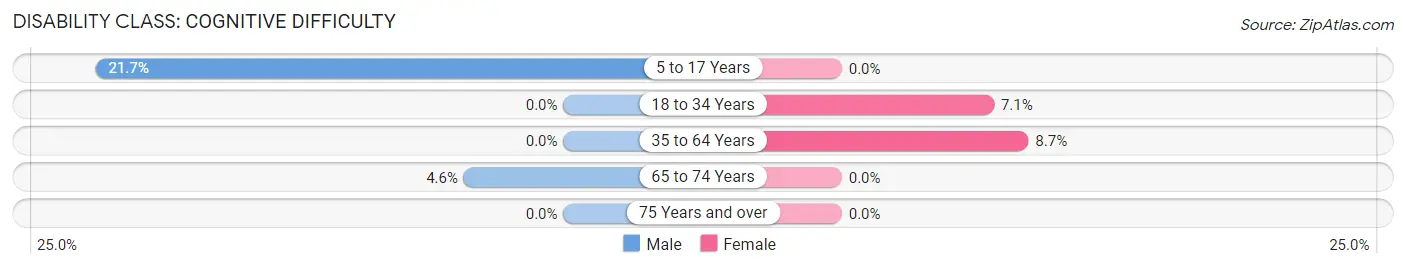
| Age Bracket | Male | Female |
| 5 to 17 Years | 28 (21.7%) | 0 (0.0%) |
| 18 to 34 Years | 0 (0.0%) | 6 (7.1%) |
| 35 to 64 Years | 0 (0.0%) | 29 (8.7%) |
| 65 to 74 Years | 6 (4.6%) | 0 (0.0%) |
| 75 Years and over | 0 (0.0%) | 0 (0.0%) |
Disability Class: Ambulatory Difficulty
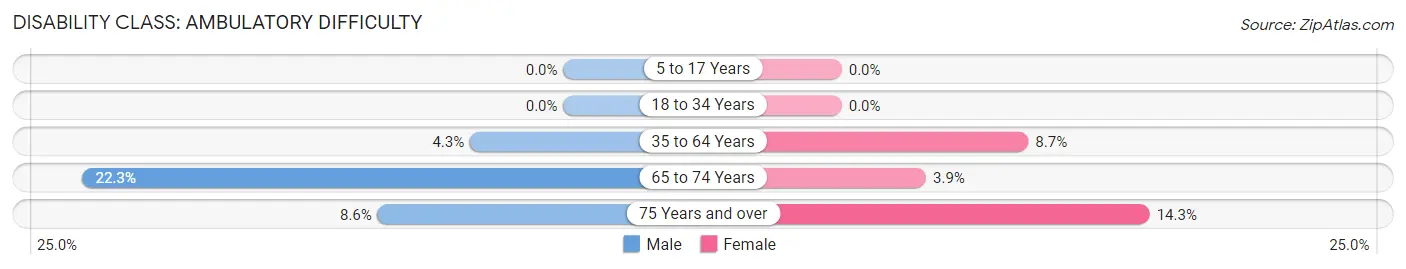
| Age Bracket | Male | Female |
| 5 to 17 Years | 0 (0.0%) | 0 (0.0%) |
| 18 to 34 Years | 0 (0.0%) | 0 (0.0%) |
| 35 to 64 Years | 12 (4.3%) | 29 (8.7%) |
| 65 to 74 Years | 29 (22.3%) | 5 (3.9%) |
| 75 Years and over | 5 (8.6%) | 5 (14.3%) |
Disability Class: Self-Care Difficulty
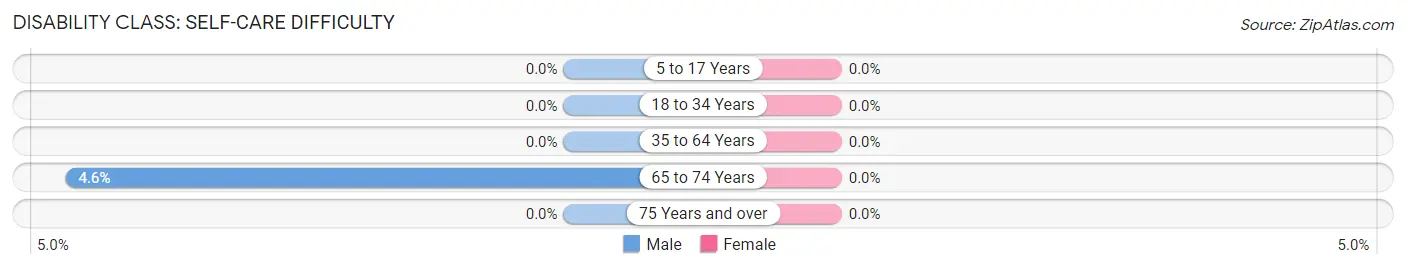
| Age Bracket | Male | Female |
| 5 to 17 Years | 0 (0.0%) | 0 (0.0%) |
| 18 to 34 Years | 0 (0.0%) | 0 (0.0%) |
| 35 to 64 Years | 0 (0.0%) | 0 (0.0%) |
| 65 to 74 Years | 6 (4.6%) | 0 (0.0%) |
| 75 Years and over | 0 (0.0%) | 0 (0.0%) |
Technology Access in Holland
Computing Device Access in Holland
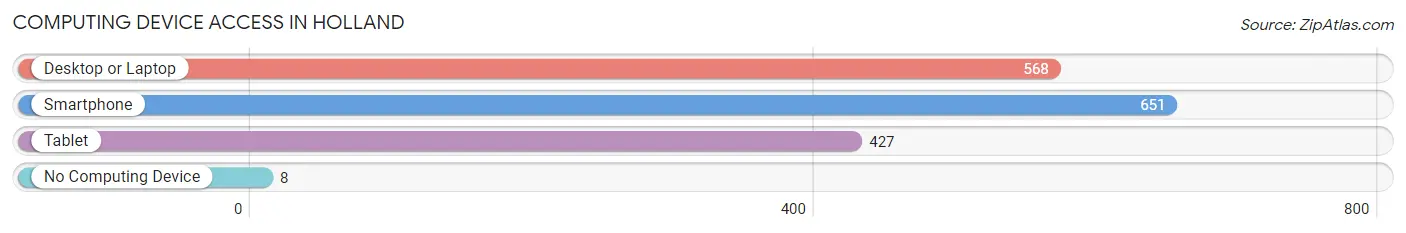
| Device Type | # Households | % Households |
| Desktop or Laptop | 568 | 82.1% |
| Smartphone | 651 | 94.1% |
| Tablet | 427 | 61.7% |
| No Computing Device | 8 | 1.2% |
| Total | 692 | 100.0% |
Internet Access in Holland
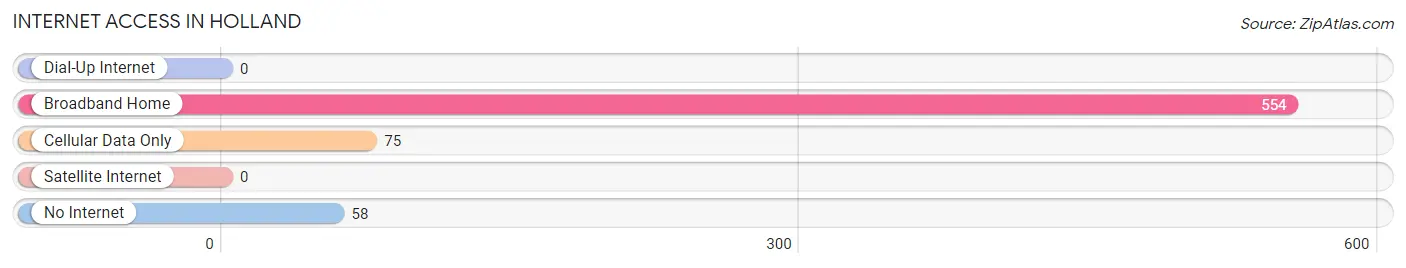
| Internet Type | # Households | % Households |
| Dial-Up Internet | 0 | 0.0% |
| Broadband Home | 554 | 80.1% |
| Cellular Data Only | 75 | 10.8% |
| Satellite Internet | 0 | 0.0% |
| No Internet | 58 | 8.4% |
| Total | 692 | 100.0% |
Holland Summary
Holland is a town located in the western part of Massachusetts, in the United States. It is part of the Berkshire County and is bordered by the towns of Otis, Blandford, Chester, and Middlefield. The town has a total area of 24.2 square miles, of which 24.1 square miles is land and 0.1 square mile is water. The town is located in the foothills of the Berkshire Mountains and is home to several small lakes and ponds.
History
Holland was first settled in 1762 by a group of settlers from Connecticut. The town was originally part of the town of Blandford, but was incorporated as its own town in 1778. The town was named after the Dutch city of Holland, which was the birthplace of the first settler, John Holland.
The town was primarily an agricultural community for much of its history, with dairy farming being the main industry. In the late 19th century, the town began to develop a small manufacturing industry, with several small factories producing textiles, paper, and other goods.
Geography
Holland is located in the western part of Massachusetts, in the foothills of the Berkshire Mountains. The town is bordered by the towns of Otis, Blandford, Chester, and Middlefield. The town has a total area of 24.2 square miles, of which 24.1 square miles is land and 0.1 square mile is water. The town is home to several small lakes and ponds, including Lake Siog, Lake Onota, and Lake Buel.
Economy
Holland’s economy is primarily based on agriculture and tourism. The town is home to several small farms, which produce dairy, beef, and other agricultural products. The town is also home to several small businesses, including restaurants, retail stores, and other services.
The town is also home to several tourist attractions, including the Berkshire Scenic Railway Museum, the Berkshire Botanical Garden, and the Berkshire Museum. The town is also home to several ski resorts, including Otis Ridge and Bousquet Mountain.
Demographics
As of the 2010 census, the town of Holland had a population of 1,845. The racial makeup of the town was 97.2% White, 0.7% African American, 0.2% Native American, 0.3% Asian, 0.1% Pacific Islander, 0.2% from other races, and 1.3% from two or more races. Hispanic or Latino of any race were 1.2% of the population.
The median income for a household in the town was $50,938, and the median income for a family was $60,000. The per capita income for the town was $25,938. About 6.2% of families and 8.2% of the population were below the poverty line, including 10.2% of those under age 18 and 5.2% of those age 65 or over.
Common Questions
What is Per Capita Income in Holland?
Per Capita income in Holland is $52,972.
What is the Median Family Income in Holland?
Median Family Income in Holland is $78,250.
What is the Median Household income in Holland?
Median Household Income in Holland is $78,462.
What is Income or Wage Gap in Holland?
Income or Wage Gap in Holland is 10.3%.
Women in Holland earn 89.7 cents for every dollar earned by a man.
What is Inequality or Gini Index in Holland?
Inequality or Gini Index in Holland is 0.46.
What is the Total Population of Holland?
Total Population of Holland is 1,452.
What is the Total Male Population of Holland?
Total Male Population of Holland is 747.
What is the Total Female Population of Holland?
Total Female Population of Holland is 705.
What is the Ratio of Males per 100 Females in Holland?
There are 105.96 Males per 100 Females in Holland.
What is the Ratio of Females per 100 Males in Holland?
There are 94.38 Females per 100 Males in Holland.
What is the Median Population Age in Holland?
Median Population Age in Holland is 51.4 Years.
What is the Average Family Size in Holland
Average Family Size in Holland is 2.7 People.
What is the Average Household Size in Holland
Average Household Size in Holland is 2.1 People.
How Large is the Labor Force in Holland?
There are 803 People in the Labor Forcein in Holland.
What is the Percentage of People in the Labor Force in Holland?
64.0% of People are in the Labor Force in Holland.
What is the Unemployment Rate in Holland?
Unemployment Rate in Holland is 3.1%.