Ocotillo, CA Map & Demographics
Ocotillo Map
Ocotillo Overview
$12,340
PER CAPITA INCOME
$20,761
AVG FAMILY INCOME
$20,761
AVG HOUSEHOLD INCOME
0.33
INEQUALITY / GINI INDEX
146
TOTAL POPULATION
96
MALE POPULATION
50
FEMALE POPULATION
192.00
MALES / 100 FEMALES
52.08
FEMALES / 100 MALES
58.3
MEDIAN AGE
2.0
AVG FAMILY SIZE
2.0
AVG HOUSEHOLD SIZE
22
LABOR FORCE [ PEOPLE ]
15.1%
PERCENT IN LABOR FORCE
100.0%
UNEMPLOYMENT RATE
Ocotillo Zip Codes
Ocotillo Area Codes
Income in Ocotillo
Income Overview in Ocotillo
Per Capita Income in Ocotillo is $12,340, while median incomes of families and households are $20,761 and $20,761 respectively.
| Characteristic | Number | Measure |
| Per Capita Income | 146 | $12,340 |
| Median Family Income | 72 | $20,761 |
| Mean Family Income | 72 | $24,335 |
| Median Household Income | 72 | $20,761 |
| Mean Household Income | 72 | $24,335 |
| Income Deficit | 72 | $0 |
| Wage / Income Gap (%) | 146 | 0.00% |
| Wage / Income Gap ($) | 146 | 100.00¢ per $1 |
| Gini / Inequality Index | 146 | 0.33 |
Earnings by Sex in Ocotillo
| Sex | Number | Average Earnings |
| Male | 0 (0.0%) | $0 |
| Female | 0 (0.0%) | $0 |
| Total | 0 (0.0%) | $0 |
Earnings by Sex by Income Bracket in Ocotillo
| Income | Male | Female |
| $2,499 or less | 0 (0.0%) | 0 (0.0%) |
| $2,500 to $4,999 | 0 (0.0%) | 0 (0.0%) |
| $5,000 to $7,499 | 0 (0.0%) | 0 (0.0%) |
| $7,500 to $9,999 | 0 (0.0%) | 0 (0.0%) |
| $10,000 to $12,499 | 0 (0.0%) | 0 (0.0%) |
| $12,500 to $14,999 | 0 (0.0%) | 0 (0.0%) |
| $15,000 to $17,499 | 0 (0.0%) | 0 (0.0%) |
| $17,500 to $19,999 | 0 (0.0%) | 0 (0.0%) |
| $20,000 to $22,499 | 0 (0.0%) | 0 (0.0%) |
| $22,500 to $24,999 | 0 (0.0%) | 0 (0.0%) |
| $25,000 to $29,999 | 0 (0.0%) | 0 (0.0%) |
| $30,000 to $34,999 | 0 (0.0%) | 0 (0.0%) |
| $35,000 to $39,999 | 0 (0.0%) | 0 (0.0%) |
| $40,000 to $44,999 | 0 (0.0%) | 0 (0.0%) |
| $45,000 to $49,999 | 0 (0.0%) | 0 (0.0%) |
| $50,000 to $54,999 | 0 (0.0%) | 0 (0.0%) |
| $55,000 to $64,999 | 0 (0.0%) | 0 (0.0%) |
| $65,000 to $74,999 | 0 (0.0%) | 0 (0.0%) |
| $75,000 to $99,999 | 0 (0.0%) | 0 (0.0%) |
| $100,000+ | 0 (0.0%) | 0 (0.0%) |
| Total | 0 (0.0%) | 0 (0.0%) |
Earnings by Sex by Educational Attainment in Ocotillo
| Educational Attainment | Male Income | Female Income |
| Less than High School | - | - |
| High School Diploma | - | - |
| College or Associate's Degree | - | - |
| Bachelor's Degree | - | - |
| Graduate Degree | - | - |
| Total | - | - |
Family Income in Ocotillo
Family Income Brackets in Ocotillo
According to the Ocotillo family income data, there are 39 families falling into the $15,000 to $24,999 income range, which is the most common income bracket and makes up 54.2% of all families.
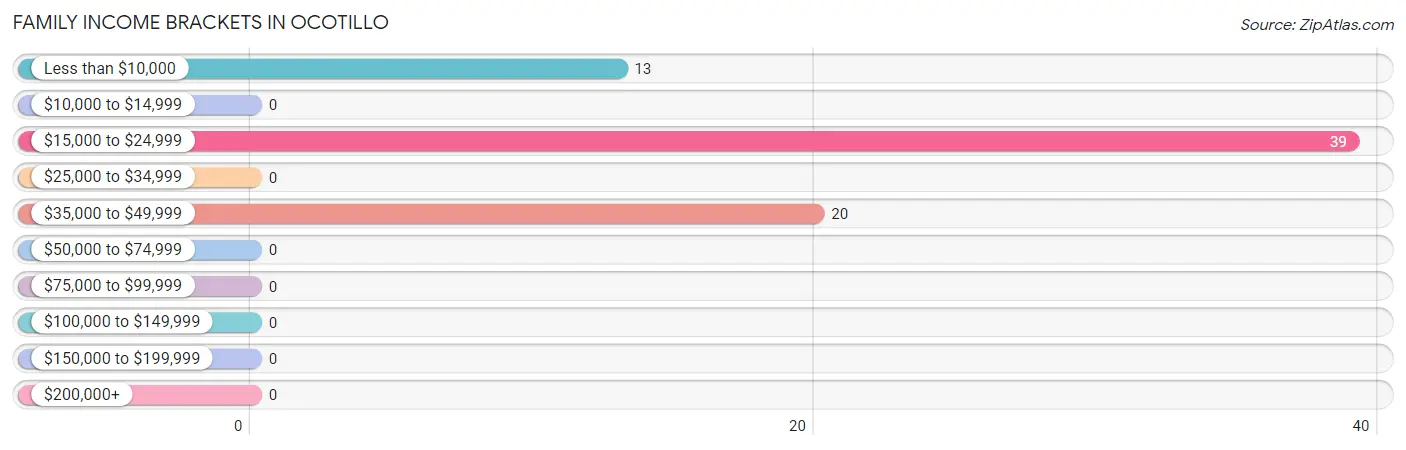
| Income Bracket | # Families | % Families |
| Less than $10,000 | 13 | 18.1% |
| $10,000 to $14,999 | 0 | 0.0% |
| $15,000 to $24,999 | 39 | 54.2% |
| $25,000 to $34,999 | 0 | 0.0% |
| $35,000 to $49,999 | 20 | 27.8% |
| $50,000 to $74,999 | 0 | 0.0% |
| $75,000 to $99,999 | 0 | 0.0% |
| $100,000 to $149,999 | 0 | 0.0% |
| $150,000 to $199,999 | 0 | 0.0% |
| $200,000+ | 0 | 0.0% |
Family Income by Famaliy Size in Ocotillo
2-person families (72 | 100.0%) account for the highest median family income in Ocotillo with $20,761 per family, while 2-person families (72 | 100.0%) have the highest median income of $10,380 per family member.
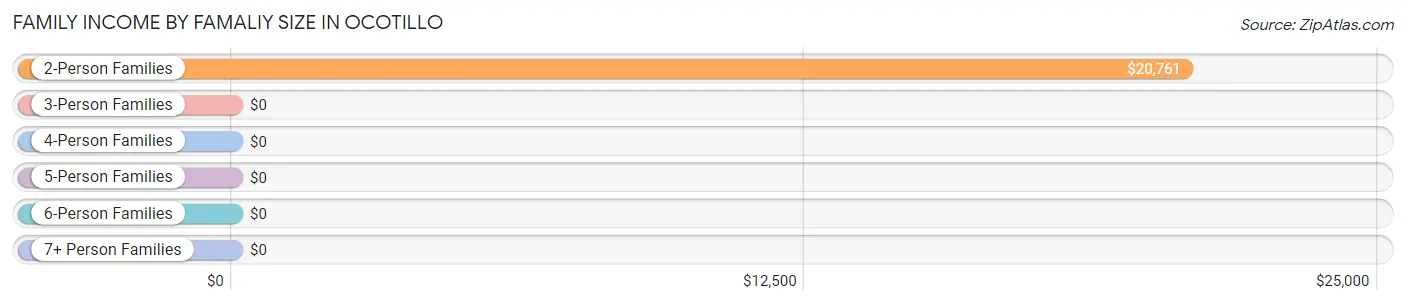
| Income Bracket | # Families | Median Income |
| 2-Person Families | 72 (100.0%) | $20,761 |
| 3-Person Families | 0 (0.0%) | $0 |
| 4-Person Families | 0 (0.0%) | $0 |
| 5-Person Families | 0 (0.0%) | $0 |
| 6-Person Families | 0 (0.0%) | $0 |
| 7+ Person Families | 0 (0.0%) | $0 |
| Total | 72 (100.0%) | $20,761 |
Family Income by Number of Earners in Ocotillo
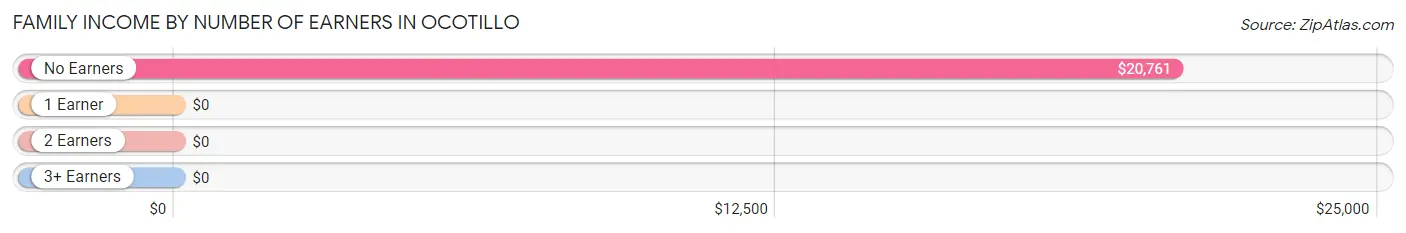
| Number of Earners | # Families | Median Income |
| No Earners | 72 (100.0%) | $20,761 |
| 1 Earner | 0 (0.0%) | $0 |
| 2 Earners | 0 (0.0%) | $0 |
| 3+ Earners | 0 (0.0%) | $0 |
| Total | 72 (100.0%) | $20,761 |
Household Income in Ocotillo
Household Income Brackets in Ocotillo
With 39 households falling in the category, the $15,000 to $24,999 income range is the most frequent in Ocotillo, accounting for 54.2% of all households.
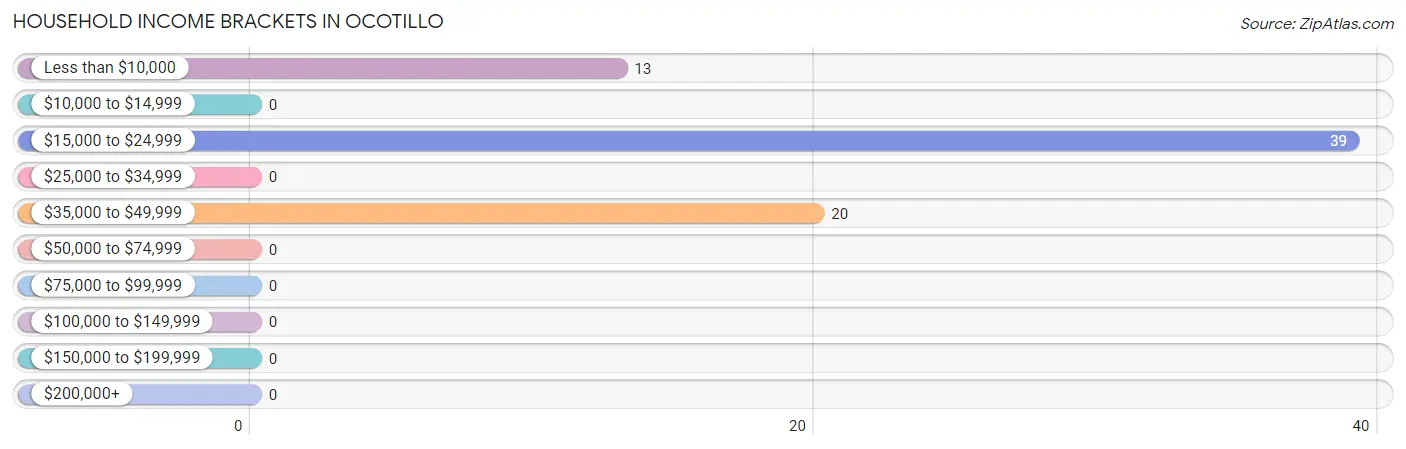
| Income Bracket | # Households | % Households |
| Less than $10,000 | 13 | 18.1% |
| $10,000 to $14,999 | 0 | 0.0% |
| $15,000 to $24,999 | 39 | 54.2% |
| $25,000 to $34,999 | 0 | 0.0% |
| $35,000 to $49,999 | 20 | 27.8% |
| $50,000 to $74,999 | 0 | 0.0% |
| $75,000 to $99,999 | 0 | 0.0% |
| $100,000 to $149,999 | 0 | 0.0% |
| $150,000 to $199,999 | 0 | 0.0% |
| $200,000+ | 0 | 0.0% |
Household Income by Householder Age in Ocotillo
The median household income in Ocotillo is $20,761, with the highest median household income of $19,531 found in the 45 to 64 years age bracket for the primary householder. A total of 52 households (72.2%) fall into this category.
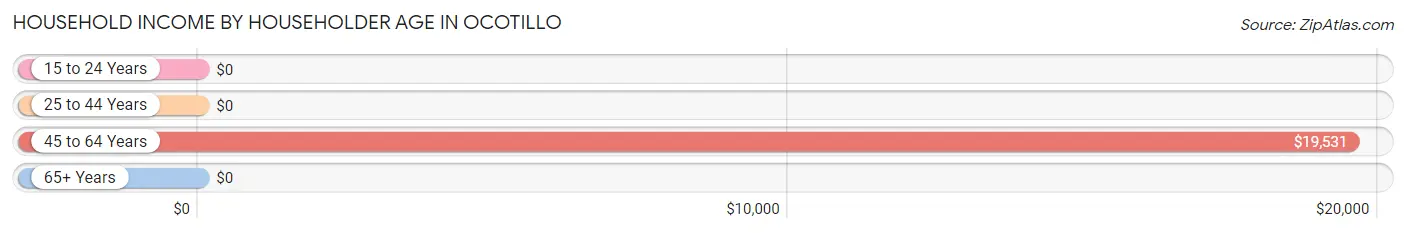
| Income Bracket | # Households | Median Income |
| 15 to 24 Years | 0 (0.0%) | $0 |
| 25 to 44 Years | 0 (0.0%) | $0 |
| 45 to 64 Years | 52 (72.2%) | $19,531 |
| 65+ Years | 20 (27.8%) | $0 |
| Total | 72 (100.0%) | $20,761 |
Poverty in Ocotillo
Income Below Poverty by Sex and Age in Ocotillo
With 50.0% poverty level for males and 32.0% for females among the residents of Ocotillo, 35 to 44 year old males and 55 to 64 year old females are the most vulnerable to poverty, with 22 males (100.0%) and 16 females (41.0%) in their respective age groups living below the poverty level.
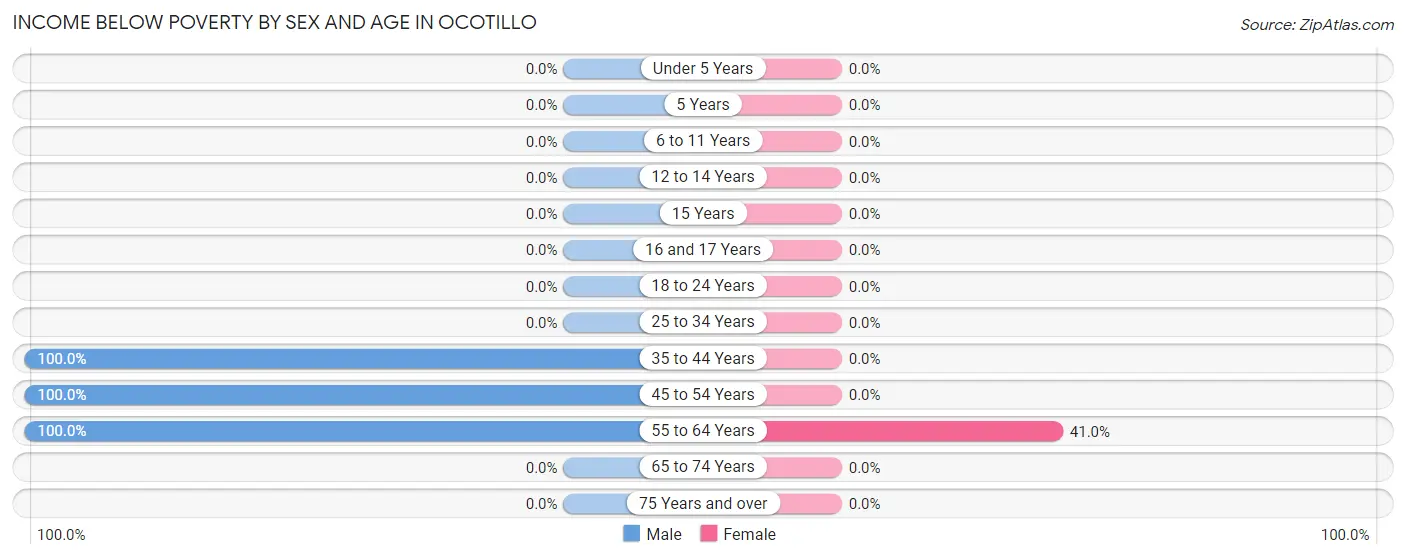
| Age Bracket | Male | Female |
| Under 5 Years | 0 (0.0%) | 0 (0.0%) |
| 5 Years | 0 (0.0%) | 0 (0.0%) |
| 6 to 11 Years | 0 (0.0%) | 0 (0.0%) |
| 12 to 14 Years | 0 (0.0%) | 0 (0.0%) |
| 15 Years | 0 (0.0%) | 0 (0.0%) |
| 16 and 17 Years | 0 (0.0%) | 0 (0.0%) |
| 18 to 24 Years | 0 (0.0%) | 0 (0.0%) |
| 25 to 34 Years | 0 (0.0%) | 0 (0.0%) |
| 35 to 44 Years | 22 (100.0%) | 0 (0.0%) |
| 45 to 54 Years | 13 (100.0%) | 0 (0.0%) |
| 55 to 64 Years | 13 (100.0%) | 16 (41.0%) |
| 65 to 74 Years | 0 (0.0%) | 0 (0.0%) |
| 75 Years and over | 0 (0.0%) | 0 (0.0%) |
| Total | 48 (50.0%) | 16 (32.0%) |
Income Above Poverty by Sex and Age in Ocotillo
According to the poverty statistics in Ocotillo, males aged 65 to 74 years and females aged 45 to 54 years are the age groups that are most secure financially, with 100.0% of males and 100.0% of females in these age groups living above the poverty line.
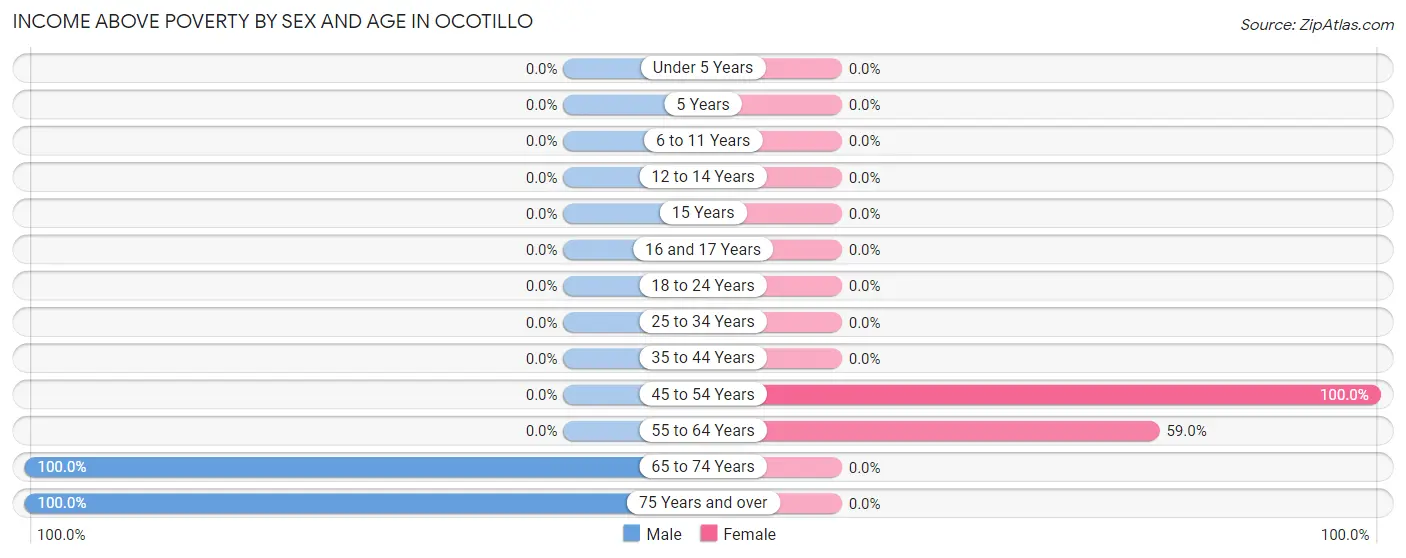
| Age Bracket | Male | Female |
| Under 5 Years | 0 (0.0%) | 0 (0.0%) |
| 5 Years | 0 (0.0%) | 0 (0.0%) |
| 6 to 11 Years | 0 (0.0%) | 0 (0.0%) |
| 12 to 14 Years | 0 (0.0%) | 0 (0.0%) |
| 15 Years | 0 (0.0%) | 0 (0.0%) |
| 16 and 17 Years | 0 (0.0%) | 0 (0.0%) |
| 18 to 24 Years | 0 (0.0%) | 0 (0.0%) |
| 25 to 34 Years | 0 (0.0%) | 0 (0.0%) |
| 35 to 44 Years | 0 (0.0%) | 0 (0.0%) |
| 45 to 54 Years | 0 (0.0%) | 11 (100.0%) |
| 55 to 64 Years | 0 (0.0%) | 23 (59.0%) |
| 65 to 74 Years | 28 (100.0%) | 0 (0.0%) |
| 75 Years and over | 20 (100.0%) | 0 (0.0%) |
| Total | 48 (50.0%) | 34 (68.0%) |
Income Below Poverty Among Married-Couple Families in Ocotillo
The poverty statistics for married-couple families in Ocotillo show that 40.3% or 29 of the total 72 families live below the poverty line. Families with no children have the highest poverty rate of 40.3%, comprising of 29 families. On the other hand, families with no children have the lowest poverty rate of 40.3%, which includes 29 families.
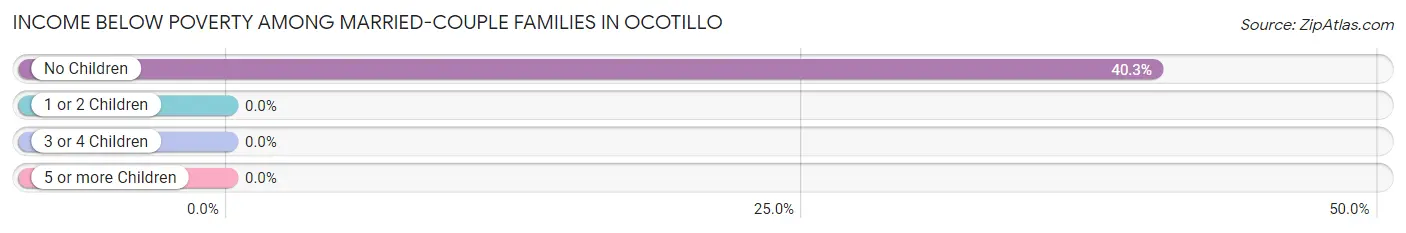
| Children | Above Poverty | Below Poverty |
| No Children | 43 (59.7%) | 29 (40.3%) |
| 1 or 2 Children | 0 (0.0%) | 0 (0.0%) |
| 3 or 4 Children | 0 (0.0%) | 0 (0.0%) |
| 5 or more Children | 0 (0.0%) | 0 (0.0%) |
| Total | 43 (59.7%) | 29 (40.3%) |
Income Below Poverty Among Single-Parent Households in Ocotillo
| Children | Single Father | Single Mother |
| No Children | 0 (0.0%) | 0 (0.0%) |
| 1 or 2 Children | 0 (0.0%) | 0 (0.0%) |
| 3 or 4 Children | 0 (0.0%) | 0 (0.0%) |
| 5 or more Children | 0 (0.0%) | 0 (0.0%) |
| Total | 0 (0.0%) | 0 (0.0%) |
Income Below Poverty Among Married-Couple vs Single-Parent Households in Ocotillo
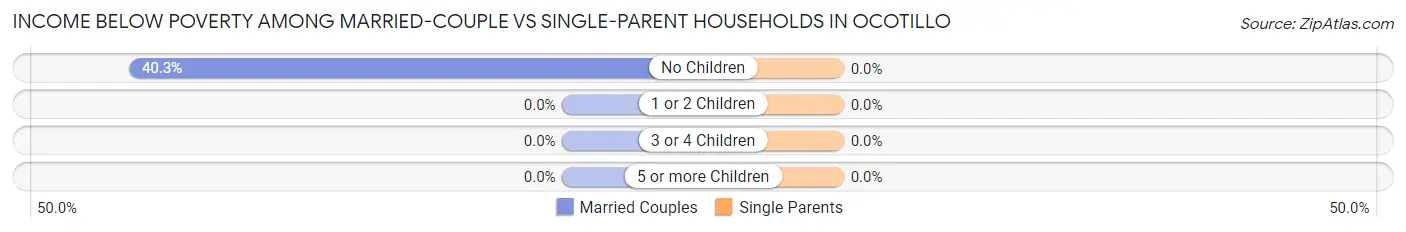
| Children | Married-Couple Families | Single-Parent Households |
| No Children | 29 (40.3%) | 0 (0.0%) |
| 1 or 2 Children | 0 (0.0%) | 0 (0.0%) |
| 3 or 4 Children | 0 (0.0%) | 0 (0.0%) |
| 5 or more Children | 0 (0.0%) | 0 (0.0%) |
| Total | 29 (40.3%) | 0 (0.0%) |
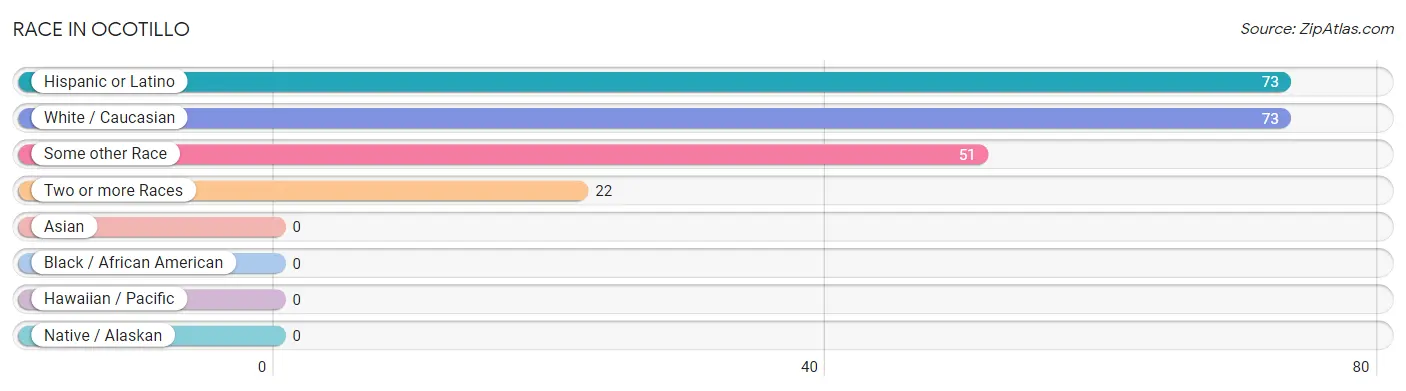
Race in Ocotillo
The most populous races in Ocotillo are Hispanic or Latino (73 | 50.0%), White / Caucasian (73 | 50.0%), and Some other Race (51 | 34.9%).
| Race | # Population | % Population |
| Asian | 0 | 0.0% |
| Black / African American | 0 | 0.0% |
| Hawaiian / Pacific | 0 | 0.0% |
| Hispanic or Latino | 73 | 50.0% |
| Native / Alaskan | 0 | 0.0% |
| White / Caucasian | 73 | 50.0% |
| Two or more Races | 22 | 15.1% |
| Some other Race | 51 | 34.9% |
| Total | 146 | 100.0% |
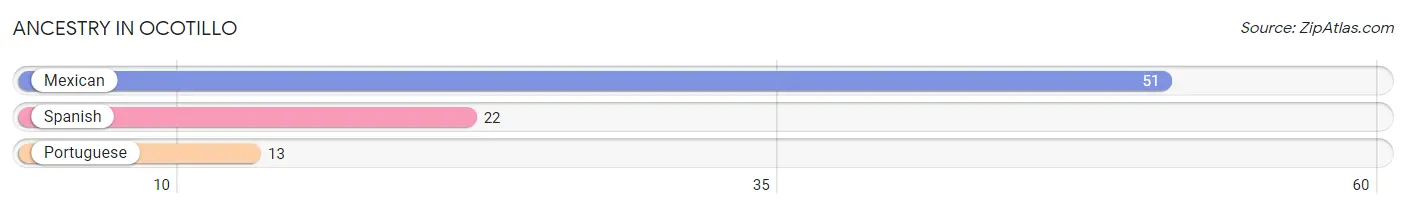
Ancestry in Ocotillo
The most populous ancestries reported in Ocotillo are Mexican (51 | 34.9%), Spanish (22 | 15.1%), and Portuguese (13 | 8.9%), together accounting for 58.9% of all Ocotillo residents.
| Ancestry | # Population | % Population |
| Mexican | 51 | 34.9% |
| Portuguese | 13 | 8.9% |
| Spanish | 22 | 15.1% | View All 3 Rows |
Immigrants in Ocotillo
The most numerous immigrant groups reported in Ocotillo came from Central America (23 | 15.8%), Latin America (23 | 15.8%), Mexico (23 | 15.8%), Czechoslovakia (16 | 11.0%), and Eastern Europe (16 | 11.0%), together accounting for 69.2% of all Ocotillo residents.
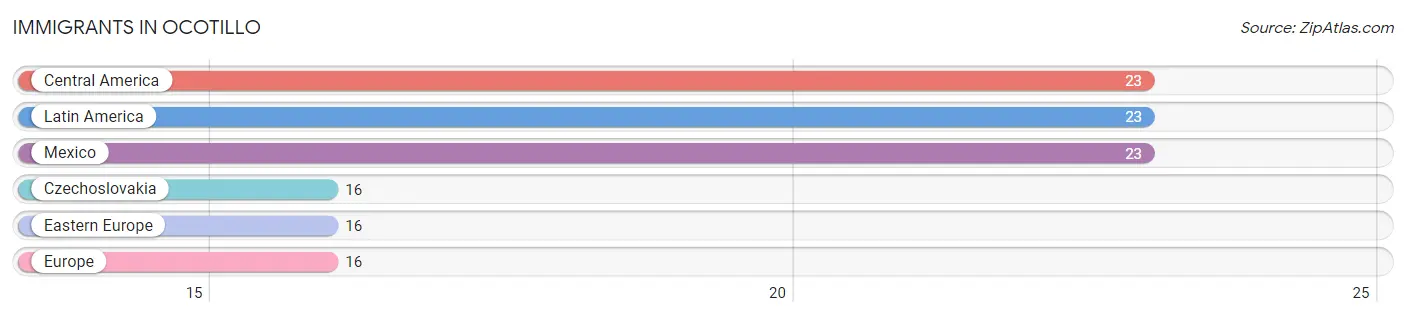
| Immigration Origin | # Population | % Population |
| Central America | 23 | 15.8% |
| Czechoslovakia | 16 | 11.0% |
| Eastern Europe | 16 | 11.0% |
| Europe | 16 | 11.0% |
| Latin America | 23 | 15.8% |
| Mexico | 23 | 15.8% | View All 6 Rows |
Sex and Age in Ocotillo
Sex and Age in Ocotillo
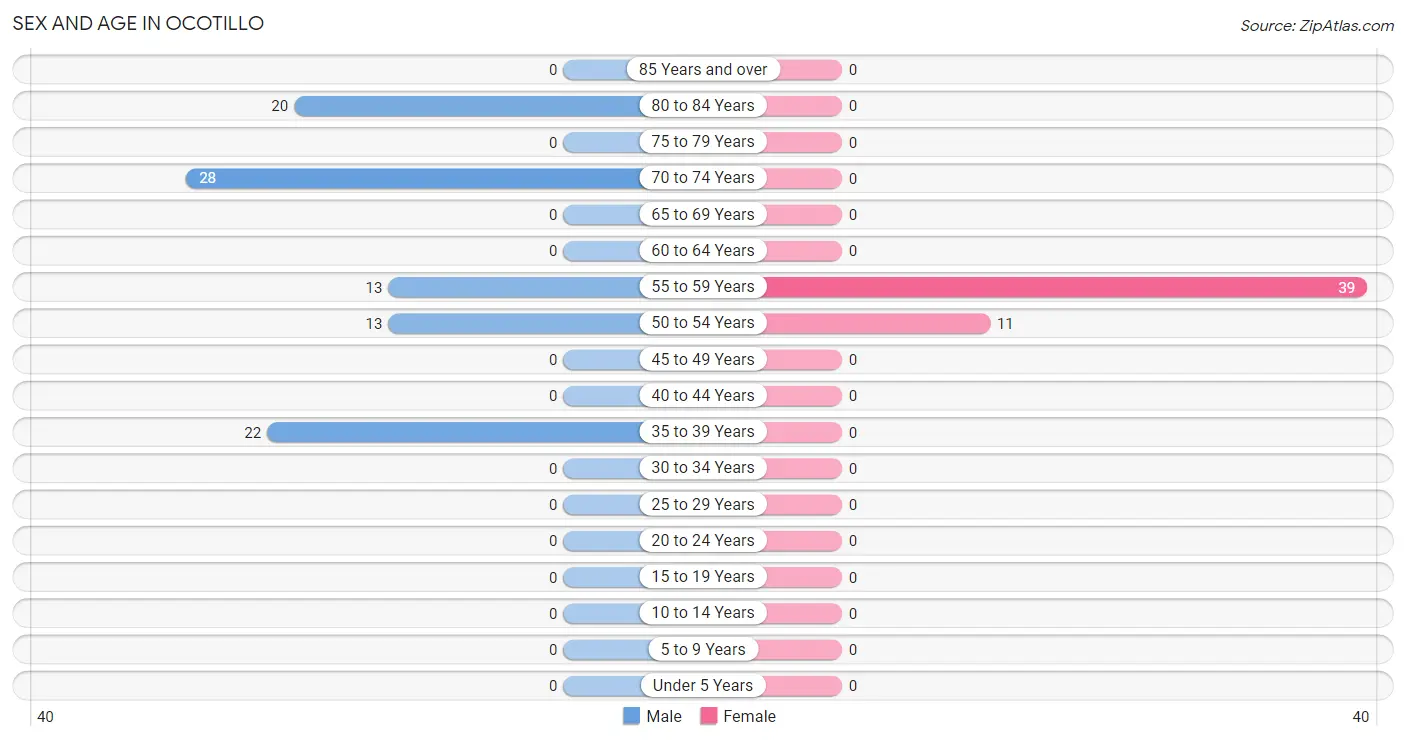
The most populous age groups in Ocotillo are 70 to 74 Years (28 | 29.2%) for men and 55 to 59 Years (39 | 78.0%) for women.
| Age Bracket | Male | Female |
| Under 5 Years | 0 (0.0%) | 0 (0.0%) |
| 5 to 9 Years | 0 (0.0%) | 0 (0.0%) |
| 10 to 14 Years | 0 (0.0%) | 0 (0.0%) |
| 15 to 19 Years | 0 (0.0%) | 0 (0.0%) |
| 20 to 24 Years | 0 (0.0%) | 0 (0.0%) |
| 25 to 29 Years | 0 (0.0%) | 0 (0.0%) |
| 30 to 34 Years | 0 (0.0%) | 0 (0.0%) |
| 35 to 39 Years | 22 (22.9%) | 0 (0.0%) |
| 40 to 44 Years | 0 (0.0%) | 0 (0.0%) |
| 45 to 49 Years | 0 (0.0%) | 0 (0.0%) |
| 50 to 54 Years | 13 (13.5%) | 11 (22.0%) |
| 55 to 59 Years | 13 (13.5%) | 39 (78.0%) |
| 60 to 64 Years | 0 (0.0%) | 0 (0.0%) |
| 65 to 69 Years | 0 (0.0%) | 0 (0.0%) |
| 70 to 74 Years | 28 (29.2%) | 0 (0.0%) |
| 75 to 79 Years | 0 (0.0%) | 0 (0.0%) |
| 80 to 84 Years | 20 (20.8%) | 0 (0.0%) |
| 85 Years and over | 0 (0.0%) | 0 (0.0%) |
| Total | 96 (100.0%) | 50 (100.0%) |
Families and Households in Ocotillo
Median Family Size in Ocotillo
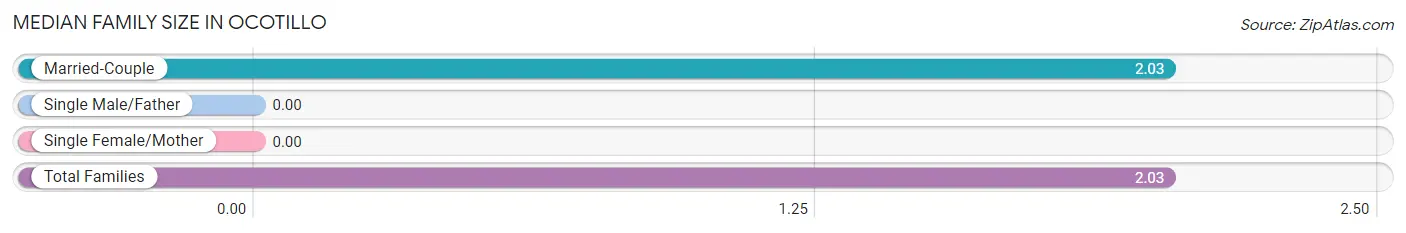
| Family Type | # Families | Family Size |
| Married-Couple | 72 (100.0%) | 2.03 |
| Single Male/Father | 0 (0.0%) | - |
| Single Female/Mother | 0 (0.0%) | - |
| Total Families | 72 (100.0%) | 2.03 |
Median Household Size in Ocotillo
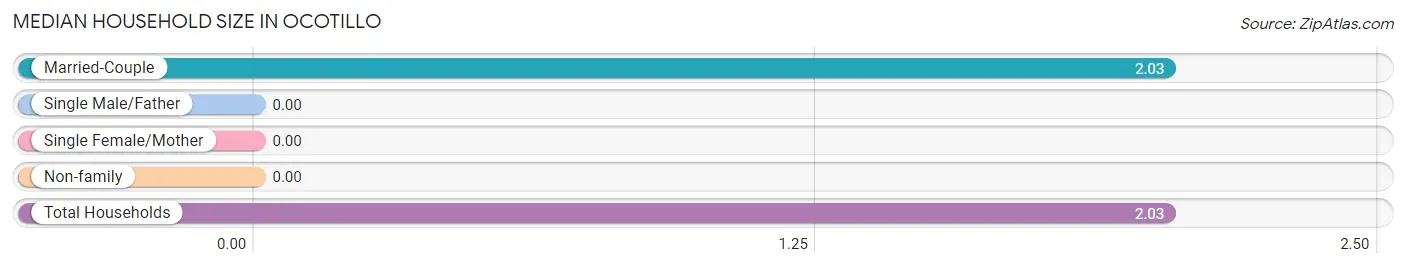
| Household Type | # Households | Household Size |
| Married-Couple | 72 (100.0%) | 2.03 |
| Single Male/Father | 0 (0.0%) | - |
| Single Female/Mother | 0 (0.0%) | - |
| Non-family | 0 (0.0%) | - |
| Total Households | 72 (100.0%) | 2.03 |
Household Size by Marriage Status in Ocotillo
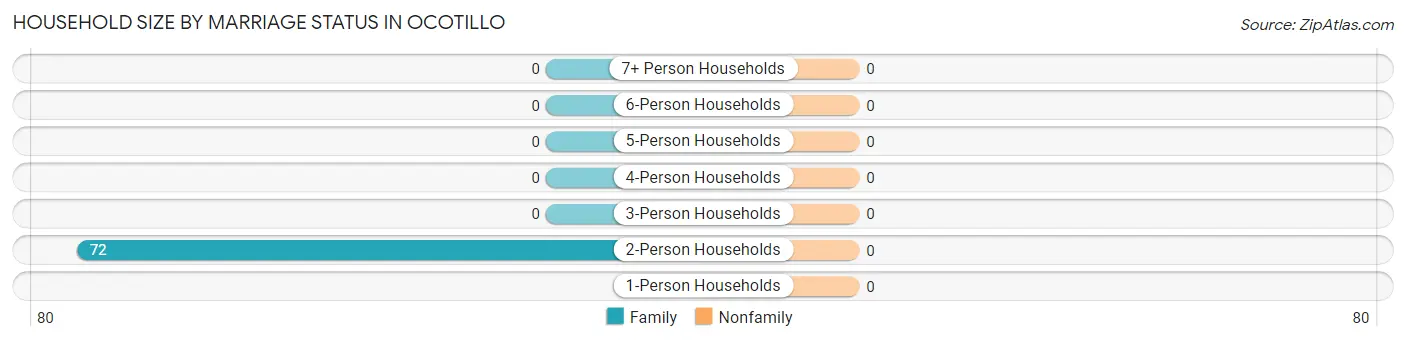
| Household Size | Family Households | Nonfamily Households |
| 1-Person Households | - | 0 (0.0%) |
| 2-Person Households | 72 (100.0%) | 0 (0.0%) |
| 3-Person Households | 0 (0.0%) | 0 (0.0%) |
| 4-Person Households | 0 (0.0%) | 0 (0.0%) |
| 5-Person Households | 0 (0.0%) | 0 (0.0%) |
| 6-Person Households | 0 (0.0%) | 0 (0.0%) |
| 7+ Person Households | 0 (0.0%) | 0 (0.0%) |
| Total | 72 (100.0%) | 0 (0.0%) |
Female Fertility in Ocotillo
Fertility by Age in Ocotillo
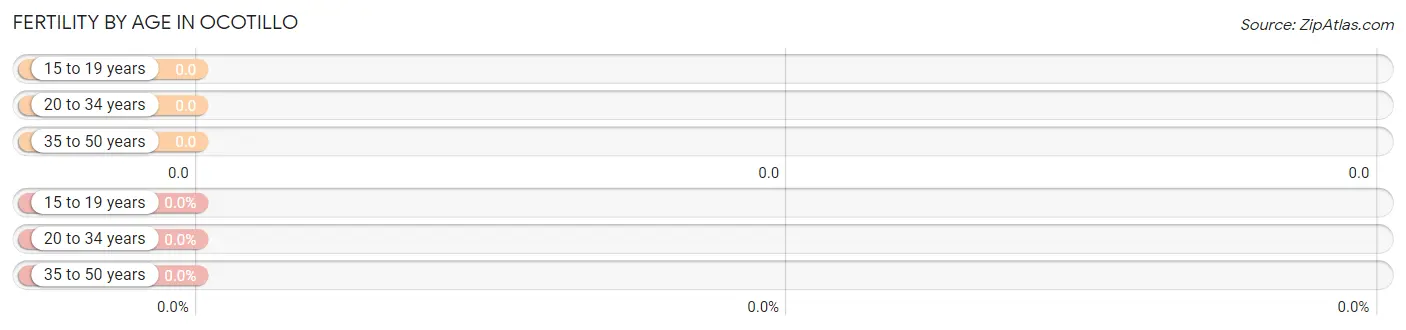
| Age Bracket | Women with Births | Births / 1,000 Women |
| 15 to 19 years | 0 (0.0%) | 0.0 |
| 20 to 34 years | 0 (0.0%) | 0.0 |
| 35 to 50 years | 0 (0.0%) | 0.0 |
| Total | 0 (0.0%) | 0.0 |
Fertility by Age by Marriage Status in Ocotillo
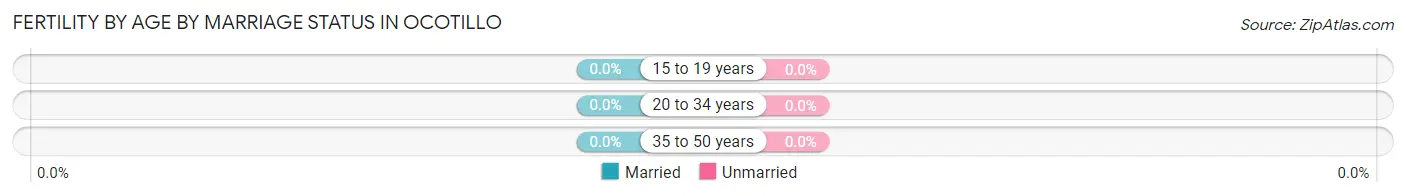
| Age Bracket | Married | Unmarried |
| 15 to 19 years | 0 (0.0%) | 0 (0.0%) |
| 20 to 34 years | 0 (0.0%) | 0 (0.0%) |
| 35 to 50 years | 0 (0.0%) | 0 (0.0%) |
| Total | 0 (0.0%) | 0 (0.0%) |
Fertility by Education in Ocotillo
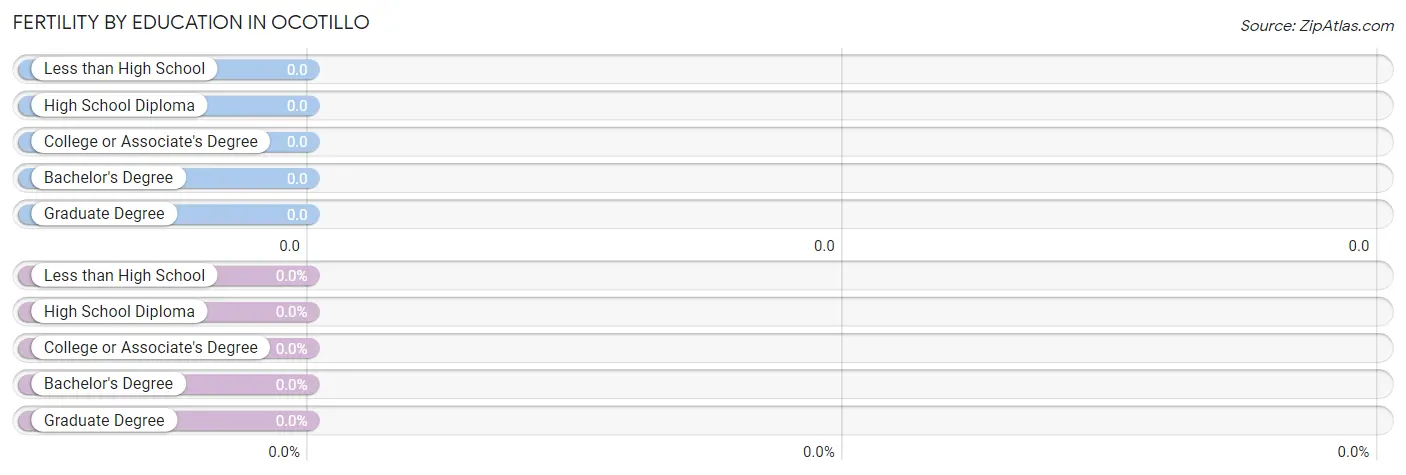
| Educational Attainment | Women with Births | Births / 1,000 Women |
| Less than High School | 0 (0.0%) | 0.0 |
| High School Diploma | 0 (0.0%) | 0.0 |
| College or Associate's Degree | 0 (0.0%) | 0.0 |
| Bachelor's Degree | 0 (0.0%) | 0.0 |
| Graduate Degree | 0 (0.0%) | 0.0 |
| Total | 0 (0.0%) | 0.0 |
Fertility by Education by Marriage Status in Ocotillo
| Educational Attainment | Married | Unmarried |
| Less than High School | 0 (0.0%) | 0 (0.0%) |
| High School Diploma | 0 (0.0%) | 0 (0.0%) |
| College or Associate's Degree | 0 (0.0%) | 0 (0.0%) |
| Bachelor's Degree | 0 (0.0%) | 0 (0.0%) |
| Graduate Degree | 0 (0.0%) | 0 (0.0%) |
| Total | 0 (0.0%) | 0 (0.0%) |
Employment Characteristics in Ocotillo
Employment by Class of Employer in Ocotillo
| Employer Class | # Employees | % Employees |
| Private Company Employees | 0 | 0.0% |
| Self-Employed (Incorporated) | 0 | 0.0% |
| Self-Employed (Not Incorporated) | 0 | 0.0% |
| Not-for-profit Organizations | 0 | 0.0% |
| Local Government Employees | 0 | 0.0% |
| State Government Employees | 0 | 0.0% |
| Federal Government Employees | 0 | 0.0% |
| Unpaid Family Workers | 0 | 0.0% |
| Total | 0 | 0.0% |
Employment Status by Age in Ocotillo
According to the labor force statistics for Ocotillo, out of the total population over 16 years of age (146), 15.1% or 22 individuals are in the labor force, with 100.0% or 22 of them unemployed. The age group with the highest labor force participation rate is 35 to 44 years, with 100.0% or 22 individuals in the labor force. Within the labor force, the 35 to 44 years age range has the highest percentage of unemployed individuals, with 100.0% or 22 of them being unemployed.
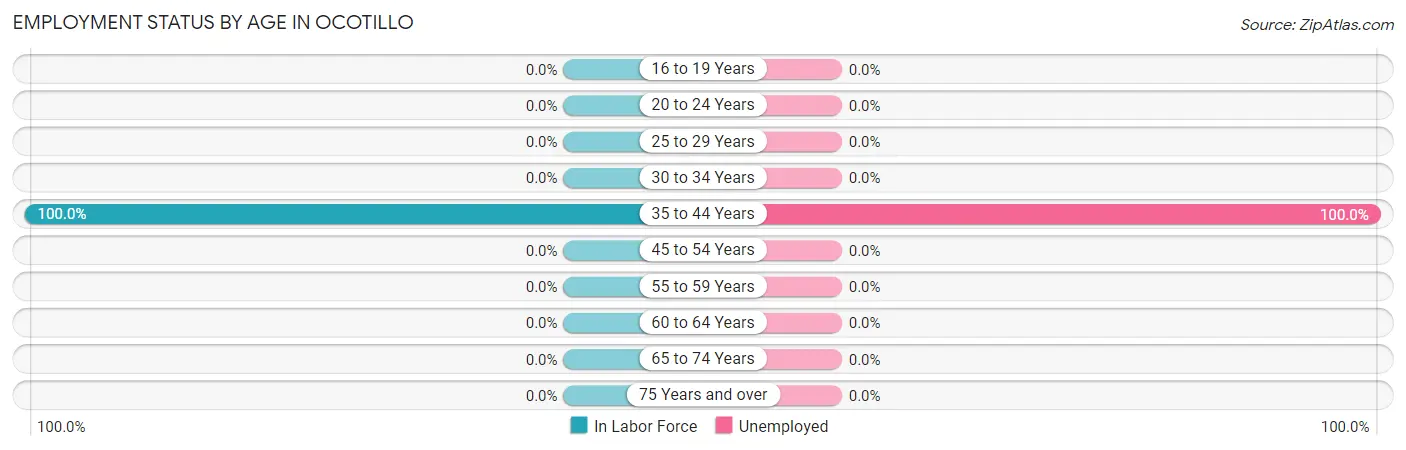
| Age Bracket | In Labor Force | Unemployed |
| 16 to 19 Years | 0 (0.0%) | 0 (0.0%) |
| 20 to 24 Years | 0 (0.0%) | 0 (0.0%) |
| 25 to 29 Years | 0 (0.0%) | 0 (0.0%) |
| 30 to 34 Years | 0 (0.0%) | 0 (0.0%) |
| 35 to 44 Years | 22 (100.0%) | 22 (100.0%) |
| 45 to 54 Years | 0 (0.0%) | 0 (0.0%) |
| 55 to 59 Years | 0 (0.0%) | 0 (0.0%) |
| 60 to 64 Years | 0 (0.0%) | 0 (0.0%) |
| 65 to 74 Years | 0 (0.0%) | 0 (0.0%) |
| 75 Years and over | 0 (0.0%) | 0 (0.0%) |
| Total | 22 (15.1%) | 22 (100.0%) |
Employment Status by Educational Attainment in Ocotillo
According to labor force statistics for Ocotillo, 22.4% of individuals (22) out of the total population between 25 and 64 years of age (98) are in the labor force, with 100.0% or 22 of them being unemployed. The group with the highest labor force participation rate are those with the educational attainment of college / associate degree, with 100.0% or 22 individuals in the labor force. Within the labor force, individuals with college / associate degree education have the highest percentage of unemployment, with 100.0% or 22 of them being unemployed.
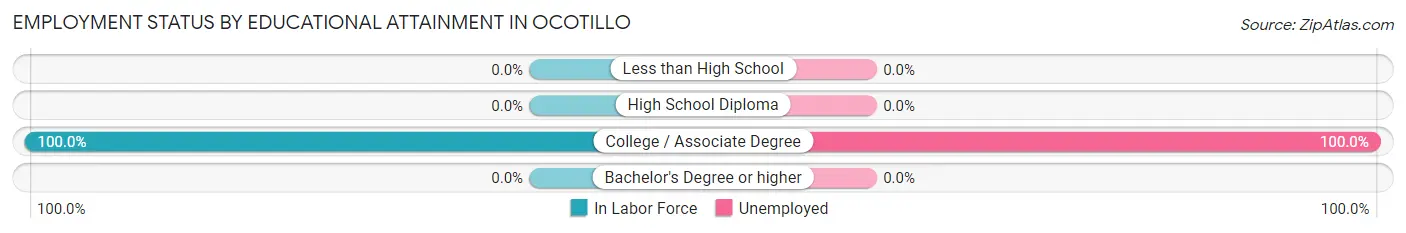
| Educational Attainment | In Labor Force | Unemployed |
| Less than High School | 0 (0.0%) | 0 (0.0%) |
| High School Diploma | 0 (0.0%) | 0 (0.0%) |
| College / Associate Degree | 22 (100.0%) | 22 (100.0%) |
| Bachelor's Degree or higher | 0 (0.0%) | 0 (0.0%) |
| Total | 22 (22.4%) | 98 (100.0%) |
Employment Occupations by Sex in Ocotillo
Management, Business, Science and Arts Occupations
Management, Business, Science and Arts Occupations by Sex
| Occupation | Male | Female |
| Management | 0 (0.0%) | 0 (0.0%) |
| Business & Financial | 0 (0.0%) | 0 (0.0%) |
| Computers, Engineering & Science | 0 (0.0%) | 0 (0.0%) |
| Computers & Mathematics | 0 (0.0%) | 0 (0.0%) |
| Architecture & Engineering | 0 (0.0%) | 0 (0.0%) |
| Life, Physical & Social Science | 0 (0.0%) | 0 (0.0%) |
| Community & Social Service | 0 (0.0%) | 0 (0.0%) |
| Education, Arts & Media | 0 (0.0%) | 0 (0.0%) |
| Legal Services & Support | 0 (0.0%) | 0 (0.0%) |
| Education Instruction & Library | 0 (0.0%) | 0 (0.0%) |
| Arts, Media & Entertainment | 0 (0.0%) | 0 (0.0%) |
| Health Diagnosing & Treating | 0 (0.0%) | 0 (0.0%) |
| Health Technologists | 0 (0.0%) | 0 (0.0%) |
| Total (Category) | 0 (0.0%) | 0 (0.0%) |
| Total (Overall) | 0 (0.0%) | 0 (0.0%) |
Services Occupations
Services Occupations by Sex
| Occupation | Male | Female |
| Healthcare Support | 0 (0.0%) | 0 (0.0%) |
| Security & Protection | 0 (0.0%) | 0 (0.0%) |
| Firefighting & Prevention | 0 (0.0%) | 0 (0.0%) |
| Law Enforcement | 0 (0.0%) | 0 (0.0%) |
| Food Preparation & Serving | 0 (0.0%) | 0 (0.0%) |
| Cleaning & Maintenance | 0 (0.0%) | 0 (0.0%) |
| Personal Care & Service | 0 (0.0%) | 0 (0.0%) |
| Total (Category) | 0 (0.0%) | 0 (0.0%) |
| Total (Overall) | 0 (0.0%) | 0 (0.0%) |
Sales and Office Occupations
Sales and Office Occupations by Sex
| Occupation | Male | Female |
| Sales & Related | 0 (0.0%) | 0 (0.0%) |
| Office & Administration | 0 (0.0%) | 0 (0.0%) |
| Total (Category) | 0 (0.0%) | 0 (0.0%) |
| Total (Overall) | 0 (0.0%) | 0 (0.0%) |
Natural Resources, Construction and Maintenance Occupations
Natural Resources, Construction and Maintenance Occupations by Sex
| Occupation | Male | Female |
| Farming, Fishing & Forestry | 0 (0.0%) | 0 (0.0%) |
| Construction & Extraction | 0 (0.0%) | 0 (0.0%) |
| Installation, Maintenance & Repair | 0 (0.0%) | 0 (0.0%) |
| Total (Category) | 0 (0.0%) | 0 (0.0%) |
| Total (Overall) | 0 (0.0%) | 0 (0.0%) |
Production, Transportation and Moving Occupations
Production, Transportation and Moving Occupations by Sex
| Occupation | Male | Female |
| Production | 0 (0.0%) | 0 (0.0%) |
| Transportation | 0 (0.0%) | 0 (0.0%) |
| Material Moving | 0 (0.0%) | 0 (0.0%) |
| Total (Category) | 0 (0.0%) | 0 (0.0%) |
| Total (Overall) | 0 (0.0%) | 0 (0.0%) |
Employment Industries by Sex in Ocotillo
Employment Industries in Ocotillo
Employment Industries by Sex in Ocotillo
| Industry | Male | Female |
| Agriculture, Fishing & Hunting | 0 (0.0%) | 0 (0.0%) |
| Mining, Quarrying, & Extraction | 0 (0.0%) | 0 (0.0%) |
| Construction | 0 (0.0%) | 0 (0.0%) |
| Manufacturing | 0 (0.0%) | 0 (0.0%) |
| Wholesale Trade | 0 (0.0%) | 0 (0.0%) |
| Retail Trade | 0 (0.0%) | 0 (0.0%) |
| Transportation & Warehousing | 0 (0.0%) | 0 (0.0%) |
| Utilities | 0 (0.0%) | 0 (0.0%) |
| Information | 0 (0.0%) | 0 (0.0%) |
| Finance & Insurance | 0 (0.0%) | 0 (0.0%) |
| Real Estate, Rental & Leasing | 0 (0.0%) | 0 (0.0%) |
| Professional & Scientific | 0 (0.0%) | 0 (0.0%) |
| Enterprise Management | 0 (0.0%) | 0 (0.0%) |
| Administrative & Support | 0 (0.0%) | 0 (0.0%) |
| Educational Services | 0 (0.0%) | 0 (0.0%) |
| Health Care & Social Assistance | 0 (0.0%) | 0 (0.0%) |
| Arts, Entertainment & Recreation | 0 (0.0%) | 0 (0.0%) |
| Accommodation & Food Services | 0 (0.0%) | 0 (0.0%) |
| Public Administration | 0 (0.0%) | 0 (0.0%) |
| Total | 0 (0.0%) | 0 (0.0%) |
Education in Ocotillo
School Enrollment in Ocotillo
| School Level | # Students | % Students |
| Nursery / Preschool | 0 | 0.0% |
| Kindergarten | 0 | 0.0% |
| Elementary School | 0 | 0.0% |
| Middle School | 0 | 0.0% |
| High School | 0 | 0.0% |
| College / Undergraduate | 0 | 0.0% |
| Graduate / Professional | 0 | 0.0% |
| Total | 0 | 0.0% |
School Enrollment by Age by Funding Source in Ocotillo
| Age Bracket | Public School | Private School |
| 3 to 4 Year Olds | 0 (0.0%) | 0 (0.0%) |
| 5 to 9 Year Old | 0 (0.0%) | 0 (0.0%) |
| 10 to 14 Year Olds | 0 (0.0%) | 0 (0.0%) |
| 15 to 17 Year Olds | 0 (0.0%) | 0 (0.0%) |
| 18 to 19 Year Olds | 0 (0.0%) | 0 (0.0%) |
| 20 to 24 Year Olds | 0 (0.0%) | 0 (0.0%) |
| 25 to 34 Year Olds | 0 (0.0%) | 0 (0.0%) |
| 35 Years and over | 0 (0.0%) | 0 (0.0%) |
| Total | 0 (0.0%) | 0 (0.0%) |
Educational Attainment by Field of Study in Ocotillo
, and bio, nature & agricultural (13 | 100.0%) are the most common fields of study among 13 individuals in Ocotillo who have obtained a bachelor's degree or higher.
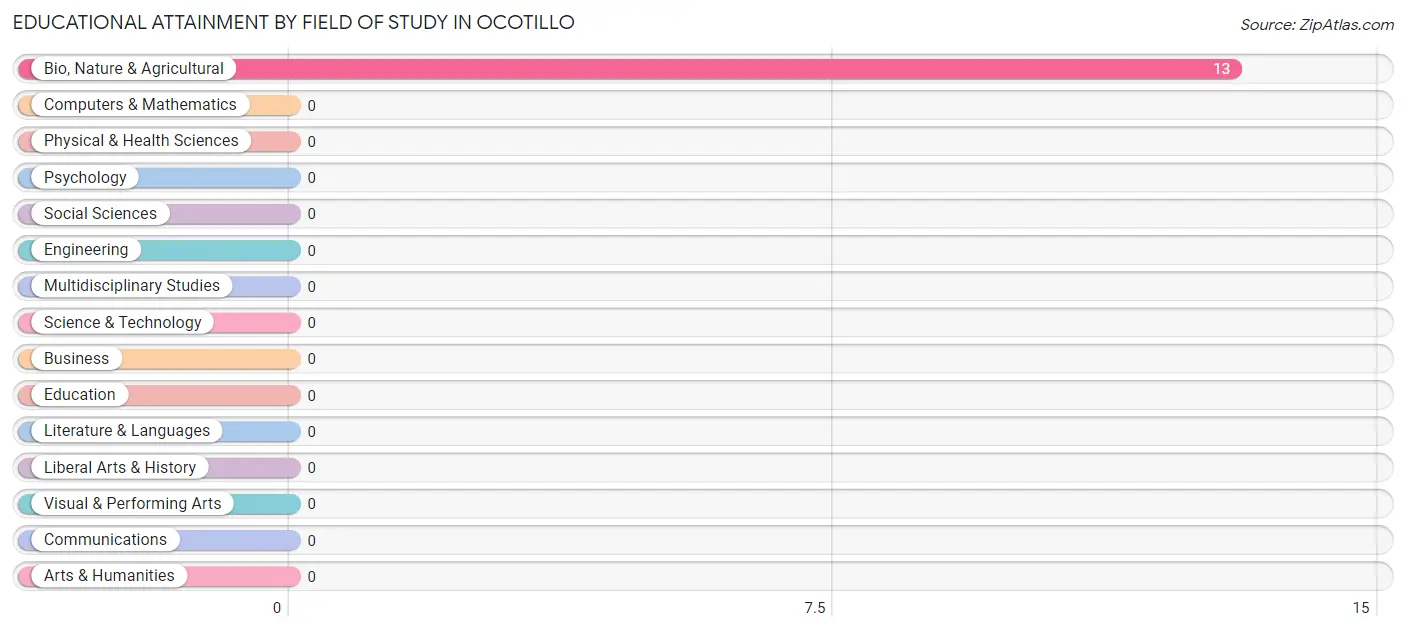
| Field of Study | # Graduates | % Graduates |
| Computers & Mathematics | 0 | 0.0% |
| Bio, Nature & Agricultural | 13 | 100.0% |
| Physical & Health Sciences | 0 | 0.0% |
| Psychology | 0 | 0.0% |
| Social Sciences | 0 | 0.0% |
| Engineering | 0 | 0.0% |
| Multidisciplinary Studies | 0 | 0.0% |
| Science & Technology | 0 | 0.0% |
| Business | 0 | 0.0% |
| Education | 0 | 0.0% |
| Literature & Languages | 0 | 0.0% |
| Liberal Arts & History | 0 | 0.0% |
| Visual & Performing Arts | 0 | 0.0% |
| Communications | 0 | 0.0% |
| Arts & Humanities | 0 | 0.0% |
| Total | 13 | 100.0% |
Transportation & Commute in Ocotillo
Vehicle Availability by Sex in Ocotillo
| Vehicles Available | Male | Female |
| No Vehicle | 0 (0.0%) | 0 (0.0%) |
| 1 Vehicle | 0 (0.0%) | 0 (0.0%) |
| 2 Vehicles | 0 (0.0%) | 0 (0.0%) |
| 3 Vehicles | 0 (0.0%) | 0 (0.0%) |
| 4 Vehicles | 0 (0.0%) | 0 (0.0%) |
| 5 or more Vehicles | 0 (0.0%) | 0 (0.0%) |
| Total | 0 (0.0%) | 0 (0.0%) |
Commute Time in Ocotillo
| Commute Time | # Commuters | % Commuters |
| Less than 5 Minutes | 0 | 0.0% |
| 5 to 9 Minutes | 0 | 0.0% |
| 10 to 14 Minutes | 0 | 0.0% |
| 15 to 19 Minutes | 0 | 0.0% |
| 20 to 24 Minutes | 0 | 0.0% |
| 25 to 29 Minutes | 0 | 0.0% |
| 30 to 34 Minutes | 0 | 0.0% |
| 35 to 39 Minutes | 0 | 0.0% |
| 40 to 44 Minutes | 0 | 0.0% |
| 45 to 59 Minutes | 0 | 0.0% |
| 60 to 89 Minutes | 0 | 0.0% |
| 90 or more Minutes | 0 | 0.0% |
Commute Time by Sex in Ocotillo
| Commute Time | Male | Female |
| Less than 5 Minutes | 0 (0.0%) | 0 (0.0%) |
| 5 to 9 Minutes | 0 (0.0%) | 0 (0.0%) |
| 10 to 14 Minutes | 0 (0.0%) | 0 (0.0%) |
| 15 to 19 Minutes | 0 (0.0%) | 0 (0.0%) |
| 20 to 24 Minutes | 0 (0.0%) | 0 (0.0%) |
| 25 to 29 Minutes | 0 (0.0%) | 0 (0.0%) |
| 30 to 34 Minutes | 0 (0.0%) | 0 (0.0%) |
| 35 to 39 Minutes | 0 (0.0%) | 0 (0.0%) |
| 40 to 44 Minutes | 0 (0.0%) | 0 (0.0%) |
| 45 to 59 Minutes | 0 (0.0%) | 0 (0.0%) |
| 60 to 89 Minutes | 0 (0.0%) | 0 (0.0%) |
| 90 or more Minutes | 0 (0.0%) | 0 (0.0%) |
Time of Departure to Work by Sex in Ocotillo

| Time of Departure | Male | Female |
| 12:00 AM to 4:59 AM | 0 (0.0%) | 0 (0.0%) |
| 5:00 AM to 5:29 AM | 0 (0.0%) | 0 (0.0%) |
| 5:30 AM to 5:59 AM | 0 (0.0%) | 0 (0.0%) |
| 6:00 AM to 6:29 AM | 0 (0.0%) | 0 (0.0%) |
| 6:30 AM to 6:59 AM | 0 (0.0%) | 0 (0.0%) |
| 7:00 AM to 7:29 AM | 0 (0.0%) | 0 (0.0%) |
| 7:30 AM to 7:59 AM | 0 (0.0%) | 0 (0.0%) |
| 8:00 AM to 8:29 AM | 0 (0.0%) | 0 (0.0%) |
| 8:30 AM to 8:59 AM | 0 (0.0%) | 0 (0.0%) |
| 9:00 AM to 9:59 AM | 0 (0.0%) | 0 (0.0%) |
| 10:00 AM to 10:59 AM | 0 (0.0%) | 0 (0.0%) |
| 11:00 AM to 11:59 AM | 0 (0.0%) | 0 (0.0%) |
| 12:00 PM to 3:59 PM | 0 (0.0%) | 0 (0.0%) |
| 4:00 PM to 11:59 PM | 0 (0.0%) | 0 (0.0%) |
| Total | 0 (0.0%) | 0 (0.0%) |
Housing Occupancy in Ocotillo
Occupancy by Ownership in Ocotillo
Of the total 72 dwellings in Ocotillo, owner-occupied units account for 56 (77.8%), while renter-occupied units make up 16 (22.2%).
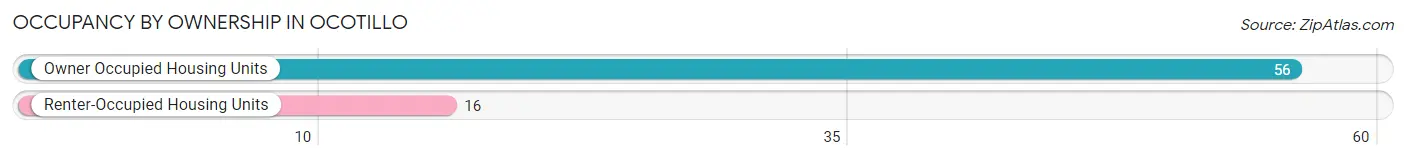
| Occupancy | # Housing Units | % Housing Units |
| Owner Occupied Housing Units | 56 | 77.8% |
| Renter-Occupied Housing Units | 16 | 22.2% |
| Total Occupied Housing Units | 72 | 100.0% |
Occupancy by Household Size in Ocotillo
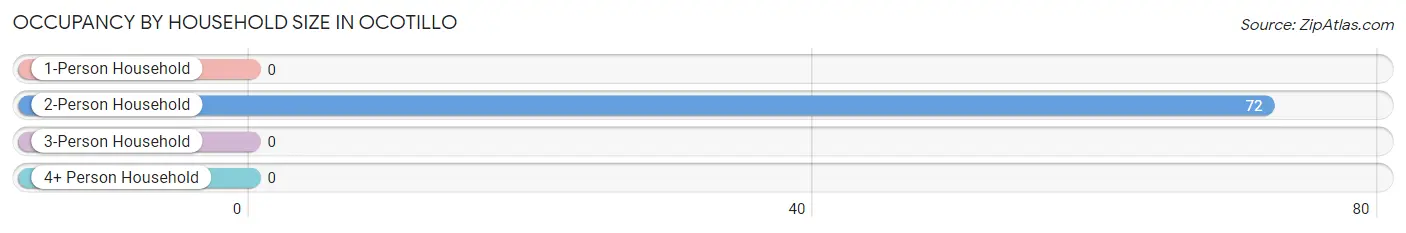
| Household Size | # Housing Units | % Housing Units |
| 1-Person Household | 0 | 0.0% |
| 2-Person Household | 72 | 100.0% |
| 3-Person Household | 0 | 0.0% |
| 4+ Person Household | 0 | 0.0% |
| Total Housing Units | 72 | 100.0% |
Occupancy by Ownership by Household Size in Ocotillo
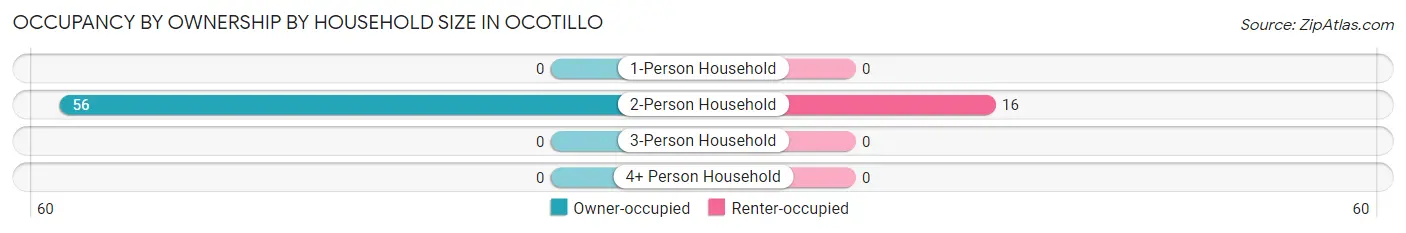
| Household Size | Owner-occupied | Renter-occupied |
| 1-Person Household | 0 (0.0%) | 0 (0.0%) |
| 2-Person Household | 56 (77.8%) | 16 (22.2%) |
| 3-Person Household | 0 (0.0%) | 0 (0.0%) |
| 4+ Person Household | 0 (0.0%) | 0 (0.0%) |
| Total Housing Units | 56 (77.8%) | 16 (22.2%) |
Occupancy by Educational Attainment in Ocotillo
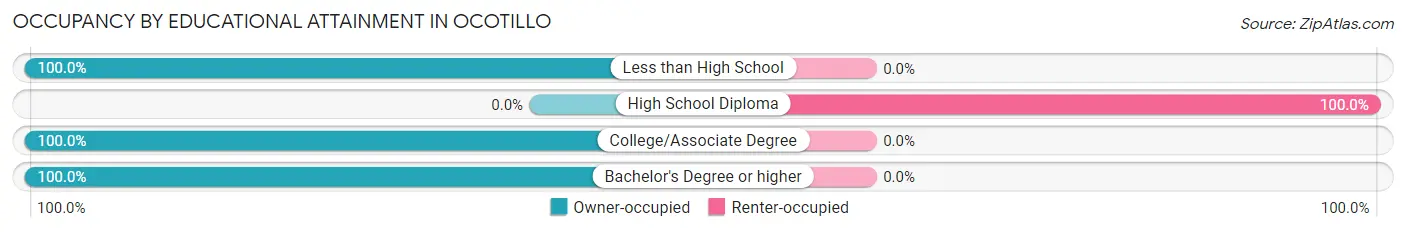
| Household Size | Owner-occupied | Renter-occupied |
| Less than High School | 23 (100.0%) | 0 (0.0%) |
| High School Diploma | 0 (0.0%) | 16 (100.0%) |
| College/Associate Degree | 20 (100.0%) | 0 (0.0%) |
| Bachelor's Degree or higher | 13 (100.0%) | 0 (0.0%) |
Occupancy by Age of Householder in Ocotillo
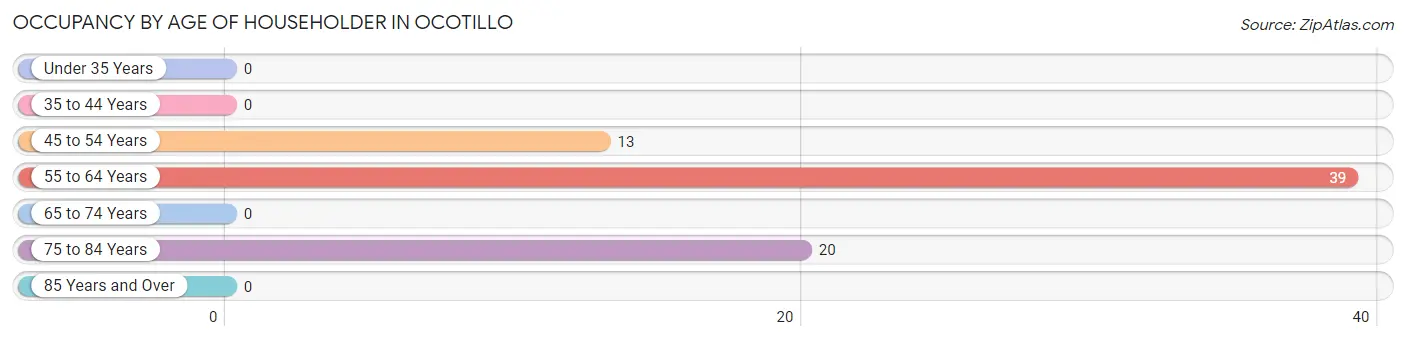
| Age Bracket | # Households | % Households |
| Under 35 Years | 0 | 0.0% |
| 35 to 44 Years | 0 | 0.0% |
| 45 to 54 Years | 13 | 18.1% |
| 55 to 64 Years | 39 | 54.2% |
| 65 to 74 Years | 0 | 0.0% |
| 75 to 84 Years | 20 | 27.8% |
| 85 Years and Over | 0 | 0.0% |
| Total | 72 | 100.0% |
Housing Finances in Ocotillo
Median Income by Occupancy in Ocotillo
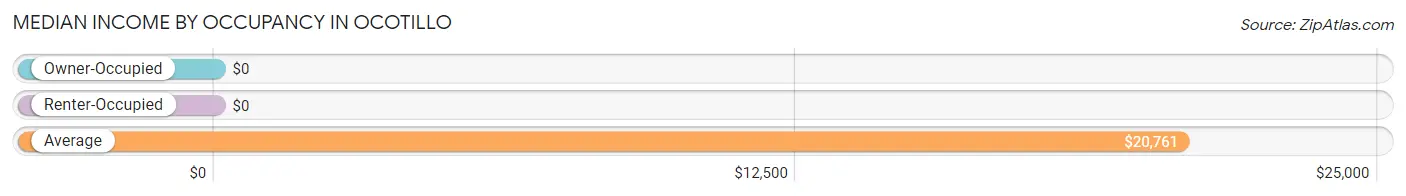
| Occupancy Type | # Households | Median Income |
| Owner-Occupied | 56 (77.8%) | $0 |
| Renter-Occupied | 16 (22.2%) | $0 |
| Average | 72 (100.0%) | $20,761 |
Occupancy by Householder Income Bracket in Ocotillo
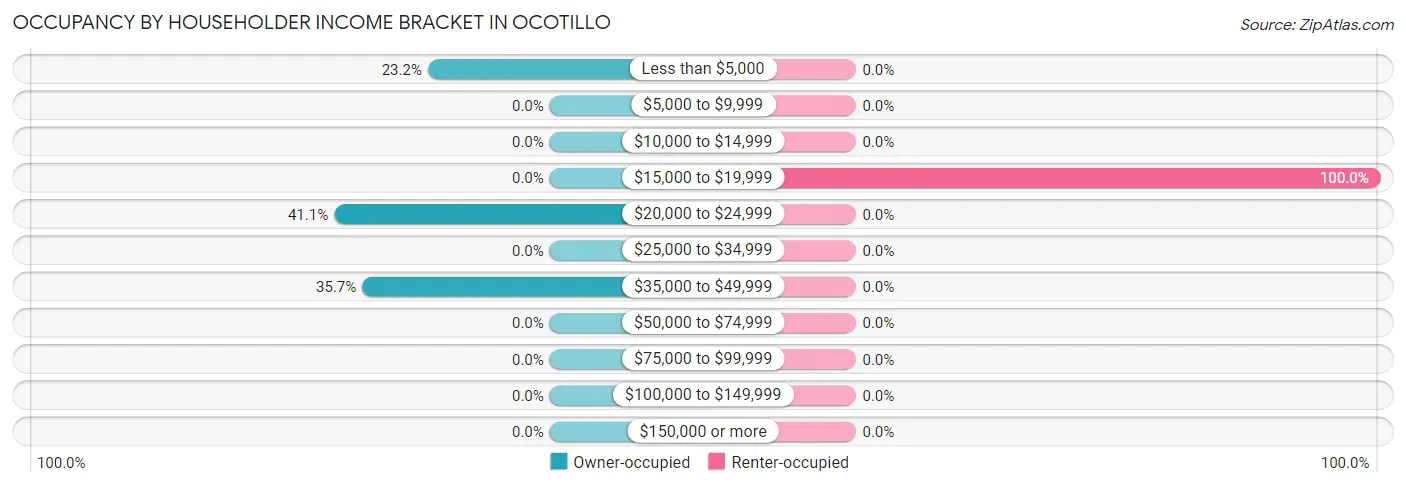
| Income Bracket | Owner-occupied | Renter-occupied |
| Less than $5,000 | 13 (23.2%) | 0 (0.0%) |
| $5,000 to $9,999 | 0 (0.0%) | 0 (0.0%) |
| $10,000 to $14,999 | 0 (0.0%) | 0 (0.0%) |
| $15,000 to $19,999 | 0 (0.0%) | 16 (100.0%) |
| $20,000 to $24,999 | 23 (41.1%) | 0 (0.0%) |
| $25,000 to $34,999 | 0 (0.0%) | 0 (0.0%) |
| $35,000 to $49,999 | 20 (35.7%) | 0 (0.0%) |
| $50,000 to $74,999 | 0 (0.0%) | 0 (0.0%) |
| $75,000 to $99,999 | 0 (0.0%) | 0 (0.0%) |
| $100,000 to $149,999 | 0 (0.0%) | 0 (0.0%) |
| $150,000 or more | 0 (0.0%) | 0 (0.0%) |
| Total | 56 (100.0%) | 16 (100.0%) |
Monthly Housing Cost Tiers in Ocotillo
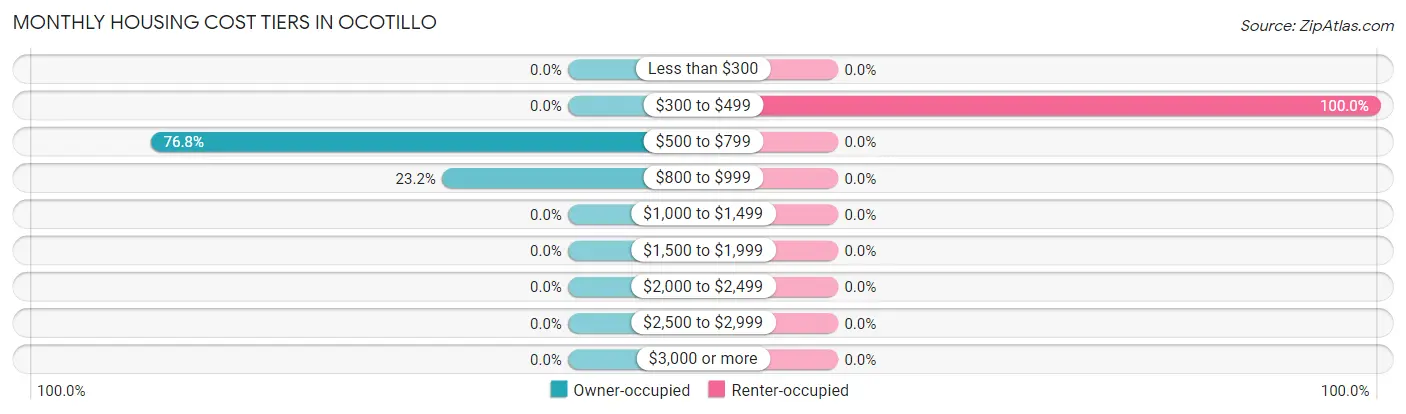
| Monthly Cost | Owner-occupied | Renter-occupied |
| Less than $300 | 0 (0.0%) | 0 (0.0%) |
| $300 to $499 | 0 (0.0%) | 16 (100.0%) |
| $500 to $799 | 43 (76.8%) | 0 (0.0%) |
| $800 to $999 | 13 (23.2%) | 0 (0.0%) |
| $1,000 to $1,499 | 0 (0.0%) | 0 (0.0%) |
| $1,500 to $1,999 | 0 (0.0%) | 0 (0.0%) |
| $2,000 to $2,499 | 0 (0.0%) | 0 (0.0%) |
| $2,500 to $2,999 | 0 (0.0%) | 0 (0.0%) |
| $3,000 or more | 0 (0.0%) | 0 (0.0%) |
| Total | 56 (100.0%) | 16 (100.0%) |
Physical Housing Characteristics in Ocotillo
Housing Structures in Ocotillo
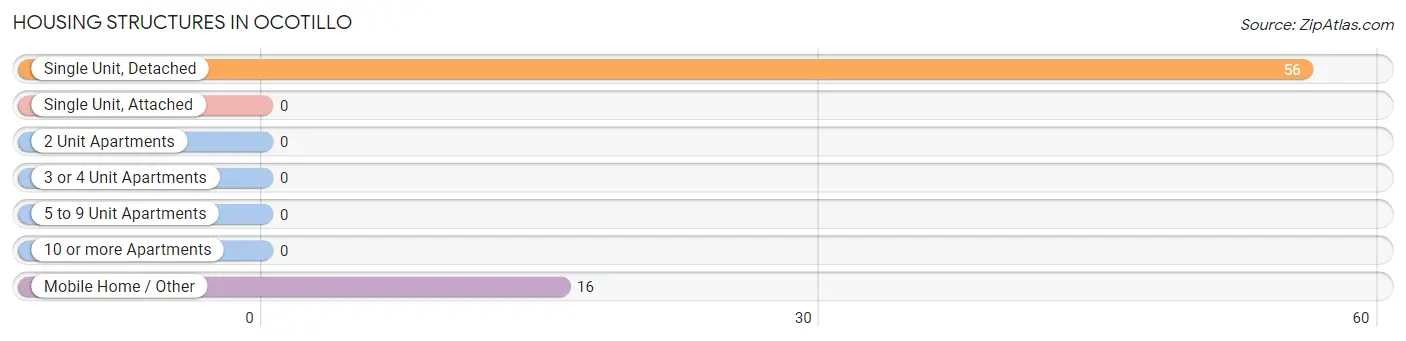
| Structure Type | # Housing Units | % Housing Units |
| Single Unit, Detached | 56 | 77.8% |
| Single Unit, Attached | 0 | 0.0% |
| 2 Unit Apartments | 0 | 0.0% |
| 3 or 4 Unit Apartments | 0 | 0.0% |
| 5 to 9 Unit Apartments | 0 | 0.0% |
| 10 or more Apartments | 0 | 0.0% |
| Mobile Home / Other | 16 | 22.2% |
| Total | 72 | 100.0% |
Housing Structures by Occupancy in Ocotillo
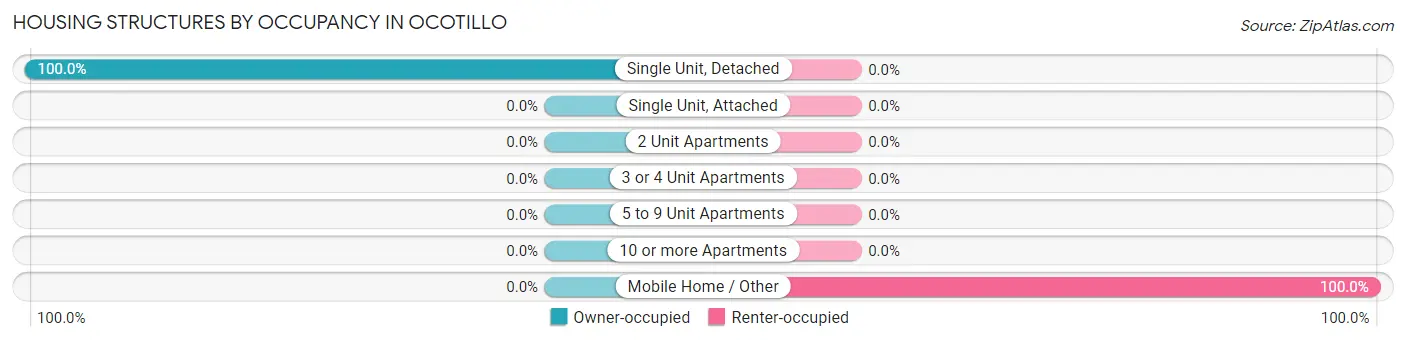
| Structure Type | Owner-occupied | Renter-occupied |
| Single Unit, Detached | 56 (100.0%) | 0 (0.0%) |
| Single Unit, Attached | 0 (0.0%) | 0 (0.0%) |
| 2 Unit Apartments | 0 (0.0%) | 0 (0.0%) |
| 3 or 4 Unit Apartments | 0 (0.0%) | 0 (0.0%) |
| 5 to 9 Unit Apartments | 0 (0.0%) | 0 (0.0%) |
| 10 or more Apartments | 0 (0.0%) | 0 (0.0%) |
| Mobile Home / Other | 0 (0.0%) | 16 (100.0%) |
| Total | 56 (77.8%) | 16 (22.2%) |
Housing Structures by Number of Rooms in Ocotillo
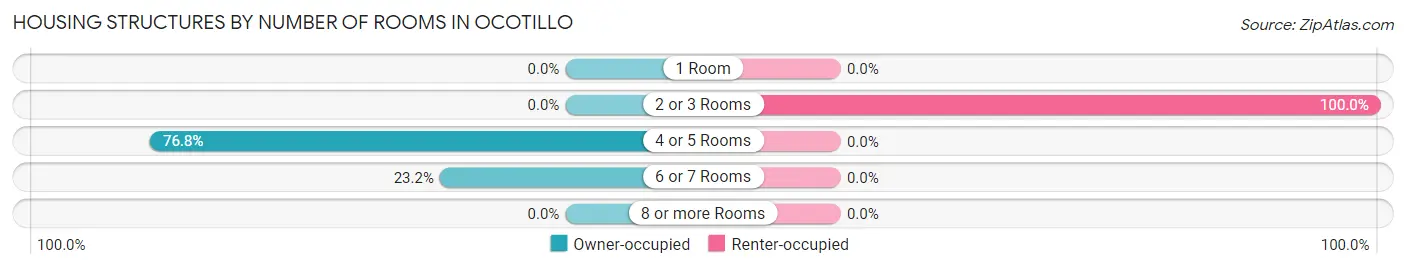
| Number of Rooms | Owner-occupied | Renter-occupied |
| 1 Room | 0 (0.0%) | 0 (0.0%) |
| 2 or 3 Rooms | 0 (0.0%) | 16 (100.0%) |
| 4 or 5 Rooms | 43 (76.8%) | 0 (0.0%) |
| 6 or 7 Rooms | 13 (23.2%) | 0 (0.0%) |
| 8 or more Rooms | 0 (0.0%) | 0 (0.0%) |
| Total | 56 (100.0%) | 16 (100.0%) |
Housing Structure by Heating Type in Ocotillo
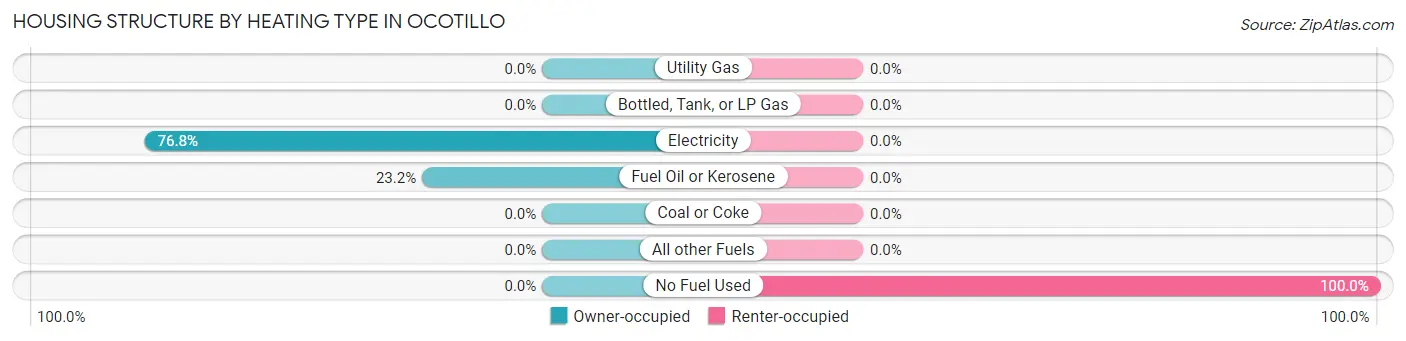
| Heating Type | Owner-occupied | Renter-occupied |
| Utility Gas | 0 (0.0%) | 0 (0.0%) |
| Bottled, Tank, or LP Gas | 0 (0.0%) | 0 (0.0%) |
| Electricity | 43 (76.8%) | 0 (0.0%) |
| Fuel Oil or Kerosene | 13 (23.2%) | 0 (0.0%) |
| Coal or Coke | 0 (0.0%) | 0 (0.0%) |
| All other Fuels | 0 (0.0%) | 0 (0.0%) |
| No Fuel Used | 0 (0.0%) | 16 (100.0%) |
| Total | 56 (100.0%) | 16 (100.0%) |
Household Vehicle Usage in Ocotillo
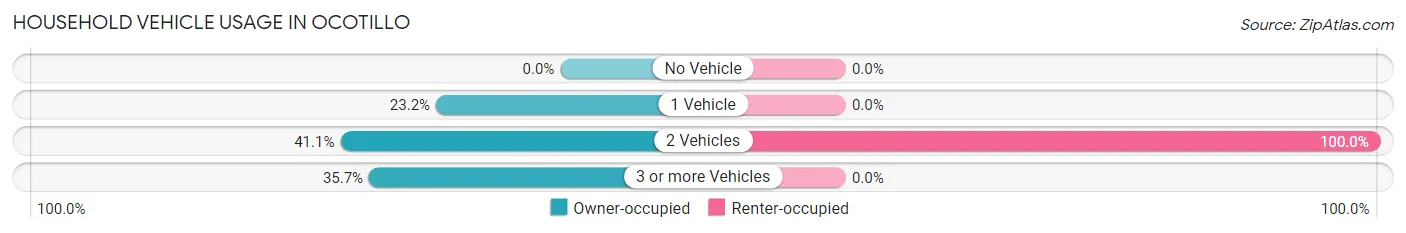
| Vehicles per Household | Owner-occupied | Renter-occupied |
| No Vehicle | 0 (0.0%) | 0 (0.0%) |
| 1 Vehicle | 13 (23.2%) | 0 (0.0%) |
| 2 Vehicles | 23 (41.1%) | 16 (100.0%) |
| 3 or more Vehicles | 20 (35.7%) | 0 (0.0%) |
| Total | 56 (100.0%) | 16 (100.0%) |
Real Estate & Mortgages in Ocotillo
Real Estate and Mortgage Overview in Ocotillo
| Characteristic | Without Mortgage | With Mortgage |
| Housing Units | 43 | 13 |
| Median Property Value | - | - |
| Median Household Income | - | - |
| Monthly Housing Costs | - | - |
| Real Estate Taxes | - | - |
Property Value by Mortgage Status in Ocotillo
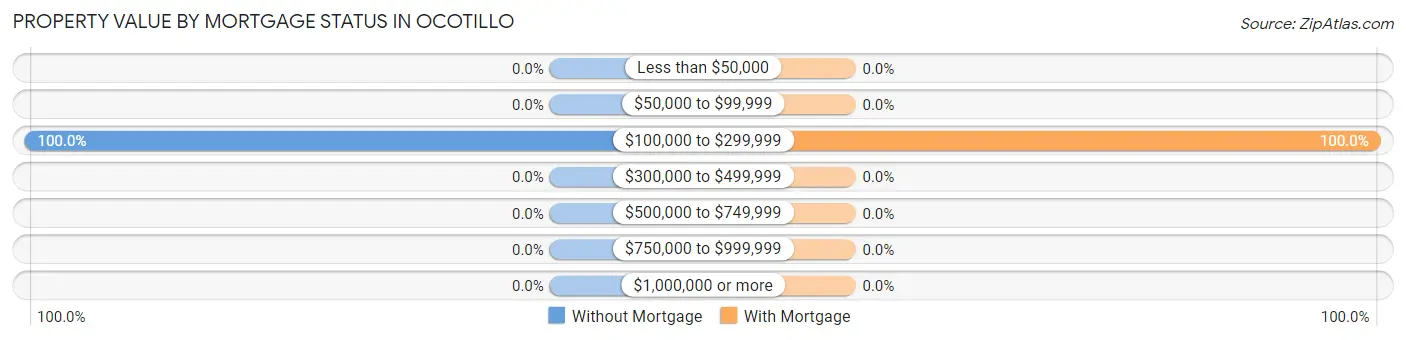
| Property Value | Without Mortgage | With Mortgage |
| Less than $50,000 | 0 (0.0%) | 0 (0.0%) |
| $50,000 to $99,999 | 0 (0.0%) | 0 (0.0%) |
| $100,000 to $299,999 | 43 (100.0%) | 13 (100.0%) |
| $300,000 to $499,999 | 0 (0.0%) | 0 (0.0%) |
| $500,000 to $749,999 | 0 (0.0%) | 0 (0.0%) |
| $750,000 to $999,999 | 0 (0.0%) | 0 (0.0%) |
| $1,000,000 or more | 0 (0.0%) | 0 (0.0%) |
| Total | 43 (100.0%) | 13 (100.0%) |
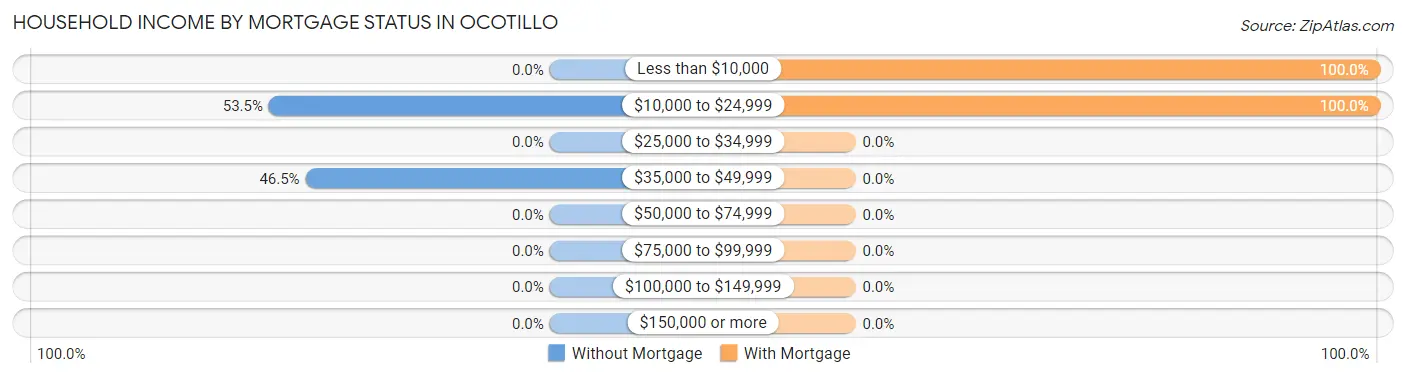
Household Income by Mortgage Status in Ocotillo
| Household Income | Without Mortgage | With Mortgage |
| Less than $10,000 | 0 (0.0%) | 13 (100.0%) |
| $10,000 to $24,999 | 23 (53.5%) | 13 (100.0%) |
| $25,000 to $34,999 | 0 (0.0%) | 0 (0.0%) |
| $35,000 to $49,999 | 20 (46.5%) | 0 (0.0%) |
| $50,000 to $74,999 | 0 (0.0%) | 0 (0.0%) |
| $75,000 to $99,999 | 0 (0.0%) | 0 (0.0%) |
| $100,000 to $149,999 | 0 (0.0%) | 0 (0.0%) |
| $150,000 or more | 0 (0.0%) | 0 (0.0%) |
| Total | 43 (100.0%) | 13 (100.0%) |
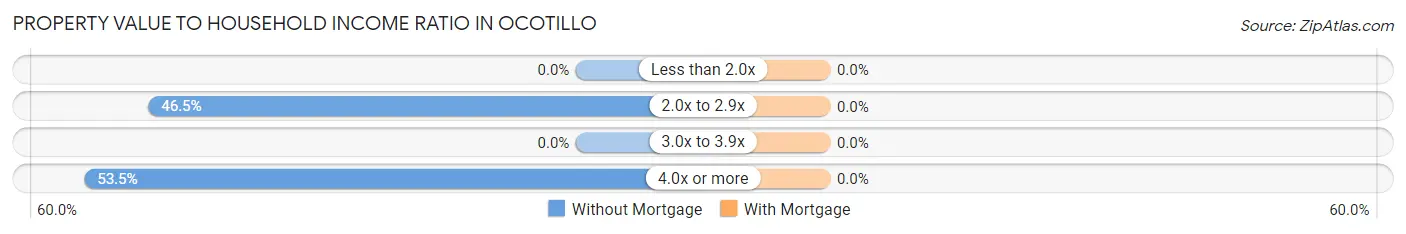
Property Value to Household Income Ratio in Ocotillo
| Value-to-Income Ratio | Without Mortgage | With Mortgage |
| Less than 2.0x | 0 (0.0%) | 0 (0.0%) |
| 2.0x to 2.9x | 20 (46.5%) | 0 (0.0%) |
| 3.0x to 3.9x | 0 (0.0%) | 0 (0.0%) |
| 4.0x or more | 23 (53.5%) | 0 (0.0%) |
| Total | 43 (100.0%) | 13 (100.0%) |
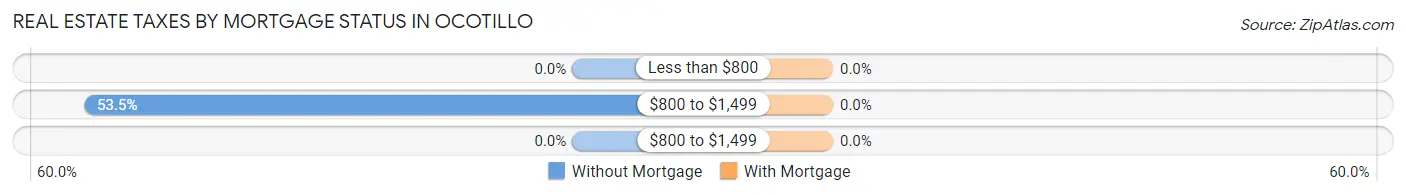
Real Estate Taxes by Mortgage Status in Ocotillo
| Property Taxes | Without Mortgage | With Mortgage |
| Less than $800 | 0 (0.0%) | 0 (0.0%) |
| $800 to $1,499 | 23 (53.5%) | 0 (0.0%) |
| $800 to $1,499 | 0 (0.0%) | 0 (0.0%) |
| Total | 43 (100.0%) | 13 (100.0%) |
Health & Disability in Ocotillo
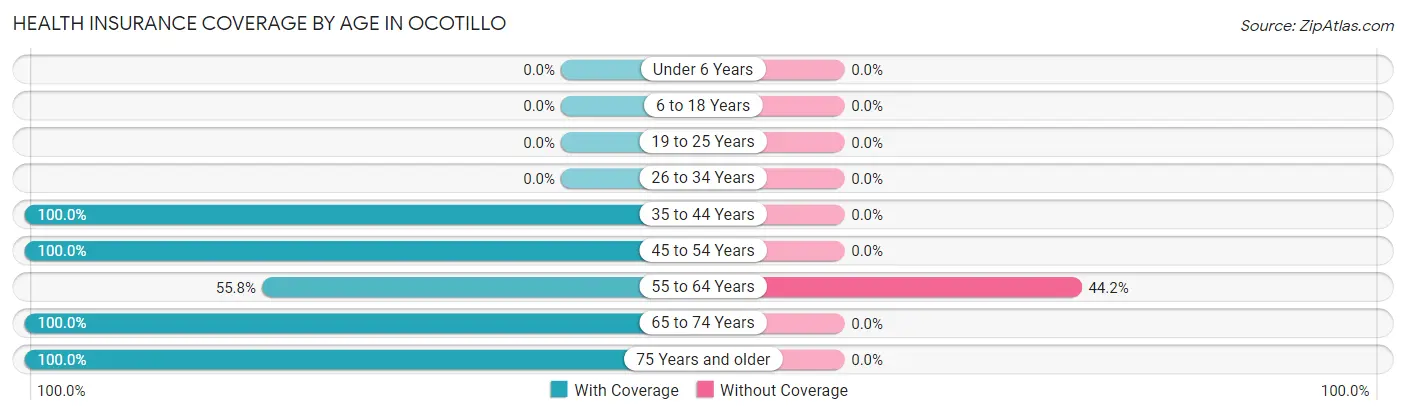
Health Insurance Coverage by Age in Ocotillo
| Age Bracket | With Coverage | Without Coverage |
| Under 6 Years | 0 (0.0%) | 0 (0.0%) |
| 6 to 18 Years | 0 (0.0%) | 0 (0.0%) |
| 19 to 25 Years | 0 (0.0%) | 0 (0.0%) |
| 26 to 34 Years | 0 (0.0%) | 0 (0.0%) |
| 35 to 44 Years | 22 (100.0%) | 0 (0.0%) |
| 45 to 54 Years | 24 (100.0%) | 0 (0.0%) |
| 55 to 64 Years | 29 (55.8%) | 23 (44.2%) |
| 65 to 74 Years | 28 (100.0%) | 0 (0.0%) |
| 75 Years and older | 20 (100.0%) | 0 (0.0%) |
| Total | 123 (84.3%) | 23 (15.8%) |
Health Insurance Coverage by Citizenship Status in Ocotillo
| Citizenship Status | With Coverage | Without Coverage |
| Native Born | 0 (0.0%) | 0 (0.0%) |
| Foreign Born, Citizen | 0 (0.0%) | 0 (0.0%) |
| Foreign Born, not a Citizen | 0 (0.0%) | 0 (0.0%) |
Health Insurance Coverage by Household Income in Ocotillo
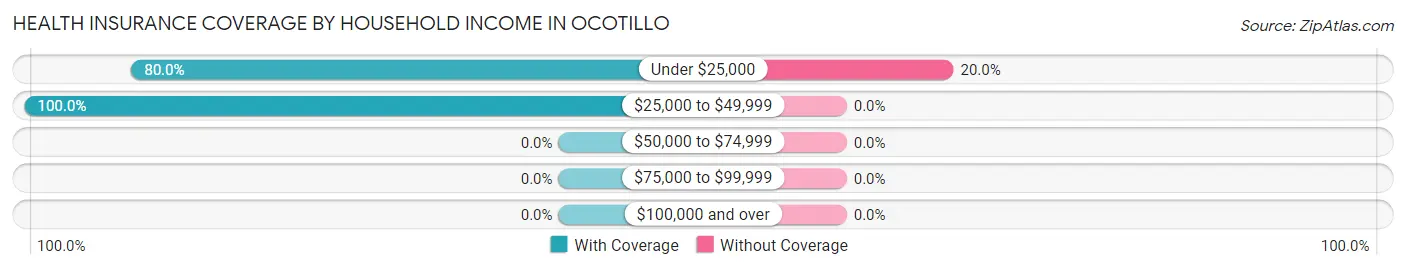
| Household Income | With Coverage | Without Coverage |
| Under $25,000 | 92 (80.0%) | 23 (20.0%) |
| $25,000 to $49,999 | 31 (100.0%) | 0 (0.0%) |
| $50,000 to $74,999 | 0 (0.0%) | 0 (0.0%) |
| $75,000 to $99,999 | 0 (0.0%) | 0 (0.0%) |
| $100,000 and over | 0 (0.0%) | 0 (0.0%) |
Public vs Private Health Insurance Coverage by Age in Ocotillo
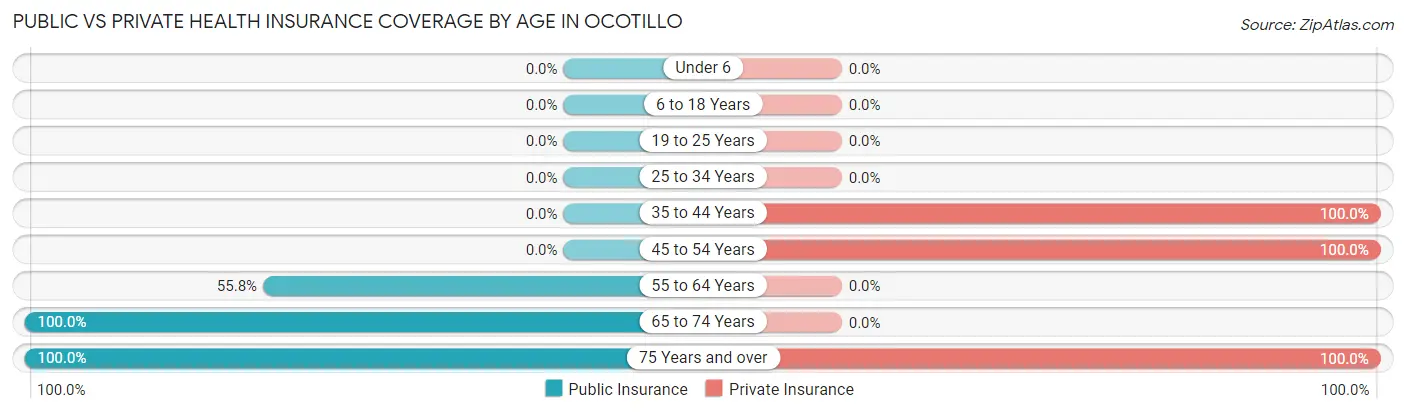
| Age Bracket | Public Insurance | Private Insurance |
| Under 6 | 0 (0.0%) | 0 (0.0%) |
| 6 to 18 Years | 0 (0.0%) | 0 (0.0%) |
| 19 to 25 Years | 0 (0.0%) | 0 (0.0%) |
| 25 to 34 Years | 0 (0.0%) | 0 (0.0%) |
| 35 to 44 Years | 0 (0.0%) | 22 (100.0%) |
| 45 to 54 Years | 0 (0.0%) | 24 (100.0%) |
| 55 to 64 Years | 29 (55.8%) | 0 (0.0%) |
| 65 to 74 Years | 28 (100.0%) | 0 (0.0%) |
| 75 Years and over | 20 (100.0%) | 20 (100.0%) |
| Total | 77 (52.7%) | 66 (45.2%) |
Disability Status by Sex by Age in Ocotillo
| Age Bracket | Male | Female |
| Under 5 Years | 0 (0.0%) | 0 (0.0%) |
| 5 to 17 Years | 0 (0.0%) | 0 (0.0%) |
| 18 to 34 Years | 0 (0.0%) | 0 (0.0%) |
| 35 to 64 Years | 0 (0.0%) | 0 (0.0%) |
| 65 to 74 Years | 0 (0.0%) | 0 (0.0%) |
| 75 Years and over | 0 (0.0%) | 0 (0.0%) |
Disability Class by Sex by Age in Ocotillo
Disability Class: Hearing Difficulty
| Age Bracket | Male | Female |
| Under 5 Years | 0 (0.0%) | 0 (0.0%) |
| 5 to 17 Years | 0 (0.0%) | 0 (0.0%) |
| 18 to 34 Years | 0 (0.0%) | 0 (0.0%) |
| 35 to 64 Years | 0 (0.0%) | 0 (0.0%) |
| 65 to 74 Years | 0 (0.0%) | 0 (0.0%) |
| 75 Years and over | 0 (0.0%) | 0 (0.0%) |
Disability Class: Vision Difficulty
| Age Bracket | Male | Female |
| Under 5 Years | 0 (0.0%) | 0 (0.0%) |
| 5 to 17 Years | 0 (0.0%) | 0 (0.0%) |
| 18 to 34 Years | 0 (0.0%) | 0 (0.0%) |
| 35 to 64 Years | 0 (0.0%) | 0 (0.0%) |
| 65 to 74 Years | 0 (0.0%) | 0 (0.0%) |
| 75 Years and over | 0 (0.0%) | 0 (0.0%) |
Disability Class: Cognitive Difficulty
| Age Bracket | Male | Female |
| 5 to 17 Years | 0 (0.0%) | 0 (0.0%) |
| 18 to 34 Years | 0 (0.0%) | 0 (0.0%) |
| 35 to 64 Years | 0 (0.0%) | 0 (0.0%) |
| 65 to 74 Years | 0 (0.0%) | 0 (0.0%) |
| 75 Years and over | 0 (0.0%) | 0 (0.0%) |
Disability Class: Ambulatory Difficulty
| Age Bracket | Male | Female |
| 5 to 17 Years | 0 (0.0%) | 0 (0.0%) |
| 18 to 34 Years | 0 (0.0%) | 0 (0.0%) |
| 35 to 64 Years | 0 (0.0%) | 0 (0.0%) |
| 65 to 74 Years | 0 (0.0%) | 0 (0.0%) |
| 75 Years and over | 0 (0.0%) | 0 (0.0%) |
Disability Class: Self-Care Difficulty
| Age Bracket | Male | Female |
| 5 to 17 Years | 0 (0.0%) | 0 (0.0%) |
| 18 to 34 Years | 0 (0.0%) | 0 (0.0%) |
| 35 to 64 Years | 0 (0.0%) | 0 (0.0%) |
| 65 to 74 Years | 0 (0.0%) | 0 (0.0%) |
| 75 Years and over | 0 (0.0%) | 0 (0.0%) |
Technology Access in Ocotillo
Computing Device Access in Ocotillo
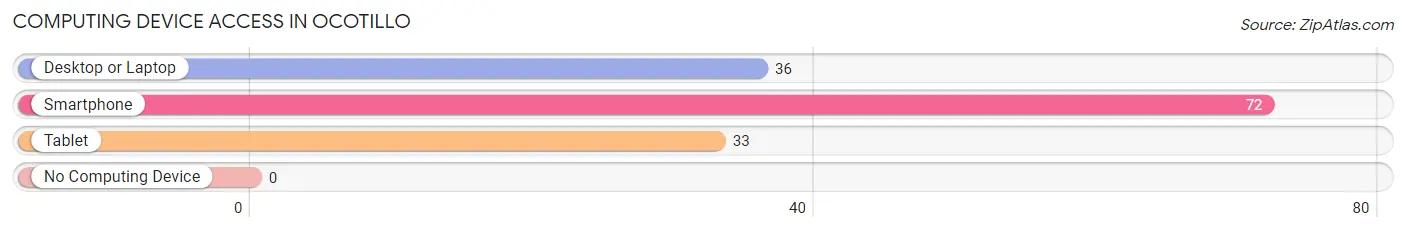
| Device Type | # Households | % Households |
| Desktop or Laptop | 36 | 50.0% |
| Smartphone | 72 | 100.0% |
| Tablet | 33 | 45.8% |
| No Computing Device | 0 | 0.0% |
| Total | 72 | 100.0% |
Internet Access in Ocotillo
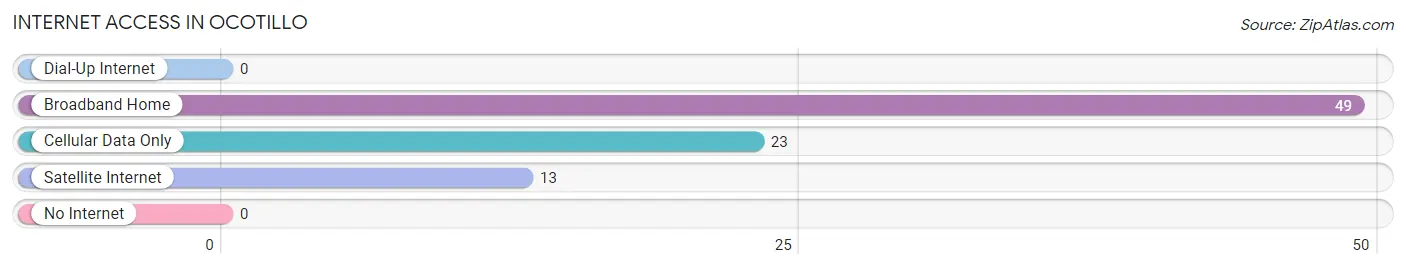
| Internet Type | # Households | % Households |
| Dial-Up Internet | 0 | 0.0% |
| Broadband Home | 49 | 68.1% |
| Cellular Data Only | 23 | 31.9% |
| Satellite Internet | 13 | 18.1% |
| No Internet | 0 | 0.0% |
| Total | 72 | 100.0% |
Ocotillo Summary
Ocotillo is a small unincorporated community located in Imperial County, California. It is situated in the southeastern corner of the state, approximately 30 miles east of El Centro and just south of the U.S.-Mexico border. The town is home to a population of approximately 1,000 people, and is known for its unique desert landscape and its proximity to the Salton Sea.
History
The area that is now Ocotillo was first inhabited by the Kumeyaay people, who lived in the region for thousands of years before the arrival of Europeans. The first Europeans to explore the area were Spanish missionaries, who arrived in the late 1700s. The area was later settled by American ranchers in the late 1800s, and the town of Ocotillo was officially established in 1902.
The town was named after the ocotillo cactus, which is native to the region. The town grew slowly over the years, and by the 1950s it had a population of around 500 people. In the 1960s, the town began to experience a population boom as people moved to the area to take advantage of the nearby agricultural opportunities.
Geography
Ocotillo is located in the southeastern corner of California, approximately 30 miles east of El Centro and just south of the U.S.-Mexico border. The town is situated in the Sonoran Desert, and is surrounded by a unique desert landscape. The area is characterized by low-lying hills, sandy washes, and a variety of cacti and other desert plants.
The town is located near the Salton Sea, a large saline lake that was created in 1905 when the Colorado River flooded the area. The lake is a popular destination for birdwatchers, and is home to a variety of species of birds, fish, and other wildlife.
Economy
The economy of Ocotillo is largely based on agriculture. The town is located in an area that is known for its fertile soil, and the surrounding area is home to a variety of crops, including alfalfa, cotton, and vegetables. The town is also home to a number of small businesses, including restaurants, shops, and other services.
Demographics
As of the 2010 census, the population of Ocotillo was 1,000 people. The town is predominantly Hispanic, with approximately 90% of the population identifying as Hispanic or Latino. The median household income in the town is $30,000, and the median age is 33 years old.
Conclusion
Ocotillo is a small unincorporated community located in Imperial County, California. It is situated in the southeastern corner of the state, approximately 30 miles east of El Centro and just south of the U.S.-Mexico border. The town is home to a population of approximately 1,000 people, and is known for its unique desert landscape and its proximity to the Salton Sea. The economy of Ocotillo is largely based on agriculture, and the town is predominantly Hispanic. Ocotillo is a unique and interesting place to visit, and is a great destination for those looking to explore the beauty of the Sonoran Desert.
Common Questions
What is Per Capita Income in Ocotillo?
Per Capita income in Ocotillo is $12,340.
What is the Median Family Income in Ocotillo?
Median Family Income in Ocotillo is $20,761.
What is the Median Household income in Ocotillo?
Median Household Income in Ocotillo is $20,761.
What is Inequality or Gini Index in Ocotillo?
Inequality or Gini Index in Ocotillo is 0.33.
What is the Total Population of Ocotillo?
Total Population of Ocotillo is 146.
What is the Total Male Population of Ocotillo?
Total Male Population of Ocotillo is 96.
What is the Total Female Population of Ocotillo?
Total Female Population of Ocotillo is 50.
What is the Ratio of Males per 100 Females in Ocotillo?
There are 192.00 Males per 100 Females in Ocotillo.
What is the Ratio of Females per 100 Males in Ocotillo?
There are 52.08 Females per 100 Males in Ocotillo.
What is the Median Population Age in Ocotillo?
Median Population Age in Ocotillo is 58.3 Years.
What is the Average Family Size in Ocotillo
Average Family Size in Ocotillo is 2.0 People.
What is the Average Household Size in Ocotillo
Average Household Size in Ocotillo is 2.0 People.
How Large is the Labor Force in Ocotillo?
There are 22 People in the Labor Forcein in Ocotillo.
What is the Percentage of People in the Labor Force in Ocotillo?
15.1% of People are in the Labor Force in Ocotillo.
What is the Unemployment Rate in Ocotillo?
Unemployment Rate in Ocotillo is 100.0%.