Riverside, MD Map & Demographics
Riverside Map
Riverside Overview
$44,828
PER CAPITA INCOME
$110,077
AVG FAMILY INCOME
$91,842
AVG HOUSEHOLD INCOME
8.7%
WAGE / INCOME GAP [ % ]
91.3¢/ $1
WAGE / INCOME GAP [ $ ]
0.34
INEQUALITY / GINI INDEX
5,924
TOTAL POPULATION
3,013
MALE POPULATION
2,911
FEMALE POPULATION
103.50
MALES / 100 FEMALES
96.61
FEMALES / 100 MALES
35.5
MEDIAN AGE
2.9
AVG FAMILY SIZE
2.2
AVG HOUSEHOLD SIZE
3,890
LABOR FORCE [ PEOPLE ]
78.8%
PERCENT IN LABOR FORCE
1.1%
UNEMPLOYMENT RATE
Income in Riverside
Income Overview in Riverside
Per Capita Income in Riverside is $44,828, while median incomes of families and households are $110,077 and $91,842 respectively.
| Characteristic | Number | Measure |
| Per Capita Income | 5,924 | $44,828 |
| Median Family Income | 1,378 | $110,077 |
| Mean Family Income | 1,378 | $111,330 |
| Median Household Income | 2,604 | $91,842 |
| Mean Household Income | 2,604 | $99,268 |
| Income Deficit | 1,378 | $0 |
| Wage / Income Gap (%) | 5,924 | 8.72% |
| Wage / Income Gap ($) | 5,924 | 91.28¢ per $1 |
| Gini / Inequality Index | 5,924 | 0.34 |
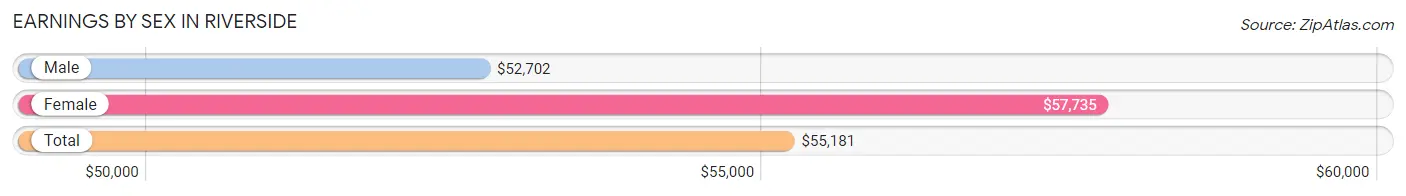
Earnings by Sex in Riverside
Average Earnings in Riverside are $55,181, $52,702 for men and $57,735 for women, a difference of 8.7%.
| Sex | Number | Average Earnings |
| Male | 2,125 (53.3%) | $52,702 |
| Female | 1,864 (46.7%) | $57,735 |
| Total | 3,989 (100.0%) | $55,181 |
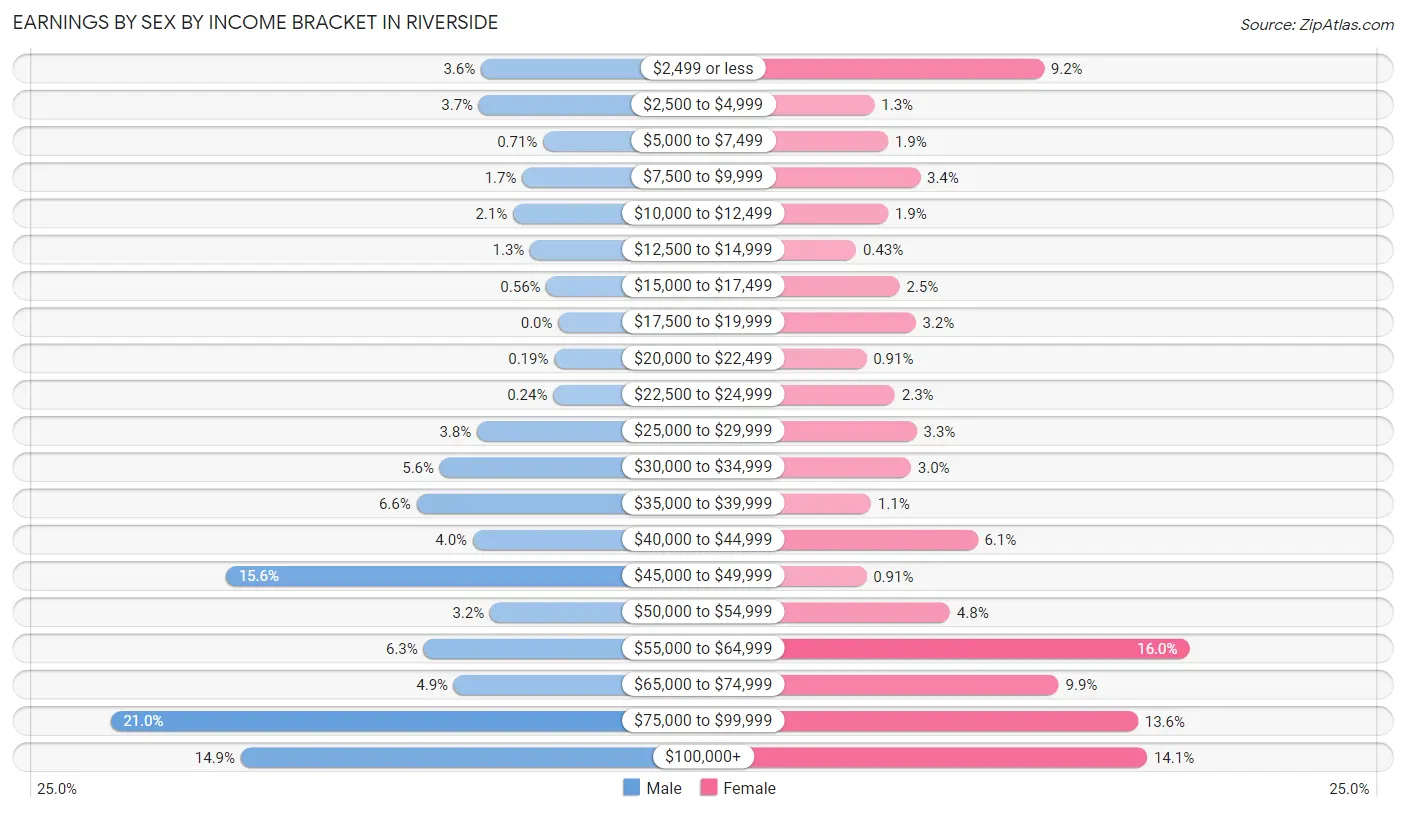
Earnings by Sex by Income Bracket in Riverside
The most common earnings brackets in Riverside are $75,000 to $99,999 for men (446 | 21.0%) and $55,000 to $64,999 for women (299 | 16.0%).
| Income | Male | Female |
| $2,499 or less | 77 (3.6%) | 172 (9.2%) |
| $2,500 to $4,999 | 79 (3.7%) | 24 (1.3%) |
| $5,000 to $7,499 | 15 (0.7%) | 36 (1.9%) |
| $7,500 to $9,999 | 36 (1.7%) | 64 (3.4%) |
| $10,000 to $12,499 | 45 (2.1%) | 36 (1.9%) |
| $12,500 to $14,999 | 28 (1.3%) | 8 (0.4%) |
| $15,000 to $17,499 | 12 (0.6%) | 46 (2.5%) |
| $17,500 to $19,999 | 0 (0.0%) | 60 (3.2%) |
| $20,000 to $22,499 | 4 (0.2%) | 17 (0.9%) |
| $22,500 to $24,999 | 5 (0.2%) | 42 (2.2%) |
| $25,000 to $29,999 | 81 (3.8%) | 61 (3.3%) |
| $30,000 to $34,999 | 118 (5.6%) | 56 (3.0%) |
| $35,000 to $39,999 | 141 (6.6%) | 21 (1.1%) |
| $40,000 to $44,999 | 85 (4.0%) | 114 (6.1%) |
| $45,000 to $49,999 | 331 (15.6%) | 17 (0.9%) |
| $50,000 to $54,999 | 68 (3.2%) | 90 (4.8%) |
| $55,000 to $64,999 | 134 (6.3%) | 299 (16.0%) |
| $65,000 to $74,999 | 104 (4.9%) | 185 (9.9%) |
| $75,000 to $99,999 | 446 (21.0%) | 254 (13.6%) |
| $100,000+ | 316 (14.9%) | 262 (14.1%) |
| Total | 2,125 (100.0%) | 1,864 (100.0%) |
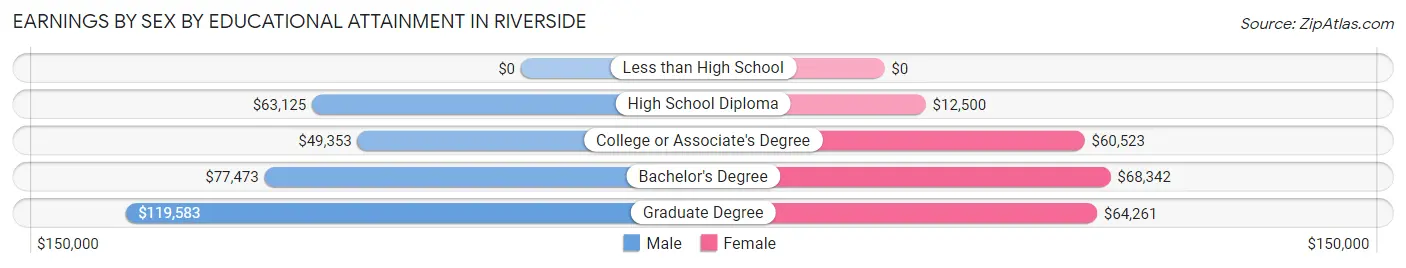
Earnings by Sex by Educational Attainment in Riverside
Average earnings in Riverside are $64,425 for men and $59,412 for women, a difference of 7.8%. Men with an educational attainment of graduate degree enjoy the highest average annual earnings of $119,583, while those with college or associate's degree education earn the least with $49,353. Women with an educational attainment of bachelor's degree earn the most with the average annual earnings of $68,342, while those with high school diploma education have the smallest earnings of $12,500.
| Educational Attainment | Male Income | Female Income |
| Less than High School | - | - |
| High School Diploma | $63,125 | $12,500 |
| College or Associate's Degree | $49,353 | $60,523 |
| Bachelor's Degree | $77,473 | $68,342 |
| Graduate Degree | $119,583 | $64,261 |
| Total | $64,425 | $59,412 |
Family Income in Riverside
Family Income Brackets in Riverside
According to the Riverside family income data, there are 462 families falling into the $100,000 to $149,999 income range, which is the most common income bracket and makes up 33.5% of all families.
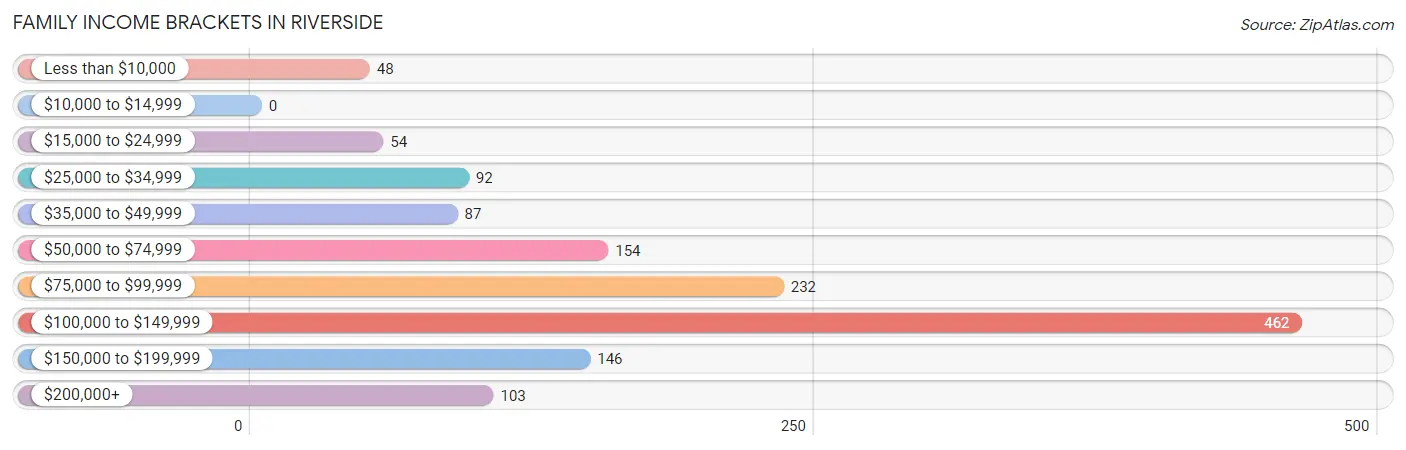
| Income Bracket | # Families | % Families |
| Less than $10,000 | 48 | 3.5% |
| $10,000 to $14,999 | 0 | 0.0% |
| $15,000 to $24,999 | 54 | 3.9% |
| $25,000 to $34,999 | 92 | 6.7% |
| $35,000 to $49,999 | 87 | 6.3% |
| $50,000 to $74,999 | 154 | 11.2% |
| $75,000 to $99,999 | 232 | 16.8% |
| $100,000 to $149,999 | 462 | 33.5% |
| $150,000 to $199,999 | 146 | 10.6% |
| $200,000+ | 103 | 7.5% |
Family Income by Famaliy Size in Riverside
4-person families (246 | 17.8%) account for the highest median family income in Riverside with $131,346 per family, while 2-person families (656 | 47.6%) have the highest median income of $41,098 per family member.
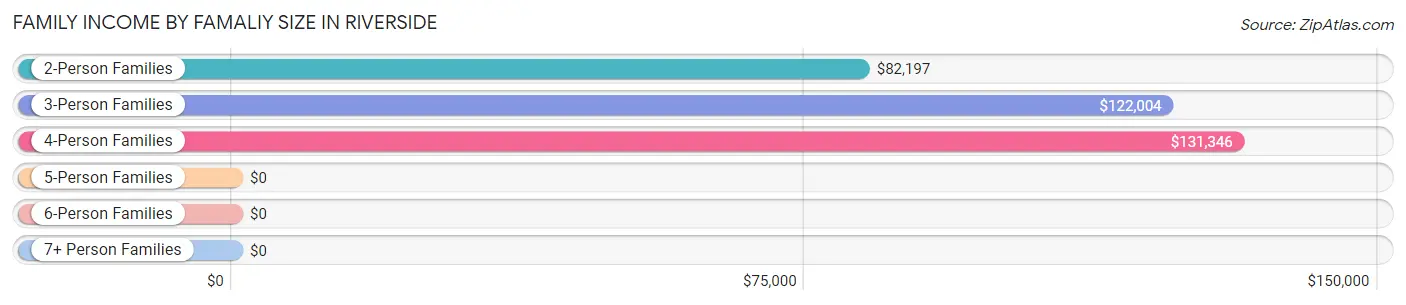
| Income Bracket | # Families | Median Income |
| 2-Person Families | 656 (47.6%) | $82,197 |
| 3-Person Families | 377 (27.4%) | $122,004 |
| 4-Person Families | 246 (17.8%) | $131,346 |
| 5-Person Families | 50 (3.6%) | $0 |
| 6-Person Families | 38 (2.8%) | $0 |
| 7+ Person Families | 11 (0.8%) | $0 |
| Total | 1,378 (100.0%) | $110,077 |
Family Income by Number of Earners in Riverside
The median family income in Riverside is $110,077, with families comprising 3+ earners (222) having the highest median family income of $137,083, while families with no earners (226) have the lowest median family income of $30,926, accounting for 16.1% and 16.4% of families, respectively.
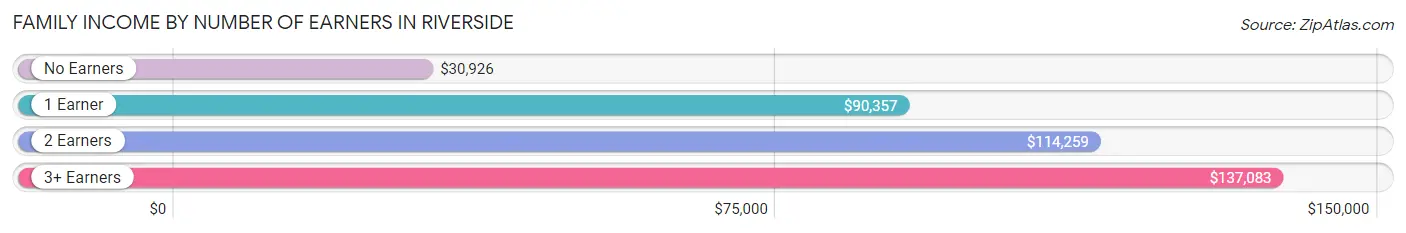
| Number of Earners | # Families | Median Income |
| No Earners | 226 (16.4%) | $30,926 |
| 1 Earner | 248 (18.0%) | $90,357 |
| 2 Earners | 682 (49.5%) | $114,259 |
| 3+ Earners | 222 (16.1%) | $137,083 |
| Total | 1,378 (100.0%) | $110,077 |
Household Income in Riverside
Household Income Brackets in Riverside
With 810 households falling in the category, the $100,000 to $149,999 income range is the most frequent in Riverside, accounting for 31.1% of all households. In contrast, only 13 households (0.5%) fall into the $10,000 to $14,999 income bracket, making it the least populous group.
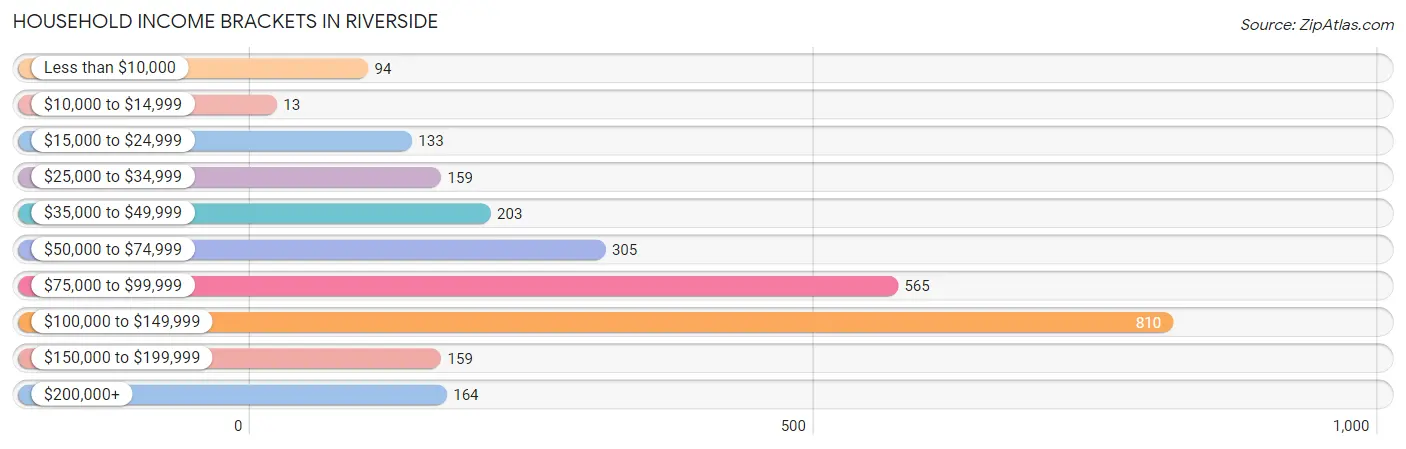
| Income Bracket | # Households | % Households |
| Less than $10,000 | 94 | 3.6% |
| $10,000 to $14,999 | 13 | 0.5% |
| $15,000 to $24,999 | 133 | 5.1% |
| $25,000 to $34,999 | 159 | 6.1% |
| $35,000 to $49,999 | 203 | 7.8% |
| $50,000 to $74,999 | 305 | 11.7% |
| $75,000 to $99,999 | 565 | 21.7% |
| $100,000 to $149,999 | 810 | 31.1% |
| $150,000 to $199,999 | 159 | 6.1% |
| $200,000+ | 164 | 6.3% |
Household Income by Householder Age in Riverside
The median household income in Riverside is $91,842, with the highest median household income of $103,956 found in the 45 to 64 years age bracket for the primary householder. A total of 841 households (32.3%) fall into this category. Meanwhile, the 65+ years age bracket for the primary householder has the lowest median household income of $39,821, with 404 households (15.5%) in this group.
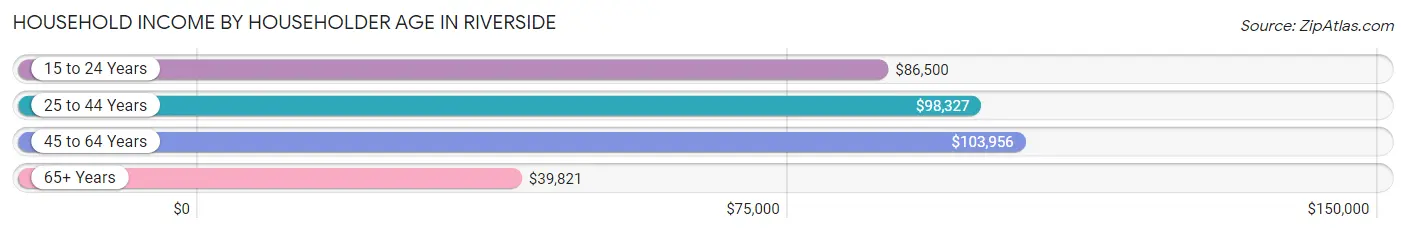
| Income Bracket | # Households | Median Income |
| 15 to 24 Years | 280 (10.7%) | $86,500 |
| 25 to 44 Years | 1,079 (41.4%) | $98,327 |
| 45 to 64 Years | 841 (32.3%) | $103,956 |
| 65+ Years | 404 (15.5%) | $39,821 |
| Total | 2,604 (100.0%) | $91,842 |
Poverty in Riverside
Income Below Poverty by Sex and Age in Riverside
With 7.1% poverty level for males and 6.7% for females among the residents of Riverside, 6 to 11 year old males and 6 to 11 year old females are the most vulnerable to poverty, with 43 males (17.8%) and 50 females (28.7%) in their respective age groups living below the poverty level.
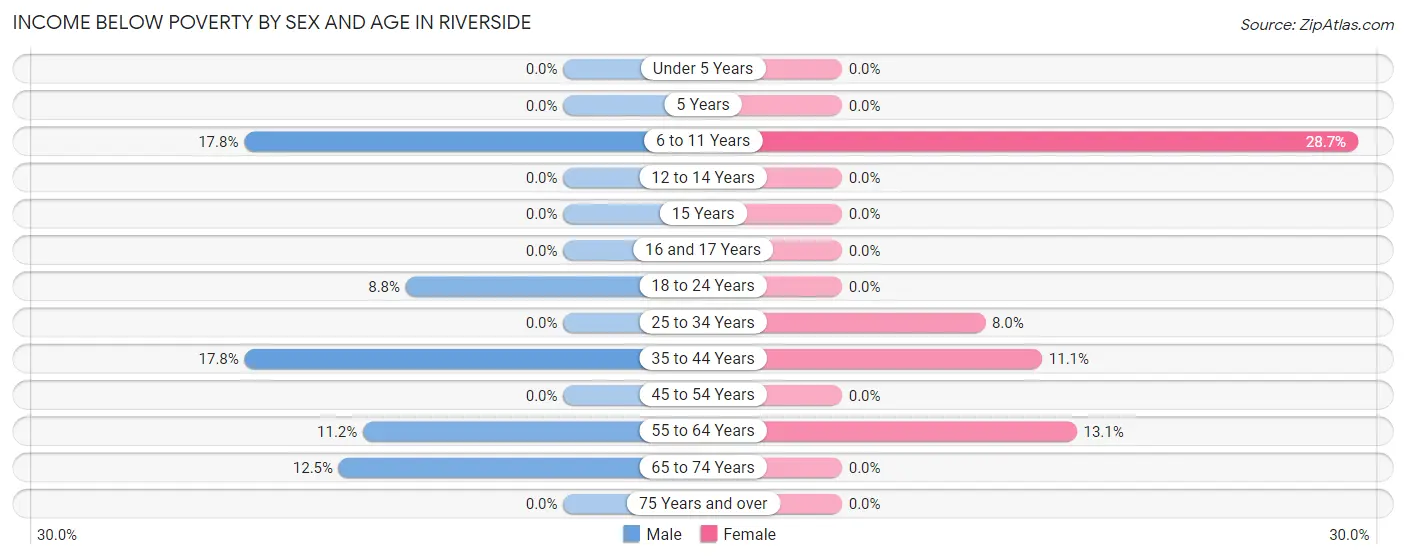
| Age Bracket | Male | Female |
| Under 5 Years | 0 (0.0%) | 0 (0.0%) |
| 5 Years | 0 (0.0%) | 0 (0.0%) |
| 6 to 11 Years | 43 (17.8%) | 50 (28.7%) |
| 12 to 14 Years | 0 (0.0%) | 0 (0.0%) |
| 15 Years | 0 (0.0%) | 0 (0.0%) |
| 16 and 17 Years | 0 (0.0%) | 0 (0.0%) |
| 18 to 24 Years | 35 (8.8%) | 0 (0.0%) |
| 25 to 34 Years | 0 (0.0%) | 40 (8.0%) |
| 35 to 44 Years | 74 (17.7%) | 48 (11.1%) |
| 45 to 54 Years | 0 (0.0%) | 0 (0.0%) |
| 55 to 64 Years | 35 (11.2%) | 52 (13.1%) |
| 65 to 74 Years | 27 (12.5%) | 0 (0.0%) |
| 75 Years and over | 0 (0.0%) | 0 (0.0%) |
| Total | 214 (7.1%) | 190 (6.7%) |
Income Above Poverty by Sex and Age in Riverside
According to the poverty statistics in Riverside, males aged under 5 years and females aged under 5 years are the age groups that are most secure financially, with 100.0% of males and 100.0% of females in these age groups living above the poverty line.
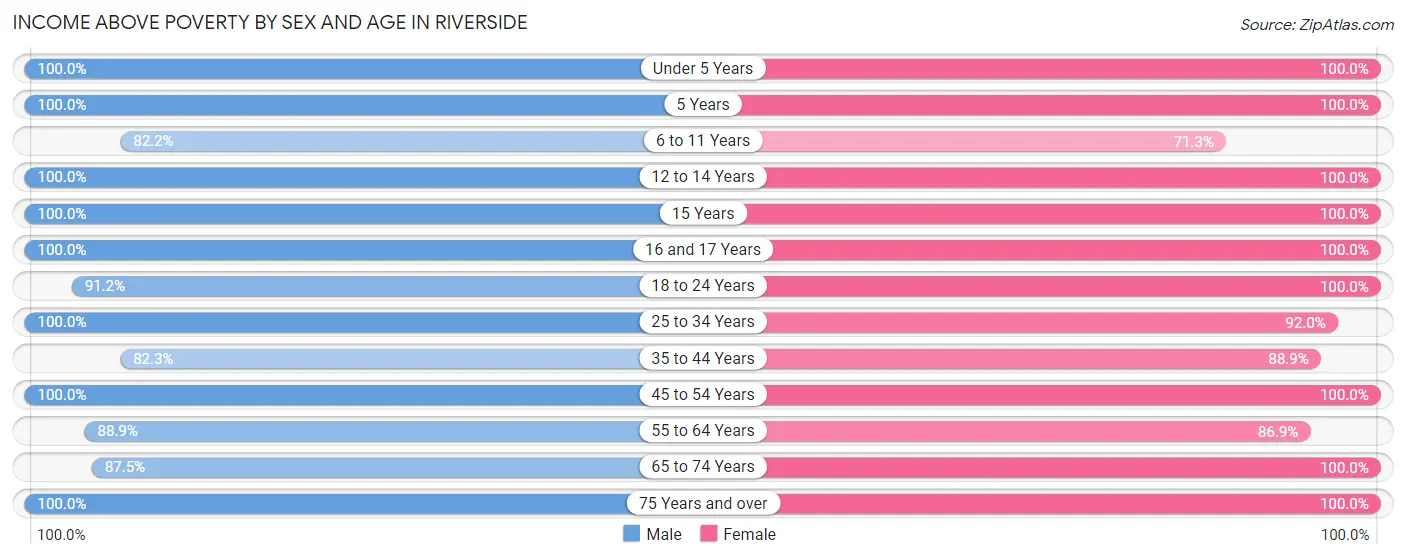
| Age Bracket | Male | Female |
| Under 5 Years | 171 (100.0%) | 92 (100.0%) |
| 5 Years | 35 (100.0%) | 53 (100.0%) |
| 6 to 11 Years | 199 (82.2%) | 124 (71.3%) |
| 12 to 14 Years | 98 (100.0%) | 40 (100.0%) |
| 15 Years | 26 (100.0%) | 57 (100.0%) |
| 16 and 17 Years | 37 (100.0%) | 65 (100.0%) |
| 18 to 24 Years | 364 (91.2%) | 261 (100.0%) |
| 25 to 34 Years | 676 (100.0%) | 462 (92.0%) |
| 35 to 44 Years | 343 (82.3%) | 383 (88.9%) |
| 45 to 54 Years | 284 (100.0%) | 419 (100.0%) |
| 55 to 64 Years | 279 (88.8%) | 346 (86.9%) |
| 65 to 74 Years | 189 (87.5%) | 207 (100.0%) |
| 75 Years and over | 88 (100.0%) | 123 (100.0%) |
| Total | 2,789 (92.9%) | 2,632 (93.3%) |
Income Below Poverty Among Married-Couple Families in Riverside
The poverty statistics for married-couple families in Riverside show that 3.5% or 41 of the total 1,174 families live below the poverty line. Families with 1 or 2 children have the highest poverty rate of 8.7%, comprising of 41 families. On the other hand, families with no children have the lowest poverty rate of 0.0%, which includes 0 families.
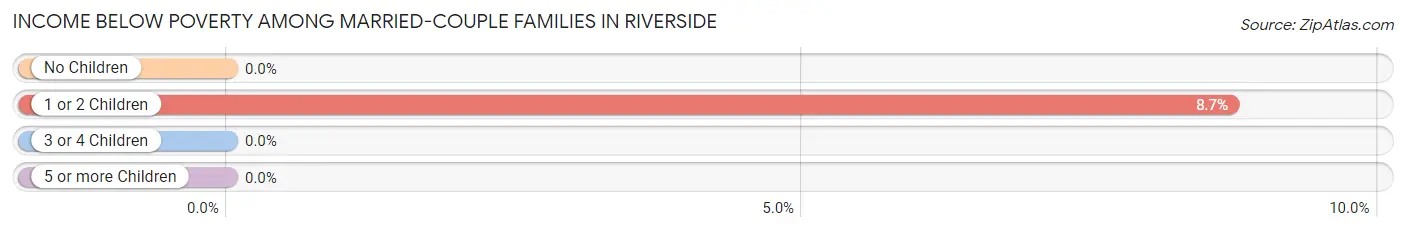
| Children | Above Poverty | Below Poverty |
| No Children | 672 (100.0%) | 0 (0.0%) |
| 1 or 2 Children | 429 (91.3%) | 41 (8.7%) |
| 3 or 4 Children | 21 (100.0%) | 0 (0.0%) |
| 5 or more Children | 11 (100.0%) | 0 (0.0%) |
| Total | 1,133 (96.5%) | 41 (3.5%) |
Income Below Poverty Among Single-Parent Households in Riverside
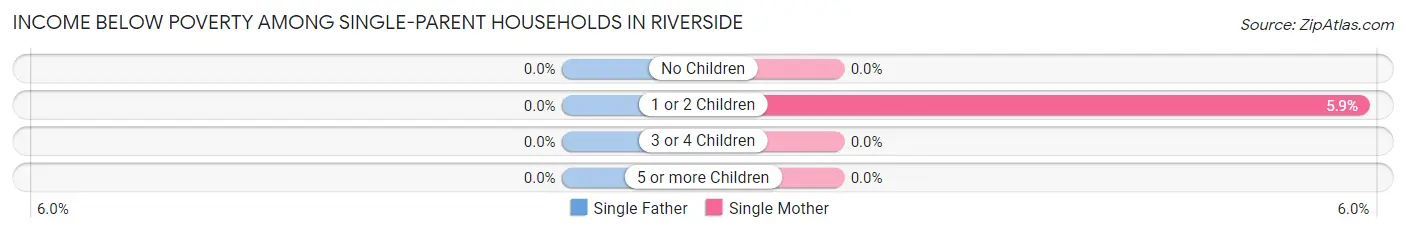
| Children | Single Father | Single Mother |
| No Children | 0 (0.0%) | 0 (0.0%) |
| 1 or 2 Children | 0 (0.0%) | 7 (5.9%) |
| 3 or 4 Children | 0 (0.0%) | 0 (0.0%) |
| 5 or more Children | 0 (0.0%) | 0 (0.0%) |
| Total | 0 (0.0%) | 7 (4.0%) |
Income Below Poverty Among Married-Couple vs Single-Parent Households in Riverside
The poverty data for Riverside shows that 41 of the married-couple family households (3.5%) and 7 of the single-parent households (3.4%) are living below the poverty level. Within the married-couple family households, those with 1 or 2 children have the highest poverty rate, with 41 households (8.7%) falling below the poverty line. Among the single-parent households, those with 1 or 2 children have the highest poverty rate, with 7 household (4.8%) living below poverty.
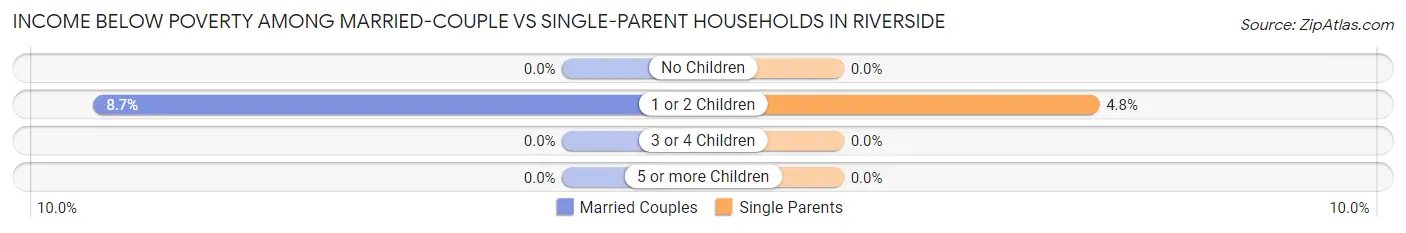
| Children | Married-Couple Families | Single-Parent Households |
| No Children | 0 (0.0%) | 0 (0.0%) |
| 1 or 2 Children | 41 (8.7%) | 7 (4.8%) |
| 3 or 4 Children | 0 (0.0%) | 0 (0.0%) |
| 5 or more Children | 0 (0.0%) | 0 (0.0%) |
| Total | 41 (3.5%) | 7 (3.4%) |
Race in Riverside
The most populous races in Riverside are White / Caucasian (4,222 | 71.3%), Black / African American (1,188 | 20.1%), and Two or more Races (247 | 4.2%).
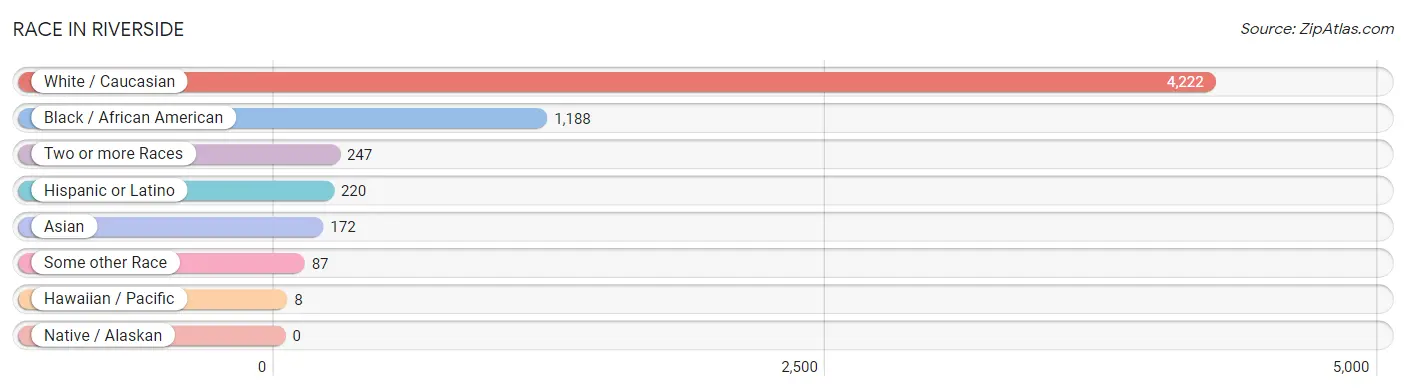
| Race | # Population | % Population |
| Asian | 172 | 2.9% |
| Black / African American | 1,188 | 20.1% |
| Hawaiian / Pacific | 8 | 0.1% |
| Hispanic or Latino | 220 | 3.7% |
| Native / Alaskan | 0 | 0.0% |
| White / Caucasian | 4,222 | 71.3% |
| Two or more Races | 247 | 4.2% |
| Some other Race | 87 | 1.5% |
| Total | 5,924 | 100.0% |
Ancestry in Riverside
The most populous ancestries reported in Riverside are Irish (1,098 | 18.5%), German (870 | 14.7%), Italian (650 | 11.0%), English (525 | 8.9%), and Polish (416 | 7.0%), together accounting for 60.1% of all Riverside residents.
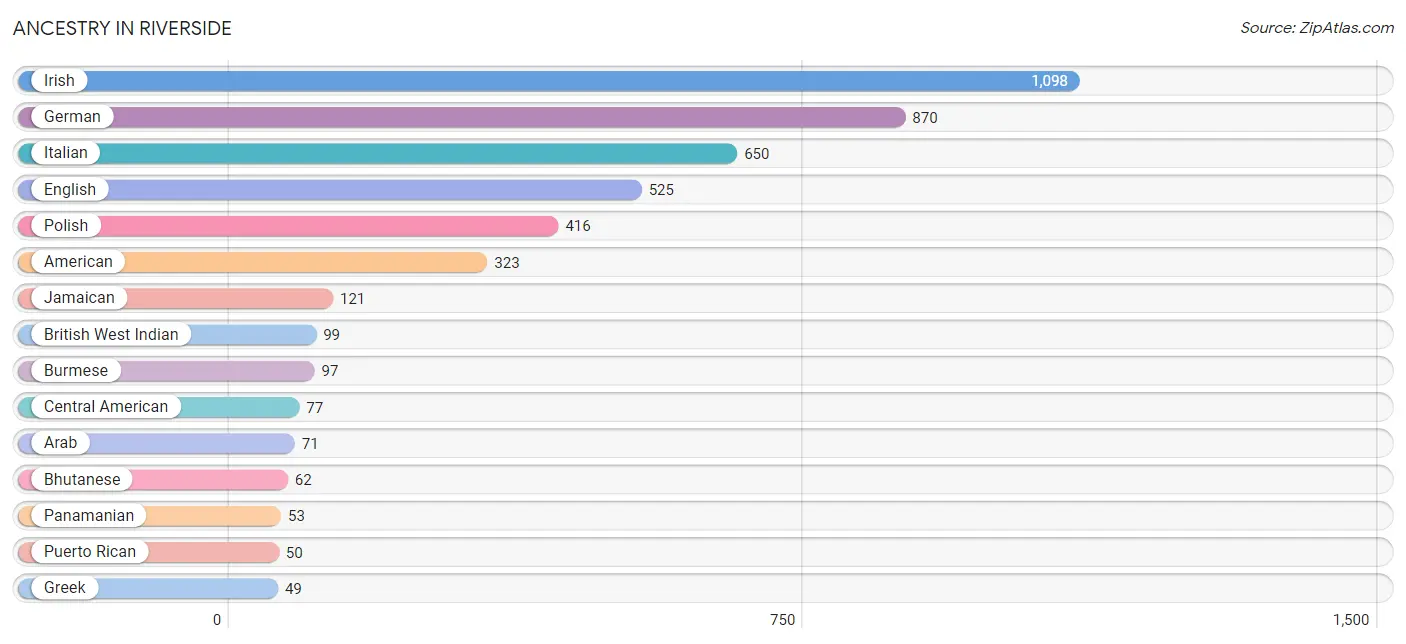
| Ancestry | # Population | % Population |
| African | 46 | 0.8% |
| American | 323 | 5.4% |
| Arab | 71 | 1.2% |
| Australian | 12 | 0.2% |
| Belgian | 11 | 0.2% |
| Bhutanese | 62 | 1.1% |
| Blackfeet | 18 | 0.3% |
| British West Indian | 99 | 1.7% |
| Bulgarian | 18 | 0.3% |
| Burmese | 97 | 1.6% |
| Central American | 77 | 1.3% |
| Cherokee | 12 | 0.2% |
| Chilean | 37 | 0.6% |
| Cuban | 18 | 0.3% |
| Dutch | 47 | 0.8% |
| Eastern European | 25 | 0.4% |
| English | 525 | 8.9% |
| European | 40 | 0.7% |
| Filipino | 12 | 0.2% |
| French | 47 | 0.8% |
| French Canadian | 28 | 0.5% |
| German | 870 | 14.7% |
| Greek | 49 | 0.8% |
| Guamanian / Chamorro | 41 | 0.7% |
| Irish | 1,098 | 18.5% |
| Italian | 650 | 11.0% |
| Jamaican | 121 | 2.0% |
| Korean | 31 | 0.5% |
| Lebanese | 41 | 0.7% |
| Mexican | 38 | 0.6% |
| Panamanian | 53 | 0.9% |
| Polish | 416 | 7.0% |
| Portuguese | 8 | 0.1% |
| Puerto Rican | 50 | 0.8% |
| Russian | 28 | 0.5% |
| Salvadoran | 24 | 0.4% |
| Scandinavian | 24 | 0.4% |
| Scotch-Irish | 11 | 0.2% |
| Scottish | 5 | 0.1% |
| Slovak | 41 | 0.7% |
| South American | 37 | 0.6% |
| Sri Lankan | 25 | 0.4% |
| Subsaharan African | 46 | 0.8% |
| Syrian | 30 | 0.5% |
| Ukrainian | 8 | 0.1% | View All 45 Rows |
Immigrants in Riverside
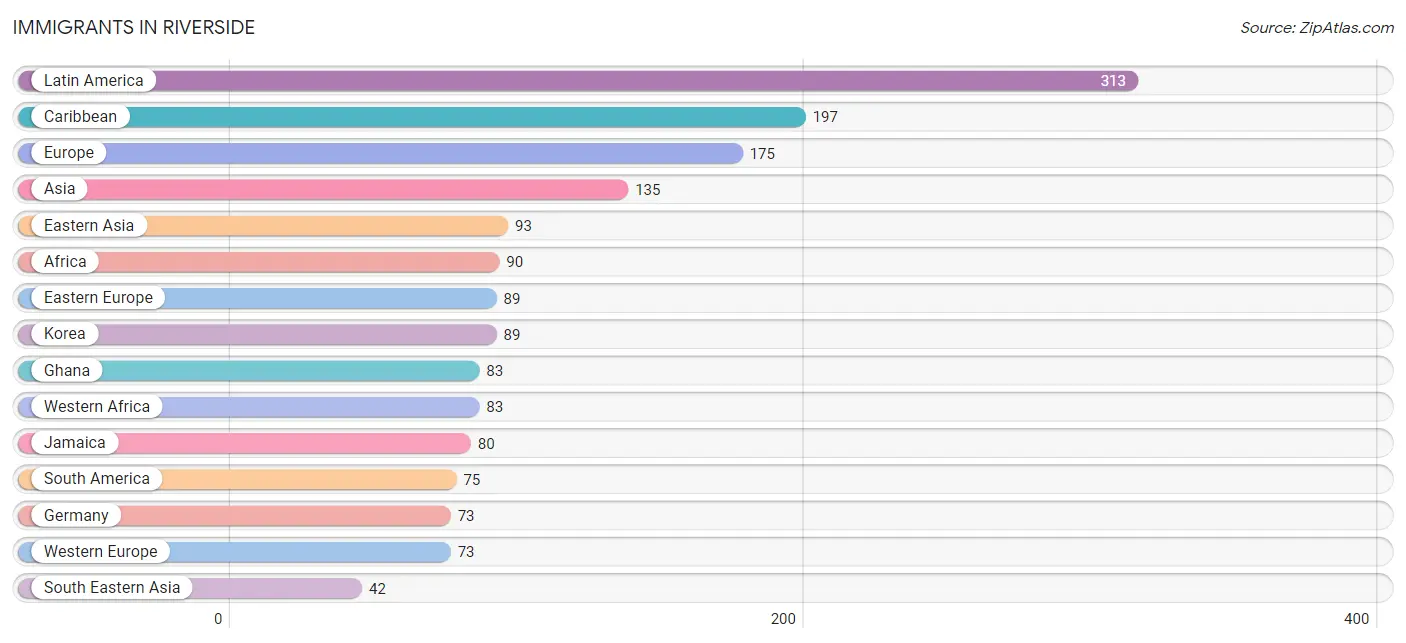
The most numerous immigrant groups reported in Riverside came from Latin America (313 | 5.3%), Caribbean (197 | 3.3%), Europe (175 | 2.9%), Asia (135 | 2.3%), and Eastern Asia (93 | 1.6%), together accounting for 15.4% of all Riverside residents.
| Immigration Origin | # Population | % Population |
| Africa | 90 | 1.5% |
| Asia | 135 | 2.3% |
| Australia | 12 | 0.2% |
| Caribbean | 197 | 3.3% |
| Central America | 41 | 0.7% |
| Chile | 37 | 0.6% |
| China | 2 | 0.0% |
| Cuba | 18 | 0.3% |
| Czechoslovakia | 41 | 0.7% |
| Eastern Africa | 7 | 0.1% |
| Eastern Asia | 93 | 1.6% |
| Eastern Europe | 89 | 1.5% |
| El Salvador | 24 | 0.4% |
| England | 13 | 0.2% |
| Europe | 175 | 2.9% |
| Germany | 73 | 1.2% |
| Ghana | 83 | 1.4% |
| Jamaica | 80 | 1.3% |
| Japan | 2 | 0.0% |
| Kenya | 7 | 0.1% |
| Korea | 89 | 1.5% |
| Latin America | 313 | 5.3% |
| Northern Europe | 13 | 0.2% |
| Oceania | 12 | 0.2% |
| Panama | 17 | 0.3% |
| Peru | 38 | 0.6% |
| Philippines | 31 | 0.5% |
| Poland | 40 | 0.7% |
| South America | 75 | 1.3% |
| South Eastern Asia | 42 | 0.7% |
| St. Vincent and the Grenadines | 10 | 0.2% |
| Taiwan | 2 | 0.0% |
| Ukraine | 8 | 0.1% |
| Vietnam | 11 | 0.2% |
| Western Africa | 83 | 1.4% |
| Western Europe | 73 | 1.2% | View All 36 Rows |
Sex and Age in Riverside
Sex and Age in Riverside
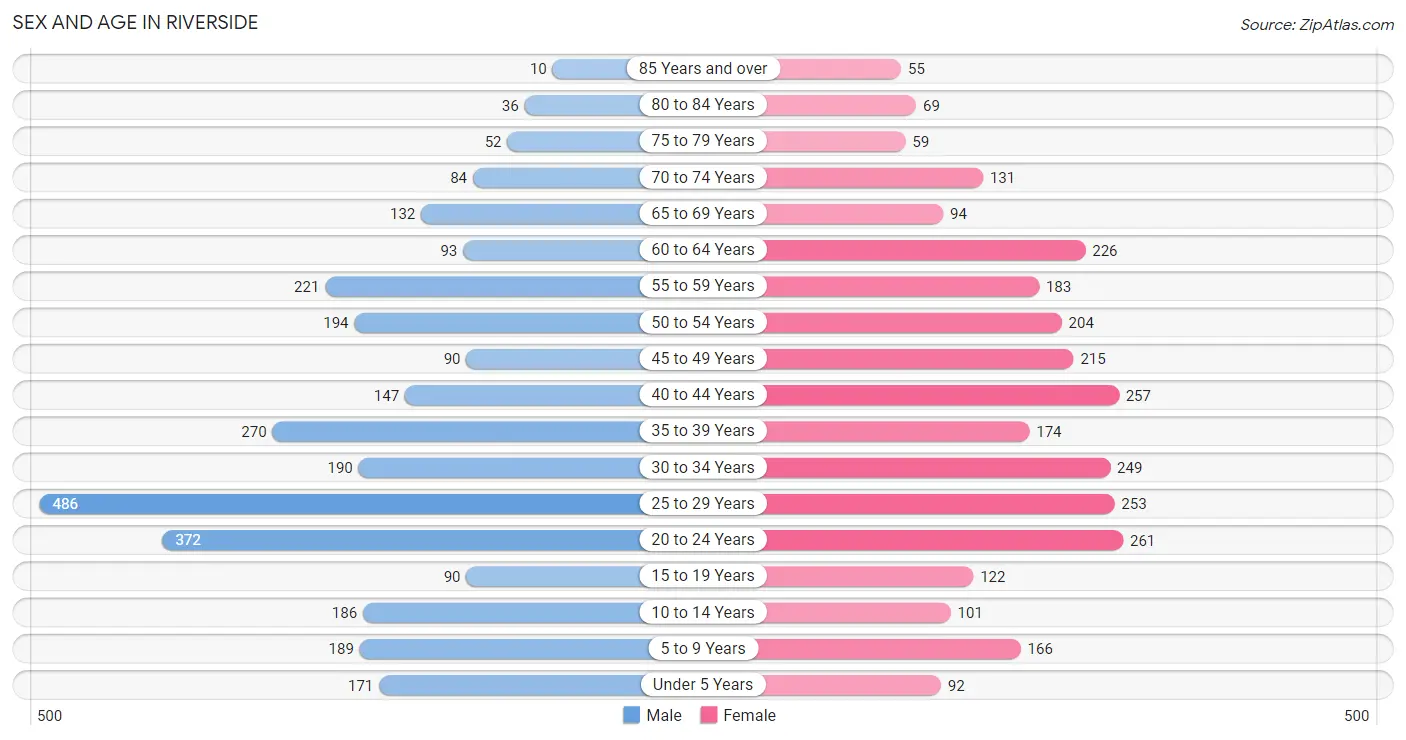
The most populous age groups in Riverside are 25 to 29 Years (486 | 16.1%) for men and 20 to 24 Years (261 | 9.0%) for women.
| Age Bracket | Male | Female |
| Under 5 Years | 171 (5.7%) | 92 (3.2%) |
| 5 to 9 Years | 189 (6.3%) | 166 (5.7%) |
| 10 to 14 Years | 186 (6.2%) | 101 (3.5%) |
| 15 to 19 Years | 90 (3.0%) | 122 (4.2%) |
| 20 to 24 Years | 372 (12.3%) | 261 (9.0%) |
| 25 to 29 Years | 486 (16.1%) | 253 (8.7%) |
| 30 to 34 Years | 190 (6.3%) | 249 (8.6%) |
| 35 to 39 Years | 270 (9.0%) | 174 (6.0%) |
| 40 to 44 Years | 147 (4.9%) | 257 (8.8%) |
| 45 to 49 Years | 90 (3.0%) | 215 (7.4%) |
| 50 to 54 Years | 194 (6.4%) | 204 (7.0%) |
| 55 to 59 Years | 221 (7.3%) | 183 (6.3%) |
| 60 to 64 Years | 93 (3.1%) | 226 (7.8%) |
| 65 to 69 Years | 132 (4.4%) | 94 (3.2%) |
| 70 to 74 Years | 84 (2.8%) | 131 (4.5%) |
| 75 to 79 Years | 52 (1.7%) | 59 (2.0%) |
| 80 to 84 Years | 36 (1.2%) | 69 (2.4%) |
| 85 Years and over | 10 (0.3%) | 55 (1.9%) |
| Total | 3,013 (100.0%) | 2,911 (100.0%) |
Families and Households in Riverside
Median Family Size in Riverside
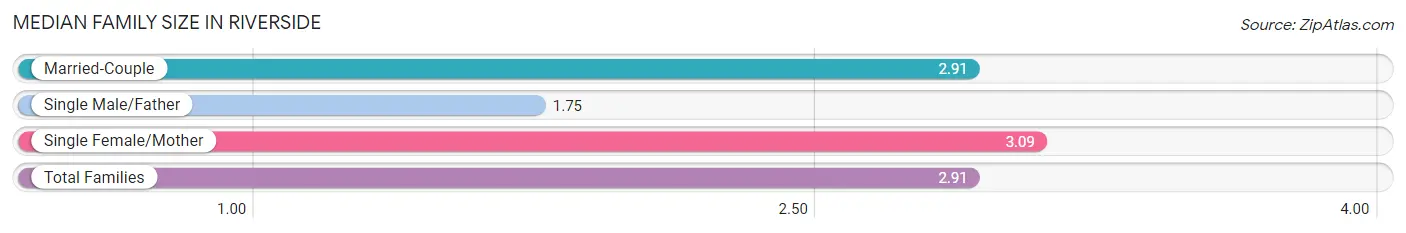
The median family size in Riverside is 2.91 persons per family, with single female/mother families (176 | 12.8%) accounting for the largest median family size of 3.09 persons per family. On the other hand, single male/father families (28 | 2.0%) represent the smallest median family size with 1.75 persons per family.
| Family Type | # Families | Family Size |
| Married-Couple | 1,174 (85.2%) | 2.91 |
| Single Male/Father | 28 (2.0%) | 1.75 |
| Single Female/Mother | 176 (12.8%) | 3.09 |
| Total Families | 1,378 (100.0%) | 2.91 |
Median Household Size in Riverside
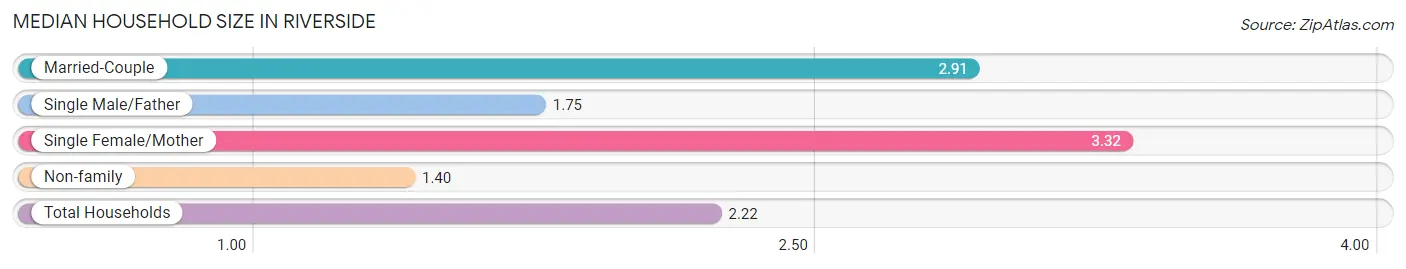
The median household size in Riverside is 2.22 persons per household, with single female/mother households (176 | 6.8%) accounting for the largest median household size of 3.32 persons per household. non-family households (1,226 | 47.1%) represent the smallest median household size with 1.40 persons per household.
| Household Type | # Households | Household Size |
| Married-Couple | 1,174 (45.1%) | 2.91 |
| Single Male/Father | 28 (1.1%) | 1.75 |
| Single Female/Mother | 176 (6.8%) | 3.32 |
| Non-family | 1,226 (47.1%) | 1.40 |
| Total Households | 2,604 (100.0%) | 2.22 |
Household Size by Marriage Status in Riverside
Out of a total of 2,604 households in Riverside, 1,378 (52.9%) are family households, while 1,226 (47.1%) are nonfamily households. The most numerous type of family households are 2-person households, comprising 640, and the most common type of nonfamily households are 1-person households, comprising 922.
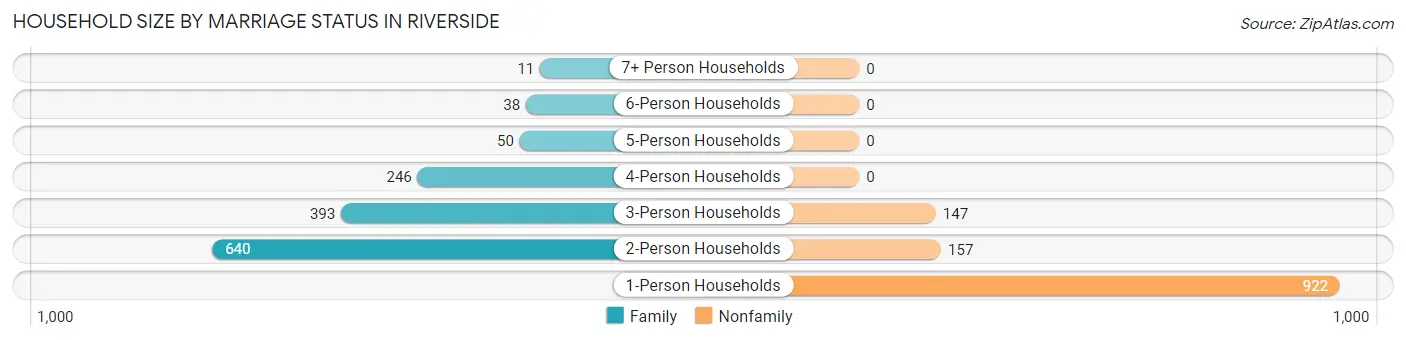
| Household Size | Family Households | Nonfamily Households |
| 1-Person Households | - | 922 (35.4%) |
| 2-Person Households | 640 (24.6%) | 157 (6.0%) |
| 3-Person Households | 393 (15.1%) | 147 (5.7%) |
| 4-Person Households | 246 (9.5%) | 0 (0.0%) |
| 5-Person Households | 50 (1.9%) | 0 (0.0%) |
| 6-Person Households | 38 (1.5%) | 0 (0.0%) |
| 7+ Person Households | 11 (0.4%) | 0 (0.0%) |
| Total | 1,378 (52.9%) | 1,226 (47.1%) |
Female Fertility in Riverside
Fertility by Age in Riverside
Average fertility rate in Riverside is 71.0 births per 1,000 women. Women in the age bracket of 35 to 50 years have the highest fertility rate with 92.0 births per 1,000 women. Women in the age bracket of 35 to 50 years acount for 58.6% of all women with births.
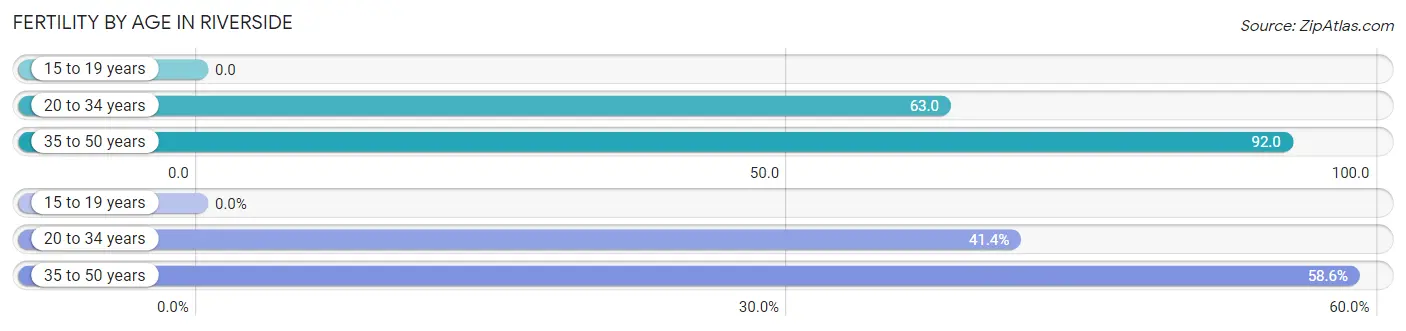
| Age Bracket | Women with Births | Births / 1,000 Women |
| 15 to 19 years | 0 (0.0%) | 0.0 |
| 20 to 34 years | 48 (41.4%) | 63.0 |
| 35 to 50 years | 68 (58.6%) | 92.0 |
| Total | 116 (100.0%) | 71.0 |
Fertility by Age by Marriage Status in Riverside
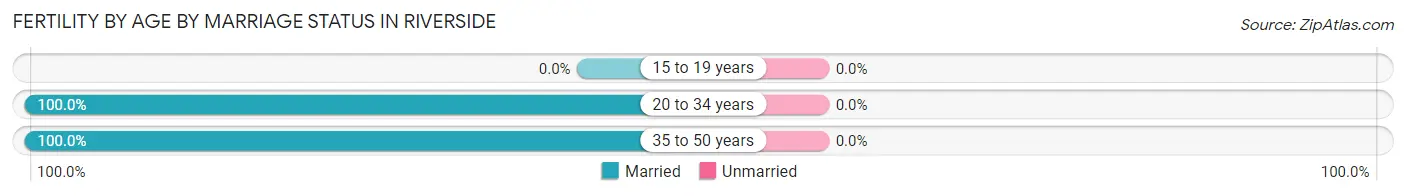
| Age Bracket | Married | Unmarried |
| 15 to 19 years | 0 (0.0%) | 0 (0.0%) |
| 20 to 34 years | 48 (100.0%) | 0 (0.0%) |
| 35 to 50 years | 68 (100.0%) | 0 (0.0%) |
| Total | 116 (100.0%) | 0 (0.0%) |
Fertility by Education in Riverside

| Educational Attainment | Women with Births | Births / 1,000 Women |
| Less than High School | 0 (0.0%) | 0.0 |
| High School Diploma | 36 (31.0%) | 151.0 |
| College or Associate's Degree | 50 (43.1%) | 87.0 |
| Bachelor's Degree | 0 (0.0%) | 0.0 |
| Graduate Degree | 30 (25.9%) | 77.0 |
| Total | 116 (100.0%) | 71.0 |
Fertility by Education by Marriage Status in Riverside
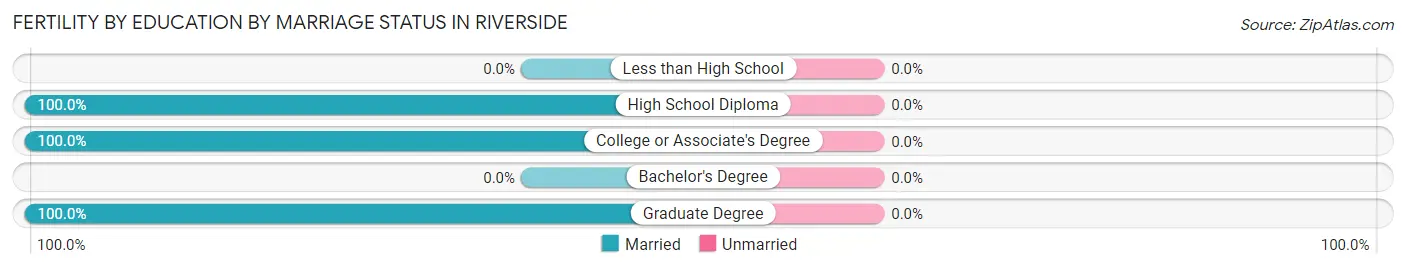
| Educational Attainment | Married | Unmarried |
| Less than High School | 0 (0.0%) | 0 (0.0%) |
| High School Diploma | 36 (100.0%) | 0 (0.0%) |
| College or Associate's Degree | 50 (100.0%) | 0 (0.0%) |
| Bachelor's Degree | 0 (0.0%) | 0 (0.0%) |
| Graduate Degree | 30 (100.0%) | 0 (0.0%) |
| Total | 116 (100.0%) | 0 (0.0%) |
Employment Characteristics in Riverside
Employment by Class of Employer in Riverside
Among the 3,837 employed individuals in Riverside, private company employees (2,338 | 60.9%), federal government employees (584 | 15.2%), and local government employees (293 | 7.6%) make up the most common classes of employment.
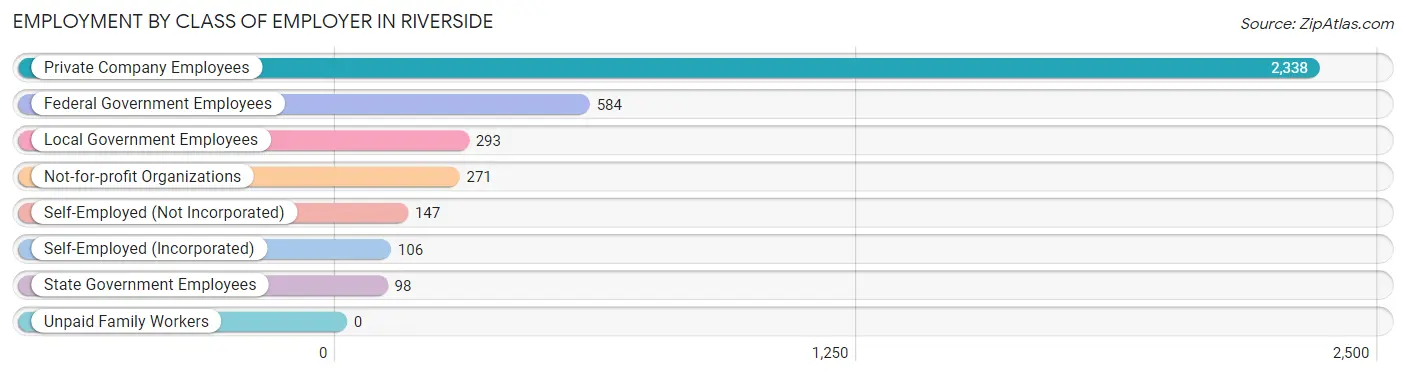
| Employer Class | # Employees | % Employees |
| Private Company Employees | 2,338 | 60.9% |
| Self-Employed (Incorporated) | 106 | 2.8% |
| Self-Employed (Not Incorporated) | 147 | 3.8% |
| Not-for-profit Organizations | 271 | 7.1% |
| Local Government Employees | 293 | 7.6% |
| State Government Employees | 98 | 2.5% |
| Federal Government Employees | 584 | 15.2% |
| Unpaid Family Workers | 0 | 0.0% |
| Total | 3,837 | 100.0% |
Employment Status by Age in Riverside
According to the labor force statistics for Riverside, out of the total population over 16 years of age (4,936), 78.8% or 3,890 individuals are in the labor force, with 1.1% or 43 of them unemployed. The age group with the highest labor force participation rate is 45 to 54 years, with 97.0% or 682 individuals in the labor force. Within the labor force, the 30 to 34 years age range has the highest percentage of unemployed individuals, with 6.9% or 29 of them being unemployed.
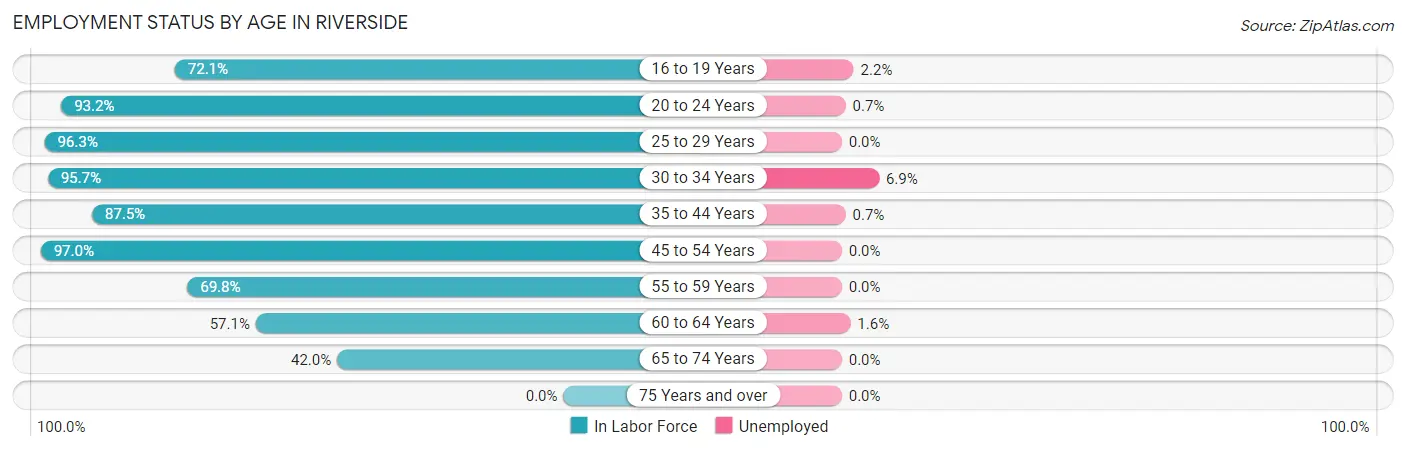
| Age Bracket | In Labor Force | Unemployed |
| 16 to 19 Years | 93 (72.1%) | 2 (2.2%) |
| 20 to 24 Years | 590 (93.2%) | 4 (0.7%) |
| 25 to 29 Years | 712 (96.3%) | 0 (0.0%) |
| 30 to 34 Years | 420 (95.7%) | 29 (6.9%) |
| 35 to 44 Years | 742 (87.5%) | 5 (0.7%) |
| 45 to 54 Years | 682 (97.0%) | 0 (0.0%) |
| 55 to 59 Years | 282 (69.8%) | 0 (0.0%) |
| 60 to 64 Years | 182 (57.1%) | 3 (1.6%) |
| 65 to 74 Years | 185 (42.0%) | 0 (0.0%) |
| 75 Years and over | 0 (0.0%) | 0 (0.0%) |
| Total | 3,890 (78.8%) | 43 (1.1%) |
Employment Status by Educational Attainment in Riverside
According to labor force statistics for Riverside, 87.5% of individuals (3,020) out of the total population between 25 and 64 years of age (3,452) are in the labor force, with 1.2% or 36 of them being unemployed. The group with the highest labor force participation rate are those with the educational attainment of bachelor's degree or higher, with 92.3% or 1,253 individuals in the labor force. Within the labor force, individuals with less than high school education have the highest percentage of unemployment, with 12.5% or 5 of them being unemployed.
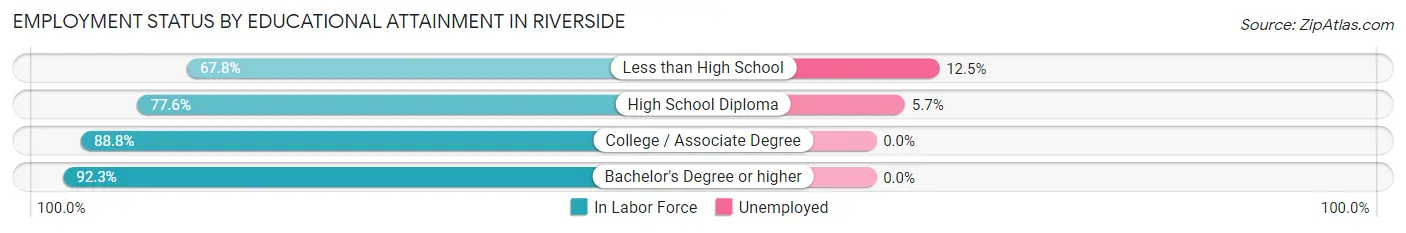
| Educational Attainment | In Labor Force | Unemployed |
| Less than High School | 40 (67.8%) | 7 (12.5%) |
| High School Diploma | 557 (77.6%) | 41 (5.7%) |
| College / Associate Degree | 1,170 (88.8%) | 0 (0.0%) |
| Bachelor's Degree or higher | 1,253 (92.3%) | 0 (0.0%) |
| Total | 3,020 (87.5%) | 41 (1.2%) |
Employment Occupations by Sex in Riverside
Management, Business, Science and Arts Occupations
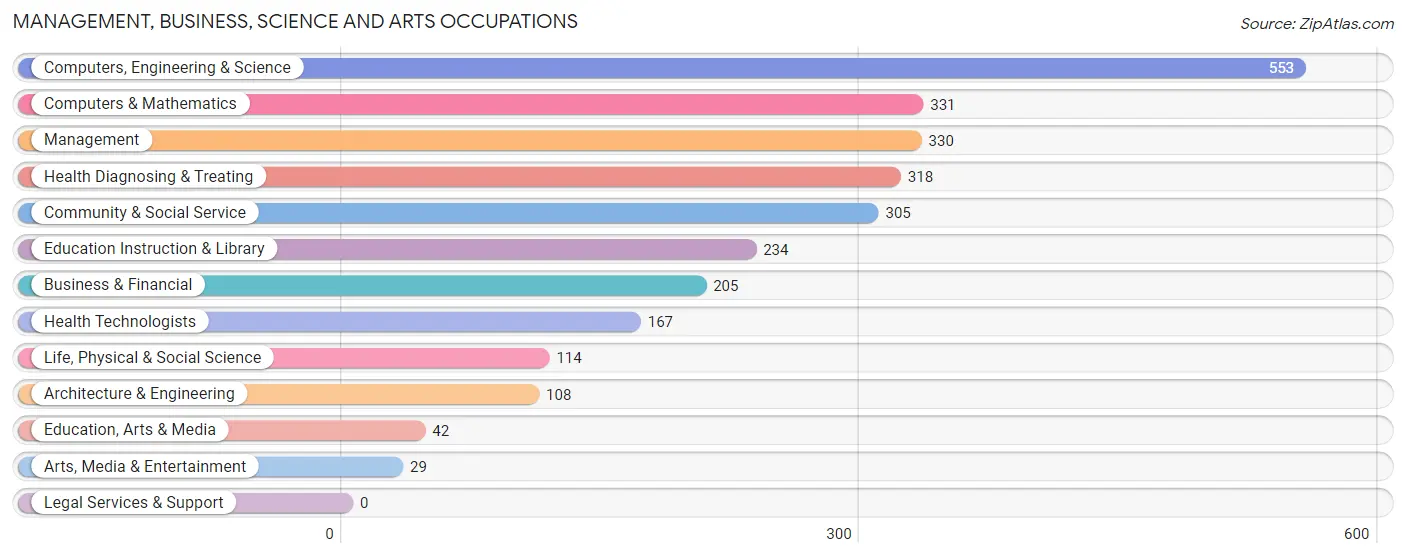
The most common Management, Business, Science and Arts occupations in Riverside are Computers, Engineering & Science (553 | 14.4%), Computers & Mathematics (331 | 8.6%), Management (330 | 8.6%), Health Diagnosing & Treating (318 | 8.3%), and Community & Social Service (305 | 7.9%).
Management, Business, Science and Arts Occupations by Sex
Within the Management, Business, Science and Arts occupations in Riverside, the most male-oriented occupations are Life, Physical & Social Science (89.5%), Architecture & Engineering (88.0%), and Computers, Engineering & Science (69.3%), while the most female-oriented occupations are Education, Arts & Media (100.0%), Health Diagnosing & Treating (100.0%), and Health Technologists (100.0%).
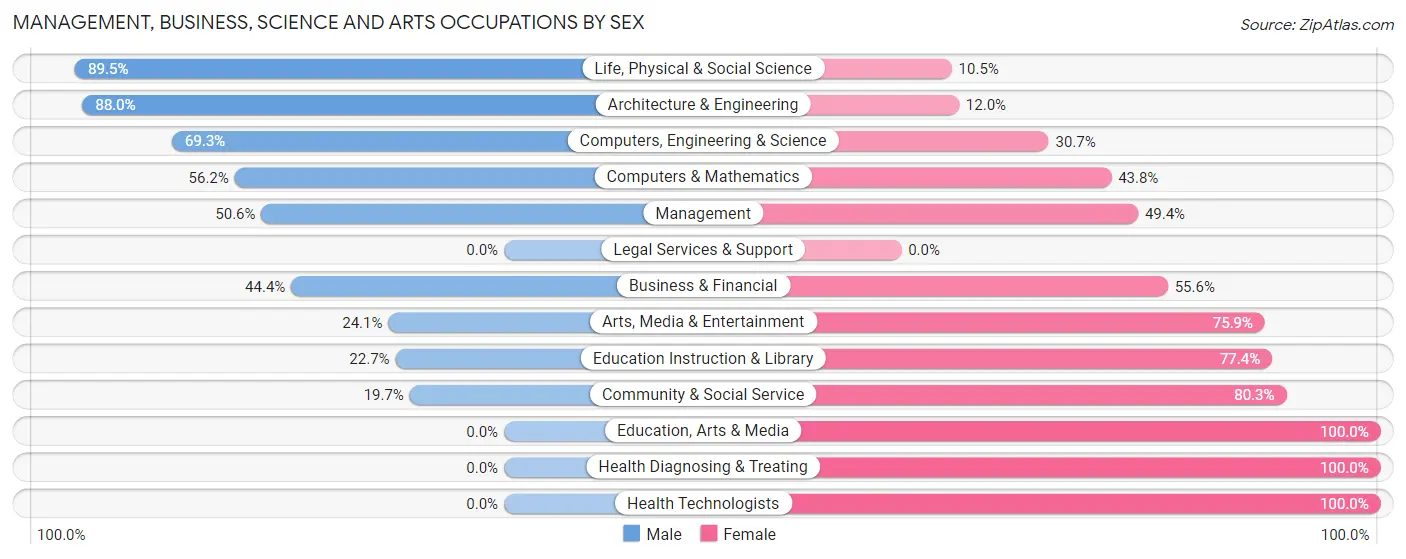
| Occupation | Male | Female |
| Management | 167 (50.6%) | 163 (49.4%) |
| Business & Financial | 91 (44.4%) | 114 (55.6%) |
| Computers, Engineering & Science | 383 (69.3%) | 170 (30.7%) |
| Computers & Mathematics | 186 (56.2%) | 145 (43.8%) |
| Architecture & Engineering | 95 (88.0%) | 13 (12.0%) |
| Life, Physical & Social Science | 102 (89.5%) | 12 (10.5%) |
| Community & Social Service | 60 (19.7%) | 245 (80.3%) |
| Education, Arts & Media | 0 (0.0%) | 42 (100.0%) |
| Legal Services & Support | 0 (0.0%) | 0 (0.0%) |
| Education Instruction & Library | 53 (22.7%) | 181 (77.3%) |
| Arts, Media & Entertainment | 7 (24.1%) | 22 (75.9%) |
| Health Diagnosing & Treating | 0 (0.0%) | 318 (100.0%) |
| Health Technologists | 0 (0.0%) | 167 (100.0%) |
| Total (Category) | 701 (41.0%) | 1,010 (59.0%) |
| Total (Overall) | 2,021 (52.6%) | 1,824 (47.4%) |
Services Occupations
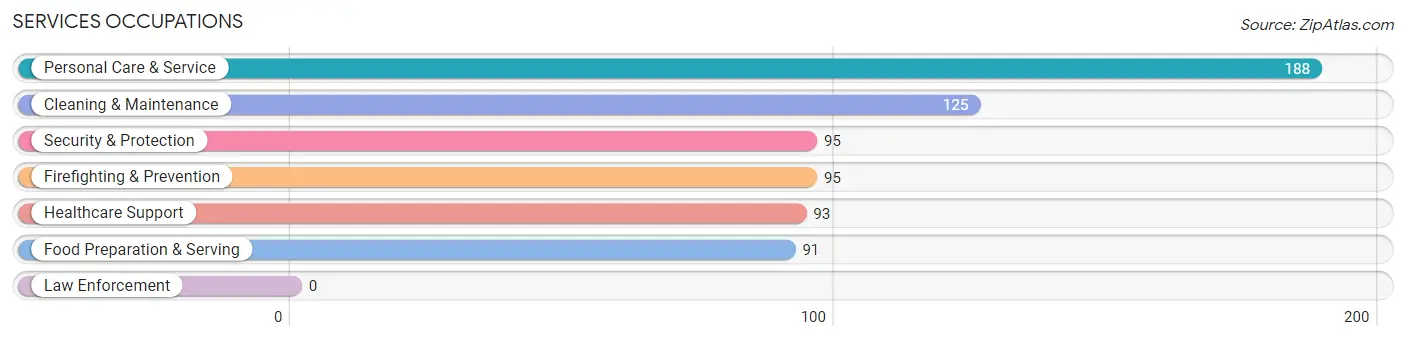
The most common Services occupations in Riverside are Personal Care & Service (188 | 4.9%), Cleaning & Maintenance (125 | 3.3%), Security & Protection (95 | 2.5%), Firefighting & Prevention (95 | 2.5%), and Healthcare Support (93 | 2.4%).
Services Occupations by Sex
Within the Services occupations in Riverside, the most male-oriented occupations are Security & Protection (92.6%), Firefighting & Prevention (92.6%), and Cleaning & Maintenance (75.2%), while the most female-oriented occupations are Healthcare Support (91.4%), Personal Care & Service (79.3%), and Food Preparation & Serving (73.6%).
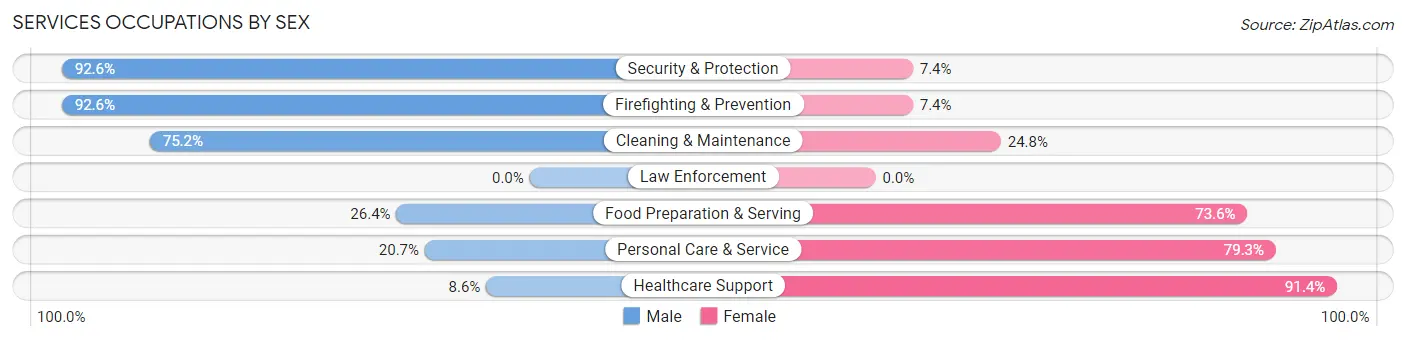
| Occupation | Male | Female |
| Healthcare Support | 8 (8.6%) | 85 (91.4%) |
| Security & Protection | 88 (92.6%) | 7 (7.4%) |
| Firefighting & Prevention | 88 (92.6%) | 7 (7.4%) |
| Law Enforcement | 0 (0.0%) | 0 (0.0%) |
| Food Preparation & Serving | 24 (26.4%) | 67 (73.6%) |
| Cleaning & Maintenance | 94 (75.2%) | 31 (24.8%) |
| Personal Care & Service | 39 (20.7%) | 149 (79.3%) |
| Total (Category) | 253 (42.7%) | 339 (57.3%) |
| Total (Overall) | 2,021 (52.6%) | 1,824 (47.4%) |
Sales and Office Occupations
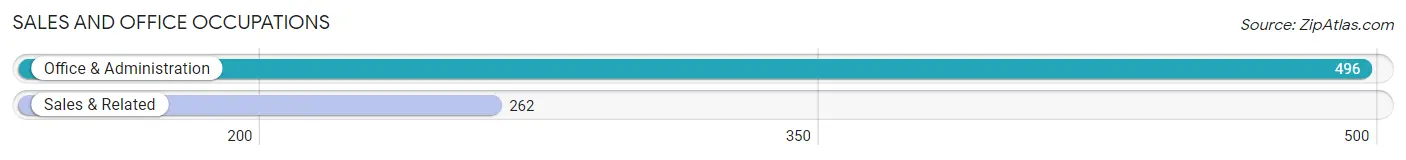
The most common Sales and Office occupations in Riverside are Office & Administration (496 | 12.9%), and Sales & Related (262 | 6.8%).
Sales and Office Occupations by Sex
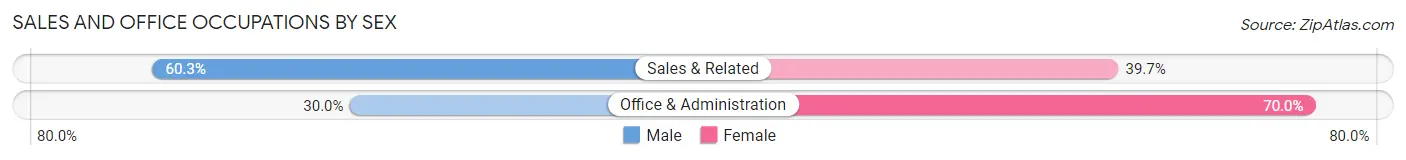
| Occupation | Male | Female |
| Sales & Related | 158 (60.3%) | 104 (39.7%) |
| Office & Administration | 149 (30.0%) | 347 (70.0%) |
| Total (Category) | 307 (40.5%) | 451 (59.5%) |
| Total (Overall) | 2,021 (52.6%) | 1,824 (47.4%) |
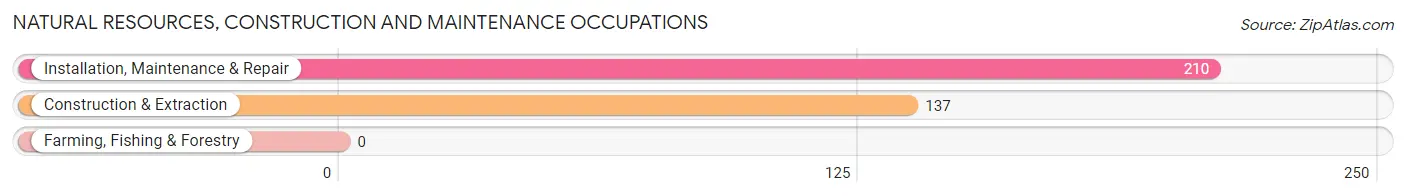
Natural Resources, Construction and Maintenance Occupations
The most common Natural Resources, Construction and Maintenance occupations in Riverside are Installation, Maintenance & Repair (210 | 5.5%), and Construction & Extraction (137 | 3.6%).
Natural Resources, Construction and Maintenance Occupations by Sex
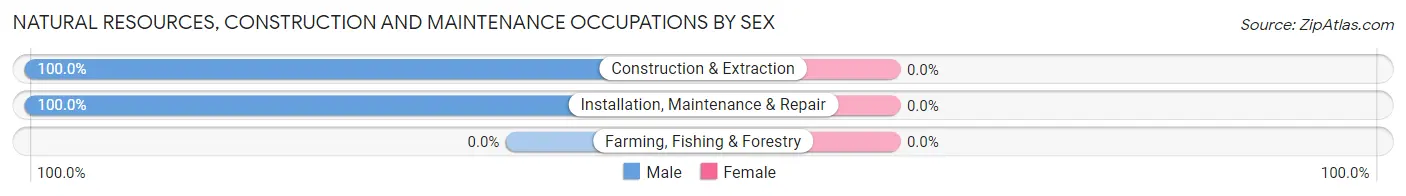
| Occupation | Male | Female |
| Farming, Fishing & Forestry | 0 (0.0%) | 0 (0.0%) |
| Construction & Extraction | 137 (100.0%) | 0 (0.0%) |
| Installation, Maintenance & Repair | 210 (100.0%) | 0 (0.0%) |
| Total (Category) | 347 (100.0%) | 0 (0.0%) |
| Total (Overall) | 2,021 (52.6%) | 1,824 (47.4%) |
Production, Transportation and Moving Occupations
The most common Production, Transportation and Moving occupations in Riverside are Material Moving (189 | 4.9%), Production (184 | 4.8%), and Transportation (64 | 1.7%).
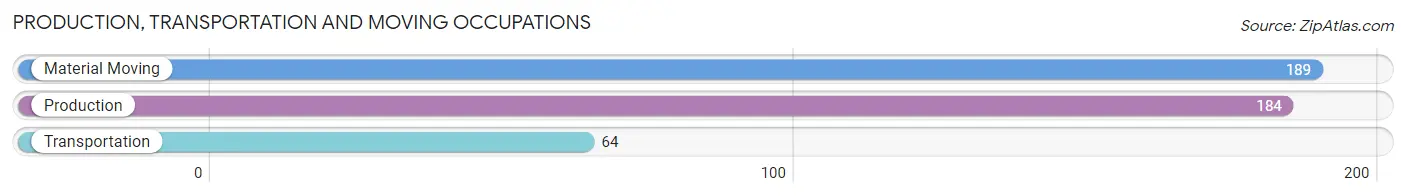
Production, Transportation and Moving Occupations by Sex
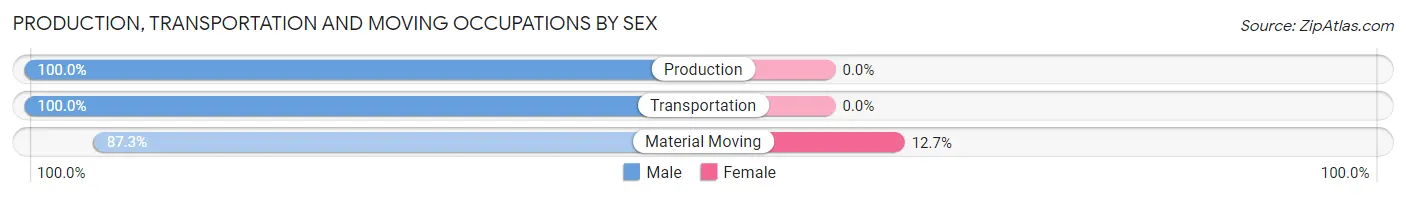
| Occupation | Male | Female |
| Production | 184 (100.0%) | 0 (0.0%) |
| Transportation | 64 (100.0%) | 0 (0.0%) |
| Material Moving | 165 (87.3%) | 24 (12.7%) |
| Total (Category) | 413 (94.5%) | 24 (5.5%) |
| Total (Overall) | 2,021 (52.6%) | 1,824 (47.4%) |
Employment Industries by Sex in Riverside
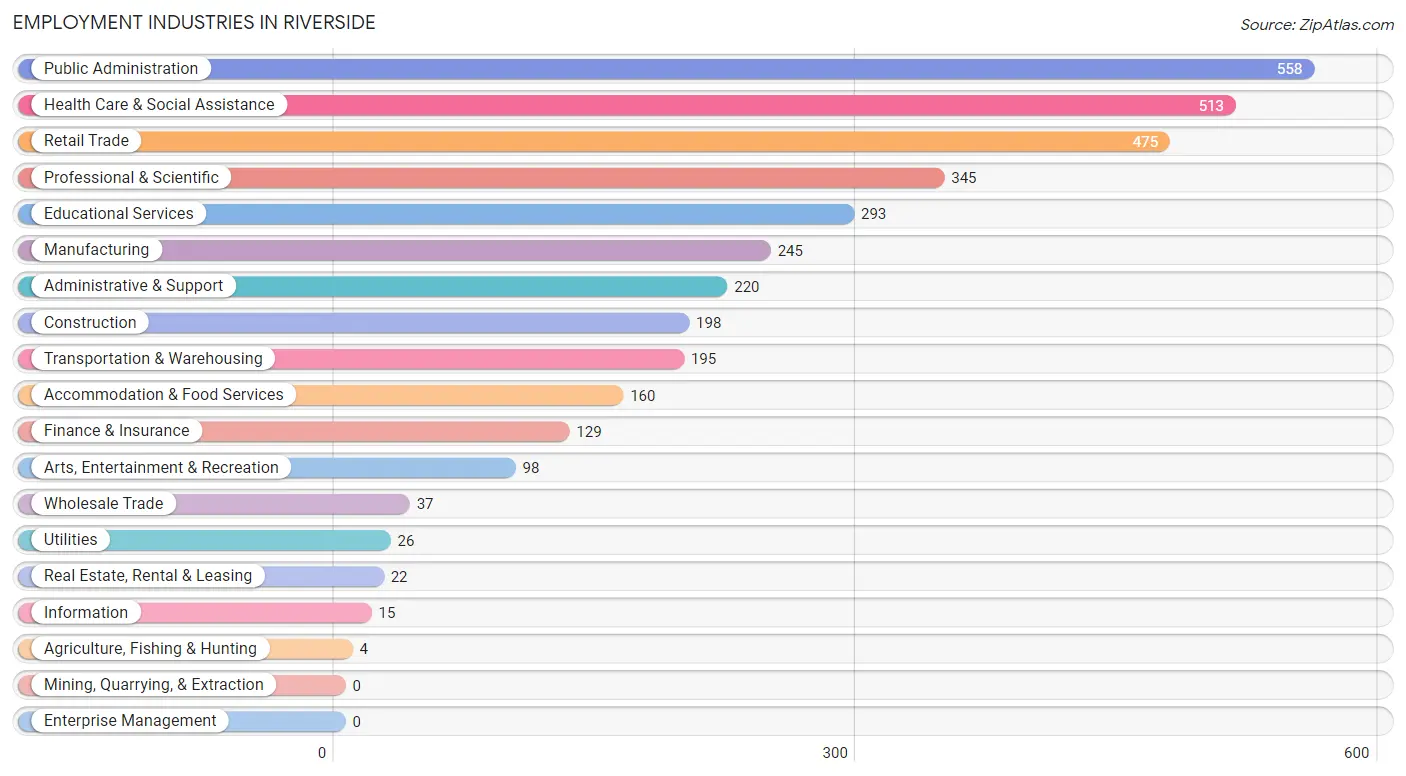
Employment Industries in Riverside
The major employment industries in Riverside include Public Administration (558 | 14.5%), Health Care & Social Assistance (513 | 13.3%), Retail Trade (475 | 12.3%), Professional & Scientific (345 | 9.0%), and Educational Services (293 | 7.6%).
Employment Industries by Sex in Riverside
The Riverside industries that see more men than women are Agriculture, Fishing & Hunting (100.0%), Construction (100.0%), and Wholesale Trade (100.0%), whereas the industries that tend to have a higher number of women are Real Estate, Rental & Leasing (100.0%), Health Care & Social Assistance (95.5%), and Administrative & Support (64.1%).
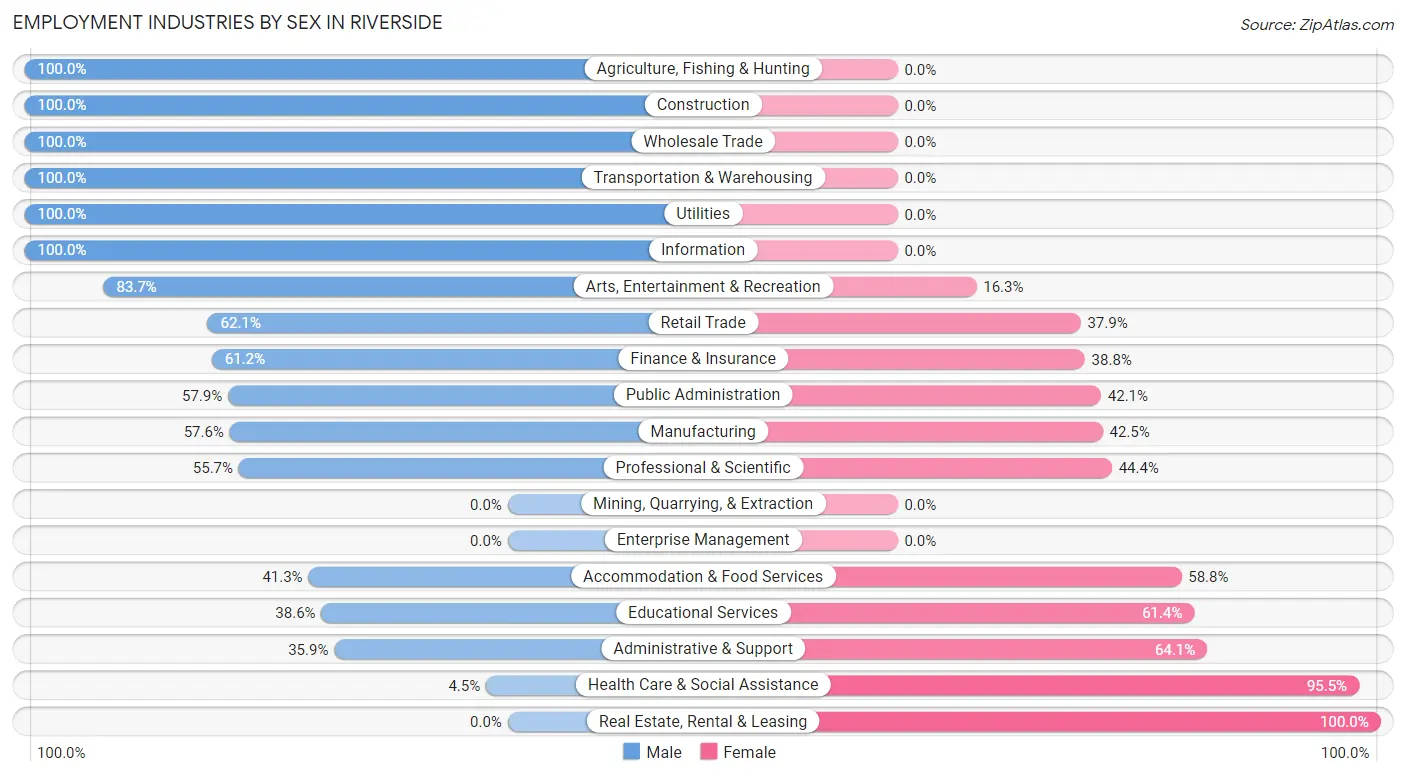
| Industry | Male | Female |
| Agriculture, Fishing & Hunting | 4 (100.0%) | 0 (0.0%) |
| Mining, Quarrying, & Extraction | 0 (0.0%) | 0 (0.0%) |
| Construction | 198 (100.0%) | 0 (0.0%) |
| Manufacturing | 141 (57.6%) | 104 (42.4%) |
| Wholesale Trade | 37 (100.0%) | 0 (0.0%) |
| Retail Trade | 295 (62.1%) | 180 (37.9%) |
| Transportation & Warehousing | 195 (100.0%) | 0 (0.0%) |
| Utilities | 26 (100.0%) | 0 (0.0%) |
| Information | 15 (100.0%) | 0 (0.0%) |
| Finance & Insurance | 79 (61.2%) | 50 (38.8%) |
| Real Estate, Rental & Leasing | 0 (0.0%) | 22 (100.0%) |
| Professional & Scientific | 192 (55.6%) | 153 (44.4%) |
| Enterprise Management | 0 (0.0%) | 0 (0.0%) |
| Administrative & Support | 79 (35.9%) | 141 (64.1%) |
| Educational Services | 113 (38.6%) | 180 (61.4%) |
| Health Care & Social Assistance | 23 (4.5%) | 490 (95.5%) |
| Arts, Entertainment & Recreation | 82 (83.7%) | 16 (16.3%) |
| Accommodation & Food Services | 66 (41.2%) | 94 (58.8%) |
| Public Administration | 323 (57.9%) | 235 (42.1%) |
| Total | 2,021 (52.6%) | 1,824 (47.4%) |
Education in Riverside
School Enrollment in Riverside
The most common levels of schooling among the 1,232 students in Riverside are college / undergraduate (258 | 20.9%), middle school (224 | 18.2%), and nursery / preschool (219 | 17.8%).
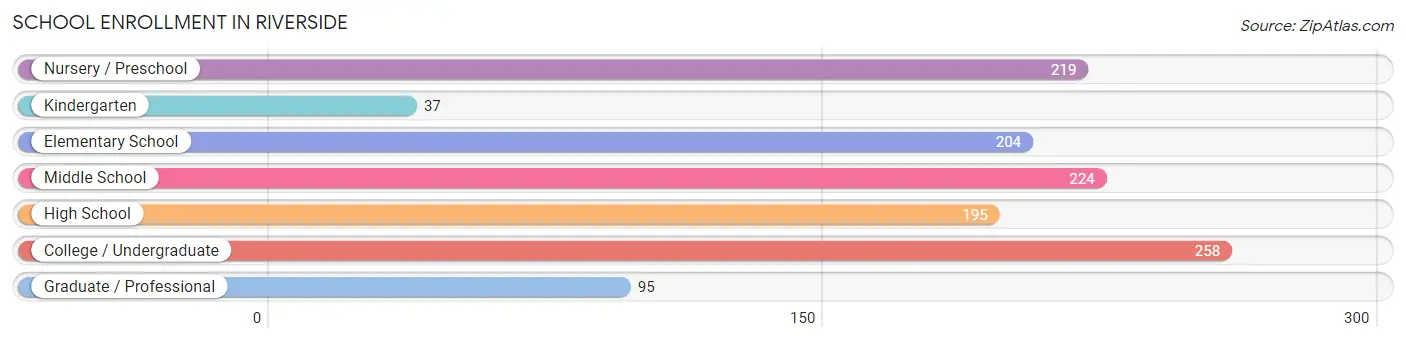
| School Level | # Students | % Students |
| Nursery / Preschool | 219 | 17.8% |
| Kindergarten | 37 | 3.0% |
| Elementary School | 204 | 16.6% |
| Middle School | 224 | 18.2% |
| High School | 195 | 15.8% |
| College / Undergraduate | 258 | 20.9% |
| Graduate / Professional | 95 | 7.7% |
| Total | 1,232 | 100.0% |
School Enrollment by Age by Funding Source in Riverside
Out of a total of 1,232 students who are enrolled in schools in Riverside, 257 (20.9%) attend a private institution, while the remaining 975 (79.1%) are enrolled in public schools. The age group of 3 to 4 year olds has the highest likelihood of being enrolled in private schools, with 87 (62.1% in the age bracket) enrolled. Conversely, the age group of 18 to 19 year olds has the lowest likelihood of being enrolled in a private school, with 27 (100.0% in the age bracket) attending a public institution.
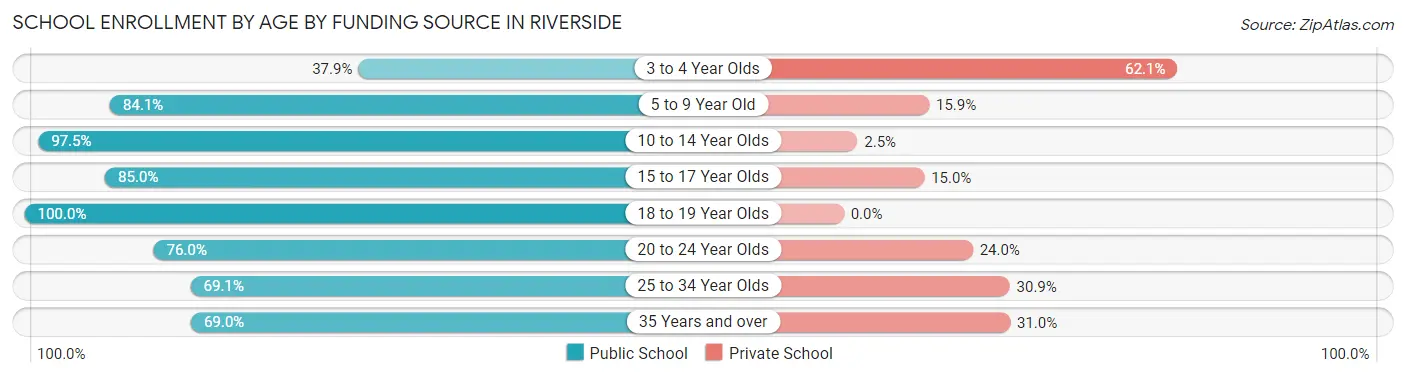
| Age Bracket | Public School | Private School |
| 3 to 4 Year Olds | 53 (37.9%) | 87 (62.1%) |
| 5 to 9 Year Old | 238 (84.1%) | 45 (15.9%) |
| 10 to 14 Year Olds | 269 (97.5%) | 7 (2.5%) |
| 15 to 17 Year Olds | 153 (85.0%) | 27 (15.0%) |
| 18 to 19 Year Olds | 27 (100.0%) | 0 (0.0%) |
| 20 to 24 Year Olds | 98 (76.0%) | 31 (24.0%) |
| 25 to 34 Year Olds | 38 (69.1%) | 17 (30.9%) |
| 35 Years and over | 98 (69.0%) | 44 (31.0%) |
| Total | 975 (79.1%) | 257 (20.9%) |
Educational Attainment by Field of Study in Riverside
Business (471 | 28.3%), education (169 | 10.1%), engineering (153 | 9.2%), bio, nature & agricultural (145 | 8.7%), and science & technology (144 | 8.6%) are the most common fields of study among 1,666 individuals in Riverside who have obtained a bachelor's degree or higher.
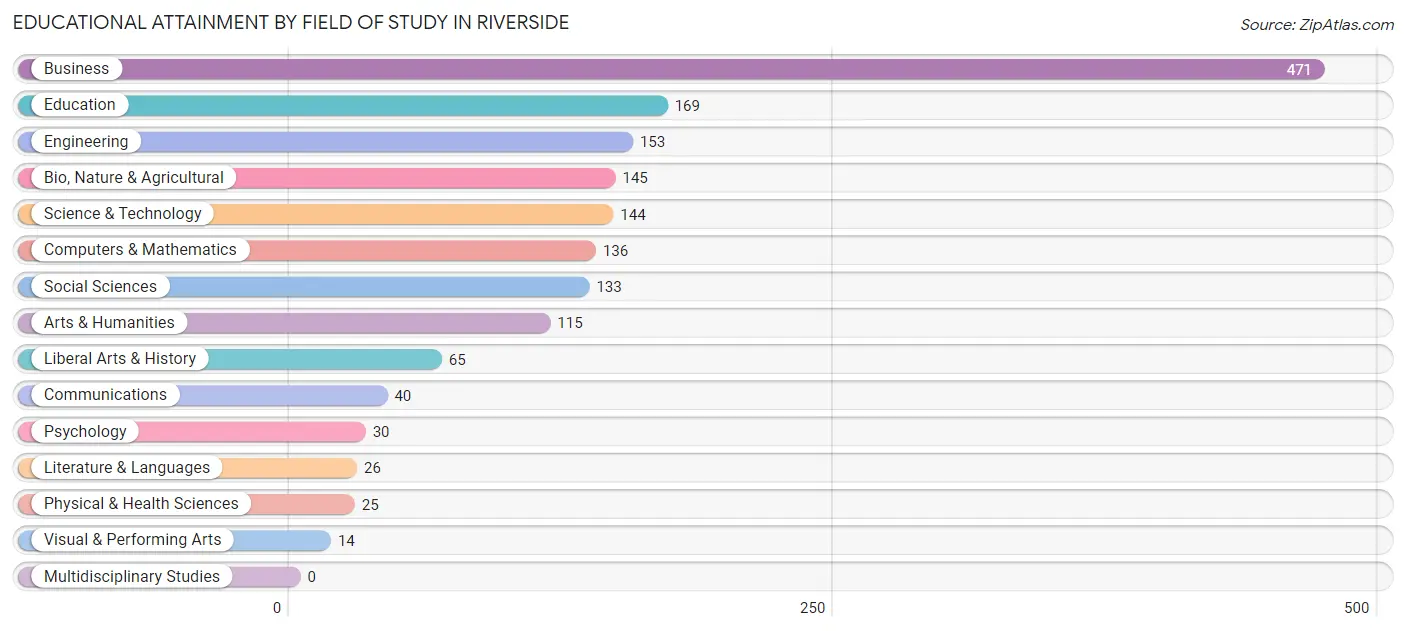
| Field of Study | # Graduates | % Graduates |
| Computers & Mathematics | 136 | 8.2% |
| Bio, Nature & Agricultural | 145 | 8.7% |
| Physical & Health Sciences | 25 | 1.5% |
| Psychology | 30 | 1.8% |
| Social Sciences | 133 | 8.0% |
| Engineering | 153 | 9.2% |
| Multidisciplinary Studies | 0 | 0.0% |
| Science & Technology | 144 | 8.6% |
| Business | 471 | 28.3% |
| Education | 169 | 10.1% |
| Literature & Languages | 26 | 1.6% |
| Liberal Arts & History | 65 | 3.9% |
| Visual & Performing Arts | 14 | 0.8% |
| Communications | 40 | 2.4% |
| Arts & Humanities | 115 | 6.9% |
| Total | 1,666 | 100.0% |
Transportation & Commute in Riverside
Vehicle Availability by Sex in Riverside
The most prevalent vehicle ownership categories in Riverside are males with 2 vehicles (869, accounting for 43.4%) and females with 2 vehicles (846, making up 48.0%).
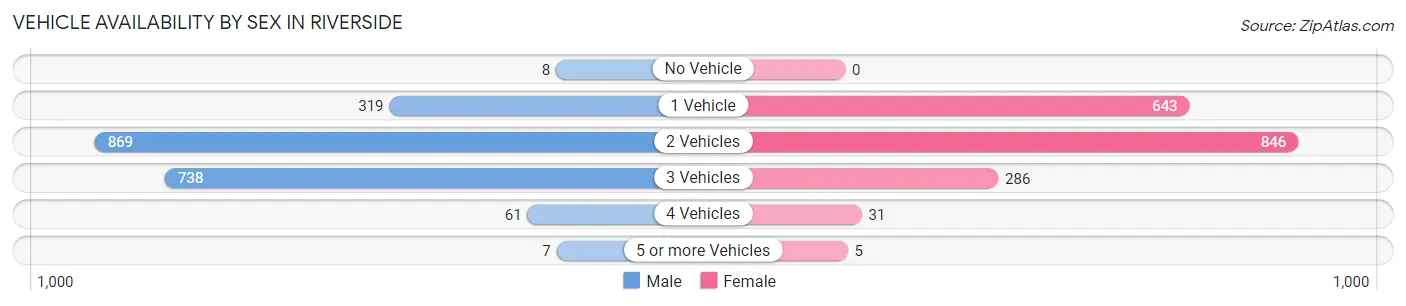
| Vehicles Available | Male | Female |
| No Vehicle | 8 (0.4%) | 0 (0.0%) |
| 1 Vehicle | 319 (15.9%) | 643 (35.5%) |
| 2 Vehicles | 869 (43.4%) | 846 (46.7%) |
| 3 Vehicles | 738 (36.9%) | 286 (15.8%) |
| 4 Vehicles | 61 (3.0%) | 31 (1.7%) |
| 5 or more Vehicles | 7 (0.4%) | 5 (0.3%) |
| Total | 2,002 (100.0%) | 1,811 (100.0%) |
Commute Time in Riverside
The most frequently occuring commute durations in Riverside are 30 to 34 minutes (500 commuters, 14.2%), 45 to 59 minutes (479 commuters, 13.6%), and 20 to 24 minutes (478 commuters, 13.6%).
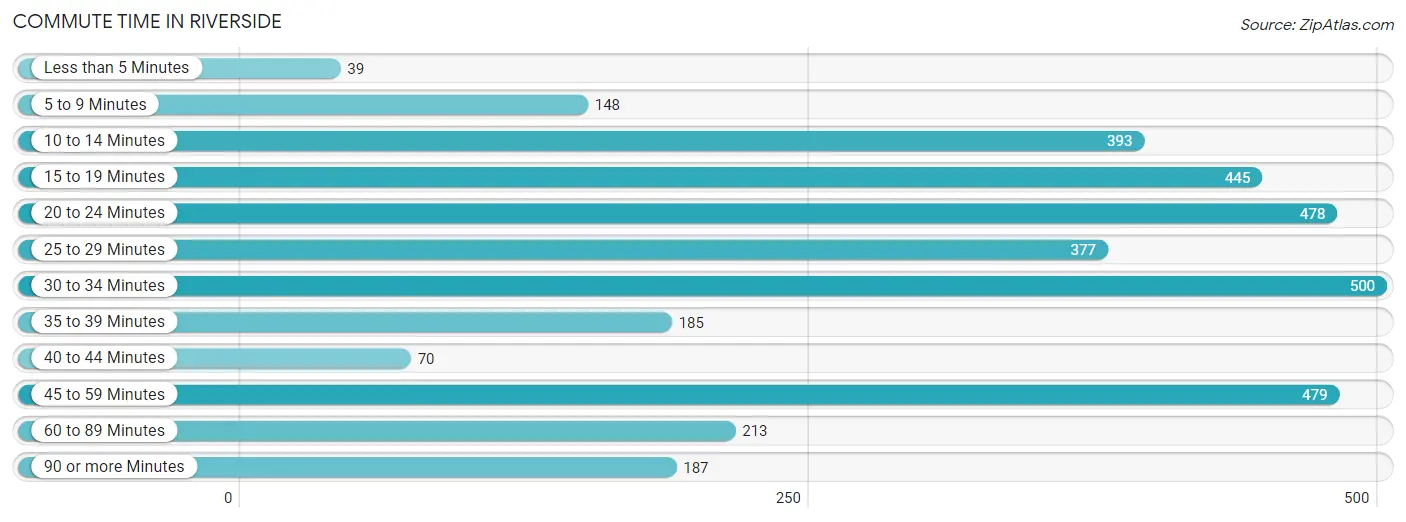
| Commute Time | # Commuters | % Commuters |
| Less than 5 Minutes | 39 | 1.1% |
| 5 to 9 Minutes | 148 | 4.2% |
| 10 to 14 Minutes | 393 | 11.2% |
| 15 to 19 Minutes | 445 | 12.7% |
| 20 to 24 Minutes | 478 | 13.6% |
| 25 to 29 Minutes | 377 | 10.7% |
| 30 to 34 Minutes | 500 | 14.2% |
| 35 to 39 Minutes | 185 | 5.3% |
| 40 to 44 Minutes | 70 | 2.0% |
| 45 to 59 Minutes | 479 | 13.6% |
| 60 to 89 Minutes | 213 | 6.1% |
| 90 or more Minutes | 187 | 5.3% |
Commute Time by Sex in Riverside
The most common commute times in Riverside are 45 to 59 minutes (294 commuters, 15.9%) for males and 30 to 34 minutes (285 commuters, 17.1%) for females.
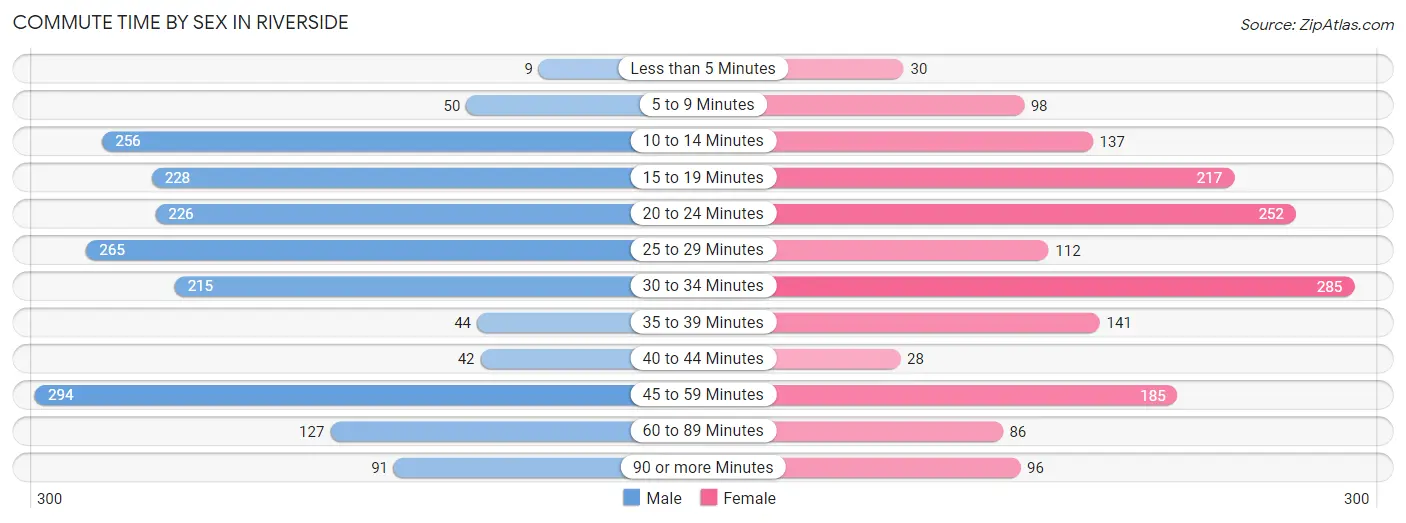
| Commute Time | Male | Female |
| Less than 5 Minutes | 9 (0.5%) | 30 (1.8%) |
| 5 to 9 Minutes | 50 (2.7%) | 98 (5.9%) |
| 10 to 14 Minutes | 256 (13.9%) | 137 (8.2%) |
| 15 to 19 Minutes | 228 (12.3%) | 217 (13.0%) |
| 20 to 24 Minutes | 226 (12.2%) | 252 (15.1%) |
| 25 to 29 Minutes | 265 (14.3%) | 112 (6.7%) |
| 30 to 34 Minutes | 215 (11.6%) | 285 (17.1%) |
| 35 to 39 Minutes | 44 (2.4%) | 141 (8.5%) |
| 40 to 44 Minutes | 42 (2.3%) | 28 (1.7%) |
| 45 to 59 Minutes | 294 (15.9%) | 185 (11.1%) |
| 60 to 89 Minutes | 127 (6.9%) | 86 (5.2%) |
| 90 or more Minutes | 91 (4.9%) | 96 (5.8%) |
Time of Departure to Work by Sex in Riverside
The most frequent times of departure to work in Riverside are 6:00 AM to 6:29 AM (369, 20.0%) for males and 7:00 AM to 7:29 AM (312, 18.7%) for females.
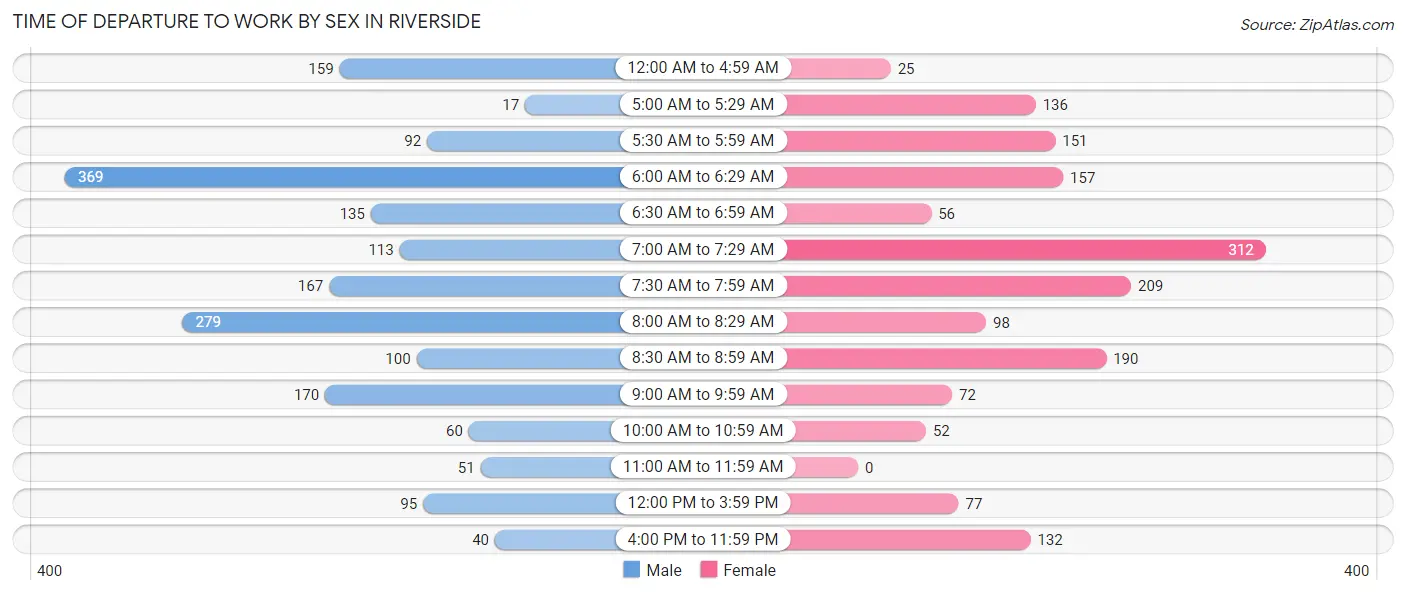
| Time of Departure | Male | Female |
| 12:00 AM to 4:59 AM | 159 (8.6%) | 25 (1.5%) |
| 5:00 AM to 5:29 AM | 17 (0.9%) | 136 (8.2%) |
| 5:30 AM to 5:59 AM | 92 (5.0%) | 151 (9.1%) |
| 6:00 AM to 6:29 AM | 369 (20.0%) | 157 (9.4%) |
| 6:30 AM to 6:59 AM | 135 (7.3%) | 56 (3.4%) |
| 7:00 AM to 7:29 AM | 113 (6.1%) | 312 (18.7%) |
| 7:30 AM to 7:59 AM | 167 (9.0%) | 209 (12.5%) |
| 8:00 AM to 8:29 AM | 279 (15.1%) | 98 (5.9%) |
| 8:30 AM to 8:59 AM | 100 (5.4%) | 190 (11.4%) |
| 9:00 AM to 9:59 AM | 170 (9.2%) | 72 (4.3%) |
| 10:00 AM to 10:59 AM | 60 (3.3%) | 52 (3.1%) |
| 11:00 AM to 11:59 AM | 51 (2.8%) | 0 (0.0%) |
| 12:00 PM to 3:59 PM | 95 (5.1%) | 77 (4.6%) |
| 4:00 PM to 11:59 PM | 40 (2.2%) | 132 (7.9%) |
| Total | 1,847 (100.0%) | 1,667 (100.0%) |
Housing Occupancy in Riverside
Occupancy by Ownership in Riverside
Of the total 2,604 dwellings in Riverside, owner-occupied units account for 1,645 (63.2%), while renter-occupied units make up 959 (36.8%).
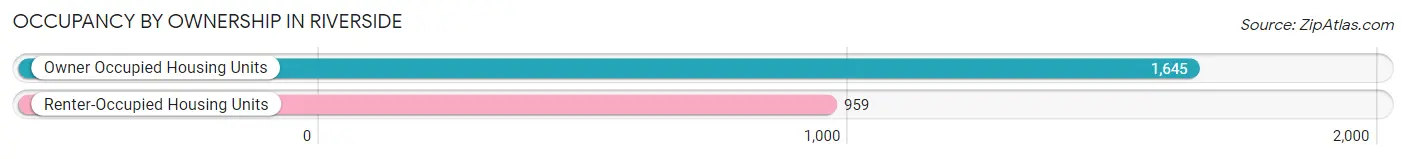
| Occupancy | # Housing Units | % Housing Units |
| Owner Occupied Housing Units | 1,645 | 63.2% |
| Renter-Occupied Housing Units | 959 | 36.8% |
| Total Occupied Housing Units | 2,604 | 100.0% |
Occupancy by Household Size in Riverside
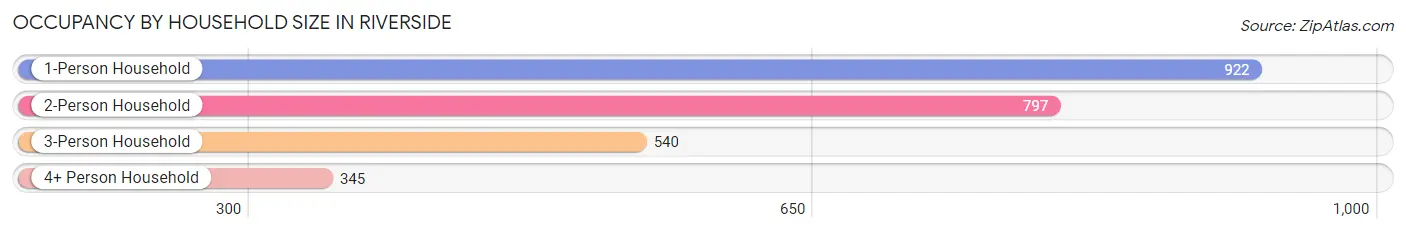
| Household Size | # Housing Units | % Housing Units |
| 1-Person Household | 922 | 35.4% |
| 2-Person Household | 797 | 30.6% |
| 3-Person Household | 540 | 20.7% |
| 4+ Person Household | 345 | 13.3% |
| Total Housing Units | 2,604 | 100.0% |
Occupancy by Ownership by Household Size in Riverside
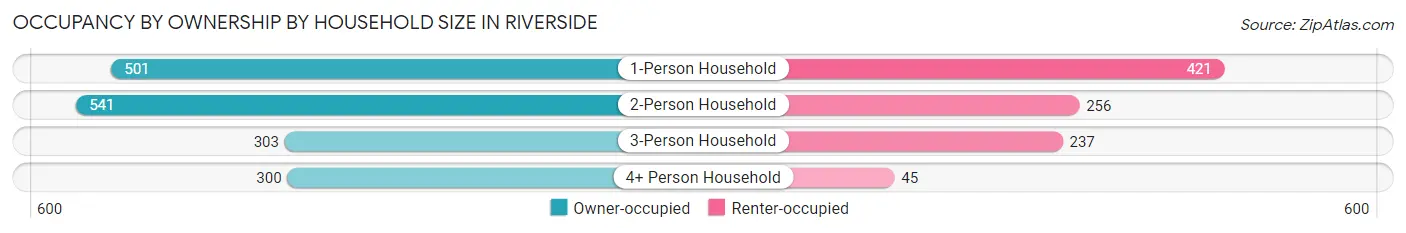
| Household Size | Owner-occupied | Renter-occupied |
| 1-Person Household | 501 (54.3%) | 421 (45.7%) |
| 2-Person Household | 541 (67.9%) | 256 (32.1%) |
| 3-Person Household | 303 (56.1%) | 237 (43.9%) |
| 4+ Person Household | 300 (87.0%) | 45 (13.0%) |
| Total Housing Units | 1,645 (63.2%) | 959 (36.8%) |
Occupancy by Educational Attainment in Riverside
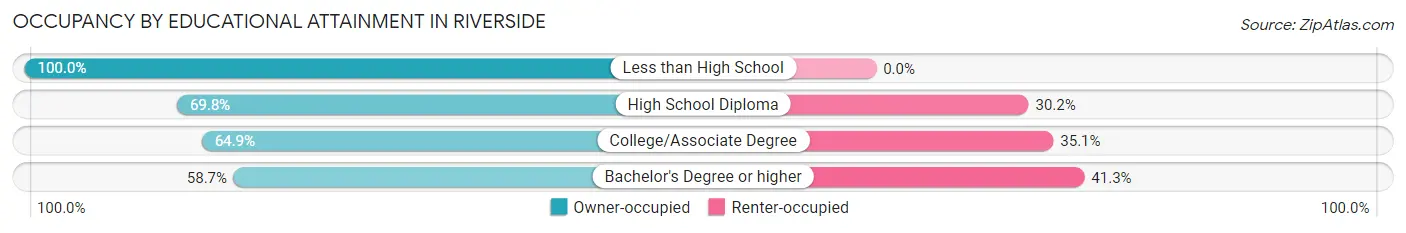
| Household Size | Owner-occupied | Renter-occupied |
| Less than High School | 15 (100.0%) | 0 (0.0%) |
| High School Diploma | 298 (69.8%) | 129 (30.2%) |
| College/Associate Degree | 661 (64.9%) | 358 (35.1%) |
| Bachelor's Degree or higher | 671 (58.7%) | 472 (41.3%) |
Occupancy by Age of Householder in Riverside
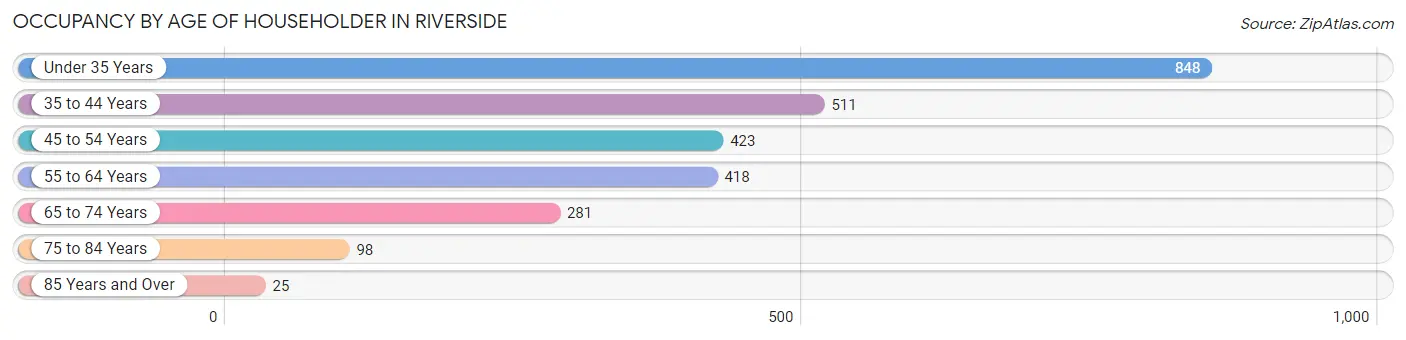
| Age Bracket | # Households | % Households |
| Under 35 Years | 848 | 32.6% |
| 35 to 44 Years | 511 | 19.6% |
| 45 to 54 Years | 423 | 16.2% |
| 55 to 64 Years | 418 | 16.1% |
| 65 to 74 Years | 281 | 10.8% |
| 75 to 84 Years | 98 | 3.8% |
| 85 Years and Over | 25 | 1.0% |
| Total | 2,604 | 100.0% |
Housing Finances in Riverside
Median Income by Occupancy in Riverside
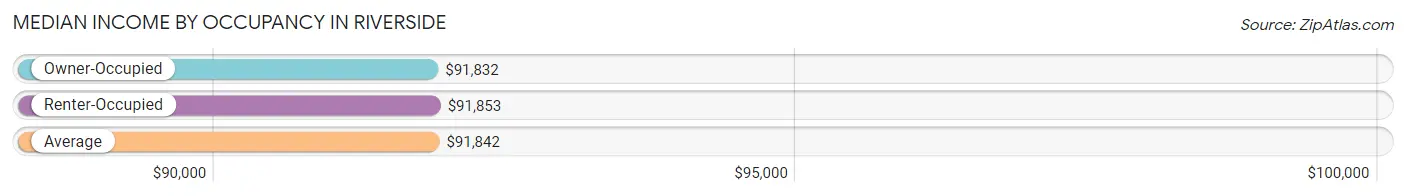
| Occupancy Type | # Households | Median Income |
| Owner-Occupied | 1,645 (63.2%) | $91,832 |
| Renter-Occupied | 959 (36.8%) | $91,853 |
| Average | 2,604 (100.0%) | $91,842 |
Occupancy by Householder Income Bracket in Riverside
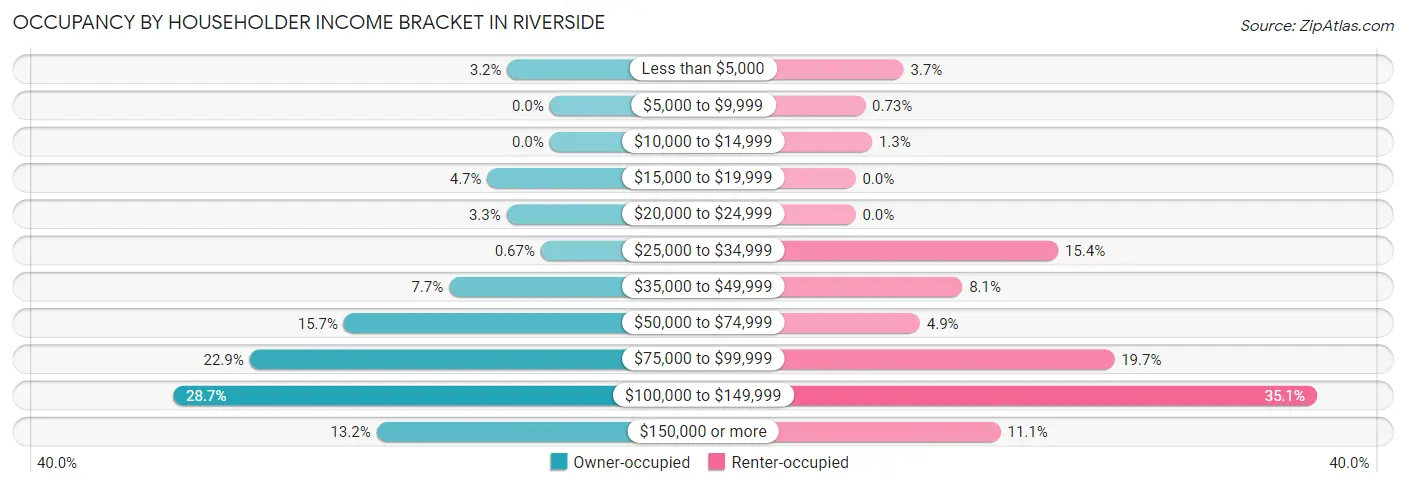
| Income Bracket | Owner-occupied | Renter-occupied |
| Less than $5,000 | 53 (3.2%) | 35 (3.6%) |
| $5,000 to $9,999 | 0 (0.0%) | 7 (0.7%) |
| $10,000 to $14,999 | 0 (0.0%) | 12 (1.3%) |
| $15,000 to $19,999 | 78 (4.7%) | 0 (0.0%) |
| $20,000 to $24,999 | 54 (3.3%) | 0 (0.0%) |
| $25,000 to $34,999 | 11 (0.7%) | 148 (15.4%) |
| $35,000 to $49,999 | 126 (7.7%) | 78 (8.1%) |
| $50,000 to $74,999 | 258 (15.7%) | 47 (4.9%) |
| $75,000 to $99,999 | 376 (22.9%) | 189 (19.7%) |
| $100,000 to $149,999 | 472 (28.7%) | 337 (35.1%) |
| $150,000 or more | 217 (13.2%) | 106 (11.1%) |
| Total | 1,645 (100.0%) | 959 (100.0%) |
Monthly Housing Cost Tiers in Riverside
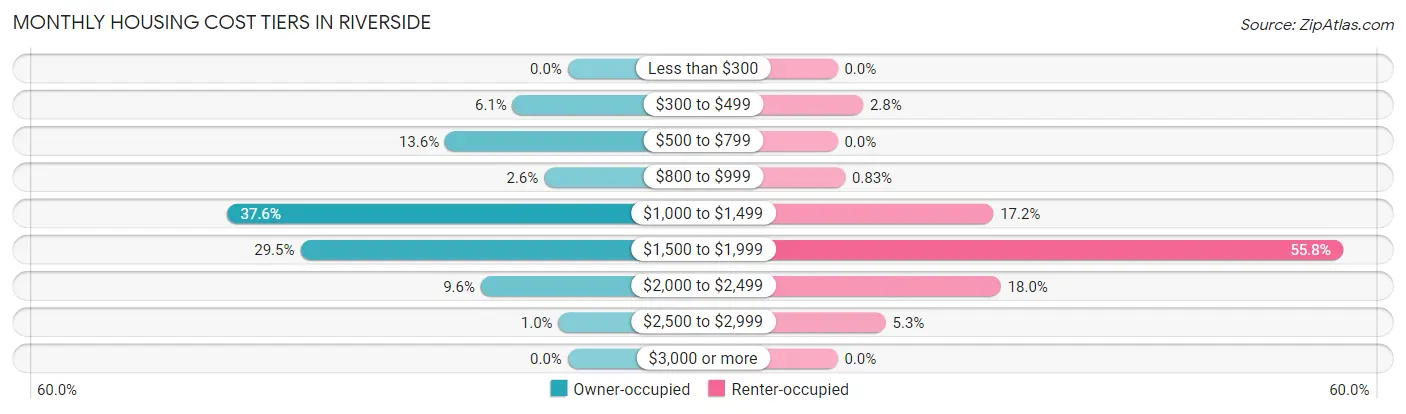
| Monthly Cost | Owner-occupied | Renter-occupied |
| Less than $300 | 0 (0.0%) | 0 (0.0%) |
| $300 to $499 | 100 (6.1%) | 27 (2.8%) |
| $500 to $799 | 223 (13.6%) | 0 (0.0%) |
| $800 to $999 | 43 (2.6%) | 8 (0.8%) |
| $1,000 to $1,499 | 618 (37.6%) | 165 (17.2%) |
| $1,500 to $1,999 | 486 (29.5%) | 535 (55.8%) |
| $2,000 to $2,499 | 158 (9.6%) | 173 (18.0%) |
| $2,500 to $2,999 | 17 (1.0%) | 51 (5.3%) |
| $3,000 or more | 0 (0.0%) | 0 (0.0%) |
| Total | 1,645 (100.0%) | 959 (100.0%) |
Physical Housing Characteristics in Riverside
Housing Structures in Riverside
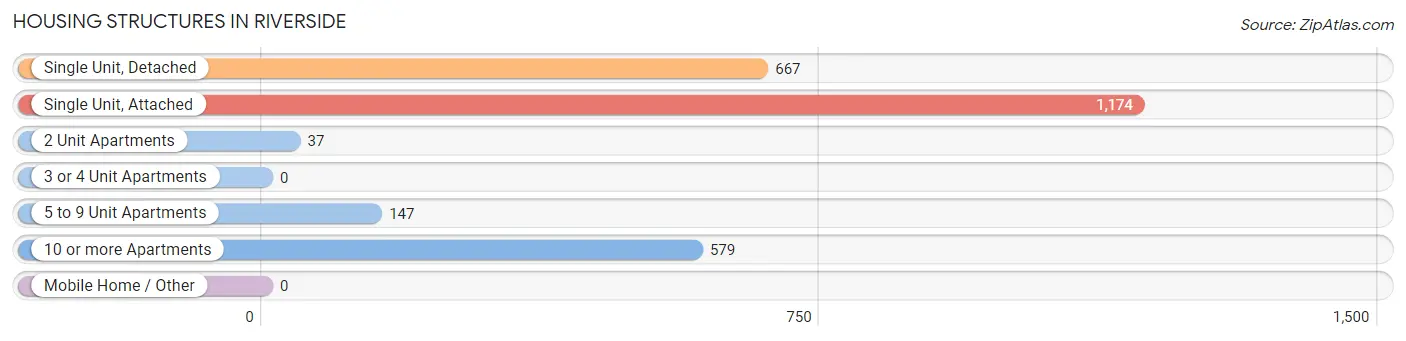
| Structure Type | # Housing Units | % Housing Units |
| Single Unit, Detached | 667 | 25.6% |
| Single Unit, Attached | 1,174 | 45.1% |
| 2 Unit Apartments | 37 | 1.4% |
| 3 or 4 Unit Apartments | 0 | 0.0% |
| 5 to 9 Unit Apartments | 147 | 5.7% |
| 10 or more Apartments | 579 | 22.2% |
| Mobile Home / Other | 0 | 0.0% |
| Total | 2,604 | 100.0% |
Housing Structures by Occupancy in Riverside
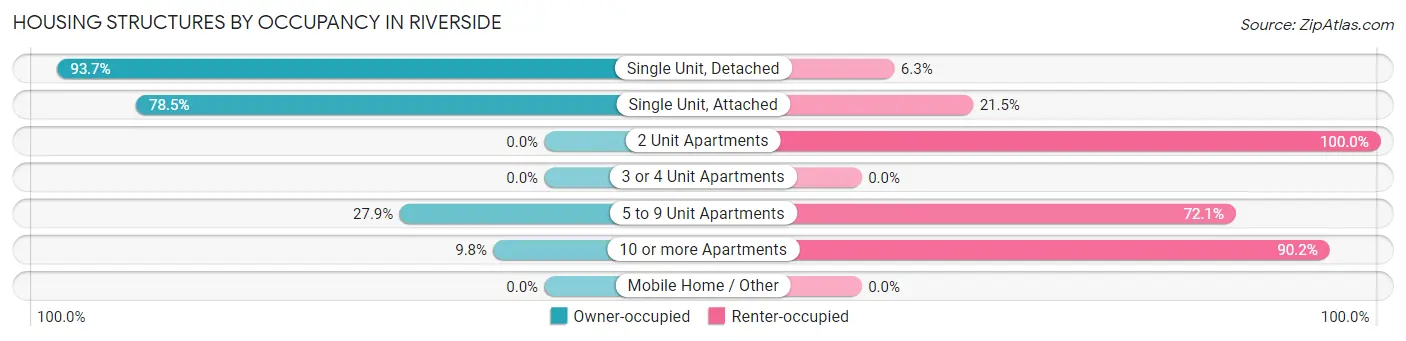
| Structure Type | Owner-occupied | Renter-occupied |
| Single Unit, Detached | 625 (93.7%) | 42 (6.3%) |
| Single Unit, Attached | 922 (78.5%) | 252 (21.5%) |
| 2 Unit Apartments | 0 (0.0%) | 37 (100.0%) |
| 3 or 4 Unit Apartments | 0 (0.0%) | 0 (0.0%) |
| 5 to 9 Unit Apartments | 41 (27.9%) | 106 (72.1%) |
| 10 or more Apartments | 57 (9.8%) | 522 (90.2%) |
| Mobile Home / Other | 0 (0.0%) | 0 (0.0%) |
| Total | 1,645 (63.2%) | 959 (36.8%) |
Housing Structures by Number of Rooms in Riverside
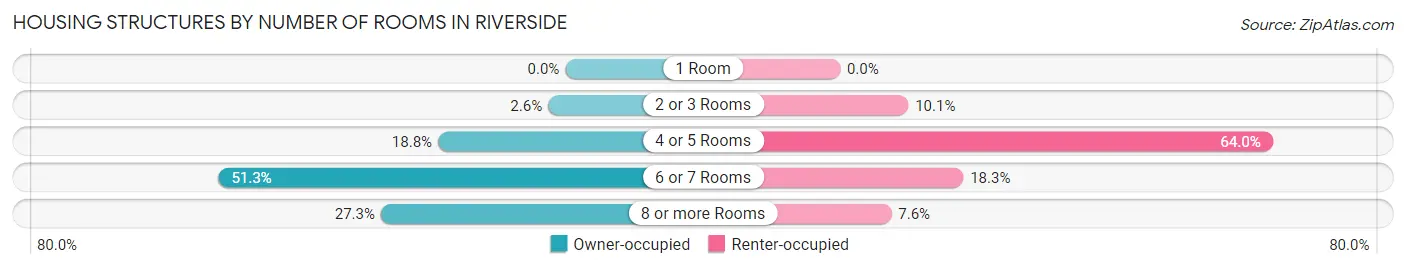
| Number of Rooms | Owner-occupied | Renter-occupied |
| 1 Room | 0 (0.0%) | 0 (0.0%) |
| 2 or 3 Rooms | 42 (2.5%) | 97 (10.1%) |
| 4 or 5 Rooms | 310 (18.8%) | 614 (64.0%) |
| 6 or 7 Rooms | 844 (51.3%) | 175 (18.2%) |
| 8 or more Rooms | 449 (27.3%) | 73 (7.6%) |
| Total | 1,645 (100.0%) | 959 (100.0%) |
Housing Structure by Heating Type in Riverside
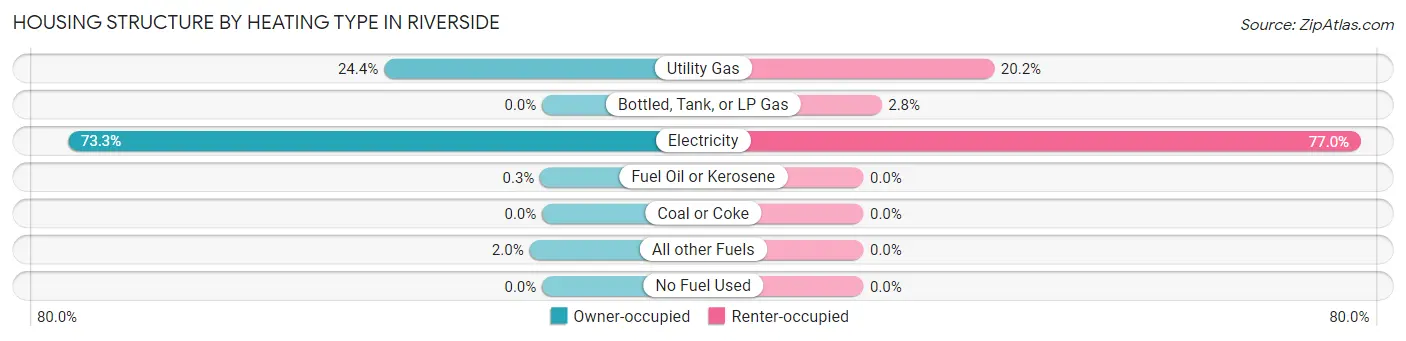
| Heating Type | Owner-occupied | Renter-occupied |
| Utility Gas | 402 (24.4%) | 194 (20.2%) |
| Bottled, Tank, or LP Gas | 0 (0.0%) | 27 (2.8%) |
| Electricity | 1,206 (73.3%) | 738 (77.0%) |
| Fuel Oil or Kerosene | 5 (0.3%) | 0 (0.0%) |
| Coal or Coke | 0 (0.0%) | 0 (0.0%) |
| All other Fuels | 32 (1.9%) | 0 (0.0%) |
| No Fuel Used | 0 (0.0%) | 0 (0.0%) |
| Total | 1,645 (100.0%) | 959 (100.0%) |
Household Vehicle Usage in Riverside
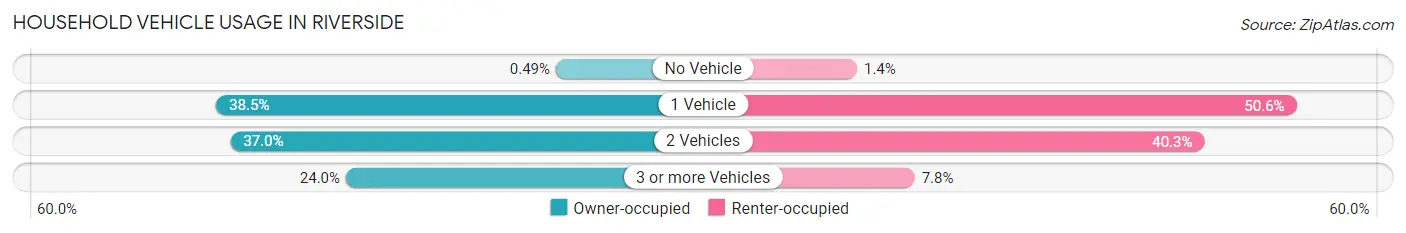
| Vehicles per Household | Owner-occupied | Renter-occupied |
| No Vehicle | 8 (0.5%) | 13 (1.4%) |
| 1 Vehicle | 634 (38.5%) | 485 (50.6%) |
| 2 Vehicles | 608 (37.0%) | 386 (40.3%) |
| 3 or more Vehicles | 395 (24.0%) | 75 (7.8%) |
| Total | 1,645 (100.0%) | 959 (100.0%) |
Real Estate & Mortgages in Riverside
Real Estate and Mortgage Overview in Riverside
| Characteristic | Without Mortgage | With Mortgage |
| Housing Units | 310 | 1,335 |
| Median Property Value | $239,000 | $229,700 |
| Median Household Income | - | - |
| Monthly Housing Costs | $551 | $0 |
| Real Estate Taxes | $3,081 | $64 |
Property Value by Mortgage Status in Riverside
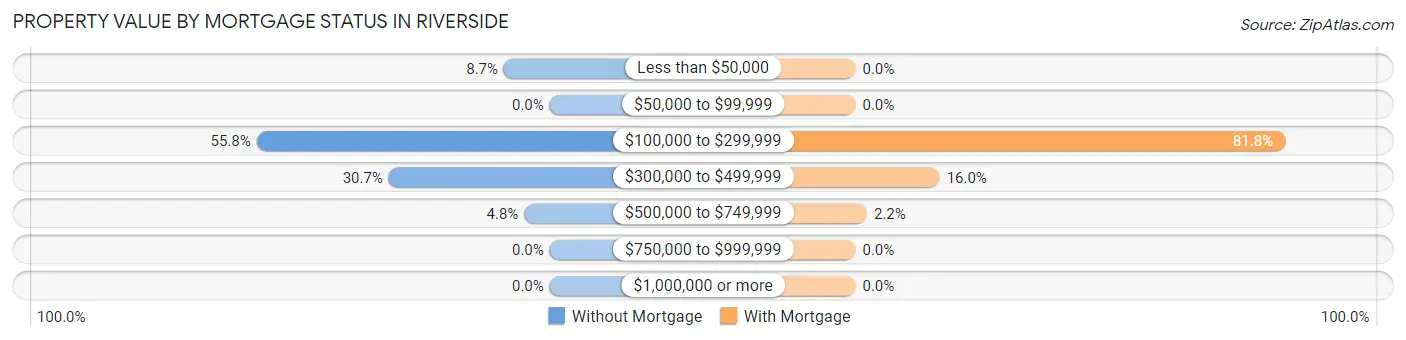
| Property Value | Without Mortgage | With Mortgage |
| Less than $50,000 | 27 (8.7%) | 0 (0.0%) |
| $50,000 to $99,999 | 0 (0.0%) | 0 (0.0%) |
| $100,000 to $299,999 | 173 (55.8%) | 1,092 (81.8%) |
| $300,000 to $499,999 | 95 (30.6%) | 214 (16.0%) |
| $500,000 to $749,999 | 15 (4.8%) | 29 (2.2%) |
| $750,000 to $999,999 | 0 (0.0%) | 0 (0.0%) |
| $1,000,000 or more | 0 (0.0%) | 0 (0.0%) |
| Total | 310 (100.0%) | 1,335 (100.0%) |
Household Income by Mortgage Status in Riverside
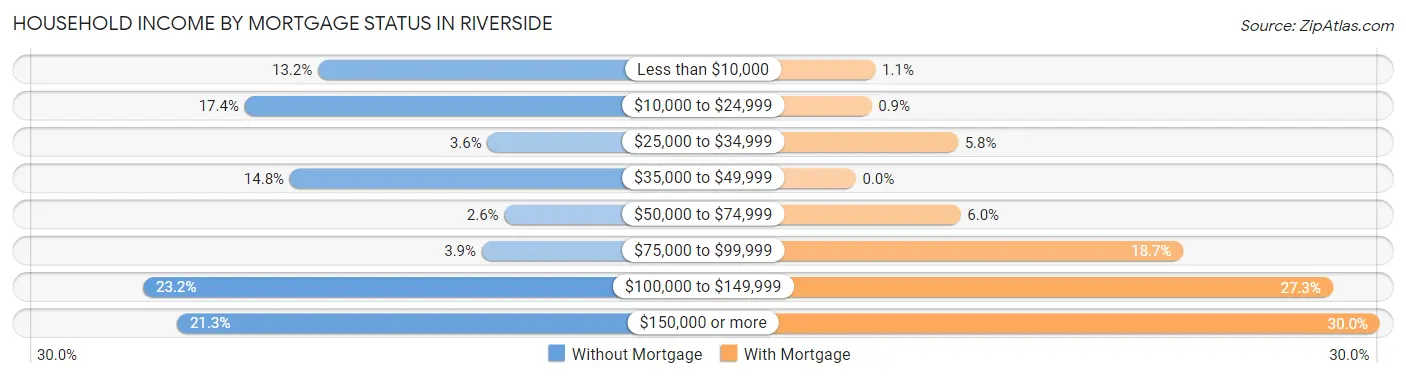
| Household Income | Without Mortgage | With Mortgage |
| Less than $10,000 | 41 (13.2%) | 15 (1.1%) |
| $10,000 to $24,999 | 54 (17.4%) | 12 (0.9%) |
| $25,000 to $34,999 | 11 (3.5%) | 78 (5.8%) |
| $35,000 to $49,999 | 46 (14.8%) | 0 (0.0%) |
| $50,000 to $74,999 | 8 (2.6%) | 80 (6.0%) |
| $75,000 to $99,999 | 12 (3.9%) | 250 (18.7%) |
| $100,000 to $149,999 | 72 (23.2%) | 364 (27.3%) |
| $150,000 or more | 66 (21.3%) | 400 (30.0%) |
| Total | 310 (100.0%) | 1,335 (100.0%) |
Property Value to Household Income Ratio in Riverside
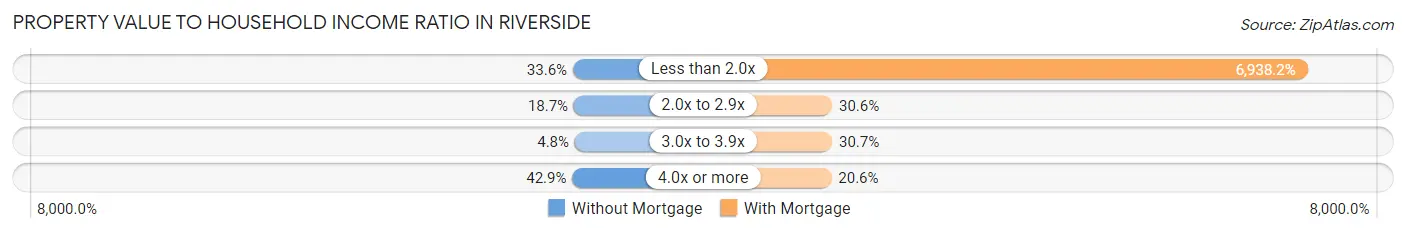
| Value-to-Income Ratio | Without Mortgage | With Mortgage |
| Less than 2.0x | 104 (33.6%) | 92,625 (6,938.2%) |
| 2.0x to 2.9x | 58 (18.7%) | 408 (30.6%) |
| 3.0x to 3.9x | 15 (4.8%) | 410 (30.7%) |
| 4.0x or more | 133 (42.9%) | 275 (20.6%) |
| Total | 310 (100.0%) | 1,335 (100.0%) |
Real Estate Taxes by Mortgage Status in Riverside
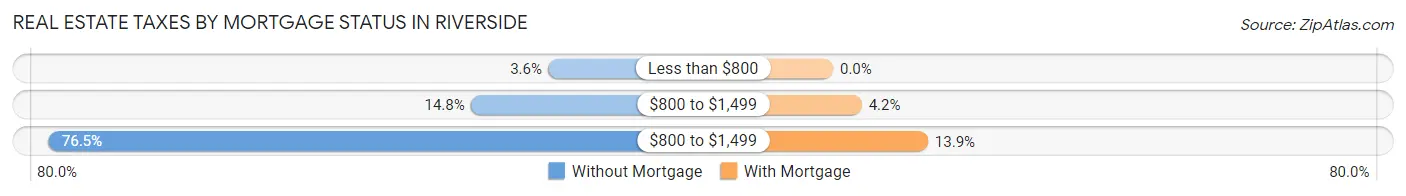
| Property Taxes | Without Mortgage | With Mortgage |
| Less than $800 | 11 (3.5%) | 0 (0.0%) |
| $800 to $1,499 | 46 (14.8%) | 56 (4.2%) |
| $800 to $1,499 | 237 (76.4%) | 185 (13.9%) |
| Total | 310 (100.0%) | 1,335 (100.0%) |
Health & Disability in Riverside
Health Insurance Coverage by Age in Riverside
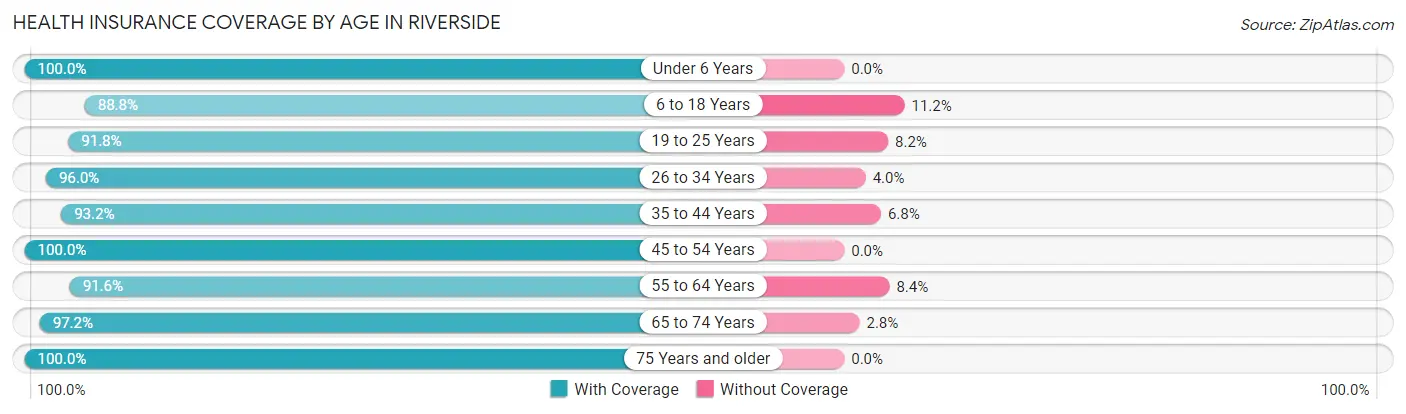
| Age Bracket | With Coverage | Without Coverage |
| Under 6 Years | 351 (100.0%) | 0 (0.0%) |
| 6 to 18 Years | 680 (88.8%) | 86 (11.2%) |
| 19 to 25 Years | 697 (91.8%) | 62 (8.2%) |
| 26 to 34 Years | 1,010 (96.0%) | 42 (4.0%) |
| 35 to 44 Years | 790 (93.2%) | 58 (6.8%) |
| 45 to 54 Years | 703 (100.0%) | 0 (0.0%) |
| 55 to 64 Years | 652 (91.6%) | 60 (8.4%) |
| 65 to 74 Years | 411 (97.2%) | 12 (2.8%) |
| 75 Years and older | 211 (100.0%) | 0 (0.0%) |
| Total | 5,505 (94.5%) | 320 (5.5%) |
Health Insurance Coverage by Citizenship Status in Riverside
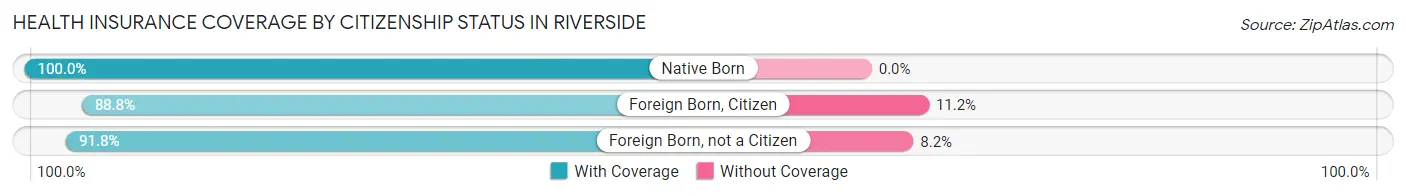
| Citizenship Status | With Coverage | Without Coverage |
| Native Born | 351 (100.0%) | 0 (0.0%) |
| Foreign Born, Citizen | 680 (88.8%) | 86 (11.2%) |
| Foreign Born, not a Citizen | 697 (91.8%) | 62 (8.2%) |
Health Insurance Coverage by Household Income in Riverside
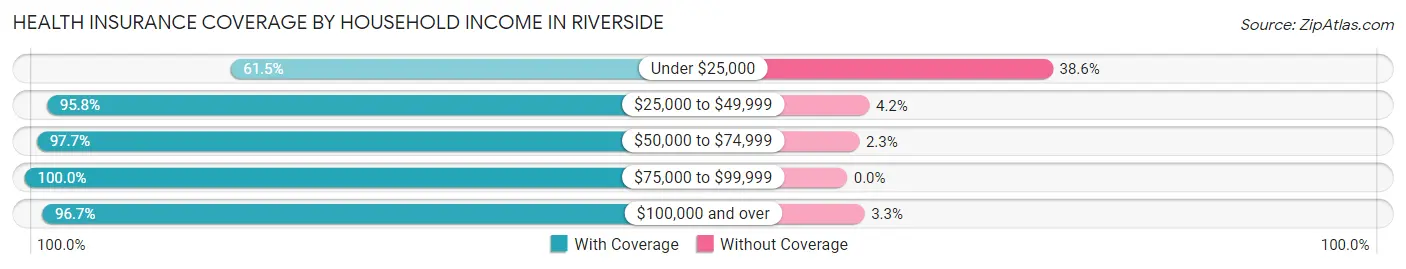
| Household Income | With Coverage | Without Coverage |
| Under $25,000 | 279 (61.5%) | 175 (38.6%) |
| $25,000 to $49,999 | 597 (95.8%) | 26 (4.2%) |
| $50,000 to $74,999 | 685 (97.7%) | 16 (2.3%) |
| $75,000 to $99,999 | 1,000 (100.0%) | 0 (0.0%) |
| $100,000 and over | 2,899 (96.7%) | 98 (3.3%) |
Public vs Private Health Insurance Coverage by Age in Riverside
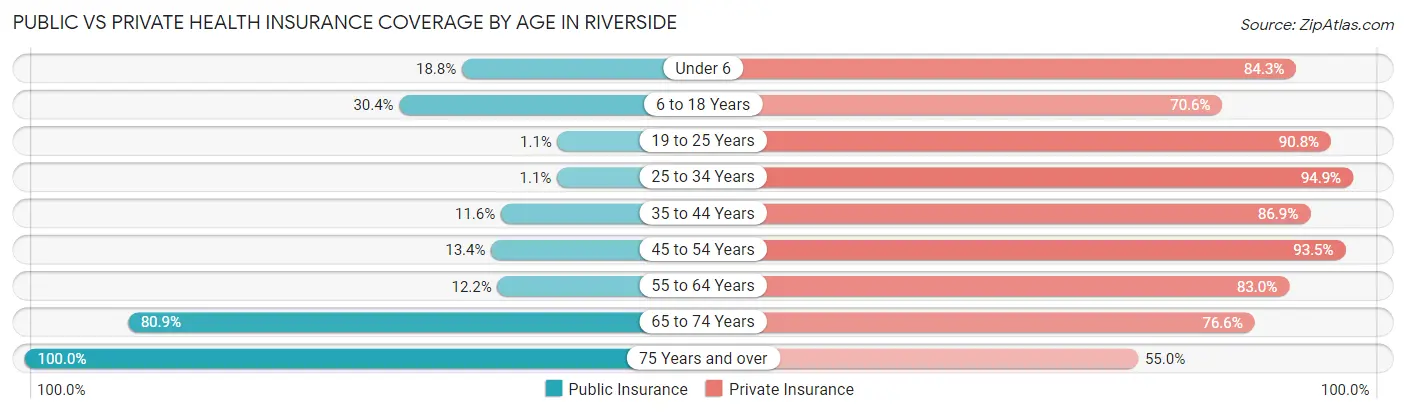
| Age Bracket | Public Insurance | Private Insurance |
| Under 6 | 66 (18.8%) | 296 (84.3%) |
| 6 to 18 Years | 233 (30.4%) | 541 (70.6%) |
| 19 to 25 Years | 8 (1.1%) | 689 (90.8%) |
| 25 to 34 Years | 12 (1.1%) | 998 (94.9%) |
| 35 to 44 Years | 98 (11.6%) | 737 (86.9%) |
| 45 to 54 Years | 94 (13.4%) | 657 (93.5%) |
| 55 to 64 Years | 87 (12.2%) | 591 (83.0%) |
| 65 to 74 Years | 342 (80.8%) | 324 (76.6%) |
| 75 Years and over | 211 (100.0%) | 116 (55.0%) |
| Total | 1,151 (19.8%) | 4,949 (85.0%) |
Disability Status by Sex by Age in Riverside
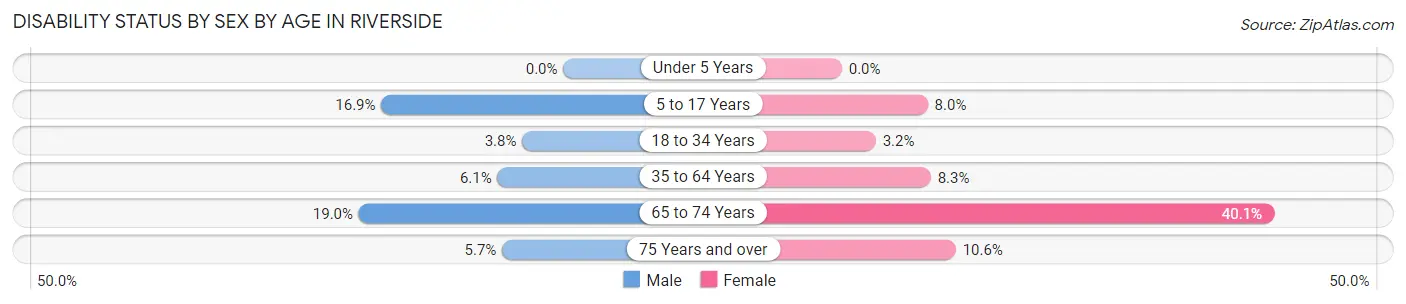
| Age Bracket | Male | Female |
| Under 5 Years | 0 (0.0%) | 0 (0.0%) |
| 5 to 17 Years | 74 (16.9%) | 31 (8.0%) |
| 18 to 34 Years | 41 (3.8%) | 24 (3.2%) |
| 35 to 64 Years | 62 (6.1%) | 103 (8.3%) |
| 65 to 74 Years | 41 (19.0%) | 83 (40.1%) |
| 75 Years and over | 5 (5.7%) | 13 (10.6%) |
Disability Class by Sex by Age in Riverside
Disability Class: Hearing Difficulty
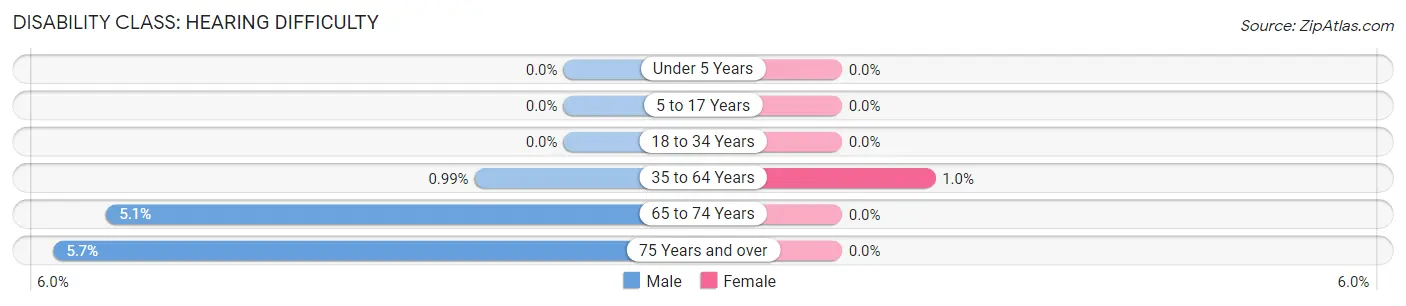
| Age Bracket | Male | Female |
| Under 5 Years | 0 (0.0%) | 0 (0.0%) |
| 5 to 17 Years | 0 (0.0%) | 0 (0.0%) |
| 18 to 34 Years | 0 (0.0%) | 0 (0.0%) |
| 35 to 64 Years | 10 (1.0%) | 13 (1.0%) |
| 65 to 74 Years | 11 (5.1%) | 0 (0.0%) |
| 75 Years and over | 5 (5.7%) | 0 (0.0%) |
Disability Class: Vision Difficulty
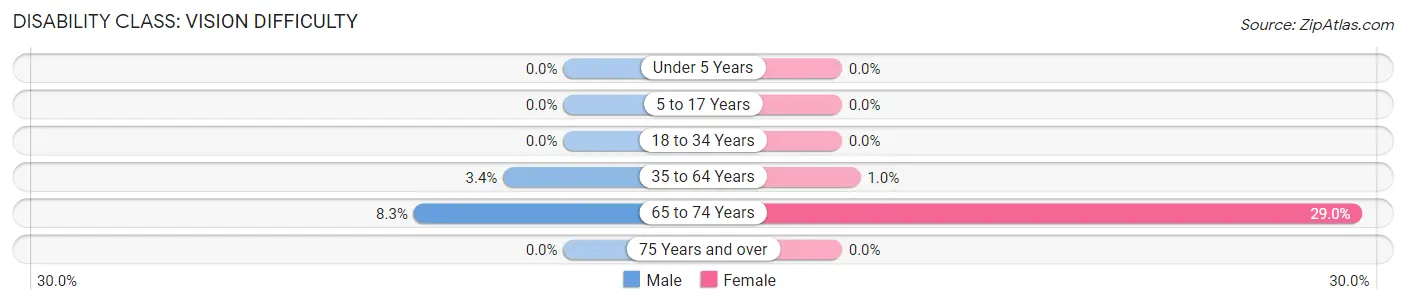
| Age Bracket | Male | Female |
| Under 5 Years | 0 (0.0%) | 0 (0.0%) |
| 5 to 17 Years | 0 (0.0%) | 0 (0.0%) |
| 18 to 34 Years | 0 (0.0%) | 0 (0.0%) |
| 35 to 64 Years | 34 (3.4%) | 13 (1.0%) |
| 65 to 74 Years | 18 (8.3%) | 60 (29.0%) |
| 75 Years and over | 0 (0.0%) | 0 (0.0%) |
Disability Class: Cognitive Difficulty
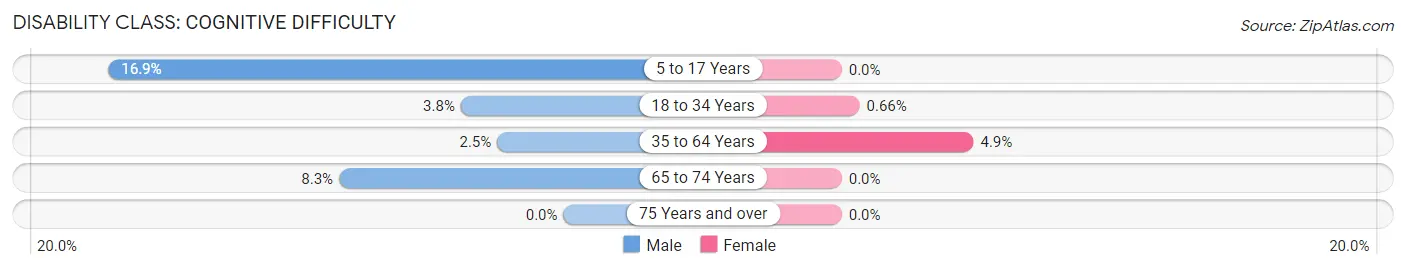
| Age Bracket | Male | Female |
| 5 to 17 Years | 74 (16.9%) | 0 (0.0%) |
| 18 to 34 Years | 41 (3.8%) | 5 (0.7%) |
| 35 to 64 Years | 25 (2.5%) | 61 (4.9%) |
| 65 to 74 Years | 18 (8.3%) | 0 (0.0%) |
| 75 Years and over | 0 (0.0%) | 0 (0.0%) |
Disability Class: Ambulatory Difficulty
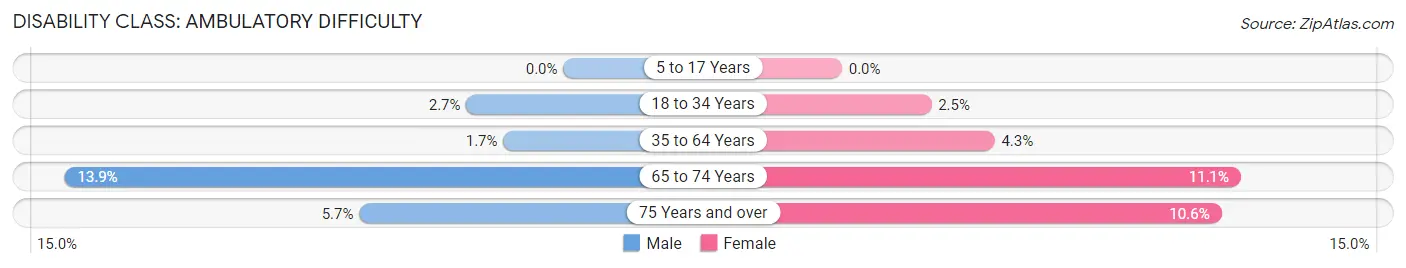
| Age Bracket | Male | Female |
| 5 to 17 Years | 0 (0.0%) | 0 (0.0%) |
| 18 to 34 Years | 29 (2.7%) | 19 (2.5%) |
| 35 to 64 Years | 17 (1.7%) | 53 (4.3%) |
| 65 to 74 Years | 30 (13.9%) | 23 (11.1%) |
| 75 Years and over | 5 (5.7%) | 13 (10.6%) |
Disability Class: Self-Care Difficulty
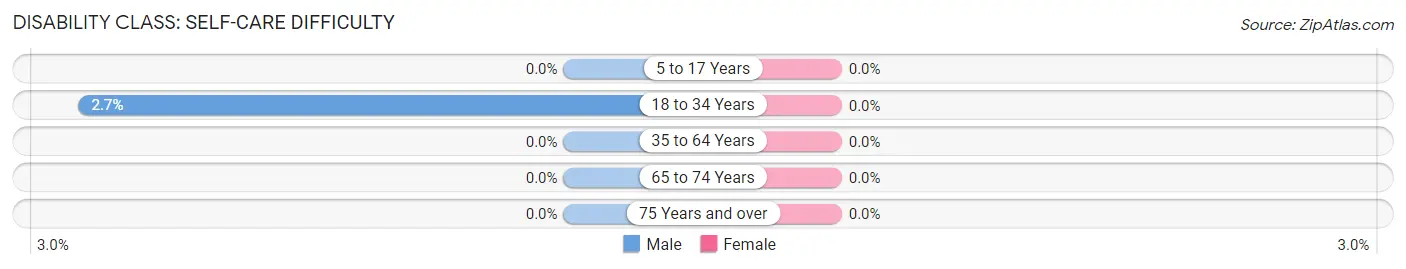
| Age Bracket | Male | Female |
| 5 to 17 Years | 0 (0.0%) | 0 (0.0%) |
| 18 to 34 Years | 29 (2.7%) | 0 (0.0%) |
| 35 to 64 Years | 0 (0.0%) | 0 (0.0%) |
| 65 to 74 Years | 0 (0.0%) | 0 (0.0%) |
| 75 Years and over | 0 (0.0%) | 0 (0.0%) |
Technology Access in Riverside
Computing Device Access in Riverside
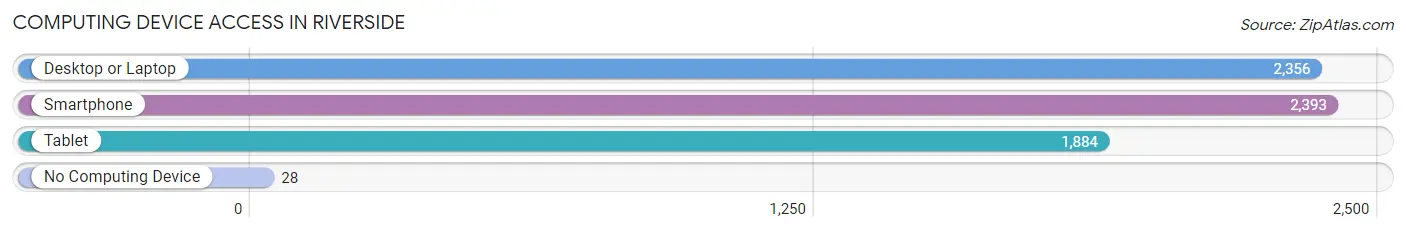
| Device Type | # Households | % Households |
| Desktop or Laptop | 2,356 | 90.5% |
| Smartphone | 2,393 | 91.9% |
| Tablet | 1,884 | 72.4% |
| No Computing Device | 28 | 1.1% |
| Total | 2,604 | 100.0% |
Internet Access in Riverside
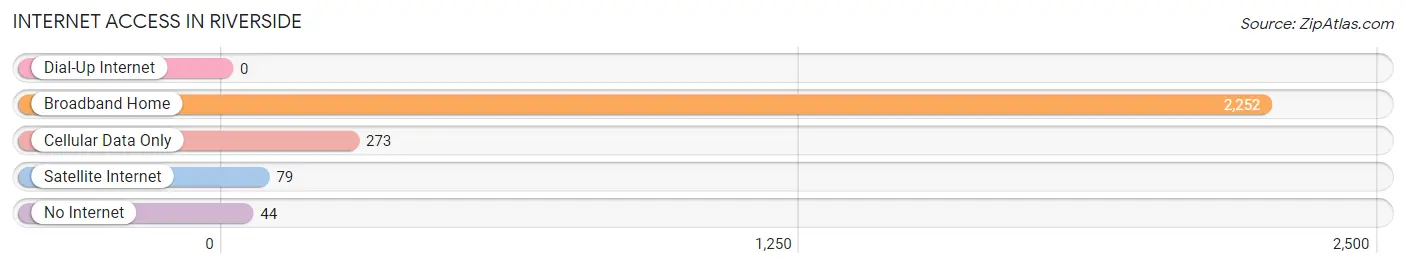
| Internet Type | # Households | % Households |
| Dial-Up Internet | 0 | 0.0% |
| Broadband Home | 2,252 | 86.5% |
| Cellular Data Only | 273 | 10.5% |
| Satellite Internet | 79 | 3.0% |
| No Internet | 44 | 1.7% |
| Total | 2,604 | 100.0% |
Riverside Summary
Riverside, Maryland is a small town located in the northeastern part of the state, just south of Baltimore. It is a part of Baltimore County and is situated on the banks of the Patapsco River. The town has a population of just over 4,000 people and is known for its small-town charm and close-knit community.
History
Riverside was first settled in the late 1700s by a group of German immigrants. The town was originally known as “Riverside” due to its location on the banks of the Patapsco River. The town was officially incorporated in 1887 and was named after the river.
In the early 1900s, Riverside was a popular destination for vacationers and tourists. The town was known for its picturesque views of the river and its many attractions, such as the Riverside Amusement Park. The park was a popular destination for families and featured a roller coaster, a carousel, and a ferris wheel.
In the 1950s, Riverside began to experience a decline in tourism due to the rise of suburbanization. The town’s population began to decline as people moved away to the suburbs. In the 1970s, the town began to experience a resurgence in popularity as people began to move back to the area.
Geography
Riverside is located in the northeastern part of Maryland, just south of Baltimore. The town is situated on the banks of the Patapsco River and is surrounded by rolling hills and forests. The town is located in a temperate climate zone and experiences mild winters and hot summers.
Economy
Riverside’s economy is largely based on tourism and retail. The town is home to several small businesses, including restaurants, shops, and galleries. The town also has a thriving arts scene, with several galleries and performance venues.
The town is also home to several large employers, including the Riverside Amusement Park, which is a popular destination for families. The park features a roller coaster, a carousel, and a ferris wheel.
Demographics
Riverside has a population of just over 4,000 people. The town is predominantly white, with a small African American population. The median household income is $50,000 and the median home value is $200,000. The town has a low crime rate and is considered a safe place to live.
Riverside is a small town with a close-knit community. The town is known for its small-town charm and its picturesque views of the Patapsco River. The town is a popular destination for tourists and families and is home to several small businesses and attractions.
Common Questions
What is Per Capita Income in Riverside?
Per Capita income in Riverside is $44,828.
What is the Median Family Income in Riverside?
Median Family Income in Riverside is $110,077.
What is the Median Household income in Riverside?
Median Household Income in Riverside is $91,842.
What is Income or Wage Gap in Riverside?
Income or Wage Gap in Riverside is 8.7%.
Women in Riverside earn 91.3 cents for every dollar earned by a man.
What is Inequality or Gini Index in Riverside?
Inequality or Gini Index in Riverside is 0.34.
What is the Total Population of Riverside?
Total Population of Riverside is 5,924.
What is the Total Male Population of Riverside?
Total Male Population of Riverside is 3,013.
What is the Total Female Population of Riverside?
Total Female Population of Riverside is 2,911.
What is the Ratio of Males per 100 Females in Riverside?
There are 103.50 Males per 100 Females in Riverside.
What is the Ratio of Females per 100 Males in Riverside?
There are 96.61 Females per 100 Males in Riverside.
What is the Median Population Age in Riverside?
Median Population Age in Riverside is 35.5 Years.
What is the Average Family Size in Riverside
Average Family Size in Riverside is 2.9 People.
What is the Average Household Size in Riverside
Average Household Size in Riverside is 2.2 People.
How Large is the Labor Force in Riverside?
There are 3,890 People in the Labor Forcein in Riverside.
What is the Percentage of People in the Labor Force in Riverside?
78.8% of People are in the Labor Force in Riverside.
What is the Unemployment Rate in Riverside?
Unemployment Rate in Riverside is 1.1%.