Brentwood, MO Map & Demographics
Brentwood Map
Brentwood Overview
$62,793
PER CAPITA INCOME
$118,923
AVG FAMILY INCOME
$89,688
AVG HOUSEHOLD INCOME
28.4%
WAGE / INCOME GAP [ % ]
71.6¢/ $1
WAGE / INCOME GAP [ $ ]
0.45
INEQUALITY / GINI INDEX
8,173
TOTAL POPULATION
4,036
MALE POPULATION
4,137
FEMALE POPULATION
97.56
MALES / 100 FEMALES
102.50
FEMALES / 100 MALES
35.8
MEDIAN AGE
2.8
AVG FAMILY SIZE
2.0
AVG HOUSEHOLD SIZE
5,058
LABOR FORCE [ PEOPLE ]
74.5%
PERCENT IN LABOR FORCE
2.3%
UNEMPLOYMENT RATE
Brentwood Area Codes
Income in Brentwood
Income Overview in Brentwood
Per Capita Income in Brentwood is $62,793, while median incomes of families and households are $118,923 and $89,688 respectively.
| Characteristic | Number | Measure |
| Per Capita Income | 8,173 | $62,793 |
| Median Family Income | 1,850 | $118,923 |
| Mean Family Income | 1,850 | $159,346 |
| Median Household Income | 4,101 | $89,688 |
| Mean Household Income | 4,101 | $124,423 |
| Income Deficit | 1,850 | $0 |
| Wage / Income Gap (%) | 8,173 | 28.41% |
| Wage / Income Gap ($) | 8,173 | 71.59¢ per $1 |
| Gini / Inequality Index | 8,173 | 0.45 |
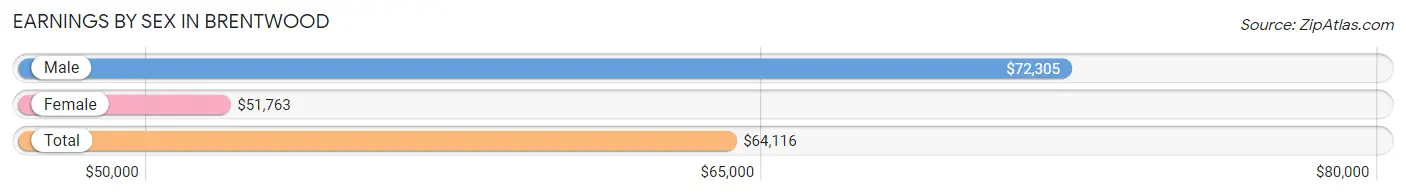
Earnings by Sex in Brentwood
Average Earnings in Brentwood are $64,116, $72,305 for men and $51,763 for women, a difference of 28.4%.
| Sex | Number | Average Earnings |
| Male | 2,486 (47.8%) | $72,305 |
| Female | 2,719 (52.2%) | $51,763 |
| Total | 5,205 (100.0%) | $64,116 |
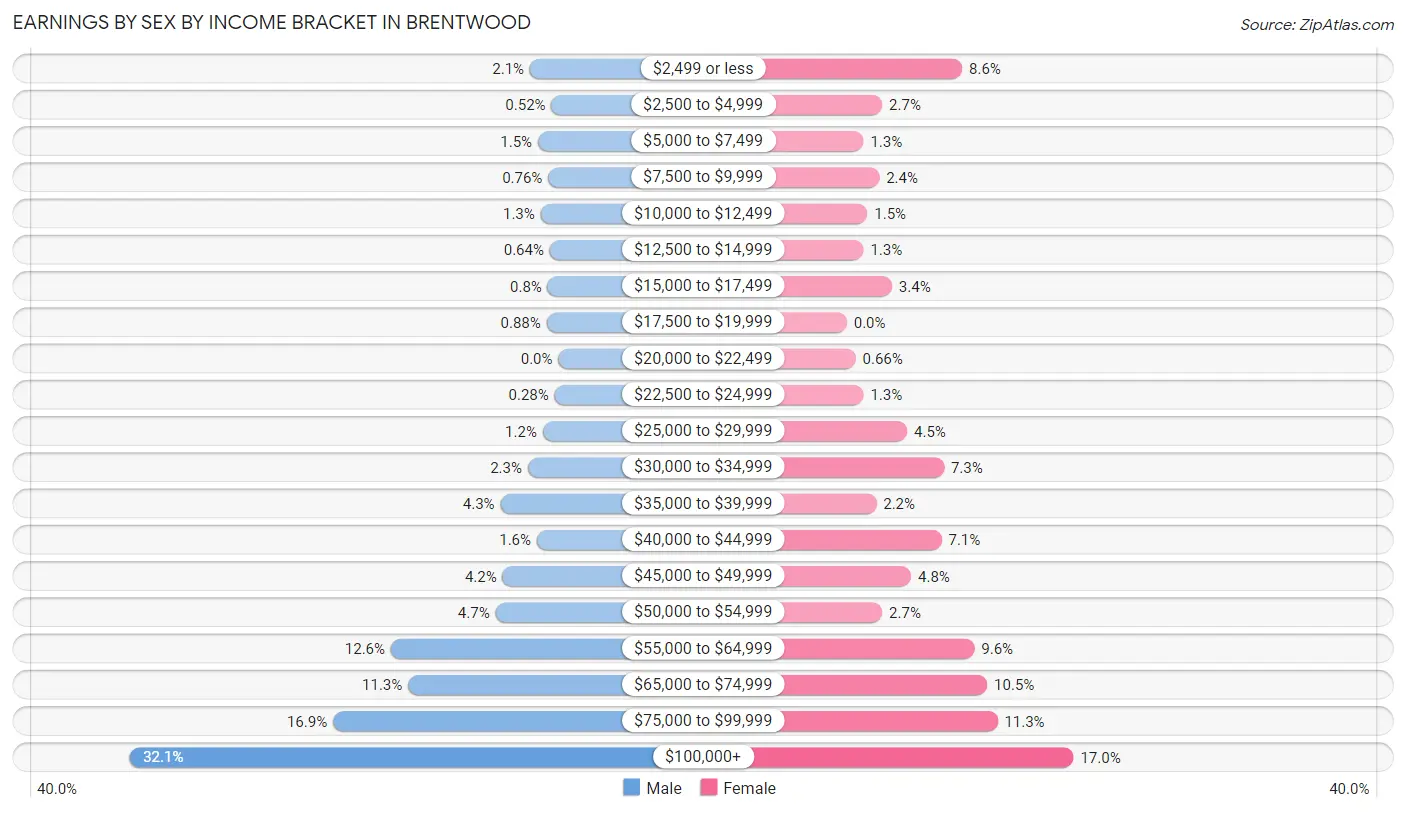
Earnings by Sex by Income Bracket in Brentwood
The most common earnings brackets in Brentwood are $100,000+ for men (798 | 32.1%) and $100,000+ for women (462 | 17.0%).
| Income | Male | Female |
| $2,499 or less | 53 (2.1%) | 235 (8.6%) |
| $2,500 to $4,999 | 13 (0.5%) | 72 (2.6%) |
| $5,000 to $7,499 | 38 (1.5%) | 34 (1.3%) |
| $7,500 to $9,999 | 19 (0.8%) | 66 (2.4%) |
| $10,000 to $12,499 | 33 (1.3%) | 42 (1.5%) |
| $12,500 to $14,999 | 16 (0.6%) | 34 (1.3%) |
| $15,000 to $17,499 | 20 (0.8%) | 92 (3.4%) |
| $17,500 to $19,999 | 22 (0.9%) | 0 (0.0%) |
| $20,000 to $22,499 | 0 (0.0%) | 18 (0.7%) |
| $22,500 to $24,999 | 7 (0.3%) | 34 (1.3%) |
| $25,000 to $29,999 | 29 (1.2%) | 123 (4.5%) |
| $30,000 to $34,999 | 57 (2.3%) | 198 (7.3%) |
| $35,000 to $39,999 | 108 (4.3%) | 60 (2.2%) |
| $40,000 to $44,999 | 40 (1.6%) | 193 (7.1%) |
| $45,000 to $49,999 | 104 (4.2%) | 131 (4.8%) |
| $50,000 to $54,999 | 117 (4.7%) | 72 (2.6%) |
| $55,000 to $64,999 | 312 (12.6%) | 260 (9.6%) |
| $65,000 to $74,999 | 280 (11.3%) | 286 (10.5%) |
| $75,000 to $99,999 | 420 (16.9%) | 307 (11.3%) |
| $100,000+ | 798 (32.1%) | 462 (17.0%) |
| Total | 2,486 (100.0%) | 2,719 (100.0%) |
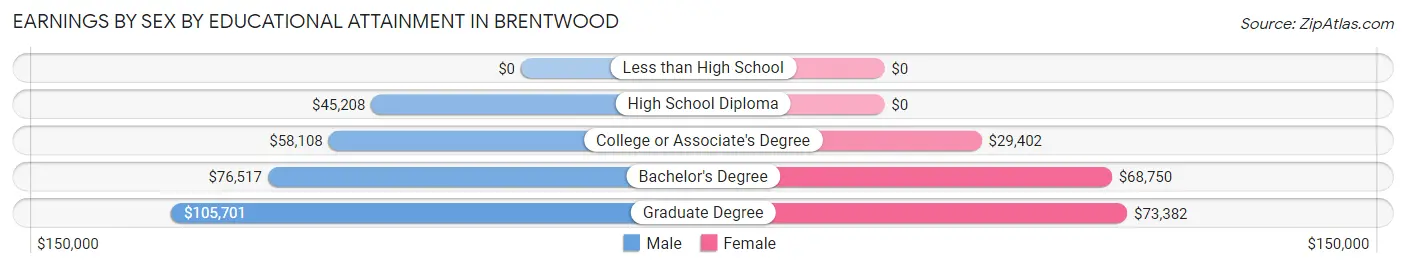
Earnings by Sex by Educational Attainment in Brentwood
Average earnings in Brentwood are $78,711 for men and $60,331 for women, a difference of 23.4%. Men with an educational attainment of graduate degree enjoy the highest average annual earnings of $105,701, while those with high school diploma education earn the least with $45,208. Women with an educational attainment of graduate degree earn the most with the average annual earnings of $73,382, while those with college or associate's degree education have the smallest earnings of $29,402.
| Educational Attainment | Male Income | Female Income |
| Less than High School | - | - |
| High School Diploma | $45,208 | $0 |
| College or Associate's Degree | $58,108 | $29,402 |
| Bachelor's Degree | $76,517 | $68,750 |
| Graduate Degree | $105,701 | $73,382 |
| Total | $78,711 | $60,331 |
Family Income in Brentwood
Family Income Brackets in Brentwood
According to the Brentwood family income data, there are 501 families falling into the $200,000+ income range, which is the most common income bracket and makes up 27.1% of all families.
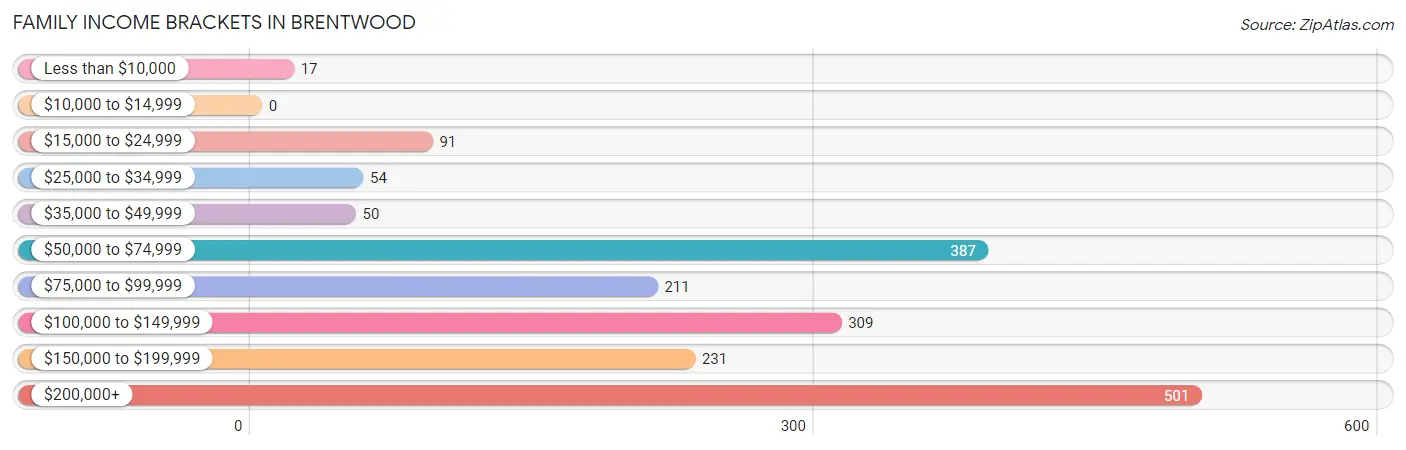
| Income Bracket | # Families | % Families |
| Less than $10,000 | 17 | 0.9% |
| $10,000 to $14,999 | 0 | 0.0% |
| $15,000 to $24,999 | 91 | 4.9% |
| $25,000 to $34,999 | 54 | 2.9% |
| $35,000 to $49,999 | 50 | 2.7% |
| $50,000 to $74,999 | 387 | 20.9% |
| $75,000 to $99,999 | 211 | 11.4% |
| $100,000 to $149,999 | 309 | 16.7% |
| $150,000 to $199,999 | 231 | 12.5% |
| $200,000+ | 501 | 27.1% |
Family Income by Famaliy Size in Brentwood
4-person families (322 | 17.4%) account for the highest median family income in Brentwood with $250,001 per family, while 4-person families (322 | 17.4%) have the highest median income of $62,500 per family member.
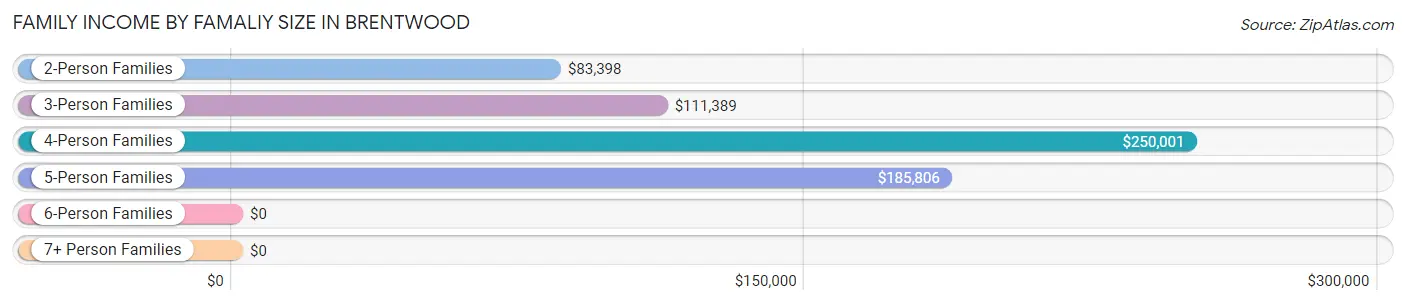
| Income Bracket | # Families | Median Income |
| 2-Person Families | 1,037 (56.0%) | $83,398 |
| 3-Person Families | 364 (19.7%) | $111,389 |
| 4-Person Families | 322 (17.4%) | $250,001 |
| 5-Person Families | 102 (5.5%) | $185,806 |
| 6-Person Families | 25 (1.3%) | $0 |
| 7+ Person Families | 0 (0.0%) | $0 |
| Total | 1,850 (100.0%) | $118,923 |
Family Income by Number of Earners in Brentwood
The median family income in Brentwood is $118,923, with families comprising 2 earners (878) having the highest median family income of $164,333, while families with no earners (310) have the lowest median family income of $63,862, accounting for 47.5% and 16.8% of families, respectively.
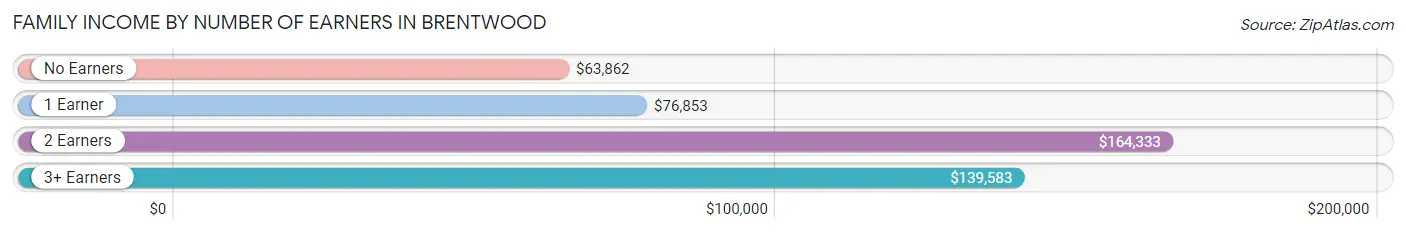
| Number of Earners | # Families | Median Income |
| No Earners | 310 (16.8%) | $63,862 |
| 1 Earner | 461 (24.9%) | $76,853 |
| 2 Earners | 878 (47.5%) | $164,333 |
| 3+ Earners | 201 (10.9%) | $139,583 |
| Total | 1,850 (100.0%) | $118,923 |
Household Income in Brentwood
Household Income Brackets in Brentwood
With 894 households falling in the category, the $100,000 to $149,999 income range is the most frequent in Brentwood, accounting for 21.8% of all households. In contrast, only 45 households (1.1%) fall into the $10,000 to $14,999 income bracket, making it the least populous group.
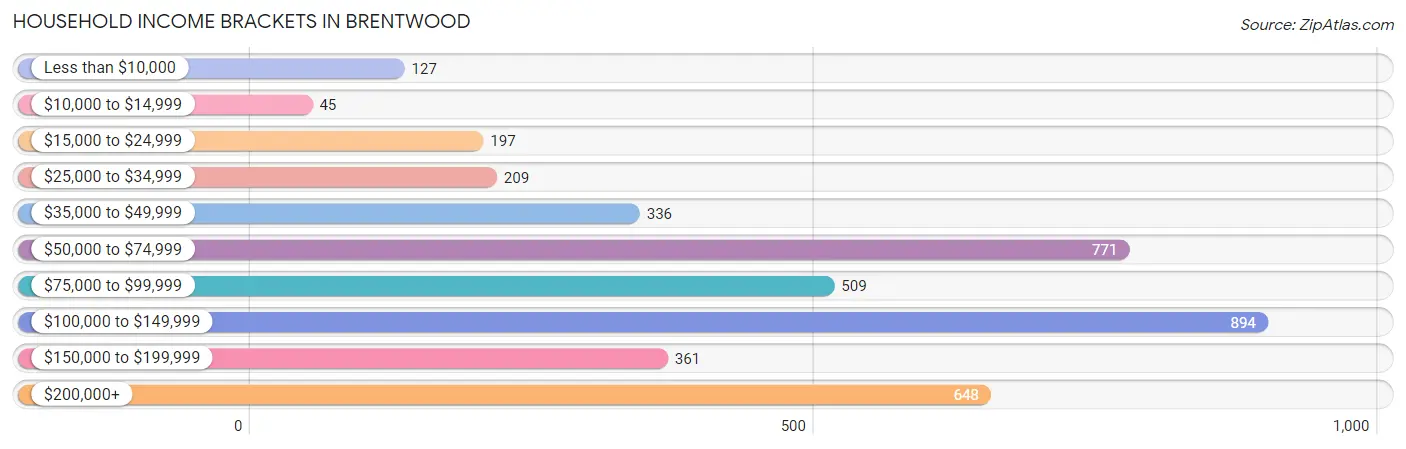
| Income Bracket | # Households | % Households |
| Less than $10,000 | 127 | 3.1% |
| $10,000 to $14,999 | 45 | 1.1% |
| $15,000 to $24,999 | 197 | 4.8% |
| $25,000 to $34,999 | 209 | 5.1% |
| $35,000 to $49,999 | 336 | 8.2% |
| $50,000 to $74,999 | 771 | 18.8% |
| $75,000 to $99,999 | 509 | 12.4% |
| $100,000 to $149,999 | 894 | 21.8% |
| $150,000 to $199,999 | 361 | 8.8% |
| $200,000+ | 648 | 15.8% |
Household Income by Householder Age in Brentwood
The median household income in Brentwood is $89,688, with the highest median household income of $108,750 found in the 45 to 64 years age bracket for the primary householder. A total of 1,076 households (26.2%) fall into this category. Meanwhile, the 15 to 24 years age bracket for the primary householder has the lowest median household income of $0, with 207 households (5.1%) in this group.
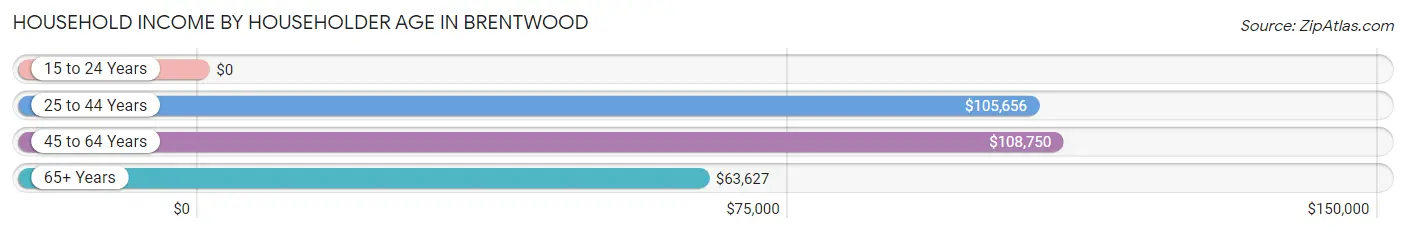
| Income Bracket | # Households | Median Income |
| 15 to 24 Years | 207 (5.1%) | $0 |
| 25 to 44 Years | 1,945 (47.4%) | $105,656 |
| 45 to 64 Years | 1,076 (26.2%) | $108,750 |
| 65+ Years | 873 (21.3%) | $63,627 |
| Total | 4,101 (100.0%) | $89,688 |
Poverty in Brentwood
Income Below Poverty by Sex and Age in Brentwood
With 5.9% poverty level for males and 5.3% for females among the residents of Brentwood, 18 to 24 year old males and 16 and 17 year old females are the most vulnerable to poverty, with 53 males (14.4%) and 16 females (39.0%) in their respective age groups living below the poverty level.
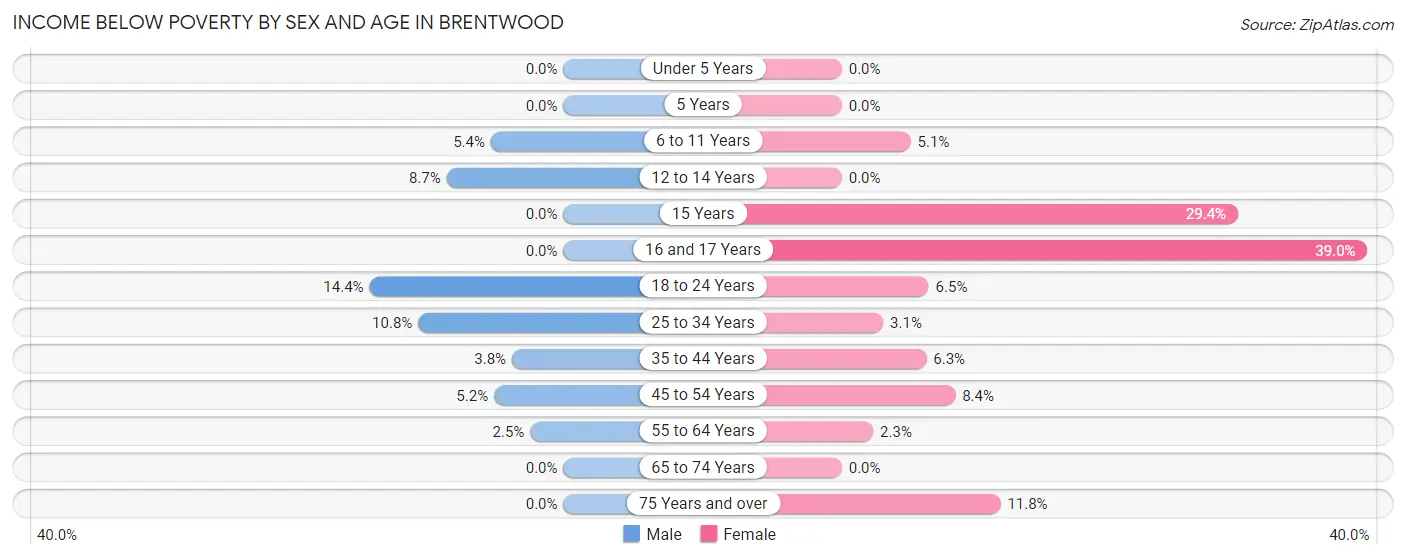
| Age Bracket | Male | Female |
| Under 5 Years | 0 (0.0%) | 0 (0.0%) |
| 5 Years | 0 (0.0%) | 0 (0.0%) |
| 6 to 11 Years | 16 (5.4%) | 9 (5.1%) |
| 12 to 14 Years | 15 (8.7%) | 0 (0.0%) |
| 15 Years | 0 (0.0%) | 15 (29.4%) |
| 16 and 17 Years | 0 (0.0%) | 16 (39.0%) |
| 18 to 24 Years | 53 (14.4%) | 30 (6.5%) |
| 25 to 34 Years | 95 (10.8%) | 23 (3.1%) |
| 35 to 44 Years | 26 (3.8%) | 45 (6.3%) |
| 45 to 54 Years | 17 (5.1%) | 33 (8.4%) |
| 55 to 64 Years | 10 (2.5%) | 11 (2.3%) |
| 65 to 74 Years | 0 (0.0%) | 0 (0.0%) |
| 75 Years and over | 0 (0.0%) | 35 (11.8%) |
| Total | 232 (5.9%) | 217 (5.3%) |
Income Above Poverty by Sex and Age in Brentwood
According to the poverty statistics in Brentwood, males aged under 5 years and females aged under 5 years are the age groups that are most secure financially, with 100.0% of males and 100.0% of females in these age groups living above the poverty line.
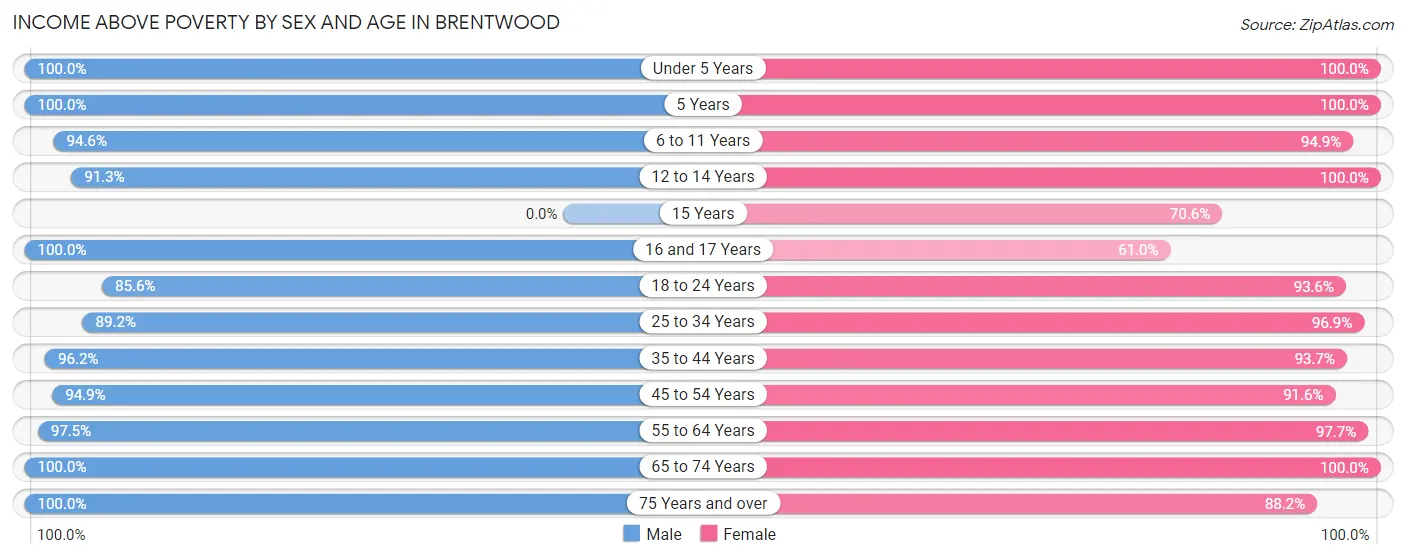
| Age Bracket | Male | Female |
| Under 5 Years | 200 (100.0%) | 192 (100.0%) |
| 5 Years | 58 (100.0%) | 28 (100.0%) |
| 6 to 11 Years | 281 (94.6%) | 167 (94.9%) |
| 12 to 14 Years | 158 (91.3%) | 123 (100.0%) |
| 15 Years | 0 (0.0%) | 36 (70.6%) |
| 16 and 17 Years | 58 (100.0%) | 25 (61.0%) |
| 18 to 24 Years | 315 (85.6%) | 435 (93.5%) |
| 25 to 34 Years | 786 (89.2%) | 726 (96.9%) |
| 35 to 44 Years | 654 (96.2%) | 671 (93.7%) |
| 45 to 54 Years | 313 (94.9%) | 359 (91.6%) |
| 55 to 64 Years | 396 (97.5%) | 461 (97.7%) |
| 65 to 74 Years | 333 (100.0%) | 422 (100.0%) |
| 75 Years and over | 174 (100.0%) | 262 (88.2%) |
| Total | 3,726 (94.1%) | 3,907 (94.7%) |
Income Below Poverty Among Married-Couple Families in Brentwood
The poverty statistics for married-couple families in Brentwood show that 2.0% or 27 of the total 1,362 families live below the poverty line. Families with 1 or 2 children have the highest poverty rate of 2.3%, comprising of 10 families. On the other hand, families with 3 or 4 children have the lowest poverty rate of 0.0%, which includes 0 families.
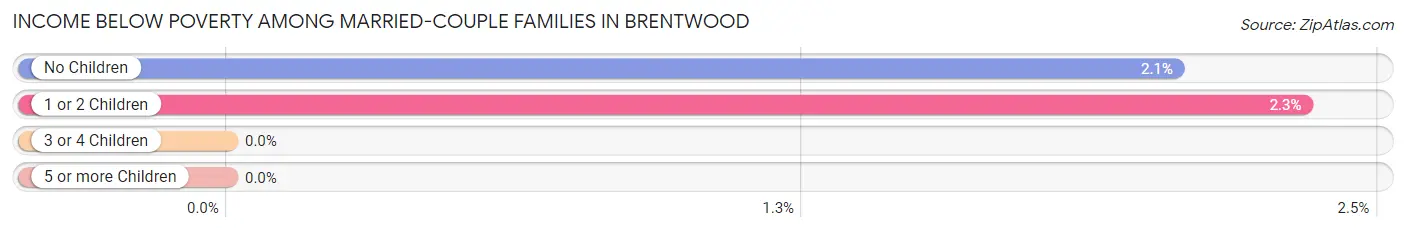
| Children | Above Poverty | Below Poverty |
| No Children | 809 (97.9%) | 17 (2.1%) |
| 1 or 2 Children | 418 (97.7%) | 10 (2.3%) |
| 3 or 4 Children | 108 (100.0%) | 0 (0.0%) |
| 5 or more Children | 0 (0.0%) | 0 (0.0%) |
| Total | 1,335 (98.0%) | 27 (2.0%) |
Income Below Poverty Among Single-Parent Households in Brentwood
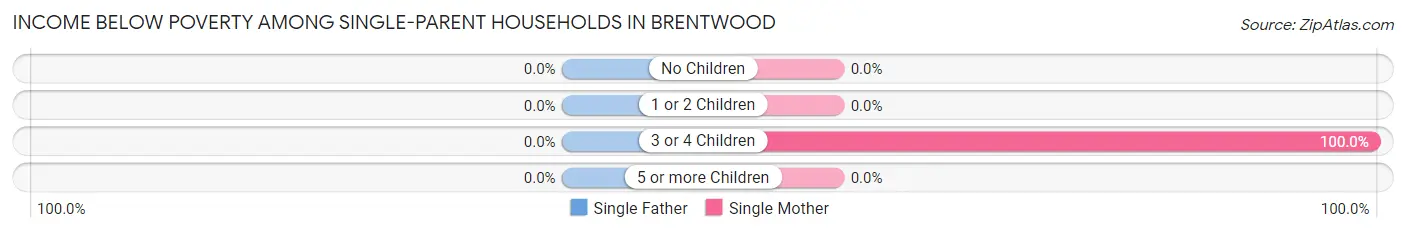
| Children | Single Father | Single Mother |
| No Children | 0 (0.0%) | 0 (0.0%) |
| 1 or 2 Children | 0 (0.0%) | 0 (0.0%) |
| 3 or 4 Children | 0 (0.0%) | 16 (100.0%) |
| 5 or more Children | 0 (0.0%) | 0 (0.0%) |
| Total | 0 (0.0%) | 16 (4.5%) |
Income Below Poverty Among Married-Couple vs Single-Parent Households in Brentwood
The poverty data for Brentwood shows that 27 of the married-couple family households (2.0%) and 16 of the single-parent households (3.3%) are living below the poverty level. Within the married-couple family households, those with 1 or 2 children have the highest poverty rate, with 10 households (2.3%) falling below the poverty line. Among the single-parent households, those with 3 or 4 children have the highest poverty rate, with 16 household (100.0%) living below poverty.
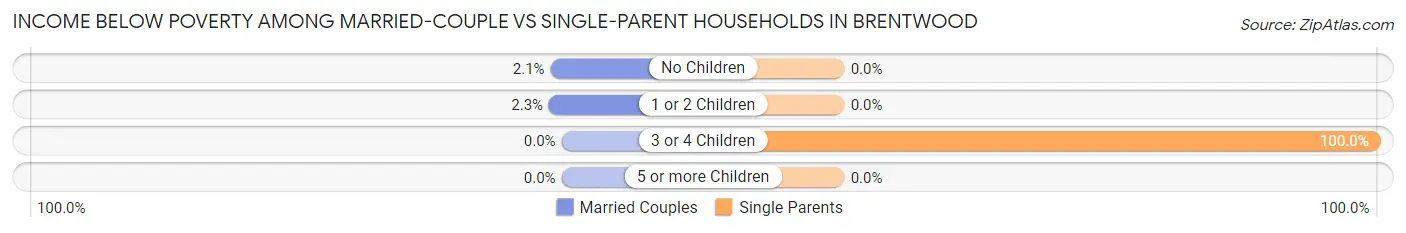
| Children | Married-Couple Families | Single-Parent Households |
| No Children | 17 (2.1%) | 0 (0.0%) |
| 1 or 2 Children | 10 (2.3%) | 0 (0.0%) |
| 3 or 4 Children | 0 (0.0%) | 16 (100.0%) |
| 5 or more Children | 0 (0.0%) | 0 (0.0%) |
| Total | 27 (2.0%) | 16 (3.3%) |
Race in Brentwood
The most populous races in Brentwood are White / Caucasian (6,610 | 80.9%), Two or more Races (738 | 9.0%), and Asian (510 | 6.2%).
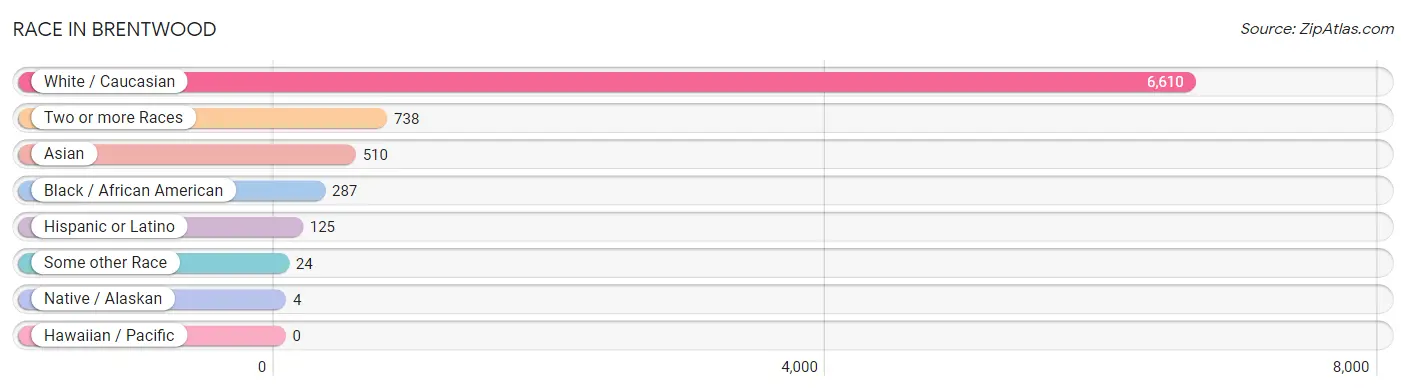
| Race | # Population | % Population |
| Asian | 510 | 6.2% |
| Black / African American | 287 | 3.5% |
| Hawaiian / Pacific | 0 | 0.0% |
| Hispanic or Latino | 125 | 1.5% |
| Native / Alaskan | 4 | 0.1% |
| White / Caucasian | 6,610 | 80.9% |
| Two or more Races | 738 | 9.0% |
| Some other Race | 24 | 0.3% |
| Total | 8,173 | 100.0% |
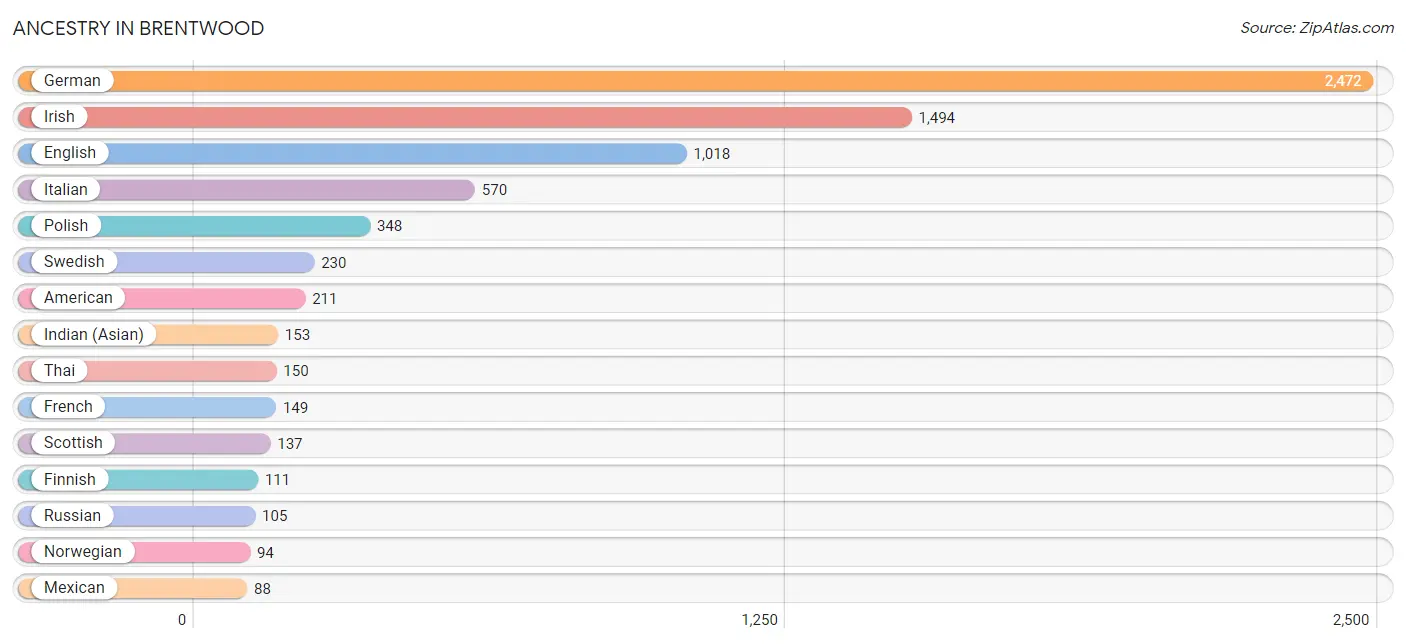
Ancestry in Brentwood
The most populous ancestries reported in Brentwood are German (2,472 | 30.2%), Irish (1,494 | 18.3%), English (1,018 | 12.5%), Italian (570 | 7.0%), and Polish (348 | 4.3%), together accounting for 72.2% of all Brentwood residents.
| Ancestry | # Population | % Population |
| Alsatian | 10 | 0.1% |
| American | 211 | 2.6% |
| Arab | 48 | 0.6% |
| Armenian | 14 | 0.2% |
| Austrian | 69 | 0.8% |
| Belgian | 19 | 0.2% |
| Bhutanese | 26 | 0.3% |
| Blackfeet | 6 | 0.1% |
| British | 28 | 0.3% |
| Burmese | 33 | 0.4% |
| Central American | 13 | 0.2% |
| Central American Indian | 19 | 0.2% |
| Cherokee | 7 | 0.1% |
| Colombian | 6 | 0.1% |
| Croatian | 20 | 0.2% |
| Czech | 62 | 0.8% |
| Czechoslovakian | 18 | 0.2% |
| Danish | 11 | 0.1% |
| Dutch | 62 | 0.8% |
| English | 1,018 | 12.5% |
| European | 85 | 1.0% |
| Filipino | 30 | 0.4% |
| Finnish | 111 | 1.4% |
| French | 149 | 1.8% |
| German | 2,472 | 30.2% |
| Greek | 66 | 0.8% |
| Hungarian | 43 | 0.5% |
| Indian (Asian) | 153 | 1.9% |
| Irish | 1,494 | 18.3% |
| Israeli | 20 | 0.2% |
| Italian | 570 | 7.0% |
| Jamaican | 37 | 0.4% |
| Korean | 74 | 0.9% |
| Latvian | 10 | 0.1% |
| Lebanese | 8 | 0.1% |
| Lithuanian | 38 | 0.5% |
| Malaysian | 10 | 0.1% |
| Mexican | 88 | 1.1% |
| Mexican American Indian | 19 | 0.2% |
| Norwegian | 94 | 1.1% |
| Pakistani | 11 | 0.1% |
| Panamanian | 13 | 0.2% |
| Pennsylvania German | 9 | 0.1% |
| Peruvian | 9 | 0.1% |
| Polish | 348 | 4.3% |
| Puerto Rican | 9 | 0.1% |
| Romanian | 17 | 0.2% |
| Russian | 105 | 1.3% |
| Scandinavian | 8 | 0.1% |
| Scotch-Irish | 27 | 0.3% |
| Scottish | 137 | 1.7% |
| Serbian | 14 | 0.2% |
| Slovak | 72 | 0.9% |
| South American | 15 | 0.2% |
| Sri Lankan | 56 | 0.7% |
| Swedish | 230 | 2.8% |
| Syrian | 40 | 0.5% |
| Thai | 150 | 1.8% |
| Turkish | 14 | 0.2% |
| Welsh | 53 | 0.6% | View All 60 Rows |
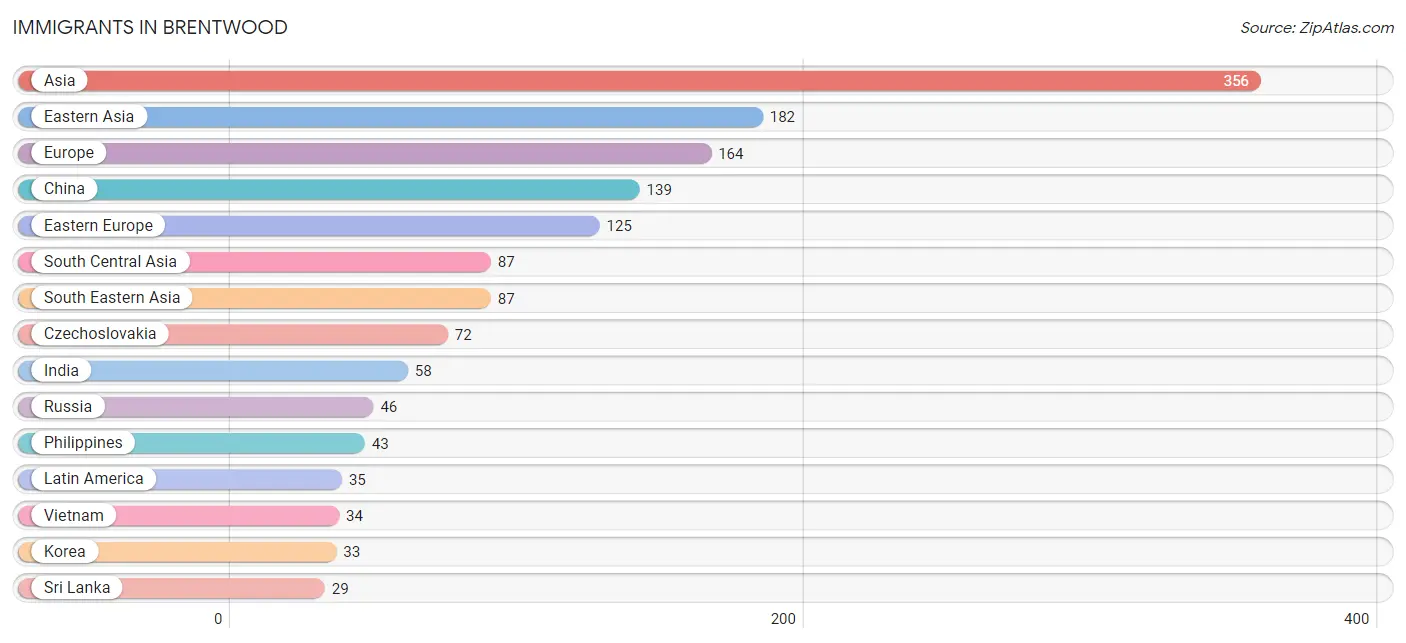
Immigrants in Brentwood
The most numerous immigrant groups reported in Brentwood came from Asia (356 | 4.4%), Eastern Asia (182 | 2.2%), Europe (164 | 2.0%), China (139 | 1.7%), and Eastern Europe (125 | 1.5%), together accounting for 11.8% of all Brentwood residents.
| Immigration Origin | # Population | % Population |
| Africa | 11 | 0.1% |
| Asia | 356 | 4.4% |
| Central America | 13 | 0.2% |
| China | 139 | 1.7% |
| Colombia | 22 | 0.3% |
| Czechoslovakia | 72 | 0.9% |
| Eastern Asia | 182 | 2.2% |
| Eastern Europe | 125 | 1.5% |
| Europe | 164 | 2.0% |
| France | 11 | 0.1% |
| Germany | 17 | 0.2% |
| Greece | 11 | 0.1% |
| India | 58 | 0.7% |
| Japan | 10 | 0.1% |
| Korea | 33 | 0.4% |
| Laos | 10 | 0.1% |
| Latin America | 35 | 0.4% |
| Lithuania | 7 | 0.1% |
| Middle Africa | 11 | 0.1% |
| Panama | 13 | 0.2% |
| Philippines | 43 | 0.5% |
| Russia | 46 | 0.6% |
| South America | 22 | 0.3% |
| South Central Asia | 87 | 1.1% |
| South Eastern Asia | 87 | 1.1% |
| Southern Europe | 11 | 0.1% |
| Sri Lanka | 29 | 0.4% |
| Taiwan | 18 | 0.2% |
| Vietnam | 34 | 0.4% |
| Western Europe | 28 | 0.3% |
| Zaire | 11 | 0.1% | View All 31 Rows |
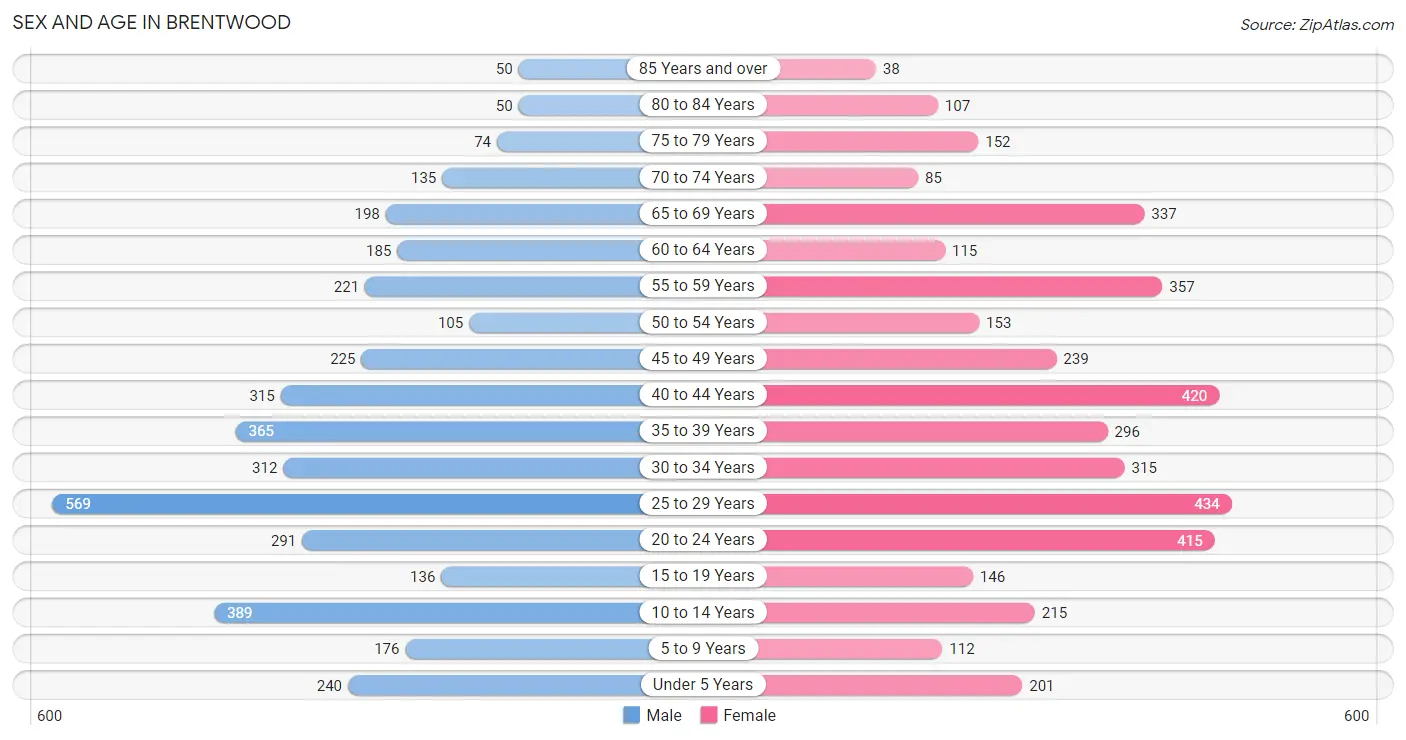
Sex and Age in Brentwood
Sex and Age in Brentwood
The most populous age groups in Brentwood are 25 to 29 Years (569 | 14.1%) for men and 25 to 29 Years (434 | 10.5%) for women.
| Age Bracket | Male | Female |
| Under 5 Years | 240 (5.9%) | 201 (4.9%) |
| 5 to 9 Years | 176 (4.4%) | 112 (2.7%) |
| 10 to 14 Years | 389 (9.6%) | 215 (5.2%) |
| 15 to 19 Years | 136 (3.4%) | 146 (3.5%) |
| 20 to 24 Years | 291 (7.2%) | 415 (10.0%) |
| 25 to 29 Years | 569 (14.1%) | 434 (10.5%) |
| 30 to 34 Years | 312 (7.7%) | 315 (7.6%) |
| 35 to 39 Years | 365 (9.0%) | 296 (7.1%) |
| 40 to 44 Years | 315 (7.8%) | 420 (10.2%) |
| 45 to 49 Years | 225 (5.6%) | 239 (5.8%) |
| 50 to 54 Years | 105 (2.6%) | 153 (3.7%) |
| 55 to 59 Years | 221 (5.5%) | 357 (8.6%) |
| 60 to 64 Years | 185 (4.6%) | 115 (2.8%) |
| 65 to 69 Years | 198 (4.9%) | 337 (8.2%) |
| 70 to 74 Years | 135 (3.3%) | 85 (2.1%) |
| 75 to 79 Years | 74 (1.8%) | 152 (3.7%) |
| 80 to 84 Years | 50 (1.2%) | 107 (2.6%) |
| 85 Years and over | 50 (1.2%) | 38 (0.9%) |
| Total | 4,036 (100.0%) | 4,137 (100.0%) |
Families and Households in Brentwood
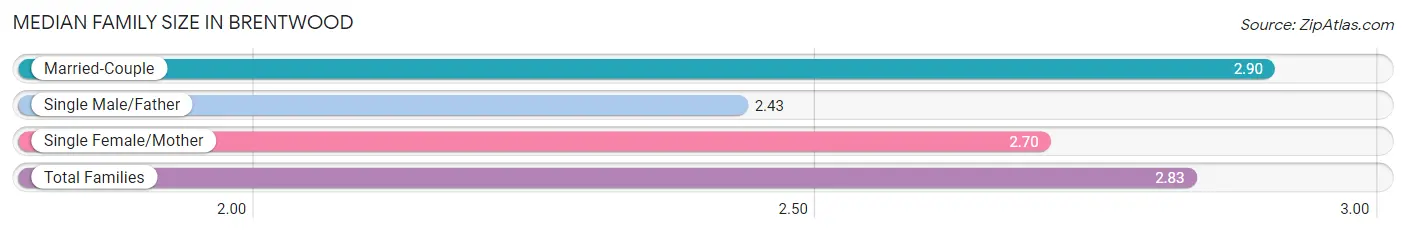
Median Family Size in Brentwood
The median family size in Brentwood is 2.83 persons per family, with married-couple families (1,362 | 73.6%) accounting for the largest median family size of 2.9 persons per family. On the other hand, single male/father families (132 | 7.1%) represent the smallest median family size with 2.43 persons per family.
| Family Type | # Families | Family Size |
| Married-Couple | 1,362 (73.6%) | 2.90 |
| Single Male/Father | 132 (7.1%) | 2.43 |
| Single Female/Mother | 356 (19.2%) | 2.70 |
| Total Families | 1,850 (100.0%) | 2.83 |
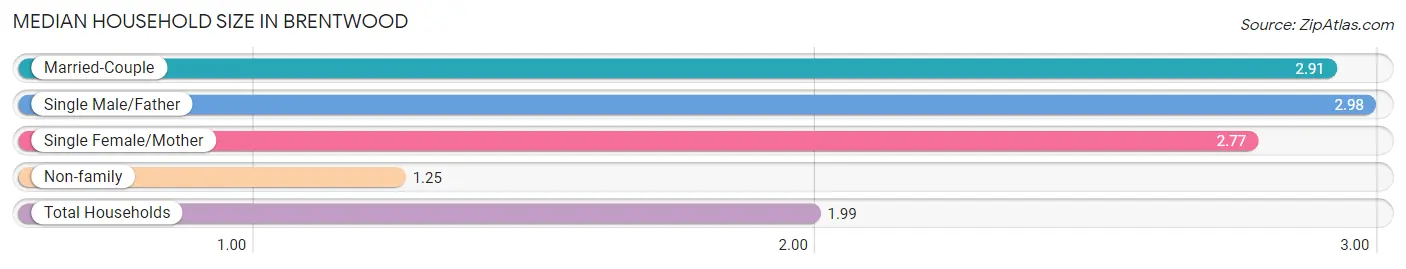
Median Household Size in Brentwood
The median household size in Brentwood is 1.99 persons per household, with single male/father households (132 | 3.2%) accounting for the largest median household size of 2.98 persons per household. non-family households (2,251 | 54.9%) represent the smallest median household size with 1.25 persons per household.
| Household Type | # Households | Household Size |
| Married-Couple | 1,362 (33.2%) | 2.91 |
| Single Male/Father | 132 (3.2%) | 2.98 |
| Single Female/Mother | 356 (8.7%) | 2.77 |
| Non-family | 2,251 (54.9%) | 1.25 |
| Total Households | 4,101 (100.0%) | 1.99 |
Household Size by Marriage Status in Brentwood
Out of a total of 4,101 households in Brentwood, 1,850 (45.1%) are family households, while 2,251 (54.9%) are nonfamily households. The most numerous type of family households are 2-person households, comprising 994, and the most common type of nonfamily households are 1-person households, comprising 1,819.
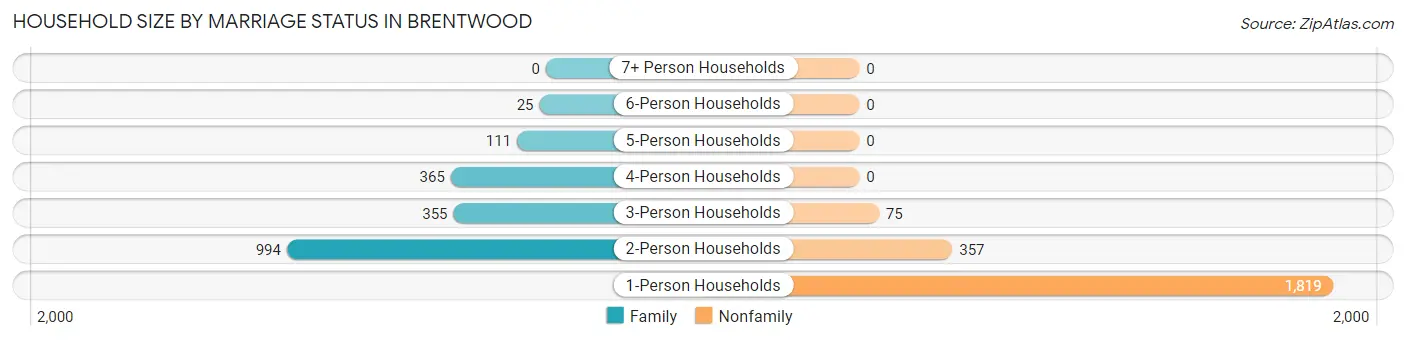
| Household Size | Family Households | Nonfamily Households |
| 1-Person Households | - | 1,819 (44.4%) |
| 2-Person Households | 994 (24.2%) | 357 (8.7%) |
| 3-Person Households | 355 (8.7%) | 75 (1.8%) |
| 4-Person Households | 365 (8.9%) | 0 (0.0%) |
| 5-Person Households | 111 (2.7%) | 0 (0.0%) |
| 6-Person Households | 25 (0.6%) | 0 (0.0%) |
| 7+ Person Households | 0 (0.0%) | 0 (0.0%) |
| Total | 1,850 (45.1%) | 2,251 (54.9%) |
Female Fertility in Brentwood
Fertility by Age in Brentwood
Average fertility rate in Brentwood is 37.0 births per 1,000 women. Women in the age bracket of 20 to 34 years have the highest fertility rate with 40.0 births per 1,000 women. Women in the age bracket of 20 to 34 years acount for 54.6% of all women with births.
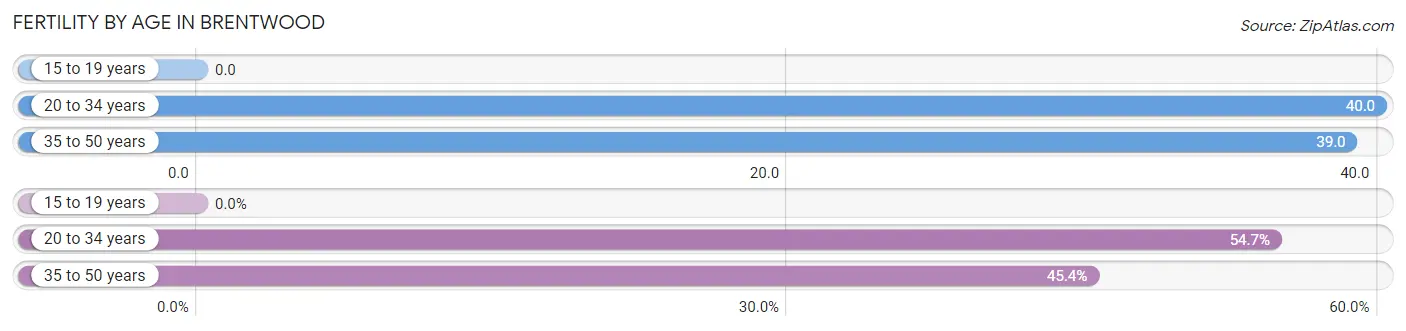
| Age Bracket | Women with Births | Births / 1,000 Women |
| 15 to 19 years | 0 (0.0%) | 0.0 |
| 20 to 34 years | 47 (54.6%) | 40.0 |
| 35 to 50 years | 39 (45.4%) | 39.0 |
| Total | 86 (100.0%) | 37.0 |
Fertility by Age by Marriage Status in Brentwood
87.2% of women with births (86) in Brentwood are married. The highest percentage of unmarried women with births falls into 20 to 34 years age bracket with 23.4% of them unmarried at the time of birth, while the lowest percentage of unmarried women with births belong to 35 to 50 years age bracket with 0.0% of them unmarried.
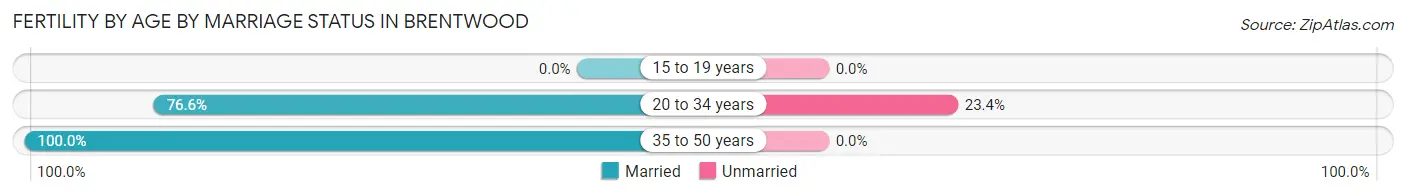
| Age Bracket | Married | Unmarried |
| 15 to 19 years | 0 (0.0%) | 0 (0.0%) |
| 20 to 34 years | 36 (76.6%) | 11 (23.4%) |
| 35 to 50 years | 39 (100.0%) | 0 (0.0%) |
| Total | 75 (87.2%) | 11 (12.8%) |
Fertility by Education in Brentwood
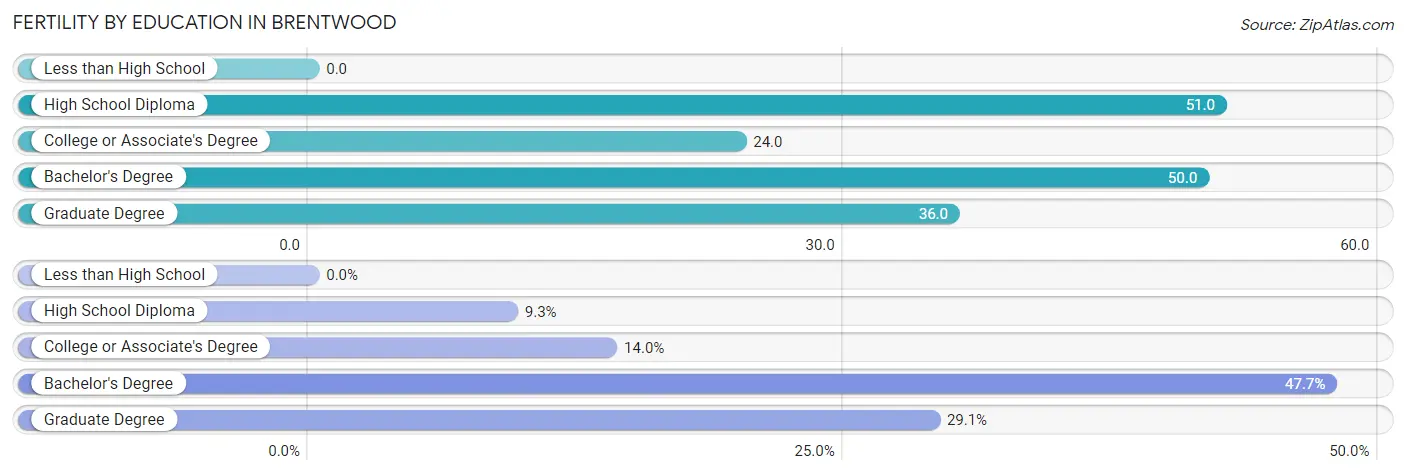
| Educational Attainment | Women with Births | Births / 1,000 Women |
| Less than High School | 0 (0.0%) | 0.0 |
| High School Diploma | 8 (9.3%) | 51.0 |
| College or Associate's Degree | 12 (14.0%) | 24.0 |
| Bachelor's Degree | 41 (47.7%) | 50.0 |
| Graduate Degree | 25 (29.1%) | 36.0 |
| Total | 86 (100.0%) | 37.0 |
Fertility by Education by Marriage Status in Brentwood
12.8% of women with births in Brentwood are unmarried. Women with the educational attainment of high school diploma are most likely to be married with 100.0% of them married at childbirth, while women with the educational attainment of college or associate's degree are least likely to be married with 91.7% of them unmarried at childbirth.
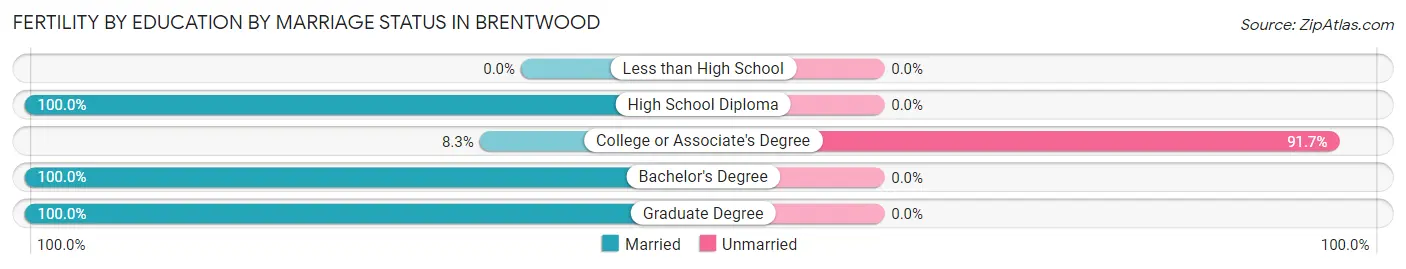
| Educational Attainment | Married | Unmarried |
| Less than High School | 0 (0.0%) | 0 (0.0%) |
| High School Diploma | 8 (100.0%) | 0 (0.0%) |
| College or Associate's Degree | 1 (8.3%) | 11 (91.7%) |
| Bachelor's Degree | 41 (100.0%) | 0 (0.0%) |
| Graduate Degree | 25 (100.0%) | 0 (0.0%) |
| Total | 75 (87.2%) | 11 (12.8%) |
Employment Characteristics in Brentwood
Employment by Class of Employer in Brentwood
Among the 4,880 employed individuals in Brentwood, private company employees (3,338 | 68.4%), not-for-profit organizations (714 | 14.6%), and self-employed (not incorporated) (253 | 5.2%) make up the most common classes of employment.
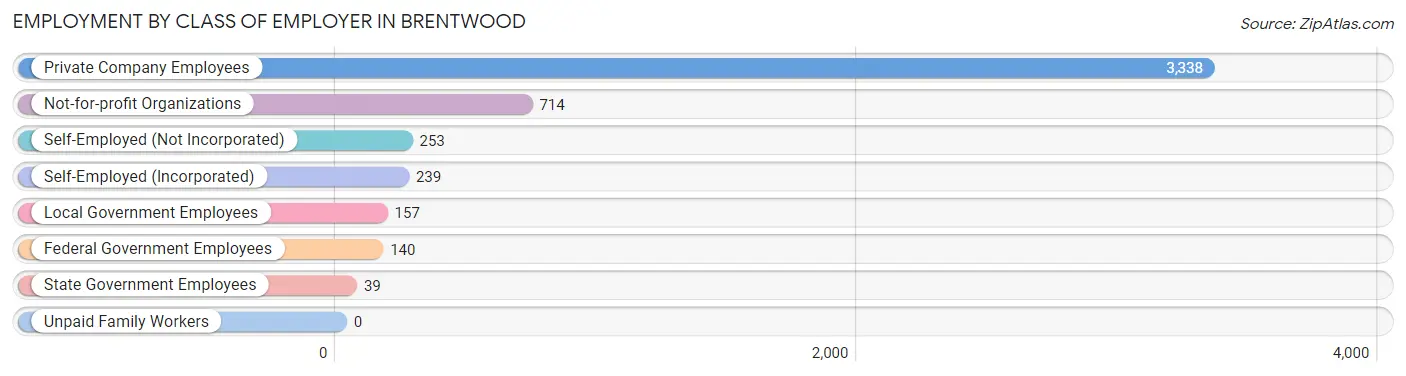
| Employer Class | # Employees | % Employees |
| Private Company Employees | 3,338 | 68.4% |
| Self-Employed (Incorporated) | 239 | 4.9% |
| Self-Employed (Not Incorporated) | 253 | 5.2% |
| Not-for-profit Organizations | 714 | 14.6% |
| Local Government Employees | 157 | 3.2% |
| State Government Employees | 39 | 0.8% |
| Federal Government Employees | 140 | 2.9% |
| Unpaid Family Workers | 0 | 0.0% |
| Total | 4,880 | 100.0% |
Employment Status by Age in Brentwood
According to the labor force statistics for Brentwood, out of the total population over 16 years of age (6,789), 74.5% or 5,058 individuals are in the labor force, with 2.3% or 116 of them unemployed. The age group with the highest labor force participation rate is 30 to 34 years, with 97.1% or 609 individuals in the labor force. Within the labor force, the 20 to 24 years age range has the highest percentage of unemployed individuals, with 7.4% or 48 of them being unemployed.
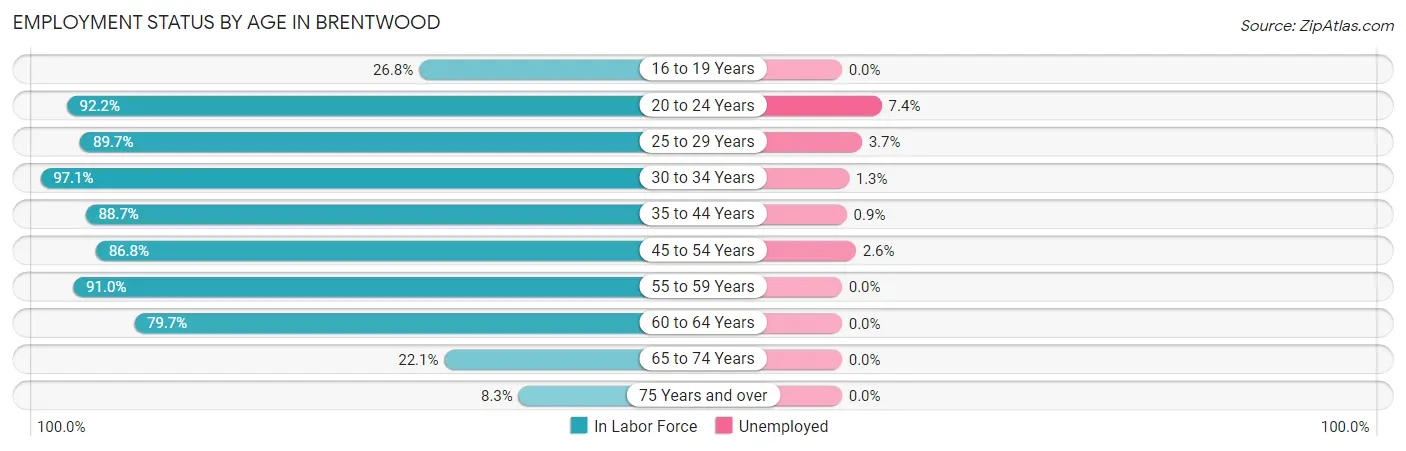
| Age Bracket | In Labor Force | Unemployed |
| 16 to 19 Years | 62 (26.8%) | 0 (0.0%) |
| 20 to 24 Years | 651 (92.2%) | 48 (7.4%) |
| 25 to 29 Years | 900 (89.7%) | 33 (3.7%) |
| 30 to 34 Years | 609 (97.1%) | 8 (1.3%) |
| 35 to 44 Years | 1,238 (88.7%) | 11 (0.9%) |
| 45 to 54 Years | 627 (86.8%) | 16 (2.6%) |
| 55 to 59 Years | 526 (91.0%) | 0 (0.0%) |
| 60 to 64 Years | 239 (79.7%) | 0 (0.0%) |
| 65 to 74 Years | 167 (22.1%) | 0 (0.0%) |
| 75 Years and over | 39 (8.3%) | 0 (0.0%) |
| Total | 5,058 (74.5%) | 116 (2.3%) |
Employment Status by Educational Attainment in Brentwood
According to labor force statistics for Brentwood, 89.5% of individuals (4,140) out of the total population between 25 and 64 years of age (4,626) are in the labor force, with 1.6% or 66 of them being unemployed. The group with the highest labor force participation rate are those with the educational attainment of bachelor's degree or higher, with 92.1% or 3,287 individuals in the labor force. Within the labor force, individuals with college / associate degree education have the highest percentage of unemployment, with 1.9% or 11 of them being unemployed.
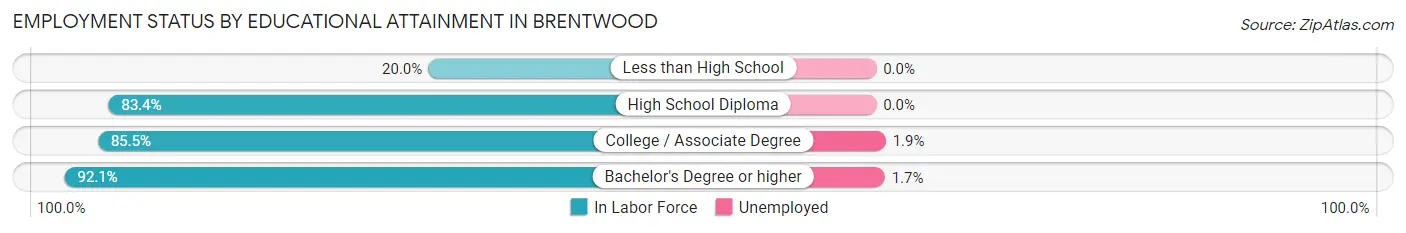
| Educational Attainment | In Labor Force | Unemployed |
| Less than High School | 14 (20.0%) | 0 (0.0%) |
| High School Diploma | 271 (83.4%) | 0 (0.0%) |
| College / Associate Degree | 566 (85.5%) | 13 (1.9%) |
| Bachelor's Degree or higher | 3,287 (92.1%) | 61 (1.7%) |
| Total | 4,140 (89.5%) | 74 (1.6%) |
Employment Occupations by Sex in Brentwood
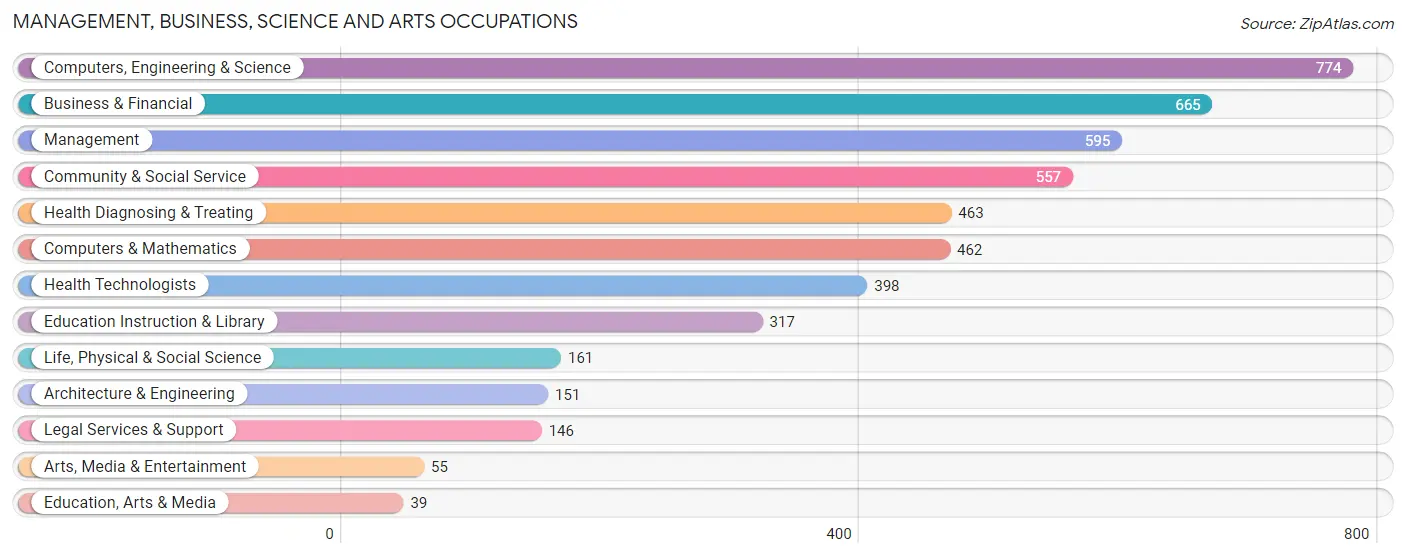
Management, Business, Science and Arts Occupations
The most common Management, Business, Science and Arts occupations in Brentwood are Computers, Engineering & Science (774 | 15.7%), Business & Financial (665 | 13.5%), Management (595 | 12.1%), Community & Social Service (557 | 11.3%), and Health Diagnosing & Treating (463 | 9.4%).
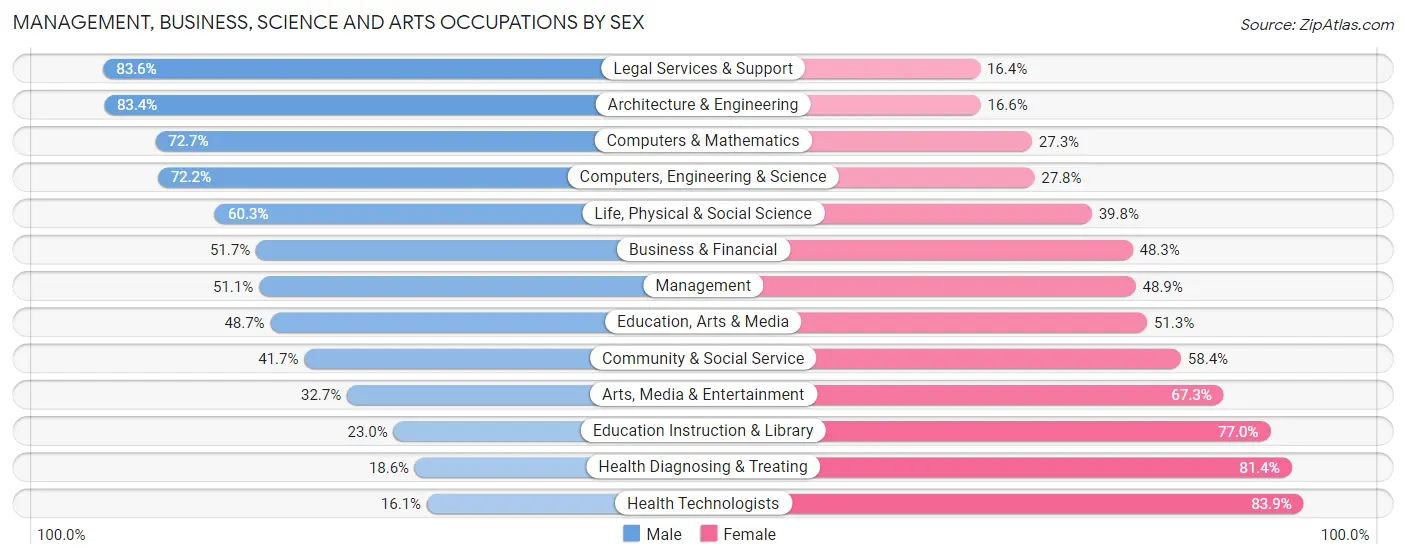
Management, Business, Science and Arts Occupations by Sex
Within the Management, Business, Science and Arts occupations in Brentwood, the most male-oriented occupations are Legal Services & Support (83.6%), Architecture & Engineering (83.4%), and Computers & Mathematics (72.7%), while the most female-oriented occupations are Health Technologists (83.9%), Health Diagnosing & Treating (81.4%), and Education Instruction & Library (77.0%).
| Occupation | Male | Female |
| Management | 304 (51.1%) | 291 (48.9%) |
| Business & Financial | 344 (51.7%) | 321 (48.3%) |
| Computers, Engineering & Science | 559 (72.2%) | 215 (27.8%) |
| Computers & Mathematics | 336 (72.7%) | 126 (27.3%) |
| Architecture & Engineering | 126 (83.4%) | 25 (16.6%) |
| Life, Physical & Social Science | 97 (60.3%) | 64 (39.8%) |
| Community & Social Service | 232 (41.6%) | 325 (58.4%) |
| Education, Arts & Media | 19 (48.7%) | 20 (51.3%) |
| Legal Services & Support | 122 (83.6%) | 24 (16.4%) |
| Education Instruction & Library | 73 (23.0%) | 244 (77.0%) |
| Arts, Media & Entertainment | 18 (32.7%) | 37 (67.3%) |
| Health Diagnosing & Treating | 86 (18.6%) | 377 (81.4%) |
| Health Technologists | 64 (16.1%) | 334 (83.9%) |
| Total (Category) | 1,525 (49.9%) | 1,529 (50.1%) |
| Total (Overall) | 2,409 (48.8%) | 2,522 (51.1%) |
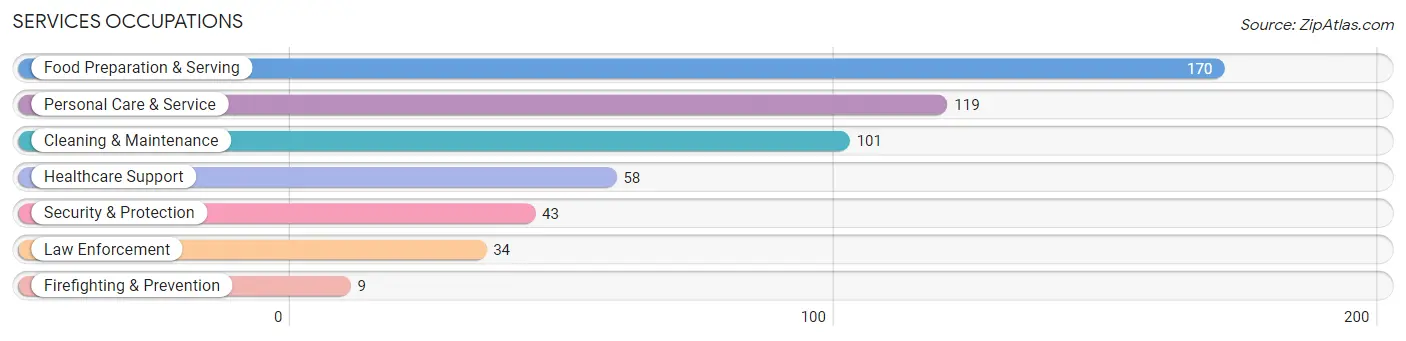
Services Occupations
The most common Services occupations in Brentwood are Food Preparation & Serving (170 | 3.5%), Personal Care & Service (119 | 2.4%), Cleaning & Maintenance (101 | 2.1%), Healthcare Support (58 | 1.2%), and Security & Protection (43 | 0.9%).
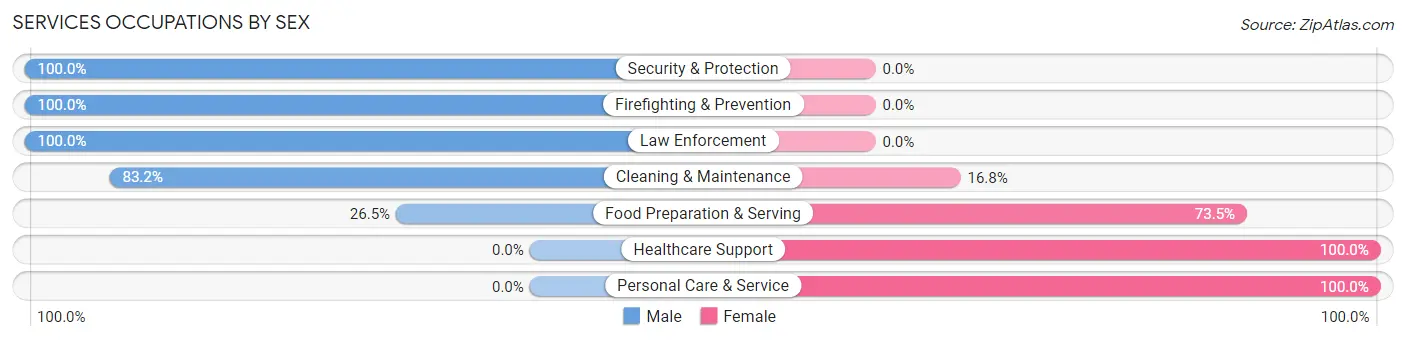
Services Occupations by Sex
Within the Services occupations in Brentwood, the most male-oriented occupations are Security & Protection (100.0%), Firefighting & Prevention (100.0%), and Law Enforcement (100.0%), while the most female-oriented occupations are Healthcare Support (100.0%), Personal Care & Service (100.0%), and Food Preparation & Serving (73.5%).
| Occupation | Male | Female |
| Healthcare Support | 0 (0.0%) | 58 (100.0%) |
| Security & Protection | 43 (100.0%) | 0 (0.0%) |
| Firefighting & Prevention | 9 (100.0%) | 0 (0.0%) |
| Law Enforcement | 34 (100.0%) | 0 (0.0%) |
| Food Preparation & Serving | 45 (26.5%) | 125 (73.5%) |
| Cleaning & Maintenance | 84 (83.2%) | 17 (16.8%) |
| Personal Care & Service | 0 (0.0%) | 119 (100.0%) |
| Total (Category) | 172 (35.0%) | 319 (65.0%) |
| Total (Overall) | 2,409 (48.8%) | 2,522 (51.1%) |
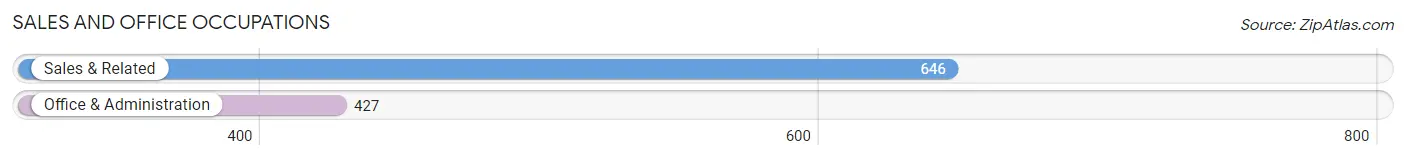
Sales and Office Occupations
The most common Sales and Office occupations in Brentwood are Sales & Related (646 | 13.1%), and Office & Administration (427 | 8.7%).
Sales and Office Occupations by Sex
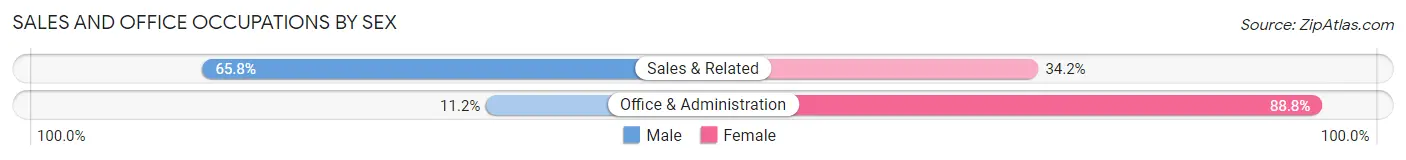
| Occupation | Male | Female |
| Sales & Related | 425 (65.8%) | 221 (34.2%) |
| Office & Administration | 48 (11.2%) | 379 (88.8%) |
| Total (Category) | 473 (44.1%) | 600 (55.9%) |
| Total (Overall) | 2,409 (48.8%) | 2,522 (51.1%) |
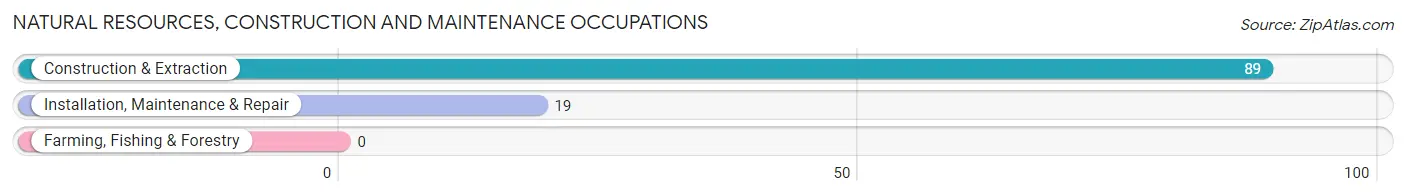
Natural Resources, Construction and Maintenance Occupations
The most common Natural Resources, Construction and Maintenance occupations in Brentwood are Construction & Extraction (89 | 1.8%), and Installation, Maintenance & Repair (19 | 0.4%).
Natural Resources, Construction and Maintenance Occupations by Sex
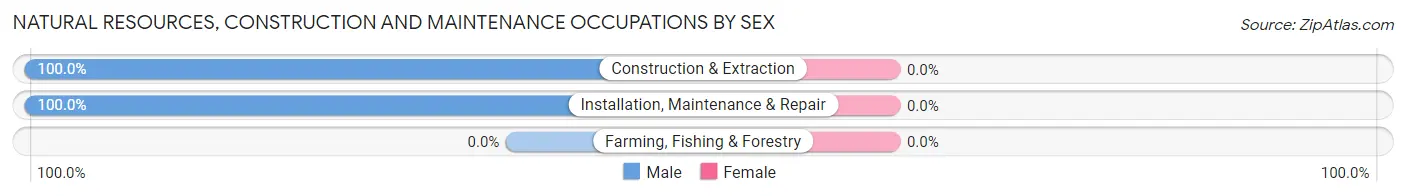
| Occupation | Male | Female |
| Farming, Fishing & Forestry | 0 (0.0%) | 0 (0.0%) |
| Construction & Extraction | 89 (100.0%) | 0 (0.0%) |
| Installation, Maintenance & Repair | 19 (100.0%) | 0 (0.0%) |
| Total (Category) | 108 (100.0%) | 0 (0.0%) |
| Total (Overall) | 2,409 (48.8%) | 2,522 (51.1%) |
Production, Transportation and Moving Occupations
The most common Production, Transportation and Moving occupations in Brentwood are Transportation (88 | 1.8%), Material Moving (59 | 1.2%), and Production (58 | 1.2%).
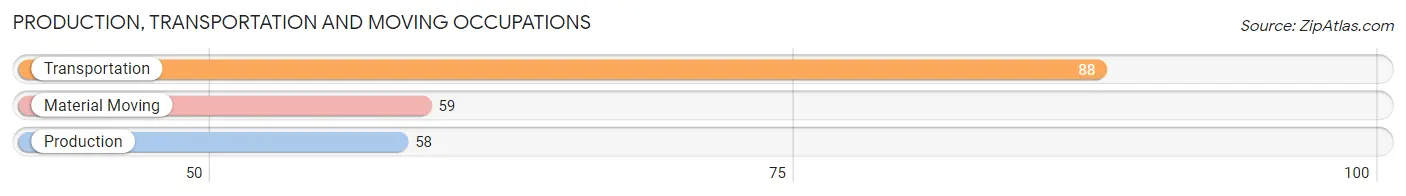
Production, Transportation and Moving Occupations by Sex
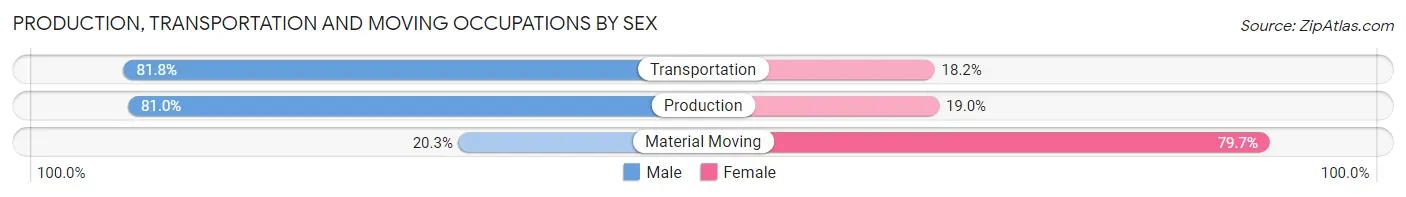
| Occupation | Male | Female |
| Production | 47 (81.0%) | 11 (19.0%) |
| Transportation | 72 (81.8%) | 16 (18.2%) |
| Material Moving | 12 (20.3%) | 47 (79.7%) |
| Total (Category) | 131 (63.9%) | 74 (36.1%) |
| Total (Overall) | 2,409 (48.8%) | 2,522 (51.1%) |
Employment Industries by Sex in Brentwood
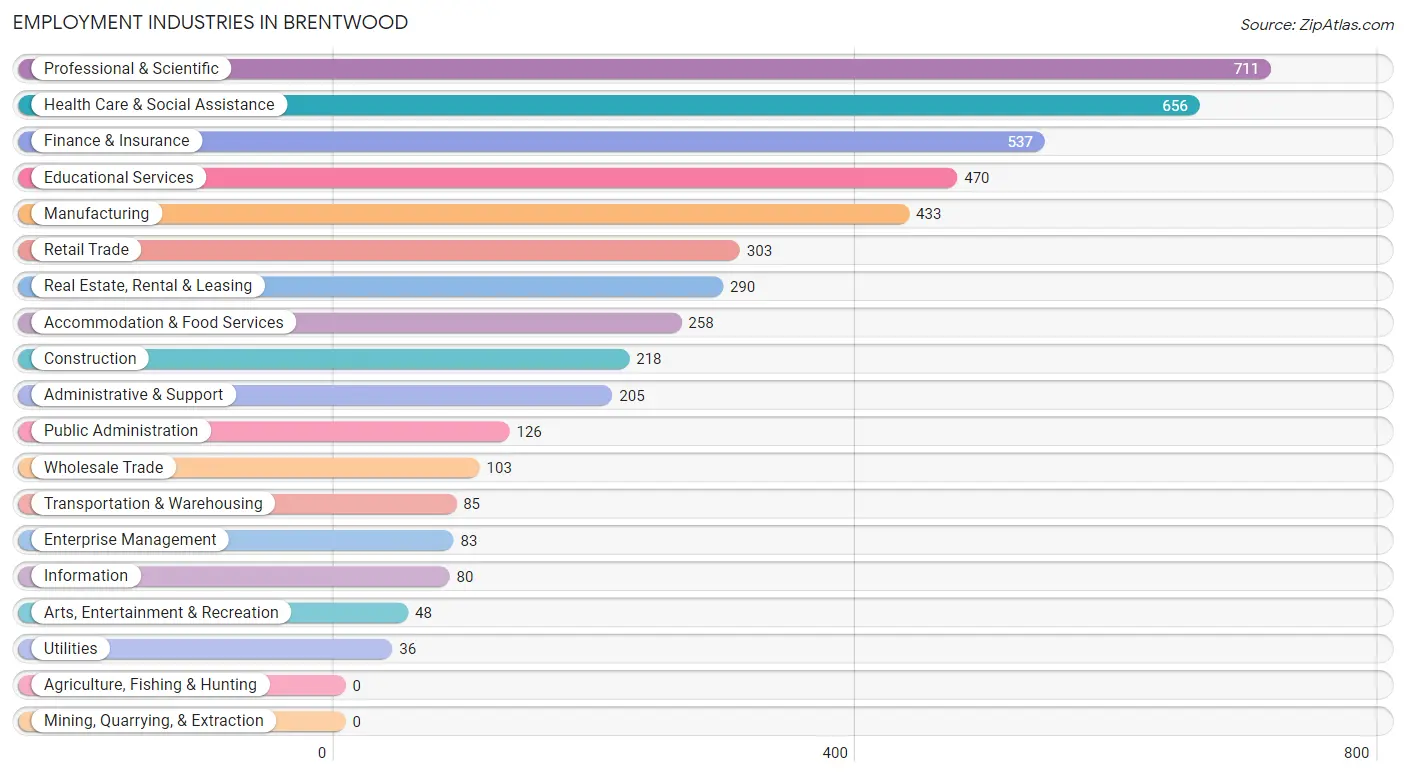
Employment Industries in Brentwood
The major employment industries in Brentwood include Professional & Scientific (711 | 14.4%), Health Care & Social Assistance (656 | 13.3%), Finance & Insurance (537 | 10.9%), Educational Services (470 | 9.5%), and Manufacturing (433 | 8.8%).
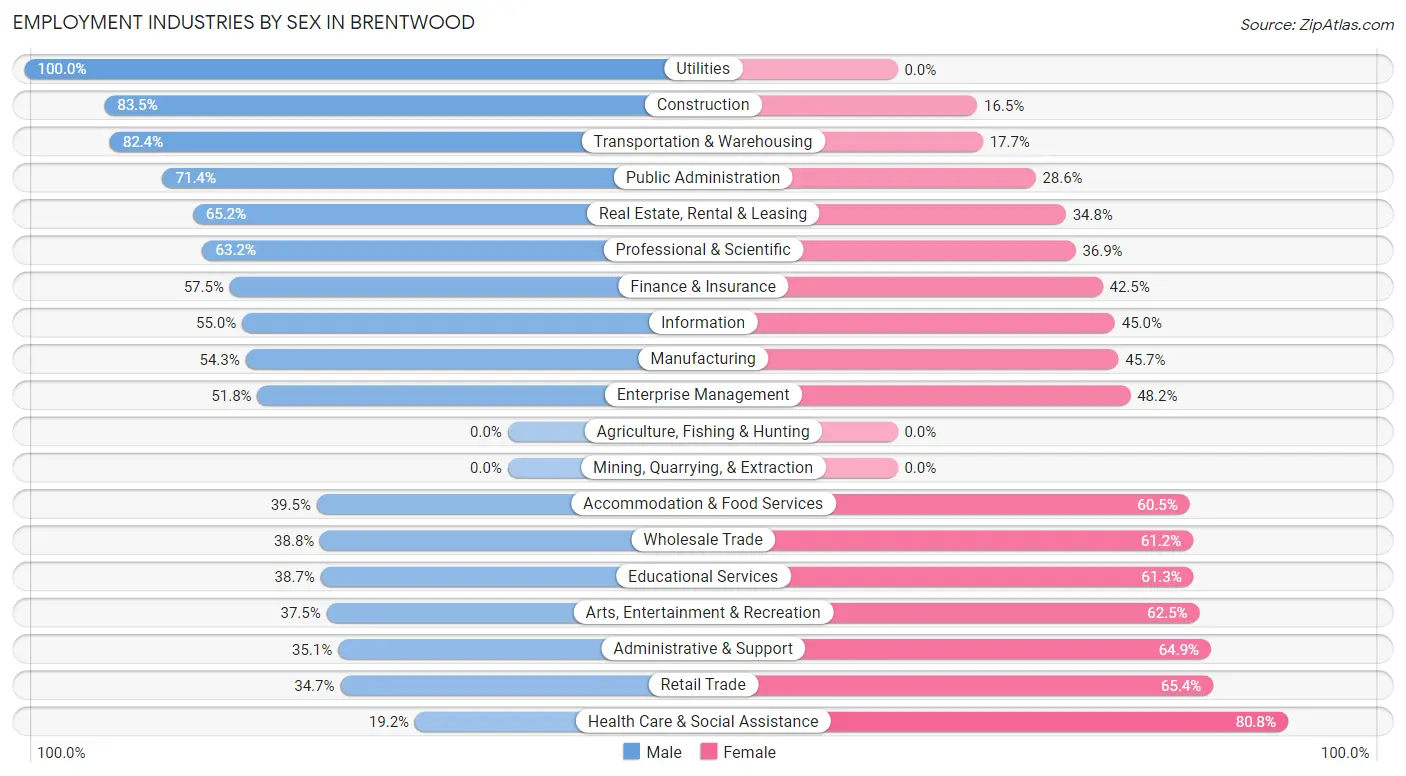
Employment Industries by Sex in Brentwood
The Brentwood industries that see more men than women are Utilities (100.0%), Construction (83.5%), and Transportation & Warehousing (82.4%), whereas the industries that tend to have a higher number of women are Health Care & Social Assistance (80.8%), Retail Trade (65.3%), and Administrative & Support (64.9%).
| Industry | Male | Female |
| Agriculture, Fishing & Hunting | 0 (0.0%) | 0 (0.0%) |
| Mining, Quarrying, & Extraction | 0 (0.0%) | 0 (0.0%) |
| Construction | 182 (83.5%) | 36 (16.5%) |
| Manufacturing | 235 (54.3%) | 198 (45.7%) |
| Wholesale Trade | 40 (38.8%) | 63 (61.2%) |
| Retail Trade | 105 (34.6%) | 198 (65.3%) |
| Transportation & Warehousing | 70 (82.4%) | 15 (17.6%) |
| Utilities | 36 (100.0%) | 0 (0.0%) |
| Information | 44 (55.0%) | 36 (45.0%) |
| Finance & Insurance | 309 (57.5%) | 228 (42.5%) |
| Real Estate, Rental & Leasing | 189 (65.2%) | 101 (34.8%) |
| Professional & Scientific | 449 (63.1%) | 262 (36.8%) |
| Enterprise Management | 43 (51.8%) | 40 (48.2%) |
| Administrative & Support | 72 (35.1%) | 133 (64.9%) |
| Educational Services | 182 (38.7%) | 288 (61.3%) |
| Health Care & Social Assistance | 126 (19.2%) | 530 (80.8%) |
| Arts, Entertainment & Recreation | 18 (37.5%) | 30 (62.5%) |
| Accommodation & Food Services | 102 (39.5%) | 156 (60.5%) |
| Public Administration | 90 (71.4%) | 36 (28.6%) |
| Total | 2,409 (48.8%) | 2,522 (51.1%) |
Education in Brentwood
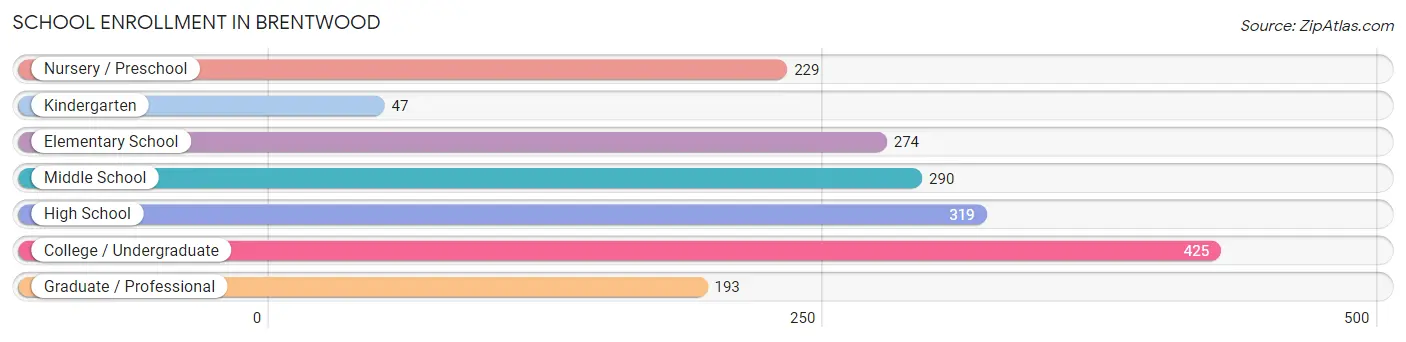
School Enrollment in Brentwood
The most common levels of schooling among the 1,777 students in Brentwood are college / undergraduate (425 | 23.9%), high school (319 | 17.9%), and middle school (290 | 16.3%).
| School Level | # Students | % Students |
| Nursery / Preschool | 229 | 12.9% |
| Kindergarten | 47 | 2.6% |
| Elementary School | 274 | 15.4% |
| Middle School | 290 | 16.3% |
| High School | 319 | 17.9% |
| College / Undergraduate | 425 | 23.9% |
| Graduate / Professional | 193 | 10.9% |
| Total | 1,777 | 100.0% |
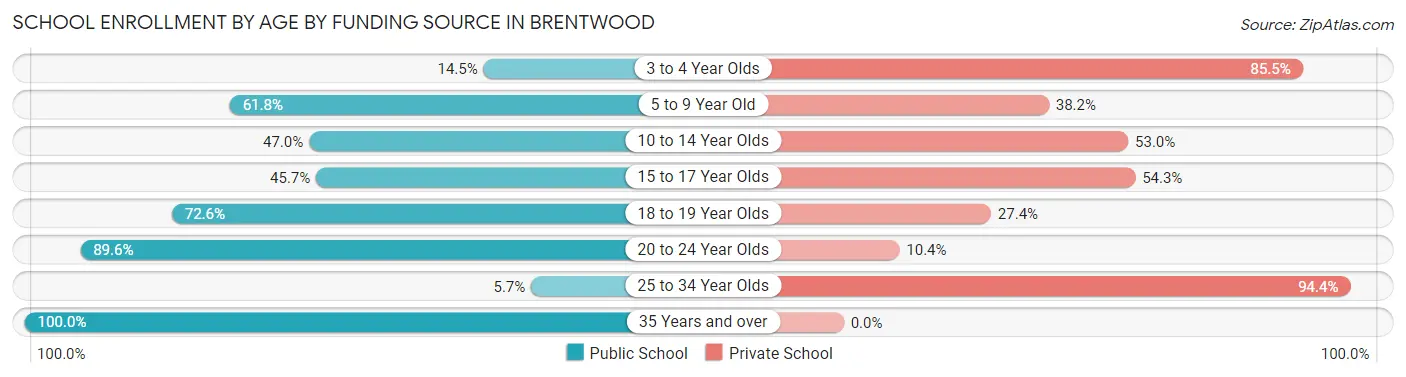
School Enrollment by Age by Funding Source in Brentwood
Out of a total of 1,777 students who are enrolled in schools in Brentwood, 871 (49.0%) attend a private institution, while the remaining 906 (51.0%) are enrolled in public schools. The age group of 25 to 34 year olds has the highest likelihood of being enrolled in private schools, with 167 (94.4% in the age bracket) enrolled. Conversely, the age group of 35 years and over has the lowest likelihood of being enrolled in a private school, with 35 (100.0% in the age bracket) attending a public institution.
| Age Bracket | Public School | Private School |
| 3 to 4 Year Olds | 27 (14.5%) | 159 (85.5%) |
| 5 to 9 Year Old | 131 (61.8%) | 81 (38.2%) |
| 10 to 14 Year Olds | 284 (47.0%) | 320 (53.0%) |
| 15 to 17 Year Olds | 69 (45.7%) | 82 (54.3%) |
| 18 to 19 Year Olds | 82 (72.6%) | 31 (27.4%) |
| 20 to 24 Year Olds | 268 (89.6%) | 31 (10.4%) |
| 25 to 34 Year Olds | 10 (5.7%) | 167 (94.4%) |
| 35 Years and over | 35 (100.0%) | 0 (0.0%) |
| Total | 906 (51.0%) | 871 (49.0%) |
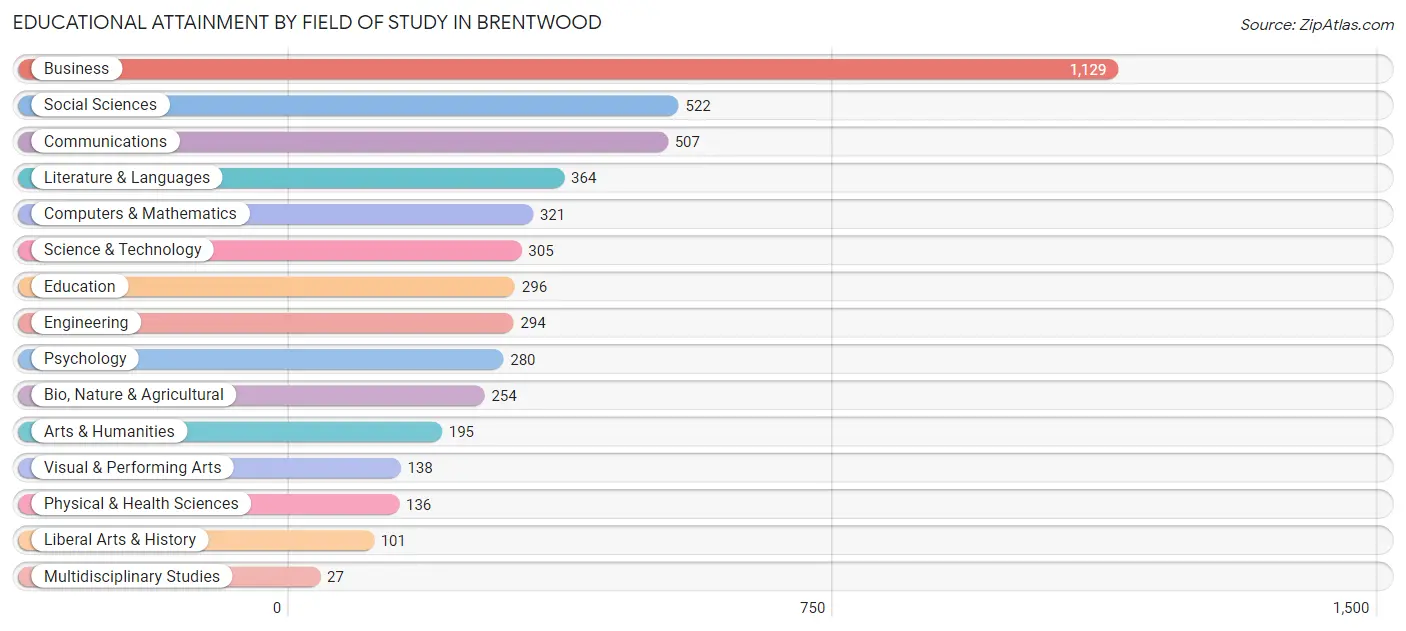
Educational Attainment by Field of Study in Brentwood
Business (1,129 | 23.2%), social sciences (522 | 10.7%), communications (507 | 10.4%), literature & languages (364 | 7.5%), and computers & mathematics (321 | 6.6%) are the most common fields of study among 4,869 individuals in Brentwood who have obtained a bachelor's degree or higher.
| Field of Study | # Graduates | % Graduates |
| Computers & Mathematics | 321 | 6.6% |
| Bio, Nature & Agricultural | 254 | 5.2% |
| Physical & Health Sciences | 136 | 2.8% |
| Psychology | 280 | 5.8% |
| Social Sciences | 522 | 10.7% |
| Engineering | 294 | 6.0% |
| Multidisciplinary Studies | 27 | 0.5% |
| Science & Technology | 305 | 6.3% |
| Business | 1,129 | 23.2% |
| Education | 296 | 6.1% |
| Literature & Languages | 364 | 7.5% |
| Liberal Arts & History | 101 | 2.1% |
| Visual & Performing Arts | 138 | 2.8% |
| Communications | 507 | 10.4% |
| Arts & Humanities | 195 | 4.0% |
| Total | 4,869 | 100.0% |
Transportation & Commute in Brentwood
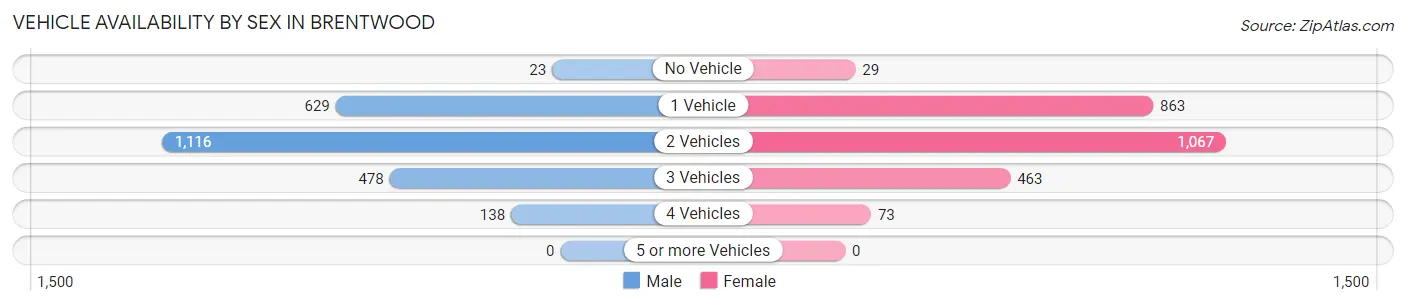
Vehicle Availability by Sex in Brentwood
The most prevalent vehicle ownership categories in Brentwood are males with 2 vehicles (1,116, accounting for 46.8%) and females with 2 vehicles (1,067, making up 44.7%).
| Vehicles Available | Male | Female |
| No Vehicle | 23 (1.0%) | 29 (1.2%) |
| 1 Vehicle | 629 (26.4%) | 863 (34.6%) |
| 2 Vehicles | 1,116 (46.8%) | 1,067 (42.8%) |
| 3 Vehicles | 478 (20.1%) | 463 (18.6%) |
| 4 Vehicles | 138 (5.8%) | 73 (2.9%) |
| 5 or more Vehicles | 0 (0.0%) | 0 (0.0%) |
| Total | 2,384 (100.0%) | 2,495 (100.0%) |
Commute Time in Brentwood
The most frequently occuring commute durations in Brentwood are 20 to 24 minutes (1,077 commuters, 26.0%), 15 to 19 minutes (1,053 commuters, 25.4%), and 10 to 14 minutes (653 commuters, 15.8%).
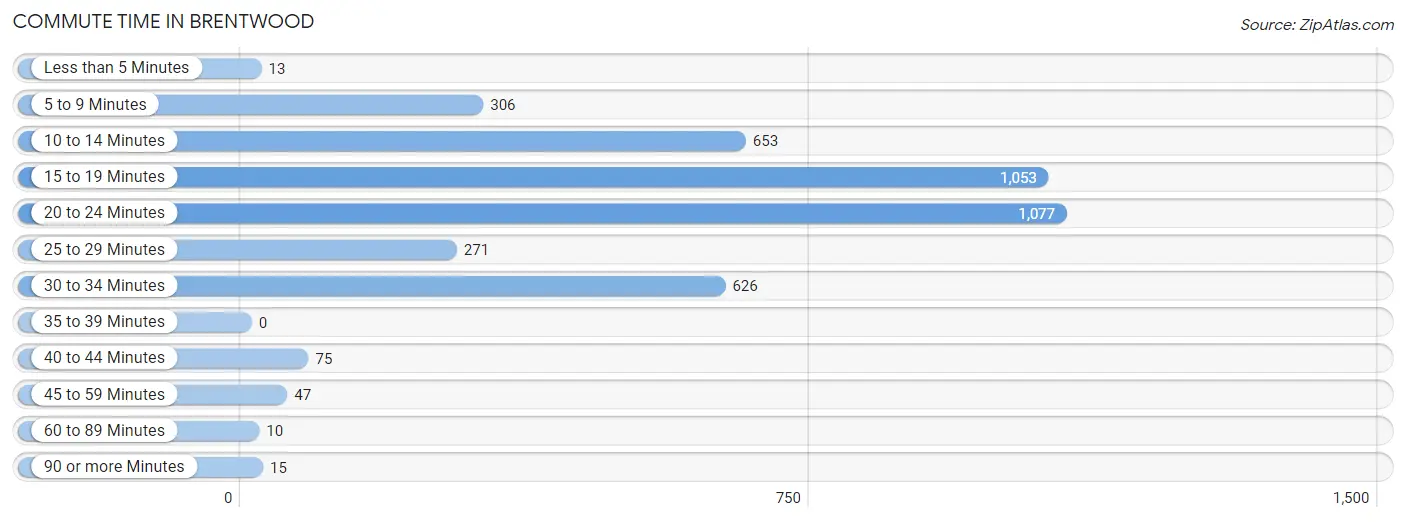
| Commute Time | # Commuters | % Commuters |
| Less than 5 Minutes | 13 | 0.3% |
| 5 to 9 Minutes | 306 | 7.4% |
| 10 to 14 Minutes | 653 | 15.8% |
| 15 to 19 Minutes | 1,053 | 25.4% |
| 20 to 24 Minutes | 1,077 | 26.0% |
| 25 to 29 Minutes | 271 | 6.5% |
| 30 to 34 Minutes | 626 | 15.1% |
| 35 to 39 Minutes | 0 | 0.0% |
| 40 to 44 Minutes | 75 | 1.8% |
| 45 to 59 Minutes | 47 | 1.1% |
| 60 to 89 Minutes | 10 | 0.2% |
| 90 or more Minutes | 15 | 0.4% |
Commute Time by Sex in Brentwood
The most common commute times in Brentwood are 20 to 24 minutes (509 commuters, 26.1%) for males and 15 to 19 minutes (613 commuters, 27.9%) for females.
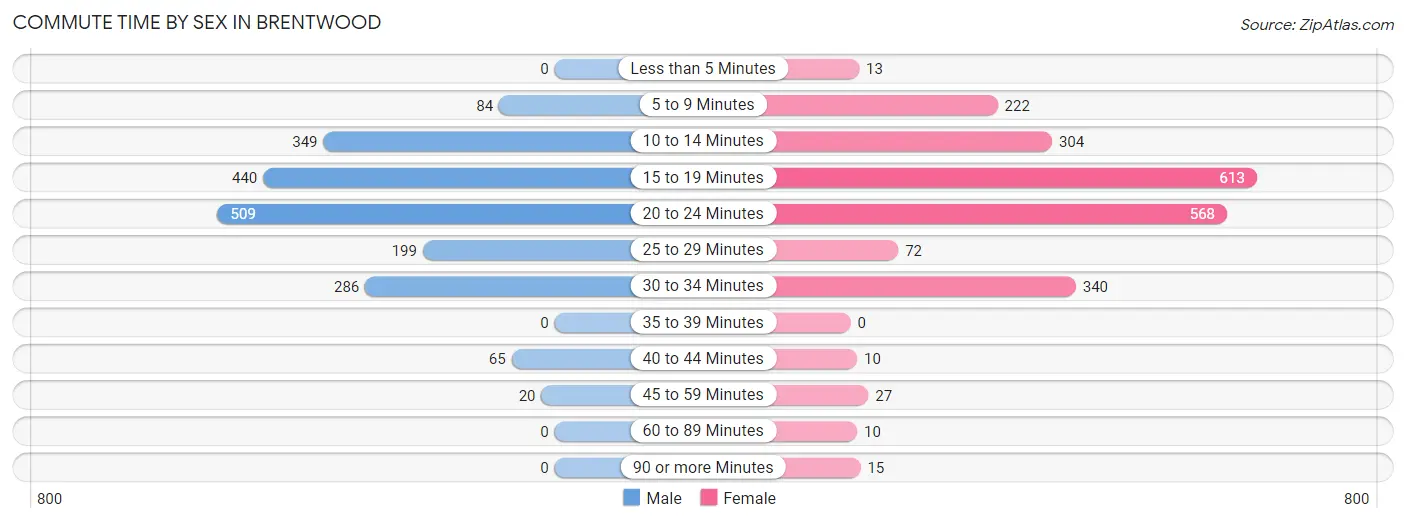
| Commute Time | Male | Female |
| Less than 5 Minutes | 0 (0.0%) | 13 (0.6%) |
| 5 to 9 Minutes | 84 (4.3%) | 222 (10.1%) |
| 10 to 14 Minutes | 349 (17.9%) | 304 (13.9%) |
| 15 to 19 Minutes | 440 (22.5%) | 613 (27.9%) |
| 20 to 24 Minutes | 509 (26.1%) | 568 (25.9%) |
| 25 to 29 Minutes | 199 (10.2%) | 72 (3.3%) |
| 30 to 34 Minutes | 286 (14.6%) | 340 (15.5%) |
| 35 to 39 Minutes | 0 (0.0%) | 0 (0.0%) |
| 40 to 44 Minutes | 65 (3.3%) | 10 (0.5%) |
| 45 to 59 Minutes | 20 (1.0%) | 27 (1.2%) |
| 60 to 89 Minutes | 0 (0.0%) | 10 (0.5%) |
| 90 or more Minutes | 0 (0.0%) | 15 (0.7%) |
Time of Departure to Work by Sex in Brentwood
The most frequent times of departure to work in Brentwood are 7:00 AM to 7:29 AM (460, 23.6%) for males and 7:30 AM to 7:59 AM (551, 25.1%) for females.
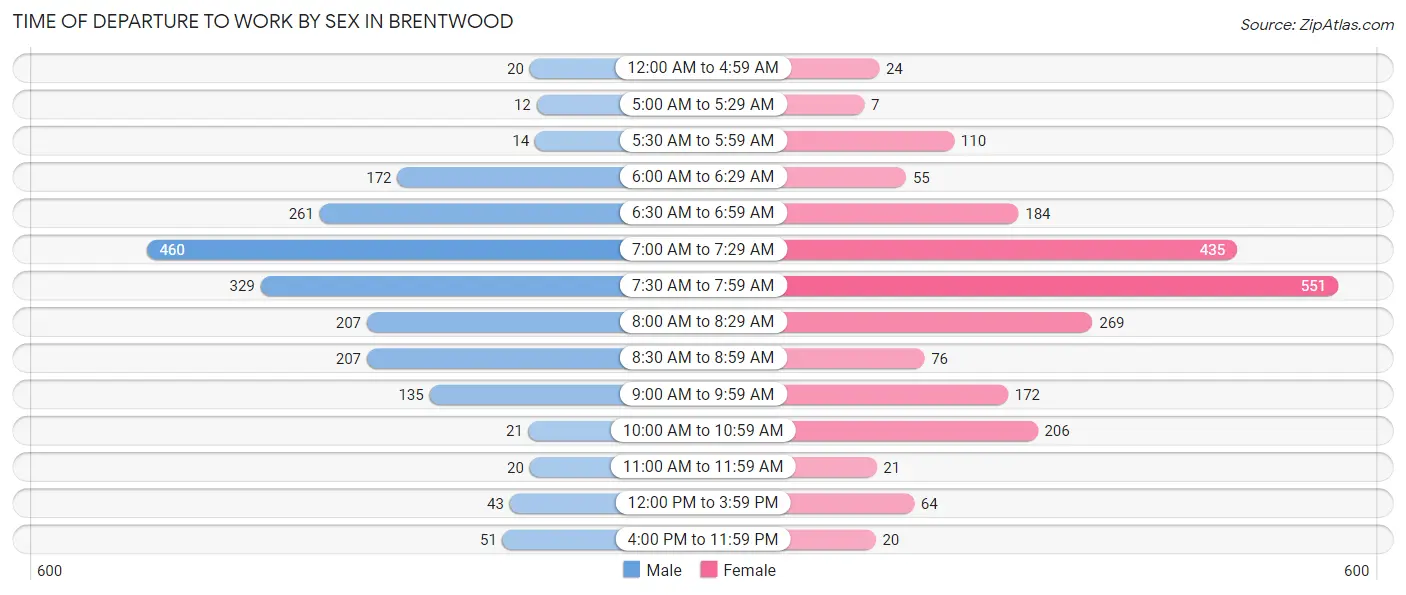
| Time of Departure | Male | Female |
| 12:00 AM to 4:59 AM | 20 (1.0%) | 24 (1.1%) |
| 5:00 AM to 5:29 AM | 12 (0.6%) | 7 (0.3%) |
| 5:30 AM to 5:59 AM | 14 (0.7%) | 110 (5.0%) |
| 6:00 AM to 6:29 AM | 172 (8.8%) | 55 (2.5%) |
| 6:30 AM to 6:59 AM | 261 (13.4%) | 184 (8.4%) |
| 7:00 AM to 7:29 AM | 460 (23.6%) | 435 (19.8%) |
| 7:30 AM to 7:59 AM | 329 (16.9%) | 551 (25.1%) |
| 8:00 AM to 8:29 AM | 207 (10.6%) | 269 (12.3%) |
| 8:30 AM to 8:59 AM | 207 (10.6%) | 76 (3.5%) |
| 9:00 AM to 9:59 AM | 135 (6.9%) | 172 (7.8%) |
| 10:00 AM to 10:59 AM | 21 (1.1%) | 206 (9.4%) |
| 11:00 AM to 11:59 AM | 20 (1.0%) | 21 (1.0%) |
| 12:00 PM to 3:59 PM | 43 (2.2%) | 64 (2.9%) |
| 4:00 PM to 11:59 PM | 51 (2.6%) | 20 (0.9%) |
| Total | 1,952 (100.0%) | 2,194 (100.0%) |
Housing Occupancy in Brentwood
Occupancy by Ownership in Brentwood
Of the total 4,101 dwellings in Brentwood, owner-occupied units account for 2,633 (64.2%), while renter-occupied units make up 1,468 (35.8%).
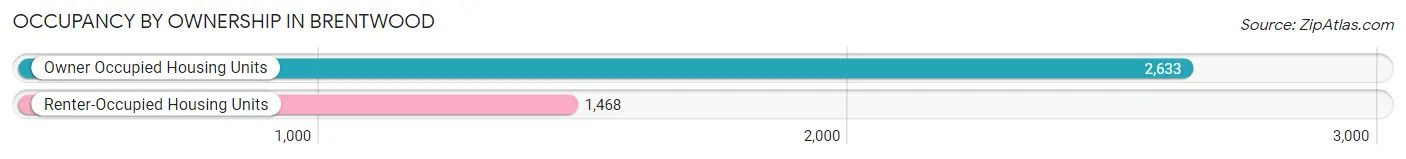
| Occupancy | # Housing Units | % Housing Units |
| Owner Occupied Housing Units | 2,633 | 64.2% |
| Renter-Occupied Housing Units | 1,468 | 35.8% |
| Total Occupied Housing Units | 4,101 | 100.0% |
Occupancy by Household Size in Brentwood
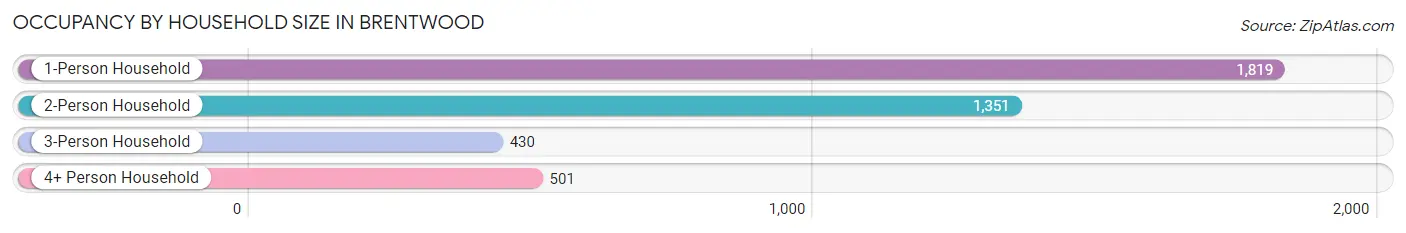
| Household Size | # Housing Units | % Housing Units |
| 1-Person Household | 1,819 | 44.4% |
| 2-Person Household | 1,351 | 32.9% |
| 3-Person Household | 430 | 10.5% |
| 4+ Person Household | 501 | 12.2% |
| Total Housing Units | 4,101 | 100.0% |
Occupancy by Ownership by Household Size in Brentwood
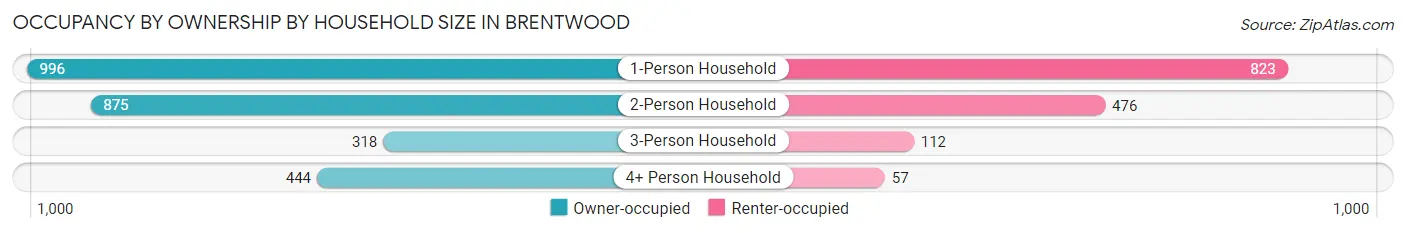
| Household Size | Owner-occupied | Renter-occupied |
| 1-Person Household | 996 (54.8%) | 823 (45.2%) |
| 2-Person Household | 875 (64.8%) | 476 (35.2%) |
| 3-Person Household | 318 (74.0%) | 112 (26.1%) |
| 4+ Person Household | 444 (88.6%) | 57 (11.4%) |
| Total Housing Units | 2,633 (64.2%) | 1,468 (35.8%) |
Occupancy by Educational Attainment in Brentwood
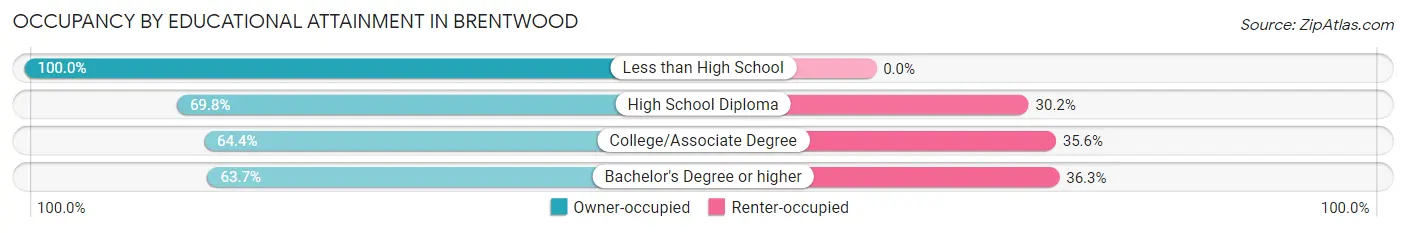
| Household Size | Owner-occupied | Renter-occupied |
| Less than High School | 7 (100.0%) | 0 (0.0%) |
| High School Diploma | 157 (69.8%) | 68 (30.2%) |
| College/Associate Degree | 405 (64.4%) | 224 (35.6%) |
| Bachelor's Degree or higher | 2,064 (63.7%) | 1,176 (36.3%) |
Occupancy by Age of Householder in Brentwood
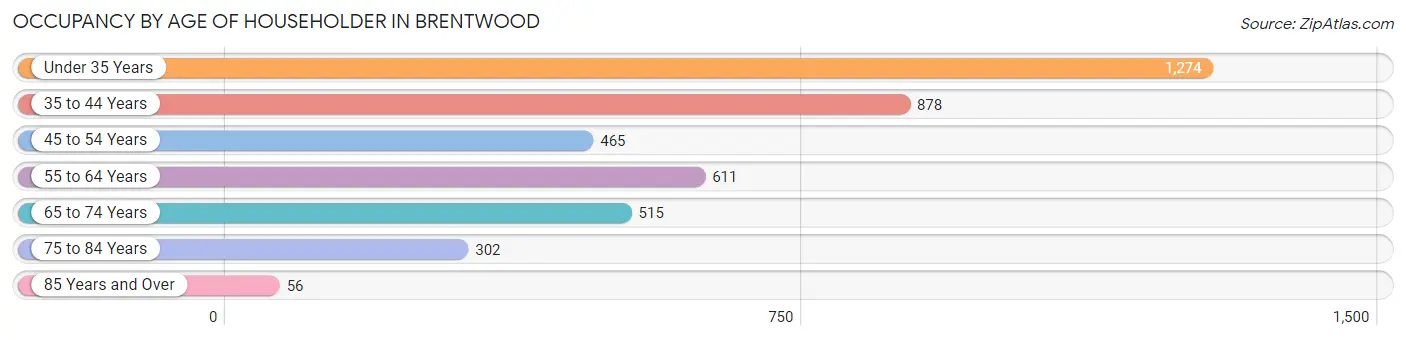
| Age Bracket | # Households | % Households |
| Under 35 Years | 1,274 | 31.1% |
| 35 to 44 Years | 878 | 21.4% |
| 45 to 54 Years | 465 | 11.3% |
| 55 to 64 Years | 611 | 14.9% |
| 65 to 74 Years | 515 | 12.6% |
| 75 to 84 Years | 302 | 7.4% |
| 85 Years and Over | 56 | 1.4% |
| Total | 4,101 | 100.0% |
Housing Finances in Brentwood
Median Income by Occupancy in Brentwood
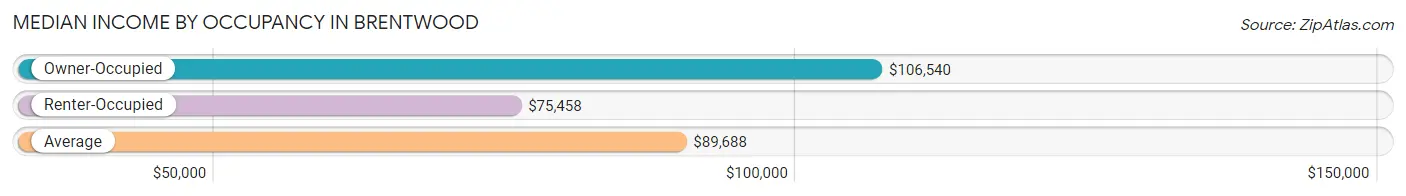
| Occupancy Type | # Households | Median Income |
| Owner-Occupied | 2,633 (64.2%) | $106,540 |
| Renter-Occupied | 1,468 (35.8%) | $75,458 |
| Average | 4,101 (100.0%) | $89,688 |
Occupancy by Householder Income Bracket in Brentwood
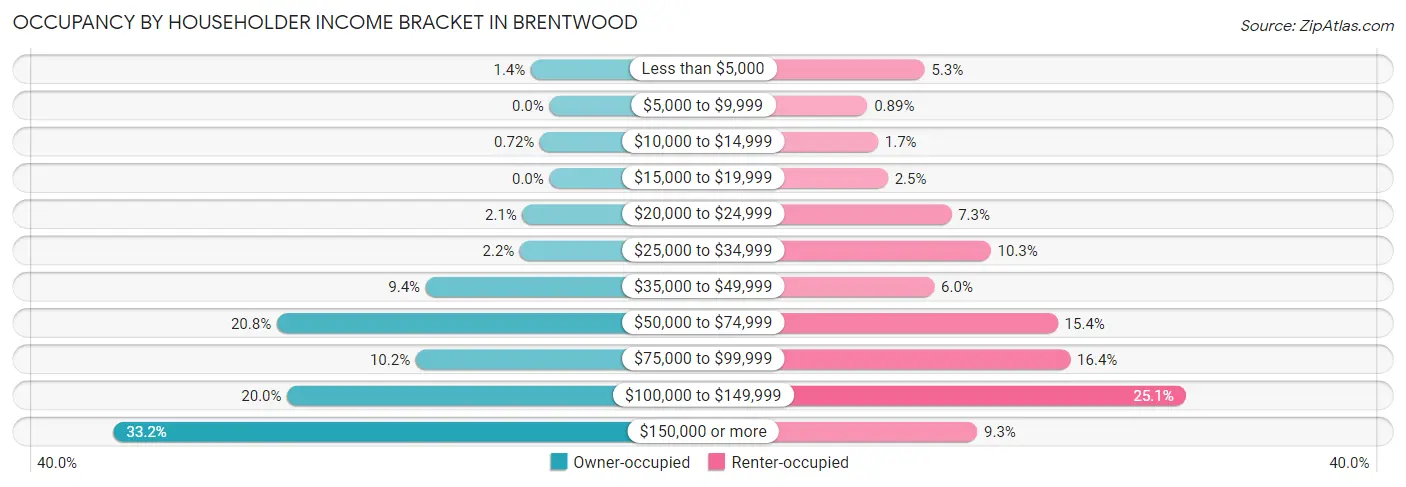
| Income Bracket | Owner-occupied | Renter-occupied |
| Less than $5,000 | 37 (1.4%) | 77 (5.2%) |
| $5,000 to $9,999 | 0 (0.0%) | 13 (0.9%) |
| $10,000 to $14,999 | 19 (0.7%) | 25 (1.7%) |
| $15,000 to $19,999 | 0 (0.0%) | 36 (2.5%) |
| $20,000 to $24,999 | 54 (2.1%) | 107 (7.3%) |
| $25,000 to $34,999 | 59 (2.2%) | 151 (10.3%) |
| $35,000 to $49,999 | 248 (9.4%) | 88 (6.0%) |
| $50,000 to $74,999 | 547 (20.8%) | 226 (15.4%) |
| $75,000 to $99,999 | 268 (10.2%) | 240 (16.4%) |
| $100,000 to $149,999 | 526 (20.0%) | 369 (25.1%) |
| $150,000 or more | 875 (33.2%) | 136 (9.3%) |
| Total | 2,633 (100.0%) | 1,468 (100.0%) |
Monthly Housing Cost Tiers in Brentwood
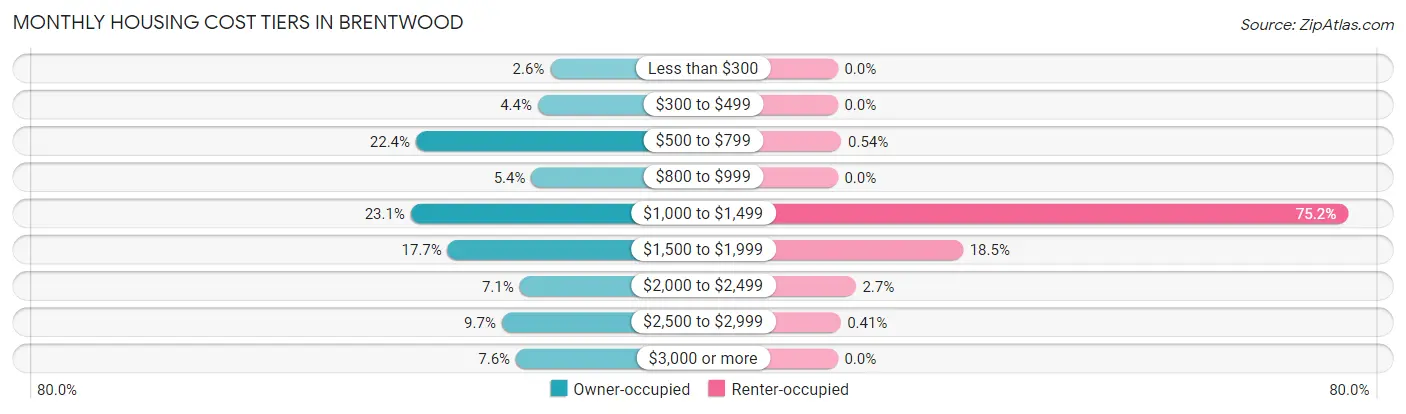
| Monthly Cost | Owner-occupied | Renter-occupied |
| Less than $300 | 68 (2.6%) | 0 (0.0%) |
| $300 to $499 | 116 (4.4%) | 0 (0.0%) |
| $500 to $799 | 589 (22.4%) | 8 (0.5%) |
| $800 to $999 | 141 (5.4%) | 0 (0.0%) |
| $1,000 to $1,499 | 609 (23.1%) | 1,104 (75.2%) |
| $1,500 to $1,999 | 466 (17.7%) | 271 (18.5%) |
| $2,000 to $2,499 | 187 (7.1%) | 39 (2.7%) |
| $2,500 to $2,999 | 256 (9.7%) | 6 (0.4%) |
| $3,000 or more | 201 (7.6%) | 0 (0.0%) |
| Total | 2,633 (100.0%) | 1,468 (100.0%) |
Physical Housing Characteristics in Brentwood
Housing Structures in Brentwood
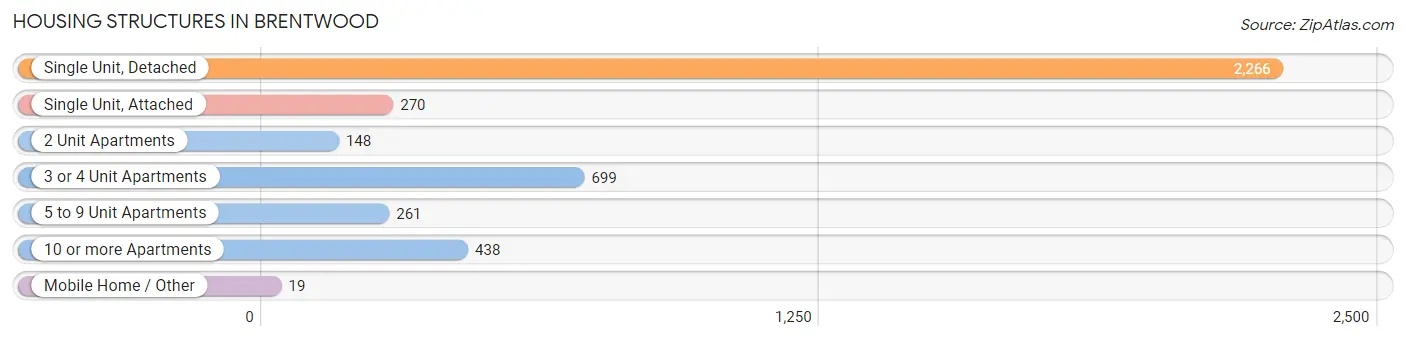
| Structure Type | # Housing Units | % Housing Units |
| Single Unit, Detached | 2,266 | 55.2% |
| Single Unit, Attached | 270 | 6.6% |
| 2 Unit Apartments | 148 | 3.6% |
| 3 or 4 Unit Apartments | 699 | 17.0% |
| 5 to 9 Unit Apartments | 261 | 6.4% |
| 10 or more Apartments | 438 | 10.7% |
| Mobile Home / Other | 19 | 0.5% |
| Total | 4,101 | 100.0% |
Housing Structures by Occupancy in Brentwood
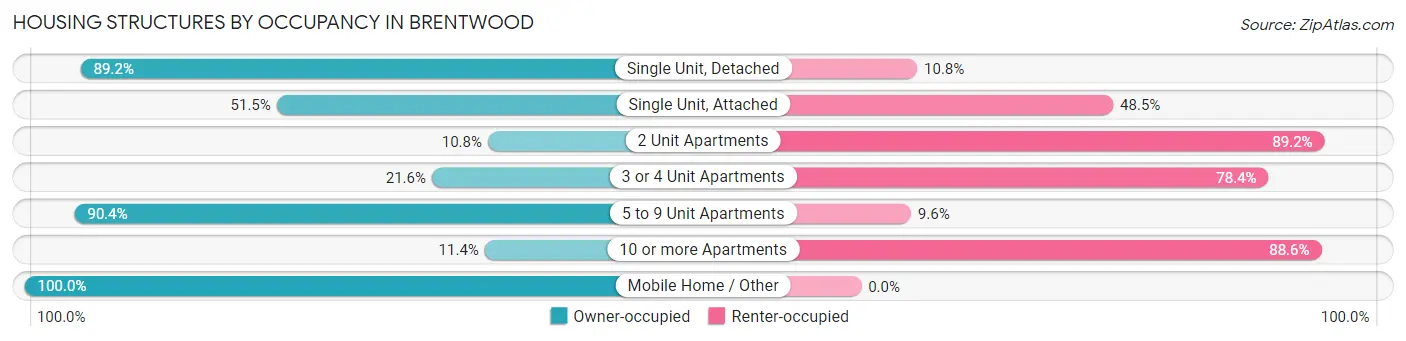
| Structure Type | Owner-occupied | Renter-occupied |
| Single Unit, Detached | 2,022 (89.2%) | 244 (10.8%) |
| Single Unit, Attached | 139 (51.5%) | 131 (48.5%) |
| 2 Unit Apartments | 16 (10.8%) | 132 (89.2%) |
| 3 or 4 Unit Apartments | 151 (21.6%) | 548 (78.4%) |
| 5 to 9 Unit Apartments | 236 (90.4%) | 25 (9.6%) |
| 10 or more Apartments | 50 (11.4%) | 388 (88.6%) |
| Mobile Home / Other | 19 (100.0%) | 0 (0.0%) |
| Total | 2,633 (64.2%) | 1,468 (35.8%) |
Housing Structures by Number of Rooms in Brentwood
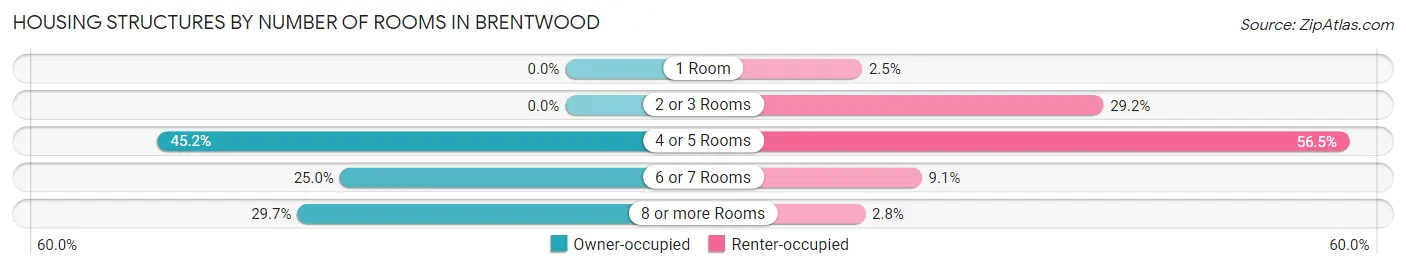
| Number of Rooms | Owner-occupied | Renter-occupied |
| 1 Room | 0 (0.0%) | 36 (2.5%) |
| 2 or 3 Rooms | 0 (0.0%) | 429 (29.2%) |
| 4 or 5 Rooms | 1,191 (45.2%) | 829 (56.5%) |
| 6 or 7 Rooms | 659 (25.0%) | 133 (9.1%) |
| 8 or more Rooms | 783 (29.7%) | 41 (2.8%) |
| Total | 2,633 (100.0%) | 1,468 (100.0%) |
Housing Structure by Heating Type in Brentwood
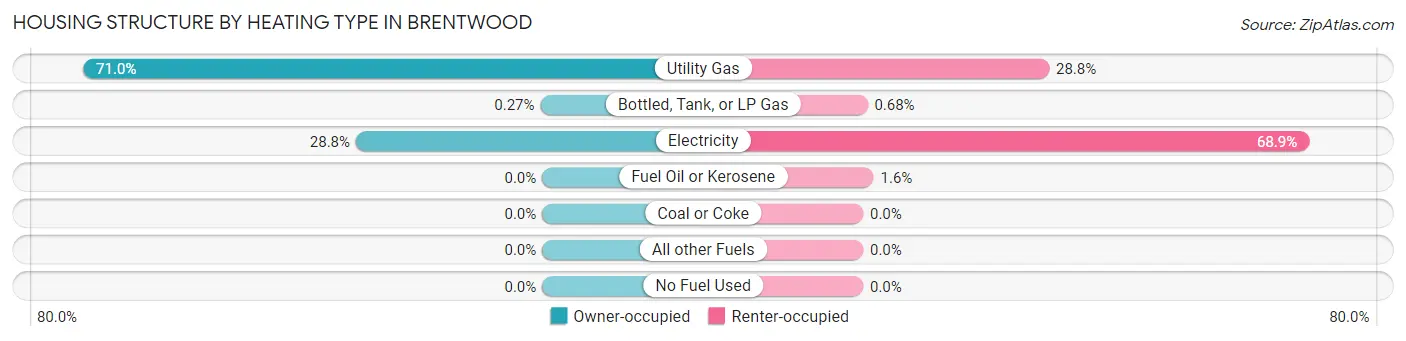
| Heating Type | Owner-occupied | Renter-occupied |
| Utility Gas | 1,868 (71.0%) | 422 (28.7%) |
| Bottled, Tank, or LP Gas | 7 (0.3%) | 10 (0.7%) |
| Electricity | 758 (28.8%) | 1,012 (68.9%) |
| Fuel Oil or Kerosene | 0 (0.0%) | 24 (1.6%) |
| Coal or Coke | 0 (0.0%) | 0 (0.0%) |
| All other Fuels | 0 (0.0%) | 0 (0.0%) |
| No Fuel Used | 0 (0.0%) | 0 (0.0%) |
| Total | 2,633 (100.0%) | 1,468 (100.0%) |
Household Vehicle Usage in Brentwood
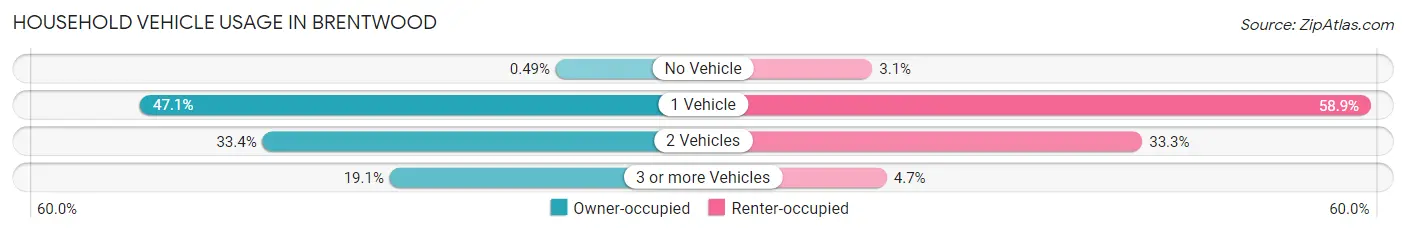
| Vehicles per Household | Owner-occupied | Renter-occupied |
| No Vehicle | 13 (0.5%) | 45 (3.1%) |
| 1 Vehicle | 1,239 (47.1%) | 865 (58.9%) |
| 2 Vehicles | 878 (33.4%) | 489 (33.3%) |
| 3 or more Vehicles | 503 (19.1%) | 69 (4.7%) |
| Total | 2,633 (100.0%) | 1,468 (100.0%) |
Real Estate & Mortgages in Brentwood
Real Estate and Mortgage Overview in Brentwood
| Characteristic | Without Mortgage | With Mortgage |
| Housing Units | 986 | 1,647 |
| Median Property Value | $262,200 | $276,000 |
| Median Household Income | $78,984 | $613 |
| Monthly Housing Costs | $626 | $201 |
| Real Estate Taxes | $3,067 | $7 |
Property Value by Mortgage Status in Brentwood
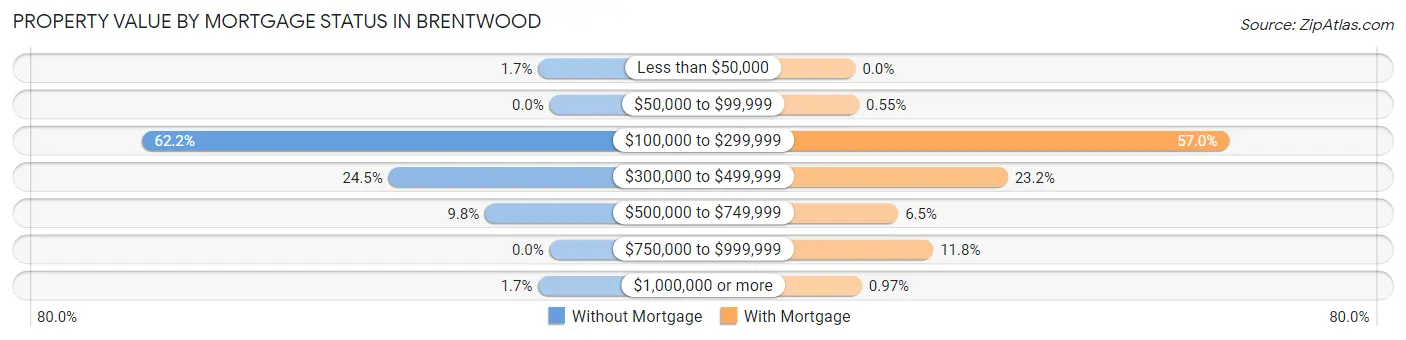
| Property Value | Without Mortgage | With Mortgage |
| Less than $50,000 | 17 (1.7%) | 0 (0.0%) |
| $50,000 to $99,999 | 0 (0.0%) | 9 (0.5%) |
| $100,000 to $299,999 | 613 (62.2%) | 938 (57.0%) |
| $300,000 to $499,999 | 242 (24.5%) | 382 (23.2%) |
| $500,000 to $749,999 | 97 (9.8%) | 107 (6.5%) |
| $750,000 to $999,999 | 0 (0.0%) | 195 (11.8%) |
| $1,000,000 or more | 17 (1.7%) | 16 (1.0%) |
| Total | 986 (100.0%) | 1,647 (100.0%) |
Household Income by Mortgage Status in Brentwood
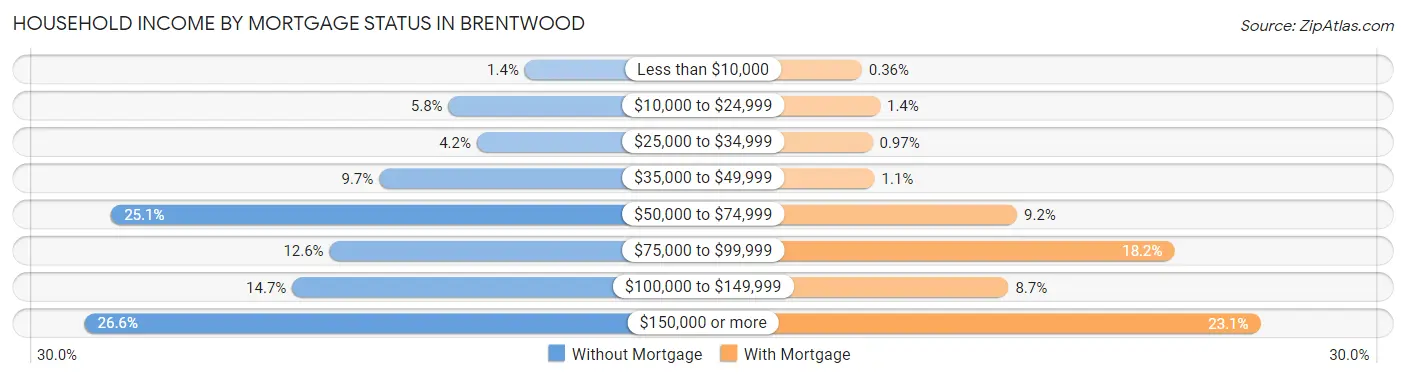
| Household Income | Without Mortgage | With Mortgage |
| Less than $10,000 | 14 (1.4%) | 6 (0.4%) |
| $10,000 to $24,999 | 57 (5.8%) | 23 (1.4%) |
| $25,000 to $34,999 | 41 (4.2%) | 16 (1.0%) |
| $35,000 to $49,999 | 96 (9.7%) | 18 (1.1%) |
| $50,000 to $74,999 | 247 (25.1%) | 152 (9.2%) |
| $75,000 to $99,999 | 124 (12.6%) | 300 (18.2%) |
| $100,000 to $149,999 | 145 (14.7%) | 144 (8.7%) |
| $150,000 or more | 262 (26.6%) | 381 (23.1%) |
| Total | 986 (100.0%) | 1,647 (100.0%) |
Property Value to Household Income Ratio in Brentwood
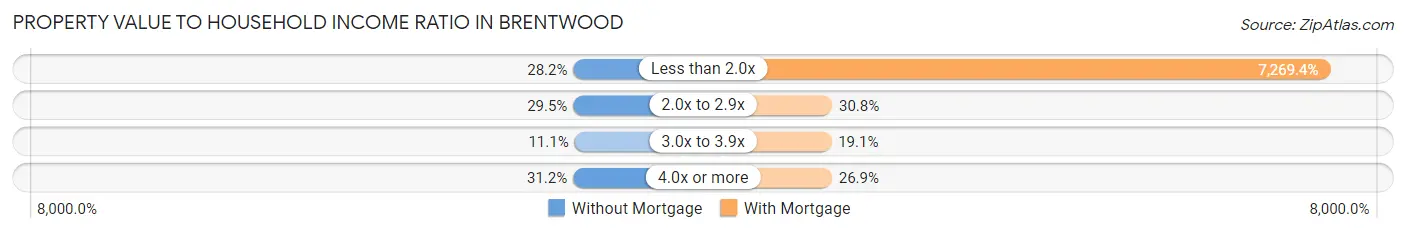
| Value-to-Income Ratio | Without Mortgage | With Mortgage |
| Less than 2.0x | 278 (28.2%) | 119,727 (7,269.4%) |
| 2.0x to 2.9x | 291 (29.5%) | 508 (30.8%) |
| 3.0x to 3.9x | 109 (11.1%) | 314 (19.1%) |
| 4.0x or more | 308 (31.2%) | 443 (26.9%) |
| Total | 986 (100.0%) | 1,647 (100.0%) |
Real Estate Taxes by Mortgage Status in Brentwood
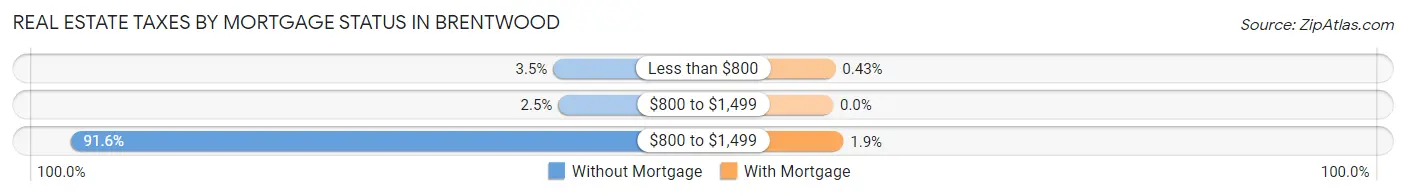
| Property Taxes | Without Mortgage | With Mortgage |
| Less than $800 | 34 (3.5%) | 7 (0.4%) |
| $800 to $1,499 | 25 (2.5%) | 0 (0.0%) |
| $800 to $1,499 | 903 (91.6%) | 31 (1.9%) |
| Total | 986 (100.0%) | 1,647 (100.0%) |
Health & Disability in Brentwood
Health Insurance Coverage by Age in Brentwood
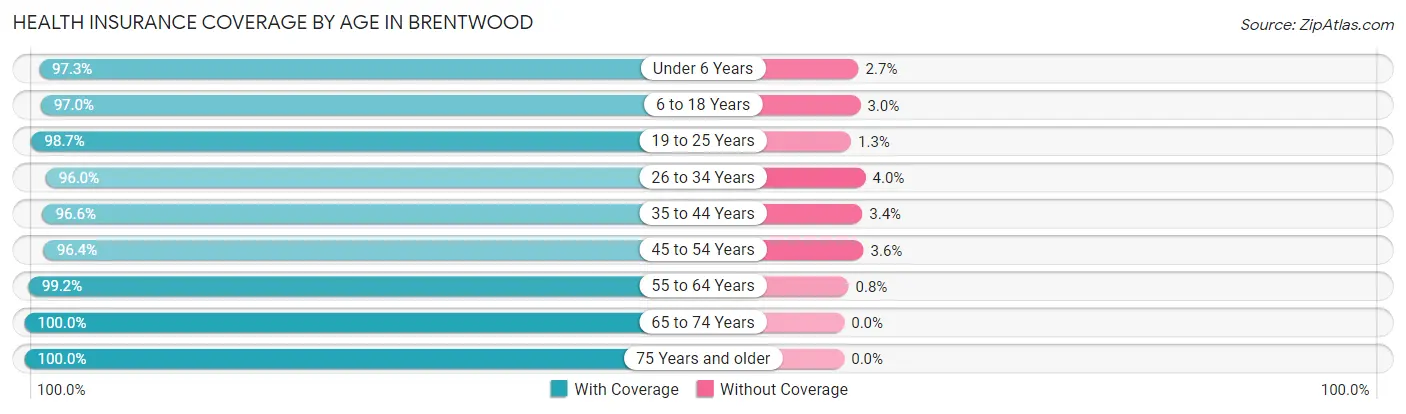
| Age Bracket | With Coverage | Without Coverage |
| Under 6 Years | 545 (97.3%) | 15 (2.7%) |
| 6 to 18 Years | 935 (97.0%) | 29 (3.0%) |
| 19 to 25 Years | 933 (98.7%) | 12 (1.3%) |
| 26 to 34 Years | 1,404 (96.0%) | 58 (4.0%) |
| 35 to 44 Years | 1,349 (96.6%) | 47 (3.4%) |
| 45 to 54 Years | 696 (96.4%) | 26 (3.6%) |
| 55 to 64 Years | 871 (99.2%) | 7 (0.8%) |
| 65 to 74 Years | 755 (100.0%) | 0 (0.0%) |
| 75 Years and older | 471 (100.0%) | 0 (0.0%) |
| Total | 7,959 (97.6%) | 194 (2.4%) |
Health Insurance Coverage by Citizenship Status in Brentwood
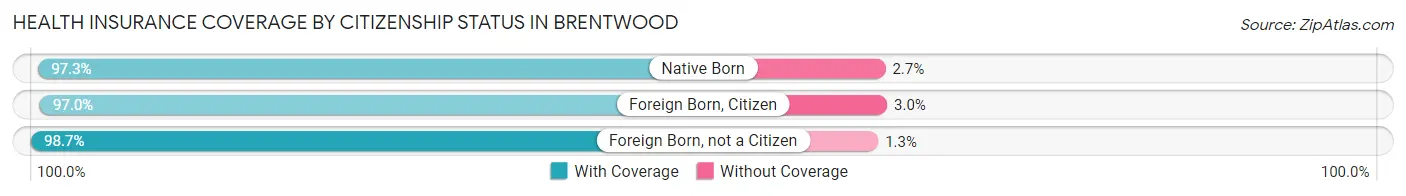
| Citizenship Status | With Coverage | Without Coverage |
| Native Born | 545 (97.3%) | 15 (2.7%) |
| Foreign Born, Citizen | 935 (97.0%) | 29 (3.0%) |
| Foreign Born, not a Citizen | 933 (98.7%) | 12 (1.3%) |
Health Insurance Coverage by Household Income in Brentwood
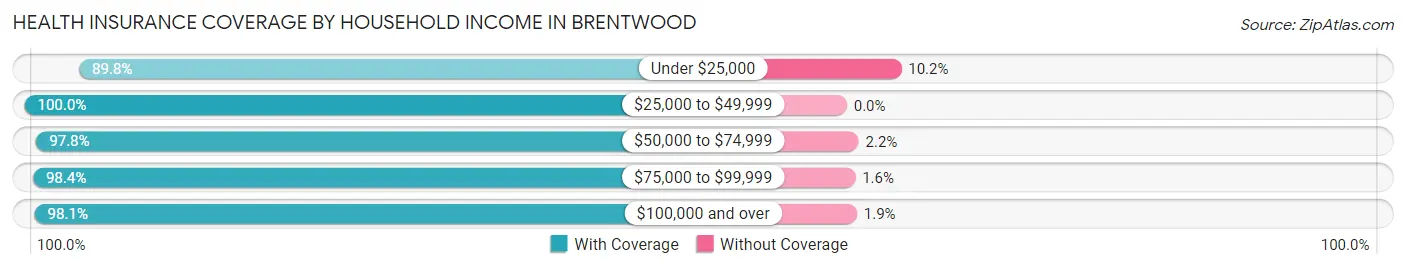
| Household Income | With Coverage | Without Coverage |
| Under $25,000 | 563 (89.8%) | 64 (10.2%) |
| $25,000 to $49,999 | 761 (100.0%) | 0 (0.0%) |
| $50,000 to $74,999 | 1,284 (97.8%) | 29 (2.2%) |
| $75,000 to $99,999 | 871 (98.4%) | 14 (1.6%) |
| $100,000 and over | 4,473 (98.1%) | 86 (1.9%) |
Public vs Private Health Insurance Coverage by Age in Brentwood
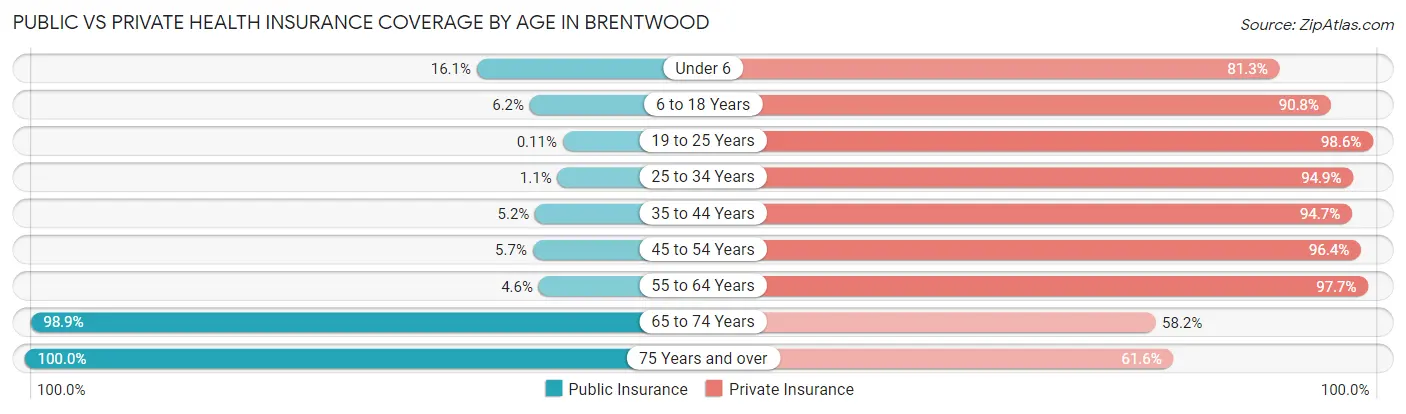
| Age Bracket | Public Insurance | Private Insurance |
| Under 6 | 90 (16.1%) | 455 (81.2%) |
| 6 to 18 Years | 60 (6.2%) | 875 (90.8%) |
| 19 to 25 Years | 1 (0.1%) | 932 (98.6%) |
| 25 to 34 Years | 16 (1.1%) | 1,388 (94.9%) |
| 35 to 44 Years | 73 (5.2%) | 1,322 (94.7%) |
| 45 to 54 Years | 41 (5.7%) | 696 (96.4%) |
| 55 to 64 Years | 40 (4.6%) | 858 (97.7%) |
| 65 to 74 Years | 747 (98.9%) | 439 (58.2%) |
| 75 Years and over | 471 (100.0%) | 290 (61.6%) |
| Total | 1,539 (18.9%) | 7,255 (89.0%) |
Disability Status by Sex by Age in Brentwood
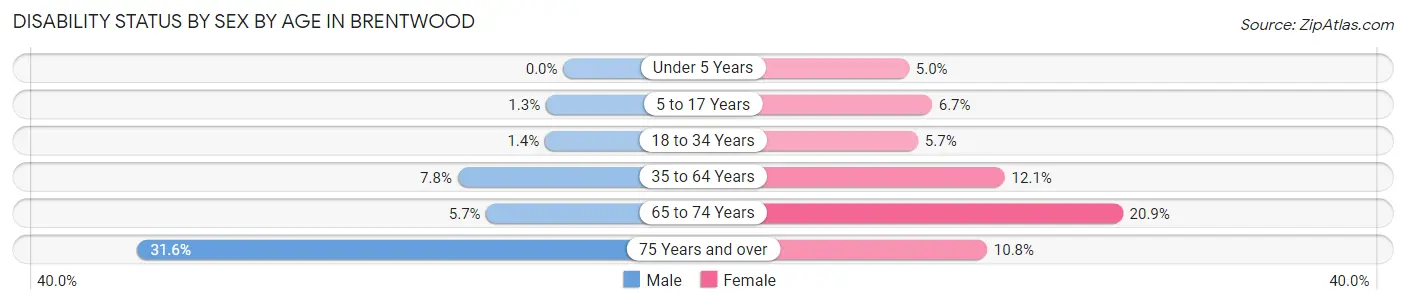
| Age Bracket | Male | Female |
| Under 5 Years | 0 (0.0%) | 10 (5.0%) |
| 5 to 17 Years | 8 (1.3%) | 28 (6.7%) |
| 18 to 34 Years | 17 (1.4%) | 68 (5.7%) |
| 35 to 64 Years | 111 (7.8%) | 191 (12.1%) |
| 65 to 74 Years | 19 (5.7%) | 88 (20.8%) |
| 75 Years and over | 55 (31.6%) | 32 (10.8%) |
Disability Class by Sex by Age in Brentwood
Disability Class: Hearing Difficulty
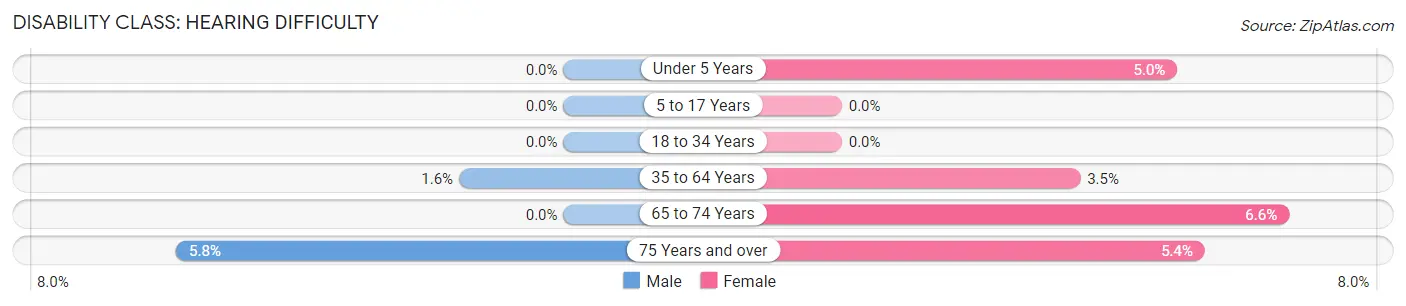
| Age Bracket | Male | Female |
| Under 5 Years | 0 (0.0%) | 10 (5.0%) |
| 5 to 17 Years | 0 (0.0%) | 0 (0.0%) |
| 18 to 34 Years | 0 (0.0%) | 0 (0.0%) |
| 35 to 64 Years | 22 (1.5%) | 56 (3.5%) |
| 65 to 74 Years | 0 (0.0%) | 28 (6.6%) |
| 75 Years and over | 10 (5.8%) | 16 (5.4%) |
Disability Class: Vision Difficulty
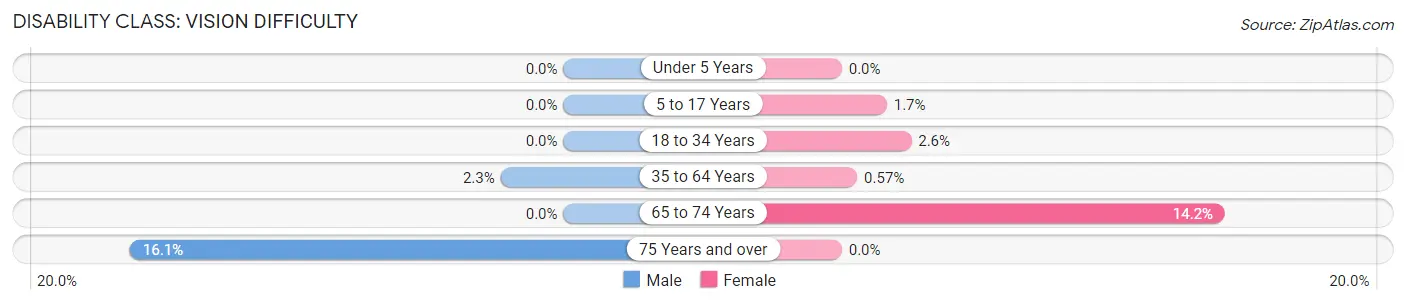
| Age Bracket | Male | Female |
| Under 5 Years | 0 (0.0%) | 0 (0.0%) |
| 5 to 17 Years | 0 (0.0%) | 7 (1.7%) |
| 18 to 34 Years | 0 (0.0%) | 31 (2.6%) |
| 35 to 64 Years | 33 (2.3%) | 9 (0.6%) |
| 65 to 74 Years | 0 (0.0%) | 60 (14.2%) |
| 75 Years and over | 28 (16.1%) | 0 (0.0%) |
Disability Class: Cognitive Difficulty
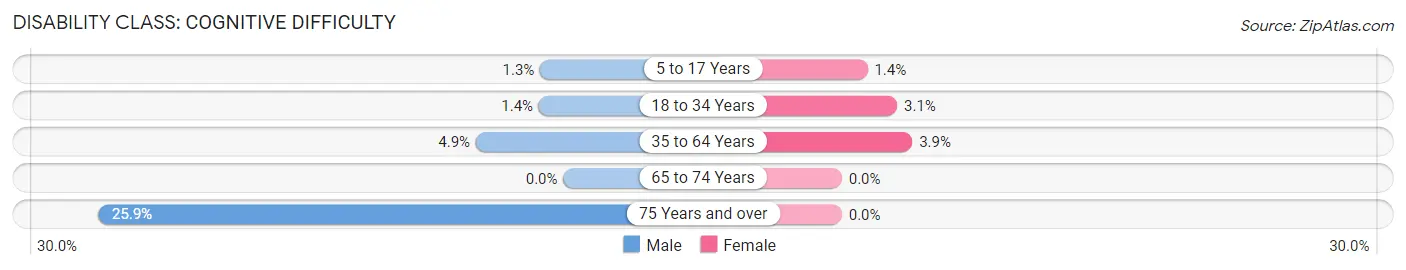
| Age Bracket | Male | Female |
| 5 to 17 Years | 8 (1.3%) | 6 (1.4%) |
| 18 to 34 Years | 17 (1.4%) | 37 (3.1%) |
| 35 to 64 Years | 69 (4.9%) | 62 (3.9%) |
| 65 to 74 Years | 0 (0.0%) | 0 (0.0%) |
| 75 Years and over | 45 (25.9%) | 0 (0.0%) |
Disability Class: Ambulatory Difficulty
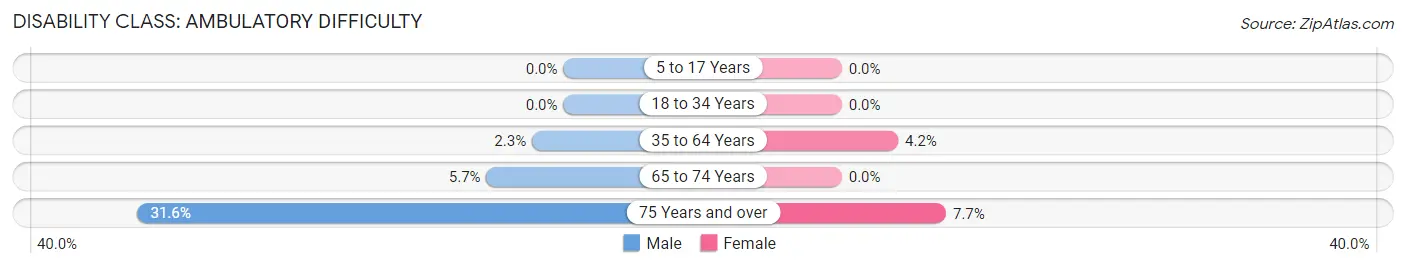
| Age Bracket | Male | Female |
| 5 to 17 Years | 0 (0.0%) | 0 (0.0%) |
| 18 to 34 Years | 0 (0.0%) | 0 (0.0%) |
| 35 to 64 Years | 33 (2.3%) | 66 (4.2%) |
| 65 to 74 Years | 19 (5.7%) | 0 (0.0%) |
| 75 Years and over | 55 (31.6%) | 23 (7.7%) |
Disability Class: Self-Care Difficulty
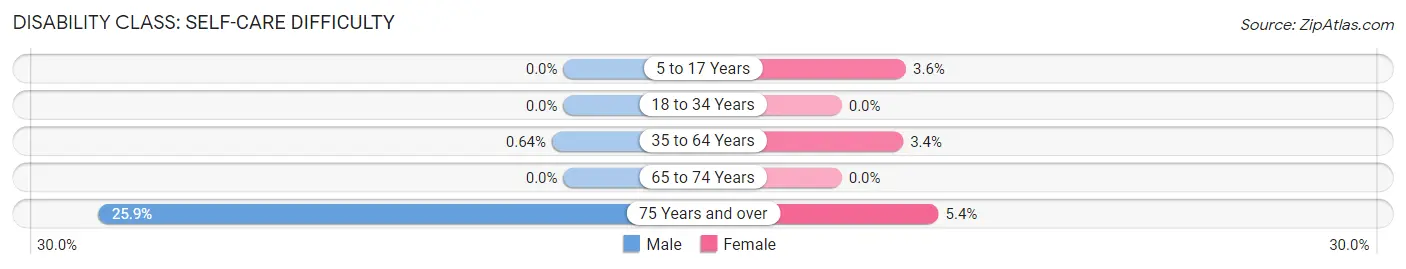
| Age Bracket | Male | Female |
| 5 to 17 Years | 0 (0.0%) | 15 (3.6%) |
| 18 to 34 Years | 0 (0.0%) | 0 (0.0%) |
| 35 to 64 Years | 9 (0.6%) | 54 (3.4%) |
| 65 to 74 Years | 0 (0.0%) | 0 (0.0%) |
| 75 Years and over | 45 (25.9%) | 16 (5.4%) |
Technology Access in Brentwood
Computing Device Access in Brentwood
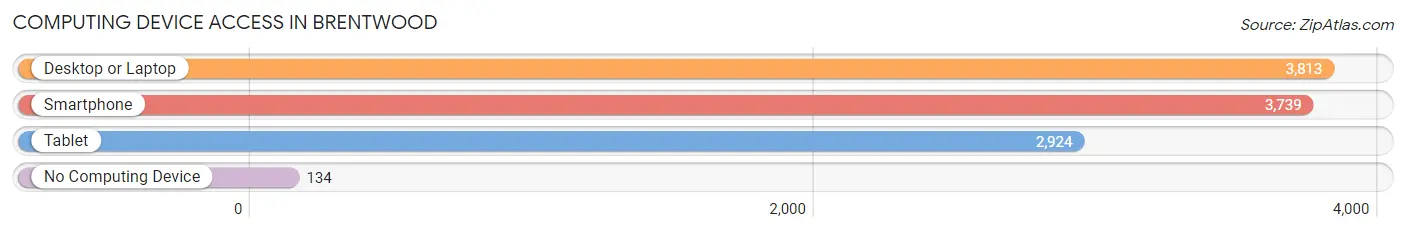
| Device Type | # Households | % Households |
| Desktop or Laptop | 3,813 | 93.0% |
| Smartphone | 3,739 | 91.2% |
| Tablet | 2,924 | 71.3% |
| No Computing Device | 134 | 3.3% |
| Total | 4,101 | 100.0% |
Internet Access in Brentwood
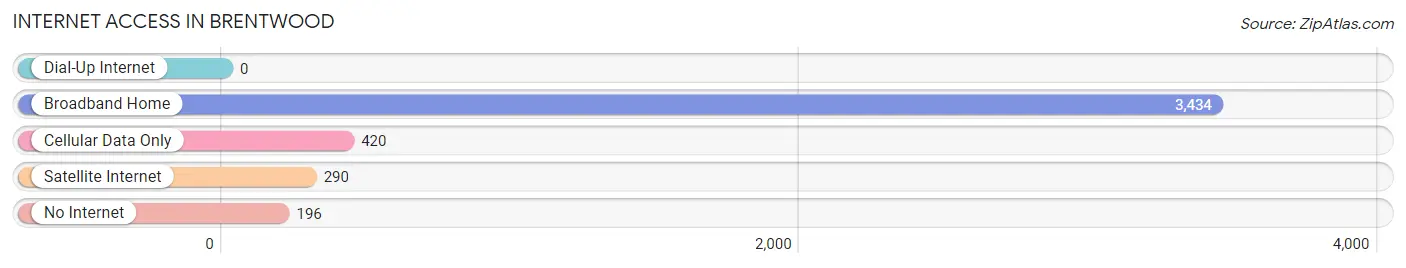
| Internet Type | # Households | % Households |
| Dial-Up Internet | 0 | 0.0% |
| Broadband Home | 3,434 | 83.7% |
| Cellular Data Only | 420 | 10.2% |
| Satellite Internet | 290 | 7.1% |
| No Internet | 196 | 4.8% |
| Total | 4,101 | 100.0% |
Brentwood Summary
Brentwood is a city located in St. Louis County, Missouri, United States. It is a suburb of St. Louis and is part of the Greater St. Louis metropolitan area. The population was 8,055 at the 2010 census.
History
Brentwood was founded in 1876 by William B. Brent, a former Confederate soldier. Brent purchased a tract of land in the area and began to develop it into a residential community. The town was incorporated in 1914 and was named after Brent.
In the early 20th century, Brentwood was a popular summer resort for St. Louisans. The town was known for its many parks and recreational facilities, including a golf course, tennis courts, and a swimming pool.
Geography
Brentwood is located at 38°37′17″N 90°22′45″W (38.6214, -90.3791). According to the United States Census Bureau, the city has a total area of 2.2 square miles (5.7 km2), all land.
Economy
Brentwood is home to a variety of businesses, including retail stores, restaurants, and professional services. The city is also home to several corporate headquarters, including Express Scripts, a pharmacy benefit management company, and Edward Jones, a financial services firm.
Demographics
As of the 2010 census, there were 8,055 people, 3,541 households, and 2,092 families residing in the city. The population density was 3,637.3 people per square mile (1,406.2/km2). There were 3,817 housing units at an average density of 1,717.2 per square mile (662.3/km2). The racial makeup of the city was 87.2% White, 5.3% African American, 0.2% Native American, 4.2% Asian, 0.7% from other races, and 2.4% from two or more races. Hispanic or Latino of any race were 2.7% of the population.
There were 3,541 households, out of which 28.2% had children under the age of 18 living with them, 46.2% were married couples living together, 10.2% had a female householder with no husband present, and 39.7% were non-families. 33.2% of all households were made up of individuals, and 11.2% had someone living alone who was 65 years of age or older. The average household size was 2.27 and the average family size was 2.93.
In the city, the population was spread out, with 22.7% under the age of 18, 6.7% from 18 to 24, 28.2% from 25 to 44, 27.2% from 45 to 64, and 15.2% who were 65 years of age or older. The median age was 40 years. For every 100 females, there were 91.2 males. For every 100 females age 18 and over, there were 87.7 males.
The median income for a household in the city was $60,945, and the median income for a family was $76,945. Males had a median income of $50,945 versus $37,945 for females. The per capita income for the city was $35,945. About 3.2% of families and 4.7% of the population were below the poverty line, including 5.3% of those under age 18 and 4.2% of those age 65 or over.
Common Questions
What is Per Capita Income in Brentwood?
Per Capita income in Brentwood is $62,793.
What is the Median Family Income in Brentwood?
Median Family Income in Brentwood is $118,923.
What is the Median Household income in Brentwood?
Median Household Income in Brentwood is $89,688.
What is Income or Wage Gap in Brentwood?
Income or Wage Gap in Brentwood is 28.4%.
Women in Brentwood earn 71.6 cents for every dollar earned by a man.
What is Inequality or Gini Index in Brentwood?
Inequality or Gini Index in Brentwood is 0.45.
What is the Total Population of Brentwood?
Total Population of Brentwood is 8,173.
What is the Total Male Population of Brentwood?
Total Male Population of Brentwood is 4,036.
What is the Total Female Population of Brentwood?
Total Female Population of Brentwood is 4,137.
What is the Ratio of Males per 100 Females in Brentwood?
There are 97.56 Males per 100 Females in Brentwood.
What is the Ratio of Females per 100 Males in Brentwood?
There are 102.50 Females per 100 Males in Brentwood.
What is the Median Population Age in Brentwood?
Median Population Age in Brentwood is 35.8 Years.
What is the Average Family Size in Brentwood
Average Family Size in Brentwood is 2.8 People.
What is the Average Household Size in Brentwood
Average Household Size in Brentwood is 2.0 People.
How Large is the Labor Force in Brentwood?
There are 5,058 People in the Labor Forcein in Brentwood.
What is the Percentage of People in the Labor Force in Brentwood?
74.5% of People are in the Labor Force in Brentwood.
What is the Unemployment Rate in Brentwood?
Unemployment Rate in Brentwood is 2.3%.