Shenorock, NY Map & Demographics
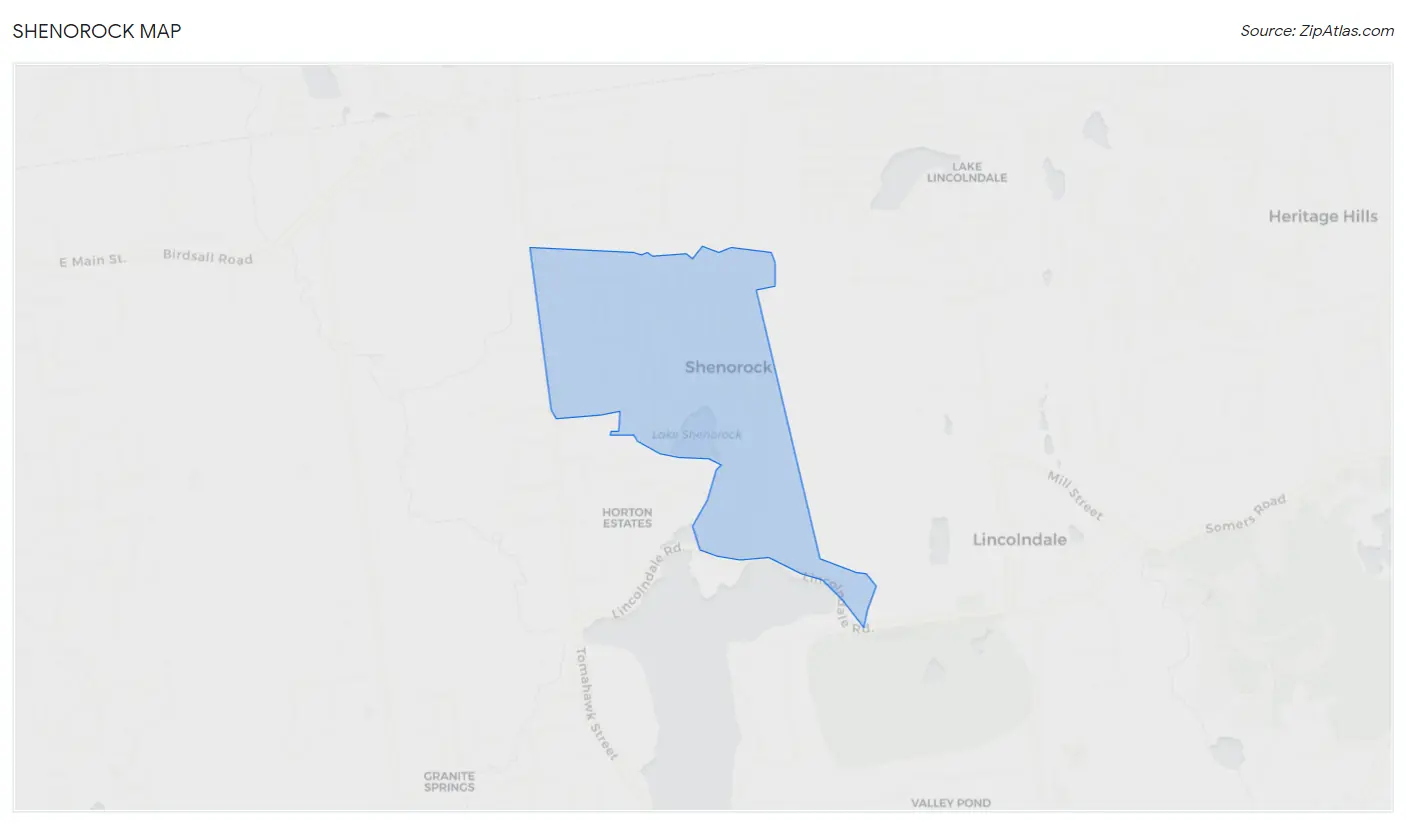
Shenorock Map
Shenorock Overview
$57,475
PER CAPITA INCOME
$169,931
AVG FAMILY INCOME
$129,700
AVG HOUSEHOLD INCOME
21.0%
WAGE / INCOME GAP [ % ]
79.0¢/ $1
WAGE / INCOME GAP [ $ ]
0.37
INEQUALITY / GINI INDEX
1,883
TOTAL POPULATION
908
MALE POPULATION
975
FEMALE POPULATION
93.13
MALES / 100 FEMALES
107.38
FEMALES / 100 MALES
43.5
MEDIAN AGE
3.1
AVG FAMILY SIZE
2.8
AVG HOUSEHOLD SIZE
1,045
LABOR FORCE [ PEOPLE ]
65.3%
PERCENT IN LABOR FORCE
6.1%
UNEMPLOYMENT RATE
Shenorock Area Codes
Income in Shenorock
Income Overview in Shenorock
Per Capita Income in Shenorock is $57,475, while median incomes of families and households are $169,931 and $129,700 respectively.
| Characteristic | Number | Measure |
| Per Capita Income | 1,883 | $57,475 |
| Median Family Income | 549 | $169,931 |
| Mean Family Income | 549 | $174,375 |
| Median Household Income | 678 | $129,700 |
| Mean Household Income | 678 | $158,854 |
| Income Deficit | 549 | $0 |
| Wage / Income Gap (%) | 1,883 | 21.02% |
| Wage / Income Gap ($) | 1,883 | 78.98¢ per $1 |
| Gini / Inequality Index | 1,883 | 0.37 |
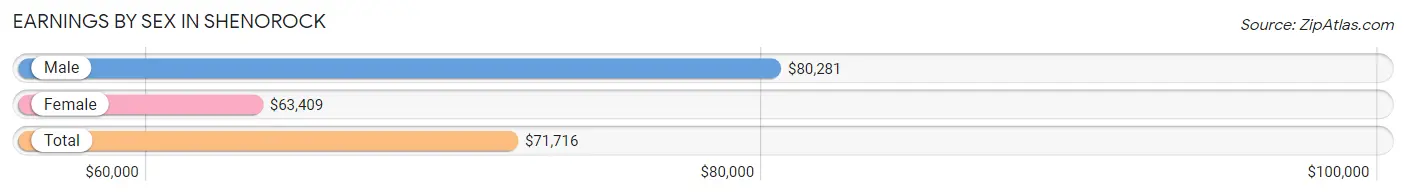
Earnings by Sex in Shenorock
Average Earnings in Shenorock are $71,716, $80,281 for men and $63,409 for women, a difference of 21.0%.
| Sex | Number | Average Earnings |
| Male | 605 (53.3%) | $80,281 |
| Female | 530 (46.7%) | $63,409 |
| Total | 1,135 (100.0%) | $71,716 |
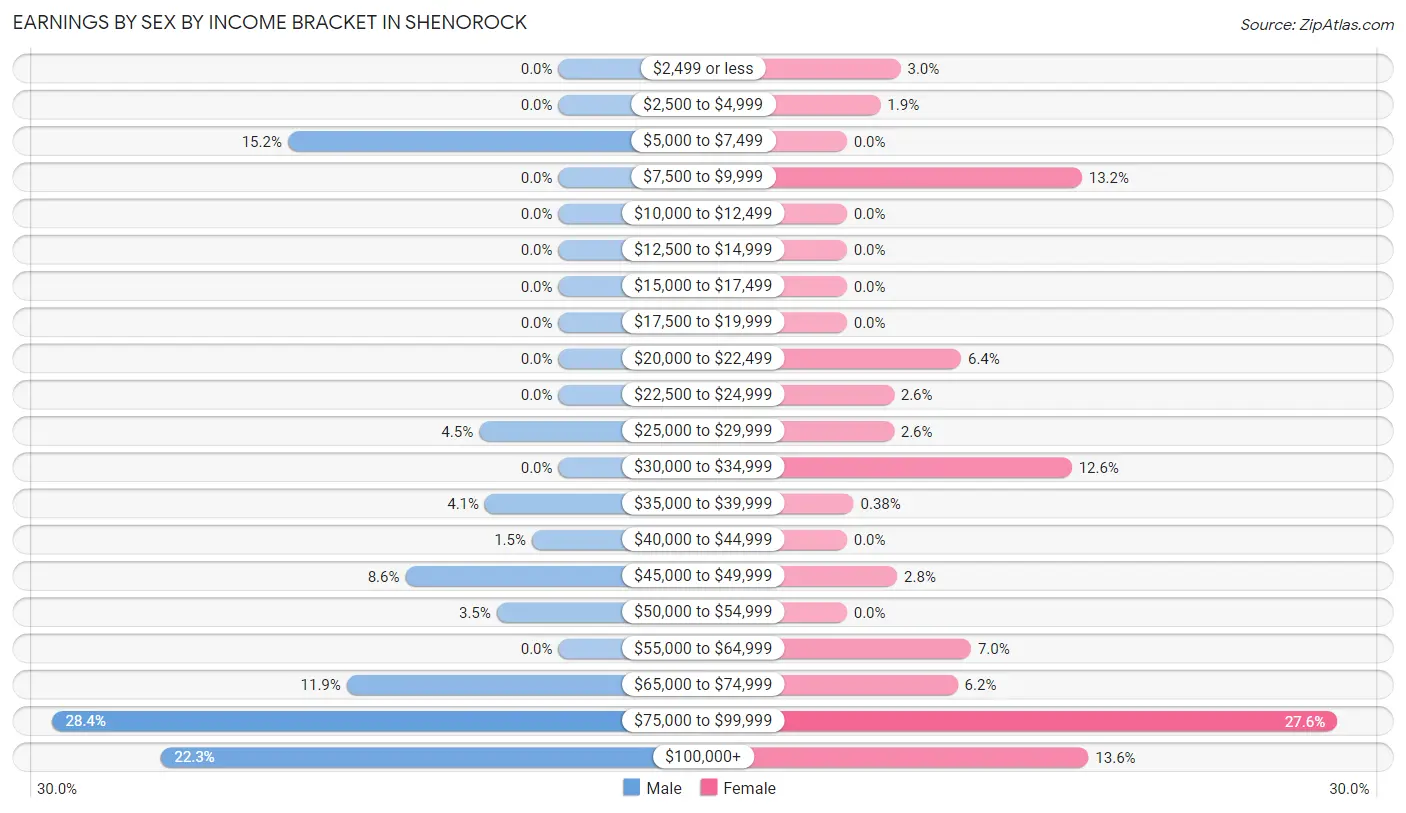
Earnings by Sex by Income Bracket in Shenorock
The most common earnings brackets in Shenorock are $75,000 to $99,999 for men (172 | 28.4%) and $75,000 to $99,999 for women (146 | 27.6%).
| Income | Male | Female |
| $2,499 or less | 0 (0.0%) | 16 (3.0%) |
| $2,500 to $4,999 | 0 (0.0%) | 10 (1.9%) |
| $5,000 to $7,499 | 92 (15.2%) | 0 (0.0%) |
| $7,500 to $9,999 | 0 (0.0%) | 70 (13.2%) |
| $10,000 to $12,499 | 0 (0.0%) | 0 (0.0%) |
| $12,500 to $14,999 | 0 (0.0%) | 0 (0.0%) |
| $15,000 to $17,499 | 0 (0.0%) | 0 (0.0%) |
| $17,500 to $19,999 | 0 (0.0%) | 0 (0.0%) |
| $20,000 to $22,499 | 0 (0.0%) | 34 (6.4%) |
| $22,500 to $24,999 | 0 (0.0%) | 14 (2.6%) |
| $25,000 to $29,999 | 27 (4.5%) | 14 (2.6%) |
| $30,000 to $34,999 | 0 (0.0%) | 67 (12.6%) |
| $35,000 to $39,999 | 25 (4.1%) | 2 (0.4%) |
| $40,000 to $44,999 | 9 (1.5%) | 0 (0.0%) |
| $45,000 to $49,999 | 52 (8.6%) | 15 (2.8%) |
| $50,000 to $54,999 | 21 (3.5%) | 0 (0.0%) |
| $55,000 to $64,999 | 0 (0.0%) | 37 (7.0%) |
| $65,000 to $74,999 | 72 (11.9%) | 33 (6.2%) |
| $75,000 to $99,999 | 172 (28.4%) | 146 (27.6%) |
| $100,000+ | 135 (22.3%) | 72 (13.6%) |
| Total | 605 (100.0%) | 530 (100.0%) |
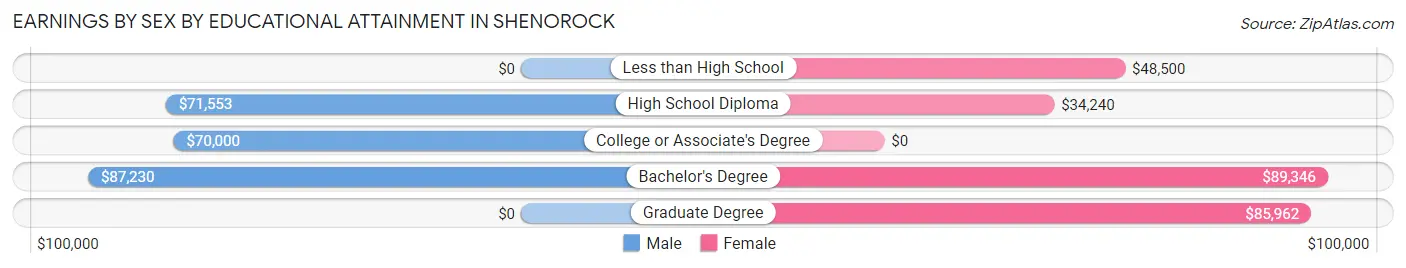
Earnings by Sex by Educational Attainment in Shenorock
Average earnings in Shenorock are $86,127 for men and $81,912 for women, a difference of 4.9%. Men with an educational attainment of bachelor's degree enjoy the highest average annual earnings of $87,230, while those with college or associate's degree education earn the least with $70,000. Women with an educational attainment of bachelor's degree earn the most with the average annual earnings of $89,346, while those with high school diploma education have the smallest earnings of $34,240.
| Educational Attainment | Male Income | Female Income |
| Less than High School | - | - |
| High School Diploma | $71,553 | $34,240 |
| College or Associate's Degree | $70,000 | $0 |
| Bachelor's Degree | $87,230 | $89,346 |
| Graduate Degree | - | - |
| Total | $86,127 | $81,912 |
Family Income in Shenorock
Family Income Brackets in Shenorock
According to the Shenorock family income data, there are 172 families falling into the $150,000 to $199,999 income range, which is the most common income bracket and makes up 31.3% of all families.
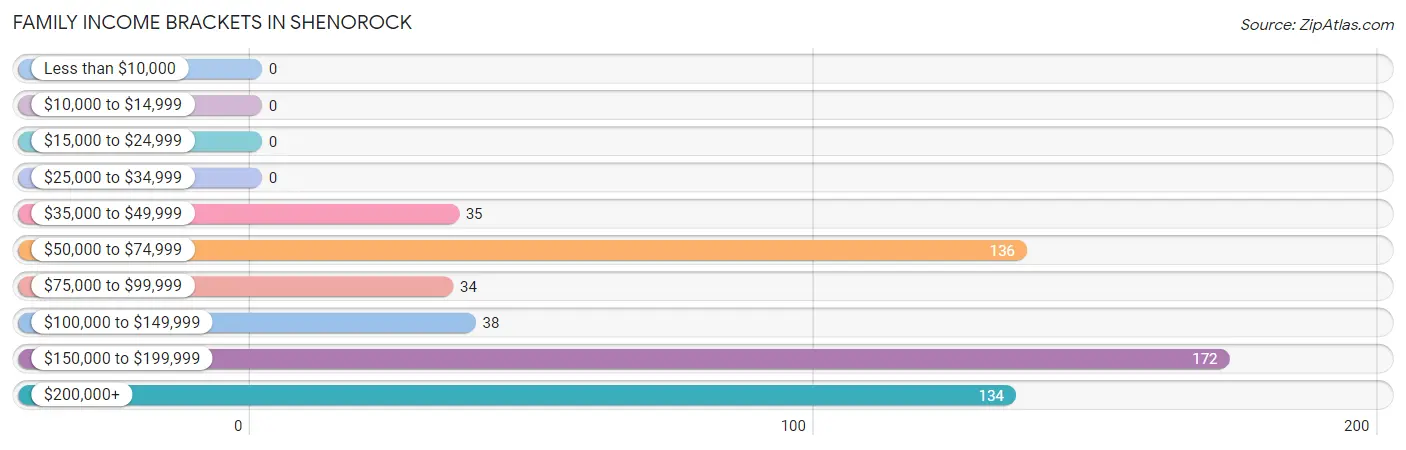
| Income Bracket | # Families | % Families |
| Less than $10,000 | 0 | 0.0% |
| $10,000 to $14,999 | 0 | 0.0% |
| $15,000 to $24,999 | 0 | 0.0% |
| $25,000 to $34,999 | 0 | 0.0% |
| $35,000 to $49,999 | 35 | 6.4% |
| $50,000 to $74,999 | 136 | 24.8% |
| $75,000 to $99,999 | 34 | 6.2% |
| $100,000 to $149,999 | 38 | 6.9% |
| $150,000 to $199,999 | 172 | 31.3% |
| $200,000+ | 134 | 24.4% |
Family Income by Famaliy Size in Shenorock
4-person families (102 | 18.6%) account for the highest median family income in Shenorock with $250,001 per family, while 4-person families (102 | 18.6%) have the highest median income of $62,500 per family member.
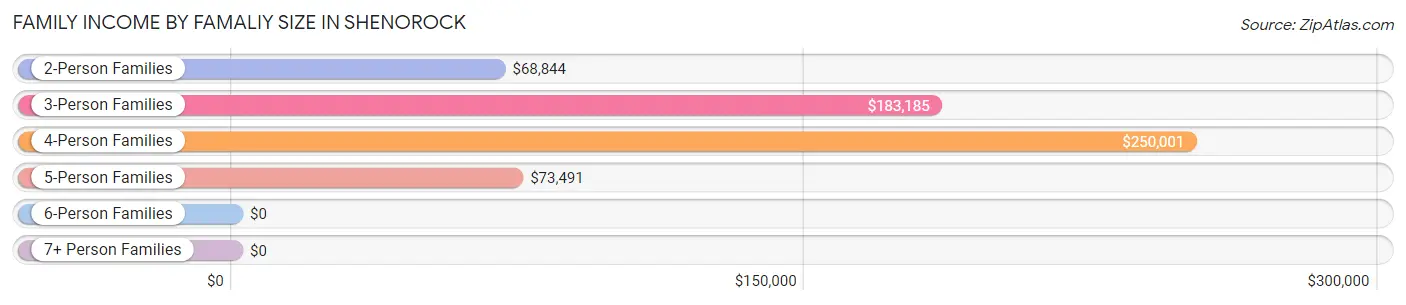
| Income Bracket | # Families | Median Income |
| 2-Person Families | 155 (28.2%) | $68,844 |
| 3-Person Families | 239 (43.5%) | $183,185 |
| 4-Person Families | 102 (18.6%) | $250,001 |
| 5-Person Families | 53 (9.7%) | $73,491 |
| 6-Person Families | 0 (0.0%) | $0 |
| 7+ Person Families | 0 (0.0%) | $0 |
| Total | 549 (100.0%) | $169,931 |
Family Income by Number of Earners in Shenorock
The median family income in Shenorock is $169,931, with families comprising 3+ earners (132) having the highest median family income of $250,001, while families with no earners (63) have the lowest median family income of $49,650, accounting for 24.0% and 11.5% of families, respectively.
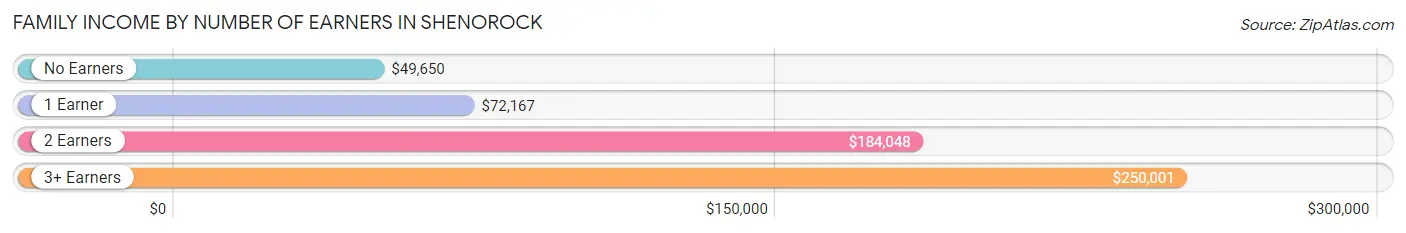
| Number of Earners | # Families | Median Income |
| No Earners | 63 (11.5%) | $49,650 |
| 1 Earner | 150 (27.3%) | $72,167 |
| 2 Earners | 204 (37.2%) | $184,048 |
| 3+ Earners | 132 (24.0%) | $250,001 |
| Total | 549 (100.0%) | $169,931 |
Household Income in Shenorock
Household Income Brackets in Shenorock
With 181 households falling in the category, the $150,000 to $199,999 income range is the most frequent in Shenorock, accounting for 26.7% of all households.
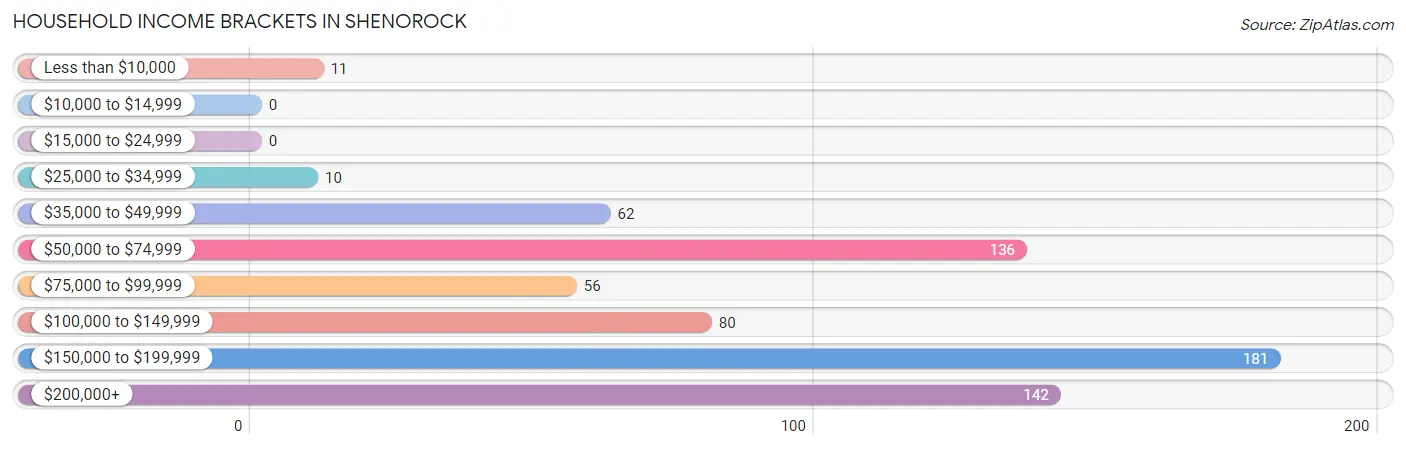
| Income Bracket | # Households | % Households |
| Less than $10,000 | 11 | 1.6% |
| $10,000 to $14,999 | 0 | 0.0% |
| $15,000 to $24,999 | 0 | 0.0% |
| $25,000 to $34,999 | 10 | 1.5% |
| $35,000 to $49,999 | 62 | 9.1% |
| $50,000 to $74,999 | 136 | 20.1% |
| $75,000 to $99,999 | 56 | 8.3% |
| $100,000 to $149,999 | 80 | 11.8% |
| $150,000 to $199,999 | 181 | 26.7% |
| $200,000+ | 142 | 20.9% |
Household Income by Householder Age in Shenorock
The median household income in Shenorock is $129,700, with the highest median household income of $183,274 found in the 25 to 44 years age bracket for the primary householder. A total of 154 households (22.7%) fall into this category. Meanwhile, the 15 to 24 years age bracket for the primary householder has the lowest median household income of $0, with 25 households (3.7%) in this group.
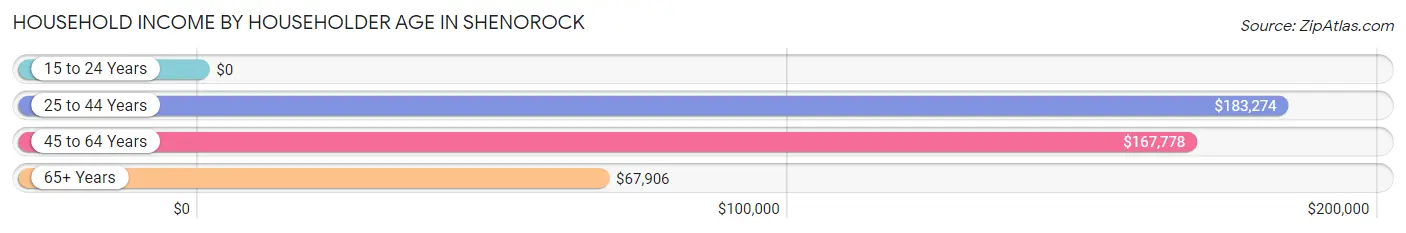
| Income Bracket | # Households | Median Income |
| 15 to 24 Years | 25 (3.7%) | $0 |
| 25 to 44 Years | 154 (22.7%) | $183,274 |
| 45 to 64 Years | 320 (47.2%) | $167,778 |
| 65+ Years | 179 (26.4%) | $67,906 |
| Total | 678 (100.0%) | $129,700 |
Poverty in Shenorock
Income Below Poverty by Sex and Age in Shenorock
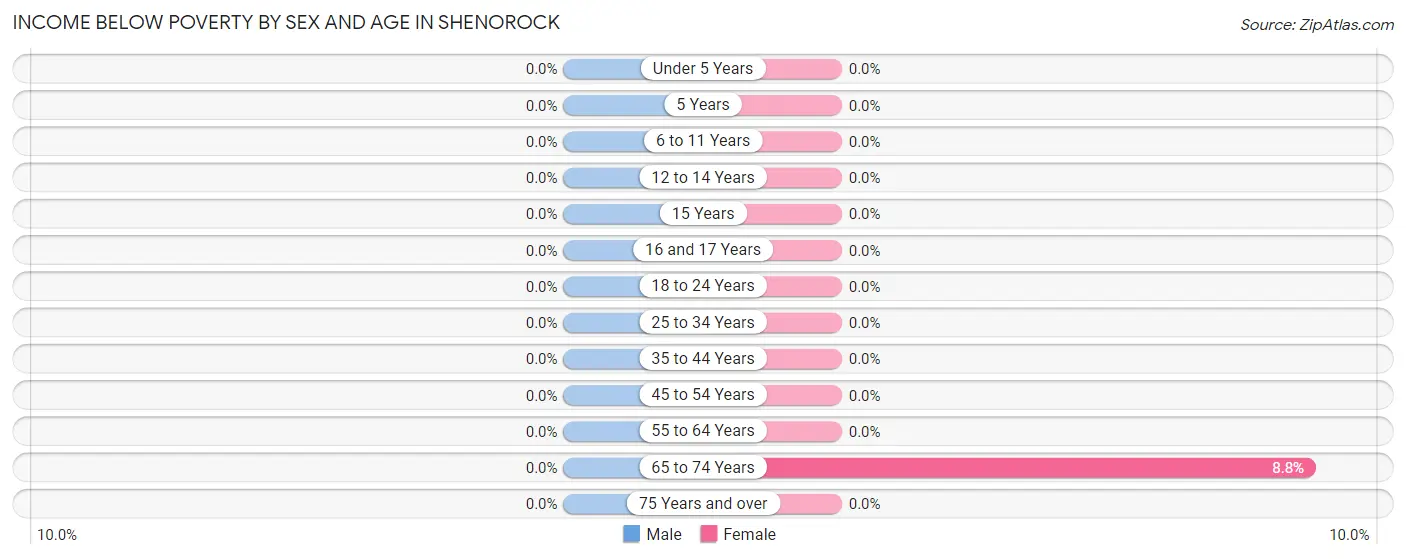
| Age Bracket | Male | Female |
| Under 5 Years | 0 (0.0%) | 0 (0.0%) |
| 5 Years | 0 (0.0%) | 0 (0.0%) |
| 6 to 11 Years | 0 (0.0%) | 0 (0.0%) |
| 12 to 14 Years | 0 (0.0%) | 0 (0.0%) |
| 15 Years | 0 (0.0%) | 0 (0.0%) |
| 16 and 17 Years | 0 (0.0%) | 0 (0.0%) |
| 18 to 24 Years | 0 (0.0%) | 0 (0.0%) |
| 25 to 34 Years | 0 (0.0%) | 0 (0.0%) |
| 35 to 44 Years | 0 (0.0%) | 0 (0.0%) |
| 45 to 54 Years | 0 (0.0%) | 0 (0.0%) |
| 55 to 64 Years | 0 (0.0%) | 0 (0.0%) |
| 65 to 74 Years | 0 (0.0%) | 11 (8.8%) |
| 75 Years and over | 0 (0.0%) | 0 (0.0%) |
| Total | 0 (0.0%) | 11 (1.1%) |
Income Above Poverty by Sex and Age in Shenorock
According to the poverty statistics in Shenorock, males aged 5 years and females aged under 5 years are the age groups that are most secure financially, with 100.0% of males and 100.0% of females in these age groups living above the poverty line.
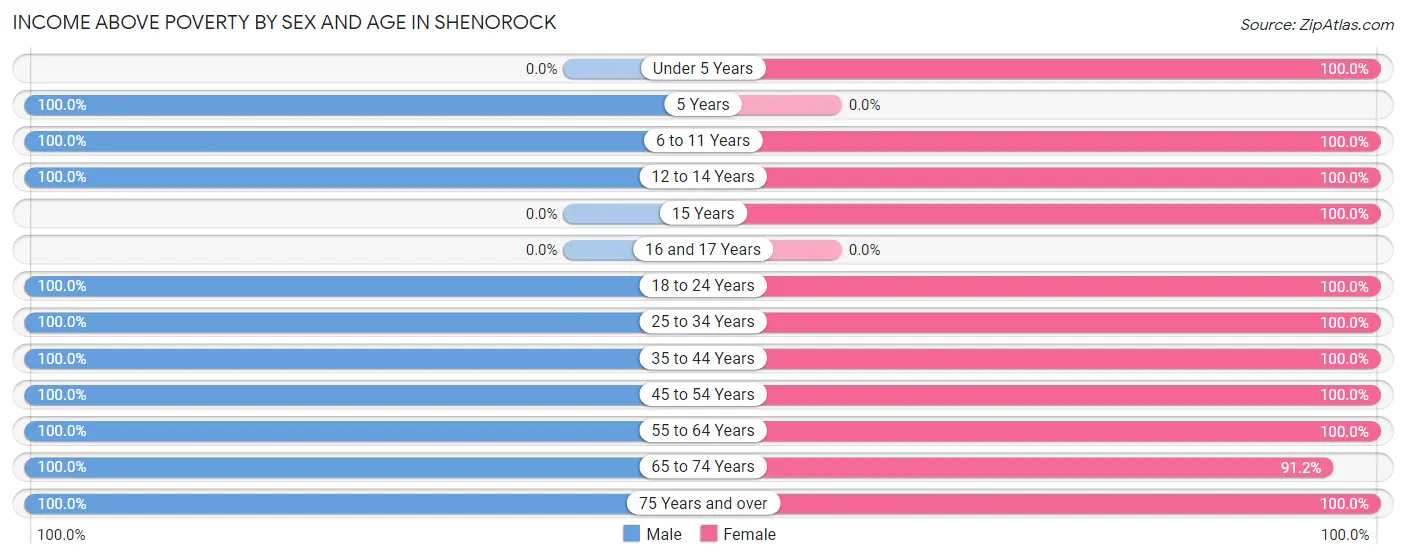
| Age Bracket | Male | Female |
| Under 5 Years | 0 (0.0%) | 47 (100.0%) |
| 5 Years | 9 (100.0%) | 0 (0.0%) |
| 6 to 11 Years | 47 (100.0%) | 87 (100.0%) |
| 12 to 14 Years | 32 (100.0%) | 47 (100.0%) |
| 15 Years | 0 (0.0%) | 14 (100.0%) |
| 16 and 17 Years | 0 (0.0%) | 0 (0.0%) |
| 18 to 24 Years | 184 (100.0%) | 120 (100.0%) |
| 25 to 34 Years | 20 (100.0%) | 18 (100.0%) |
| 35 to 44 Years | 155 (100.0%) | 192 (100.0%) |
| 45 to 54 Years | 177 (100.0%) | 195 (100.0%) |
| 55 to 64 Years | 184 (100.0%) | 68 (100.0%) |
| 65 to 74 Years | 56 (100.0%) | 114 (91.2%) |
| 75 Years and over | 44 (100.0%) | 62 (100.0%) |
| Total | 908 (100.0%) | 964 (98.9%) |
Income Below Poverty Among Married-Couple Families in Shenorock
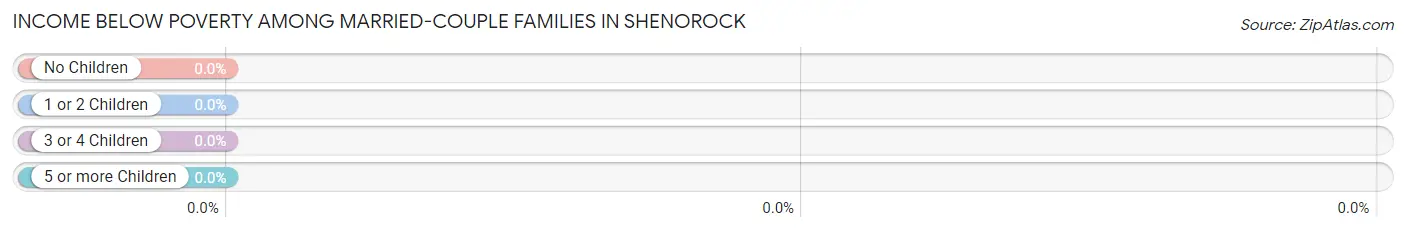
| Children | Above Poverty | Below Poverty |
| No Children | 285 (100.0%) | 0 (0.0%) |
| 1 or 2 Children | 181 (100.0%) | 0 (0.0%) |
| 3 or 4 Children | 9 (100.0%) | 0 (0.0%) |
| 5 or more Children | 0 (0.0%) | 0 (0.0%) |
| Total | 475 (100.0%) | 0 (0.0%) |
Income Below Poverty Among Single-Parent Households in Shenorock
| Children | Single Father | Single Mother |
| No Children | 0 (0.0%) | 0 (0.0%) |
| 1 or 2 Children | 0 (0.0%) | 0 (0.0%) |
| 3 or 4 Children | 0 (0.0%) | 0 (0.0%) |
| 5 or more Children | 0 (0.0%) | 0 (0.0%) |
| Total | 0 (0.0%) | 0 (0.0%) |
Income Below Poverty Among Married-Couple vs Single-Parent Households in Shenorock
| Children | Married-Couple Families | Single-Parent Households |
| No Children | 0 (0.0%) | 0 (0.0%) |
| 1 or 2 Children | 0 (0.0%) | 0 (0.0%) |
| 3 or 4 Children | 0 (0.0%) | 0 (0.0%) |
| 5 or more Children | 0 (0.0%) | 0 (0.0%) |
| Total | 0 (0.0%) | 0 (0.0%) |
Race in Shenorock
The most populous races in Shenorock are White / Caucasian (1,578 | 83.8%), Hispanic or Latino (433 | 23.0%), and Two or more Races (186 | 9.9%).
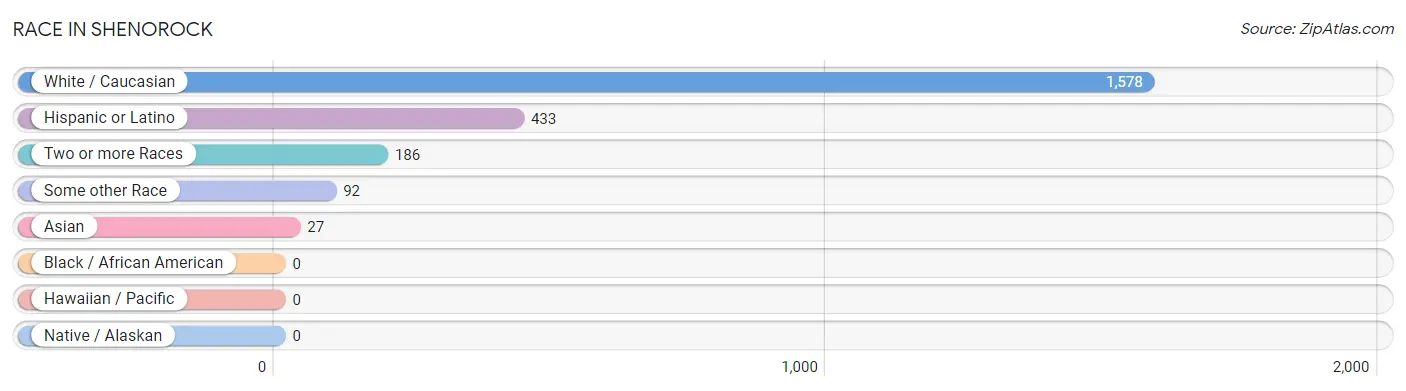
| Race | # Population | % Population |
| Asian | 27 | 1.4% |
| Black / African American | 0 | 0.0% |
| Hawaiian / Pacific | 0 | 0.0% |
| Hispanic or Latino | 433 | 23.0% |
| Native / Alaskan | 0 | 0.0% |
| White / Caucasian | 1,578 | 83.8% |
| Two or more Races | 186 | 9.9% |
| Some other Race | 92 | 4.9% |
| Total | 1,883 | 100.0% |
Ancestry in Shenorock
The most populous ancestries reported in Shenorock are Irish (437 | 23.2%), Italian (401 | 21.3%), South American (217 | 11.5%), German (187 | 9.9%), and Central American (140 | 7.4%), together accounting for 73.4% of all Shenorock residents.
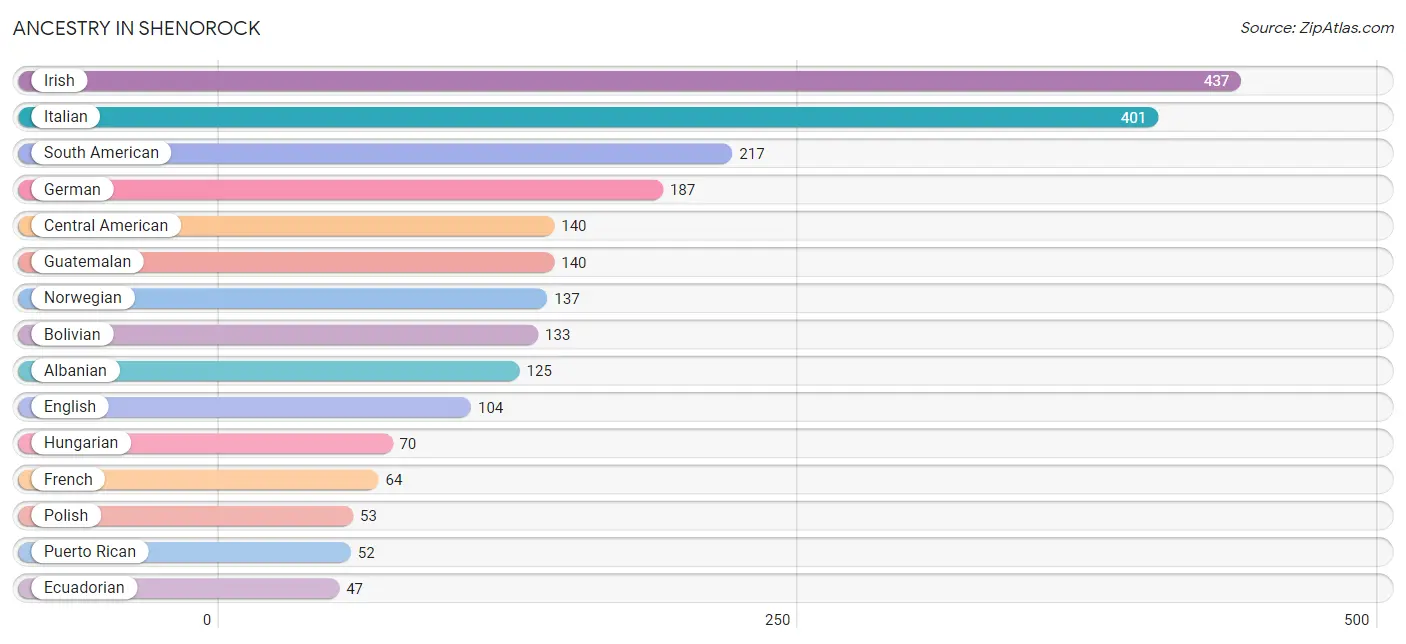
| Ancestry | # Population | % Population |
| Albanian | 125 | 6.6% |
| American | 36 | 1.9% |
| Bolivian | 133 | 7.1% |
| Brazilian | 35 | 1.9% |
| Central American | 140 | 7.4% |
| Colombian | 16 | 0.9% |
| Dutch | 14 | 0.7% |
| Ecuadorian | 47 | 2.5% |
| English | 104 | 5.5% |
| European | 36 | 1.9% |
| French | 64 | 3.4% |
| German | 187 | 9.9% |
| Guatemalan | 140 | 7.4% |
| Guyanese | 3 | 0.2% |
| Hungarian | 70 | 3.7% |
| Indian (Asian) | 27 | 1.4% |
| Irish | 437 | 23.2% |
| Italian | 401 | 21.3% |
| Northern European | 15 | 0.8% |
| Norwegian | 137 | 7.3% |
| Peruvian | 18 | 1.0% |
| Polish | 53 | 2.8% |
| Portuguese | 35 | 1.9% |
| Puerto Rican | 52 | 2.8% |
| Russian | 17 | 0.9% |
| Scottish | 14 | 0.7% |
| South American | 217 | 11.5% |
| Thai | 3 | 0.2% | View All 28 Rows |
Immigrants in Shenorock
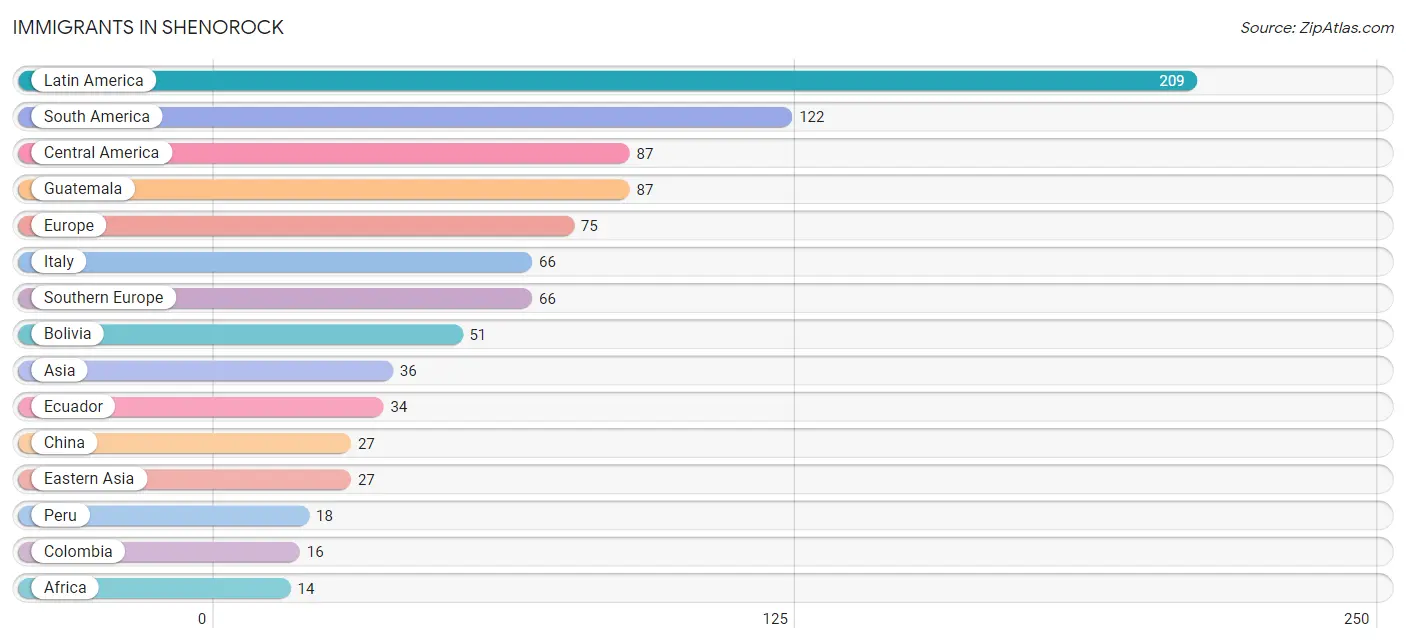
The most numerous immigrant groups reported in Shenorock came from Latin America (209 | 11.1%), South America (122 | 6.5%), Central America (87 | 4.6%), Guatemala (87 | 4.6%), and Europe (75 | 4.0%), together accounting for 30.8% of all Shenorock residents.
| Immigration Origin | # Population | % Population |
| Africa | 14 | 0.7% |
| Asia | 36 | 1.9% |
| Bolivia | 51 | 2.7% |
| Central America | 87 | 4.6% |
| China | 27 | 1.4% |
| Colombia | 16 | 0.9% |
| Eastern Asia | 27 | 1.4% |
| Eastern Europe | 9 | 0.5% |
| Ecuador | 34 | 1.8% |
| Europe | 75 | 4.0% |
| Guatemala | 87 | 4.6% |
| Guyana | 3 | 0.2% |
| Italy | 66 | 3.5% |
| Latin America | 209 | 11.1% |
| Peru | 18 | 1.0% |
| Poland | 9 | 0.5% |
| South Africa | 14 | 0.7% |
| South America | 122 | 6.5% |
| South Central Asia | 9 | 0.5% |
| Southern Europe | 66 | 3.5% |
| Uzbekistan | 9 | 0.5% | View All 21 Rows |
Sex and Age in Shenorock
Sex and Age in Shenorock
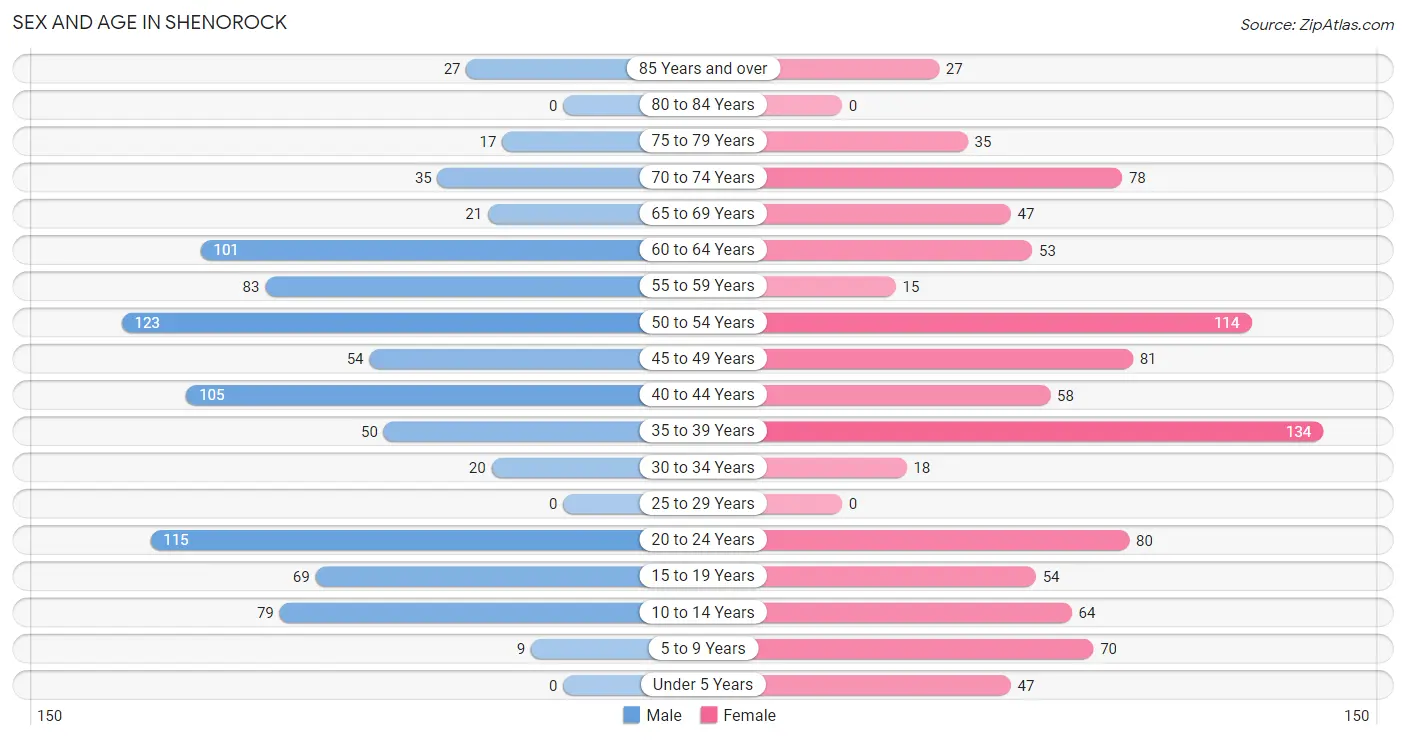
The most populous age groups in Shenorock are 50 to 54 Years (123 | 13.6%) for men and 35 to 39 Years (134 | 13.7%) for women.
| Age Bracket | Male | Female |
| Under 5 Years | 0 (0.0%) | 47 (4.8%) |
| 5 to 9 Years | 9 (1.0%) | 70 (7.2%) |
| 10 to 14 Years | 79 (8.7%) | 64 (6.6%) |
| 15 to 19 Years | 69 (7.6%) | 54 (5.5%) |
| 20 to 24 Years | 115 (12.7%) | 80 (8.2%) |
| 25 to 29 Years | 0 (0.0%) | 0 (0.0%) |
| 30 to 34 Years | 20 (2.2%) | 18 (1.8%) |
| 35 to 39 Years | 50 (5.5%) | 134 (13.7%) |
| 40 to 44 Years | 105 (11.6%) | 58 (5.9%) |
| 45 to 49 Years | 54 (5.9%) | 81 (8.3%) |
| 50 to 54 Years | 123 (13.6%) | 114 (11.7%) |
| 55 to 59 Years | 83 (9.1%) | 15 (1.5%) |
| 60 to 64 Years | 101 (11.1%) | 53 (5.4%) |
| 65 to 69 Years | 21 (2.3%) | 47 (4.8%) |
| 70 to 74 Years | 35 (3.8%) | 78 (8.0%) |
| 75 to 79 Years | 17 (1.9%) | 35 (3.6%) |
| 80 to 84 Years | 0 (0.0%) | 0 (0.0%) |
| 85 Years and over | 27 (3.0%) | 27 (2.8%) |
| Total | 908 (100.0%) | 975 (100.0%) |
Families and Households in Shenorock
Median Family Size in Shenorock
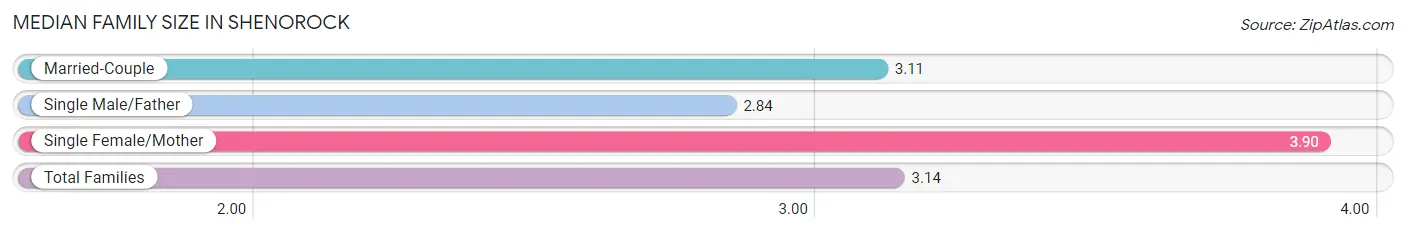
The median family size in Shenorock is 3.14 persons per family, with single female/mother families (31 | 5.7%) accounting for the largest median family size of 3.9 persons per family. On the other hand, single male/father families (43 | 7.8%) represent the smallest median family size with 2.84 persons per family.
| Family Type | # Families | Family Size |
| Married-Couple | 475 (86.5%) | 3.11 |
| Single Male/Father | 43 (7.8%) | 2.84 |
| Single Female/Mother | 31 (5.7%) | 3.90 |
| Total Families | 549 (100.0%) | 3.14 |
Median Household Size in Shenorock
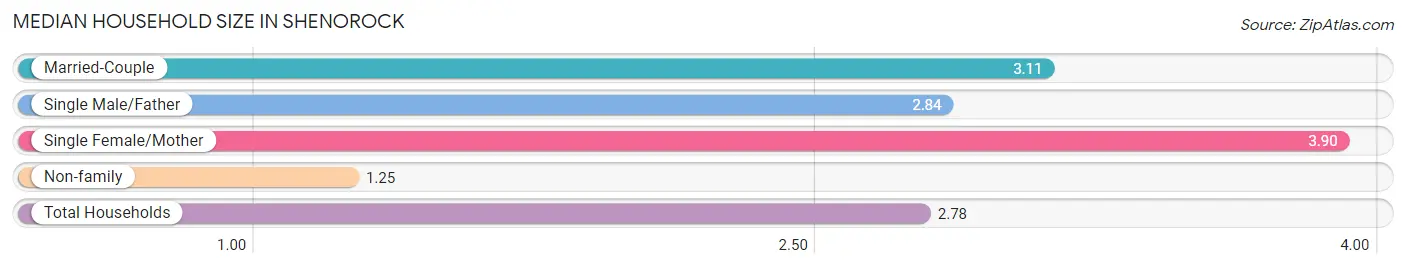
The median household size in Shenorock is 2.78 persons per household, with single female/mother households (31 | 4.6%) accounting for the largest median household size of 3.9 persons per household. non-family households (129 | 19.0%) represent the smallest median household size with 1.25 persons per household.
| Household Type | # Households | Household Size |
| Married-Couple | 475 (70.1%) | 3.11 |
| Single Male/Father | 43 (6.3%) | 2.84 |
| Single Female/Mother | 31 (4.6%) | 3.90 |
| Non-family | 129 (19.0%) | 1.25 |
| Total Households | 678 (100.0%) | 2.78 |
Household Size by Marriage Status in Shenorock
Out of a total of 678 households in Shenorock, 549 (81.0%) are family households, while 129 (19.0%) are nonfamily households. The most numerous type of family households are 3-person households, comprising 239, and the most common type of nonfamily households are 1-person households, comprising 97.
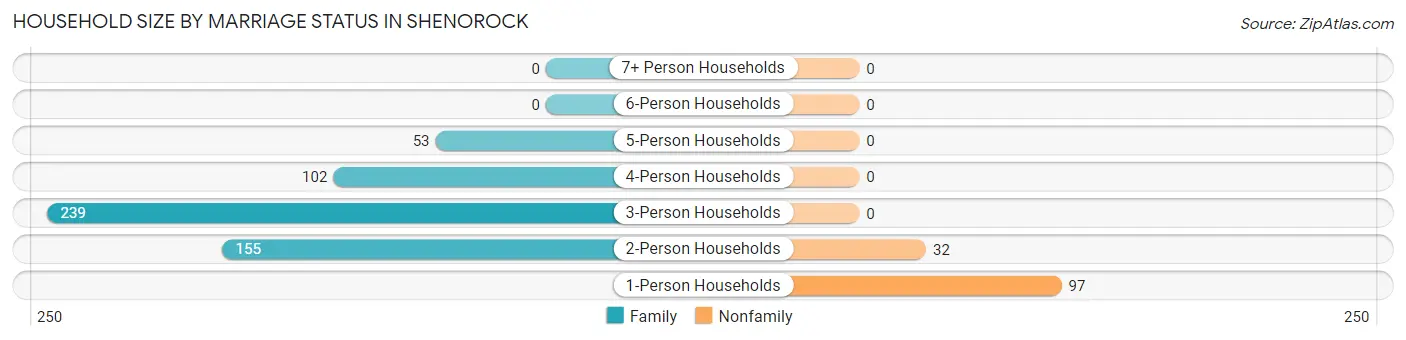
| Household Size | Family Households | Nonfamily Households |
| 1-Person Households | - | 97 (14.3%) |
| 2-Person Households | 155 (22.9%) | 32 (4.7%) |
| 3-Person Households | 239 (35.2%) | 0 (0.0%) |
| 4-Person Households | 102 (15.0%) | 0 (0.0%) |
| 5-Person Households | 53 (7.8%) | 0 (0.0%) |
| 6-Person Households | 0 (0.0%) | 0 (0.0%) |
| 7+ Person Households | 0 (0.0%) | 0 (0.0%) |
| Total | 549 (81.0%) | 129 (19.0%) |
Female Fertility in Shenorock
Fertility by Age in Shenorock
| Age Bracket | Women with Births | Births / 1,000 Women |
| 15 to 19 years | 0 (0.0%) | 0.0 |
| 20 to 34 years | 0 (0.0%) | 0.0 |
| 35 to 50 years | 0 (0.0%) | 0.0 |
| Total | 0 (0.0%) | 0.0 |
Fertility by Age by Marriage Status in Shenorock
| Age Bracket | Married | Unmarried |
| 15 to 19 years | 0 (0.0%) | 0 (0.0%) |
| 20 to 34 years | 0 (0.0%) | 0 (0.0%) |
| 35 to 50 years | 0 (0.0%) | 0 (0.0%) |
| Total | 0 (0.0%) | 0 (0.0%) |
Fertility by Education in Shenorock
| Educational Attainment | Women with Births | Births / 1,000 Women |
| Less than High School | 0 (0.0%) | 0.0 |
| High School Diploma | 0 (0.0%) | 0.0 |
| College or Associate's Degree | 0 (0.0%) | 0.0 |
| Bachelor's Degree | 0 (0.0%) | 0.0 |
| Graduate Degree | 0 (0.0%) | 0.0 |
| Total | 0 (0.0%) | 0.0 |
Fertility by Education by Marriage Status in Shenorock
| Educational Attainment | Married | Unmarried |
| Less than High School | 0 (0.0%) | 0 (0.0%) |
| High School Diploma | 0 (0.0%) | 0 (0.0%) |
| College or Associate's Degree | 0 (0.0%) | 0 (0.0%) |
| Bachelor's Degree | 0 (0.0%) | 0 (0.0%) |
| Graduate Degree | 0 (0.0%) | 0 (0.0%) |
| Total | 0 (0.0%) | 0 (0.0%) |
Employment Characteristics in Shenorock
Employment by Class of Employer in Shenorock
Among the 980 employed individuals in Shenorock, private company employees (548 | 55.9%), local government employees (227 | 23.2%), and self-employed (not incorporated) (61 | 6.2%) make up the most common classes of employment.
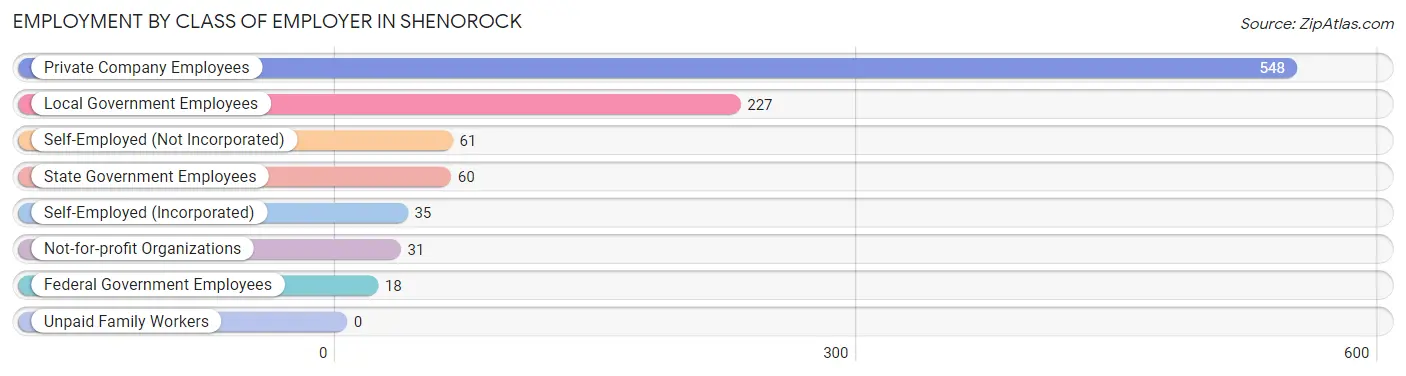
| Employer Class | # Employees | % Employees |
| Private Company Employees | 548 | 55.9% |
| Self-Employed (Incorporated) | 35 | 3.6% |
| Self-Employed (Not Incorporated) | 61 | 6.2% |
| Not-for-profit Organizations | 31 | 3.2% |
| Local Government Employees | 227 | 23.2% |
| State Government Employees | 60 | 6.1% |
| Federal Government Employees | 18 | 1.8% |
| Unpaid Family Workers | 0 | 0.0% |
| Total | 980 | 100.0% |
Employment Status by Age in Shenorock
According to the labor force statistics for Shenorock, out of the total population over 16 years of age (1,600), 65.3% or 1,045 individuals are in the labor force, with 6.1% or 64 of them unemployed. The age group with the highest labor force participation rate is 35 to 44 years, with 100.0% or 347 individuals in the labor force. Within the labor force, the 20 to 24 years age range has the highest percentage of unemployed individuals, with 25.3% or 24 of them being unemployed.
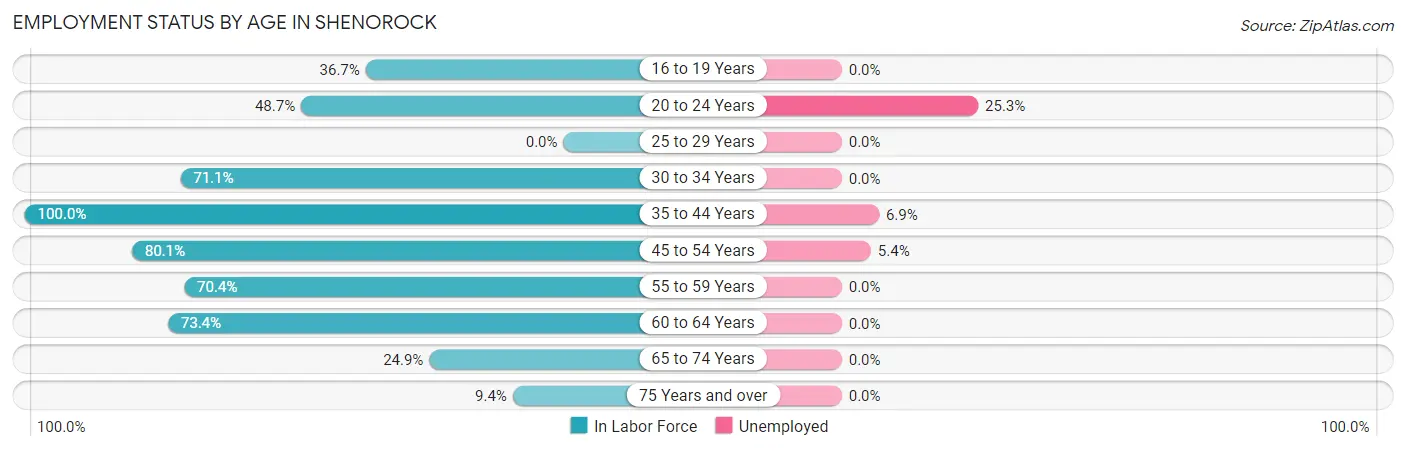
| Age Bracket | In Labor Force | Unemployed |
| 16 to 19 Years | 40 (36.7%) | 0 (0.0%) |
| 20 to 24 Years | 95 (48.7%) | 24 (25.3%) |
| 25 to 29 Years | 0 (0.0%) | 0 (0.0%) |
| 30 to 34 Years | 27 (71.1%) | 0 (0.0%) |
| 35 to 44 Years | 347 (100.0%) | 24 (6.9%) |
| 45 to 54 Years | 298 (80.1%) | 16 (5.4%) |
| 55 to 59 Years | 69 (70.4%) | 0 (0.0%) |
| 60 to 64 Years | 113 (73.4%) | 0 (0.0%) |
| 65 to 74 Years | 45 (24.9%) | 0 (0.0%) |
| 75 Years and over | 10 (9.4%) | 0 (0.0%) |
| Total | 1,045 (65.3%) | 64 (6.1%) |
Employment Status by Educational Attainment in Shenorock
According to labor force statistics for Shenorock, 84.6% of individuals (854) out of the total population between 25 and 64 years of age (1,009) are in the labor force, with 4.7% or 40 of them being unemployed. The group with the highest labor force participation rate are those with the educational attainment of bachelor's degree or higher, with 95.1% or 504 individuals in the labor force. Within the labor force, individuals with college / associate degree education have the highest percentage of unemployment, with 17.1% or 13 of them being unemployed.
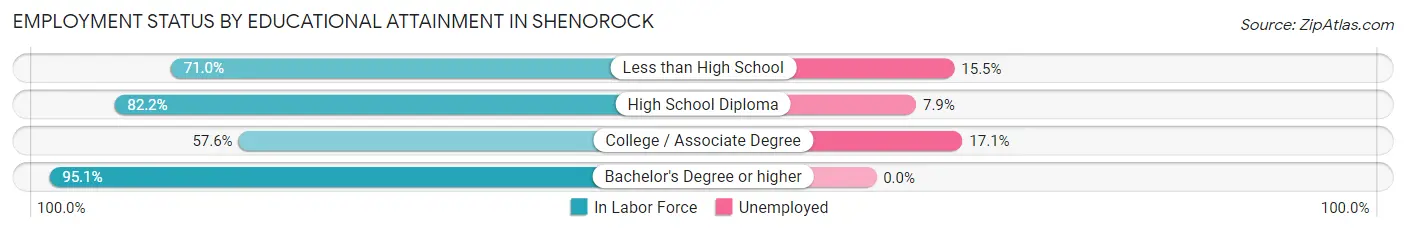
| Educational Attainment | In Labor Force | Unemployed |
| Less than High School | 71 (71.0%) | 16 (15.5%) |
| High School Diploma | 203 (82.2%) | 20 (7.9%) |
| College / Associate Degree | 76 (57.6%) | 23 (17.1%) |
| Bachelor's Degree or higher | 504 (95.1%) | 0 (0.0%) |
| Total | 854 (84.6%) | 47 (4.7%) |
Employment Occupations by Sex in Shenorock
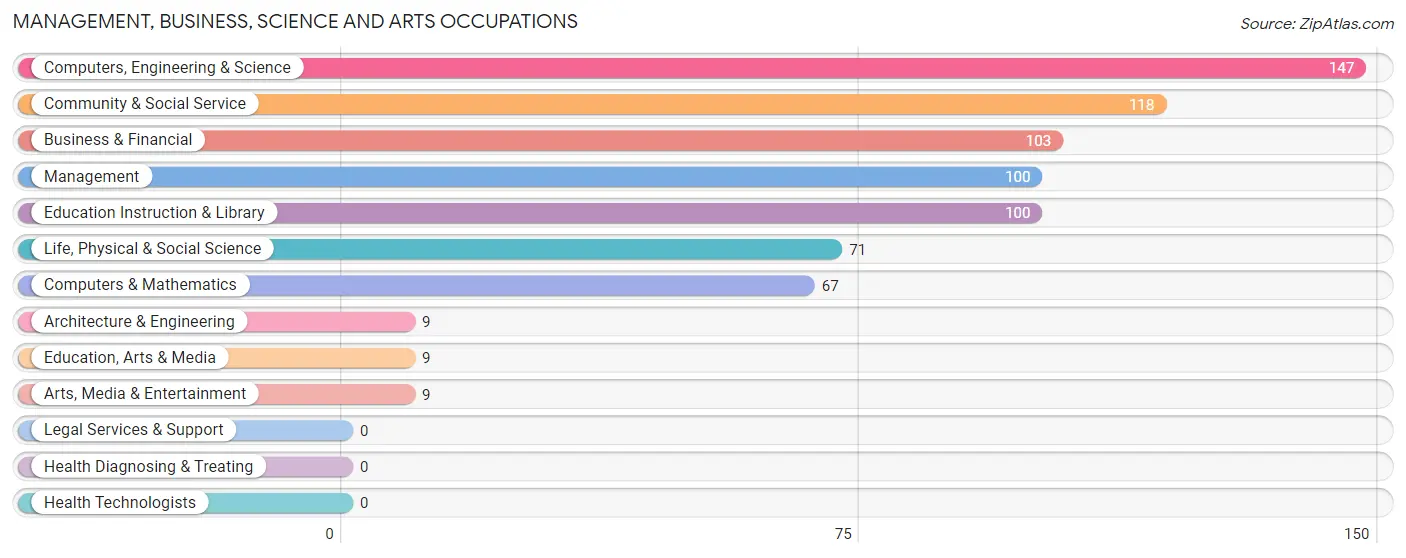
Management, Business, Science and Arts Occupations
The most common Management, Business, Science and Arts occupations in Shenorock are Computers, Engineering & Science (147 | 15.0%), Community & Social Service (118 | 12.0%), Business & Financial (103 | 10.5%), Management (100 | 10.2%), and Education Instruction & Library (100 | 10.2%).
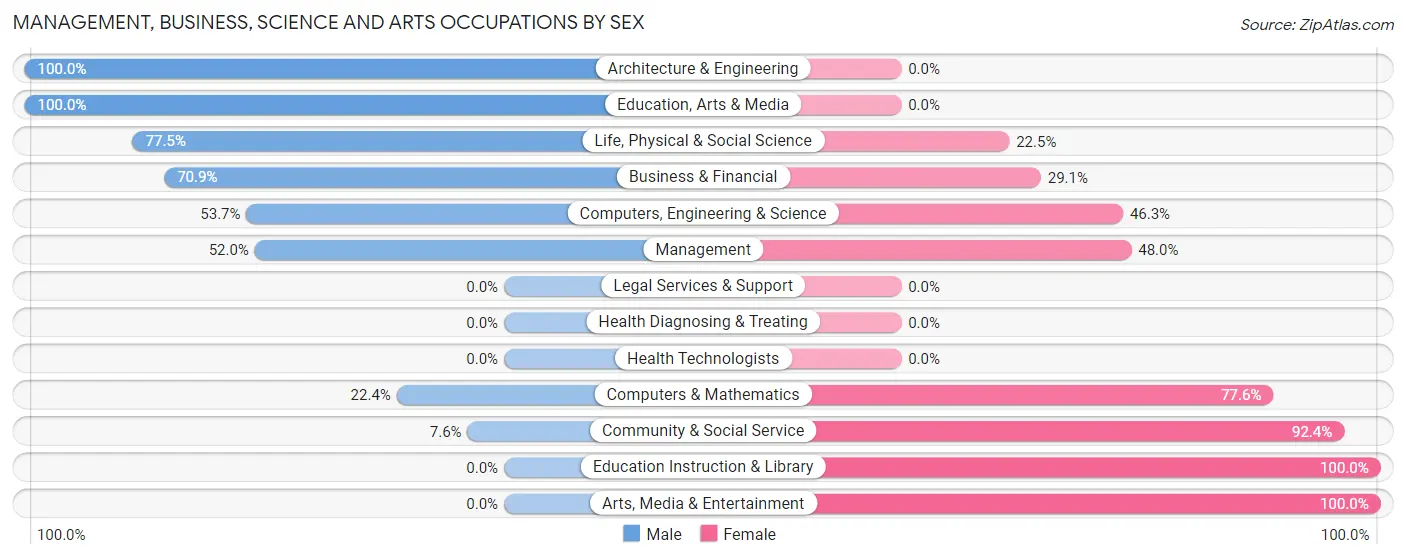
Management, Business, Science and Arts Occupations by Sex
Within the Management, Business, Science and Arts occupations in Shenorock, the most male-oriented occupations are Architecture & Engineering (100.0%), Education, Arts & Media (100.0%), and Life, Physical & Social Science (77.5%), while the most female-oriented occupations are Education Instruction & Library (100.0%), Arts, Media & Entertainment (100.0%), and Community & Social Service (92.4%).
| Occupation | Male | Female |
| Management | 52 (52.0%) | 48 (48.0%) |
| Business & Financial | 73 (70.9%) | 30 (29.1%) |
| Computers, Engineering & Science | 79 (53.7%) | 68 (46.3%) |
| Computers & Mathematics | 15 (22.4%) | 52 (77.6%) |
| Architecture & Engineering | 9 (100.0%) | 0 (0.0%) |
| Life, Physical & Social Science | 55 (77.5%) | 16 (22.5%) |
| Community & Social Service | 9 (7.6%) | 109 (92.4%) |
| Education, Arts & Media | 9 (100.0%) | 0 (0.0%) |
| Legal Services & Support | 0 (0.0%) | 0 (0.0%) |
| Education Instruction & Library | 0 (0.0%) | 100 (100.0%) |
| Arts, Media & Entertainment | 0 (0.0%) | 9 (100.0%) |
| Health Diagnosing & Treating | 0 (0.0%) | 0 (0.0%) |
| Health Technologists | 0 (0.0%) | 0 (0.0%) |
| Total (Category) | 213 (45.5%) | 255 (54.5%) |
| Total (Overall) | 500 (51.0%) | 480 (49.0%) |
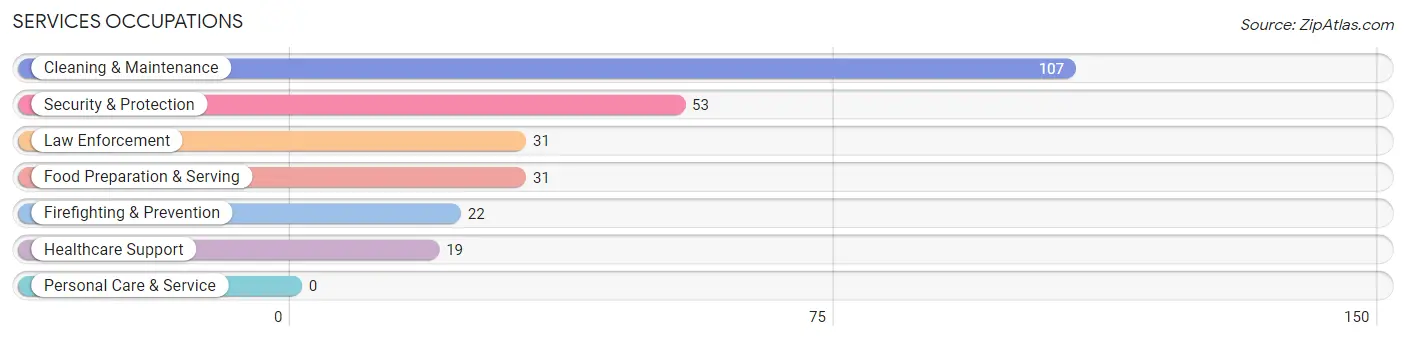
Services Occupations
The most common Services occupations in Shenorock are Cleaning & Maintenance (107 | 10.9%), Security & Protection (53 | 5.4%), Law Enforcement (31 | 3.2%), Food Preparation & Serving (31 | 3.2%), and Firefighting & Prevention (22 | 2.2%).
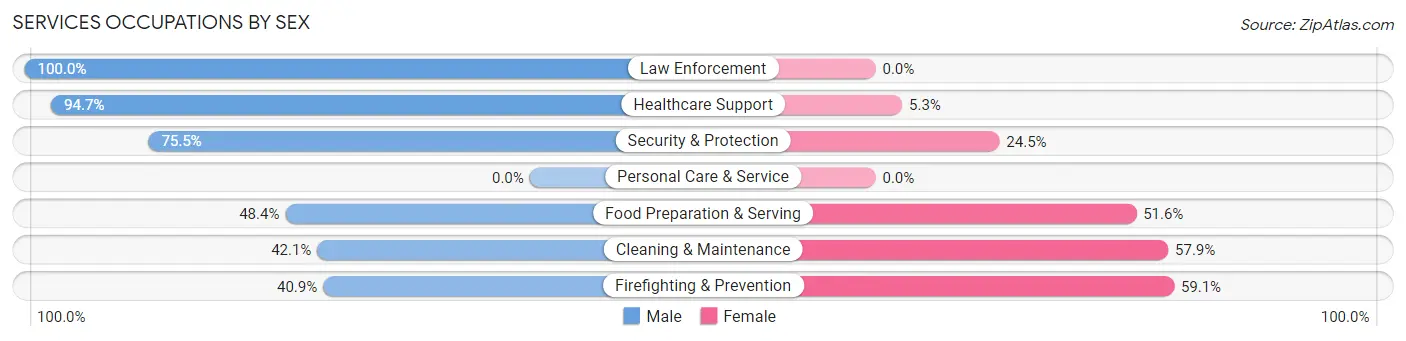
Services Occupations by Sex
Within the Services occupations in Shenorock, the most male-oriented occupations are Law Enforcement (100.0%), Healthcare Support (94.7%), and Security & Protection (75.5%), while the most female-oriented occupations are Firefighting & Prevention (59.1%), Cleaning & Maintenance (57.9%), and Food Preparation & Serving (51.6%).
| Occupation | Male | Female |
| Healthcare Support | 18 (94.7%) | 1 (5.3%) |
| Security & Protection | 40 (75.5%) | 13 (24.5%) |
| Firefighting & Prevention | 9 (40.9%) | 13 (59.1%) |
| Law Enforcement | 31 (100.0%) | 0 (0.0%) |
| Food Preparation & Serving | 15 (48.4%) | 16 (51.6%) |
| Cleaning & Maintenance | 45 (42.1%) | 62 (57.9%) |
| Personal Care & Service | 0 (0.0%) | 0 (0.0%) |
| Total (Category) | 118 (56.2%) | 92 (43.8%) |
| Total (Overall) | 500 (51.0%) | 480 (49.0%) |
Sales and Office Occupations
The most common Sales and Office occupations in Shenorock are Office & Administration (94 | 9.6%), and Sales & Related (64 | 6.5%).
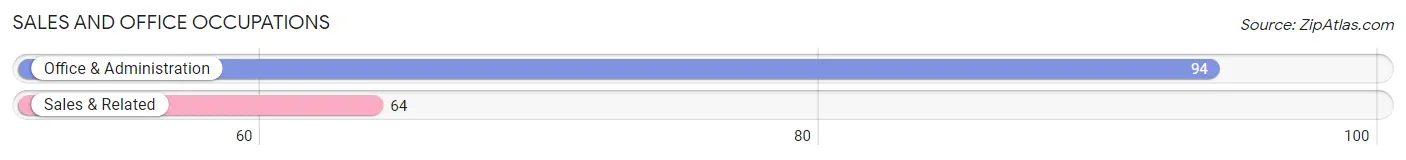
Sales and Office Occupations by Sex
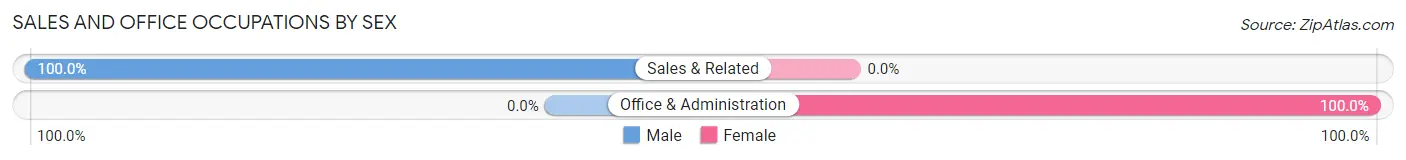
| Occupation | Male | Female |
| Sales & Related | 64 (100.0%) | 0 (0.0%) |
| Office & Administration | 0 (0.0%) | 94 (100.0%) |
| Total (Category) | 64 (40.5%) | 94 (59.5%) |
| Total (Overall) | 500 (51.0%) | 480 (49.0%) |
Natural Resources, Construction and Maintenance Occupations
The most common Natural Resources, Construction and Maintenance occupations in Shenorock are , and Construction & Extraction (100 | 10.2%).
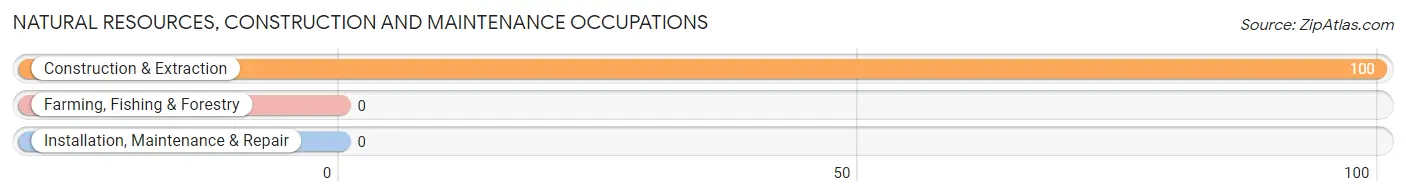
Natural Resources, Construction and Maintenance Occupations by Sex
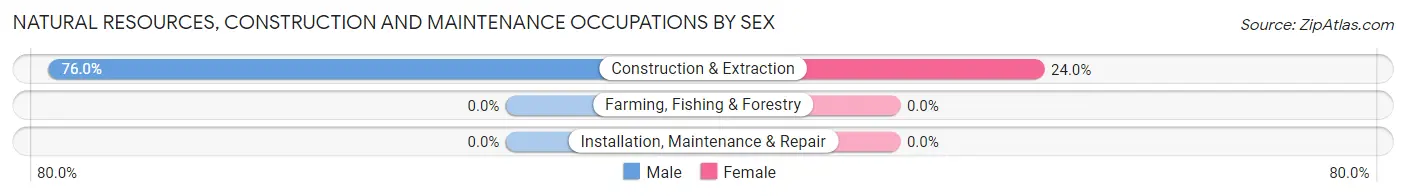
| Occupation | Male | Female |
| Farming, Fishing & Forestry | 0 (0.0%) | 0 (0.0%) |
| Construction & Extraction | 76 (76.0%) | 24 (24.0%) |
| Installation, Maintenance & Repair | 0 (0.0%) | 0 (0.0%) |
| Total (Category) | 76 (76.0%) | 24 (24.0%) |
| Total (Overall) | 500 (51.0%) | 480 (49.0%) |
Production, Transportation and Moving Occupations
The most common Production, Transportation and Moving occupations in Shenorock are Transportation (29 | 3.0%), and Material Moving (15 | 1.5%).
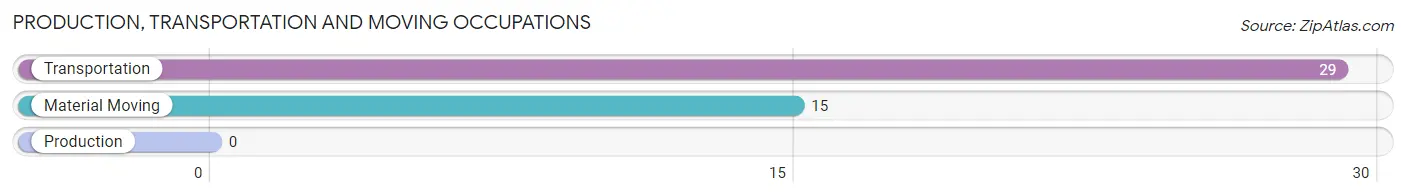
Production, Transportation and Moving Occupations by Sex
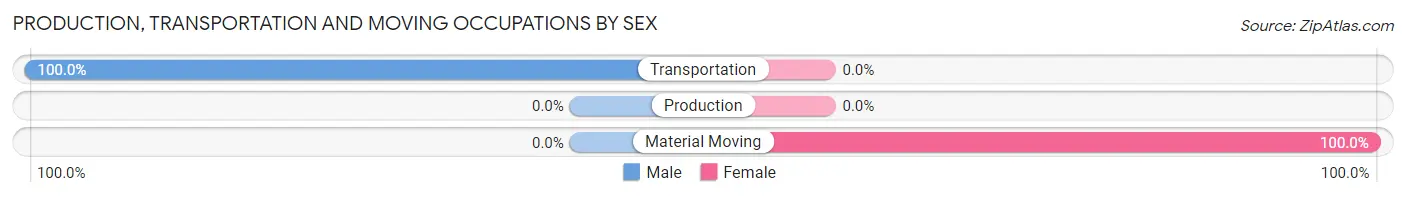
| Occupation | Male | Female |
| Production | 0 (0.0%) | 0 (0.0%) |
| Transportation | 29 (100.0%) | 0 (0.0%) |
| Material Moving | 0 (0.0%) | 15 (100.0%) |
| Total (Category) | 29 (65.9%) | 15 (34.1%) |
| Total (Overall) | 500 (51.0%) | 480 (49.0%) |
Employment Industries by Sex in Shenorock
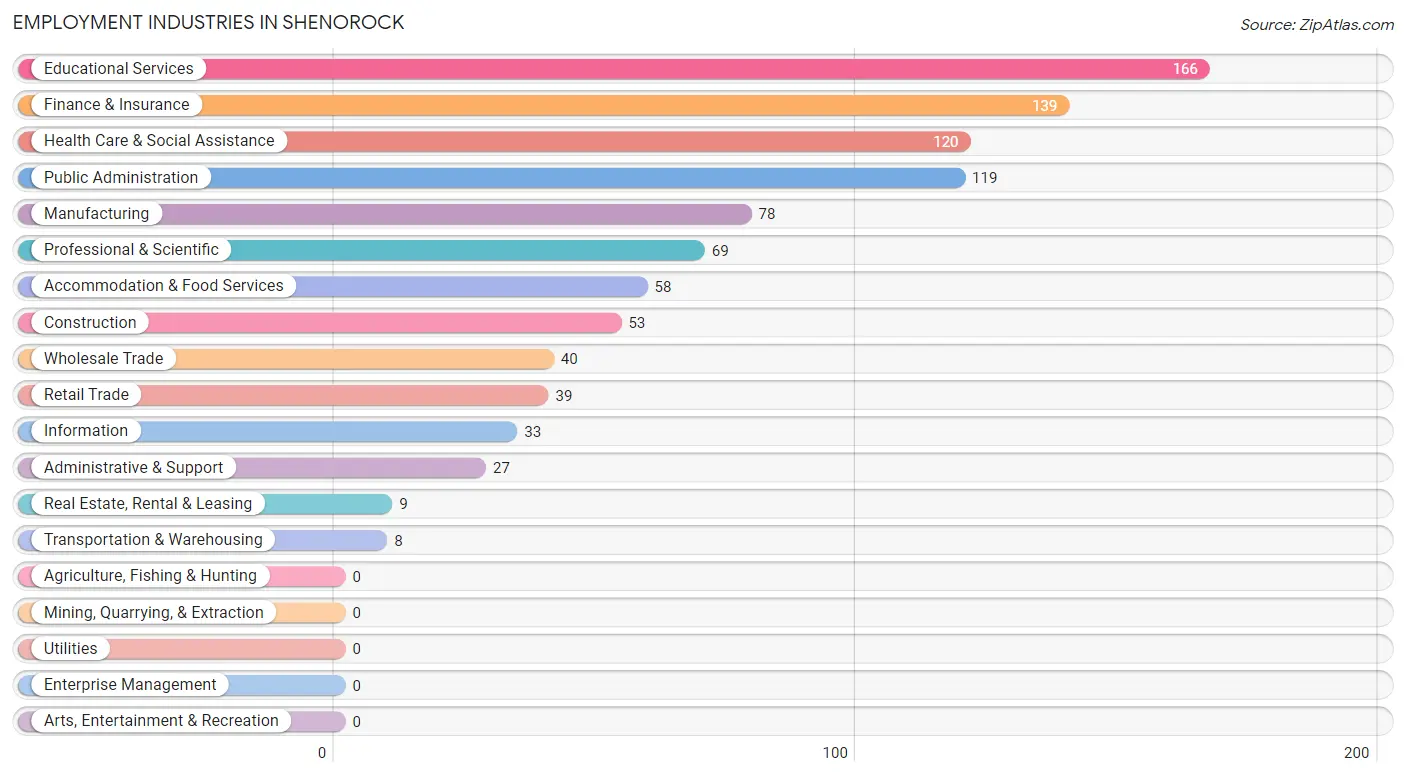
Employment Industries in Shenorock
The major employment industries in Shenorock include Educational Services (166 | 16.9%), Finance & Insurance (139 | 14.2%), Health Care & Social Assistance (120 | 12.2%), Public Administration (119 | 12.1%), and Manufacturing (78 | 8.0%).
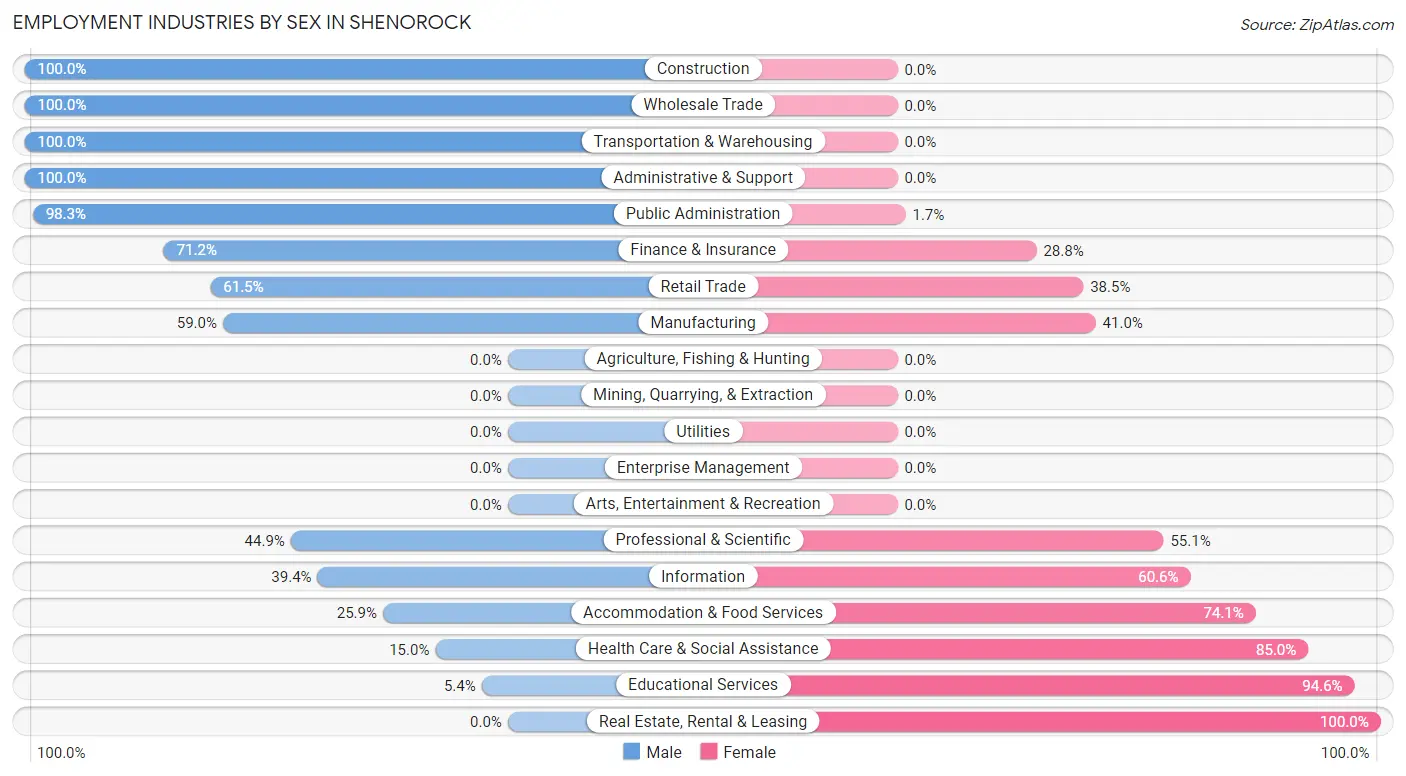
Employment Industries by Sex in Shenorock
The Shenorock industries that see more men than women are Construction (100.0%), Wholesale Trade (100.0%), and Transportation & Warehousing (100.0%), whereas the industries that tend to have a higher number of women are Real Estate, Rental & Leasing (100.0%), Educational Services (94.6%), and Health Care & Social Assistance (85.0%).
| Industry | Male | Female |
| Agriculture, Fishing & Hunting | 0 (0.0%) | 0 (0.0%) |
| Mining, Quarrying, & Extraction | 0 (0.0%) | 0 (0.0%) |
| Construction | 53 (100.0%) | 0 (0.0%) |
| Manufacturing | 46 (59.0%) | 32 (41.0%) |
| Wholesale Trade | 40 (100.0%) | 0 (0.0%) |
| Retail Trade | 24 (61.5%) | 15 (38.5%) |
| Transportation & Warehousing | 8 (100.0%) | 0 (0.0%) |
| Utilities | 0 (0.0%) | 0 (0.0%) |
| Information | 13 (39.4%) | 20 (60.6%) |
| Finance & Insurance | 99 (71.2%) | 40 (28.8%) |
| Real Estate, Rental & Leasing | 0 (0.0%) | 9 (100.0%) |
| Professional & Scientific | 31 (44.9%) | 38 (55.1%) |
| Enterprise Management | 0 (0.0%) | 0 (0.0%) |
| Administrative & Support | 27 (100.0%) | 0 (0.0%) |
| Educational Services | 9 (5.4%) | 157 (94.6%) |
| Health Care & Social Assistance | 18 (15.0%) | 102 (85.0%) |
| Arts, Entertainment & Recreation | 0 (0.0%) | 0 (0.0%) |
| Accommodation & Food Services | 15 (25.9%) | 43 (74.1%) |
| Public Administration | 117 (98.3%) | 2 (1.7%) |
| Total | 500 (51.0%) | 480 (49.0%) |
Education in Shenorock
School Enrollment in Shenorock
The most common levels of schooling among the 337 students in Shenorock are middle school (129 | 38.3%), college / undergraduate (107 | 31.8%), and elementary school (70 | 20.8%).
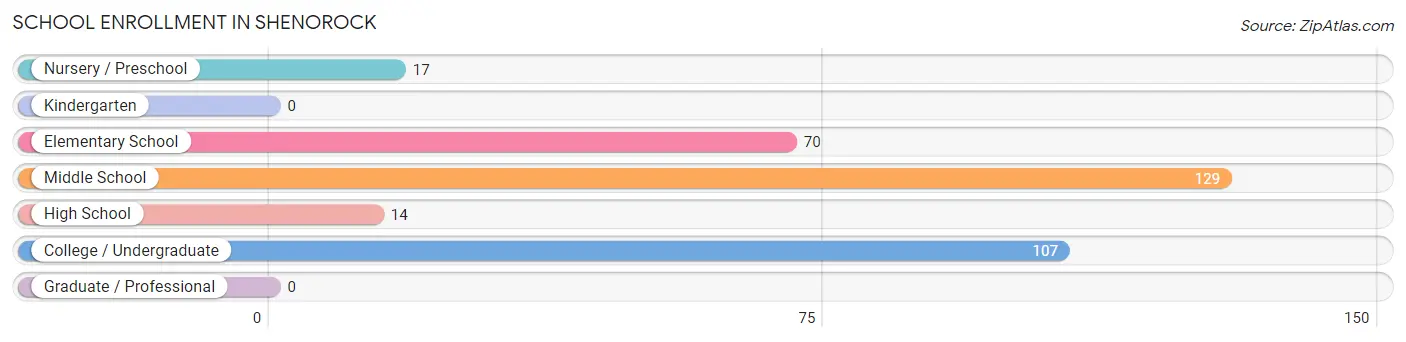
| School Level | # Students | % Students |
| Nursery / Preschool | 17 | 5.0% |
| Kindergarten | 0 | 0.0% |
| Elementary School | 70 | 20.8% |
| Middle School | 129 | 38.3% |
| High School | 14 | 4.2% |
| College / Undergraduate | 107 | 31.8% |
| Graduate / Professional | 0 | 0.0% |
| Total | 337 | 100.0% |
School Enrollment by Age by Funding Source in Shenorock
Out of a total of 337 students who are enrolled in schools in Shenorock, 74 (22.0%) attend a private institution, while the remaining 263 (78.0%) are enrolled in public schools. The age group of 3 to 4 year olds has the highest likelihood of being enrolled in private schools, with 8 (100.0% in the age bracket) enrolled. Conversely, the age group of 15 to 17 year olds has the lowest likelihood of being enrolled in a private school, with 14 (100.0% in the age bracket) attending a public institution.
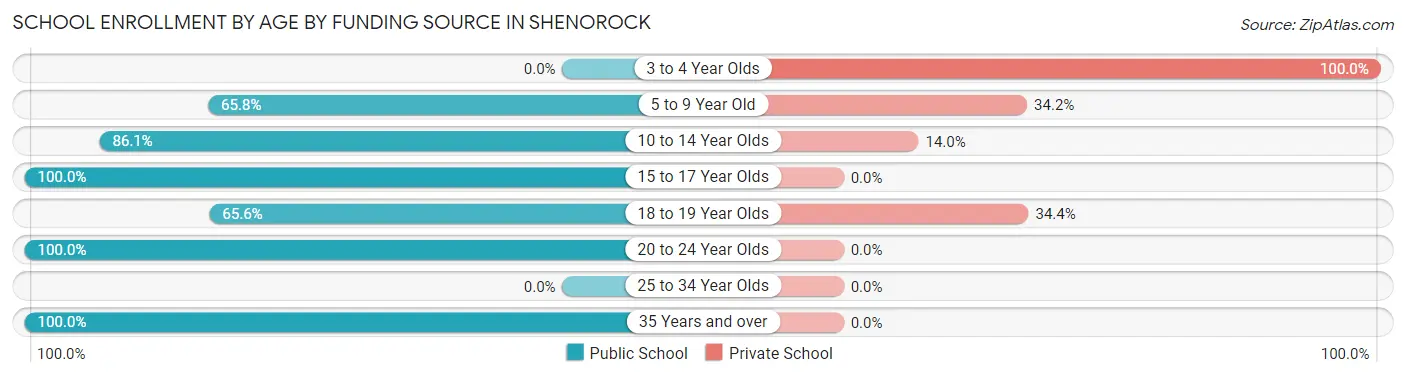
| Age Bracket | Public School | Private School |
| 3 to 4 Year Olds | 0 (0.0%) | 8 (100.0%) |
| 5 to 9 Year Old | 52 (65.8%) | 27 (34.2%) |
| 10 to 14 Year Olds | 111 (86.1%) | 18 (14.0%) |
| 15 to 17 Year Olds | 14 (100.0%) | 0 (0.0%) |
| 18 to 19 Year Olds | 40 (65.6%) | 21 (34.4%) |
| 20 to 24 Year Olds | 36 (100.0%) | 0 (0.0%) |
| 25 to 34 Year Olds | 0 (0.0%) | 0 (0.0%) |
| 35 Years and over | 10 (100.0%) | 0 (0.0%) |
| Total | 263 (78.0%) | 74 (22.0%) |
Educational Attainment by Field of Study in Shenorock
Business (220 | 34.6%), communications (112 | 17.6%), literature & languages (65 | 10.2%), arts & humanities (64 | 10.1%), and psychology (47 | 7.4%) are the most common fields of study among 635 individuals in Shenorock who have obtained a bachelor's degree or higher.
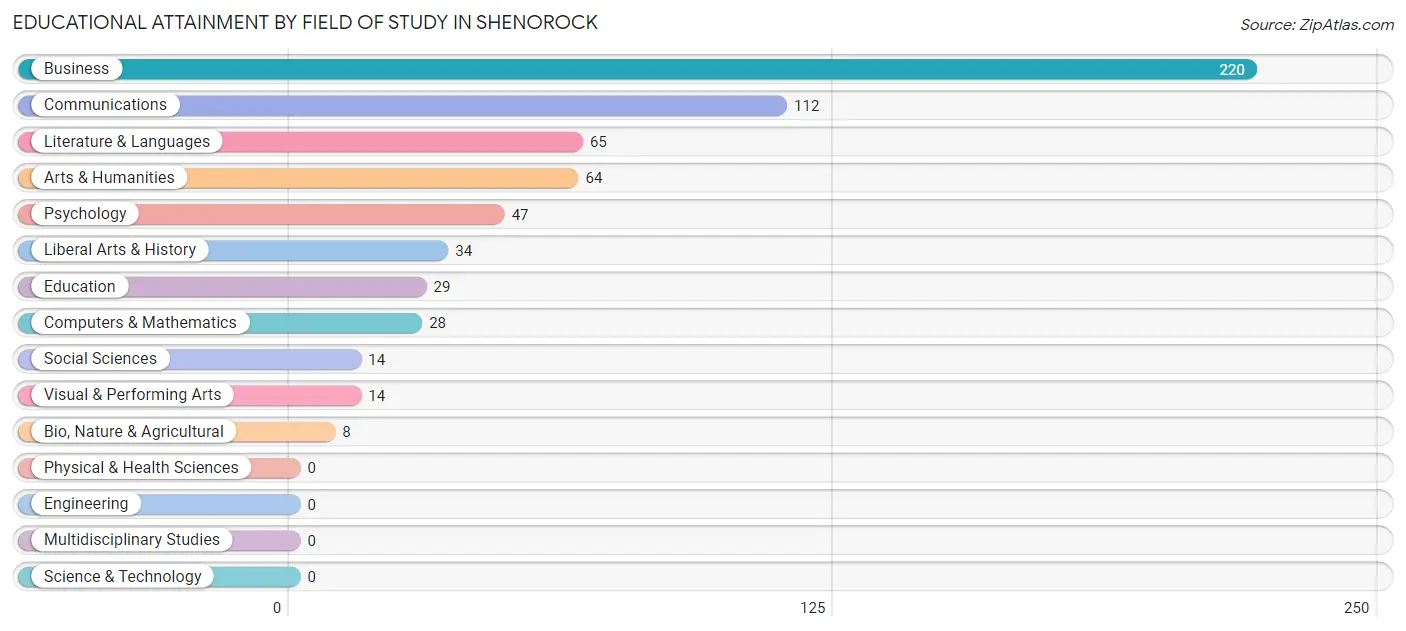
| Field of Study | # Graduates | % Graduates |
| Computers & Mathematics | 28 | 4.4% |
| Bio, Nature & Agricultural | 8 | 1.3% |
| Physical & Health Sciences | 0 | 0.0% |
| Psychology | 47 | 7.4% |
| Social Sciences | 14 | 2.2% |
| Engineering | 0 | 0.0% |
| Multidisciplinary Studies | 0 | 0.0% |
| Science & Technology | 0 | 0.0% |
| Business | 220 | 34.6% |
| Education | 29 | 4.6% |
| Literature & Languages | 65 | 10.2% |
| Liberal Arts & History | 34 | 5.3% |
| Visual & Performing Arts | 14 | 2.2% |
| Communications | 112 | 17.6% |
| Arts & Humanities | 64 | 10.1% |
| Total | 635 | 100.0% |
Transportation & Commute in Shenorock
Vehicle Availability by Sex in Shenorock
The most prevalent vehicle ownership categories in Shenorock are males with 2 vehicles (318, accounting for 63.6%) and females with 2 vehicles (297, making up 66.2%).
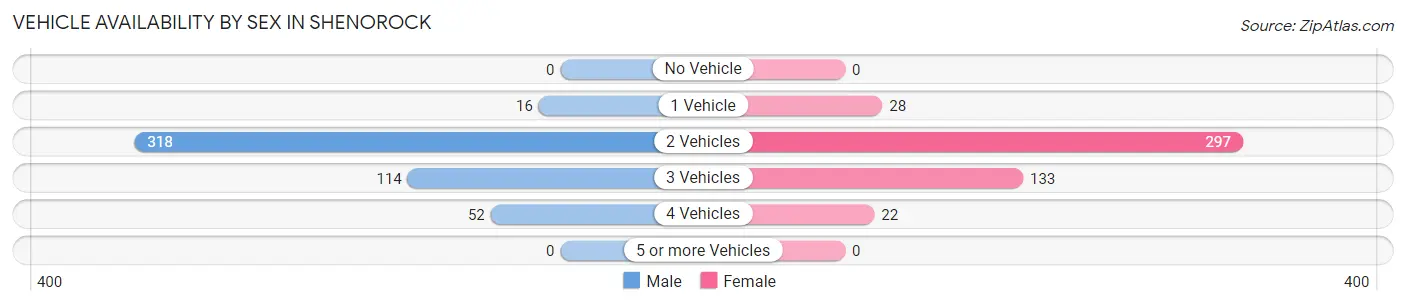
| Vehicles Available | Male | Female |
| No Vehicle | 0 (0.0%) | 0 (0.0%) |
| 1 Vehicle | 16 (3.2%) | 28 (5.8%) |
| 2 Vehicles | 318 (63.6%) | 297 (61.9%) |
| 3 Vehicles | 114 (22.8%) | 133 (27.7%) |
| 4 Vehicles | 52 (10.4%) | 22 (4.6%) |
| 5 or more Vehicles | 0 (0.0%) | 0 (0.0%) |
| Total | 500 (100.0%) | 480 (100.0%) |
Commute Time in Shenorock
The most frequently occuring commute durations in Shenorock are 15 to 19 minutes (145 commuters, 17.8%), 45 to 59 minutes (139 commuters, 17.1%), and 40 to 44 minutes (95 commuters, 11.7%).
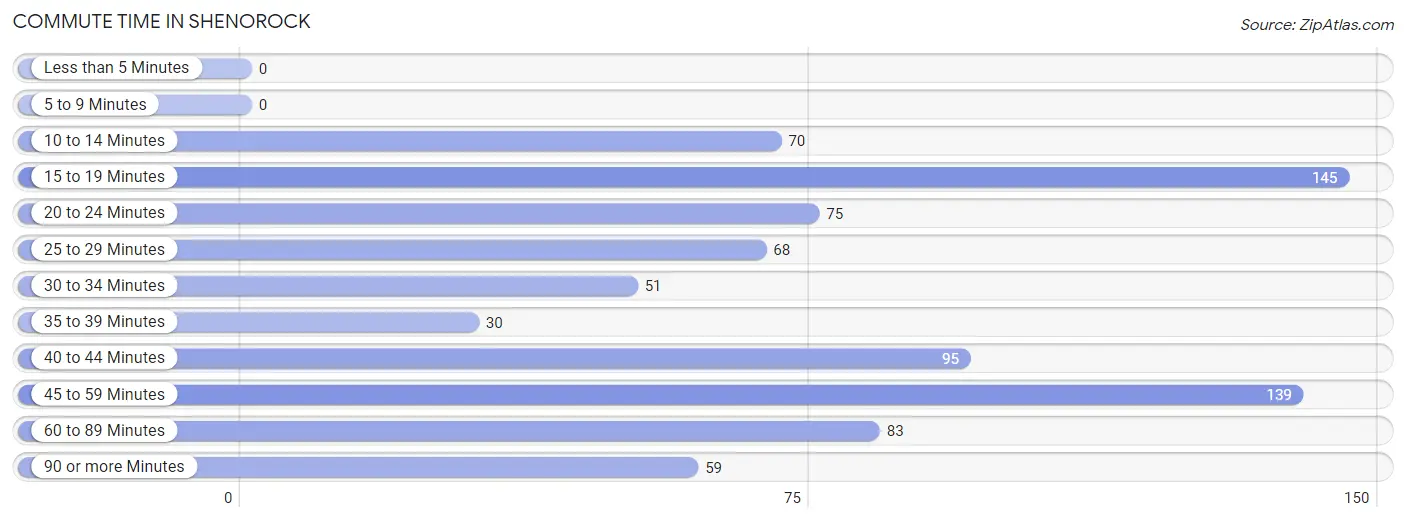
| Commute Time | # Commuters | % Commuters |
| Less than 5 Minutes | 0 | 0.0% |
| 5 to 9 Minutes | 0 | 0.0% |
| 10 to 14 Minutes | 70 | 8.6% |
| 15 to 19 Minutes | 145 | 17.8% |
| 20 to 24 Minutes | 75 | 9.2% |
| 25 to 29 Minutes | 68 | 8.3% |
| 30 to 34 Minutes | 51 | 6.3% |
| 35 to 39 Minutes | 30 | 3.7% |
| 40 to 44 Minutes | 95 | 11.7% |
| 45 to 59 Minutes | 139 | 17.1% |
| 60 to 89 Minutes | 83 | 10.2% |
| 90 or more Minutes | 59 | 7.2% |
Commute Time by Sex in Shenorock
The most common commute times in Shenorock are 15 to 19 minutes (91 commuters, 21.2%) for males and 40 to 44 minutes (86 commuters, 22.3%) for females.
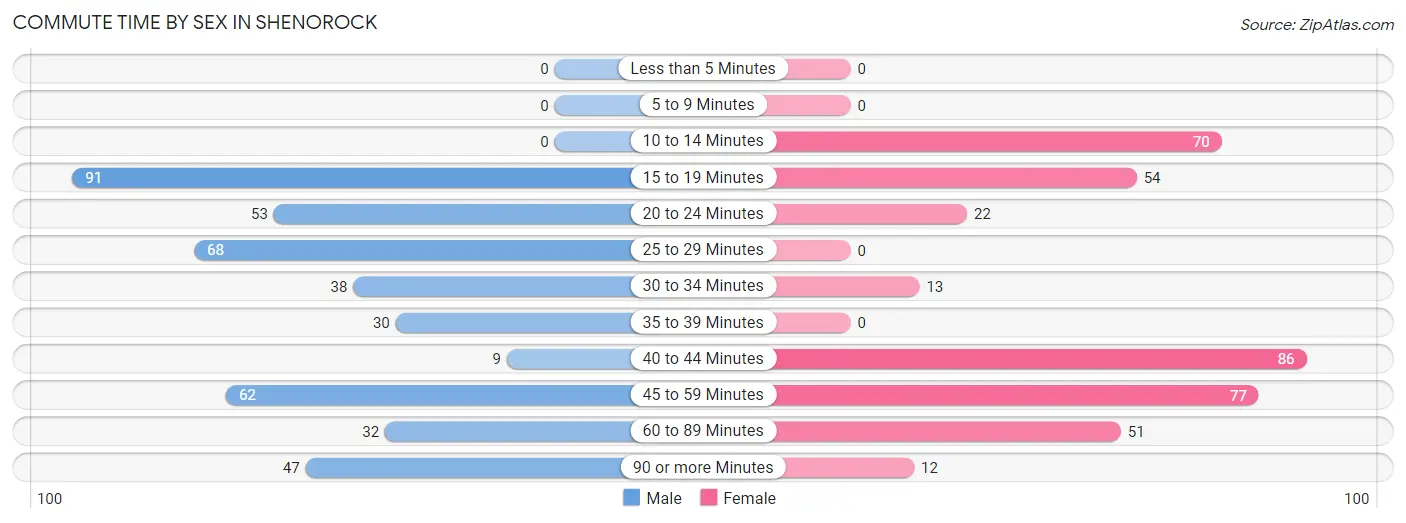
| Commute Time | Male | Female |
| Less than 5 Minutes | 0 (0.0%) | 0 (0.0%) |
| 5 to 9 Minutes | 0 (0.0%) | 0 (0.0%) |
| 10 to 14 Minutes | 0 (0.0%) | 70 (18.2%) |
| 15 to 19 Minutes | 91 (21.2%) | 54 (14.0%) |
| 20 to 24 Minutes | 53 (12.3%) | 22 (5.7%) |
| 25 to 29 Minutes | 68 (15.8%) | 0 (0.0%) |
| 30 to 34 Minutes | 38 (8.8%) | 13 (3.4%) |
| 35 to 39 Minutes | 30 (7.0%) | 0 (0.0%) |
| 40 to 44 Minutes | 9 (2.1%) | 86 (22.3%) |
| 45 to 59 Minutes | 62 (14.4%) | 77 (20.0%) |
| 60 to 89 Minutes | 32 (7.4%) | 51 (13.3%) |
| 90 or more Minutes | 47 (10.9%) | 12 (3.1%) |
Time of Departure to Work by Sex in Shenorock
The most frequent times of departure to work in Shenorock are 6:30 AM to 6:59 AM (150, 34.9%) for males and 6:00 AM to 6:29 AM (124, 32.2%) for females.
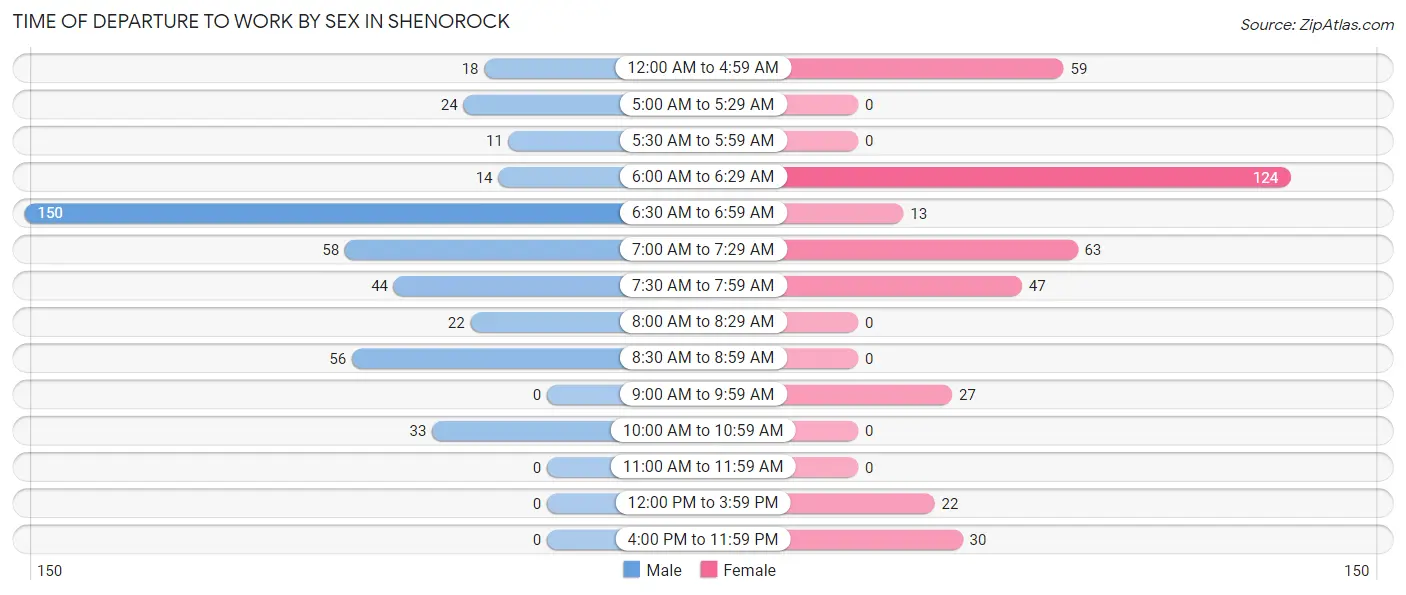
| Time of Departure | Male | Female |
| 12:00 AM to 4:59 AM | 18 (4.2%) | 59 (15.3%) |
| 5:00 AM to 5:29 AM | 24 (5.6%) | 0 (0.0%) |
| 5:30 AM to 5:59 AM | 11 (2.6%) | 0 (0.0%) |
| 6:00 AM to 6:29 AM | 14 (3.3%) | 124 (32.2%) |
| 6:30 AM to 6:59 AM | 150 (34.9%) | 13 (3.4%) |
| 7:00 AM to 7:29 AM | 58 (13.5%) | 63 (16.4%) |
| 7:30 AM to 7:59 AM | 44 (10.2%) | 47 (12.2%) |
| 8:00 AM to 8:29 AM | 22 (5.1%) | 0 (0.0%) |
| 8:30 AM to 8:59 AM | 56 (13.0%) | 0 (0.0%) |
| 9:00 AM to 9:59 AM | 0 (0.0%) | 27 (7.0%) |
| 10:00 AM to 10:59 AM | 33 (7.7%) | 0 (0.0%) |
| 11:00 AM to 11:59 AM | 0 (0.0%) | 0 (0.0%) |
| 12:00 PM to 3:59 PM | 0 (0.0%) | 22 (5.7%) |
| 4:00 PM to 11:59 PM | 0 (0.0%) | 30 (7.8%) |
| Total | 430 (100.0%) | 385 (100.0%) |
Housing Occupancy in Shenorock
Occupancy by Ownership in Shenorock
Of the total 678 dwellings in Shenorock, owner-occupied units account for 633 (93.4%), while renter-occupied units make up 45 (6.6%).
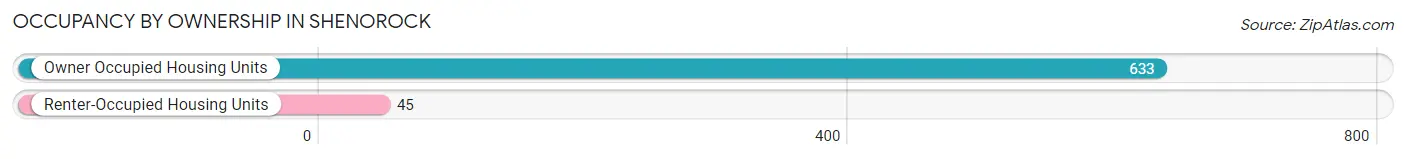
| Occupancy | # Housing Units | % Housing Units |
| Owner Occupied Housing Units | 633 | 93.4% |
| Renter-Occupied Housing Units | 45 | 6.6% |
| Total Occupied Housing Units | 678 | 100.0% |
Occupancy by Household Size in Shenorock
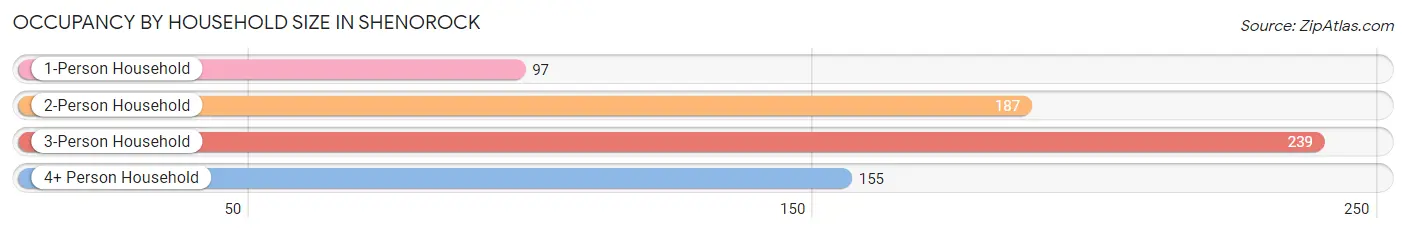
| Household Size | # Housing Units | % Housing Units |
| 1-Person Household | 97 | 14.3% |
| 2-Person Household | 187 | 27.6% |
| 3-Person Household | 239 | 35.2% |
| 4+ Person Household | 155 | 22.9% |
| Total Housing Units | 678 | 100.0% |
Occupancy by Ownership by Household Size in Shenorock
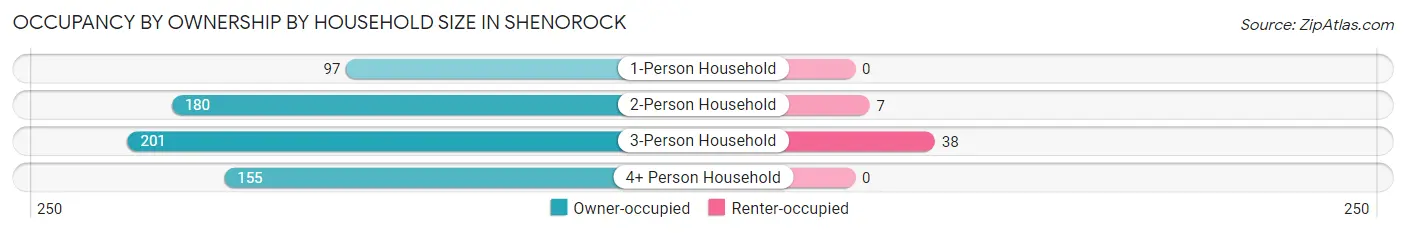
| Household Size | Owner-occupied | Renter-occupied |
| 1-Person Household | 97 (100.0%) | 0 (0.0%) |
| 2-Person Household | 180 (96.3%) | 7 (3.7%) |
| 3-Person Household | 201 (84.1%) | 38 (15.9%) |
| 4+ Person Household | 155 (100.0%) | 0 (0.0%) |
| Total Housing Units | 633 (93.4%) | 45 (6.6%) |
Occupancy by Educational Attainment in Shenorock
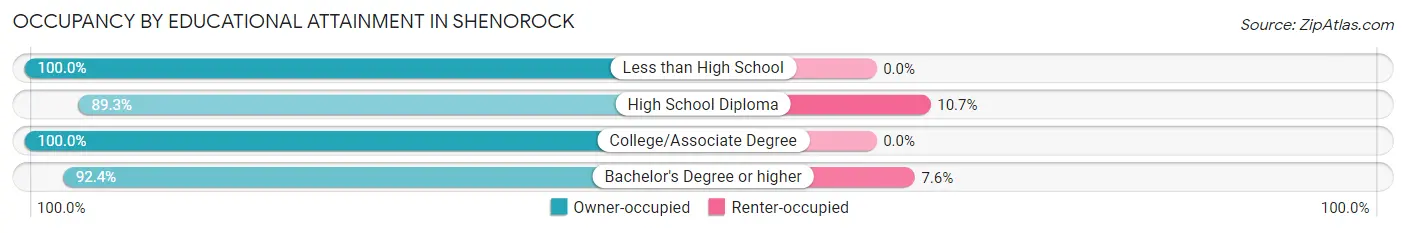
| Household Size | Owner-occupied | Renter-occupied |
| Less than High School | 32 (100.0%) | 0 (0.0%) |
| High School Diploma | 208 (89.3%) | 25 (10.7%) |
| College/Associate Degree | 150 (100.0%) | 0 (0.0%) |
| Bachelor's Degree or higher | 243 (92.4%) | 20 (7.6%) |
Occupancy by Age of Householder in Shenorock
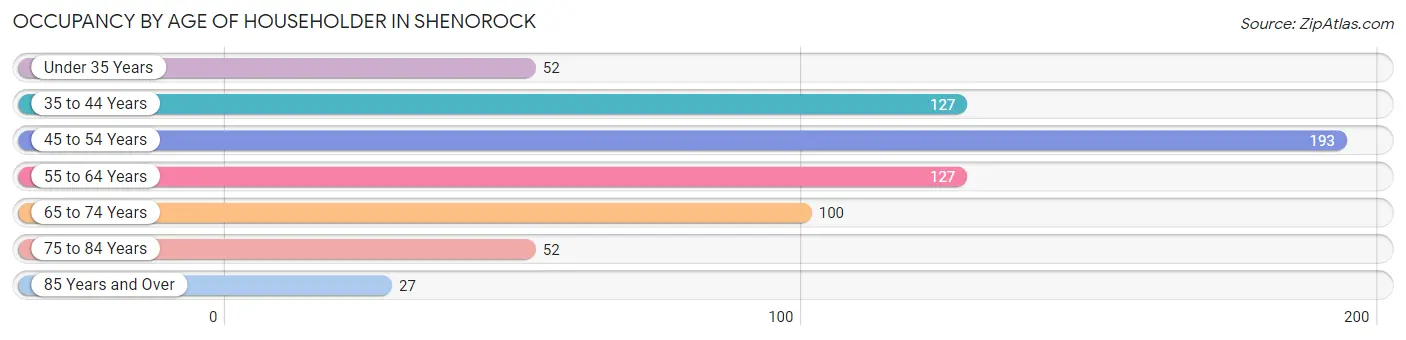
| Age Bracket | # Households | % Households |
| Under 35 Years | 52 | 7.7% |
| 35 to 44 Years | 127 | 18.7% |
| 45 to 54 Years | 193 | 28.5% |
| 55 to 64 Years | 127 | 18.7% |
| 65 to 74 Years | 100 | 14.7% |
| 75 to 84 Years | 52 | 7.7% |
| 85 Years and Over | 27 | 4.0% |
| Total | 678 | 100.0% |
Housing Finances in Shenorock
Median Income by Occupancy in Shenorock
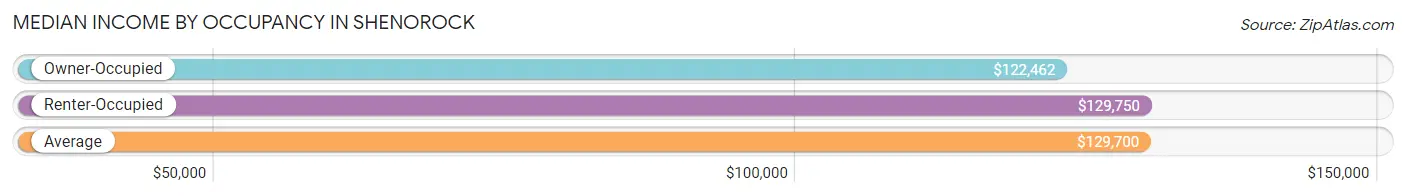
| Occupancy Type | # Households | Median Income |
| Owner-Occupied | 633 (93.4%) | $122,462 |
| Renter-Occupied | 45 (6.6%) | $129,750 |
| Average | 678 (100.0%) | $129,700 |
Occupancy by Householder Income Bracket in Shenorock
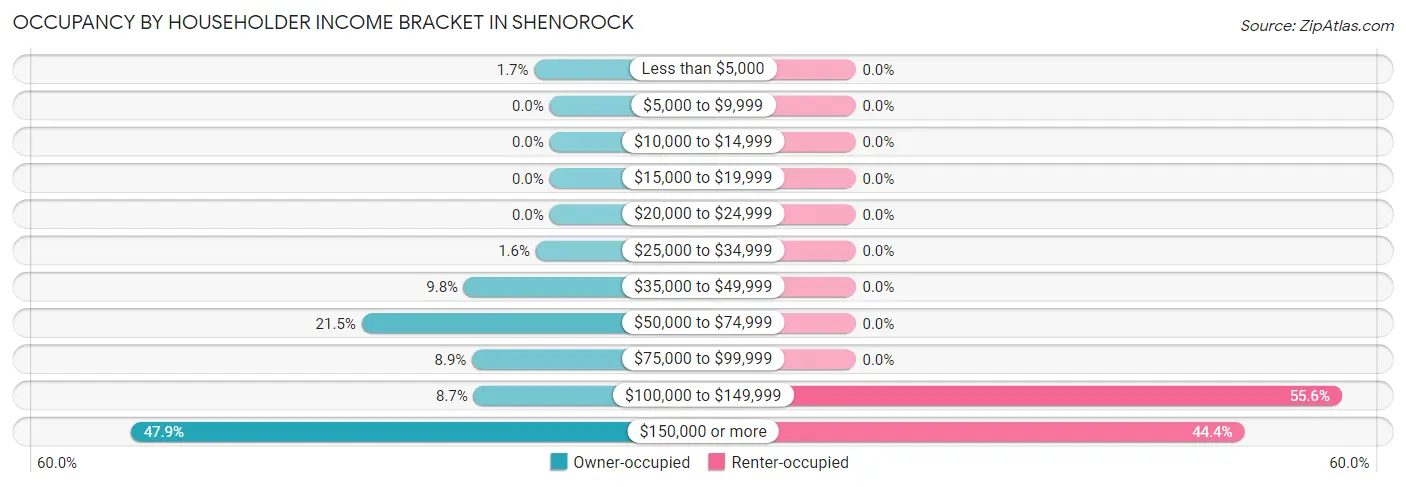
| Income Bracket | Owner-occupied | Renter-occupied |
| Less than $5,000 | 11 (1.7%) | 0 (0.0%) |
| $5,000 to $9,999 | 0 (0.0%) | 0 (0.0%) |
| $10,000 to $14,999 | 0 (0.0%) | 0 (0.0%) |
| $15,000 to $19,999 | 0 (0.0%) | 0 (0.0%) |
| $20,000 to $24,999 | 0 (0.0%) | 0 (0.0%) |
| $25,000 to $34,999 | 10 (1.6%) | 0 (0.0%) |
| $35,000 to $49,999 | 62 (9.8%) | 0 (0.0%) |
| $50,000 to $74,999 | 136 (21.5%) | 0 (0.0%) |
| $75,000 to $99,999 | 56 (8.8%) | 0 (0.0%) |
| $100,000 to $149,999 | 55 (8.7%) | 25 (55.6%) |
| $150,000 or more | 303 (47.9%) | 20 (44.4%) |
| Total | 633 (100.0%) | 45 (100.0%) |
Monthly Housing Cost Tiers in Shenorock
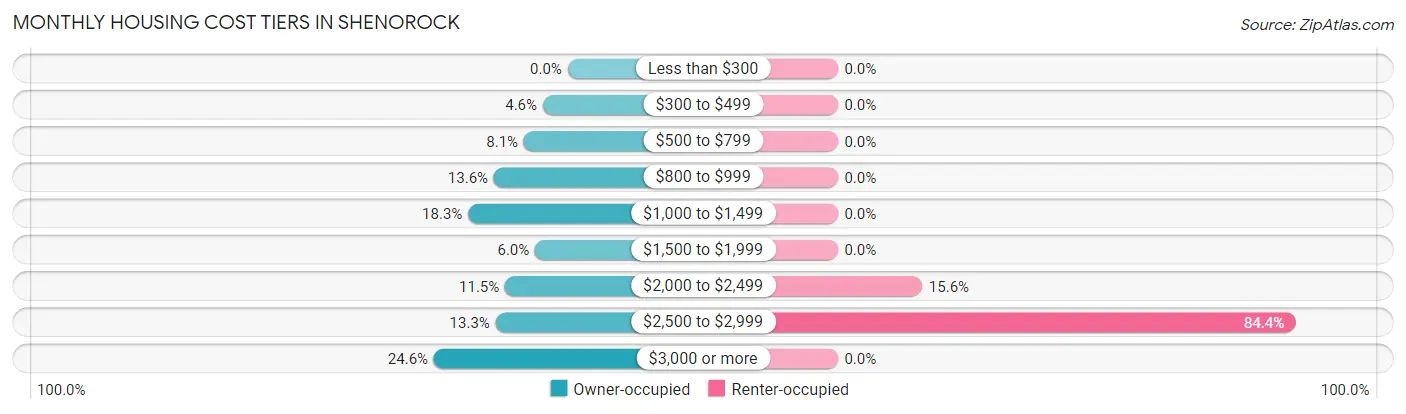
| Monthly Cost | Owner-occupied | Renter-occupied |
| Less than $300 | 0 (0.0%) | 0 (0.0%) |
| $300 to $499 | 29 (4.6%) | 0 (0.0%) |
| $500 to $799 | 51 (8.1%) | 0 (0.0%) |
| $800 to $999 | 86 (13.6%) | 0 (0.0%) |
| $1,000 to $1,499 | 116 (18.3%) | 0 (0.0%) |
| $1,500 to $1,999 | 38 (6.0%) | 0 (0.0%) |
| $2,000 to $2,499 | 73 (11.5%) | 7 (15.6%) |
| $2,500 to $2,999 | 84 (13.3%) | 38 (84.4%) |
| $3,000 or more | 156 (24.6%) | 0 (0.0%) |
| Total | 633 (100.0%) | 45 (100.0%) |
Physical Housing Characteristics in Shenorock
Housing Structures in Shenorock
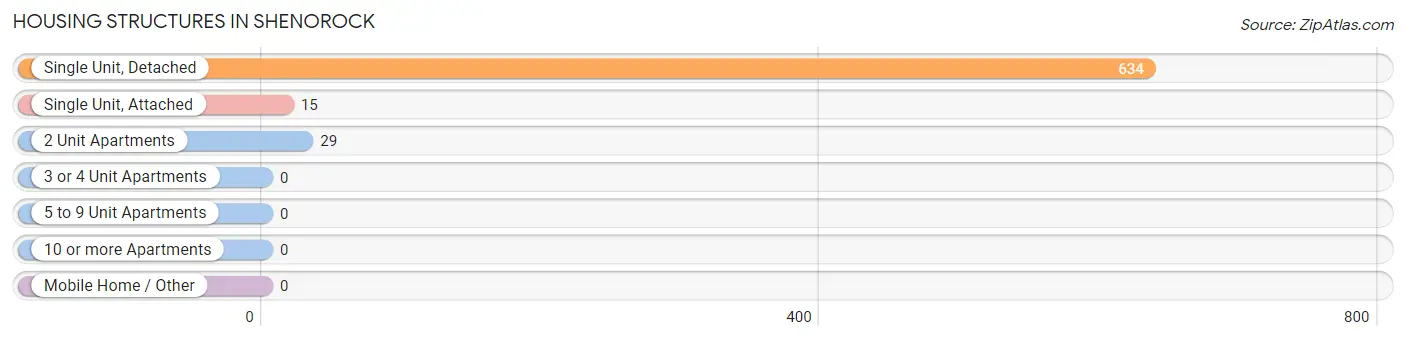
| Structure Type | # Housing Units | % Housing Units |
| Single Unit, Detached | 634 | 93.5% |
| Single Unit, Attached | 15 | 2.2% |
| 2 Unit Apartments | 29 | 4.3% |
| 3 or 4 Unit Apartments | 0 | 0.0% |
| 5 to 9 Unit Apartments | 0 | 0.0% |
| 10 or more Apartments | 0 | 0.0% |
| Mobile Home / Other | 0 | 0.0% |
| Total | 678 | 100.0% |
Housing Structures by Occupancy in Shenorock
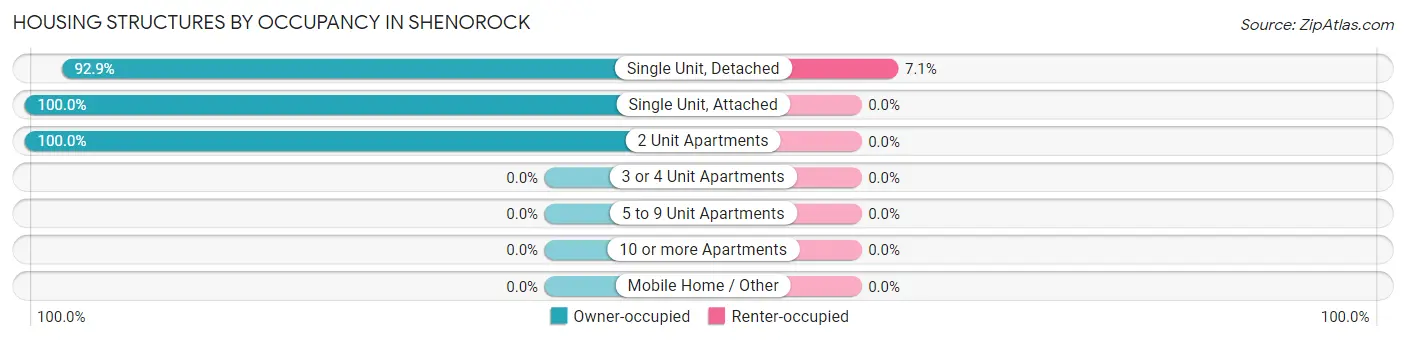
| Structure Type | Owner-occupied | Renter-occupied |
| Single Unit, Detached | 589 (92.9%) | 45 (7.1%) |
| Single Unit, Attached | 15 (100.0%) | 0 (0.0%) |
| 2 Unit Apartments | 29 (100.0%) | 0 (0.0%) |
| 3 or 4 Unit Apartments | 0 (0.0%) | 0 (0.0%) |
| 5 to 9 Unit Apartments | 0 (0.0%) | 0 (0.0%) |
| 10 or more Apartments | 0 (0.0%) | 0 (0.0%) |
| Mobile Home / Other | 0 (0.0%) | 0 (0.0%) |
| Total | 633 (93.4%) | 45 (6.6%) |
Housing Structures by Number of Rooms in Shenorock
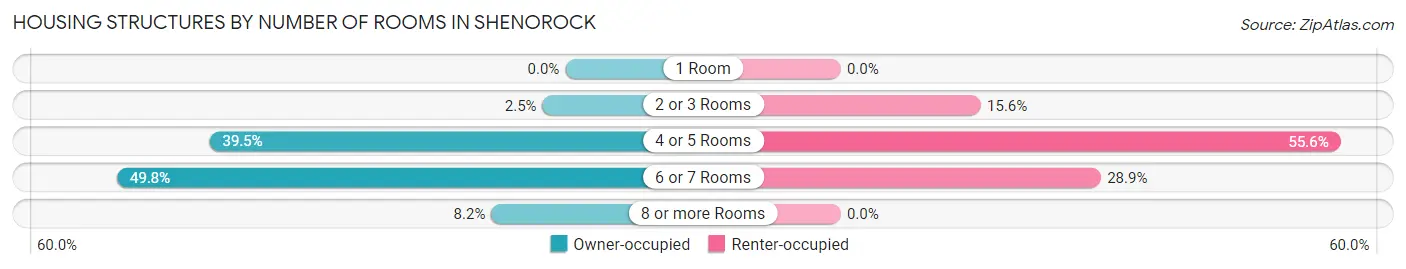
| Number of Rooms | Owner-occupied | Renter-occupied |
| 1 Room | 0 (0.0%) | 0 (0.0%) |
| 2 or 3 Rooms | 16 (2.5%) | 7 (15.6%) |
| 4 or 5 Rooms | 250 (39.5%) | 25 (55.6%) |
| 6 or 7 Rooms | 315 (49.8%) | 13 (28.9%) |
| 8 or more Rooms | 52 (8.2%) | 0 (0.0%) |
| Total | 633 (100.0%) | 45 (100.0%) |
Housing Structure by Heating Type in Shenorock
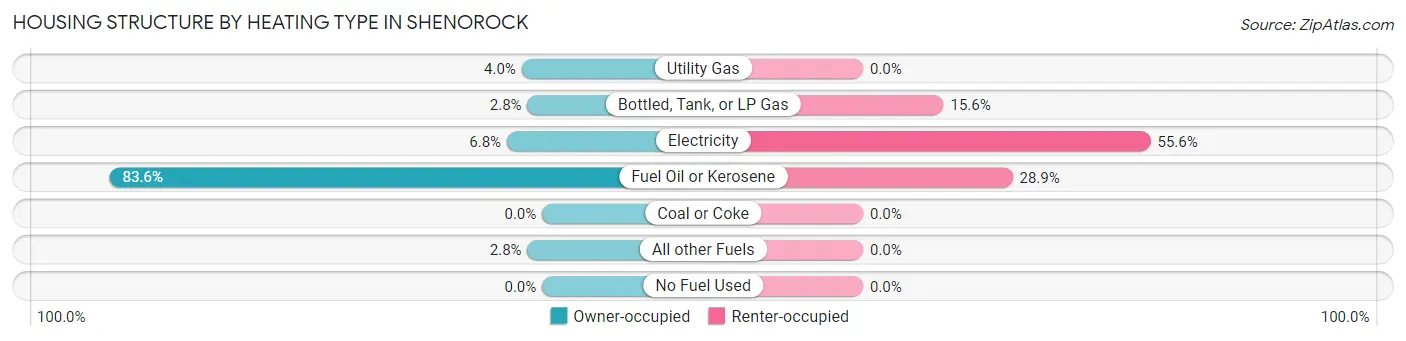
| Heating Type | Owner-occupied | Renter-occupied |
| Utility Gas | 25 (4.0%) | 0 (0.0%) |
| Bottled, Tank, or LP Gas | 18 (2.8%) | 7 (15.6%) |
| Electricity | 43 (6.8%) | 25 (55.6%) |
| Fuel Oil or Kerosene | 529 (83.6%) | 13 (28.9%) |
| Coal or Coke | 0 (0.0%) | 0 (0.0%) |
| All other Fuels | 18 (2.8%) | 0 (0.0%) |
| No Fuel Used | 0 (0.0%) | 0 (0.0%) |
| Total | 633 (100.0%) | 45 (100.0%) |
Household Vehicle Usage in Shenorock
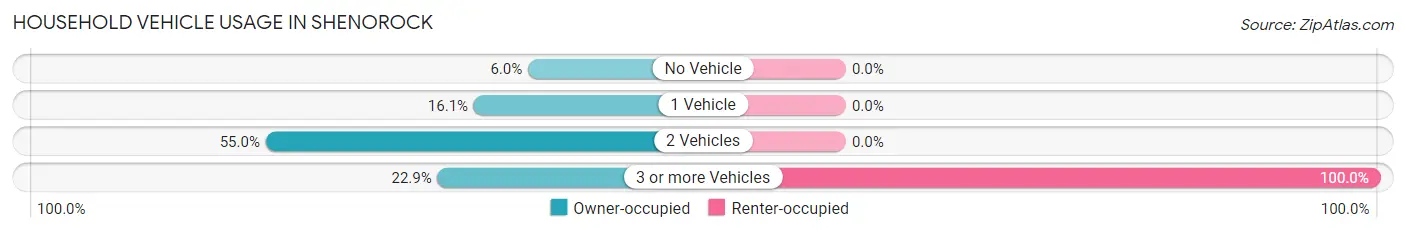
| Vehicles per Household | Owner-occupied | Renter-occupied |
| No Vehicle | 38 (6.0%) | 0 (0.0%) |
| 1 Vehicle | 102 (16.1%) | 0 (0.0%) |
| 2 Vehicles | 348 (55.0%) | 0 (0.0%) |
| 3 or more Vehicles | 145 (22.9%) | 45 (100.0%) |
| Total | 633 (100.0%) | 45 (100.0%) |
Real Estate & Mortgages in Shenorock
Real Estate and Mortgage Overview in Shenorock
| Characteristic | Without Mortgage | With Mortgage |
| Housing Units | 210 | 423 |
| Median Property Value | $396,200 | $435,100 |
| Median Household Income | $69,375 | $285 |
| Monthly Housing Costs | $1,116 | $139 |
| Real Estate Taxes | $9,659 | $0 |
Property Value by Mortgage Status in Shenorock
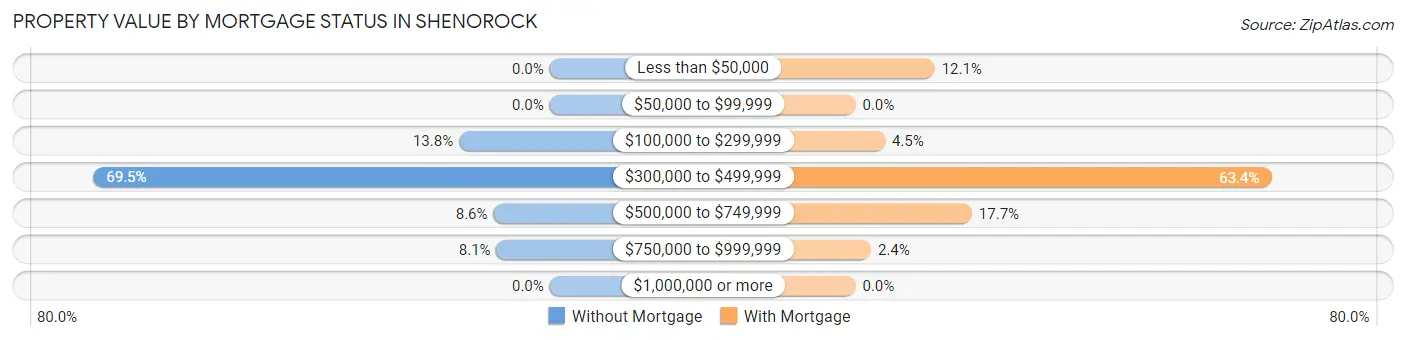
| Property Value | Without Mortgage | With Mortgage |
| Less than $50,000 | 0 (0.0%) | 51 (12.1%) |
| $50,000 to $99,999 | 0 (0.0%) | 0 (0.0%) |
| $100,000 to $299,999 | 29 (13.8%) | 19 (4.5%) |
| $300,000 to $499,999 | 146 (69.5%) | 268 (63.4%) |
| $500,000 to $749,999 | 18 (8.6%) | 75 (17.7%) |
| $750,000 to $999,999 | 17 (8.1%) | 10 (2.4%) |
| $1,000,000 or more | 0 (0.0%) | 0 (0.0%) |
| Total | 210 (100.0%) | 423 (100.0%) |
Household Income by Mortgage Status in Shenorock
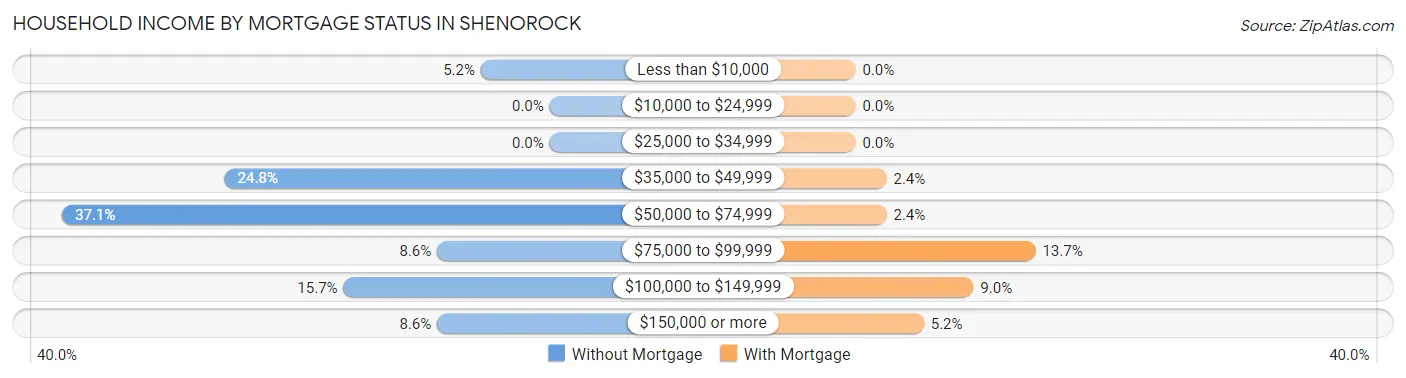
| Household Income | Without Mortgage | With Mortgage |
| Less than $10,000 | 11 (5.2%) | 0 (0.0%) |
| $10,000 to $24,999 | 0 (0.0%) | 0 (0.0%) |
| $25,000 to $34,999 | 0 (0.0%) | 0 (0.0%) |
| $35,000 to $49,999 | 52 (24.8%) | 10 (2.4%) |
| $50,000 to $74,999 | 78 (37.1%) | 10 (2.4%) |
| $75,000 to $99,999 | 18 (8.6%) | 58 (13.7%) |
| $100,000 to $149,999 | 33 (15.7%) | 38 (9.0%) |
| $150,000 or more | 18 (8.6%) | 22 (5.2%) |
| Total | 210 (100.0%) | 423 (100.0%) |
Property Value to Household Income Ratio in Shenorock
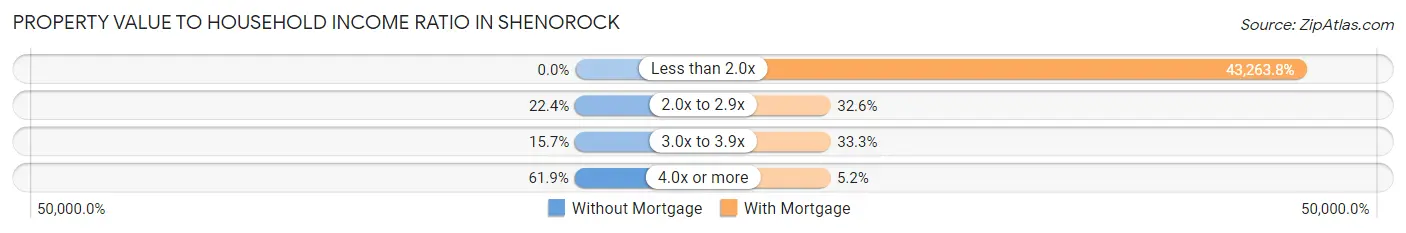
| Value-to-Income Ratio | Without Mortgage | With Mortgage |
| Less than 2.0x | 0 (0.0%) | 183,006 (43,263.8%) |
| 2.0x to 2.9x | 47 (22.4%) | 138 (32.6%) |
| 3.0x to 3.9x | 33 (15.7%) | 141 (33.3%) |
| 4.0x or more | 130 (61.9%) | 22 (5.2%) |
| Total | 210 (100.0%) | 423 (100.0%) |
Real Estate Taxes by Mortgage Status in Shenorock
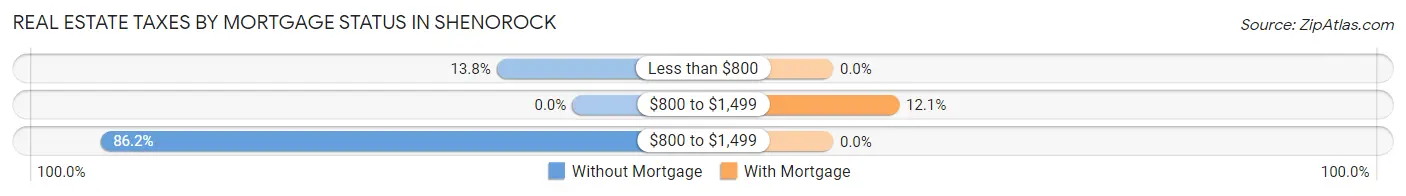
| Property Taxes | Without Mortgage | With Mortgage |
| Less than $800 | 29 (13.8%) | 0 (0.0%) |
| $800 to $1,499 | 0 (0.0%) | 51 (12.1%) |
| $800 to $1,499 | 181 (86.2%) | 0 (0.0%) |
| Total | 210 (100.0%) | 423 (100.0%) |
Health & Disability in Shenorock
Health Insurance Coverage by Age in Shenorock
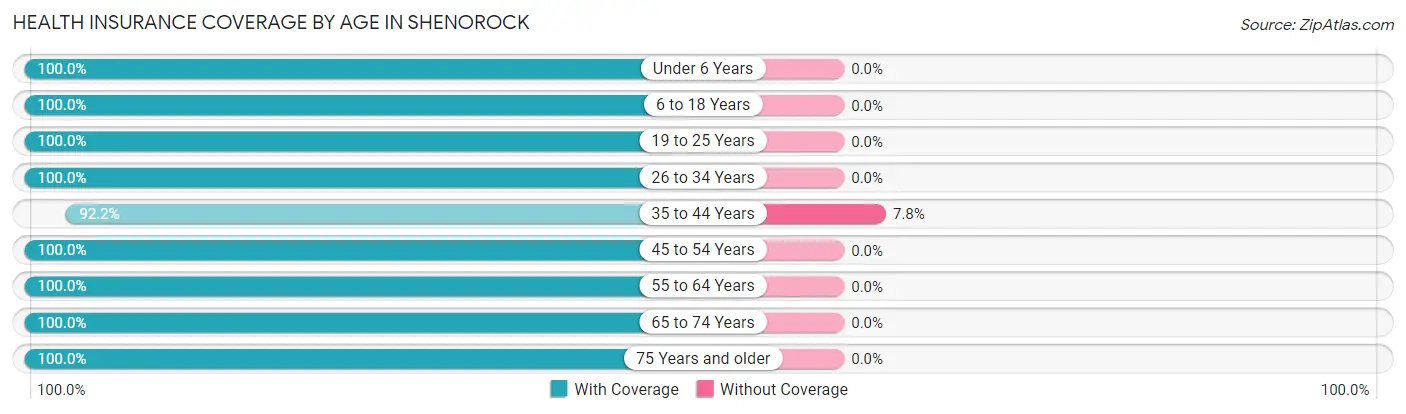
| Age Bracket | With Coverage | Without Coverage |
| Under 6 Years | 56 (100.0%) | 0 (0.0%) |
| 6 to 18 Years | 336 (100.0%) | 0 (0.0%) |
| 19 to 25 Years | 195 (100.0%) | 0 (0.0%) |
| 26 to 34 Years | 38 (100.0%) | 0 (0.0%) |
| 35 to 44 Years | 320 (92.2%) | 27 (7.8%) |
| 45 to 54 Years | 372 (100.0%) | 0 (0.0%) |
| 55 to 64 Years | 252 (100.0%) | 0 (0.0%) |
| 65 to 74 Years | 181 (100.0%) | 0 (0.0%) |
| 75 Years and older | 106 (100.0%) | 0 (0.0%) |
| Total | 1,856 (98.6%) | 27 (1.4%) |
Health Insurance Coverage by Citizenship Status in Shenorock
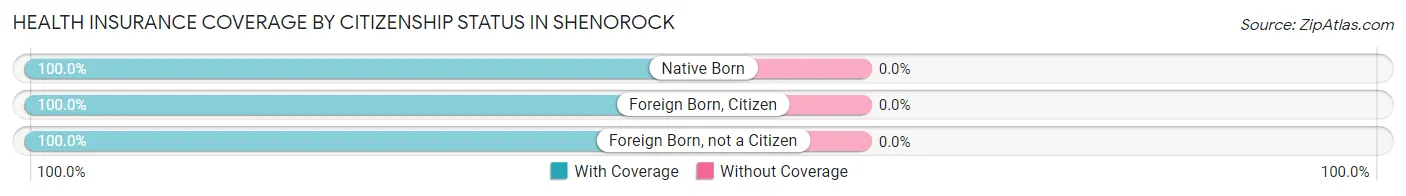
| Citizenship Status | With Coverage | Without Coverage |
| Native Born | 56 (100.0%) | 0 (0.0%) |
| Foreign Born, Citizen | 336 (100.0%) | 0 (0.0%) |
| Foreign Born, not a Citizen | 195 (100.0%) | 0 (0.0%) |
Health Insurance Coverage by Household Income in Shenorock
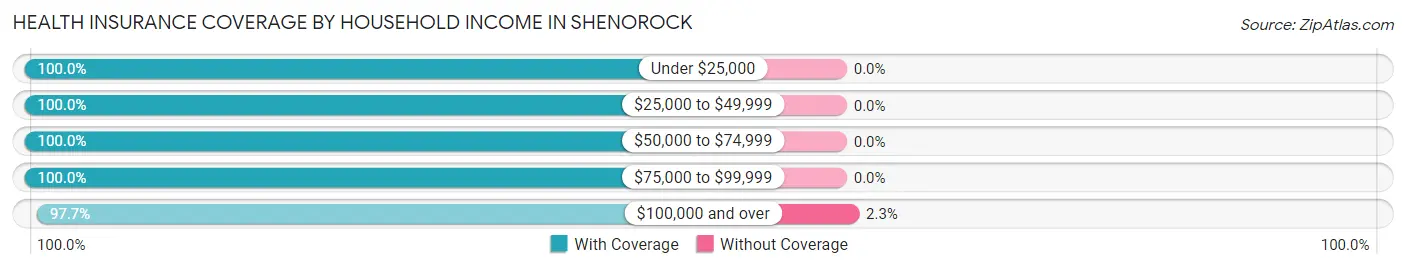
| Household Income | With Coverage | Without Coverage |
| Under $25,000 | 11 (100.0%) | 0 (0.0%) |
| $25,000 to $49,999 | 120 (100.0%) | 0 (0.0%) |
| $50,000 to $74,999 | 456 (100.0%) | 0 (0.0%) |
| $75,000 to $99,999 | 122 (100.0%) | 0 (0.0%) |
| $100,000 and over | 1,147 (97.7%) | 27 (2.3%) |
Public vs Private Health Insurance Coverage by Age in Shenorock
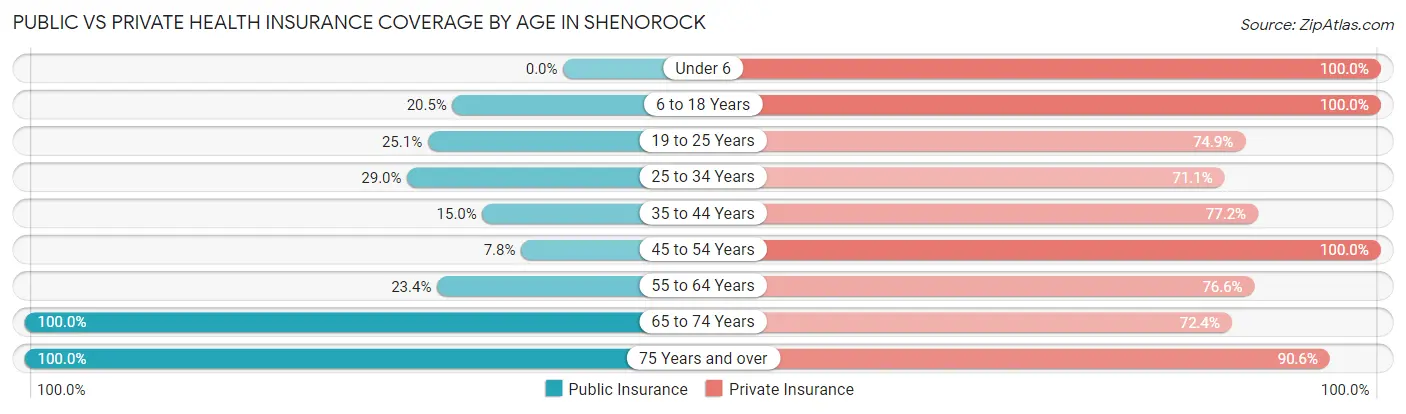
| Age Bracket | Public Insurance | Private Insurance |
| Under 6 | 0 (0.0%) | 56 (100.0%) |
| 6 to 18 Years | 69 (20.5%) | 336 (100.0%) |
| 19 to 25 Years | 49 (25.1%) | 146 (74.9%) |
| 25 to 34 Years | 11 (28.9%) | 27 (71.1%) |
| 35 to 44 Years | 52 (15.0%) | 268 (77.2%) |
| 45 to 54 Years | 29 (7.8%) | 372 (100.0%) |
| 55 to 64 Years | 59 (23.4%) | 193 (76.6%) |
| 65 to 74 Years | 181 (100.0%) | 131 (72.4%) |
| 75 Years and over | 106 (100.0%) | 96 (90.6%) |
| Total | 556 (29.5%) | 1,625 (86.3%) |
Disability Status by Sex by Age in Shenorock
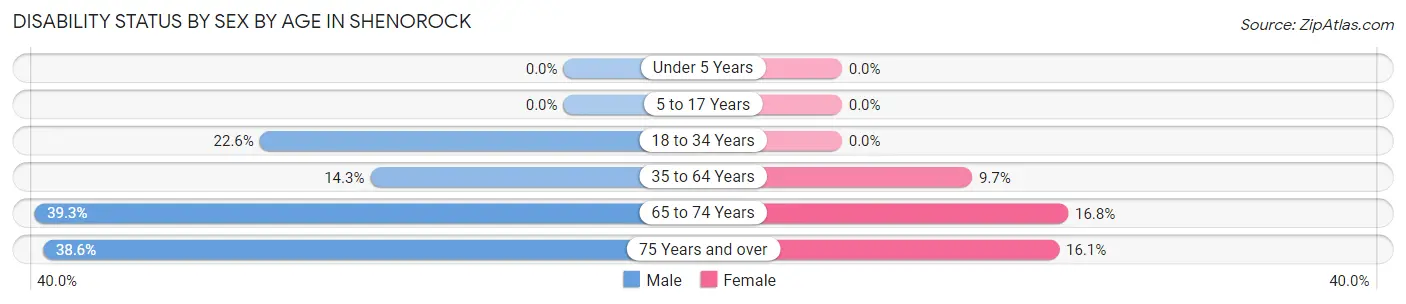
| Age Bracket | Male | Female |
| Under 5 Years | 0 (0.0%) | 0 (0.0%) |
| 5 to 17 Years | 0 (0.0%) | 0 (0.0%) |
| 18 to 34 Years | 46 (22.6%) | 0 (0.0%) |
| 35 to 64 Years | 74 (14.3%) | 44 (9.7%) |
| 65 to 74 Years | 22 (39.3%) | 21 (16.8%) |
| 75 Years and over | 17 (38.6%) | 10 (16.1%) |
Disability Class by Sex by Age in Shenorock
Disability Class: Hearing Difficulty
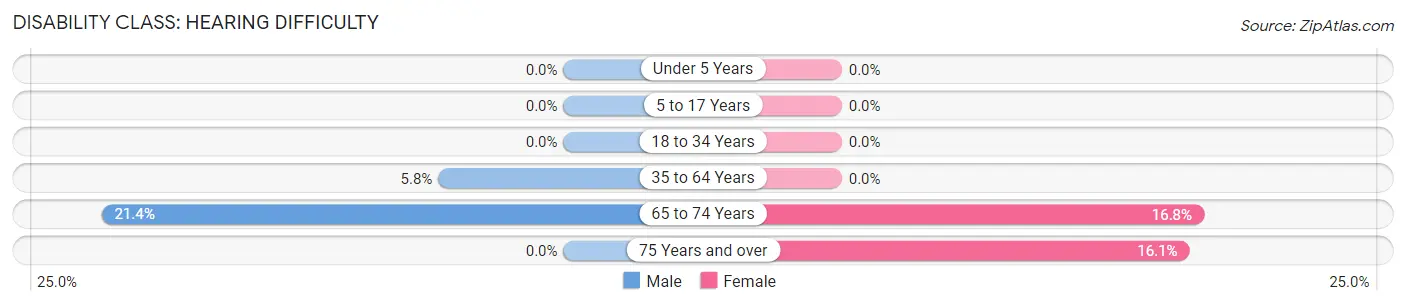
| Age Bracket | Male | Female |
| Under 5 Years | 0 (0.0%) | 0 (0.0%) |
| 5 to 17 Years | 0 (0.0%) | 0 (0.0%) |
| 18 to 34 Years | 0 (0.0%) | 0 (0.0%) |
| 35 to 64 Years | 30 (5.8%) | 0 (0.0%) |
| 65 to 74 Years | 12 (21.4%) | 21 (16.8%) |
| 75 Years and over | 0 (0.0%) | 10 (16.1%) |
Disability Class: Vision Difficulty
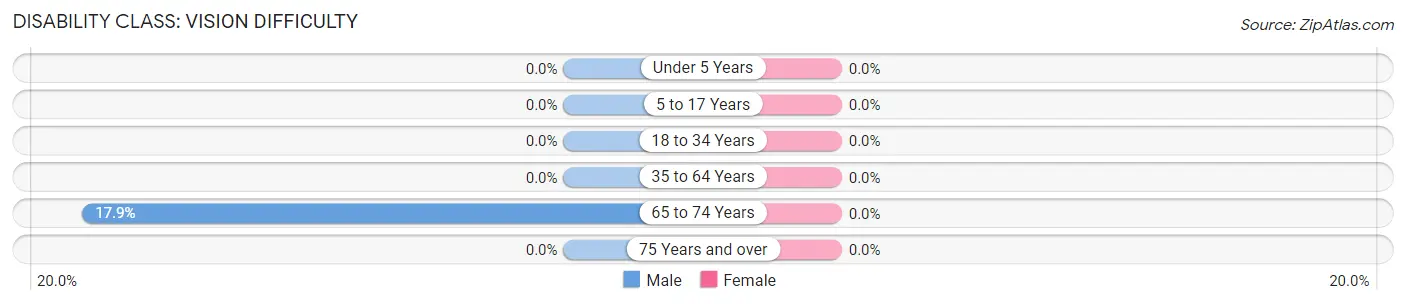
| Age Bracket | Male | Female |
| Under 5 Years | 0 (0.0%) | 0 (0.0%) |
| 5 to 17 Years | 0 (0.0%) | 0 (0.0%) |
| 18 to 34 Years | 0 (0.0%) | 0 (0.0%) |
| 35 to 64 Years | 0 (0.0%) | 0 (0.0%) |
| 65 to 74 Years | 10 (17.9%) | 0 (0.0%) |
| 75 Years and over | 0 (0.0%) | 0 (0.0%) |
Disability Class: Cognitive Difficulty
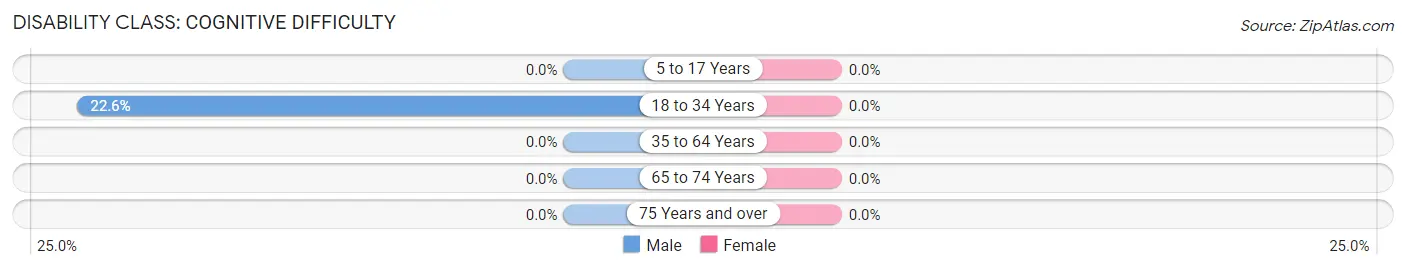
| Age Bracket | Male | Female |
| 5 to 17 Years | 0 (0.0%) | 0 (0.0%) |
| 18 to 34 Years | 46 (22.6%) | 0 (0.0%) |
| 35 to 64 Years | 0 (0.0%) | 0 (0.0%) |
| 65 to 74 Years | 0 (0.0%) | 0 (0.0%) |
| 75 Years and over | 0 (0.0%) | 0 (0.0%) |
Disability Class: Ambulatory Difficulty
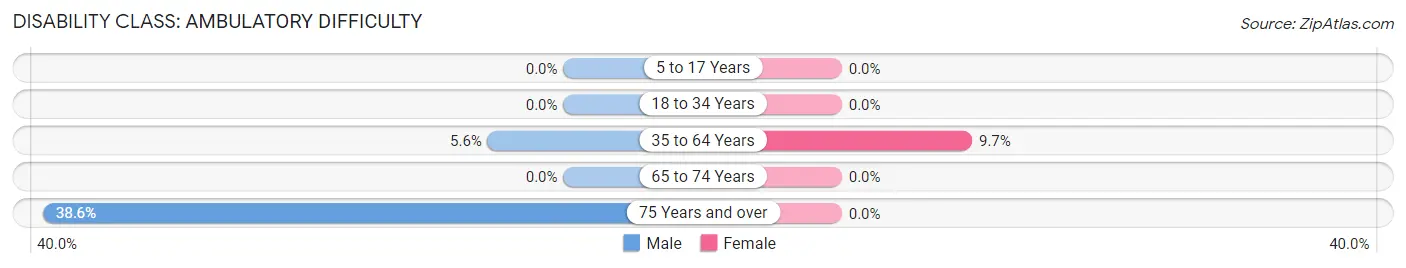
| Age Bracket | Male | Female |
| 5 to 17 Years | 0 (0.0%) | 0 (0.0%) |
| 18 to 34 Years | 0 (0.0%) | 0 (0.0%) |
| 35 to 64 Years | 29 (5.6%) | 44 (9.7%) |
| 65 to 74 Years | 0 (0.0%) | 0 (0.0%) |
| 75 Years and over | 17 (38.6%) | 0 (0.0%) |
Disability Class: Self-Care Difficulty
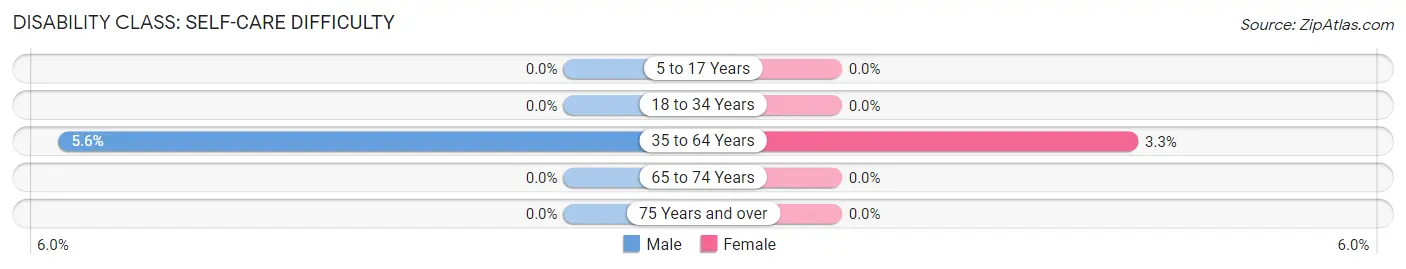
| Age Bracket | Male | Female |
| 5 to 17 Years | 0 (0.0%) | 0 (0.0%) |
| 18 to 34 Years | 0 (0.0%) | 0 (0.0%) |
| 35 to 64 Years | 29 (5.6%) | 15 (3.3%) |
| 65 to 74 Years | 0 (0.0%) | 0 (0.0%) |
| 75 Years and over | 0 (0.0%) | 0 (0.0%) |
Technology Access in Shenorock
Computing Device Access in Shenorock
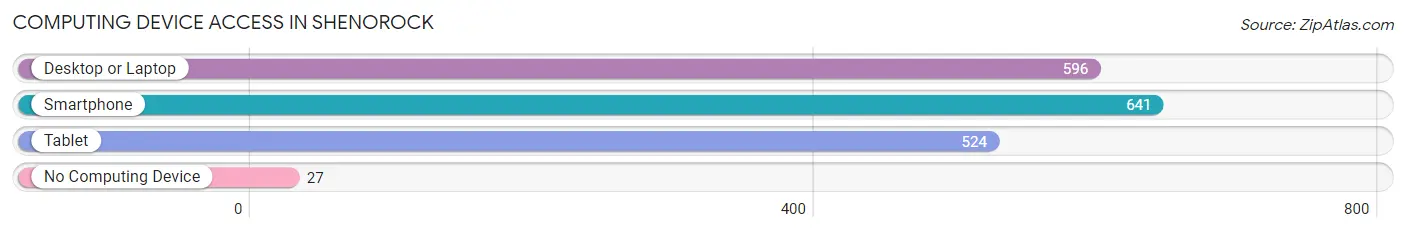
| Device Type | # Households | % Households |
| Desktop or Laptop | 596 | 87.9% |
| Smartphone | 641 | 94.5% |
| Tablet | 524 | 77.3% |
| No Computing Device | 27 | 4.0% |
| Total | 678 | 100.0% |
Internet Access in Shenorock
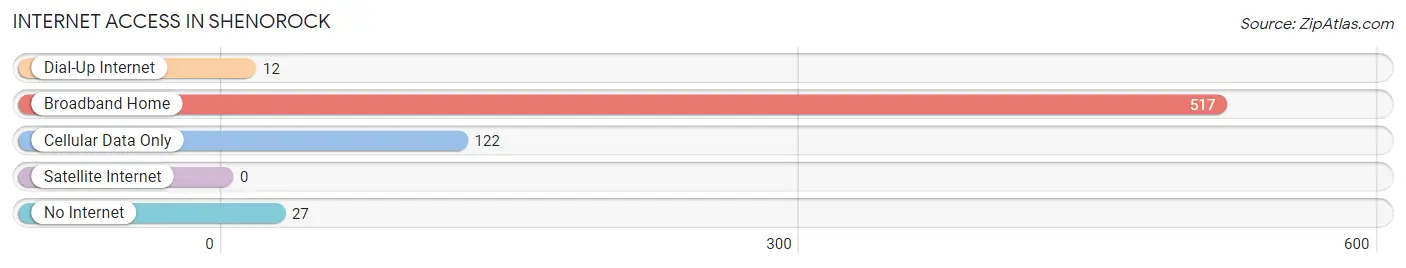
| Internet Type | # Households | % Households |
| Dial-Up Internet | 12 | 1.8% |
| Broadband Home | 517 | 76.2% |
| Cellular Data Only | 122 | 18.0% |
| Satellite Internet | 0 | 0.0% |
| No Internet | 27 | 4.0% |
| Total | 678 | 100.0% |
Shenorock Summary
Shenorock is a hamlet located in the town of Somers in Westchester County, New York. It is situated in the southeastern corner of the town, near the border with Putnam County. The hamlet is located approximately 40 miles north of New York City and is part of the New York metropolitan area.
History
The area that is now Shenorock was originally inhabited by the Wappinger Native American tribe. The first European settlers arrived in the area in the late 17th century. The hamlet was originally known as “Shenorock”, a name derived from the Wappinger word for “place of the rocks”.
In the late 19th century, the hamlet began to grow as a summer resort community. The area was popular with wealthy New Yorkers who built large estates in the area. The hamlet was also home to several large farms, which provided produce to the nearby city of New York.
In the early 20th century, the hamlet began to decline as a resort community. Many of the large estates were sold off and the farms were abandoned. The hamlet was eventually incorporated into the town of Somers in the 1950s.
Geography
Shenorock is located in the southeastern corner of the town of Somers, near the border with Putnam County. The hamlet is situated on the banks of the Croton River, which flows through the area. The hamlet is located approximately 40 miles north of New York City and is part of the New York metropolitan area.
The hamlet is mostly rural, with rolling hills and wooded areas. The area is home to several parks, including the Shenorock Nature Preserve, which is a popular destination for hikers and nature lovers.
Economy
Shenorock is primarily a residential community, with most of its residents commuting to nearby cities for work. The hamlet is home to several small businesses, including a few restaurants, a grocery store, and a few retail stores.
The hamlet is also home to several large estates, which are popular with wealthy New Yorkers. These estates are often rented out for weddings and other events.
Demographics
As of the 2010 census, the population of Shenorock was 1,845. The population is primarily white (94.3%), with a small percentage of African Americans (2.2%) and Hispanics (2.2%). The median household income is $107,917, which is significantly higher than the national average.
The hamlet is home to several large estates, which are popular with wealthy New Yorkers. These estates are often rented out for weddings and other events.
Conclusion
Shenorock is a small hamlet located in the town of Somers in Westchester County, New York. The hamlet is situated on the banks of the Croton River and is home to several parks and nature preserves. The hamlet is primarily a residential community, with most of its residents commuting to nearby cities for work. The population of Shenorock is primarily white, with a median household income significantly higher than the national average. The hamlet is also home to several large estates, which are popular with wealthy New Yorkers.
Common Questions
What is Per Capita Income in Shenorock?
Per Capita income in Shenorock is $57,475.
What is the Median Family Income in Shenorock?
Median Family Income in Shenorock is $169,931.
What is the Median Household income in Shenorock?
Median Household Income in Shenorock is $129,700.
What is Income or Wage Gap in Shenorock?
Income or Wage Gap in Shenorock is 21.0%.
Women in Shenorock earn 79.0 cents for every dollar earned by a man.
What is Inequality or Gini Index in Shenorock?
Inequality or Gini Index in Shenorock is 0.37.
What is the Total Population of Shenorock?
Total Population of Shenorock is 1,883.
What is the Total Male Population of Shenorock?
Total Male Population of Shenorock is 908.
What is the Total Female Population of Shenorock?
Total Female Population of Shenorock is 975.
What is the Ratio of Males per 100 Females in Shenorock?
There are 93.13 Males per 100 Females in Shenorock.
What is the Ratio of Females per 100 Males in Shenorock?
There are 107.38 Females per 100 Males in Shenorock.
What is the Median Population Age in Shenorock?
Median Population Age in Shenorock is 43.5 Years.
What is the Average Family Size in Shenorock
Average Family Size in Shenorock is 3.1 People.
What is the Average Household Size in Shenorock
Average Household Size in Shenorock is 2.8 People.
How Large is the Labor Force in Shenorock?
There are 1,045 People in the Labor Forcein in Shenorock.
What is the Percentage of People in the Labor Force in Shenorock?
65.3% of People are in the Labor Force in Shenorock.
What is the Unemployment Rate in Shenorock?
Unemployment Rate in Shenorock is 6.1%.