Canaan, NH Map & Demographics
Canaan Map
Canaan Overview
$42,360
PER CAPITA INCOME
$91,250
AVG FAMILY INCOME
0.46
INEQUALITY / GINI INDEX
173
TOTAL POPULATION
87
MALE POPULATION
86
FEMALE POPULATION
101.16
MALES / 100 FEMALES
98.85
FEMALES / 100 MALES
60.6
MEDIAN AGE
1.9
AVG FAMILY SIZE
1.4
AVG HOUSEHOLD SIZE
118
LABOR FORCE [ PEOPLE ]
68.2%
PERCENT IN LABOR FORCE
Canaan Zip Codes
Canaan Area Codes
Income in Canaan
Income Overview in Canaan
| Characteristic | Number | Measure |
| Per Capita Income | 173 | $42,360 |
| Median Family Income | 30 | $91,250 |
| Mean Family Income | 30 | $88,823 |
| Median Household Income | 123 | $0 |
| Mean Household Income | 123 | $62,462 |
| Income Deficit | 30 | $0 |
| Wage / Income Gap (%) | 173 | 0.00% |
| Wage / Income Gap ($) | 173 | 100.00¢ per $1 |
| Gini / Inequality Index | 173 | 0.46 |
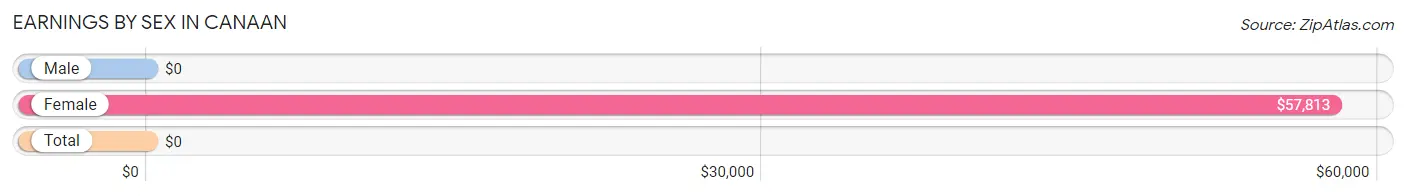
Earnings by Sex in Canaan
| Sex | Number | Average Earnings |
| Male | 86 (63.2%) | $0 |
| Female | 50 (36.8%) | $57,813 |
| Total | 136 (100.0%) | $0 |
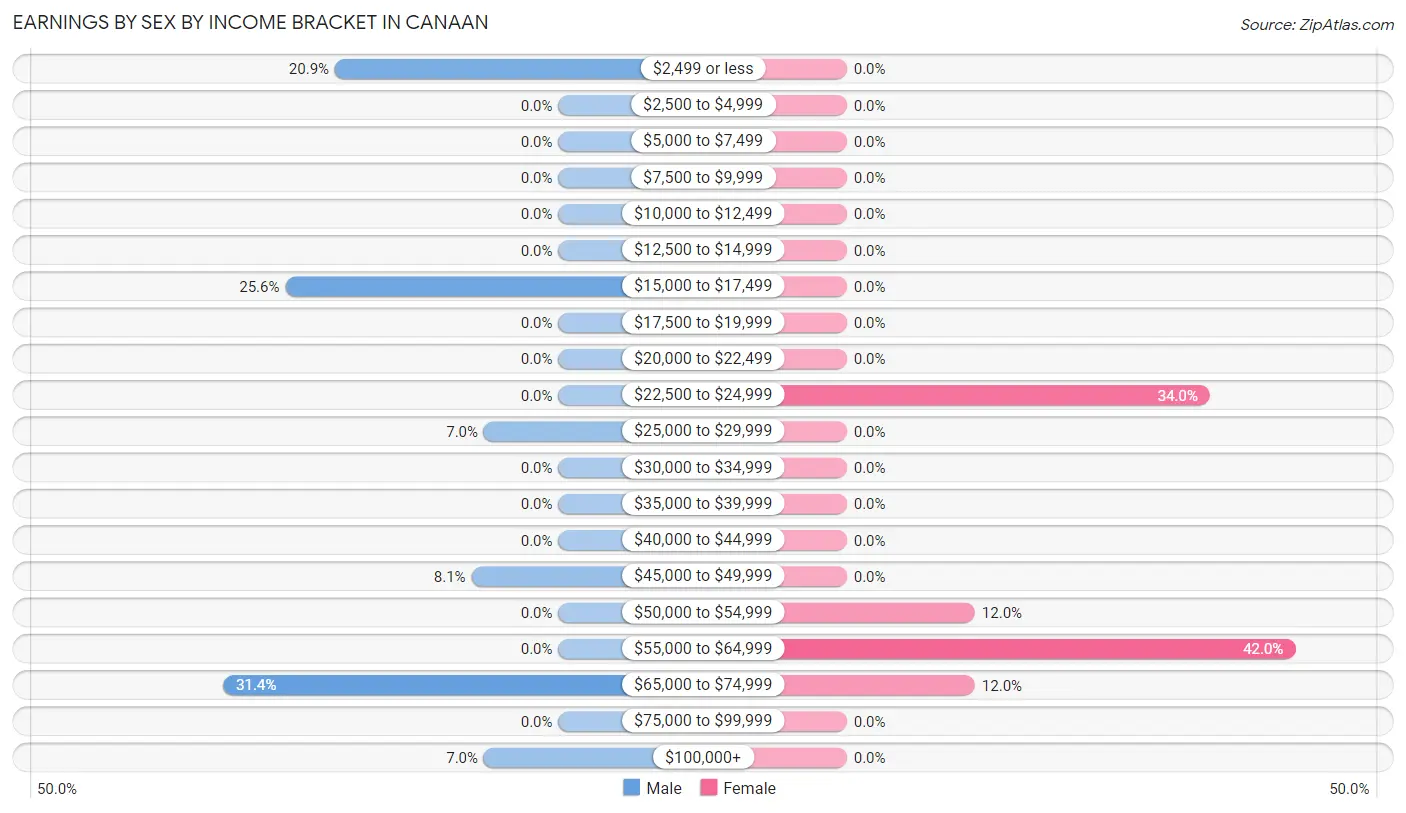
Earnings by Sex by Income Bracket in Canaan
The most common earnings brackets in Canaan are $65,000 to $74,999 for men (27 | 31.4%) and $55,000 to $64,999 for women (21 | 42.0%).
| Income | Male | Female |
| $2,499 or less | 18 (20.9%) | 0 (0.0%) |
| $2,500 to $4,999 | 0 (0.0%) | 0 (0.0%) |
| $5,000 to $7,499 | 0 (0.0%) | 0 (0.0%) |
| $7,500 to $9,999 | 0 (0.0%) | 0 (0.0%) |
| $10,000 to $12,499 | 0 (0.0%) | 0 (0.0%) |
| $12,500 to $14,999 | 0 (0.0%) | 0 (0.0%) |
| $15,000 to $17,499 | 22 (25.6%) | 0 (0.0%) |
| $17,500 to $19,999 | 0 (0.0%) | 0 (0.0%) |
| $20,000 to $22,499 | 0 (0.0%) | 0 (0.0%) |
| $22,500 to $24,999 | 0 (0.0%) | 17 (34.0%) |
| $25,000 to $29,999 | 6 (7.0%) | 0 (0.0%) |
| $30,000 to $34,999 | 0 (0.0%) | 0 (0.0%) |
| $35,000 to $39,999 | 0 (0.0%) | 0 (0.0%) |
| $40,000 to $44,999 | 0 (0.0%) | 0 (0.0%) |
| $45,000 to $49,999 | 7 (8.1%) | 0 (0.0%) |
| $50,000 to $54,999 | 0 (0.0%) | 6 (12.0%) |
| $55,000 to $64,999 | 0 (0.0%) | 21 (42.0%) |
| $65,000 to $74,999 | 27 (31.4%) | 6 (12.0%) |
| $75,000 to $99,999 | 0 (0.0%) | 0 (0.0%) |
| $100,000+ | 6 (7.0%) | 0 (0.0%) |
| Total | 86 (100.0%) | 50 (100.0%) |
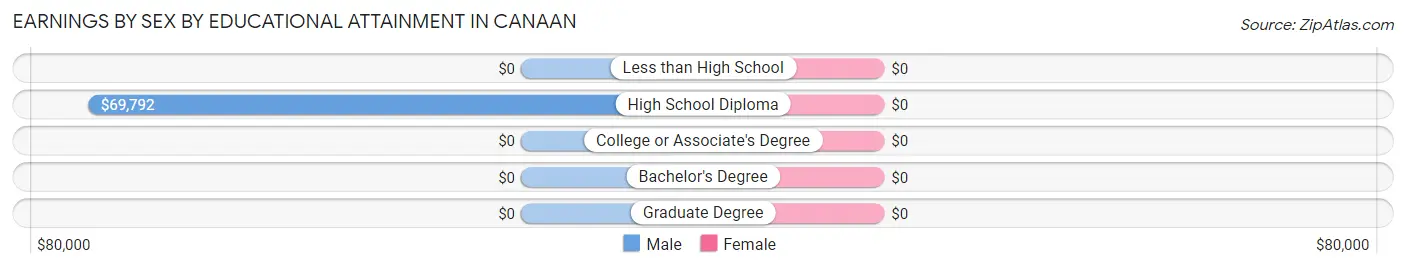
Earnings by Sex by Educational Attainment in Canaan
| Educational Attainment | Male Income | Female Income |
| Less than High School | - | - |
| High School Diploma | $69,792 | $0 |
| College or Associate's Degree | - | - |
| Bachelor's Degree | - | - |
| Graduate Degree | - | - |
| Total | - | - |
Family Income in Canaan
Family Income Brackets in Canaan
According to the Canaan family income data, there are 18 families falling into the $75,000 to $99,999 income range, which is the most common income bracket and makes up 60.0% of all families.
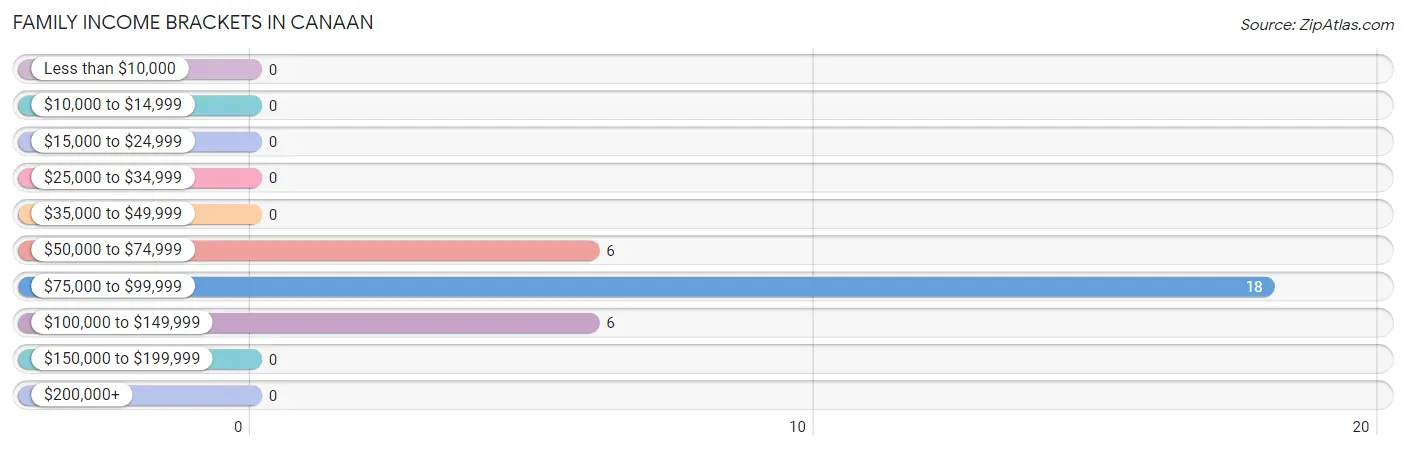
| Income Bracket | # Families | % Families |
| Less than $10,000 | 0 | 0.0% |
| $10,000 to $14,999 | 0 | 0.0% |
| $15,000 to $24,999 | 0 | 0.0% |
| $25,000 to $34,999 | 0 | 0.0% |
| $35,000 to $49,999 | 0 | 0.0% |
| $50,000 to $74,999 | 6 | 20.0% |
| $75,000 to $99,999 | 18 | 60.0% |
| $100,000 to $149,999 | 6 | 20.0% |
| $150,000 to $199,999 | 0 | 0.0% |
| $200,000+ | 0 | 0.0% |
Family Income by Famaliy Size in Canaan
2-person families (30 | 100.0%) account for the highest median family income in Canaan with $91,250 per family, while 2-person families (30 | 100.0%) have the highest median income of $45,625 per family member.
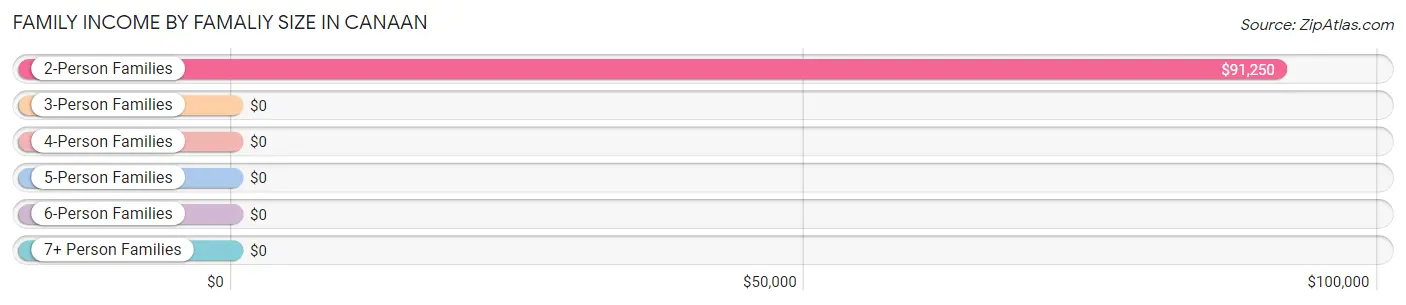
| Income Bracket | # Families | Median Income |
| 2-Person Families | 30 (100.0%) | $91,250 |
| 3-Person Families | 0 (0.0%) | $0 |
| 4-Person Families | 0 (0.0%) | $0 |
| 5-Person Families | 0 (0.0%) | $0 |
| 6-Person Families | 0 (0.0%) | $0 |
| 7+ Person Families | 0 (0.0%) | $0 |
| Total | 30 (100.0%) | $91,250 |
Family Income by Number of Earners in Canaan
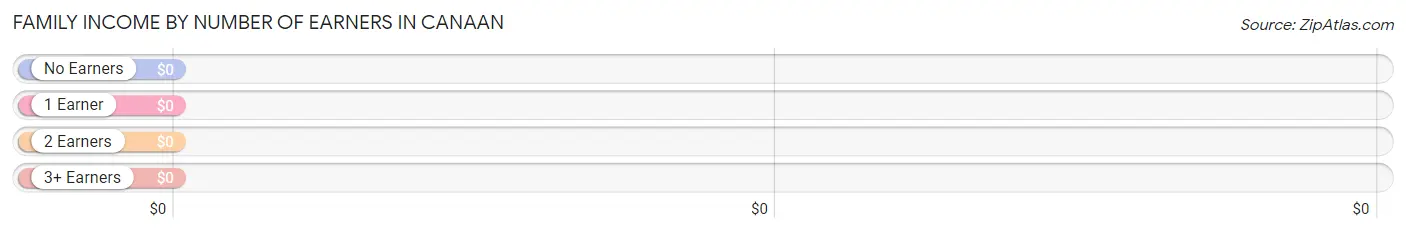
| Number of Earners | # Families | Median Income |
| No Earners | 0 (0.0%) | $0 |
| 1 Earner | 18 (60.0%) | $0 |
| 2 Earners | 12 (40.0%) | $0 |
| 3+ Earners | 0 (0.0%) | $0 |
| Total | 30 (100.0%) | $91,250 |
Household Income in Canaan
Household Income Brackets in Canaan
With 34 households falling in the category, the $15,000 to $24,999 income range is the most frequent in Canaan, accounting for 27.6% of all households.
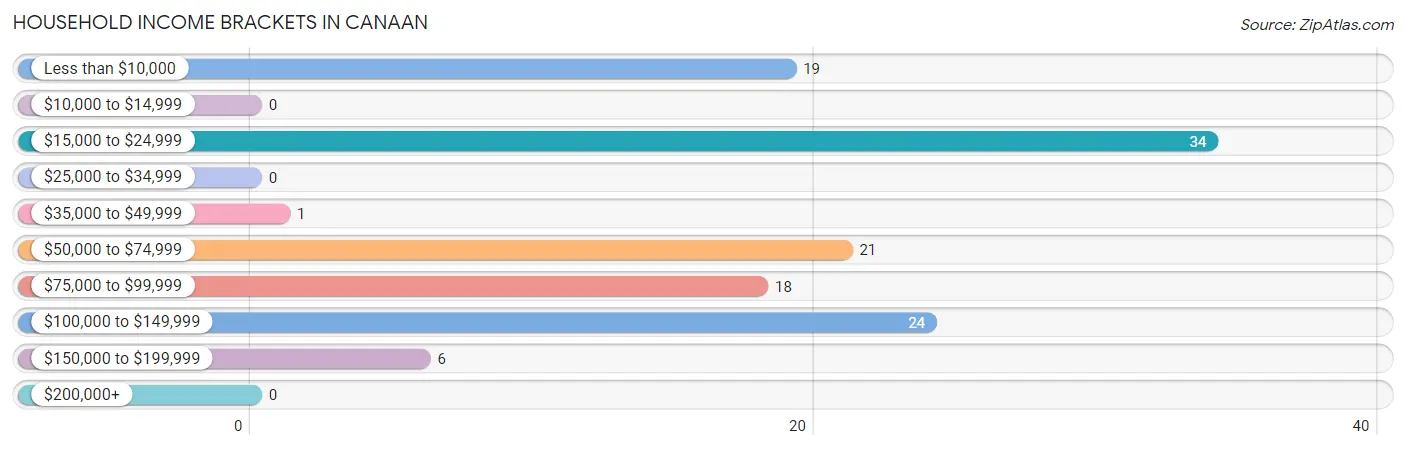
| Income Bracket | # Households | % Households |
| Less than $10,000 | 19 | 15.4% |
| $10,000 to $14,999 | 0 | 0.0% |
| $15,000 to $24,999 | 34 | 27.6% |
| $25,000 to $34,999 | 0 | 0.0% |
| $35,000 to $49,999 | 1 | 0.8% |
| $50,000 to $74,999 | 21 | 17.1% |
| $75,000 to $99,999 | 18 | 14.6% |
| $100,000 to $149,999 | 24 | 19.5% |
| $150,000 to $199,999 | 6 | 4.9% |
| $200,000+ | 0 | 0.0% |
Household Income by Householder Age in Canaan
The median household income in Canaan is $0, with the highest median household income of $90,764 found in the 65+ years age bracket for the primary householder. A total of 25 households (20.3%) fall into this category. Meanwhile, the 15 to 24 years age bracket for the primary householder has the lowest median household income of $0, with 12 households (9.8%) in this group.
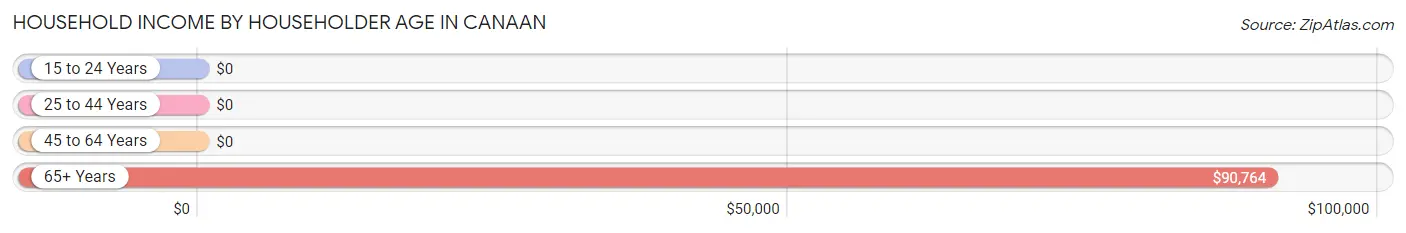
| Income Bracket | # Households | Median Income |
| 15 to 24 Years | 12 (9.8%) | $0 |
| 25 to 44 Years | 28 (22.8%) | $0 |
| 45 to 64 Years | 58 (47.1%) | $0 |
| 65+ Years | 25 (20.3%) | $90,764 |
| Total | 123 (100.0%) | $0 |
Poverty in Canaan
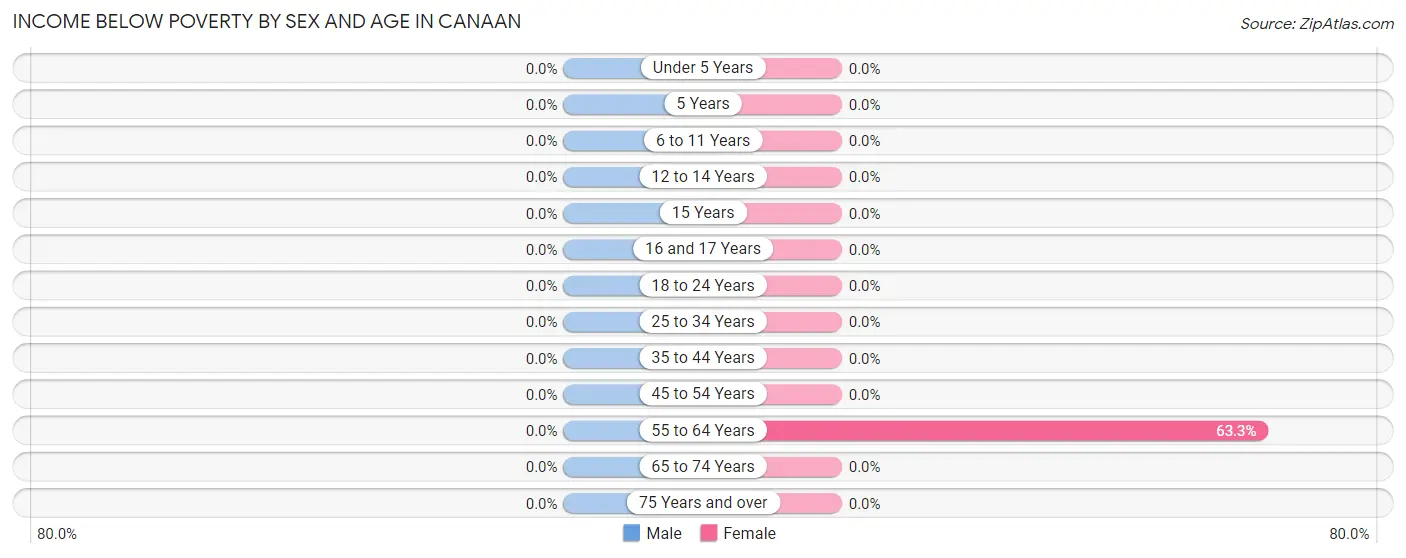
Income Below Poverty by Sex and Age in Canaan
| Age Bracket | Male | Female |
| Under 5 Years | 0 (0.0%) | 0 (0.0%) |
| 5 Years | 0 (0.0%) | 0 (0.0%) |
| 6 to 11 Years | 0 (0.0%) | 0 (0.0%) |
| 12 to 14 Years | 0 (0.0%) | 0 (0.0%) |
| 15 Years | 0 (0.0%) | 0 (0.0%) |
| 16 and 17 Years | 0 (0.0%) | 0 (0.0%) |
| 18 to 24 Years | 0 (0.0%) | 0 (0.0%) |
| 25 to 34 Years | 0 (0.0%) | 0 (0.0%) |
| 35 to 44 Years | 0 (0.0%) | 0 (0.0%) |
| 45 to 54 Years | 0 (0.0%) | 0 (0.0%) |
| 55 to 64 Years | 0 (0.0%) | 19 (63.3%) |
| 65 to 74 Years | 0 (0.0%) | 0 (0.0%) |
| 75 Years and over | 0 (0.0%) | 0 (0.0%) |
| Total | 0 (0.0%) | 19 (22.1%) |
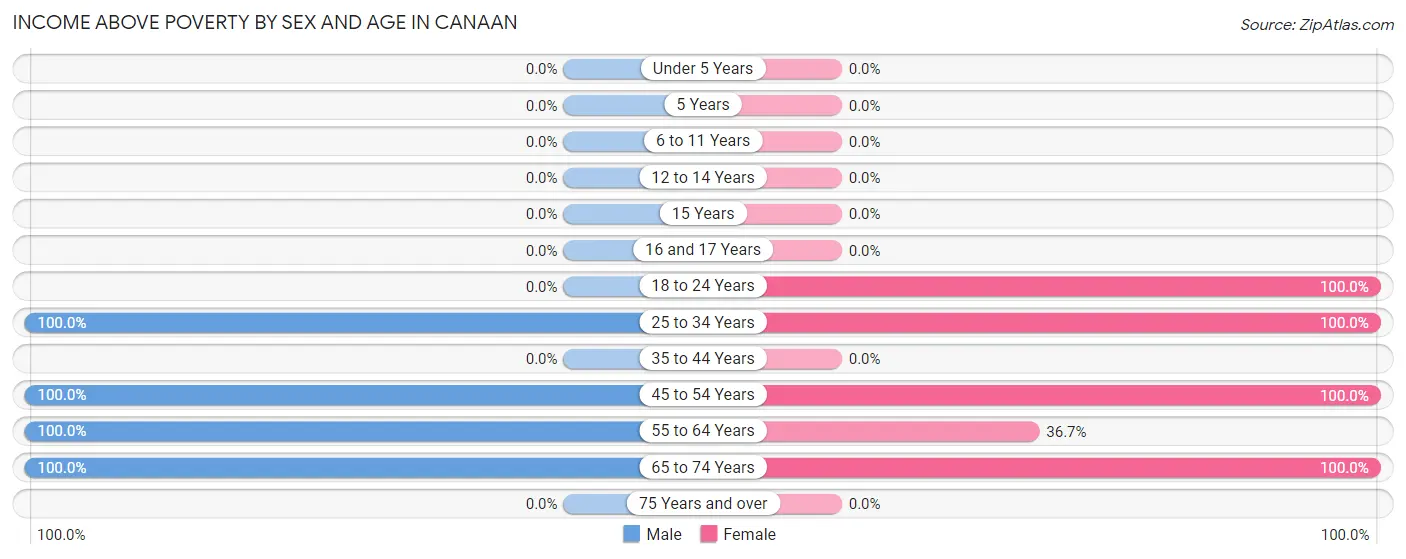
Income Above Poverty by Sex and Age in Canaan
According to the poverty statistics in Canaan, males aged 25 to 34 years and females aged 18 to 24 years are the age groups that are most secure financially, with 100.0% of males and 100.0% of females in these age groups living above the poverty line.
| Age Bracket | Male | Female |
| Under 5 Years | 0 (0.0%) | 0 (0.0%) |
| 5 Years | 0 (0.0%) | 0 (0.0%) |
| 6 to 11 Years | 0 (0.0%) | 0 (0.0%) |
| 12 to 14 Years | 0 (0.0%) | 0 (0.0%) |
| 15 Years | 0 (0.0%) | 0 (0.0%) |
| 16 and 17 Years | 0 (0.0%) | 0 (0.0%) |
| 18 to 24 Years | 0 (0.0%) | 12 (100.0%) |
| 25 to 34 Years | 22 (100.0%) | 6 (100.0%) |
| 35 to 44 Years | 0 (0.0%) | 0 (0.0%) |
| 45 to 54 Years | 6 (100.0%) | 21 (100.0%) |
| 55 to 64 Years | 34 (100.0%) | 11 (36.7%) |
| 65 to 74 Years | 25 (100.0%) | 17 (100.0%) |
| 75 Years and over | 0 (0.0%) | 0 (0.0%) |
| Total | 87 (100.0%) | 67 (77.9%) |
Income Below Poverty Among Married-Couple Families in Canaan
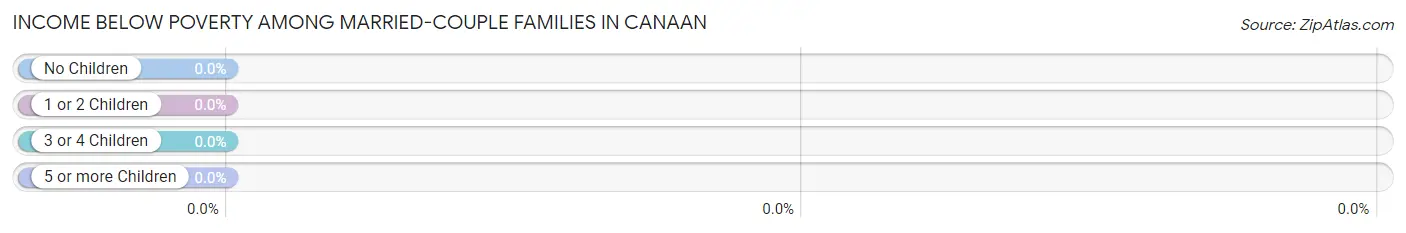
| Children | Above Poverty | Below Poverty |
| No Children | 30 (100.0%) | 0 (0.0%) |
| 1 or 2 Children | 0 (0.0%) | 0 (0.0%) |
| 3 or 4 Children | 0 (0.0%) | 0 (0.0%) |
| 5 or more Children | 0 (0.0%) | 0 (0.0%) |
| Total | 30 (100.0%) | 0 (0.0%) |
Income Below Poverty Among Single-Parent Households in Canaan
| Children | Single Father | Single Mother |
| No Children | 0 (0.0%) | 0 (0.0%) |
| 1 or 2 Children | 0 (0.0%) | 0 (0.0%) |
| 3 or 4 Children | 0 (0.0%) | 0 (0.0%) |
| 5 or more Children | 0 (0.0%) | 0 (0.0%) |
| Total | 0 (0.0%) | 0 (0.0%) |
Income Below Poverty Among Married-Couple vs Single-Parent Households in Canaan
| Children | Married-Couple Families | Single-Parent Households |
| No Children | 0 (0.0%) | 0 (0.0%) |
| 1 or 2 Children | 0 (0.0%) | 0 (0.0%) |
| 3 or 4 Children | 0 (0.0%) | 0 (0.0%) |
| 5 or more Children | 0 (0.0%) | 0 (0.0%) |
| Total | 0 (0.0%) | 0 (0.0%) |
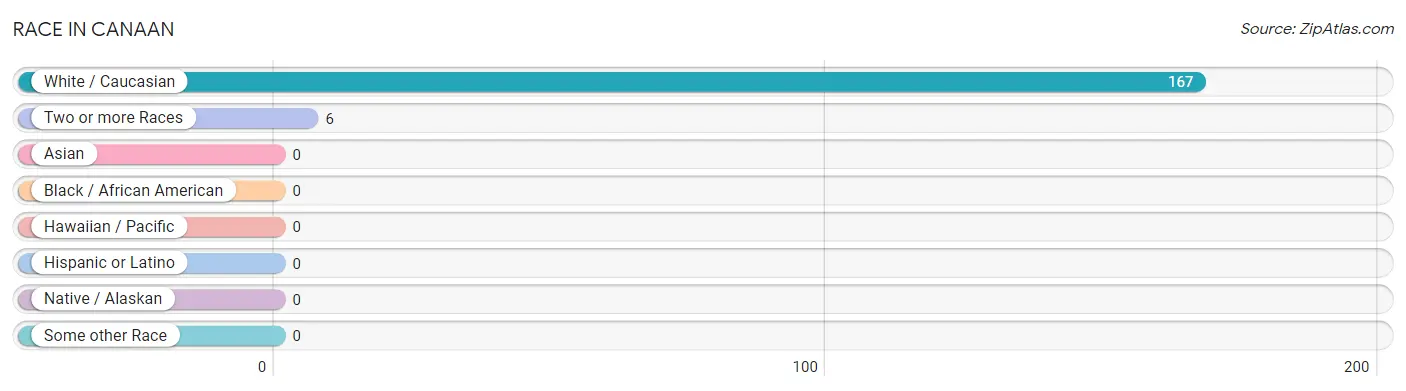
Race in Canaan
The most populous races in Canaan are White / Caucasian (167 | 96.5%), and Two or more Races (6 | 3.5%).
| Race | # Population | % Population |
| Asian | 0 | 0.0% |
| Black / African American | 0 | 0.0% |
| Hawaiian / Pacific | 0 | 0.0% |
| Hispanic or Latino | 0 | 0.0% |
| Native / Alaskan | 0 | 0.0% |
| White / Caucasian | 167 | 96.5% |
| Two or more Races | 6 | 3.5% |
| Some other Race | 0 | 0.0% |
| Total | 173 | 100.0% |
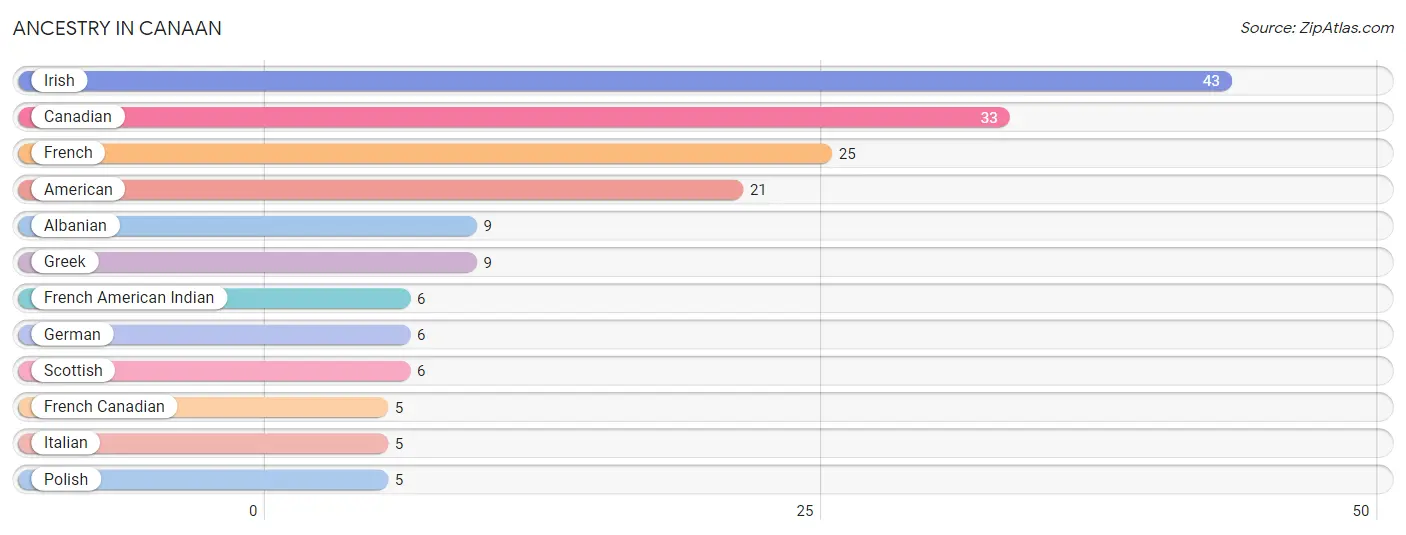
Ancestry in Canaan
The most populous ancestries reported in Canaan are Irish (43 | 24.9%), Canadian (33 | 19.1%), French (25 | 14.4%), American (21 | 12.1%), and Albanian (9 | 5.2%), together accounting for 75.7% of all Canaan residents.
| Ancestry | # Population | % Population |
| Albanian | 9 | 5.2% |
| American | 21 | 12.1% |
| Canadian | 33 | 19.1% |
| French | 25 | 14.4% |
| French American Indian | 6 | 3.5% |
| French Canadian | 5 | 2.9% |
| German | 6 | 3.5% |
| Greek | 9 | 5.2% |
| Irish | 43 | 24.9% |
| Italian | 5 | 2.9% |
| Polish | 5 | 2.9% |
| Scottish | 6 | 3.5% | View All 12 Rows |
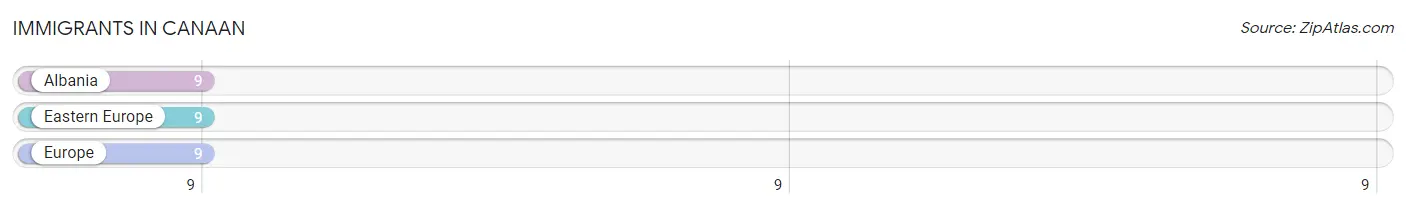
Immigrants in Canaan
The most numerous immigrant groups reported in Canaan came from Albania (9 | 5.2%), Eastern Europe (9 | 5.2%), and Europe (9 | 5.2%), together accounting for 15.6% of all Canaan residents.
| Immigration Origin | # Population | % Population |
| Albania | 9 | 5.2% |
| Eastern Europe | 9 | 5.2% |
| Europe | 9 | 5.2% | View All 3 Rows |
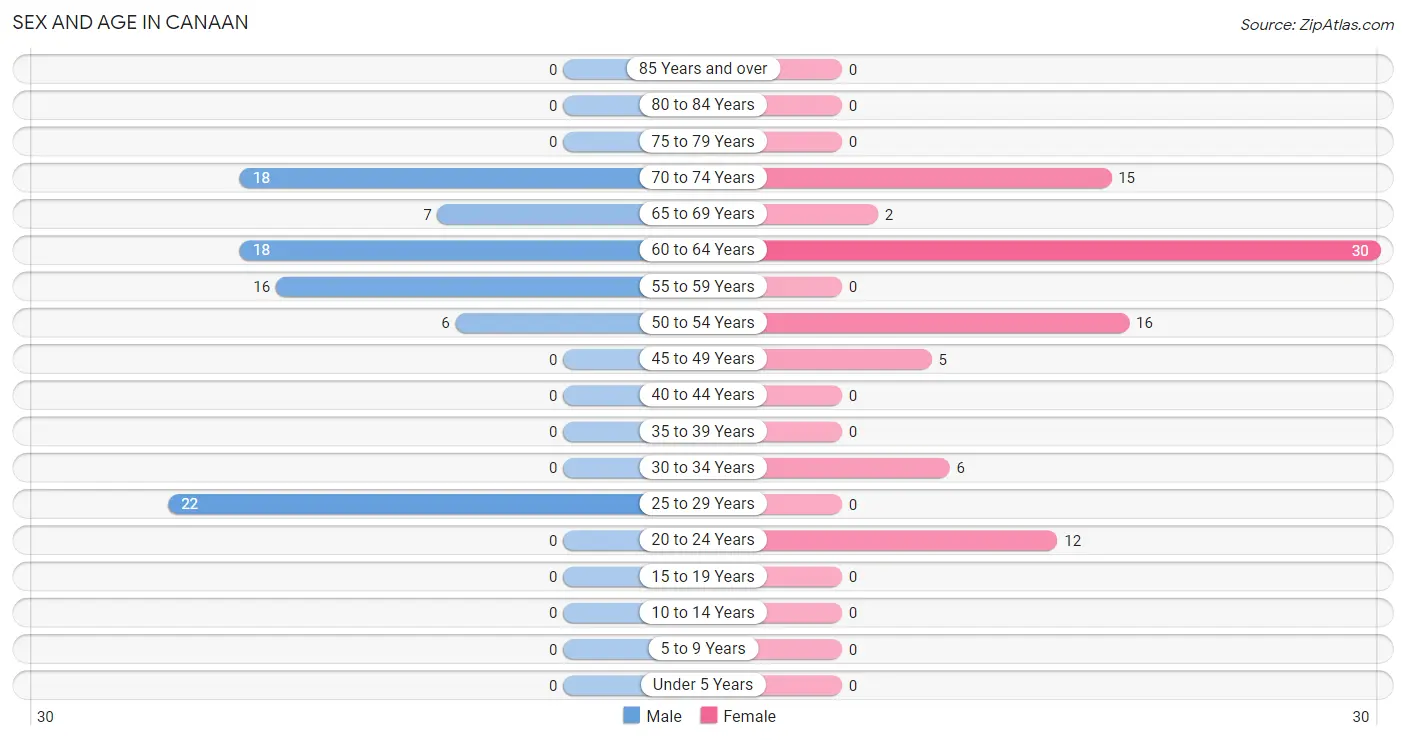
Sex and Age in Canaan
Sex and Age in Canaan
The most populous age groups in Canaan are 25 to 29 Years (22 | 25.3%) for men and 60 to 64 Years (30 | 34.9%) for women.
| Age Bracket | Male | Female |
| Under 5 Years | 0 (0.0%) | 0 (0.0%) |
| 5 to 9 Years | 0 (0.0%) | 0 (0.0%) |
| 10 to 14 Years | 0 (0.0%) | 0 (0.0%) |
| 15 to 19 Years | 0 (0.0%) | 0 (0.0%) |
| 20 to 24 Years | 0 (0.0%) | 12 (14.0%) |
| 25 to 29 Years | 22 (25.3%) | 0 (0.0%) |
| 30 to 34 Years | 0 (0.0%) | 6 (7.0%) |
| 35 to 39 Years | 0 (0.0%) | 0 (0.0%) |
| 40 to 44 Years | 0 (0.0%) | 0 (0.0%) |
| 45 to 49 Years | 0 (0.0%) | 5 (5.8%) |
| 50 to 54 Years | 6 (6.9%) | 16 (18.6%) |
| 55 to 59 Years | 16 (18.4%) | 0 (0.0%) |
| 60 to 64 Years | 18 (20.7%) | 30 (34.9%) |
| 65 to 69 Years | 7 (8.1%) | 2 (2.3%) |
| 70 to 74 Years | 18 (20.7%) | 15 (17.4%) |
| 75 to 79 Years | 0 (0.0%) | 0 (0.0%) |
| 80 to 84 Years | 0 (0.0%) | 0 (0.0%) |
| 85 Years and over | 0 (0.0%) | 0 (0.0%) |
| Total | 87 (100.0%) | 86 (100.0%) |
Families and Households in Canaan
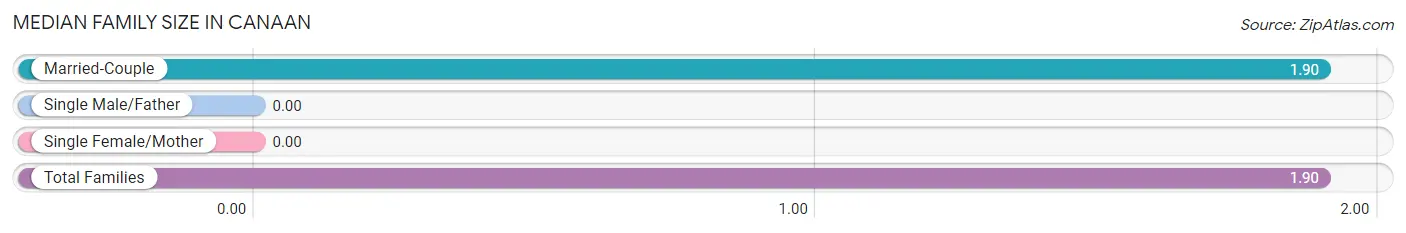
Median Family Size in Canaan
| Family Type | # Families | Family Size |
| Married-Couple | 30 (100.0%) | 1.90 |
| Single Male/Father | 0 (0.0%) | - |
| Single Female/Mother | 0 (0.0%) | - |
| Total Families | 30 (100.0%) | 1.90 |
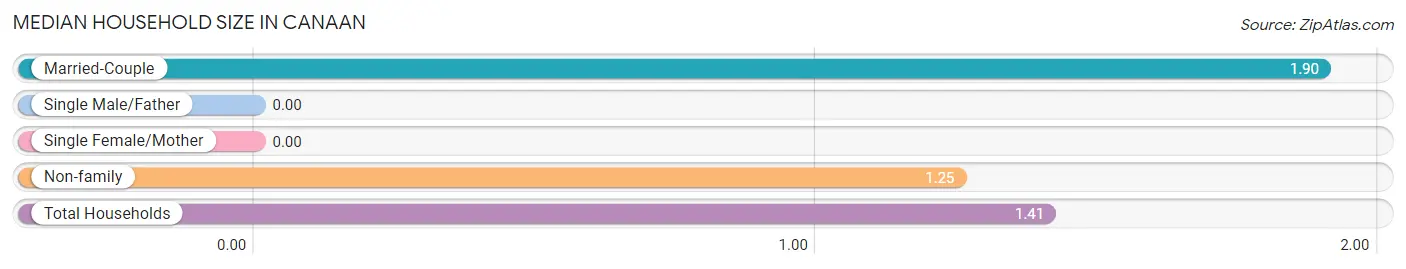
Median Household Size in Canaan
| Household Type | # Households | Household Size |
| Married-Couple | 30 (24.4%) | 1.90 |
| Single Male/Father | 0 (0.0%) | - |
| Single Female/Mother | 0 (0.0%) | - |
| Non-family | 93 (75.6%) | 1.25 |
| Total Households | 123 (100.0%) | 1.41 |
Household Size by Marriage Status in Canaan
Out of a total of 123 households in Canaan, 30 (24.4%) are family households, while 93 (75.6%) are nonfamily households. The most numerous type of family households are 2-person households, comprising 30, and the most common type of nonfamily households are 1-person households, comprising 68.
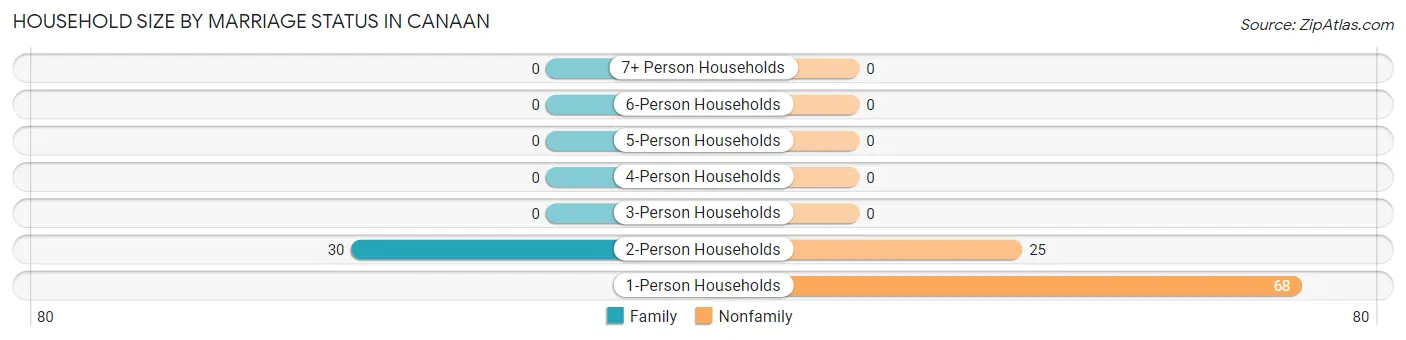
| Household Size | Family Households | Nonfamily Households |
| 1-Person Households | - | 68 (55.3%) |
| 2-Person Households | 30 (24.4%) | 25 (20.3%) |
| 3-Person Households | 0 (0.0%) | 0 (0.0%) |
| 4-Person Households | 0 (0.0%) | 0 (0.0%) |
| 5-Person Households | 0 (0.0%) | 0 (0.0%) |
| 6-Person Households | 0 (0.0%) | 0 (0.0%) |
| 7+ Person Households | 0 (0.0%) | 0 (0.0%) |
| Total | 30 (24.4%) | 93 (75.6%) |
Female Fertility in Canaan
Fertility by Age in Canaan
| Age Bracket | Women with Births | Births / 1,000 Women |
| 15 to 19 years | 0 (0.0%) | 0.0 |
| 20 to 34 years | 0 (0.0%) | 0.0 |
| 35 to 50 years | 0 (0.0%) | 0.0 |
| Total | 0 (0.0%) | 0.0 |
Fertility by Age by Marriage Status in Canaan
| Age Bracket | Married | Unmarried |
| 15 to 19 years | 0 (0.0%) | 0 (0.0%) |
| 20 to 34 years | 0 (0.0%) | 0 (0.0%) |
| 35 to 50 years | 0 (0.0%) | 0 (0.0%) |
| Total | 0 (0.0%) | 0 (0.0%) |
Fertility by Education in Canaan
| Educational Attainment | Women with Births | Births / 1,000 Women |
| Less than High School | 0 (0.0%) | 0.0 |
| High School Diploma | 0 (0.0%) | 0.0 |
| College or Associate's Degree | 0 (0.0%) | 0.0 |
| Bachelor's Degree | 0 (0.0%) | 0.0 |
| Graduate Degree | 0 (0.0%) | 0.0 |
| Total | 0 (0.0%) | 0.0 |
Fertility by Education by Marriage Status in Canaan
| Educational Attainment | Married | Unmarried |
| Less than High School | 0 (0.0%) | 0 (0.0%) |
| High School Diploma | 0 (0.0%) | 0 (0.0%) |
| College or Associate's Degree | 0 (0.0%) | 0 (0.0%) |
| Bachelor's Degree | 0 (0.0%) | 0 (0.0%) |
| Graduate Degree | 0 (0.0%) | 0 (0.0%) |
| Total | 0 (0.0%) | 0 (0.0%) |
Employment Characteristics in Canaan
Employment by Class of Employer in Canaan
Among the 118 employed individuals in Canaan, private company employees (62 | 52.5%), local government employees (29 | 24.6%), and not-for-profit organizations (18 | 15.2%) make up the most common classes of employment.
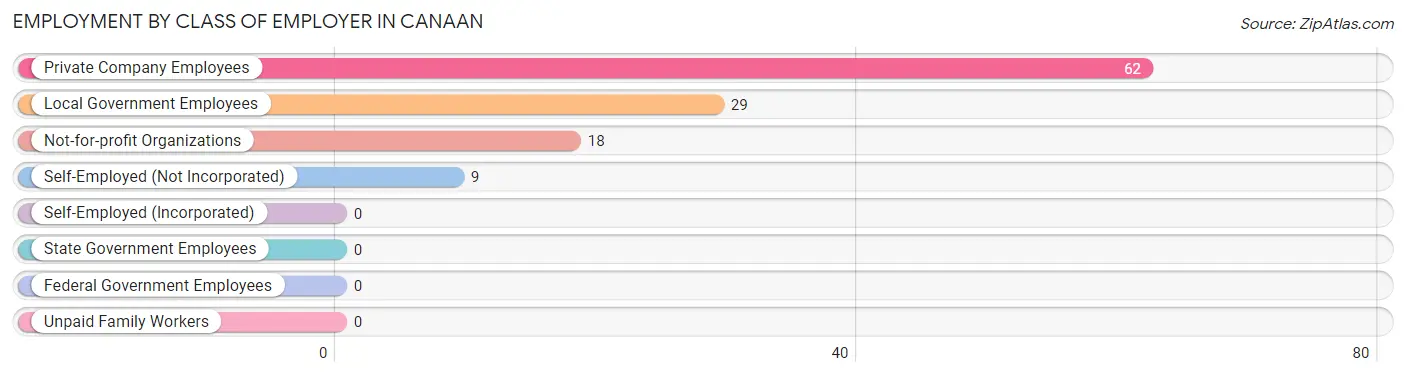
| Employer Class | # Employees | % Employees |
| Private Company Employees | 62 | 52.5% |
| Self-Employed (Incorporated) | 0 | 0.0% |
| Self-Employed (Not Incorporated) | 9 | 7.6% |
| Not-for-profit Organizations | 18 | 15.2% |
| Local Government Employees | 29 | 24.6% |
| State Government Employees | 0 | 0.0% |
| Federal Government Employees | 0 | 0.0% |
| Unpaid Family Workers | 0 | 0.0% |
| Total | 118 | 100.0% |
Employment Status by Age in Canaan
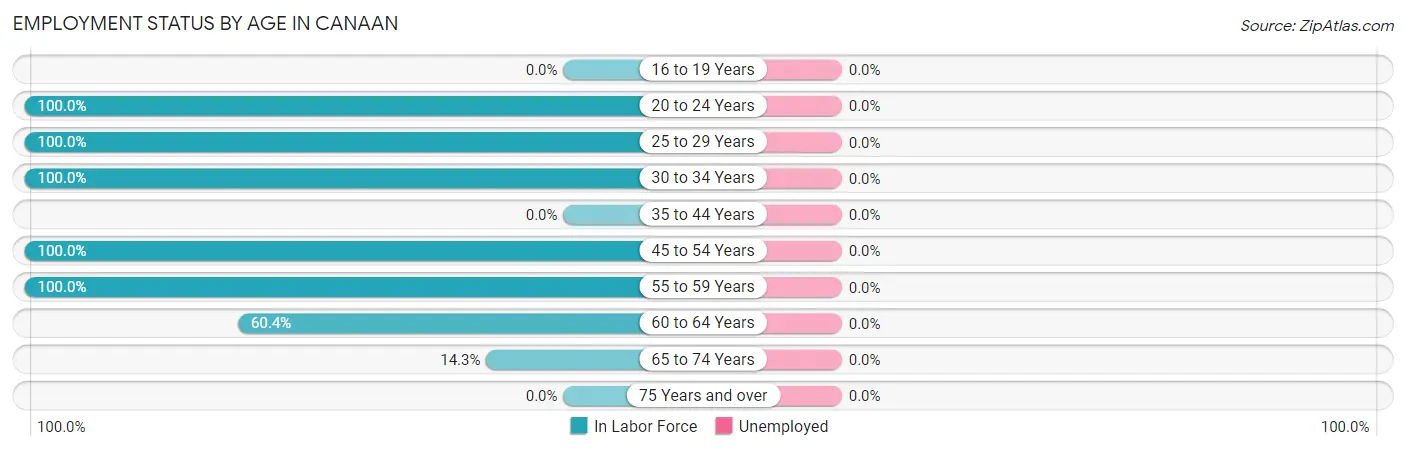
| Age Bracket | In Labor Force | Unemployed |
| 16 to 19 Years | 0 (0.0%) | 0 (0.0%) |
| 20 to 24 Years | 12 (100.0%) | 0 (0.0%) |
| 25 to 29 Years | 22 (100.0%) | 0 (0.0%) |
| 30 to 34 Years | 6 (100.0%) | 0 (0.0%) |
| 35 to 44 Years | 0 (0.0%) | 0 (0.0%) |
| 45 to 54 Years | 27 (100.0%) | 0 (0.0%) |
| 55 to 59 Years | 16 (100.0%) | 0 (0.0%) |
| 60 to 64 Years | 29 (60.4%) | 0 (0.0%) |
| 65 to 74 Years | 6 (14.3%) | 0 (0.0%) |
| 75 Years and over | 0 (0.0%) | 0 (0.0%) |
| Total | 118 (68.2%) | 0 (0.0%) |
Employment Status by Educational Attainment in Canaan
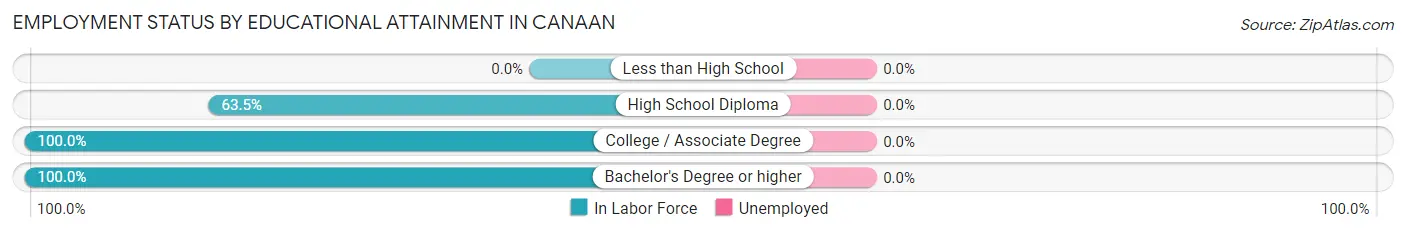
| Educational Attainment | In Labor Force | Unemployed |
| Less than High School | 0 (0.0%) | 0 (0.0%) |
| High School Diploma | 33 (63.5%) | 0 (0.0%) |
| College / Associate Degree | 38 (100.0%) | 0 (0.0%) |
| Bachelor's Degree or higher | 29 (100.0%) | 0 (0.0%) |
| Total | 100 (84.0%) | 0 (0.0%) |
Employment Occupations by Sex in Canaan
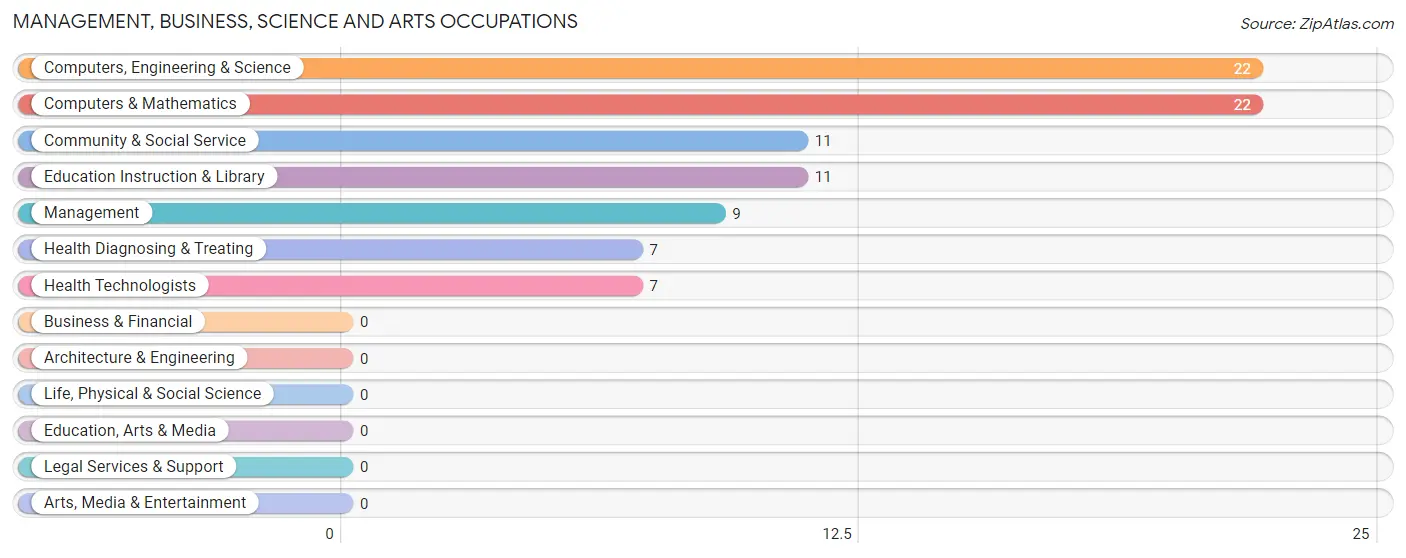
Management, Business, Science and Arts Occupations
The most common Management, Business, Science and Arts occupations in Canaan are Computers, Engineering & Science (22 | 18.6%), Computers & Mathematics (22 | 18.6%), Community & Social Service (11 | 9.3%), Education Instruction & Library (11 | 9.3%), and Management (9 | 7.6%).
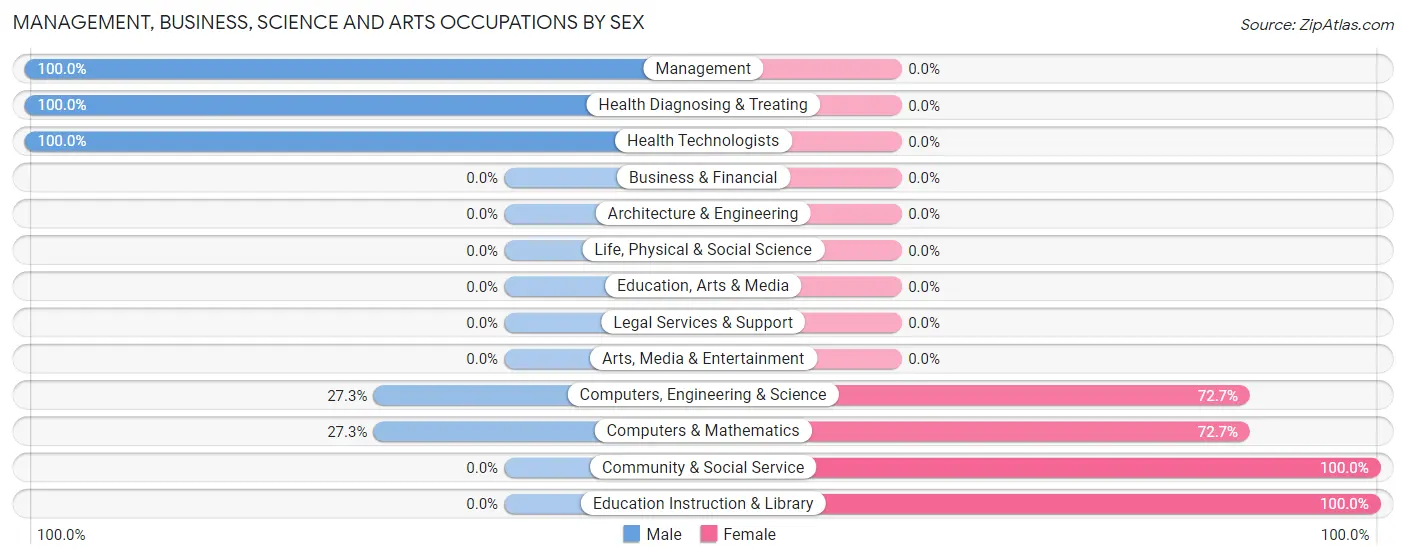
Management, Business, Science and Arts Occupations by Sex
Within the Management, Business, Science and Arts occupations in Canaan, the most male-oriented occupations are Management (100.0%), Health Diagnosing & Treating (100.0%), and Health Technologists (100.0%), while the most female-oriented occupations are Community & Social Service (100.0%), Education Instruction & Library (100.0%), and Computers, Engineering & Science (72.7%).
| Occupation | Male | Female |
| Management | 9 (100.0%) | 0 (0.0%) |
| Business & Financial | 0 (0.0%) | 0 (0.0%) |
| Computers, Engineering & Science | 6 (27.3%) | 16 (72.7%) |
| Computers & Mathematics | 6 (27.3%) | 16 (72.7%) |
| Architecture & Engineering | 0 (0.0%) | 0 (0.0%) |
| Life, Physical & Social Science | 0 (0.0%) | 0 (0.0%) |
| Community & Social Service | 0 (0.0%) | 11 (100.0%) |
| Education, Arts & Media | 0 (0.0%) | 0 (0.0%) |
| Legal Services & Support | 0 (0.0%) | 0 (0.0%) |
| Education Instruction & Library | 0 (0.0%) | 11 (100.0%) |
| Arts, Media & Entertainment | 0 (0.0%) | 0 (0.0%) |
| Health Diagnosing & Treating | 7 (100.0%) | 0 (0.0%) |
| Health Technologists | 7 (100.0%) | 0 (0.0%) |
| Total (Category) | 22 (44.9%) | 27 (55.1%) |
| Total (Overall) | 68 (57.6%) | 50 (42.4%) |
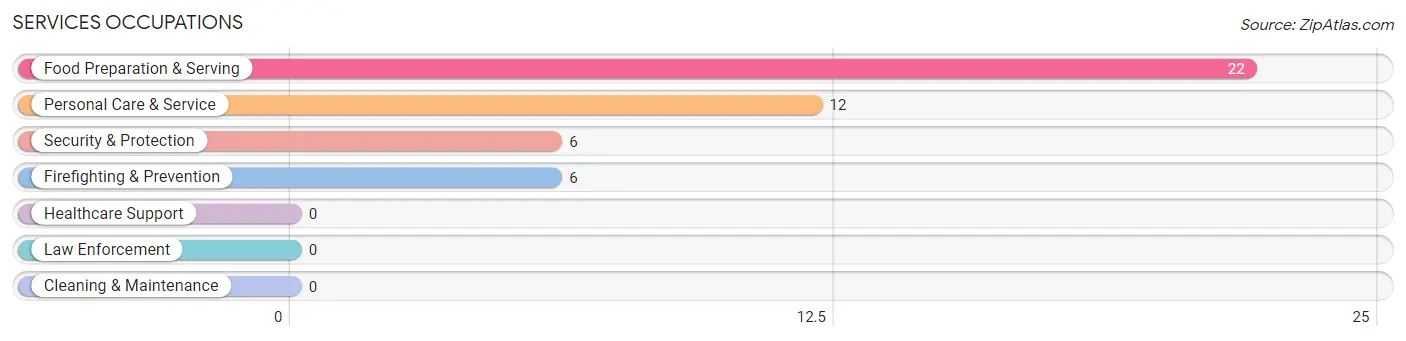
Services Occupations
The most common Services occupations in Canaan are Food Preparation & Serving (22 | 18.6%), Personal Care & Service (12 | 10.2%), Security & Protection (6 | 5.1%), and Firefighting & Prevention (6 | 5.1%).
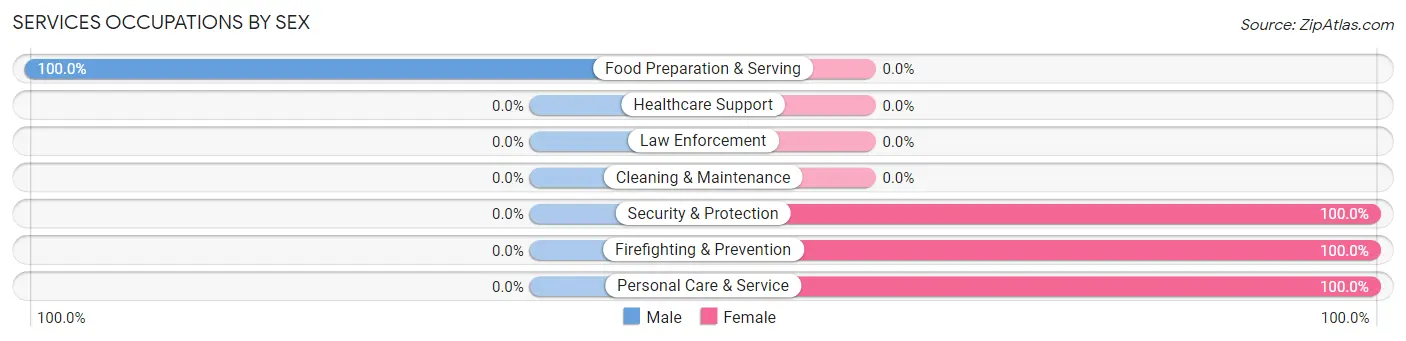
Services Occupations by Sex
| Occupation | Male | Female |
| Healthcare Support | 0 (0.0%) | 0 (0.0%) |
| Security & Protection | 0 (0.0%) | 6 (100.0%) |
| Firefighting & Prevention | 0 (0.0%) | 6 (100.0%) |
| Law Enforcement | 0 (0.0%) | 0 (0.0%) |
| Food Preparation & Serving | 22 (100.0%) | 0 (0.0%) |
| Cleaning & Maintenance | 0 (0.0%) | 0 (0.0%) |
| Personal Care & Service | 0 (0.0%) | 12 (100.0%) |
| Total (Category) | 22 (55.0%) | 18 (45.0%) |
| Total (Overall) | 68 (57.6%) | 50 (42.4%) |
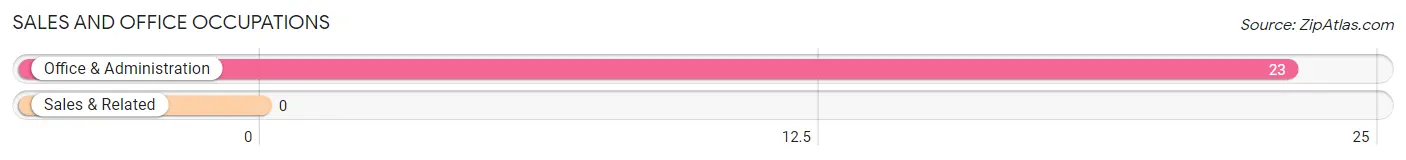
Sales and Office Occupations
The most common Sales and Office occupations in Canaan are , and Office & Administration (23 | 19.5%).
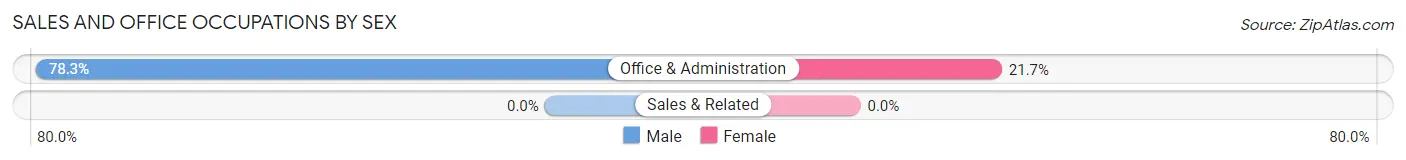
Sales and Office Occupations by Sex
| Occupation | Male | Female |
| Sales & Related | 0 (0.0%) | 0 (0.0%) |
| Office & Administration | 18 (78.3%) | 5 (21.7%) |
| Total (Category) | 18 (78.3%) | 5 (21.7%) |
| Total (Overall) | 68 (57.6%) | 50 (42.4%) |
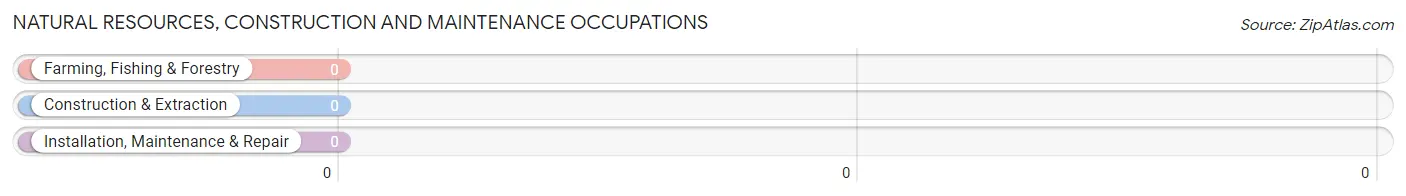
Natural Resources, Construction and Maintenance Occupations
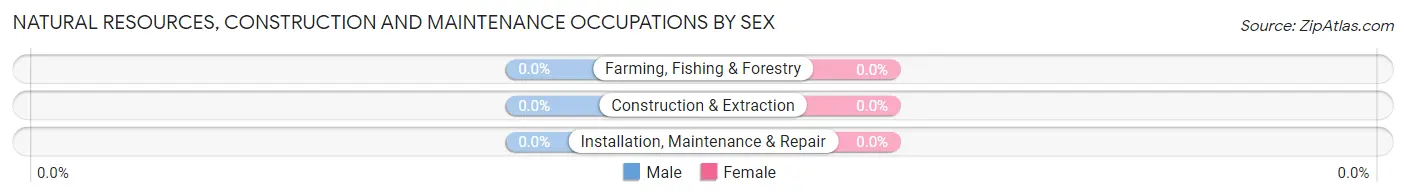
Natural Resources, Construction and Maintenance Occupations by Sex
| Occupation | Male | Female |
| Farming, Fishing & Forestry | 0 (0.0%) | 0 (0.0%) |
| Construction & Extraction | 0 (0.0%) | 0 (0.0%) |
| Installation, Maintenance & Repair | 0 (0.0%) | 0 (0.0%) |
| Total (Category) | 0 (0.0%) | 0 (0.0%) |
| Total (Overall) | 68 (57.6%) | 50 (42.4%) |
Production, Transportation and Moving Occupations
The most common Production, Transportation and Moving occupations in Canaan are , and Transportation (6 | 5.1%).
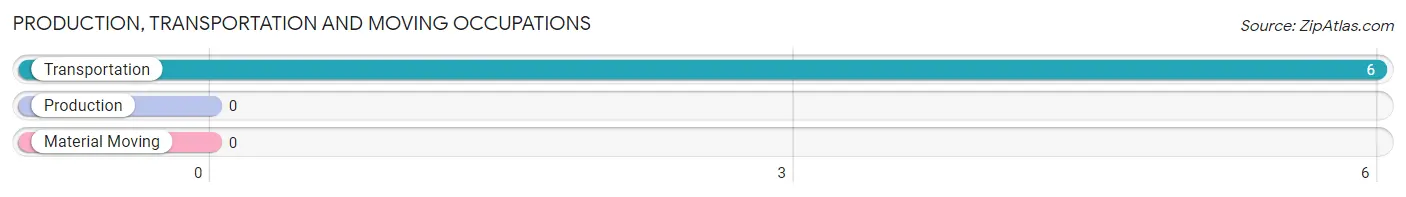
Production, Transportation and Moving Occupations by Sex
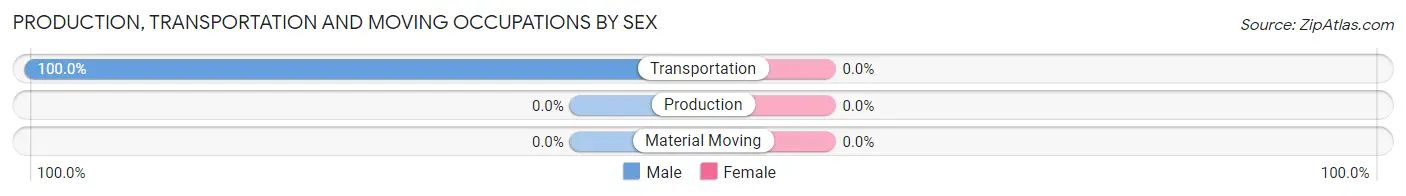
| Occupation | Male | Female |
| Production | 0 (0.0%) | 0 (0.0%) |
| Transportation | 6 (100.0%) | 0 (0.0%) |
| Material Moving | 0 (0.0%) | 0 (0.0%) |
| Total (Category) | 6 (100.0%) | 0 (0.0%) |
| Total (Overall) | 68 (57.6%) | 50 (42.4%) |
Employment Industries by Sex in Canaan
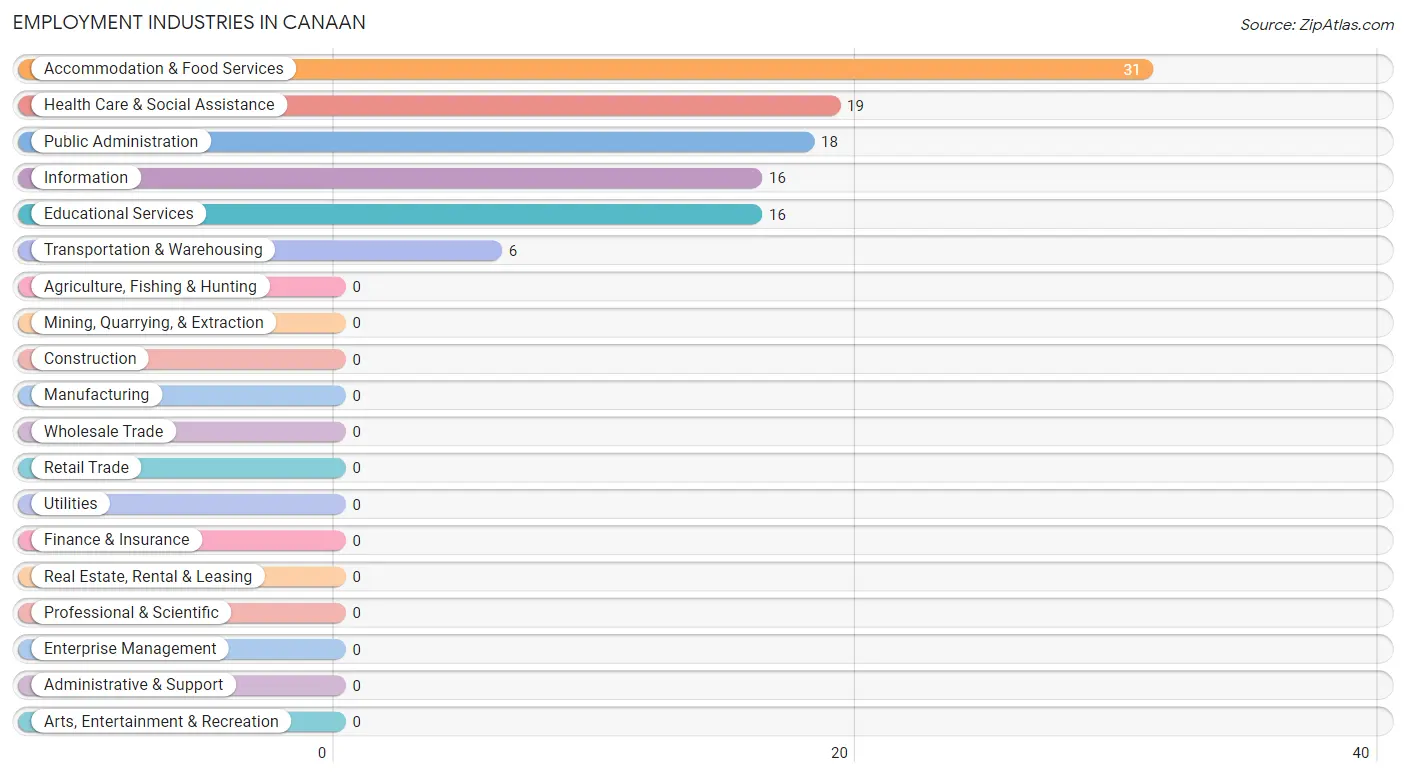
Employment Industries in Canaan
The major employment industries in Canaan include Accommodation & Food Services (31 | 26.3%), Health Care & Social Assistance (19 | 16.1%), Public Administration (18 | 15.2%), Information (16 | 13.6%), and Educational Services (16 | 13.6%).
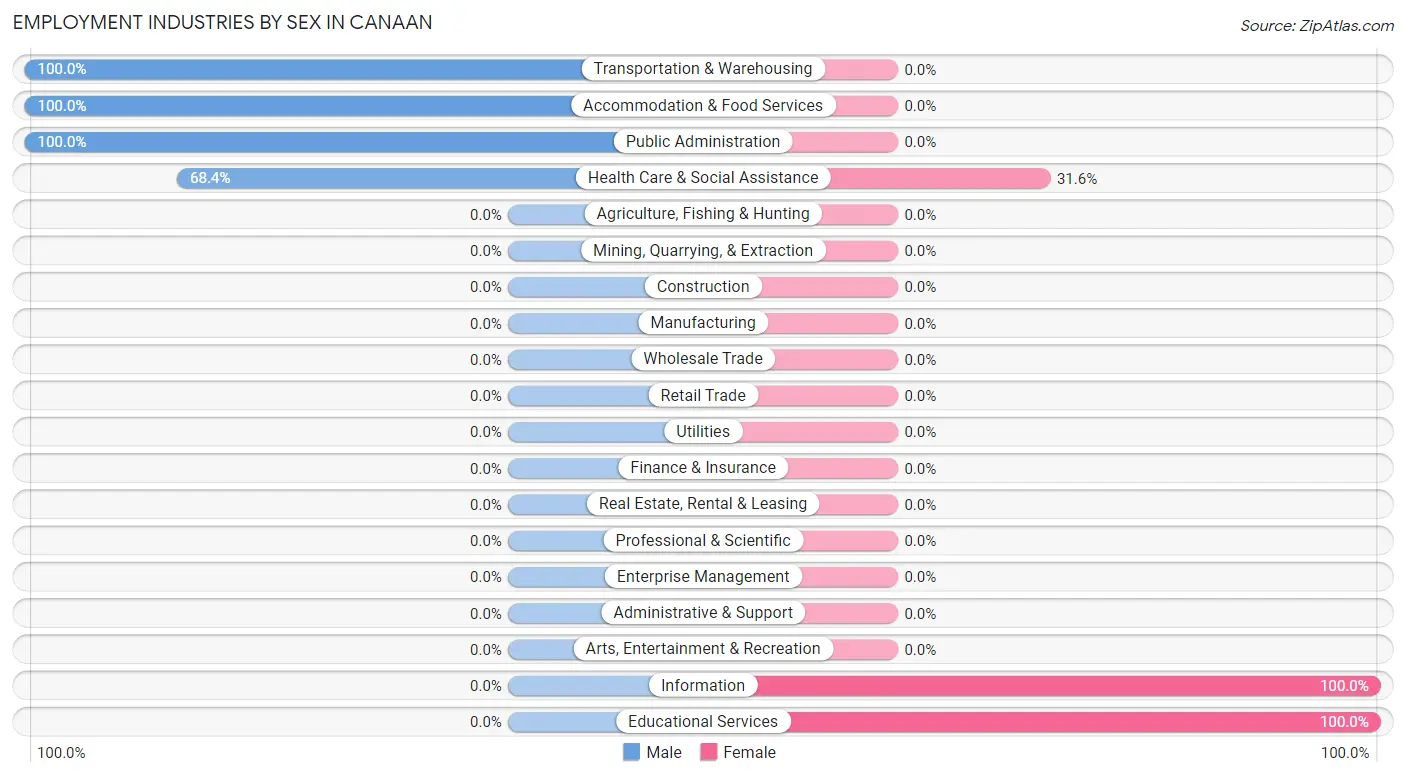
Employment Industries by Sex in Canaan
The Canaan industries that see more men than women are Transportation & Warehousing (100.0%), Accommodation & Food Services (100.0%), and Public Administration (100.0%), whereas the industries that tend to have a higher number of women are Information (100.0%), Educational Services (100.0%), and Health Care & Social Assistance (31.6%).
| Industry | Male | Female |
| Agriculture, Fishing & Hunting | 0 (0.0%) | 0 (0.0%) |
| Mining, Quarrying, & Extraction | 0 (0.0%) | 0 (0.0%) |
| Construction | 0 (0.0%) | 0 (0.0%) |
| Manufacturing | 0 (0.0%) | 0 (0.0%) |
| Wholesale Trade | 0 (0.0%) | 0 (0.0%) |
| Retail Trade | 0 (0.0%) | 0 (0.0%) |
| Transportation & Warehousing | 6 (100.0%) | 0 (0.0%) |
| Utilities | 0 (0.0%) | 0 (0.0%) |
| Information | 0 (0.0%) | 16 (100.0%) |
| Finance & Insurance | 0 (0.0%) | 0 (0.0%) |
| Real Estate, Rental & Leasing | 0 (0.0%) | 0 (0.0%) |
| Professional & Scientific | 0 (0.0%) | 0 (0.0%) |
| Enterprise Management | 0 (0.0%) | 0 (0.0%) |
| Administrative & Support | 0 (0.0%) | 0 (0.0%) |
| Educational Services | 0 (0.0%) | 16 (100.0%) |
| Health Care & Social Assistance | 13 (68.4%) | 6 (31.6%) |
| Arts, Entertainment & Recreation | 0 (0.0%) | 0 (0.0%) |
| Accommodation & Food Services | 31 (100.0%) | 0 (0.0%) |
| Public Administration | 18 (100.0%) | 0 (0.0%) |
| Total | 68 (57.6%) | 50 (42.4%) |
Education in Canaan
School Enrollment in Canaan
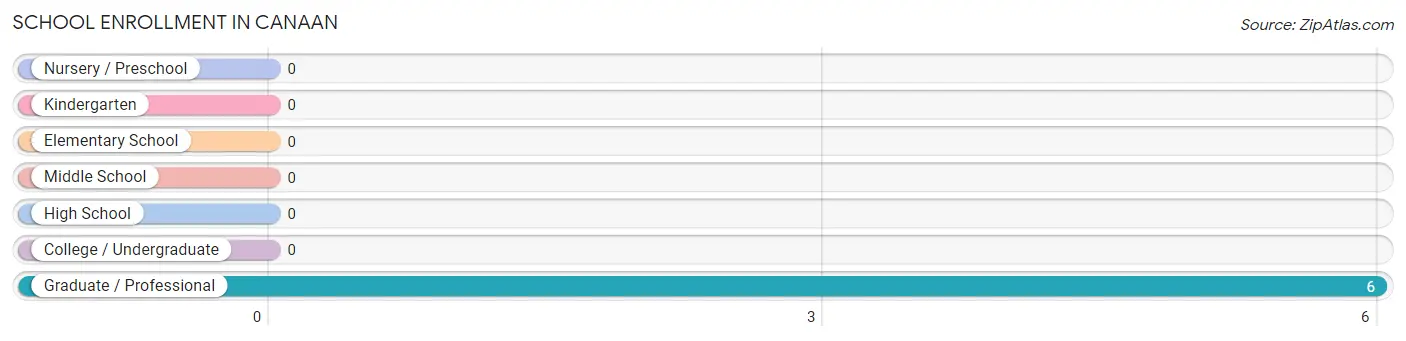
| School Level | # Students | % Students |
| Nursery / Preschool | 0 | 0.0% |
| Kindergarten | 0 | 0.0% |
| Elementary School | 0 | 0.0% |
| Middle School | 0 | 0.0% |
| High School | 0 | 0.0% |
| College / Undergraduate | 0 | 0.0% |
| Graduate / Professional | 6 | 100.0% |
| Total | 6 | 100.0% |
School Enrollment by Age by Funding Source in Canaan
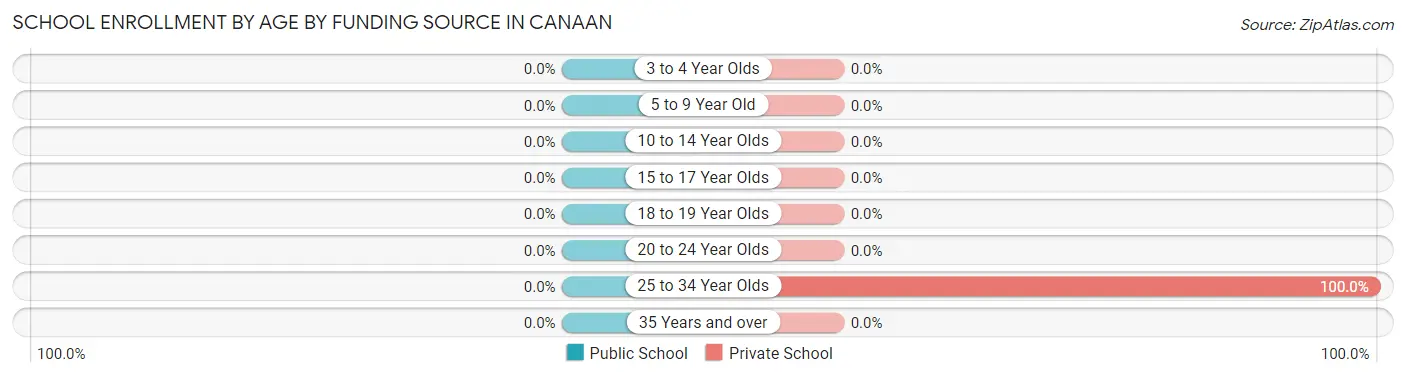
| Age Bracket | Public School | Private School |
| 3 to 4 Year Olds | 0 (0.0%) | 0 (0.0%) |
| 5 to 9 Year Old | 0 (0.0%) | 0 (0.0%) |
| 10 to 14 Year Olds | 0 (0.0%) | 0 (0.0%) |
| 15 to 17 Year Olds | 0 (0.0%) | 0 (0.0%) |
| 18 to 19 Year Olds | 0 (0.0%) | 0 (0.0%) |
| 20 to 24 Year Olds | 0 (0.0%) | 0 (0.0%) |
| 25 to 34 Year Olds | 0 (0.0%) | 6 (100.0%) |
| 35 Years and over | 0 (0.0%) | 0 (0.0%) |
| Total | 0 (0.0%) | 6 (100.0%) |
Educational Attainment by Field of Study in Canaan
Education (11 | 31.4%), science & technology (7 | 20.0%), computers & mathematics (6 | 17.1%), psychology (6 | 17.1%), and arts & humanities (5 | 14.3%) are the most common fields of study among 35 individuals in Canaan who have obtained a bachelor's degree or higher.
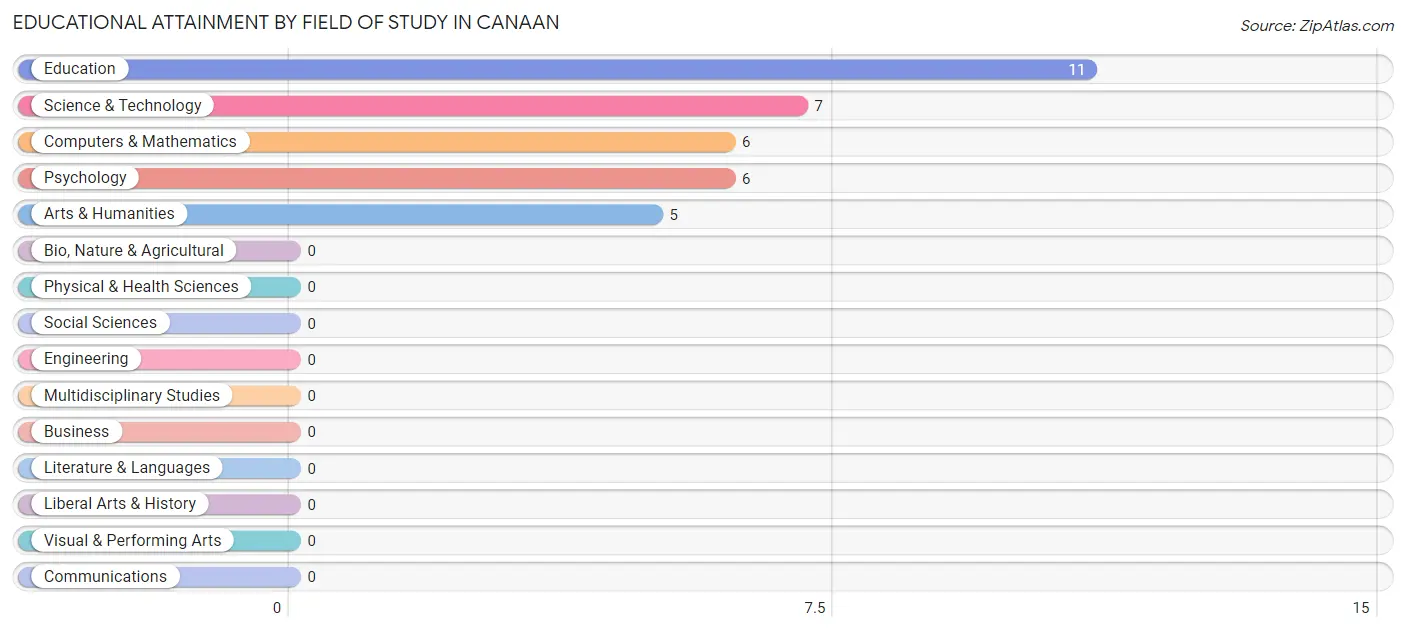
| Field of Study | # Graduates | % Graduates |
| Computers & Mathematics | 6 | 17.1% |
| Bio, Nature & Agricultural | 0 | 0.0% |
| Physical & Health Sciences | 0 | 0.0% |
| Psychology | 6 | 17.1% |
| Social Sciences | 0 | 0.0% |
| Engineering | 0 | 0.0% |
| Multidisciplinary Studies | 0 | 0.0% |
| Science & Technology | 7 | 20.0% |
| Business | 0 | 0.0% |
| Education | 11 | 31.4% |
| Literature & Languages | 0 | 0.0% |
| Liberal Arts & History | 0 | 0.0% |
| Visual & Performing Arts | 0 | 0.0% |
| Communications | 0 | 0.0% |
| Arts & Humanities | 5 | 14.3% |
| Total | 35 | 100.0% |
Transportation & Commute in Canaan
Vehicle Availability by Sex in Canaan
The most prevalent vehicle ownership categories in Canaan are males with 3 vehicles (25, accounting for 36.8%) and females with 3 vehicles (22, making up 50.0%).
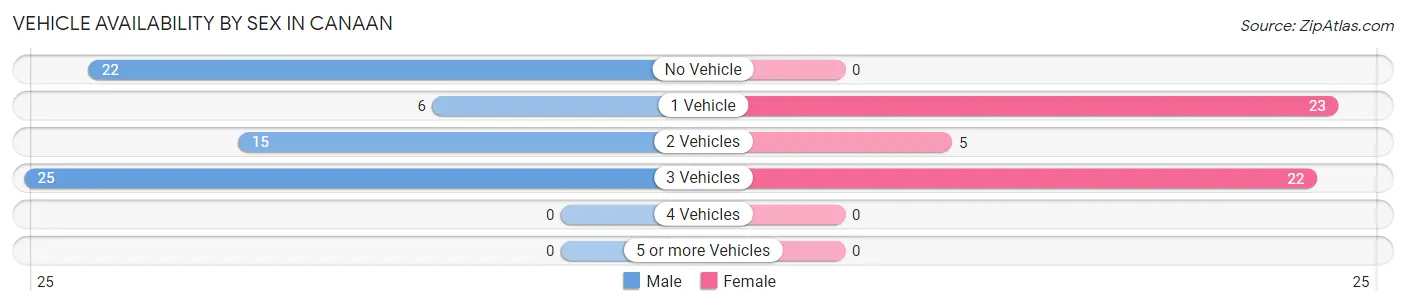
| Vehicles Available | Male | Female |
| No Vehicle | 22 (32.4%) | 0 (0.0%) |
| 1 Vehicle | 6 (8.8%) | 23 (46.0%) |
| 2 Vehicles | 15 (22.1%) | 5 (10.0%) |
| 3 Vehicles | 25 (36.8%) | 22 (44.0%) |
| 4 Vehicles | 0 (0.0%) | 0 (0.0%) |
| 5 or more Vehicles | 0 (0.0%) | 0 (0.0%) |
| Total | 68 (100.0%) | 50 (100.0%) |
Commute Time in Canaan
The most frequently occuring commute durations in Canaan are 30 to 34 minutes (52 commuters, 47.7%), 10 to 14 minutes (38 commuters, 34.9%), and 25 to 29 minutes (13 commuters, 11.9%).
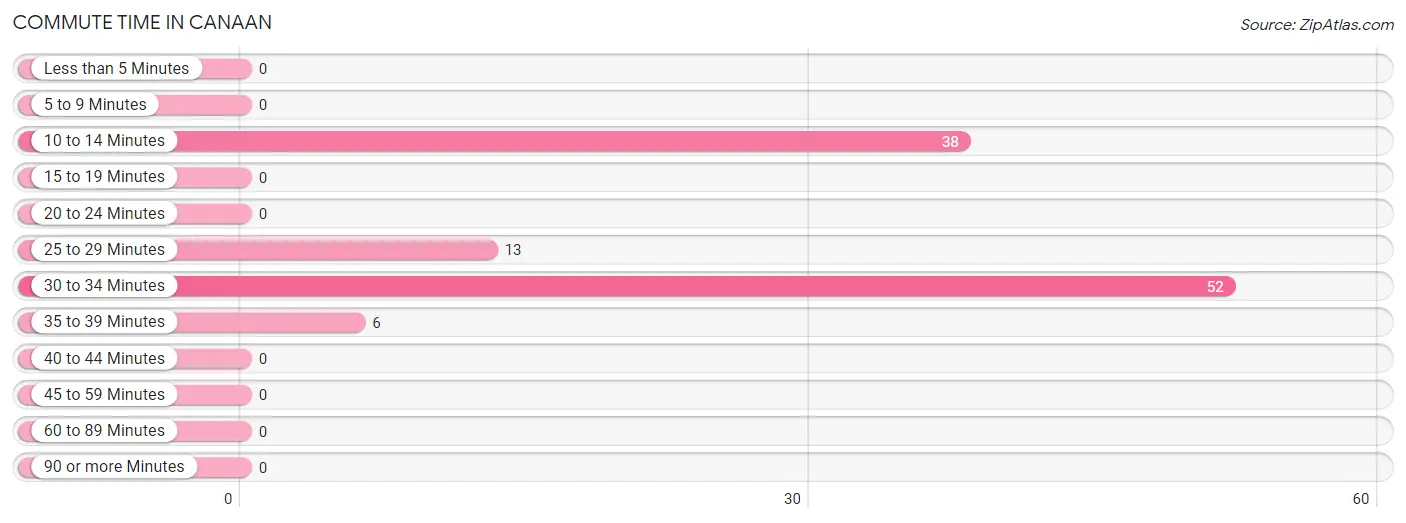
| Commute Time | # Commuters | % Commuters |
| Less than 5 Minutes | 0 | 0.0% |
| 5 to 9 Minutes | 0 | 0.0% |
| 10 to 14 Minutes | 38 | 34.9% |
| 15 to 19 Minutes | 0 | 0.0% |
| 20 to 24 Minutes | 0 | 0.0% |
| 25 to 29 Minutes | 13 | 11.9% |
| 30 to 34 Minutes | 52 | 47.7% |
| 35 to 39 Minutes | 6 | 5.5% |
| 40 to 44 Minutes | 0 | 0.0% |
| 45 to 59 Minutes | 0 | 0.0% |
| 60 to 89 Minutes | 0 | 0.0% |
| 90 or more Minutes | 0 | 0.0% |
Commute Time by Sex in Canaan
The most common commute times in Canaan are 30 to 34 minutes (24 commuters, 40.7%) for males and 30 to 34 minutes (28 commuters, 56.0%) for females.
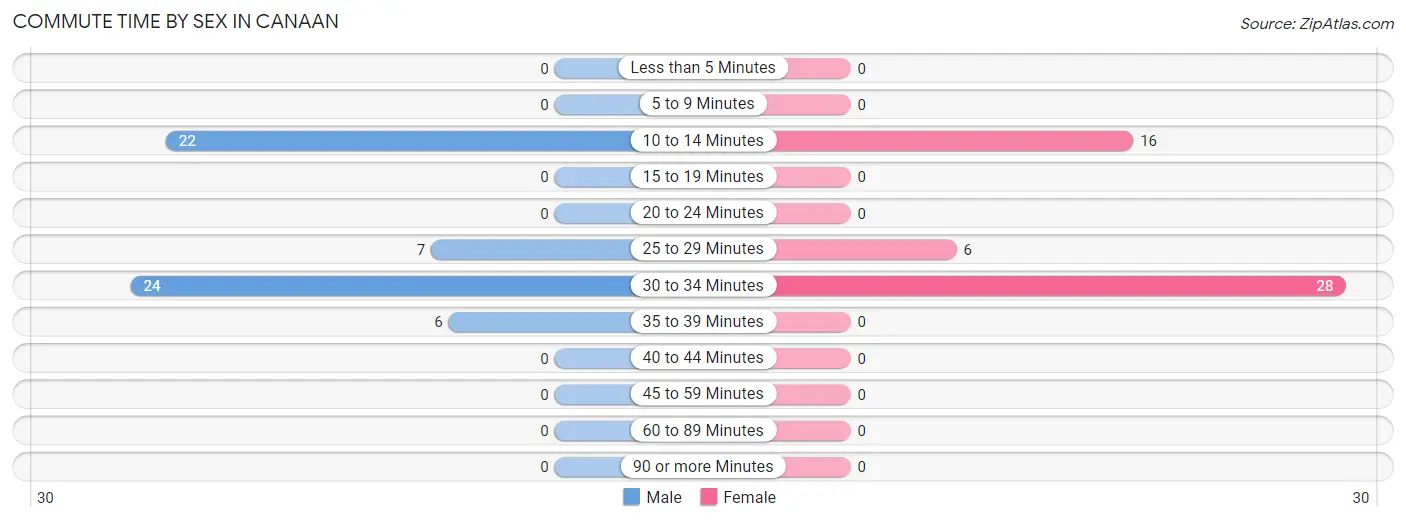
| Commute Time | Male | Female |
| Less than 5 Minutes | 0 (0.0%) | 0 (0.0%) |
| 5 to 9 Minutes | 0 (0.0%) | 0 (0.0%) |
| 10 to 14 Minutes | 22 (37.3%) | 16 (32.0%) |
| 15 to 19 Minutes | 0 (0.0%) | 0 (0.0%) |
| 20 to 24 Minutes | 0 (0.0%) | 0 (0.0%) |
| 25 to 29 Minutes | 7 (11.9%) | 6 (12.0%) |
| 30 to 34 Minutes | 24 (40.7%) | 28 (56.0%) |
| 35 to 39 Minutes | 6 (10.2%) | 0 (0.0%) |
| 40 to 44 Minutes | 0 (0.0%) | 0 (0.0%) |
| 45 to 59 Minutes | 0 (0.0%) | 0 (0.0%) |
| 60 to 89 Minutes | 0 (0.0%) | 0 (0.0%) |
| 90 or more Minutes | 0 (0.0%) | 0 (0.0%) |
Time of Departure to Work by Sex in Canaan
The most frequent times of departure to work in Canaan are 4:00 PM to 11:59 PM (22, 37.3%) for males and 7:30 AM to 7:59 AM (17, 34.0%) for females.
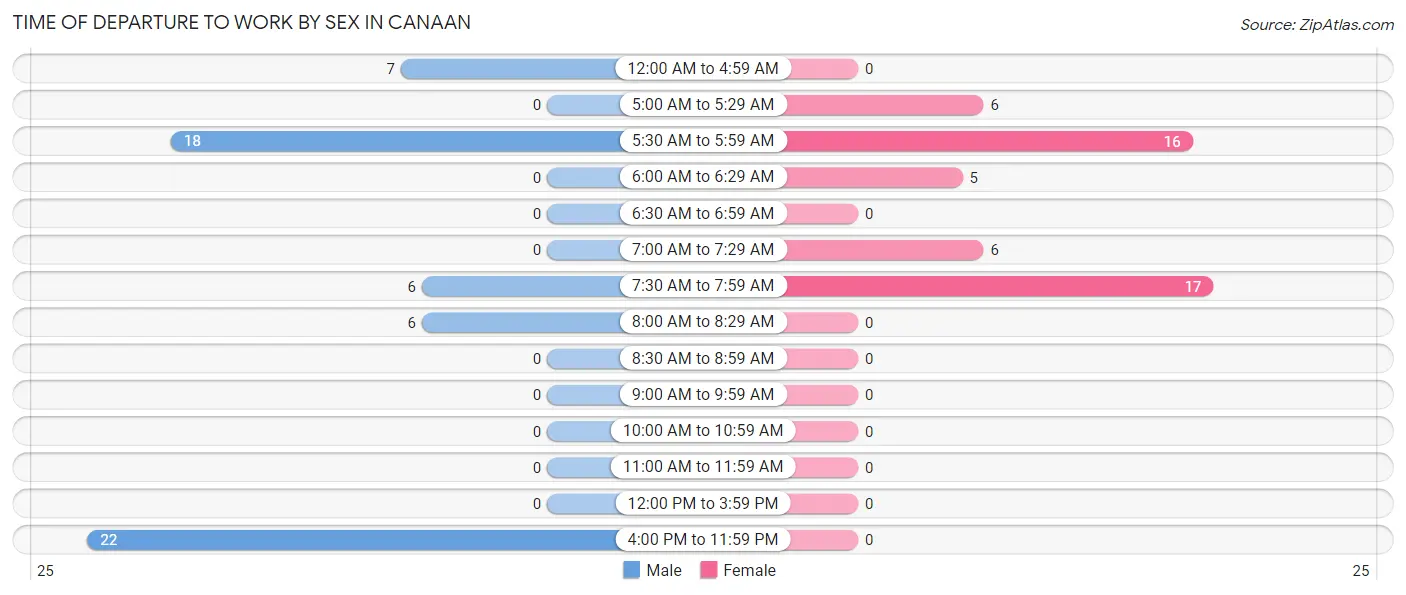
| Time of Departure | Male | Female |
| 12:00 AM to 4:59 AM | 7 (11.9%) | 0 (0.0%) |
| 5:00 AM to 5:29 AM | 0 (0.0%) | 6 (12.0%) |
| 5:30 AM to 5:59 AM | 18 (30.5%) | 16 (32.0%) |
| 6:00 AM to 6:29 AM | 0 (0.0%) | 5 (10.0%) |
| 6:30 AM to 6:59 AM | 0 (0.0%) | 0 (0.0%) |
| 7:00 AM to 7:29 AM | 0 (0.0%) | 6 (12.0%) |
| 7:30 AM to 7:59 AM | 6 (10.2%) | 17 (34.0%) |
| 8:00 AM to 8:29 AM | 6 (10.2%) | 0 (0.0%) |
| 8:30 AM to 8:59 AM | 0 (0.0%) | 0 (0.0%) |
| 9:00 AM to 9:59 AM | 0 (0.0%) | 0 (0.0%) |
| 10:00 AM to 10:59 AM | 0 (0.0%) | 0 (0.0%) |
| 11:00 AM to 11:59 AM | 0 (0.0%) | 0 (0.0%) |
| 12:00 PM to 3:59 PM | 0 (0.0%) | 0 (0.0%) |
| 4:00 PM to 11:59 PM | 22 (37.3%) | 0 (0.0%) |
| Total | 59 (100.0%) | 50 (100.0%) |
Housing Occupancy in Canaan
Occupancy by Ownership in Canaan
Of the total 123 dwellings in Canaan, owner-occupied units account for 75 (61.0%), while renter-occupied units make up 48 (39.0%).
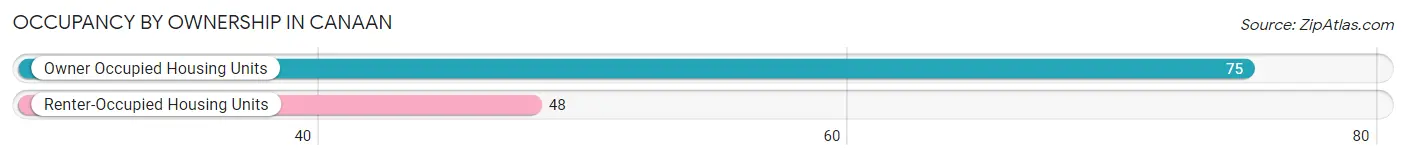
| Occupancy | # Housing Units | % Housing Units |
| Owner Occupied Housing Units | 75 | 61.0% |
| Renter-Occupied Housing Units | 48 | 39.0% |
| Total Occupied Housing Units | 123 | 100.0% |
Occupancy by Household Size in Canaan
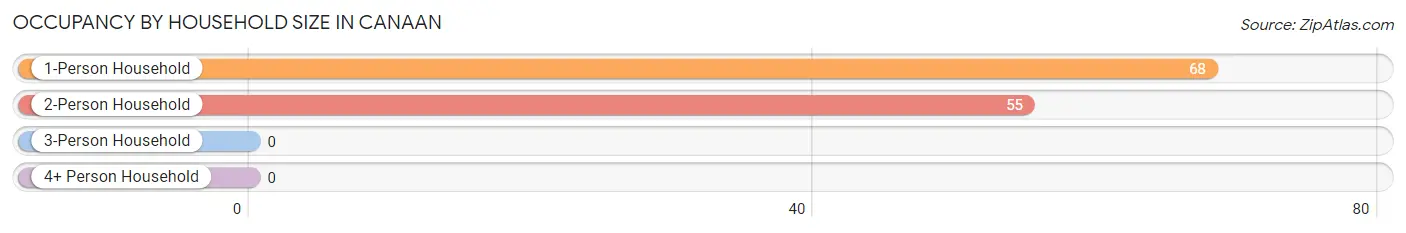
| Household Size | # Housing Units | % Housing Units |
| 1-Person Household | 68 | 55.3% |
| 2-Person Household | 55 | 44.7% |
| 3-Person Household | 0 | 0.0% |
| 4+ Person Household | 0 | 0.0% |
| Total Housing Units | 123 | 100.0% |
Occupancy by Ownership by Household Size in Canaan
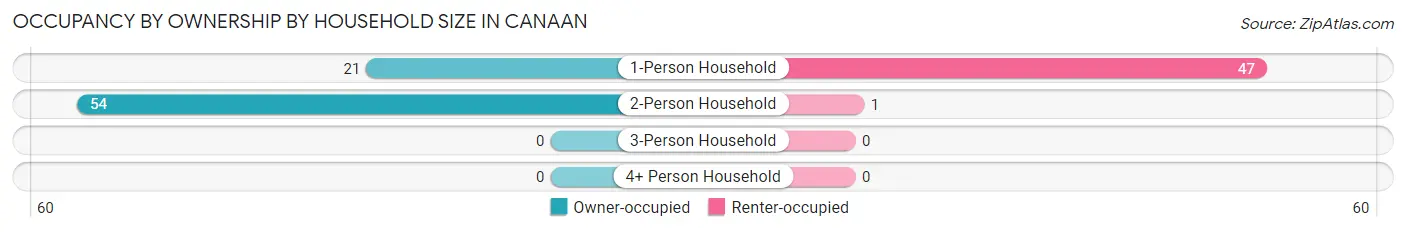
| Household Size | Owner-occupied | Renter-occupied |
| 1-Person Household | 21 (30.9%) | 47 (69.1%) |
| 2-Person Household | 54 (98.2%) | 1 (1.8%) |
| 3-Person Household | 0 (0.0%) | 0 (0.0%) |
| 4+ Person Household | 0 (0.0%) | 0 (0.0%) |
| Total Housing Units | 75 (61.0%) | 48 (39.0%) |
Occupancy by Educational Attainment in Canaan
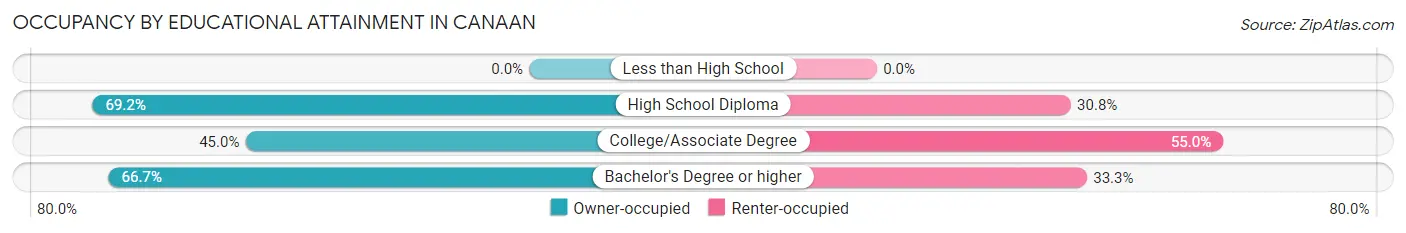
| Household Size | Owner-occupied | Renter-occupied |
| Less than High School | 0 (0.0%) | 0 (0.0%) |
| High School Diploma | 45 (69.2%) | 20 (30.8%) |
| College/Associate Degree | 18 (45.0%) | 22 (55.0%) |
| Bachelor's Degree or higher | 12 (66.7%) | 6 (33.3%) |
Occupancy by Age of Householder in Canaan
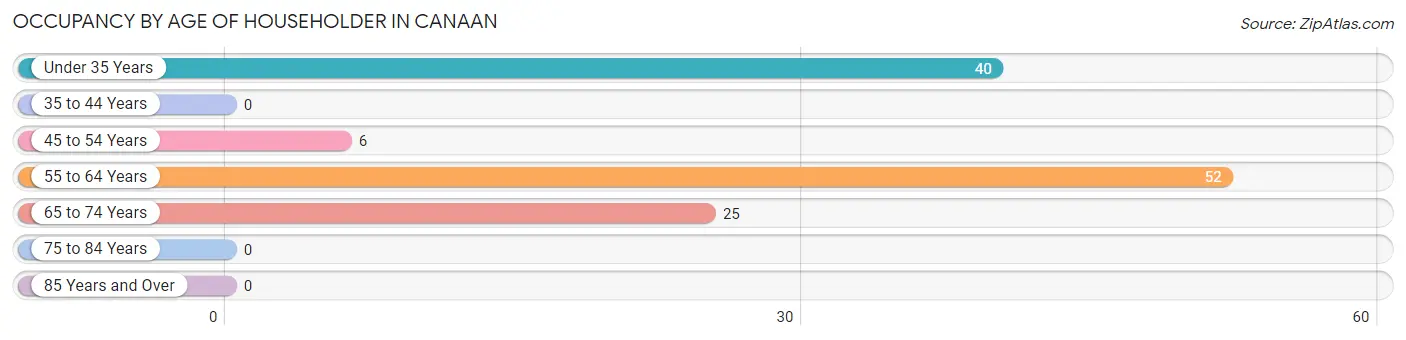
| Age Bracket | # Households | % Households |
| Under 35 Years | 40 | 32.5% |
| 35 to 44 Years | 0 | 0.0% |
| 45 to 54 Years | 6 | 4.9% |
| 55 to 64 Years | 52 | 42.3% |
| 65 to 74 Years | 25 | 20.3% |
| 75 to 84 Years | 0 | 0.0% |
| 85 Years and Over | 0 | 0.0% |
| Total | 123 | 100.0% |
Housing Finances in Canaan
Median Income by Occupancy in Canaan
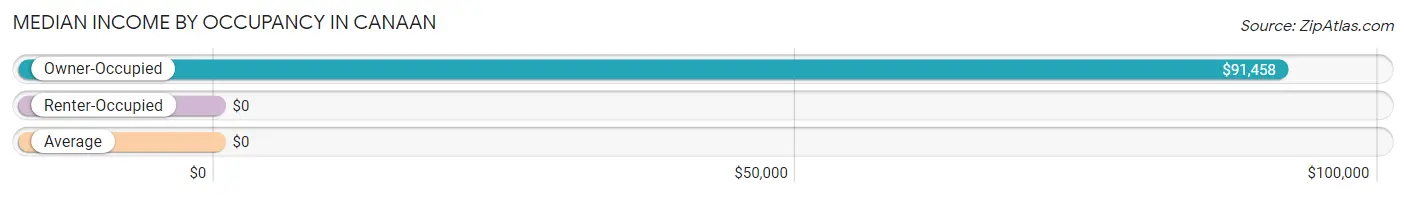
| Occupancy Type | # Households | Median Income |
| Owner-Occupied | 75 (61.0%) | $91,458 |
| Renter-Occupied | 48 (39.0%) | $0 |
| Average | 123 (100.0%) | $0 |
Occupancy by Householder Income Bracket in Canaan
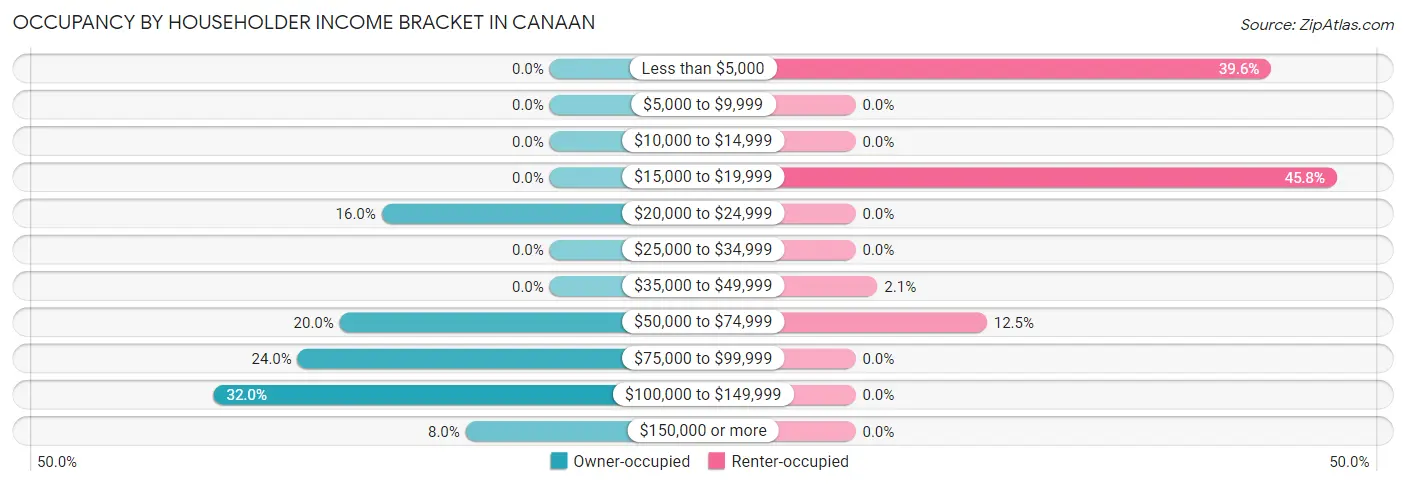
| Income Bracket | Owner-occupied | Renter-occupied |
| Less than $5,000 | 0 (0.0%) | 19 (39.6%) |
| $5,000 to $9,999 | 0 (0.0%) | 0 (0.0%) |
| $10,000 to $14,999 | 0 (0.0%) | 0 (0.0%) |
| $15,000 to $19,999 | 0 (0.0%) | 22 (45.8%) |
| $20,000 to $24,999 | 12 (16.0%) | 0 (0.0%) |
| $25,000 to $34,999 | 0 (0.0%) | 0 (0.0%) |
| $35,000 to $49,999 | 0 (0.0%) | 1 (2.1%) |
| $50,000 to $74,999 | 15 (20.0%) | 6 (12.5%) |
| $75,000 to $99,999 | 18 (24.0%) | 0 (0.0%) |
| $100,000 to $149,999 | 24 (32.0%) | 0 (0.0%) |
| $150,000 or more | 6 (8.0%) | 0 (0.0%) |
| Total | 75 (100.0%) | 48 (100.0%) |
Monthly Housing Cost Tiers in Canaan
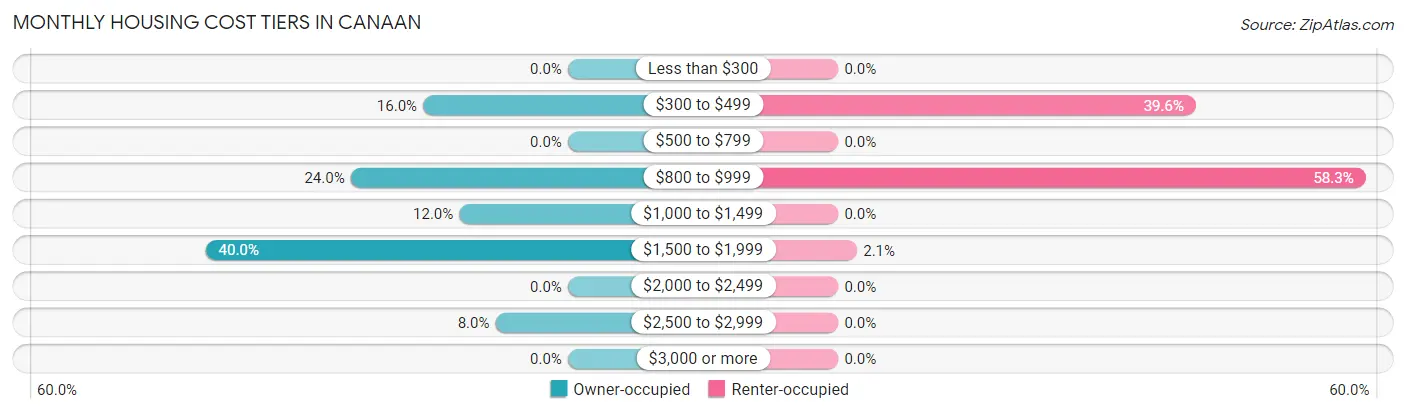
| Monthly Cost | Owner-occupied | Renter-occupied |
| Less than $300 | 0 (0.0%) | 0 (0.0%) |
| $300 to $499 | 12 (16.0%) | 19 (39.6%) |
| $500 to $799 | 0 (0.0%) | 0 (0.0%) |
| $800 to $999 | 18 (24.0%) | 28 (58.3%) |
| $1,000 to $1,499 | 9 (12.0%) | 0 (0.0%) |
| $1,500 to $1,999 | 30 (40.0%) | 1 (2.1%) |
| $2,000 to $2,499 | 0 (0.0%) | 0 (0.0%) |
| $2,500 to $2,999 | 6 (8.0%) | 0 (0.0%) |
| $3,000 or more | 0 (0.0%) | 0 (0.0%) |
| Total | 75 (100.0%) | 48 (100.0%) |
Physical Housing Characteristics in Canaan
Housing Structures in Canaan
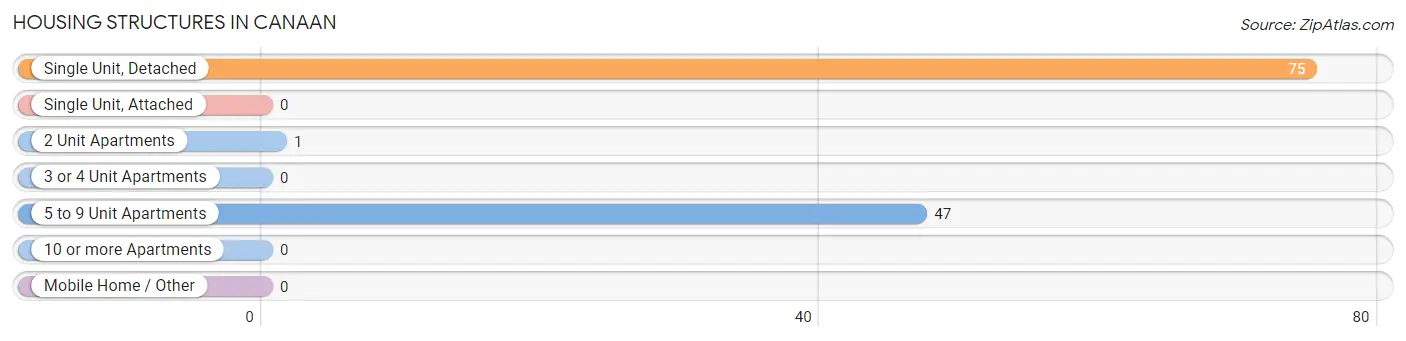
| Structure Type | # Housing Units | % Housing Units |
| Single Unit, Detached | 75 | 61.0% |
| Single Unit, Attached | 0 | 0.0% |
| 2 Unit Apartments | 1 | 0.8% |
| 3 or 4 Unit Apartments | 0 | 0.0% |
| 5 to 9 Unit Apartments | 47 | 38.2% |
| 10 or more Apartments | 0 | 0.0% |
| Mobile Home / Other | 0 | 0.0% |
| Total | 123 | 100.0% |
Housing Structures by Occupancy in Canaan
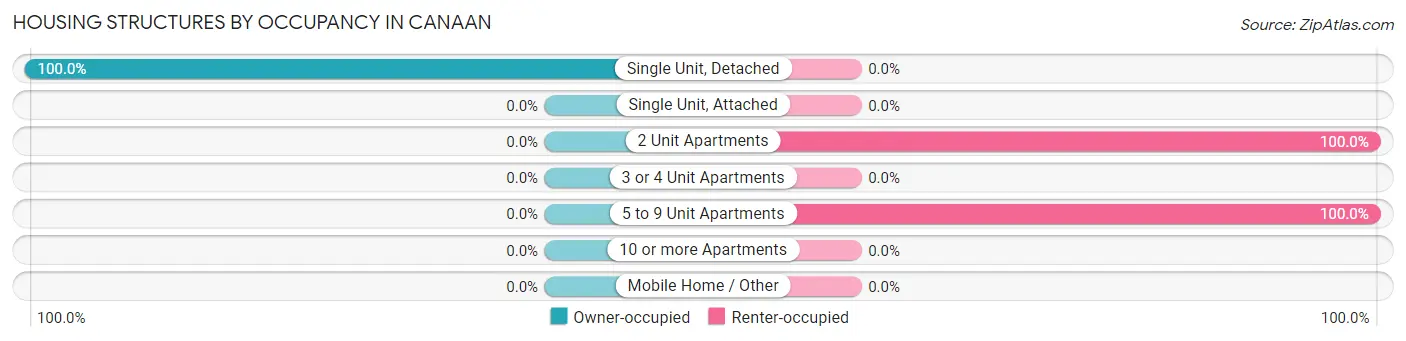
| Structure Type | Owner-occupied | Renter-occupied |
| Single Unit, Detached | 75 (100.0%) | 0 (0.0%) |
| Single Unit, Attached | 0 (0.0%) | 0 (0.0%) |
| 2 Unit Apartments | 0 (0.0%) | 1 (100.0%) |
| 3 or 4 Unit Apartments | 0 (0.0%) | 0 (0.0%) |
| 5 to 9 Unit Apartments | 0 (0.0%) | 47 (100.0%) |
| 10 or more Apartments | 0 (0.0%) | 0 (0.0%) |
| Mobile Home / Other | 0 (0.0%) | 0 (0.0%) |
| Total | 75 (61.0%) | 48 (39.0%) |
Housing Structures by Number of Rooms in Canaan
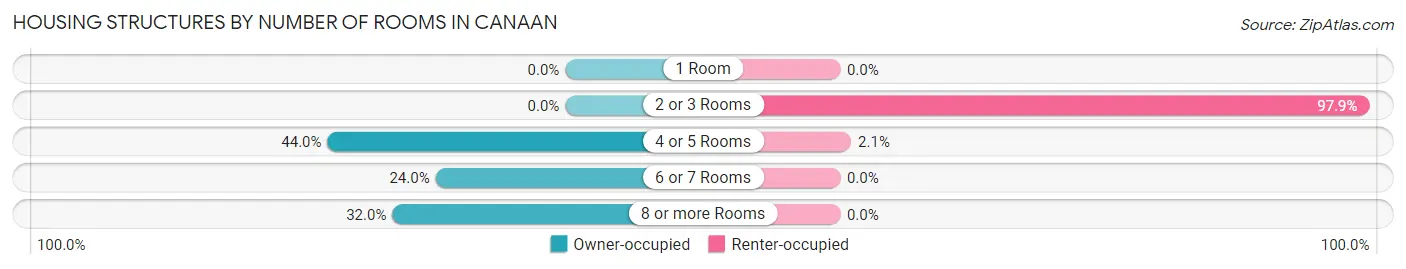
| Number of Rooms | Owner-occupied | Renter-occupied |
| 1 Room | 0 (0.0%) | 0 (0.0%) |
| 2 or 3 Rooms | 0 (0.0%) | 47 (97.9%) |
| 4 or 5 Rooms | 33 (44.0%) | 1 (2.1%) |
| 6 or 7 Rooms | 18 (24.0%) | 0 (0.0%) |
| 8 or more Rooms | 24 (32.0%) | 0 (0.0%) |
| Total | 75 (100.0%) | 48 (100.0%) |
Housing Structure by Heating Type in Canaan
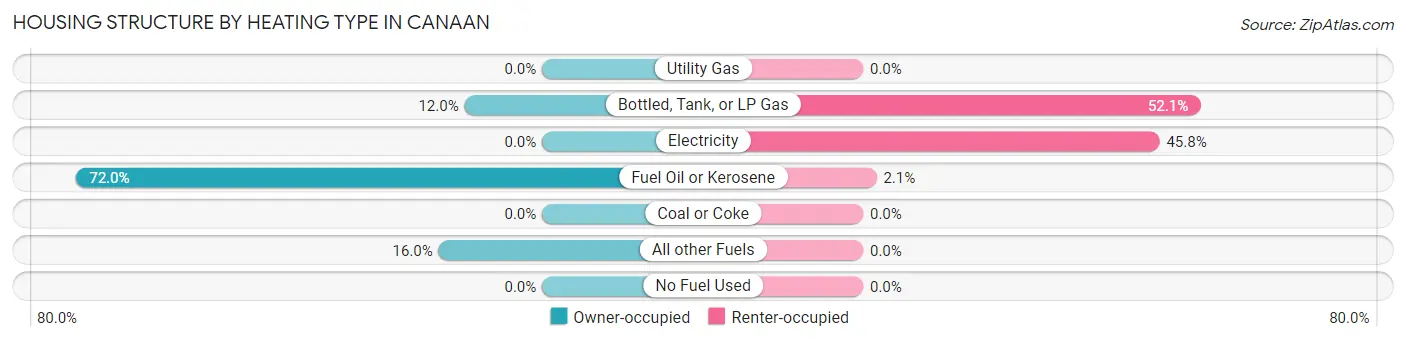
| Heating Type | Owner-occupied | Renter-occupied |
| Utility Gas | 0 (0.0%) | 0 (0.0%) |
| Bottled, Tank, or LP Gas | 9 (12.0%) | 25 (52.1%) |
| Electricity | 0 (0.0%) | 22 (45.8%) |
| Fuel Oil or Kerosene | 54 (72.0%) | 1 (2.1%) |
| Coal or Coke | 0 (0.0%) | 0 (0.0%) |
| All other Fuels | 12 (16.0%) | 0 (0.0%) |
| No Fuel Used | 0 (0.0%) | 0 (0.0%) |
| Total | 75 (100.0%) | 48 (100.0%) |
Household Vehicle Usage in Canaan
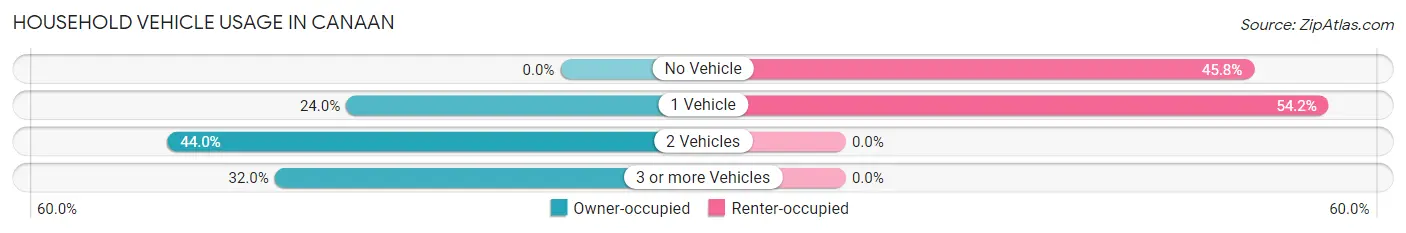
| Vehicles per Household | Owner-occupied | Renter-occupied |
| No Vehicle | 0 (0.0%) | 22 (45.8%) |
| 1 Vehicle | 18 (24.0%) | 26 (54.2%) |
| 2 Vehicles | 33 (44.0%) | 0 (0.0%) |
| 3 or more Vehicles | 24 (32.0%) | 0 (0.0%) |
| Total | 75 (100.0%) | 48 (100.0%) |
Real Estate & Mortgages in Canaan
Real Estate and Mortgage Overview in Canaan
| Characteristic | Without Mortgage | With Mortgage |
| Housing Units | 39 | 36 |
| Median Property Value | - | - |
| Median Household Income | $74,583 | $6 |
| Monthly Housing Costs | $842 | $0 |
| Real Estate Taxes | $6,042 | $0 |
Property Value by Mortgage Status in Canaan
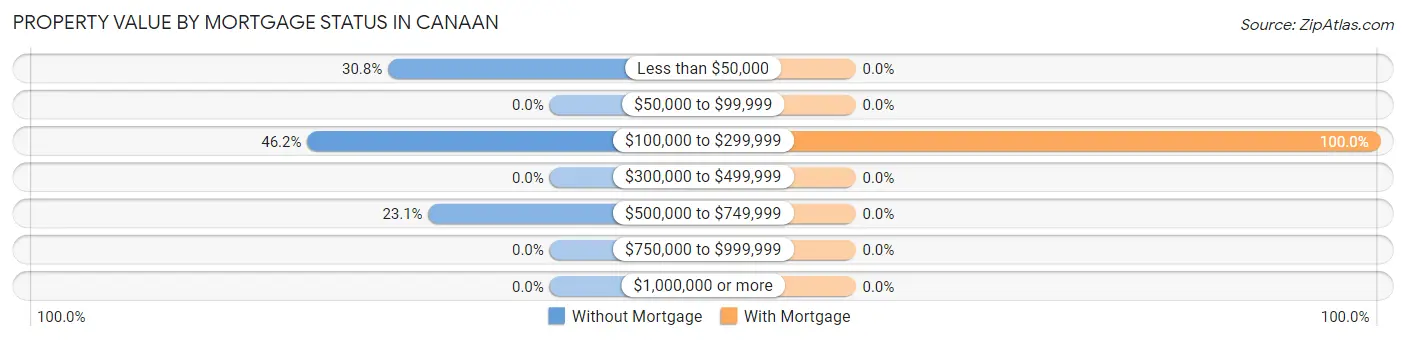
| Property Value | Without Mortgage | With Mortgage |
| Less than $50,000 | 12 (30.8%) | 0 (0.0%) |
| $50,000 to $99,999 | 0 (0.0%) | 0 (0.0%) |
| $100,000 to $299,999 | 18 (46.2%) | 36 (100.0%) |
| $300,000 to $499,999 | 0 (0.0%) | 0 (0.0%) |
| $500,000 to $749,999 | 9 (23.1%) | 0 (0.0%) |
| $750,000 to $999,999 | 0 (0.0%) | 0 (0.0%) |
| $1,000,000 or more | 0 (0.0%) | 0 (0.0%) |
| Total | 39 (100.0%) | 36 (100.0%) |
Household Income by Mortgage Status in Canaan
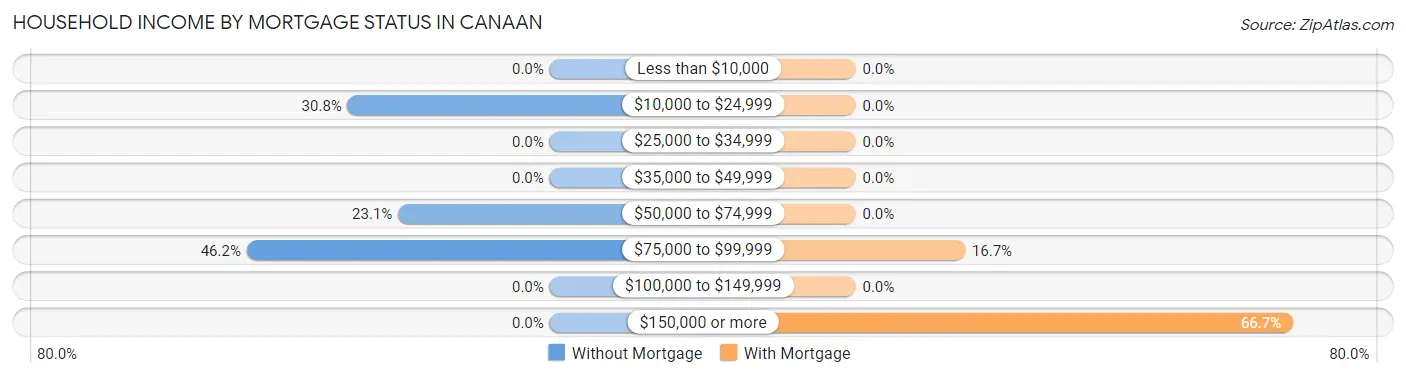
| Household Income | Without Mortgage | With Mortgage |
| Less than $10,000 | 0 (0.0%) | 0 (0.0%) |
| $10,000 to $24,999 | 12 (30.8%) | 0 (0.0%) |
| $25,000 to $34,999 | 0 (0.0%) | 0 (0.0%) |
| $35,000 to $49,999 | 0 (0.0%) | 0 (0.0%) |
| $50,000 to $74,999 | 9 (23.1%) | 0 (0.0%) |
| $75,000 to $99,999 | 18 (46.2%) | 6 (16.7%) |
| $100,000 to $149,999 | 0 (0.0%) | 0 (0.0%) |
| $150,000 or more | 0 (0.0%) | 24 (66.7%) |
| Total | 39 (100.0%) | 36 (100.0%) |
Property Value to Household Income Ratio in Canaan
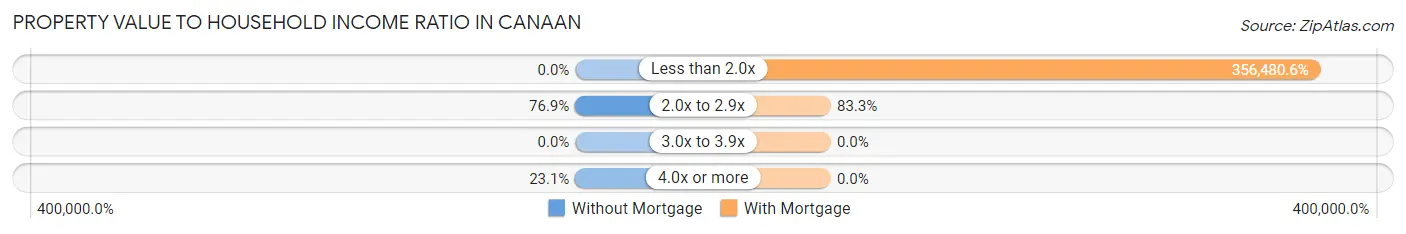
| Value-to-Income Ratio | Without Mortgage | With Mortgage |
| Less than 2.0x | 0 (0.0%) | 128,333 (356,480.6%) |
| 2.0x to 2.9x | 30 (76.9%) | 30 (83.3%) |
| 3.0x to 3.9x | 0 (0.0%) | 0 (0.0%) |
| 4.0x or more | 9 (23.1%) | 0 (0.0%) |
| Total | 39 (100.0%) | 36 (100.0%) |
Real Estate Taxes by Mortgage Status in Canaan
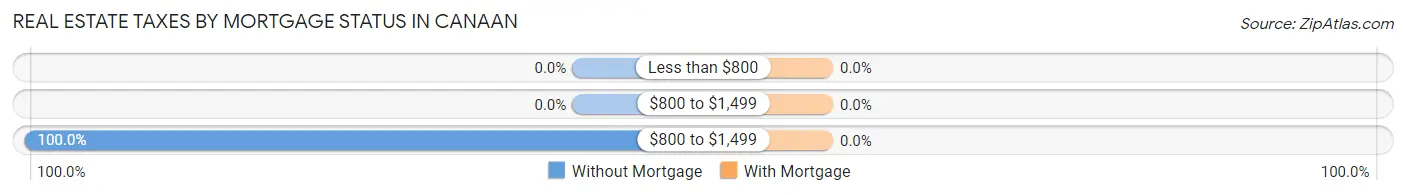
| Property Taxes | Without Mortgage | With Mortgage |
| Less than $800 | 0 (0.0%) | 0 (0.0%) |
| $800 to $1,499 | 0 (0.0%) | 0 (0.0%) |
| $800 to $1,499 | 39 (100.0%) | 0 (0.0%) |
| Total | 39 (100.0%) | 36 (100.0%) |
Health & Disability in Canaan
Health Insurance Coverage by Age in Canaan
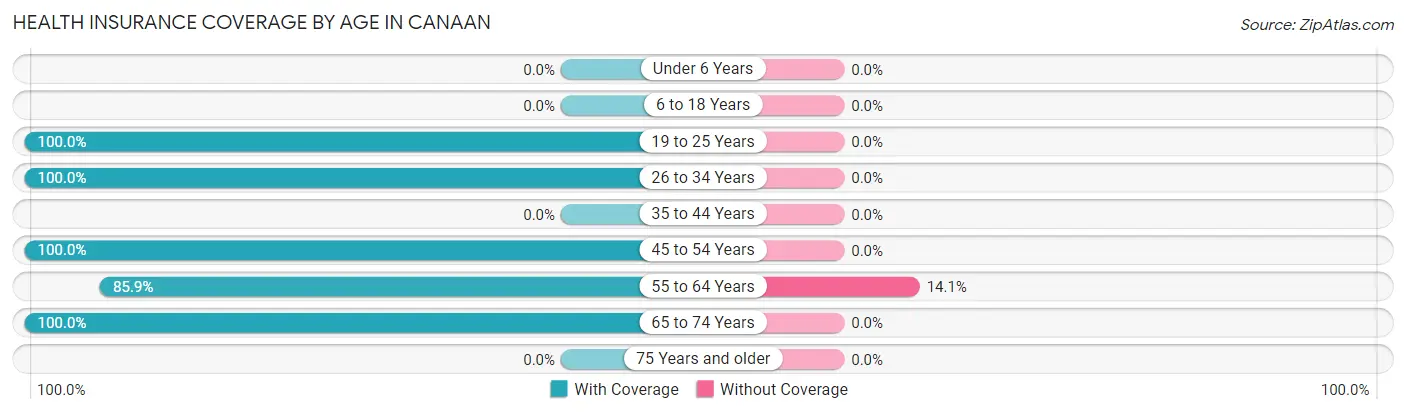
| Age Bracket | With Coverage | Without Coverage |
| Under 6 Years | 0 (0.0%) | 0 (0.0%) |
| 6 to 18 Years | 0 (0.0%) | 0 (0.0%) |
| 19 to 25 Years | 12 (100.0%) | 0 (0.0%) |
| 26 to 34 Years | 28 (100.0%) | 0 (0.0%) |
| 35 to 44 Years | 0 (0.0%) | 0 (0.0%) |
| 45 to 54 Years | 27 (100.0%) | 0 (0.0%) |
| 55 to 64 Years | 55 (85.9%) | 9 (14.1%) |
| 65 to 74 Years | 42 (100.0%) | 0 (0.0%) |
| 75 Years and older | 0 (0.0%) | 0 (0.0%) |
| Total | 164 (94.8%) | 9 (5.2%) |
Health Insurance Coverage by Citizenship Status in Canaan
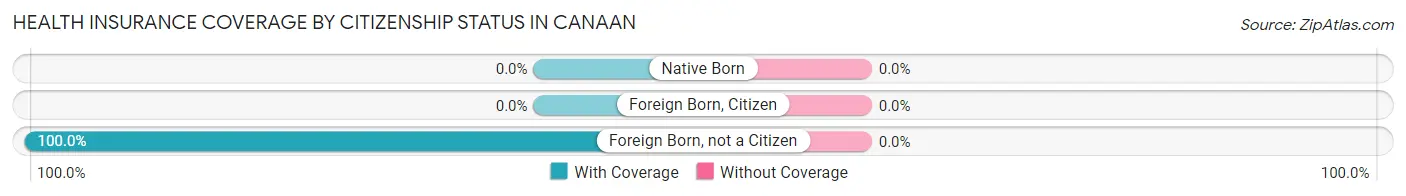
| Citizenship Status | With Coverage | Without Coverage |
| Native Born | 0 (0.0%) | 0 (0.0%) |
| Foreign Born, Citizen | 0 (0.0%) | 0 (0.0%) |
| Foreign Born, not a Citizen | 12 (100.0%) | 0 (0.0%) |
Health Insurance Coverage by Household Income in Canaan
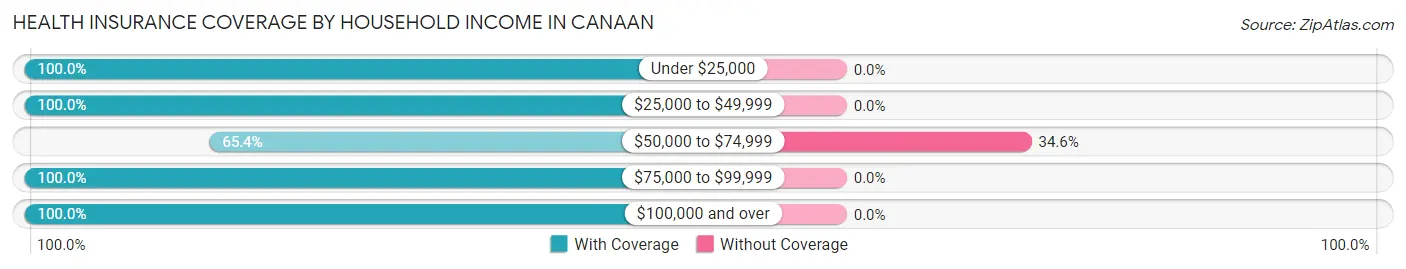
| Household Income | With Coverage | Without Coverage |
| Under $25,000 | 53 (100.0%) | 0 (0.0%) |
| $25,000 to $49,999 | 3 (100.0%) | 0 (0.0%) |
| $50,000 to $74,999 | 17 (65.4%) | 9 (34.6%) |
| $75,000 to $99,999 | 33 (100.0%) | 0 (0.0%) |
| $100,000 and over | 58 (100.0%) | 0 (0.0%) |
Public vs Private Health Insurance Coverage by Age in Canaan
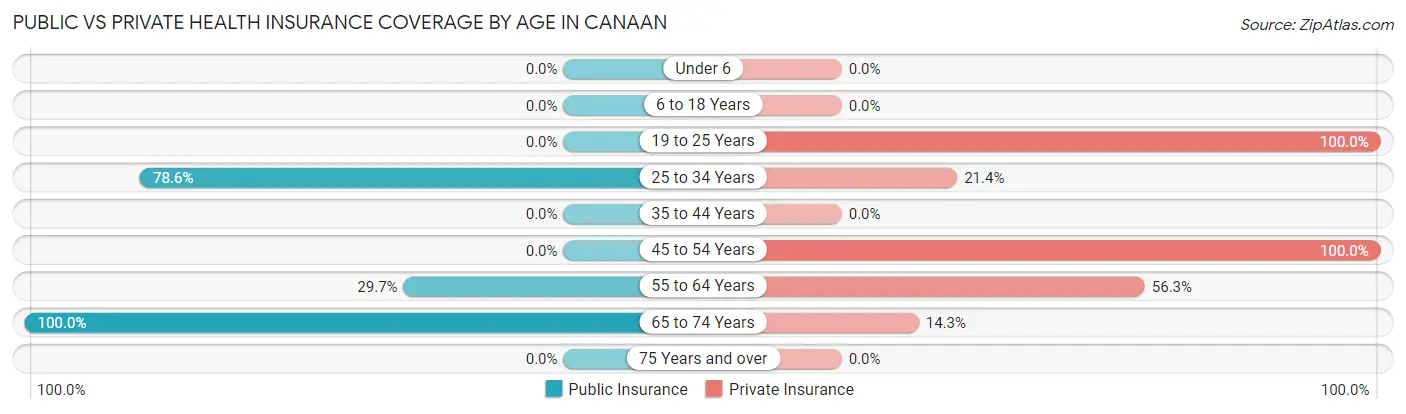
| Age Bracket | Public Insurance | Private Insurance |
| Under 6 | 0 (0.0%) | 0 (0.0%) |
| 6 to 18 Years | 0 (0.0%) | 0 (0.0%) |
| 19 to 25 Years | 0 (0.0%) | 12 (100.0%) |
| 25 to 34 Years | 22 (78.6%) | 6 (21.4%) |
| 35 to 44 Years | 0 (0.0%) | 0 (0.0%) |
| 45 to 54 Years | 0 (0.0%) | 27 (100.0%) |
| 55 to 64 Years | 19 (29.7%) | 36 (56.2%) |
| 65 to 74 Years | 42 (100.0%) | 6 (14.3%) |
| 75 Years and over | 0 (0.0%) | 0 (0.0%) |
| Total | 83 (48.0%) | 87 (50.3%) |
Disability Status by Sex by Age in Canaan
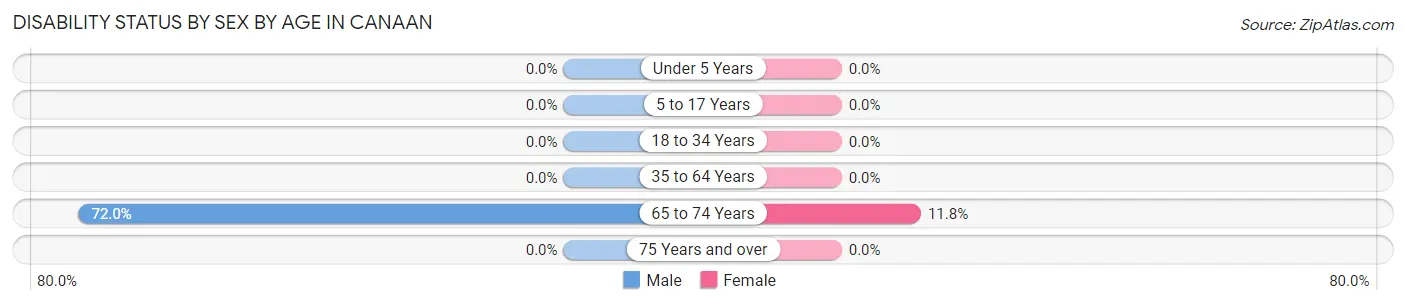
| Age Bracket | Male | Female |
| Under 5 Years | 0 (0.0%) | 0 (0.0%) |
| 5 to 17 Years | 0 (0.0%) | 0 (0.0%) |
| 18 to 34 Years | 0 (0.0%) | 0 (0.0%) |
| 35 to 64 Years | 0 (0.0%) | 0 (0.0%) |
| 65 to 74 Years | 18 (72.0%) | 2 (11.8%) |
| 75 Years and over | 0 (0.0%) | 0 (0.0%) |
Disability Class by Sex by Age in Canaan
Disability Class: Hearing Difficulty
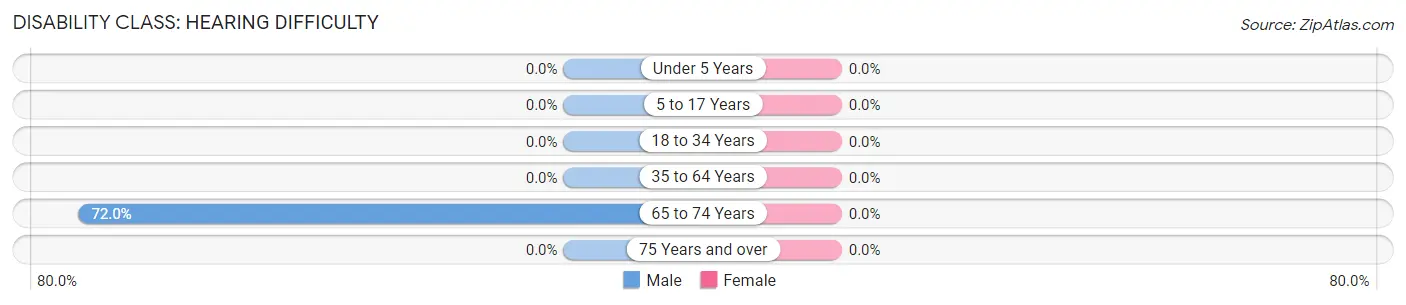
| Age Bracket | Male | Female |
| Under 5 Years | 0 (0.0%) | 0 (0.0%) |
| 5 to 17 Years | 0 (0.0%) | 0 (0.0%) |
| 18 to 34 Years | 0 (0.0%) | 0 (0.0%) |
| 35 to 64 Years | 0 (0.0%) | 0 (0.0%) |
| 65 to 74 Years | 18 (72.0%) | 0 (0.0%) |
| 75 Years and over | 0 (0.0%) | 0 (0.0%) |
Disability Class: Vision Difficulty
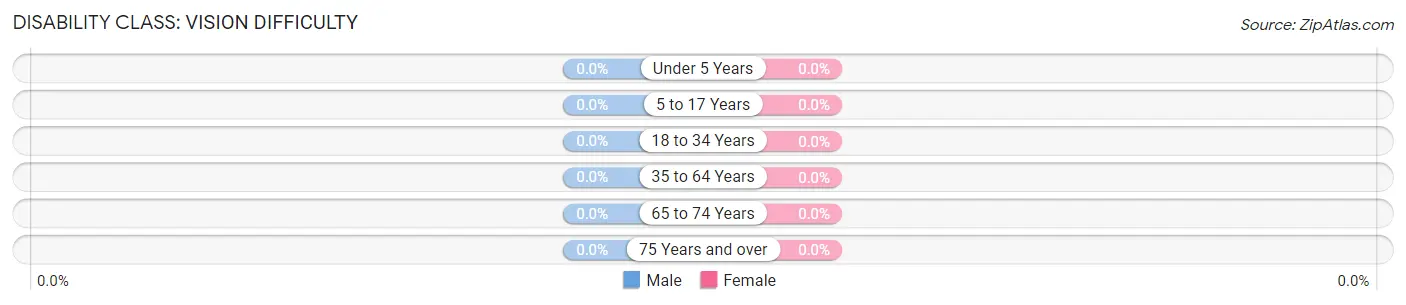
| Age Bracket | Male | Female |
| Under 5 Years | 0 (0.0%) | 0 (0.0%) |
| 5 to 17 Years | 0 (0.0%) | 0 (0.0%) |
| 18 to 34 Years | 0 (0.0%) | 0 (0.0%) |
| 35 to 64 Years | 0 (0.0%) | 0 (0.0%) |
| 65 to 74 Years | 0 (0.0%) | 0 (0.0%) |
| 75 Years and over | 0 (0.0%) | 0 (0.0%) |
Disability Class: Cognitive Difficulty
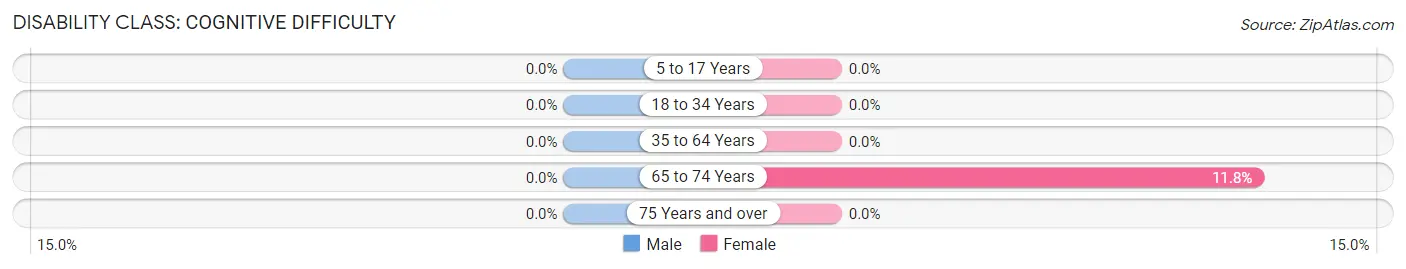
| Age Bracket | Male | Female |
| 5 to 17 Years | 0 (0.0%) | 0 (0.0%) |
| 18 to 34 Years | 0 (0.0%) | 0 (0.0%) |
| 35 to 64 Years | 0 (0.0%) | 0 (0.0%) |
| 65 to 74 Years | 0 (0.0%) | 2 (11.8%) |
| 75 Years and over | 0 (0.0%) | 0 (0.0%) |
Disability Class: Ambulatory Difficulty
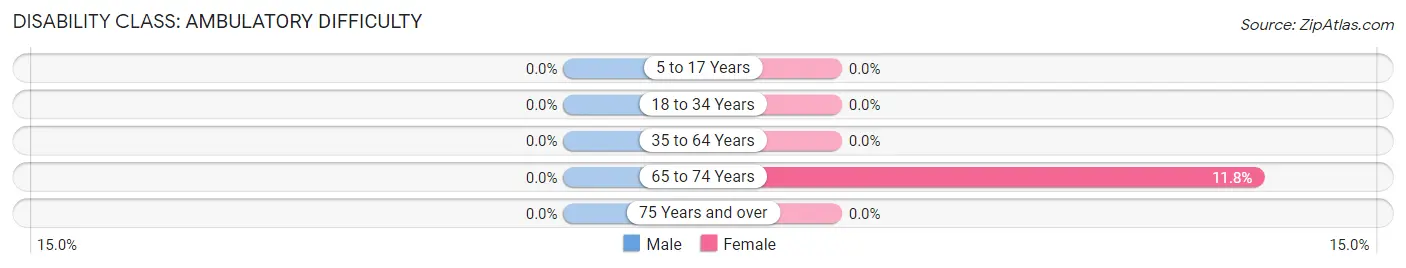
| Age Bracket | Male | Female |
| 5 to 17 Years | 0 (0.0%) | 0 (0.0%) |
| 18 to 34 Years | 0 (0.0%) | 0 (0.0%) |
| 35 to 64 Years | 0 (0.0%) | 0 (0.0%) |
| 65 to 74 Years | 0 (0.0%) | 2 (11.8%) |
| 75 Years and over | 0 (0.0%) | 0 (0.0%) |
Disability Class: Self-Care Difficulty
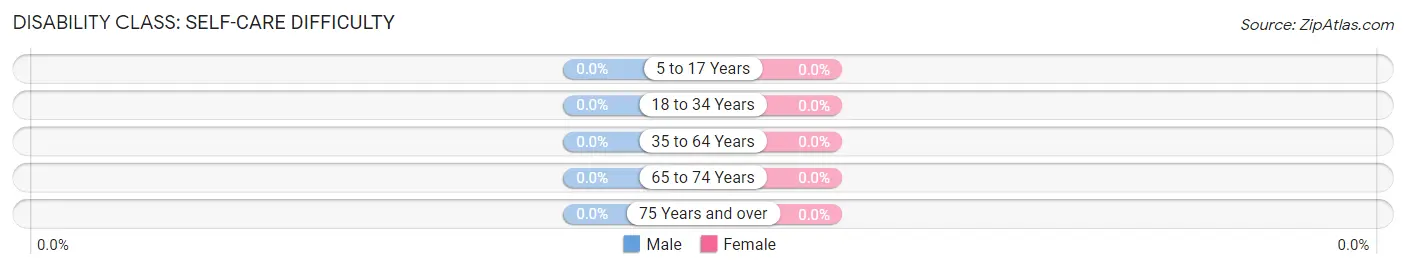
| Age Bracket | Male | Female |
| 5 to 17 Years | 0 (0.0%) | 0 (0.0%) |
| 18 to 34 Years | 0 (0.0%) | 0 (0.0%) |
| 35 to 64 Years | 0 (0.0%) | 0 (0.0%) |
| 65 to 74 Years | 0 (0.0%) | 0 (0.0%) |
| 75 Years and over | 0 (0.0%) | 0 (0.0%) |
Technology Access in Canaan
Computing Device Access in Canaan
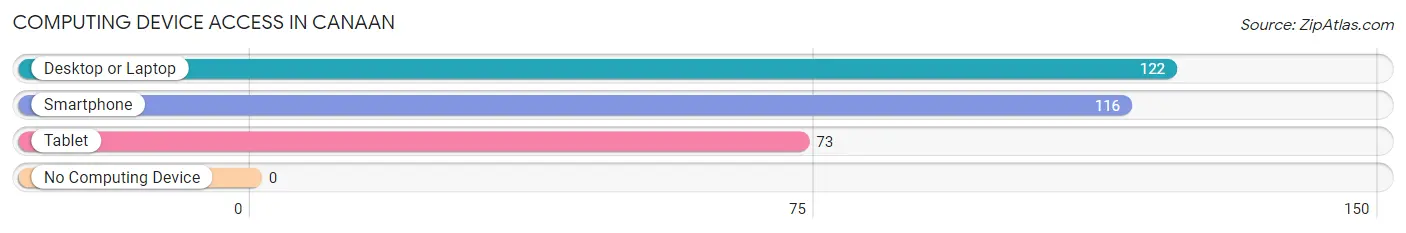
| Device Type | # Households | % Households |
| Desktop or Laptop | 122 | 99.2% |
| Smartphone | 116 | 94.3% |
| Tablet | 73 | 59.4% |
| No Computing Device | 0 | 0.0% |
| Total | 123 | 100.0% |
Internet Access in Canaan
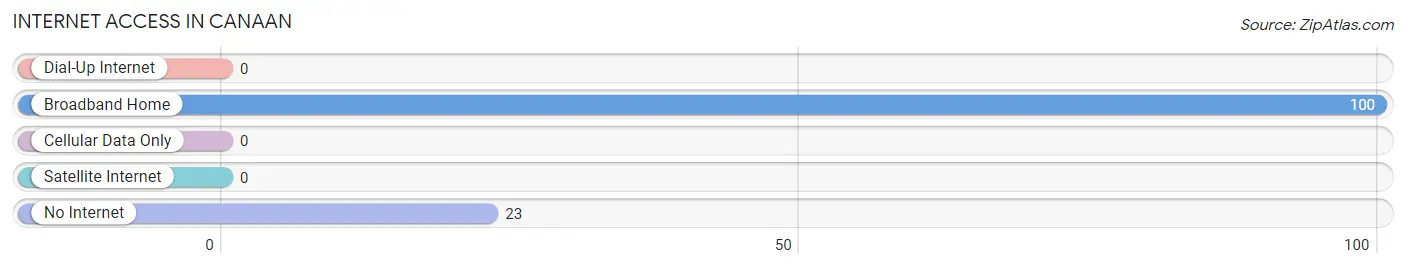
| Internet Type | # Households | % Households |
| Dial-Up Internet | 0 | 0.0% |
| Broadband Home | 100 | 81.3% |
| Cellular Data Only | 0 | 0.0% |
| Satellite Internet | 0 | 0.0% |
| No Internet | 23 | 18.7% |
| Total | 123 | 100.0% |
Canaan Summary
Canaan is a town located in Grafton County, New Hampshire, United States. The population was 1,845 at the 2010 census. It is part of the Lebanon, NH–VT Micropolitan Statistical Area.
History
Canaan was first settled in 1763 by a group of settlers from Connecticut. The town was originally part of a larger tract of land known as the "New Hampshire Grants" which was granted to settlers by the Province of New Hampshire. The town was incorporated in 1782 and named after the Biblical land of Canaan.
In the 19th century, Canaan was an agricultural community, with a variety of crops being grown. The town also had several mills, including a sawmill, gristmill, and a woolen mill.
Geography
Canaan is located in southwestern Grafton County, bordered by the towns of Dorchester to the north, Orange to the east, Enfield to the south, and Lebanon to the west. The town is situated in the Connecticut River Valley, with the Connecticut River forming the western boundary of the town.
According to the United States Census Bureau, the town has a total area of 33.2 square miles, of which 32.9 square miles is land and 0.3 square miles is water. The highest point in Canaan is the summit of Mount Cardigan, at 3,155 feet above sea level.
Economy
Canaan's economy is largely based on agriculture and tourism. The town is home to several farms, which produce a variety of crops, including apples, corn, hay, and vegetables. The town also has several small businesses, including a general store, a restaurant, and a bed and breakfast.
Tourism is an important part of the local economy, with many visitors coming to the area to enjoy the natural beauty of the Connecticut River Valley. The town is home to several popular attractions, including the Cardigan Mountain State Park, the Canaan Village Historic District, and the Canaan Street Historic District.
Demographics
As of the 2010 census, there were 1,845 people, 745 households, and 517 families residing in the town. The population density was 56.2 people per square mile. There were 817 housing units at an average density of 24.9 per square mile. The racial makeup of the town was 97.2% White, 0.3% African American, 0.2% Native American, 0.3% Asian, 0.1% Pacific Islander, 0.4% from other races, and 1.5% from two or more races. Hispanic or Latino of any race were 1.2% of the population.
There were 745 households, out of which 28.3% had children under the age of 18 living with them, 54.2% were married couples living together, 9.2% had a female householder with no husband present, and 31.7% were non-families. 25.2% of all households were made up of individuals, and 10.2% had someone living alone who was 65 years of age or older. The average household size was 2.47 and the average family size was 2.94.
In the town, the population was spread out, with 23.7% under the age of 18, 6.2% from 18 to 24, 28.2% from 25 to 44, 28.2% from 45 to 64, and 13.7% who were 65 years of age or older. The median age was 40 years. For every 100 females, there were 97.2 males. For every 100 females age 18 and over, there were 95.2 males.
The median income for a household in the town was $45,000, and the median income for a family was $51,250. Males had a median income of $35,000 versus $25,000 for females. The per capita income for the town was $21,945. About 5.2% of families and 7.2% of the population were below the poverty line, including 8.2% of those under age 18 and 8.3% of those age 65 or over.
Common Questions
What is Per Capita Income in Canaan?
Per Capita income in Canaan is $42,360.
What is the Median Family Income in Canaan?
Median Family Income in Canaan is $91,250.
What is Inequality or Gini Index in Canaan?
Inequality or Gini Index in Canaan is 0.46.
What is the Total Population of Canaan?
Total Population of Canaan is 173.
What is the Total Male Population of Canaan?
Total Male Population of Canaan is 87.
What is the Total Female Population of Canaan?
Total Female Population of Canaan is 86.
What is the Ratio of Males per 100 Females in Canaan?
There are 101.16 Males per 100 Females in Canaan.
What is the Ratio of Females per 100 Males in Canaan?
There are 98.85 Females per 100 Males in Canaan.
What is the Median Population Age in Canaan?
Median Population Age in Canaan is 60.6 Years.
What is the Average Family Size in Canaan
Average Family Size in Canaan is 1.9 People.
What is the Average Household Size in Canaan
Average Household Size in Canaan is 1.4 People.
How Large is the Labor Force in Canaan?
There are 118 People in the Labor Forcein in Canaan.
What is the Percentage of People in the Labor Force in Canaan?
68.2% of People are in the Labor Force in Canaan.