Hastings On Hudson, NY Map & Demographics
Hastings On Hudson Map
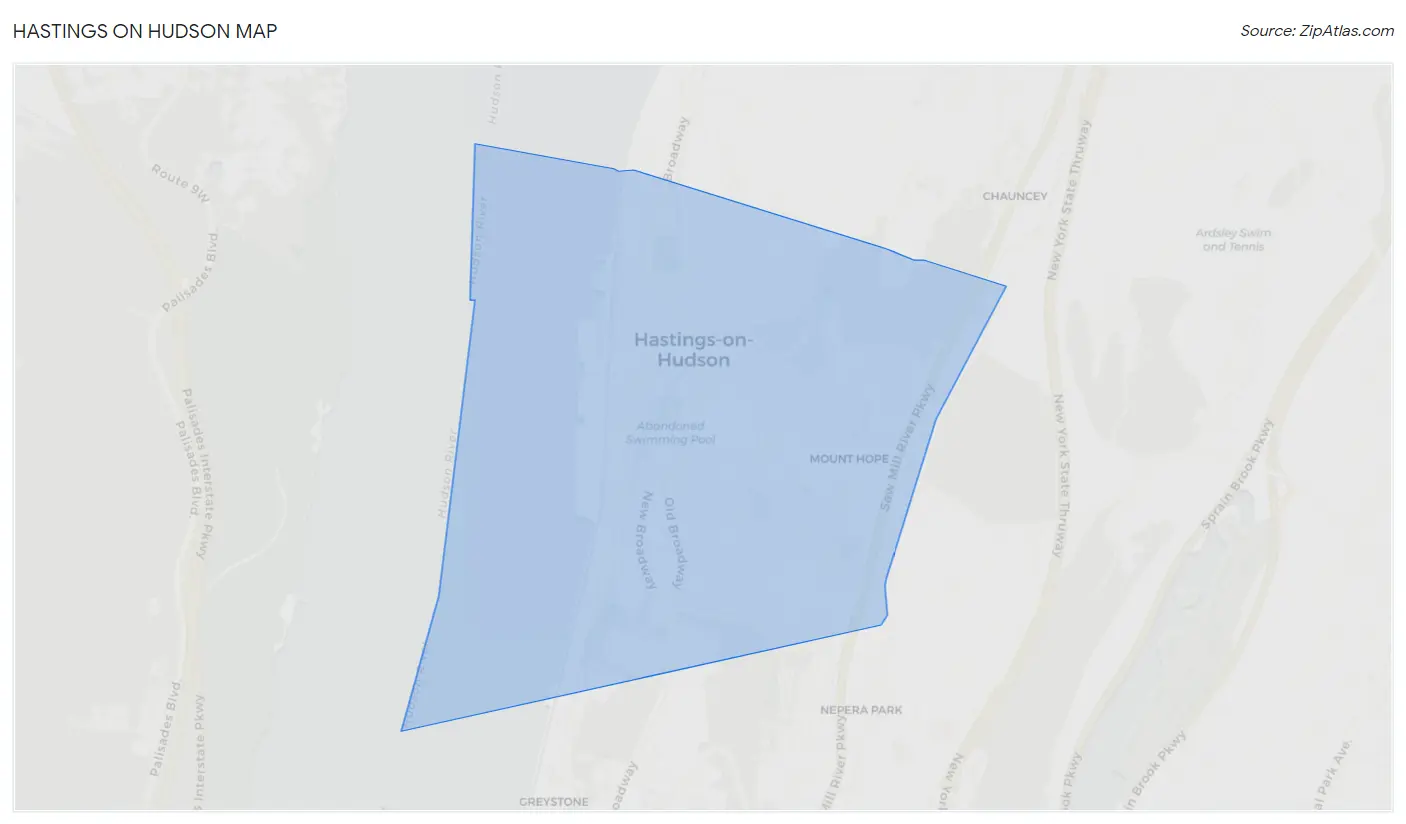
Hastings On Hudson Overview
$92,689
PER CAPITA INCOME
$214,728
AVG FAMILY INCOME
$161,908
AVG HOUSEHOLD INCOME
25.1%
WAGE / INCOME GAP [ % ]
74.9¢/ $1
WAGE / INCOME GAP [ $ ]
0.48
INEQUALITY / GINI INDEX
8,456
TOTAL POPULATION
4,170
MALE POPULATION
4,286
FEMALE POPULATION
97.29
MALES / 100 FEMALES
102.78
FEMALES / 100 MALES
45.3
MEDIAN AGE
3.2
AVG FAMILY SIZE
2.6
AVG HOUSEHOLD SIZE
4,542
LABOR FORCE [ PEOPLE ]
66.8%
PERCENT IN LABOR FORCE
2.2%
UNEMPLOYMENT RATE
Hastings On Hudson Zip Codes
Hastings On Hudson Area Codes
Income in Hastings On Hudson
Income Overview in Hastings On Hudson
Per Capita Income in Hastings On Hudson is $92,689, while median incomes of families and households are $214,728 and $161,908 respectively.
| Characteristic | Number | Measure |
| Per Capita Income | 8,456 | $92,689 |
| Median Family Income | 2,216 | $214,728 |
| Mean Family Income | 2,216 | $291,268 |
| Median Household Income | 3,089 | $161,908 |
| Mean Household Income | 3,089 | $247,079 |
| Income Deficit | 2,216 | $0 |
| Wage / Income Gap (%) | 8,456 | 25.10% |
| Wage / Income Gap ($) | 8,456 | 74.90¢ per $1 |
| Gini / Inequality Index | 8,456 | 0.48 |
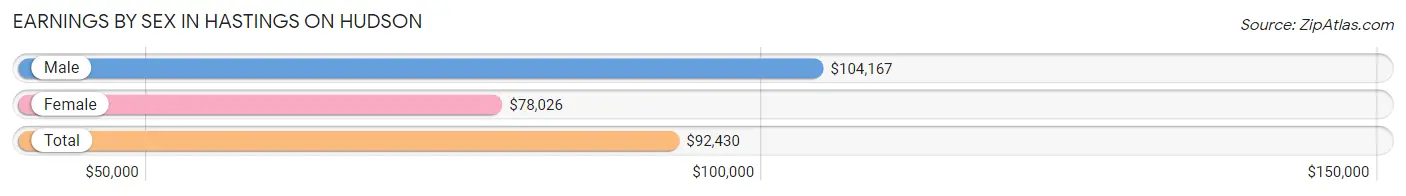
Earnings by Sex in Hastings On Hudson
Average Earnings in Hastings On Hudson are $92,430, $104,167 for men and $78,026 for women, a difference of 25.1%.
| Sex | Number | Average Earnings |
| Male | 2,466 (51.5%) | $104,167 |
| Female | 2,318 (48.4%) | $78,026 |
| Total | 4,784 (100.0%) | $92,430 |
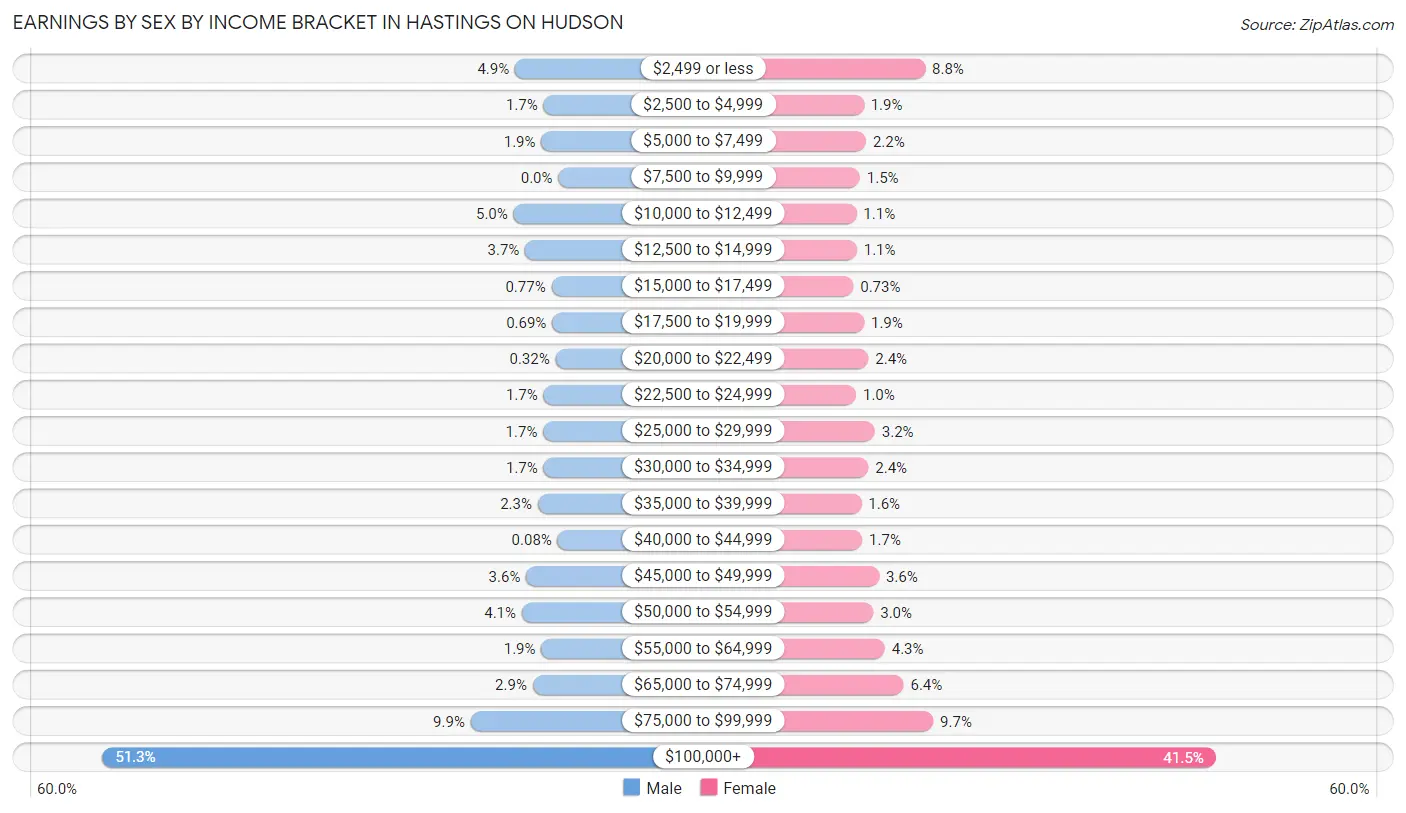
Earnings by Sex by Income Bracket in Hastings On Hudson
The most common earnings brackets in Hastings On Hudson are $100,000+ for men (1,264 | 51.3%) and $100,000+ for women (961 | 41.5%).
| Income | Male | Female |
| $2,499 or less | 120 (4.9%) | 204 (8.8%) |
| $2,500 to $4,999 | 41 (1.7%) | 44 (1.9%) |
| $5,000 to $7,499 | 47 (1.9%) | 50 (2.2%) |
| $7,500 to $9,999 | 0 (0.0%) | 34 (1.5%) |
| $10,000 to $12,499 | 124 (5.0%) | 25 (1.1%) |
| $12,500 to $14,999 | 92 (3.7%) | 26 (1.1%) |
| $15,000 to $17,499 | 19 (0.8%) | 17 (0.7%) |
| $17,500 to $19,999 | 17 (0.7%) | 45 (1.9%) |
| $20,000 to $22,499 | 8 (0.3%) | 56 (2.4%) |
| $22,500 to $24,999 | 41 (1.7%) | 24 (1.0%) |
| $25,000 to $29,999 | 42 (1.7%) | 73 (3.2%) |
| $30,000 to $34,999 | 41 (1.7%) | 56 (2.4%) |
| $35,000 to $39,999 | 57 (2.3%) | 38 (1.6%) |
| $40,000 to $44,999 | 2 (0.1%) | 40 (1.7%) |
| $45,000 to $49,999 | 89 (3.6%) | 84 (3.6%) |
| $50,000 to $54,999 | 101 (4.1%) | 69 (3.0%) |
| $55,000 to $64,999 | 47 (1.9%) | 99 (4.3%) |
| $65,000 to $74,999 | 71 (2.9%) | 148 (6.4%) |
| $75,000 to $99,999 | 243 (9.9%) | 225 (9.7%) |
| $100,000+ | 1,264 (51.3%) | 961 (41.5%) |
| Total | 2,466 (100.0%) | 2,318 (100.0%) |
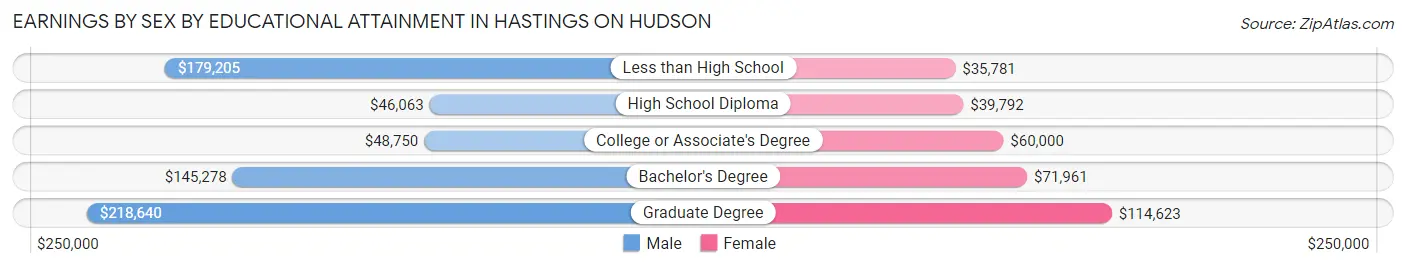
Earnings by Sex by Educational Attainment in Hastings On Hudson
Average earnings in Hastings On Hudson are $128,906 for men and $89,914 for women, a difference of 30.2%. Men with an educational attainment of graduate degree enjoy the highest average annual earnings of $218,640, while those with high school diploma education earn the least with $46,063. Women with an educational attainment of graduate degree earn the most with the average annual earnings of $114,623, while those with less than high school education have the smallest earnings of $35,781.
| Educational Attainment | Male Income | Female Income |
| Less than High School | $179,205 | $35,781 |
| High School Diploma | $46,063 | $39,792 |
| College or Associate's Degree | $48,750 | $60,000 |
| Bachelor's Degree | $145,278 | $71,961 |
| Graduate Degree | $218,640 | $114,623 |
| Total | $128,906 | $89,914 |
Family Income in Hastings On Hudson
Family Income Brackets in Hastings On Hudson
According to the Hastings On Hudson family income data, there are 1,219 families falling into the $200,000+ income range, which is the most common income bracket and makes up 55.0% of all families.
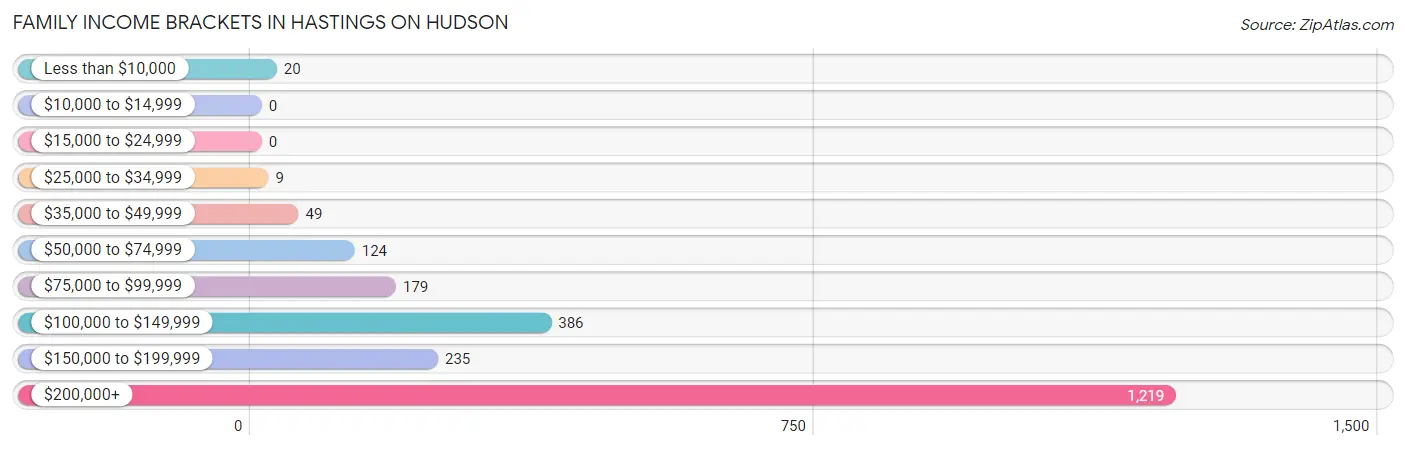
| Income Bracket | # Families | % Families |
| Less than $10,000 | 20 | 0.9% |
| $10,000 to $14,999 | 0 | 0.0% |
| $15,000 to $24,999 | 0 | 0.0% |
| $25,000 to $34,999 | 9 | 0.4% |
| $35,000 to $49,999 | 49 | 2.2% |
| $50,000 to $74,999 | 124 | 5.6% |
| $75,000 to $99,999 | 179 | 8.1% |
| $100,000 to $149,999 | 386 | 17.4% |
| $150,000 to $199,999 | 235 | 10.6% |
| $200,000+ | 1,219 | 55.0% |
Family Income by Famaliy Size in Hastings On Hudson
4-person families (549 | 24.8%) account for the highest median family income in Hastings On Hudson with $250,001 per family, while 2-person families (960 | 43.3%) have the highest median income of $80,198 per family member.
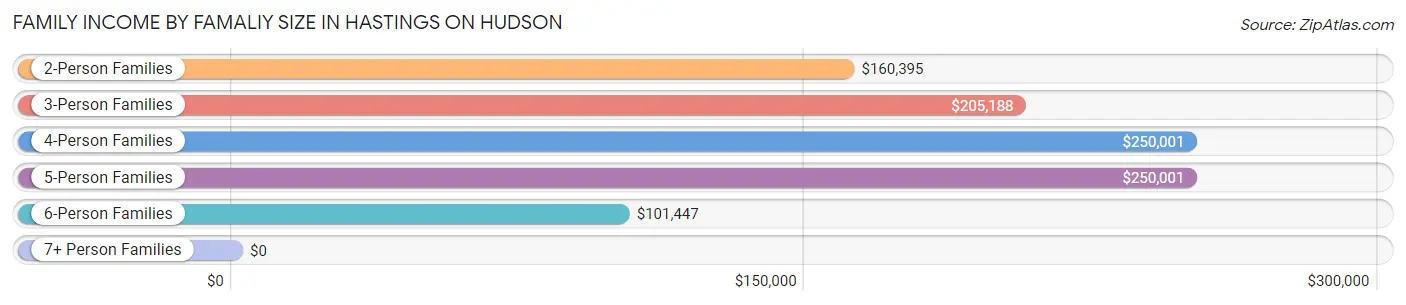
| Income Bracket | # Families | Median Income |
| 2-Person Families | 960 (43.3%) | $160,395 |
| 3-Person Families | 523 (23.6%) | $205,188 |
| 4-Person Families | 549 (24.8%) | $250,001 |
| 5-Person Families | 84 (3.8%) | $250,001 |
| 6-Person Families | 100 (4.5%) | $101,447 |
| 7+ Person Families | 0 (0.0%) | $0 |
| Total | 2,216 (100.0%) | $214,728 |
Family Income by Number of Earners in Hastings On Hudson
The median family income in Hastings On Hudson is $214,728, with families comprising 2 earners (1,313) having the highest median family income of $250,001, while families with no earners (197) have the lowest median family income of $102,621, accounting for 59.3% and 8.9% of families, respectively.
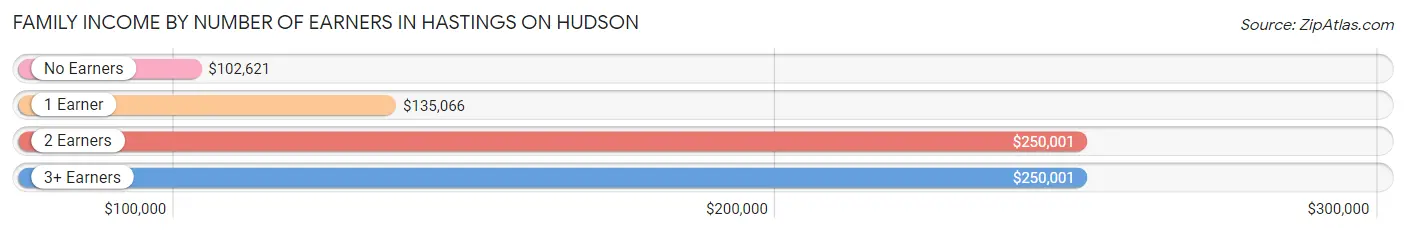
| Number of Earners | # Families | Median Income |
| No Earners | 197 (8.9%) | $102,621 |
| 1 Earner | 459 (20.7%) | $135,066 |
| 2 Earners | 1,313 (59.3%) | $250,001 |
| 3+ Earners | 247 (11.2%) | $250,001 |
| Total | 2,216 (100.0%) | $214,728 |
Household Income in Hastings On Hudson
Household Income Brackets in Hastings On Hudson
With 1,350 households falling in the category, the $200,000+ income range is the most frequent in Hastings On Hudson, accounting for 43.7% of all households. In contrast, only 46 households (1.5%) fall into the $10,000 to $14,999 income bracket, making it the least populous group.
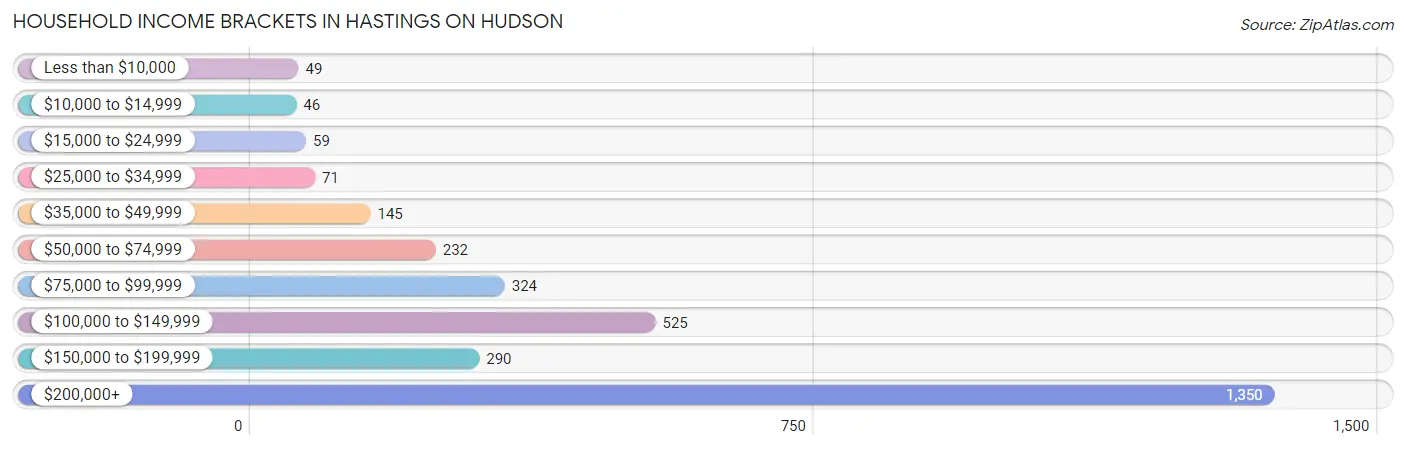
| Income Bracket | # Households | % Households |
| Less than $10,000 | 49 | 1.6% |
| $10,000 to $14,999 | 46 | 1.5% |
| $15,000 to $24,999 | 59 | 1.9% |
| $25,000 to $34,999 | 71 | 2.3% |
| $35,000 to $49,999 | 145 | 4.7% |
| $50,000 to $74,999 | 232 | 7.5% |
| $75,000 to $99,999 | 324 | 10.5% |
| $100,000 to $149,999 | 525 | 17.0% |
| $150,000 to $199,999 | 290 | 9.4% |
| $200,000+ | 1,350 | 43.7% |
Household Income by Householder Age in Hastings On Hudson
The median household income in Hastings On Hudson is $161,908, with the highest median household income of $226,066 found in the 45 to 64 years age bracket for the primary householder. A total of 1,263 households (40.9%) fall into this category.
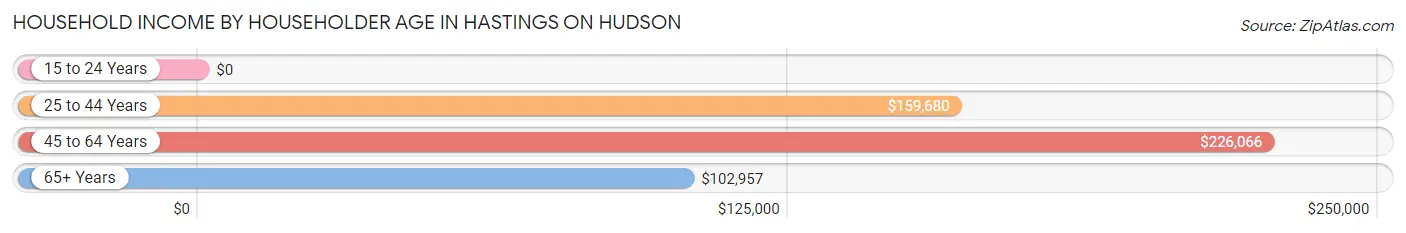
| Income Bracket | # Households | Median Income |
| 15 to 24 Years | 0 (0.0%) | $0 |
| 25 to 44 Years | 769 (24.9%) | $159,680 |
| 45 to 64 Years | 1,263 (40.9%) | $226,066 |
| 65+ Years | 1,057 (34.2%) | $102,957 |
| Total | 3,089 (100.0%) | $161,908 |
Poverty in Hastings On Hudson
Income Below Poverty by Sex and Age in Hastings On Hudson
With 1.4% poverty level for males and 3.0% for females among the residents of Hastings On Hudson, 16 and 17 year old males and 16 and 17 year old females are the most vulnerable to poverty, with 5 males (7.0%) and 13 females (14.4%) in their respective age groups living below the poverty level.
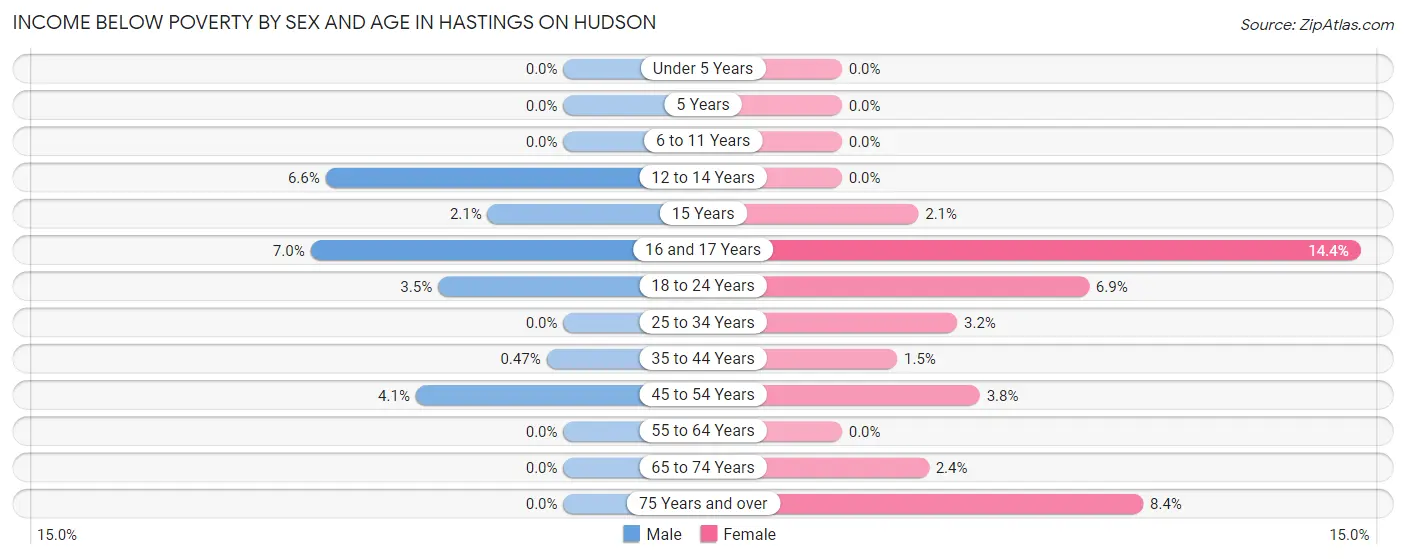
| Age Bracket | Male | Female |
| Under 5 Years | 0 (0.0%) | 0 (0.0%) |
| 5 Years | 0 (0.0%) | 0 (0.0%) |
| 6 to 11 Years | 0 (0.0%) | 0 (0.0%) |
| 12 to 14 Years | 9 (6.6%) | 0 (0.0%) |
| 15 Years | 2 (2.1%) | 2 (2.1%) |
| 16 and 17 Years | 5 (7.0%) | 13 (14.4%) |
| 18 to 24 Years | 14 (3.5%) | 15 (6.9%) |
| 25 to 34 Years | 0 (0.0%) | 10 (3.2%) |
| 35 to 44 Years | 2 (0.5%) | 8 (1.5%) |
| 45 to 54 Years | 23 (4.1%) | 19 (3.8%) |
| 55 to 64 Years | 0 (0.0%) | 0 (0.0%) |
| 65 to 74 Years | 0 (0.0%) | 11 (2.4%) |
| 75 Years and over | 0 (0.0%) | 46 (8.4%) |
| Total | 55 (1.4%) | 124 (3.0%) |
Income Above Poverty by Sex and Age in Hastings On Hudson
According to the poverty statistics in Hastings On Hudson, males aged under 5 years and females aged under 5 years are the age groups that are most secure financially, with 100.0% of males and 100.0% of females in these age groups living above the poverty line.
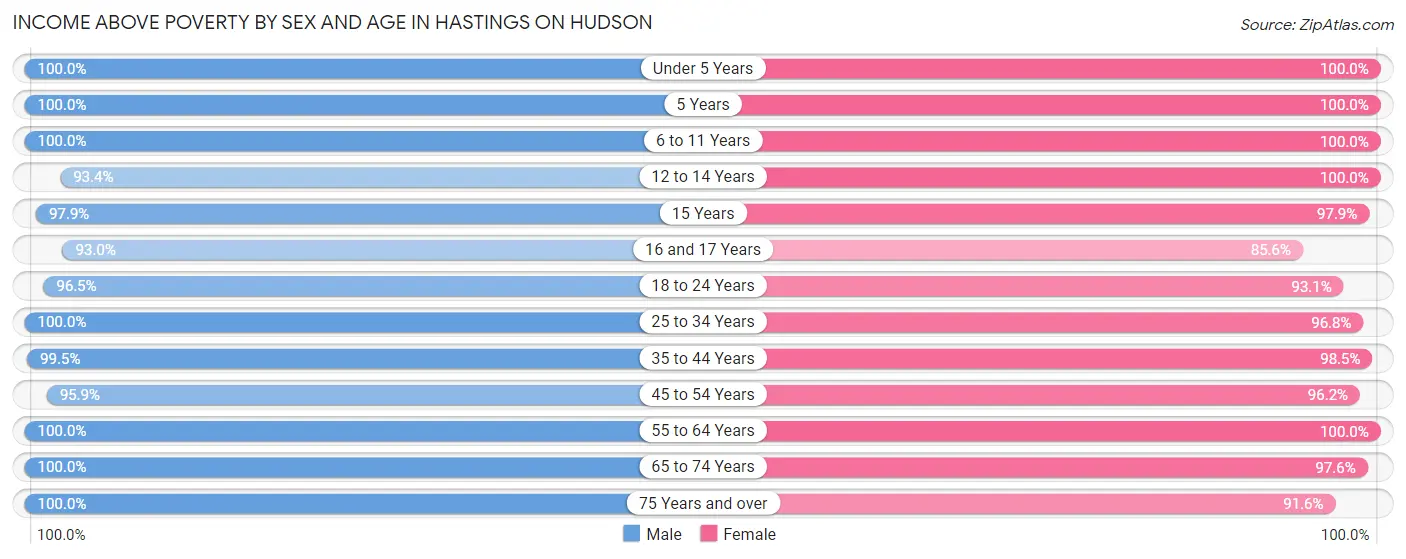
| Age Bracket | Male | Female |
| Under 5 Years | 219 (100.0%) | 152 (100.0%) |
| 5 Years | 48 (100.0%) | 131 (100.0%) |
| 6 to 11 Years | 247 (100.0%) | 288 (100.0%) |
| 12 to 14 Years | 127 (93.4%) | 147 (100.0%) |
| 15 Years | 93 (97.9%) | 92 (97.9%) |
| 16 and 17 Years | 66 (93.0%) | 77 (85.6%) |
| 18 to 24 Years | 387 (96.5%) | 203 (93.1%) |
| 25 to 34 Years | 449 (100.0%) | 302 (96.8%) |
| 35 to 44 Years | 428 (99.5%) | 510 (98.5%) |
| 45 to 54 Years | 537 (95.9%) | 476 (96.2%) |
| 55 to 64 Years | 633 (100.0%) | 700 (100.0%) |
| 65 to 74 Years | 431 (100.0%) | 444 (97.6%) |
| 75 Years and over | 270 (100.0%) | 502 (91.6%) |
| Total | 3,935 (98.6%) | 4,024 (97.0%) |
Income Below Poverty Among Married-Couple Families in Hastings On Hudson
The poverty statistics for married-couple families in Hastings On Hudson show that 0.9% or 19 of the total 2,002 families live below the poverty line. Families with 1 or 2 children have the highest poverty rate of 2.6%, comprising of 19 families. On the other hand, families with no children have the lowest poverty rate of 0.0%, which includes 0 families.
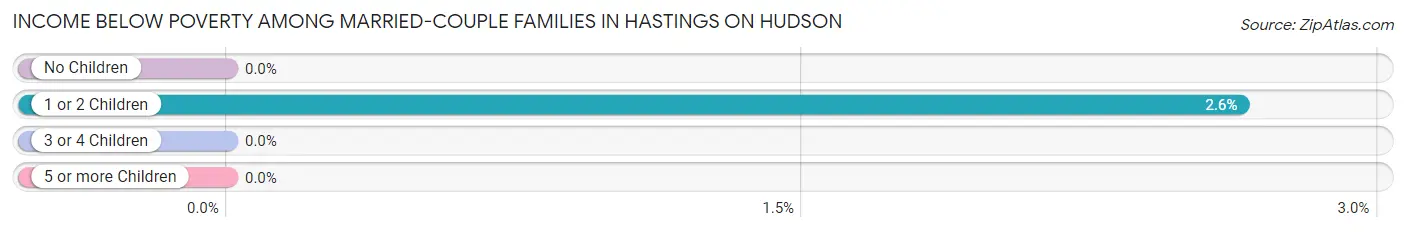
| Children | Above Poverty | Below Poverty |
| No Children | 1,154 (100.0%) | 0 (0.0%) |
| 1 or 2 Children | 701 (97.4%) | 19 (2.6%) |
| 3 or 4 Children | 128 (100.0%) | 0 (0.0%) |
| 5 or more Children | 0 (0.0%) | 0 (0.0%) |
| Total | 1,983 (99.1%) | 19 (0.9%) |
Income Below Poverty Among Single-Parent Households in Hastings On Hudson
| Children | Single Father | Single Mother |
| No Children | 0 (0.0%) | 0 (0.0%) |
| 1 or 2 Children | 0 (0.0%) | 0 (0.0%) |
| 3 or 4 Children | 0 (0.0%) | 0 (0.0%) |
| 5 or more Children | 0 (0.0%) | 0 (0.0%) |
| Total | 0 (0.0%) | 0 (0.0%) |
Income Below Poverty Among Married-Couple vs Single-Parent Households in Hastings On Hudson
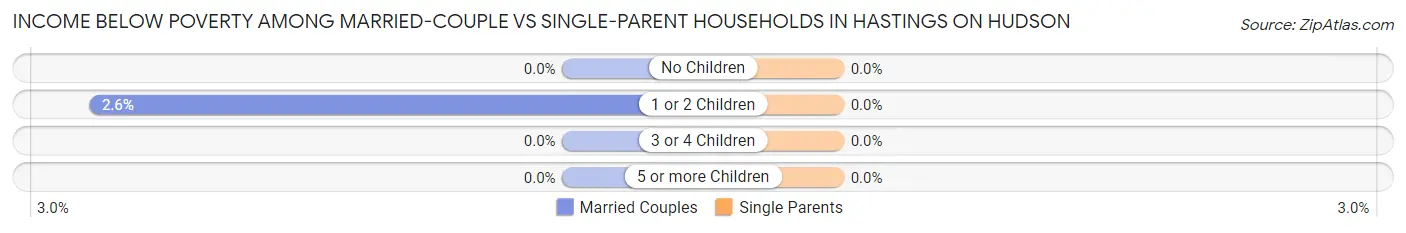
| Children | Married-Couple Families | Single-Parent Households |
| No Children | 0 (0.0%) | 0 (0.0%) |
| 1 or 2 Children | 19 (2.6%) | 0 (0.0%) |
| 3 or 4 Children | 0 (0.0%) | 0 (0.0%) |
| 5 or more Children | 0 (0.0%) | 0 (0.0%) |
| Total | 19 (0.9%) | 0 (0.0%) |
Race in Hastings On Hudson
The most populous races in Hastings On Hudson are White / Caucasian (7,068 | 83.6%), Hispanic or Latino (821 | 9.7%), and Two or more Races (590 | 7.0%).
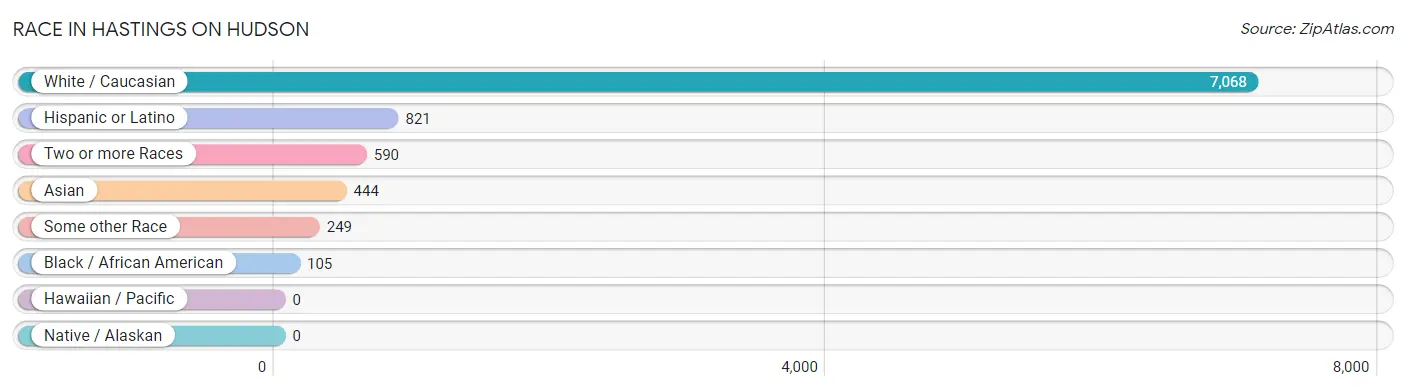
| Race | # Population | % Population |
| Asian | 444 | 5.2% |
| Black / African American | 105 | 1.2% |
| Hawaiian / Pacific | 0 | 0.0% |
| Hispanic or Latino | 821 | 9.7% |
| Native / Alaskan | 0 | 0.0% |
| White / Caucasian | 7,068 | 83.6% |
| Two or more Races | 590 | 7.0% |
| Some other Race | 249 | 2.9% |
| Total | 8,456 | 100.0% |
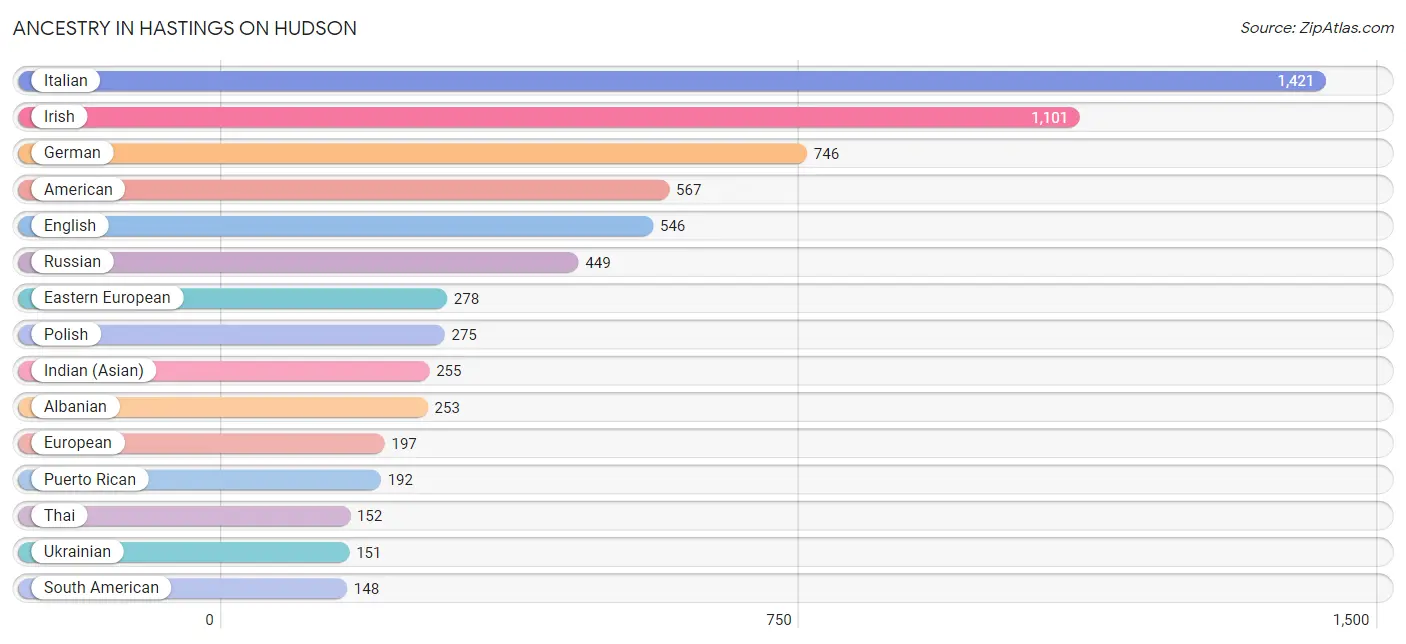
Ancestry in Hastings On Hudson
The most populous ancestries reported in Hastings On Hudson are Italian (1,421 | 16.8%), Irish (1,101 | 13.0%), German (746 | 8.8%), American (567 | 6.7%), and English (546 | 6.5%), together accounting for 51.8% of all Hastings On Hudson residents.
| Ancestry | # Population | % Population |
| Afghan | 12 | 0.1% |
| African | 8 | 0.1% |
| Albanian | 253 | 3.0% |
| American | 567 | 6.7% |
| Arab | 60 | 0.7% |
| Argentinean | 74 | 0.9% |
| Armenian | 15 | 0.2% |
| Australian | 13 | 0.2% |
| Austrian | 90 | 1.1% |
| Belgian | 13 | 0.2% |
| Bhutanese | 46 | 0.5% |
| British | 53 | 0.6% |
| Burmese | 35 | 0.4% |
| Central American | 105 | 1.2% |
| Central American Indian | 21 | 0.3% |
| Colombian | 2 | 0.0% |
| Costa Rican | 44 | 0.5% |
| Croatian | 10 | 0.1% |
| Cuban | 84 | 1.0% |
| Czech | 11 | 0.1% |
| Czechoslovakian | 10 | 0.1% |
| Danish | 37 | 0.4% |
| Dominican | 79 | 0.9% |
| Dutch | 137 | 1.6% |
| Eastern European | 278 | 3.3% |
| Ecuadorian | 63 | 0.7% |
| English | 546 | 6.5% |
| European | 197 | 2.3% |
| Finnish | 14 | 0.2% |
| French | 91 | 1.1% |
| French Canadian | 11 | 0.1% |
| German | 746 | 8.8% |
| Greek | 129 | 1.5% |
| Guatemalan | 21 | 0.3% |
| Guyanese | 8 | 0.1% |
| Haitian | 25 | 0.3% |
| Honduran | 12 | 0.1% |
| Hungarian | 33 | 0.4% |
| Indian (Asian) | 255 | 3.0% |
| Iranian | 70 | 0.8% |
| Irish | 1,101 | 13.0% |
| Israeli | 60 | 0.7% |
| Italian | 1,421 | 16.8% |
| Jamaican | 117 | 1.4% |
| Korean | 84 | 1.0% |
| Latvian | 29 | 0.3% |
| Lebanese | 32 | 0.4% |
| Lithuanian | 33 | 0.4% |
| Macedonian | 50 | 0.6% |
| Mexican | 146 | 1.7% |
| Moroccan | 5 | 0.1% |
| Nicaraguan | 12 | 0.1% |
| Northern European | 40 | 0.5% |
| Norwegian | 44 | 0.5% |
| Pakistani | 22 | 0.3% |
| Polish | 275 | 3.3% |
| Portuguese | 8 | 0.1% |
| Puerto Rican | 192 | 2.3% |
| Romanian | 20 | 0.2% |
| Russian | 449 | 5.3% |
| Salvadoran | 16 | 0.2% |
| Scotch-Irish | 44 | 0.5% |
| Scottish | 82 | 1.0% |
| Serbian | 10 | 0.1% |
| Slovak | 17 | 0.2% |
| South African | 17 | 0.2% |
| South American | 148 | 1.8% |
| Spaniard | 27 | 0.3% |
| Spanish | 13 | 0.2% |
| Subsaharan African | 25 | 0.3% |
| Swedish | 70 | 0.8% |
| Swiss | 26 | 0.3% |
| Thai | 152 | 1.8% |
| Trinidadian and Tobagonian | 6 | 0.1% |
| Turkish | 9 | 0.1% |
| Ukrainian | 151 | 1.8% |
| Uruguayan | 9 | 0.1% |
| Welsh | 34 | 0.4% |
| West Indian | 7 | 0.1% | View All 79 Rows |
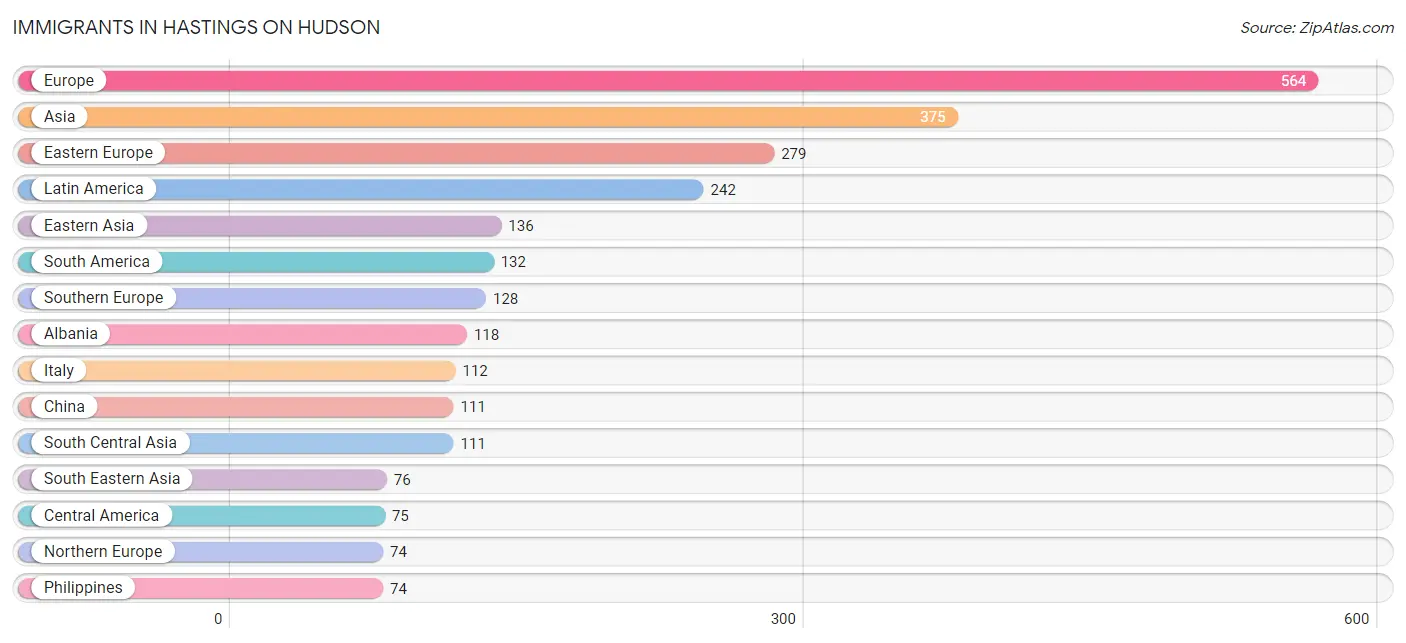
Immigrants in Hastings On Hudson
The most numerous immigrant groups reported in Hastings On Hudson came from Europe (564 | 6.7%), Asia (375 | 4.4%), Eastern Europe (279 | 3.3%), Latin America (242 | 2.9%), and Eastern Asia (136 | 1.6%), together accounting for 18.9% of all Hastings On Hudson residents.
| Immigration Origin | # Population | % Population |
| Afghanistan | 12 | 0.1% |
| Africa | 29 | 0.3% |
| Albania | 118 | 1.4% |
| Argentina | 64 | 0.8% |
| Asia | 375 | 4.4% |
| Australia | 27 | 0.3% |
| Austria | 11 | 0.1% |
| Barbados | 7 | 0.1% |
| Brazil | 8 | 0.1% |
| Canada | 44 | 0.5% |
| Caribbean | 35 | 0.4% |
| Central America | 75 | 0.9% |
| Chile | 22 | 0.3% |
| China | 111 | 1.3% |
| Czechoslovakia | 12 | 0.1% |
| Denmark | 10 | 0.1% |
| Eastern Asia | 136 | 1.6% |
| Eastern Europe | 279 | 3.3% |
| Ecuador | 29 | 0.3% |
| El Salvador | 9 | 0.1% |
| England | 9 | 0.1% |
| Europe | 564 | 6.7% |
| France | 36 | 0.4% |
| Germany | 19 | 0.2% |
| Greece | 16 | 0.2% |
| Guatemala | 21 | 0.3% |
| Honduras | 12 | 0.1% |
| India | 47 | 0.6% |
| Iran | 24 | 0.3% |
| Ireland | 19 | 0.2% |
| Israel | 26 | 0.3% |
| Italy | 112 | 1.3% |
| Jamaica | 22 | 0.3% |
| Japan | 17 | 0.2% |
| Korea | 8 | 0.1% |
| Latin America | 242 | 2.9% |
| Latvia | 9 | 0.1% |
| Mexico | 33 | 0.4% |
| Morocco | 5 | 0.1% |
| Nepal | 28 | 0.3% |
| Netherlands | 7 | 0.1% |
| North Macedonia | 19 | 0.2% |
| Northern Africa | 5 | 0.1% |
| Northern Europe | 74 | 0.9% |
| Oceania | 27 | 0.3% |
| Philippines | 74 | 0.9% |
| Poland | 18 | 0.2% |
| Russia | 47 | 0.6% |
| Serbia | 10 | 0.1% |
| South Africa | 24 | 0.3% |
| South America | 132 | 1.6% |
| South Central Asia | 111 | 1.3% |
| South Eastern Asia | 76 | 0.9% |
| Southern Europe | 128 | 1.5% |
| Taiwan | 32 | 0.4% |
| Thailand | 2 | 0.0% |
| Trinidad and Tobago | 6 | 0.1% |
| Turkey | 26 | 0.3% |
| Ukraine | 35 | 0.4% |
| Uruguay | 9 | 0.1% |
| Western Asia | 52 | 0.6% |
| Western Europe | 73 | 0.9% | View All 62 Rows |
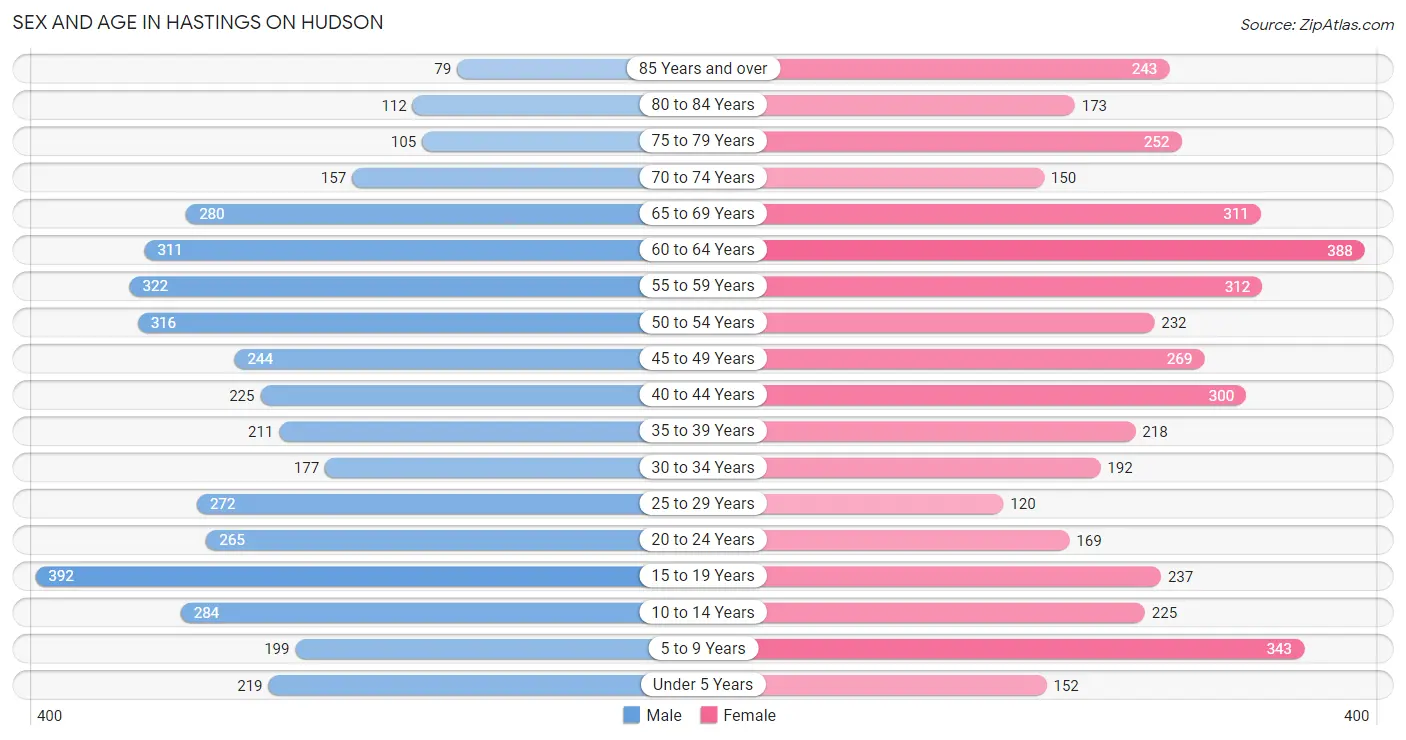
Sex and Age in Hastings On Hudson
Sex and Age in Hastings On Hudson
The most populous age groups in Hastings On Hudson are 15 to 19 Years (392 | 9.4%) for men and 60 to 64 Years (388 | 9.0%) for women.
| Age Bracket | Male | Female |
| Under 5 Years | 219 (5.2%) | 152 (3.5%) |
| 5 to 9 Years | 199 (4.8%) | 343 (8.0%) |
| 10 to 14 Years | 284 (6.8%) | 225 (5.2%) |
| 15 to 19 Years | 392 (9.4%) | 237 (5.5%) |
| 20 to 24 Years | 265 (6.4%) | 169 (3.9%) |
| 25 to 29 Years | 272 (6.5%) | 120 (2.8%) |
| 30 to 34 Years | 177 (4.2%) | 192 (4.5%) |
| 35 to 39 Years | 211 (5.1%) | 218 (5.1%) |
| 40 to 44 Years | 225 (5.4%) | 300 (7.0%) |
| 45 to 49 Years | 244 (5.9%) | 269 (6.3%) |
| 50 to 54 Years | 316 (7.6%) | 232 (5.4%) |
| 55 to 59 Years | 322 (7.7%) | 312 (7.3%) |
| 60 to 64 Years | 311 (7.5%) | 388 (9.0%) |
| 65 to 69 Years | 280 (6.7%) | 311 (7.3%) |
| 70 to 74 Years | 157 (3.8%) | 150 (3.5%) |
| 75 to 79 Years | 105 (2.5%) | 252 (5.9%) |
| 80 to 84 Years | 112 (2.7%) | 173 (4.0%) |
| 85 Years and over | 79 (1.9%) | 243 (5.7%) |
| Total | 4,170 (100.0%) | 4,286 (100.0%) |
Families and Households in Hastings On Hudson
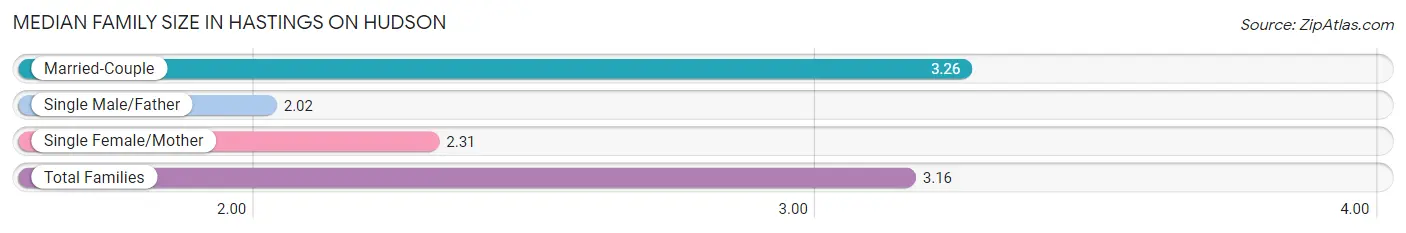
Median Family Size in Hastings On Hudson
The median family size in Hastings On Hudson is 3.16 persons per family, with married-couple families (2,002 | 90.3%) accounting for the largest median family size of 3.26 persons per family. On the other hand, single male/father families (52 | 2.4%) represent the smallest median family size with 2.02 persons per family.
| Family Type | # Families | Family Size |
| Married-Couple | 2,002 (90.3%) | 3.26 |
| Single Male/Father | 52 (2.4%) | 2.02 |
| Single Female/Mother | 162 (7.3%) | 2.31 |
| Total Families | 2,216 (100.0%) | 3.16 |
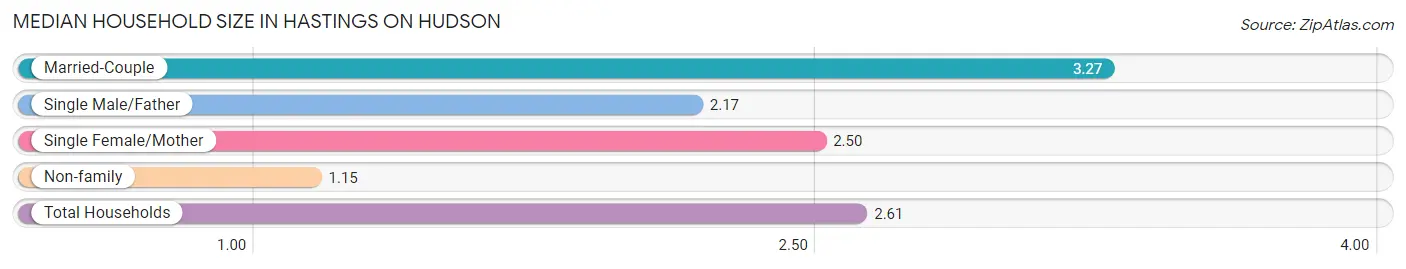
Median Household Size in Hastings On Hudson
The median household size in Hastings On Hudson is 2.61 persons per household, with married-couple households (2,002 | 64.8%) accounting for the largest median household size of 3.27 persons per household. non-family households (873 | 28.3%) represent the smallest median household size with 1.15 persons per household.
| Household Type | # Households | Household Size |
| Married-Couple | 2,002 (64.8%) | 3.27 |
| Single Male/Father | 52 (1.7%) | 2.17 |
| Single Female/Mother | 162 (5.2%) | 2.50 |
| Non-family | 873 (28.3%) | 1.15 |
| Total Households | 3,089 (100.0%) | 2.61 |
Household Size by Marriage Status in Hastings On Hudson
Out of a total of 3,089 households in Hastings On Hudson, 2,216 (71.7%) are family households, while 873 (28.3%) are nonfamily households. The most numerous type of family households are 2-person households, comprising 917, and the most common type of nonfamily households are 1-person households, comprising 752.
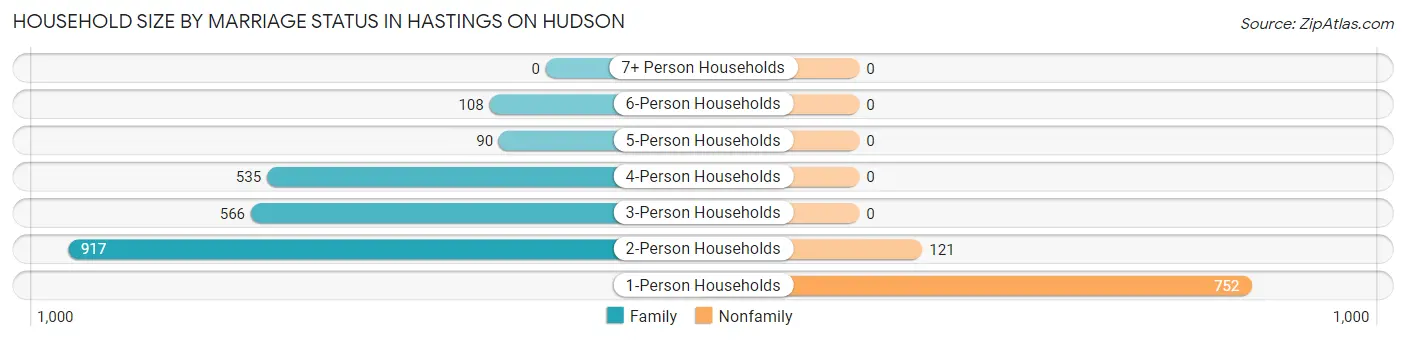
| Household Size | Family Households | Nonfamily Households |
| 1-Person Households | - | 752 (24.3%) |
| 2-Person Households | 917 (29.7%) | 121 (3.9%) |
| 3-Person Households | 566 (18.3%) | 0 (0.0%) |
| 4-Person Households | 535 (17.3%) | 0 (0.0%) |
| 5-Person Households | 90 (2.9%) | 0 (0.0%) |
| 6-Person Households | 108 (3.5%) | 0 (0.0%) |
| 7+ Person Households | 0 (0.0%) | 0 (0.0%) |
| Total | 2,216 (71.7%) | 873 (28.3%) |
Female Fertility in Hastings On Hudson
Fertility by Age in Hastings On Hudson
Average fertility rate in Hastings On Hudson is 40.0 births per 1,000 women. Women in the age bracket of 20 to 34 years have the highest fertility rate with 129.0 births per 1,000 women. Women in the age bracket of 20 to 34 years acount for 100.0% of all women with births.
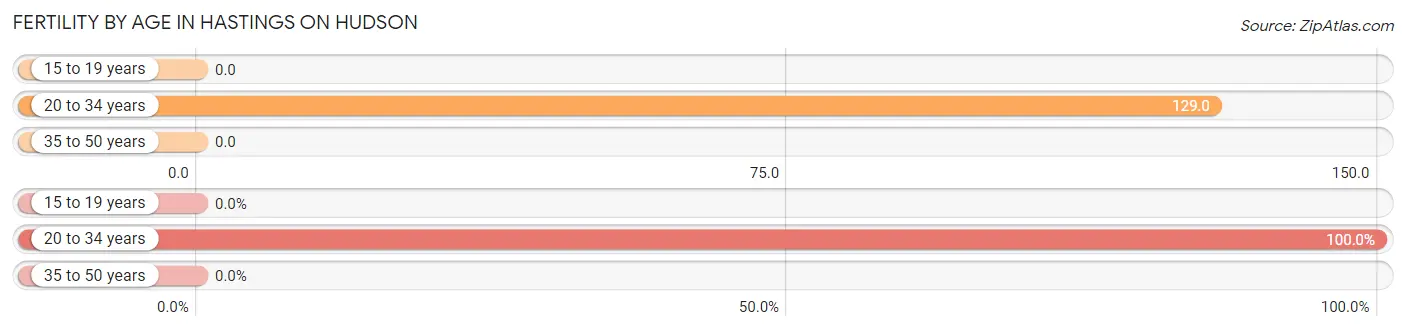
| Age Bracket | Women with Births | Births / 1,000 Women |
| 15 to 19 years | 0 (0.0%) | 0.0 |
| 20 to 34 years | 62 (100.0%) | 129.0 |
| 35 to 50 years | 0 (0.0%) | 0.0 |
| Total | 62 (100.0%) | 40.0 |
Fertility by Age by Marriage Status in Hastings On Hudson
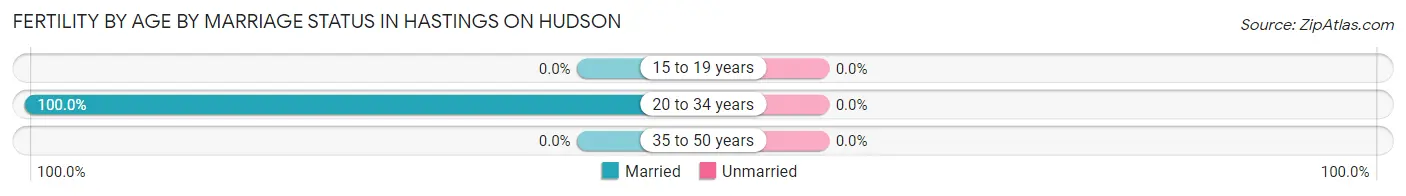
| Age Bracket | Married | Unmarried |
| 15 to 19 years | 0 (0.0%) | 0 (0.0%) |
| 20 to 34 years | 62 (100.0%) | 0 (0.0%) |
| 35 to 50 years | 0 (0.0%) | 0 (0.0%) |
| Total | 62 (100.0%) | 0 (0.0%) |
Fertility by Education in Hastings On Hudson
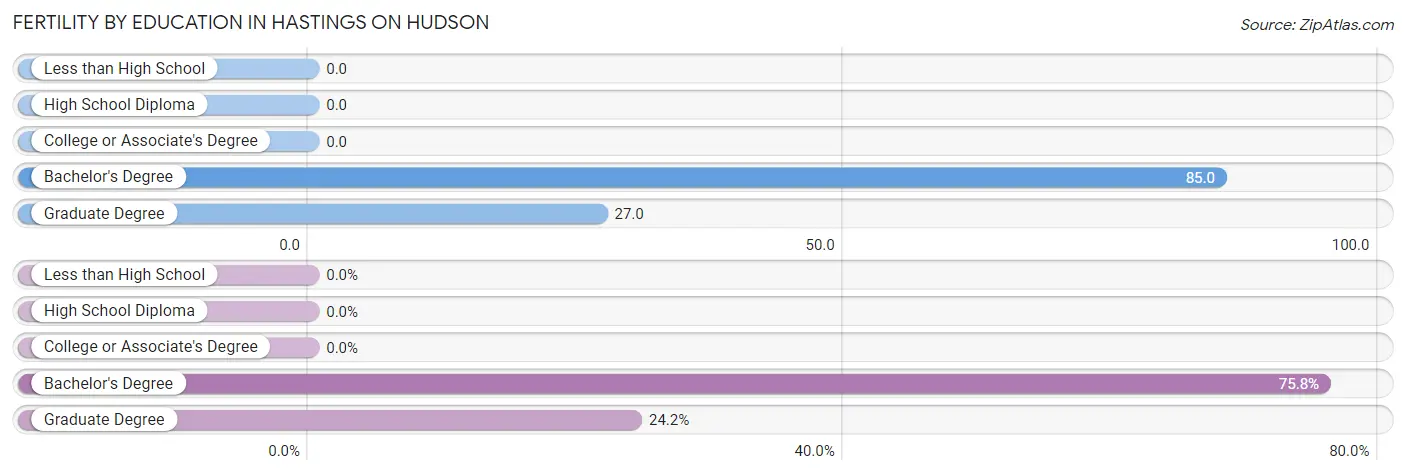
| Educational Attainment | Women with Births | Births / 1,000 Women |
| Less than High School | 0 (0.0%) | 0.0 |
| High School Diploma | 0 (0.0%) | 0.0 |
| College or Associate's Degree | 0 (0.0%) | 0.0 |
| Bachelor's Degree | 47 (75.8%) | 85.0 |
| Graduate Degree | 15 (24.2%) | 27.0 |
| Total | 62 (100.0%) | 40.0 |
Fertility by Education by Marriage Status in Hastings On Hudson
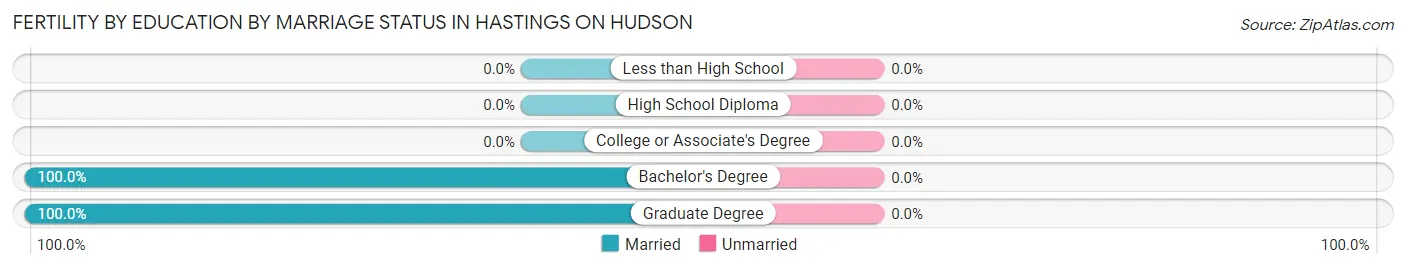
| Educational Attainment | Married | Unmarried |
| Less than High School | 0 (0.0%) | 0 (0.0%) |
| High School Diploma | 0 (0.0%) | 0 (0.0%) |
| College or Associate's Degree | 0 (0.0%) | 0 (0.0%) |
| Bachelor's Degree | 47 (100.0%) | 0 (0.0%) |
| Graduate Degree | 15 (100.0%) | 0 (0.0%) |
| Total | 62 (100.0%) | 0 (0.0%) |
Employment Characteristics in Hastings On Hudson
Employment by Class of Employer in Hastings On Hudson
Among the 4,388 employed individuals in Hastings On Hudson, private company employees (2,013 | 45.9%), not-for-profit organizations (1,081 | 24.6%), and self-employed (not incorporated) (491 | 11.2%) make up the most common classes of employment.
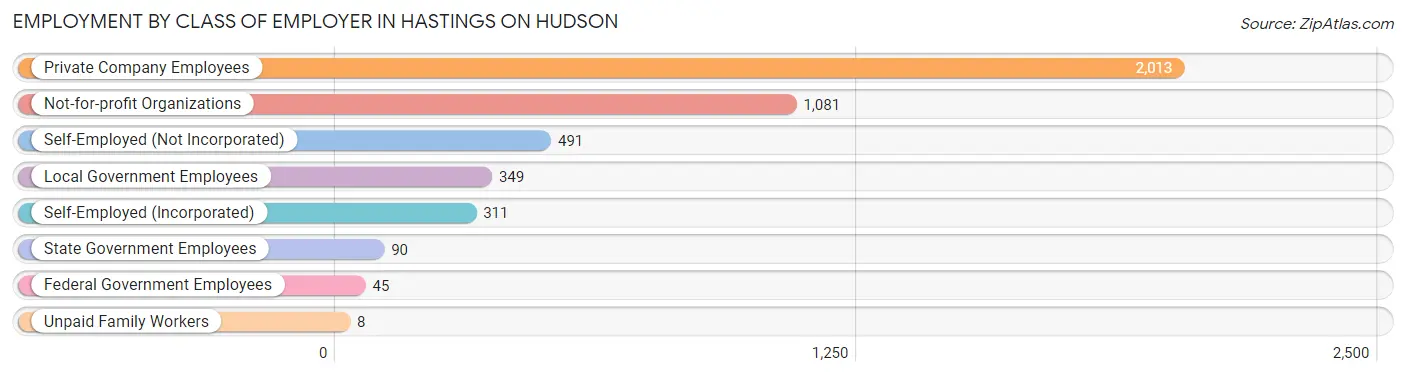
| Employer Class | # Employees | % Employees |
| Private Company Employees | 2,013 | 45.9% |
| Self-Employed (Incorporated) | 311 | 7.1% |
| Self-Employed (Not Incorporated) | 491 | 11.2% |
| Not-for-profit Organizations | 1,081 | 24.6% |
| Local Government Employees | 349 | 8.0% |
| State Government Employees | 90 | 2.1% |
| Federal Government Employees | 45 | 1.0% |
| Unpaid Family Workers | 8 | 0.2% |
| Total | 4,388 | 100.0% |
Employment Status by Age in Hastings On Hudson
According to the labor force statistics for Hastings On Hudson, out of the total population over 16 years of age (6,800), 66.8% or 4,542 individuals are in the labor force, with 2.2% or 100 of them unemployed. The age group with the highest labor force participation rate is 30 to 34 years, with 93.5% or 345 individuals in the labor force. Within the labor force, the 20 to 24 years age range has the highest percentage of unemployed individuals, with 8.4% or 28 of them being unemployed.
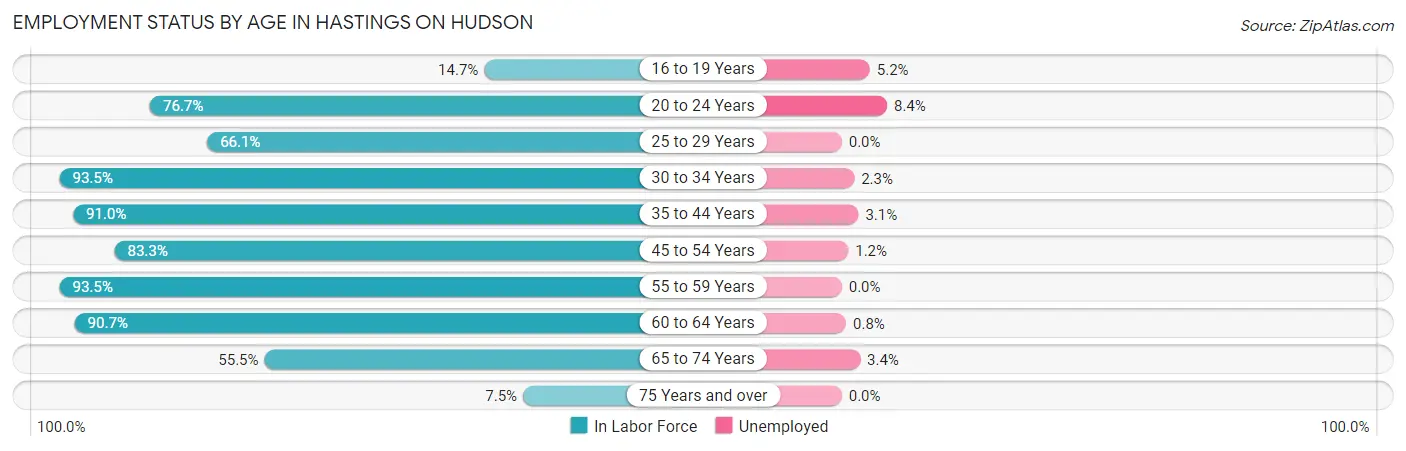
| Age Bracket | In Labor Force | Unemployed |
| 16 to 19 Years | 58 (14.7%) | 3 (5.2%) |
| 20 to 24 Years | 333 (76.7%) | 28 (8.4%) |
| 25 to 29 Years | 259 (66.1%) | 0 (0.0%) |
| 30 to 34 Years | 345 (93.5%) | 8 (2.3%) |
| 35 to 44 Years | 868 (91.0%) | 27 (3.1%) |
| 45 to 54 Years | 884 (83.3%) | 11 (1.2%) |
| 55 to 59 Years | 593 (93.5%) | 0 (0.0%) |
| 60 to 64 Years | 634 (90.7%) | 5 (0.8%) |
| 65 to 74 Years | 498 (55.5%) | 17 (3.4%) |
| 75 Years and over | 72 (7.5%) | 0 (0.0%) |
| Total | 4,542 (66.8%) | 100 (2.2%) |
Employment Status by Educational Attainment in Hastings On Hudson
According to labor force statistics for Hastings On Hudson, 87.2% of individuals (3,583) out of the total population between 25 and 64 years of age (4,109) are in the labor force, with 1.4% or 50 of them being unemployed. The group with the highest labor force participation rate are those with the educational attainment of bachelor's degree or higher, with 89.4% or 2,814 individuals in the labor force. Within the labor force, individuals with less than high school education have the highest percentage of unemployment, with 18.2% or 10 of them being unemployed.
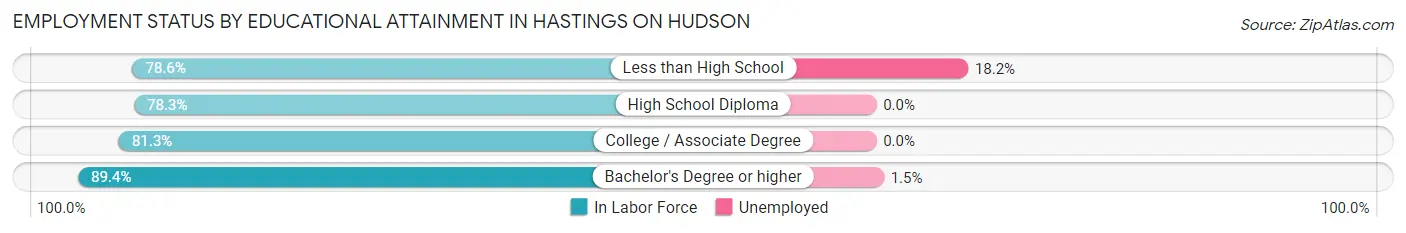
| Educational Attainment | In Labor Force | Unemployed |
| Less than High School | 55 (78.6%) | 13 (18.2%) |
| High School Diploma | 249 (78.3%) | 0 (0.0%) |
| College / Associate Degree | 466 (81.3%) | 0 (0.0%) |
| Bachelor's Degree or higher | 2,814 (89.4%) | 47 (1.5%) |
| Total | 3,583 (87.2%) | 58 (1.4%) |
Employment Occupations by Sex in Hastings On Hudson
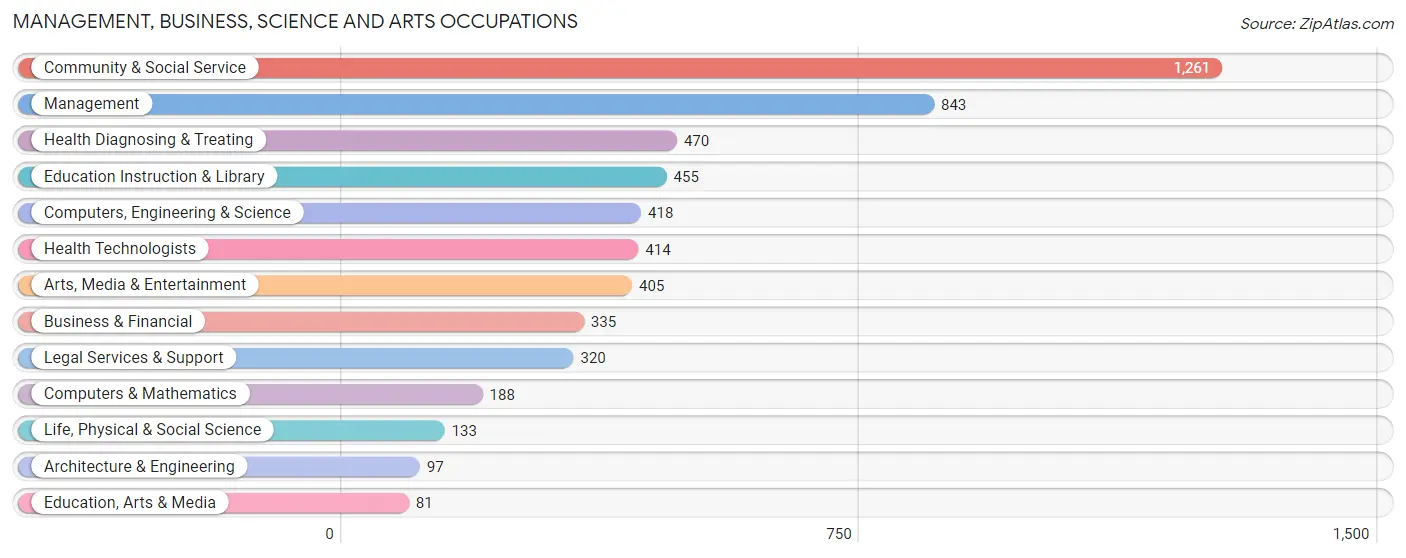
Management, Business, Science and Arts Occupations
The most common Management, Business, Science and Arts occupations in Hastings On Hudson are Community & Social Service (1,261 | 28.4%), Management (843 | 19.0%), Health Diagnosing & Treating (470 | 10.6%), Education Instruction & Library (455 | 10.2%), and Computers, Engineering & Science (418 | 9.4%).
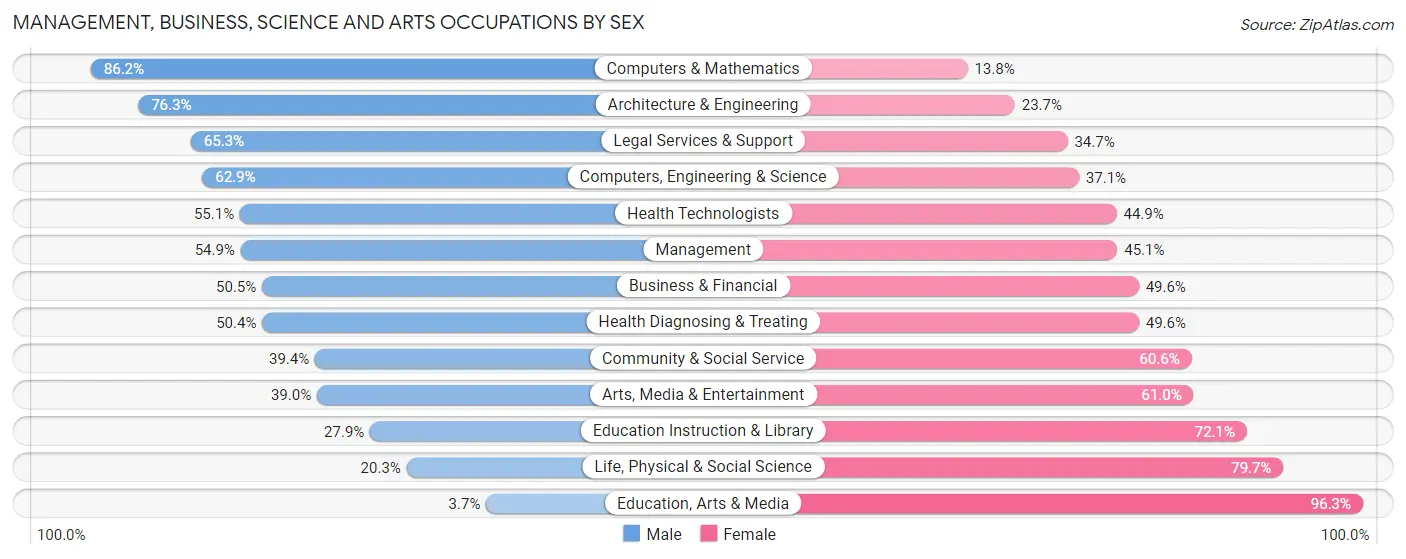
Management, Business, Science and Arts Occupations by Sex
Within the Management, Business, Science and Arts occupations in Hastings On Hudson, the most male-oriented occupations are Computers & Mathematics (86.2%), Architecture & Engineering (76.3%), and Legal Services & Support (65.3%), while the most female-oriented occupations are Education, Arts & Media (96.3%), Life, Physical & Social Science (79.7%), and Education Instruction & Library (72.1%).
| Occupation | Male | Female |
| Management | 463 (54.9%) | 380 (45.1%) |
| Business & Financial | 169 (50.4%) | 166 (49.5%) |
| Computers, Engineering & Science | 263 (62.9%) | 155 (37.1%) |
| Computers & Mathematics | 162 (86.2%) | 26 (13.8%) |
| Architecture & Engineering | 74 (76.3%) | 23 (23.7%) |
| Life, Physical & Social Science | 27 (20.3%) | 106 (79.7%) |
| Community & Social Service | 497 (39.4%) | 764 (60.6%) |
| Education, Arts & Media | 3 (3.7%) | 78 (96.3%) |
| Legal Services & Support | 209 (65.3%) | 111 (34.7%) |
| Education Instruction & Library | 127 (27.9%) | 328 (72.1%) |
| Arts, Media & Entertainment | 158 (39.0%) | 247 (61.0%) |
| Health Diagnosing & Treating | 237 (50.4%) | 233 (49.6%) |
| Health Technologists | 228 (55.1%) | 186 (44.9%) |
| Total (Category) | 1,629 (49.0%) | 1,698 (51.0%) |
| Total (Overall) | 2,287 (51.4%) | 2,158 (48.5%) |
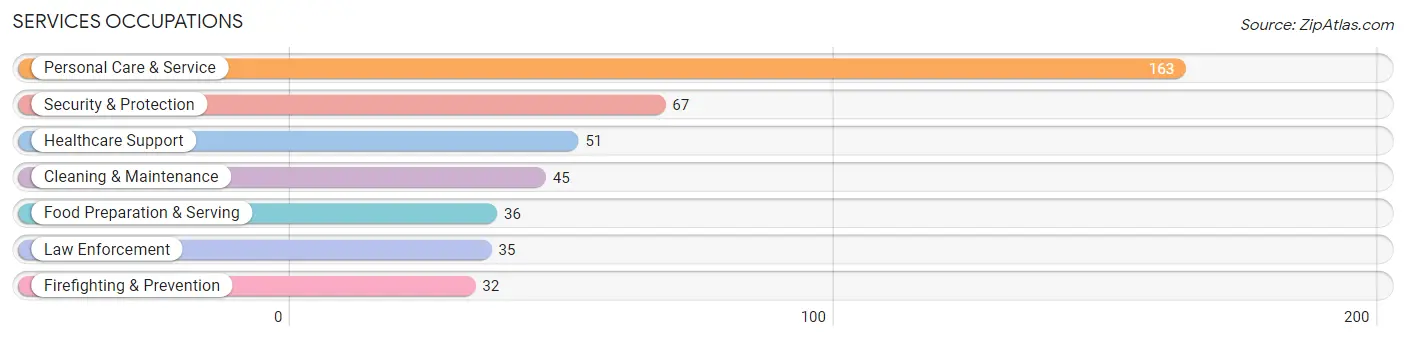
Services Occupations
The most common Services occupations in Hastings On Hudson are Personal Care & Service (163 | 3.7%), Security & Protection (67 | 1.5%), Healthcare Support (51 | 1.1%), Cleaning & Maintenance (45 | 1.0%), and Food Preparation & Serving (36 | 0.8%).
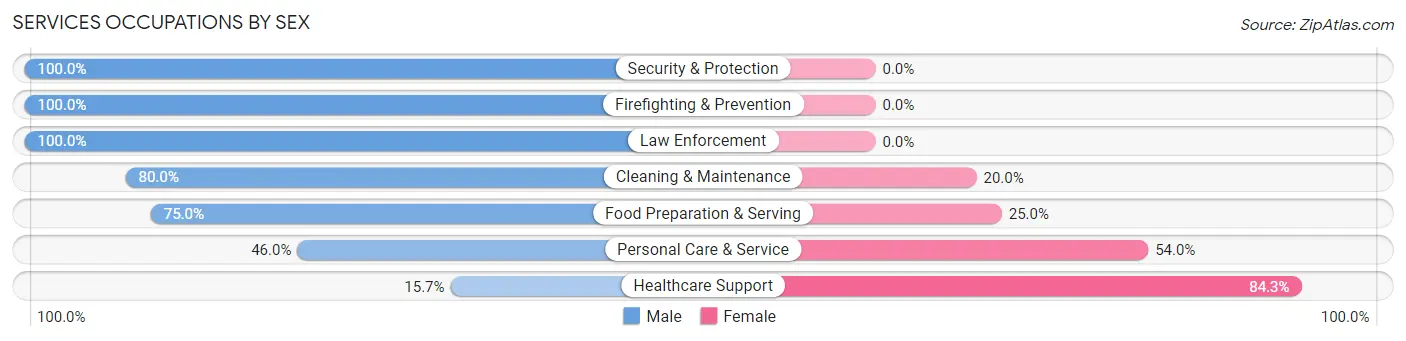
Services Occupations by Sex
Within the Services occupations in Hastings On Hudson, the most male-oriented occupations are Security & Protection (100.0%), Firefighting & Prevention (100.0%), and Law Enforcement (100.0%), while the most female-oriented occupations are Healthcare Support (84.3%), Personal Care & Service (54.0%), and Food Preparation & Serving (25.0%).
| Occupation | Male | Female |
| Healthcare Support | 8 (15.7%) | 43 (84.3%) |
| Security & Protection | 67 (100.0%) | 0 (0.0%) |
| Firefighting & Prevention | 32 (100.0%) | 0 (0.0%) |
| Law Enforcement | 35 (100.0%) | 0 (0.0%) |
| Food Preparation & Serving | 27 (75.0%) | 9 (25.0%) |
| Cleaning & Maintenance | 36 (80.0%) | 9 (20.0%) |
| Personal Care & Service | 75 (46.0%) | 88 (54.0%) |
| Total (Category) | 213 (58.8%) | 149 (41.2%) |
| Total (Overall) | 2,287 (51.4%) | 2,158 (48.5%) |
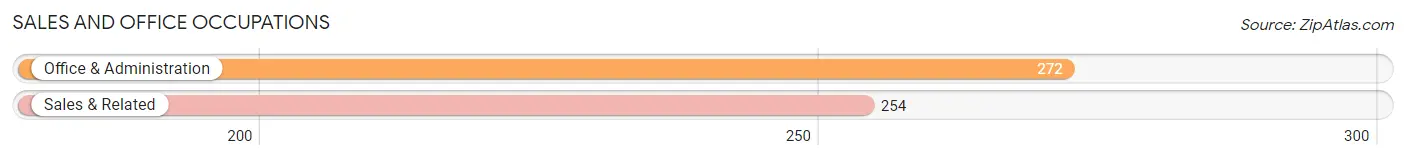
Sales and Office Occupations
The most common Sales and Office occupations in Hastings On Hudson are Office & Administration (272 | 6.1%), and Sales & Related (254 | 5.7%).
Sales and Office Occupations by Sex
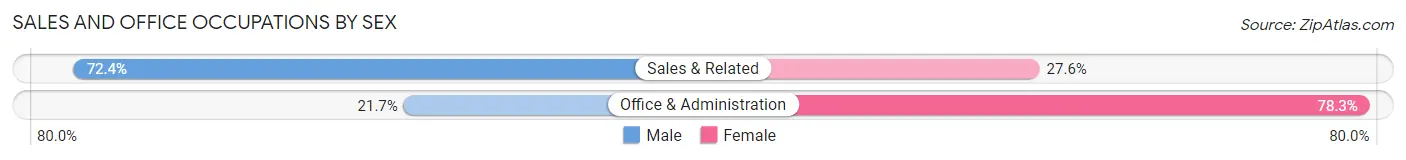
| Occupation | Male | Female |
| Sales & Related | 184 (72.4%) | 70 (27.6%) |
| Office & Administration | 59 (21.7%) | 213 (78.3%) |
| Total (Category) | 243 (46.2%) | 283 (53.8%) |
| Total (Overall) | 2,287 (51.4%) | 2,158 (48.5%) |
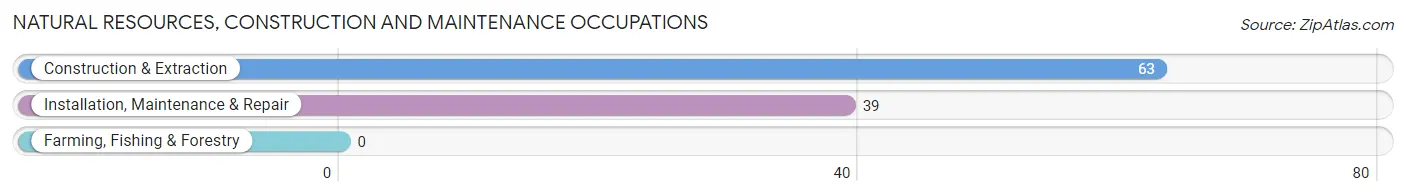
Natural Resources, Construction and Maintenance Occupations
The most common Natural Resources, Construction and Maintenance occupations in Hastings On Hudson are Construction & Extraction (63 | 1.4%), and Installation, Maintenance & Repair (39 | 0.9%).
Natural Resources, Construction and Maintenance Occupations by Sex
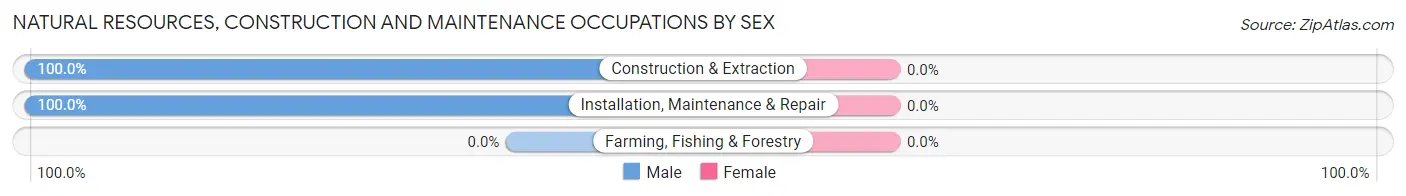
| Occupation | Male | Female |
| Farming, Fishing & Forestry | 0 (0.0%) | 0 (0.0%) |
| Construction & Extraction | 63 (100.0%) | 0 (0.0%) |
| Installation, Maintenance & Repair | 39 (100.0%) | 0 (0.0%) |
| Total (Category) | 102 (100.0%) | 0 (0.0%) |
| Total (Overall) | 2,287 (51.4%) | 2,158 (48.5%) |
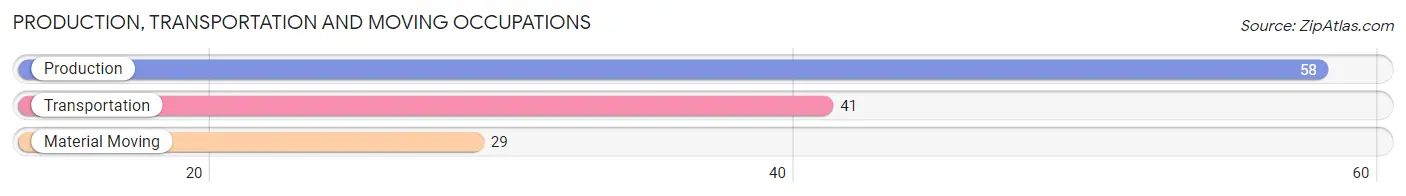
Production, Transportation and Moving Occupations
The most common Production, Transportation and Moving occupations in Hastings On Hudson are Production (58 | 1.3%), Transportation (41 | 0.9%), and Material Moving (29 | 0.6%).
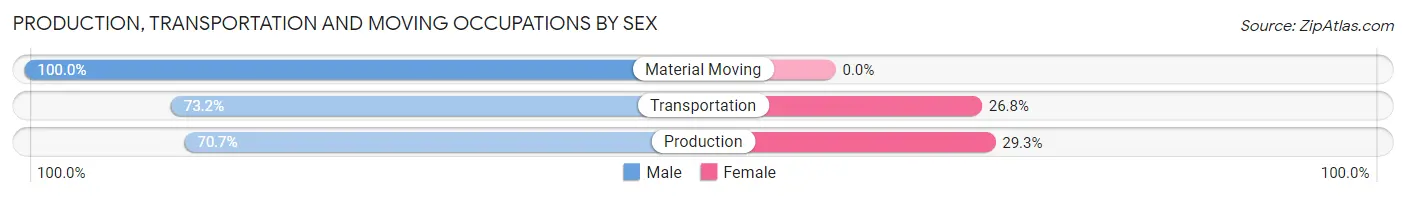
Production, Transportation and Moving Occupations by Sex
| Occupation | Male | Female |
| Production | 41 (70.7%) | 17 (29.3%) |
| Transportation | 30 (73.2%) | 11 (26.8%) |
| Material Moving | 29 (100.0%) | 0 (0.0%) |
| Total (Category) | 100 (78.1%) | 28 (21.9%) |
| Total (Overall) | 2,287 (51.4%) | 2,158 (48.5%) |
Employment Industries by Sex in Hastings On Hudson
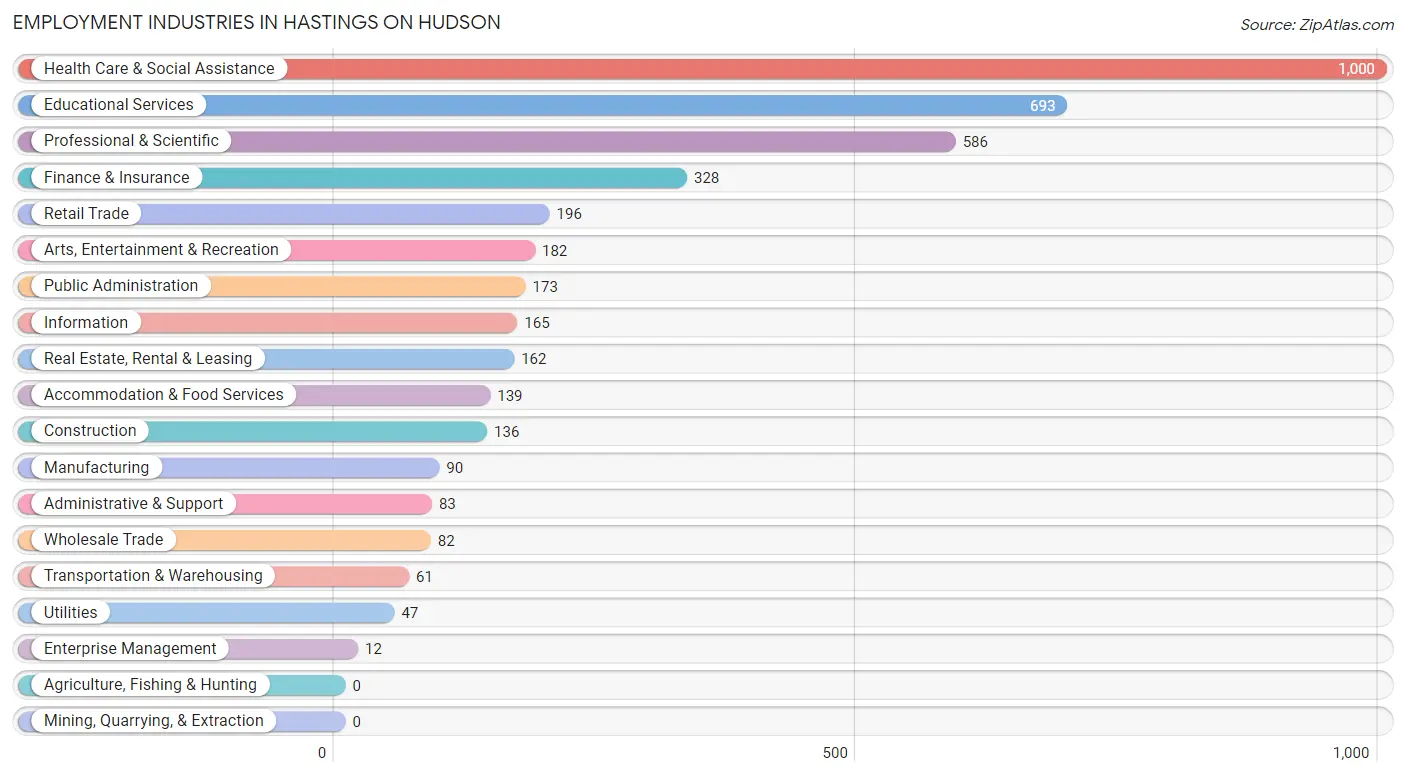
Employment Industries in Hastings On Hudson
The major employment industries in Hastings On Hudson include Health Care & Social Assistance (1,000 | 22.5%), Educational Services (693 | 15.6%), Professional & Scientific (586 | 13.2%), Finance & Insurance (328 | 7.4%), and Retail Trade (196 | 4.4%).
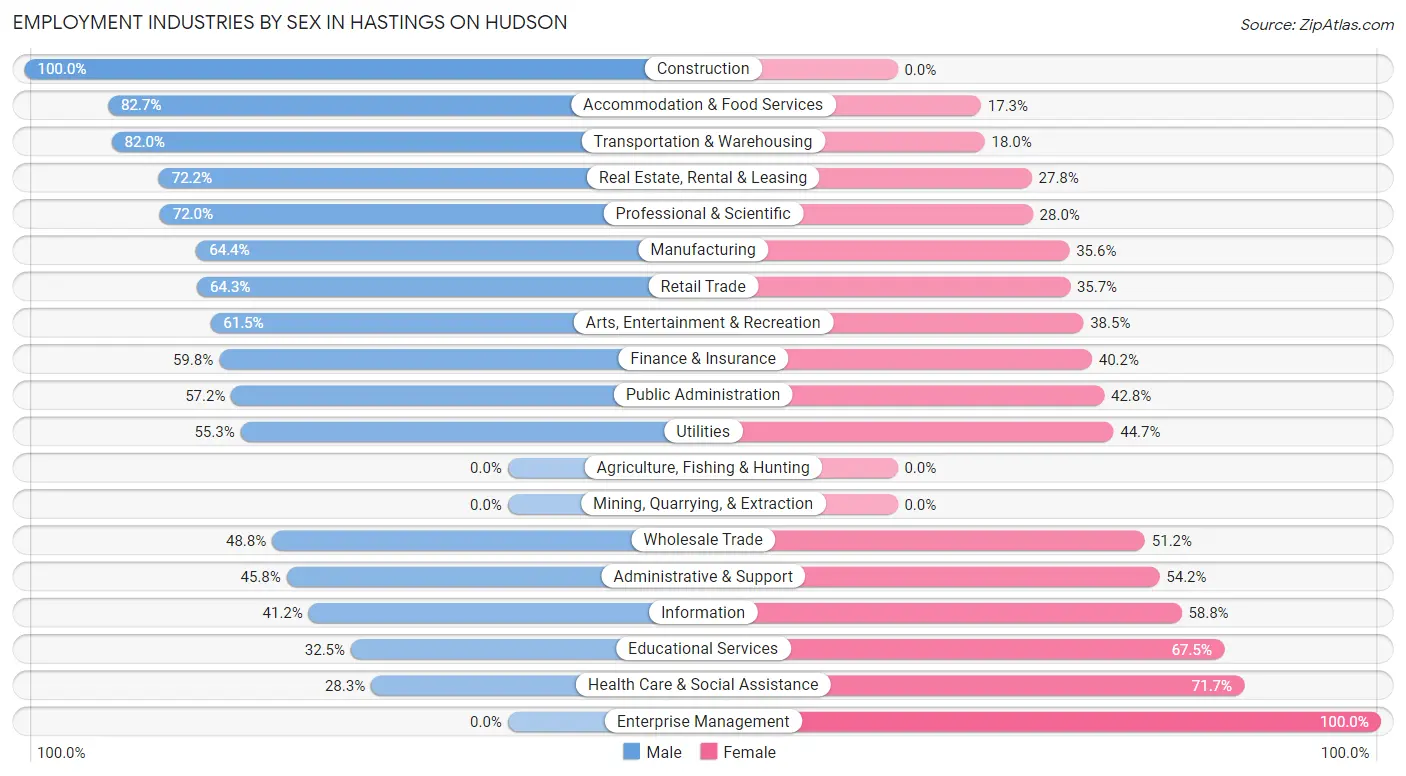
Employment Industries by Sex in Hastings On Hudson
The Hastings On Hudson industries that see more men than women are Construction (100.0%), Accommodation & Food Services (82.7%), and Transportation & Warehousing (82.0%), whereas the industries that tend to have a higher number of women are Enterprise Management (100.0%), Health Care & Social Assistance (71.7%), and Educational Services (67.5%).
| Industry | Male | Female |
| Agriculture, Fishing & Hunting | 0 (0.0%) | 0 (0.0%) |
| Mining, Quarrying, & Extraction | 0 (0.0%) | 0 (0.0%) |
| Construction | 136 (100.0%) | 0 (0.0%) |
| Manufacturing | 58 (64.4%) | 32 (35.6%) |
| Wholesale Trade | 40 (48.8%) | 42 (51.2%) |
| Retail Trade | 126 (64.3%) | 70 (35.7%) |
| Transportation & Warehousing | 50 (82.0%) | 11 (18.0%) |
| Utilities | 26 (55.3%) | 21 (44.7%) |
| Information | 68 (41.2%) | 97 (58.8%) |
| Finance & Insurance | 196 (59.8%) | 132 (40.2%) |
| Real Estate, Rental & Leasing | 117 (72.2%) | 45 (27.8%) |
| Professional & Scientific | 422 (72.0%) | 164 (28.0%) |
| Enterprise Management | 0 (0.0%) | 12 (100.0%) |
| Administrative & Support | 38 (45.8%) | 45 (54.2%) |
| Educational Services | 225 (32.5%) | 468 (67.5%) |
| Health Care & Social Assistance | 283 (28.3%) | 717 (71.7%) |
| Arts, Entertainment & Recreation | 112 (61.5%) | 70 (38.5%) |
| Accommodation & Food Services | 115 (82.7%) | 24 (17.3%) |
| Public Administration | 99 (57.2%) | 74 (42.8%) |
| Total | 2,287 (51.4%) | 2,158 (48.5%) |
Education in Hastings On Hudson
School Enrollment in Hastings On Hudson
The most common levels of schooling among the 2,097 students in Hastings On Hudson are high school (614 | 29.3%), elementary school (393 | 18.7%), and middle school (342 | 16.3%).
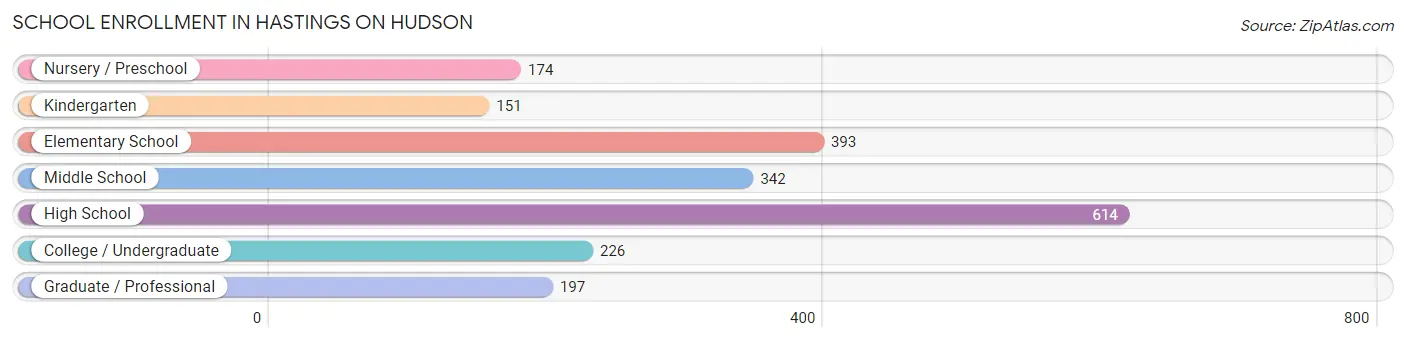
| School Level | # Students | % Students |
| Nursery / Preschool | 174 | 8.3% |
| Kindergarten | 151 | 7.2% |
| Elementary School | 393 | 18.7% |
| Middle School | 342 | 16.3% |
| High School | 614 | 29.3% |
| College / Undergraduate | 226 | 10.8% |
| Graduate / Professional | 197 | 9.4% |
| Total | 2,097 | 100.0% |
School Enrollment by Age by Funding Source in Hastings On Hudson
Out of a total of 2,097 students who are enrolled in schools in Hastings On Hudson, 407 (19.4%) attend a private institution, while the remaining 1,690 (80.6%) are enrolled in public schools. The age group of 3 to 4 year olds has the highest likelihood of being enrolled in private schools, with 127 (81.4% in the age bracket) enrolled. Conversely, the age group of 5 to 9 year old has the lowest likelihood of being enrolled in a private school, with 501 (95.3% in the age bracket) attending a public institution.
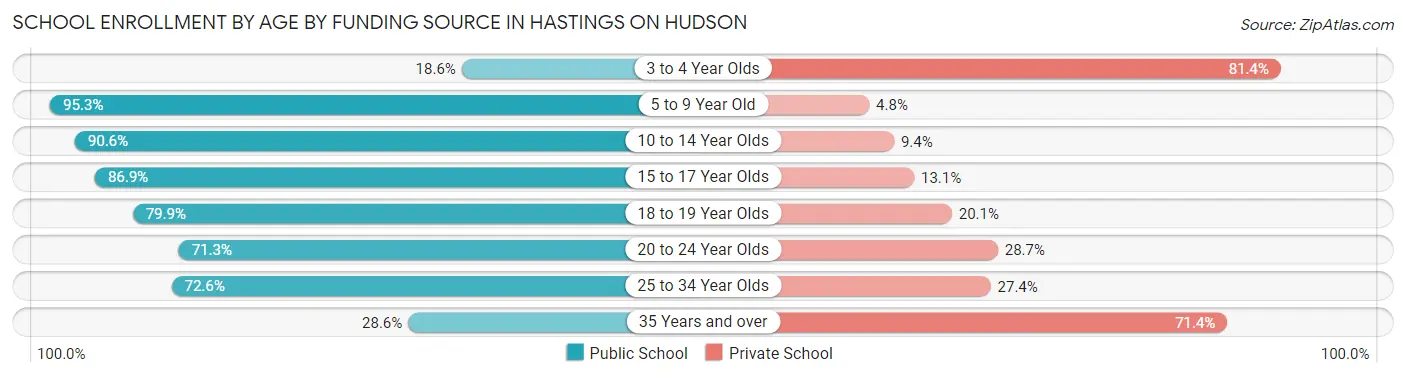
| Age Bracket | Public School | Private School |
| 3 to 4 Year Olds | 29 (18.6%) | 127 (81.4%) |
| 5 to 9 Year Old | 501 (95.3%) | 25 (4.8%) |
| 10 to 14 Year Olds | 445 (90.6%) | 46 (9.4%) |
| 15 to 17 Year Olds | 371 (86.9%) | 56 (13.1%) |
| 18 to 19 Year Olds | 115 (79.9%) | 29 (20.1%) |
| 20 to 24 Year Olds | 144 (71.3%) | 58 (28.7%) |
| 25 to 34 Year Olds | 69 (72.6%) | 26 (27.4%) |
| 35 Years and over | 16 (28.6%) | 40 (71.4%) |
| Total | 1,690 (80.6%) | 407 (19.4%) |
Educational Attainment by Field of Study in Hastings On Hudson
Social sciences (605 | 13.1%), business (495 | 10.7%), visual & performing arts (491 | 10.6%), literature & languages (427 | 9.2%), and psychology (371 | 8.0%) are the most common fields of study among 4,625 individuals in Hastings On Hudson who have obtained a bachelor's degree or higher.
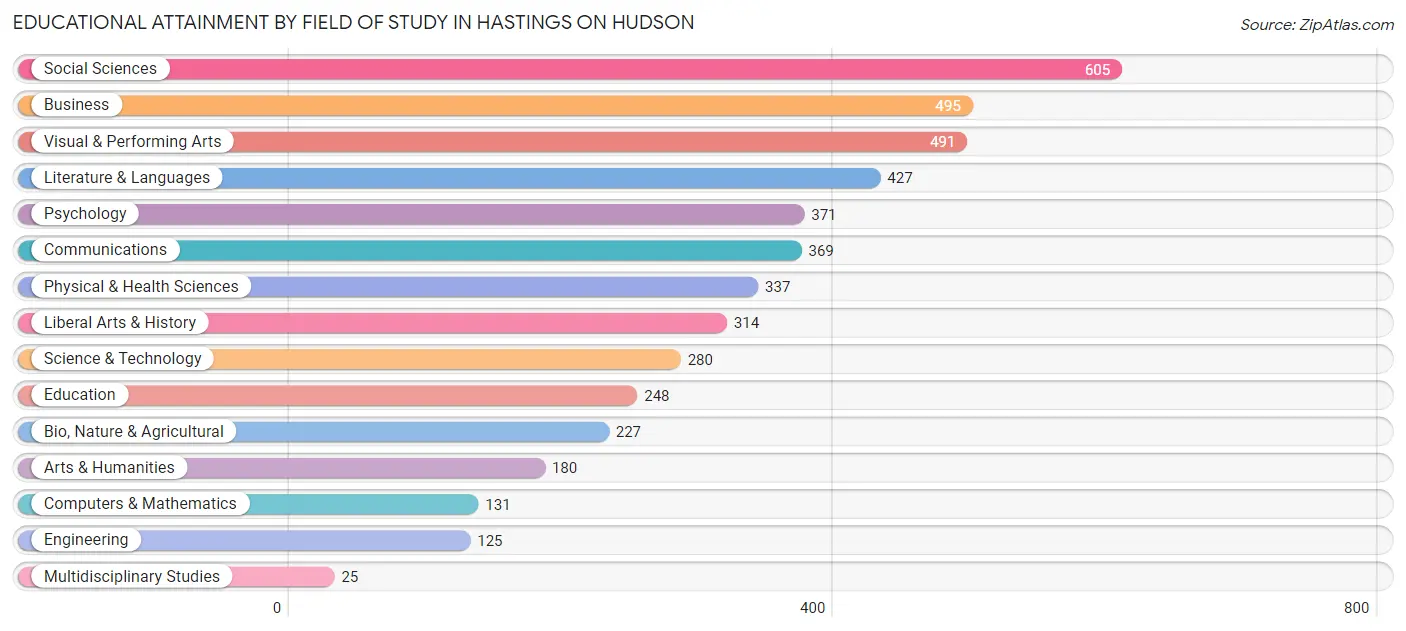
| Field of Study | # Graduates | % Graduates |
| Computers & Mathematics | 131 | 2.8% |
| Bio, Nature & Agricultural | 227 | 4.9% |
| Physical & Health Sciences | 337 | 7.3% |
| Psychology | 371 | 8.0% |
| Social Sciences | 605 | 13.1% |
| Engineering | 125 | 2.7% |
| Multidisciplinary Studies | 25 | 0.5% |
| Science & Technology | 280 | 6.0% |
| Business | 495 | 10.7% |
| Education | 248 | 5.4% |
| Literature & Languages | 427 | 9.2% |
| Liberal Arts & History | 314 | 6.8% |
| Visual & Performing Arts | 491 | 10.6% |
| Communications | 369 | 8.0% |
| Arts & Humanities | 180 | 3.9% |
| Total | 4,625 | 100.0% |
Transportation & Commute in Hastings On Hudson
Vehicle Availability by Sex in Hastings On Hudson
The most prevalent vehicle ownership categories in Hastings On Hudson are males with 2 vehicles (1,177, accounting for 52.9%) and females with 2 vehicles (1,176, making up 55.1%).
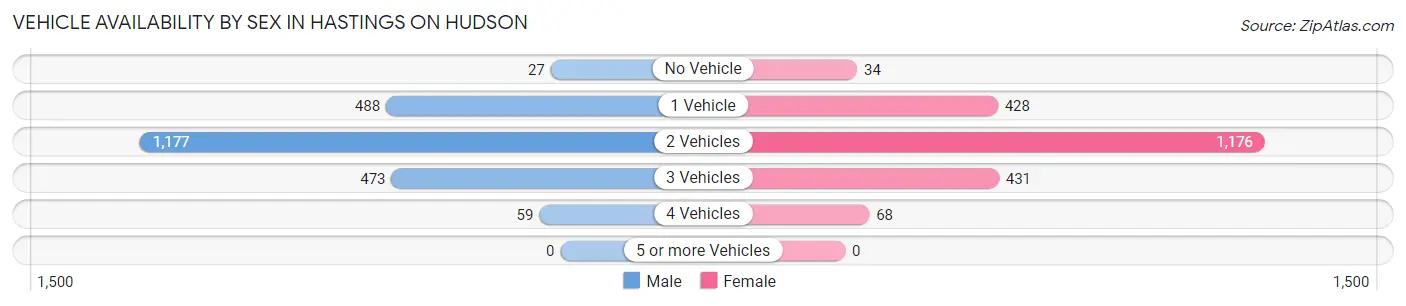
| Vehicles Available | Male | Female |
| No Vehicle | 27 (1.2%) | 34 (1.6%) |
| 1 Vehicle | 488 (21.9%) | 428 (20.0%) |
| 2 Vehicles | 1,177 (52.9%) | 1,176 (55.0%) |
| 3 Vehicles | 473 (21.3%) | 431 (20.2%) |
| 4 Vehicles | 59 (2.6%) | 68 (3.2%) |
| 5 or more Vehicles | 0 (0.0%) | 0 (0.0%) |
| Total | 2,224 (100.0%) | 2,137 (100.0%) |
Commute Time in Hastings On Hudson
The most frequently occuring commute durations in Hastings On Hudson are 60 to 89 minutes (929 commuters, 27.6%), 45 to 59 minutes (382 commuters, 11.4%), and 20 to 24 minutes (288 commuters, 8.6%).
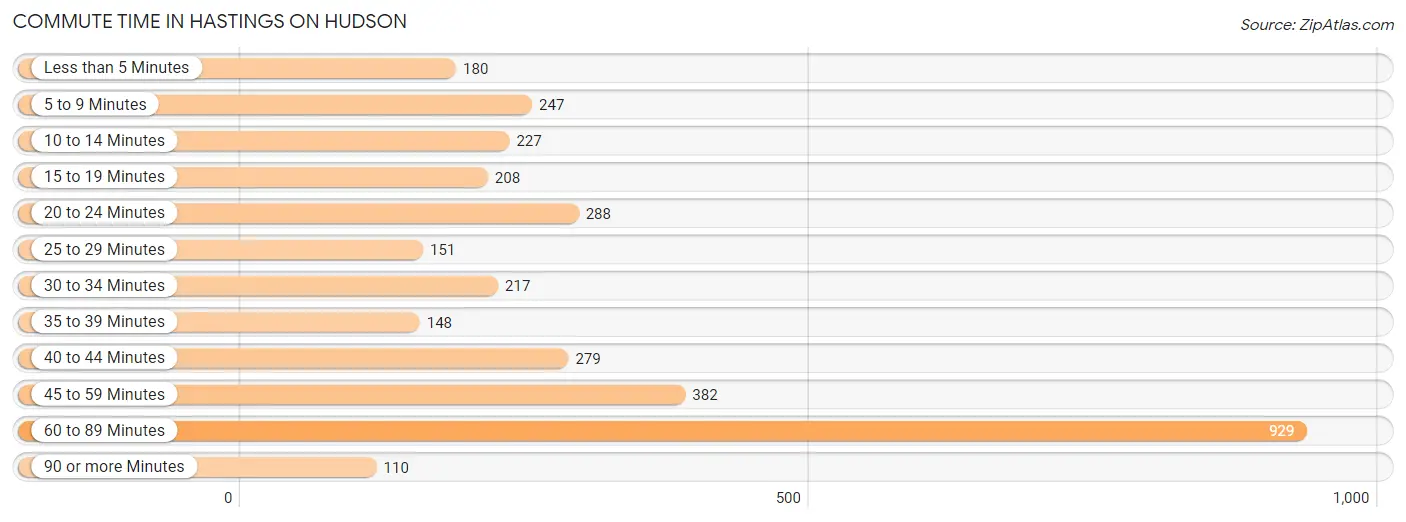
| Commute Time | # Commuters | % Commuters |
| Less than 5 Minutes | 180 | 5.3% |
| 5 to 9 Minutes | 247 | 7.3% |
| 10 to 14 Minutes | 227 | 6.7% |
| 15 to 19 Minutes | 208 | 6.2% |
| 20 to 24 Minutes | 288 | 8.6% |
| 25 to 29 Minutes | 151 | 4.5% |
| 30 to 34 Minutes | 217 | 6.5% |
| 35 to 39 Minutes | 148 | 4.4% |
| 40 to 44 Minutes | 279 | 8.3% |
| 45 to 59 Minutes | 382 | 11.4% |
| 60 to 89 Minutes | 929 | 27.6% |
| 90 or more Minutes | 110 | 3.3% |
Commute Time by Sex in Hastings On Hudson
The most common commute times in Hastings On Hudson are 60 to 89 minutes (467 commuters, 26.4%) for males and 60 to 89 minutes (462 commuters, 28.9%) for females.
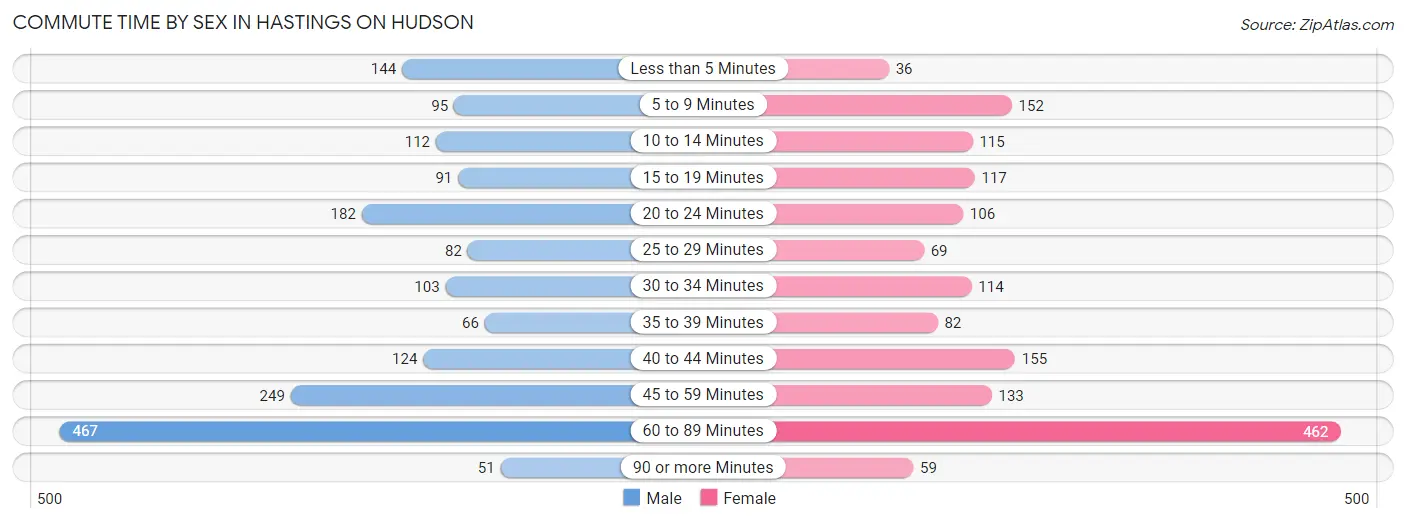
| Commute Time | Male | Female |
| Less than 5 Minutes | 144 (8.2%) | 36 (2.2%) |
| 5 to 9 Minutes | 95 (5.4%) | 152 (9.5%) |
| 10 to 14 Minutes | 112 (6.3%) | 115 (7.2%) |
| 15 to 19 Minutes | 91 (5.1%) | 117 (7.3%) |
| 20 to 24 Minutes | 182 (10.3%) | 106 (6.6%) |
| 25 to 29 Minutes | 82 (4.6%) | 69 (4.3%) |
| 30 to 34 Minutes | 103 (5.8%) | 114 (7.1%) |
| 35 to 39 Minutes | 66 (3.7%) | 82 (5.1%) |
| 40 to 44 Minutes | 124 (7.0%) | 155 (9.7%) |
| 45 to 59 Minutes | 249 (14.1%) | 133 (8.3%) |
| 60 to 89 Minutes | 467 (26.4%) | 462 (28.9%) |
| 90 or more Minutes | 51 (2.9%) | 59 (3.7%) |
Time of Departure to Work by Sex in Hastings On Hudson
The most frequent times of departure to work in Hastings On Hudson are 7:30 AM to 7:59 AM (386, 21.9%) for males and 7:30 AM to 7:59 AM (430, 26.9%) for females.
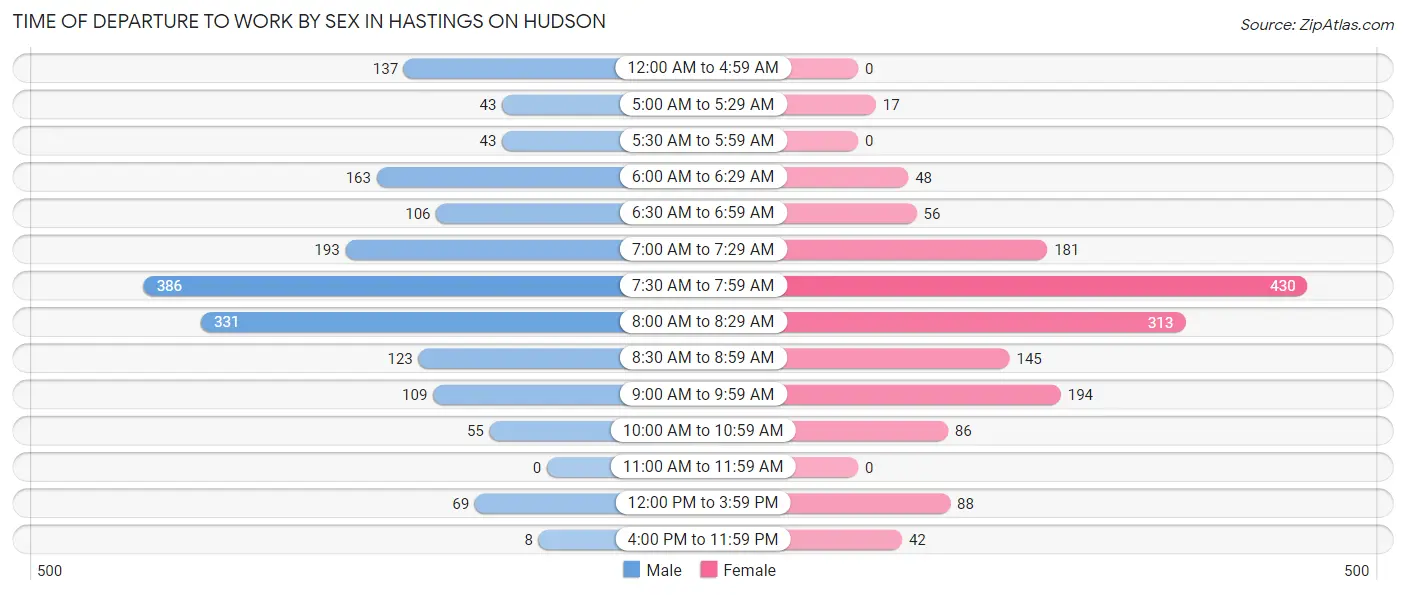
| Time of Departure | Male | Female |
| 12:00 AM to 4:59 AM | 137 (7.8%) | 0 (0.0%) |
| 5:00 AM to 5:29 AM | 43 (2.4%) | 17 (1.1%) |
| 5:30 AM to 5:59 AM | 43 (2.4%) | 0 (0.0%) |
| 6:00 AM to 6:29 AM | 163 (9.2%) | 48 (3.0%) |
| 6:30 AM to 6:59 AM | 106 (6.0%) | 56 (3.5%) |
| 7:00 AM to 7:29 AM | 193 (10.9%) | 181 (11.3%) |
| 7:30 AM to 7:59 AM | 386 (21.9%) | 430 (26.9%) |
| 8:00 AM to 8:29 AM | 331 (18.7%) | 313 (19.6%) |
| 8:30 AM to 8:59 AM | 123 (7.0%) | 145 (9.1%) |
| 9:00 AM to 9:59 AM | 109 (6.2%) | 194 (12.1%) |
| 10:00 AM to 10:59 AM | 55 (3.1%) | 86 (5.4%) |
| 11:00 AM to 11:59 AM | 0 (0.0%) | 0 (0.0%) |
| 12:00 PM to 3:59 PM | 69 (3.9%) | 88 (5.5%) |
| 4:00 PM to 11:59 PM | 8 (0.4%) | 42 (2.6%) |
| Total | 1,766 (100.0%) | 1,600 (100.0%) |
Housing Occupancy in Hastings On Hudson
Occupancy by Ownership in Hastings On Hudson
Of the total 3,089 dwellings in Hastings On Hudson, owner-occupied units account for 2,385 (77.2%), while renter-occupied units make up 704 (22.8%).
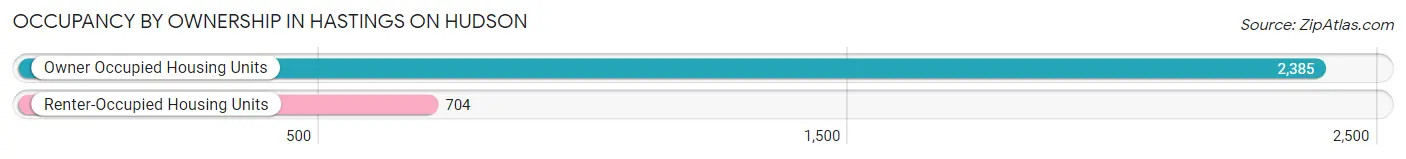
| Occupancy | # Housing Units | % Housing Units |
| Owner Occupied Housing Units | 2,385 | 77.2% |
| Renter-Occupied Housing Units | 704 | 22.8% |
| Total Occupied Housing Units | 3,089 | 100.0% |
Occupancy by Household Size in Hastings On Hudson
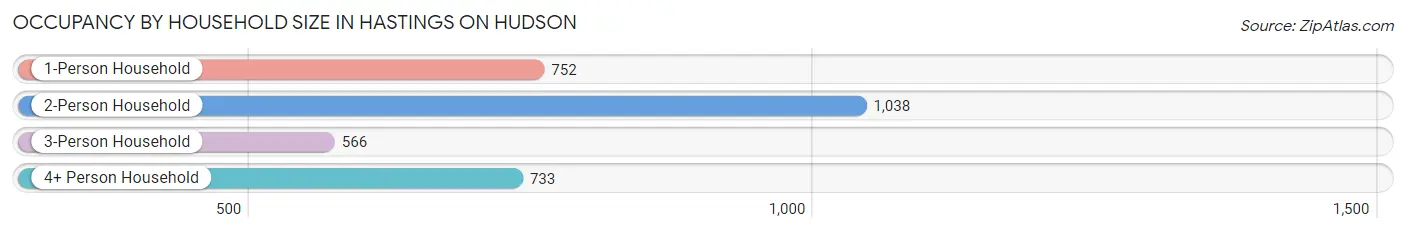
| Household Size | # Housing Units | % Housing Units |
| 1-Person Household | 752 | 24.3% |
| 2-Person Household | 1,038 | 33.6% |
| 3-Person Household | 566 | 18.3% |
| 4+ Person Household | 733 | 23.7% |
| Total Housing Units | 3,089 | 100.0% |
Occupancy by Ownership by Household Size in Hastings On Hudson
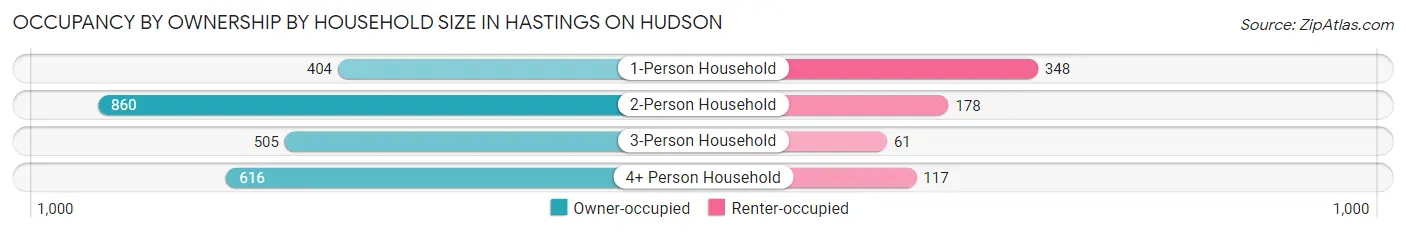
| Household Size | Owner-occupied | Renter-occupied |
| 1-Person Household | 404 (53.7%) | 348 (46.3%) |
| 2-Person Household | 860 (82.9%) | 178 (17.2%) |
| 3-Person Household | 505 (89.2%) | 61 (10.8%) |
| 4+ Person Household | 616 (84.0%) | 117 (16.0%) |
| Total Housing Units | 2,385 (77.2%) | 704 (22.8%) |
Occupancy by Educational Attainment in Hastings On Hudson
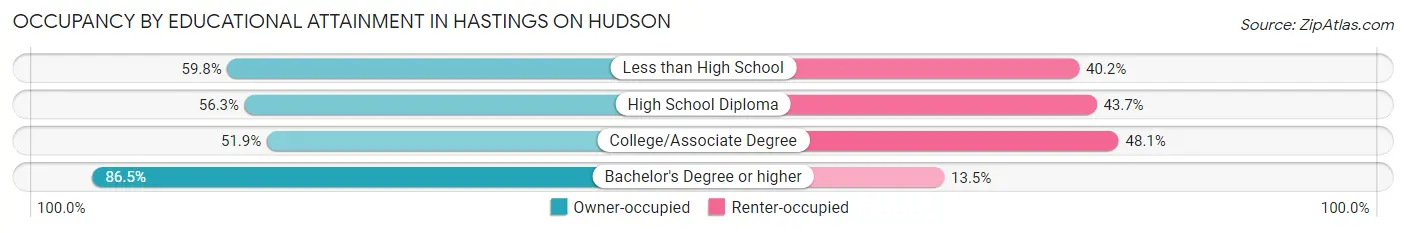
| Household Size | Owner-occupied | Renter-occupied |
| Less than High School | 49 (59.8%) | 33 (40.2%) |
| High School Diploma | 178 (56.3%) | 138 (43.7%) |
| College/Associate Degree | 256 (51.9%) | 237 (48.1%) |
| Bachelor's Degree or higher | 1,902 (86.5%) | 296 (13.5%) |
Occupancy by Age of Householder in Hastings On Hudson
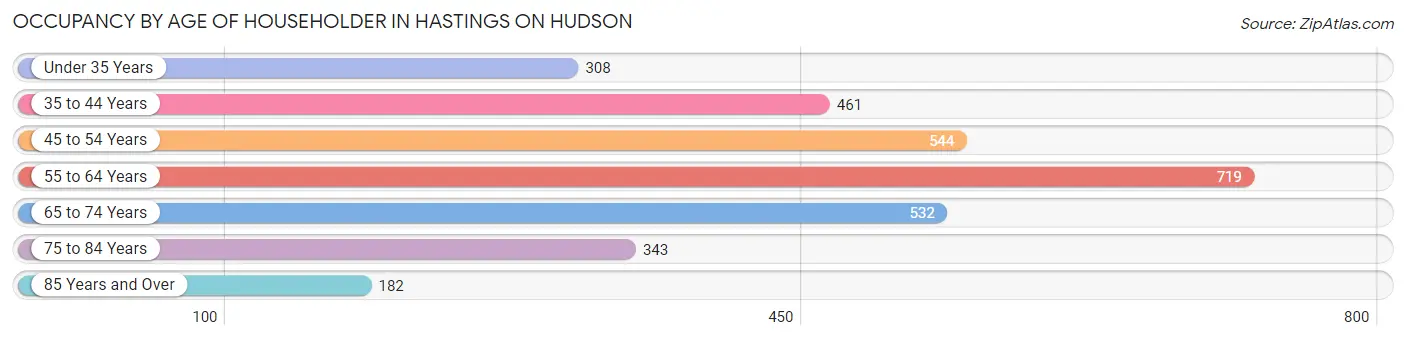
| Age Bracket | # Households | % Households |
| Under 35 Years | 308 | 10.0% |
| 35 to 44 Years | 461 | 14.9% |
| 45 to 54 Years | 544 | 17.6% |
| 55 to 64 Years | 719 | 23.3% |
| 65 to 74 Years | 532 | 17.2% |
| 75 to 84 Years | 343 | 11.1% |
| 85 Years and Over | 182 | 5.9% |
| Total | 3,089 | 100.0% |
Housing Finances in Hastings On Hudson
Median Income by Occupancy in Hastings On Hudson
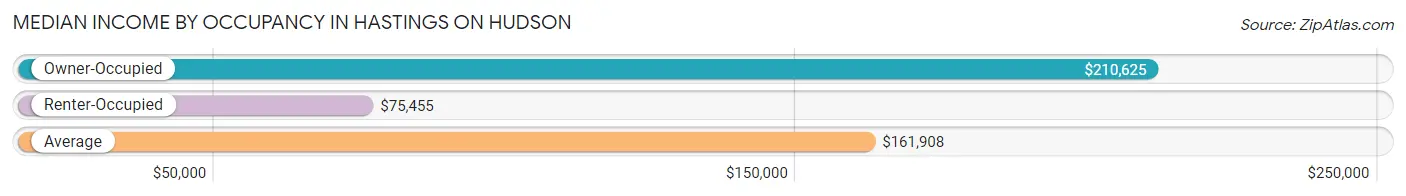
| Occupancy Type | # Households | Median Income |
| Owner-Occupied | 2,385 (77.2%) | $210,625 |
| Renter-Occupied | 704 (22.8%) | $75,455 |
| Average | 3,089 (100.0%) | $161,908 |
Occupancy by Householder Income Bracket in Hastings On Hudson
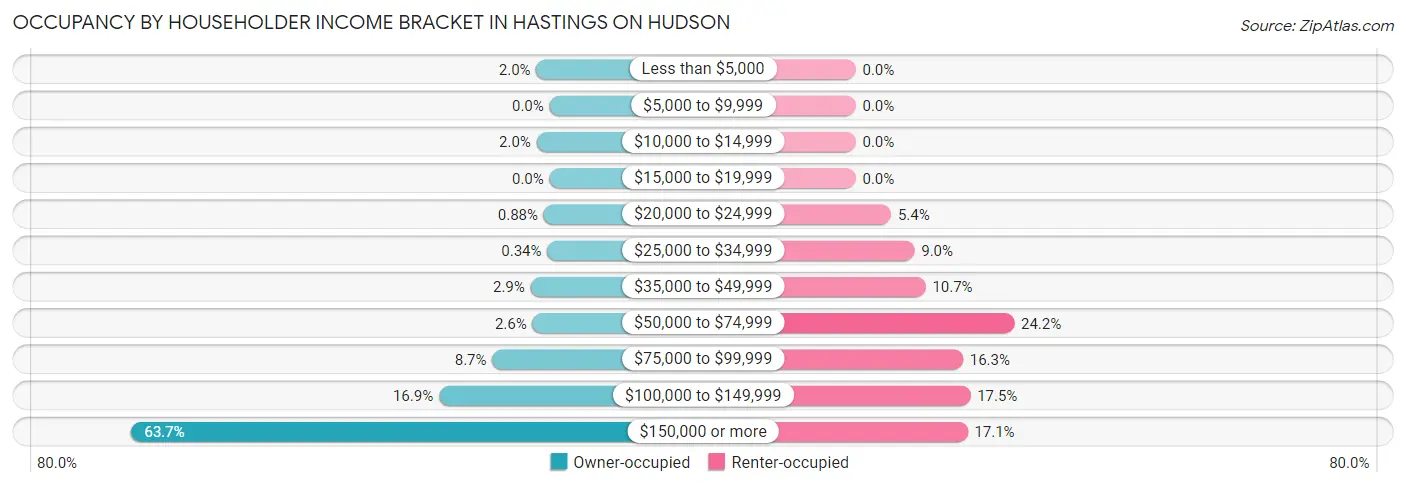
| Income Bracket | Owner-occupied | Renter-occupied |
| Less than $5,000 | 48 (2.0%) | 0 (0.0%) |
| $5,000 to $9,999 | 0 (0.0%) | 0 (0.0%) |
| $10,000 to $14,999 | 47 (2.0%) | 0 (0.0%) |
| $15,000 to $19,999 | 0 (0.0%) | 0 (0.0%) |
| $20,000 to $24,999 | 21 (0.9%) | 38 (5.4%) |
| $25,000 to $34,999 | 8 (0.3%) | 63 (8.9%) |
| $35,000 to $49,999 | 69 (2.9%) | 75 (10.6%) |
| $50,000 to $74,999 | 62 (2.6%) | 170 (24.1%) |
| $75,000 to $99,999 | 208 (8.7%) | 115 (16.3%) |
| $100,000 to $149,999 | 402 (16.9%) | 123 (17.5%) |
| $150,000 or more | 1,520 (63.7%) | 120 (17.1%) |
| Total | 2,385 (100.0%) | 704 (100.0%) |
Monthly Housing Cost Tiers in Hastings On Hudson
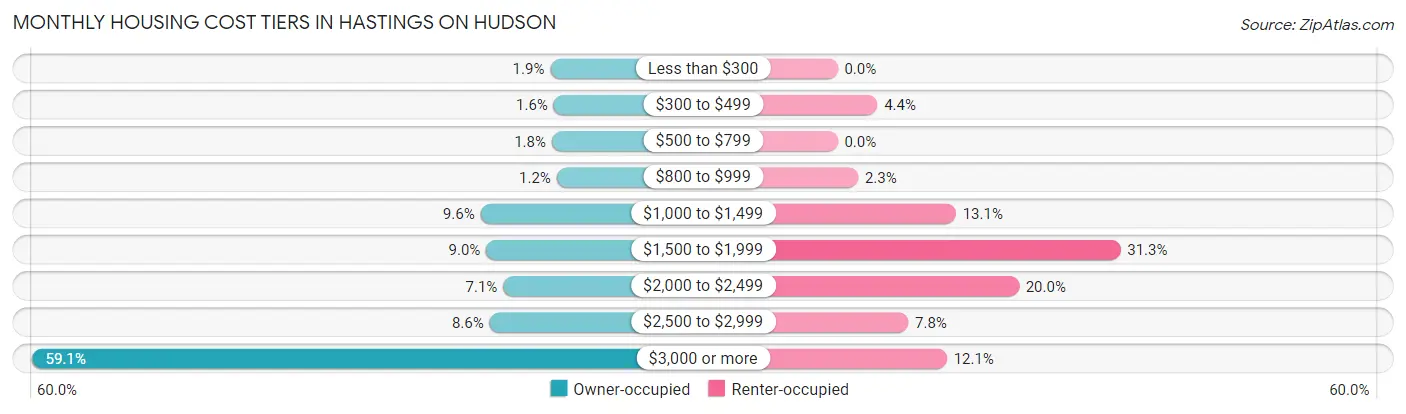
| Monthly Cost | Owner-occupied | Renter-occupied |
| Less than $300 | 46 (1.9%) | 0 (0.0%) |
| $300 to $499 | 37 (1.5%) | 31 (4.4%) |
| $500 to $799 | 42 (1.8%) | 0 (0.0%) |
| $800 to $999 | 29 (1.2%) | 16 (2.3%) |
| $1,000 to $1,499 | 230 (9.6%) | 92 (13.1%) |
| $1,500 to $1,999 | 215 (9.0%) | 220 (31.2%) |
| $2,000 to $2,499 | 170 (7.1%) | 141 (20.0%) |
| $2,500 to $2,999 | 206 (8.6%) | 55 (7.8%) |
| $3,000 or more | 1,410 (59.1%) | 85 (12.1%) |
| Total | 2,385 (100.0%) | 704 (100.0%) |
Physical Housing Characteristics in Hastings On Hudson
Housing Structures in Hastings On Hudson
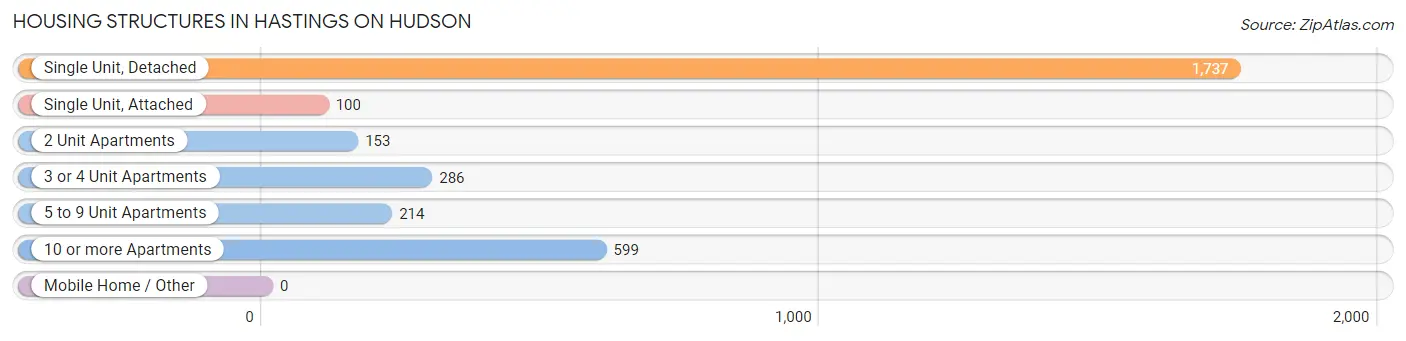
| Structure Type | # Housing Units | % Housing Units |
| Single Unit, Detached | 1,737 | 56.2% |
| Single Unit, Attached | 100 | 3.2% |
| 2 Unit Apartments | 153 | 5.0% |
| 3 or 4 Unit Apartments | 286 | 9.3% |
| 5 to 9 Unit Apartments | 214 | 6.9% |
| 10 or more Apartments | 599 | 19.4% |
| Mobile Home / Other | 0 | 0.0% |
| Total | 3,089 | 100.0% |
Housing Structures by Occupancy in Hastings On Hudson
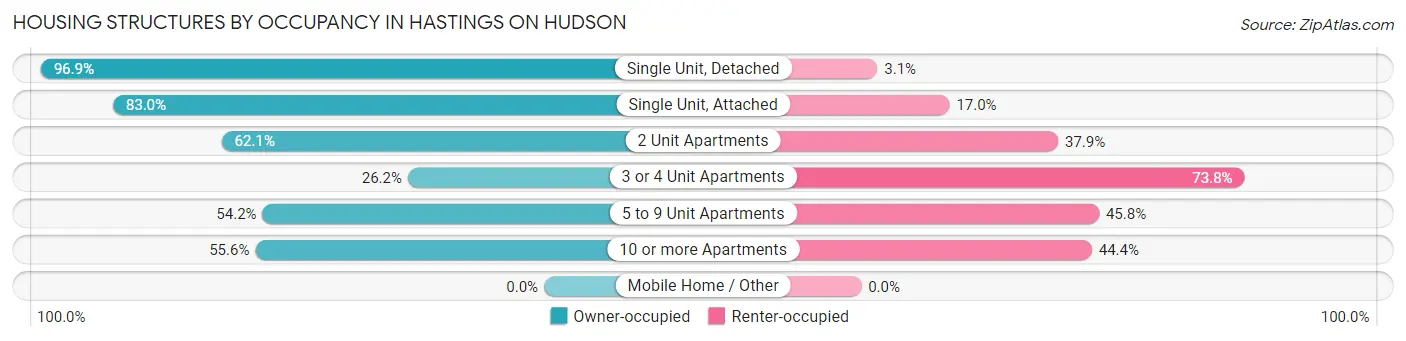
| Structure Type | Owner-occupied | Renter-occupied |
| Single Unit, Detached | 1,683 (96.9%) | 54 (3.1%) |
| Single Unit, Attached | 83 (83.0%) | 17 (17.0%) |
| 2 Unit Apartments | 95 (62.1%) | 58 (37.9%) |
| 3 or 4 Unit Apartments | 75 (26.2%) | 211 (73.8%) |
| 5 to 9 Unit Apartments | 116 (54.2%) | 98 (45.8%) |
| 10 or more Apartments | 333 (55.6%) | 266 (44.4%) |
| Mobile Home / Other | 0 (0.0%) | 0 (0.0%) |
| Total | 2,385 (77.2%) | 704 (22.8%) |
Housing Structures by Number of Rooms in Hastings On Hudson
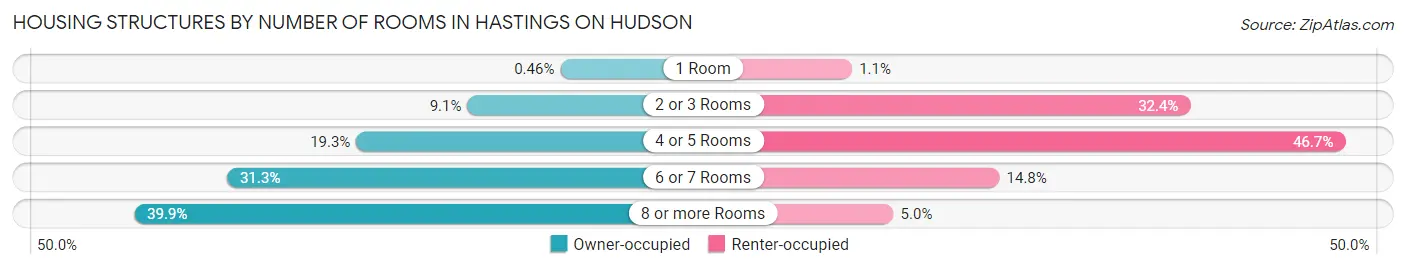
| Number of Rooms | Owner-occupied | Renter-occupied |
| 1 Room | 11 (0.5%) | 8 (1.1%) |
| 2 or 3 Rooms | 216 (9.1%) | 228 (32.4%) |
| 4 or 5 Rooms | 461 (19.3%) | 329 (46.7%) |
| 6 or 7 Rooms | 746 (31.3%) | 104 (14.8%) |
| 8 or more Rooms | 951 (39.9%) | 35 (5.0%) |
| Total | 2,385 (100.0%) | 704 (100.0%) |
Housing Structure by Heating Type in Hastings On Hudson
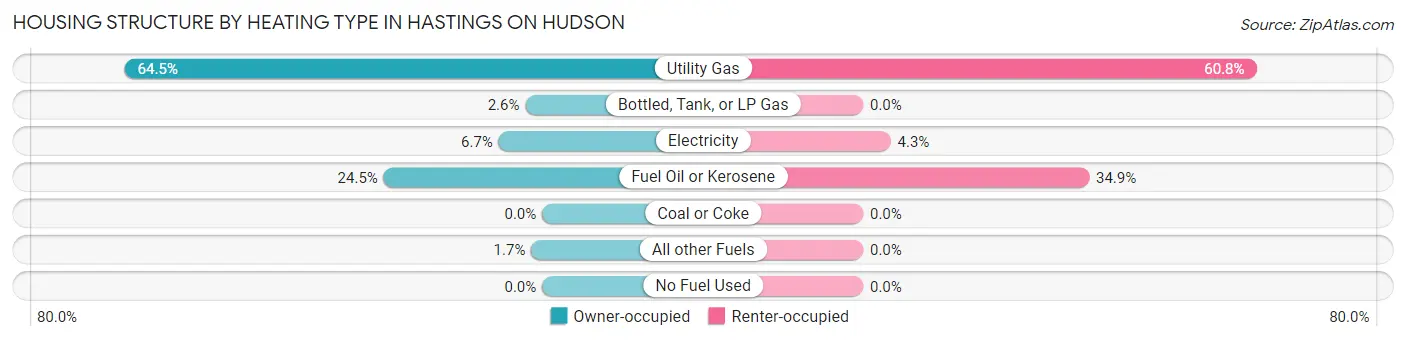
| Heating Type | Owner-occupied | Renter-occupied |
| Utility Gas | 1,539 (64.5%) | 428 (60.8%) |
| Bottled, Tank, or LP Gas | 62 (2.6%) | 0 (0.0%) |
| Electricity | 160 (6.7%) | 30 (4.3%) |
| Fuel Oil or Kerosene | 584 (24.5%) | 246 (34.9%) |
| Coal or Coke | 0 (0.0%) | 0 (0.0%) |
| All other Fuels | 40 (1.7%) | 0 (0.0%) |
| No Fuel Used | 0 (0.0%) | 0 (0.0%) |
| Total | 2,385 (100.0%) | 704 (100.0%) |
Household Vehicle Usage in Hastings On Hudson
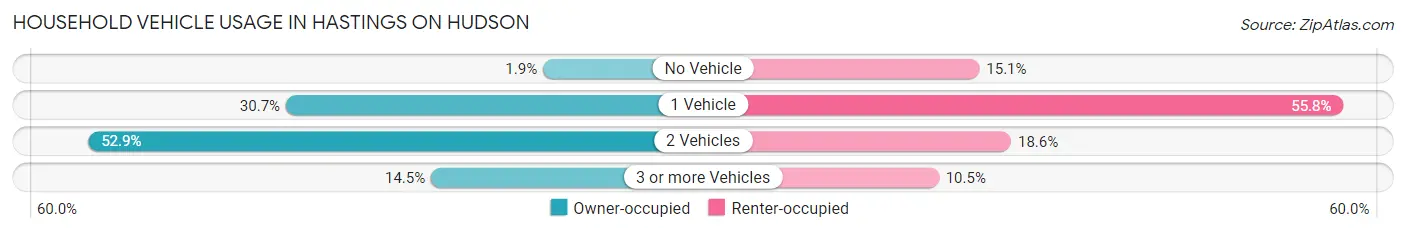
| Vehicles per Household | Owner-occupied | Renter-occupied |
| No Vehicle | 46 (1.9%) | 106 (15.1%) |
| 1 Vehicle | 733 (30.7%) | 393 (55.8%) |
| 2 Vehicles | 1,261 (52.9%) | 131 (18.6%) |
| 3 or more Vehicles | 345 (14.5%) | 74 (10.5%) |
| Total | 2,385 (100.0%) | 704 (100.0%) |
Real Estate & Mortgages in Hastings On Hudson
Real Estate and Mortgage Overview in Hastings On Hudson
| Characteristic | Without Mortgage | With Mortgage |
| Housing Units | 860 | 1,525 |
| Median Property Value | $796,000 | $849,600 |
| Median Household Income | $135,500 | $1,143 |
| Monthly Housing Costs | $1,501 | $1,240 |
| Real Estate Taxes | $10,001 | $62 |
Property Value by Mortgage Status in Hastings On Hudson
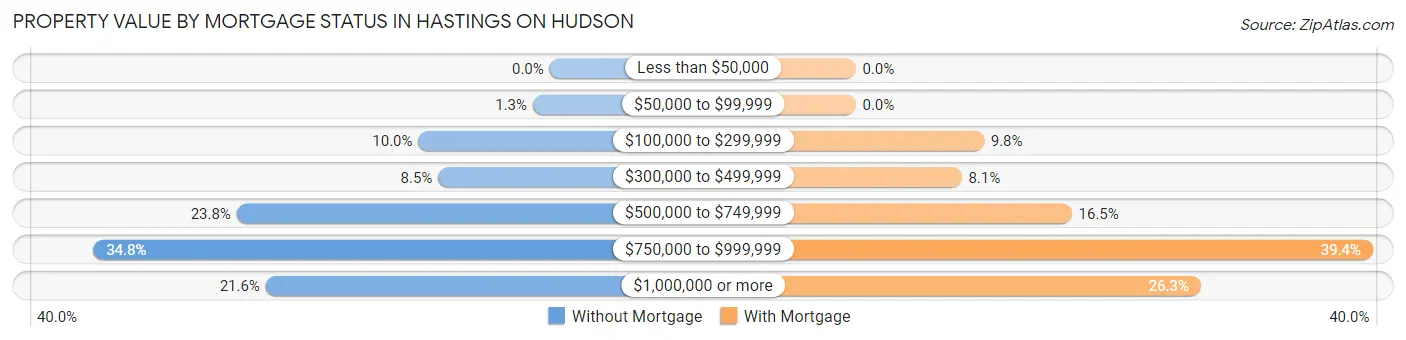
| Property Value | Without Mortgage | With Mortgage |
| Less than $50,000 | 0 (0.0%) | 0 (0.0%) |
| $50,000 to $99,999 | 11 (1.3%) | 0 (0.0%) |
| $100,000 to $299,999 | 86 (10.0%) | 149 (9.8%) |
| $300,000 to $499,999 | 73 (8.5%) | 123 (8.1%) |
| $500,000 to $749,999 | 205 (23.8%) | 251 (16.5%) |
| $750,000 to $999,999 | 299 (34.8%) | 601 (39.4%) |
| $1,000,000 or more | 186 (21.6%) | 401 (26.3%) |
| Total | 860 (100.0%) | 1,525 (100.0%) |
Household Income by Mortgage Status in Hastings On Hudson
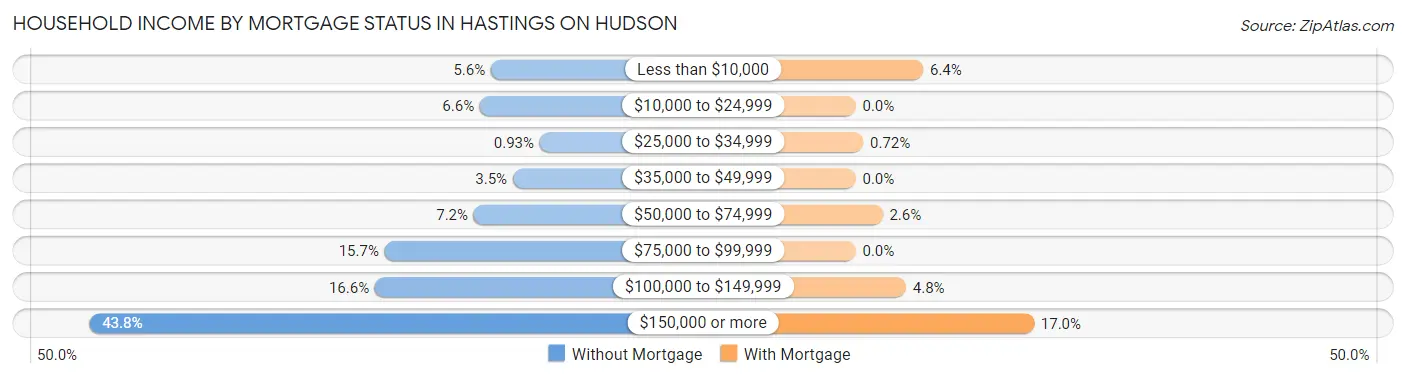
| Household Income | Without Mortgage | With Mortgage |
| Less than $10,000 | 48 (5.6%) | 98 (6.4%) |
| $10,000 to $24,999 | 57 (6.6%) | 0 (0.0%) |
| $25,000 to $34,999 | 8 (0.9%) | 11 (0.7%) |
| $35,000 to $49,999 | 30 (3.5%) | 0 (0.0%) |
| $50,000 to $74,999 | 62 (7.2%) | 39 (2.6%) |
| $75,000 to $99,999 | 135 (15.7%) | 0 (0.0%) |
| $100,000 to $149,999 | 143 (16.6%) | 73 (4.8%) |
| $150,000 or more | 377 (43.8%) | 259 (17.0%) |
| Total | 860 (100.0%) | 1,525 (100.0%) |
Property Value to Household Income Ratio in Hastings On Hudson
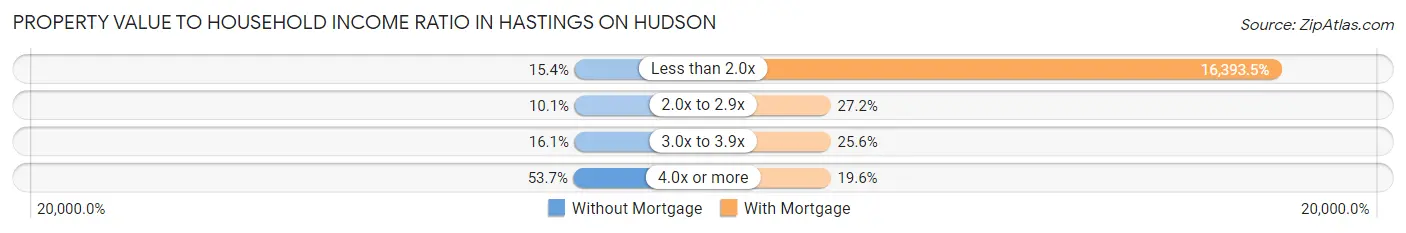
| Value-to-Income Ratio | Without Mortgage | With Mortgage |
| Less than 2.0x | 132 (15.3%) | 250,001 (16,393.5%) |
| 2.0x to 2.9x | 87 (10.1%) | 415 (27.2%) |
| 3.0x to 3.9x | 138 (16.1%) | 391 (25.6%) |
| 4.0x or more | 462 (53.7%) | 299 (19.6%) |
| Total | 860 (100.0%) | 1,525 (100.0%) |
Real Estate Taxes by Mortgage Status in Hastings On Hudson
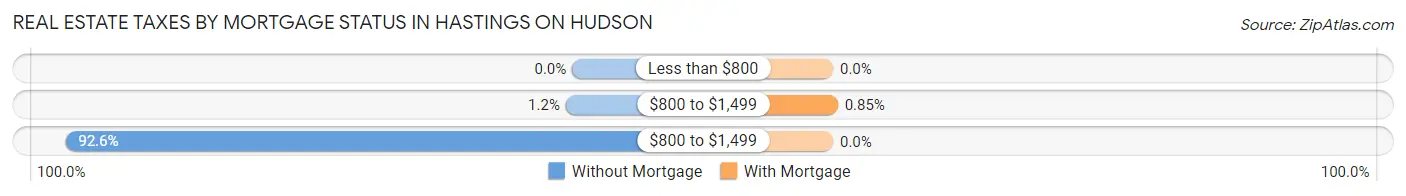
| Property Taxes | Without Mortgage | With Mortgage |
| Less than $800 | 0 (0.0%) | 0 (0.0%) |
| $800 to $1,499 | 10 (1.2%) | 13 (0.9%) |
| $800 to $1,499 | 796 (92.6%) | 0 (0.0%) |
| Total | 860 (100.0%) | 1,525 (100.0%) |
Health & Disability in Hastings On Hudson
Health Insurance Coverage by Age in Hastings On Hudson
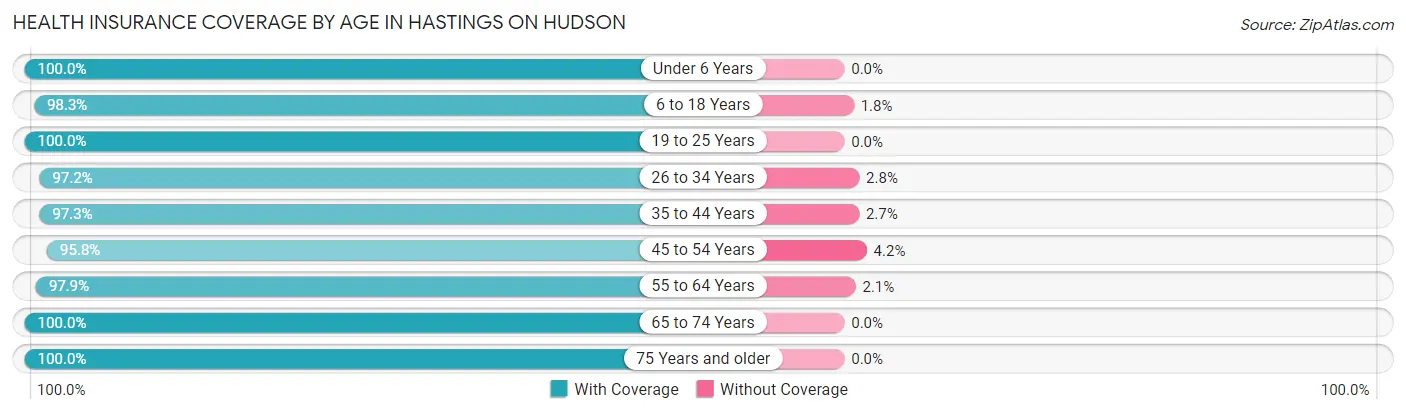
| Age Bracket | With Coverage | Without Coverage |
| Under 6 Years | 550 (100.0%) | 0 (0.0%) |
| 6 to 18 Years | 1,288 (98.3%) | 23 (1.8%) |
| 19 to 25 Years | 559 (100.0%) | 0 (0.0%) |
| 26 to 34 Years | 666 (97.2%) | 19 (2.8%) |
| 35 to 44 Years | 922 (97.3%) | 26 (2.7%) |
| 45 to 54 Years | 1,011 (95.8%) | 44 (4.2%) |
| 55 to 64 Years | 1,305 (97.9%) | 28 (2.1%) |
| 65 to 74 Years | 886 (100.0%) | 0 (0.0%) |
| 75 Years and older | 818 (100.0%) | 0 (0.0%) |
| Total | 8,005 (98.3%) | 140 (1.7%) |
Health Insurance Coverage by Citizenship Status in Hastings On Hudson
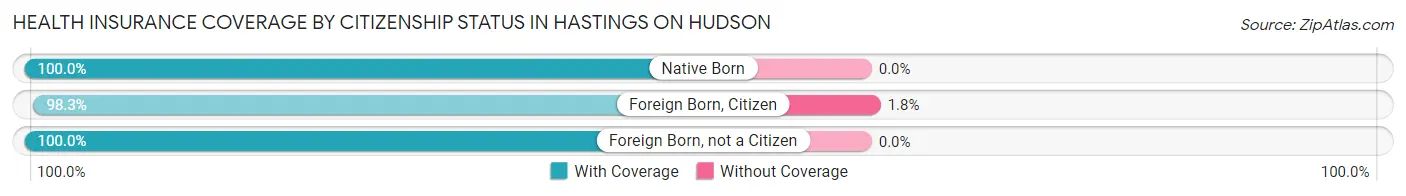
| Citizenship Status | With Coverage | Without Coverage |
| Native Born | 550 (100.0%) | 0 (0.0%) |
| Foreign Born, Citizen | 1,288 (98.3%) | 23 (1.8%) |
| Foreign Born, not a Citizen | 559 (100.0%) | 0 (0.0%) |
Health Insurance Coverage by Household Income in Hastings On Hudson
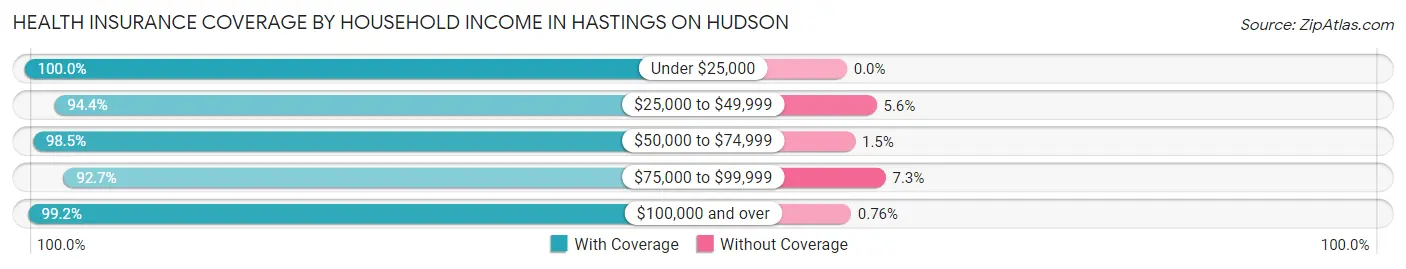
| Household Income | With Coverage | Without Coverage |
| Under $25,000 | 213 (100.0%) | 0 (0.0%) |
| $25,000 to $49,999 | 271 (94.4%) | 16 (5.6%) |
| $50,000 to $74,999 | 510 (98.5%) | 8 (1.5%) |
| $75,000 to $99,999 | 562 (92.7%) | 44 (7.3%) |
| $100,000 and over | 6,392 (99.2%) | 49 (0.8%) |
Public vs Private Health Insurance Coverage by Age in Hastings On Hudson
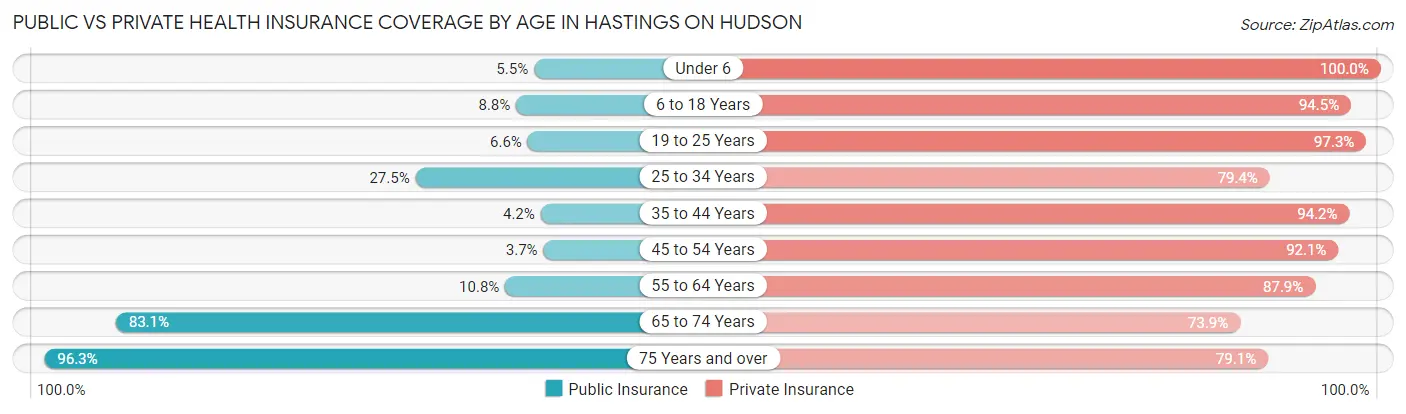
| Age Bracket | Public Insurance | Private Insurance |
| Under 6 | 30 (5.4%) | 550 (100.0%) |
| 6 to 18 Years | 115 (8.8%) | 1,239 (94.5%) |
| 19 to 25 Years | 37 (6.6%) | 544 (97.3%) |
| 25 to 34 Years | 188 (27.5%) | 544 (79.4%) |
| 35 to 44 Years | 40 (4.2%) | 893 (94.2%) |
| 45 to 54 Years | 39 (3.7%) | 972 (92.1%) |
| 55 to 64 Years | 144 (10.8%) | 1,171 (87.8%) |
| 65 to 74 Years | 736 (83.1%) | 655 (73.9%) |
| 75 Years and over | 788 (96.3%) | 647 (79.1%) |
| Total | 2,117 (26.0%) | 7,215 (88.6%) |
Disability Status by Sex by Age in Hastings On Hudson
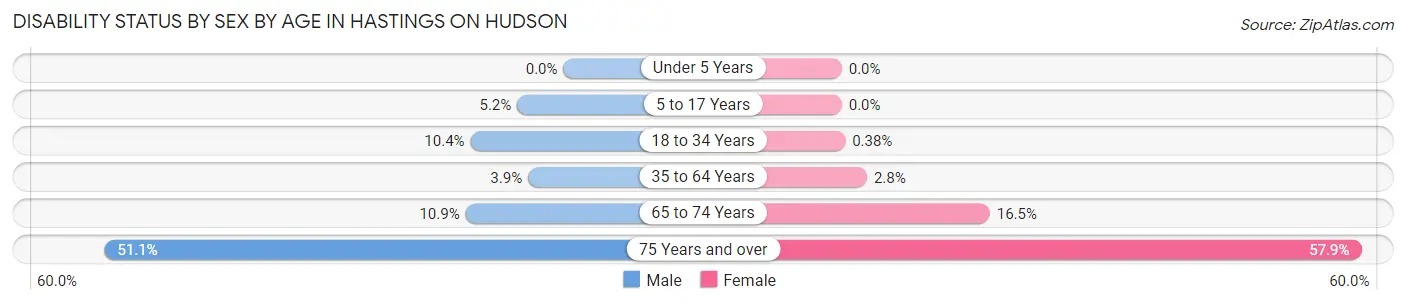
| Age Bracket | Male | Female |
| Under 5 Years | 0 (0.0%) | 0 (0.0%) |
| 5 to 17 Years | 31 (5.1%) | 0 (0.0%) |
| 18 to 34 Years | 88 (10.3%) | 2 (0.4%) |
| 35 to 64 Years | 64 (3.9%) | 48 (2.8%) |
| 65 to 74 Years | 47 (10.9%) | 75 (16.5%) |
| 75 Years and over | 138 (51.1%) | 317 (57.9%) |
Disability Class by Sex by Age in Hastings On Hudson
Disability Class: Hearing Difficulty
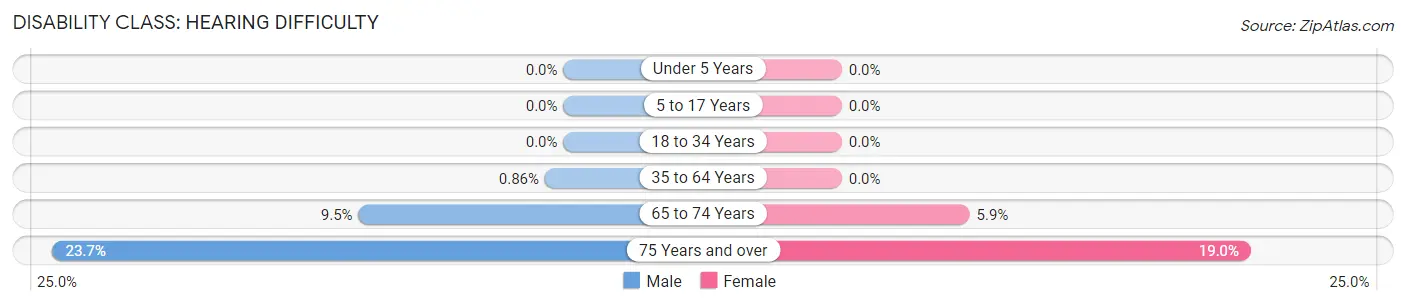
| Age Bracket | Male | Female |
| Under 5 Years | 0 (0.0%) | 0 (0.0%) |
| 5 to 17 Years | 0 (0.0%) | 0 (0.0%) |
| 18 to 34 Years | 0 (0.0%) | 0 (0.0%) |
| 35 to 64 Years | 14 (0.9%) | 0 (0.0%) |
| 65 to 74 Years | 41 (9.5%) | 27 (5.9%) |
| 75 Years and over | 64 (23.7%) | 104 (19.0%) |
Disability Class: Vision Difficulty
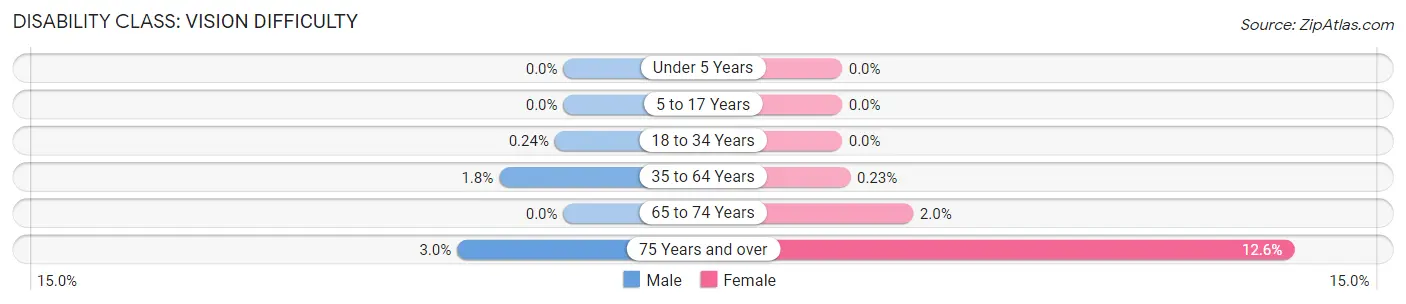
| Age Bracket | Male | Female |
| Under 5 Years | 0 (0.0%) | 0 (0.0%) |
| 5 to 17 Years | 0 (0.0%) | 0 (0.0%) |
| 18 to 34 Years | 2 (0.2%) | 0 (0.0%) |
| 35 to 64 Years | 29 (1.8%) | 4 (0.2%) |
| 65 to 74 Years | 0 (0.0%) | 9 (2.0%) |
| 75 Years and over | 8 (3.0%) | 69 (12.6%) |
Disability Class: Cognitive Difficulty
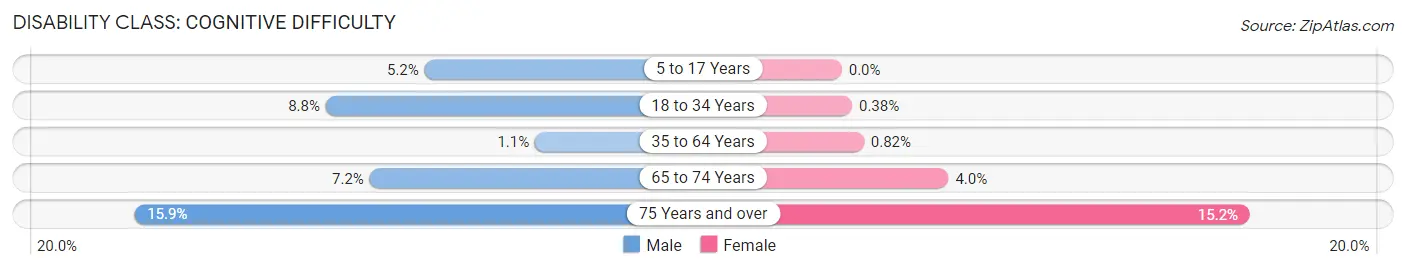
| Age Bracket | Male | Female |
| 5 to 17 Years | 31 (5.1%) | 0 (0.0%) |
| 18 to 34 Years | 75 (8.8%) | 2 (0.4%) |
| 35 to 64 Years | 17 (1.1%) | 14 (0.8%) |
| 65 to 74 Years | 31 (7.2%) | 18 (4.0%) |
| 75 Years and over | 43 (15.9%) | 83 (15.1%) |
Disability Class: Ambulatory Difficulty
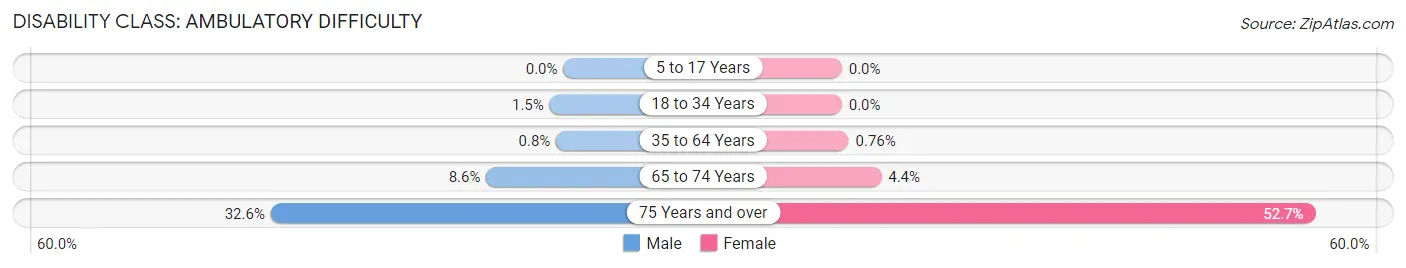
| Age Bracket | Male | Female |
| 5 to 17 Years | 0 (0.0%) | 0 (0.0%) |
| 18 to 34 Years | 13 (1.5%) | 0 (0.0%) |
| 35 to 64 Years | 13 (0.8%) | 13 (0.8%) |
| 65 to 74 Years | 37 (8.6%) | 20 (4.4%) |
| 75 Years and over | 88 (32.6%) | 289 (52.7%) |
Disability Class: Self-Care Difficulty
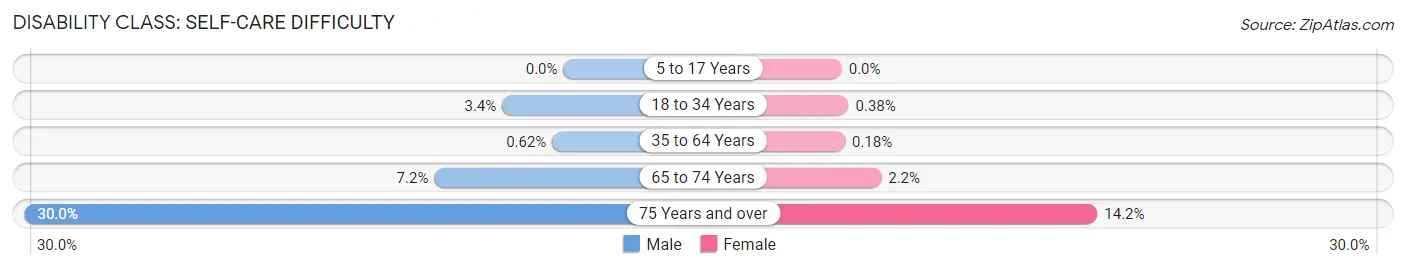
| Age Bracket | Male | Female |
| 5 to 17 Years | 0 (0.0%) | 0 (0.0%) |
| 18 to 34 Years | 29 (3.4%) | 2 (0.4%) |
| 35 to 64 Years | 10 (0.6%) | 3 (0.2%) |
| 65 to 74 Years | 31 (7.2%) | 10 (2.2%) |
| 75 Years and over | 81 (30.0%) | 78 (14.2%) |
Technology Access in Hastings On Hudson
Computing Device Access in Hastings On Hudson
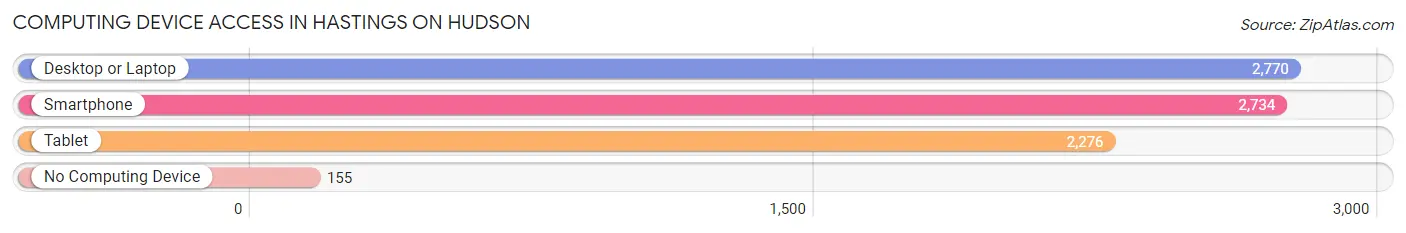
| Device Type | # Households | % Households |
| Desktop or Laptop | 2,770 | 89.7% |
| Smartphone | 2,734 | 88.5% |
| Tablet | 2,276 | 73.7% |
| No Computing Device | 155 | 5.0% |
| Total | 3,089 | 100.0% |
Internet Access in Hastings On Hudson
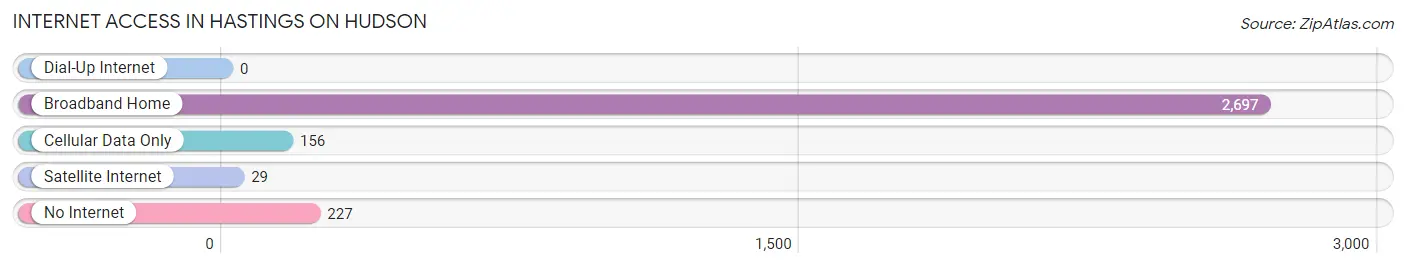
| Internet Type | # Households | % Households |
| Dial-Up Internet | 0 | 0.0% |
| Broadband Home | 2,697 | 87.3% |
| Cellular Data Only | 156 | 5.1% |
| Satellite Internet | 29 | 0.9% |
| No Internet | 227 | 7.3% |
| Total | 3,089 | 100.0% |
Hastings On Hudson Summary
Hastings-on-Hudson is a village located in Westchester County, New York, United States. It is situated on the eastern bank of the Hudson River, about 25 miles north of New York City. The village is part of the town of Greenburgh and is bordered by the villages of Dobbs Ferry to the south and Irvington to the north. As of the 2010 census, the village had a population of 7,849.
History
The area that is now Hastings-on-Hudson was originally inhabited by the Weckquaesgeek Native Americans. The first European settlers arrived in the area in 1693, when a group of Dutch and English settlers purchased land from the Weckquaesgeek. The village was originally known as “Hastings-in-the-Hudson” and was incorporated in 1879.
The village was named after Thomas Hastings, a prominent New York lawyer and politician who was born in the area in 1784. Hastings was a member of the New York State Assembly and the New York State Senate, and served as a U.S. Representative from 1817 to 1821.
Geography
Hastings-on-Hudson is located at 41°02'N 73°51'W (41.037, -73.851). According to the United States Census Bureau, the village has a total area of 1.2 square miles (3.1 km2), all of it land.
The village is situated on the eastern bank of the Hudson River, about 25 miles north of New York City. It is bordered by the villages of Dobbs Ferry to the south and Irvington to the north.
Economy
Hastings-on-Hudson is a primarily residential community, with a small commercial district located along Warburton Avenue. The village is home to several small businesses, including restaurants, cafes, boutiques, and professional services.
The village is also home to several corporate headquarters, including the global headquarters of the Estée Lauder Companies, which is located in the village's historic downtown area.
Demographics
As of the 2010 census, there were 7,849 people, 3,093 households, and 2,072 families residing in the village. The population density was 6,541.3 people per square mile (2,521.2/km2). There were 3,309 housing units at an average density of 2,717.3 per square mile (1,051.2/km2). The racial makeup of the village was 81.2% White, 8.2% African American, 0.2% Native American, 6.3% Asian, 0.1% Pacific Islander, 1.7% from other races, and 2.3% from two or more races. Hispanic or Latino of any race were 6.7% of the population.
There were 3,093 households, out of which 33.2% had children under the age of 18 living with them, 53.2% were married couples living together, 9.7% had a female householder with no husband present, and 33.2% were non-families. 28.2% of all households were made up of individuals, and 11.2% had someone living alone who was 65 years of age or older. The average household size was 2.55 and the average family size was 3.17.
In the village, the population was spread out, with 25.2% under the age of 18, 5.2% from 18 to 24, 28.2% from 25 to 44, 27.2% from 45 to 64, and 14.2% who were 65 years of age or older. The median age was 40 years. For every 100 females, there were 91.2 males. For every 100 females age 18 and over, there were 87.2 males.
The median income for a household in the village was $87,813, and the median income for a family was $106,917. Males had a median income of $71,917 versus $50,000 for females. The per capita income for the village was $45,945. About 2.7% of families and 4.2% of the population were below the poverty line, including 4.2% of those under age 18 and 4.2% of those age 65 or over.
Common Questions
What is Per Capita Income in Hastings On Hudson?
Per Capita income in Hastings On Hudson is $92,689.
What is the Median Family Income in Hastings On Hudson?
Median Family Income in Hastings On Hudson is $214,728.
What is the Median Household income in Hastings On Hudson?
Median Household Income in Hastings On Hudson is $161,908.
What is Income or Wage Gap in Hastings On Hudson?
Income or Wage Gap in Hastings On Hudson is 25.1%.
Women in Hastings On Hudson earn 74.9 cents for every dollar earned by a man.
What is Inequality or Gini Index in Hastings On Hudson?
Inequality or Gini Index in Hastings On Hudson is 0.48.
What is the Total Population of Hastings On Hudson?
Total Population of Hastings On Hudson is 8,456.
What is the Total Male Population of Hastings On Hudson?
Total Male Population of Hastings On Hudson is 4,170.
What is the Total Female Population of Hastings On Hudson?
Total Female Population of Hastings On Hudson is 4,286.
What is the Ratio of Males per 100 Females in Hastings On Hudson?
There are 97.29 Males per 100 Females in Hastings On Hudson.
What is the Ratio of Females per 100 Males in Hastings On Hudson?
There are 102.78 Females per 100 Males in Hastings On Hudson.
What is the Median Population Age in Hastings On Hudson?
Median Population Age in Hastings On Hudson is 45.3 Years.
What is the Average Family Size in Hastings On Hudson
Average Family Size in Hastings On Hudson is 3.2 People.
What is the Average Household Size in Hastings On Hudson
Average Household Size in Hastings On Hudson is 2.6 People.
How Large is the Labor Force in Hastings On Hudson?
There are 4,542 People in the Labor Forcein in Hastings On Hudson.
What is the Percentage of People in the Labor Force in Hastings On Hudson?
66.8% of People are in the Labor Force in Hastings On Hudson.
What is the Unemployment Rate in Hastings On Hudson?
Unemployment Rate in Hastings On Hudson is 2.2%.