Woodridge, NY Map & Demographics
Woodridge Map
Woodridge Overview
$25,698
PER CAPITA INCOME
$87,813
AVG FAMILY INCOME
$70,313
AVG HOUSEHOLD INCOME
47.8%
WAGE / INCOME GAP [ % ]
52.2¢/ $1
WAGE / INCOME GAP [ $ ]
0.41
INEQUALITY / GINI INDEX
936
TOTAL POPULATION
423
MALE POPULATION
513
FEMALE POPULATION
82.46
MALES / 100 FEMALES
121.28
FEMALES / 100 MALES
29.4
MEDIAN AGE
5.6
AVG FAMILY SIZE
3.1
AVG HOUSEHOLD SIZE
363
LABOR FORCE [ PEOPLE ]
50.1%
PERCENT IN LABOR FORCE
17.1%
UNEMPLOYMENT RATE
Woodridge Zip Codes
Income in Woodridge
Income Overview in Woodridge
Per Capita Income in Woodridge is $25,698, while median incomes of families and households are $87,813 and $70,313 respectively.
| Characteristic | Number | Measure |
| Per Capita Income | 936 | $25,698 |
| Median Family Income | 129 | $87,813 |
| Mean Family Income | 129 | $88,109 |
| Median Household Income | 290 | $70,313 |
| Mean Household Income | 290 | $65,570 |
| Income Deficit | 129 | $0 |
| Wage / Income Gap (%) | 936 | 47.79% |
| Wage / Income Gap ($) | 936 | 52.21¢ per $1 |
| Gini / Inequality Index | 936 | 0.41 |
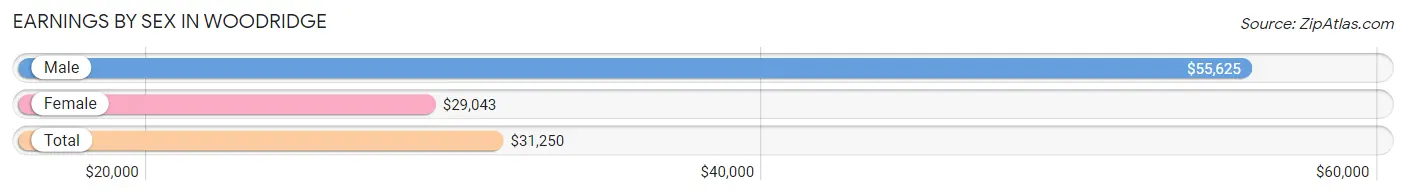
Earnings by Sex in Woodridge
Average Earnings in Woodridge are $31,250, $55,625 for men and $29,043 for women, a difference of 47.8%.
| Sex | Number | Average Earnings |
| Male | 184 (45.5%) | $55,625 |
| Female | 220 (54.5%) | $29,043 |
| Total | 404 (100.0%) | $31,250 |
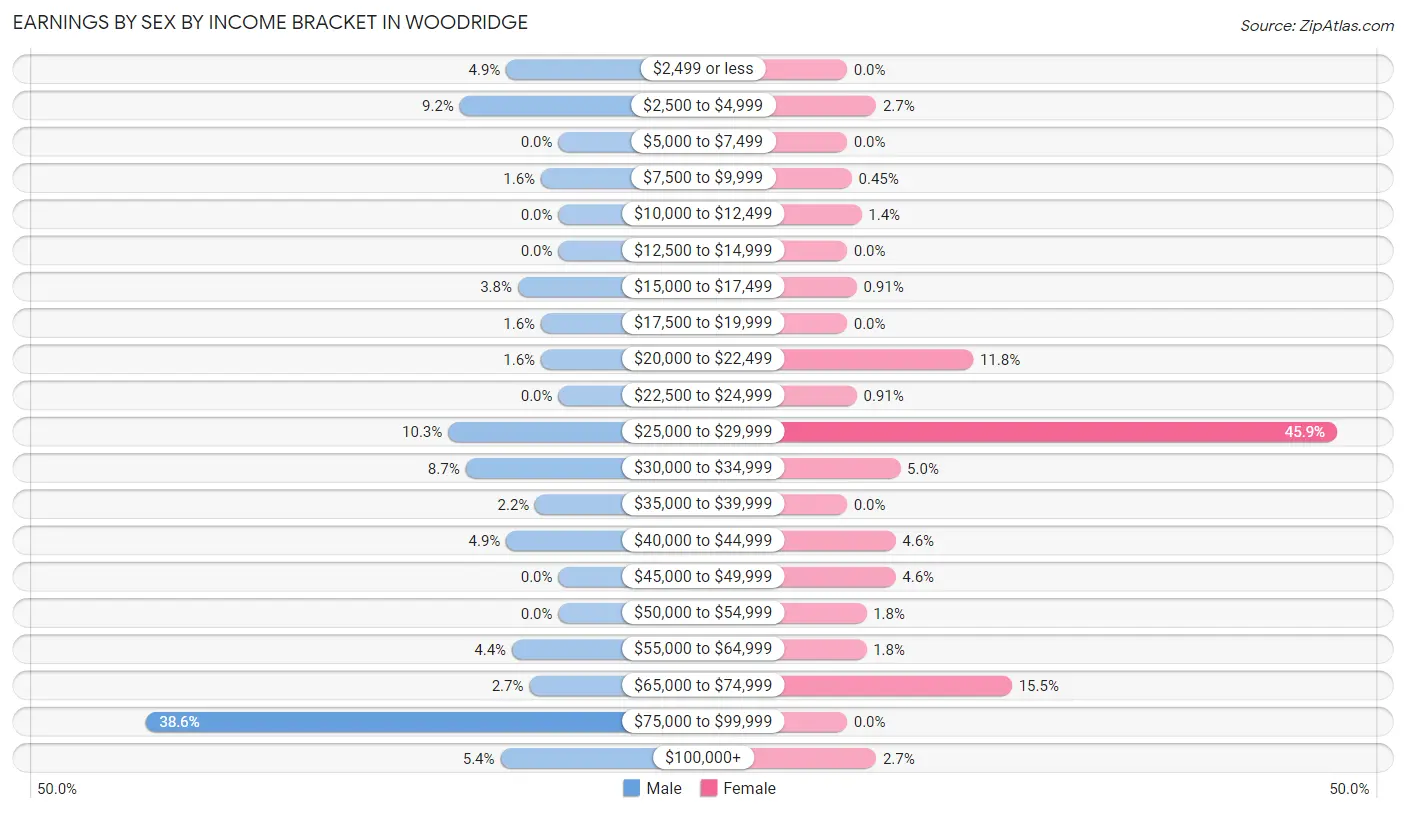
Earnings by Sex by Income Bracket in Woodridge
The most common earnings brackets in Woodridge are $75,000 to $99,999 for men (71 | 38.6%) and $25,000 to $29,999 for women (101 | 45.9%).
| Income | Male | Female |
| $2,499 or less | 9 (4.9%) | 0 (0.0%) |
| $2,500 to $4,999 | 17 (9.2%) | 6 (2.7%) |
| $5,000 to $7,499 | 0 (0.0%) | 0 (0.0%) |
| $7,500 to $9,999 | 3 (1.6%) | 1 (0.4%) |
| $10,000 to $12,499 | 0 (0.0%) | 3 (1.4%) |
| $12,500 to $14,999 | 0 (0.0%) | 0 (0.0%) |
| $15,000 to $17,499 | 7 (3.8%) | 2 (0.9%) |
| $17,500 to $19,999 | 3 (1.6%) | 0 (0.0%) |
| $20,000 to $22,499 | 3 (1.6%) | 26 (11.8%) |
| $22,500 to $24,999 | 0 (0.0%) | 2 (0.9%) |
| $25,000 to $29,999 | 19 (10.3%) | 101 (45.9%) |
| $30,000 to $34,999 | 16 (8.7%) | 11 (5.0%) |
| $35,000 to $39,999 | 4 (2.2%) | 0 (0.0%) |
| $40,000 to $44,999 | 9 (4.9%) | 10 (4.5%) |
| $45,000 to $49,999 | 0 (0.0%) | 10 (4.5%) |
| $50,000 to $54,999 | 0 (0.0%) | 4 (1.8%) |
| $55,000 to $64,999 | 8 (4.3%) | 4 (1.8%) |
| $65,000 to $74,999 | 5 (2.7%) | 34 (15.4%) |
| $75,000 to $99,999 | 71 (38.6%) | 0 (0.0%) |
| $100,000+ | 10 (5.4%) | 6 (2.7%) |
| Total | 184 (100.0%) | 220 (100.0%) |
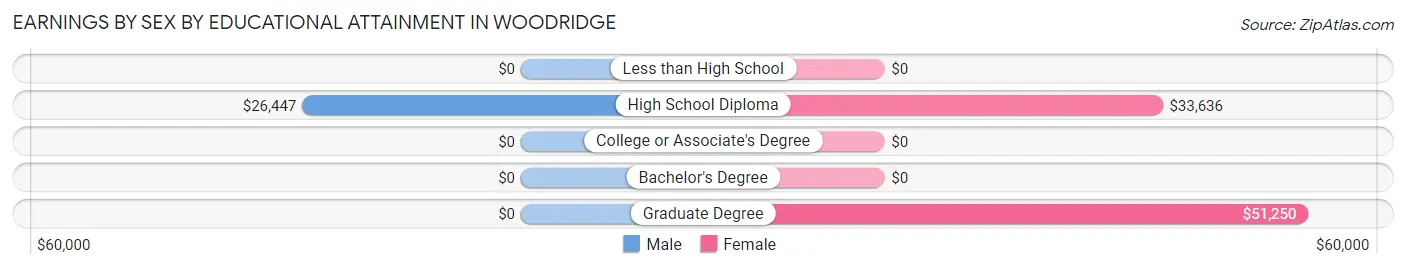
Earnings by Sex by Educational Attainment in Woodridge
Average earnings in Woodridge are $82,533 for men and $29,414 for women, a difference of 64.4%. Men with an educational attainment of high school diploma enjoy the highest average annual earnings of $26,447, while those with high school diploma education earn the least with $26,447. Women with an educational attainment of graduate degree earn the most with the average annual earnings of $51,250, while those with high school diploma education have the smallest earnings of $33,636.
| Educational Attainment | Male Income | Female Income |
| Less than High School | - | - |
| High School Diploma | $26,447 | $33,636 |
| College or Associate's Degree | - | - |
| Bachelor's Degree | - | - |
| Graduate Degree | - | - |
| Total | $82,533 | $29,414 |
Family Income in Woodridge
Family Income Brackets in Woodridge
According to the Woodridge family income data, there are 30 families falling into the $100,000 to $149,999 income range, which is the most common income bracket and makes up 23.3% of all families.
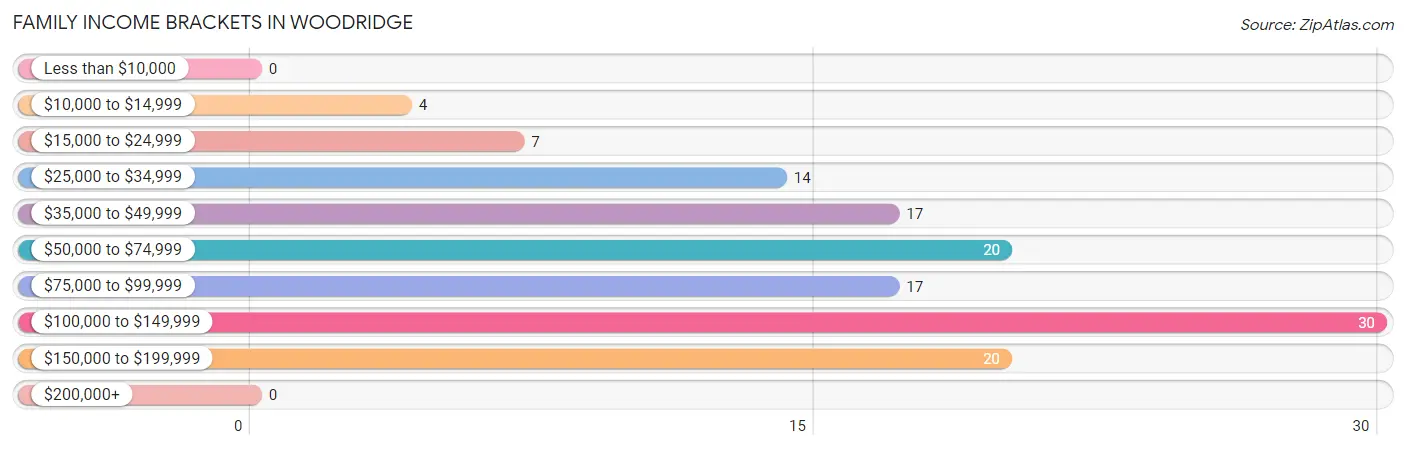
| Income Bracket | # Families | % Families |
| Less than $10,000 | 0 | 0.0% |
| $10,000 to $14,999 | 4 | 3.1% |
| $15,000 to $24,999 | 7 | 5.4% |
| $25,000 to $34,999 | 14 | 10.9% |
| $35,000 to $49,999 | 17 | 13.2% |
| $50,000 to $74,999 | 20 | 15.5% |
| $75,000 to $99,999 | 17 | 13.2% |
| $100,000 to $149,999 | 30 | 23.3% |
| $150,000 to $199,999 | 20 | 15.5% |
| $200,000+ | 0 | 0.0% |
Family Income by Famaliy Size in Woodridge
5-person families (8 | 6.2%) account for the highest median family income in Woodridge with $173,750 per family, while 2-person families (29 | 22.5%) have the highest median income of $60,104 per family member.
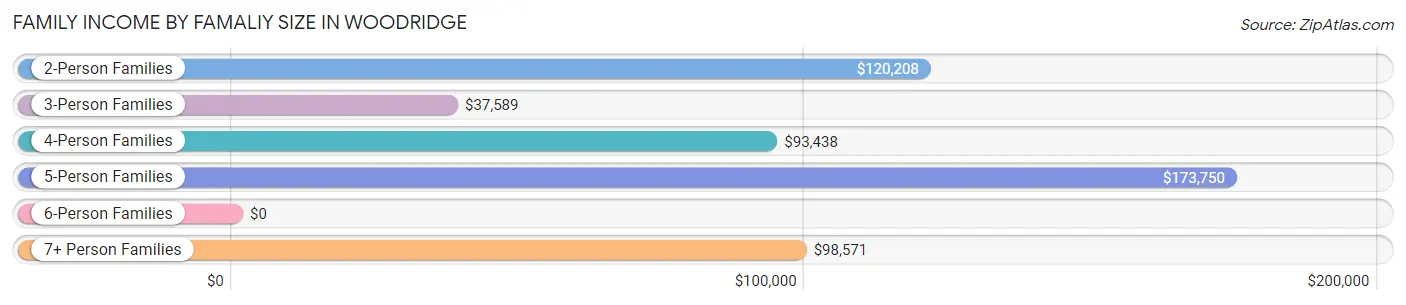
| Income Bracket | # Families | Median Income |
| 2-Person Families | 29 (22.5%) | $120,208 |
| 3-Person Families | 35 (27.1%) | $37,589 |
| 4-Person Families | 11 (8.5%) | $93,438 |
| 5-Person Families | 8 (6.2%) | $173,750 |
| 6-Person Families | 8 (6.2%) | $0 |
| 7+ Person Families | 38 (29.5%) | $98,571 |
| Total | 129 (100.0%) | $87,813 |
Family Income by Number of Earners in Woodridge
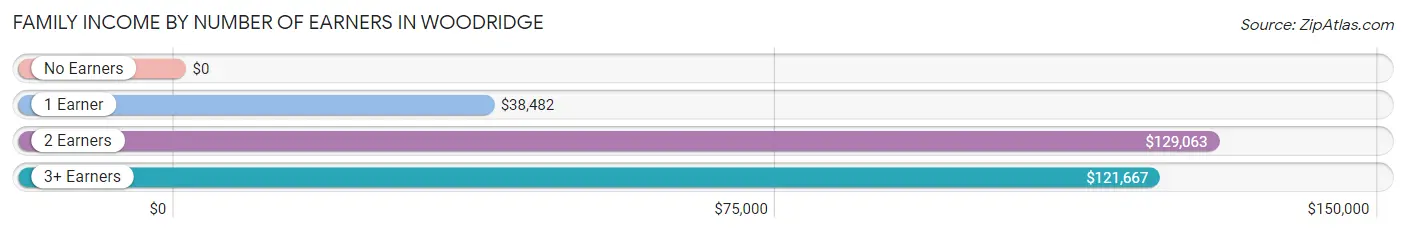
| Number of Earners | # Families | Median Income |
| No Earners | 18 (14.0%) | $0 |
| 1 Earner | 45 (34.9%) | $38,482 |
| 2 Earners | 54 (41.9%) | $129,063 |
| 3+ Earners | 12 (9.3%) | $121,667 |
| Total | 129 (100.0%) | $87,813 |
Household Income in Woodridge
Household Income Brackets in Woodridge
With 58 households falling in the category, the $75,000 to $99,999 income range is the most frequent in Woodridge, accounting for 20.0% of all households.
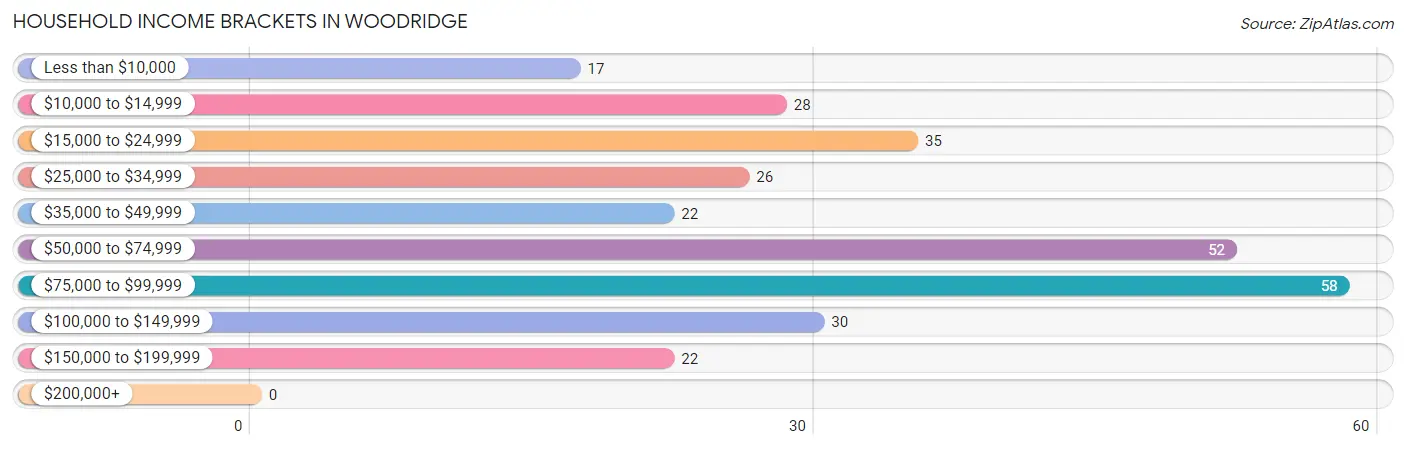
| Income Bracket | # Households | % Households |
| Less than $10,000 | 17 | 5.9% |
| $10,000 to $14,999 | 28 | 9.7% |
| $15,000 to $24,999 | 35 | 12.1% |
| $25,000 to $34,999 | 26 | 9.0% |
| $35,000 to $49,999 | 22 | 7.6% |
| $50,000 to $74,999 | 52 | 17.9% |
| $75,000 to $99,999 | 58 | 20.0% |
| $100,000 to $149,999 | 30 | 10.3% |
| $150,000 to $199,999 | 22 | 7.6% |
| $200,000+ | 0 | 0.0% |
Household Income by Householder Age in Woodridge
The median household income in Woodridge is $70,313, with the highest median household income of $90,125 found in the 25 to 44 years age bracket for the primary householder. A total of 119 households (41.0%) fall into this category. Meanwhile, the 15 to 24 years age bracket for the primary householder has the lowest median household income of $0, with 3 households (1.0%) in this group.
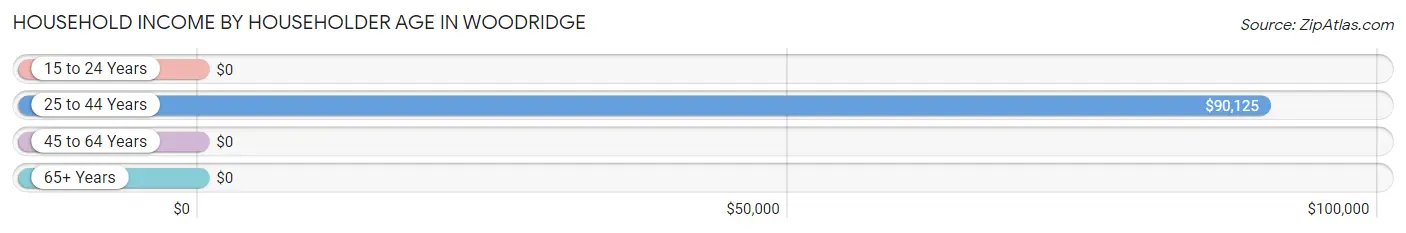
| Income Bracket | # Households | Median Income |
| 15 to 24 Years | 3 (1.0%) | $0 |
| 25 to 44 Years | 119 (41.0%) | $90,125 |
| 45 to 64 Years | 59 (20.3%) | $0 |
| 65+ Years | 109 (37.6%) | $0 |
| Total | 290 (100.0%) | $70,313 |
Poverty in Woodridge
Income Below Poverty by Sex and Age in Woodridge
With 10.3% poverty level for males and 9.9% for females among the residents of Woodridge, 75 year old and over males and 16 and 17 year old females are the most vulnerable to poverty, with 15 males (60.0%) and 7 females (53.8%) in their respective age groups living below the poverty level.
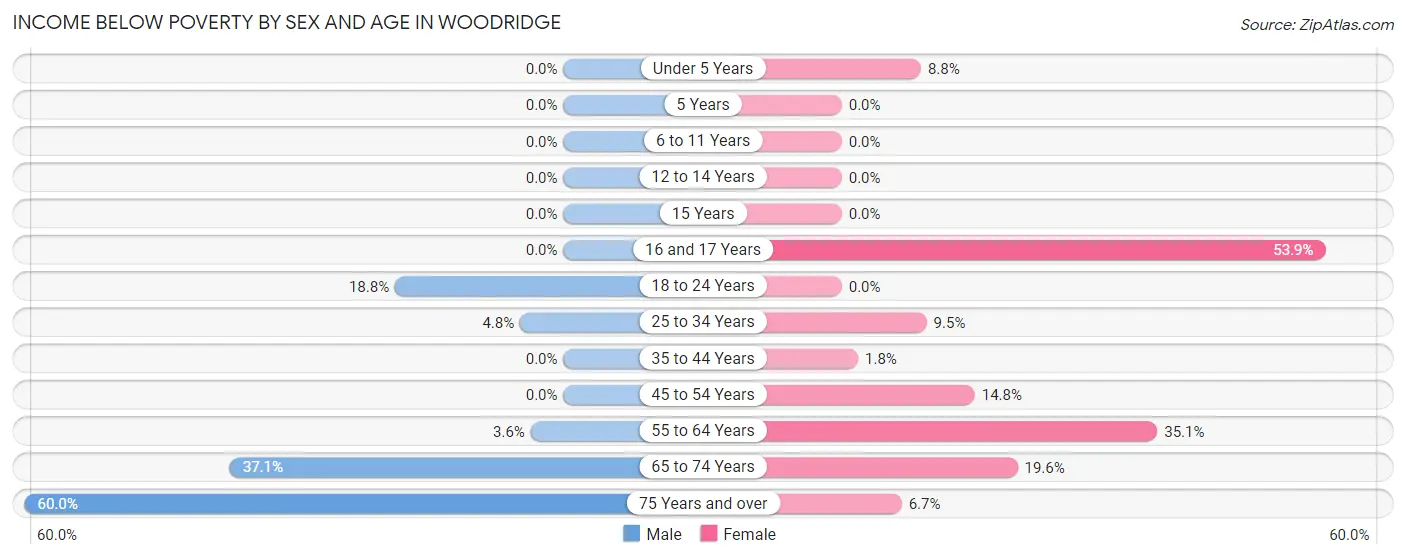
| Age Bracket | Male | Female |
| Under 5 Years | 0 (0.0%) | 3 (8.8%) |
| 5 Years | 0 (0.0%) | 0 (0.0%) |
| 6 to 11 Years | 0 (0.0%) | 0 (0.0%) |
| 12 to 14 Years | 0 (0.0%) | 0 (0.0%) |
| 15 Years | 0 (0.0%) | 0 (0.0%) |
| 16 and 17 Years | 0 (0.0%) | 7 (53.8%) |
| 18 to 24 Years | 9 (18.8%) | 0 (0.0%) |
| 25 to 34 Years | 4 (4.8%) | 12 (9.5%) |
| 35 to 44 Years | 0 (0.0%) | 1 (1.8%) |
| 45 to 54 Years | 0 (0.0%) | 4 (14.8%) |
| 55 to 64 Years | 2 (3.6%) | 13 (35.1%) |
| 65 to 74 Years | 13 (37.1%) | 9 (19.6%) |
| 75 Years and over | 15 (60.0%) | 2 (6.7%) |
| Total | 43 (10.3%) | 51 (9.9%) |
Income Above Poverty by Sex and Age in Woodridge
According to the poverty statistics in Woodridge, males aged under 5 years and females aged 5 years are the age groups that are most secure financially, with 100.0% of males and 100.0% of females in these age groups living above the poverty line.
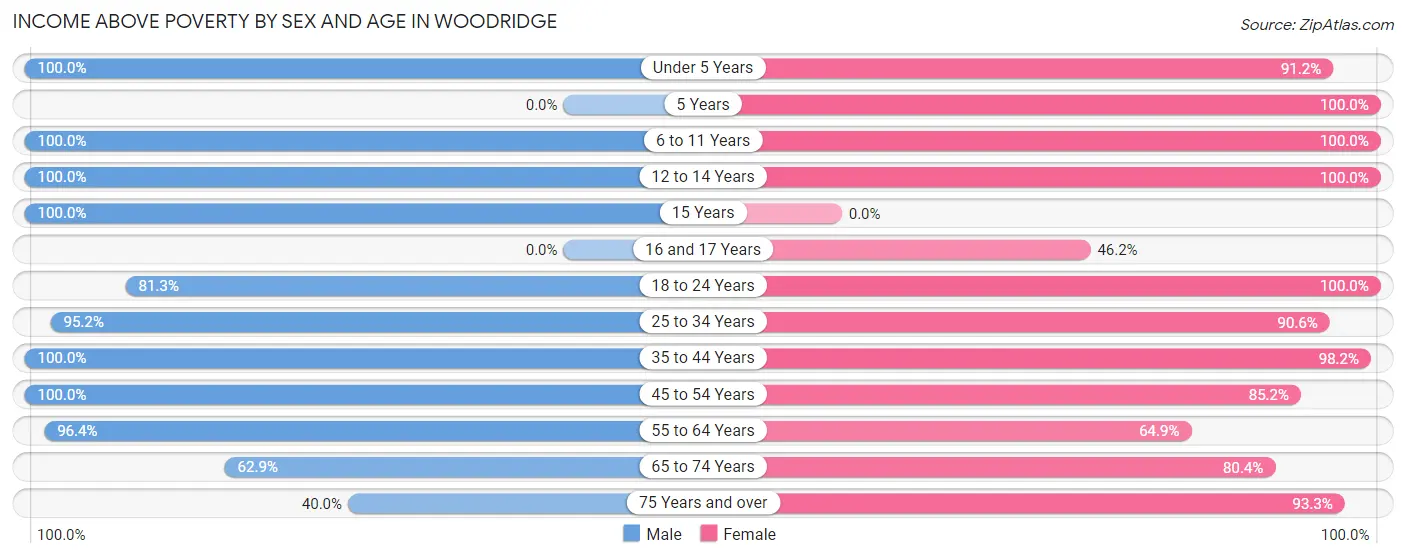
| Age Bracket | Male | Female |
| Under 5 Years | 49 (100.0%) | 31 (91.2%) |
| 5 Years | 0 (0.0%) | 33 (100.0%) |
| 6 to 11 Years | 19 (100.0%) | 35 (100.0%) |
| 12 to 14 Years | 20 (100.0%) | 15 (100.0%) |
| 15 Years | 7 (100.0%) | 0 (0.0%) |
| 16 and 17 Years | 0 (0.0%) | 6 (46.2%) |
| 18 to 24 Years | 39 (81.2%) | 61 (100.0%) |
| 25 to 34 Years | 79 (95.2%) | 115 (90.5%) |
| 35 to 44 Years | 55 (100.0%) | 54 (98.2%) |
| 45 to 54 Years | 22 (100.0%) | 23 (85.2%) |
| 55 to 64 Years | 53 (96.4%) | 24 (64.9%) |
| 65 to 74 Years | 22 (62.9%) | 37 (80.4%) |
| 75 Years and over | 10 (40.0%) | 28 (93.3%) |
| Total | 375 (89.7%) | 462 (90.1%) |
Income Below Poverty Among Married-Couple Families in Woodridge
The poverty statistics for married-couple families in Woodridge show that 5.6% or 4 of the total 72 families live below the poverty line. Families with 1 or 2 children have the highest poverty rate of 18.2%, comprising of 4 families. On the other hand, families with no children have the lowest poverty rate of 0.0%, which includes 0 families.
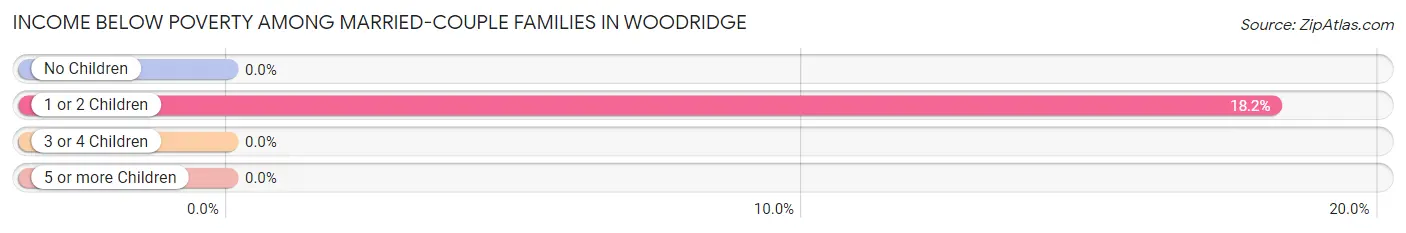
| Children | Above Poverty | Below Poverty |
| No Children | 20 (100.0%) | 0 (0.0%) |
| 1 or 2 Children | 18 (81.8%) | 4 (18.2%) |
| 3 or 4 Children | 23 (100.0%) | 0 (0.0%) |
| 5 or more Children | 7 (100.0%) | 0 (0.0%) |
| Total | 68 (94.4%) | 4 (5.6%) |
Income Below Poverty Among Single-Parent Households in Woodridge
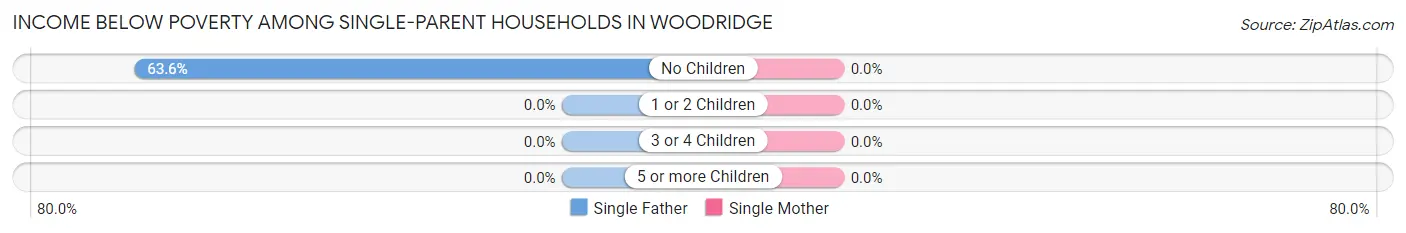
| Children | Single Father | Single Mother |
| No Children | 7 (63.6%) | 0 (0.0%) |
| 1 or 2 Children | 0 (0.0%) | 0 (0.0%) |
| 3 or 4 Children | 0 (0.0%) | 0 (0.0%) |
| 5 or more Children | 0 (0.0%) | 0 (0.0%) |
| Total | 7 (43.8%) | 0 (0.0%) |
Income Below Poverty Among Married-Couple vs Single-Parent Households in Woodridge
The poverty data for Woodridge shows that 4 of the married-couple family households (5.6%) and 7 of the single-parent households (12.3%) are living below the poverty level. Within the married-couple family households, those with 1 or 2 children have the highest poverty rate, with 4 households (18.2%) falling below the poverty line. Among the single-parent households, those with no children have the highest poverty rate, with 7 household (53.8%) living below poverty.
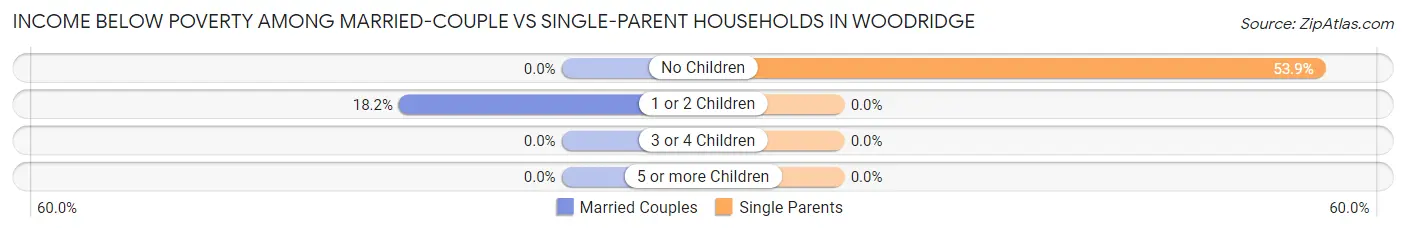
| Children | Married-Couple Families | Single-Parent Households |
| No Children | 0 (0.0%) | 7 (53.8%) |
| 1 or 2 Children | 4 (18.2%) | 0 (0.0%) |
| 3 or 4 Children | 0 (0.0%) | 0 (0.0%) |
| 5 or more Children | 0 (0.0%) | 0 (0.0%) |
| Total | 4 (5.6%) | 7 (12.3%) |
Race in Woodridge
The most populous races in Woodridge are White / Caucasian (650 | 69.4%), Asian (126 | 13.5%), and Hispanic or Latino (115 | 12.3%).
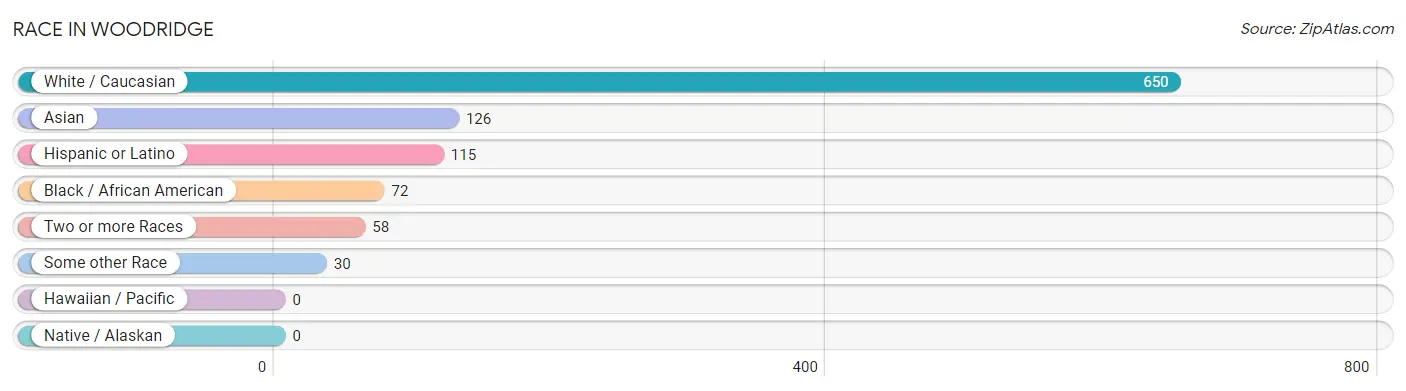
| Race | # Population | % Population |
| Asian | 126 | 13.5% |
| Black / African American | 72 | 7.7% |
| Hawaiian / Pacific | 0 | 0.0% |
| Hispanic or Latino | 115 | 12.3% |
| Native / Alaskan | 0 | 0.0% |
| White / Caucasian | 650 | 69.4% |
| Two or more Races | 58 | 6.2% |
| Some other Race | 30 | 3.2% |
| Total | 936 | 100.0% |
Ancestry in Woodridge
The most populous ancestries reported in Woodridge are Albanian (170 | 18.2%), Indian (Asian) (126 | 13.5%), French (108 | 11.5%), Puerto Rican (102 | 10.9%), and Polish (93 | 9.9%), together accounting for 64.0% of all Woodridge residents.
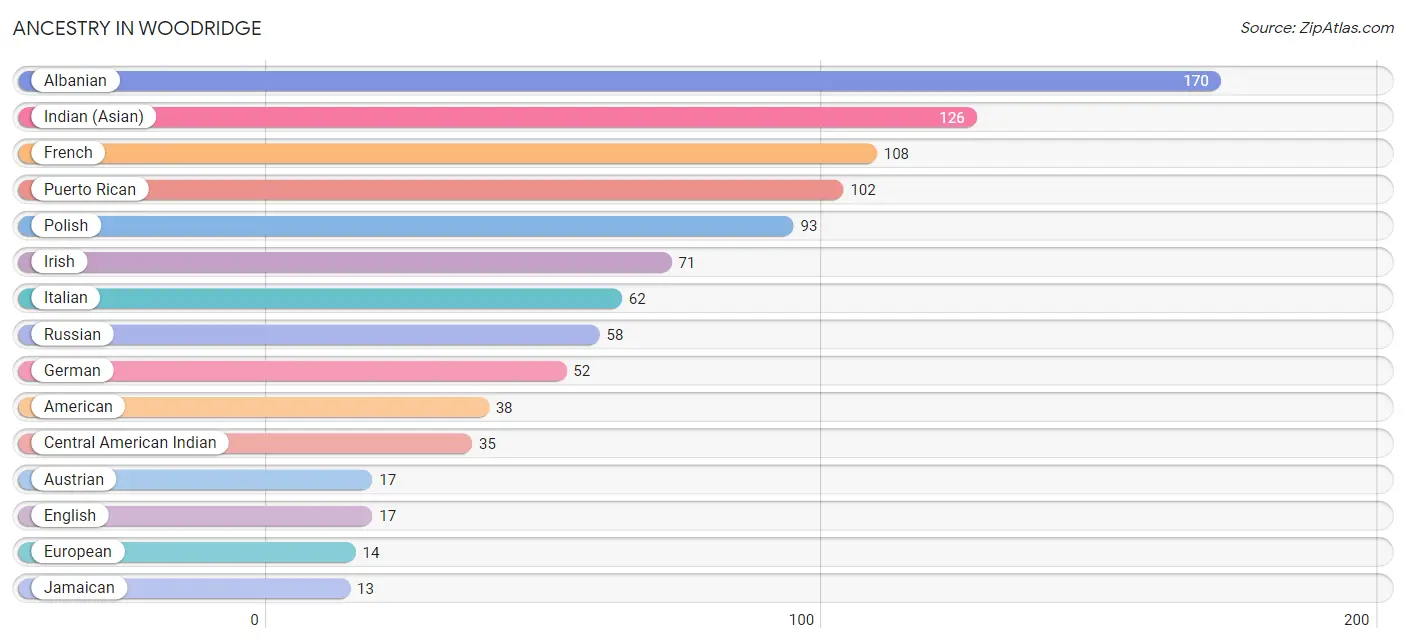
| Ancestry | # Population | % Population |
| Albanian | 170 | 18.2% |
| American | 38 | 4.1% |
| Austrian | 17 | 1.8% |
| Central American Indian | 35 | 3.7% |
| Dutch | 2 | 0.2% |
| English | 17 | 1.8% |
| European | 14 | 1.5% |
| French | 108 | 11.5% |
| German | 52 | 5.6% |
| Hungarian | 9 | 1.0% |
| Indian (Asian) | 126 | 13.5% |
| Irish | 71 | 7.6% |
| Italian | 62 | 6.6% |
| Jamaican | 13 | 1.4% |
| Polish | 93 | 9.9% |
| Puerto Rican | 102 | 10.9% |
| Russian | 58 | 6.2% |
| Swedish | 9 | 1.0% | View All 18 Rows |
Immigrants in Woodridge
The most numerous immigrant groups reported in Woodridge came from Asia (66 | 7.0%), China (66 | 7.0%), Eastern Asia (66 | 7.0%), Eastern Europe (44 | 4.7%), and Europe (44 | 4.7%), together accounting for 30.5% of all Woodridge residents.
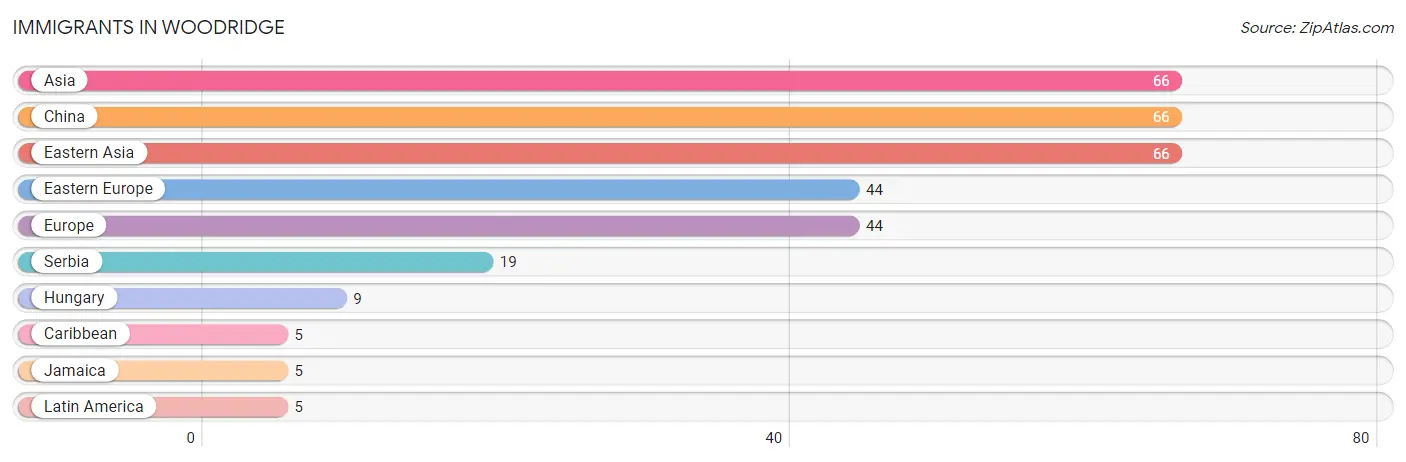
| Immigration Origin | # Population | % Population |
| Asia | 66 | 7.0% |
| Caribbean | 5 | 0.5% |
| China | 66 | 7.0% |
| Eastern Asia | 66 | 7.0% |
| Eastern Europe | 44 | 4.7% |
| Europe | 44 | 4.7% |
| Hungary | 9 | 1.0% |
| Jamaica | 5 | 0.5% |
| Latin America | 5 | 0.5% |
| Serbia | 19 | 2.0% | View All 10 Rows |
Sex and Age in Woodridge
Sex and Age in Woodridge
The most populous age groups in Woodridge are 55 to 59 Years (50 | 11.8%) for men and 25 to 29 Years (90 | 17.5%) for women.
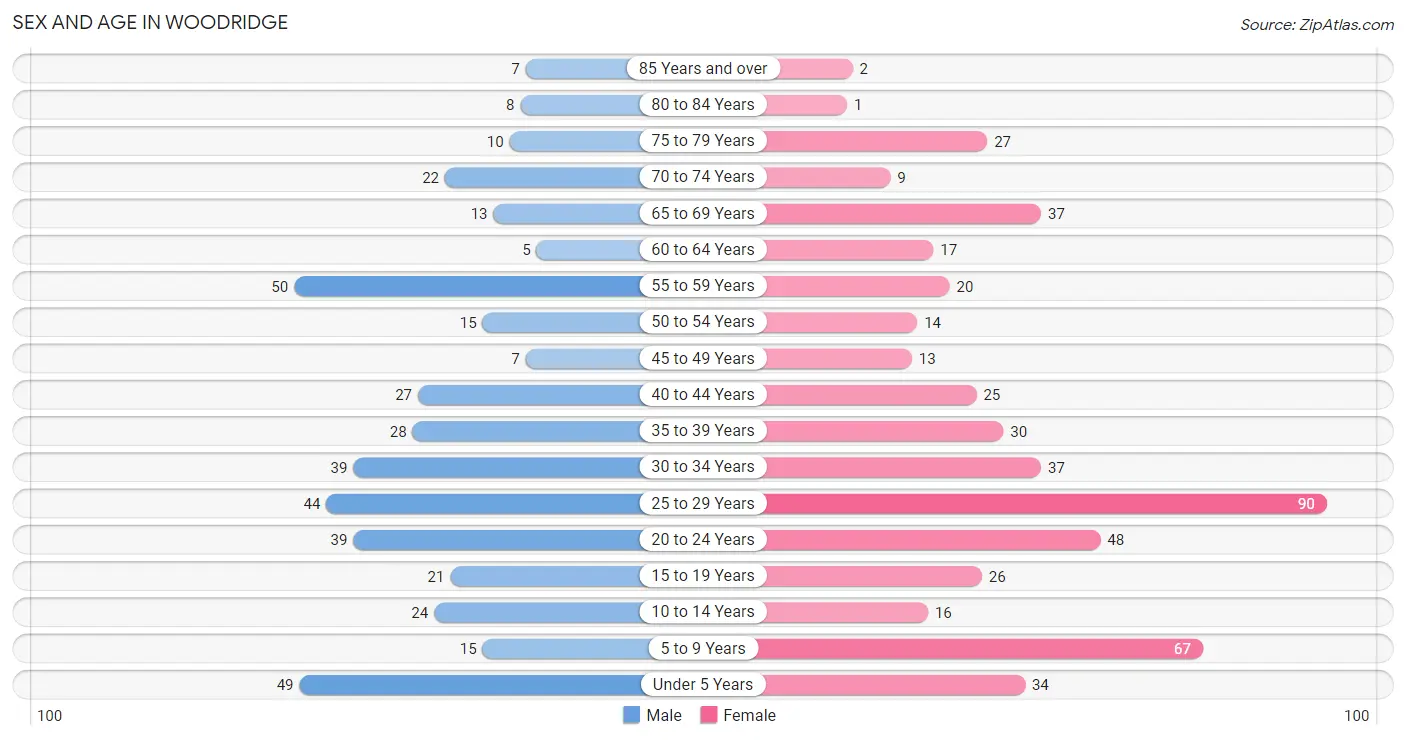
| Age Bracket | Male | Female |
| Under 5 Years | 49 (11.6%) | 34 (6.6%) |
| 5 to 9 Years | 15 (3.5%) | 67 (13.1%) |
| 10 to 14 Years | 24 (5.7%) | 16 (3.1%) |
| 15 to 19 Years | 21 (5.0%) | 26 (5.1%) |
| 20 to 24 Years | 39 (9.2%) | 48 (9.4%) |
| 25 to 29 Years | 44 (10.4%) | 90 (17.5%) |
| 30 to 34 Years | 39 (9.2%) | 37 (7.2%) |
| 35 to 39 Years | 28 (6.6%) | 30 (5.9%) |
| 40 to 44 Years | 27 (6.4%) | 25 (4.9%) |
| 45 to 49 Years | 7 (1.7%) | 13 (2.5%) |
| 50 to 54 Years | 15 (3.5%) | 14 (2.7%) |
| 55 to 59 Years | 50 (11.8%) | 20 (3.9%) |
| 60 to 64 Years | 5 (1.2%) | 17 (3.3%) |
| 65 to 69 Years | 13 (3.1%) | 37 (7.2%) |
| 70 to 74 Years | 22 (5.2%) | 9 (1.8%) |
| 75 to 79 Years | 10 (2.4%) | 27 (5.3%) |
| 80 to 84 Years | 8 (1.9%) | 1 (0.2%) |
| 85 Years and over | 7 (1.7%) | 2 (0.4%) |
| Total | 423 (100.0%) | 513 (100.0%) |
Families and Households in Woodridge
Median Family Size in Woodridge
The median family size in Woodridge is 5.62 persons per family, with married-couple families (72 | 55.8%) accounting for the largest median family size of 5.97 persons per family. On the other hand, single male/father families (16 | 12.4%) represent the smallest median family size with 3.31 persons per family.
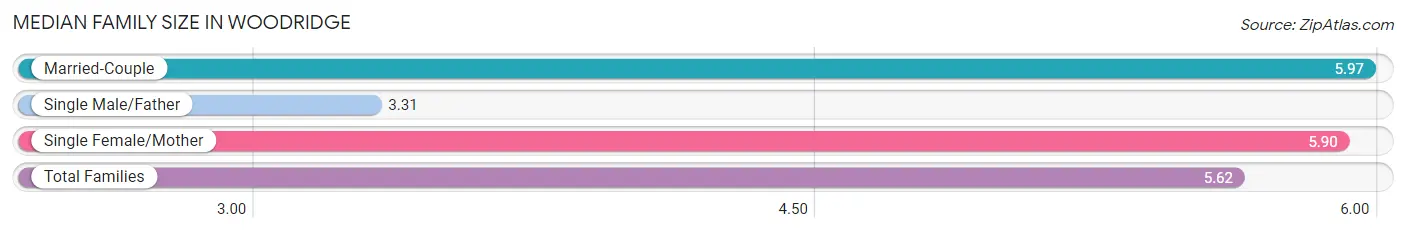
| Family Type | # Families | Family Size |
| Married-Couple | 72 (55.8%) | 5.97 |
| Single Male/Father | 16 (12.4%) | 3.31 |
| Single Female/Mother | 41 (31.8%) | 5.90 |
| Total Families | 129 (100.0%) | 5.62 |
Median Household Size in Woodridge
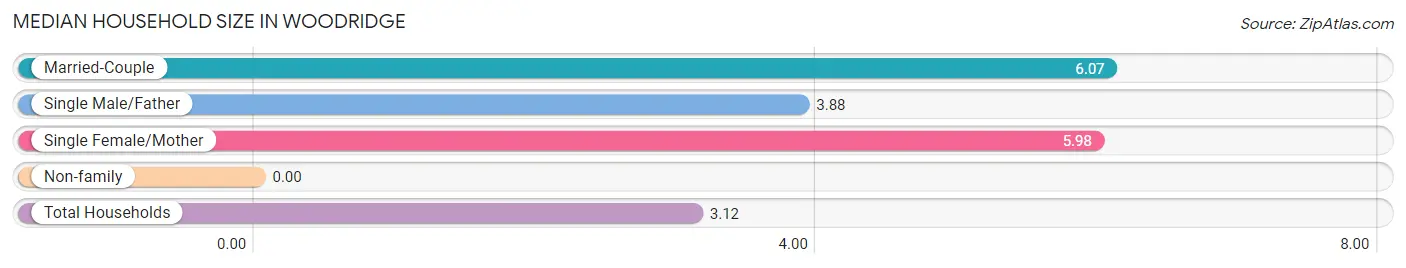
| Household Type | # Households | Household Size |
| Married-Couple | 72 (24.8%) | 6.07 |
| Single Male/Father | 16 (5.5%) | 3.88 |
| Single Female/Mother | 41 (14.1%) | 5.98 |
| Non-family | 161 (55.5%) | - |
| Total Households | 290 (100.0%) | 3.12 |
Household Size by Marriage Status in Woodridge
Out of a total of 290 households in Woodridge, 129 (44.5%) are family households, while 161 (55.5%) are nonfamily households. The most numerous type of family households are 7+ person households, comprising 46, and the most common type of nonfamily households are 1-person households, comprising 161.
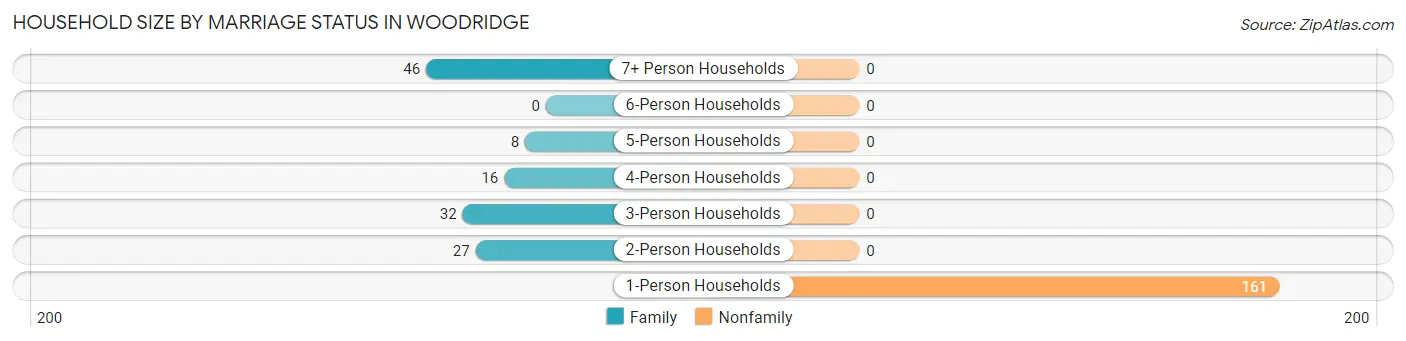
| Household Size | Family Households | Nonfamily Households |
| 1-Person Households | - | 161 (55.5%) |
| 2-Person Households | 27 (9.3%) | 0 (0.0%) |
| 3-Person Households | 32 (11.0%) | 0 (0.0%) |
| 4-Person Households | 16 (5.5%) | 0 (0.0%) |
| 5-Person Households | 8 (2.8%) | 0 (0.0%) |
| 6-Person Households | 0 (0.0%) | 0 (0.0%) |
| 7+ Person Households | 46 (15.9%) | 0 (0.0%) |
| Total | 129 (44.5%) | 161 (55.5%) |
Female Fertility in Woodridge
Fertility by Age in Woodridge
Average fertility rate in Woodridge is 89.0 births per 1,000 women. Women in the age bracket of 35 to 50 years have the highest fertility rate with 103.0 births per 1,000 women. Women in the age bracket of 20 to 34 years acount for 70.8% of all women with births.
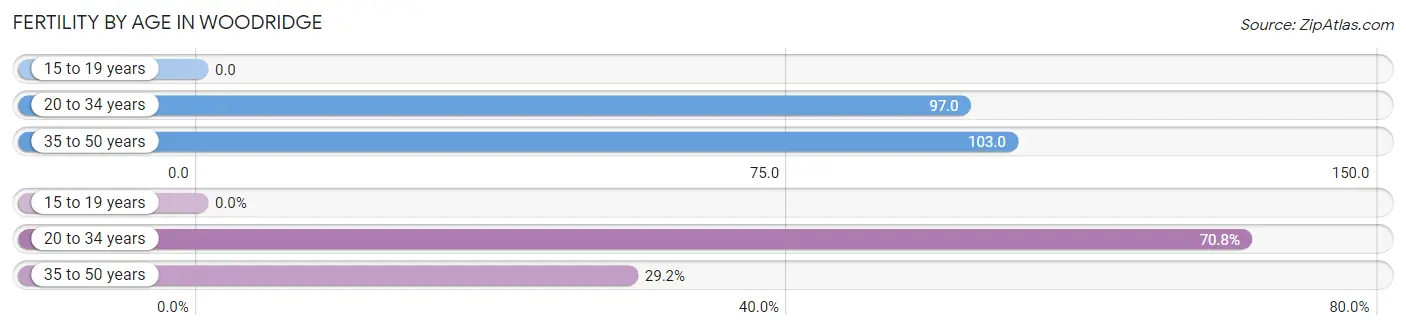
| Age Bracket | Women with Births | Births / 1,000 Women |
| 15 to 19 years | 0 (0.0%) | 0.0 |
| 20 to 34 years | 17 (70.8%) | 97.0 |
| 35 to 50 years | 7 (29.2%) | 103.0 |
| Total | 24 (100.0%) | 89.0 |
Fertility by Age by Marriage Status in Woodridge
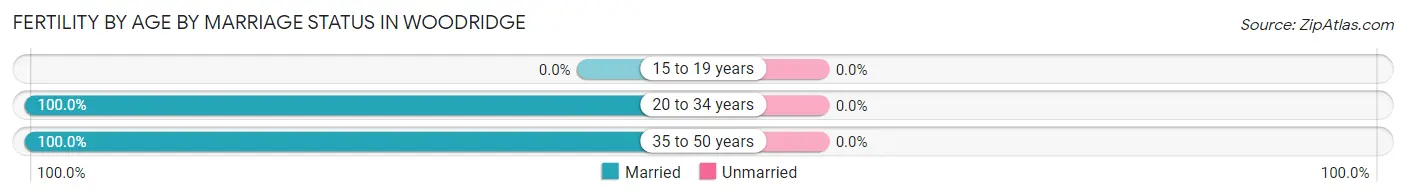
| Age Bracket | Married | Unmarried |
| 15 to 19 years | 0 (0.0%) | 0 (0.0%) |
| 20 to 34 years | 17 (100.0%) | 0 (0.0%) |
| 35 to 50 years | 7 (100.0%) | 0 (0.0%) |
| Total | 24 (100.0%) | 0 (0.0%) |
Fertility by Education in Woodridge
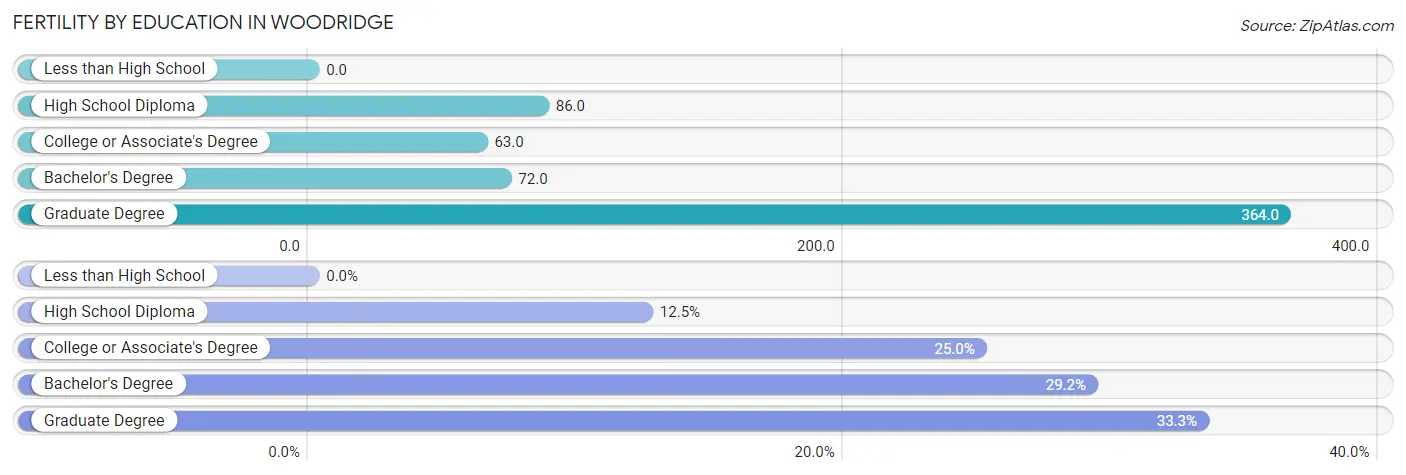
| Educational Attainment | Women with Births | Births / 1,000 Women |
| Less than High School | 0 (0.0%) | 0.0 |
| High School Diploma | 3 (12.5%) | 86.0 |
| College or Associate's Degree | 6 (25.0%) | 63.0 |
| Bachelor's Degree | 7 (29.2%) | 72.0 |
| Graduate Degree | 8 (33.3%) | 364.0 |
| Total | 24 (100.0%) | 89.0 |
Fertility by Education by Marriage Status in Woodridge
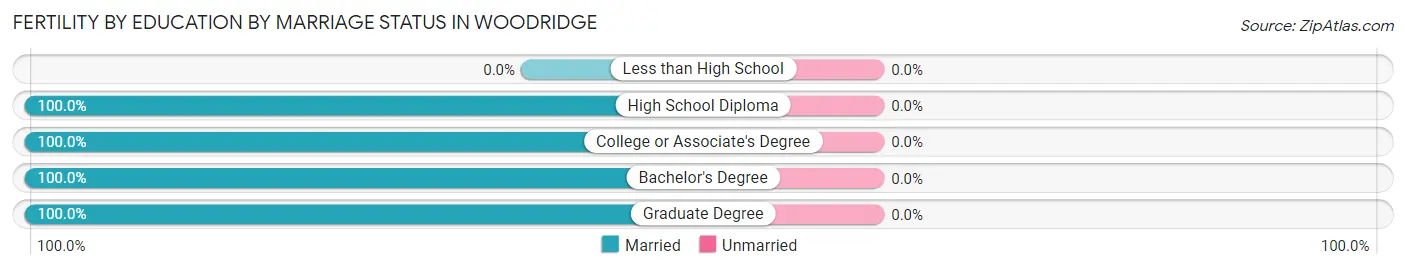
| Educational Attainment | Married | Unmarried |
| Less than High School | 0 (0.0%) | 0 (0.0%) |
| High School Diploma | 3 (100.0%) | 0 (0.0%) |
| College or Associate's Degree | 6 (100.0%) | 0 (0.0%) |
| Bachelor's Degree | 7 (100.0%) | 0 (0.0%) |
| Graduate Degree | 8 (100.0%) | 0 (0.0%) |
| Total | 24 (100.0%) | 0 (0.0%) |
Employment Characteristics in Woodridge
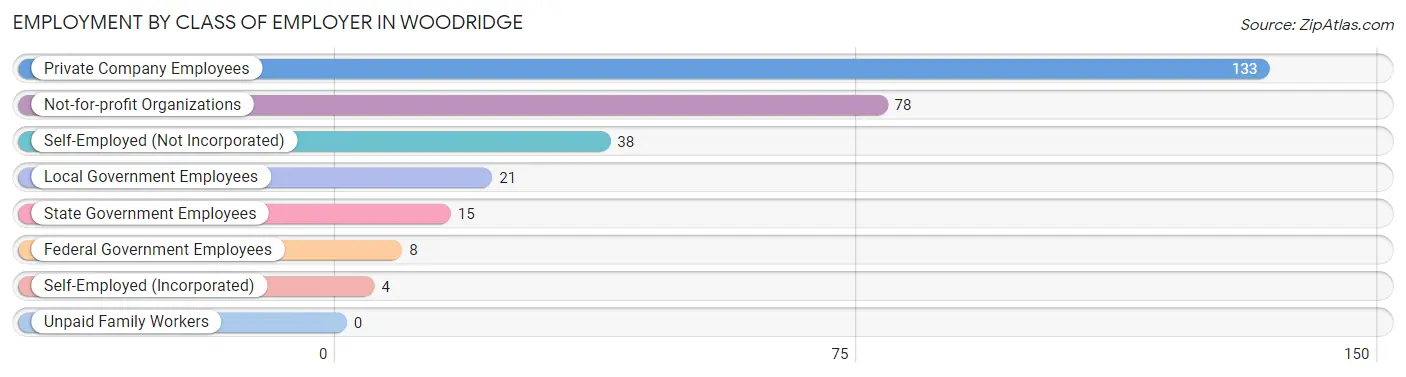
Employment by Class of Employer in Woodridge
Among the 297 employed individuals in Woodridge, private company employees (133 | 44.8%), not-for-profit organizations (78 | 26.3%), and self-employed (not incorporated) (38 | 12.8%) make up the most common classes of employment.
| Employer Class | # Employees | % Employees |
| Private Company Employees | 133 | 44.8% |
| Self-Employed (Incorporated) | 4 | 1.3% |
| Self-Employed (Not Incorporated) | 38 | 12.8% |
| Not-for-profit Organizations | 78 | 26.3% |
| Local Government Employees | 21 | 7.1% |
| State Government Employees | 15 | 5.1% |
| Federal Government Employees | 8 | 2.7% |
| Unpaid Family Workers | 0 | 0.0% |
| Total | 297 | 100.0% |
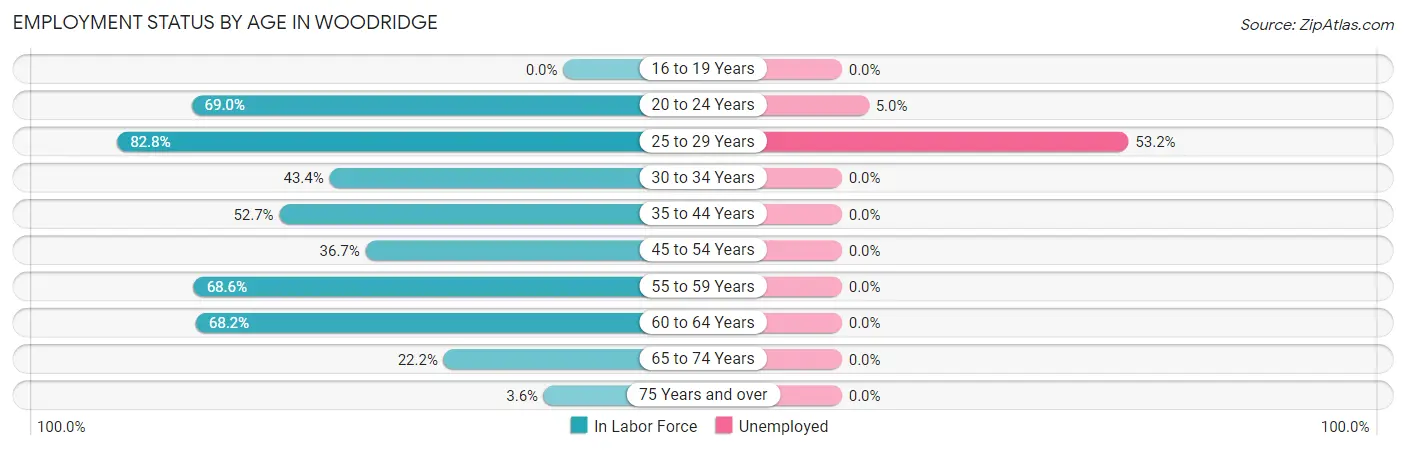
Employment Status by Age in Woodridge
According to the labor force statistics for Woodridge, out of the total population over 16 years of age (724), 50.1% or 363 individuals are in the labor force, with 17.1% or 62 of them unemployed. The age group with the highest labor force participation rate is 25 to 29 years, with 82.8% or 111 individuals in the labor force. Within the labor force, the 25 to 29 years age range has the highest percentage of unemployed individuals, with 53.2% or 59 of them being unemployed.
| Age Bracket | In Labor Force | Unemployed |
| 16 to 19 Years | 0 (0.0%) | 0 (0.0%) |
| 20 to 24 Years | 60 (69.0%) | 3 (5.0%) |
| 25 to 29 Years | 111 (82.8%) | 59 (53.2%) |
| 30 to 34 Years | 33 (43.4%) | 0 (0.0%) |
| 35 to 44 Years | 58 (52.7%) | 0 (0.0%) |
| 45 to 54 Years | 18 (36.7%) | 0 (0.0%) |
| 55 to 59 Years | 48 (68.6%) | 0 (0.0%) |
| 60 to 64 Years | 15 (68.2%) | 0 (0.0%) |
| 65 to 74 Years | 18 (22.2%) | 0 (0.0%) |
| 75 Years and over | 2 (3.6%) | 0 (0.0%) |
| Total | 363 (50.1%) | 62 (17.1%) |
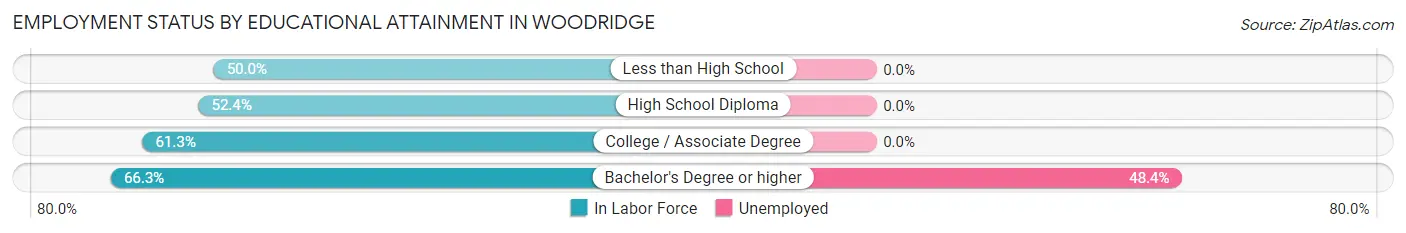
Employment Status by Educational Attainment in Woodridge
According to labor force statistics for Woodridge, 61.4% of individuals (283) out of the total population between 25 and 64 years of age (461) are in the labor force, with 20.8% or 59 of them being unemployed. The group with the highest labor force participation rate are those with the educational attainment of bachelor's degree or higher, with 66.3% or 122 individuals in the labor force. Within the labor force, individuals with bachelor's degree or higher education have the highest percentage of unemployment, with 48.4% or 59 of them being unemployed.
| Educational Attainment | In Labor Force | Unemployed |
| Less than High School | 6 (50.0%) | 0 (0.0%) |
| High School Diploma | 44 (52.4%) | 0 (0.0%) |
| College / Associate Degree | 111 (61.3%) | 0 (0.0%) |
| Bachelor's Degree or higher | 122 (66.3%) | 89 (48.4%) |
| Total | 283 (61.4%) | 96 (20.8%) |
Employment Occupations by Sex in Woodridge
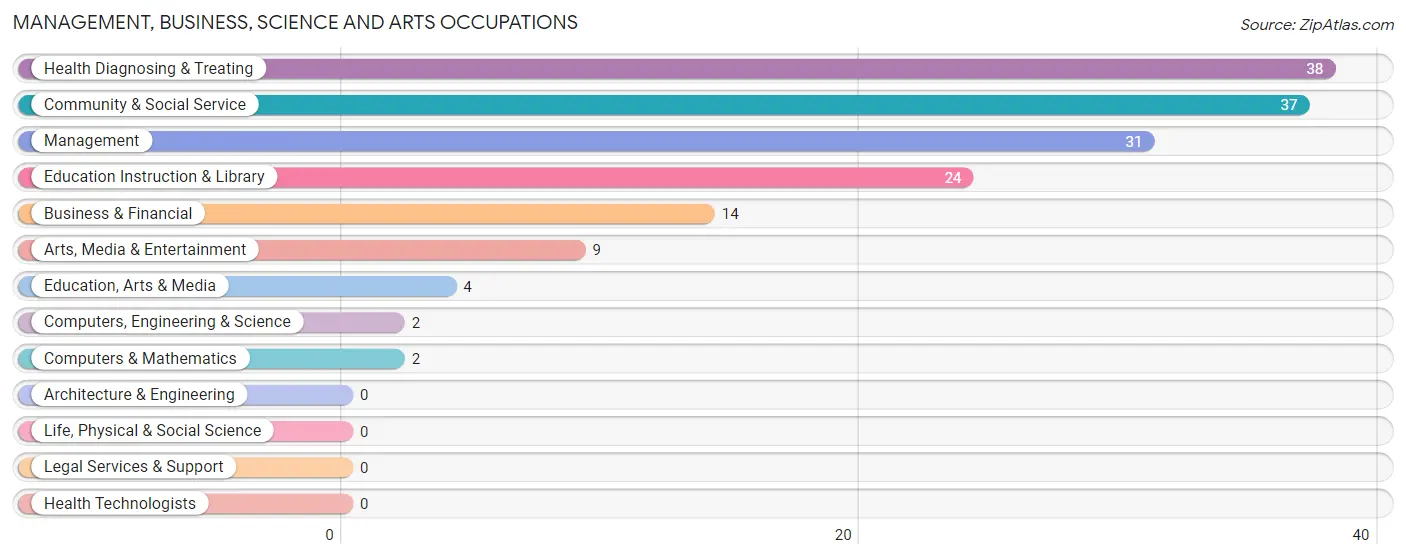
Management, Business, Science and Arts Occupations
The most common Management, Business, Science and Arts occupations in Woodridge are Health Diagnosing & Treating (38 | 12.6%), Community & Social Service (37 | 12.3%), Management (31 | 10.3%), Education Instruction & Library (24 | 8.0%), and Business & Financial (14 | 4.6%).
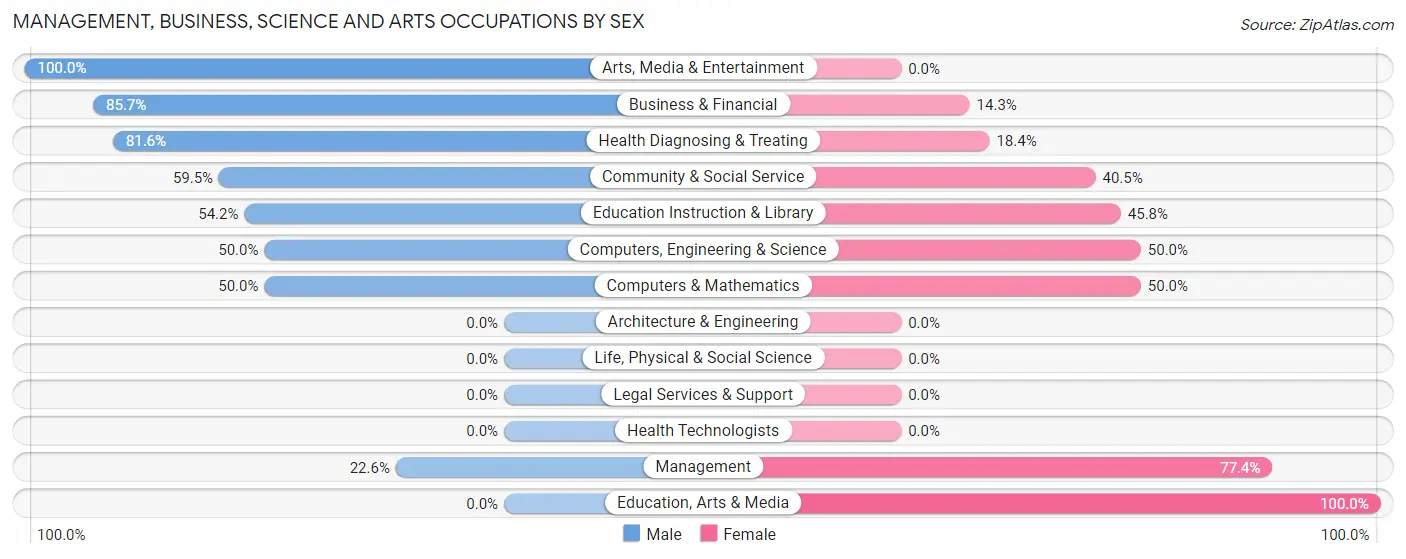
Management, Business, Science and Arts Occupations by Sex
Within the Management, Business, Science and Arts occupations in Woodridge, the most male-oriented occupations are Arts, Media & Entertainment (100.0%), Business & Financial (85.7%), and Health Diagnosing & Treating (81.6%), while the most female-oriented occupations are Education, Arts & Media (100.0%), Management (77.4%), and Computers, Engineering & Science (50.0%).
| Occupation | Male | Female |
| Management | 7 (22.6%) | 24 (77.4%) |
| Business & Financial | 12 (85.7%) | 2 (14.3%) |
| Computers, Engineering & Science | 1 (50.0%) | 1 (50.0%) |
| Computers & Mathematics | 1 (50.0%) | 1 (50.0%) |
| Architecture & Engineering | 0 (0.0%) | 0 (0.0%) |
| Life, Physical & Social Science | 0 (0.0%) | 0 (0.0%) |
| Community & Social Service | 22 (59.5%) | 15 (40.5%) |
| Education, Arts & Media | 0 (0.0%) | 4 (100.0%) |
| Legal Services & Support | 0 (0.0%) | 0 (0.0%) |
| Education Instruction & Library | 13 (54.2%) | 11 (45.8%) |
| Arts, Media & Entertainment | 9 (100.0%) | 0 (0.0%) |
| Health Diagnosing & Treating | 31 (81.6%) | 7 (18.4%) |
| Health Technologists | 0 (0.0%) | 0 (0.0%) |
| Total (Category) | 73 (59.8%) | 49 (40.2%) |
| Total (Overall) | 140 (46.5%) | 161 (53.5%) |
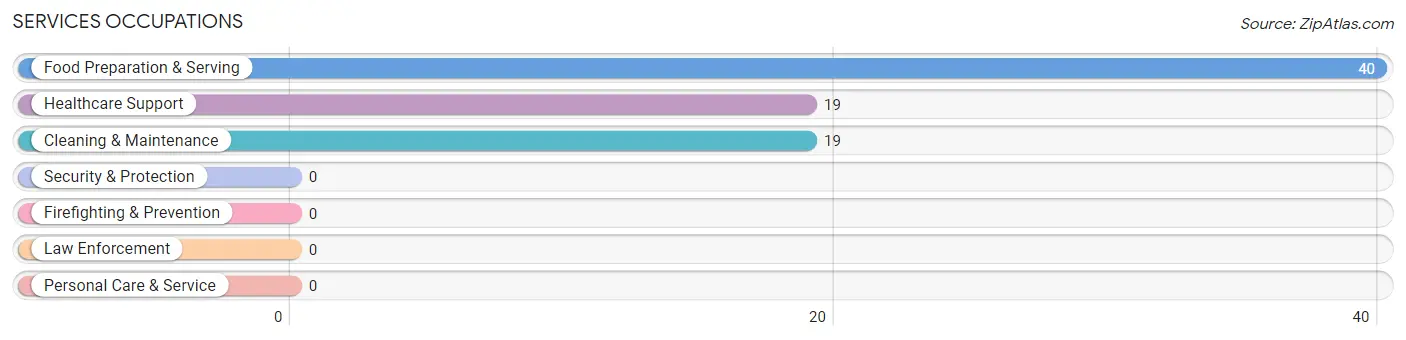
Services Occupations
The most common Services occupations in Woodridge are Food Preparation & Serving (40 | 13.3%), Healthcare Support (19 | 6.3%), and Cleaning & Maintenance (19 | 6.3%).
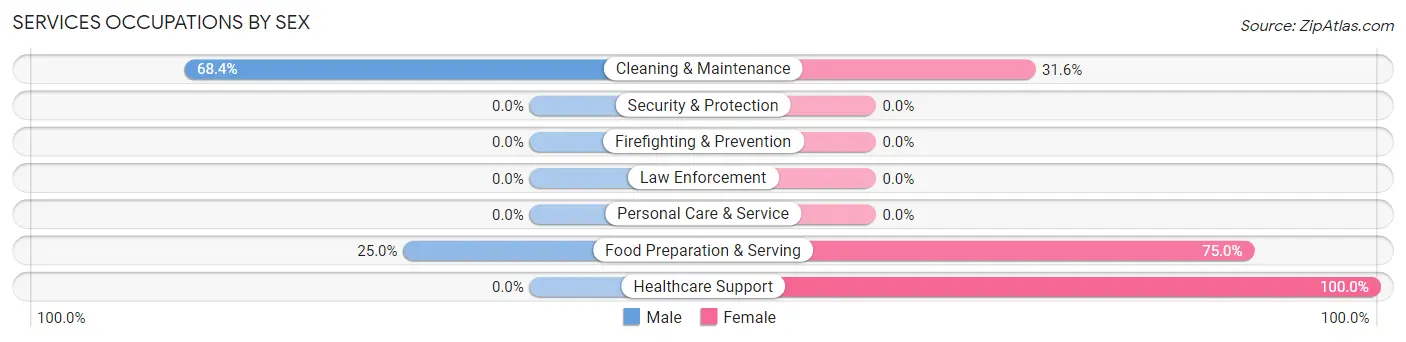
Services Occupations by Sex
Within the Services occupations in Woodridge, the most male-oriented occupations are Cleaning & Maintenance (68.4%), and Food Preparation & Serving (25.0%), while the most female-oriented occupations are Healthcare Support (100.0%), Food Preparation & Serving (75.0%), and Cleaning & Maintenance (31.6%).
| Occupation | Male | Female |
| Healthcare Support | 0 (0.0%) | 19 (100.0%) |
| Security & Protection | 0 (0.0%) | 0 (0.0%) |
| Firefighting & Prevention | 0 (0.0%) | 0 (0.0%) |
| Law Enforcement | 0 (0.0%) | 0 (0.0%) |
| Food Preparation & Serving | 10 (25.0%) | 30 (75.0%) |
| Cleaning & Maintenance | 13 (68.4%) | 6 (31.6%) |
| Personal Care & Service | 0 (0.0%) | 0 (0.0%) |
| Total (Category) | 23 (29.5%) | 55 (70.5%) |
| Total (Overall) | 140 (46.5%) | 161 (53.5%) |
Sales and Office Occupations
The most common Sales and Office occupations in Woodridge are Office & Administration (52 | 17.3%), and Sales & Related (8 | 2.7%).
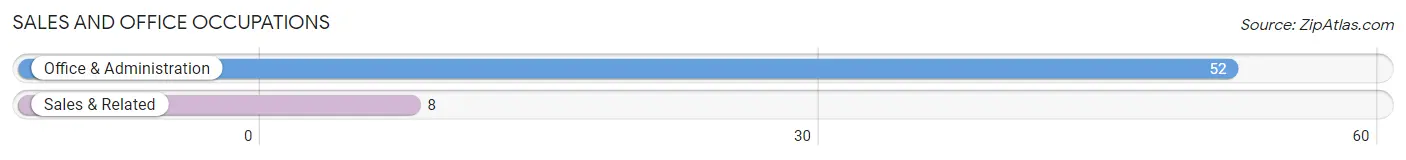
Sales and Office Occupations by Sex
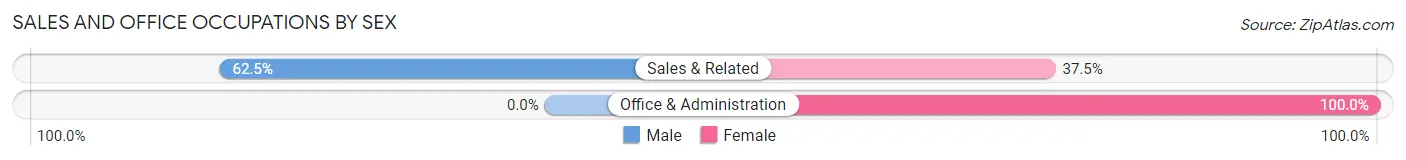
| Occupation | Male | Female |
| Sales & Related | 5 (62.5%) | 3 (37.5%) |
| Office & Administration | 0 (0.0%) | 52 (100.0%) |
| Total (Category) | 5 (8.3%) | 55 (91.7%) |
| Total (Overall) | 140 (46.5%) | 161 (53.5%) |
Natural Resources, Construction and Maintenance Occupations
The most common Natural Resources, Construction and Maintenance occupations in Woodridge are Construction & Extraction (5 | 1.7%), and Installation, Maintenance & Repair (2 | 0.7%).
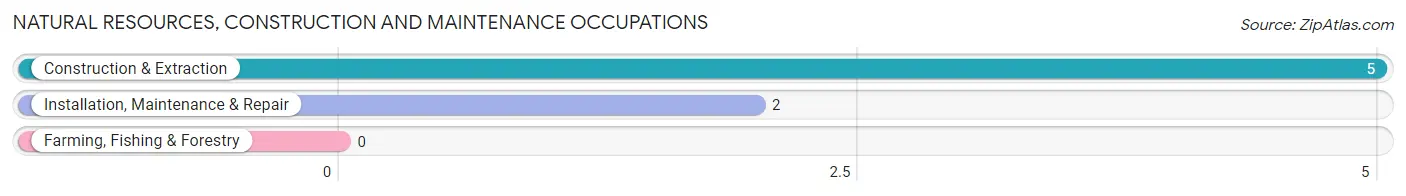
Natural Resources, Construction and Maintenance Occupations by Sex

| Occupation | Male | Female |
| Farming, Fishing & Forestry | 0 (0.0%) | 0 (0.0%) |
| Construction & Extraction | 5 (100.0%) | 0 (0.0%) |
| Installation, Maintenance & Repair | 2 (100.0%) | 0 (0.0%) |
| Total (Category) | 7 (100.0%) | 0 (0.0%) |
| Total (Overall) | 140 (46.5%) | 161 (53.5%) |
Production, Transportation and Moving Occupations
The most common Production, Transportation and Moving occupations in Woodridge are Transportation (29 | 9.6%), and Material Moving (5 | 1.7%).
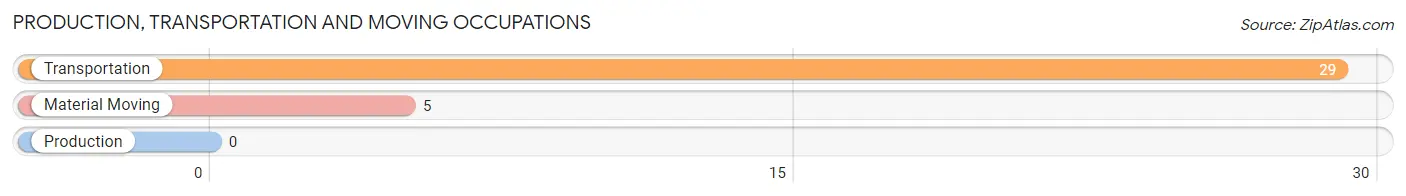
Production, Transportation and Moving Occupations by Sex
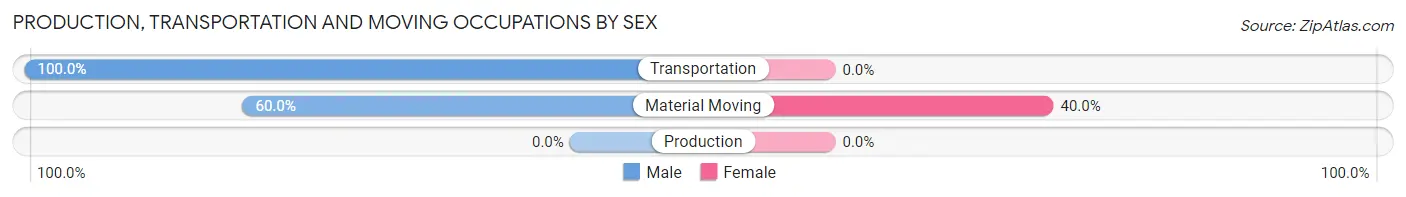
| Occupation | Male | Female |
| Production | 0 (0.0%) | 0 (0.0%) |
| Transportation | 29 (100.0%) | 0 (0.0%) |
| Material Moving | 3 (60.0%) | 2 (40.0%) |
| Total (Category) | 32 (94.1%) | 2 (5.9%) |
| Total (Overall) | 140 (46.5%) | 161 (53.5%) |
Employment Industries by Sex in Woodridge
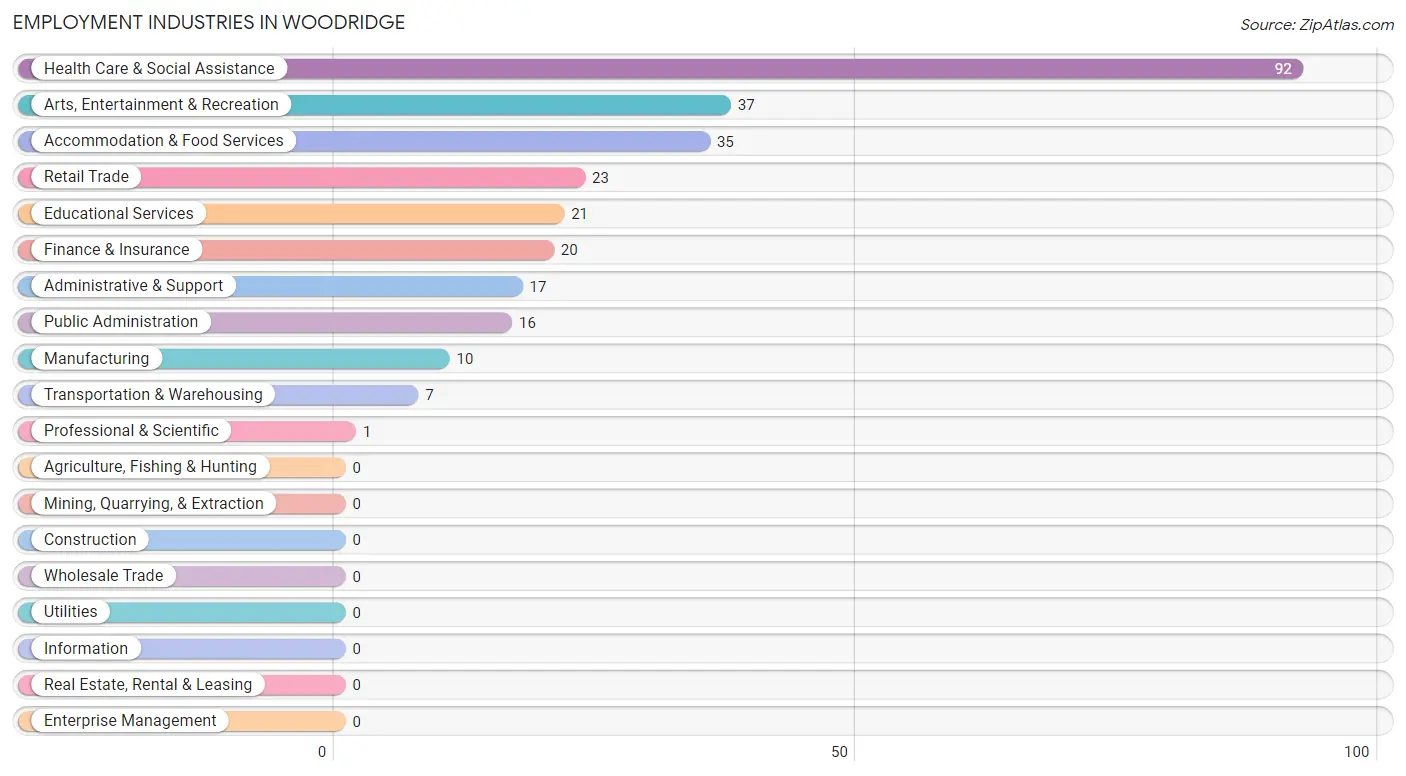
Employment Industries in Woodridge
The major employment industries in Woodridge include Health Care & Social Assistance (92 | 30.6%), Arts, Entertainment & Recreation (37 | 12.3%), Accommodation & Food Services (35 | 11.6%), Retail Trade (23 | 7.6%), and Educational Services (21 | 7.0%).
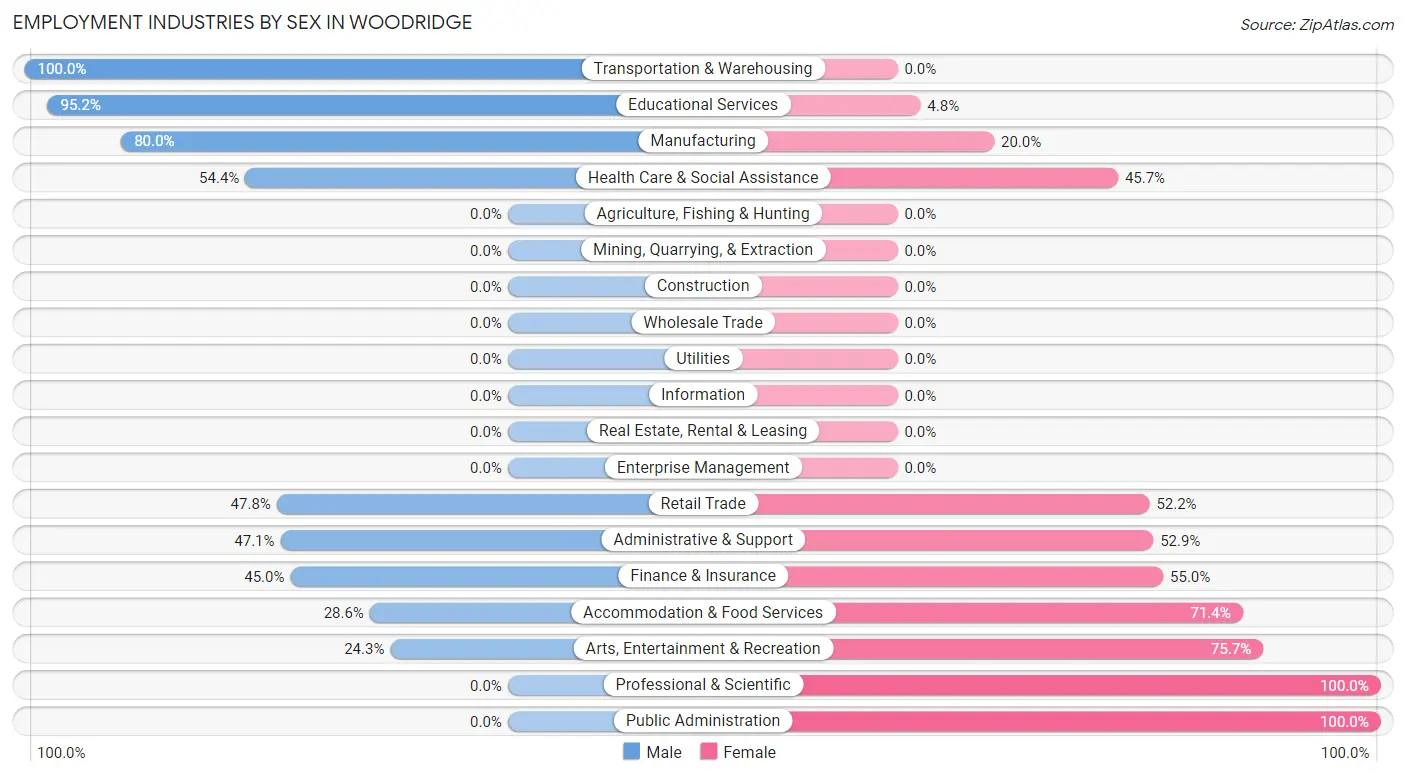
Employment Industries by Sex in Woodridge
The Woodridge industries that see more men than women are Transportation & Warehousing (100.0%), Educational Services (95.2%), and Manufacturing (80.0%), whereas the industries that tend to have a higher number of women are Professional & Scientific (100.0%), Public Administration (100.0%), and Arts, Entertainment & Recreation (75.7%).
| Industry | Male | Female |
| Agriculture, Fishing & Hunting | 0 (0.0%) | 0 (0.0%) |
| Mining, Quarrying, & Extraction | 0 (0.0%) | 0 (0.0%) |
| Construction | 0 (0.0%) | 0 (0.0%) |
| Manufacturing | 8 (80.0%) | 2 (20.0%) |
| Wholesale Trade | 0 (0.0%) | 0 (0.0%) |
| Retail Trade | 11 (47.8%) | 12 (52.2%) |
| Transportation & Warehousing | 7 (100.0%) | 0 (0.0%) |
| Utilities | 0 (0.0%) | 0 (0.0%) |
| Information | 0 (0.0%) | 0 (0.0%) |
| Finance & Insurance | 9 (45.0%) | 11 (55.0%) |
| Real Estate, Rental & Leasing | 0 (0.0%) | 0 (0.0%) |
| Professional & Scientific | 0 (0.0%) | 1 (100.0%) |
| Enterprise Management | 0 (0.0%) | 0 (0.0%) |
| Administrative & Support | 8 (47.1%) | 9 (52.9%) |
| Educational Services | 20 (95.2%) | 1 (4.8%) |
| Health Care & Social Assistance | 50 (54.3%) | 42 (45.7%) |
| Arts, Entertainment & Recreation | 9 (24.3%) | 28 (75.7%) |
| Accommodation & Food Services | 10 (28.6%) | 25 (71.4%) |
| Public Administration | 0 (0.0%) | 16 (100.0%) |
| Total | 140 (46.5%) | 161 (53.5%) |
Education in Woodridge
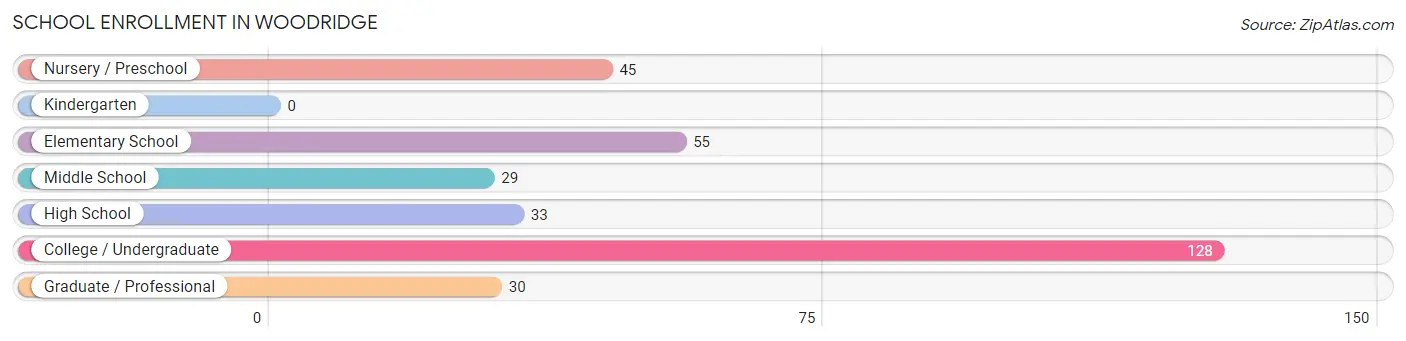
School Enrollment in Woodridge
The most common levels of schooling among the 320 students in Woodridge are college / undergraduate (128 | 40.0%), elementary school (55 | 17.2%), and nursery / preschool (45 | 14.1%).
| School Level | # Students | % Students |
| Nursery / Preschool | 45 | 14.1% |
| Kindergarten | 0 | 0.0% |
| Elementary School | 55 | 17.2% |
| Middle School | 29 | 9.1% |
| High School | 33 | 10.3% |
| College / Undergraduate | 128 | 40.0% |
| Graduate / Professional | 30 | 9.4% |
| Total | 320 | 100.0% |
School Enrollment by Age by Funding Source in Woodridge
Out of a total of 320 students who are enrolled in schools in Woodridge, 95 (29.7%) attend a private institution, while the remaining 225 (70.3%) are enrolled in public schools. The age group of 18 to 19 year olds has the highest likelihood of being enrolled in private schools, with 15 (78.9% in the age bracket) enrolled. Conversely, the age group of 3 to 4 year olds has the lowest likelihood of being enrolled in a private school, with 29 (100.0% in the age bracket) attending a public institution.
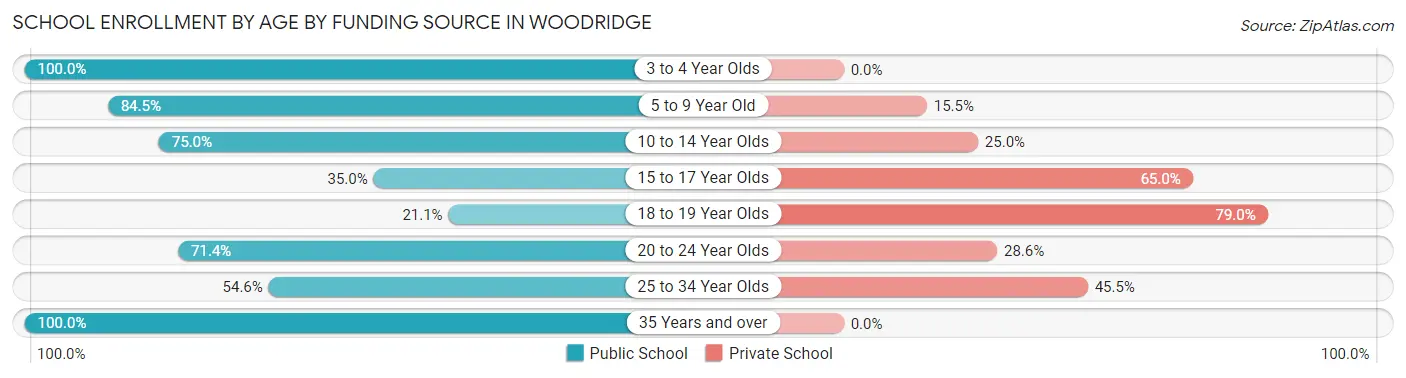
| Age Bracket | Public School | Private School |
| 3 to 4 Year Olds | 29 (100.0%) | 0 (0.0%) |
| 5 to 9 Year Old | 60 (84.5%) | 11 (15.5%) |
| 10 to 14 Year Olds | 30 (75.0%) | 10 (25.0%) |
| 15 to 17 Year Olds | 7 (35.0%) | 13 (65.0%) |
| 18 to 19 Year Olds | 4 (21.0%) | 15 (78.9%) |
| 20 to 24 Year Olds | 40 (71.4%) | 16 (28.6%) |
| 25 to 34 Year Olds | 36 (54.5%) | 30 (45.5%) |
| 35 Years and over | 19 (100.0%) | 0 (0.0%) |
| Total | 225 (70.3%) | 95 (29.7%) |
Educational Attainment by Field of Study in Woodridge
Bio, nature & agricultural (73 | 31.3%), literature & languages (43 | 18.4%), liberal arts & history (36 | 15.4%), psychology (18 | 7.7%), and social sciences (16 | 6.9%) are the most common fields of study among 233 individuals in Woodridge who have obtained a bachelor's degree or higher.
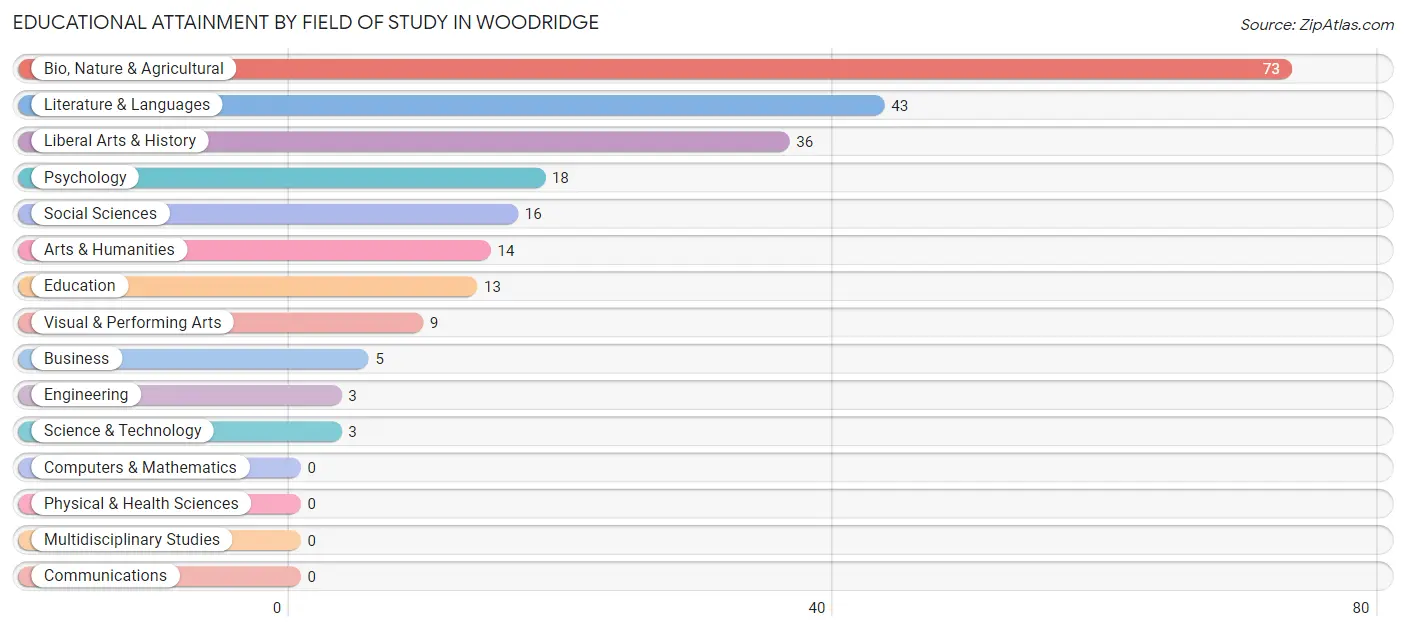
| Field of Study | # Graduates | % Graduates |
| Computers & Mathematics | 0 | 0.0% |
| Bio, Nature & Agricultural | 73 | 31.3% |
| Physical & Health Sciences | 0 | 0.0% |
| Psychology | 18 | 7.7% |
| Social Sciences | 16 | 6.9% |
| Engineering | 3 | 1.3% |
| Multidisciplinary Studies | 0 | 0.0% |
| Science & Technology | 3 | 1.3% |
| Business | 5 | 2.1% |
| Education | 13 | 5.6% |
| Literature & Languages | 43 | 18.4% |
| Liberal Arts & History | 36 | 15.4% |
| Visual & Performing Arts | 9 | 3.9% |
| Communications | 0 | 0.0% |
| Arts & Humanities | 14 | 6.0% |
| Total | 233 | 100.0% |
Transportation & Commute in Woodridge
Vehicle Availability by Sex in Woodridge
The most prevalent vehicle ownership categories in Woodridge are males with 2 vehicles (60, accounting for 47.2%) and females with 2 vehicles (31, making up 37.3%).
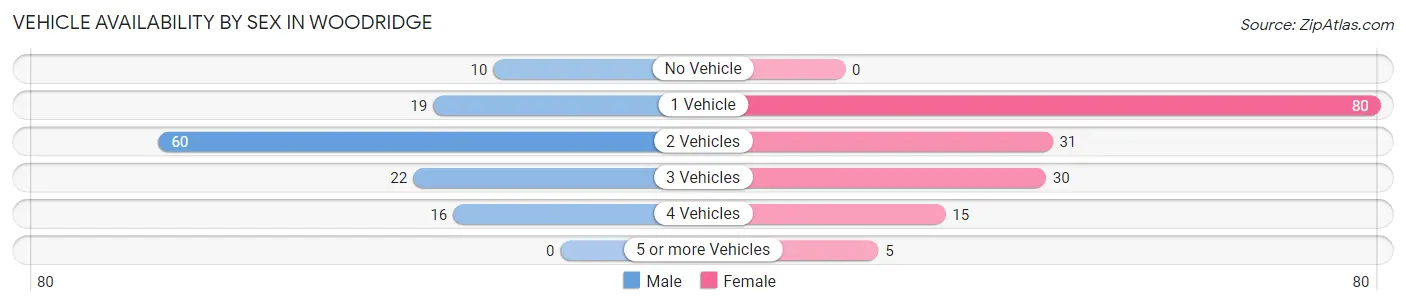
| Vehicles Available | Male | Female |
| No Vehicle | 10 (7.9%) | 0 (0.0%) |
| 1 Vehicle | 19 (15.0%) | 80 (49.7%) |
| 2 Vehicles | 60 (47.2%) | 31 (19.3%) |
| 3 Vehicles | 22 (17.3%) | 30 (18.6%) |
| 4 Vehicles | 16 (12.6%) | 15 (9.3%) |
| 5 or more Vehicles | 0 (0.0%) | 5 (3.1%) |
| Total | 127 (100.0%) | 161 (100.0%) |
Commute Time in Woodridge
The most frequently occuring commute durations in Woodridge are 15 to 19 minutes (70 commuters, 25.3%), 20 to 24 minutes (43 commuters, 15.5%), and 30 to 34 minutes (43 commuters, 15.5%).
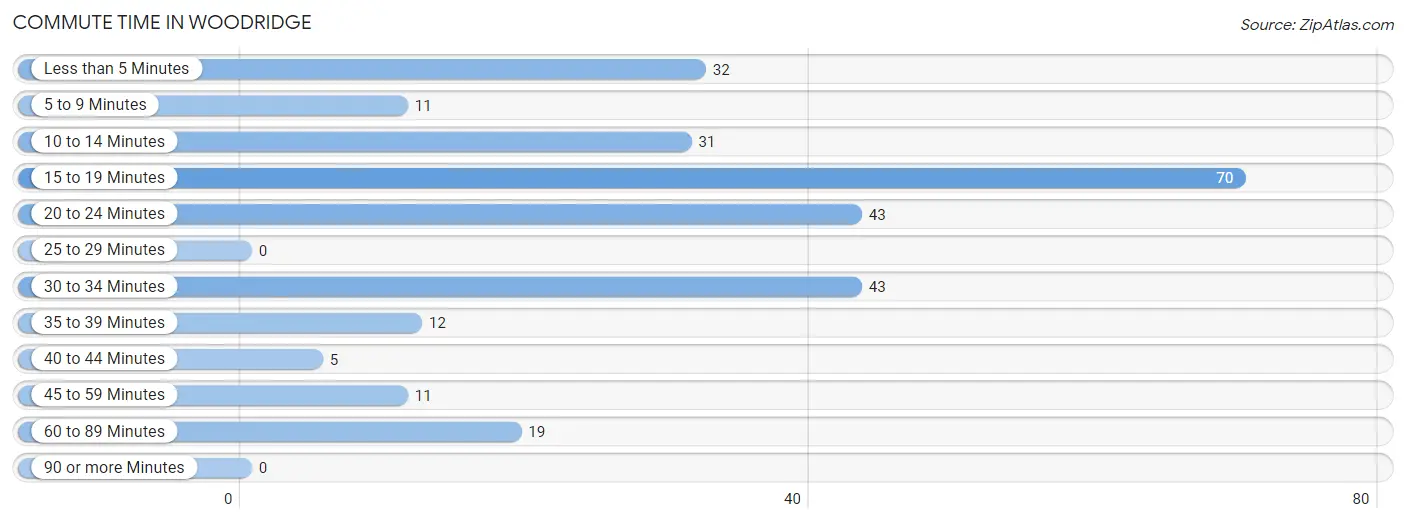
| Commute Time | # Commuters | % Commuters |
| Less than 5 Minutes | 32 | 11.6% |
| 5 to 9 Minutes | 11 | 4.0% |
| 10 to 14 Minutes | 31 | 11.2% |
| 15 to 19 Minutes | 70 | 25.3% |
| 20 to 24 Minutes | 43 | 15.5% |
| 25 to 29 Minutes | 0 | 0.0% |
| 30 to 34 Minutes | 43 | 15.5% |
| 35 to 39 Minutes | 12 | 4.3% |
| 40 to 44 Minutes | 5 | 1.8% |
| 45 to 59 Minutes | 11 | 4.0% |
| 60 to 89 Minutes | 19 | 6.9% |
| 90 or more Minutes | 0 | 0.0% |
Commute Time by Sex in Woodridge
The most common commute times in Woodridge are 30 to 34 minutes (37 commuters, 27.4%) for males and 15 to 19 minutes (38 commuters, 26.8%) for females.
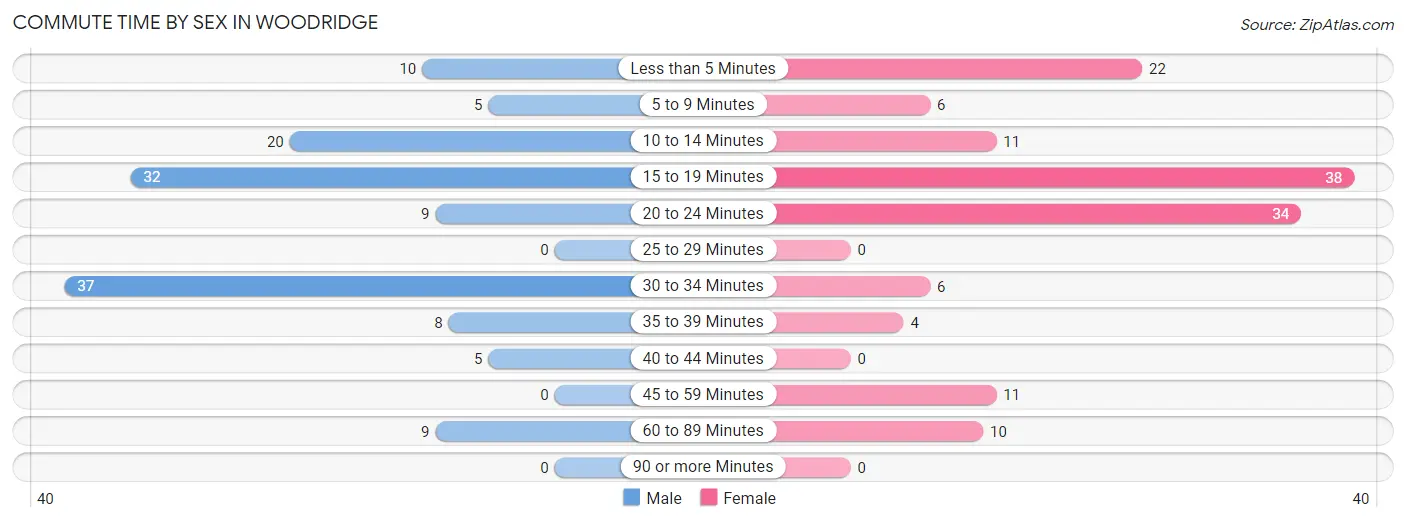
| Commute Time | Male | Female |
| Less than 5 Minutes | 10 (7.4%) | 22 (15.5%) |
| 5 to 9 Minutes | 5 (3.7%) | 6 (4.2%) |
| 10 to 14 Minutes | 20 (14.8%) | 11 (7.7%) |
| 15 to 19 Minutes | 32 (23.7%) | 38 (26.8%) |
| 20 to 24 Minutes | 9 (6.7%) | 34 (23.9%) |
| 25 to 29 Minutes | 0 (0.0%) | 0 (0.0%) |
| 30 to 34 Minutes | 37 (27.4%) | 6 (4.2%) |
| 35 to 39 Minutes | 8 (5.9%) | 4 (2.8%) |
| 40 to 44 Minutes | 5 (3.7%) | 0 (0.0%) |
| 45 to 59 Minutes | 0 (0.0%) | 11 (7.7%) |
| 60 to 89 Minutes | 9 (6.7%) | 10 (7.0%) |
| 90 or more Minutes | 0 (0.0%) | 0 (0.0%) |
Time of Departure to Work by Sex in Woodridge
The most frequent times of departure to work in Woodridge are 10:00 AM to 10:59 AM (34, 25.2%) for males and 12:00 PM to 3:59 PM (31, 21.8%) for females.
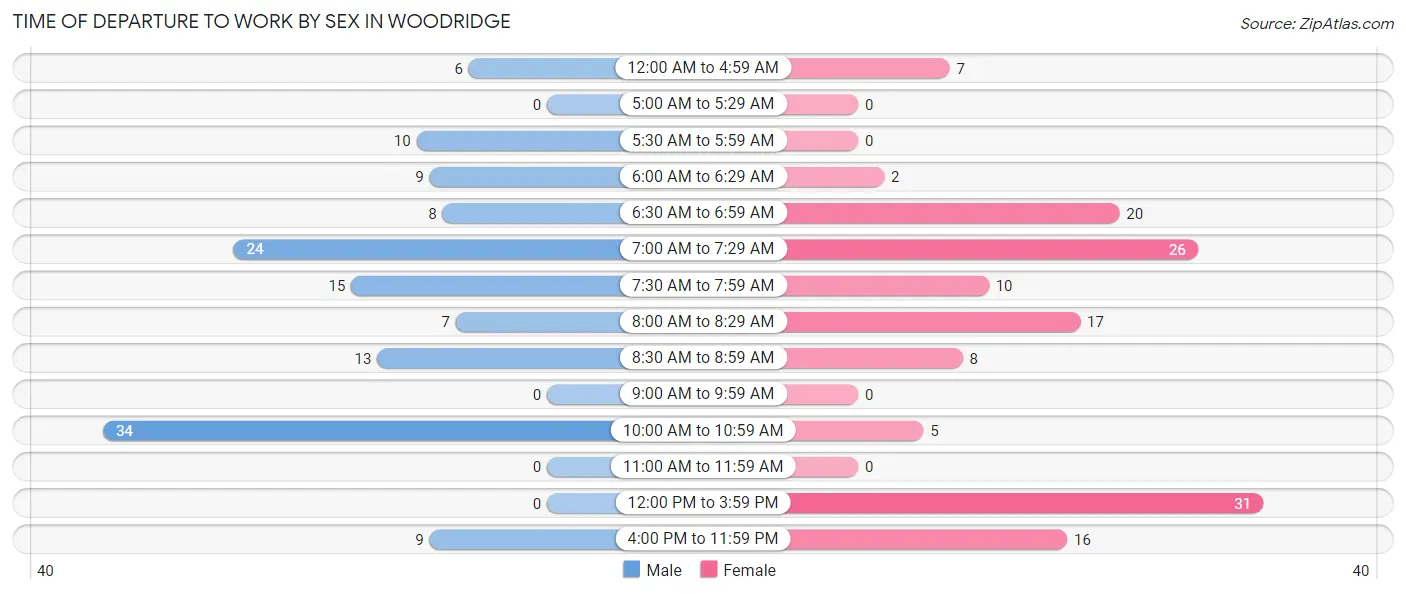
| Time of Departure | Male | Female |
| 12:00 AM to 4:59 AM | 6 (4.4%) | 7 (4.9%) |
| 5:00 AM to 5:29 AM | 0 (0.0%) | 0 (0.0%) |
| 5:30 AM to 5:59 AM | 10 (7.4%) | 0 (0.0%) |
| 6:00 AM to 6:29 AM | 9 (6.7%) | 2 (1.4%) |
| 6:30 AM to 6:59 AM | 8 (5.9%) | 20 (14.1%) |
| 7:00 AM to 7:29 AM | 24 (17.8%) | 26 (18.3%) |
| 7:30 AM to 7:59 AM | 15 (11.1%) | 10 (7.0%) |
| 8:00 AM to 8:29 AM | 7 (5.2%) | 17 (12.0%) |
| 8:30 AM to 8:59 AM | 13 (9.6%) | 8 (5.6%) |
| 9:00 AM to 9:59 AM | 0 (0.0%) | 0 (0.0%) |
| 10:00 AM to 10:59 AM | 34 (25.2%) | 5 (3.5%) |
| 11:00 AM to 11:59 AM | 0 (0.0%) | 0 (0.0%) |
| 12:00 PM to 3:59 PM | 0 (0.0%) | 31 (21.8%) |
| 4:00 PM to 11:59 PM | 9 (6.7%) | 16 (11.3%) |
| Total | 135 (100.0%) | 142 (100.0%) |
Housing Occupancy in Woodridge
Occupancy by Ownership in Woodridge
Of the total 290 dwellings in Woodridge, owner-occupied units account for 136 (46.9%), while renter-occupied units make up 154 (53.1%).
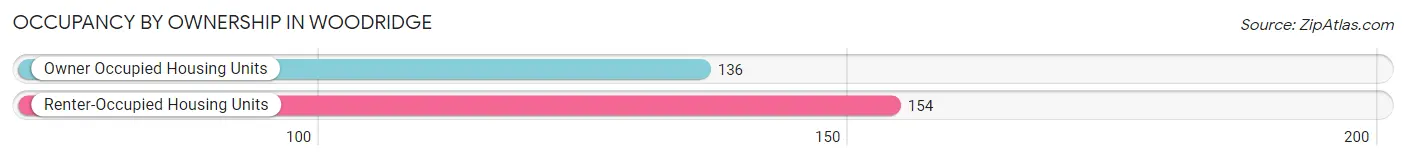
| Occupancy | # Housing Units | % Housing Units |
| Owner Occupied Housing Units | 136 | 46.9% |
| Renter-Occupied Housing Units | 154 | 53.1% |
| Total Occupied Housing Units | 290 | 100.0% |
Occupancy by Household Size in Woodridge
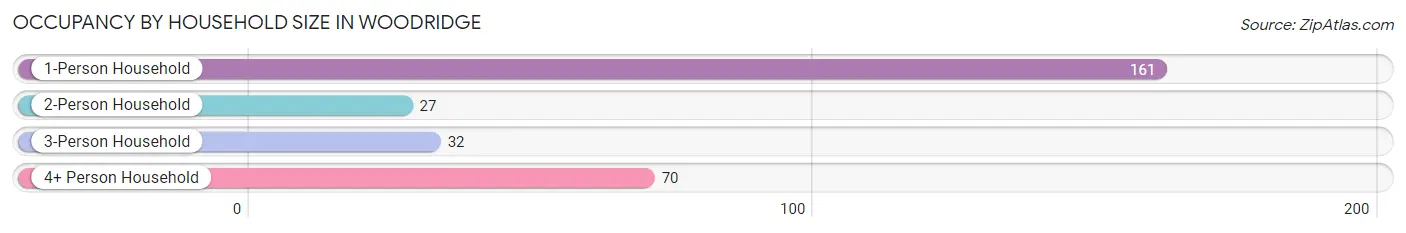
| Household Size | # Housing Units | % Housing Units |
| 1-Person Household | 161 | 55.5% |
| 2-Person Household | 27 | 9.3% |
| 3-Person Household | 32 | 11.0% |
| 4+ Person Household | 70 | 24.1% |
| Total Housing Units | 290 | 100.0% |
Occupancy by Ownership by Household Size in Woodridge
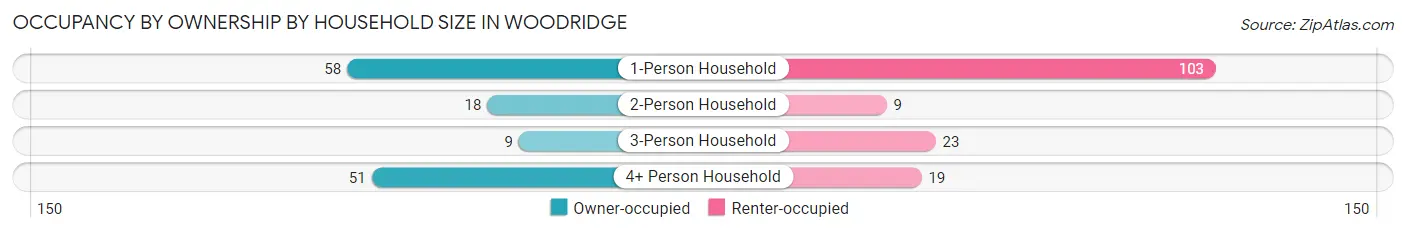
| Household Size | Owner-occupied | Renter-occupied |
| 1-Person Household | 58 (36.0%) | 103 (64.0%) |
| 2-Person Household | 18 (66.7%) | 9 (33.3%) |
| 3-Person Household | 9 (28.1%) | 23 (71.9%) |
| 4+ Person Household | 51 (72.9%) | 19 (27.1%) |
| Total Housing Units | 136 (46.9%) | 154 (53.1%) |
Occupancy by Educational Attainment in Woodridge
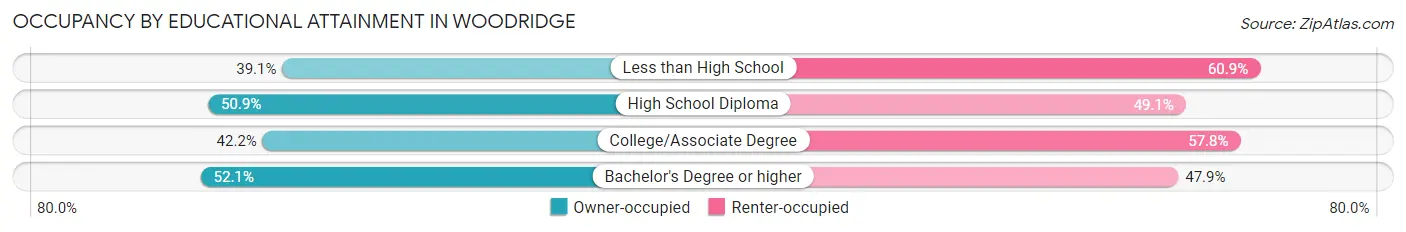
| Household Size | Owner-occupied | Renter-occupied |
| Less than High School | 9 (39.1%) | 14 (60.9%) |
| High School Diploma | 28 (50.9%) | 27 (49.1%) |
| College/Associate Degree | 49 (42.2%) | 67 (57.8%) |
| Bachelor's Degree or higher | 50 (52.1%) | 46 (47.9%) |
Occupancy by Age of Householder in Woodridge
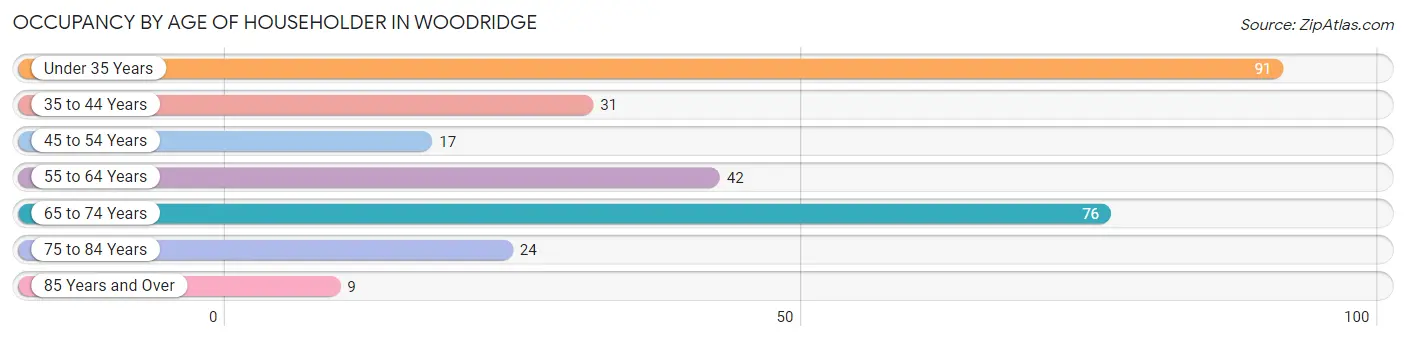
| Age Bracket | # Households | % Households |
| Under 35 Years | 91 | 31.4% |
| 35 to 44 Years | 31 | 10.7% |
| 45 to 54 Years | 17 | 5.9% |
| 55 to 64 Years | 42 | 14.5% |
| 65 to 74 Years | 76 | 26.2% |
| 75 to 84 Years | 24 | 8.3% |
| 85 Years and Over | 9 | 3.1% |
| Total | 290 | 100.0% |
Housing Finances in Woodridge
Median Income by Occupancy in Woodridge
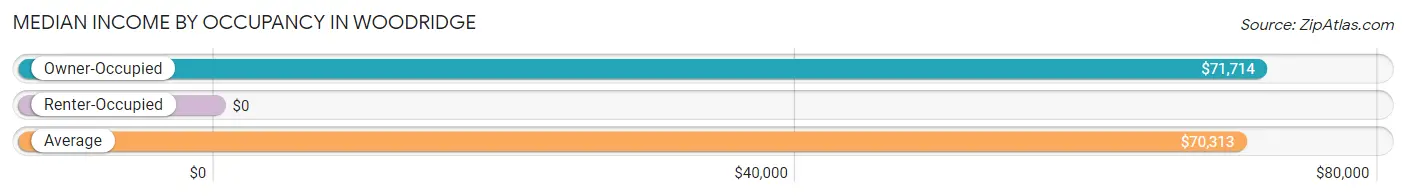
| Occupancy Type | # Households | Median Income |
| Owner-Occupied | 136 (46.9%) | $71,714 |
| Renter-Occupied | 154 (53.1%) | $0 |
| Average | 290 (100.0%) | $70,313 |
Occupancy by Householder Income Bracket in Woodridge
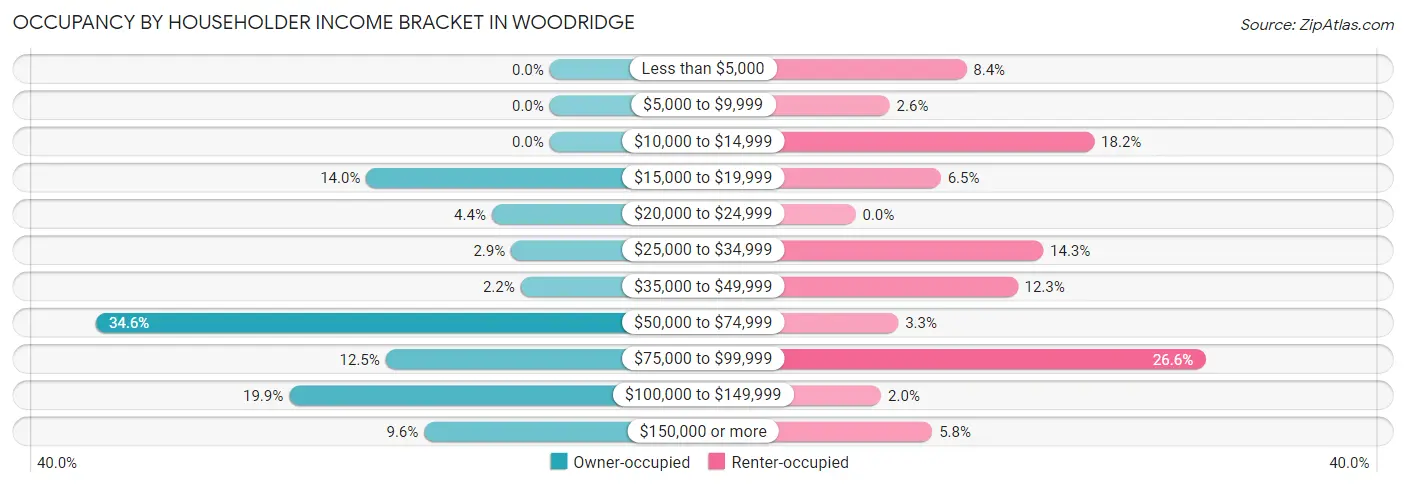
| Income Bracket | Owner-occupied | Renter-occupied |
| Less than $5,000 | 0 (0.0%) | 13 (8.4%) |
| $5,000 to $9,999 | 0 (0.0%) | 4 (2.6%) |
| $10,000 to $14,999 | 0 (0.0%) | 28 (18.2%) |
| $15,000 to $19,999 | 19 (14.0%) | 10 (6.5%) |
| $20,000 to $24,999 | 6 (4.4%) | 0 (0.0%) |
| $25,000 to $34,999 | 4 (2.9%) | 22 (14.3%) |
| $35,000 to $49,999 | 3 (2.2%) | 19 (12.3%) |
| $50,000 to $74,999 | 47 (34.6%) | 5 (3.3%) |
| $75,000 to $99,999 | 17 (12.5%) | 41 (26.6%) |
| $100,000 to $149,999 | 27 (19.9%) | 3 (1.9%) |
| $150,000 or more | 13 (9.6%) | 9 (5.8%) |
| Total | 136 (100.0%) | 154 (100.0%) |
Monthly Housing Cost Tiers in Woodridge
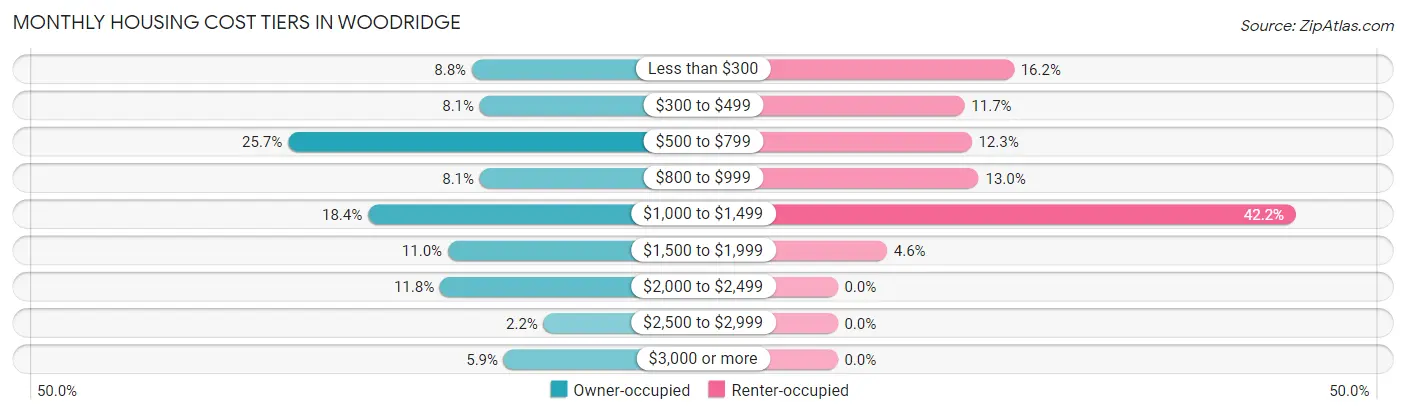
| Monthly Cost | Owner-occupied | Renter-occupied |
| Less than $300 | 12 (8.8%) | 25 (16.2%) |
| $300 to $499 | 11 (8.1%) | 18 (11.7%) |
| $500 to $799 | 35 (25.7%) | 19 (12.3%) |
| $800 to $999 | 11 (8.1%) | 20 (13.0%) |
| $1,000 to $1,499 | 25 (18.4%) | 65 (42.2%) |
| $1,500 to $1,999 | 15 (11.0%) | 7 (4.5%) |
| $2,000 to $2,499 | 16 (11.8%) | 0 (0.0%) |
| $2,500 to $2,999 | 3 (2.2%) | 0 (0.0%) |
| $3,000 or more | 8 (5.9%) | 0 (0.0%) |
| Total | 136 (100.0%) | 154 (100.0%) |
Physical Housing Characteristics in Woodridge
Housing Structures in Woodridge
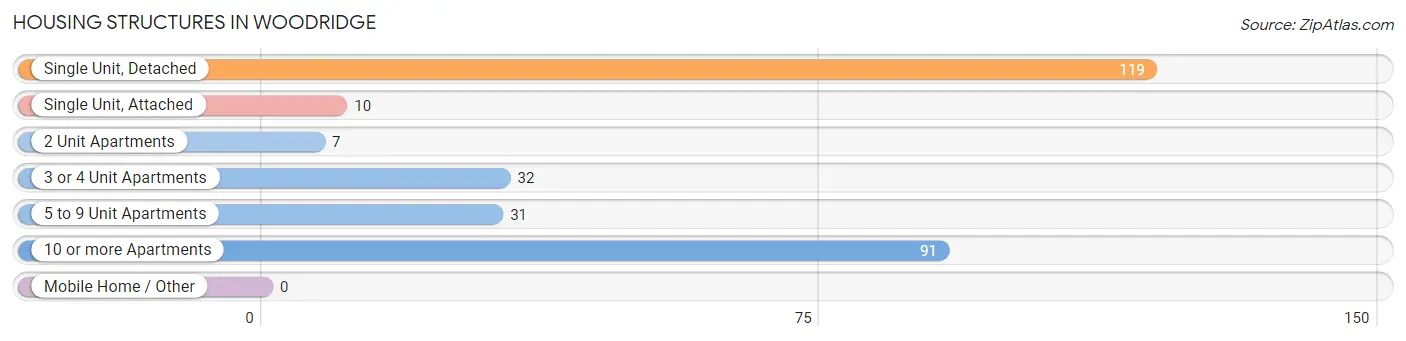
| Structure Type | # Housing Units | % Housing Units |
| Single Unit, Detached | 119 | 41.0% |
| Single Unit, Attached | 10 | 3.5% |
| 2 Unit Apartments | 7 | 2.4% |
| 3 or 4 Unit Apartments | 32 | 11.0% |
| 5 to 9 Unit Apartments | 31 | 10.7% |
| 10 or more Apartments | 91 | 31.4% |
| Mobile Home / Other | 0 | 0.0% |
| Total | 290 | 100.0% |
Housing Structures by Occupancy in Woodridge
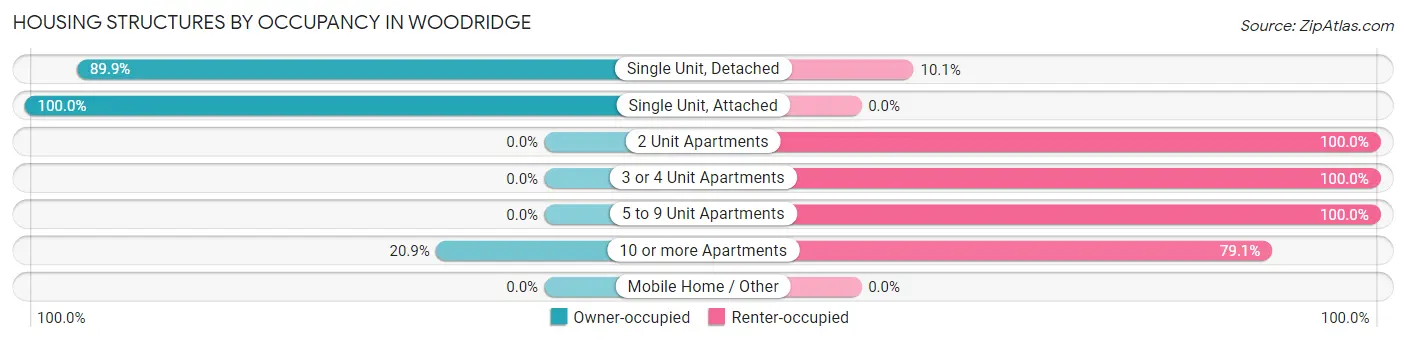
| Structure Type | Owner-occupied | Renter-occupied |
| Single Unit, Detached | 107 (89.9%) | 12 (10.1%) |
| Single Unit, Attached | 10 (100.0%) | 0 (0.0%) |
| 2 Unit Apartments | 0 (0.0%) | 7 (100.0%) |
| 3 or 4 Unit Apartments | 0 (0.0%) | 32 (100.0%) |
| 5 to 9 Unit Apartments | 0 (0.0%) | 31 (100.0%) |
| 10 or more Apartments | 19 (20.9%) | 72 (79.1%) |
| Mobile Home / Other | 0 (0.0%) | 0 (0.0%) |
| Total | 136 (46.9%) | 154 (53.1%) |
Housing Structures by Number of Rooms in Woodridge

| Number of Rooms | Owner-occupied | Renter-occupied |
| 1 Room | 0 (0.0%) | 4 (2.6%) |
| 2 or 3 Rooms | 0 (0.0%) | 96 (62.3%) |
| 4 or 5 Rooms | 29 (21.3%) | 26 (16.9%) |
| 6 or 7 Rooms | 59 (43.4%) | 21 (13.6%) |
| 8 or more Rooms | 48 (35.3%) | 7 (4.5%) |
| Total | 136 (100.0%) | 154 (100.0%) |
Housing Structure by Heating Type in Woodridge
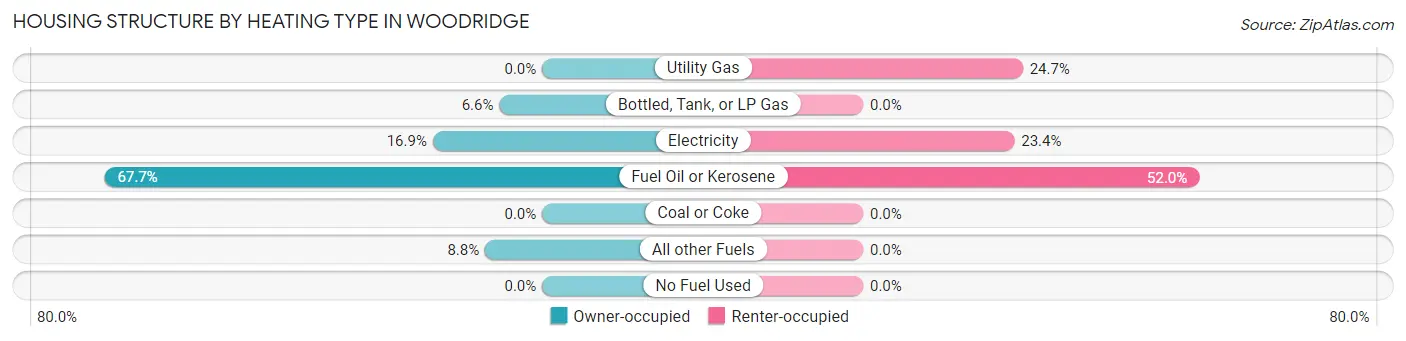
| Heating Type | Owner-occupied | Renter-occupied |
| Utility Gas | 0 (0.0%) | 38 (24.7%) |
| Bottled, Tank, or LP Gas | 9 (6.6%) | 0 (0.0%) |
| Electricity | 23 (16.9%) | 36 (23.4%) |
| Fuel Oil or Kerosene | 92 (67.6%) | 80 (51.9%) |
| Coal or Coke | 0 (0.0%) | 0 (0.0%) |
| All other Fuels | 12 (8.8%) | 0 (0.0%) |
| No Fuel Used | 0 (0.0%) | 0 (0.0%) |
| Total | 136 (100.0%) | 154 (100.0%) |
Household Vehicle Usage in Woodridge
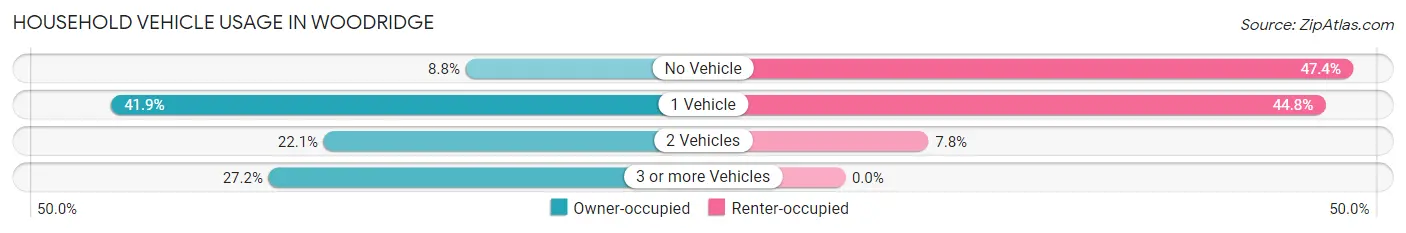
| Vehicles per Household | Owner-occupied | Renter-occupied |
| No Vehicle | 12 (8.8%) | 73 (47.4%) |
| 1 Vehicle | 57 (41.9%) | 69 (44.8%) |
| 2 Vehicles | 30 (22.1%) | 12 (7.8%) |
| 3 or more Vehicles | 37 (27.2%) | 0 (0.0%) |
| Total | 136 (100.0%) | 154 (100.0%) |
Real Estate & Mortgages in Woodridge
Real Estate and Mortgage Overview in Woodridge
| Characteristic | Without Mortgage | With Mortgage |
| Housing Units | 86 | 50 |
| Median Property Value | - | - |
| Median Household Income | $71,184 | $7 |
| Monthly Housing Costs | $580 | $4 |
| Real Estate Taxes | - | - |
Property Value by Mortgage Status in Woodridge
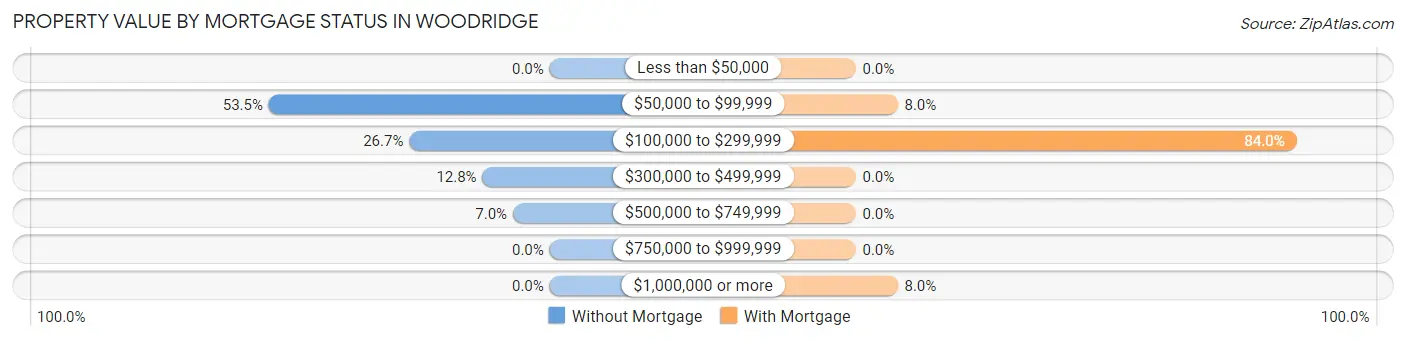
| Property Value | Without Mortgage | With Mortgage |
| Less than $50,000 | 0 (0.0%) | 0 (0.0%) |
| $50,000 to $99,999 | 46 (53.5%) | 4 (8.0%) |
| $100,000 to $299,999 | 23 (26.7%) | 42 (84.0%) |
| $300,000 to $499,999 | 11 (12.8%) | 0 (0.0%) |
| $500,000 to $749,999 | 6 (7.0%) | 0 (0.0%) |
| $750,000 to $999,999 | 0 (0.0%) | 0 (0.0%) |
| $1,000,000 or more | 0 (0.0%) | 4 (8.0%) |
| Total | 86 (100.0%) | 50 (100.0%) |
Household Income by Mortgage Status in Woodridge
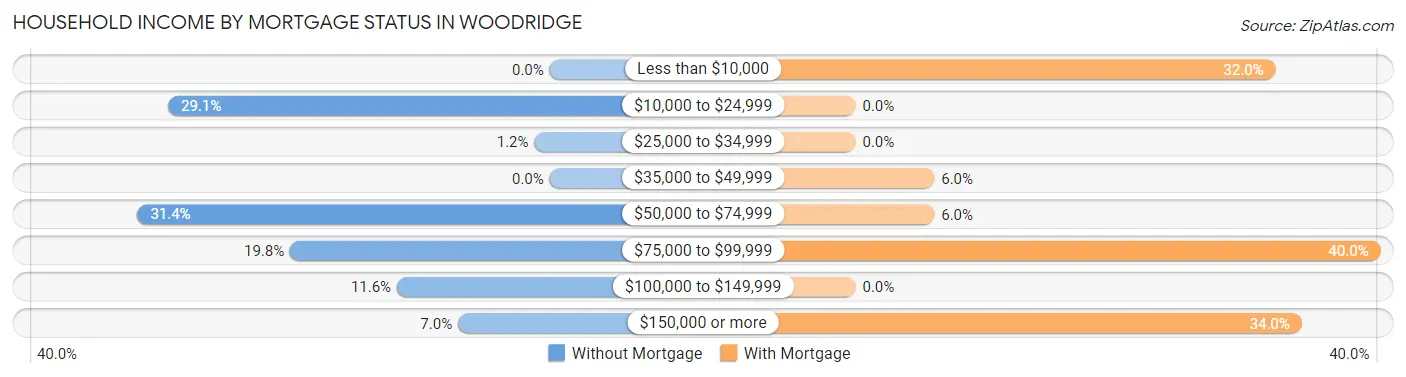
| Household Income | Without Mortgage | With Mortgage |
| Less than $10,000 | 0 (0.0%) | 16 (32.0%) |
| $10,000 to $24,999 | 25 (29.1%) | 0 (0.0%) |
| $25,000 to $34,999 | 1 (1.2%) | 0 (0.0%) |
| $35,000 to $49,999 | 0 (0.0%) | 3 (6.0%) |
| $50,000 to $74,999 | 27 (31.4%) | 3 (6.0%) |
| $75,000 to $99,999 | 17 (19.8%) | 20 (40.0%) |
| $100,000 to $149,999 | 10 (11.6%) | 0 (0.0%) |
| $150,000 or more | 6 (7.0%) | 17 (34.0%) |
| Total | 86 (100.0%) | 50 (100.0%) |
Property Value to Household Income Ratio in Woodridge
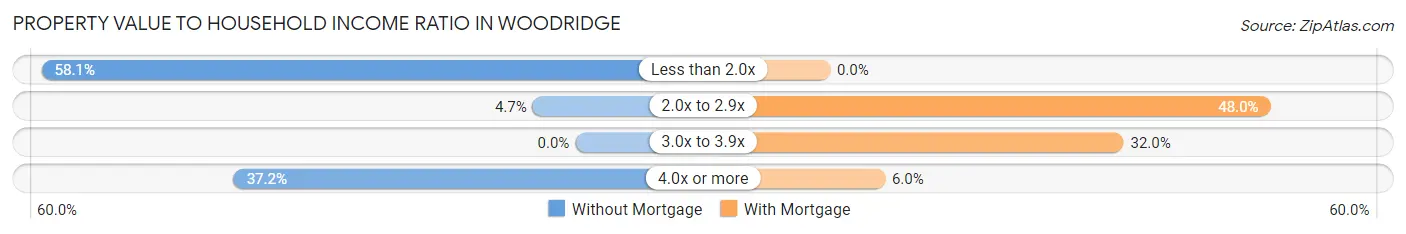
| Value-to-Income Ratio | Without Mortgage | With Mortgage |
| Less than 2.0x | 50 (58.1%) | 0 (0.0%) |
| 2.0x to 2.9x | 4 (4.6%) | 24 (48.0%) |
| 3.0x to 3.9x | 0 (0.0%) | 16 (32.0%) |
| 4.0x or more | 32 (37.2%) | 3 (6.0%) |
| Total | 86 (100.0%) | 50 (100.0%) |
Real Estate Taxes by Mortgage Status in Woodridge
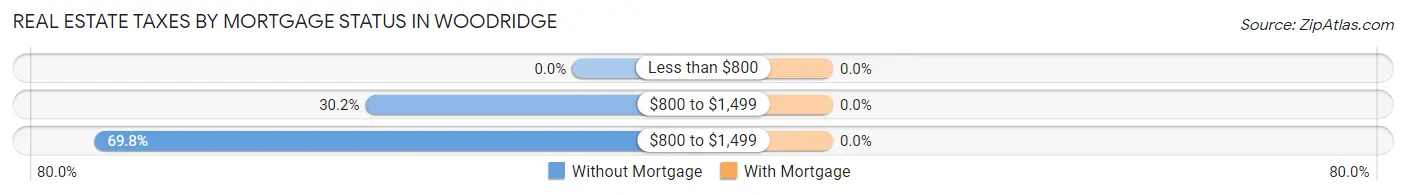
| Property Taxes | Without Mortgage | With Mortgage |
| Less than $800 | 0 (0.0%) | 0 (0.0%) |
| $800 to $1,499 | 26 (30.2%) | 0 (0.0%) |
| $800 to $1,499 | 60 (69.8%) | 0 (0.0%) |
| Total | 86 (100.0%) | 50 (100.0%) |
Health & Disability in Woodridge
Health Insurance Coverage by Age in Woodridge
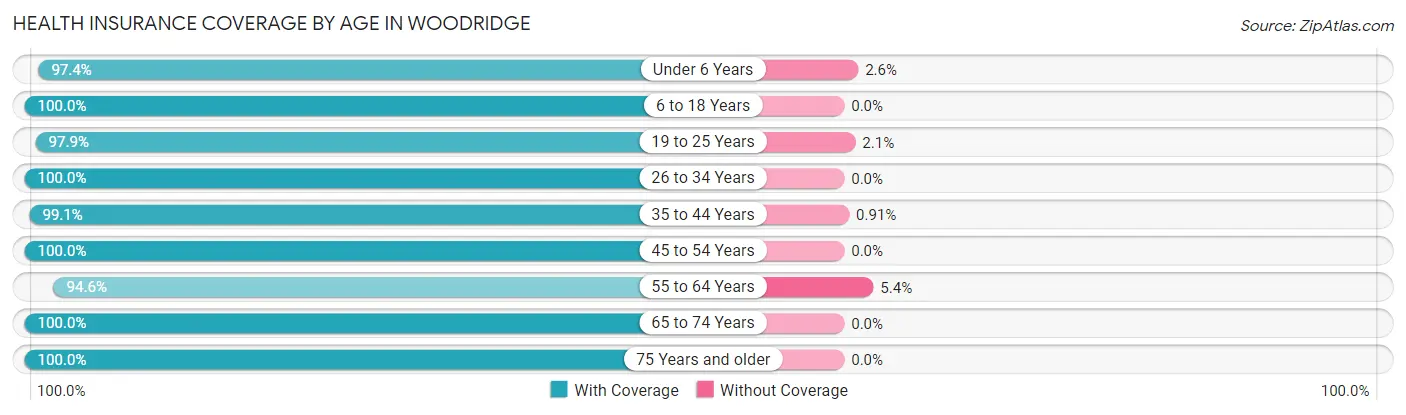
| Age Bracket | With Coverage | Without Coverage |
| Under 6 Years | 113 (97.4%) | 3 (2.6%) |
| 6 to 18 Years | 132 (100.0%) | 0 (0.0%) |
| 19 to 25 Years | 142 (97.9%) | 3 (2.1%) |
| 26 to 34 Years | 151 (100.0%) | 0 (0.0%) |
| 35 to 44 Years | 109 (99.1%) | 1 (0.9%) |
| 45 to 54 Years | 49 (100.0%) | 0 (0.0%) |
| 55 to 64 Years | 87 (94.6%) | 5 (5.4%) |
| 65 to 74 Years | 81 (100.0%) | 0 (0.0%) |
| 75 Years and older | 55 (100.0%) | 0 (0.0%) |
| Total | 919 (98.7%) | 12 (1.3%) |
Health Insurance Coverage by Citizenship Status in Woodridge
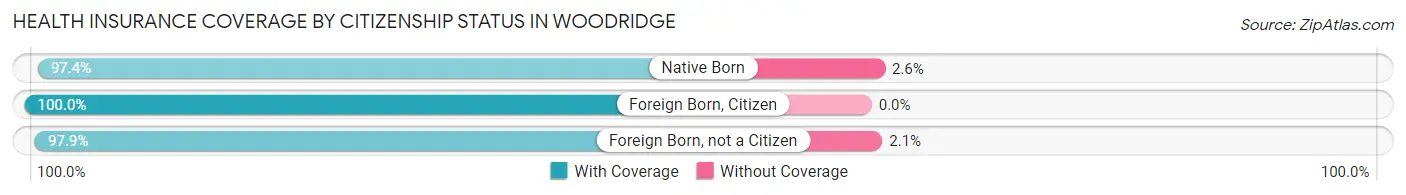
| Citizenship Status | With Coverage | Without Coverage |
| Native Born | 113 (97.4%) | 3 (2.6%) |
| Foreign Born, Citizen | 132 (100.0%) | 0 (0.0%) |
| Foreign Born, not a Citizen | 142 (97.9%) | 3 (2.1%) |
Health Insurance Coverage by Household Income in Woodridge
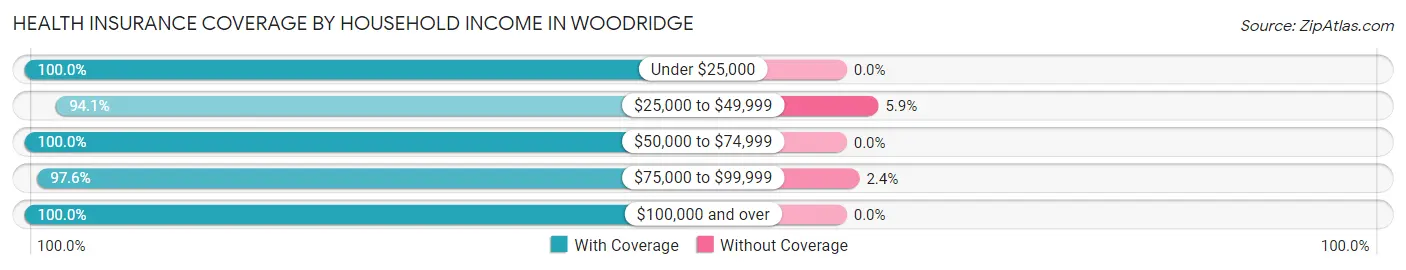
| Household Income | With Coverage | Without Coverage |
| Under $25,000 | 94 (100.0%) | 0 (0.0%) |
| $25,000 to $49,999 | 127 (94.1%) | 8 (5.9%) |
| $50,000 to $74,999 | 216 (100.0%) | 0 (0.0%) |
| $75,000 to $99,999 | 123 (97.6%) | 3 (2.4%) |
| $100,000 and over | 334 (100.0%) | 0 (0.0%) |
Public vs Private Health Insurance Coverage by Age in Woodridge
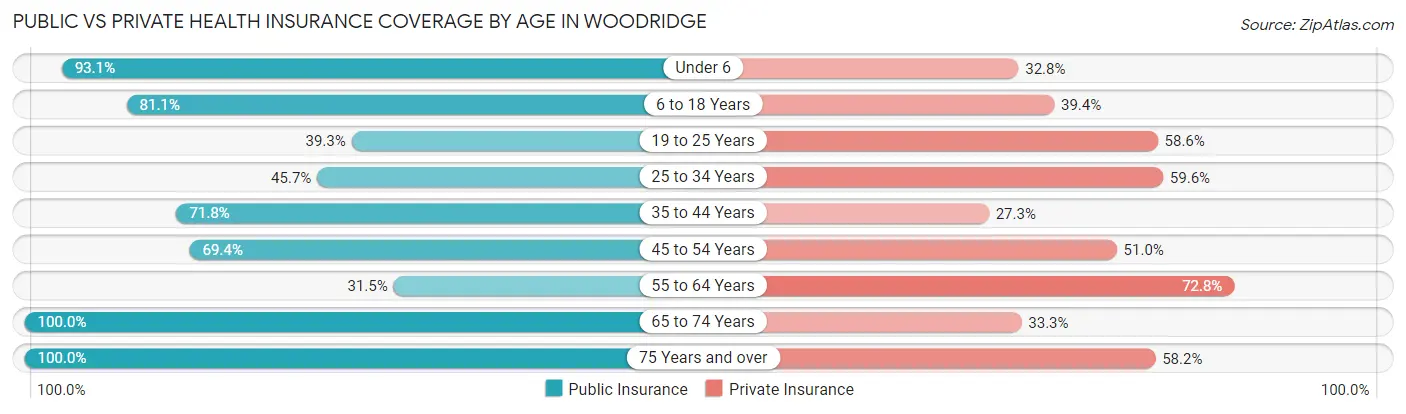
| Age Bracket | Public Insurance | Private Insurance |
| Under 6 | 108 (93.1%) | 38 (32.8%) |
| 6 to 18 Years | 107 (81.1%) | 52 (39.4%) |
| 19 to 25 Years | 57 (39.3%) | 85 (58.6%) |
| 25 to 34 Years | 69 (45.7%) | 90 (59.6%) |
| 35 to 44 Years | 79 (71.8%) | 30 (27.3%) |
| 45 to 54 Years | 34 (69.4%) | 25 (51.0%) |
| 55 to 64 Years | 29 (31.5%) | 67 (72.8%) |
| 65 to 74 Years | 81 (100.0%) | 27 (33.3%) |
| 75 Years and over | 55 (100.0%) | 32 (58.2%) |
| Total | 619 (66.5%) | 446 (47.9%) |
Disability Status by Sex by Age in Woodridge
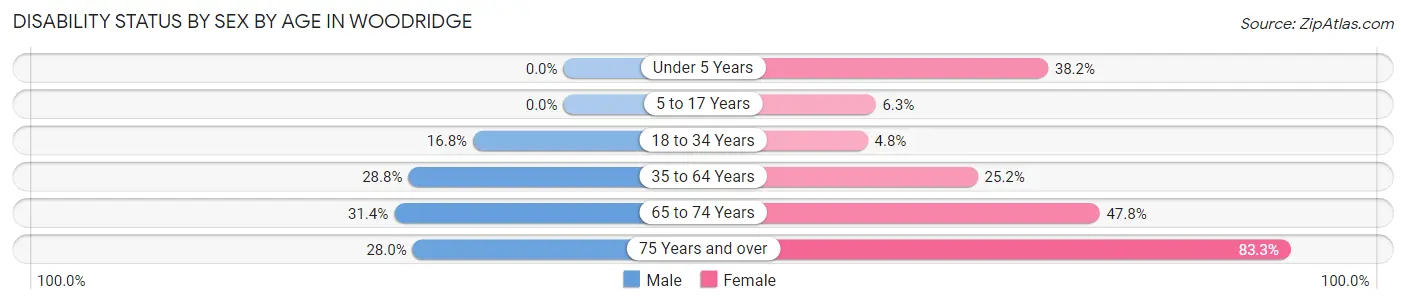
| Age Bracket | Male | Female |
| Under 5 Years | 0 (0.0%) | 13 (38.2%) |
| 5 to 17 Years | 0 (0.0%) | 6 (6.2%) |
| 18 to 34 Years | 22 (16.8%) | 9 (4.8%) |
| 35 to 64 Years | 38 (28.8%) | 30 (25.2%) |
| 65 to 74 Years | 11 (31.4%) | 22 (47.8%) |
| 75 Years and over | 7 (28.0%) | 25 (83.3%) |
Disability Class by Sex by Age in Woodridge
Disability Class: Hearing Difficulty
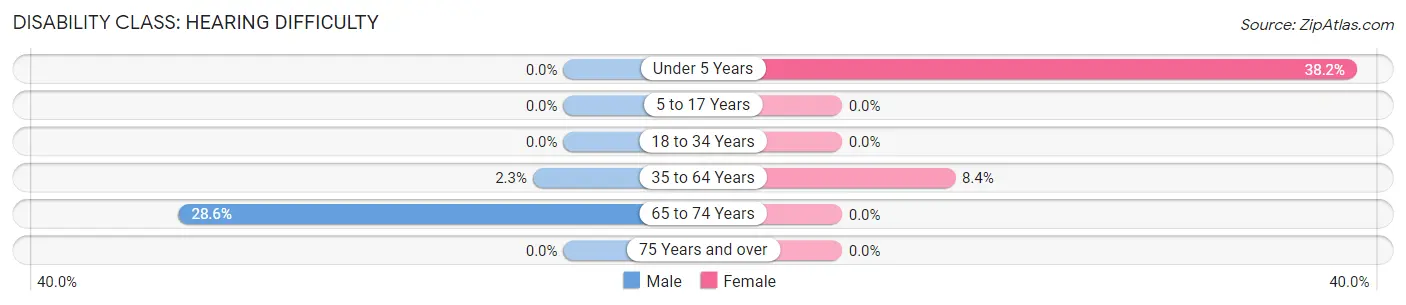
| Age Bracket | Male | Female |
| Under 5 Years | 0 (0.0%) | 13 (38.2%) |
| 5 to 17 Years | 0 (0.0%) | 0 (0.0%) |
| 18 to 34 Years | 0 (0.0%) | 0 (0.0%) |
| 35 to 64 Years | 3 (2.3%) | 10 (8.4%) |
| 65 to 74 Years | 10 (28.6%) | 0 (0.0%) |
| 75 Years and over | 0 (0.0%) | 0 (0.0%) |
Disability Class: Vision Difficulty
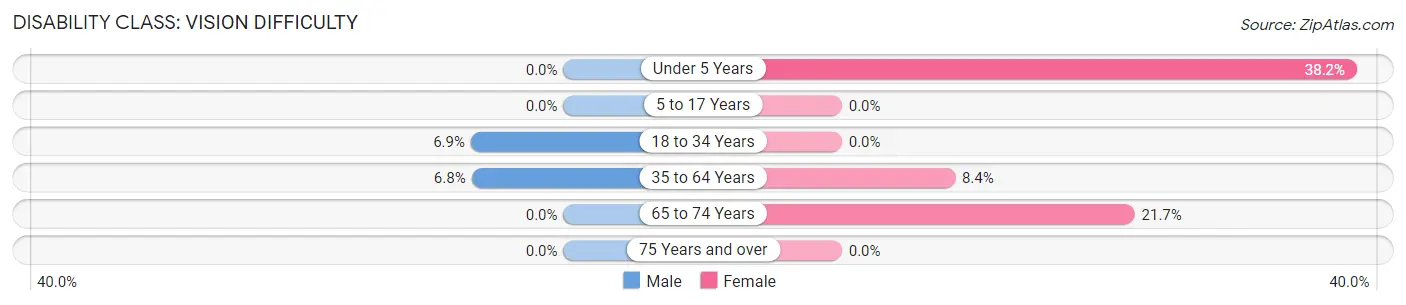
| Age Bracket | Male | Female |
| Under 5 Years | 0 (0.0%) | 13 (38.2%) |
| 5 to 17 Years | 0 (0.0%) | 0 (0.0%) |
| 18 to 34 Years | 9 (6.9%) | 0 (0.0%) |
| 35 to 64 Years | 9 (6.8%) | 10 (8.4%) |
| 65 to 74 Years | 0 (0.0%) | 10 (21.7%) |
| 75 Years and over | 0 (0.0%) | 0 (0.0%) |
Disability Class: Cognitive Difficulty
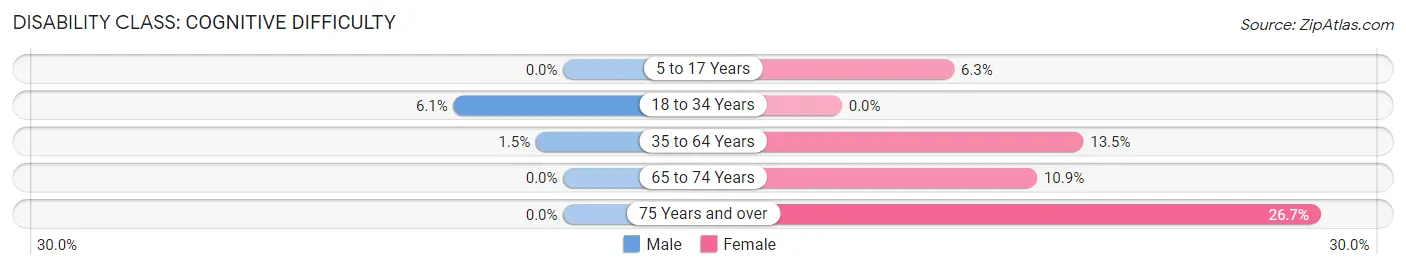
| Age Bracket | Male | Female |
| 5 to 17 Years | 0 (0.0%) | 6 (6.2%) |
| 18 to 34 Years | 8 (6.1%) | 0 (0.0%) |
| 35 to 64 Years | 2 (1.5%) | 16 (13.5%) |
| 65 to 74 Years | 0 (0.0%) | 5 (10.9%) |
| 75 Years and over | 0 (0.0%) | 8 (26.7%) |
Disability Class: Ambulatory Difficulty
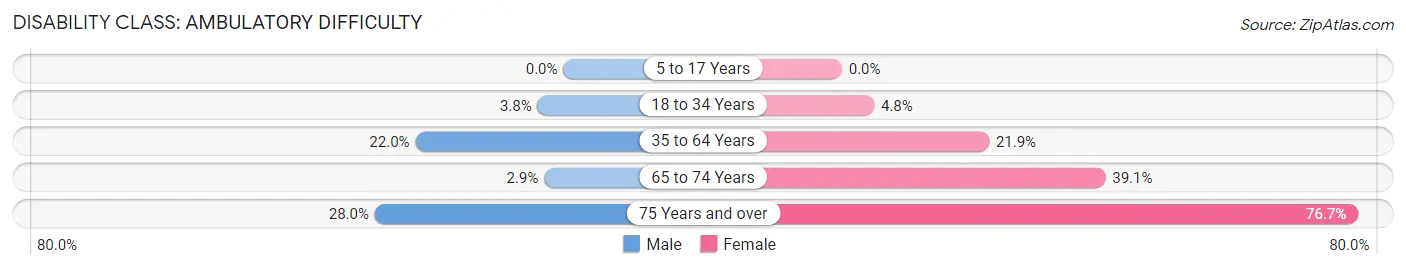
| Age Bracket | Male | Female |
| 5 to 17 Years | 0 (0.0%) | 0 (0.0%) |
| 18 to 34 Years | 5 (3.8%) | 9 (4.8%) |
| 35 to 64 Years | 29 (22.0%) | 26 (21.8%) |
| 65 to 74 Years | 1 (2.9%) | 18 (39.1%) |
| 75 Years and over | 7 (28.0%) | 23 (76.7%) |
Disability Class: Self-Care Difficulty
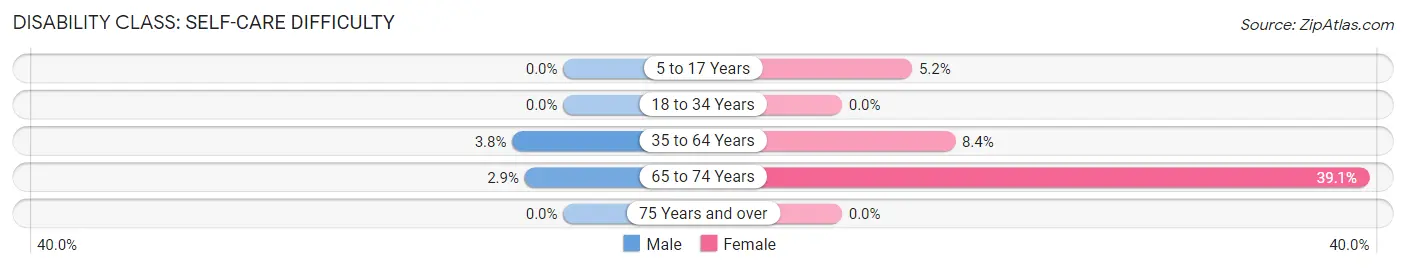
| Age Bracket | Male | Female |
| 5 to 17 Years | 0 (0.0%) | 5 (5.2%) |
| 18 to 34 Years | 0 (0.0%) | 0 (0.0%) |
| 35 to 64 Years | 5 (3.8%) | 10 (8.4%) |
| 65 to 74 Years | 1 (2.9%) | 18 (39.1%) |
| 75 Years and over | 0 (0.0%) | 0 (0.0%) |
Technology Access in Woodridge
Computing Device Access in Woodridge
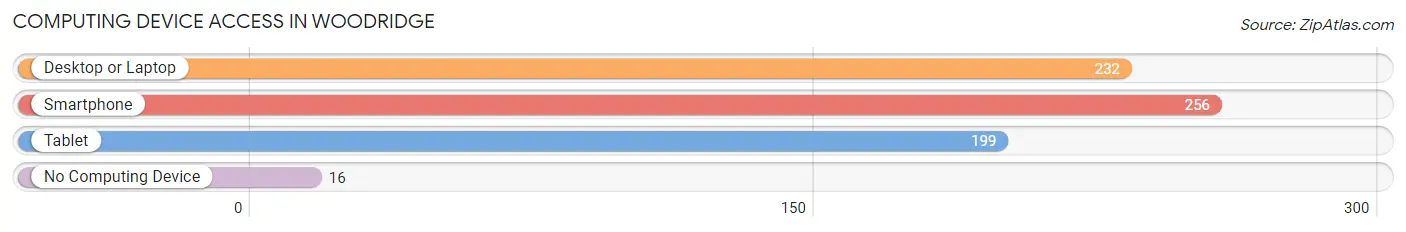
| Device Type | # Households | % Households |
| Desktop or Laptop | 232 | 80.0% |
| Smartphone | 256 | 88.3% |
| Tablet | 199 | 68.6% |
| No Computing Device | 16 | 5.5% |
| Total | 290 | 100.0% |
Internet Access in Woodridge
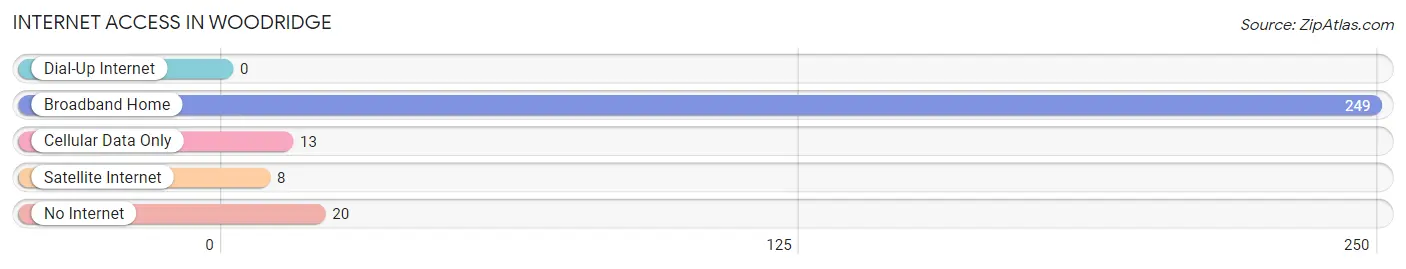
| Internet Type | # Households | % Households |
| Dial-Up Internet | 0 | 0.0% |
| Broadband Home | 249 | 85.9% |
| Cellular Data Only | 13 | 4.5% |
| Satellite Internet | 8 | 2.8% |
| No Internet | 20 | 6.9% |
| Total | 290 | 100.0% |
Woodridge Summary
Woodridge, NY is a small hamlet located in the town of Fallsburg in Sullivan County, New York. It is situated in the Catskill Mountains, approximately 90 miles northwest of New York City. The hamlet was founded in 1845 and has a population of approximately 1,000 people.
History
Woodridge was founded in 1845 by a group of settlers from Connecticut. The settlers were attracted to the area due to its abundance of natural resources, including timber, water, and fertile soil. The settlers built a sawmill and a gristmill, which provided the foundation for the hamlet’s economy.
In the late 19th century, the hamlet experienced a period of growth and prosperity. The population increased from approximately 500 in 1880 to 1,000 in 1900. During this period, the hamlet was home to a variety of businesses, including a hotel, a general store, a blacksmith shop, and a post office.
In the early 20th century, the hamlet experienced a period of decline. The population decreased from 1,000 in 1900 to 500 in 1940. This decline was due to the decline of the timber industry and the lack of economic opportunities in the area.
Geography
Woodridge is located in the Catskill Mountains in Sullivan County, New York. The hamlet is situated at an elevation of 1,400 feet and is surrounded by forests and rolling hills. The hamlet is located approximately 90 miles northwest of New York City.
The hamlet is located near several bodies of water, including the Neversink River, the Mongaup River, and the Beaverkill River. The hamlet is also located near several state parks, including the Mongaup Valley State Park and the Neversink Unique Area.
Economy
The economy of Woodridge is largely based on tourism. The hamlet is home to several bed and breakfasts, as well as a variety of outdoor recreation activities, including fishing, hunting, and hiking. The hamlet is also home to several small businesses, including a general store, a post office, and a gas station.
Demographics
As of the 2010 census, the population of Woodridge was 1,000. The racial makeup of the hamlet was 97.2% White, 0.7% African American, 0.3% Native American, 0.3% Asian, and 1.5% from other races. The median household income was $41,250, and the median age was 44.
Woodridge is a small hamlet with a rich history and a vibrant economy. The hamlet is home to a variety of businesses and outdoor recreation activities, and is a popular destination for tourists. The hamlet is also home to a diverse population, with a variety of racial and ethnic backgrounds.
Common Questions
What is Per Capita Income in Woodridge?
Per Capita income in Woodridge is $25,698.
What is the Median Family Income in Woodridge?
Median Family Income in Woodridge is $87,813.
What is the Median Household income in Woodridge?
Median Household Income in Woodridge is $70,313.
What is Income or Wage Gap in Woodridge?
Income or Wage Gap in Woodridge is 47.8%.
Women in Woodridge earn 52.2 cents for every dollar earned by a man.
What is Inequality or Gini Index in Woodridge?
Inequality or Gini Index in Woodridge is 0.41.
What is the Total Population of Woodridge?
Total Population of Woodridge is 936.
What is the Total Male Population of Woodridge?
Total Male Population of Woodridge is 423.
What is the Total Female Population of Woodridge?
Total Female Population of Woodridge is 513.
What is the Ratio of Males per 100 Females in Woodridge?
There are 82.46 Males per 100 Females in Woodridge.
What is the Ratio of Females per 100 Males in Woodridge?
There are 121.28 Females per 100 Males in Woodridge.
What is the Median Population Age in Woodridge?
Median Population Age in Woodridge is 29.4 Years.
What is the Average Family Size in Woodridge
Average Family Size in Woodridge is 5.6 People.
What is the Average Household Size in Woodridge
Average Household Size in Woodridge is 3.1 People.
How Large is the Labor Force in Woodridge?
There are 363 People in the Labor Forcein in Woodridge.
What is the Percentage of People in the Labor Force in Woodridge?
50.1% of People are in the Labor Force in Woodridge.
What is the Unemployment Rate in Woodridge?
Unemployment Rate in Woodridge is 17.1%.