Fox River Grove, IL Map & Demographics
Fox River Grove Map
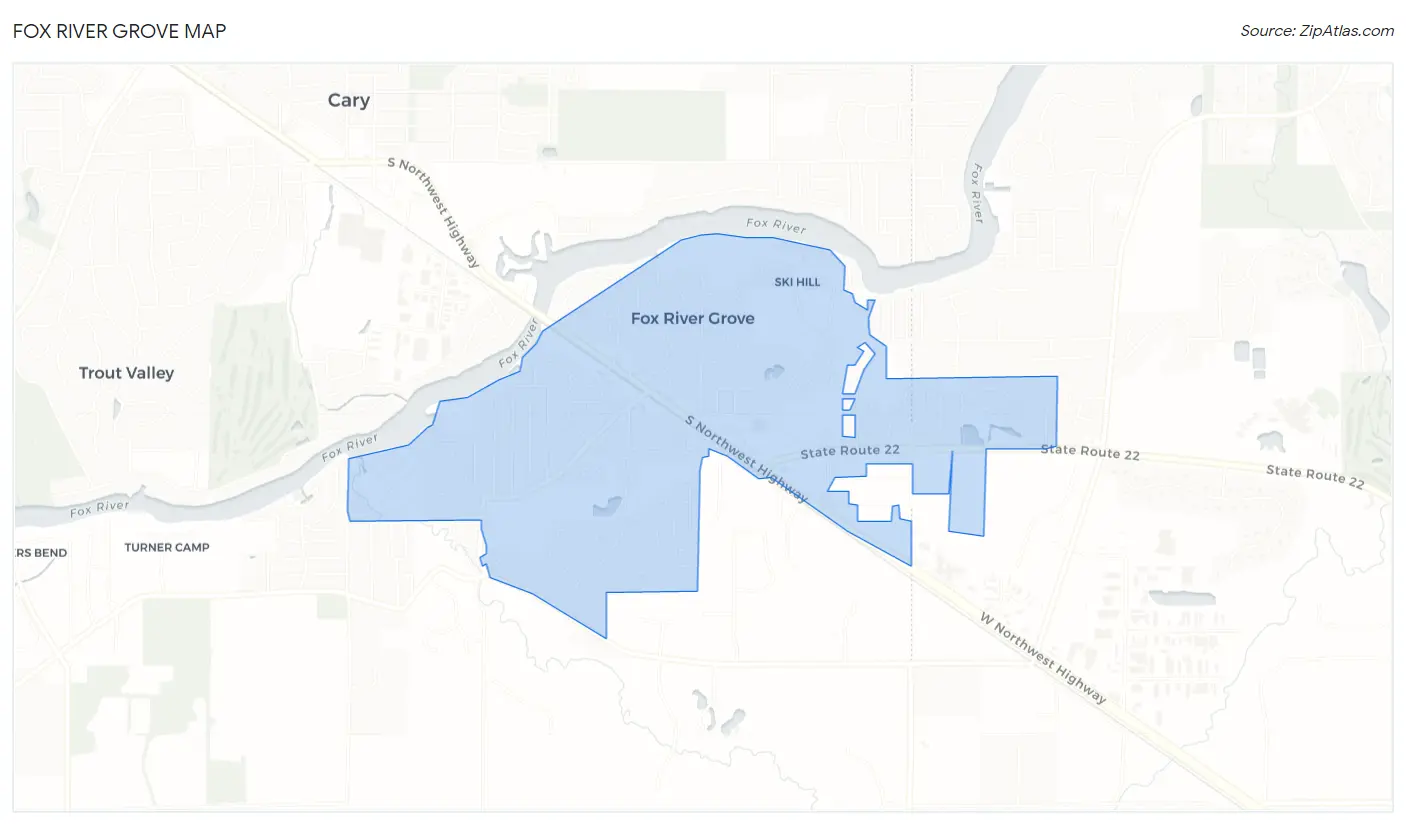
Fox River Grove Overview
$48,358
PER CAPITA INCOME
$126,104
AVG FAMILY INCOME
$121,705
AVG HOUSEHOLD INCOME
19.3%
WAGE / INCOME GAP [ % ]
80.7¢/ $1
WAGE / INCOME GAP [ $ ]
0.34
INEQUALITY / GINI INDEX
4,600
TOTAL POPULATION
2,168
MALE POPULATION
2,432
FEMALE POPULATION
89.14
MALES / 100 FEMALES
112.18
FEMALES / 100 MALES
41.1
MEDIAN AGE
3.0
AVG FAMILY SIZE
2.7
AVG HOUSEHOLD SIZE
2,702
LABOR FORCE [ PEOPLE ]
71.4%
PERCENT IN LABOR FORCE
3.6%
UNEMPLOYMENT RATE
Fox River Grove Zip Codes
Income in Fox River Grove
Income Overview in Fox River Grove
Per Capita Income in Fox River Grove is $48,358, while median incomes of families and households are $126,104 and $121,705 respectively.
| Characteristic | Number | Measure |
| Per Capita Income | 4,600 | $48,358 |
| Median Family Income | 1,338 | $126,104 |
| Mean Family Income | 1,338 | $146,603 |
| Median Household Income | 1,719 | $121,705 |
| Mean Household Income | 1,719 | $131,121 |
| Income Deficit | 1,338 | $0 |
| Wage / Income Gap (%) | 4,600 | 19.34% |
| Wage / Income Gap ($) | 4,600 | 80.66¢ per $1 |
| Gini / Inequality Index | 4,600 | 0.34 |
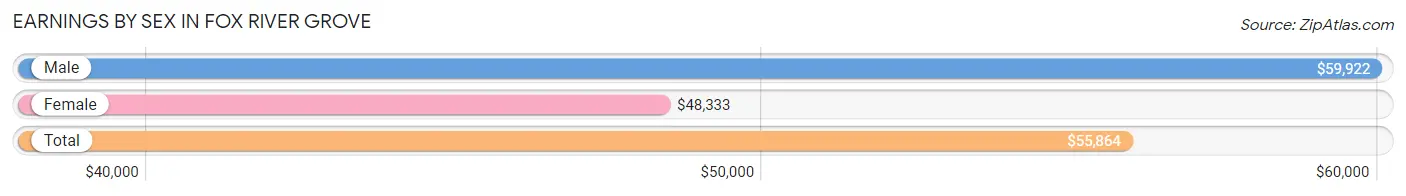
Earnings by Sex in Fox River Grove
Average Earnings in Fox River Grove are $55,864, $59,922 for men and $48,333 for women, a difference of 19.3%.
| Sex | Number | Average Earnings |
| Male | 1,324 (48.7%) | $59,922 |
| Female | 1,394 (51.3%) | $48,333 |
| Total | 2,718 (100.0%) | $55,864 |
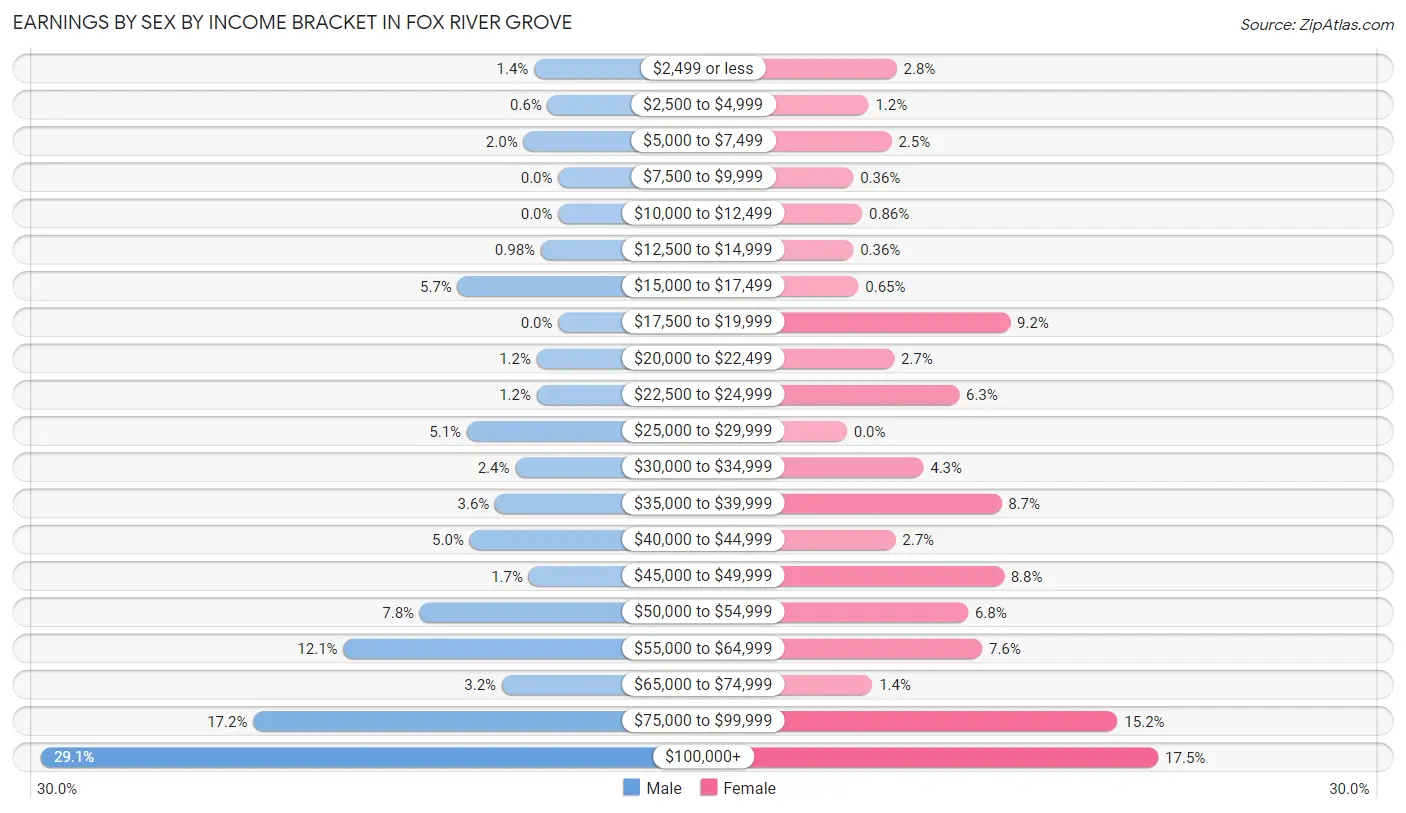
Earnings by Sex by Income Bracket in Fox River Grove
The most common earnings brackets in Fox River Grove are $100,000+ for men (385 | 29.1%) and $100,000+ for women (244 | 17.5%).
| Income | Male | Female |
| $2,499 or less | 18 (1.4%) | 39 (2.8%) |
| $2,500 to $4,999 | 8 (0.6%) | 17 (1.2%) |
| $5,000 to $7,499 | 26 (2.0%) | 35 (2.5%) |
| $7,500 to $9,999 | 0 (0.0%) | 5 (0.4%) |
| $10,000 to $12,499 | 0 (0.0%) | 12 (0.9%) |
| $12,500 to $14,999 | 13 (1.0%) | 5 (0.4%) |
| $15,000 to $17,499 | 75 (5.7%) | 9 (0.6%) |
| $17,500 to $19,999 | 0 (0.0%) | 128 (9.2%) |
| $20,000 to $22,499 | 16 (1.2%) | 37 (2.6%) |
| $22,500 to $24,999 | 16 (1.2%) | 88 (6.3%) |
| $25,000 to $29,999 | 68 (5.1%) | 0 (0.0%) |
| $30,000 to $34,999 | 32 (2.4%) | 60 (4.3%) |
| $35,000 to $39,999 | 47 (3.5%) | 121 (8.7%) |
| $40,000 to $44,999 | 66 (5.0%) | 38 (2.7%) |
| $45,000 to $49,999 | 22 (1.7%) | 123 (8.8%) |
| $50,000 to $54,999 | 103 (7.8%) | 95 (6.8%) |
| $55,000 to $64,999 | 160 (12.1%) | 106 (7.6%) |
| $65,000 to $74,999 | 42 (3.2%) | 20 (1.4%) |
| $75,000 to $99,999 | 227 (17.2%) | 212 (15.2%) |
| $100,000+ | 385 (29.1%) | 244 (17.5%) |
| Total | 1,324 (100.0%) | 1,394 (100.0%) |
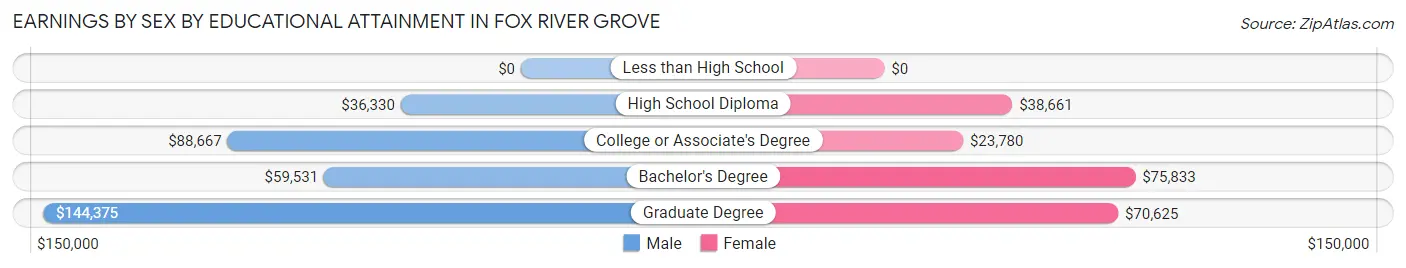
Earnings by Sex by Educational Attainment in Fox River Grove
Average earnings in Fox River Grove are $77,563 for men and $49,875 for women, a difference of 35.7%. Men with an educational attainment of graduate degree enjoy the highest average annual earnings of $144,375, while those with high school diploma education earn the least with $36,330. Women with an educational attainment of bachelor's degree earn the most with the average annual earnings of $75,833, while those with college or associate's degree education have the smallest earnings of $23,780.
| Educational Attainment | Male Income | Female Income |
| Less than High School | - | - |
| High School Diploma | $36,330 | $38,661 |
| College or Associate's Degree | $88,667 | $23,780 |
| Bachelor's Degree | $59,531 | $75,833 |
| Graduate Degree | $144,375 | $70,625 |
| Total | $77,563 | $49,875 |
Family Income in Fox River Grove
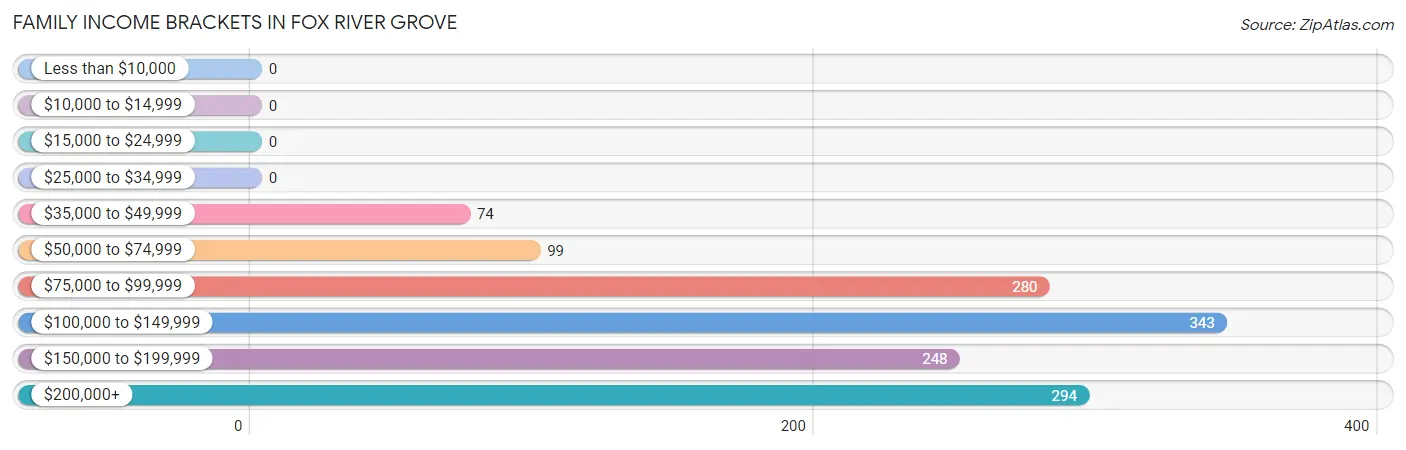
Family Income Brackets in Fox River Grove
According to the Fox River Grove family income data, there are 343 families falling into the $100,000 to $149,999 income range, which is the most common income bracket and makes up 25.6% of all families.
| Income Bracket | # Families | % Families |
| Less than $10,000 | 0 | 0.0% |
| $10,000 to $14,999 | 0 | 0.0% |
| $15,000 to $24,999 | 0 | 0.0% |
| $25,000 to $34,999 | 0 | 0.0% |
| $35,000 to $49,999 | 74 | 5.5% |
| $50,000 to $74,999 | 99 | 7.4% |
| $75,000 to $99,999 | 280 | 20.9% |
| $100,000 to $149,999 | 343 | 25.6% |
| $150,000 to $199,999 | 248 | 18.5% |
| $200,000+ | 294 | 22.0% |
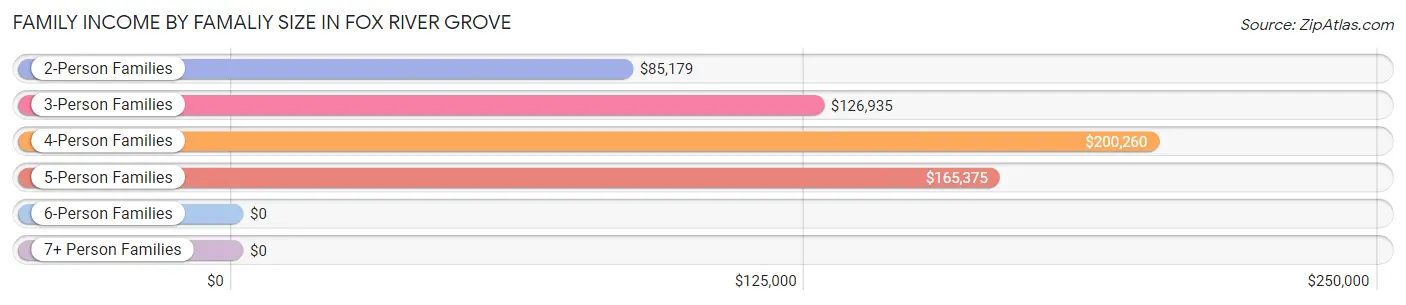
Family Income by Famaliy Size in Fox River Grove
4-person families (341 | 25.5%) account for the highest median family income in Fox River Grove with $200,260 per family, while 4-person families (341 | 25.5%) have the highest median income of $50,065 per family member.
| Income Bracket | # Families | Median Income |
| 2-Person Families | 460 (34.4%) | $85,179 |
| 3-Person Families | 454 (33.9%) | $126,935 |
| 4-Person Families | 341 (25.5%) | $200,260 |
| 5-Person Families | 75 (5.6%) | $165,375 |
| 6-Person Families | 8 (0.6%) | $0 |
| 7+ Person Families | 0 (0.0%) | $0 |
| Total | 1,338 (100.0%) | $126,104 |
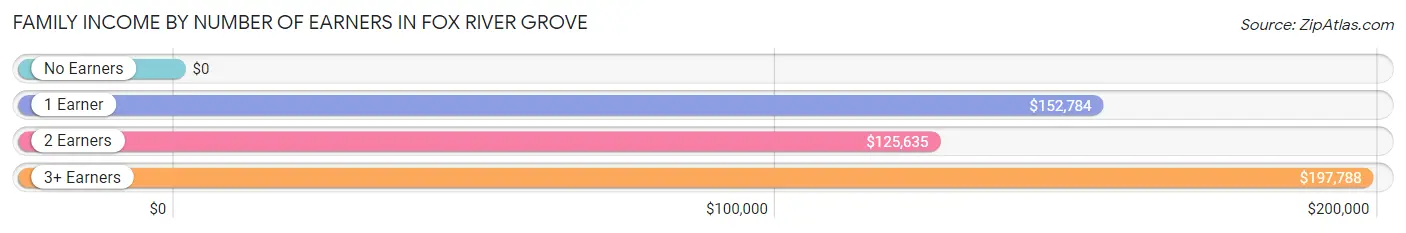
Family Income by Number of Earners in Fox River Grove
| Number of Earners | # Families | Median Income |
| No Earners | 25 (1.9%) | $0 |
| 1 Earner | 345 (25.8%) | $152,784 |
| 2 Earners | 879 (65.7%) | $125,635 |
| 3+ Earners | 89 (6.7%) | $197,788 |
| Total | 1,338 (100.0%) | $126,104 |
Household Income in Fox River Grove
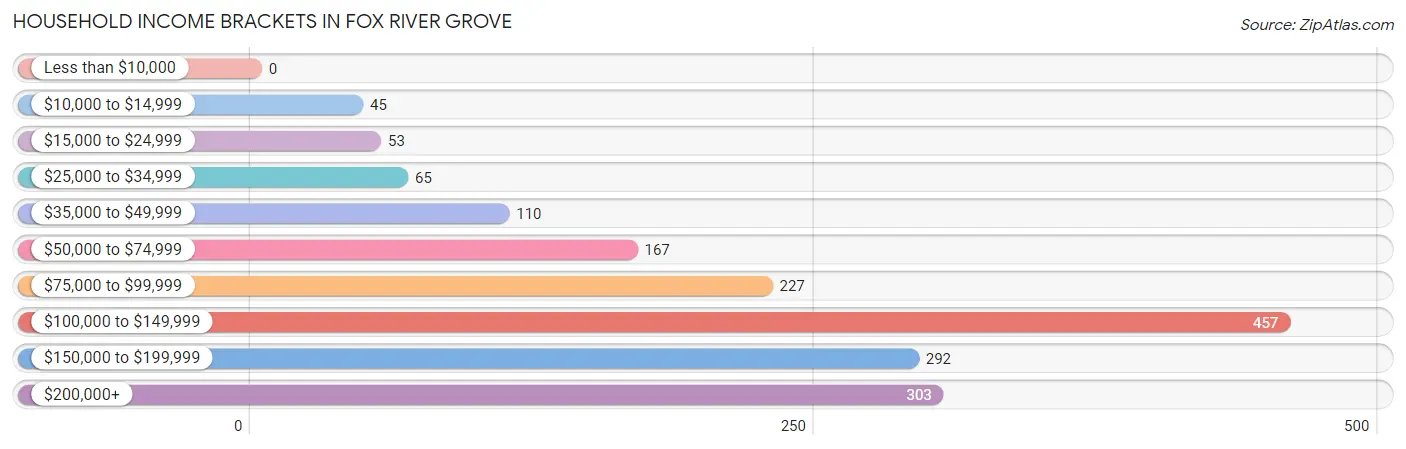
Household Income Brackets in Fox River Grove
With 457 households falling in the category, the $100,000 to $149,999 income range is the most frequent in Fox River Grove, accounting for 26.6% of all households.
| Income Bracket | # Households | % Households |
| Less than $10,000 | 0 | 0.0% |
| $10,000 to $14,999 | 45 | 2.6% |
| $15,000 to $24,999 | 53 | 3.1% |
| $25,000 to $34,999 | 65 | 3.8% |
| $35,000 to $49,999 | 110 | 6.4% |
| $50,000 to $74,999 | 167 | 9.7% |
| $75,000 to $99,999 | 227 | 13.2% |
| $100,000 to $149,999 | 457 | 26.6% |
| $150,000 to $199,999 | 292 | 17.0% |
| $200,000+ | 303 | 17.6% |
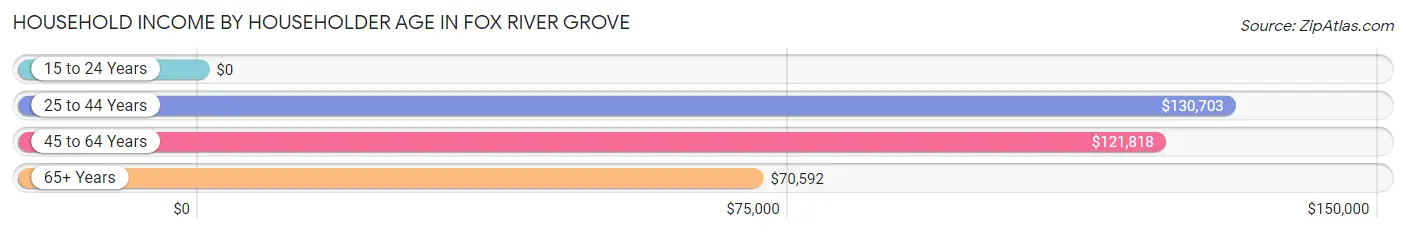
Household Income by Householder Age in Fox River Grove
The median household income in Fox River Grove is $121,705, with the highest median household income of $130,703 found in the 25 to 44 years age bracket for the primary householder. A total of 444 households (25.8%) fall into this category.
| Income Bracket | # Households | Median Income |
| 15 to 24 Years | 0 (0.0%) | $0 |
| 25 to 44 Years | 444 (25.8%) | $130,703 |
| 45 to 64 Years | 976 (56.8%) | $121,818 |
| 65+ Years | 299 (17.4%) | $70,592 |
| Total | 1,719 (100.0%) | $121,705 |
Poverty in Fox River Grove
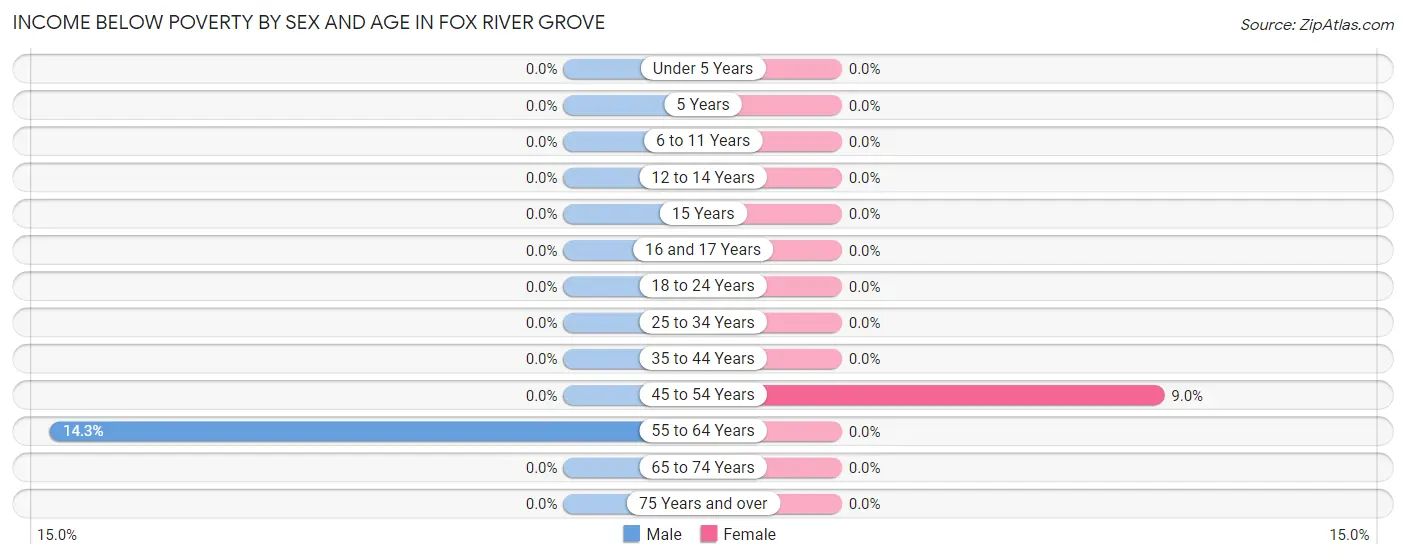
Income Below Poverty by Sex and Age in Fox River Grove
With 2.6% poverty level for males and 1.8% for females among the residents of Fox River Grove, 55 to 64 year old males and 45 to 54 year old females are the most vulnerable to poverty, with 57 males (14.3%) and 45 females (9.0%) in their respective age groups living below the poverty level.
| Age Bracket | Male | Female |
| Under 5 Years | 0 (0.0%) | 0 (0.0%) |
| 5 Years | 0 (0.0%) | 0 (0.0%) |
| 6 to 11 Years | 0 (0.0%) | 0 (0.0%) |
| 12 to 14 Years | 0 (0.0%) | 0 (0.0%) |
| 15 Years | 0 (0.0%) | 0 (0.0%) |
| 16 and 17 Years | 0 (0.0%) | 0 (0.0%) |
| 18 to 24 Years | 0 (0.0%) | 0 (0.0%) |
| 25 to 34 Years | 0 (0.0%) | 0 (0.0%) |
| 35 to 44 Years | 0 (0.0%) | 0 (0.0%) |
| 45 to 54 Years | 0 (0.0%) | 45 (9.0%) |
| 55 to 64 Years | 57 (14.3%) | 0 (0.0%) |
| 65 to 74 Years | 0 (0.0%) | 0 (0.0%) |
| 75 Years and over | 0 (0.0%) | 0 (0.0%) |
| Total | 57 (2.6%) | 45 (1.8%) |
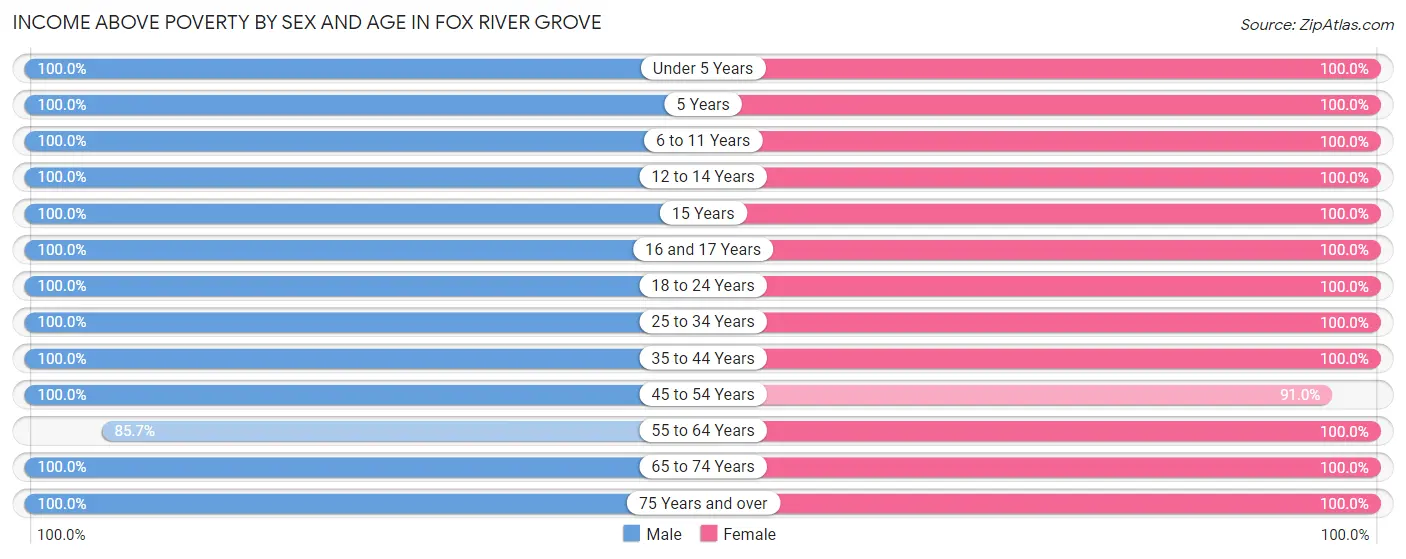
Income Above Poverty by Sex and Age in Fox River Grove
According to the poverty statistics in Fox River Grove, males aged under 5 years and females aged under 5 years are the age groups that are most secure financially, with 100.0% of males and 100.0% of females in these age groups living above the poverty line.
| Age Bracket | Male | Female |
| Under 5 Years | 105 (100.0%) | 108 (100.0%) |
| 5 Years | 32 (100.0%) | 7 (100.0%) |
| 6 to 11 Years | 217 (100.0%) | 235 (100.0%) |
| 12 to 14 Years | 50 (100.0%) | 26 (100.0%) |
| 15 Years | 30 (100.0%) | 6 (100.0%) |
| 16 and 17 Years | 120 (100.0%) | 81 (100.0%) |
| 18 to 24 Years | 154 (100.0%) | 92 (100.0%) |
| 25 to 34 Years | 373 (100.0%) | 348 (100.0%) |
| 35 to 44 Years | 247 (100.0%) | 392 (100.0%) |
| 45 to 54 Years | 258 (100.0%) | 456 (91.0%) |
| 55 to 64 Years | 342 (85.7%) | 293 (100.0%) |
| 65 to 74 Years | 165 (100.0%) | 219 (100.0%) |
| 75 Years and over | 18 (100.0%) | 124 (100.0%) |
| Total | 2,111 (97.4%) | 2,387 (98.2%) |
Income Below Poverty Among Married-Couple Families in Fox River Grove
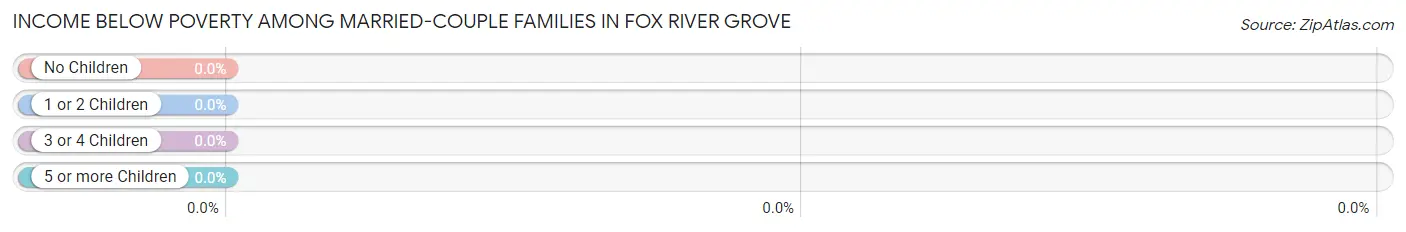
| Children | Above Poverty | Below Poverty |
| No Children | 444 (100.0%) | 0 (0.0%) |
| 1 or 2 Children | 473 (100.0%) | 0 (0.0%) |
| 3 or 4 Children | 50 (100.0%) | 0 (0.0%) |
| 5 or more Children | 0 (0.0%) | 0 (0.0%) |
| Total | 967 (100.0%) | 0 (0.0%) |
Income Below Poverty Among Single-Parent Households in Fox River Grove
| Children | Single Father | Single Mother |
| No Children | 0 (0.0%) | 0 (0.0%) |
| 1 or 2 Children | 0 (0.0%) | 0 (0.0%) |
| 3 or 4 Children | 0 (0.0%) | 0 (0.0%) |
| 5 or more Children | 0 (0.0%) | 0 (0.0%) |
| Total | 0 (0.0%) | 0 (0.0%) |
Income Below Poverty Among Married-Couple vs Single-Parent Households in Fox River Grove
| Children | Married-Couple Families | Single-Parent Households |
| No Children | 0 (0.0%) | 0 (0.0%) |
| 1 or 2 Children | 0 (0.0%) | 0 (0.0%) |
| 3 or 4 Children | 0 (0.0%) | 0 (0.0%) |
| 5 or more Children | 0 (0.0%) | 0 (0.0%) |
| Total | 0 (0.0%) | 0 (0.0%) |
Race in Fox River Grove
The most populous races in Fox River Grove are White / Caucasian (3,926 | 85.4%), Hispanic or Latino (812 | 17.6%), and Two or more Races (506 | 11.0%).
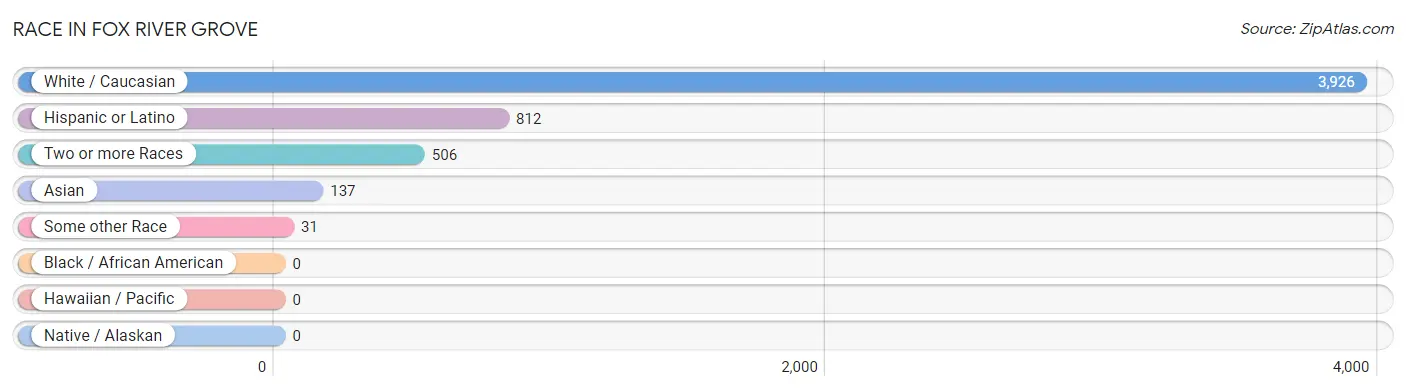
| Race | # Population | % Population |
| Asian | 137 | 3.0% |
| Black / African American | 0 | 0.0% |
| Hawaiian / Pacific | 0 | 0.0% |
| Hispanic or Latino | 812 | 17.6% |
| Native / Alaskan | 0 | 0.0% |
| White / Caucasian | 3,926 | 85.4% |
| Two or more Races | 506 | 11.0% |
| Some other Race | 31 | 0.7% |
| Total | 4,600 | 100.0% |
Ancestry in Fox River Grove
The most populous ancestries reported in Fox River Grove are German (1,266 | 27.5%), Italian (876 | 19.0%), English (855 | 18.6%), Irish (626 | 13.6%), and Polish (524 | 11.4%), together accounting for 90.1% of all Fox River Grove residents.
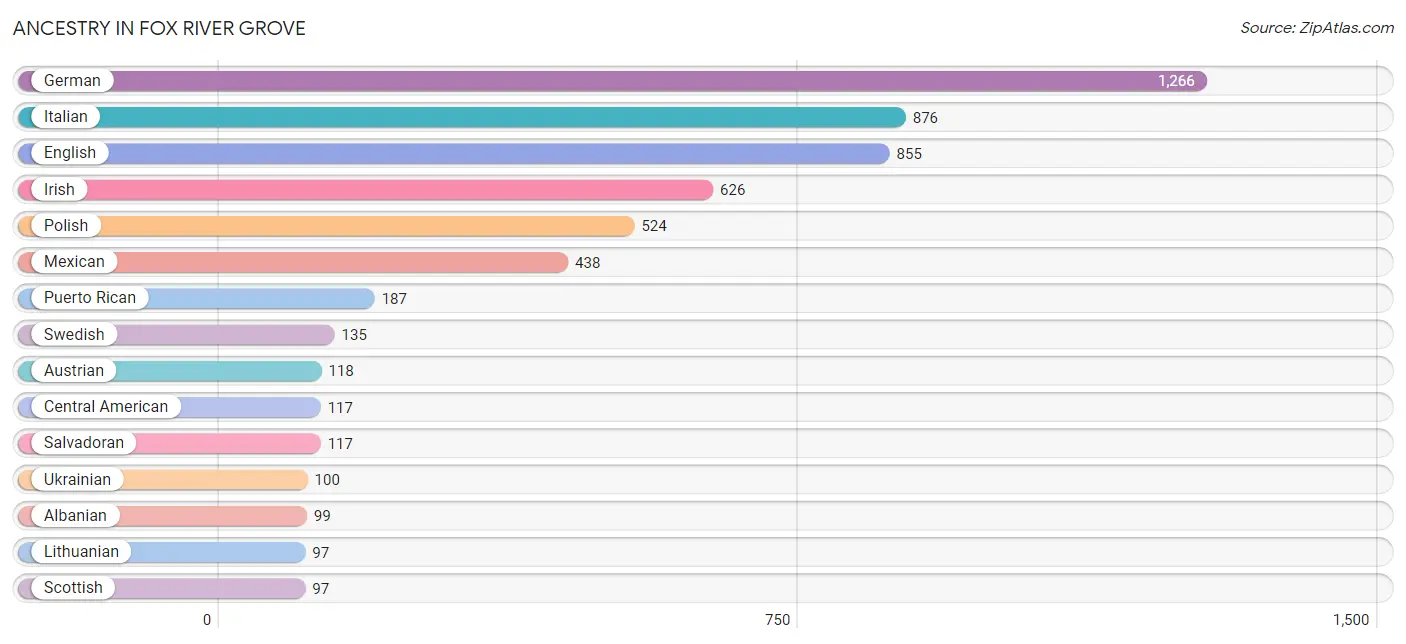
| Ancestry | # Population | % Population |
| Albanian | 99 | 2.1% |
| American | 36 | 0.8% |
| Arab | 13 | 0.3% |
| Austrian | 118 | 2.6% |
| Burmese | 93 | 2.0% |
| Central American | 117 | 2.5% |
| Choctaw | 5 | 0.1% |
| Croatian | 6 | 0.1% |
| Cuban | 5 | 0.1% |
| Czech | 86 | 1.9% |
| Czechoslovakian | 75 | 1.6% |
| Danish | 73 | 1.6% |
| Dutch | 81 | 1.8% |
| English | 855 | 18.6% |
| European | 53 | 1.1% |
| Finnish | 9 | 0.2% |
| French | 87 | 1.9% |
| French Canadian | 23 | 0.5% |
| German | 1,266 | 27.5% |
| Hungarian | 11 | 0.2% |
| Indian (Asian) | 32 | 0.7% |
| Irish | 626 | 13.6% |
| Italian | 876 | 19.0% |
| Korean | 40 | 0.9% |
| Lebanese | 13 | 0.3% |
| Lithuanian | 97 | 2.1% |
| Mexican | 438 | 9.5% |
| Norwegian | 55 | 1.2% |
| Polish | 524 | 11.4% |
| Portuguese | 7 | 0.2% |
| Puerto Rican | 187 | 4.1% |
| Romanian | 11 | 0.2% |
| Salvadoran | 117 | 2.5% |
| Scotch-Irish | 35 | 0.8% |
| Scottish | 97 | 2.1% |
| Serbian | 40 | 0.9% |
| Slovak | 20 | 0.4% |
| Slovene | 10 | 0.2% |
| South African | 7 | 0.2% |
| Spaniard | 65 | 1.4% |
| Subsaharan African | 7 | 0.2% |
| Swedish | 135 | 2.9% |
| Swiss | 16 | 0.4% |
| Ukrainian | 100 | 2.2% |
| Welsh | 55 | 1.2% | View All 45 Rows |
Immigrants in Fox River Grove
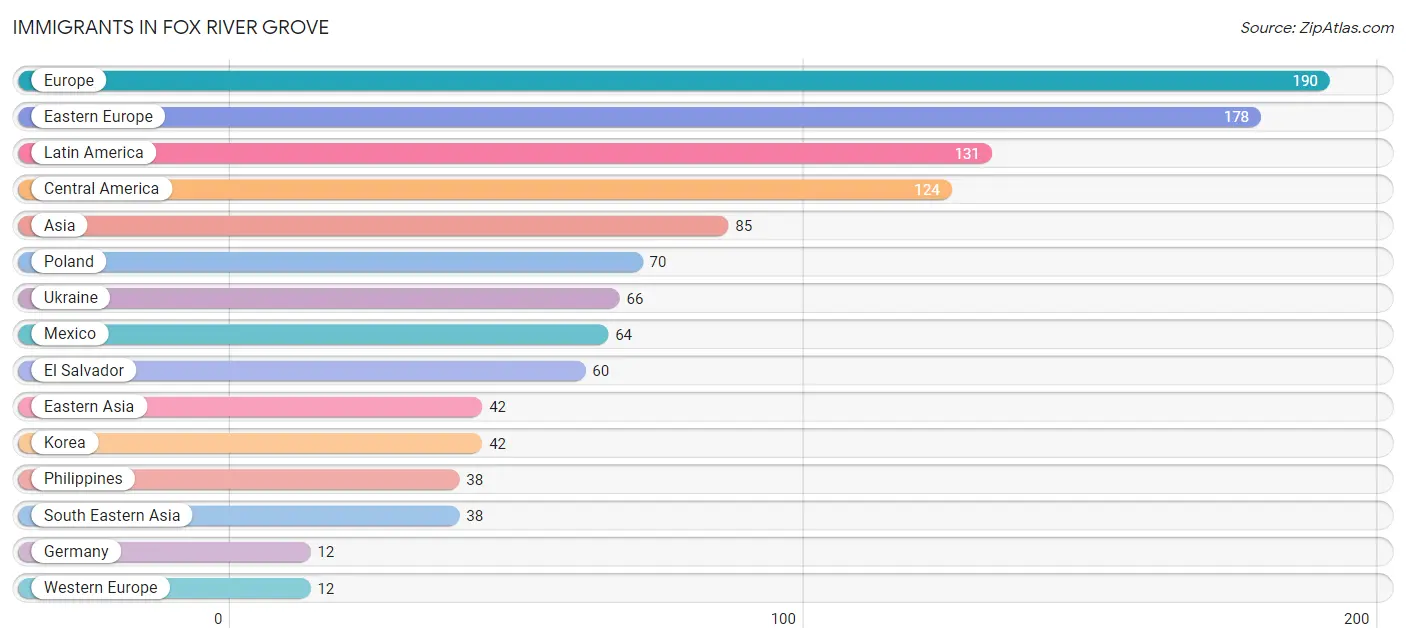
The most numerous immigrant groups reported in Fox River Grove came from Europe (190 | 4.1%), Eastern Europe (178 | 3.9%), Latin America (131 | 2.9%), Central America (124 | 2.7%), and Asia (85 | 1.8%), together accounting for 15.4% of all Fox River Grove residents.
| Immigration Origin | # Population | % Population |
| Africa | 7 | 0.2% |
| Asia | 85 | 1.8% |
| Brazil | 7 | 0.2% |
| Central America | 124 | 2.7% |
| Eastern Asia | 42 | 0.9% |
| Eastern Europe | 178 | 3.9% |
| El Salvador | 60 | 1.3% |
| Europe | 190 | 4.1% |
| Germany | 12 | 0.3% |
| Korea | 42 | 0.9% |
| Latin America | 131 | 2.9% |
| Lebanon | 5 | 0.1% |
| Mexico | 64 | 1.4% |
| North Macedonia | 9 | 0.2% |
| Philippines | 38 | 0.8% |
| Poland | 70 | 1.5% |
| Romania | 11 | 0.2% |
| South Africa | 7 | 0.2% |
| South America | 7 | 0.2% |
| South Eastern Asia | 38 | 0.8% |
| Ukraine | 66 | 1.4% |
| Western Asia | 5 | 0.1% |
| Western Europe | 12 | 0.3% | View All 23 Rows |
Sex and Age in Fox River Grove
Sex and Age in Fox River Grove
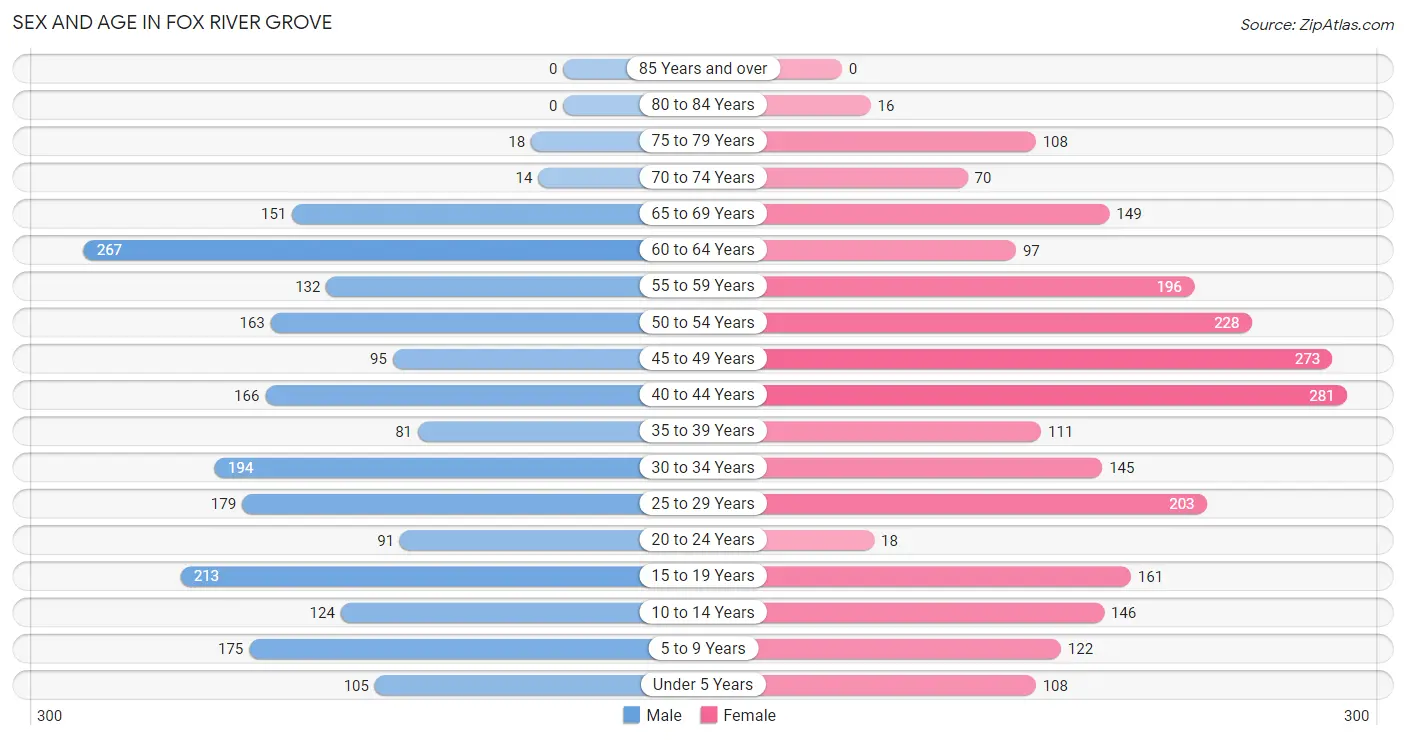
The most populous age groups in Fox River Grove are 60 to 64 Years (267 | 12.3%) for men and 40 to 44 Years (281 | 11.6%) for women.
| Age Bracket | Male | Female |
| Under 5 Years | 105 (4.8%) | 108 (4.4%) |
| 5 to 9 Years | 175 (8.1%) | 122 (5.0%) |
| 10 to 14 Years | 124 (5.7%) | 146 (6.0%) |
| 15 to 19 Years | 213 (9.8%) | 161 (6.6%) |
| 20 to 24 Years | 91 (4.2%) | 18 (0.7%) |
| 25 to 29 Years | 179 (8.3%) | 203 (8.4%) |
| 30 to 34 Years | 194 (8.9%) | 145 (6.0%) |
| 35 to 39 Years | 81 (3.7%) | 111 (4.6%) |
| 40 to 44 Years | 166 (7.7%) | 281 (11.6%) |
| 45 to 49 Years | 95 (4.4%) | 273 (11.2%) |
| 50 to 54 Years | 163 (7.5%) | 228 (9.4%) |
| 55 to 59 Years | 132 (6.1%) | 196 (8.1%) |
| 60 to 64 Years | 267 (12.3%) | 97 (4.0%) |
| 65 to 69 Years | 151 (7.0%) | 149 (6.1%) |
| 70 to 74 Years | 14 (0.6%) | 70 (2.9%) |
| 75 to 79 Years | 18 (0.8%) | 108 (4.4%) |
| 80 to 84 Years | 0 (0.0%) | 16 (0.7%) |
| 85 Years and over | 0 (0.0%) | 0 (0.0%) |
| Total | 2,168 (100.0%) | 2,432 (100.0%) |
Families and Households in Fox River Grove
Median Family Size in Fox River Grove
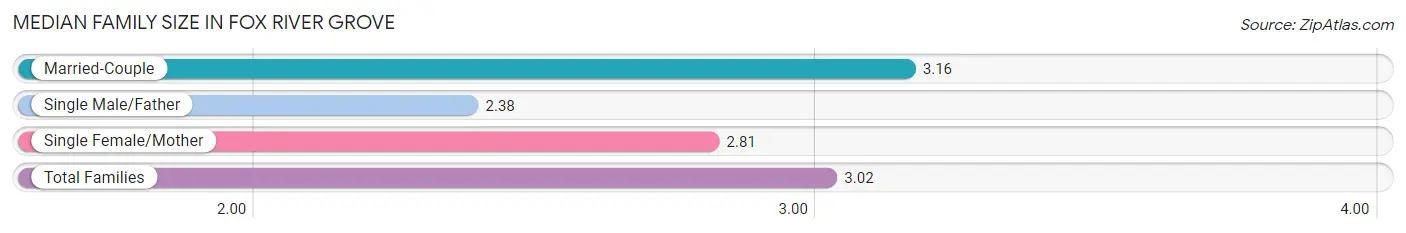
The median family size in Fox River Grove is 3.02 persons per family, with married-couple families (967 | 72.3%) accounting for the largest median family size of 3.16 persons per family. On the other hand, single male/father families (138 | 10.3%) represent the smallest median family size with 2.38 persons per family.
| Family Type | # Families | Family Size |
| Married-Couple | 967 (72.3%) | 3.16 |
| Single Male/Father | 138 (10.3%) | 2.38 |
| Single Female/Mother | 233 (17.4%) | 2.81 |
| Total Families | 1,338 (100.0%) | 3.02 |
Median Household Size in Fox River Grove
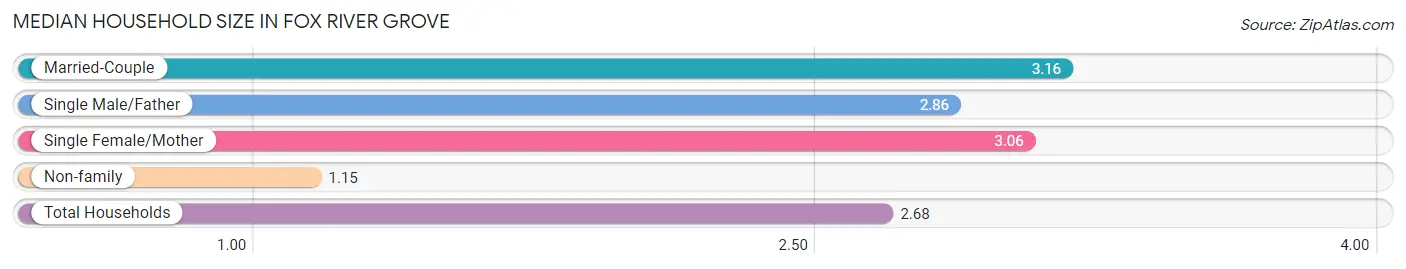
The median household size in Fox River Grove is 2.68 persons per household, with married-couple households (967 | 56.2%) accounting for the largest median household size of 3.16 persons per household. non-family households (381 | 22.2%) represent the smallest median household size with 1.15 persons per household.
| Household Type | # Households | Household Size |
| Married-Couple | 967 (56.2%) | 3.16 |
| Single Male/Father | 138 (8.0%) | 2.86 |
| Single Female/Mother | 233 (13.6%) | 3.06 |
| Non-family | 381 (22.2%) | 1.15 |
| Total Households | 1,719 (100.0%) | 2.68 |
Household Size by Marriage Status in Fox River Grove
Out of a total of 1,719 households in Fox River Grove, 1,338 (77.8%) are family households, while 381 (22.2%) are nonfamily households. The most numerous type of family households are 3-person households, comprising 507, and the most common type of nonfamily households are 1-person households, comprising 328.
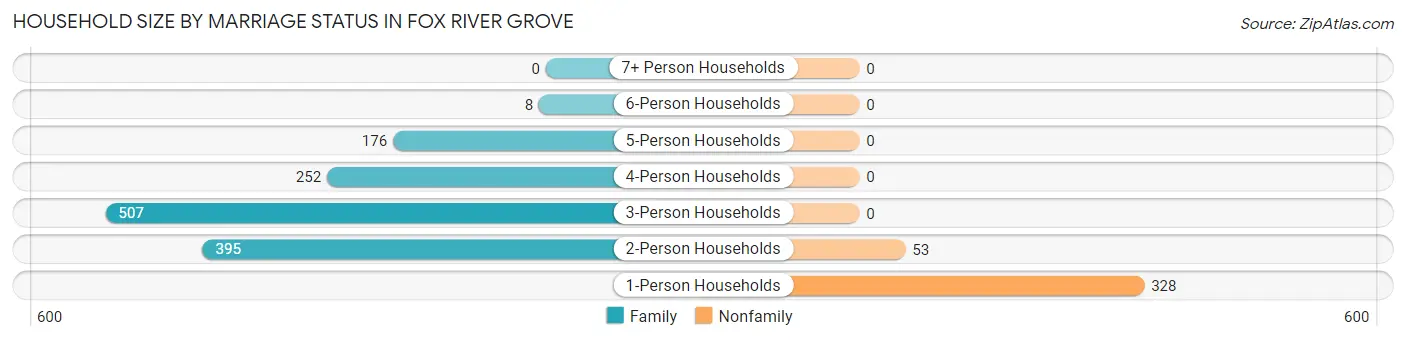
| Household Size | Family Households | Nonfamily Households |
| 1-Person Households | - | 328 (19.1%) |
| 2-Person Households | 395 (23.0%) | 53 (3.1%) |
| 3-Person Households | 507 (29.5%) | 0 (0.0%) |
| 4-Person Households | 252 (14.7%) | 0 (0.0%) |
| 5-Person Households | 176 (10.2%) | 0 (0.0%) |
| 6-Person Households | 8 (0.5%) | 0 (0.0%) |
| 7+ Person Households | 0 (0.0%) | 0 (0.0%) |
| Total | 1,338 (77.8%) | 381 (22.2%) |
Female Fertility in Fox River Grove
Fertility by Age in Fox River Grove
Average fertility rate in Fox River Grove is 25.0 births per 1,000 women. Women in the age bracket of 20 to 34 years have the highest fertility rate with 85.0 births per 1,000 women. Women in the age bracket of 20 to 34 years acount for 100.0% of all women with births.
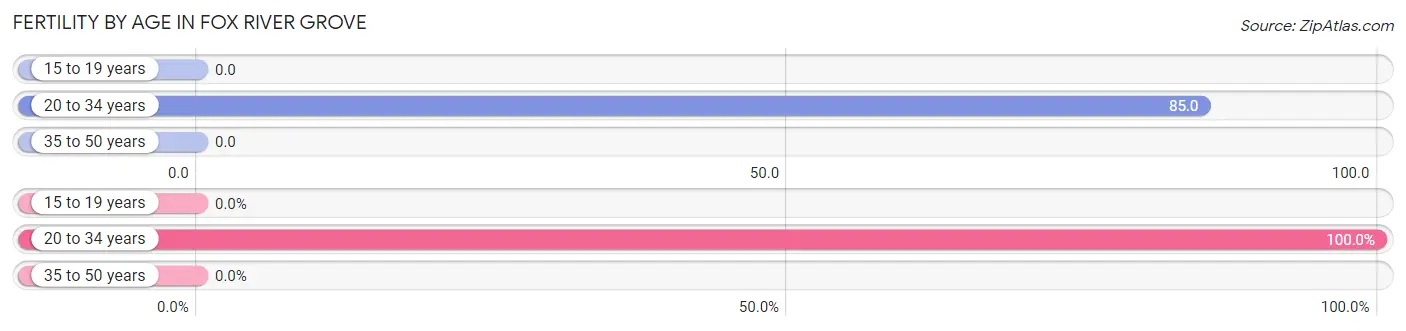
| Age Bracket | Women with Births | Births / 1,000 Women |
| 15 to 19 years | 0 (0.0%) | 0.0 |
| 20 to 34 years | 31 (100.0%) | 85.0 |
| 35 to 50 years | 0 (0.0%) | 0.0 |
| Total | 31 (100.0%) | 25.0 |
Fertility by Age by Marriage Status in Fox River Grove
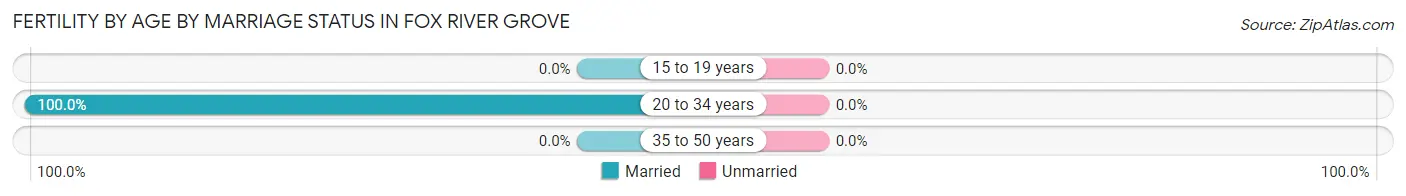
| Age Bracket | Married | Unmarried |
| 15 to 19 years | 0 (0.0%) | 0 (0.0%) |
| 20 to 34 years | 31 (100.0%) | 0 (0.0%) |
| 35 to 50 years | 0 (0.0%) | 0 (0.0%) |
| Total | 31 (100.0%) | 0 (0.0%) |
Fertility by Education in Fox River Grove
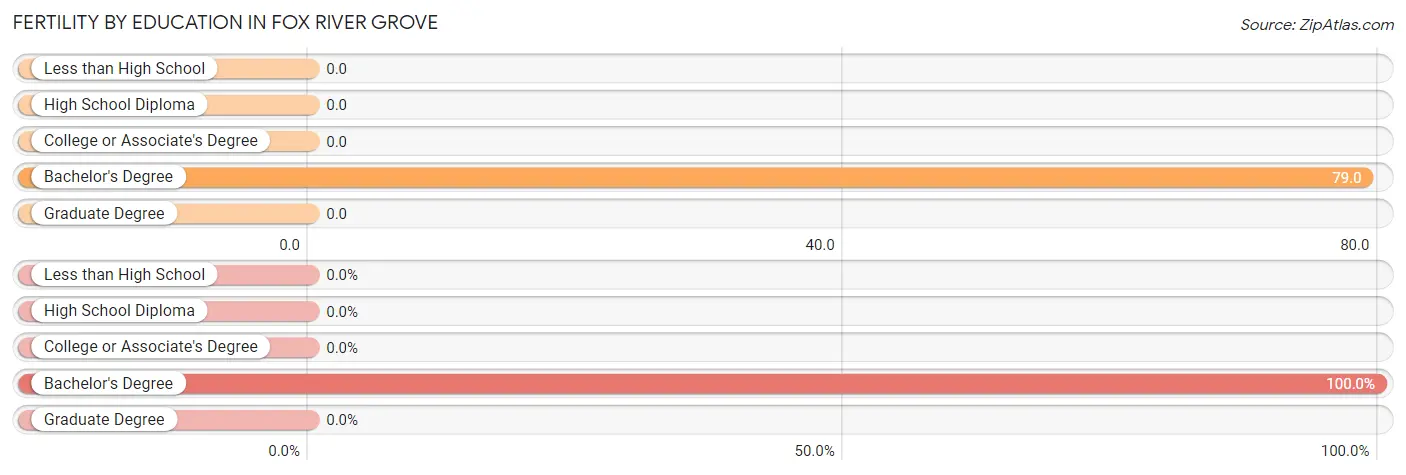
| Educational Attainment | Women with Births | Births / 1,000 Women |
| Less than High School | 0 (0.0%) | 0.0 |
| High School Diploma | 0 (0.0%) | 0.0 |
| College or Associate's Degree | 0 (0.0%) | 0.0 |
| Bachelor's Degree | 31 (100.0%) | 79.0 |
| Graduate Degree | 0 (0.0%) | 0.0 |
| Total | 31 (100.0%) | 25.0 |
Fertility by Education by Marriage Status in Fox River Grove
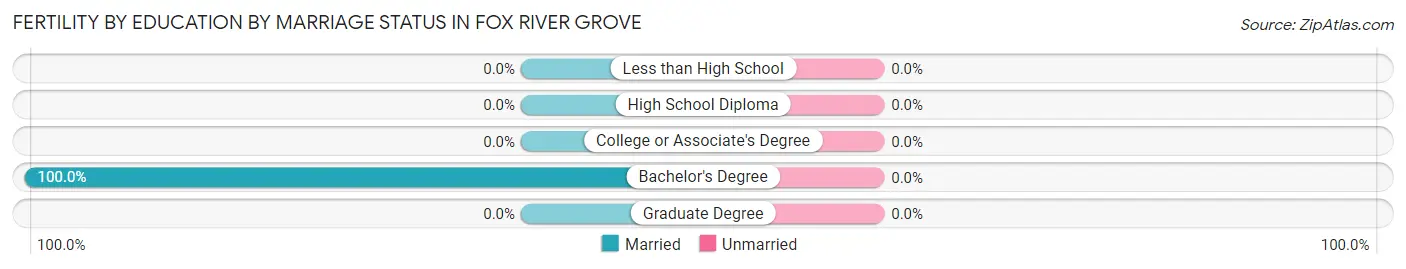
| Educational Attainment | Married | Unmarried |
| Less than High School | 0 (0.0%) | 0 (0.0%) |
| High School Diploma | 0 (0.0%) | 0 (0.0%) |
| College or Associate's Degree | 0 (0.0%) | 0 (0.0%) |
| Bachelor's Degree | 31 (100.0%) | 0 (0.0%) |
| Graduate Degree | 0 (0.0%) | 0 (0.0%) |
| Total | 31 (100.0%) | 0 (0.0%) |
Employment Characteristics in Fox River Grove
Employment by Class of Employer in Fox River Grove
Among the 2,587 employed individuals in Fox River Grove, private company employees (1,790 | 69.2%), not-for-profit organizations (289 | 11.2%), and local government employees (178 | 6.9%) make up the most common classes of employment.
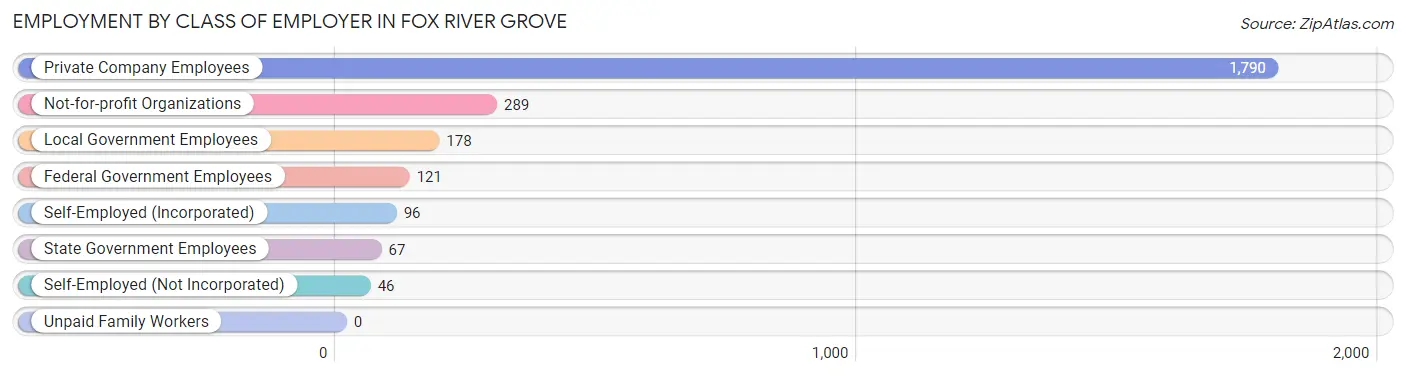
| Employer Class | # Employees | % Employees |
| Private Company Employees | 1,790 | 69.2% |
| Self-Employed (Incorporated) | 96 | 3.7% |
| Self-Employed (Not Incorporated) | 46 | 1.8% |
| Not-for-profit Organizations | 289 | 11.2% |
| Local Government Employees | 178 | 6.9% |
| State Government Employees | 67 | 2.6% |
| Federal Government Employees | 121 | 4.7% |
| Unpaid Family Workers | 0 | 0.0% |
| Total | 2,587 | 100.0% |
Employment Status by Age in Fox River Grove
According to the labor force statistics for Fox River Grove, out of the total population over 16 years of age (3,784), 71.4% or 2,702 individuals are in the labor force, with 3.6% or 97 of them unemployed. The age group with the highest labor force participation rate is 25 to 29 years, with 100.0% or 382 individuals in the labor force. Within the labor force, the 16 to 19 years age range has the highest percentage of unemployed individuals, with 25.8% or 16 of them being unemployed.
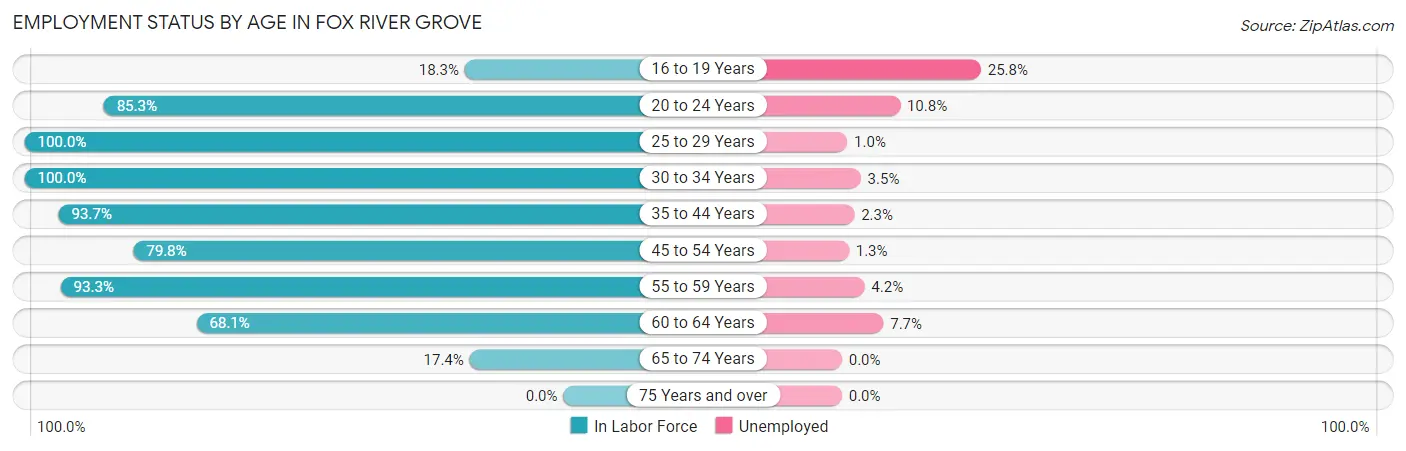
| Age Bracket | In Labor Force | Unemployed |
| 16 to 19 Years | 62 (18.3%) | 16 (25.8%) |
| 20 to 24 Years | 93 (85.3%) | 10 (10.8%) |
| 25 to 29 Years | 382 (100.0%) | 4 (1.0%) |
| 30 to 34 Years | 339 (100.0%) | 12 (3.5%) |
| 35 to 44 Years | 599 (93.7%) | 14 (2.3%) |
| 45 to 54 Years | 606 (79.8%) | 8 (1.3%) |
| 55 to 59 Years | 306 (93.3%) | 13 (4.2%) |
| 60 to 64 Years | 248 (68.1%) | 19 (7.7%) |
| 65 to 74 Years | 67 (17.4%) | 0 (0.0%) |
| 75 Years and over | 0 (0.0%) | 0 (0.0%) |
| Total | 2,702 (71.4%) | 97 (3.6%) |
Employment Status by Educational Attainment in Fox River Grove
According to labor force statistics for Fox River Grove, 88.2% of individuals (2,479) out of the total population between 25 and 64 years of age (2,811) are in the labor force, with 2.8% or 69 of them being unemployed. The group with the highest labor force participation rate are those with the educational attainment of less than high school, with 100.0% or 15 individuals in the labor force. Within the labor force, individuals with less than high school education have the highest percentage of unemployment, with 20.0% or 3 of them being unemployed.
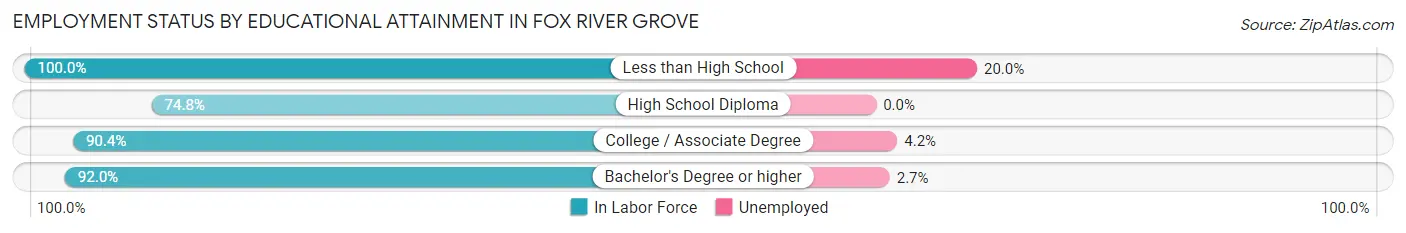
| Educational Attainment | In Labor Force | Unemployed |
| Less than High School | 15 (100.0%) | 3 (20.0%) |
| High School Diploma | 409 (74.8%) | 0 (0.0%) |
| College / Associate Degree | 757 (90.4%) | 35 (4.2%) |
| Bachelor's Degree or higher | 1,299 (92.0%) | 38 (2.7%) |
| Total | 2,479 (88.2%) | 79 (2.8%) |
Employment Occupations by Sex in Fox River Grove
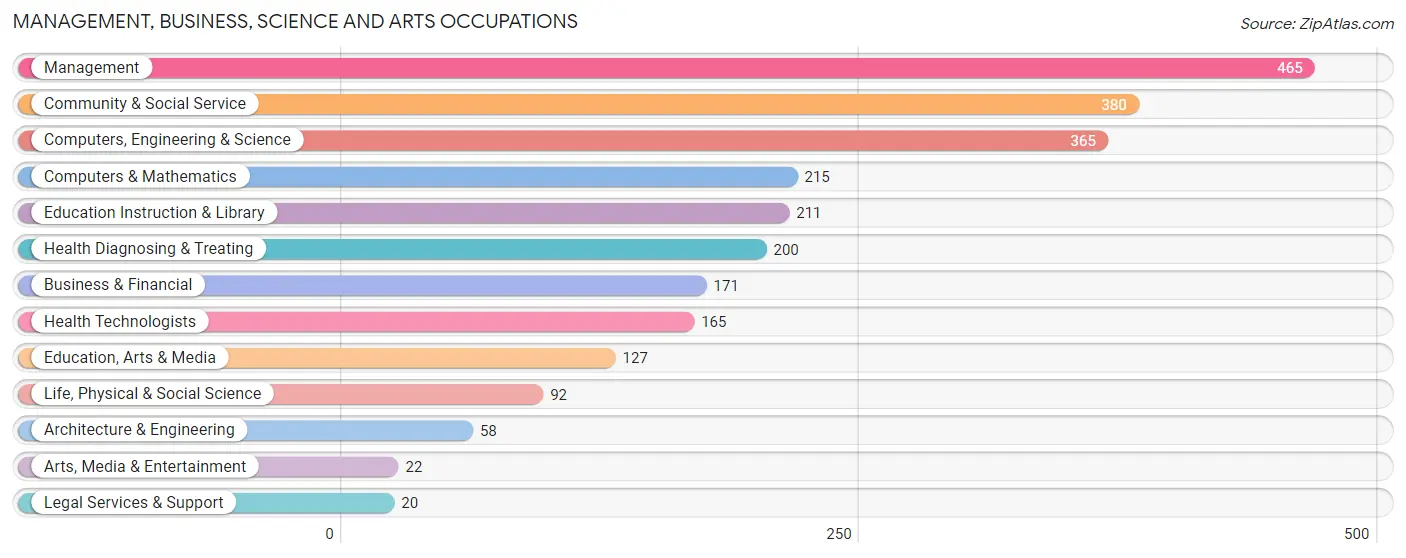
Management, Business, Science and Arts Occupations
The most common Management, Business, Science and Arts occupations in Fox River Grove are Management (465 | 17.8%), Community & Social Service (380 | 14.6%), Computers, Engineering & Science (365 | 14.0%), Computers & Mathematics (215 | 8.3%), and Education Instruction & Library (211 | 8.1%).
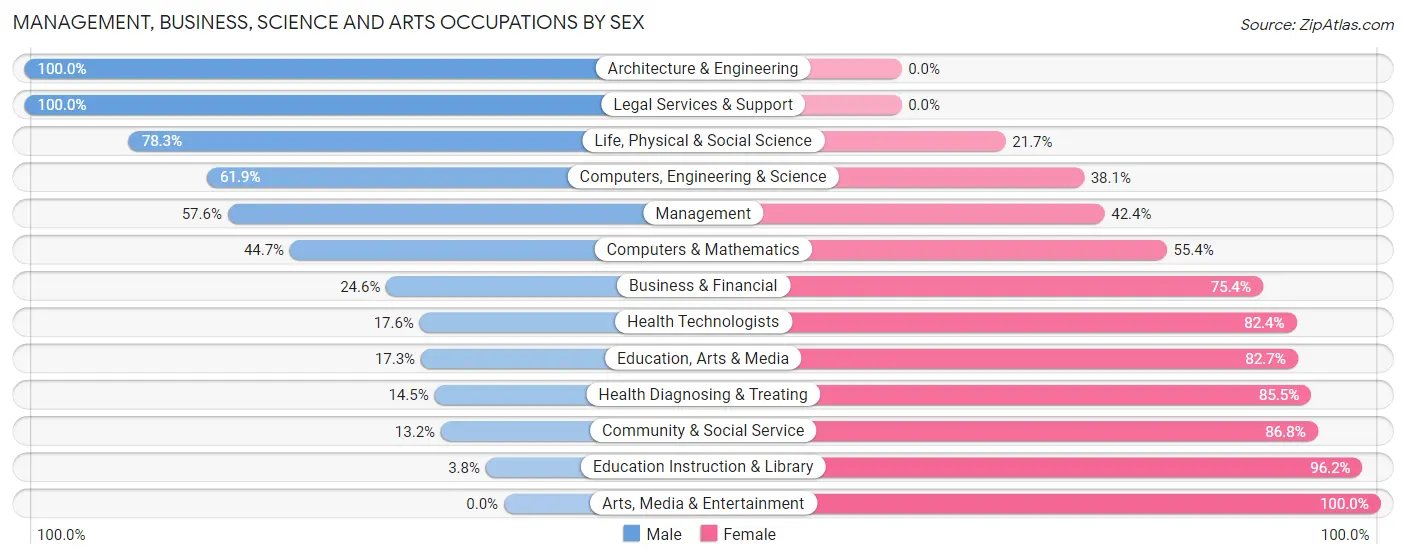
Management, Business, Science and Arts Occupations by Sex
Within the Management, Business, Science and Arts occupations in Fox River Grove, the most male-oriented occupations are Architecture & Engineering (100.0%), Legal Services & Support (100.0%), and Life, Physical & Social Science (78.3%), while the most female-oriented occupations are Arts, Media & Entertainment (100.0%), Education Instruction & Library (96.2%), and Community & Social Service (86.8%).
| Occupation | Male | Female |
| Management | 268 (57.6%) | 197 (42.4%) |
| Business & Financial | 42 (24.6%) | 129 (75.4%) |
| Computers, Engineering & Science | 226 (61.9%) | 139 (38.1%) |
| Computers & Mathematics | 96 (44.7%) | 119 (55.3%) |
| Architecture & Engineering | 58 (100.0%) | 0 (0.0%) |
| Life, Physical & Social Science | 72 (78.3%) | 20 (21.7%) |
| Community & Social Service | 50 (13.2%) | 330 (86.8%) |
| Education, Arts & Media | 22 (17.3%) | 105 (82.7%) |
| Legal Services & Support | 20 (100.0%) | 0 (0.0%) |
| Education Instruction & Library | 8 (3.8%) | 203 (96.2%) |
| Arts, Media & Entertainment | 0 (0.0%) | 22 (100.0%) |
| Health Diagnosing & Treating | 29 (14.5%) | 171 (85.5%) |
| Health Technologists | 29 (17.6%) | 136 (82.4%) |
| Total (Category) | 615 (38.9%) | 966 (61.1%) |
| Total (Overall) | 1,272 (48.8%) | 1,334 (51.2%) |
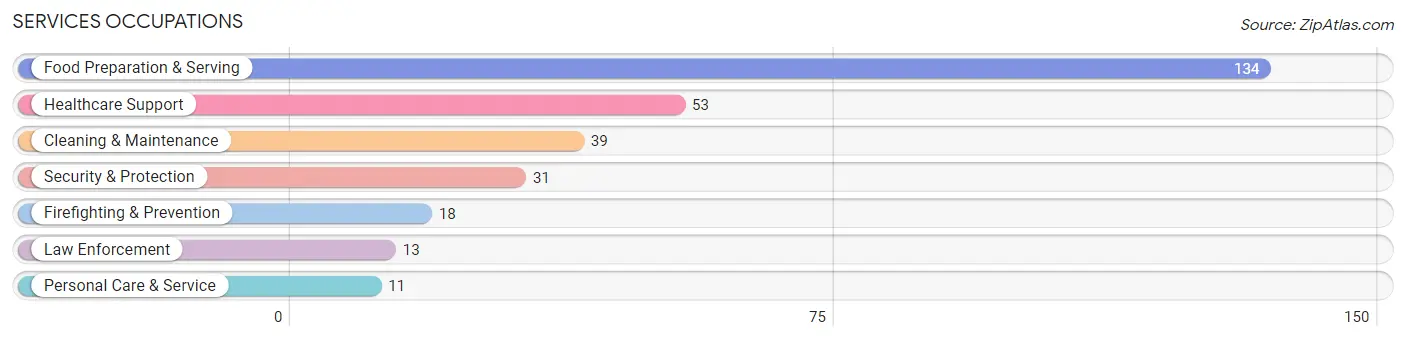
Services Occupations
The most common Services occupations in Fox River Grove are Food Preparation & Serving (134 | 5.1%), Healthcare Support (53 | 2.0%), Cleaning & Maintenance (39 | 1.5%), Security & Protection (31 | 1.2%), and Firefighting & Prevention (18 | 0.7%).
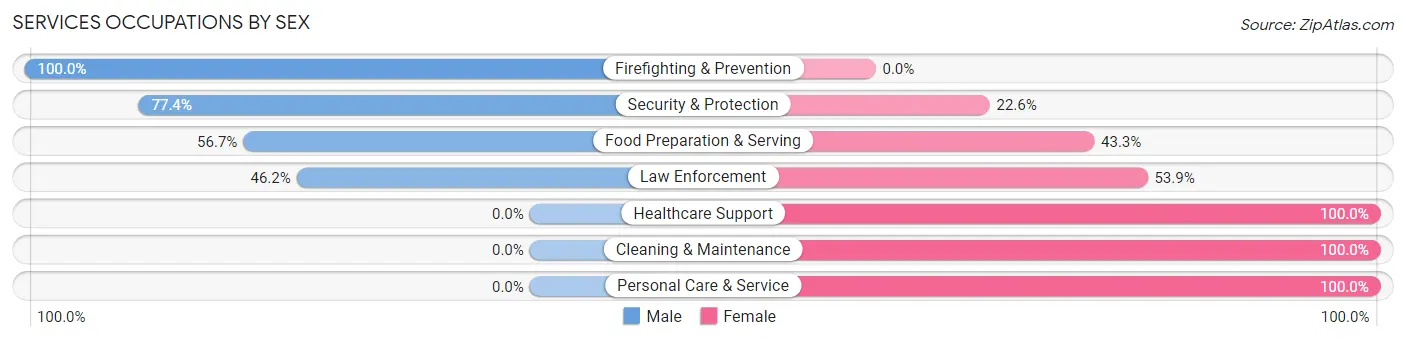
Services Occupations by Sex
Within the Services occupations in Fox River Grove, the most male-oriented occupations are Firefighting & Prevention (100.0%), Security & Protection (77.4%), and Food Preparation & Serving (56.7%), while the most female-oriented occupations are Healthcare Support (100.0%), Cleaning & Maintenance (100.0%), and Personal Care & Service (100.0%).
| Occupation | Male | Female |
| Healthcare Support | 0 (0.0%) | 53 (100.0%) |
| Security & Protection | 24 (77.4%) | 7 (22.6%) |
| Firefighting & Prevention | 18 (100.0%) | 0 (0.0%) |
| Law Enforcement | 6 (46.2%) | 7 (53.8%) |
| Food Preparation & Serving | 76 (56.7%) | 58 (43.3%) |
| Cleaning & Maintenance | 0 (0.0%) | 39 (100.0%) |
| Personal Care & Service | 0 (0.0%) | 11 (100.0%) |
| Total (Category) | 100 (37.3%) | 168 (62.7%) |
| Total (Overall) | 1,272 (48.8%) | 1,334 (51.2%) |
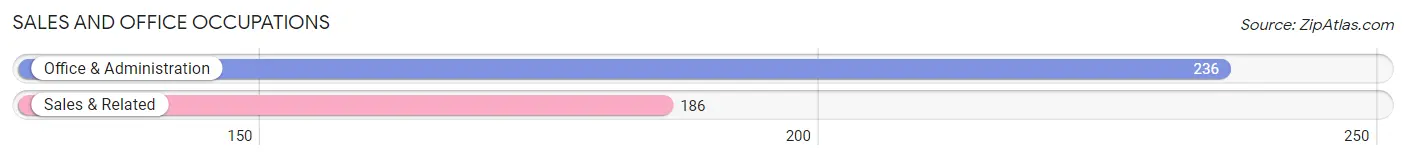
Sales and Office Occupations
The most common Sales and Office occupations in Fox River Grove are Office & Administration (236 | 9.1%), and Sales & Related (186 | 7.1%).
Sales and Office Occupations by Sex
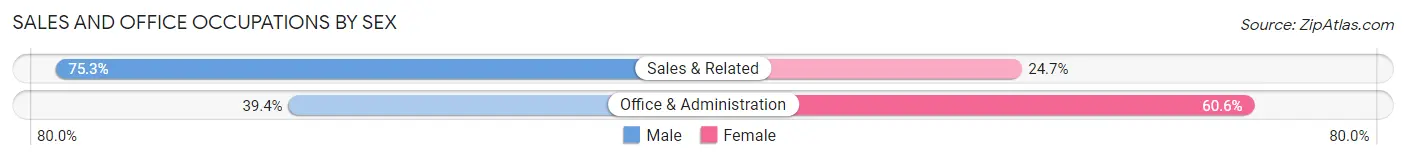
| Occupation | Male | Female |
| Sales & Related | 140 (75.3%) | 46 (24.7%) |
| Office & Administration | 93 (39.4%) | 143 (60.6%) |
| Total (Category) | 233 (55.2%) | 189 (44.8%) |
| Total (Overall) | 1,272 (48.8%) | 1,334 (51.2%) |
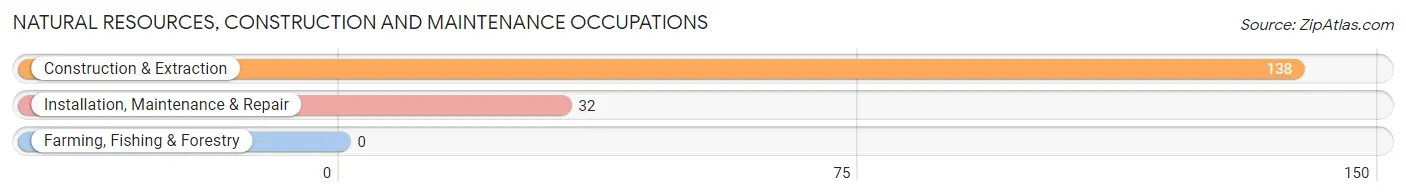
Natural Resources, Construction and Maintenance Occupations
The most common Natural Resources, Construction and Maintenance occupations in Fox River Grove are Construction & Extraction (138 | 5.3%), and Installation, Maintenance & Repair (32 | 1.2%).
Natural Resources, Construction and Maintenance Occupations by Sex
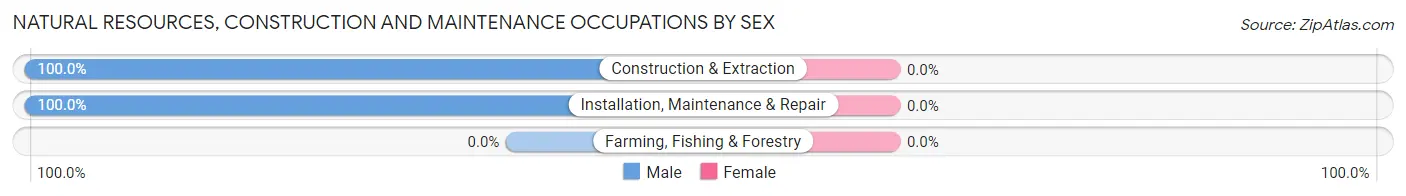
| Occupation | Male | Female |
| Farming, Fishing & Forestry | 0 (0.0%) | 0 (0.0%) |
| Construction & Extraction | 138 (100.0%) | 0 (0.0%) |
| Installation, Maintenance & Repair | 32 (100.0%) | 0 (0.0%) |
| Total (Category) | 170 (100.0%) | 0 (0.0%) |
| Total (Overall) | 1,272 (48.8%) | 1,334 (51.2%) |
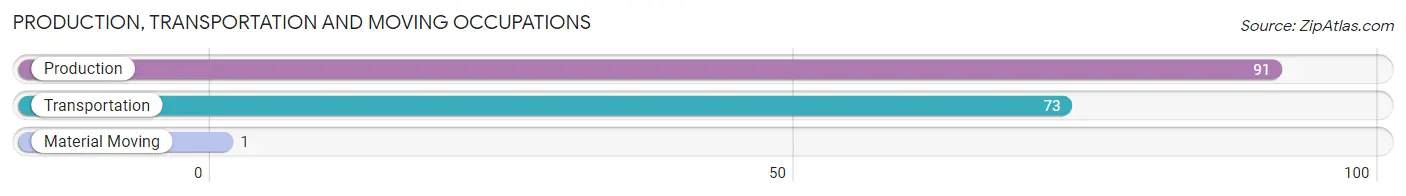
Production, Transportation and Moving Occupations
The most common Production, Transportation and Moving occupations in Fox River Grove are Production (91 | 3.5%), Transportation (73 | 2.8%), and Material Moving (1 | 0.0%).
Production, Transportation and Moving Occupations by Sex
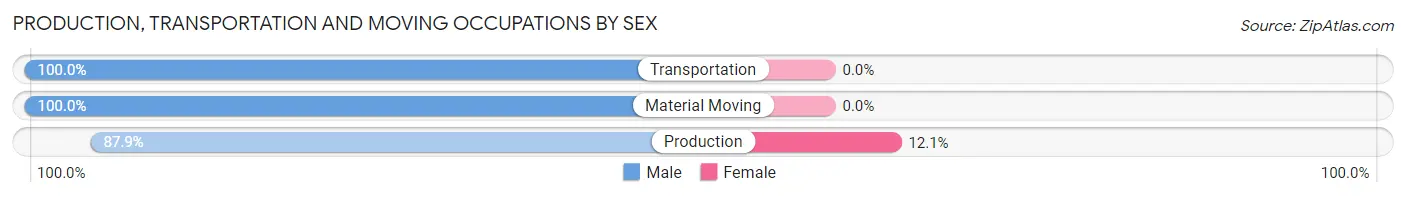
| Occupation | Male | Female |
| Production | 80 (87.9%) | 11 (12.1%) |
| Transportation | 73 (100.0%) | 0 (0.0%) |
| Material Moving | 1 (100.0%) | 0 (0.0%) |
| Total (Category) | 154 (93.3%) | 11 (6.7%) |
| Total (Overall) | 1,272 (48.8%) | 1,334 (51.2%) |
Employment Industries by Sex in Fox River Grove
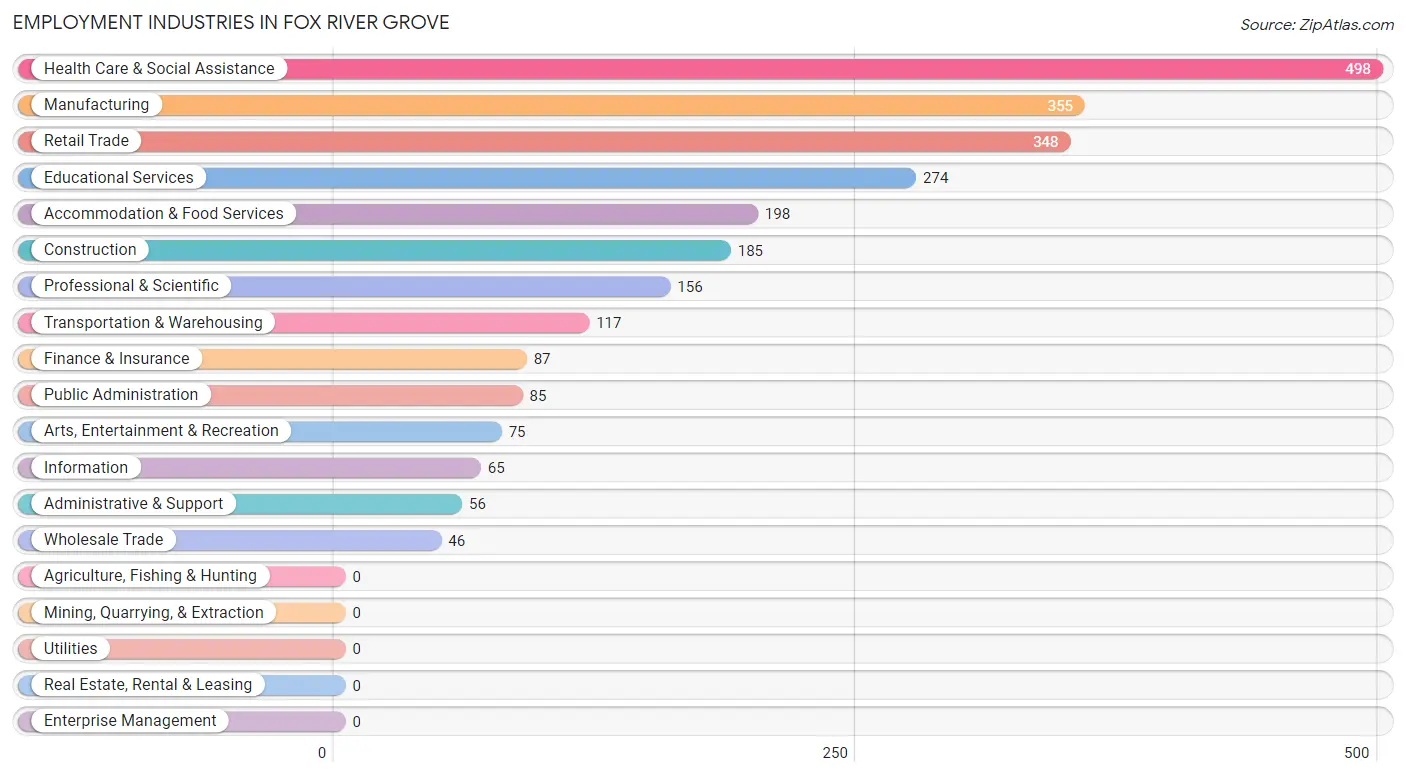
Employment Industries in Fox River Grove
The major employment industries in Fox River Grove include Health Care & Social Assistance (498 | 19.1%), Manufacturing (355 | 13.6%), Retail Trade (348 | 13.4%), Educational Services (274 | 10.5%), and Accommodation & Food Services (198 | 7.6%).
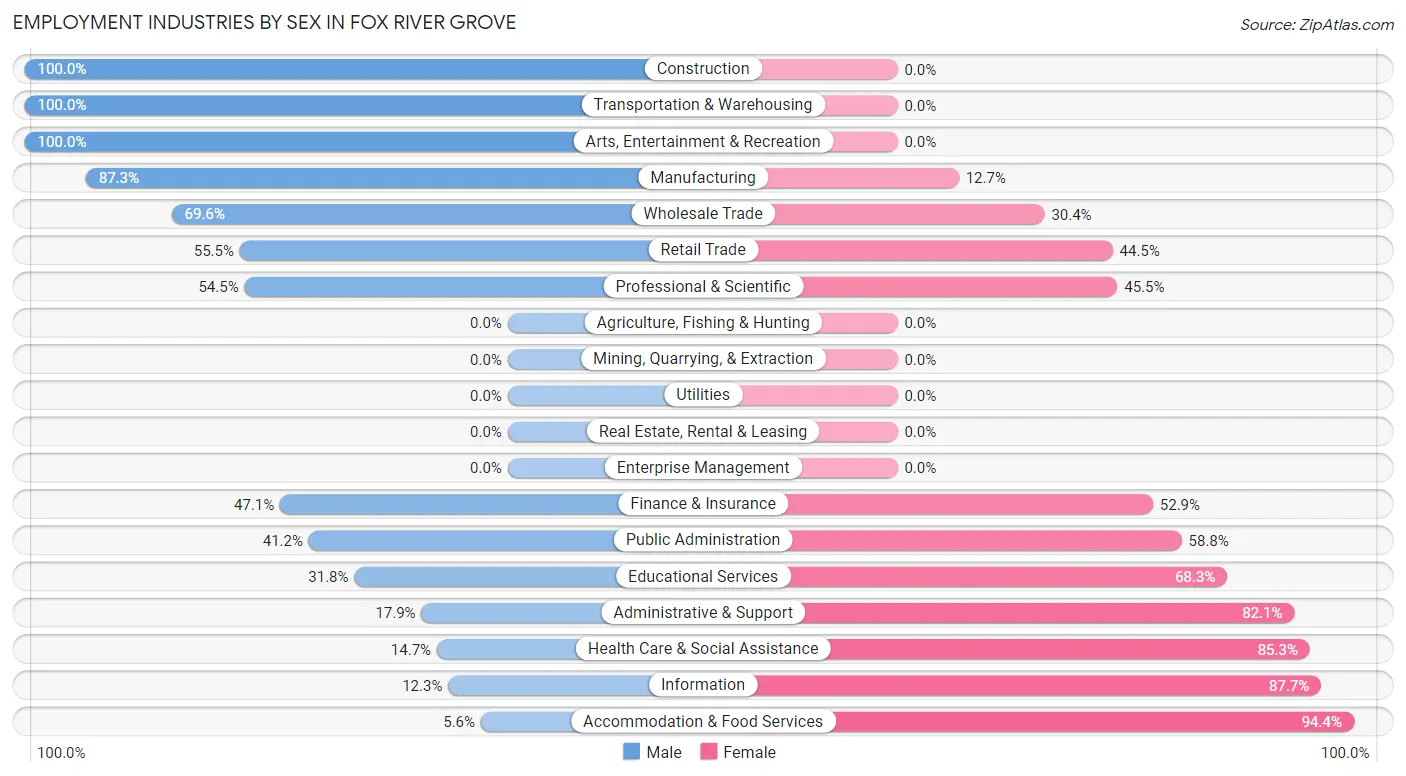
Employment Industries by Sex in Fox River Grove
The Fox River Grove industries that see more men than women are Construction (100.0%), Transportation & Warehousing (100.0%), and Arts, Entertainment & Recreation (100.0%), whereas the industries that tend to have a higher number of women are Accommodation & Food Services (94.4%), Information (87.7%), and Health Care & Social Assistance (85.3%).
| Industry | Male | Female |
| Agriculture, Fishing & Hunting | 0 (0.0%) | 0 (0.0%) |
| Mining, Quarrying, & Extraction | 0 (0.0%) | 0 (0.0%) |
| Construction | 185 (100.0%) | 0 (0.0%) |
| Manufacturing | 310 (87.3%) | 45 (12.7%) |
| Wholesale Trade | 32 (69.6%) | 14 (30.4%) |
| Retail Trade | 193 (55.5%) | 155 (44.5%) |
| Transportation & Warehousing | 117 (100.0%) | 0 (0.0%) |
| Utilities | 0 (0.0%) | 0 (0.0%) |
| Information | 8 (12.3%) | 57 (87.7%) |
| Finance & Insurance | 41 (47.1%) | 46 (52.9%) |
| Real Estate, Rental & Leasing | 0 (0.0%) | 0 (0.0%) |
| Professional & Scientific | 85 (54.5%) | 71 (45.5%) |
| Enterprise Management | 0 (0.0%) | 0 (0.0%) |
| Administrative & Support | 10 (17.9%) | 46 (82.1%) |
| Educational Services | 87 (31.8%) | 187 (68.2%) |
| Health Care & Social Assistance | 73 (14.7%) | 425 (85.3%) |
| Arts, Entertainment & Recreation | 75 (100.0%) | 0 (0.0%) |
| Accommodation & Food Services | 11 (5.6%) | 187 (94.4%) |
| Public Administration | 35 (41.2%) | 50 (58.8%) |
| Total | 1,272 (48.8%) | 1,334 (51.2%) |
Education in Fox River Grove
School Enrollment in Fox River Grove
The most common levels of schooling among the 1,216 students in Fox River Grove are high school (294 | 24.2%), college / undergraduate (248 | 20.4%), and middle school (233 | 19.2%).
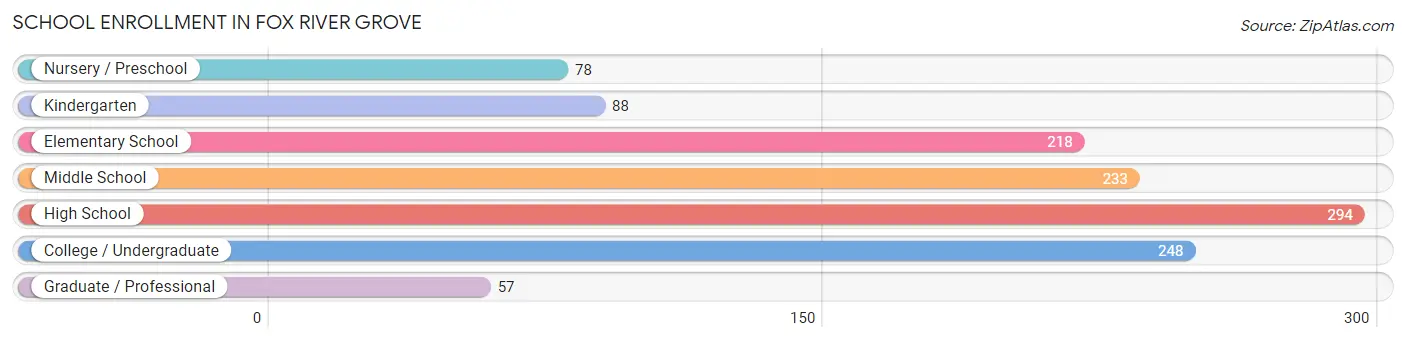
| School Level | # Students | % Students |
| Nursery / Preschool | 78 | 6.4% |
| Kindergarten | 88 | 7.2% |
| Elementary School | 218 | 17.9% |
| Middle School | 233 | 19.2% |
| High School | 294 | 24.2% |
| College / Undergraduate | 248 | 20.4% |
| Graduate / Professional | 57 | 4.7% |
| Total | 1,216 | 100.0% |
School Enrollment by Age by Funding Source in Fox River Grove
Out of a total of 1,216 students who are enrolled in schools in Fox River Grove, 86 (7.1%) attend a private institution, while the remaining 1,130 (92.9%) are enrolled in public schools. The age group of 25 to 34 year olds has the highest likelihood of being enrolled in private schools, with 12 (57.1% in the age bracket) enrolled. Conversely, the age group of 15 to 17 year olds has the lowest likelihood of being enrolled in a private school, with 237 (100.0% in the age bracket) attending a public institution.
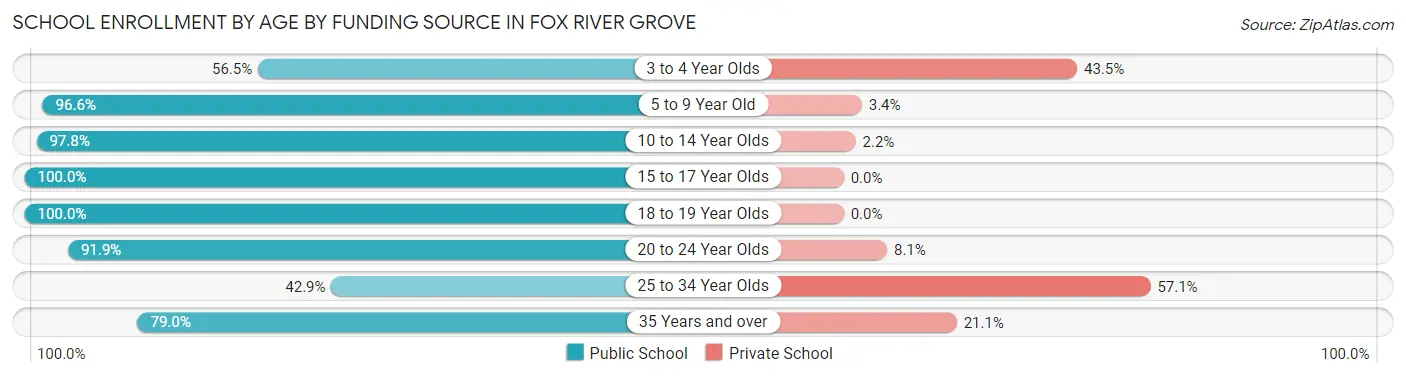
| Age Bracket | Public School | Private School |
| 3 to 4 Year Olds | 39 (56.5%) | 30 (43.5%) |
| 5 to 9 Year Old | 287 (96.6%) | 10 (3.4%) |
| 10 to 14 Year Olds | 264 (97.8%) | 6 (2.2%) |
| 15 to 17 Year Olds | 237 (100.0%) | 0 (0.0%) |
| 18 to 19 Year Olds | 128 (100.0%) | 0 (0.0%) |
| 20 to 24 Year Olds | 91 (91.9%) | 8 (8.1%) |
| 25 to 34 Year Olds | 9 (42.9%) | 12 (57.1%) |
| 35 Years and over | 75 (78.9%) | 20 (21.0%) |
| Total | 1,130 (92.9%) | 86 (7.1%) |
Educational Attainment by Field of Study in Fox River Grove
Business (286 | 14.8%), social sciences (228 | 11.8%), engineering (200 | 10.3%), science & technology (178 | 9.2%), and computers & mathematics (175 | 9.0%) are the most common fields of study among 1,935 individuals in Fox River Grove who have obtained a bachelor's degree or higher.
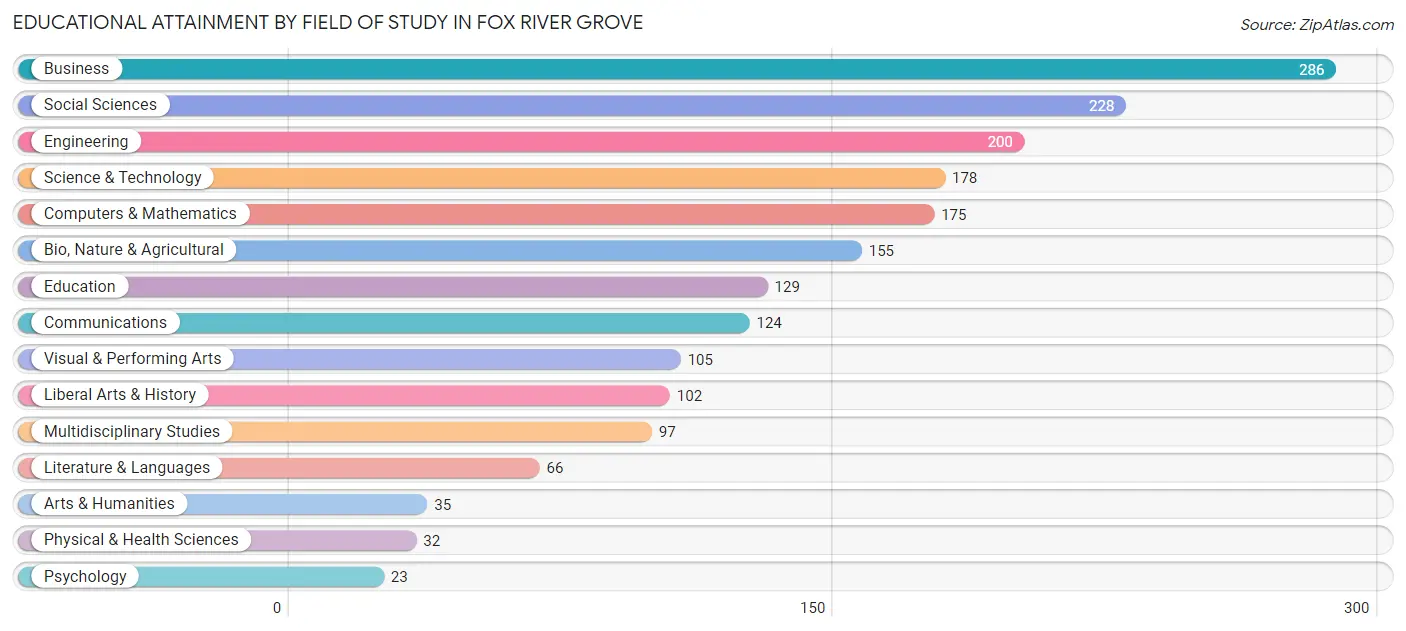
| Field of Study | # Graduates | % Graduates |
| Computers & Mathematics | 175 | 9.0% |
| Bio, Nature & Agricultural | 155 | 8.0% |
| Physical & Health Sciences | 32 | 1.7% |
| Psychology | 23 | 1.2% |
| Social Sciences | 228 | 11.8% |
| Engineering | 200 | 10.3% |
| Multidisciplinary Studies | 97 | 5.0% |
| Science & Technology | 178 | 9.2% |
| Business | 286 | 14.8% |
| Education | 129 | 6.7% |
| Literature & Languages | 66 | 3.4% |
| Liberal Arts & History | 102 | 5.3% |
| Visual & Performing Arts | 105 | 5.4% |
| Communications | 124 | 6.4% |
| Arts & Humanities | 35 | 1.8% |
| Total | 1,935 | 100.0% |
Transportation & Commute in Fox River Grove
Vehicle Availability by Sex in Fox River Grove
The most prevalent vehicle ownership categories in Fox River Grove are males with 2 vehicles (650, accounting for 51.4%) and females with 2 vehicles (852, making up 49.1%).
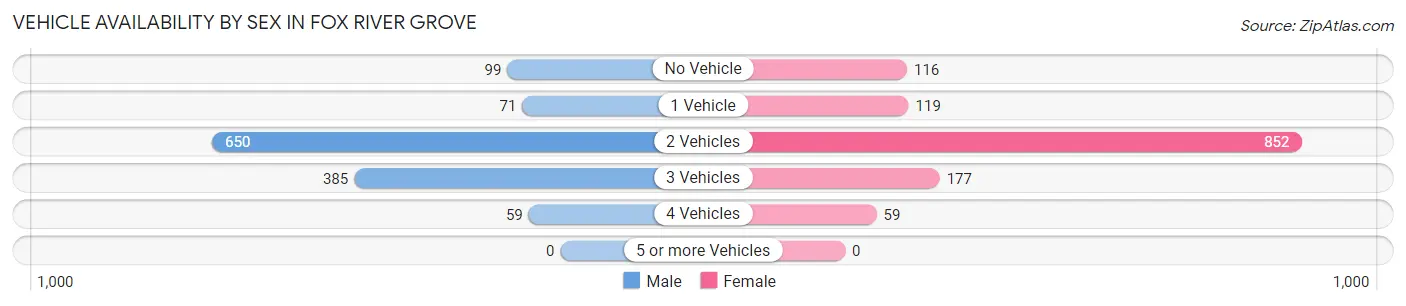
| Vehicles Available | Male | Female |
| No Vehicle | 99 (7.8%) | 116 (8.8%) |
| 1 Vehicle | 71 (5.6%) | 119 (9.0%) |
| 2 Vehicles | 650 (51.4%) | 852 (64.4%) |
| 3 Vehicles | 385 (30.5%) | 177 (13.4%) |
| 4 Vehicles | 59 (4.7%) | 59 (4.5%) |
| 5 or more Vehicles | 0 (0.0%) | 0 (0.0%) |
| Total | 1,264 (100.0%) | 1,323 (100.0%) |
Commute Time in Fox River Grove
The most frequently occuring commute durations in Fox River Grove are 20 to 24 minutes (403 commuters, 19.8%), 60 to 89 minutes (337 commuters, 16.6%), and 45 to 59 minutes (293 commuters, 14.4%).
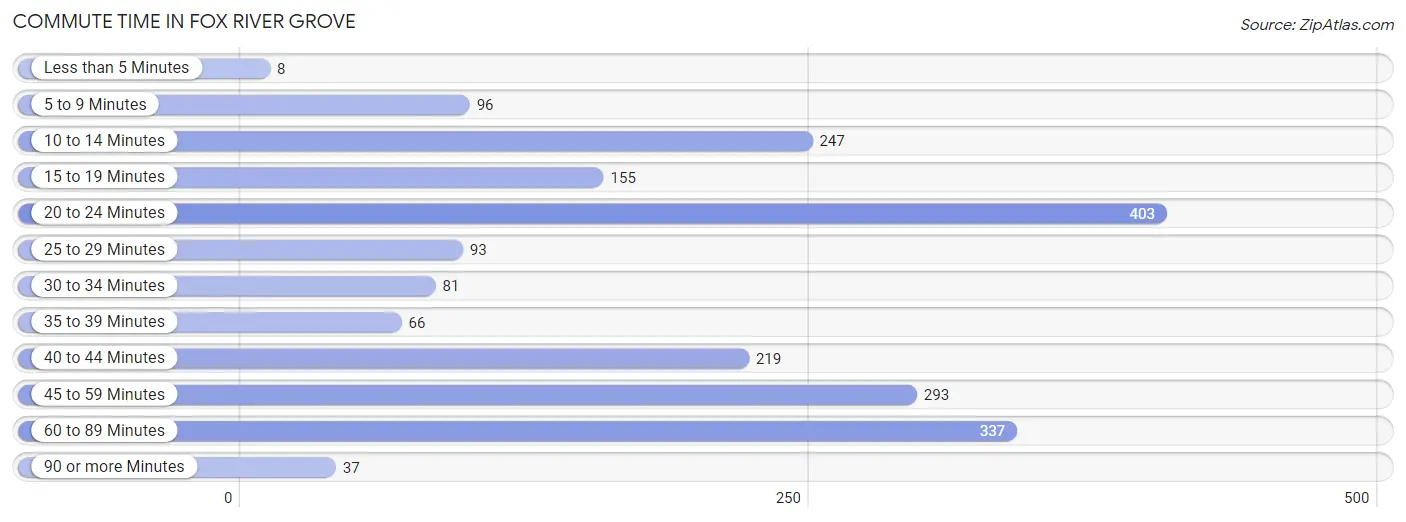
| Commute Time | # Commuters | % Commuters |
| Less than 5 Minutes | 8 | 0.4% |
| 5 to 9 Minutes | 96 | 4.7% |
| 10 to 14 Minutes | 247 | 12.1% |
| 15 to 19 Minutes | 155 | 7.6% |
| 20 to 24 Minutes | 403 | 19.8% |
| 25 to 29 Minutes | 93 | 4.6% |
| 30 to 34 Minutes | 81 | 4.0% |
| 35 to 39 Minutes | 66 | 3.2% |
| 40 to 44 Minutes | 219 | 10.8% |
| 45 to 59 Minutes | 293 | 14.4% |
| 60 to 89 Minutes | 337 | 16.6% |
| 90 or more Minutes | 37 | 1.8% |
Commute Time by Sex in Fox River Grove
The most common commute times in Fox River Grove are 45 to 59 minutes (273 commuters, 25.8%) for males and 60 to 89 minutes (253 commuters, 25.9%) for females.
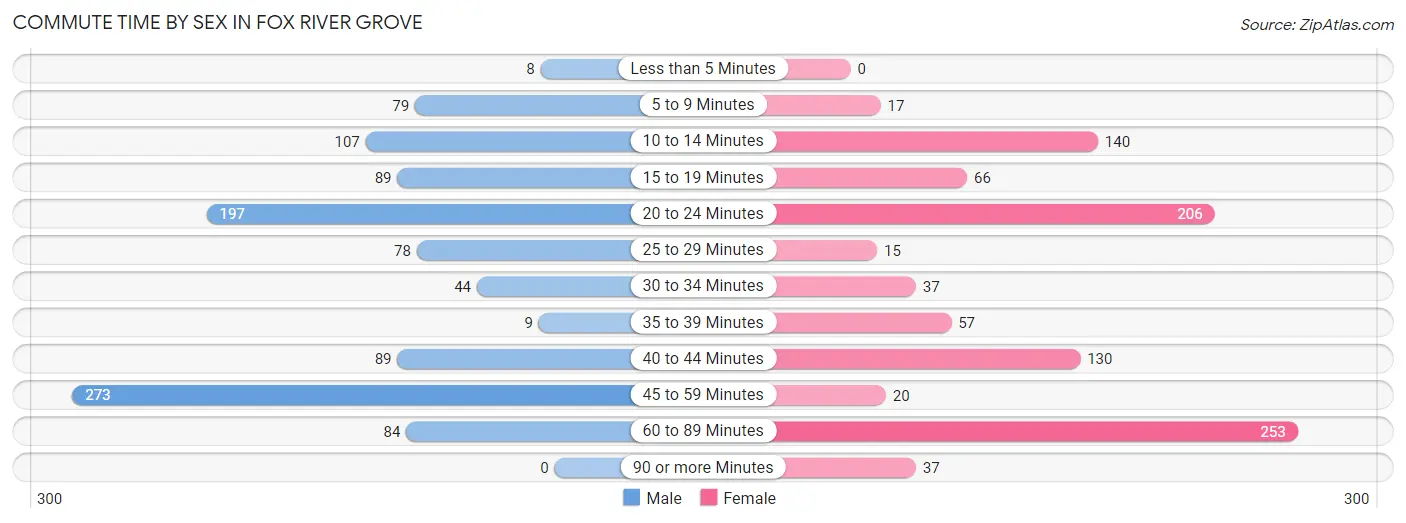
| Commute Time | Male | Female |
| Less than 5 Minutes | 8 (0.8%) | 0 (0.0%) |
| 5 to 9 Minutes | 79 (7.5%) | 17 (1.7%) |
| 10 to 14 Minutes | 107 (10.1%) | 140 (14.3%) |
| 15 to 19 Minutes | 89 (8.4%) | 66 (6.8%) |
| 20 to 24 Minutes | 197 (18.6%) | 206 (21.1%) |
| 25 to 29 Minutes | 78 (7.4%) | 15 (1.5%) |
| 30 to 34 Minutes | 44 (4.2%) | 37 (3.8%) |
| 35 to 39 Minutes | 9 (0.9%) | 57 (5.8%) |
| 40 to 44 Minutes | 89 (8.4%) | 130 (13.3%) |
| 45 to 59 Minutes | 273 (25.8%) | 20 (2.0%) |
| 60 to 89 Minutes | 84 (8.0%) | 253 (25.9%) |
| 90 or more Minutes | 0 (0.0%) | 37 (3.8%) |
Time of Departure to Work by Sex in Fox River Grove
The most frequent times of departure to work in Fox River Grove are 7:00 AM to 7:29 AM (295, 27.9%) for males and 7:30 AM to 7:59 AM (198, 20.3%) for females.
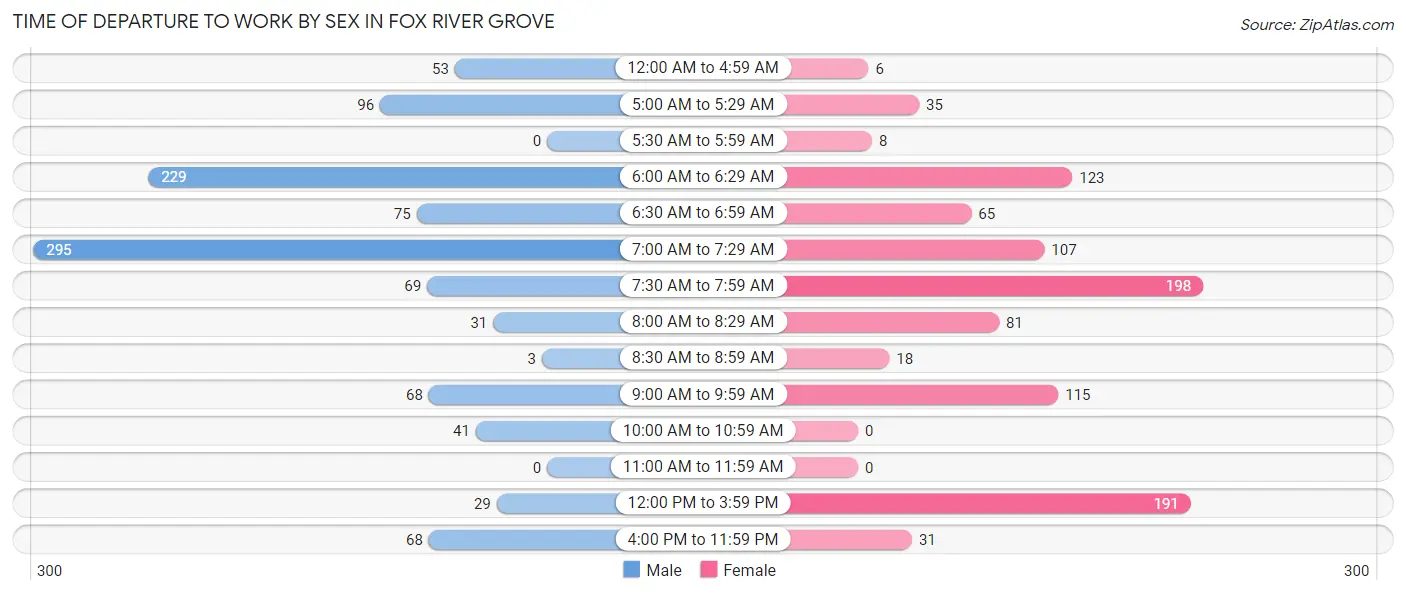
| Time of Departure | Male | Female |
| 12:00 AM to 4:59 AM | 53 (5.0%) | 6 (0.6%) |
| 5:00 AM to 5:29 AM | 96 (9.1%) | 35 (3.6%) |
| 5:30 AM to 5:59 AM | 0 (0.0%) | 8 (0.8%) |
| 6:00 AM to 6:29 AM | 229 (21.7%) | 123 (12.6%) |
| 6:30 AM to 6:59 AM | 75 (7.1%) | 65 (6.7%) |
| 7:00 AM to 7:29 AM | 295 (27.9%) | 107 (10.9%) |
| 7:30 AM to 7:59 AM | 69 (6.5%) | 198 (20.3%) |
| 8:00 AM to 8:29 AM | 31 (2.9%) | 81 (8.3%) |
| 8:30 AM to 8:59 AM | 3 (0.3%) | 18 (1.8%) |
| 9:00 AM to 9:59 AM | 68 (6.4%) | 115 (11.8%) |
| 10:00 AM to 10:59 AM | 41 (3.9%) | 0 (0.0%) |
| 11:00 AM to 11:59 AM | 0 (0.0%) | 0 (0.0%) |
| 12:00 PM to 3:59 PM | 29 (2.7%) | 191 (19.5%) |
| 4:00 PM to 11:59 PM | 68 (6.4%) | 31 (3.2%) |
| Total | 1,057 (100.0%) | 978 (100.0%) |
Housing Occupancy in Fox River Grove
Occupancy by Ownership in Fox River Grove
Of the total 1,719 dwellings in Fox River Grove, owner-occupied units account for 1,413 (82.2%), while renter-occupied units make up 306 (17.8%).
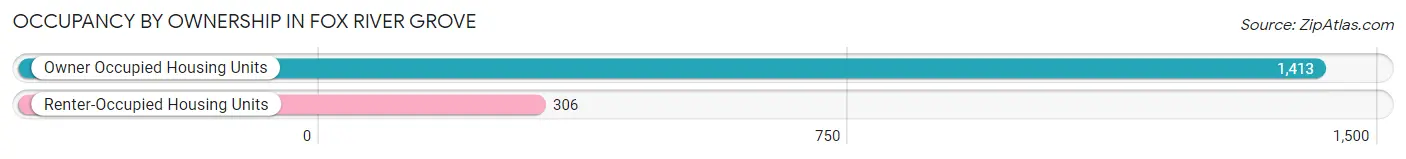
| Occupancy | # Housing Units | % Housing Units |
| Owner Occupied Housing Units | 1,413 | 82.2% |
| Renter-Occupied Housing Units | 306 | 17.8% |
| Total Occupied Housing Units | 1,719 | 100.0% |
Occupancy by Household Size in Fox River Grove
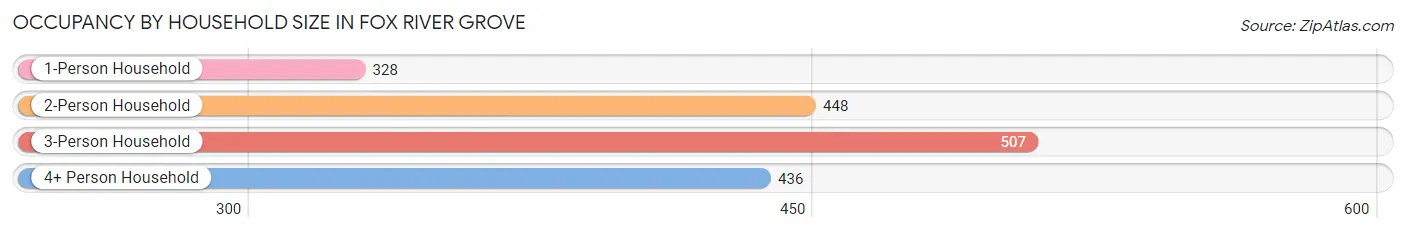
| Household Size | # Housing Units | % Housing Units |
| 1-Person Household | 328 | 19.1% |
| 2-Person Household | 448 | 26.1% |
| 3-Person Household | 507 | 29.5% |
| 4+ Person Household | 436 | 25.4% |
| Total Housing Units | 1,719 | 100.0% |
Occupancy by Ownership by Household Size in Fox River Grove
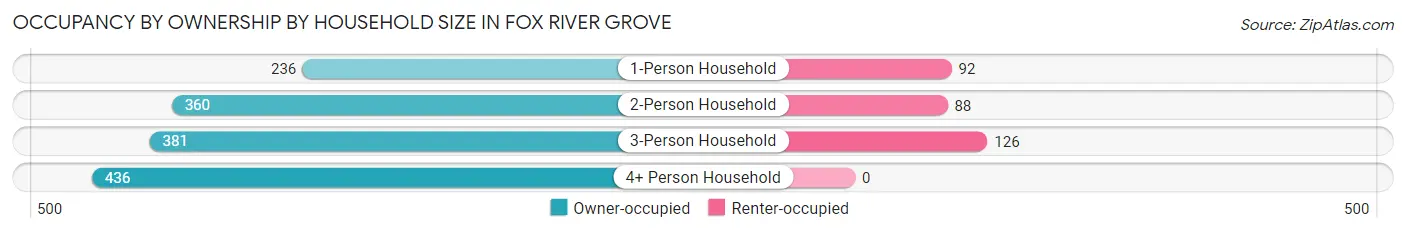
| Household Size | Owner-occupied | Renter-occupied |
| 1-Person Household | 236 (72.0%) | 92 (28.1%) |
| 2-Person Household | 360 (80.4%) | 88 (19.6%) |
| 3-Person Household | 381 (75.1%) | 126 (24.8%) |
| 4+ Person Household | 436 (100.0%) | 0 (0.0%) |
| Total Housing Units | 1,413 (82.2%) | 306 (17.8%) |
Occupancy by Educational Attainment in Fox River Grove
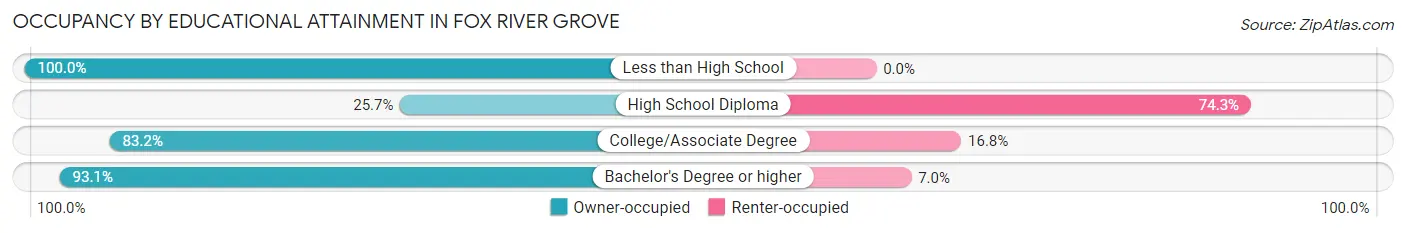
| Household Size | Owner-occupied | Renter-occupied |
| Less than High School | 19 (100.0%) | 0 (0.0%) |
| High School Diploma | 54 (25.7%) | 156 (74.3%) |
| College/Associate Degree | 390 (83.2%) | 79 (16.8%) |
| Bachelor's Degree or higher | 950 (93.0%) | 71 (7.0%) |
Occupancy by Age of Householder in Fox River Grove
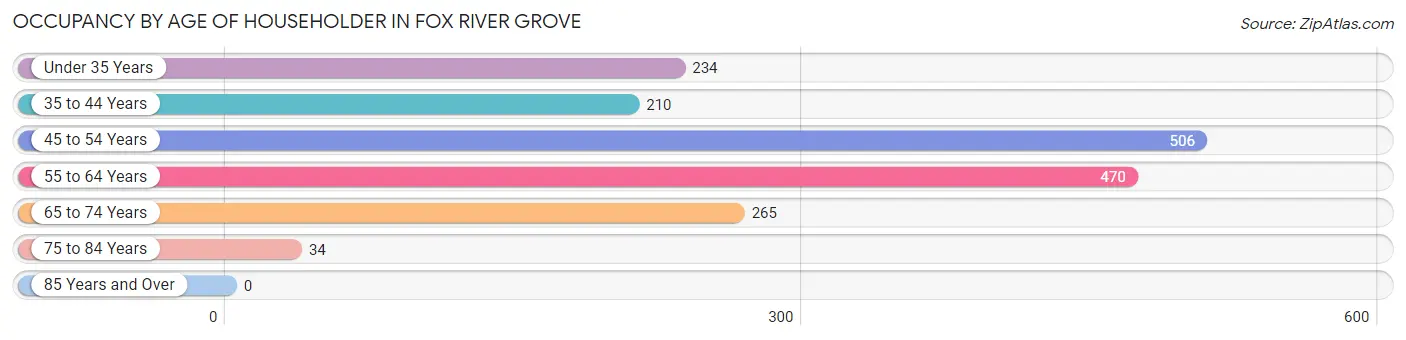
| Age Bracket | # Households | % Households |
| Under 35 Years | 234 | 13.6% |
| 35 to 44 Years | 210 | 12.2% |
| 45 to 54 Years | 506 | 29.4% |
| 55 to 64 Years | 470 | 27.3% |
| 65 to 74 Years | 265 | 15.4% |
| 75 to 84 Years | 34 | 2.0% |
| 85 Years and Over | 0 | 0.0% |
| Total | 1,719 | 100.0% |
Housing Finances in Fox River Grove
Median Income by Occupancy in Fox River Grove
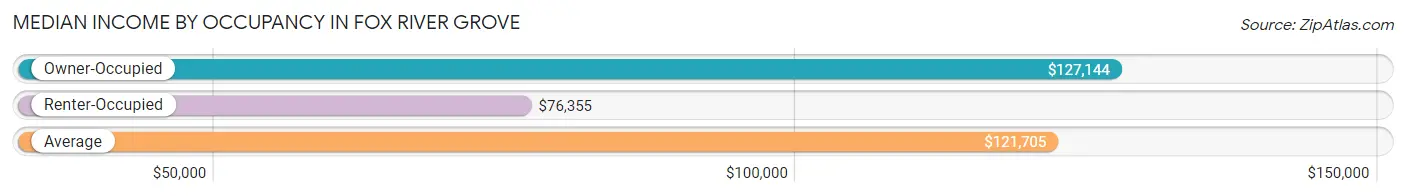
| Occupancy Type | # Households | Median Income |
| Owner-Occupied | 1,413 (82.2%) | $127,144 |
| Renter-Occupied | 306 (17.8%) | $76,355 |
| Average | 1,719 (100.0%) | $121,705 |
Occupancy by Householder Income Bracket in Fox River Grove
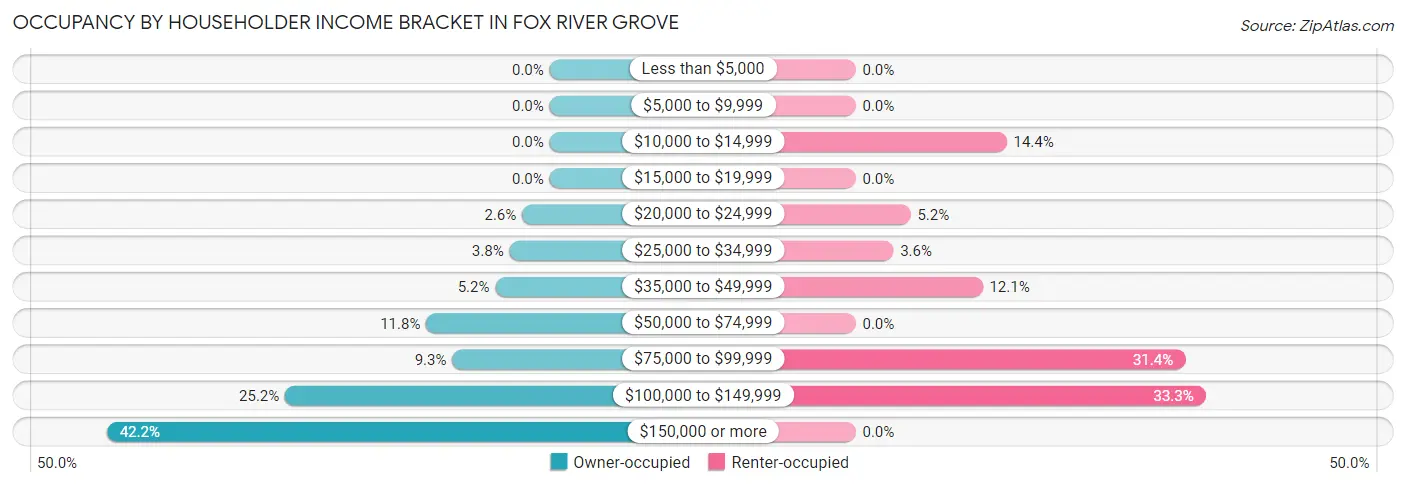
| Income Bracket | Owner-occupied | Renter-occupied |
| Less than $5,000 | 0 (0.0%) | 0 (0.0%) |
| $5,000 to $9,999 | 0 (0.0%) | 0 (0.0%) |
| $10,000 to $14,999 | 0 (0.0%) | 44 (14.4%) |
| $15,000 to $19,999 | 0 (0.0%) | 0 (0.0%) |
| $20,000 to $24,999 | 37 (2.6%) | 16 (5.2%) |
| $25,000 to $34,999 | 54 (3.8%) | 11 (3.6%) |
| $35,000 to $49,999 | 73 (5.2%) | 37 (12.1%) |
| $50,000 to $74,999 | 166 (11.7%) | 0 (0.0%) |
| $75,000 to $99,999 | 131 (9.3%) | 96 (31.4%) |
| $100,000 to $149,999 | 356 (25.2%) | 102 (33.3%) |
| $150,000 or more | 596 (42.2%) | 0 (0.0%) |
| Total | 1,413 (100.0%) | 306 (100.0%) |
Monthly Housing Cost Tiers in Fox River Grove
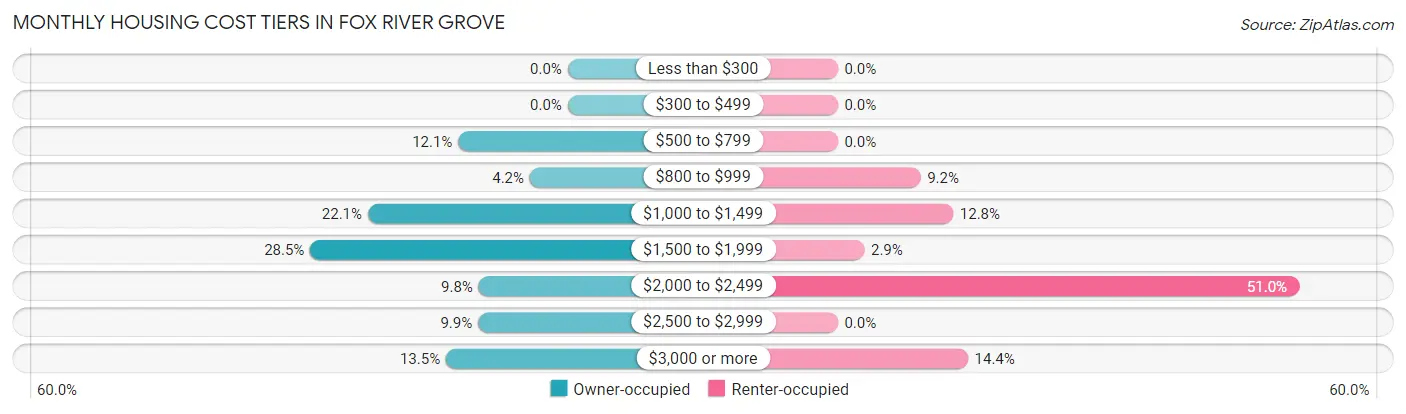
| Monthly Cost | Owner-occupied | Renter-occupied |
| Less than $300 | 0 (0.0%) | 0 (0.0%) |
| $300 to $499 | 0 (0.0%) | 0 (0.0%) |
| $500 to $799 | 171 (12.1%) | 0 (0.0%) |
| $800 to $999 | 59 (4.2%) | 28 (9.1%) |
| $1,000 to $1,499 | 312 (22.1%) | 39 (12.8%) |
| $1,500 to $1,999 | 402 (28.4%) | 9 (2.9%) |
| $2,000 to $2,499 | 139 (9.8%) | 156 (51.0%) |
| $2,500 to $2,999 | 140 (9.9%) | 0 (0.0%) |
| $3,000 or more | 190 (13.5%) | 44 (14.4%) |
| Total | 1,413 (100.0%) | 306 (100.0%) |
Physical Housing Characteristics in Fox River Grove
Housing Structures in Fox River Grove
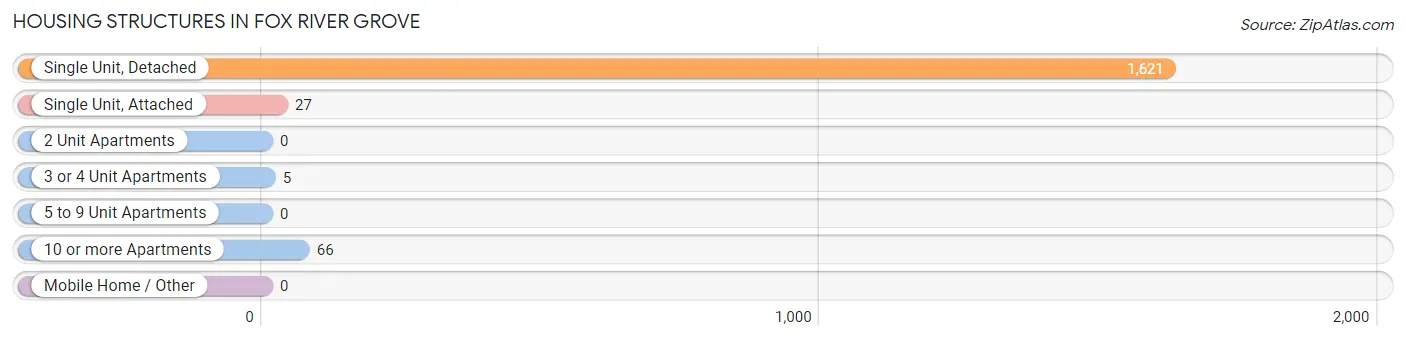
| Structure Type | # Housing Units | % Housing Units |
| Single Unit, Detached | 1,621 | 94.3% |
| Single Unit, Attached | 27 | 1.6% |
| 2 Unit Apartments | 0 | 0.0% |
| 3 or 4 Unit Apartments | 5 | 0.3% |
| 5 to 9 Unit Apartments | 0 | 0.0% |
| 10 or more Apartments | 66 | 3.8% |
| Mobile Home / Other | 0 | 0.0% |
| Total | 1,719 | 100.0% |
Housing Structures by Occupancy in Fox River Grove
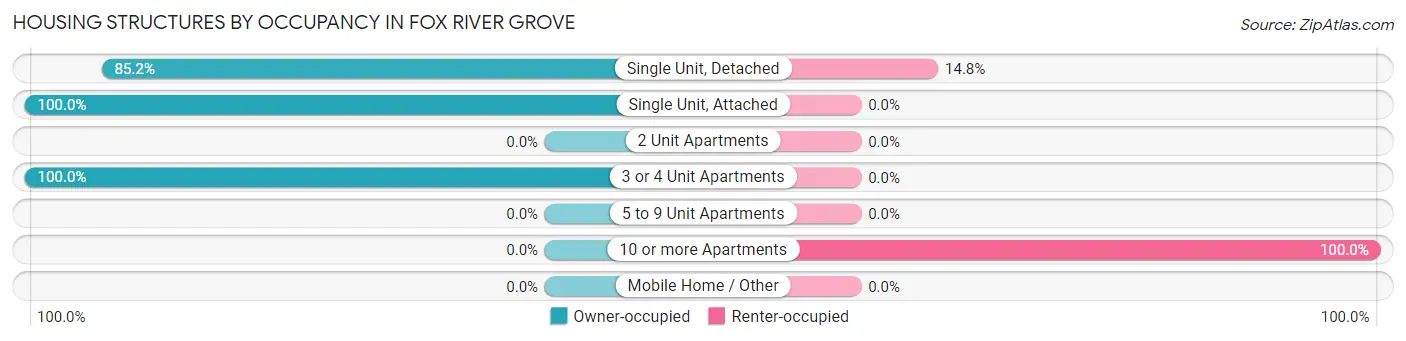
| Structure Type | Owner-occupied | Renter-occupied |
| Single Unit, Detached | 1,381 (85.2%) | 240 (14.8%) |
| Single Unit, Attached | 27 (100.0%) | 0 (0.0%) |
| 2 Unit Apartments | 0 (0.0%) | 0 (0.0%) |
| 3 or 4 Unit Apartments | 5 (100.0%) | 0 (0.0%) |
| 5 to 9 Unit Apartments | 0 (0.0%) | 0 (0.0%) |
| 10 or more Apartments | 0 (0.0%) | 66 (100.0%) |
| Mobile Home / Other | 0 (0.0%) | 0 (0.0%) |
| Total | 1,413 (82.2%) | 306 (17.8%) |
Housing Structures by Number of Rooms in Fox River Grove
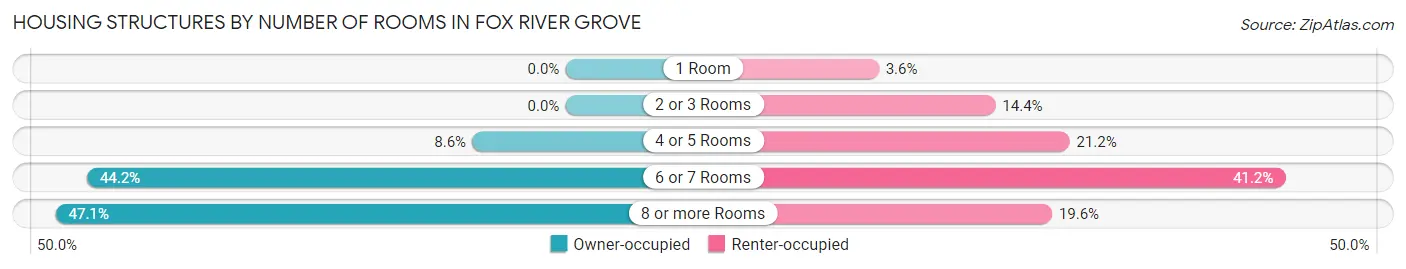
| Number of Rooms | Owner-occupied | Renter-occupied |
| 1 Room | 0 (0.0%) | 11 (3.6%) |
| 2 or 3 Rooms | 0 (0.0%) | 44 (14.4%) |
| 4 or 5 Rooms | 122 (8.6%) | 65 (21.2%) |
| 6 or 7 Rooms | 625 (44.2%) | 126 (41.2%) |
| 8 or more Rooms | 666 (47.1%) | 60 (19.6%) |
| Total | 1,413 (100.0%) | 306 (100.0%) |
Housing Structure by Heating Type in Fox River Grove
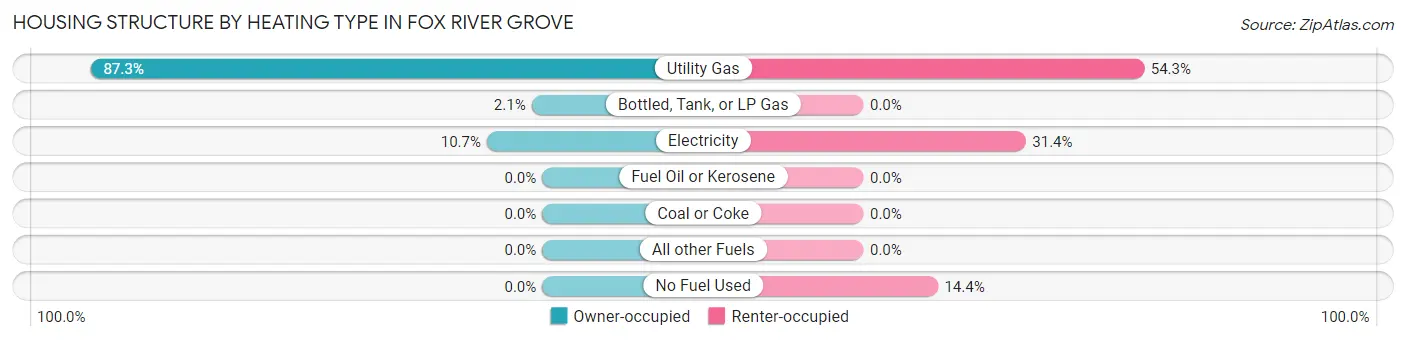
| Heating Type | Owner-occupied | Renter-occupied |
| Utility Gas | 1,233 (87.3%) | 166 (54.2%) |
| Bottled, Tank, or LP Gas | 29 (2.1%) | 0 (0.0%) |
| Electricity | 151 (10.7%) | 96 (31.4%) |
| Fuel Oil or Kerosene | 0 (0.0%) | 0 (0.0%) |
| Coal or Coke | 0 (0.0%) | 0 (0.0%) |
| All other Fuels | 0 (0.0%) | 0 (0.0%) |
| No Fuel Used | 0 (0.0%) | 44 (14.4%) |
| Total | 1,413 (100.0%) | 306 (100.0%) |
Household Vehicle Usage in Fox River Grove
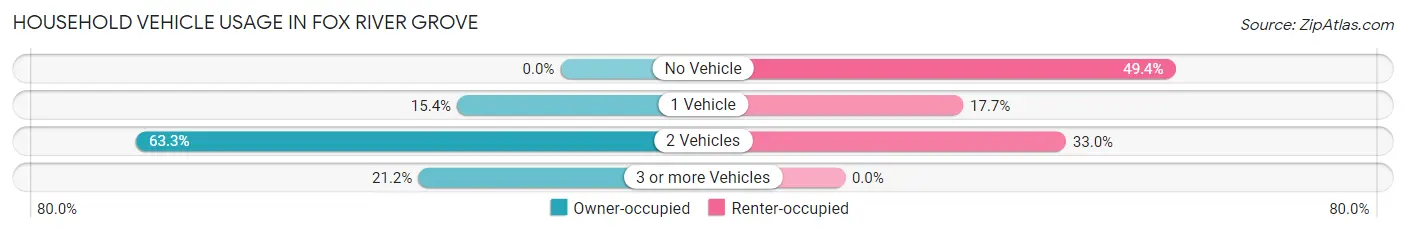
| Vehicles per Household | Owner-occupied | Renter-occupied |
| No Vehicle | 0 (0.0%) | 151 (49.3%) |
| 1 Vehicle | 218 (15.4%) | 54 (17.6%) |
| 2 Vehicles | 895 (63.3%) | 101 (33.0%) |
| 3 or more Vehicles | 300 (21.2%) | 0 (0.0%) |
| Total | 1,413 (100.0%) | 306 (100.0%) |
Real Estate & Mortgages in Fox River Grove
Real Estate and Mortgage Overview in Fox River Grove
| Characteristic | Without Mortgage | With Mortgage |
| Housing Units | 409 | 1,004 |
| Median Property Value | $261,500 | $245,400 |
| Median Household Income | - | - |
| Monthly Housing Costs | $998 | $190 |
| Real Estate Taxes | $8,028 | $120 |
Property Value by Mortgage Status in Fox River Grove
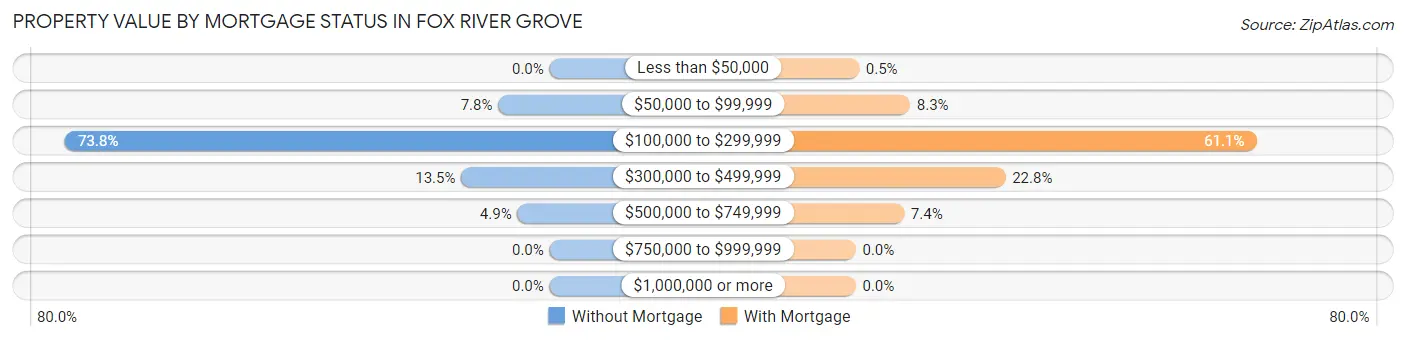
| Property Value | Without Mortgage | With Mortgage |
| Less than $50,000 | 0 (0.0%) | 5 (0.5%) |
| $50,000 to $99,999 | 32 (7.8%) | 83 (8.3%) |
| $100,000 to $299,999 | 302 (73.8%) | 613 (61.1%) |
| $300,000 to $499,999 | 55 (13.5%) | 229 (22.8%) |
| $500,000 to $749,999 | 20 (4.9%) | 74 (7.4%) |
| $750,000 to $999,999 | 0 (0.0%) | 0 (0.0%) |
| $1,000,000 or more | 0 (0.0%) | 0 (0.0%) |
| Total | 409 (100.0%) | 1,004 (100.0%) |
Household Income by Mortgage Status in Fox River Grove
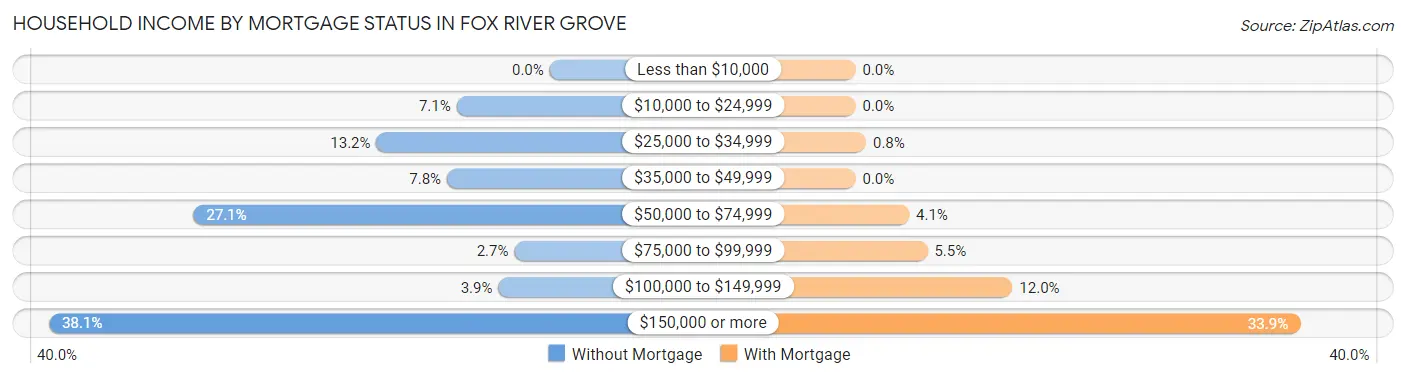
| Household Income | Without Mortgage | With Mortgage |
| Less than $10,000 | 0 (0.0%) | 0 (0.0%) |
| $10,000 to $24,999 | 29 (7.1%) | 0 (0.0%) |
| $25,000 to $34,999 | 54 (13.2%) | 8 (0.8%) |
| $35,000 to $49,999 | 32 (7.8%) | 0 (0.0%) |
| $50,000 to $74,999 | 111 (27.1%) | 41 (4.1%) |
| $75,000 to $99,999 | 11 (2.7%) | 55 (5.5%) |
| $100,000 to $149,999 | 16 (3.9%) | 120 (11.9%) |
| $150,000 or more | 156 (38.1%) | 340 (33.9%) |
| Total | 409 (100.0%) | 1,004 (100.0%) |
Property Value to Household Income Ratio in Fox River Grove
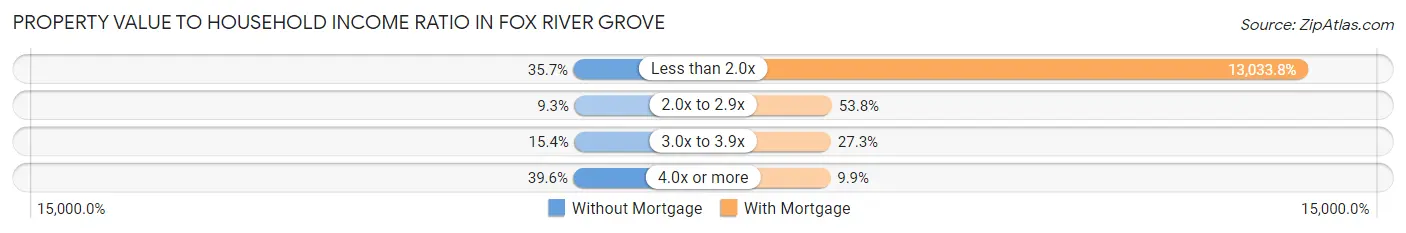
| Value-to-Income Ratio | Without Mortgage | With Mortgage |
| Less than 2.0x | 146 (35.7%) | 130,859 (13,033.8%) |
| 2.0x to 2.9x | 38 (9.3%) | 540 (53.8%) |
| 3.0x to 3.9x | 63 (15.4%) | 274 (27.3%) |
| 4.0x or more | 162 (39.6%) | 99 (9.9%) |
| Total | 409 (100.0%) | 1,004 (100.0%) |
Real Estate Taxes by Mortgage Status in Fox River Grove
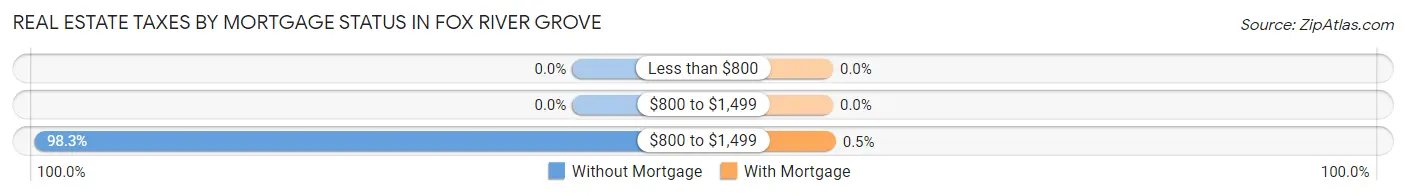
| Property Taxes | Without Mortgage | With Mortgage |
| Less than $800 | 0 (0.0%) | 0 (0.0%) |
| $800 to $1,499 | 0 (0.0%) | 0 (0.0%) |
| $800 to $1,499 | 402 (98.3%) | 5 (0.5%) |
| Total | 409 (100.0%) | 1,004 (100.0%) |
Health & Disability in Fox River Grove
Health Insurance Coverage by Age in Fox River Grove
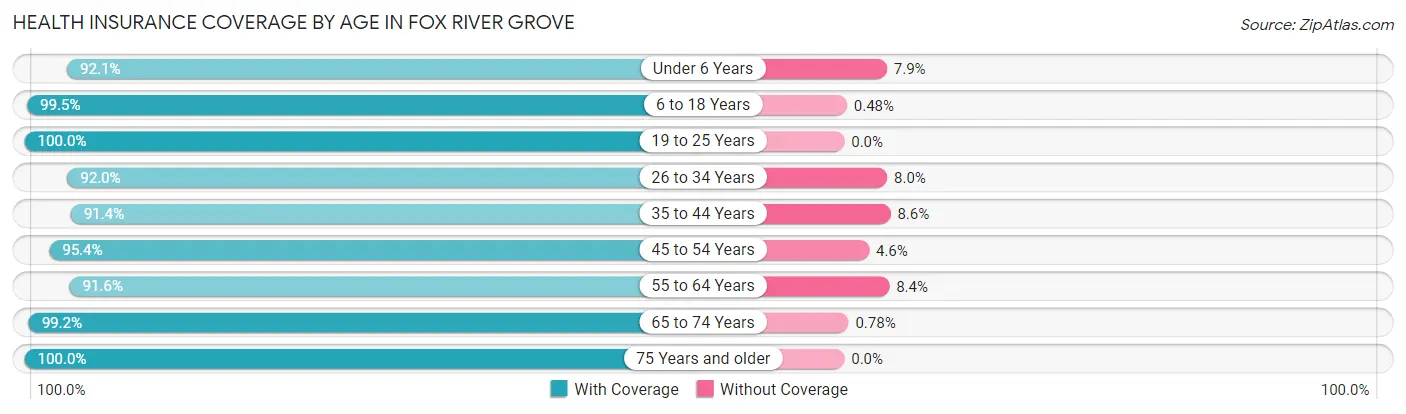
| Age Bracket | With Coverage | Without Coverage |
| Under 6 Years | 232 (92.1%) | 20 (7.9%) |
| 6 to 18 Years | 832 (99.5%) | 4 (0.5%) |
| 19 to 25 Years | 232 (100.0%) | 0 (0.0%) |
| 26 to 34 Years | 611 (92.0%) | 53 (8.0%) |
| 35 to 44 Years | 584 (91.4%) | 55 (8.6%) |
| 45 to 54 Years | 724 (95.4%) | 35 (4.6%) |
| 55 to 64 Years | 634 (91.6%) | 58 (8.4%) |
| 65 to 74 Years | 381 (99.2%) | 3 (0.8%) |
| 75 Years and older | 142 (100.0%) | 0 (0.0%) |
| Total | 4,372 (95.0%) | 228 (5.0%) |
Health Insurance Coverage by Citizenship Status in Fox River Grove
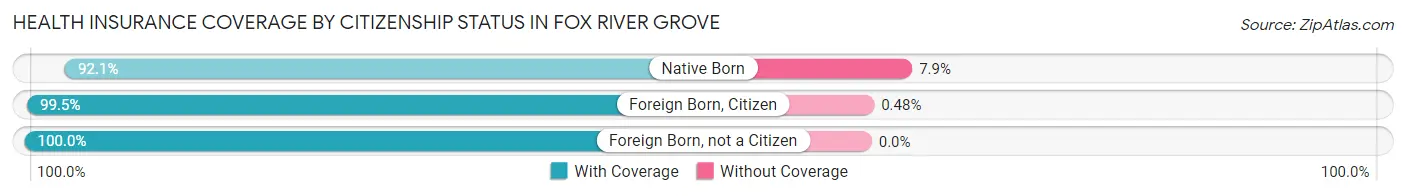
| Citizenship Status | With Coverage | Without Coverage |
| Native Born | 232 (92.1%) | 20 (7.9%) |
| Foreign Born, Citizen | 832 (99.5%) | 4 (0.5%) |
| Foreign Born, not a Citizen | 232 (100.0%) | 0 (0.0%) |
Health Insurance Coverage by Household Income in Fox River Grove
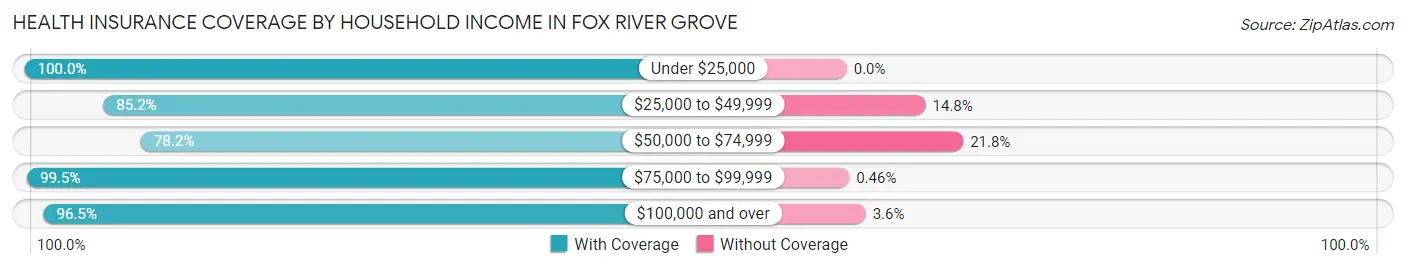
| Household Income | With Coverage | Without Coverage |
| Under $25,000 | 97 (100.0%) | 0 (0.0%) |
| $25,000 to $49,999 | 225 (85.2%) | 39 (14.8%) |
| $50,000 to $74,999 | 251 (78.2%) | 70 (21.8%) |
| $75,000 to $99,999 | 649 (99.5%) | 3 (0.5%) |
| $100,000 and over | 3,150 (96.5%) | 116 (3.5%) |
Public vs Private Health Insurance Coverage by Age in Fox River Grove
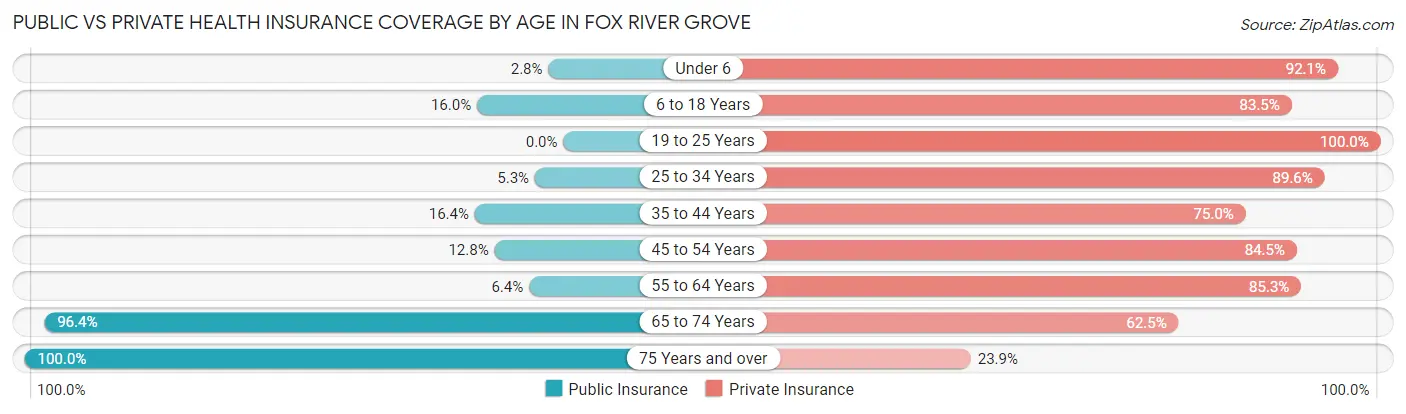
| Age Bracket | Public Insurance | Private Insurance |
| Under 6 | 7 (2.8%) | 232 (92.1%) |
| 6 to 18 Years | 134 (16.0%) | 698 (83.5%) |
| 19 to 25 Years | 0 (0.0%) | 232 (100.0%) |
| 25 to 34 Years | 35 (5.3%) | 595 (89.6%) |
| 35 to 44 Years | 105 (16.4%) | 479 (75.0%) |
| 45 to 54 Years | 97 (12.8%) | 641 (84.5%) |
| 55 to 64 Years | 44 (6.4%) | 590 (85.3%) |
| 65 to 74 Years | 370 (96.4%) | 240 (62.5%) |
| 75 Years and over | 142 (100.0%) | 34 (23.9%) |
| Total | 934 (20.3%) | 3,741 (81.3%) |
Disability Status by Sex by Age in Fox River Grove
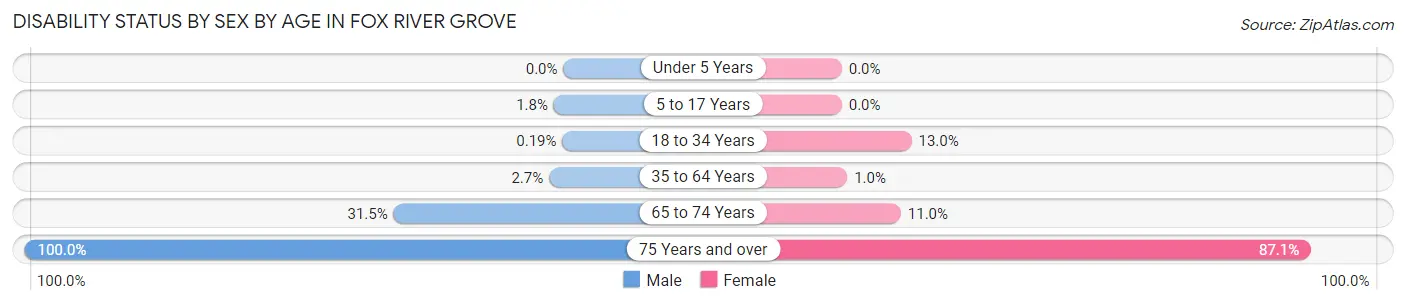
| Age Bracket | Male | Female |
| Under 5 Years | 0 (0.0%) | 0 (0.0%) |
| 5 to 17 Years | 8 (1.8%) | 0 (0.0%) |
| 18 to 34 Years | 1 (0.2%) | 57 (13.0%) |
| 35 to 64 Years | 24 (2.6%) | 12 (1.0%) |
| 65 to 74 Years | 52 (31.5%) | 24 (11.0%) |
| 75 Years and over | 18 (100.0%) | 108 (87.1%) |
Disability Class by Sex by Age in Fox River Grove
Disability Class: Hearing Difficulty
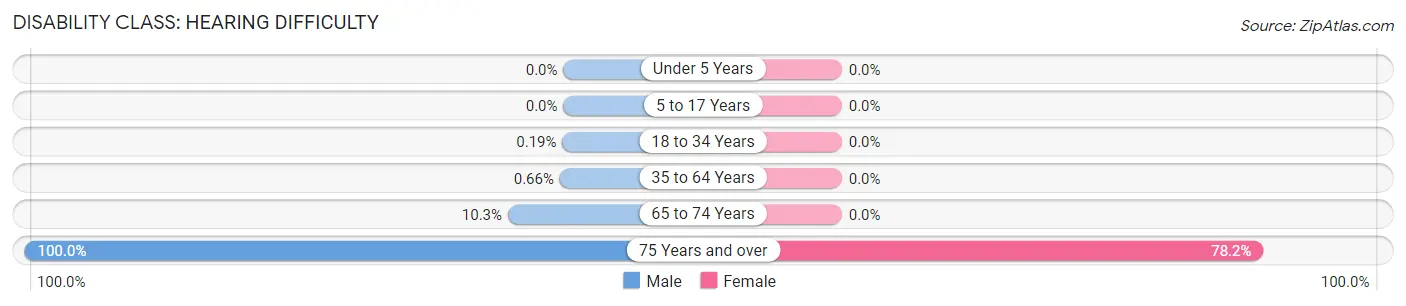
| Age Bracket | Male | Female |
| Under 5 Years | 0 (0.0%) | 0 (0.0%) |
| 5 to 17 Years | 0 (0.0%) | 0 (0.0%) |
| 18 to 34 Years | 1 (0.2%) | 0 (0.0%) |
| 35 to 64 Years | 6 (0.7%) | 0 (0.0%) |
| 65 to 74 Years | 17 (10.3%) | 0 (0.0%) |
| 75 Years and over | 18 (100.0%) | 97 (78.2%) |
Disability Class: Vision Difficulty
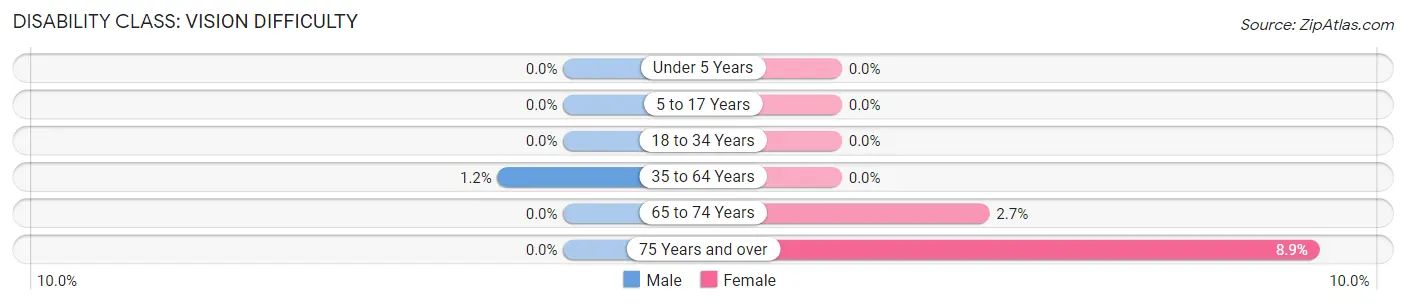
| Age Bracket | Male | Female |
| Under 5 Years | 0 (0.0%) | 0 (0.0%) |
| 5 to 17 Years | 0 (0.0%) | 0 (0.0%) |
| 18 to 34 Years | 0 (0.0%) | 0 (0.0%) |
| 35 to 64 Years | 11 (1.2%) | 0 (0.0%) |
| 65 to 74 Years | 0 (0.0%) | 6 (2.7%) |
| 75 Years and over | 0 (0.0%) | 11 (8.9%) |
Disability Class: Cognitive Difficulty
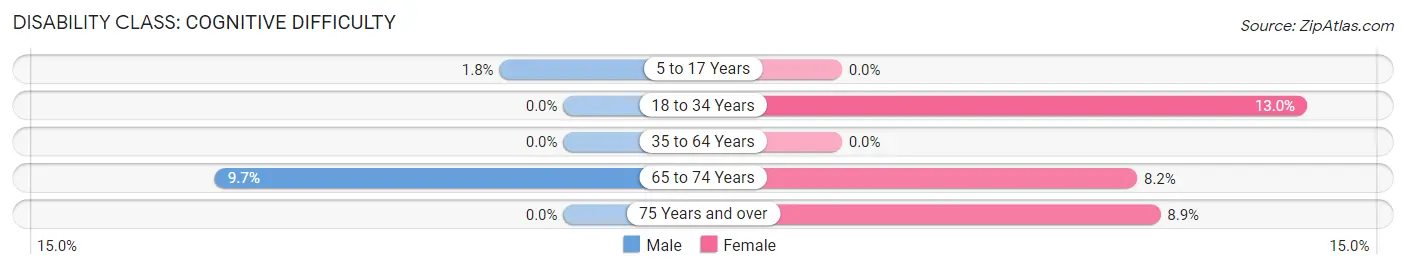
| Age Bracket | Male | Female |
| 5 to 17 Years | 8 (1.8%) | 0 (0.0%) |
| 18 to 34 Years | 0 (0.0%) | 57 (13.0%) |
| 35 to 64 Years | 0 (0.0%) | 0 (0.0%) |
| 65 to 74 Years | 16 (9.7%) | 18 (8.2%) |
| 75 Years and over | 0 (0.0%) | 11 (8.9%) |
Disability Class: Ambulatory Difficulty
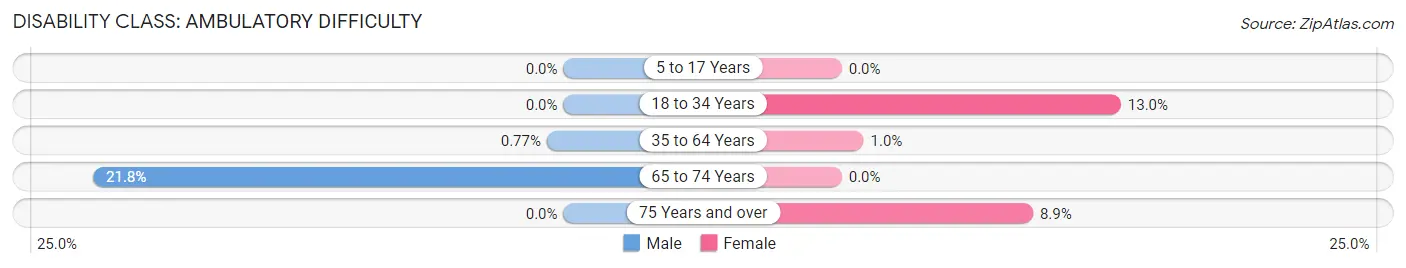
| Age Bracket | Male | Female |
| 5 to 17 Years | 0 (0.0%) | 0 (0.0%) |
| 18 to 34 Years | 0 (0.0%) | 57 (13.0%) |
| 35 to 64 Years | 7 (0.8%) | 12 (1.0%) |
| 65 to 74 Years | 36 (21.8%) | 0 (0.0%) |
| 75 Years and over | 0 (0.0%) | 11 (8.9%) |
Disability Class: Self-Care Difficulty
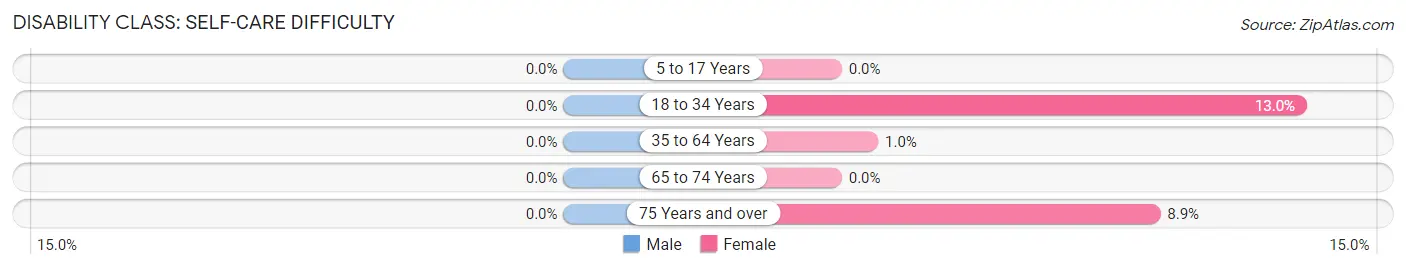
| Age Bracket | Male | Female |
| 5 to 17 Years | 0 (0.0%) | 0 (0.0%) |
| 18 to 34 Years | 0 (0.0%) | 57 (13.0%) |
| 35 to 64 Years | 0 (0.0%) | 12 (1.0%) |
| 65 to 74 Years | 0 (0.0%) | 0 (0.0%) |
| 75 Years and over | 0 (0.0%) | 11 (8.9%) |
Technology Access in Fox River Grove
Computing Device Access in Fox River Grove
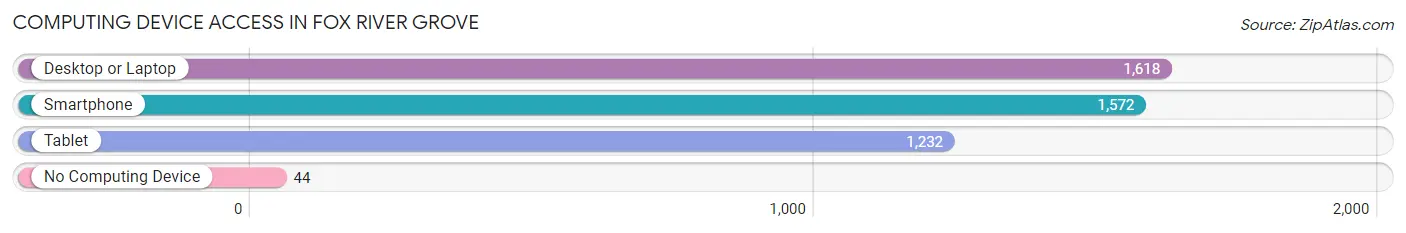
| Device Type | # Households | % Households |
| Desktop or Laptop | 1,618 | 94.1% |
| Smartphone | 1,572 | 91.4% |
| Tablet | 1,232 | 71.7% |
| No Computing Device | 44 | 2.6% |
| Total | 1,719 | 100.0% |
Internet Access in Fox River Grove
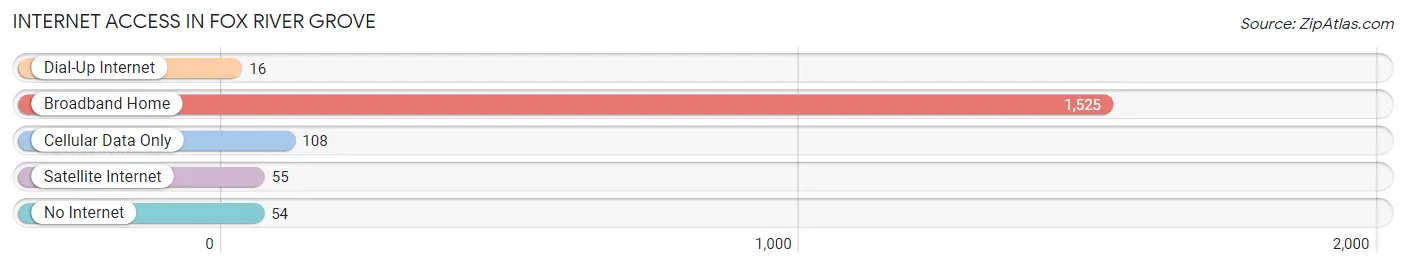
| Internet Type | # Households | % Households |
| Dial-Up Internet | 16 | 0.9% |
| Broadband Home | 1,525 | 88.7% |
| Cellular Data Only | 108 | 6.3% |
| Satellite Internet | 55 | 3.2% |
| No Internet | 54 | 3.1% |
| Total | 1,719 | 100.0% |
Fox River Grove Summary
River Grove, Illinois is a small village located in McHenry County, Illinois, United States. It is situated on the Fox River, approximately 40 miles northwest of Chicago. The village has a population of approximately 5,000 people and covers an area of 1.6 square miles.
History
The area that is now River Grove was first settled in the early 1800s by settlers from New England. The first settlers were primarily farmers, and the area was known as “Fox River Settlement”. In 1854, the village was officially incorporated as the Village of Fox River Grove.
The village was named after the Fox River, which runs through the area. The river was named by French explorers in the late 1600s, who named it after the foxes they saw in the area.
The village grew slowly over the years, and by the early 1900s, it had become a popular summer resort destination. The village was known for its beautiful scenery and its many recreational activities, such as fishing, boating, and swimming.
In the 1950s, the village began to experience rapid growth as more people moved to the area. This growth was fueled by the construction of the Northwest Tollway, which made it easier for people to commute to Chicago.
Geography
River Grove is located in McHenry County, Illinois, approximately 40 miles northwest of Chicago. The village covers an area of 1.6 square miles and is situated on the Fox River. The village is bordered by the villages of Barrington, Cary, and Fox River Valley.
The village is located in a hilly area, with the highest point being the Fox River Valley. The village is also home to several parks, including the Fox River Grove Park, which features a playground, picnic area, and walking trails.
Economy
The economy of River Grove is largely based on the service industry. The village is home to several restaurants, retail stores, and other businesses. The village is also home to several manufacturing companies, including a plastics manufacturer and a printing company.
The village is also home to several educational institutions, including a public elementary school, a middle school, and a high school.
Demographics
As of the 2010 census, the population of River Grove was 5,000. The racial makeup of the village was 94.3% White, 1.2% African American, 0.3% Native American, 1.2% Asian, and 2.9% from other races.
The median household income in River Grove was $63,750, and the median family income was $76,250. The per capita income was $30,945.
Conclusion
River Grove is a small village located in McHenry County, Illinois, approximately 40 miles northwest of Chicago. The village has a population of approximately 5,000 people and covers an area of 1.6 square miles. The economy of River Grove is largely based on the service industry, and the village is home to several educational institutions. The racial makeup of the village is 94.3% White, 1.2% African American, 0.3% Native American, 1.2% Asian, and 2.9% from other races. The median household income in River Grove was $63,750, and the median family income was $76,250.
Common Questions
What is Per Capita Income in Fox River Grove?
Per Capita income in Fox River Grove is $48,358.
What is the Median Family Income in Fox River Grove?
Median Family Income in Fox River Grove is $126,104.
What is the Median Household income in Fox River Grove?
Median Household Income in Fox River Grove is $121,705.
What is Income or Wage Gap in Fox River Grove?
Income or Wage Gap in Fox River Grove is 19.3%.
Women in Fox River Grove earn 80.7 cents for every dollar earned by a man.
What is Inequality or Gini Index in Fox River Grove?
Inequality or Gini Index in Fox River Grove is 0.34.
What is the Total Population of Fox River Grove?
Total Population of Fox River Grove is 4,600.
What is the Total Male Population of Fox River Grove?
Total Male Population of Fox River Grove is 2,168.
What is the Total Female Population of Fox River Grove?
Total Female Population of Fox River Grove is 2,432.
What is the Ratio of Males per 100 Females in Fox River Grove?
There are 89.14 Males per 100 Females in Fox River Grove.
What is the Ratio of Females per 100 Males in Fox River Grove?
There are 112.18 Females per 100 Males in Fox River Grove.
What is the Median Population Age in Fox River Grove?
Median Population Age in Fox River Grove is 41.1 Years.
What is the Average Family Size in Fox River Grove
Average Family Size in Fox River Grove is 3.0 People.
What is the Average Household Size in Fox River Grove
Average Household Size in Fox River Grove is 2.7 People.
How Large is the Labor Force in Fox River Grove?
There are 2,702 People in the Labor Forcein in Fox River Grove.
What is the Percentage of People in the Labor Force in Fox River Grove?
71.4% of People are in the Labor Force in Fox River Grove.
What is the Unemployment Rate in Fox River Grove?
Unemployment Rate in Fox River Grove is 3.6%.