Chalfant, CA Map & Demographics
Chalfant Map
Chalfant Overview
$24,123
PER CAPITA INCOME
$72,308
AVG FAMILY INCOME
$67,857
AVG HOUSEHOLD INCOME
18.0%
WAGE / INCOME GAP [ % ]
82.0¢/ $1
WAGE / INCOME GAP [ $ ]
0.39
INEQUALITY / GINI INDEX
605
TOTAL POPULATION
318
MALE POPULATION
287
FEMALE POPULATION
110.80
MALES / 100 FEMALES
90.25
FEMALES / 100 MALES
52.3
MEDIAN AGE
3.1
AVG FAMILY SIZE
2.9
AVG HOUSEHOLD SIZE
259
LABOR FORCE [ PEOPLE ]
47.4%
PERCENT IN LABOR FORCE
10.0%
UNEMPLOYMENT RATE
Income in Chalfant
Income Overview in Chalfant
Per Capita Income in Chalfant is $24,123, while median incomes of families and households are $72,308 and $67,857 respectively.
| Characteristic | Number | Measure |
| Per Capita Income | 605 | $24,123 |
| Median Family Income | 164 | $72,308 |
| Mean Family Income | 164 | $74,616 |
| Median Household Income | 212 | $67,857 |
| Mean Household Income | 212 | $61,053 |
| Income Deficit | 164 | $0 |
| Wage / Income Gap (%) | 605 | 18.03% |
| Wage / Income Gap ($) | 605 | 81.97¢ per $1 |
| Gini / Inequality Index | 605 | 0.39 |
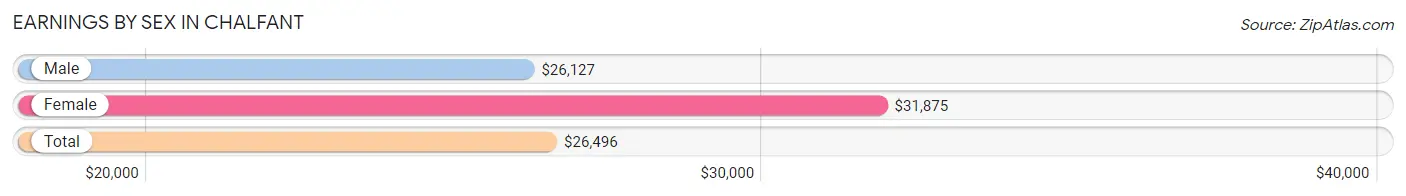
Earnings by Sex in Chalfant
Average Earnings in Chalfant are $26,496, $26,127 for men and $31,875 for women, a difference of 18.0%.
| Sex | Number | Average Earnings |
| Male | 111 (43.5%) | $26,127 |
| Female | 144 (56.5%) | $31,875 |
| Total | 255 (100.0%) | $26,496 |
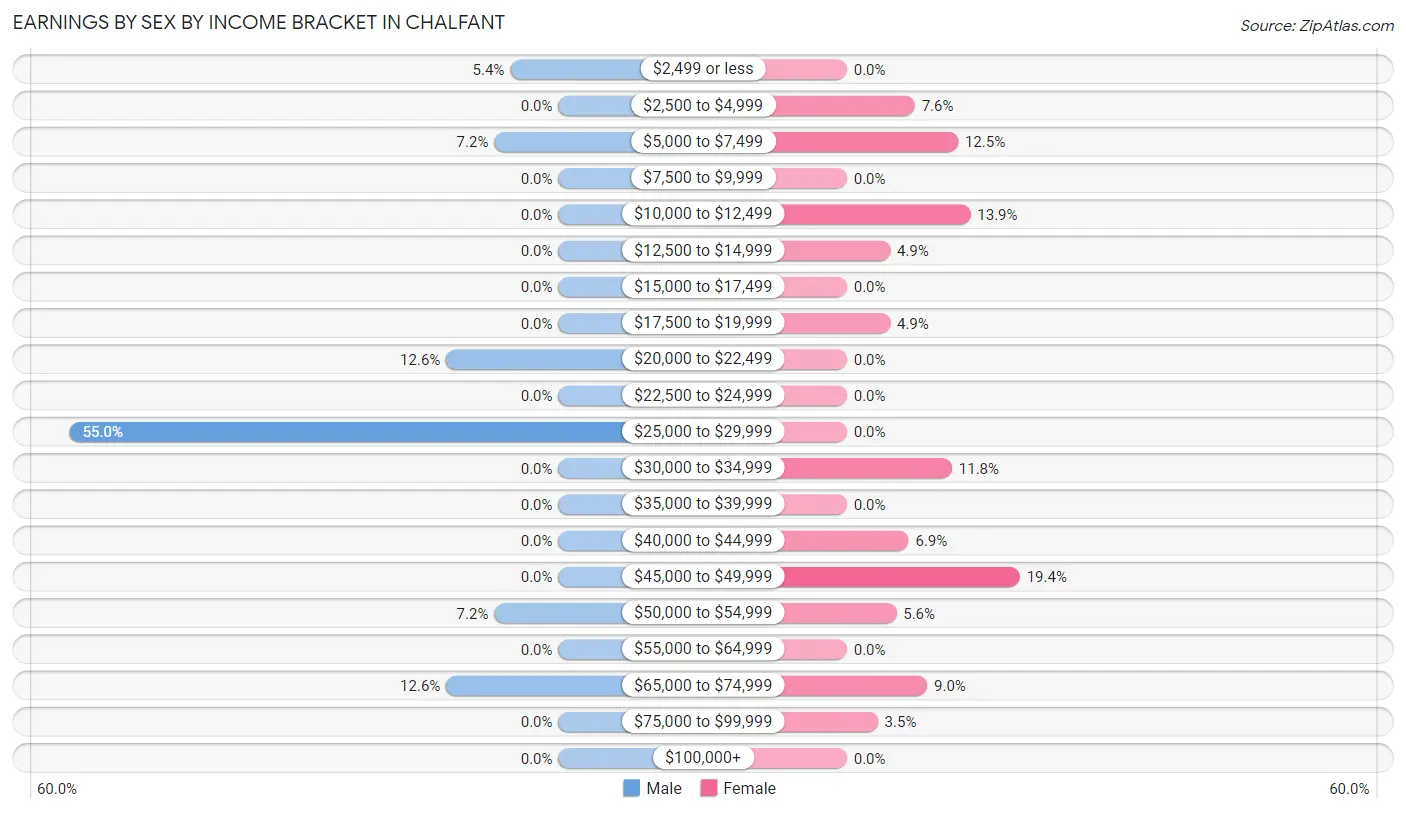
Earnings by Sex by Income Bracket in Chalfant
The most common earnings brackets in Chalfant are $25,000 to $29,999 for men (61 | 54.9%) and $45,000 to $49,999 for women (28 | 19.4%).
| Income | Male | Female |
| $2,499 or less | 6 (5.4%) | 0 (0.0%) |
| $2,500 to $4,999 | 0 (0.0%) | 11 (7.6%) |
| $5,000 to $7,499 | 8 (7.2%) | 18 (12.5%) |
| $7,500 to $9,999 | 0 (0.0%) | 0 (0.0%) |
| $10,000 to $12,499 | 0 (0.0%) | 20 (13.9%) |
| $12,500 to $14,999 | 0 (0.0%) | 7 (4.9%) |
| $15,000 to $17,499 | 0 (0.0%) | 0 (0.0%) |
| $17,500 to $19,999 | 0 (0.0%) | 7 (4.9%) |
| $20,000 to $22,499 | 14 (12.6%) | 0 (0.0%) |
| $22,500 to $24,999 | 0 (0.0%) | 0 (0.0%) |
| $25,000 to $29,999 | 61 (54.9%) | 0 (0.0%) |
| $30,000 to $34,999 | 0 (0.0%) | 17 (11.8%) |
| $35,000 to $39,999 | 0 (0.0%) | 0 (0.0%) |
| $40,000 to $44,999 | 0 (0.0%) | 10 (6.9%) |
| $45,000 to $49,999 | 0 (0.0%) | 28 (19.4%) |
| $50,000 to $54,999 | 8 (7.2%) | 8 (5.6%) |
| $55,000 to $64,999 | 0 (0.0%) | 0 (0.0%) |
| $65,000 to $74,999 | 14 (12.6%) | 13 (9.0%) |
| $75,000 to $99,999 | 0 (0.0%) | 5 (3.5%) |
| $100,000+ | 0 (0.0%) | 0 (0.0%) |
| Total | 111 (100.0%) | 144 (100.0%) |
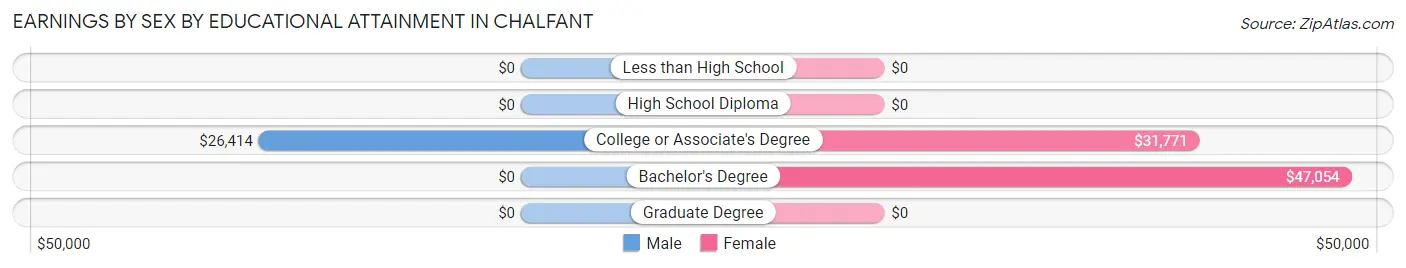
Earnings by Sex by Educational Attainment in Chalfant
Average earnings in Chalfant are $26,127 for men and $42,750 for women, a difference of 38.9%. Men with an educational attainment of college or associate's degree enjoy the highest average annual earnings of $26,414, while those with college or associate's degree education earn the least with $26,414. Women with an educational attainment of bachelor's degree earn the most with the average annual earnings of $47,054, while those with college or associate's degree education have the smallest earnings of $31,771.
| Educational Attainment | Male Income | Female Income |
| Less than High School | - | - |
| High School Diploma | - | - |
| College or Associate's Degree | $26,414 | $31,771 |
| Bachelor's Degree | - | - |
| Graduate Degree | - | - |
| Total | $26,127 | $42,750 |
Family Income in Chalfant
Family Income Brackets in Chalfant
According to the Chalfant family income data, there are 39 families falling into the $100,000 to $149,999 income range, which is the most common income bracket and makes up 23.8% of all families.
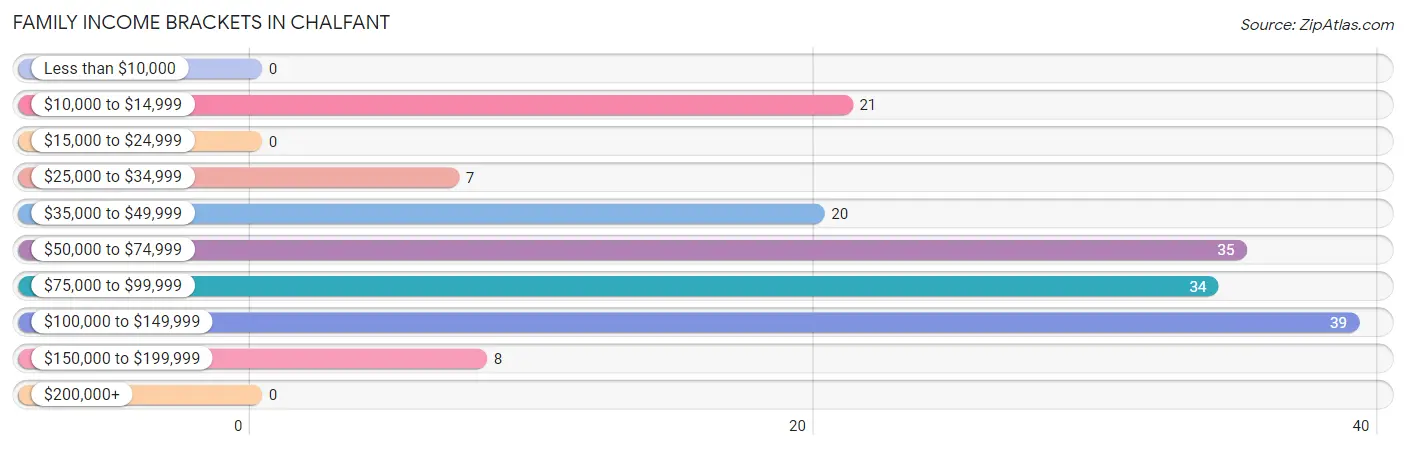
| Income Bracket | # Families | % Families |
| Less than $10,000 | 0 | 0.0% |
| $10,000 to $14,999 | 21 | 12.8% |
| $15,000 to $24,999 | 0 | 0.0% |
| $25,000 to $34,999 | 7 | 4.3% |
| $35,000 to $49,999 | 20 | 12.2% |
| $50,000 to $74,999 | 35 | 21.3% |
| $75,000 to $99,999 | 34 | 20.7% |
| $100,000 to $149,999 | 39 | 23.8% |
| $150,000 to $199,999 | 8 | 4.9% |
| $200,000+ | 0 | 0.0% |
Family Income by Famaliy Size in Chalfant
2-person families (88 | 53.7%) account for the highest median family income in Chalfant with $68,571 per family, while 2-person families (88 | 53.7%) have the highest median income of $34,286 per family member.
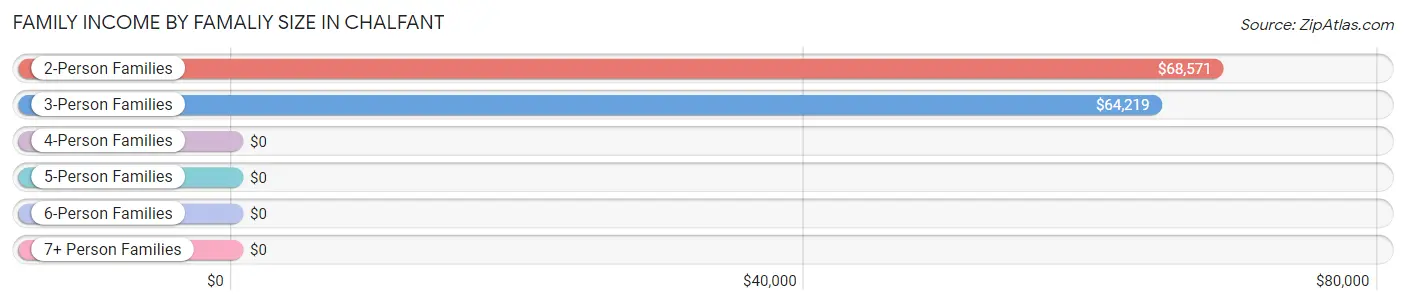
| Income Bracket | # Families | Median Income |
| 2-Person Families | 88 (53.7%) | $68,571 |
| 3-Person Families | 31 (18.9%) | $64,219 |
| 4-Person Families | 33 (20.1%) | $0 |
| 5-Person Families | 12 (7.3%) | $0 |
| 6-Person Families | 0 (0.0%) | $0 |
| 7+ Person Families | 0 (0.0%) | $0 |
| Total | 164 (100.0%) | $72,308 |
Family Income by Number of Earners in Chalfant
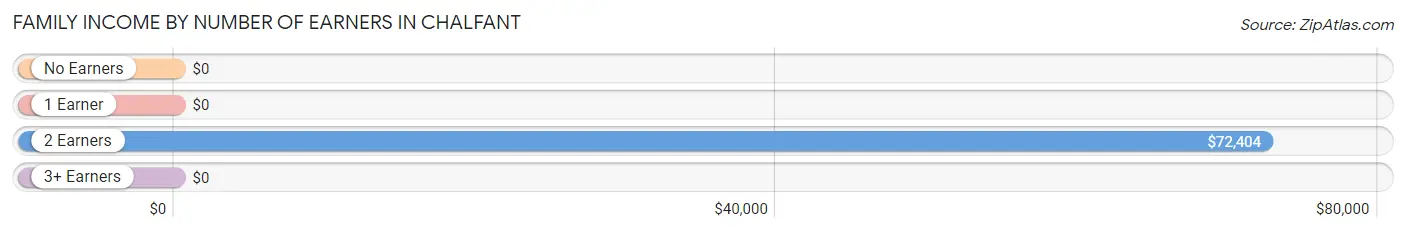
| Number of Earners | # Families | Median Income |
| No Earners | 44 (26.8%) | $0 |
| 1 Earner | 67 (40.8%) | $0 |
| 2 Earners | 53 (32.3%) | $72,404 |
| 3+ Earners | 0 (0.0%) | $0 |
| Total | 164 (100.0%) | $72,308 |
Household Income in Chalfant
Household Income Brackets in Chalfant
With 39 households falling in the category, the $100,000 to $149,999 income range is the most frequent in Chalfant, accounting for 18.4% of all households.
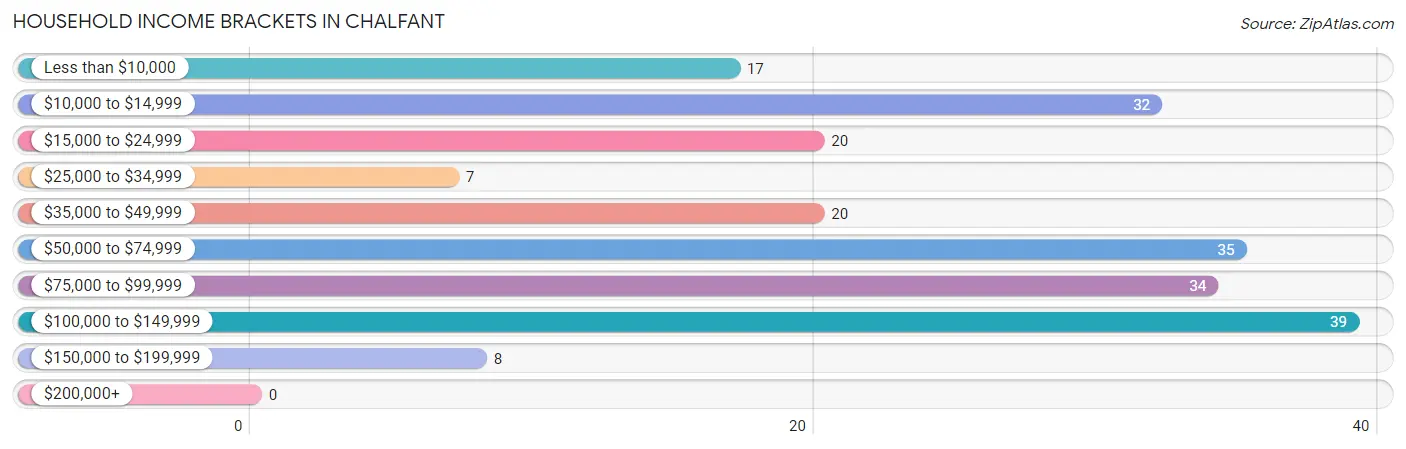
| Income Bracket | # Households | % Households |
| Less than $10,000 | 17 | 8.0% |
| $10,000 to $14,999 | 32 | 15.1% |
| $15,000 to $24,999 | 20 | 9.4% |
| $25,000 to $34,999 | 7 | 3.3% |
| $35,000 to $49,999 | 20 | 9.4% |
| $50,000 to $74,999 | 35 | 16.5% |
| $75,000 to $99,999 | 34 | 16.0% |
| $100,000 to $149,999 | 39 | 18.4% |
| $150,000 to $199,999 | 8 | 3.8% |
| $200,000+ | 0 | 0.0% |
Household Income by Householder Age in Chalfant
The median household income in Chalfant is $67,857, with the highest median household income of $69,286 found in the 25 to 44 years age bracket for the primary householder. A total of 58 households (27.4%) fall into this category.
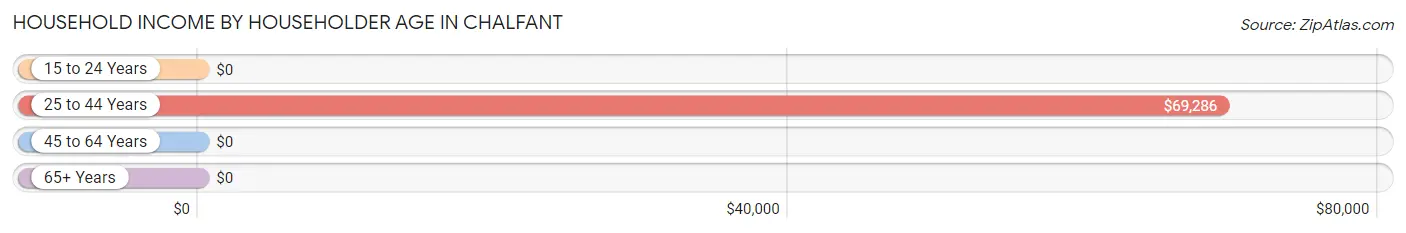
| Income Bracket | # Households | Median Income |
| 15 to 24 Years | 0 (0.0%) | $0 |
| 25 to 44 Years | 58 (27.4%) | $69,286 |
| 45 to 64 Years | 73 (34.4%) | $0 |
| 65+ Years | 81 (38.2%) | $0 |
| Total | 212 (100.0%) | $67,857 |
Poverty in Chalfant
Income Below Poverty by Sex and Age in Chalfant
With 21.1% poverty level for males and 20.6% for females among the residents of Chalfant, 55 to 64 year old males and 75 year old and over females are the most vulnerable to poverty, with 43 males (54.4%) and 11 females (100.0%) in their respective age groups living below the poverty level.
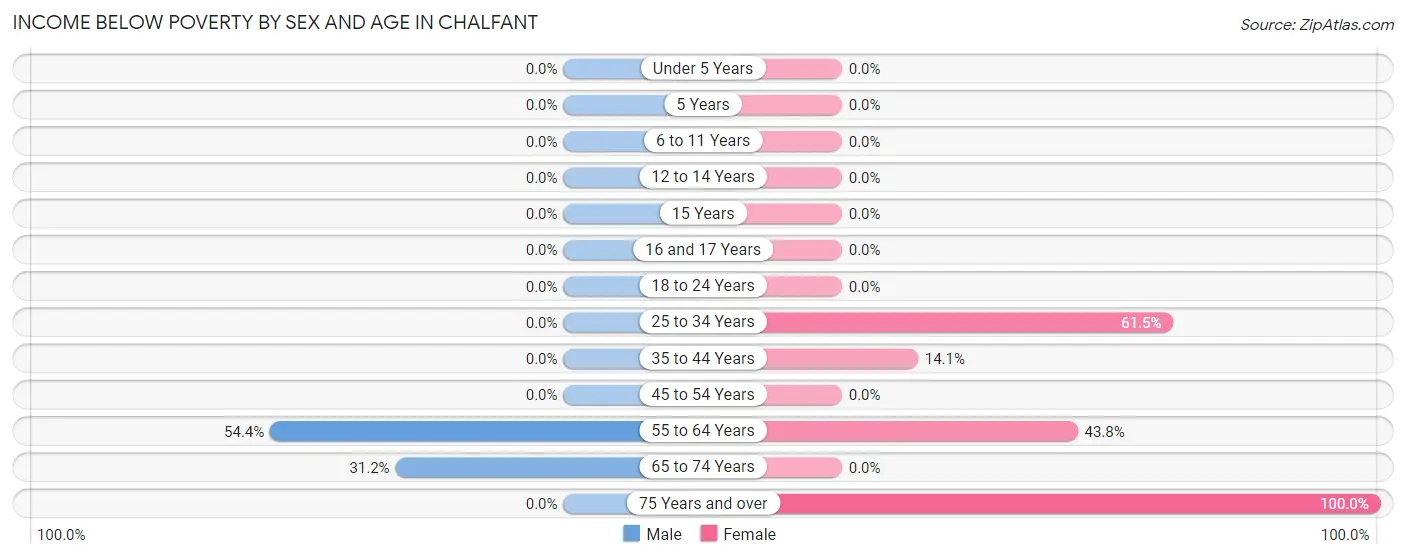
| Age Bracket | Male | Female |
| Under 5 Years | 0 (0.0%) | 0 (0.0%) |
| 5 Years | 0 (0.0%) | 0 (0.0%) |
| 6 to 11 Years | 0 (0.0%) | 0 (0.0%) |
| 12 to 14 Years | 0 (0.0%) | 0 (0.0%) |
| 15 Years | 0 (0.0%) | 0 (0.0%) |
| 16 and 17 Years | 0 (0.0%) | 0 (0.0%) |
| 18 to 24 Years | 0 (0.0%) | 0 (0.0%) |
| 25 to 34 Years | 0 (0.0%) | 16 (61.5%) |
| 35 to 44 Years | 0 (0.0%) | 11 (14.1%) |
| 45 to 54 Years | 0 (0.0%) | 0 (0.0%) |
| 55 to 64 Years | 43 (54.4%) | 21 (43.8%) |
| 65 to 74 Years | 24 (31.2%) | 0 (0.0%) |
| 75 Years and over | 0 (0.0%) | 11 (100.0%) |
| Total | 67 (21.1%) | 59 (20.6%) |
Income Above Poverty by Sex and Age in Chalfant
According to the poverty statistics in Chalfant, males aged 12 to 14 years and females aged under 5 years are the age groups that are most secure financially, with 100.0% of males and 100.0% of females in these age groups living above the poverty line.
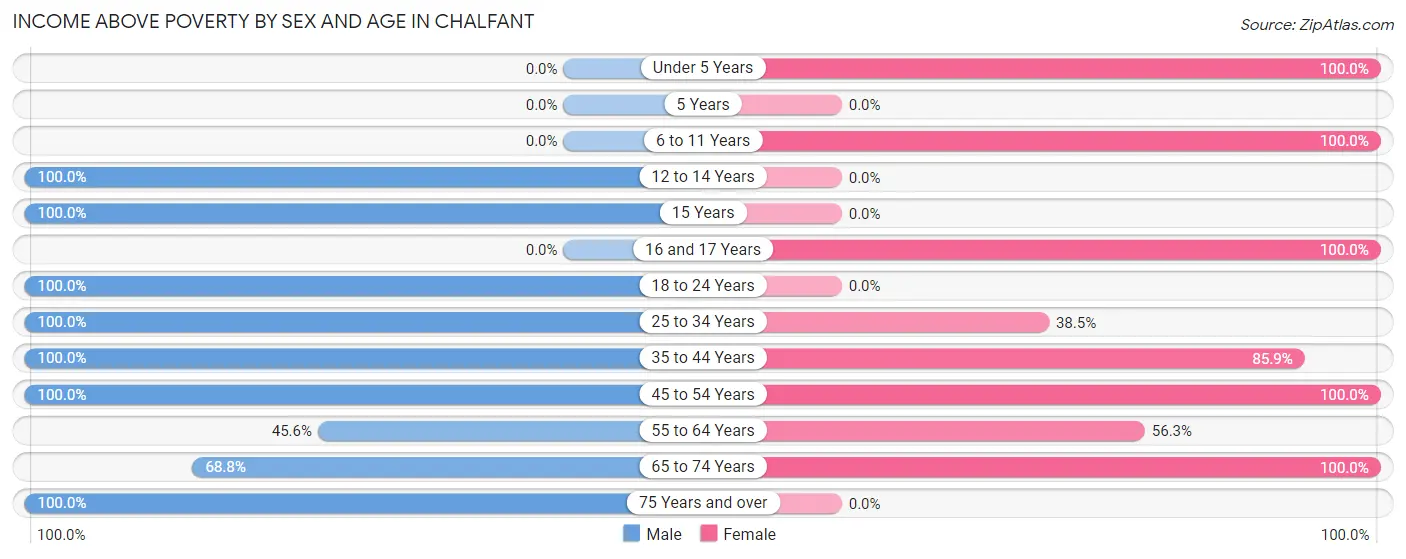
| Age Bracket | Male | Female |
| Under 5 Years | 0 (0.0%) | 14 (100.0%) |
| 5 Years | 0 (0.0%) | 0 (0.0%) |
| 6 to 11 Years | 0 (0.0%) | 14 (100.0%) |
| 12 to 14 Years | 13 (100.0%) | 0 (0.0%) |
| 15 Years | 18 (100.0%) | 0 (0.0%) |
| 16 and 17 Years | 0 (0.0%) | 18 (100.0%) |
| 18 to 24 Years | 30 (100.0%) | 0 (0.0%) |
| 25 to 34 Years | 8 (100.0%) | 10 (38.5%) |
| 35 to 44 Years | 75 (100.0%) | 67 (85.9%) |
| 45 to 54 Years | 14 (100.0%) | 28 (100.0%) |
| 55 to 64 Years | 36 (45.6%) | 27 (56.2%) |
| 65 to 74 Years | 53 (68.8%) | 50 (100.0%) |
| 75 Years and over | 4 (100.0%) | 0 (0.0%) |
| Total | 251 (78.9%) | 228 (79.4%) |
Income Below Poverty Among Married-Couple Families in Chalfant
The poverty statistics for married-couple families in Chalfant show that 14.6% or 21 of the total 144 families live below the poverty line. Families with no children have the highest poverty rate of 17.2%, comprising of 21 families. On the other hand, families with 1 or 2 children have the lowest poverty rate of 0.0%, which includes 0 families.
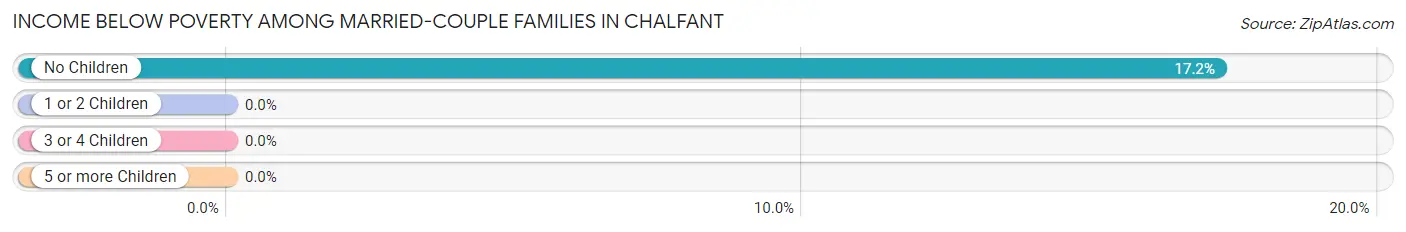
| Children | Above Poverty | Below Poverty |
| No Children | 101 (82.8%) | 21 (17.2%) |
| 1 or 2 Children | 10 (100.0%) | 0 (0.0%) |
| 3 or 4 Children | 12 (100.0%) | 0 (0.0%) |
| 5 or more Children | 0 (0.0%) | 0 (0.0%) |
| Total | 123 (85.4%) | 21 (14.6%) |
Income Below Poverty Among Single-Parent Households in Chalfant
| Children | Single Father | Single Mother |
| No Children | 0 (0.0%) | 0 (0.0%) |
| 1 or 2 Children | 0 (0.0%) | 0 (0.0%) |
| 3 or 4 Children | 0 (0.0%) | 0 (0.0%) |
| 5 or more Children | 0 (0.0%) | 0 (0.0%) |
| Total | 0 (0.0%) | 0 (0.0%) |
Income Below Poverty Among Married-Couple vs Single-Parent Households in Chalfant
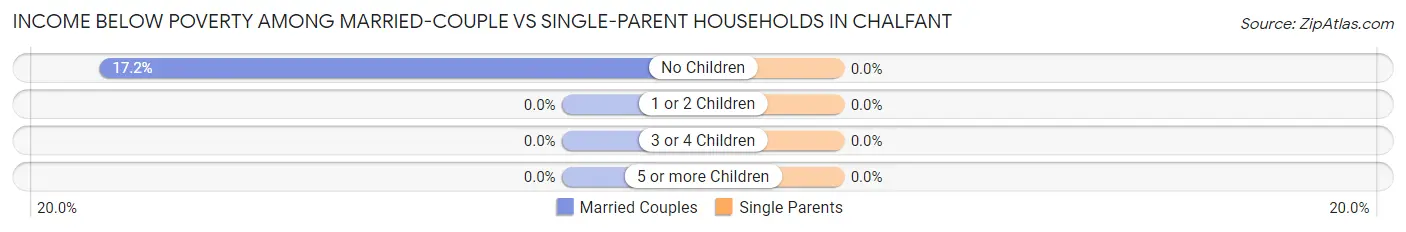
| Children | Married-Couple Families | Single-Parent Households |
| No Children | 21 (17.2%) | 0 (0.0%) |
| 1 or 2 Children | 0 (0.0%) | 0 (0.0%) |
| 3 or 4 Children | 0 (0.0%) | 0 (0.0%) |
| 5 or more Children | 0 (0.0%) | 0 (0.0%) |
| Total | 21 (14.6%) | 0 (0.0%) |
Race in Chalfant
The most populous races in Chalfant are White / Caucasian (450 | 74.4%), Native / Alaskan (86 | 14.2%), and Two or more Races (60 | 9.9%).
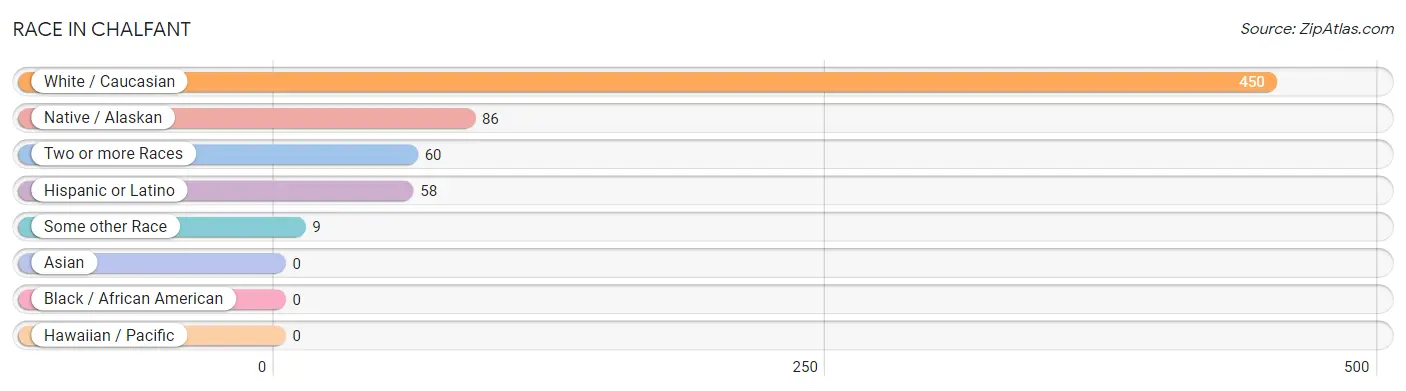
| Race | # Population | % Population |
| Asian | 0 | 0.0% |
| Black / African American | 0 | 0.0% |
| Hawaiian / Pacific | 0 | 0.0% |
| Hispanic or Latino | 58 | 9.6% |
| Native / Alaskan | 86 | 14.2% |
| White / Caucasian | 450 | 74.4% |
| Two or more Races | 60 | 9.9% |
| Some other Race | 9 | 1.5% |
| Total | 605 | 100.0% |
Ancestry in Chalfant
The most populous ancestries reported in Chalfant are American (163 | 26.9%), Shoshone (86 | 14.2%), German (63 | 10.4%), Mexican (58 | 9.6%), and English (53 | 8.8%), together accounting for 69.9% of all Chalfant residents.
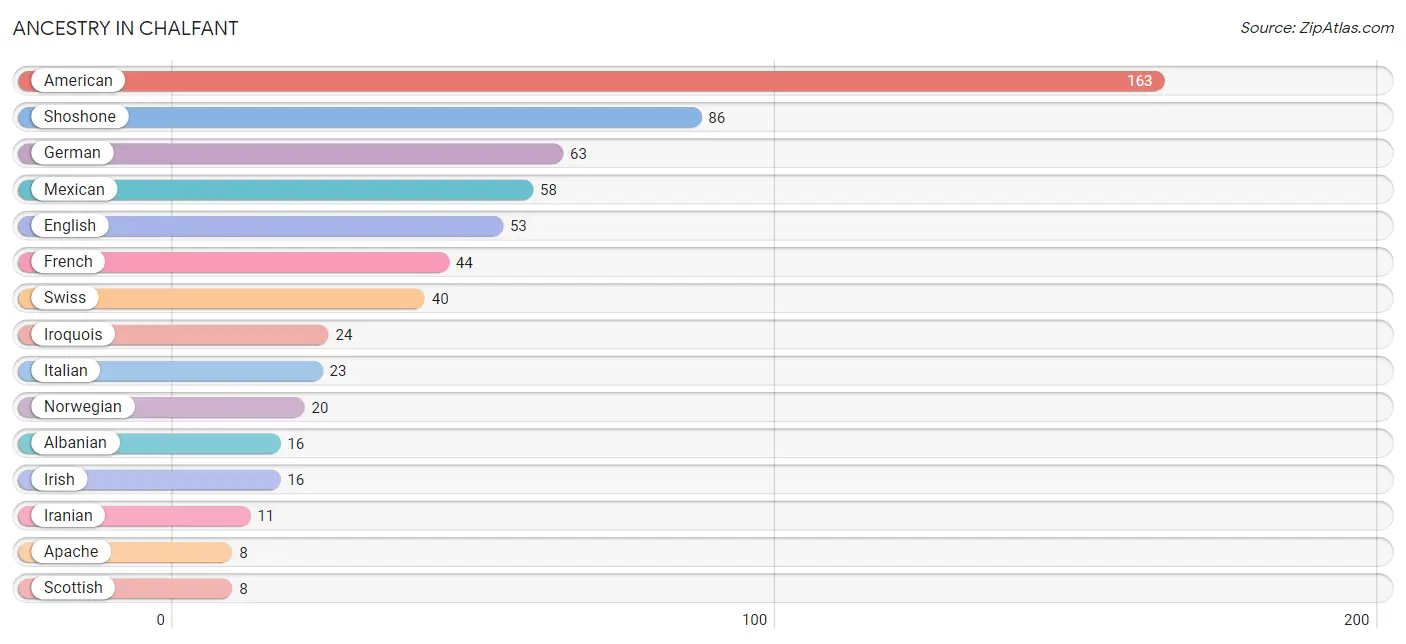
| Ancestry | # Population | % Population |
| Albanian | 16 | 2.6% |
| American | 163 | 26.9% |
| Apache | 8 | 1.3% |
| Dutch | 7 | 1.2% |
| English | 53 | 8.8% |
| Finnish | 6 | 1.0% |
| French | 44 | 7.3% |
| German | 63 | 10.4% |
| Iranian | 11 | 1.8% |
| Irish | 16 | 2.6% |
| Iroquois | 24 | 4.0% |
| Italian | 23 | 3.8% |
| Mexican | 58 | 9.6% |
| Norwegian | 20 | 3.3% |
| Paiute | 4 | 0.7% |
| Scottish | 8 | 1.3% |
| Shoshone | 86 | 14.2% |
| Swedish | 7 | 1.2% |
| Swiss | 40 | 6.6% | View All 19 Rows |
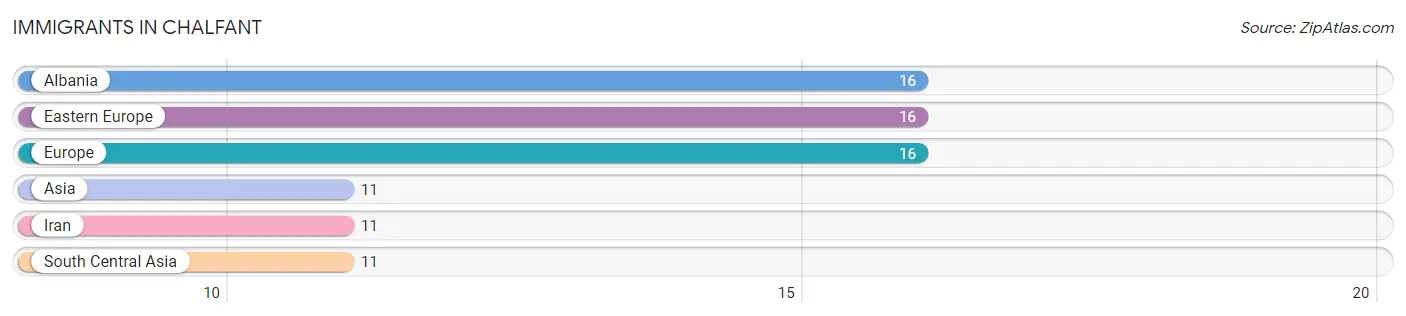
Immigrants in Chalfant
The most numerous immigrant groups reported in Chalfant came from Albania (16 | 2.6%), Eastern Europe (16 | 2.6%), Europe (16 | 2.6%), Asia (11 | 1.8%), and Iran (11 | 1.8%), together accounting for 11.6% of all Chalfant residents.
| Immigration Origin | # Population | % Population |
| Albania | 16 | 2.6% |
| Asia | 11 | 1.8% |
| Eastern Europe | 16 | 2.6% |
| Europe | 16 | 2.6% |
| Iran | 11 | 1.8% |
| South Central Asia | 11 | 1.8% | View All 6 Rows |
Sex and Age in Chalfant
Sex and Age in Chalfant
The most populous age groups in Chalfant are 70 to 74 Years (67 | 21.1%) for men and 40 to 44 Years (67 | 23.3%) for women.
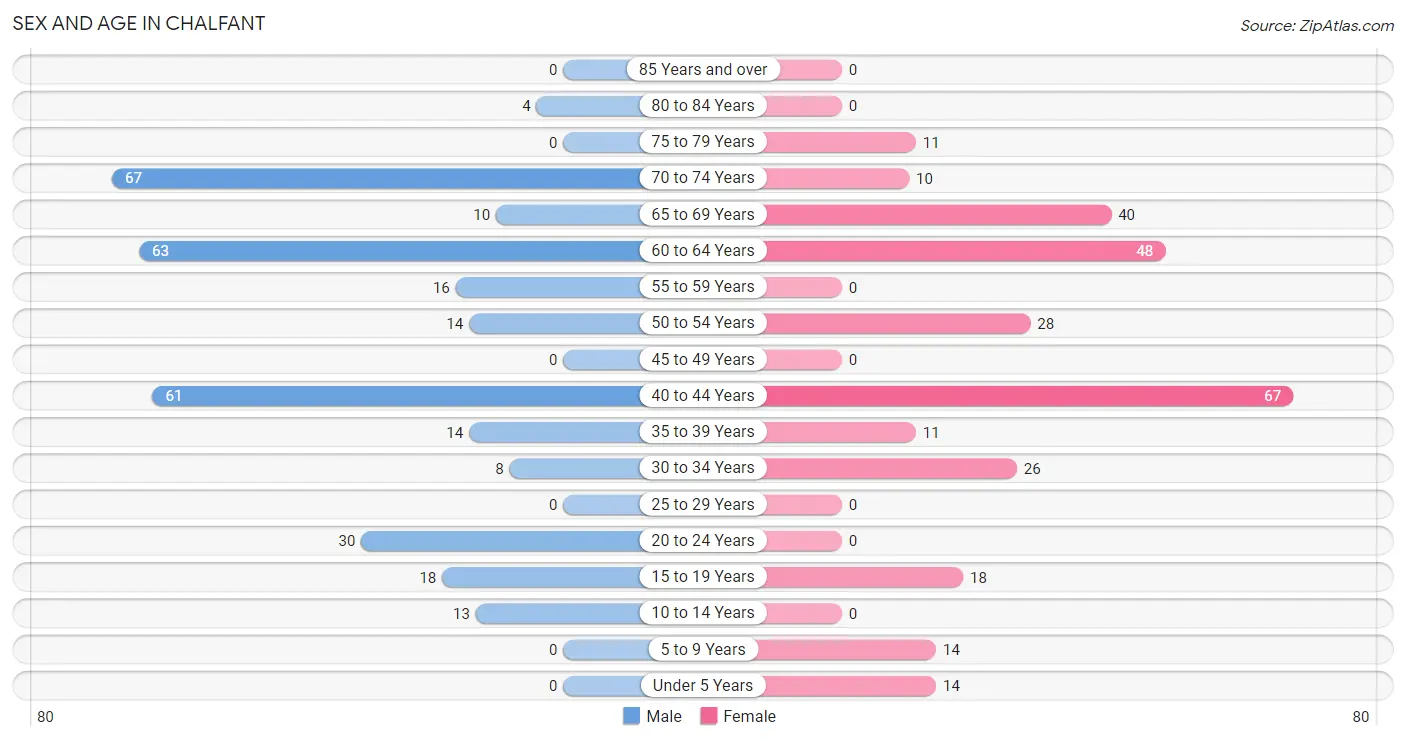
| Age Bracket | Male | Female |
| Under 5 Years | 0 (0.0%) | 14 (4.9%) |
| 5 to 9 Years | 0 (0.0%) | 14 (4.9%) |
| 10 to 14 Years | 13 (4.1%) | 0 (0.0%) |
| 15 to 19 Years | 18 (5.7%) | 18 (6.3%) |
| 20 to 24 Years | 30 (9.4%) | 0 (0.0%) |
| 25 to 29 Years | 0 (0.0%) | 0 (0.0%) |
| 30 to 34 Years | 8 (2.5%) | 26 (9.1%) |
| 35 to 39 Years | 14 (4.4%) | 11 (3.8%) |
| 40 to 44 Years | 61 (19.2%) | 67 (23.3%) |
| 45 to 49 Years | 0 (0.0%) | 0 (0.0%) |
| 50 to 54 Years | 14 (4.4%) | 28 (9.8%) |
| 55 to 59 Years | 16 (5.0%) | 0 (0.0%) |
| 60 to 64 Years | 63 (19.8%) | 48 (16.7%) |
| 65 to 69 Years | 10 (3.1%) | 40 (13.9%) |
| 70 to 74 Years | 67 (21.1%) | 10 (3.5%) |
| 75 to 79 Years | 0 (0.0%) | 11 (3.8%) |
| 80 to 84 Years | 4 (1.3%) | 0 (0.0%) |
| 85 Years and over | 0 (0.0%) | 0 (0.0%) |
| Total | 318 (100.0%) | 287 (100.0%) |
Families and Households in Chalfant
Median Family Size in Chalfant
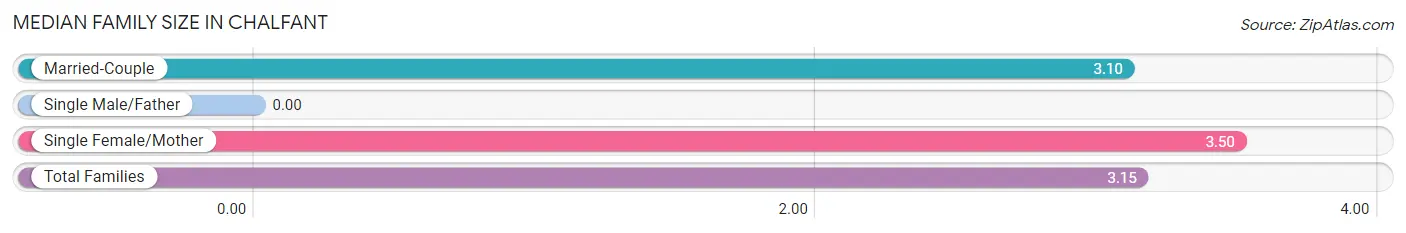
| Family Type | # Families | Family Size |
| Married-Couple | 144 (87.8%) | 3.10 |
| Single Male/Father | 0 (0.0%) | - |
| Single Female/Mother | 20 (12.2%) | 3.50 |
| Total Families | 164 (100.0%) | 3.15 |
Median Household Size in Chalfant
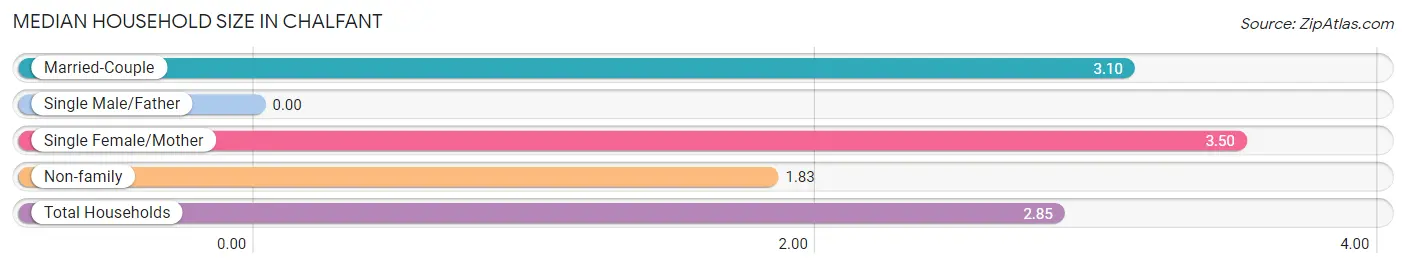
| Household Type | # Households | Household Size |
| Married-Couple | 144 (67.9%) | 3.10 |
| Single Male/Father | 0 (0.0%) | - |
| Single Female/Mother | 20 (9.4%) | 3.50 |
| Non-family | 48 (22.6%) | 1.83 |
| Total Households | 212 (100.0%) | 2.85 |
Household Size by Marriage Status in Chalfant
Out of a total of 212 households in Chalfant, 164 (77.4%) are family households, while 48 (22.6%) are nonfamily households. The most numerous type of family households are 2-person households, comprising 88, and the most common type of nonfamily households are 1-person households, comprising 28.
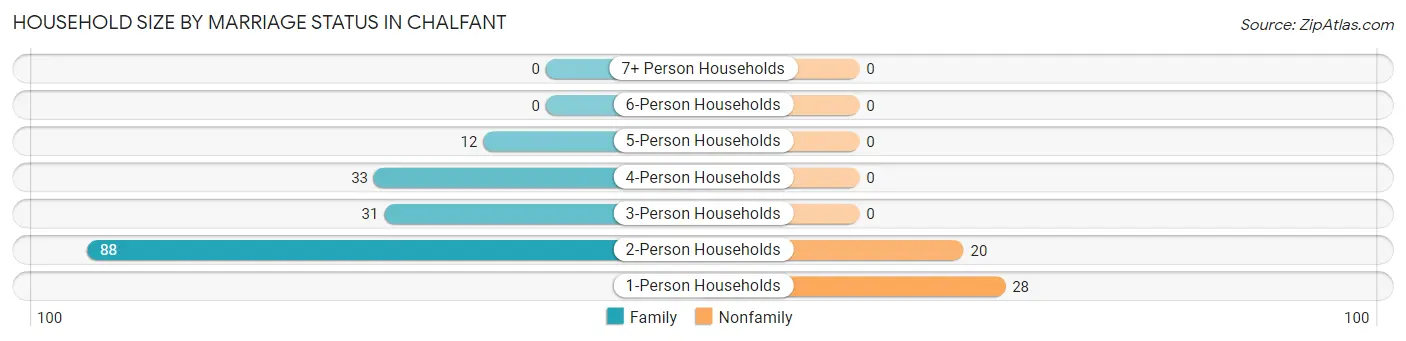
| Household Size | Family Households | Nonfamily Households |
| 1-Person Households | - | 28 (13.2%) |
| 2-Person Households | 88 (41.5%) | 20 (9.4%) |
| 3-Person Households | 31 (14.6%) | 0 (0.0%) |
| 4-Person Households | 33 (15.6%) | 0 (0.0%) |
| 5-Person Households | 12 (5.7%) | 0 (0.0%) |
| 6-Person Households | 0 (0.0%) | 0 (0.0%) |
| 7+ Person Households | 0 (0.0%) | 0 (0.0%) |
| Total | 164 (77.4%) | 48 (22.6%) |
Female Fertility in Chalfant
Fertility by Age in Chalfant
| Age Bracket | Women with Births | Births / 1,000 Women |
| 15 to 19 years | 0 (0.0%) | 0.0 |
| 20 to 34 years | 0 (0.0%) | 0.0 |
| 35 to 50 years | 0 (0.0%) | 0.0 |
| Total | 0 (0.0%) | 0.0 |
Fertility by Age by Marriage Status in Chalfant
| Age Bracket | Married | Unmarried |
| 15 to 19 years | 0 (0.0%) | 0 (0.0%) |
| 20 to 34 years | 0 (0.0%) | 0 (0.0%) |
| 35 to 50 years | 0 (0.0%) | 0 (0.0%) |
| Total | 0 (0.0%) | 0 (0.0%) |
Fertility by Education in Chalfant
| Educational Attainment | Women with Births | Births / 1,000 Women |
| Less than High School | 0 (0.0%) | 0.0 |
| High School Diploma | 0 (0.0%) | 0.0 |
| College or Associate's Degree | 0 (0.0%) | 0.0 |
| Bachelor's Degree | 0 (0.0%) | 0.0 |
| Graduate Degree | 0 (0.0%) | 0.0 |
| Total | 0 (0.0%) | 0.0 |
Fertility by Education by Marriage Status in Chalfant
| Educational Attainment | Married | Unmarried |
| Less than High School | 0 (0.0%) | 0 (0.0%) |
| High School Diploma | 0 (0.0%) | 0 (0.0%) |
| College or Associate's Degree | 0 (0.0%) | 0 (0.0%) |
| Bachelor's Degree | 0 (0.0%) | 0 (0.0%) |
| Graduate Degree | 0 (0.0%) | 0 (0.0%) |
| Total | 0 (0.0%) | 0 (0.0%) |
Employment Characteristics in Chalfant
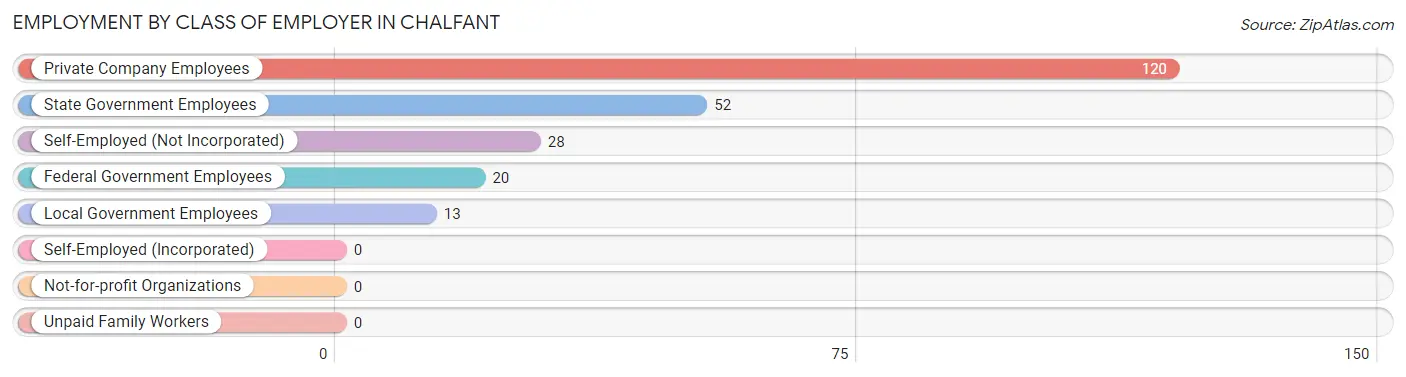
Employment by Class of Employer in Chalfant
Among the 233 employed individuals in Chalfant, private company employees (120 | 51.5%), state government employees (52 | 22.3%), and self-employed (not incorporated) (28 | 12.0%) make up the most common classes of employment.
| Employer Class | # Employees | % Employees |
| Private Company Employees | 120 | 51.5% |
| Self-Employed (Incorporated) | 0 | 0.0% |
| Self-Employed (Not Incorporated) | 28 | 12.0% |
| Not-for-profit Organizations | 0 | 0.0% |
| Local Government Employees | 13 | 5.6% |
| State Government Employees | 52 | 22.3% |
| Federal Government Employees | 20 | 8.6% |
| Unpaid Family Workers | 0 | 0.0% |
| Total | 233 | 100.0% |
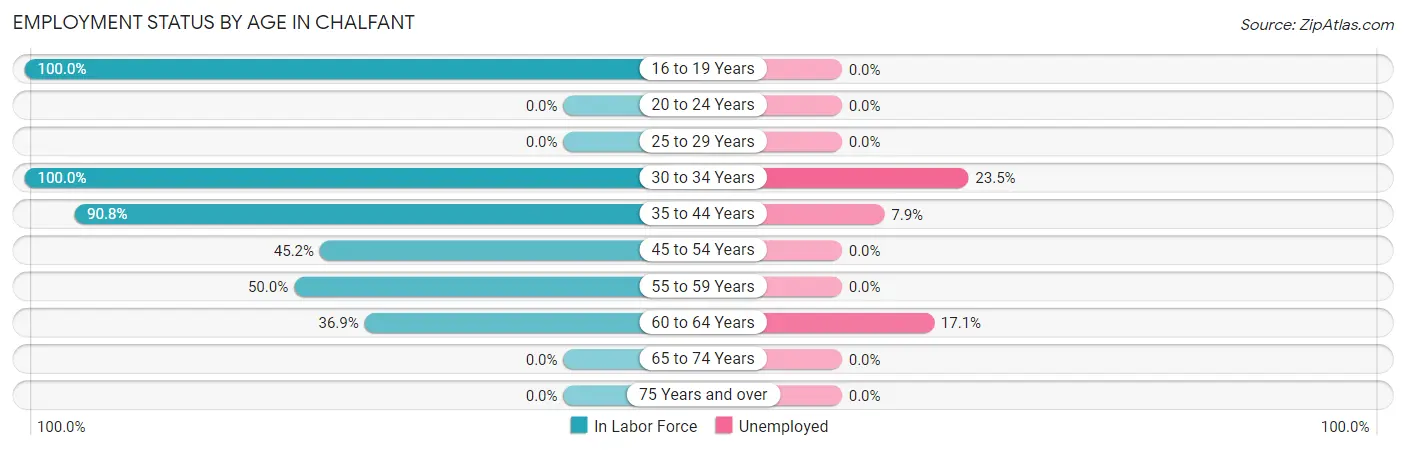
Employment Status by Age in Chalfant
According to the labor force statistics for Chalfant, out of the total population over 16 years of age (546), 47.4% or 259 individuals are in the labor force, with 10.0% or 26 of them unemployed. The age group with the highest labor force participation rate is 16 to 19 years, with 100.0% or 18 individuals in the labor force. Within the labor force, the 30 to 34 years age range has the highest percentage of unemployed individuals, with 23.5% or 8 of them being unemployed.
| Age Bracket | In Labor Force | Unemployed |
| 16 to 19 Years | 18 (100.0%) | 0 (0.0%) |
| 20 to 24 Years | 0 (0.0%) | 0 (0.0%) |
| 25 to 29 Years | 0 (0.0%) | 0 (0.0%) |
| 30 to 34 Years | 34 (100.0%) | 8 (23.5%) |
| 35 to 44 Years | 139 (90.8%) | 11 (7.9%) |
| 45 to 54 Years | 19 (45.2%) | 0 (0.0%) |
| 55 to 59 Years | 8 (50.0%) | 0 (0.0%) |
| 60 to 64 Years | 41 (36.9%) | 7 (17.1%) |
| 65 to 74 Years | 0 (0.0%) | 0 (0.0%) |
| 75 Years and over | 0 (0.0%) | 0 (0.0%) |
| Total | 259 (47.4%) | 26 (10.0%) |
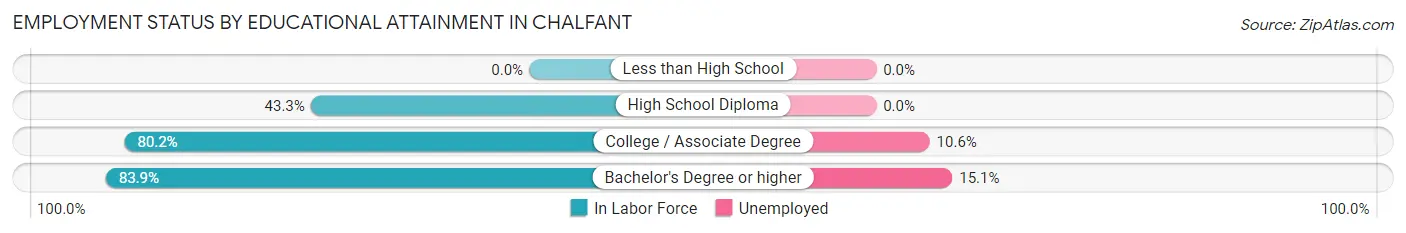
Employment Status by Educational Attainment in Chalfant
According to labor force statistics for Chalfant, 67.7% of individuals (241) out of the total population between 25 and 64 years of age (356) are in the labor force, with 10.8% or 26 of them being unemployed. The group with the highest labor force participation rate are those with the educational attainment of bachelor's degree or higher, with 83.9% or 73 individuals in the labor force. Within the labor force, individuals with bachelor's degree or higher education have the highest percentage of unemployment, with 15.1% or 11 of them being unemployed.
| Educational Attainment | In Labor Force | Unemployed |
| Less than High School | 0 (0.0%) | 0 (0.0%) |
| High School Diploma | 26 (43.3%) | 0 (0.0%) |
| College / Associate Degree | 142 (80.2%) | 19 (10.6%) |
| Bachelor's Degree or higher | 73 (83.9%) | 13 (15.1%) |
| Total | 241 (67.7%) | 38 (10.8%) |
Employment Occupations by Sex in Chalfant
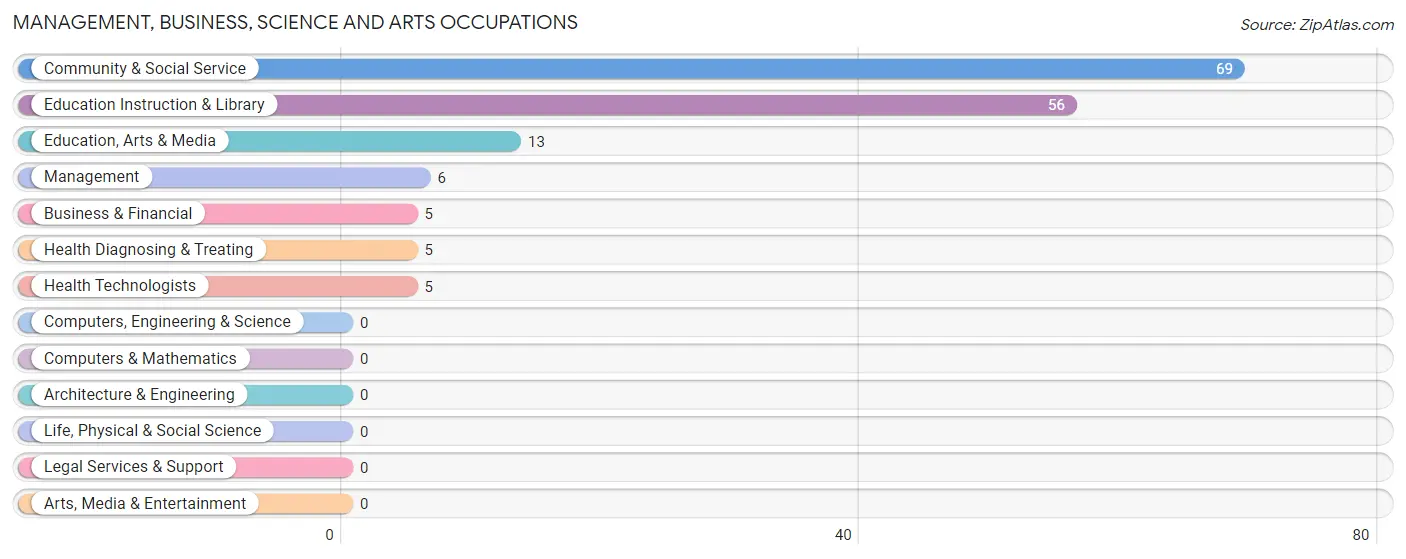
Management, Business, Science and Arts Occupations
The most common Management, Business, Science and Arts occupations in Chalfant are Community & Social Service (69 | 29.6%), Education Instruction & Library (56 | 24.0%), Education, Arts & Media (13 | 5.6%), Management (6 | 2.6%), and Business & Financial (5 | 2.1%).
Management, Business, Science and Arts Occupations by Sex
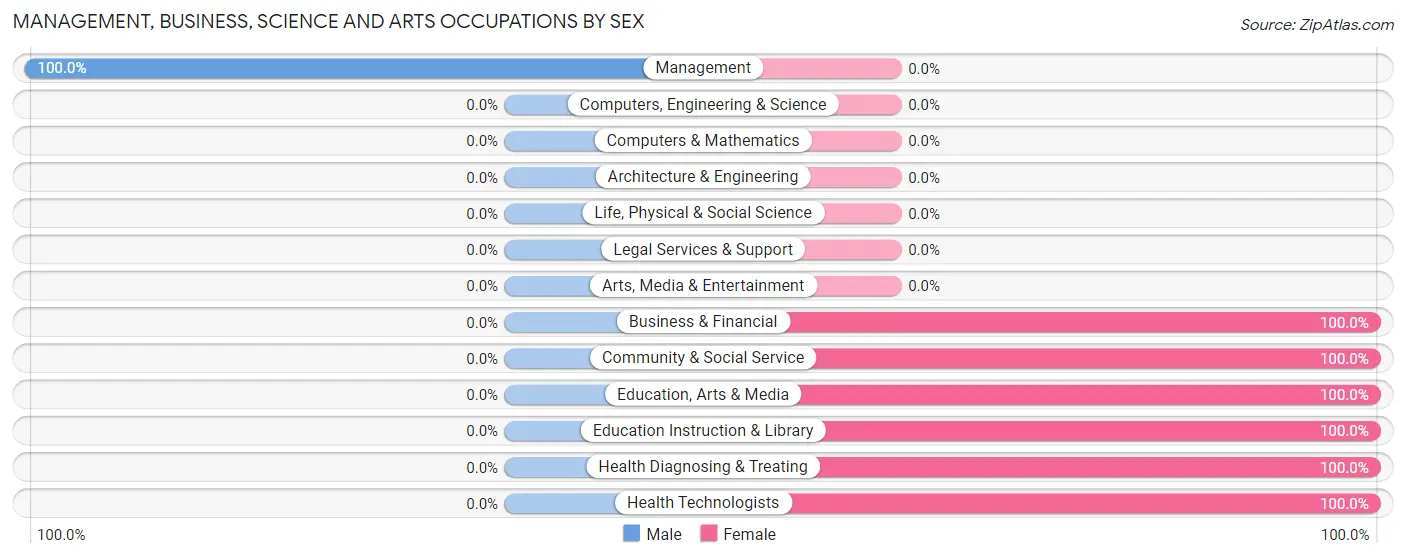
| Occupation | Male | Female |
| Management | 6 (100.0%) | 0 (0.0%) |
| Business & Financial | 0 (0.0%) | 5 (100.0%) |
| Computers, Engineering & Science | 0 (0.0%) | 0 (0.0%) |
| Computers & Mathematics | 0 (0.0%) | 0 (0.0%) |
| Architecture & Engineering | 0 (0.0%) | 0 (0.0%) |
| Life, Physical & Social Science | 0 (0.0%) | 0 (0.0%) |
| Community & Social Service | 0 (0.0%) | 69 (100.0%) |
| Education, Arts & Media | 0 (0.0%) | 13 (100.0%) |
| Legal Services & Support | 0 (0.0%) | 0 (0.0%) |
| Education Instruction & Library | 0 (0.0%) | 56 (100.0%) |
| Arts, Media & Entertainment | 0 (0.0%) | 0 (0.0%) |
| Health Diagnosing & Treating | 0 (0.0%) | 5 (100.0%) |
| Health Technologists | 0 (0.0%) | 5 (100.0%) |
| Total (Category) | 6 (7.1%) | 79 (92.9%) |
| Total (Overall) | 111 (47.6%) | 122 (52.4%) |
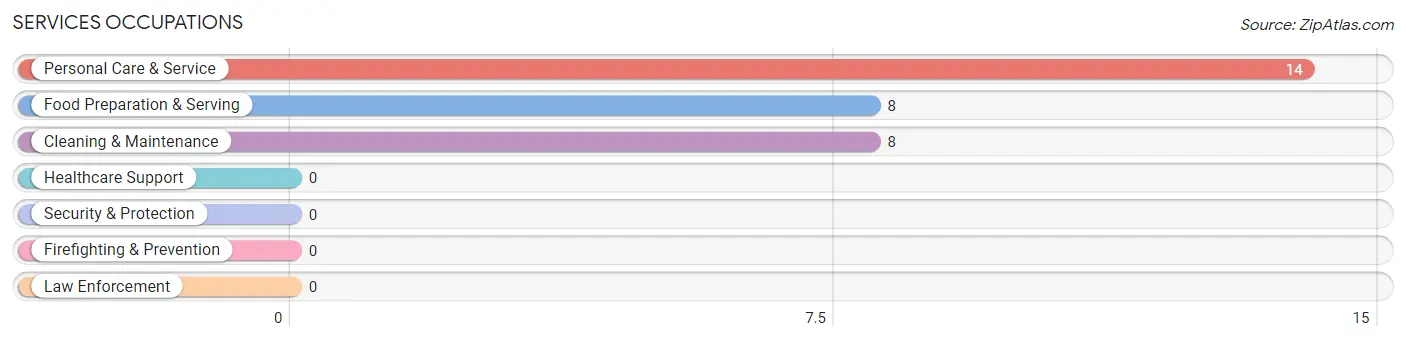
Services Occupations
The most common Services occupations in Chalfant are Personal Care & Service (14 | 6.0%), Food Preparation & Serving (8 | 3.4%), and Cleaning & Maintenance (8 | 3.4%).
Services Occupations by Sex
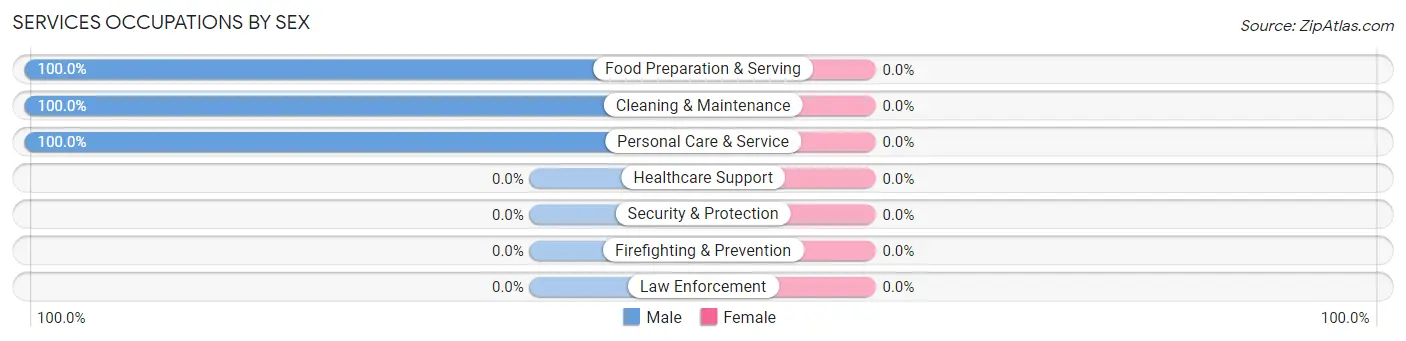
| Occupation | Male | Female |
| Healthcare Support | 0 (0.0%) | 0 (0.0%) |
| Security & Protection | 0 (0.0%) | 0 (0.0%) |
| Firefighting & Prevention | 0 (0.0%) | 0 (0.0%) |
| Law Enforcement | 0 (0.0%) | 0 (0.0%) |
| Food Preparation & Serving | 8 (100.0%) | 0 (0.0%) |
| Cleaning & Maintenance | 8 (100.0%) | 0 (0.0%) |
| Personal Care & Service | 14 (100.0%) | 0 (0.0%) |
| Total (Category) | 30 (100.0%) | 0 (0.0%) |
| Total (Overall) | 111 (47.6%) | 122 (52.4%) |
Sales and Office Occupations
The most common Sales and Office occupations in Chalfant are Office & Administration (28 | 12.0%), and Sales & Related (21 | 9.0%).
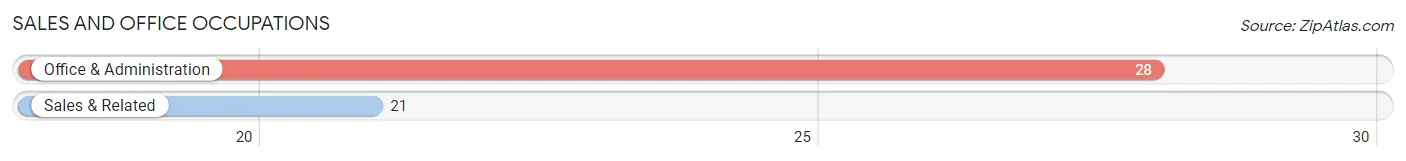
Sales and Office Occupations by Sex
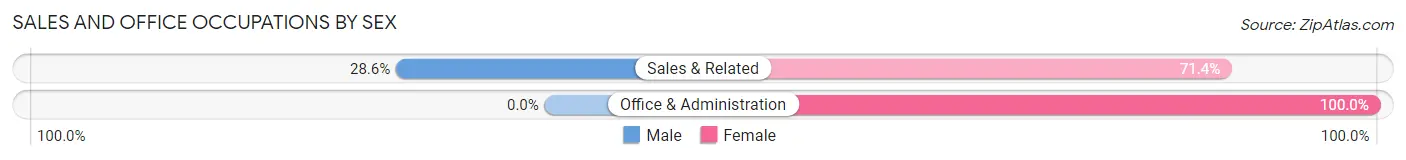
| Occupation | Male | Female |
| Sales & Related | 6 (28.6%) | 15 (71.4%) |
| Office & Administration | 0 (0.0%) | 28 (100.0%) |
| Total (Category) | 6 (12.2%) | 43 (87.8%) |
| Total (Overall) | 111 (47.6%) | 122 (52.4%) |
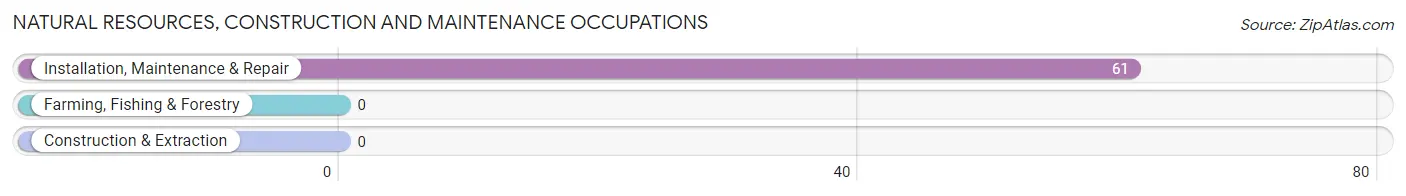
Natural Resources, Construction and Maintenance Occupations
The most common Natural Resources, Construction and Maintenance occupations in Chalfant are , and Installation, Maintenance & Repair (61 | 26.2%).
Natural Resources, Construction and Maintenance Occupations by Sex
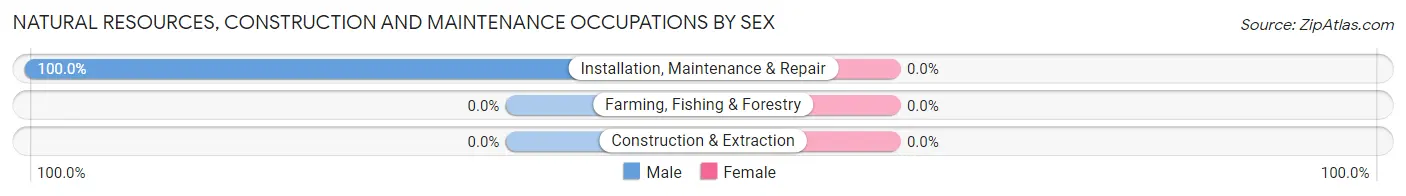
| Occupation | Male | Female |
| Farming, Fishing & Forestry | 0 (0.0%) | 0 (0.0%) |
| Construction & Extraction | 0 (0.0%) | 0 (0.0%) |
| Installation, Maintenance & Repair | 61 (100.0%) | 0 (0.0%) |
| Total (Category) | 61 (100.0%) | 0 (0.0%) |
| Total (Overall) | 111 (47.6%) | 122 (52.4%) |
Production, Transportation and Moving Occupations
The most common Production, Transportation and Moving occupations in Chalfant are , and Transportation (8 | 3.4%).
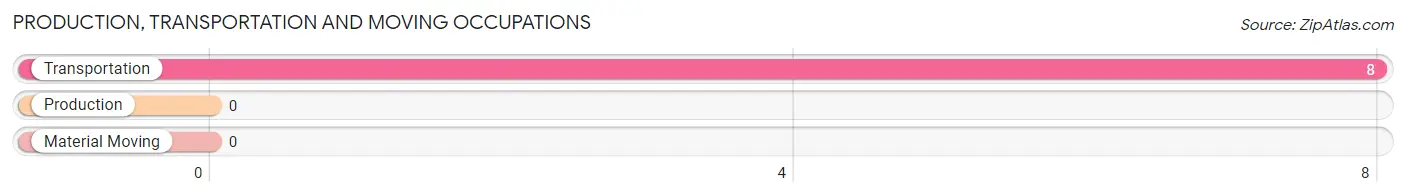
Production, Transportation and Moving Occupations by Sex
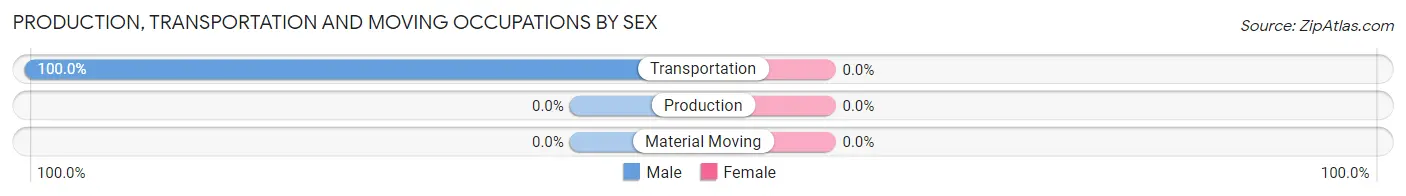
| Occupation | Male | Female |
| Production | 0 (0.0%) | 0 (0.0%) |
| Transportation | 8 (100.0%) | 0 (0.0%) |
| Material Moving | 0 (0.0%) | 0 (0.0%) |
| Total (Category) | 8 (100.0%) | 0 (0.0%) |
| Total (Overall) | 111 (47.6%) | 122 (52.4%) |
Employment Industries by Sex in Chalfant
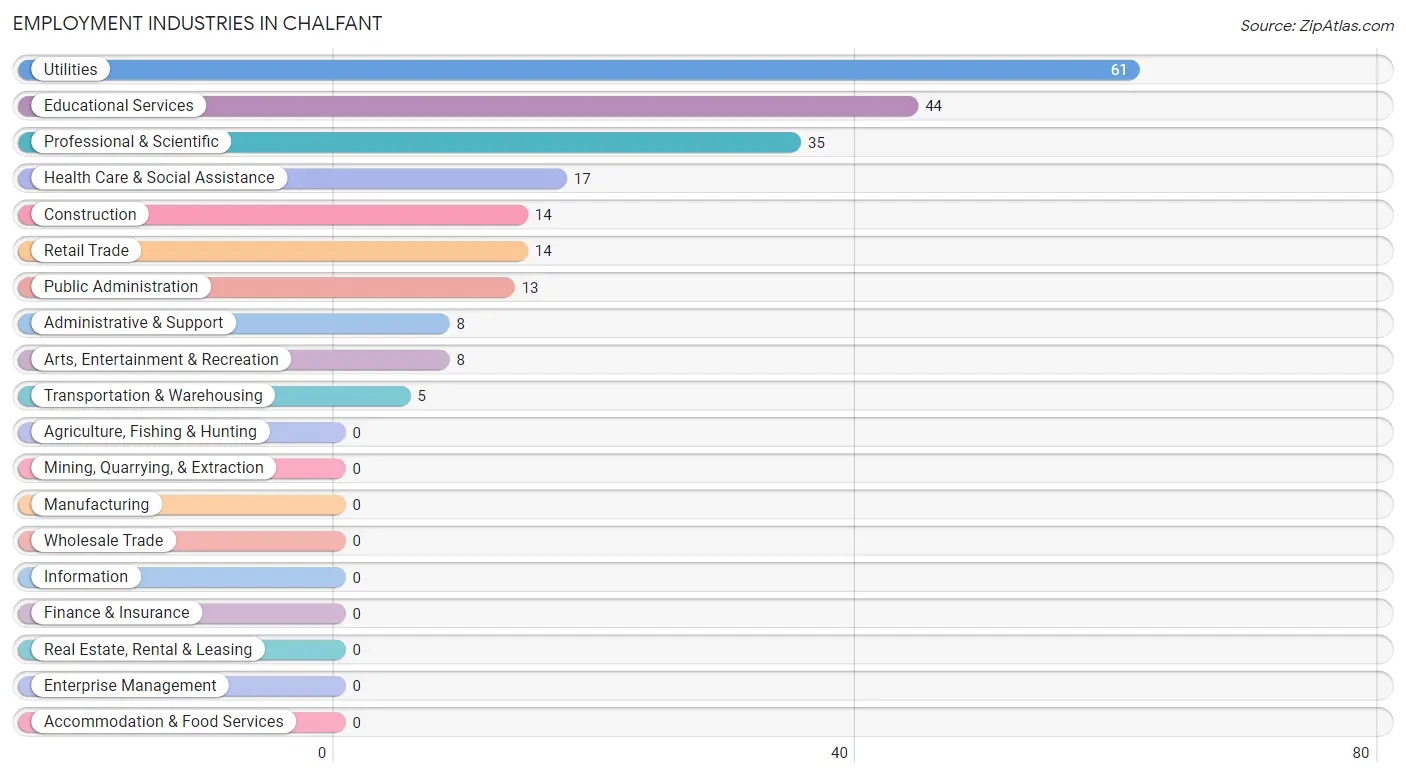
Employment Industries in Chalfant
The major employment industries in Chalfant include Utilities (61 | 26.2%), Educational Services (44 | 18.9%), Professional & Scientific (35 | 15.0%), Health Care & Social Assistance (17 | 7.3%), and Construction (14 | 6.0%).
Employment Industries by Sex in Chalfant
The Chalfant industries that see more men than women are Construction (100.0%), Utilities (100.0%), and Administrative & Support (100.0%), whereas the industries that tend to have a higher number of women are Transportation & Warehousing (100.0%), Professional & Scientific (100.0%), and Educational Services (100.0%).
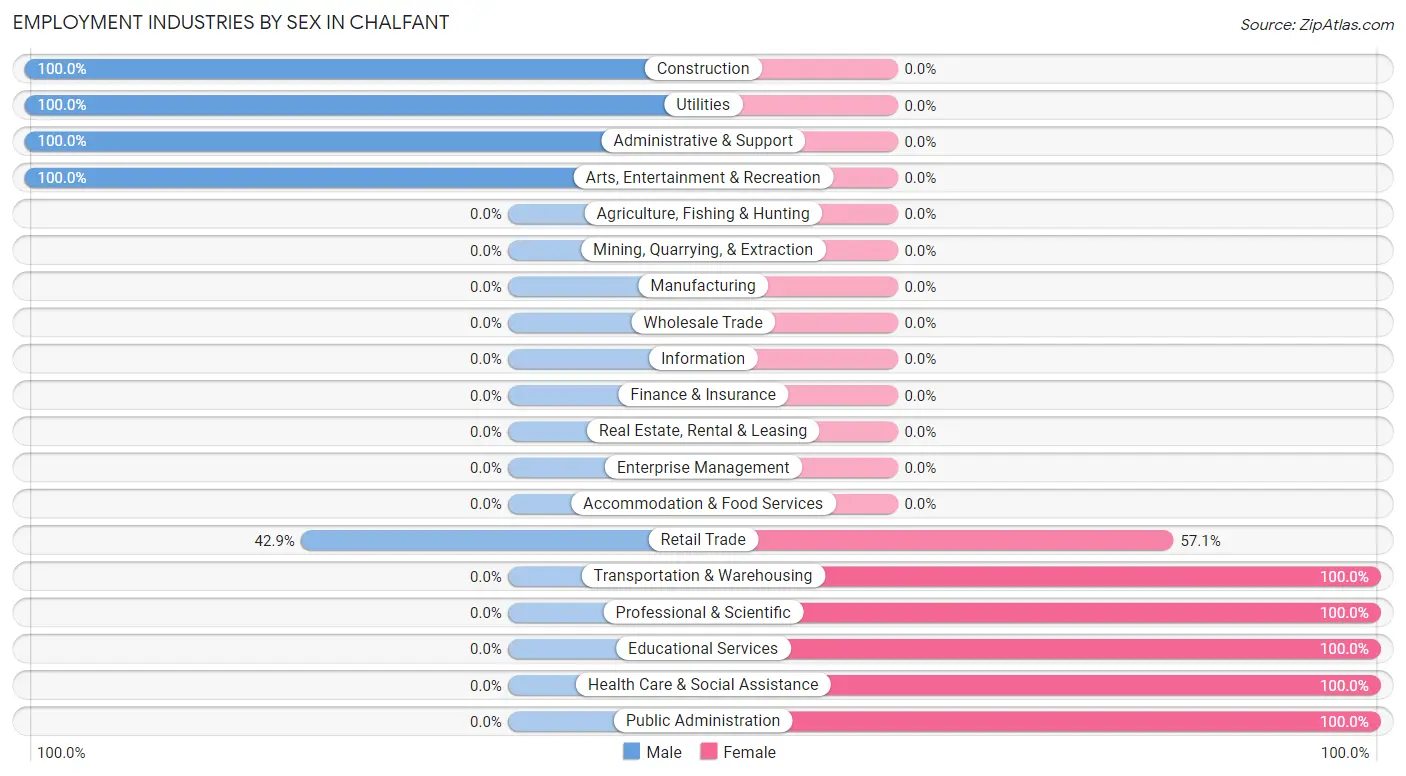
| Industry | Male | Female |
| Agriculture, Fishing & Hunting | 0 (0.0%) | 0 (0.0%) |
| Mining, Quarrying, & Extraction | 0 (0.0%) | 0 (0.0%) |
| Construction | 14 (100.0%) | 0 (0.0%) |
| Manufacturing | 0 (0.0%) | 0 (0.0%) |
| Wholesale Trade | 0 (0.0%) | 0 (0.0%) |
| Retail Trade | 6 (42.9%) | 8 (57.1%) |
| Transportation & Warehousing | 0 (0.0%) | 5 (100.0%) |
| Utilities | 61 (100.0%) | 0 (0.0%) |
| Information | 0 (0.0%) | 0 (0.0%) |
| Finance & Insurance | 0 (0.0%) | 0 (0.0%) |
| Real Estate, Rental & Leasing | 0 (0.0%) | 0 (0.0%) |
| Professional & Scientific | 0 (0.0%) | 35 (100.0%) |
| Enterprise Management | 0 (0.0%) | 0 (0.0%) |
| Administrative & Support | 8 (100.0%) | 0 (0.0%) |
| Educational Services | 0 (0.0%) | 44 (100.0%) |
| Health Care & Social Assistance | 0 (0.0%) | 17 (100.0%) |
| Arts, Entertainment & Recreation | 8 (100.0%) | 0 (0.0%) |
| Accommodation & Food Services | 0 (0.0%) | 0 (0.0%) |
| Public Administration | 0 (0.0%) | 13 (100.0%) |
| Total | 111 (47.6%) | 122 (52.4%) |
Education in Chalfant
School Enrollment in Chalfant
The most common levels of schooling among the 89 students in Chalfant are college / undergraduate (30 | 33.7%), high school (22 | 24.7%), and nursery / preschool (14 | 15.7%).
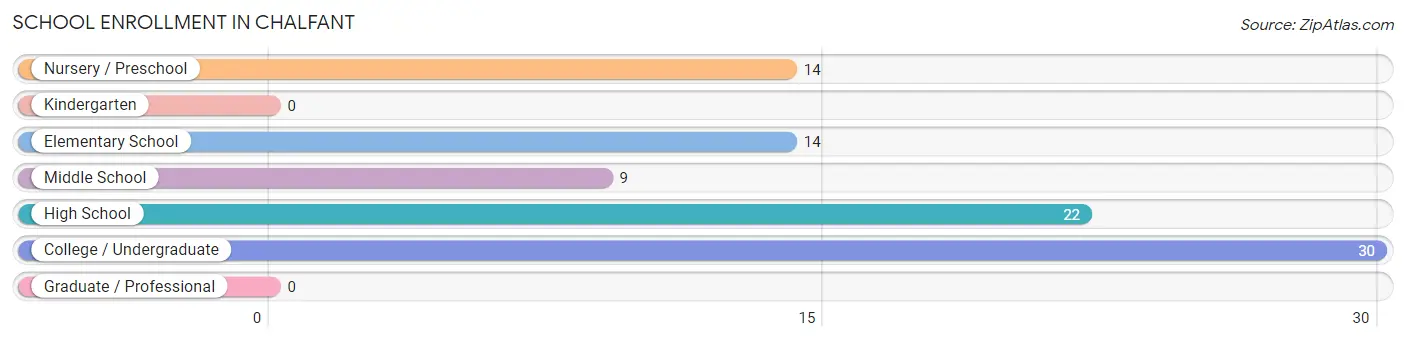
| School Level | # Students | % Students |
| Nursery / Preschool | 14 | 15.7% |
| Kindergarten | 0 | 0.0% |
| Elementary School | 14 | 15.7% |
| Middle School | 9 | 10.1% |
| High School | 22 | 24.7% |
| College / Undergraduate | 30 | 33.7% |
| Graduate / Professional | 0 | 0.0% |
| Total | 89 | 100.0% |
School Enrollment by Age by Funding Source in Chalfant
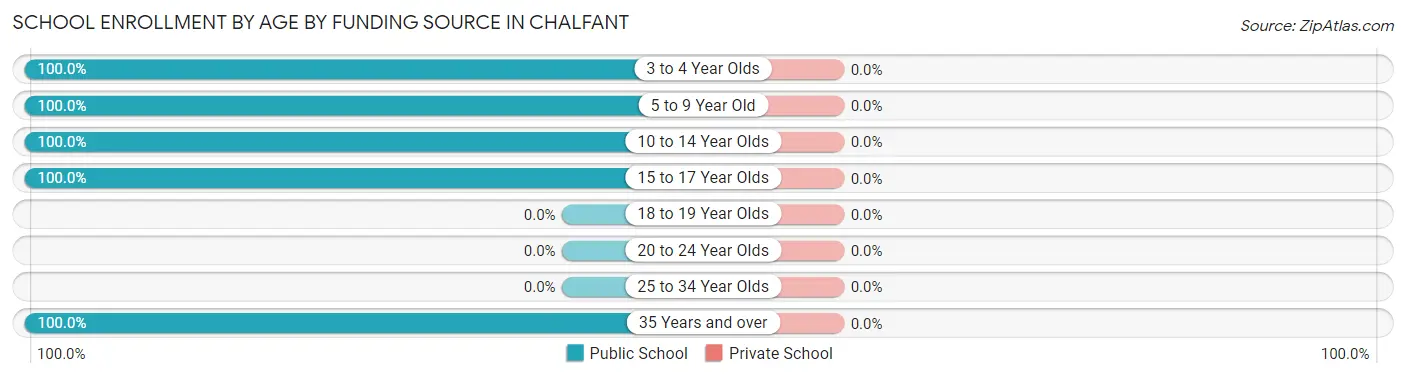
| Age Bracket | Public School | Private School |
| 3 to 4 Year Olds | 14 (100.0%) | 0 (0.0%) |
| 5 to 9 Year Old | 14 (100.0%) | 0 (0.0%) |
| 10 to 14 Year Olds | 13 (100.0%) | 0 (0.0%) |
| 15 to 17 Year Olds | 36 (100.0%) | 0 (0.0%) |
| 18 to 19 Year Olds | 0 (0.0%) | 0 (0.0%) |
| 20 to 24 Year Olds | 0 (0.0%) | 0 (0.0%) |
| 25 to 34 Year Olds | 0 (0.0%) | 0 (0.0%) |
| 35 Years and over | 12 (100.0%) | 0 (0.0%) |
| Total | 89 (100.0%) | 0 (0.0%) |
Educational Attainment by Field of Study in Chalfant
Education (72 | 47.1%), psychology (28 | 18.3%), bio, nature & agricultural (16 | 10.5%), social sciences (14 | 9.1%), and engineering (11 | 7.2%) are the most common fields of study among 153 individuals in Chalfant who have obtained a bachelor's degree or higher.
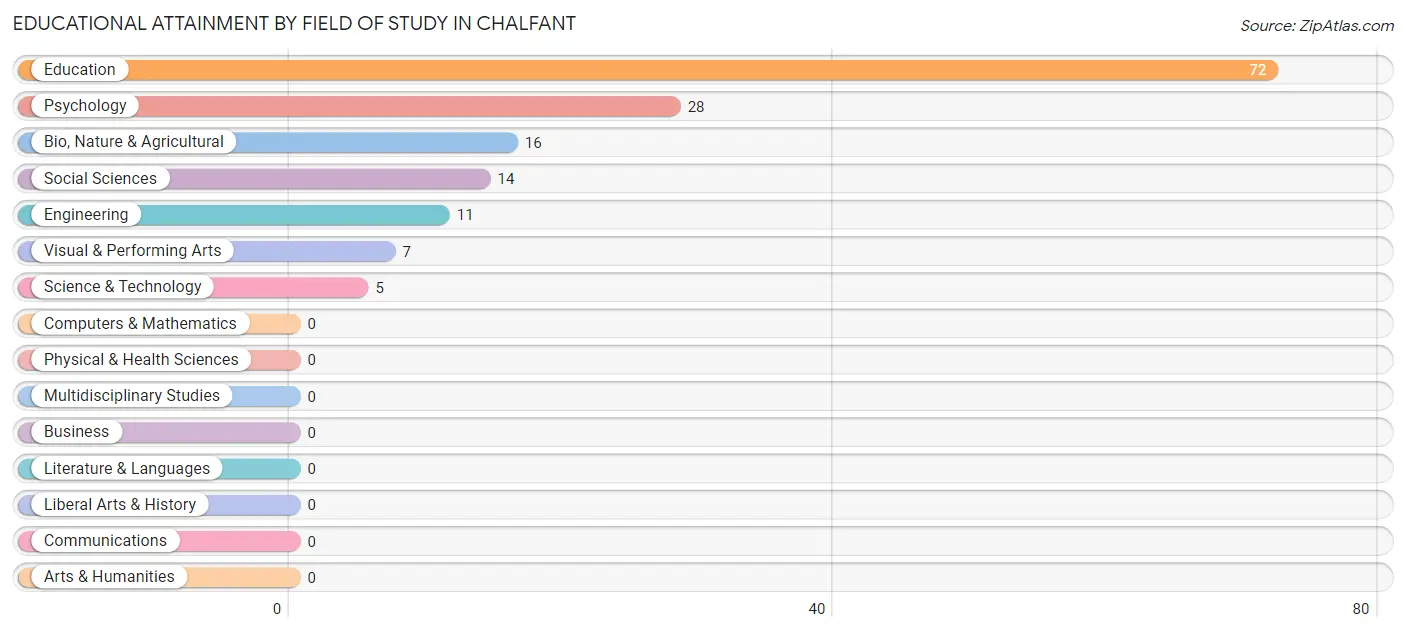
| Field of Study | # Graduates | % Graduates |
| Computers & Mathematics | 0 | 0.0% |
| Bio, Nature & Agricultural | 16 | 10.5% |
| Physical & Health Sciences | 0 | 0.0% |
| Psychology | 28 | 18.3% |
| Social Sciences | 14 | 9.1% |
| Engineering | 11 | 7.2% |
| Multidisciplinary Studies | 0 | 0.0% |
| Science & Technology | 5 | 3.3% |
| Business | 0 | 0.0% |
| Education | 72 | 47.1% |
| Literature & Languages | 0 | 0.0% |
| Liberal Arts & History | 0 | 0.0% |
| Visual & Performing Arts | 7 | 4.6% |
| Communications | 0 | 0.0% |
| Arts & Humanities | 0 | 0.0% |
| Total | 153 | 100.0% |
Transportation & Commute in Chalfant
Vehicle Availability by Sex in Chalfant
The most prevalent vehicle ownership categories in Chalfant are males with 3 vehicles (111, accounting for 100.0%) and females with 3 vehicles (58, making up 91.0%).
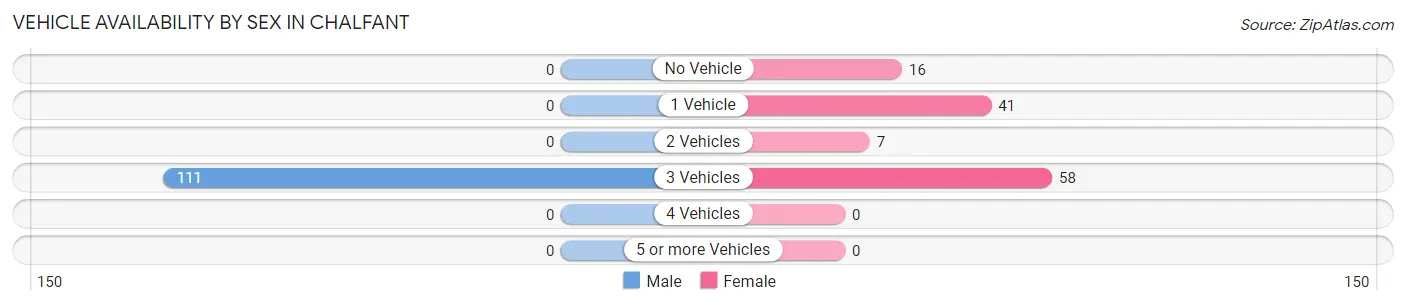
| Vehicles Available | Male | Female |
| No Vehicle | 0 (0.0%) | 16 (13.1%) |
| 1 Vehicle | 0 (0.0%) | 41 (33.6%) |
| 2 Vehicles | 0 (0.0%) | 7 (5.7%) |
| 3 Vehicles | 111 (100.0%) | 58 (47.5%) |
| 4 Vehicles | 0 (0.0%) | 0 (0.0%) |
| 5 or more Vehicles | 0 (0.0%) | 0 (0.0%) |
| Total | 111 (100.0%) | 122 (100.0%) |
Commute Time in Chalfant
The most frequently occuring commute durations in Chalfant are 20 to 24 minutes (74 commuters, 34.1%), 15 to 19 minutes (46 commuters, 21.2%), and 60 to 89 minutes (28 commuters, 12.9%).
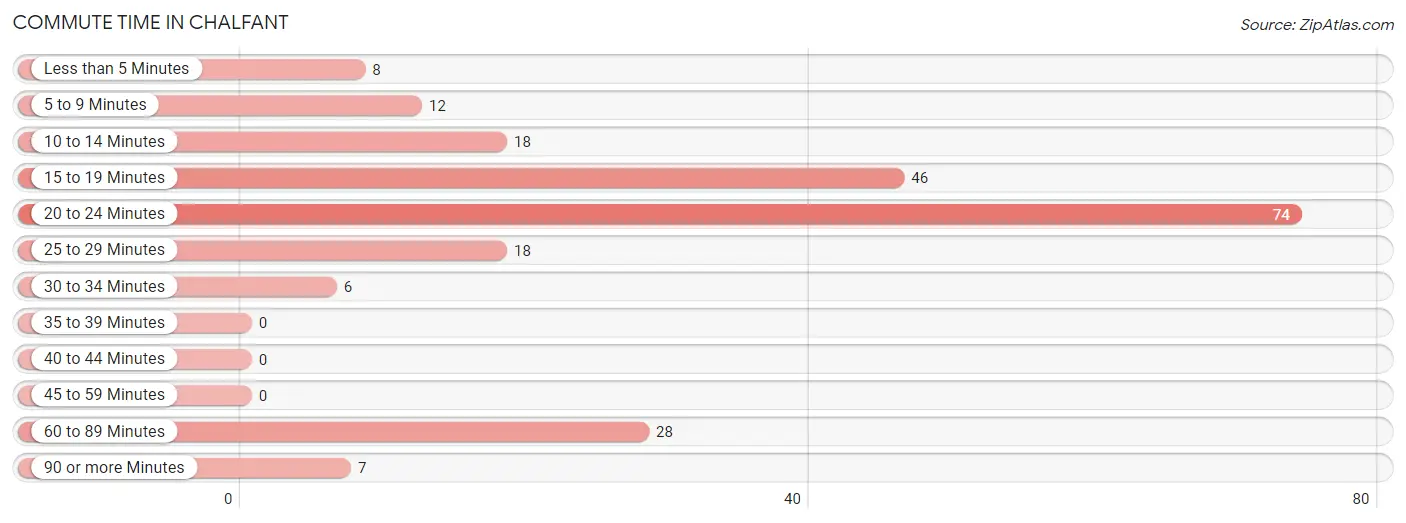
| Commute Time | # Commuters | % Commuters |
| Less than 5 Minutes | 8 | 3.7% |
| 5 to 9 Minutes | 12 | 5.5% |
| 10 to 14 Minutes | 18 | 8.3% |
| 15 to 19 Minutes | 46 | 21.2% |
| 20 to 24 Minutes | 74 | 34.1% |
| 25 to 29 Minutes | 18 | 8.3% |
| 30 to 34 Minutes | 6 | 2.8% |
| 35 to 39 Minutes | 0 | 0.0% |
| 40 to 44 Minutes | 0 | 0.0% |
| 45 to 59 Minutes | 0 | 0.0% |
| 60 to 89 Minutes | 28 | 12.9% |
| 90 or more Minutes | 7 | 3.2% |
Commute Time by Sex in Chalfant
The most common commute times in Chalfant are 20 to 24 minutes (69 commuters, 62.2%) for males and 60 to 89 minutes (28 commuters, 26.4%) for females.
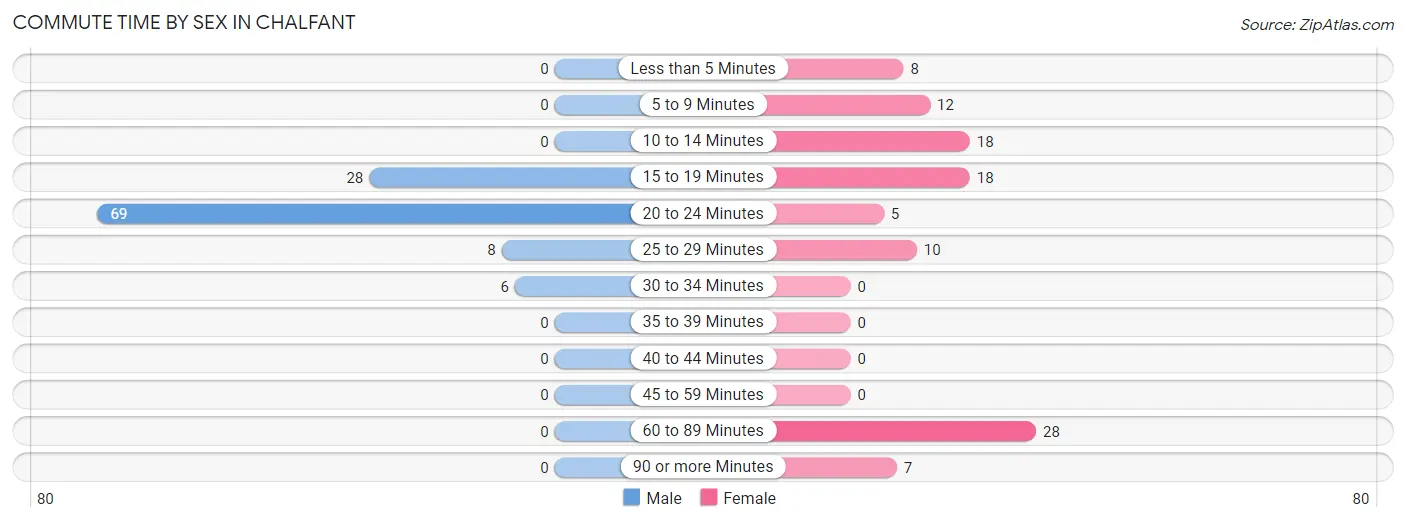
| Commute Time | Male | Female |
| Less than 5 Minutes | 0 (0.0%) | 8 (7.5%) |
| 5 to 9 Minutes | 0 (0.0%) | 12 (11.3%) |
| 10 to 14 Minutes | 0 (0.0%) | 18 (17.0%) |
| 15 to 19 Minutes | 28 (25.2%) | 18 (17.0%) |
| 20 to 24 Minutes | 69 (62.2%) | 5 (4.7%) |
| 25 to 29 Minutes | 8 (7.2%) | 10 (9.4%) |
| 30 to 34 Minutes | 6 (5.4%) | 0 (0.0%) |
| 35 to 39 Minutes | 0 (0.0%) | 0 (0.0%) |
| 40 to 44 Minutes | 0 (0.0%) | 0 (0.0%) |
| 45 to 59 Minutes | 0 (0.0%) | 0 (0.0%) |
| 60 to 89 Minutes | 0 (0.0%) | 28 (26.4%) |
| 90 or more Minutes | 0 (0.0%) | 7 (6.6%) |
Time of Departure to Work by Sex in Chalfant
The most frequent times of departure to work in Chalfant are 9:00 AM to 9:59 AM (61, 54.9%) for males and 8:00 AM to 8:29 AM (28, 26.4%) for females.
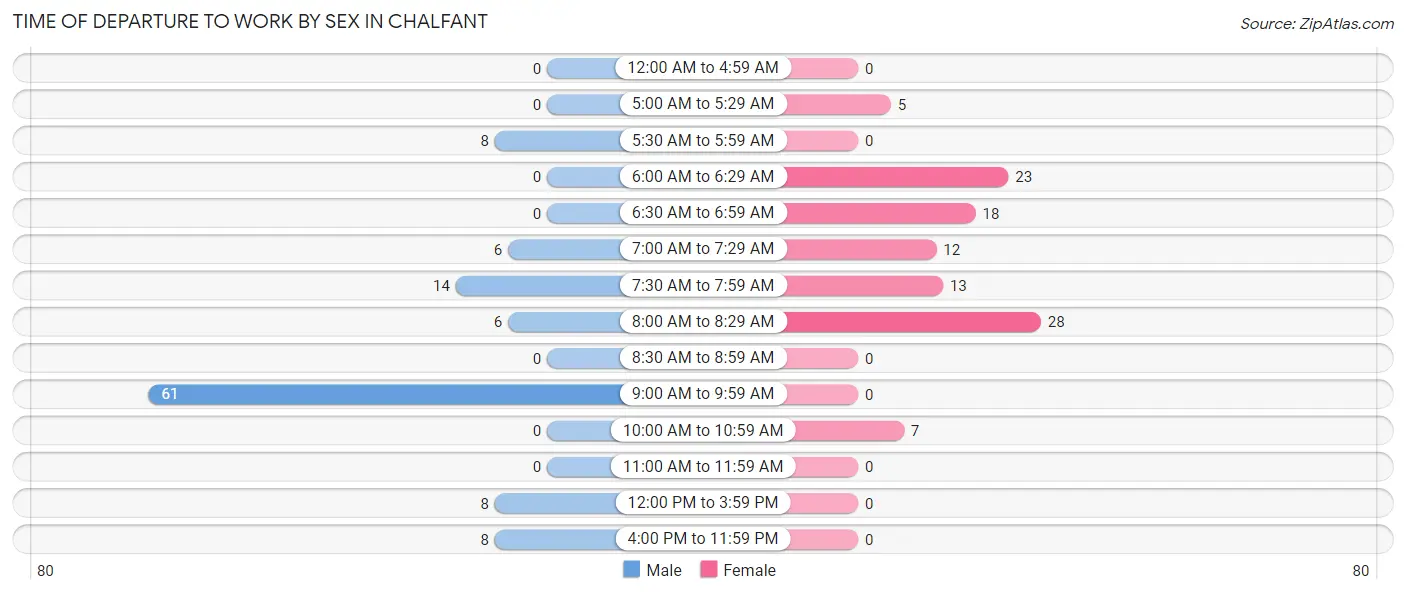
| Time of Departure | Male | Female |
| 12:00 AM to 4:59 AM | 0 (0.0%) | 0 (0.0%) |
| 5:00 AM to 5:29 AM | 0 (0.0%) | 5 (4.7%) |
| 5:30 AM to 5:59 AM | 8 (7.2%) | 0 (0.0%) |
| 6:00 AM to 6:29 AM | 0 (0.0%) | 23 (21.7%) |
| 6:30 AM to 6:59 AM | 0 (0.0%) | 18 (17.0%) |
| 7:00 AM to 7:29 AM | 6 (5.4%) | 12 (11.3%) |
| 7:30 AM to 7:59 AM | 14 (12.6%) | 13 (12.3%) |
| 8:00 AM to 8:29 AM | 6 (5.4%) | 28 (26.4%) |
| 8:30 AM to 8:59 AM | 0 (0.0%) | 0 (0.0%) |
| 9:00 AM to 9:59 AM | 61 (54.9%) | 0 (0.0%) |
| 10:00 AM to 10:59 AM | 0 (0.0%) | 7 (6.6%) |
| 11:00 AM to 11:59 AM | 0 (0.0%) | 0 (0.0%) |
| 12:00 PM to 3:59 PM | 8 (7.2%) | 0 (0.0%) |
| 4:00 PM to 11:59 PM | 8 (7.2%) | 0 (0.0%) |
| Total | 111 (100.0%) | 106 (100.0%) |
Housing Occupancy in Chalfant
Occupancy by Ownership in Chalfant
Of the total 212 dwellings in Chalfant, owner-occupied units account for 193 (91.0%), while renter-occupied units make up 19 (9.0%).
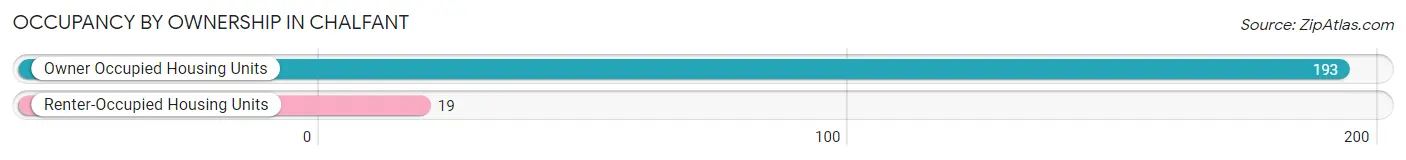
| Occupancy | # Housing Units | % Housing Units |
| Owner Occupied Housing Units | 193 | 91.0% |
| Renter-Occupied Housing Units | 19 | 9.0% |
| Total Occupied Housing Units | 212 | 100.0% |
Occupancy by Household Size in Chalfant
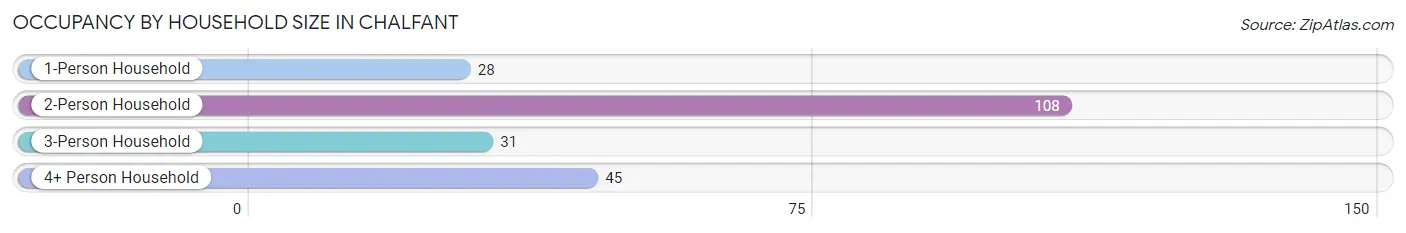
| Household Size | # Housing Units | % Housing Units |
| 1-Person Household | 28 | 13.2% |
| 2-Person Household | 108 | 50.9% |
| 3-Person Household | 31 | 14.6% |
| 4+ Person Household | 45 | 21.2% |
| Total Housing Units | 212 | 100.0% |
Occupancy by Ownership by Household Size in Chalfant
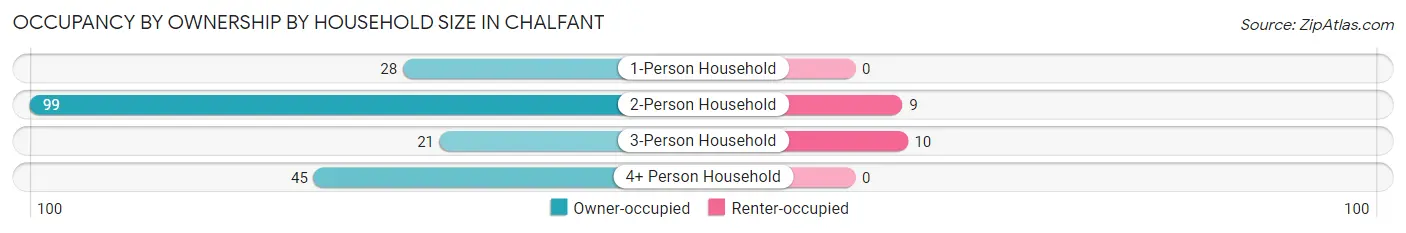
| Household Size | Owner-occupied | Renter-occupied |
| 1-Person Household | 28 (100.0%) | 0 (0.0%) |
| 2-Person Household | 99 (91.7%) | 9 (8.3%) |
| 3-Person Household | 21 (67.7%) | 10 (32.3%) |
| 4+ Person Household | 45 (100.0%) | 0 (0.0%) |
| Total Housing Units | 193 (91.0%) | 19 (9.0%) |
Occupancy by Educational Attainment in Chalfant
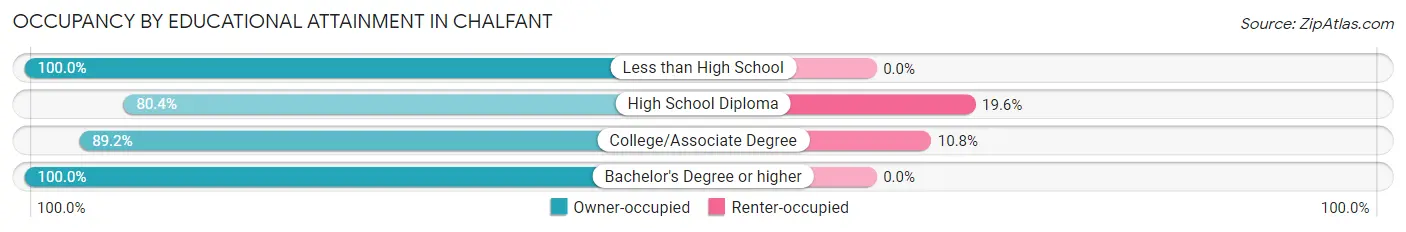
| Household Size | Owner-occupied | Renter-occupied |
| Less than High School | 9 (100.0%) | 0 (0.0%) |
| High School Diploma | 41 (80.4%) | 10 (19.6%) |
| College/Associate Degree | 74 (89.2%) | 9 (10.8%) |
| Bachelor's Degree or higher | 69 (100.0%) | 0 (0.0%) |
Occupancy by Age of Householder in Chalfant
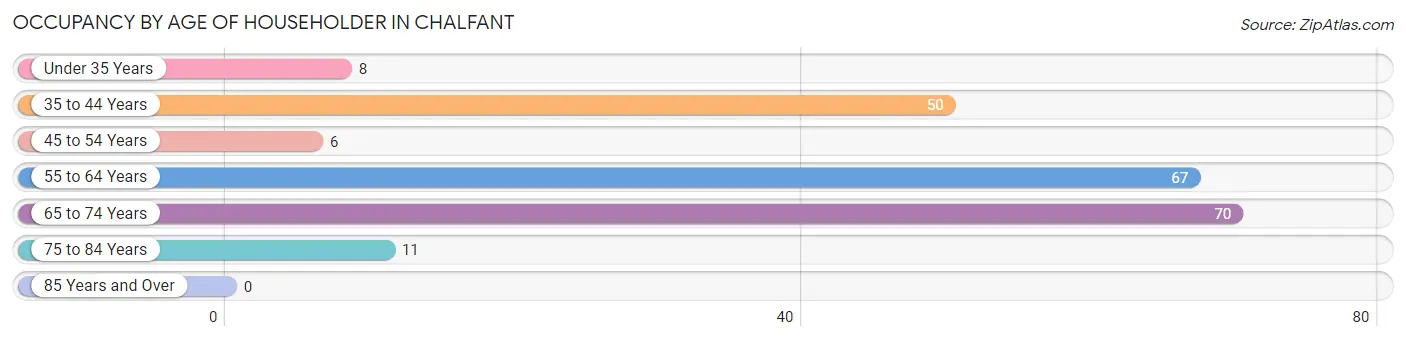
| Age Bracket | # Households | % Households |
| Under 35 Years | 8 | 3.8% |
| 35 to 44 Years | 50 | 23.6% |
| 45 to 54 Years | 6 | 2.8% |
| 55 to 64 Years | 67 | 31.6% |
| 65 to 74 Years | 70 | 33.0% |
| 75 to 84 Years | 11 | 5.2% |
| 85 Years and Over | 0 | 0.0% |
| Total | 212 | 100.0% |
Housing Finances in Chalfant
Median Income by Occupancy in Chalfant
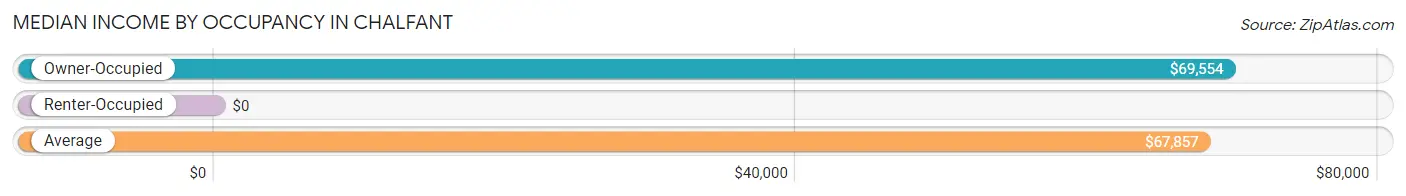
| Occupancy Type | # Households | Median Income |
| Owner-Occupied | 193 (91.0%) | $69,554 |
| Renter-Occupied | 19 (9.0%) | $0 |
| Average | 212 (100.0%) | $67,857 |
Occupancy by Householder Income Bracket in Chalfant
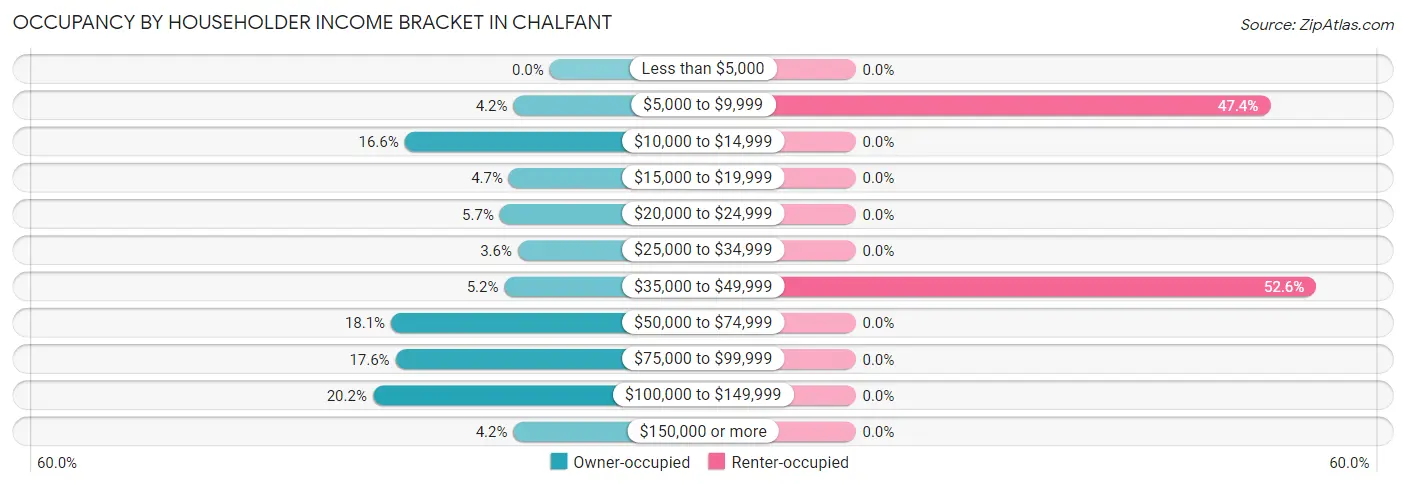
| Income Bracket | Owner-occupied | Renter-occupied |
| Less than $5,000 | 0 (0.0%) | 0 (0.0%) |
| $5,000 to $9,999 | 8 (4.2%) | 9 (47.4%) |
| $10,000 to $14,999 | 32 (16.6%) | 0 (0.0%) |
| $15,000 to $19,999 | 9 (4.7%) | 0 (0.0%) |
| $20,000 to $24,999 | 11 (5.7%) | 0 (0.0%) |
| $25,000 to $34,999 | 7 (3.6%) | 0 (0.0%) |
| $35,000 to $49,999 | 10 (5.2%) | 10 (52.6%) |
| $50,000 to $74,999 | 35 (18.1%) | 0 (0.0%) |
| $75,000 to $99,999 | 34 (17.6%) | 0 (0.0%) |
| $100,000 to $149,999 | 39 (20.2%) | 0 (0.0%) |
| $150,000 or more | 8 (4.2%) | 0 (0.0%) |
| Total | 193 (100.0%) | 19 (100.0%) |
Monthly Housing Cost Tiers in Chalfant
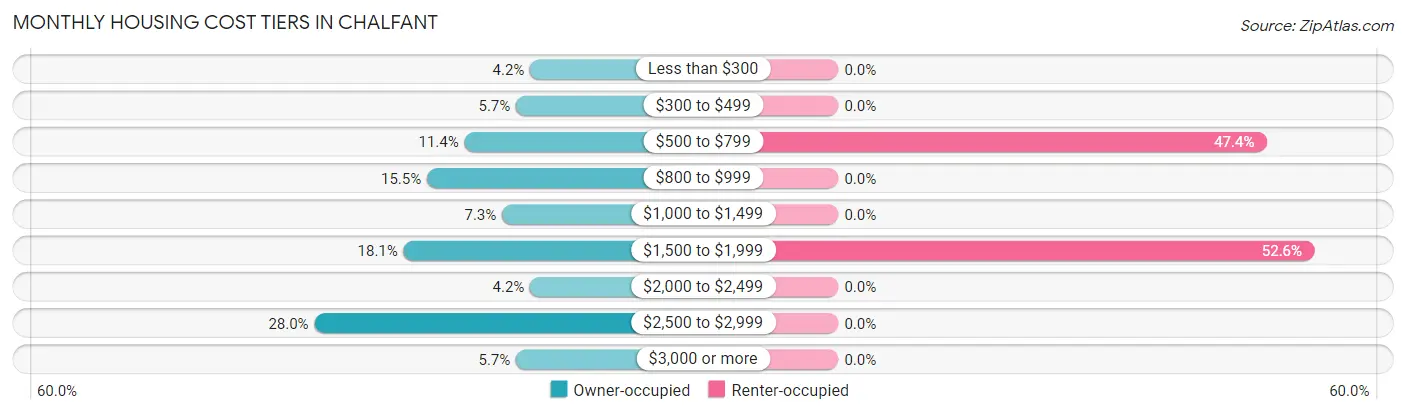
| Monthly Cost | Owner-occupied | Renter-occupied |
| Less than $300 | 8 (4.2%) | 0 (0.0%) |
| $300 to $499 | 11 (5.7%) | 0 (0.0%) |
| $500 to $799 | 22 (11.4%) | 9 (47.4%) |
| $800 to $999 | 30 (15.5%) | 0 (0.0%) |
| $1,000 to $1,499 | 14 (7.2%) | 0 (0.0%) |
| $1,500 to $1,999 | 35 (18.1%) | 10 (52.6%) |
| $2,000 to $2,499 | 8 (4.2%) | 0 (0.0%) |
| $2,500 to $2,999 | 54 (28.0%) | 0 (0.0%) |
| $3,000 or more | 11 (5.7%) | 0 (0.0%) |
| Total | 193 (100.0%) | 19 (100.0%) |
Physical Housing Characteristics in Chalfant
Housing Structures in Chalfant
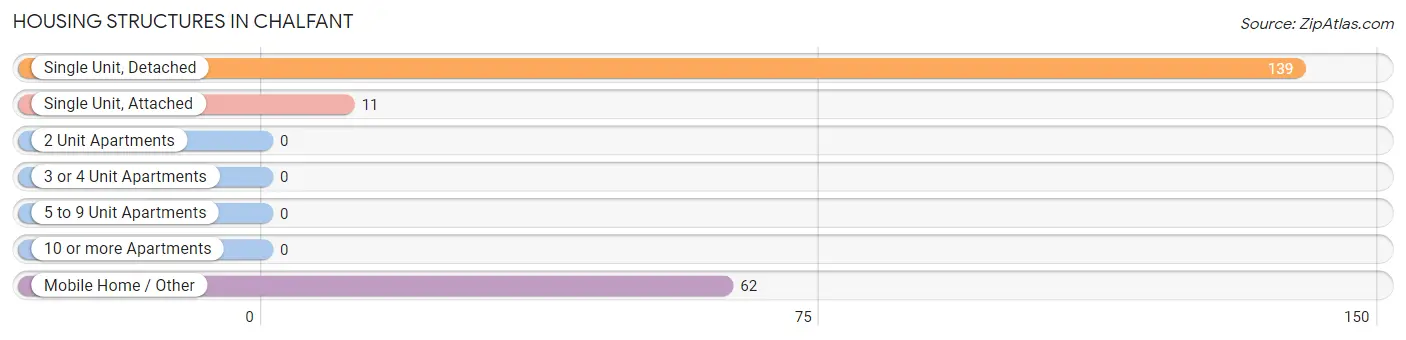
| Structure Type | # Housing Units | % Housing Units |
| Single Unit, Detached | 139 | 65.6% |
| Single Unit, Attached | 11 | 5.2% |
| 2 Unit Apartments | 0 | 0.0% |
| 3 or 4 Unit Apartments | 0 | 0.0% |
| 5 to 9 Unit Apartments | 0 | 0.0% |
| 10 or more Apartments | 0 | 0.0% |
| Mobile Home / Other | 62 | 29.2% |
| Total | 212 | 100.0% |
Housing Structures by Occupancy in Chalfant
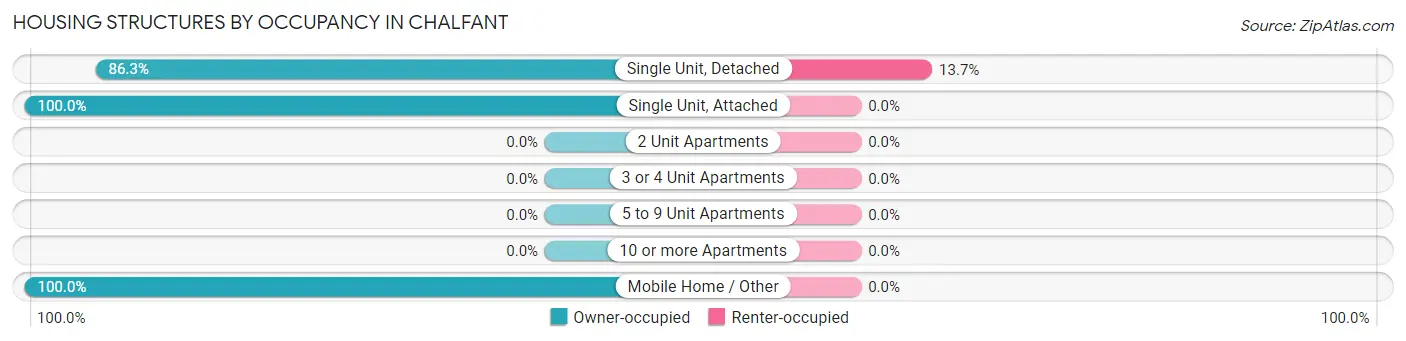
| Structure Type | Owner-occupied | Renter-occupied |
| Single Unit, Detached | 120 (86.3%) | 19 (13.7%) |
| Single Unit, Attached | 11 (100.0%) | 0 (0.0%) |
| 2 Unit Apartments | 0 (0.0%) | 0 (0.0%) |
| 3 or 4 Unit Apartments | 0 (0.0%) | 0 (0.0%) |
| 5 to 9 Unit Apartments | 0 (0.0%) | 0 (0.0%) |
| 10 or more Apartments | 0 (0.0%) | 0 (0.0%) |
| Mobile Home / Other | 62 (100.0%) | 0 (0.0%) |
| Total | 193 (91.0%) | 19 (9.0%) |
Housing Structures by Number of Rooms in Chalfant
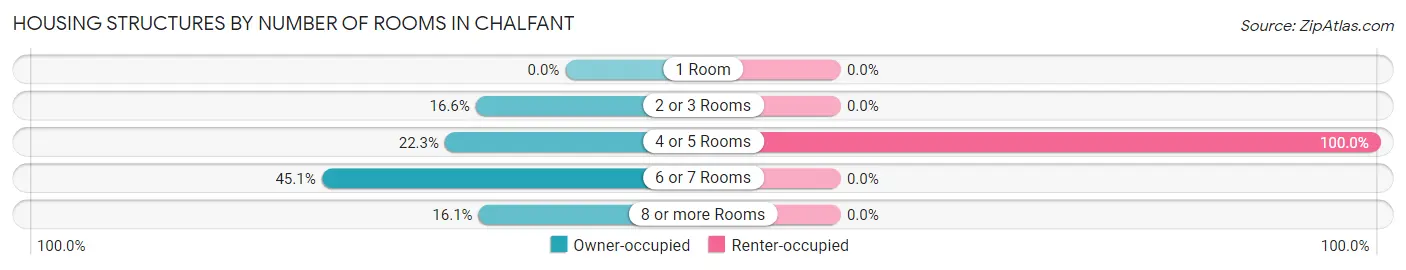
| Number of Rooms | Owner-occupied | Renter-occupied |
| 1 Room | 0 (0.0%) | 0 (0.0%) |
| 2 or 3 Rooms | 32 (16.6%) | 0 (0.0%) |
| 4 or 5 Rooms | 43 (22.3%) | 19 (100.0%) |
| 6 or 7 Rooms | 87 (45.1%) | 0 (0.0%) |
| 8 or more Rooms | 31 (16.1%) | 0 (0.0%) |
| Total | 193 (100.0%) | 19 (100.0%) |
Housing Structure by Heating Type in Chalfant
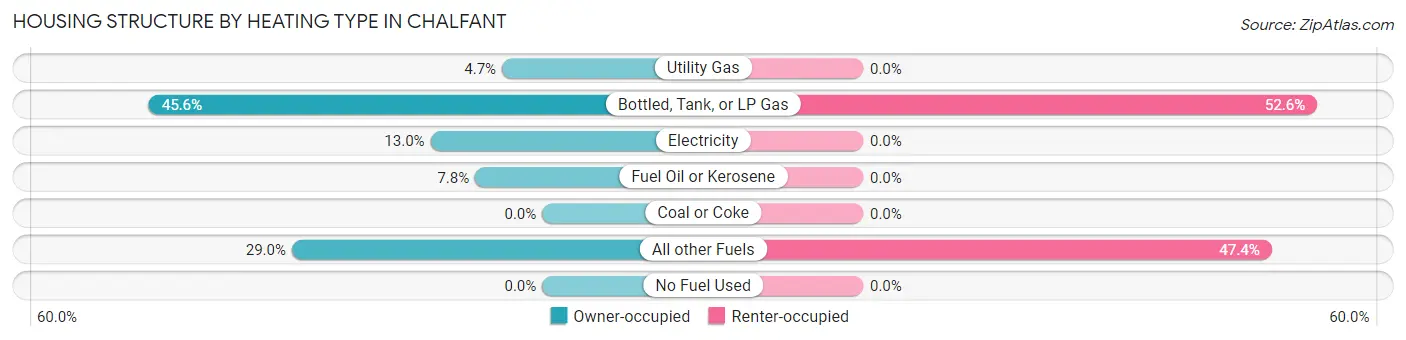
| Heating Type | Owner-occupied | Renter-occupied |
| Utility Gas | 9 (4.7%) | 0 (0.0%) |
| Bottled, Tank, or LP Gas | 88 (45.6%) | 10 (52.6%) |
| Electricity | 25 (13.0%) | 0 (0.0%) |
| Fuel Oil or Kerosene | 15 (7.8%) | 0 (0.0%) |
| Coal or Coke | 0 (0.0%) | 0 (0.0%) |
| All other Fuels | 56 (29.0%) | 9 (47.4%) |
| No Fuel Used | 0 (0.0%) | 0 (0.0%) |
| Total | 193 (100.0%) | 19 (100.0%) |
Household Vehicle Usage in Chalfant
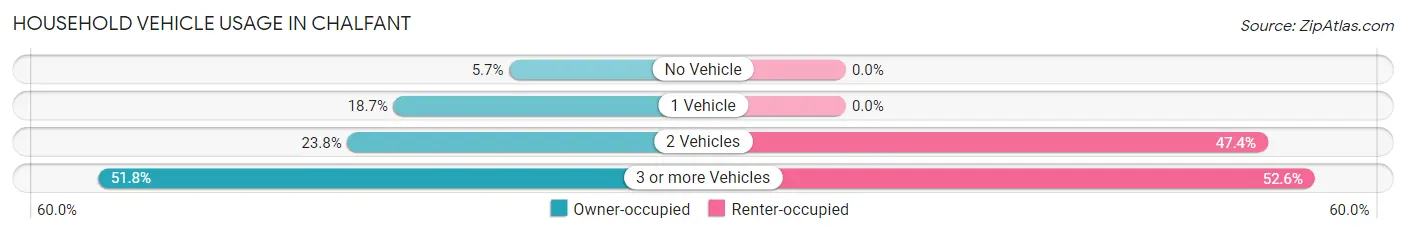
| Vehicles per Household | Owner-occupied | Renter-occupied |
| No Vehicle | 11 (5.7%) | 0 (0.0%) |
| 1 Vehicle | 36 (18.6%) | 0 (0.0%) |
| 2 Vehicles | 46 (23.8%) | 9 (47.4%) |
| 3 or more Vehicles | 100 (51.8%) | 10 (52.6%) |
| Total | 193 (100.0%) | 19 (100.0%) |
Real Estate & Mortgages in Chalfant
Real Estate and Mortgage Overview in Chalfant
| Characteristic | Without Mortgage | With Mortgage |
| Housing Units | 62 | 131 |
| Median Property Value | $303,800 | $284,800 |
| Median Household Income | - | - |
| Monthly Housing Costs | $783 | $11 |
| Real Estate Taxes | $1,786 | $0 |
Property Value by Mortgage Status in Chalfant
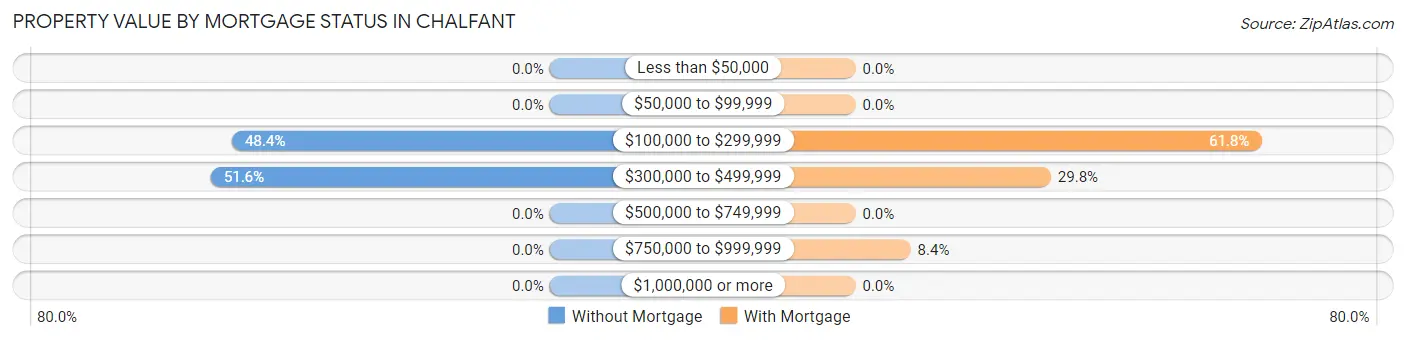
| Property Value | Without Mortgage | With Mortgage |
| Less than $50,000 | 0 (0.0%) | 0 (0.0%) |
| $50,000 to $99,999 | 0 (0.0%) | 0 (0.0%) |
| $100,000 to $299,999 | 30 (48.4%) | 81 (61.8%) |
| $300,000 to $499,999 | 32 (51.6%) | 39 (29.8%) |
| $500,000 to $749,999 | 0 (0.0%) | 0 (0.0%) |
| $750,000 to $999,999 | 0 (0.0%) | 11 (8.4%) |
| $1,000,000 or more | 0 (0.0%) | 0 (0.0%) |
| Total | 62 (100.0%) | 131 (100.0%) |
Household Income by Mortgage Status in Chalfant
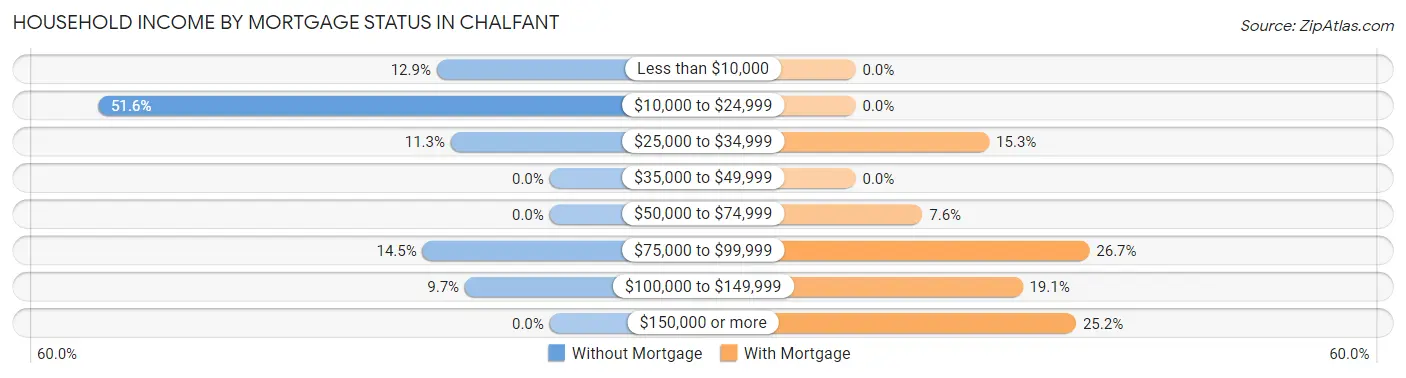
| Household Income | Without Mortgage | With Mortgage |
| Less than $10,000 | 8 (12.9%) | 0 (0.0%) |
| $10,000 to $24,999 | 32 (51.6%) | 0 (0.0%) |
| $25,000 to $34,999 | 7 (11.3%) | 20 (15.3%) |
| $35,000 to $49,999 | 0 (0.0%) | 0 (0.0%) |
| $50,000 to $74,999 | 0 (0.0%) | 10 (7.6%) |
| $75,000 to $99,999 | 9 (14.5%) | 35 (26.7%) |
| $100,000 to $149,999 | 6 (9.7%) | 25 (19.1%) |
| $150,000 or more | 0 (0.0%) | 33 (25.2%) |
| Total | 62 (100.0%) | 131 (100.0%) |
Property Value to Household Income Ratio in Chalfant
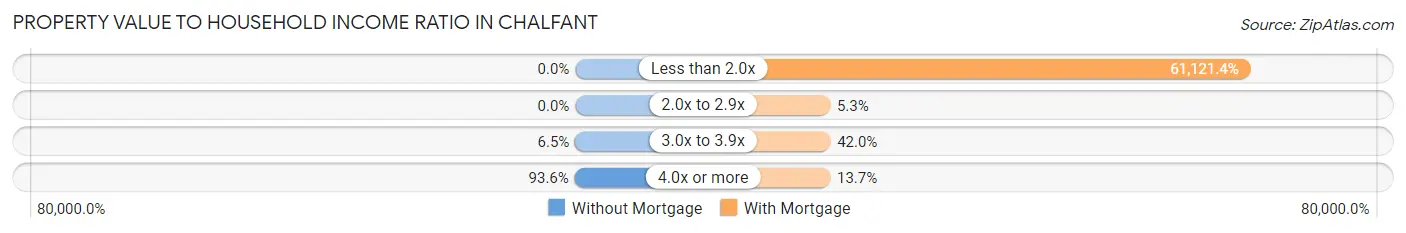
| Value-to-Income Ratio | Without Mortgage | With Mortgage |
| Less than 2.0x | 0 (0.0%) | 80,069 (61,121.4%) |
| 2.0x to 2.9x | 0 (0.0%) | 7 (5.3%) |
| 3.0x to 3.9x | 4 (6.5%) | 55 (42.0%) |
| 4.0x or more | 58 (93.5%) | 18 (13.7%) |
| Total | 62 (100.0%) | 131 (100.0%) |
Real Estate Taxes by Mortgage Status in Chalfant
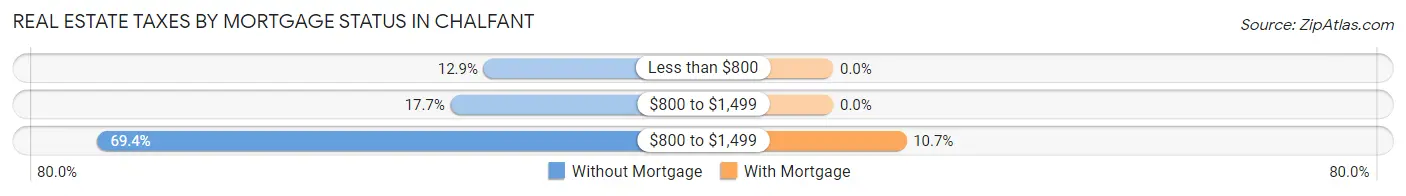
| Property Taxes | Without Mortgage | With Mortgage |
| Less than $800 | 8 (12.9%) | 0 (0.0%) |
| $800 to $1,499 | 11 (17.7%) | 0 (0.0%) |
| $800 to $1,499 | 43 (69.4%) | 14 (10.7%) |
| Total | 62 (100.0%) | 131 (100.0%) |
Health & Disability in Chalfant
Health Insurance Coverage by Age in Chalfant
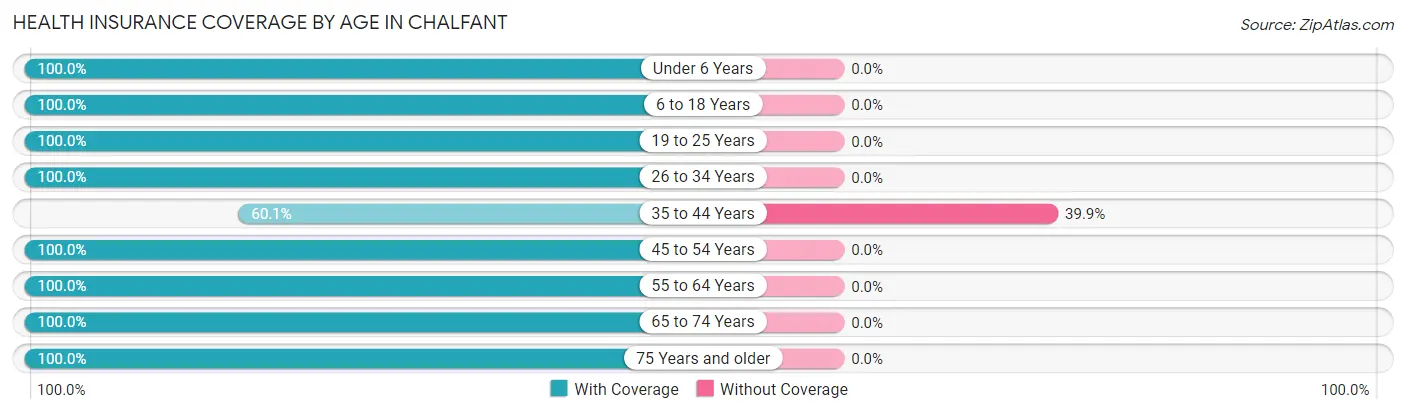
| Age Bracket | With Coverage | Without Coverage |
| Under 6 Years | 14 (100.0%) | 0 (0.0%) |
| 6 to 18 Years | 63 (100.0%) | 0 (0.0%) |
| 19 to 25 Years | 30 (100.0%) | 0 (0.0%) |
| 26 to 34 Years | 34 (100.0%) | 0 (0.0%) |
| 35 to 44 Years | 92 (60.1%) | 61 (39.9%) |
| 45 to 54 Years | 42 (100.0%) | 0 (0.0%) |
| 55 to 64 Years | 127 (100.0%) | 0 (0.0%) |
| 65 to 74 Years | 127 (100.0%) | 0 (0.0%) |
| 75 Years and older | 15 (100.0%) | 0 (0.0%) |
| Total | 544 (89.9%) | 61 (10.1%) |
Health Insurance Coverage by Citizenship Status in Chalfant
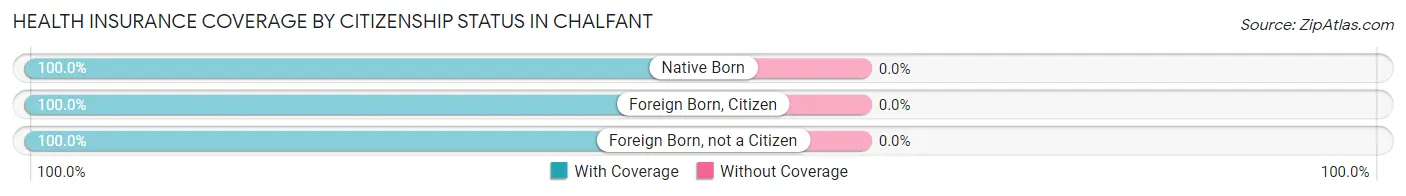
| Citizenship Status | With Coverage | Without Coverage |
| Native Born | 14 (100.0%) | 0 (0.0%) |
| Foreign Born, Citizen | 63 (100.0%) | 0 (0.0%) |
| Foreign Born, not a Citizen | 30 (100.0%) | 0 (0.0%) |
Health Insurance Coverage by Household Income in Chalfant
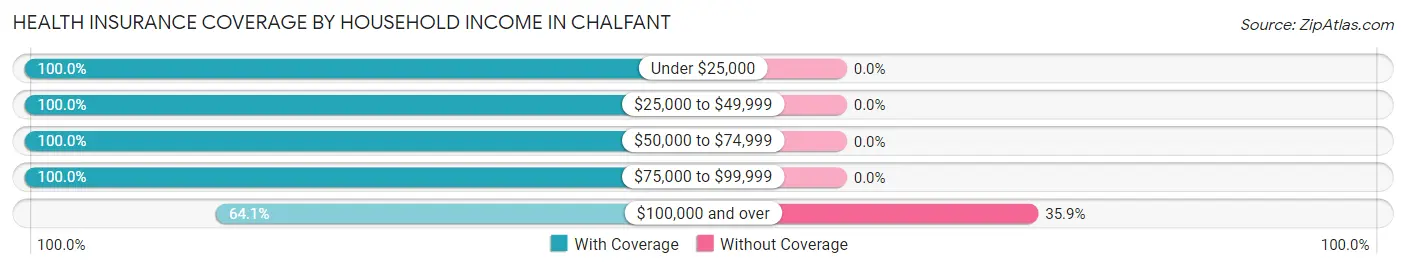
| Household Income | With Coverage | Without Coverage |
| Under $25,000 | 135 (100.0%) | 0 (0.0%) |
| $25,000 to $49,999 | 64 (100.0%) | 0 (0.0%) |
| $50,000 to $74,999 | 139 (100.0%) | 0 (0.0%) |
| $75,000 to $99,999 | 97 (100.0%) | 0 (0.0%) |
| $100,000 and over | 109 (64.1%) | 61 (35.9%) |
Public vs Private Health Insurance Coverage by Age in Chalfant
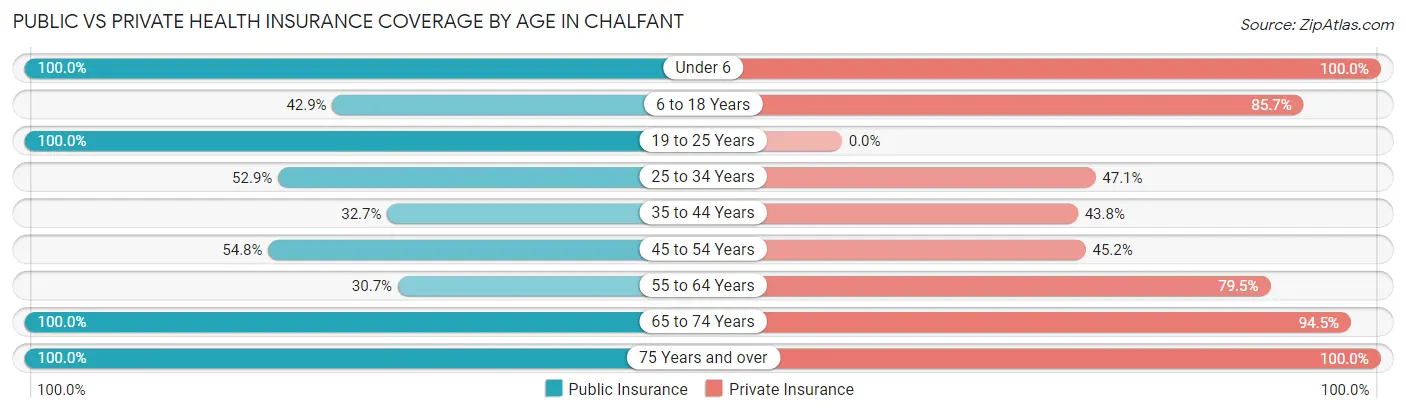
| Age Bracket | Public Insurance | Private Insurance |
| Under 6 | 14 (100.0%) | 14 (100.0%) |
| 6 to 18 Years | 27 (42.9%) | 54 (85.7%) |
| 19 to 25 Years | 30 (100.0%) | 0 (0.0%) |
| 25 to 34 Years | 18 (52.9%) | 16 (47.1%) |
| 35 to 44 Years | 50 (32.7%) | 67 (43.8%) |
| 45 to 54 Years | 23 (54.8%) | 19 (45.2%) |
| 55 to 64 Years | 39 (30.7%) | 101 (79.5%) |
| 65 to 74 Years | 127 (100.0%) | 120 (94.5%) |
| 75 Years and over | 15 (100.0%) | 15 (100.0%) |
| Total | 343 (56.7%) | 406 (67.1%) |
Disability Status by Sex by Age in Chalfant
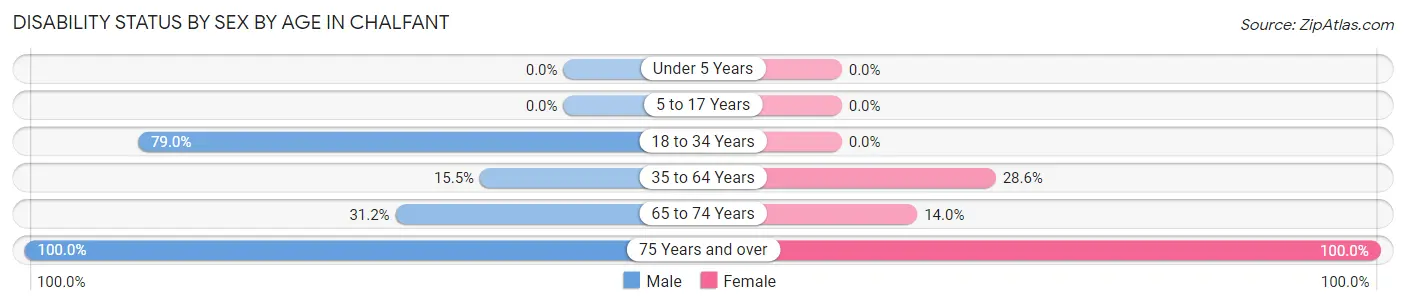
| Age Bracket | Male | Female |
| Under 5 Years | 0 (0.0%) | 0 (0.0%) |
| 5 to 17 Years | 0 (0.0%) | 0 (0.0%) |
| 18 to 34 Years | 30 (78.9%) | 0 (0.0%) |
| 35 to 64 Years | 26 (15.5%) | 44 (28.6%) |
| 65 to 74 Years | 24 (31.2%) | 7 (14.0%) |
| 75 Years and over | 4 (100.0%) | 11 (100.0%) |
Disability Class by Sex by Age in Chalfant
Disability Class: Hearing Difficulty
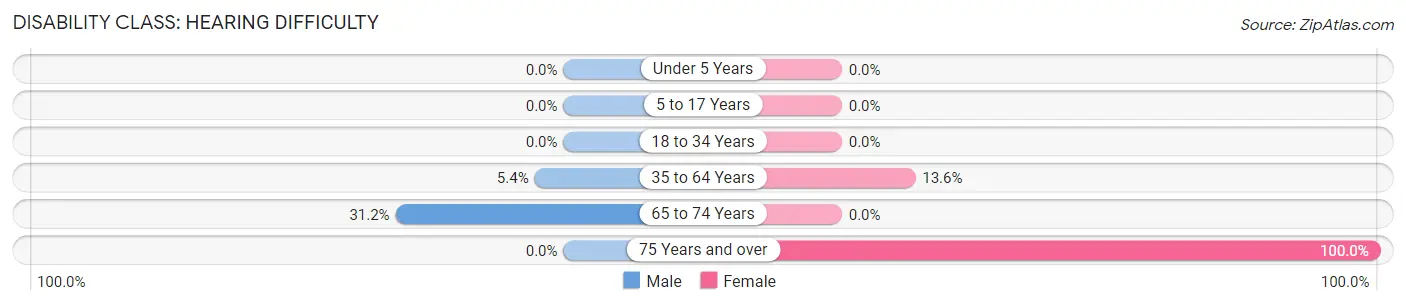
| Age Bracket | Male | Female |
| Under 5 Years | 0 (0.0%) | 0 (0.0%) |
| 5 to 17 Years | 0 (0.0%) | 0 (0.0%) |
| 18 to 34 Years | 0 (0.0%) | 0 (0.0%) |
| 35 to 64 Years | 9 (5.4%) | 21 (13.6%) |
| 65 to 74 Years | 24 (31.2%) | 0 (0.0%) |
| 75 Years and over | 0 (0.0%) | 11 (100.0%) |
Disability Class: Vision Difficulty
| Age Bracket | Male | Female |
| Under 5 Years | 0 (0.0%) | 0 (0.0%) |
| 5 to 17 Years | 0 (0.0%) | 0 (0.0%) |
| 18 to 34 Years | 0 (0.0%) | 0 (0.0%) |
| 35 to 64 Years | 0 (0.0%) | 0 (0.0%) |
| 65 to 74 Years | 0 (0.0%) | 0 (0.0%) |
| 75 Years and over | 0 (0.0%) | 0 (0.0%) |
Disability Class: Cognitive Difficulty
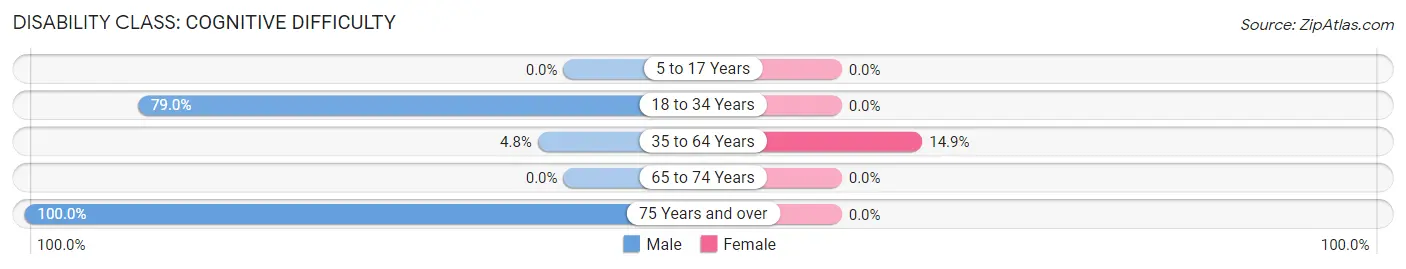
| Age Bracket | Male | Female |
| 5 to 17 Years | 0 (0.0%) | 0 (0.0%) |
| 18 to 34 Years | 30 (78.9%) | 0 (0.0%) |
| 35 to 64 Years | 8 (4.8%) | 23 (14.9%) |
| 65 to 74 Years | 0 (0.0%) | 0 (0.0%) |
| 75 Years and over | 4 (100.0%) | 0 (0.0%) |
Disability Class: Ambulatory Difficulty
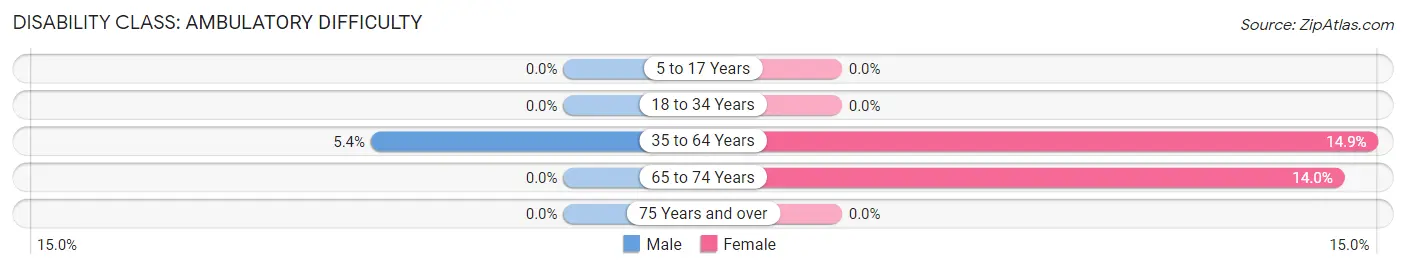
| Age Bracket | Male | Female |
| 5 to 17 Years | 0 (0.0%) | 0 (0.0%) |
| 18 to 34 Years | 0 (0.0%) | 0 (0.0%) |
| 35 to 64 Years | 9 (5.4%) | 23 (14.9%) |
| 65 to 74 Years | 0 (0.0%) | 7 (14.0%) |
| 75 Years and over | 0 (0.0%) | 0 (0.0%) |
Disability Class: Self-Care Difficulty
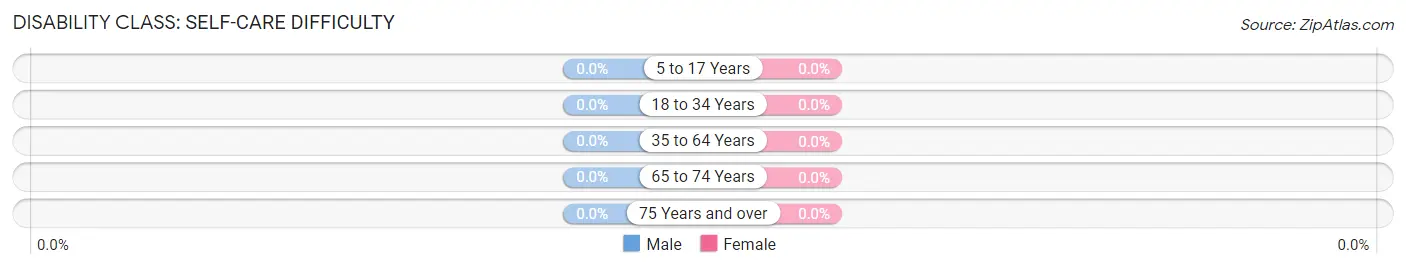
| Age Bracket | Male | Female |
| 5 to 17 Years | 0 (0.0%) | 0 (0.0%) |
| 18 to 34 Years | 0 (0.0%) | 0 (0.0%) |
| 35 to 64 Years | 0 (0.0%) | 0 (0.0%) |
| 65 to 74 Years | 0 (0.0%) | 0 (0.0%) |
| 75 Years and over | 0 (0.0%) | 0 (0.0%) |
Technology Access in Chalfant
Computing Device Access in Chalfant
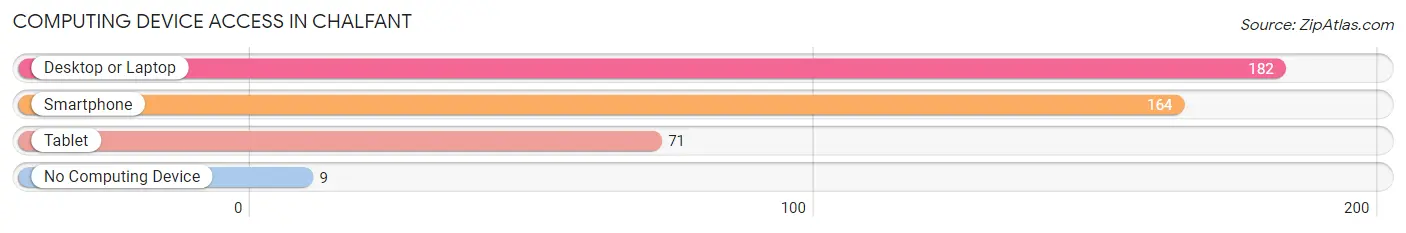
| Device Type | # Households | % Households |
| Desktop or Laptop | 182 | 85.9% |
| Smartphone | 164 | 77.4% |
| Tablet | 71 | 33.5% |
| No Computing Device | 9 | 4.3% |
| Total | 212 | 100.0% |
Internet Access in Chalfant
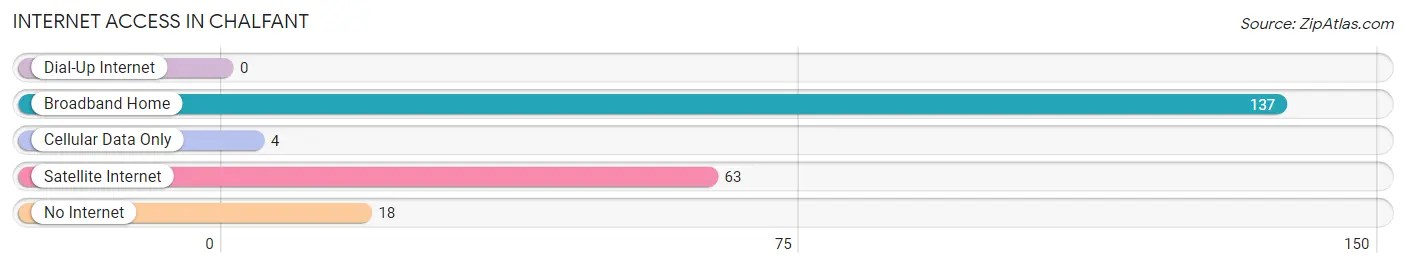
| Internet Type | # Households | % Households |
| Dial-Up Internet | 0 | 0.0% |
| Broadband Home | 137 | 64.6% |
| Cellular Data Only | 4 | 1.9% |
| Satellite Internet | 63 | 29.7% |
| No Internet | 18 | 8.5% |
| Total | 212 | 100.0% |
Chalfant Summary
Chalfant is a small unincorporated community located in the eastern part of Mono County, California. It is situated in the Owens Valley, at the base of the White Mountains, and is surrounded by the Inyo National Forest. The town is located on the eastern side of the Sierra Nevada mountain range, and is approximately 20 miles south of Bishop, California.
History
Chalfant was founded in 1883 by ranchers and miners who were drawn to the area by the abundance of natural resources. The town was named after the Chalfant family, who were among the first settlers in the area. The Chalfant family owned a large ranch in the area, and the town was built around it.
In the early 1900s, Chalfant was a bustling mining town, with several mines in the area producing gold, silver, and other minerals. The town also had a post office, a school, and several stores.
In the 1920s, the mining industry in Chalfant began to decline, and the town's population began to dwindle. By the 1940s, the town was mostly abandoned, and the post office was closed.
In the 1950s, the town was revived when the Los Angeles Department of Water and Power began to build a hydroelectric power plant in the area. The power plant provided jobs for many of the town's residents, and the population began to grow again.
Geography
Chalfant is located in the Owens Valley, at the base of the White Mountains. The town is situated at an elevation of 4,890 feet, and is surrounded by the Inyo National Forest. The town is located on the eastern side of the Sierra Nevada mountain range, and is approximately 20 miles south of Bishop, California.
The climate in Chalfant is semi-arid, with hot summers and cold winters. The average annual temperature is around 50 degrees Fahrenheit, and the average annual precipitation is around 8 inches.
Economy
The economy of Chalfant is largely based on tourism and recreation. The town is a popular destination for hikers, campers, and other outdoor enthusiasts, and there are several campgrounds and trails in the area.
The town is also home to several businesses, including a general store, a gas station, and a restaurant. The Los Angeles Department of Water and Power also operates a hydroelectric power plant in the area, providing jobs for many of the town's residents.
Demographics
As of the 2010 census, the population of Chalfant was 545. The racial makeup of the town was 94.3% White, 0.7% African American, 0.2% Native American, 0.7% Asian, 0.2% Pacific Islander, and 3.1% from other races. The median household income was $37,500, and the median age was 44.5 years.
Common Questions
What is Per Capita Income in Chalfant?
Per Capita income in Chalfant is $24,123.
What is the Median Family Income in Chalfant?
Median Family Income in Chalfant is $72,308.
What is the Median Household income in Chalfant?
Median Household Income in Chalfant is $67,857.
What is Income or Wage Gap in Chalfant?
Income or Wage Gap in Chalfant is 18.0%.
Women in Chalfant earn 82.0 cents for every dollar earned by a man.
What is Inequality or Gini Index in Chalfant?
Inequality or Gini Index in Chalfant is 0.39.
What is the Total Population of Chalfant?
Total Population of Chalfant is 605.
What is the Total Male Population of Chalfant?
Total Male Population of Chalfant is 318.
What is the Total Female Population of Chalfant?
Total Female Population of Chalfant is 287.
What is the Ratio of Males per 100 Females in Chalfant?
There are 110.80 Males per 100 Females in Chalfant.
What is the Ratio of Females per 100 Males in Chalfant?
There are 90.25 Females per 100 Males in Chalfant.
What is the Median Population Age in Chalfant?
Median Population Age in Chalfant is 52.3 Years.
What is the Average Family Size in Chalfant
Average Family Size in Chalfant is 3.1 People.
What is the Average Household Size in Chalfant
Average Household Size in Chalfant is 2.9 People.
How Large is the Labor Force in Chalfant?
There are 259 People in the Labor Forcein in Chalfant.
What is the Percentage of People in the Labor Force in Chalfant?
47.4% of People are in the Labor Force in Chalfant.
What is the Unemployment Rate in Chalfant?
Unemployment Rate in Chalfant is 10.0%.