South Milwaukee, WI Map & Demographics
South Milwaukee Map
South Milwaukee Overview
$35,100
PER CAPITA INCOME
$82,903
AVG FAMILY INCOME
$68,801
AVG HOUSEHOLD INCOME
9.6%
WAGE / INCOME GAP [ % ]
90.4¢/ $1
WAGE / INCOME GAP [ $ ]
$11,216
FAMILY INCOME DEFICIT
0.39
INEQUALITY / GINI INDEX
20,678
TOTAL POPULATION
10,317
MALE POPULATION
10,361
FEMALE POPULATION
99.58
MALES / 100 FEMALES
100.43
FEMALES / 100 MALES
41.6
MEDIAN AGE
3.0
AVG FAMILY SIZE
2.4
AVG HOUSEHOLD SIZE
10,837
LABOR FORCE [ PEOPLE ]
64.7%
PERCENT IN LABOR FORCE
3.5%
UNEMPLOYMENT RATE
South Milwaukee Zip Codes
South Milwaukee Area Codes
Income in South Milwaukee
Income Overview in South Milwaukee
Per Capita Income in South Milwaukee is $35,100, while median incomes of families and households are $82,903 and $68,801 respectively.
| Characteristic | Number | Measure |
| Per Capita Income | 20,678 | $35,100 |
| Median Family Income | 5,225 | $82,903 |
| Mean Family Income | 5,225 | $94,461 |
| Median Household Income | 8,543 | $68,801 |
| Mean Household Income | 8,543 | $81,214 |
| Income Deficit | 5,225 | $11,216 |
| Wage / Income Gap (%) | 20,678 | 9.63% |
| Wage / Income Gap ($) | 20,678 | 90.37¢ per $1 |
| Gini / Inequality Index | 20,678 | 0.39 |
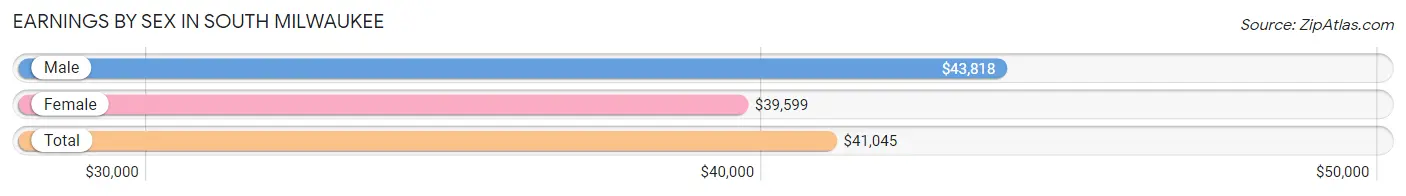
Earnings by Sex in South Milwaukee
Average Earnings in South Milwaukee are $41,045, $43,818 for men and $39,599 for women, a difference of 9.6%.
| Sex | Number | Average Earnings |
| Male | 5,760 (51.4%) | $43,818 |
| Female | 5,452 (48.6%) | $39,599 |
| Total | 11,212 (100.0%) | $41,045 |
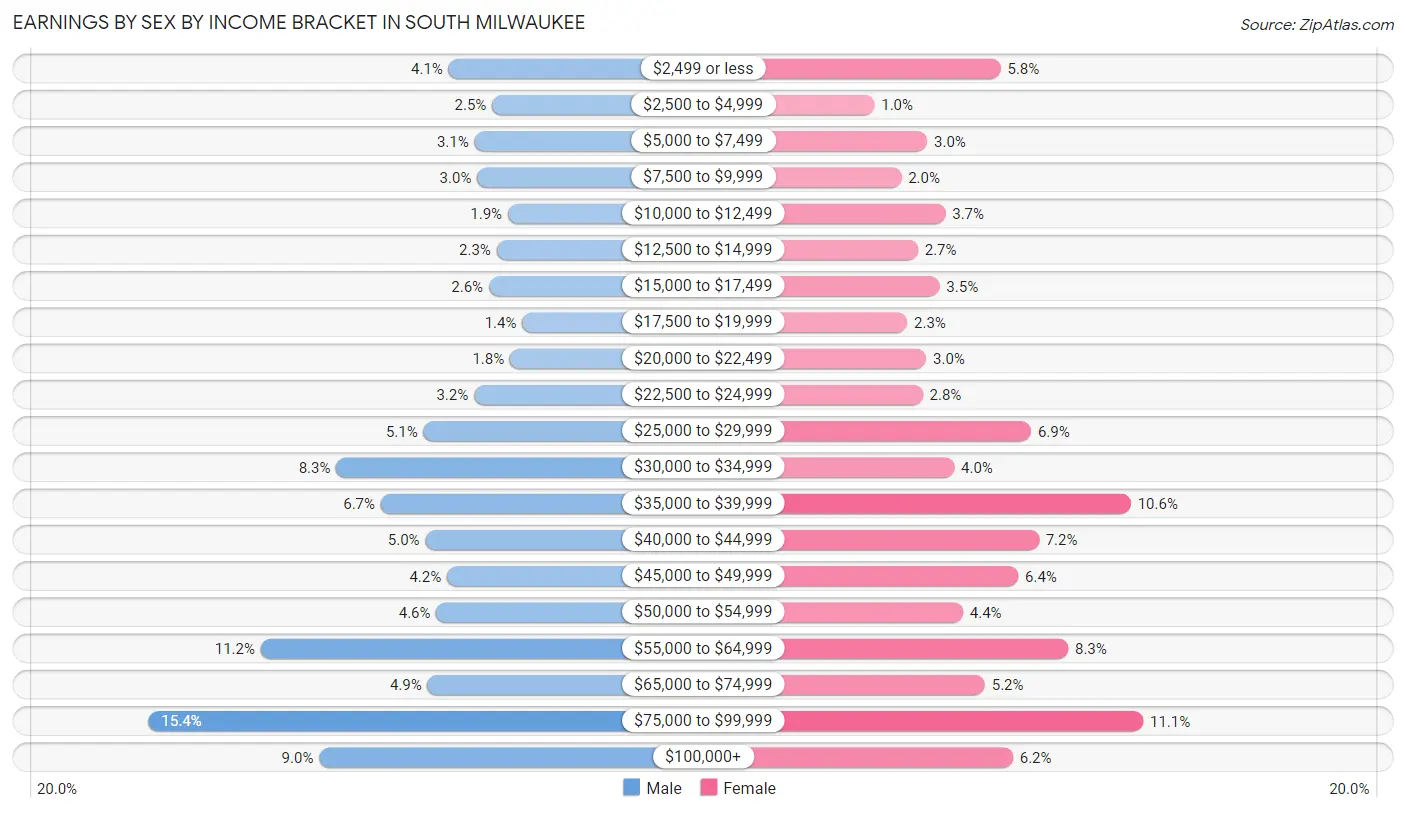
Earnings by Sex by Income Bracket in South Milwaukee
The most common earnings brackets in South Milwaukee are $75,000 to $99,999 for men (885 | 15.4%) and $75,000 to $99,999 for women (605 | 11.1%).
| Income | Male | Female |
| $2,499 or less | 237 (4.1%) | 314 (5.8%) |
| $2,500 to $4,999 | 143 (2.5%) | 56 (1.0%) |
| $5,000 to $7,499 | 181 (3.1%) | 164 (3.0%) |
| $7,500 to $9,999 | 175 (3.0%) | 111 (2.0%) |
| $10,000 to $12,499 | 109 (1.9%) | 201 (3.7%) |
| $12,500 to $14,999 | 133 (2.3%) | 145 (2.7%) |
| $15,000 to $17,499 | 150 (2.6%) | 189 (3.5%) |
| $17,500 to $19,999 | 78 (1.3%) | 123 (2.3%) |
| $20,000 to $22,499 | 104 (1.8%) | 162 (3.0%) |
| $22,500 to $24,999 | 182 (3.2%) | 155 (2.8%) |
| $25,000 to $29,999 | 291 (5.1%) | 376 (6.9%) |
| $30,000 to $34,999 | 479 (8.3%) | 219 (4.0%) |
| $35,000 to $39,999 | 383 (6.7%) | 580 (10.6%) |
| $40,000 to $44,999 | 287 (5.0%) | 392 (7.2%) |
| $45,000 to $49,999 | 240 (4.2%) | 350 (6.4%) |
| $50,000 to $54,999 | 263 (4.6%) | 237 (4.3%) |
| $55,000 to $64,999 | 642 (11.2%) | 452 (8.3%) |
| $65,000 to $74,999 | 282 (4.9%) | 282 (5.2%) |
| $75,000 to $99,999 | 885 (15.4%) | 605 (11.1%) |
| $100,000+ | 516 (9.0%) | 339 (6.2%) |
| Total | 5,760 (100.0%) | 5,452 (100.0%) |
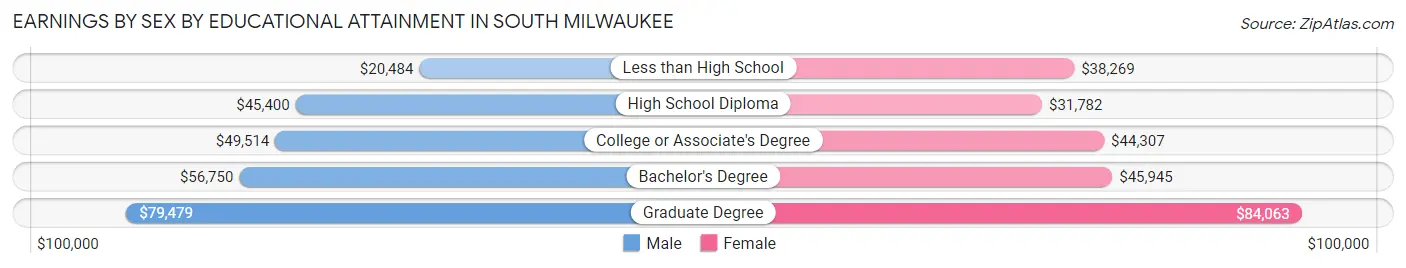
Earnings by Sex by Educational Attainment in South Milwaukee
Average earnings in South Milwaukee are $50,248 for men and $41,605 for women, a difference of 17.2%. Men with an educational attainment of graduate degree enjoy the highest average annual earnings of $79,479, while those with less than high school education earn the least with $20,484. Women with an educational attainment of graduate degree earn the most with the average annual earnings of $84,063, while those with high school diploma education have the smallest earnings of $31,782.
| Educational Attainment | Male Income | Female Income |
| Less than High School | $20,484 | $38,269 |
| High School Diploma | $45,400 | $31,782 |
| College or Associate's Degree | $49,514 | $44,307 |
| Bachelor's Degree | $56,750 | $45,945 |
| Graduate Degree | $79,479 | $84,063 |
| Total | $50,248 | $41,605 |
Family Income in South Milwaukee
Family Income Brackets in South Milwaukee
According to the South Milwaukee family income data, there are 1,181 families falling into the $75,000 to $99,999 income range, which is the most common income bracket and makes up 22.6% of all families. Conversely, the $10,000 to $14,999 income bracket is the least frequent group with only 52 families (1.0%) belonging to this category.
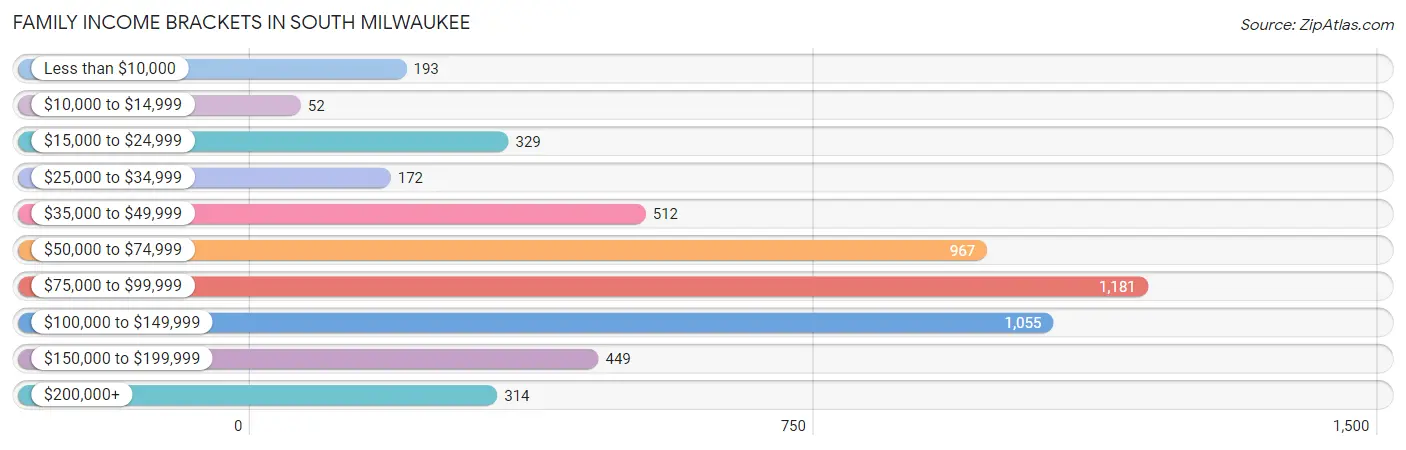
| Income Bracket | # Families | % Families |
| Less than $10,000 | 193 | 3.7% |
| $10,000 to $14,999 | 52 | 1.0% |
| $15,000 to $24,999 | 329 | 6.3% |
| $25,000 to $34,999 | 172 | 3.3% |
| $35,000 to $49,999 | 512 | 9.8% |
| $50,000 to $74,999 | 967 | 18.5% |
| $75,000 to $99,999 | 1,181 | 22.6% |
| $100,000 to $149,999 | 1,055 | 20.2% |
| $150,000 to $199,999 | 449 | 8.6% |
| $200,000+ | 314 | 6.0% |
Family Income by Famaliy Size in South Milwaukee
4-person families (1,021 | 19.5%) account for the highest median family income in South Milwaukee with $95,592 per family, while 2-person families (2,750 | 52.6%) have the highest median income of $38,788 per family member.
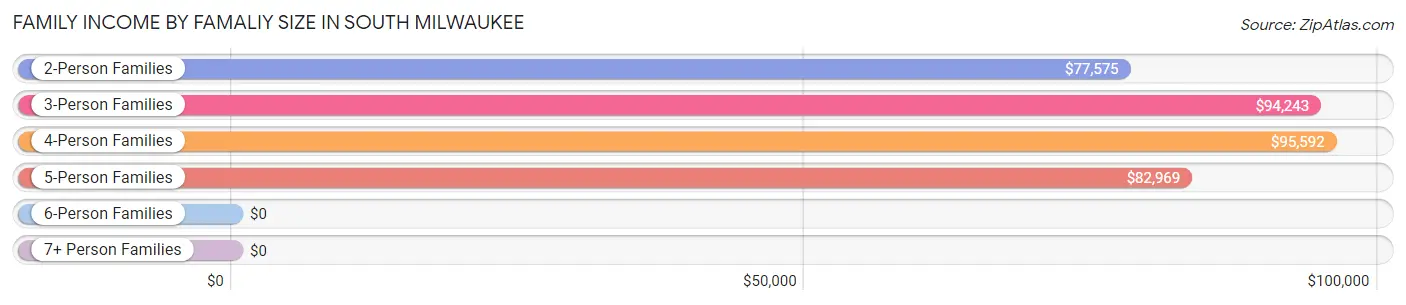
| Income Bracket | # Families | Median Income |
| 2-Person Families | 2,750 (52.6%) | $77,575 |
| 3-Person Families | 1,047 (20.0%) | $94,243 |
| 4-Person Families | 1,021 (19.5%) | $95,592 |
| 5-Person Families | 307 (5.9%) | $82,969 |
| 6-Person Families | 84 (1.6%) | $0 |
| 7+ Person Families | 16 (0.3%) | $0 |
| Total | 5,225 (100.0%) | $82,903 |
Family Income by Number of Earners in South Milwaukee
The median family income in South Milwaukee is $82,903, with families comprising 3+ earners (534) having the highest median family income of $137,143, while families with 1 earner (1,404) have the lowest median family income of $48,708, accounting for 10.2% and 26.9% of families, respectively.
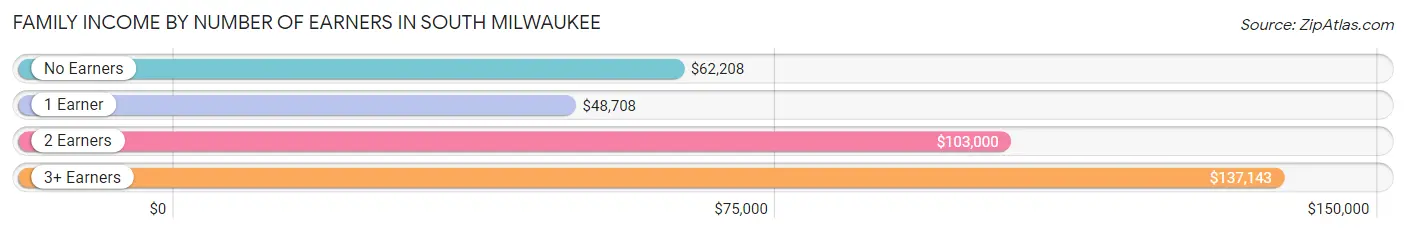
| Number of Earners | # Families | Median Income |
| No Earners | 997 (19.1%) | $62,208 |
| 1 Earner | 1,404 (26.9%) | $48,708 |
| 2 Earners | 2,290 (43.8%) | $103,000 |
| 3+ Earners | 534 (10.2%) | $137,143 |
| Total | 5,225 (100.0%) | $82,903 |
Household Income in South Milwaukee
Household Income Brackets in South Milwaukee
With 1,709 households falling in the category, the $75,000 to $99,999 income range is the most frequent in South Milwaukee, accounting for 20.0% of all households. In contrast, only 333 households (3.9%) fall into the $10,000 to $14,999 income bracket, making it the least populous group.
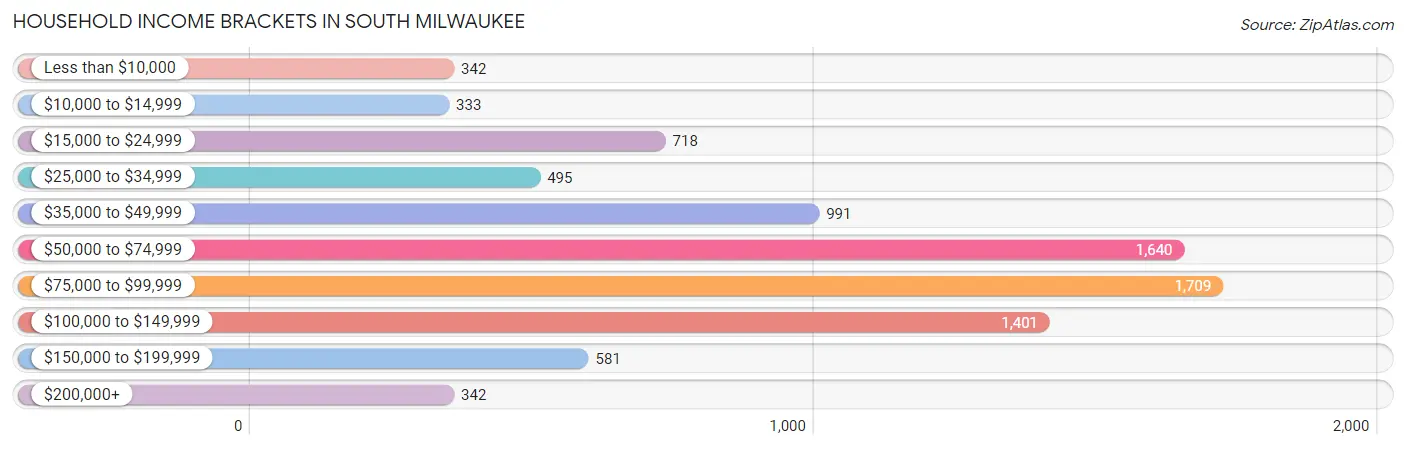
| Income Bracket | # Households | % Households |
| Less than $10,000 | 342 | 4.0% |
| $10,000 to $14,999 | 333 | 3.9% |
| $15,000 to $24,999 | 718 | 8.4% |
| $25,000 to $34,999 | 495 | 5.8% |
| $35,000 to $49,999 | 991 | 11.6% |
| $50,000 to $74,999 | 1,640 | 19.2% |
| $75,000 to $99,999 | 1,709 | 20.0% |
| $100,000 to $149,999 | 1,401 | 16.4% |
| $150,000 to $199,999 | 581 | 6.8% |
| $200,000+ | 342 | 4.0% |
Household Income by Householder Age in South Milwaukee
The median household income in South Milwaukee is $68,801, with the highest median household income of $81,108 found in the 25 to 44 years age bracket for the primary householder. A total of 2,704 households (31.7%) fall into this category. Meanwhile, the 15 to 24 years age bracket for the primary householder has the lowest median household income of $40,592, with 129 households (1.5%) in this group.
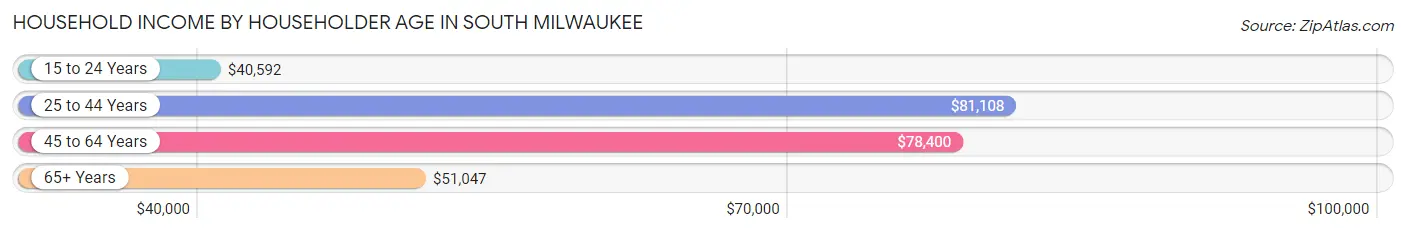
| Income Bracket | # Households | Median Income |
| 15 to 24 Years | 129 (1.5%) | $40,592 |
| 25 to 44 Years | 2,704 (31.7%) | $81,108 |
| 45 to 64 Years | 3,308 (38.7%) | $78,400 |
| 65+ Years | 2,402 (28.1%) | $51,047 |
| Total | 8,543 (100.0%) | $68,801 |
Poverty in South Milwaukee
Income Below Poverty by Sex and Age in South Milwaukee
With 12.8% poverty level for males and 14.2% for females among the residents of South Milwaukee, 5 year old males and 12 to 14 year old females are the most vulnerable to poverty, with 47 males (57.3%) and 97 females (28.6%) in their respective age groups living below the poverty level.
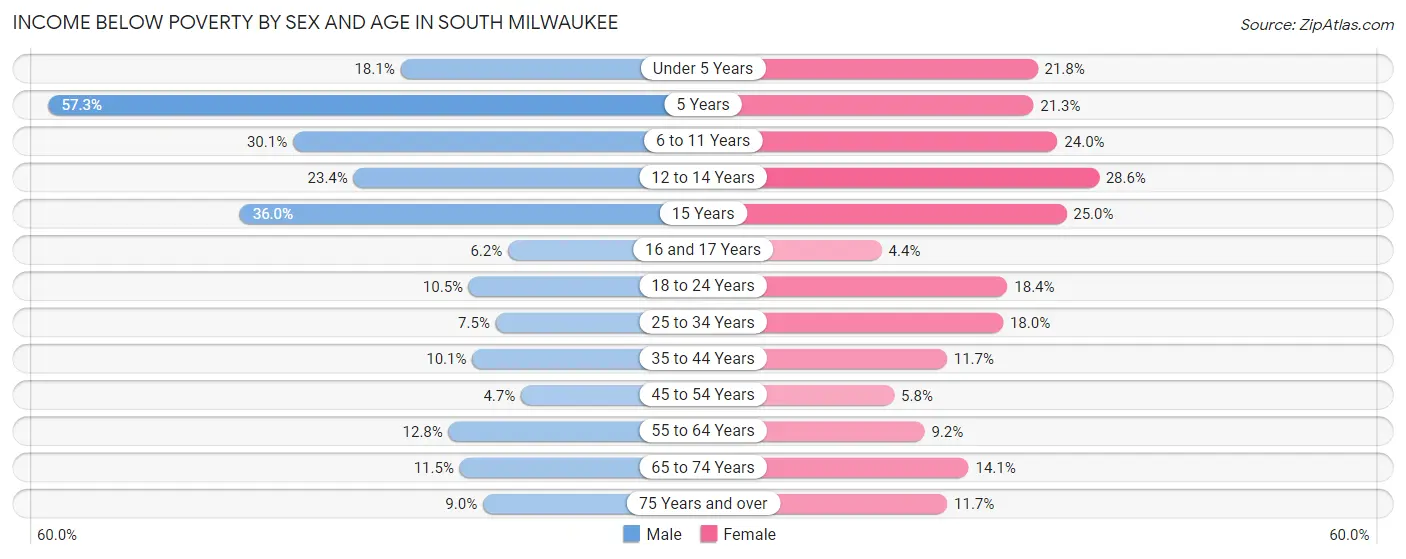
| Age Bracket | Male | Female |
| Under 5 Years | 125 (18.1%) | 116 (21.8%) |
| 5 Years | 47 (57.3%) | 16 (21.3%) |
| 6 to 11 Years | 212 (30.1%) | 175 (24.0%) |
| 12 to 14 Years | 100 (23.4%) | 97 (28.6%) |
| 15 Years | 49 (36.0%) | 40 (25.0%) |
| 16 and 17 Years | 9 (6.2%) | 10 (4.4%) |
| 18 to 24 Years | 75 (10.5%) | 71 (18.4%) |
| 25 to 34 Years | 111 (7.5%) | 310 (17.9%) |
| 35 to 44 Years | 119 (10.1%) | 136 (11.7%) |
| 45 to 54 Years | 60 (4.7%) | 72 (5.8%) |
| 55 to 64 Years | 210 (12.8%) | 152 (9.2%) |
| 65 to 74 Years | 129 (11.5%) | 156 (14.1%) |
| 75 Years and over | 58 (8.9%) | 101 (11.7%) |
| Total | 1,304 (12.8%) | 1,452 (14.2%) |
Income Above Poverty by Sex and Age in South Milwaukee
According to the poverty statistics in South Milwaukee, males aged 45 to 54 years and females aged 16 and 17 years are the age groups that are most secure financially, with 95.3% of males and 95.6% of females in these age groups living above the poverty line.
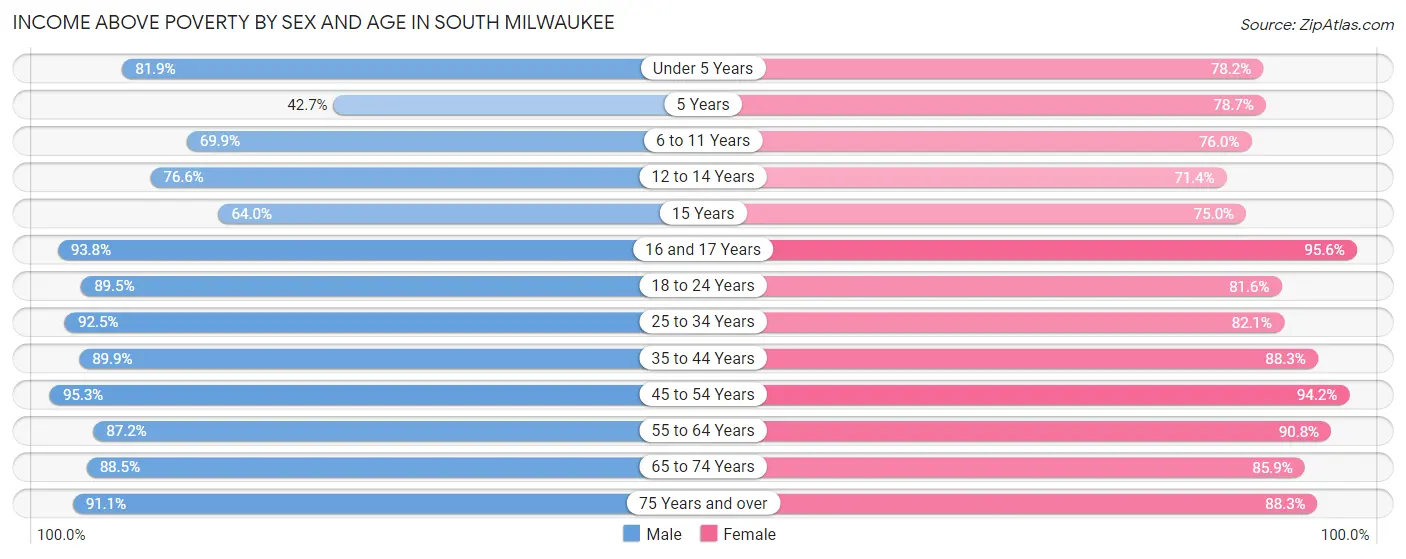
| Age Bracket | Male | Female |
| Under 5 Years | 564 (81.9%) | 416 (78.2%) |
| 5 Years | 35 (42.7%) | 59 (78.7%) |
| 6 to 11 Years | 492 (69.9%) | 554 (76.0%) |
| 12 to 14 Years | 328 (76.6%) | 242 (71.4%) |
| 15 Years | 87 (64.0%) | 120 (75.0%) |
| 16 and 17 Years | 137 (93.8%) | 215 (95.6%) |
| 18 to 24 Years | 638 (89.5%) | 314 (81.6%) |
| 25 to 34 Years | 1,363 (92.5%) | 1,417 (82.1%) |
| 35 to 44 Years | 1,054 (89.9%) | 1,027 (88.3%) |
| 45 to 54 Years | 1,215 (95.3%) | 1,163 (94.2%) |
| 55 to 64 Years | 1,433 (87.2%) | 1,498 (90.8%) |
| 65 to 74 Years | 989 (88.5%) | 949 (85.9%) |
| 75 Years and over | 590 (91.0%) | 760 (88.3%) |
| Total | 8,925 (87.3%) | 8,734 (85.8%) |
Income Below Poverty Among Married-Couple Families in South Milwaukee
The poverty statistics for married-couple families in South Milwaukee show that 6.0% or 228 of the total 3,820 families live below the poverty line. Families with 3 or 4 children have the highest poverty rate of 20.3%, comprising of 47 families. On the other hand, families with 5 or more children have the lowest poverty rate of 0.0%, which includes 0 families.
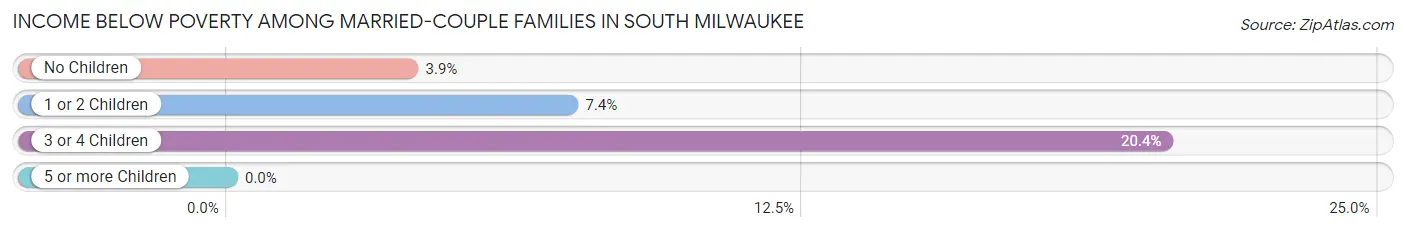
| Children | Above Poverty | Below Poverty |
| No Children | 2,324 (96.1%) | 95 (3.9%) |
| 1 or 2 Children | 1,075 (92.6%) | 86 (7.4%) |
| 3 or 4 Children | 184 (79.6%) | 47 (20.3%) |
| 5 or more Children | 9 (100.0%) | 0 (0.0%) |
| Total | 3,592 (94.0%) | 228 (6.0%) |
Income Below Poverty Among Single-Parent Households in South Milwaukee
According to the poverty data in South Milwaukee, 7.6% or 35 single-father households and 27.4% or 258 single-mother households are living below the poverty line. Among single-father households, those with 3 or 4 children have the highest poverty rate, with 18 households (69.2%) experiencing poverty. Likewise, among single-mother households, those with 3 or 4 children have the highest poverty rate, with 109 households (87.2%) falling below the poverty line.
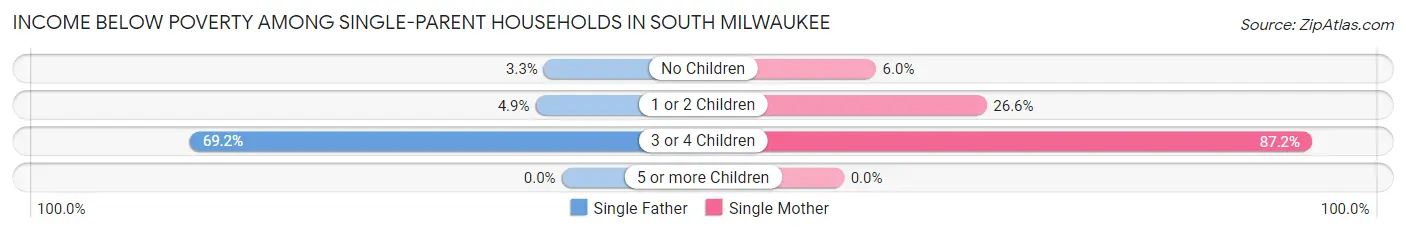
| Children | Single Father | Single Mother |
| No Children | 9 (3.3%) | 19 (6.0%) |
| 1 or 2 Children | 8 (4.9%) | 130 (26.6%) |
| 3 or 4 Children | 18 (69.2%) | 109 (87.2%) |
| 5 or more Children | 0 (0.0%) | 0 (0.0%) |
| Total | 35 (7.6%) | 258 (27.4%) |
Income Below Poverty Among Married-Couple vs Single-Parent Households in South Milwaukee
The poverty data for South Milwaukee shows that 228 of the married-couple family households (6.0%) and 293 of the single-parent households (20.8%) are living below the poverty level. Within the married-couple family households, those with 3 or 4 children have the highest poverty rate, with 47 households (20.3%) falling below the poverty line. Among the single-parent households, those with 3 or 4 children have the highest poverty rate, with 127 household (84.1%) living below poverty.
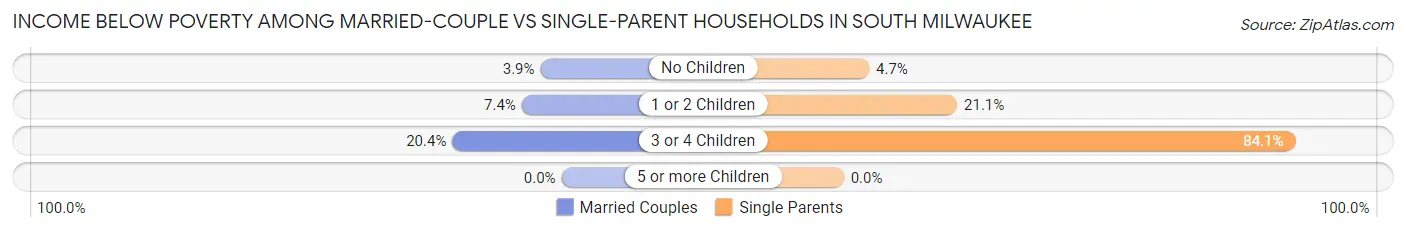
| Children | Married-Couple Families | Single-Parent Households |
| No Children | 95 (3.9%) | 28 (4.7%) |
| 1 or 2 Children | 86 (7.4%) | 138 (21.1%) |
| 3 or 4 Children | 47 (20.3%) | 127 (84.1%) |
| 5 or more Children | 0 (0.0%) | 0 (0.0%) |
| Total | 228 (6.0%) | 293 (20.8%) |
Race in South Milwaukee
The most populous races in South Milwaukee are White / Caucasian (17,780 | 86.0%), Hispanic or Latino (2,420 | 11.7%), and Two or more Races (1,469 | 7.1%).
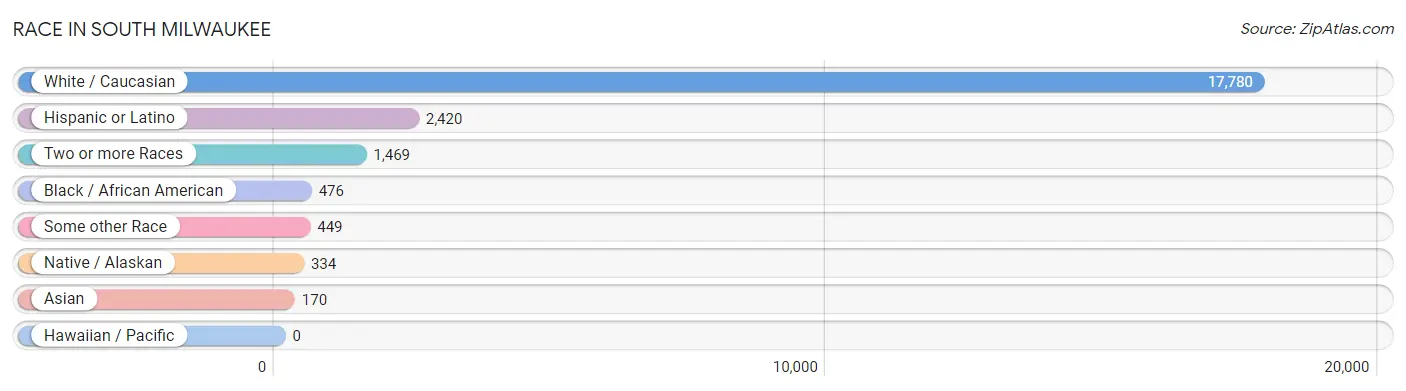
| Race | # Population | % Population |
| Asian | 170 | 0.8% |
| Black / African American | 476 | 2.3% |
| Hawaiian / Pacific | 0 | 0.0% |
| Hispanic or Latino | 2,420 | 11.7% |
| Native / Alaskan | 334 | 1.6% |
| White / Caucasian | 17,780 | 86.0% |
| Two or more Races | 1,469 | 7.1% |
| Some other Race | 449 | 2.2% |
| Total | 20,678 | 100.0% |
Ancestry in South Milwaukee
The most populous ancestries reported in South Milwaukee are German (7,390 | 35.7%), Polish (4,096 | 19.8%), Irish (1,919 | 9.3%), Mexican (1,560 | 7.5%), and English (1,223 | 5.9%), together accounting for 78.3% of all South Milwaukee residents.
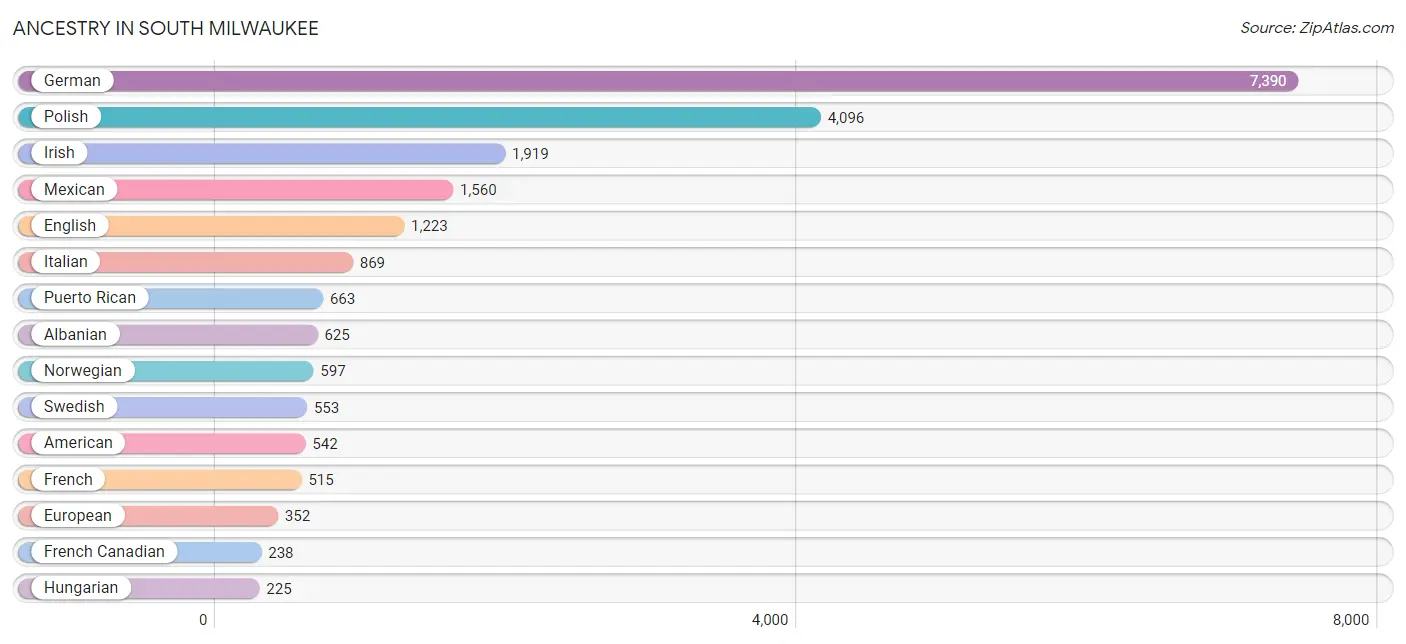
| Ancestry | # Population | % Population |
| Albanian | 625 | 3.0% |
| American | 542 | 2.6% |
| Arab | 220 | 1.1% |
| Argentinean | 14 | 0.1% |
| Armenian | 173 | 0.8% |
| Australian | 7 | 0.0% |
| Austrian | 122 | 0.6% |
| Belgian | 61 | 0.3% |
| British | 77 | 0.4% |
| Burmese | 40 | 0.2% |
| Celtic | 9 | 0.0% |
| Central American Indian | 70 | 0.3% |
| Cherokee | 187 | 0.9% |
| Chilean | 101 | 0.5% |
| Chippewa | 157 | 0.8% |
| Choctaw | 9 | 0.0% |
| Cree | 28 | 0.1% |
| Croatian | 33 | 0.2% |
| Cuban | 20 | 0.1% |
| Czech | 167 | 0.8% |
| Czechoslovakian | 24 | 0.1% |
| Danish | 188 | 0.9% |
| Dutch | 108 | 0.5% |
| Eastern European | 53 | 0.3% |
| Egyptian | 21 | 0.1% |
| English | 1,223 | 5.9% |
| European | 352 | 1.7% |
| Finnish | 88 | 0.4% |
| French | 515 | 2.5% |
| French American Indian | 11 | 0.1% |
| French Canadian | 238 | 1.1% |
| German | 7,390 | 35.7% |
| Greek | 156 | 0.7% |
| Hungarian | 225 | 1.1% |
| Indian (Asian) | 29 | 0.1% |
| Iranian | 12 | 0.1% |
| Irish | 1,919 | 9.3% |
| Iroquois | 45 | 0.2% |
| Italian | 869 | 4.2% |
| Jamaican | 7 | 0.0% |
| Korean | 42 | 0.2% |
| Latvian | 13 | 0.1% |
| Lebanese | 8 | 0.0% |
| Liberian | 35 | 0.2% |
| Lithuanian | 86 | 0.4% |
| Luxembourger | 11 | 0.1% |
| Malaysian | 41 | 0.2% |
| Menominee | 92 | 0.4% |
| Mexican | 1,560 | 7.5% |
| Mexican American Indian | 45 | 0.2% |
| Native Hawaiian | 2 | 0.0% |
| Northern European | 26 | 0.1% |
| Norwegian | 597 | 2.9% |
| Pakistani | 6 | 0.0% |
| Palestinian | 62 | 0.3% |
| Polish | 4,096 | 19.8% |
| Puerto Rican | 663 | 3.2% |
| Romanian | 8 | 0.0% |
| Russian | 77 | 0.4% |
| Scandinavian | 26 | 0.1% |
| Scotch-Irish | 26 | 0.1% |
| Scottish | 209 | 1.0% |
| Serbian | 87 | 0.4% |
| Slavic | 46 | 0.2% |
| Slovak | 129 | 0.6% |
| Slovene | 11 | 0.1% |
| South American | 115 | 0.6% |
| Spaniard | 9 | 0.0% |
| Spanish | 49 | 0.2% |
| Subsaharan African | 35 | 0.2% |
| Swedish | 553 | 2.7% |
| Swiss | 130 | 0.6% |
| Thai | 135 | 0.6% |
| Ukrainian | 99 | 0.5% |
| Welsh | 39 | 0.2% |
| Yugoslavian | 24 | 0.1% | View All 76 Rows |
Immigrants in South Milwaukee
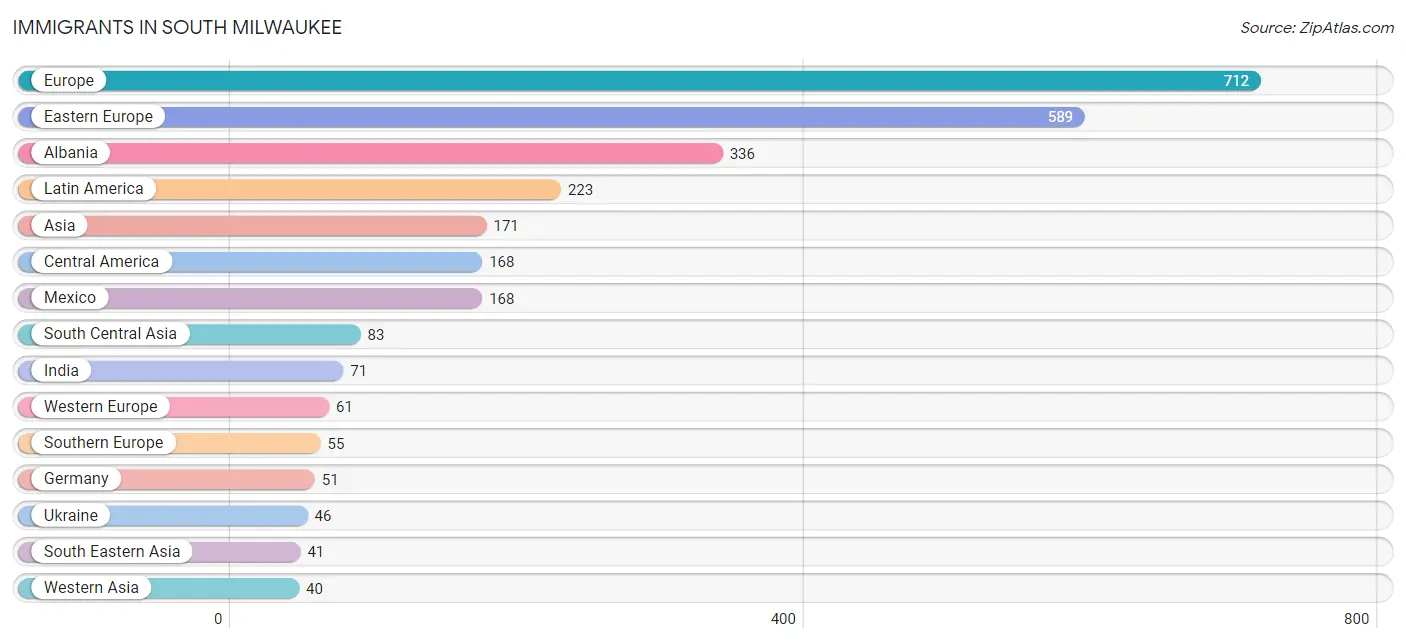
The most numerous immigrant groups reported in South Milwaukee came from Europe (712 | 3.4%), Eastern Europe (589 | 2.9%), Albania (336 | 1.6%), Latin America (223 | 1.1%), and Asia (171 | 0.8%), together accounting for 9.8% of all South Milwaukee residents.
| Immigration Origin | # Population | % Population |
| Albania | 336 | 1.6% |
| Asia | 171 | 0.8% |
| Bosnia and Herzegovina | 20 | 0.1% |
| Canada | 7 | 0.0% |
| Caribbean | 20 | 0.1% |
| Central America | 168 | 0.8% |
| Chile | 35 | 0.2% |
| China | 7 | 0.0% |
| Cuba | 20 | 0.1% |
| Eastern Asia | 7 | 0.0% |
| Eastern Europe | 589 | 2.9% |
| Europe | 712 | 3.4% |
| France | 10 | 0.1% |
| Germany | 51 | 0.3% |
| Greece | 28 | 0.1% |
| India | 71 | 0.3% |
| Iran | 12 | 0.1% |
| Iraq | 26 | 0.1% |
| Italy | 27 | 0.1% |
| Kuwait | 7 | 0.0% |
| Laos | 16 | 0.1% |
| Latin America | 223 | 1.1% |
| Latvia | 13 | 0.1% |
| Mexico | 168 | 0.8% |
| North Macedonia | 29 | 0.1% |
| Northern Europe | 7 | 0.0% |
| Philippines | 19 | 0.1% |
| Poland | 21 | 0.1% |
| Russia | 30 | 0.2% |
| Saudi Arabia | 7 | 0.0% |
| Serbia | 20 | 0.1% |
| South America | 35 | 0.2% |
| South Central Asia | 83 | 0.4% |
| South Eastern Asia | 41 | 0.2% |
| Southern Europe | 55 | 0.3% |
| Sweden | 5 | 0.0% |
| Taiwan | 7 | 0.0% |
| Thailand | 6 | 0.0% |
| Ukraine | 46 | 0.2% |
| Western Asia | 40 | 0.2% |
| Western Europe | 61 | 0.3% | View All 41 Rows |
Sex and Age in South Milwaukee
Sex and Age in South Milwaukee
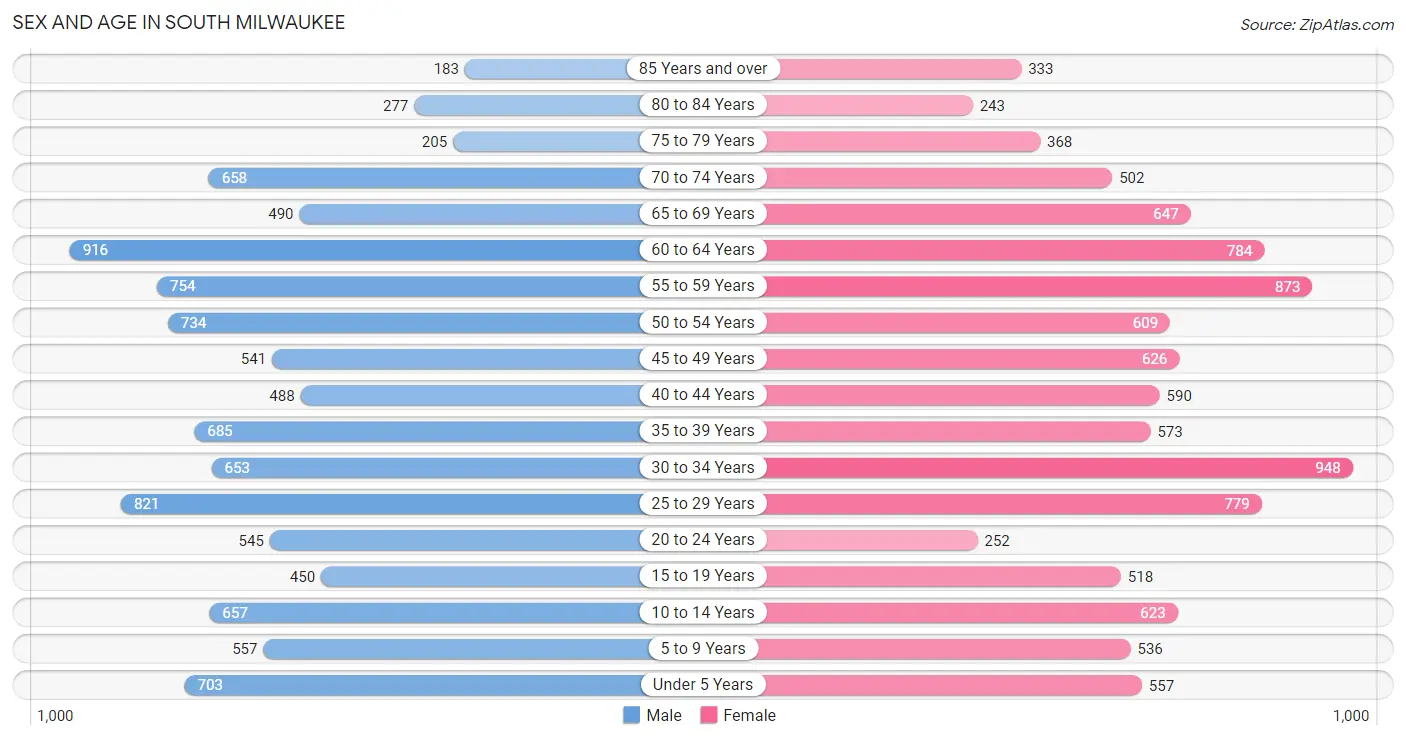
The most populous age groups in South Milwaukee are 60 to 64 Years (916 | 8.9%) for men and 30 to 34 Years (948 | 9.1%) for women.
| Age Bracket | Male | Female |
| Under 5 Years | 703 (6.8%) | 557 (5.4%) |
| 5 to 9 Years | 557 (5.4%) | 536 (5.2%) |
| 10 to 14 Years | 657 (6.4%) | 623 (6.0%) |
| 15 to 19 Years | 450 (4.4%) | 518 (5.0%) |
| 20 to 24 Years | 545 (5.3%) | 252 (2.4%) |
| 25 to 29 Years | 821 (8.0%) | 779 (7.5%) |
| 30 to 34 Years | 653 (6.3%) | 948 (9.1%) |
| 35 to 39 Years | 685 (6.6%) | 573 (5.5%) |
| 40 to 44 Years | 488 (4.7%) | 590 (5.7%) |
| 45 to 49 Years | 541 (5.2%) | 626 (6.0%) |
| 50 to 54 Years | 734 (7.1%) | 609 (5.9%) |
| 55 to 59 Years | 754 (7.3%) | 873 (8.4%) |
| 60 to 64 Years | 916 (8.9%) | 784 (7.6%) |
| 65 to 69 Years | 490 (4.8%) | 647 (6.2%) |
| 70 to 74 Years | 658 (6.4%) | 502 (4.9%) |
| 75 to 79 Years | 205 (2.0%) | 368 (3.5%) |
| 80 to 84 Years | 277 (2.7%) | 243 (2.4%) |
| 85 Years and over | 183 (1.8%) | 333 (3.2%) |
| Total | 10,317 (100.0%) | 10,361 (100.0%) |
Families and Households in South Milwaukee
Median Family Size in South Milwaukee
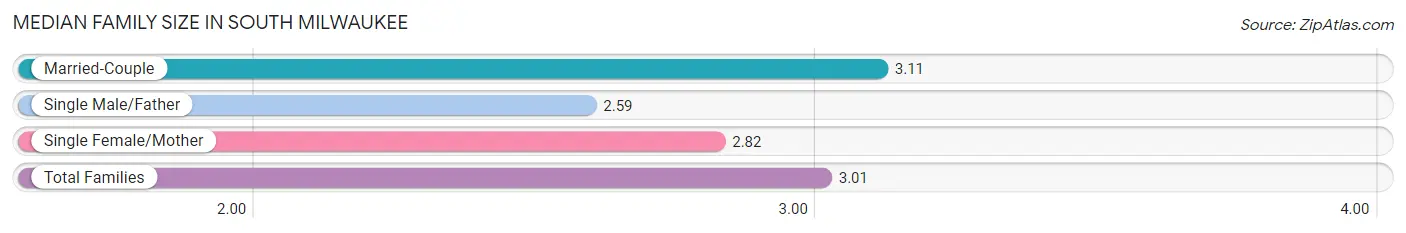
The median family size in South Milwaukee is 3.01 persons per family, with married-couple families (3,820 | 73.1%) accounting for the largest median family size of 3.11 persons per family. On the other hand, single male/father families (462 | 8.8%) represent the smallest median family size with 2.59 persons per family.
| Family Type | # Families | Family Size |
| Married-Couple | 3,820 (73.1%) | 3.11 |
| Single Male/Father | 462 (8.8%) | 2.59 |
| Single Female/Mother | 943 (18.0%) | 2.82 |
| Total Families | 5,225 (100.0%) | 3.01 |
Median Household Size in South Milwaukee
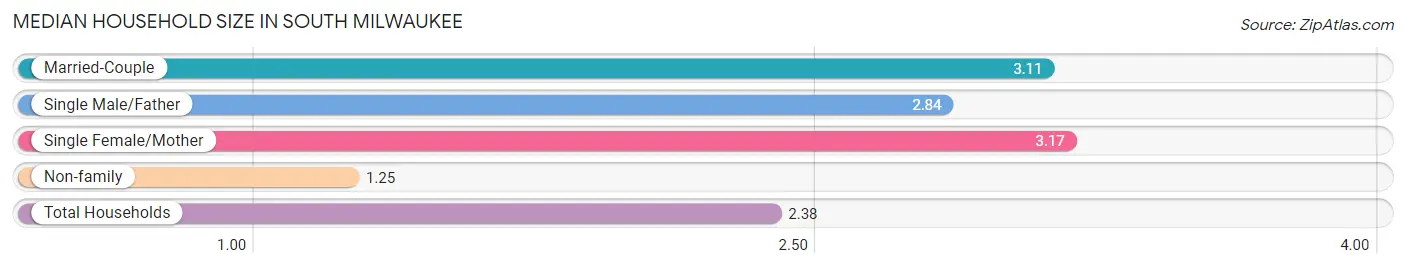
The median household size in South Milwaukee is 2.38 persons per household, with single female/mother households (943 | 11.0%) accounting for the largest median household size of 3.17 persons per household. non-family households (3,318 | 38.8%) represent the smallest median household size with 1.25 persons per household.
| Household Type | # Households | Household Size |
| Married-Couple | 3,820 (44.7%) | 3.11 |
| Single Male/Father | 462 (5.4%) | 2.84 |
| Single Female/Mother | 943 (11.0%) | 3.17 |
| Non-family | 3,318 (38.8%) | 1.25 |
| Total Households | 8,543 (100.0%) | 2.38 |
Household Size by Marriage Status in South Milwaukee
Out of a total of 8,543 households in South Milwaukee, 5,225 (61.2%) are family households, while 3,318 (38.8%) are nonfamily households. The most numerous type of family households are 2-person households, comprising 2,538, and the most common type of nonfamily households are 1-person households, comprising 2,619.
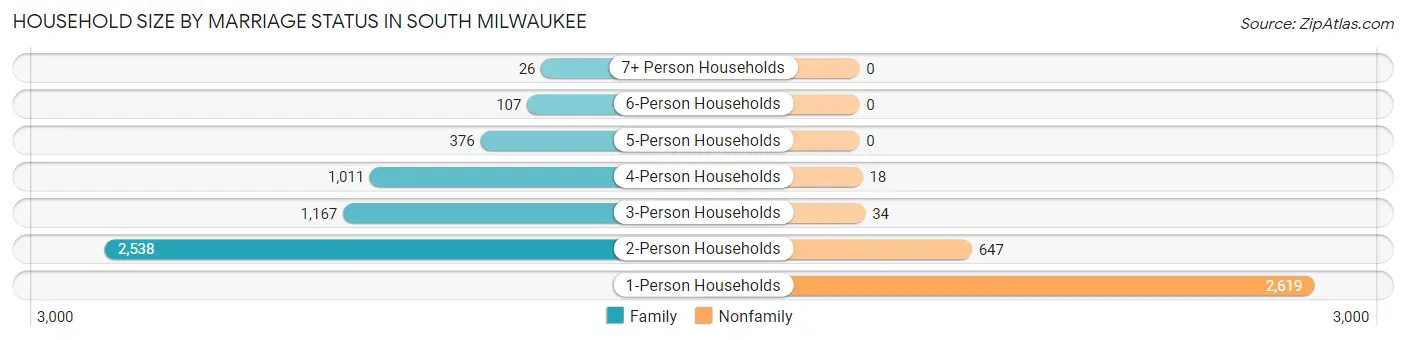
| Household Size | Family Households | Nonfamily Households |
| 1-Person Households | - | 2,619 (30.7%) |
| 2-Person Households | 2,538 (29.7%) | 647 (7.6%) |
| 3-Person Households | 1,167 (13.7%) | 34 (0.4%) |
| 4-Person Households | 1,011 (11.8%) | 18 (0.2%) |
| 5-Person Households | 376 (4.4%) | 0 (0.0%) |
| 6-Person Households | 107 (1.3%) | 0 (0.0%) |
| 7+ Person Households | 26 (0.3%) | 0 (0.0%) |
| Total | 5,225 (61.2%) | 3,318 (38.8%) |
Female Fertility in South Milwaukee
Fertility by Age in South Milwaukee
Average fertility rate in South Milwaukee is 79.0 births per 1,000 women. Women in the age bracket of 20 to 34 years have the highest fertility rate with 151.0 births per 1,000 women. Women in the age bracket of 20 to 34 years acount for 85.4% of all women with births.
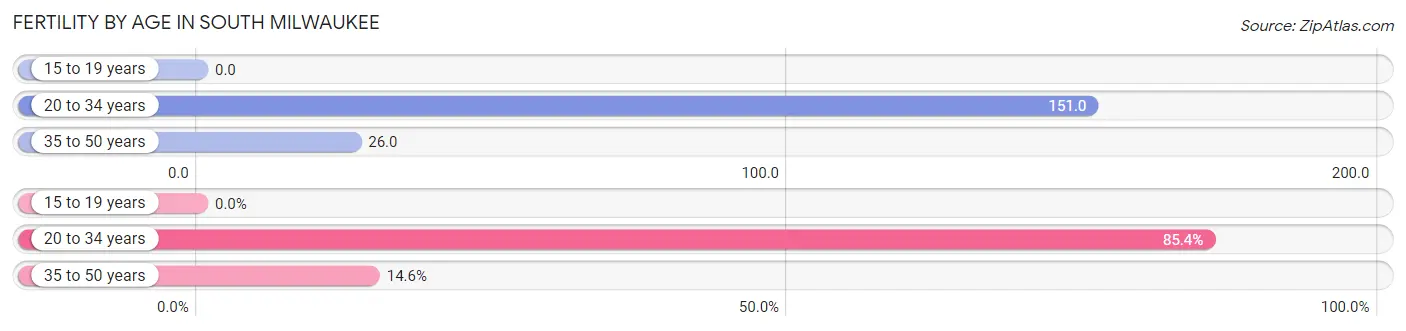
| Age Bracket | Women with Births | Births / 1,000 Women |
| 15 to 19 years | 0 (0.0%) | 0.0 |
| 20 to 34 years | 299 (85.4%) | 151.0 |
| 35 to 50 years | 51 (14.6%) | 26.0 |
| Total | 350 (100.0%) | 79.0 |
Fertility by Age by Marriage Status in South Milwaukee
66.3% of women with births (350) in South Milwaukee are married. The highest percentage of unmarried women with births falls into 20 to 34 years age bracket with 39.5% of them unmarried at the time of birth, while the lowest percentage of unmarried women with births belong to 35 to 50 years age bracket with 0.0% of them unmarried.
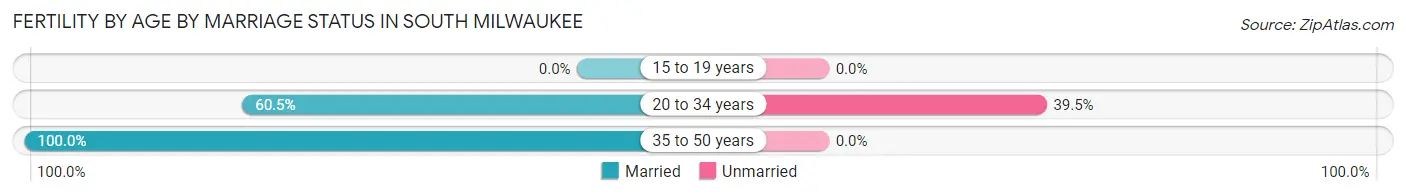
| Age Bracket | Married | Unmarried |
| 15 to 19 years | 0 (0.0%) | 0 (0.0%) |
| 20 to 34 years | 181 (60.5%) | 118 (39.5%) |
| 35 to 50 years | 51 (100.0%) | 0 (0.0%) |
| Total | 232 (66.3%) | 118 (33.7%) |
Fertility by Education in South Milwaukee
Average fertility rate in South Milwaukee is 79.0 births per 1,000 women. Women with the education attainment of graduate degree have the highest fertility rate of 138.0 births per 1,000 women, while women with the education attainment of college or associate's degree have the lowest fertility at 56.0 births per 1,000 women. Women with the education attainment of bachelor's degree represent 26.9% of all women with births.
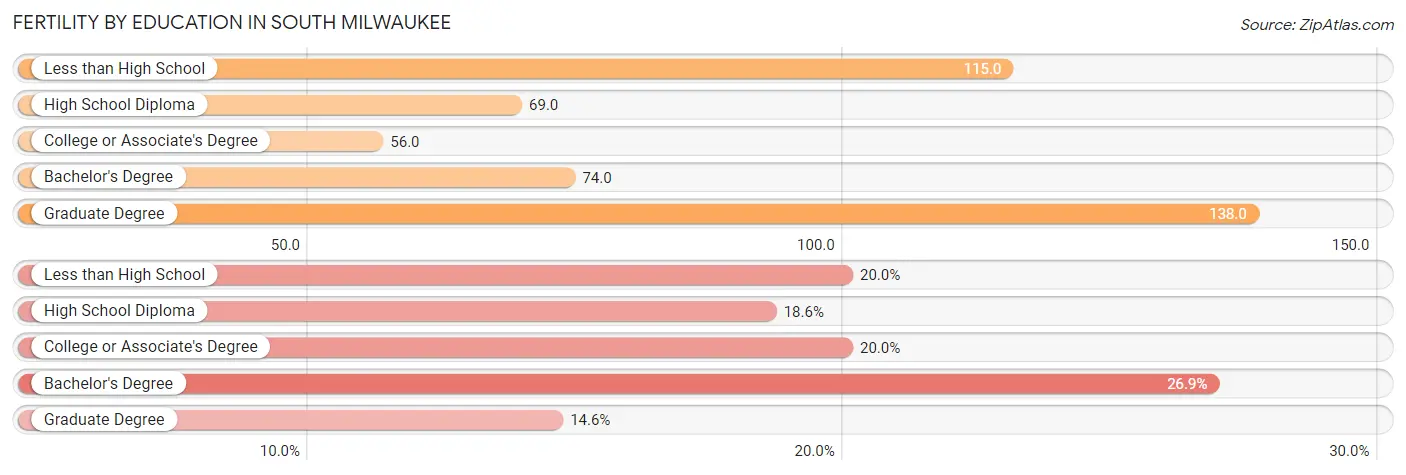
| Educational Attainment | Women with Births | Births / 1,000 Women |
| Less than High School | 70 (20.0%) | 115.0 |
| High School Diploma | 65 (18.6%) | 69.0 |
| College or Associate's Degree | 70 (20.0%) | 56.0 |
| Bachelor's Degree | 94 (26.9%) | 74.0 |
| Graduate Degree | 51 (14.6%) | 138.0 |
| Total | 350 (100.0%) | 79.0 |
Fertility by Education by Marriage Status in South Milwaukee
33.7% of women with births in South Milwaukee are unmarried. Women with the educational attainment of graduate degree are most likely to be married with 100.0% of them married at childbirth, while women with the educational attainment of high school diploma are least likely to be married with 81.5% of them unmarried at childbirth.
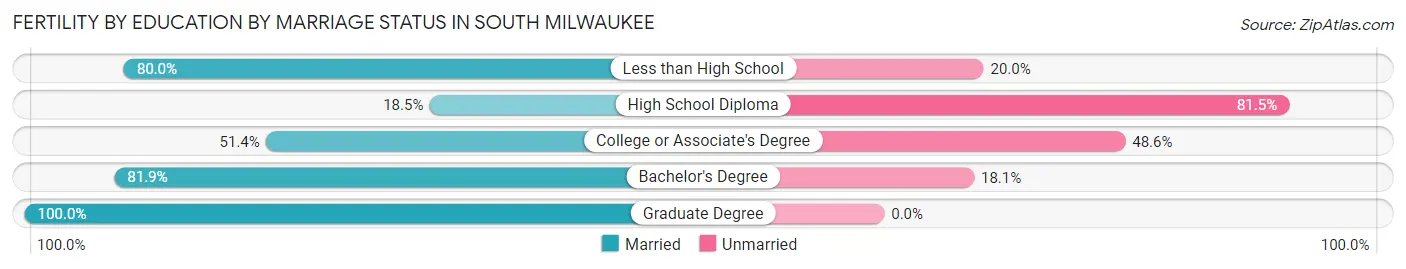
| Educational Attainment | Married | Unmarried |
| Less than High School | 56 (80.0%) | 14 (20.0%) |
| High School Diploma | 12 (18.5%) | 53 (81.5%) |
| College or Associate's Degree | 36 (51.4%) | 34 (48.6%) |
| Bachelor's Degree | 77 (81.9%) | 17 (18.1%) |
| Graduate Degree | 51 (100.0%) | 0 (0.0%) |
| Total | 232 (66.3%) | 118 (33.7%) |
Employment Characteristics in South Milwaukee
Employment by Class of Employer in South Milwaukee
Among the 10,183 employed individuals in South Milwaukee, private company employees (7,473 | 73.4%), not-for-profit organizations (1,107 | 10.9%), and local government employees (544 | 5.3%) make up the most common classes of employment.
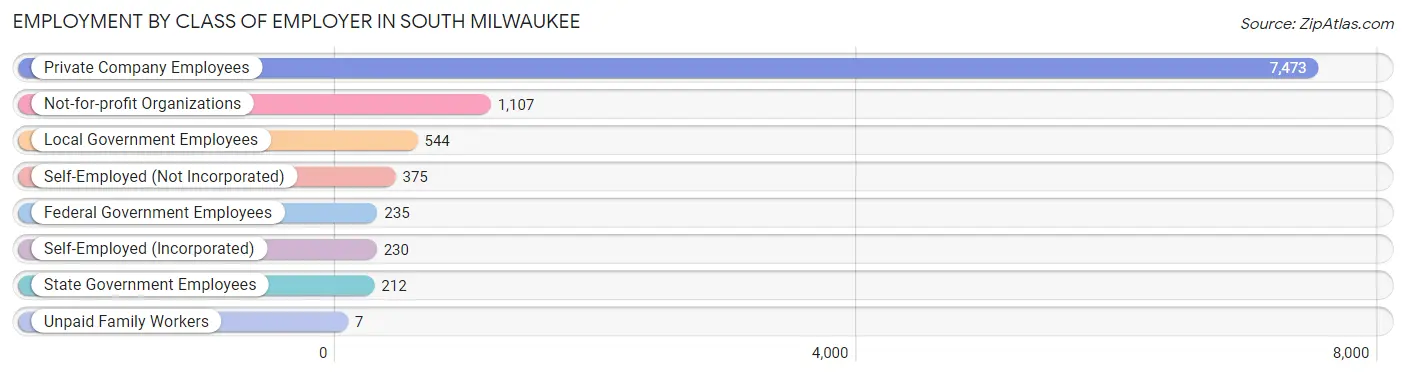
| Employer Class | # Employees | % Employees |
| Private Company Employees | 7,473 | 73.4% |
| Self-Employed (Incorporated) | 230 | 2.3% |
| Self-Employed (Not Incorporated) | 375 | 3.7% |
| Not-for-profit Organizations | 1,107 | 10.9% |
| Local Government Employees | 544 | 5.3% |
| State Government Employees | 212 | 2.1% |
| Federal Government Employees | 235 | 2.3% |
| Unpaid Family Workers | 7 | 0.1% |
| Total | 10,183 | 100.0% |
Employment Status by Age in South Milwaukee
According to the labor force statistics for South Milwaukee, out of the total population over 16 years of age (16,749), 64.7% or 10,837 individuals are in the labor force, with 3.5% or 379 of them unemployed. The age group with the highest labor force participation rate is 35 to 44 years, with 91.3% or 2,133 individuals in the labor force. Within the labor force, the 20 to 24 years age range has the highest percentage of unemployed individuals, with 11.3% or 78 of them being unemployed.
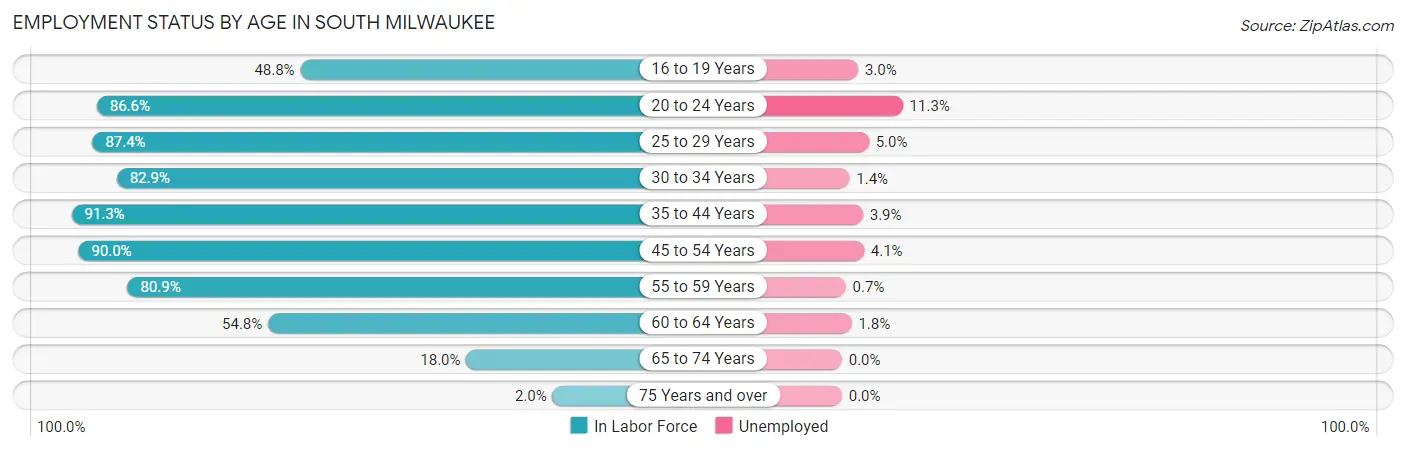
| Age Bracket | In Labor Force | Unemployed |
| 16 to 19 Years | 328 (48.8%) | 10 (3.0%) |
| 20 to 24 Years | 690 (86.6%) | 78 (11.3%) |
| 25 to 29 Years | 1,398 (87.4%) | 70 (5.0%) |
| 30 to 34 Years | 1,327 (82.9%) | 19 (1.4%) |
| 35 to 44 Years | 2,133 (91.3%) | 83 (3.9%) |
| 45 to 54 Years | 2,259 (90.0%) | 93 (4.1%) |
| 55 to 59 Years | 1,316 (80.9%) | 9 (0.7%) |
| 60 to 64 Years | 932 (54.8%) | 17 (1.8%) |
| 65 to 74 Years | 413 (18.0%) | 0 (0.0%) |
| 75 Years and over | 32 (2.0%) | 0 (0.0%) |
| Total | 10,837 (64.7%) | 379 (3.5%) |
Employment Status by Educational Attainment in South Milwaukee
According to labor force statistics for South Milwaukee, 82.3% of individuals (9,361) out of the total population between 25 and 64 years of age (11,374) are in the labor force, with 3.1% or 290 of them being unemployed. The group with the highest labor force participation rate are those with the educational attainment of bachelor's degree or higher, with 91.7% or 2,968 individuals in the labor force. Within the labor force, individuals with high school diploma education have the highest percentage of unemployment, with 5.3% or 157 of them being unemployed.
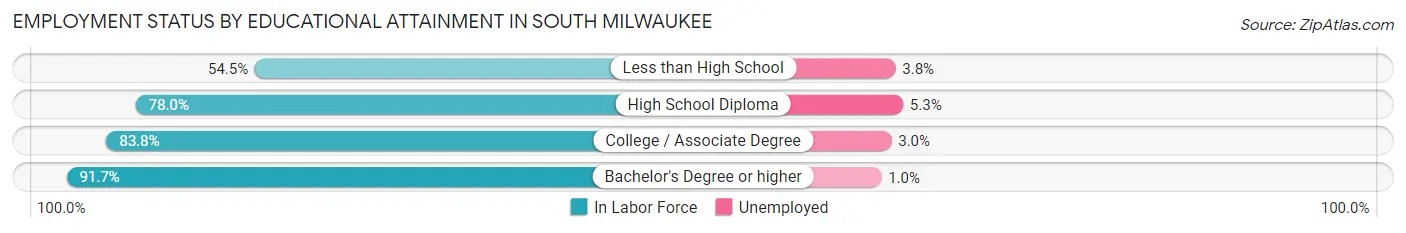
| Educational Attainment | In Labor Force | Unemployed |
| Less than High School | 370 (54.5%) | 26 (3.8%) |
| High School Diploma | 2,959 (78.0%) | 201 (5.3%) |
| College / Associate Degree | 3,071 (83.8%) | 110 (3.0%) |
| Bachelor's Degree or higher | 2,968 (91.7%) | 32 (1.0%) |
| Total | 9,361 (82.3%) | 353 (3.1%) |
Employment Occupations by Sex in South Milwaukee
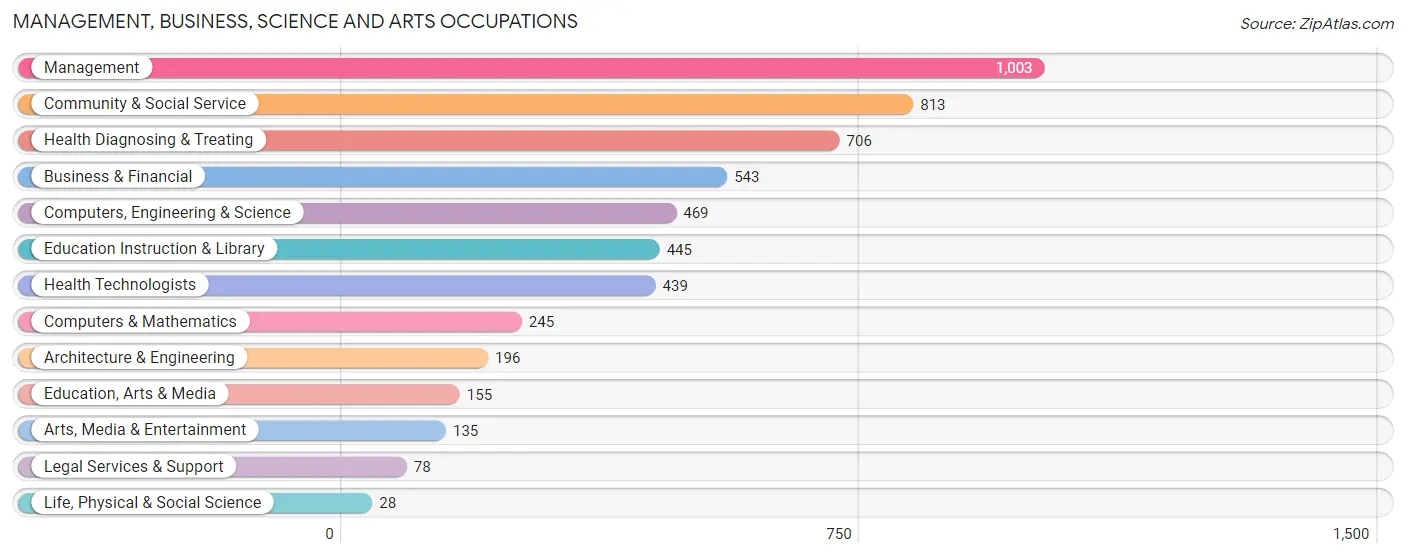
Management, Business, Science and Arts Occupations
The most common Management, Business, Science and Arts occupations in South Milwaukee are Management (1,003 | 9.6%), Community & Social Service (813 | 7.8%), Health Diagnosing & Treating (706 | 6.8%), Business & Financial (543 | 5.2%), and Computers, Engineering & Science (469 | 4.5%).
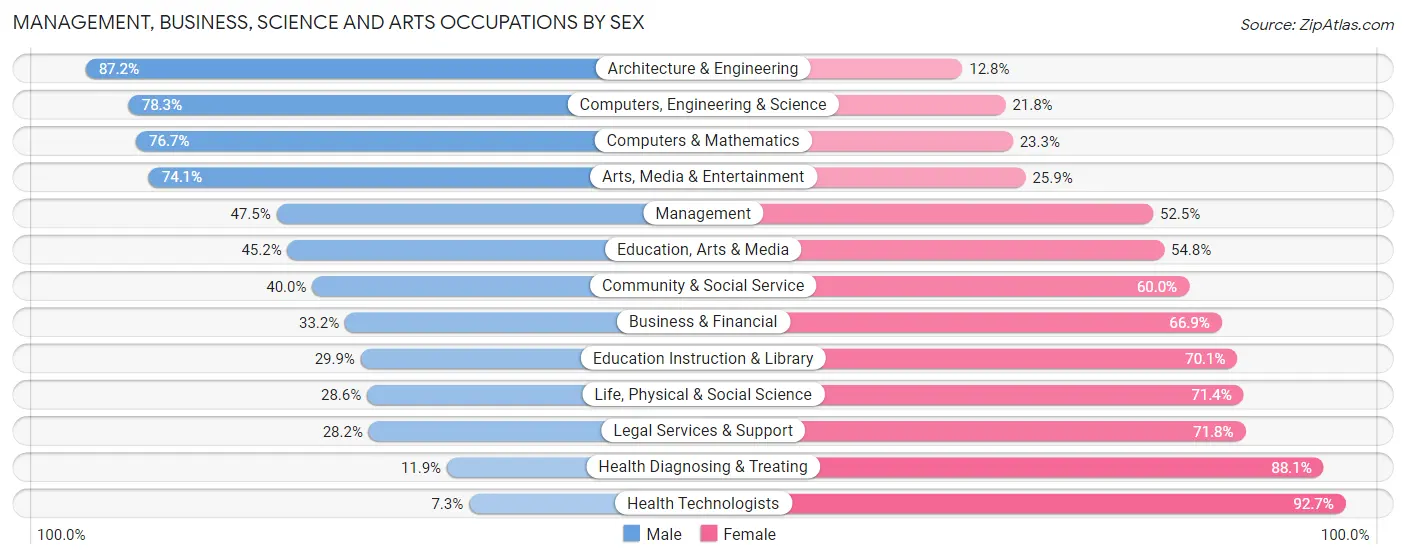
Management, Business, Science and Arts Occupations by Sex
Within the Management, Business, Science and Arts occupations in South Milwaukee, the most male-oriented occupations are Architecture & Engineering (87.2%), Computers, Engineering & Science (78.2%), and Computers & Mathematics (76.7%), while the most female-oriented occupations are Health Technologists (92.7%), Health Diagnosing & Treating (88.1%), and Legal Services & Support (71.8%).
| Occupation | Male | Female |
| Management | 476 (47.5%) | 527 (52.5%) |
| Business & Financial | 180 (33.2%) | 363 (66.8%) |
| Computers, Engineering & Science | 367 (78.2%) | 102 (21.7%) |
| Computers & Mathematics | 188 (76.7%) | 57 (23.3%) |
| Architecture & Engineering | 171 (87.2%) | 25 (12.8%) |
| Life, Physical & Social Science | 8 (28.6%) | 20 (71.4%) |
| Community & Social Service | 325 (40.0%) | 488 (60.0%) |
| Education, Arts & Media | 70 (45.2%) | 85 (54.8%) |
| Legal Services & Support | 22 (28.2%) | 56 (71.8%) |
| Education Instruction & Library | 133 (29.9%) | 312 (70.1%) |
| Arts, Media & Entertainment | 100 (74.1%) | 35 (25.9%) |
| Health Diagnosing & Treating | 84 (11.9%) | 622 (88.1%) |
| Health Technologists | 32 (7.3%) | 407 (92.7%) |
| Total (Category) | 1,432 (40.5%) | 2,102 (59.5%) |
| Total (Overall) | 5,385 (51.7%) | 5,037 (48.3%) |
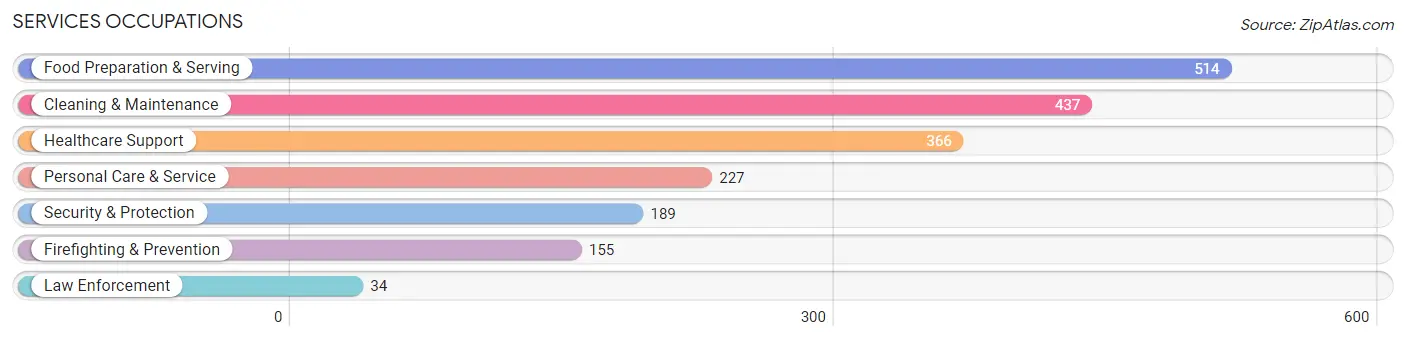
Services Occupations
The most common Services occupations in South Milwaukee are Food Preparation & Serving (514 | 4.9%), Cleaning & Maintenance (437 | 4.2%), Healthcare Support (366 | 3.5%), Personal Care & Service (227 | 2.2%), and Security & Protection (189 | 1.8%).
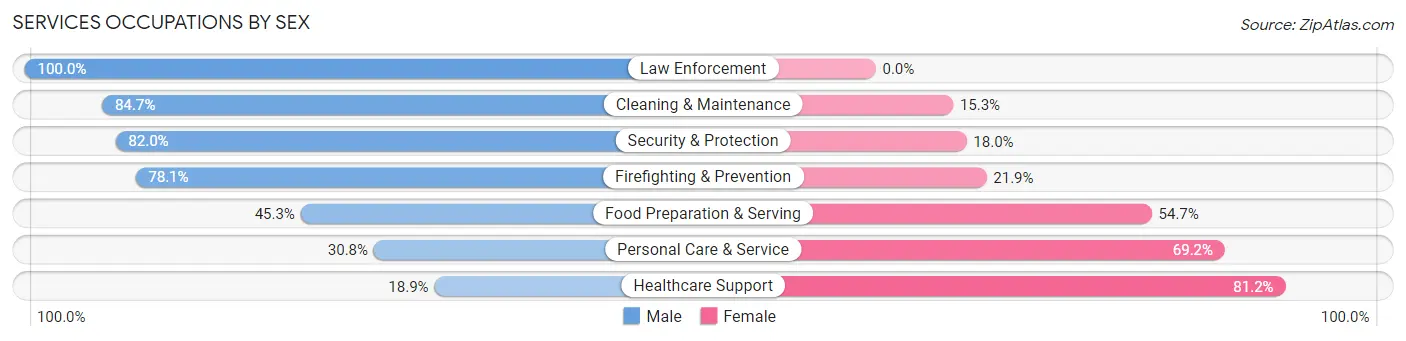
Services Occupations by Sex
Within the Services occupations in South Milwaukee, the most male-oriented occupations are Law Enforcement (100.0%), Cleaning & Maintenance (84.7%), and Security & Protection (82.0%), while the most female-oriented occupations are Healthcare Support (81.1%), Personal Care & Service (69.2%), and Food Preparation & Serving (54.7%).
| Occupation | Male | Female |
| Healthcare Support | 69 (18.9%) | 297 (81.1%) |
| Security & Protection | 155 (82.0%) | 34 (18.0%) |
| Firefighting & Prevention | 121 (78.1%) | 34 (21.9%) |
| Law Enforcement | 34 (100.0%) | 0 (0.0%) |
| Food Preparation & Serving | 233 (45.3%) | 281 (54.7%) |
| Cleaning & Maintenance | 370 (84.7%) | 67 (15.3%) |
| Personal Care & Service | 70 (30.8%) | 157 (69.2%) |
| Total (Category) | 897 (51.8%) | 836 (48.2%) |
| Total (Overall) | 5,385 (51.7%) | 5,037 (48.3%) |
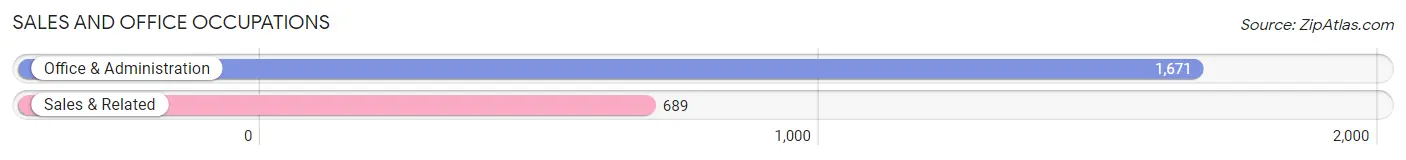
Sales and Office Occupations
The most common Sales and Office occupations in South Milwaukee are Office & Administration (1,671 | 16.0%), and Sales & Related (689 | 6.6%).
Sales and Office Occupations by Sex
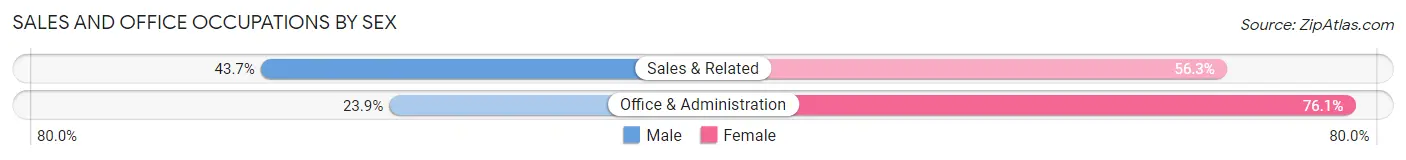
| Occupation | Male | Female |
| Sales & Related | 301 (43.7%) | 388 (56.3%) |
| Office & Administration | 400 (23.9%) | 1,271 (76.1%) |
| Total (Category) | 701 (29.7%) | 1,659 (70.3%) |
| Total (Overall) | 5,385 (51.7%) | 5,037 (48.3%) |
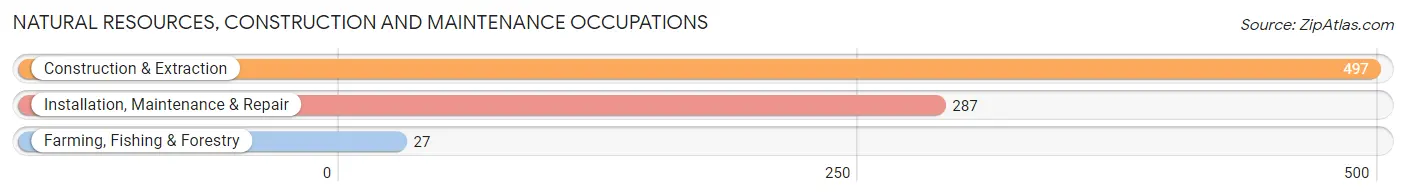
Natural Resources, Construction and Maintenance Occupations
The most common Natural Resources, Construction and Maintenance occupations in South Milwaukee are Construction & Extraction (497 | 4.8%), Installation, Maintenance & Repair (287 | 2.8%), and Farming, Fishing & Forestry (27 | 0.3%).
Natural Resources, Construction and Maintenance Occupations by Sex
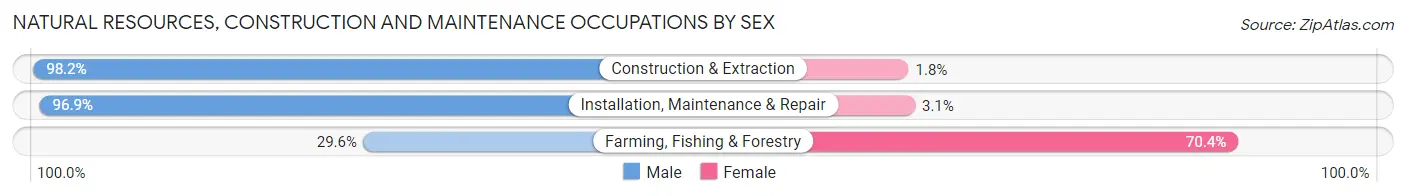
| Occupation | Male | Female |
| Farming, Fishing & Forestry | 8 (29.6%) | 19 (70.4%) |
| Construction & Extraction | 488 (98.2%) | 9 (1.8%) |
| Installation, Maintenance & Repair | 278 (96.9%) | 9 (3.1%) |
| Total (Category) | 774 (95.4%) | 37 (4.6%) |
| Total (Overall) | 5,385 (51.7%) | 5,037 (48.3%) |
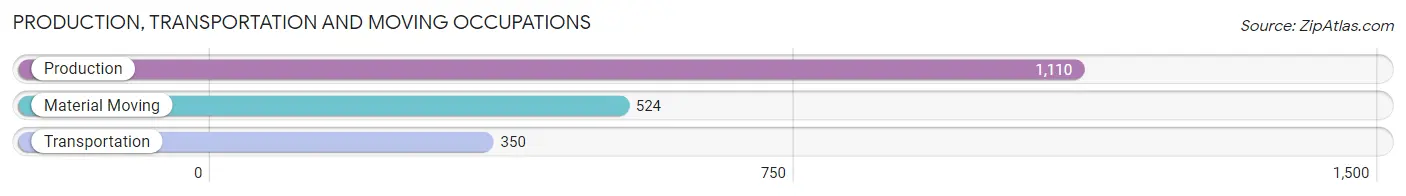
Production, Transportation and Moving Occupations
The most common Production, Transportation and Moving occupations in South Milwaukee are Production (1,110 | 10.6%), Material Moving (524 | 5.0%), and Transportation (350 | 3.4%).
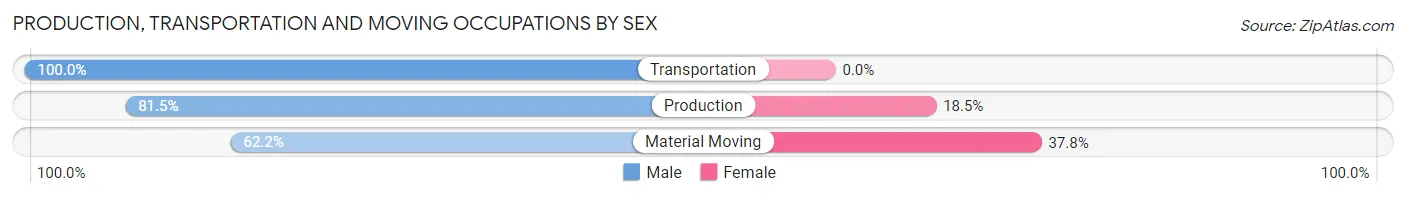
Production, Transportation and Moving Occupations by Sex
| Occupation | Male | Female |
| Production | 905 (81.5%) | 205 (18.5%) |
| Transportation | 350 (100.0%) | 0 (0.0%) |
| Material Moving | 326 (62.2%) | 198 (37.8%) |
| Total (Category) | 1,581 (79.7%) | 403 (20.3%) |
| Total (Overall) | 5,385 (51.7%) | 5,037 (48.3%) |
Employment Industries by Sex in South Milwaukee
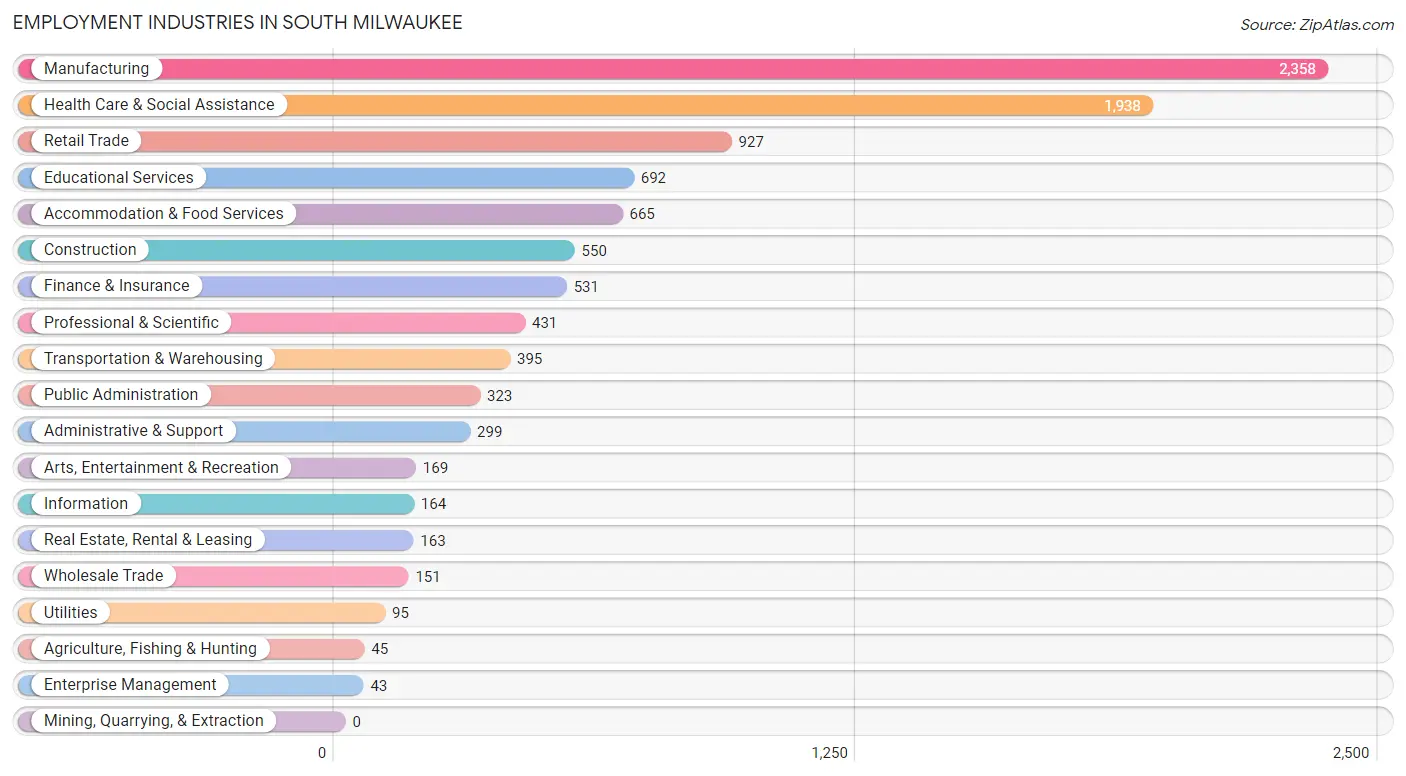
Employment Industries in South Milwaukee
The major employment industries in South Milwaukee include Manufacturing (2,358 | 22.6%), Health Care & Social Assistance (1,938 | 18.6%), Retail Trade (927 | 8.9%), Educational Services (692 | 6.6%), and Accommodation & Food Services (665 | 6.4%).
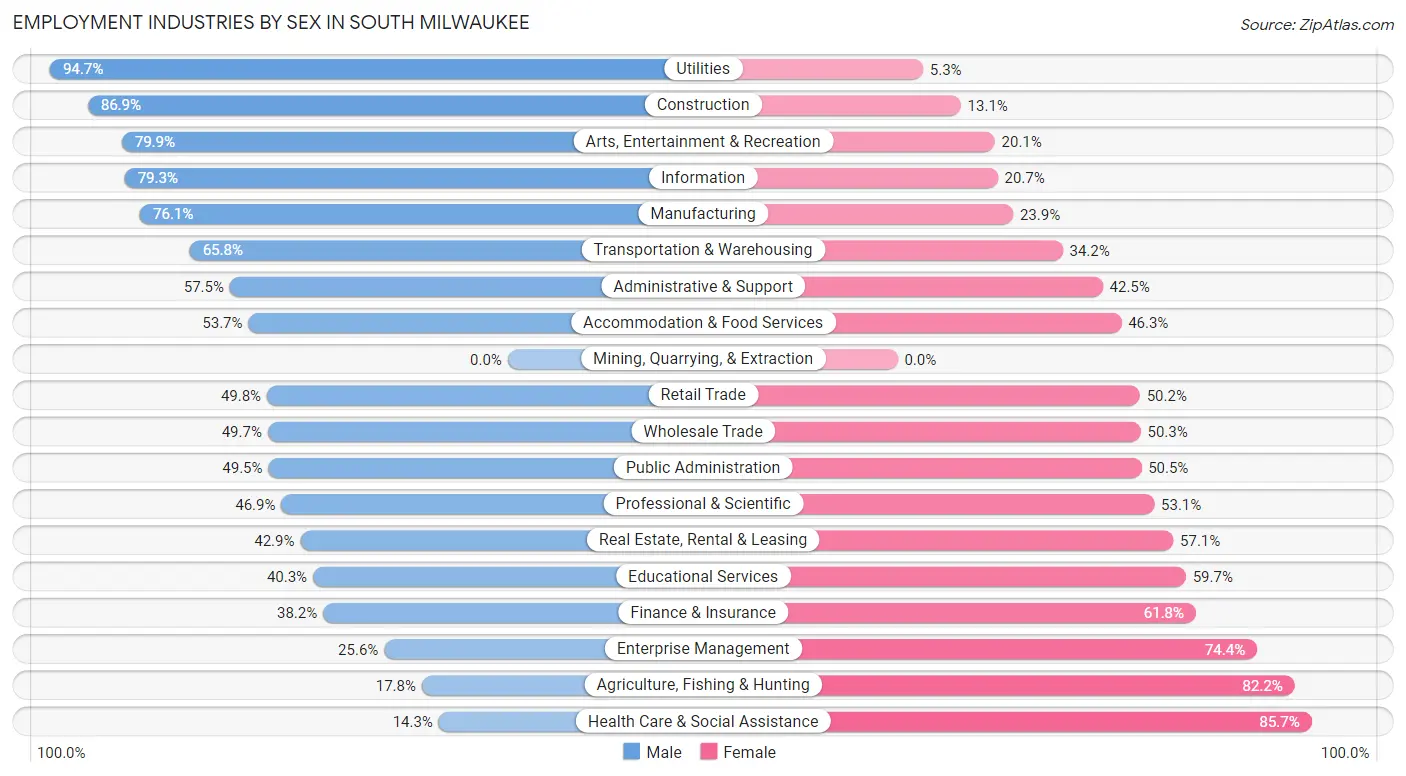
Employment Industries by Sex in South Milwaukee
The South Milwaukee industries that see more men than women are Utilities (94.7%), Construction (86.9%), and Arts, Entertainment & Recreation (79.9%), whereas the industries that tend to have a higher number of women are Health Care & Social Assistance (85.7%), Agriculture, Fishing & Hunting (82.2%), and Enterprise Management (74.4%).
| Industry | Male | Female |
| Agriculture, Fishing & Hunting | 8 (17.8%) | 37 (82.2%) |
| Mining, Quarrying, & Extraction | 0 (0.0%) | 0 (0.0%) |
| Construction | 478 (86.9%) | 72 (13.1%) |
| Manufacturing | 1,794 (76.1%) | 564 (23.9%) |
| Wholesale Trade | 75 (49.7%) | 76 (50.3%) |
| Retail Trade | 462 (49.8%) | 465 (50.2%) |
| Transportation & Warehousing | 260 (65.8%) | 135 (34.2%) |
| Utilities | 90 (94.7%) | 5 (5.3%) |
| Information | 130 (79.3%) | 34 (20.7%) |
| Finance & Insurance | 203 (38.2%) | 328 (61.8%) |
| Real Estate, Rental & Leasing | 70 (42.9%) | 93 (57.1%) |
| Professional & Scientific | 202 (46.9%) | 229 (53.1%) |
| Enterprise Management | 11 (25.6%) | 32 (74.4%) |
| Administrative & Support | 172 (57.5%) | 127 (42.5%) |
| Educational Services | 279 (40.3%) | 413 (59.7%) |
| Health Care & Social Assistance | 277 (14.3%) | 1,661 (85.7%) |
| Arts, Entertainment & Recreation | 135 (79.9%) | 34 (20.1%) |
| Accommodation & Food Services | 357 (53.7%) | 308 (46.3%) |
| Public Administration | 160 (49.5%) | 163 (50.5%) |
| Total | 5,385 (51.7%) | 5,037 (48.3%) |
Education in South Milwaukee
School Enrollment in South Milwaukee
The most common levels of schooling among the 4,061 students in South Milwaukee are elementary school (932 | 23.0%), middle school (931 | 22.9%), and high school (916 | 22.6%).
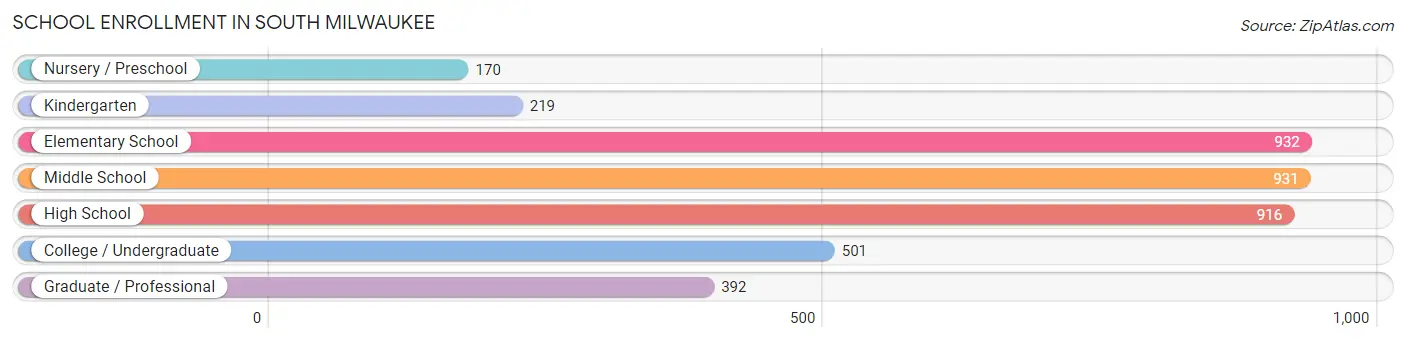
| School Level | # Students | % Students |
| Nursery / Preschool | 170 | 4.2% |
| Kindergarten | 219 | 5.4% |
| Elementary School | 932 | 23.0% |
| Middle School | 931 | 22.9% |
| High School | 916 | 22.6% |
| College / Undergraduate | 501 | 12.3% |
| Graduate / Professional | 392 | 9.7% |
| Total | 4,061 | 100.0% |
School Enrollment by Age by Funding Source in South Milwaukee
Out of a total of 4,061 students who are enrolled in schools in South Milwaukee, 897 (22.1%) attend a private institution, while the remaining 3,164 (77.9%) are enrolled in public schools. The age group of 3 to 4 year olds has the highest likelihood of being enrolled in private schools, with 98 (72.1% in the age bracket) enrolled. Conversely, the age group of 18 to 19 year olds has the lowest likelihood of being enrolled in a private school, with 200 (100.0% in the age bracket) attending a public institution.
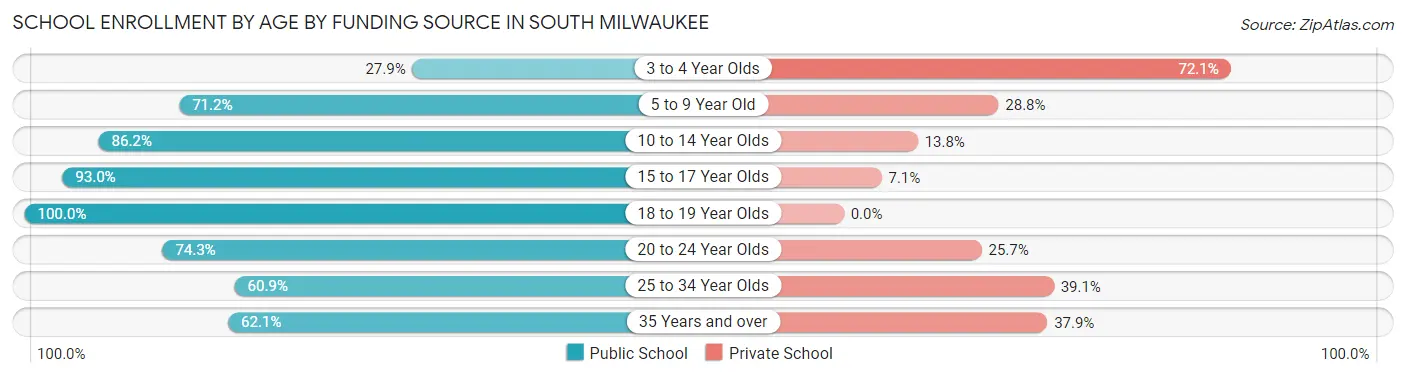
| Age Bracket | Public School | Private School |
| 3 to 4 Year Olds | 38 (27.9%) | 98 (72.1%) |
| 5 to 9 Year Old | 739 (71.2%) | 299 (28.8%) |
| 10 to 14 Year Olds | 1,038 (86.2%) | 166 (13.8%) |
| 15 to 17 Year Olds | 620 (92.9%) | 47 (7.0%) |
| 18 to 19 Year Olds | 200 (100.0%) | 0 (0.0%) |
| 20 to 24 Year Olds | 165 (74.3%) | 57 (25.7%) |
| 25 to 34 Year Olds | 193 (60.9%) | 124 (39.1%) |
| 35 Years and over | 172 (62.1%) | 105 (37.9%) |
| Total | 3,164 (77.9%) | 897 (22.1%) |
Educational Attainment by Field of Study in South Milwaukee
Business (784 | 18.3%), education (480 | 11.2%), science & technology (470 | 11.0%), arts & humanities (458 | 10.7%), and communications (329 | 7.7%) are the most common fields of study among 4,283 individuals in South Milwaukee who have obtained a bachelor's degree or higher.
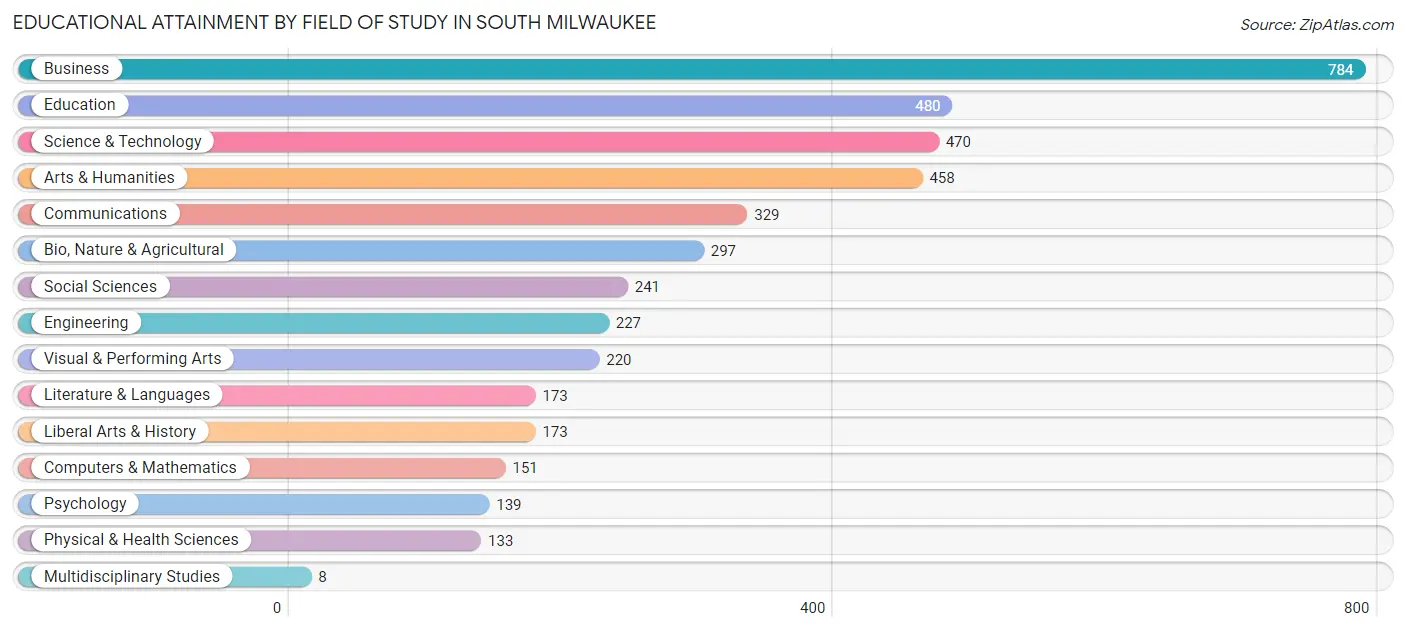
| Field of Study | # Graduates | % Graduates |
| Computers & Mathematics | 151 | 3.5% |
| Bio, Nature & Agricultural | 297 | 6.9% |
| Physical & Health Sciences | 133 | 3.1% |
| Psychology | 139 | 3.3% |
| Social Sciences | 241 | 5.6% |
| Engineering | 227 | 5.3% |
| Multidisciplinary Studies | 8 | 0.2% |
| Science & Technology | 470 | 11.0% |
| Business | 784 | 18.3% |
| Education | 480 | 11.2% |
| Literature & Languages | 173 | 4.0% |
| Liberal Arts & History | 173 | 4.0% |
| Visual & Performing Arts | 220 | 5.1% |
| Communications | 329 | 7.7% |
| Arts & Humanities | 458 | 10.7% |
| Total | 4,283 | 100.0% |
Transportation & Commute in South Milwaukee
Vehicle Availability by Sex in South Milwaukee
The most prevalent vehicle ownership categories in South Milwaukee are males with 2 vehicles (2,673, accounting for 50.5%) and females with 2 vehicles (2,099, making up 54.8%).
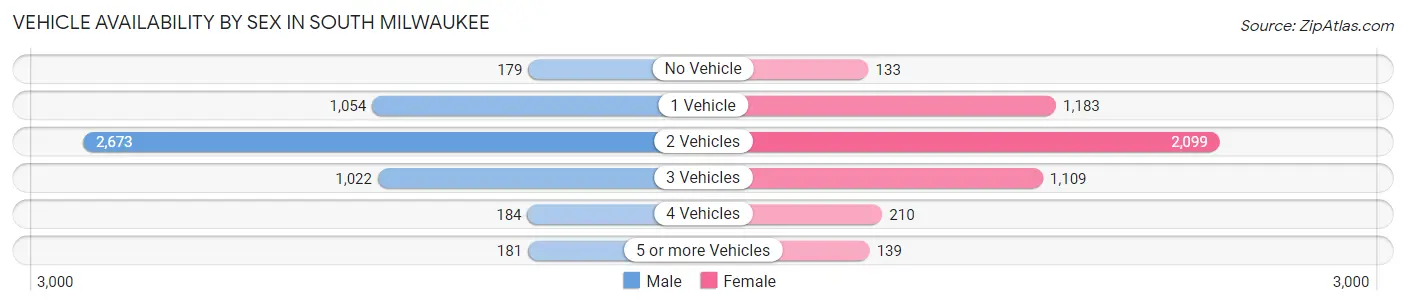
| Vehicles Available | Male | Female |
| No Vehicle | 179 (3.4%) | 133 (2.7%) |
| 1 Vehicle | 1,054 (19.9%) | 1,183 (24.3%) |
| 2 Vehicles | 2,673 (50.5%) | 2,099 (43.1%) |
| 3 Vehicles | 1,022 (19.3%) | 1,109 (22.8%) |
| 4 Vehicles | 184 (3.5%) | 210 (4.3%) |
| 5 or more Vehicles | 181 (3.4%) | 139 (2.9%) |
| Total | 5,293 (100.0%) | 4,873 (100.0%) |
Commute Time in South Milwaukee
The most frequently occuring commute durations in South Milwaukee are 30 to 34 minutes (1,720 commuters, 19.0%), 20 to 24 minutes (1,424 commuters, 15.7%), and 10 to 14 minutes (1,139 commuters, 12.6%).
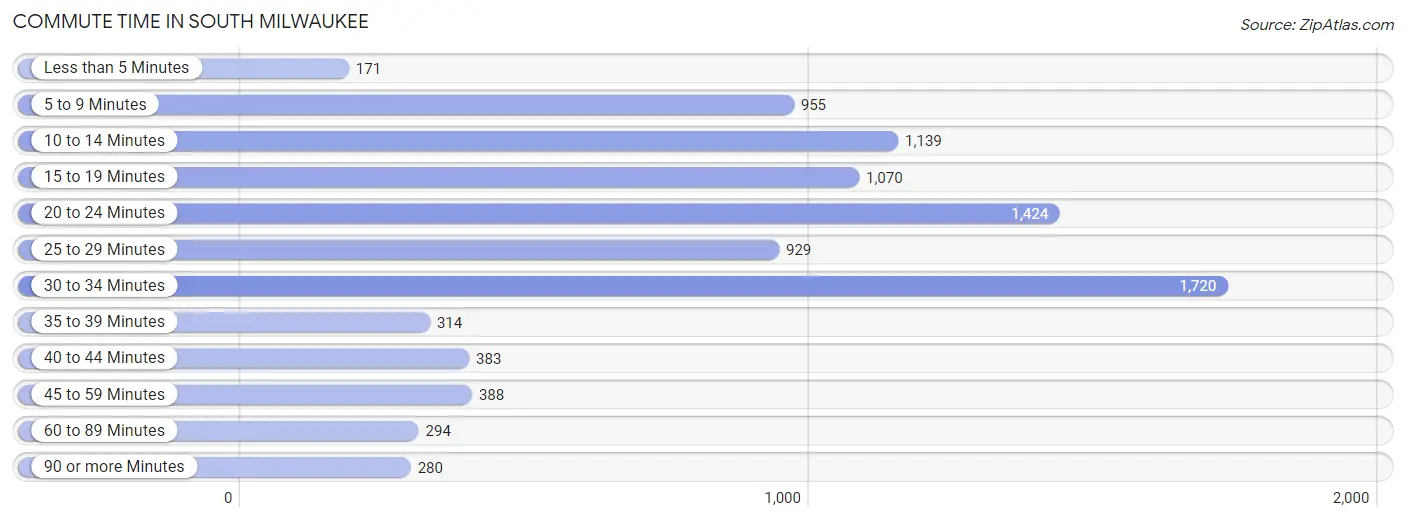
| Commute Time | # Commuters | % Commuters |
| Less than 5 Minutes | 171 | 1.9% |
| 5 to 9 Minutes | 955 | 10.5% |
| 10 to 14 Minutes | 1,139 | 12.6% |
| 15 to 19 Minutes | 1,070 | 11.8% |
| 20 to 24 Minutes | 1,424 | 15.7% |
| 25 to 29 Minutes | 929 | 10.2% |
| 30 to 34 Minutes | 1,720 | 19.0% |
| 35 to 39 Minutes | 314 | 3.5% |
| 40 to 44 Minutes | 383 | 4.2% |
| 45 to 59 Minutes | 388 | 4.3% |
| 60 to 89 Minutes | 294 | 3.2% |
| 90 or more Minutes | 280 | 3.1% |
Commute Time by Sex in South Milwaukee
The most common commute times in South Milwaukee are 30 to 34 minutes (1,014 commuters, 20.3%) for males and 20 to 24 minutes (780 commuters, 19.1%) for females.
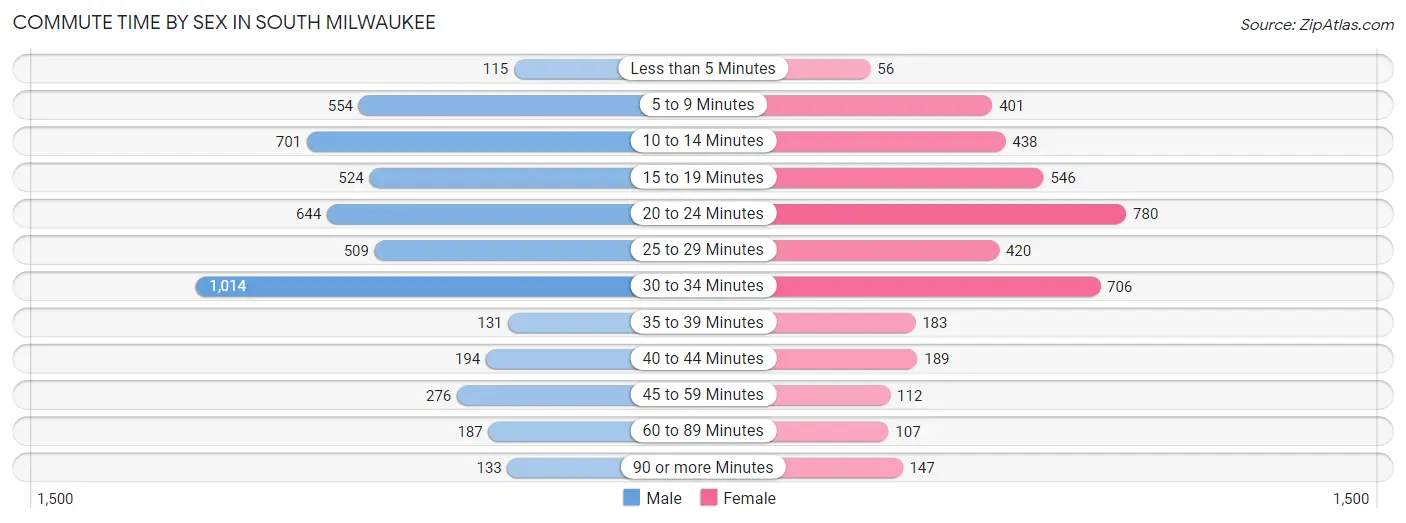
| Commute Time | Male | Female |
| Less than 5 Minutes | 115 (2.3%) | 56 (1.4%) |
| 5 to 9 Minutes | 554 (11.1%) | 401 (9.8%) |
| 10 to 14 Minutes | 701 (14.1%) | 438 (10.7%) |
| 15 to 19 Minutes | 524 (10.5%) | 546 (13.4%) |
| 20 to 24 Minutes | 644 (12.9%) | 780 (19.1%) |
| 25 to 29 Minutes | 509 (10.2%) | 420 (10.3%) |
| 30 to 34 Minutes | 1,014 (20.3%) | 706 (17.3%) |
| 35 to 39 Minutes | 131 (2.6%) | 183 (4.5%) |
| 40 to 44 Minutes | 194 (3.9%) | 189 (4.6%) |
| 45 to 59 Minutes | 276 (5.5%) | 112 (2.7%) |
| 60 to 89 Minutes | 187 (3.7%) | 107 (2.6%) |
| 90 or more Minutes | 133 (2.7%) | 147 (3.6%) |
Time of Departure to Work by Sex in South Milwaukee
The most frequent times of departure to work in South Milwaukee are 7:00 AM to 7:29 AM (887, 17.8%) for males and 7:00 AM to 7:29 AM (846, 20.7%) for females.
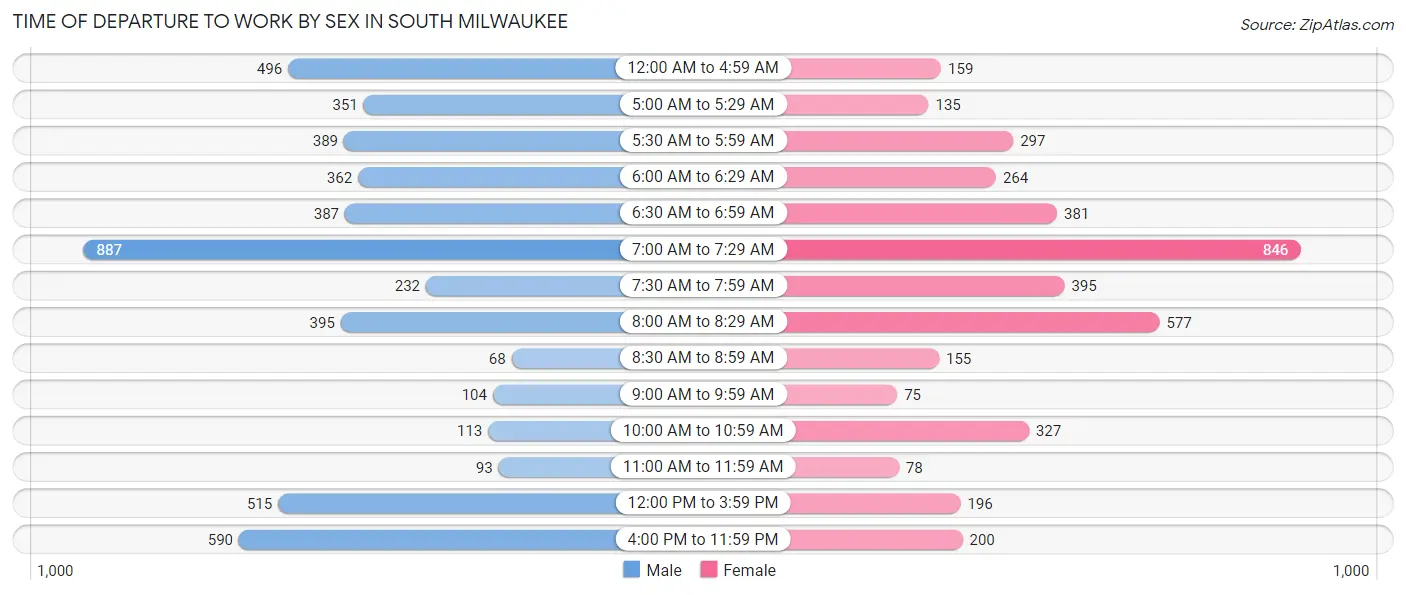
| Time of Departure | Male | Female |
| 12:00 AM to 4:59 AM | 496 (10.0%) | 159 (3.9%) |
| 5:00 AM to 5:29 AM | 351 (7.0%) | 135 (3.3%) |
| 5:30 AM to 5:59 AM | 389 (7.8%) | 297 (7.3%) |
| 6:00 AM to 6:29 AM | 362 (7.3%) | 264 (6.5%) |
| 6:30 AM to 6:59 AM | 387 (7.8%) | 381 (9.3%) |
| 7:00 AM to 7:29 AM | 887 (17.8%) | 846 (20.7%) |
| 7:30 AM to 7:59 AM | 232 (4.7%) | 395 (9.7%) |
| 8:00 AM to 8:29 AM | 395 (7.9%) | 577 (14.1%) |
| 8:30 AM to 8:59 AM | 68 (1.4%) | 155 (3.8%) |
| 9:00 AM to 9:59 AM | 104 (2.1%) | 75 (1.8%) |
| 10:00 AM to 10:59 AM | 113 (2.3%) | 327 (8.0%) |
| 11:00 AM to 11:59 AM | 93 (1.9%) | 78 (1.9%) |
| 12:00 PM to 3:59 PM | 515 (10.3%) | 196 (4.8%) |
| 4:00 PM to 11:59 PM | 590 (11.8%) | 200 (4.9%) |
| Total | 4,982 (100.0%) | 4,085 (100.0%) |
Housing Occupancy in South Milwaukee
Occupancy by Ownership in South Milwaukee
Of the total 8,543 dwellings in South Milwaukee, owner-occupied units account for 5,562 (65.1%), while renter-occupied units make up 2,981 (34.9%).
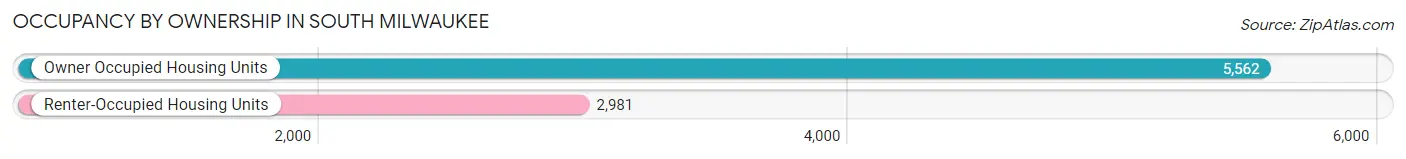
| Occupancy | # Housing Units | % Housing Units |
| Owner Occupied Housing Units | 5,562 | 65.1% |
| Renter-Occupied Housing Units | 2,981 | 34.9% |
| Total Occupied Housing Units | 8,543 | 100.0% |
Occupancy by Household Size in South Milwaukee
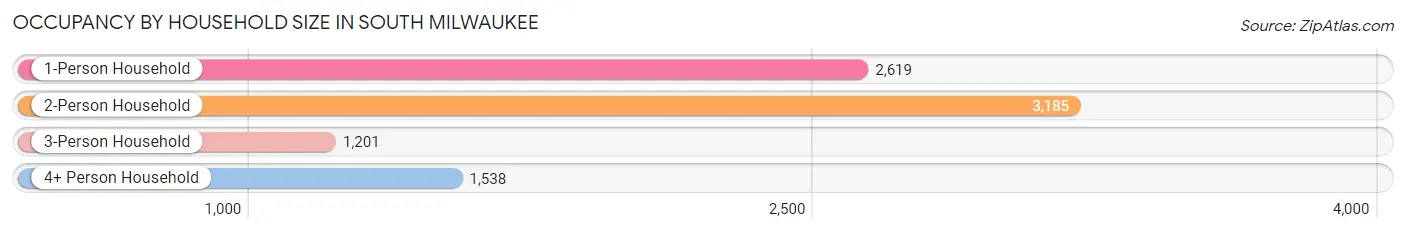
| Household Size | # Housing Units | % Housing Units |
| 1-Person Household | 2,619 | 30.7% |
| 2-Person Household | 3,185 | 37.3% |
| 3-Person Household | 1,201 | 14.1% |
| 4+ Person Household | 1,538 | 18.0% |
| Total Housing Units | 8,543 | 100.0% |
Occupancy by Ownership by Household Size in South Milwaukee
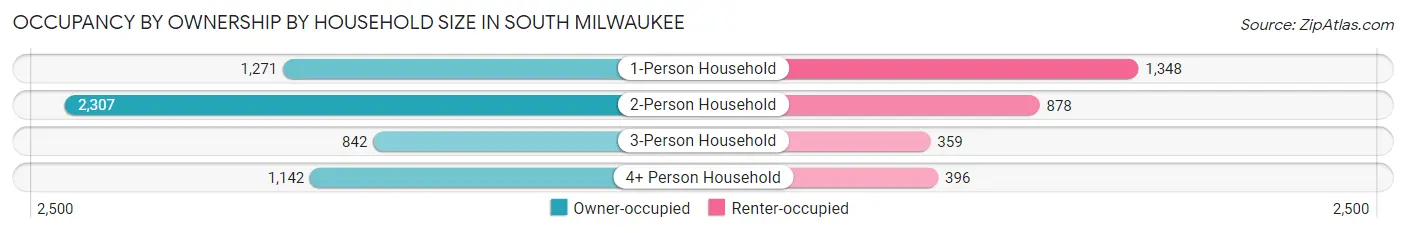
| Household Size | Owner-occupied | Renter-occupied |
| 1-Person Household | 1,271 (48.5%) | 1,348 (51.5%) |
| 2-Person Household | 2,307 (72.4%) | 878 (27.6%) |
| 3-Person Household | 842 (70.1%) | 359 (29.9%) |
| 4+ Person Household | 1,142 (74.3%) | 396 (25.8%) |
| Total Housing Units | 5,562 (65.1%) | 2,981 (34.9%) |
Occupancy by Educational Attainment in South Milwaukee
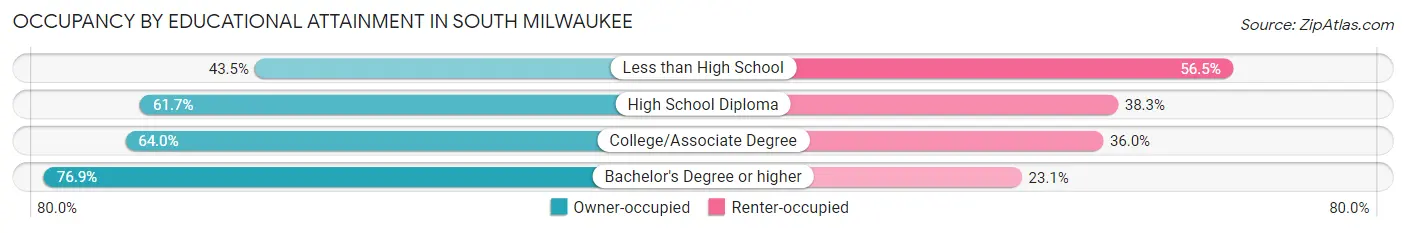
| Household Size | Owner-occupied | Renter-occupied |
| Less than High School | 274 (43.5%) | 356 (56.5%) |
| High School Diploma | 1,788 (61.7%) | 1,111 (38.3%) |
| College/Associate Degree | 1,773 (64.0%) | 996 (36.0%) |
| Bachelor's Degree or higher | 1,727 (76.9%) | 518 (23.1%) |
Occupancy by Age of Householder in South Milwaukee
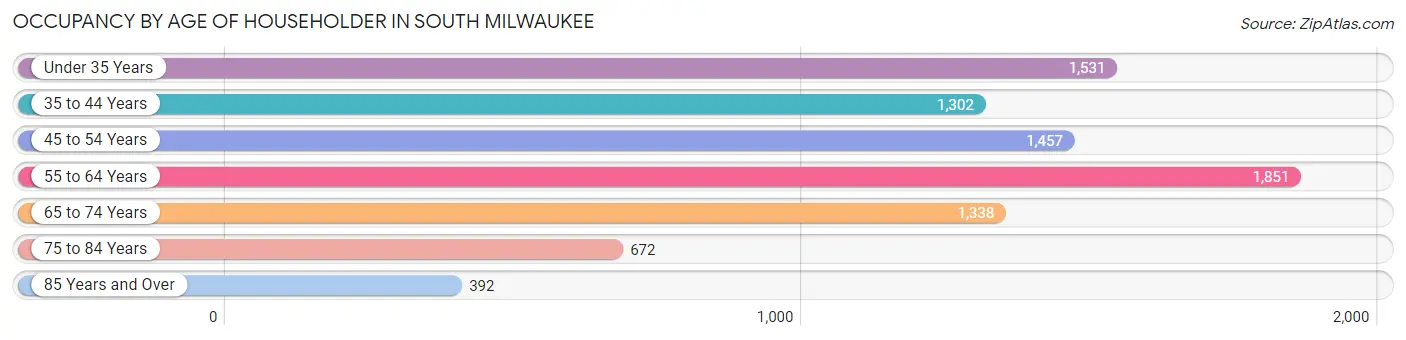
| Age Bracket | # Households | % Households |
| Under 35 Years | 1,531 | 17.9% |
| 35 to 44 Years | 1,302 | 15.2% |
| 45 to 54 Years | 1,457 | 17.1% |
| 55 to 64 Years | 1,851 | 21.7% |
| 65 to 74 Years | 1,338 | 15.7% |
| 75 to 84 Years | 672 | 7.9% |
| 85 Years and Over | 392 | 4.6% |
| Total | 8,543 | 100.0% |
Housing Finances in South Milwaukee
Median Income by Occupancy in South Milwaukee
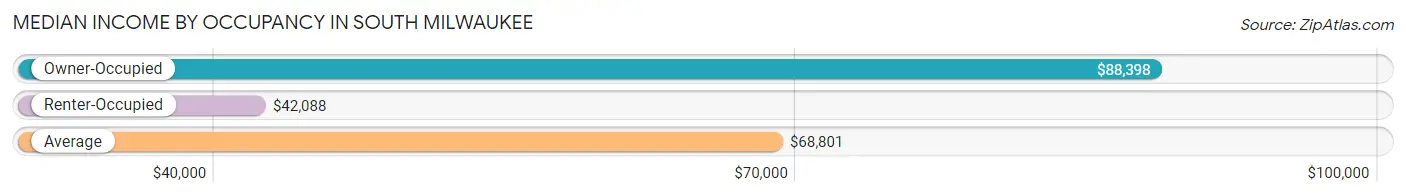
| Occupancy Type | # Households | Median Income |
| Owner-Occupied | 5,562 (65.1%) | $88,398 |
| Renter-Occupied | 2,981 (34.9%) | $42,088 |
| Average | 8,543 (100.0%) | $68,801 |
Occupancy by Householder Income Bracket in South Milwaukee
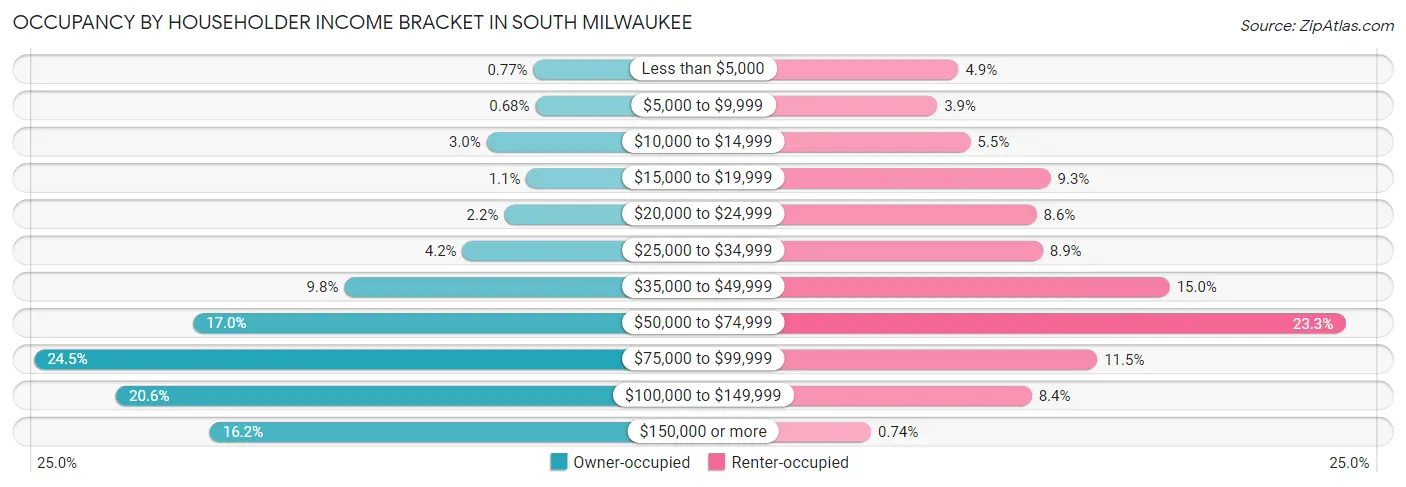
| Income Bracket | Owner-occupied | Renter-occupied |
| Less than $5,000 | 43 (0.8%) | 146 (4.9%) |
| $5,000 to $9,999 | 38 (0.7%) | 116 (3.9%) |
| $10,000 to $14,999 | 167 (3.0%) | 163 (5.5%) |
| $15,000 to $19,999 | 62 (1.1%) | 277 (9.3%) |
| $20,000 to $24,999 | 120 (2.2%) | 257 (8.6%) |
| $25,000 to $34,999 | 231 (4.2%) | 266 (8.9%) |
| $35,000 to $49,999 | 544 (9.8%) | 446 (15.0%) |
| $50,000 to $74,999 | 944 (17.0%) | 695 (23.3%) |
| $75,000 to $99,999 | 1,365 (24.5%) | 343 (11.5%) |
| $100,000 to $149,999 | 1,148 (20.6%) | 250 (8.4%) |
| $150,000 or more | 900 (16.2%) | 22 (0.7%) |
| Total | 5,562 (100.0%) | 2,981 (100.0%) |
Monthly Housing Cost Tiers in South Milwaukee
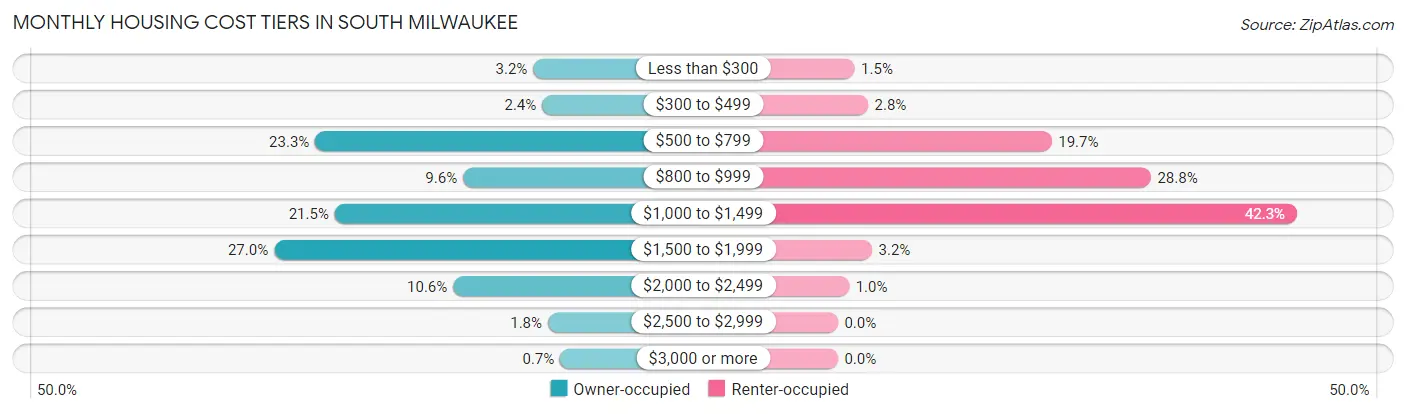
| Monthly Cost | Owner-occupied | Renter-occupied |
| Less than $300 | 177 (3.2%) | 46 (1.5%) |
| $300 to $499 | 131 (2.4%) | 83 (2.8%) |
| $500 to $799 | 1,293 (23.3%) | 587 (19.7%) |
| $800 to $999 | 536 (9.6%) | 859 (28.8%) |
| $1,000 to $1,499 | 1,193 (21.4%) | 1,261 (42.3%) |
| $1,500 to $1,999 | 1,504 (27.0%) | 94 (3.2%) |
| $2,000 to $2,499 | 587 (10.5%) | 31 (1.0%) |
| $2,500 to $2,999 | 102 (1.8%) | 0 (0.0%) |
| $3,000 or more | 39 (0.7%) | 0 (0.0%) |
| Total | 5,562 (100.0%) | 2,981 (100.0%) |
Physical Housing Characteristics in South Milwaukee
Housing Structures in South Milwaukee
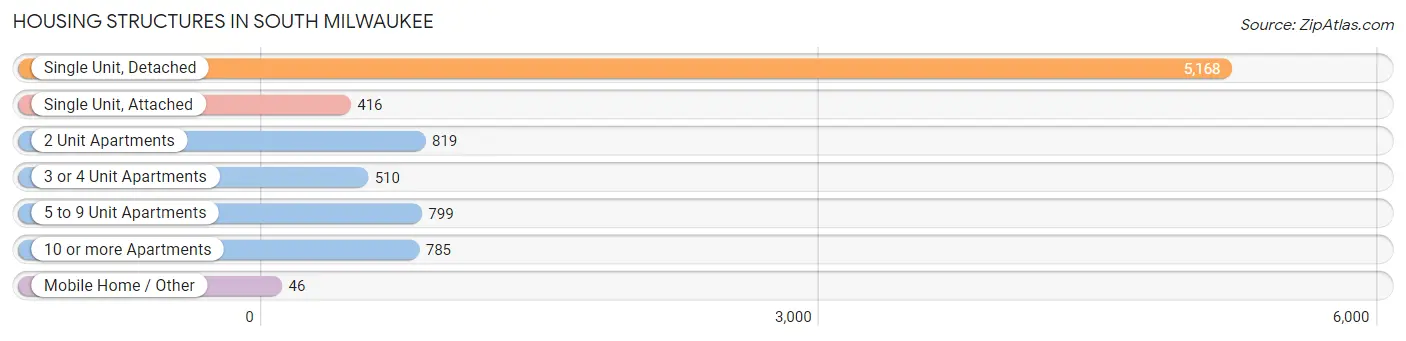
| Structure Type | # Housing Units | % Housing Units |
| Single Unit, Detached | 5,168 | 60.5% |
| Single Unit, Attached | 416 | 4.9% |
| 2 Unit Apartments | 819 | 9.6% |
| 3 or 4 Unit Apartments | 510 | 6.0% |
| 5 to 9 Unit Apartments | 799 | 9.3% |
| 10 or more Apartments | 785 | 9.2% |
| Mobile Home / Other | 46 | 0.5% |
| Total | 8,543 | 100.0% |
Housing Structures by Occupancy in South Milwaukee
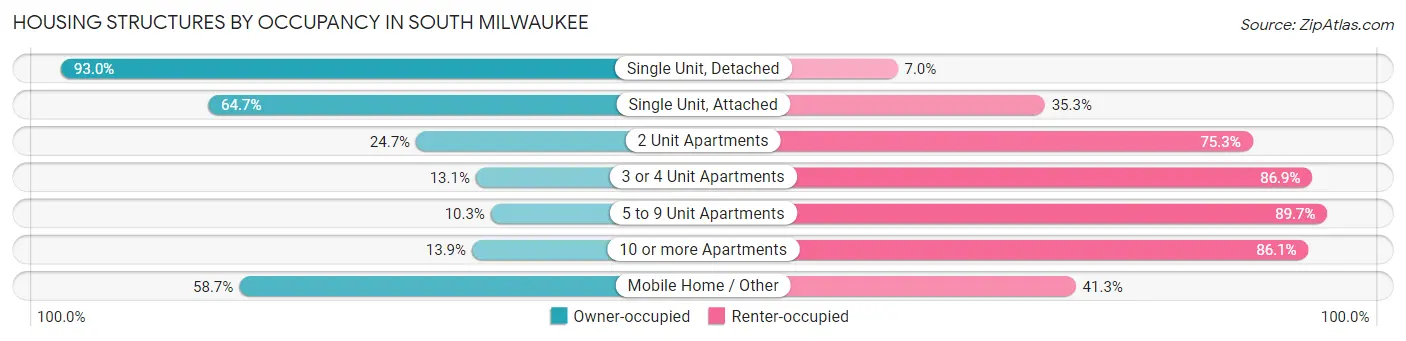
| Structure Type | Owner-occupied | Renter-occupied |
| Single Unit, Detached | 4,806 (93.0%) | 362 (7.0%) |
| Single Unit, Attached | 269 (64.7%) | 147 (35.3%) |
| 2 Unit Apartments | 202 (24.7%) | 617 (75.3%) |
| 3 or 4 Unit Apartments | 67 (13.1%) | 443 (86.9%) |
| 5 to 9 Unit Apartments | 82 (10.3%) | 717 (89.7%) |
| 10 or more Apartments | 109 (13.9%) | 676 (86.1%) |
| Mobile Home / Other | 27 (58.7%) | 19 (41.3%) |
| Total | 5,562 (65.1%) | 2,981 (34.9%) |
Housing Structures by Number of Rooms in South Milwaukee
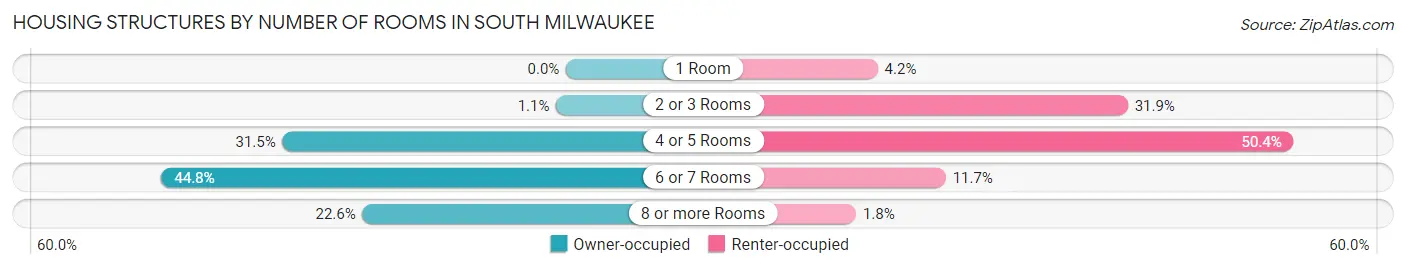
| Number of Rooms | Owner-occupied | Renter-occupied |
| 1 Room | 0 (0.0%) | 125 (4.2%) |
| 2 or 3 Rooms | 61 (1.1%) | 952 (31.9%) |
| 4 or 5 Rooms | 1,751 (31.5%) | 1,501 (50.3%) |
| 6 or 7 Rooms | 2,493 (44.8%) | 350 (11.7%) |
| 8 or more Rooms | 1,257 (22.6%) | 53 (1.8%) |
| Total | 5,562 (100.0%) | 2,981 (100.0%) |
Housing Structure by Heating Type in South Milwaukee
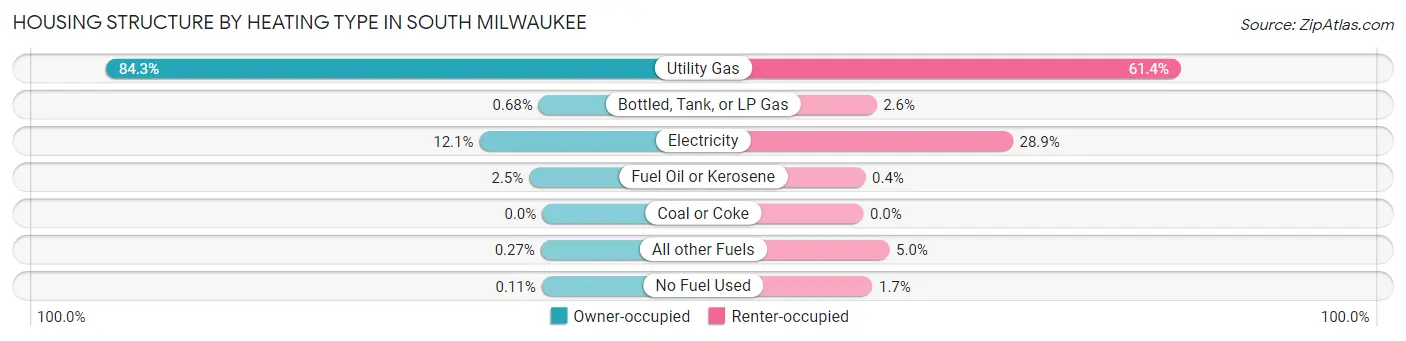
| Heating Type | Owner-occupied | Renter-occupied |
| Utility Gas | 4,688 (84.3%) | 1,830 (61.4%) |
| Bottled, Tank, or LP Gas | 38 (0.7%) | 76 (2.5%) |
| Electricity | 675 (12.1%) | 861 (28.9%) |
| Fuel Oil or Kerosene | 140 (2.5%) | 12 (0.4%) |
| Coal or Coke | 0 (0.0%) | 0 (0.0%) |
| All other Fuels | 15 (0.3%) | 150 (5.0%) |
| No Fuel Used | 6 (0.1%) | 52 (1.7%) |
| Total | 5,562 (100.0%) | 2,981 (100.0%) |
Household Vehicle Usage in South Milwaukee
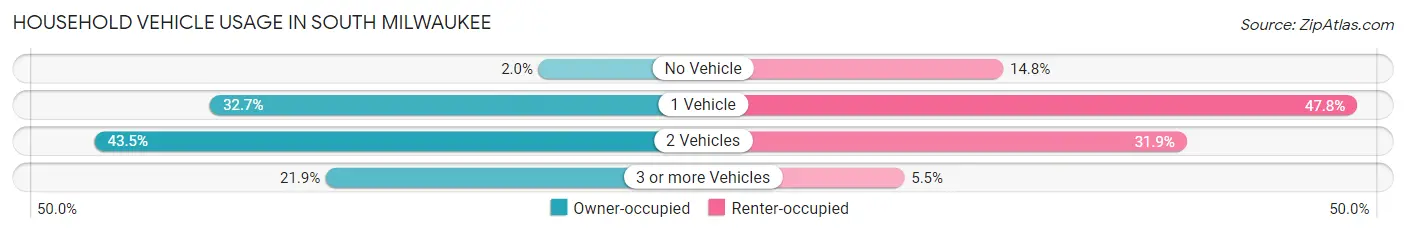
| Vehicles per Household | Owner-occupied | Renter-occupied |
| No Vehicle | 111 (2.0%) | 440 (14.8%) |
| 1 Vehicle | 1,818 (32.7%) | 1,425 (47.8%) |
| 2 Vehicles | 2,417 (43.5%) | 951 (31.9%) |
| 3 or more Vehicles | 1,216 (21.9%) | 165 (5.5%) |
| Total | 5,562 (100.0%) | 2,981 (100.0%) |
Real Estate & Mortgages in South Milwaukee
Real Estate and Mortgage Overview in South Milwaukee
| Characteristic | Without Mortgage | With Mortgage |
| Housing Units | 1,896 | 3,666 |
| Median Property Value | $194,600 | $204,400 |
| Median Household Income | $70,741 | $674 |
| Monthly Housing Costs | $684 | $28 |
| Real Estate Taxes | $4,199 | $61 |
Property Value by Mortgage Status in South Milwaukee
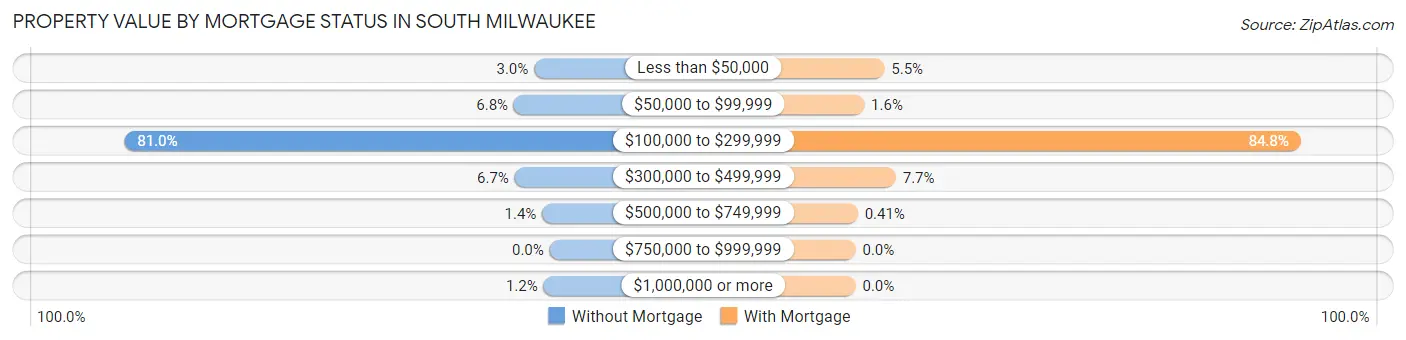
| Property Value | Without Mortgage | With Mortgage |
| Less than $50,000 | 56 (2.9%) | 201 (5.5%) |
| $50,000 to $99,999 | 129 (6.8%) | 60 (1.6%) |
| $100,000 to $299,999 | 1,536 (81.0%) | 3,109 (84.8%) |
| $300,000 to $499,999 | 126 (6.7%) | 281 (7.7%) |
| $500,000 to $749,999 | 27 (1.4%) | 15 (0.4%) |
| $750,000 to $999,999 | 0 (0.0%) | 0 (0.0%) |
| $1,000,000 or more | 22 (1.2%) | 0 (0.0%) |
| Total | 1,896 (100.0%) | 3,666 (100.0%) |
Household Income by Mortgage Status in South Milwaukee
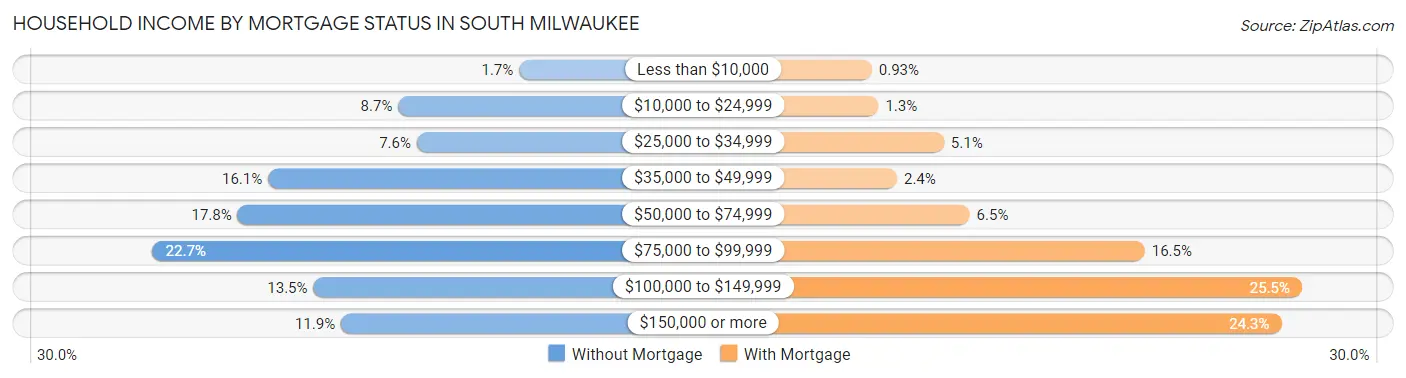
| Household Income | Without Mortgage | With Mortgage |
| Less than $10,000 | 33 (1.7%) | 34 (0.9%) |
| $10,000 to $24,999 | 164 (8.6%) | 48 (1.3%) |
| $25,000 to $34,999 | 144 (7.6%) | 185 (5.1%) |
| $35,000 to $49,999 | 305 (16.1%) | 87 (2.4%) |
| $50,000 to $74,999 | 338 (17.8%) | 239 (6.5%) |
| $75,000 to $99,999 | 430 (22.7%) | 606 (16.5%) |
| $100,000 to $149,999 | 256 (13.5%) | 935 (25.5%) |
| $150,000 or more | 226 (11.9%) | 892 (24.3%) |
| Total | 1,896 (100.0%) | 3,666 (100.0%) |
Property Value to Household Income Ratio in South Milwaukee
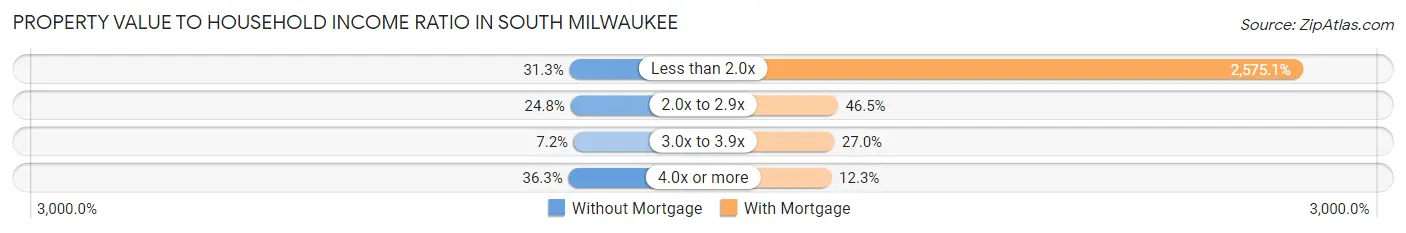
| Value-to-Income Ratio | Without Mortgage | With Mortgage |
| Less than 2.0x | 593 (31.3%) | 94,403 (2,575.1%) |
| 2.0x to 2.9x | 471 (24.8%) | 1,704 (46.5%) |
| 3.0x to 3.9x | 136 (7.2%) | 991 (27.0%) |
| 4.0x or more | 689 (36.3%) | 452 (12.3%) |
| Total | 1,896 (100.0%) | 3,666 (100.0%) |
Real Estate Taxes by Mortgage Status in South Milwaukee
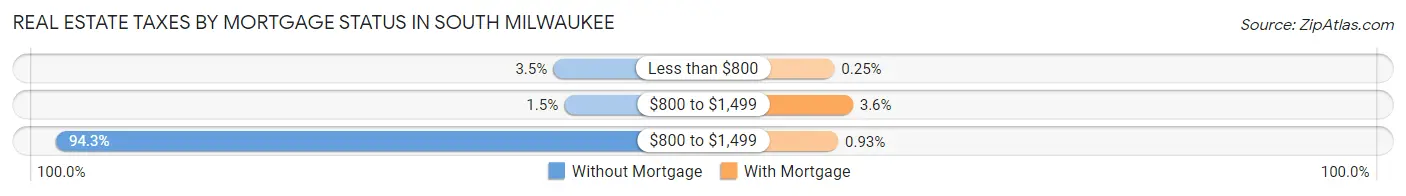
| Property Taxes | Without Mortgage | With Mortgage |
| Less than $800 | 66 (3.5%) | 9 (0.3%) |
| $800 to $1,499 | 28 (1.5%) | 132 (3.6%) |
| $800 to $1,499 | 1,787 (94.3%) | 34 (0.9%) |
| Total | 1,896 (100.0%) | 3,666 (100.0%) |
Health & Disability in South Milwaukee
Health Insurance Coverage by Age in South Milwaukee
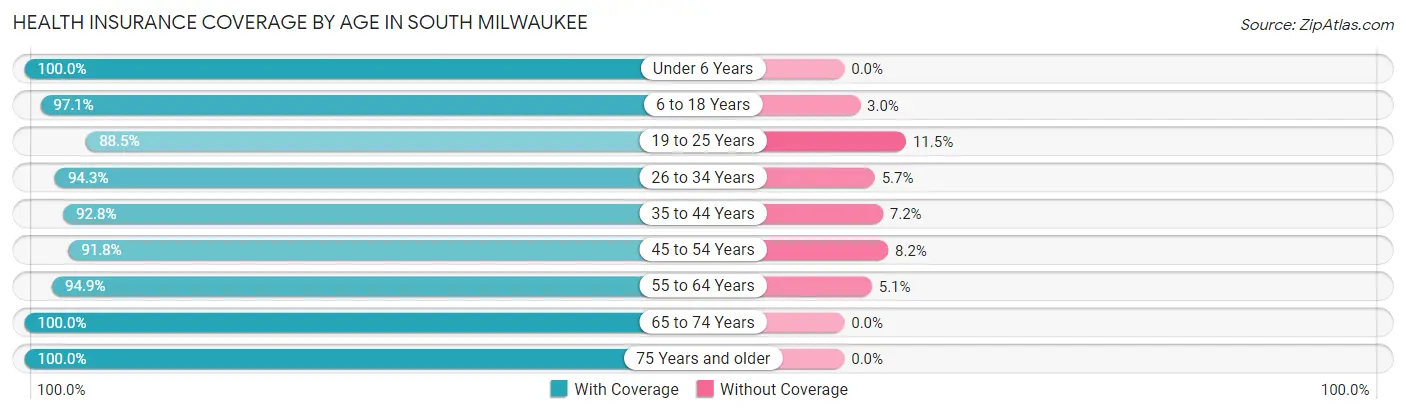
| Age Bracket | With Coverage | Without Coverage |
| Under 6 Years | 1,417 (100.0%) | 0 (0.0%) |
| 6 to 18 Years | 2,994 (97.1%) | 91 (2.9%) |
| 19 to 25 Years | 1,024 (88.5%) | 133 (11.5%) |
| 26 to 34 Years | 2,746 (94.3%) | 165 (5.7%) |
| 35 to 44 Years | 2,168 (92.8%) | 168 (7.2%) |
| 45 to 54 Years | 2,305 (91.8%) | 205 (8.2%) |
| 55 to 64 Years | 3,124 (94.9%) | 169 (5.1%) |
| 65 to 74 Years | 2,223 (100.0%) | 0 (0.0%) |
| 75 Years and older | 1,509 (100.0%) | 0 (0.0%) |
| Total | 19,510 (95.5%) | 931 (4.5%) |
Health Insurance Coverage by Citizenship Status in South Milwaukee
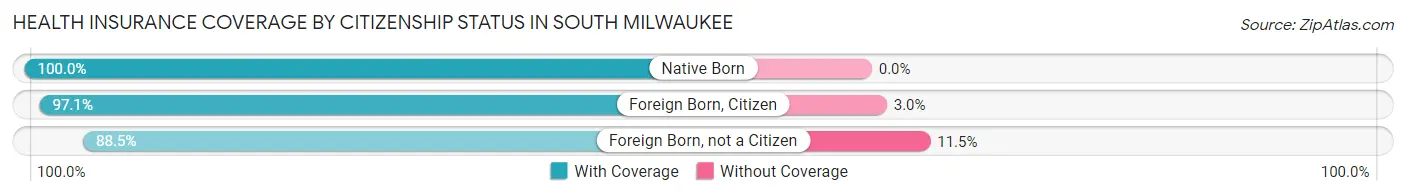
| Citizenship Status | With Coverage | Without Coverage |
| Native Born | 1,417 (100.0%) | 0 (0.0%) |
| Foreign Born, Citizen | 2,994 (97.1%) | 91 (2.9%) |
| Foreign Born, not a Citizen | 1,024 (88.5%) | 133 (11.5%) |
Health Insurance Coverage by Household Income in South Milwaukee
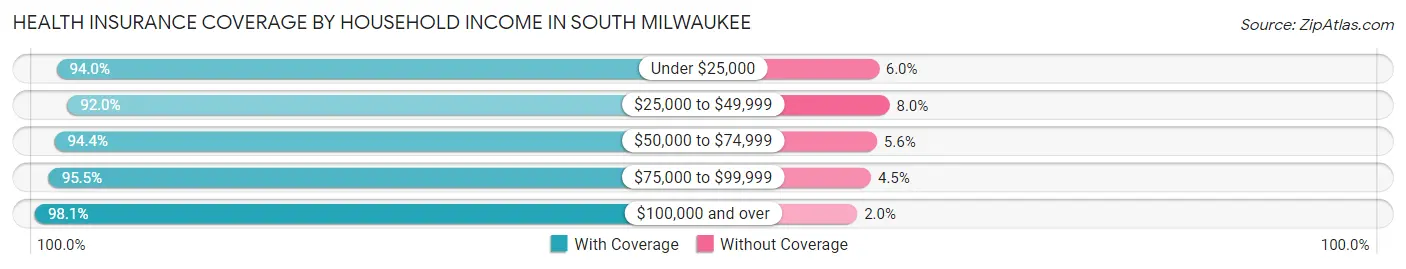
| Household Income | With Coverage | Without Coverage |
| Under $25,000 | 2,431 (94.0%) | 155 (6.0%) |
| $25,000 to $49,999 | 2,435 (92.0%) | 212 (8.0%) |
| $50,000 to $74,999 | 3,561 (94.4%) | 213 (5.6%) |
| $75,000 to $99,999 | 4,313 (95.5%) | 205 (4.5%) |
| $100,000 and over | 6,650 (98.1%) | 132 (1.9%) |
Public vs Private Health Insurance Coverage by Age in South Milwaukee
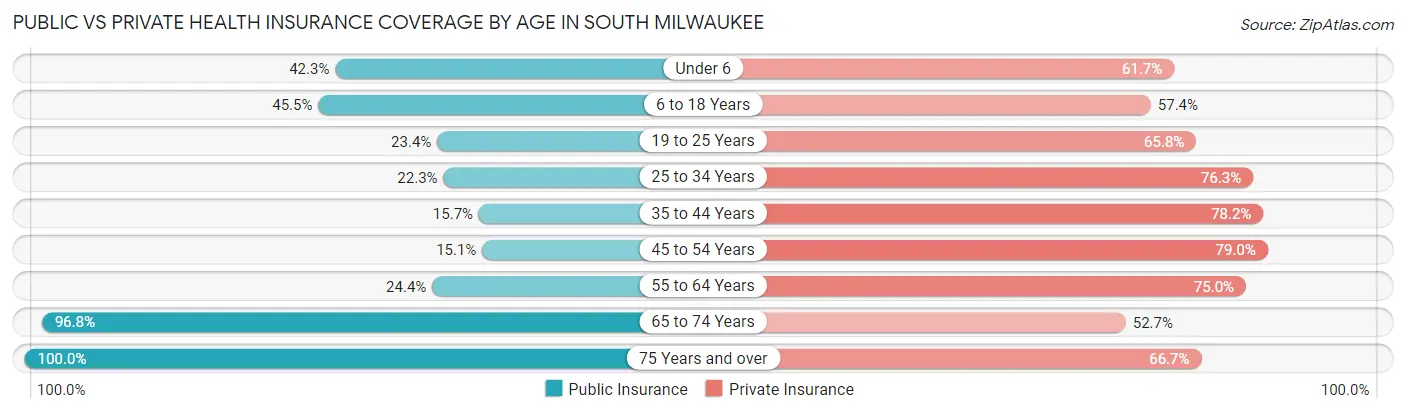
| Age Bracket | Public Insurance | Private Insurance |
| Under 6 | 600 (42.3%) | 874 (61.7%) |
| 6 to 18 Years | 1,403 (45.5%) | 1,770 (57.4%) |
| 19 to 25 Years | 271 (23.4%) | 761 (65.8%) |
| 25 to 34 Years | 648 (22.3%) | 2,222 (76.3%) |
| 35 to 44 Years | 366 (15.7%) | 1,827 (78.2%) |
| 45 to 54 Years | 378 (15.1%) | 1,984 (79.0%) |
| 55 to 64 Years | 802 (24.3%) | 2,470 (75.0%) |
| 65 to 74 Years | 2,152 (96.8%) | 1,172 (52.7%) |
| 75 Years and over | 1,509 (100.0%) | 1,007 (66.7%) |
| Total | 8,129 (39.8%) | 14,087 (68.9%) |
Disability Status by Sex by Age in South Milwaukee
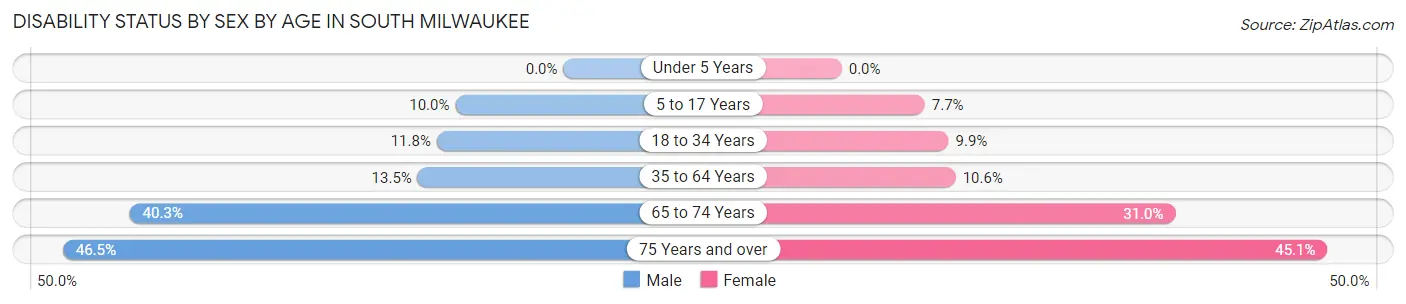
| Age Bracket | Male | Female |
| Under 5 Years | 0 (0.0%) | 0 (0.0%) |
| 5 to 17 Years | 150 (10.0%) | 119 (7.7%) |
| 18 to 34 Years | 254 (11.7%) | 209 (9.9%) |
| 35 to 64 Years | 553 (13.5%) | 428 (10.6%) |
| 65 to 74 Years | 450 (40.3%) | 342 (30.9%) |
| 75 Years and over | 301 (46.5%) | 388 (45.1%) |
Disability Class by Sex by Age in South Milwaukee
Disability Class: Hearing Difficulty
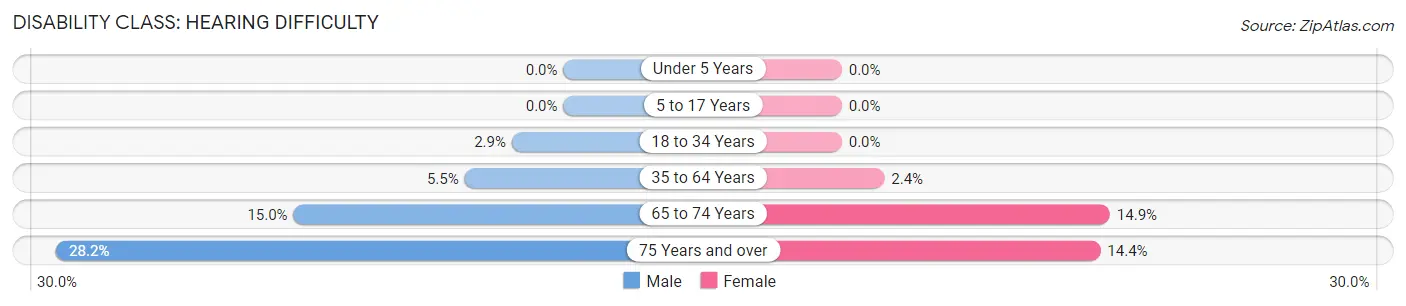
| Age Bracket | Male | Female |
| Under 5 Years | 0 (0.0%) | 0 (0.0%) |
| 5 to 17 Years | 0 (0.0%) | 0 (0.0%) |
| 18 to 34 Years | 62 (2.9%) | 0 (0.0%) |
| 35 to 64 Years | 225 (5.5%) | 96 (2.4%) |
| 65 to 74 Years | 168 (15.0%) | 165 (14.9%) |
| 75 Years and over | 183 (28.2%) | 124 (14.4%) |
Disability Class: Vision Difficulty
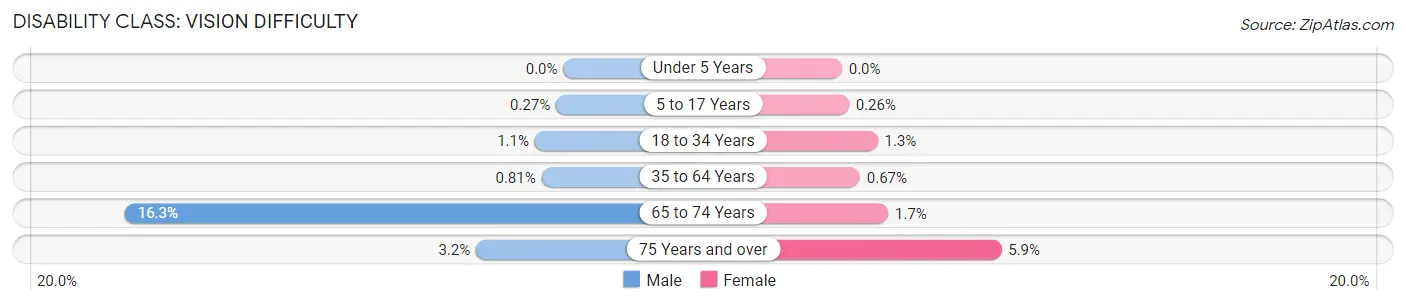
| Age Bracket | Male | Female |
| Under 5 Years | 0 (0.0%) | 0 (0.0%) |
| 5 to 17 Years | 4 (0.3%) | 4 (0.3%) |
| 18 to 34 Years | 23 (1.1%) | 28 (1.3%) |
| 35 to 64 Years | 33 (0.8%) | 27 (0.7%) |
| 65 to 74 Years | 182 (16.3%) | 19 (1.7%) |
| 75 Years and over | 21 (3.2%) | 51 (5.9%) |
Disability Class: Cognitive Difficulty
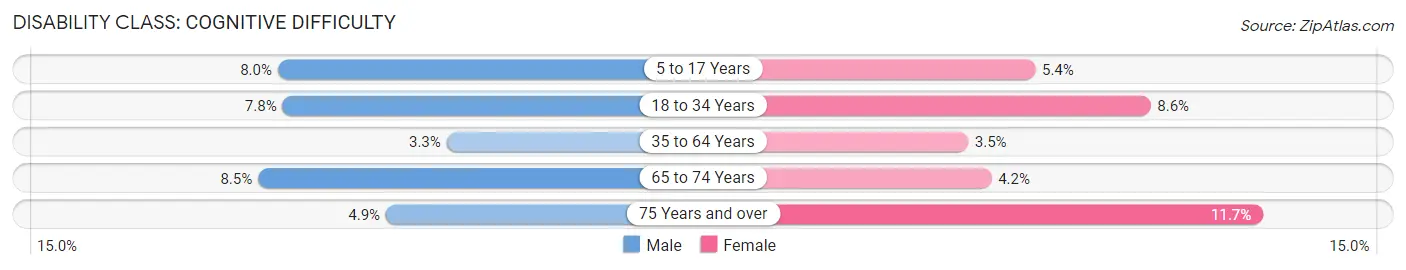
| Age Bracket | Male | Female |
| 5 to 17 Years | 119 (8.0%) | 83 (5.4%) |
| 18 to 34 Years | 169 (7.8%) | 181 (8.6%) |
| 35 to 64 Years | 133 (3.3%) | 142 (3.5%) |
| 65 to 74 Years | 95 (8.5%) | 46 (4.2%) |
| 75 Years and over | 32 (4.9%) | 101 (11.7%) |
Disability Class: Ambulatory Difficulty
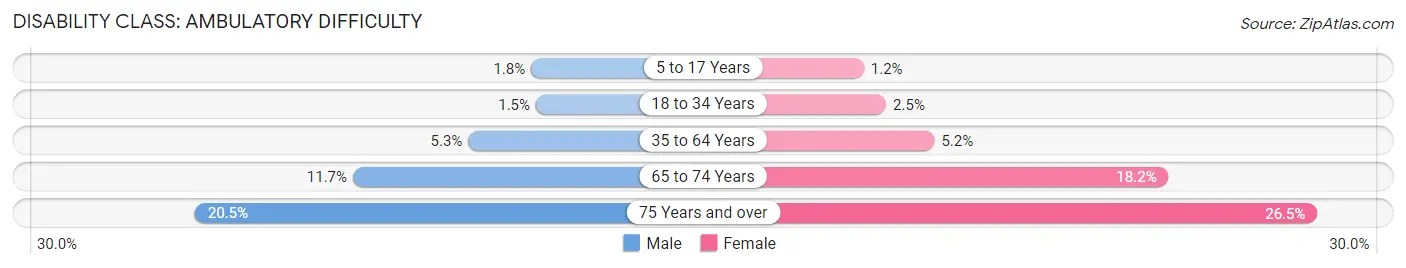
| Age Bracket | Male | Female |
| 5 to 17 Years | 27 (1.8%) | 19 (1.2%) |
| 18 to 34 Years | 33 (1.5%) | 52 (2.5%) |
| 35 to 64 Years | 217 (5.3%) | 209 (5.2%) |
| 65 to 74 Years | 131 (11.7%) | 201 (18.2%) |
| 75 Years and over | 133 (20.5%) | 228 (26.5%) |
Disability Class: Self-Care Difficulty
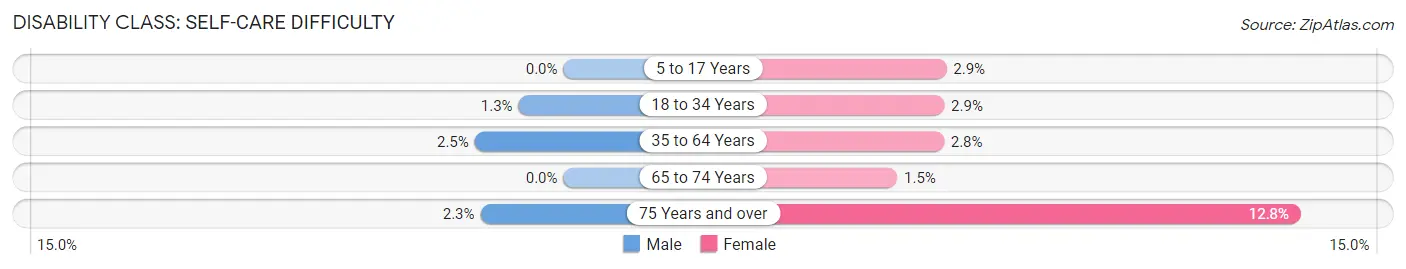
| Age Bracket | Male | Female |
| 5 to 17 Years | 0 (0.0%) | 45 (2.9%) |
| 18 to 34 Years | 27 (1.3%) | 60 (2.9%) |
| 35 to 64 Years | 101 (2.5%) | 115 (2.8%) |
| 65 to 74 Years | 0 (0.0%) | 17 (1.5%) |
| 75 Years and over | 15 (2.3%) | 110 (12.8%) |
Technology Access in South Milwaukee
Computing Device Access in South Milwaukee
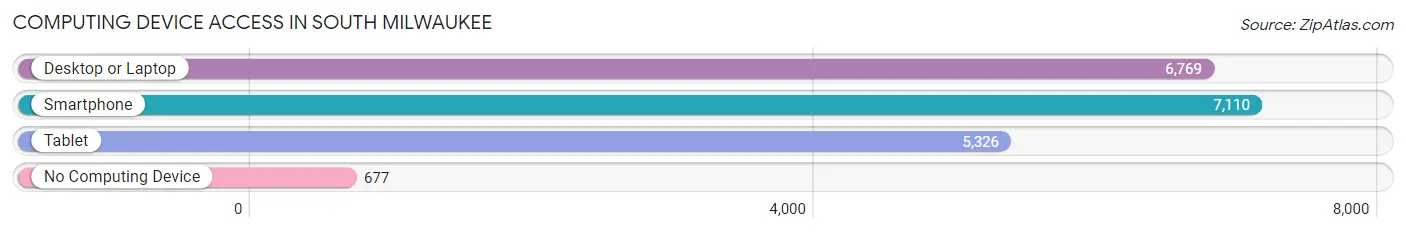
| Device Type | # Households | % Households |
| Desktop or Laptop | 6,769 | 79.2% |
| Smartphone | 7,110 | 83.2% |
| Tablet | 5,326 | 62.3% |
| No Computing Device | 677 | 7.9% |
| Total | 8,543 | 100.0% |
Internet Access in South Milwaukee
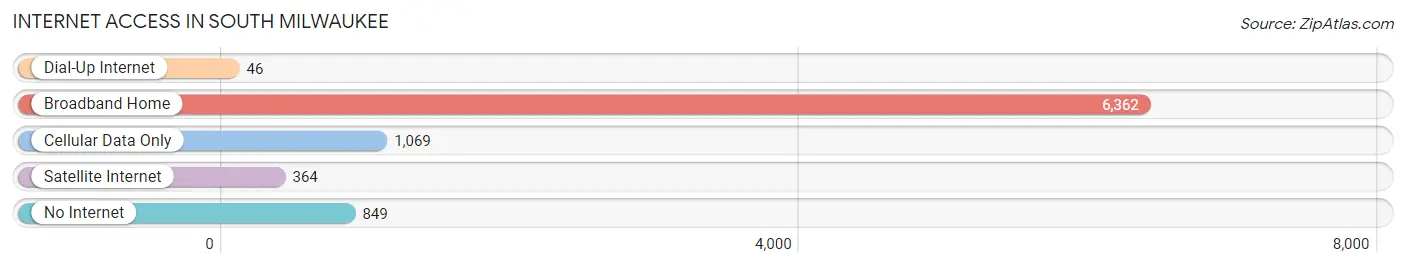
| Internet Type | # Households | % Households |
| Dial-Up Internet | 46 | 0.5% |
| Broadband Home | 6,362 | 74.5% |
| Cellular Data Only | 1,069 | 12.5% |
| Satellite Internet | 364 | 4.3% |
| No Internet | 849 | 9.9% |
| Total | 8,543 | 100.0% |
South Milwaukee Summary
History
South Milwaukee is a city located in Milwaukee County, Wisconsin, United States. It is located on the shores of Lake Michigan, just south of Milwaukee. The city was founded in 1892 and incorporated in 1922.
The area that is now South Milwaukee was originally inhabited by Native Americans, including the Potawatomi and Menominee tribes. The first European settlers arrived in the area in the early 1800s, and the city was officially founded in 1892.
The city was originally known as South Milwaukee Township, and was later renamed South Milwaukee in 1922. The city was a popular destination for immigrants from Europe, particularly Germany and Poland. The city also attracted many African American families from the south, who were looking for better economic opportunities.
The city experienced rapid growth in the early 20th century, and by the 1950s, it had become a major industrial center. The city was home to several large factories, including the South Milwaukee Iron and Steel Company, which was the largest employer in the city.
The city experienced a decline in the late 20th century, as many of the factories closed or moved away. The city has since experienced a resurgence, and is now home to a vibrant arts and culture scene.
Geography
South Milwaukee is located in Milwaukee County, Wisconsin, on the shores of Lake Michigan. The city is located just south of Milwaukee, and is bordered by Oak Creek to the east, Cudahy to the south, and St. Francis to the west.
The city has a total area of 5.3 square miles, of which 5.2 square miles is land and 0.1 square miles is water. The city is located at an elevation of 645 feet above sea level.
The city has a humid continental climate, with cold winters and hot, humid summers. The average annual temperature is 45°F, and the average annual precipitation is 33 inches.
Economy
South Milwaukee is a major industrial center, and is home to several large factories and businesses. The city is home to the South Milwaukee Iron and Steel Company, which is the largest employer in the city. Other major employers include the South Milwaukee Public Schools, the South Milwaukee Police Department, and the South Milwaukee Fire Department.
The city is also home to several small businesses, including restaurants, retail stores, and professional services. The city is also home to several parks and recreational facilities, including Grant Park, South Milwaukee Municipal Golf Course, and South Milwaukee Recreation Center.
Demographics
As of the 2010 census, South Milwaukee had a population of 21,156. The racial makeup of the city was 79.2% White, 8.3% African American, 0.4% Native American, 4.2% Asian, 0.1% Pacific Islander, 4.7% from other races, and 3.1% from two or more races. Hispanic or Latino of any race were 11.2% of the population.
The median income for a household in the city was $45,945, and the median income for a family was $54,945. The per capita income for the city was $22,845. About 8.3% of families and 10.7% of the population were below the poverty line, including 14.2% of those under age 18 and 6.2% of those age 65 or over.
Common Questions
What is Per Capita Income in South Milwaukee?
Per Capita income in South Milwaukee is $35,100.
What is the Median Family Income in South Milwaukee?
Median Family Income in South Milwaukee is $82,903.
What is the Median Household income in South Milwaukee?
Median Household Income in South Milwaukee is $68,801.
What is Income or Wage Gap in South Milwaukee?
Income or Wage Gap in South Milwaukee is 9.6%.
Women in South Milwaukee earn 90.4 cents for every dollar earned by a man.
What is Family Income Deficit in South Milwaukee?
Family Income Deficit in South Milwaukee is $11,216.
Families that are below poverty line in South Milwaukee earn $11,216 less on average than the poverty threshold level.
What is Inequality or Gini Index in South Milwaukee?
Inequality or Gini Index in South Milwaukee is 0.39.
What is the Total Population of South Milwaukee?
Total Population of South Milwaukee is 20,678.
What is the Total Male Population of South Milwaukee?
Total Male Population of South Milwaukee is 10,317.
What is the Total Female Population of South Milwaukee?
Total Female Population of South Milwaukee is 10,361.
What is the Ratio of Males per 100 Females in South Milwaukee?
There are 99.58 Males per 100 Females in South Milwaukee.
What is the Ratio of Females per 100 Males in South Milwaukee?
There are 100.43 Females per 100 Males in South Milwaukee.
What is the Median Population Age in South Milwaukee?
Median Population Age in South Milwaukee is 41.6 Years.
What is the Average Family Size in South Milwaukee
Average Family Size in South Milwaukee is 3.0 People.
What is the Average Household Size in South Milwaukee
Average Household Size in South Milwaukee is 2.4 People.
How Large is the Labor Force in South Milwaukee?
There are 10,837 People in the Labor Forcein in South Milwaukee.
What is the Percentage of People in the Labor Force in South Milwaukee?
64.7% of People are in the Labor Force in South Milwaukee.
What is the Unemployment Rate in South Milwaukee?
Unemployment Rate in South Milwaukee is 3.5%.