South Highpoint, FL Map & Demographics
South Highpoint Map
South Highpoint Overview
$30,283
PER CAPITA INCOME
$66,222
AVG FAMILY INCOME
$51,316
AVG HOUSEHOLD INCOME
25.4%
WAGE / INCOME GAP [ % ]
74.6¢/ $1
WAGE / INCOME GAP [ $ ]
$11,353
FAMILY INCOME DEFICIT
0.54
INEQUALITY / GINI INDEX
5,325
TOTAL POPULATION
2,658
MALE POPULATION
2,667
FEMALE POPULATION
99.66
MALES / 100 FEMALES
100.34
FEMALES / 100 MALES
36.0
MEDIAN AGE
3.6
AVG FAMILY SIZE
2.9
AVG HOUSEHOLD SIZE
2,923
LABOR FORCE [ PEOPLE ]
68.6%
PERCENT IN LABOR FORCE
10.7%
UNEMPLOYMENT RATE
Income in South Highpoint
Income Overview in South Highpoint
Per Capita Income in South Highpoint is $30,283, while median incomes of families and households are $66,222 and $51,316 respectively.
| Characteristic | Number | Measure |
| Per Capita Income | 5,325 | $30,283 |
| Median Family Income | 1,180 | $66,222 |
| Mean Family Income | 1,180 | $75,458 |
| Median Household Income | 1,828 | $51,316 |
| Mean Household Income | 1,828 | $83,028 |
| Income Deficit | 1,180 | $11,353 |
| Wage / Income Gap (%) | 5,325 | 25.39% |
| Wage / Income Gap ($) | 5,325 | 74.61¢ per $1 |
| Gini / Inequality Index | 5,325 | 0.54 |
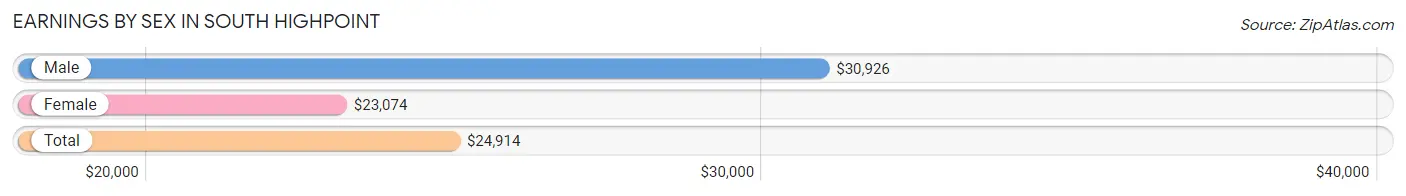
Earnings by Sex in South Highpoint
Average Earnings in South Highpoint are $24,914, $30,926 for men and $23,074 for women, a difference of 25.4%.
| Sex | Number | Average Earnings |
| Male | 1,292 (47.5%) | $30,926 |
| Female | 1,428 (52.5%) | $23,074 |
| Total | 2,720 (100.0%) | $24,914 |
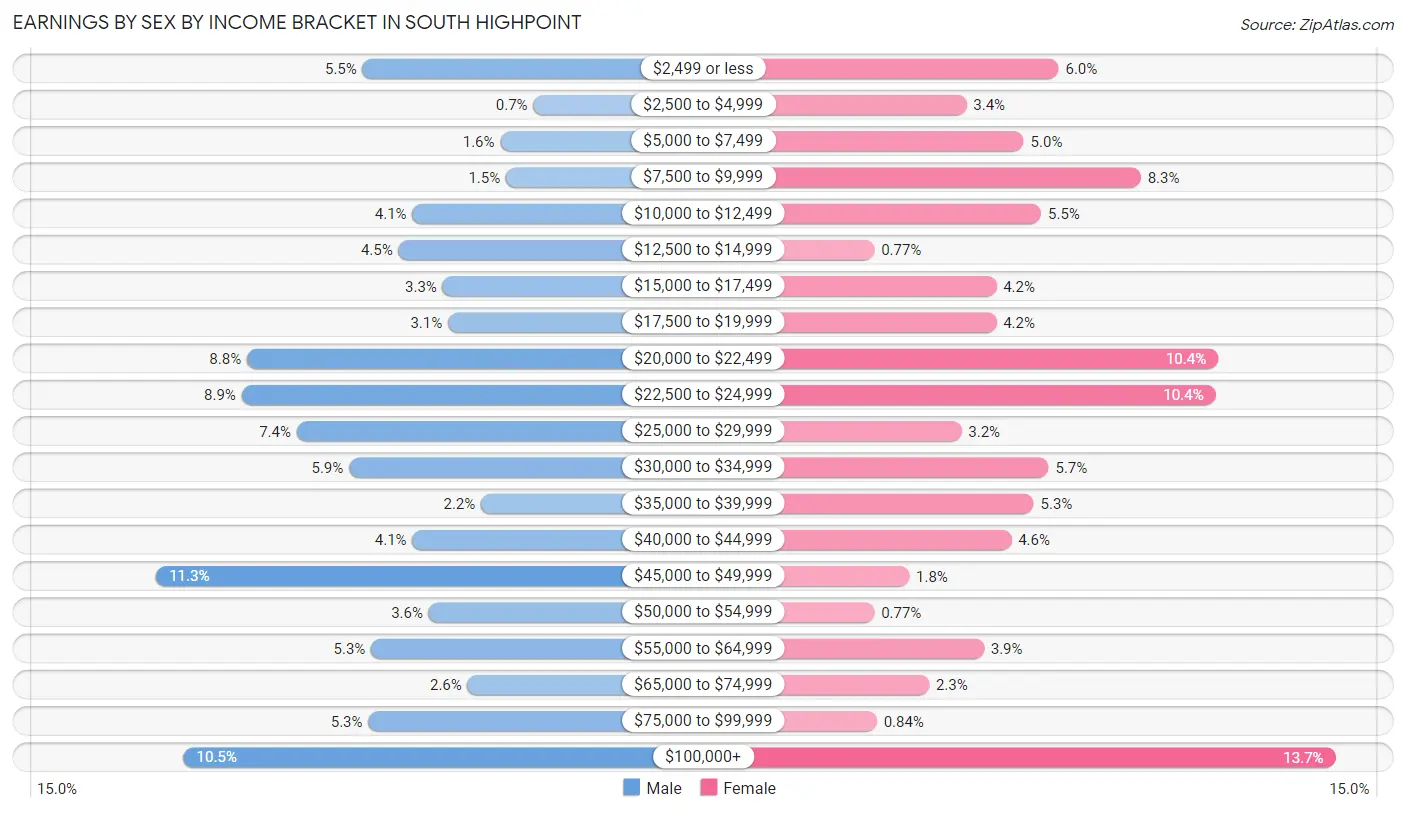
Earnings by Sex by Income Bracket in South Highpoint
The most common earnings brackets in South Highpoint are $45,000 to $49,999 for men (146 | 11.3%) and $100,000+ for women (196 | 13.7%).
| Income | Male | Female |
| $2,499 or less | 71 (5.5%) | 85 (5.9%) |
| $2,500 to $4,999 | 9 (0.7%) | 48 (3.4%) |
| $5,000 to $7,499 | 21 (1.6%) | 71 (5.0%) |
| $7,500 to $9,999 | 19 (1.5%) | 118 (8.3%) |
| $10,000 to $12,499 | 53 (4.1%) | 78 (5.5%) |
| $12,500 to $14,999 | 58 (4.5%) | 11 (0.8%) |
| $15,000 to $17,499 | 42 (3.3%) | 60 (4.2%) |
| $17,500 to $19,999 | 40 (3.1%) | 60 (4.2%) |
| $20,000 to $22,499 | 113 (8.7%) | 149 (10.4%) |
| $22,500 to $24,999 | 115 (8.9%) | 148 (10.4%) |
| $25,000 to $29,999 | 95 (7.3%) | 46 (3.2%) |
| $30,000 to $34,999 | 76 (5.9%) | 81 (5.7%) |
| $35,000 to $39,999 | 28 (2.2%) | 75 (5.2%) |
| $40,000 to $44,999 | 53 (4.1%) | 66 (4.6%) |
| $45,000 to $49,999 | 146 (11.3%) | 25 (1.8%) |
| $50,000 to $54,999 | 47 (3.6%) | 11 (0.8%) |
| $55,000 to $64,999 | 68 (5.3%) | 55 (3.8%) |
| $65,000 to $74,999 | 33 (2.5%) | 33 (2.3%) |
| $75,000 to $99,999 | 69 (5.3%) | 12 (0.8%) |
| $100,000+ | 136 (10.5%) | 196 (13.7%) |
| Total | 1,292 (100.0%) | 1,428 (100.0%) |
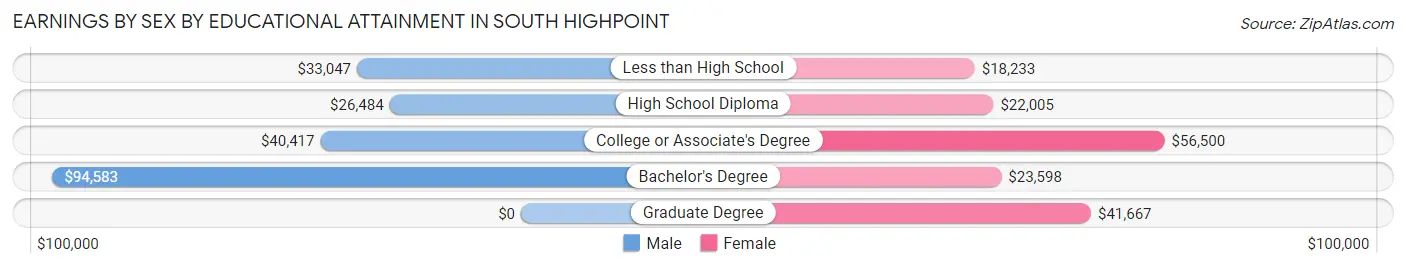
Earnings by Sex by Educational Attainment in South Highpoint
Average earnings in South Highpoint are $38,036 for men and $28,523 for women, a difference of 25.0%. Men with an educational attainment of bachelor's degree enjoy the highest average annual earnings of $94,583, while those with high school diploma education earn the least with $26,484. Women with an educational attainment of college or associate's degree earn the most with the average annual earnings of $56,500, while those with less than high school education have the smallest earnings of $18,233.
| Educational Attainment | Male Income | Female Income |
| Less than High School | $33,047 | $18,233 |
| High School Diploma | $26,484 | $22,005 |
| College or Associate's Degree | $40,417 | $56,500 |
| Bachelor's Degree | $94,583 | $23,598 |
| Graduate Degree | - | - |
| Total | $38,036 | $28,523 |
Family Income in South Highpoint
Family Income Brackets in South Highpoint
According to the South Highpoint family income data, there are 216 families falling into the $75,000 to $99,999 income range, which is the most common income bracket and makes up 18.3% of all families. Conversely, the $200,000+ income bracket is the least frequent group with only 25 families (2.1%) belonging to this category.
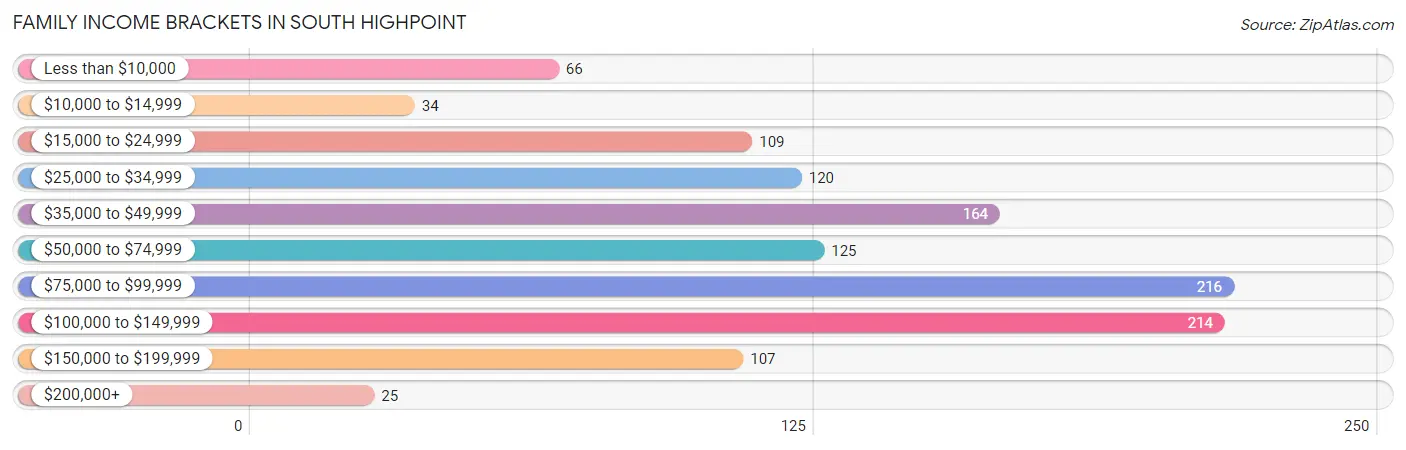
| Income Bracket | # Families | % Families |
| Less than $10,000 | 66 | 5.6% |
| $10,000 to $14,999 | 34 | 2.9% |
| $15,000 to $24,999 | 109 | 9.2% |
| $25,000 to $34,999 | 120 | 10.2% |
| $35,000 to $49,999 | 164 | 13.9% |
| $50,000 to $74,999 | 125 | 10.6% |
| $75,000 to $99,999 | 216 | 18.3% |
| $100,000 to $149,999 | 214 | 18.1% |
| $150,000 to $199,999 | 107 | 9.1% |
| $200,000+ | 25 | 2.1% |
Family Income by Famaliy Size in South Highpoint
6-person families (154 | 13.1%) account for the highest median family income in South Highpoint with $86,456 per family, while 2-person families (548 | 46.4%) have the highest median income of $31,528 per family member.
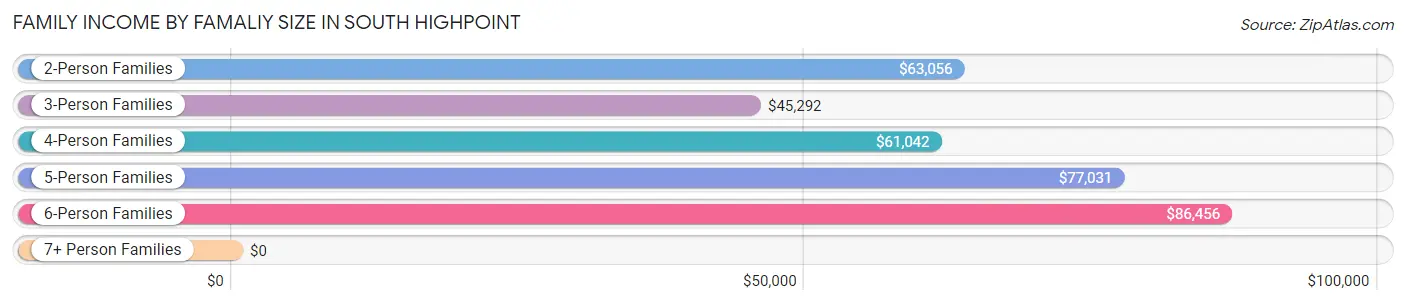
| Income Bracket | # Families | Median Income |
| 2-Person Families | 548 (46.4%) | $63,056 |
| 3-Person Families | 227 (19.2%) | $45,292 |
| 4-Person Families | 143 (12.1%) | $61,042 |
| 5-Person Families | 85 (7.2%) | $77,031 |
| 6-Person Families | 154 (13.1%) | $86,456 |
| 7+ Person Families | 23 (1.9%) | $0 |
| Total | 1,180 (100.0%) | $66,222 |
Family Income by Number of Earners in South Highpoint
The median family income in South Highpoint is $66,222, with families comprising 3+ earners (222) having the highest median family income of $88,092, while families with no earners (135) have the lowest median family income of $20,982, accounting for 18.8% and 11.4% of families, respectively.
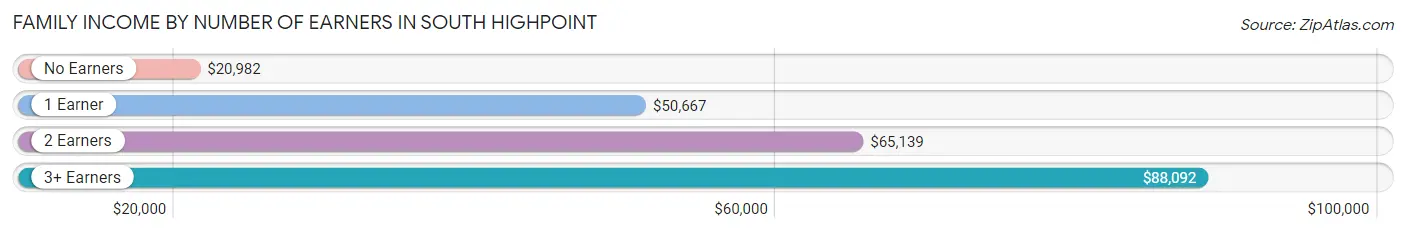
| Number of Earners | # Families | Median Income |
| No Earners | 135 (11.4%) | $20,982 |
| 1 Earner | 508 (43.0%) | $50,667 |
| 2 Earners | 315 (26.7%) | $65,139 |
| 3+ Earners | 222 (18.8%) | $88,092 |
| Total | 1,180 (100.0%) | $66,222 |
Household Income in South Highpoint
Household Income Brackets in South Highpoint
With 254 households falling in the category, the $100,000 to $149,999 income range is the most frequent in South Highpoint, accounting for 13.9% of all households. In contrast, only 97 households (5.3%) fall into the less than $10,000 income bracket, making it the least populous group.
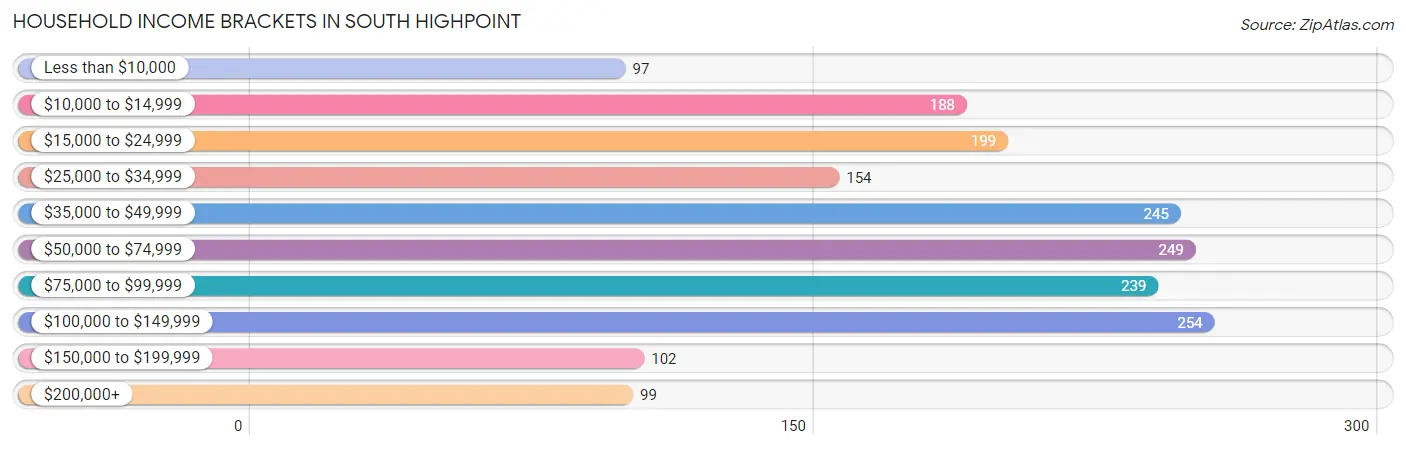
| Income Bracket | # Households | % Households |
| Less than $10,000 | 97 | 5.3% |
| $10,000 to $14,999 | 188 | 10.3% |
| $15,000 to $24,999 | 199 | 10.9% |
| $25,000 to $34,999 | 154 | 8.4% |
| $35,000 to $49,999 | 245 | 13.4% |
| $50,000 to $74,999 | 249 | 13.6% |
| $75,000 to $99,999 | 239 | 13.1% |
| $100,000 to $149,999 | 254 | 13.9% |
| $150,000 to $199,999 | 102 | 5.6% |
| $200,000+ | 99 | 5.4% |
Household Income by Householder Age in South Highpoint
The median household income in South Highpoint is $51,316, with the highest median household income of $62,375 found in the 25 to 44 years age bracket for the primary householder. A total of 581 households (31.8%) fall into this category. Meanwhile, the 45 to 64 years age bracket for the primary householder has the lowest median household income of $0, with 764 households (41.8%) in this group.
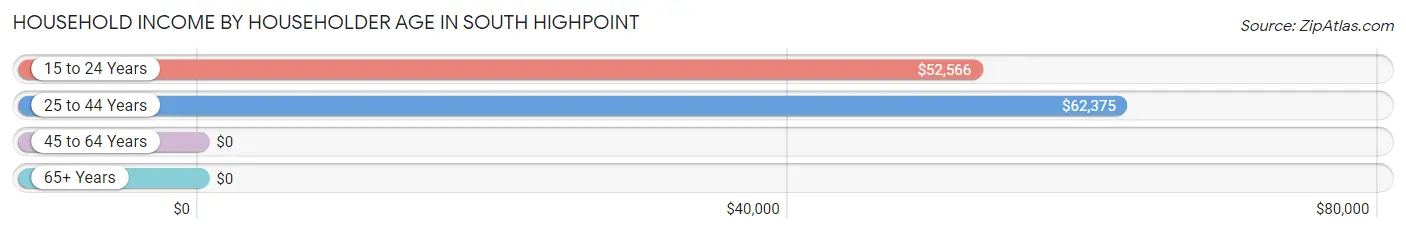
| Income Bracket | # Households | Median Income |
| 15 to 24 Years | 114 (6.2%) | $52,566 |
| 25 to 44 Years | 581 (31.8%) | $62,375 |
| 45 to 64 Years | 764 (41.8%) | $0 |
| 65+ Years | 369 (20.2%) | $0 |
| Total | 1,828 (100.0%) | $51,316 |
Poverty in South Highpoint
Income Below Poverty by Sex and Age in South Highpoint
With 20.1% poverty level for males and 15.4% for females among the residents of South Highpoint, 15 year old males and under 5 year old females are the most vulnerable to poverty, with 42 males (61.8%) and 46 females (47.4%) in their respective age groups living below the poverty level.
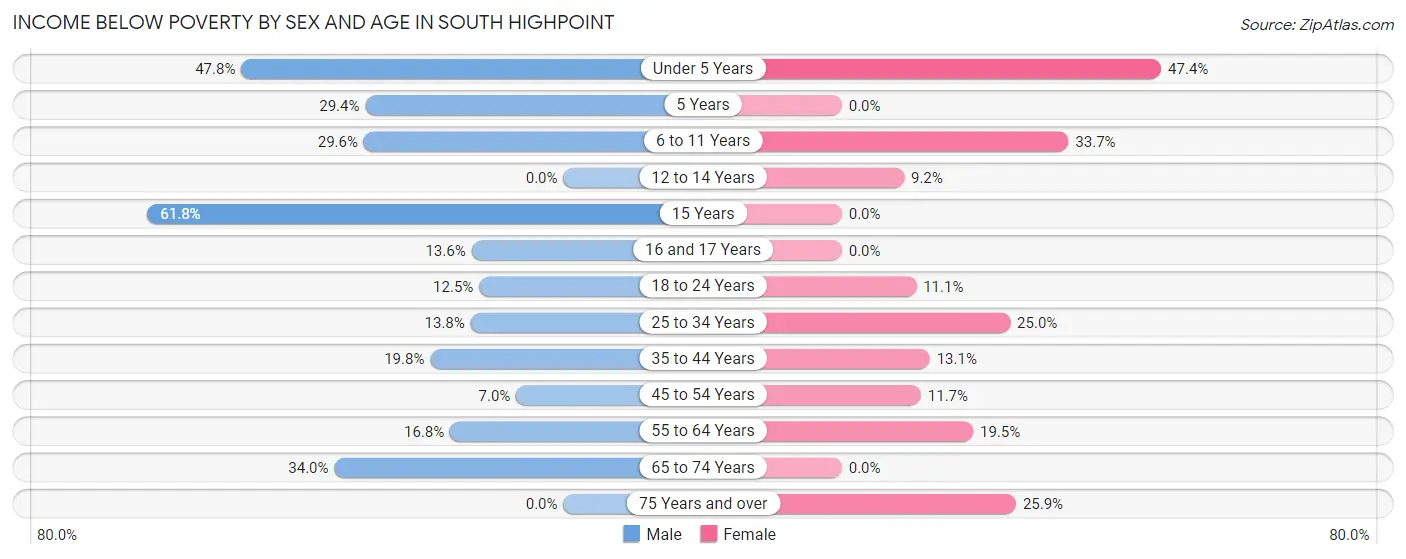
| Age Bracket | Male | Female |
| Under 5 Years | 88 (47.8%) | 46 (47.4%) |
| 5 Years | 10 (29.4%) | 0 (0.0%) |
| 6 to 11 Years | 40 (29.6%) | 71 (33.7%) |
| 12 to 14 Years | 0 (0.0%) | 17 (9.2%) |
| 15 Years | 42 (61.8%) | 0 (0.0%) |
| 16 and 17 Years | 15 (13.6%) | 0 (0.0%) |
| 18 to 24 Years | 32 (12.5%) | 38 (11.1%) |
| 25 to 34 Years | 50 (13.8%) | 83 (25.0%) |
| 35 to 44 Years | 69 (19.8%) | 38 (13.1%) |
| 45 to 54 Years | 34 (7.0%) | 56 (11.7%) |
| 55 to 64 Years | 35 (16.8%) | 46 (19.5%) |
| 65 to 74 Years | 119 (34.0%) | 0 (0.0%) |
| 75 Years and over | 0 (0.0%) | 15 (25.9%) |
| Total | 534 (20.1%) | 410 (15.4%) |
Income Above Poverty by Sex and Age in South Highpoint
According to the poverty statistics in South Highpoint, males aged 12 to 14 years and females aged 5 years are the age groups that are most secure financially, with 100.0% of males and 100.0% of females in these age groups living above the poverty line.
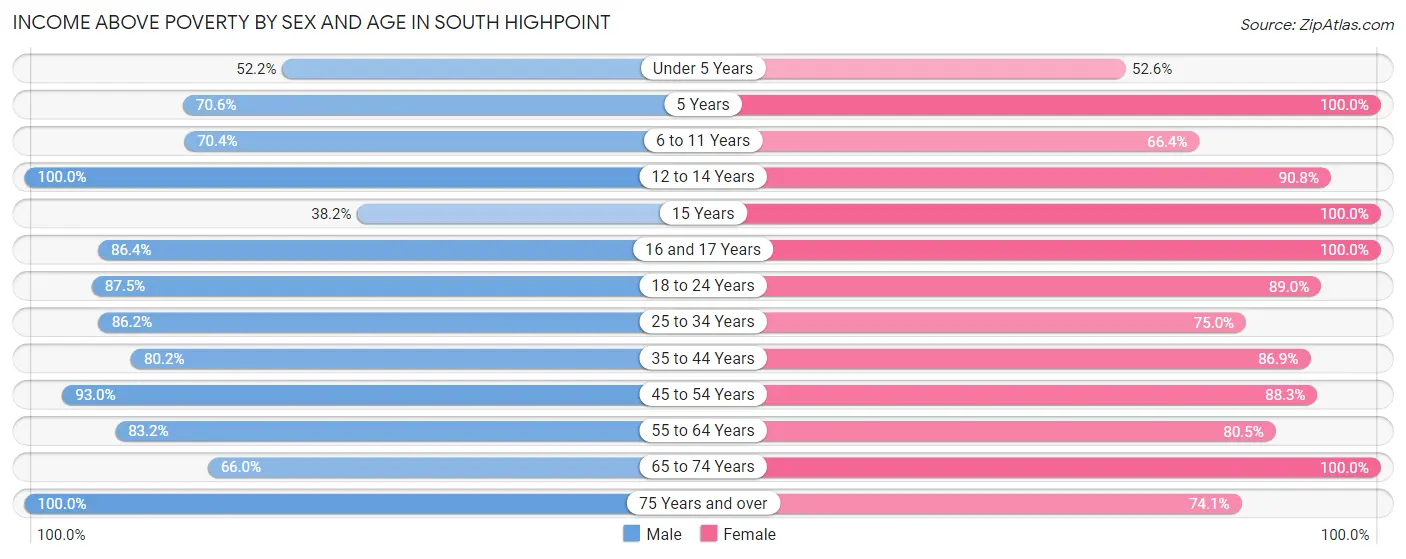
| Age Bracket | Male | Female |
| Under 5 Years | 96 (52.2%) | 51 (52.6%) |
| 5 Years | 24 (70.6%) | 61 (100.0%) |
| 6 to 11 Years | 95 (70.4%) | 140 (66.3%) |
| 12 to 14 Years | 82 (100.0%) | 167 (90.8%) |
| 15 Years | 26 (38.2%) | 8 (100.0%) |
| 16 and 17 Years | 95 (86.4%) | 132 (100.0%) |
| 18 to 24 Years | 224 (87.5%) | 306 (88.9%) |
| 25 to 34 Years | 313 (86.2%) | 249 (75.0%) |
| 35 to 44 Years | 280 (80.2%) | 253 (86.9%) |
| 45 to 54 Years | 452 (93.0%) | 421 (88.3%) |
| 55 to 64 Years | 173 (83.2%) | 190 (80.5%) |
| 65 to 74 Years | 231 (66.0%) | 236 (100.0%) |
| 75 Years and over | 33 (100.0%) | 43 (74.1%) |
| Total | 2,124 (79.9%) | 2,257 (84.6%) |
Income Below Poverty Among Married-Couple Families in South Highpoint
The poverty statistics for married-couple families in South Highpoint show that 7.0% or 52 of the total 739 families live below the poverty line. Families with 1 or 2 children have the highest poverty rate of 13.2%, comprising of 27 families. On the other hand, families with 5 or more children have the lowest poverty rate of 0.0%, which includes 0 families.
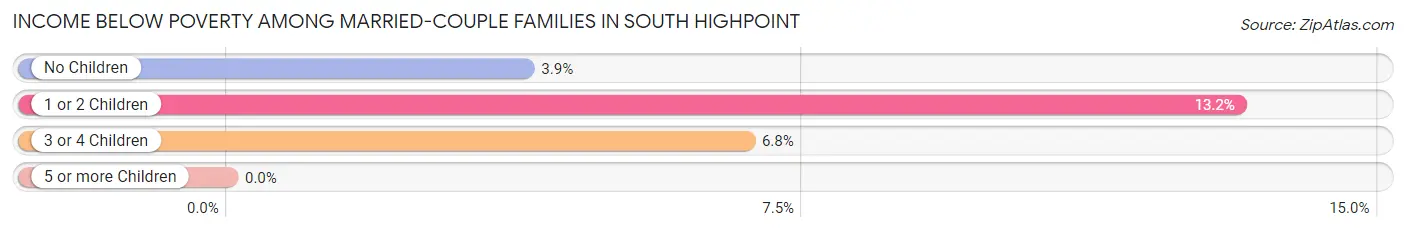
| Children | Above Poverty | Below Poverty |
| No Children | 348 (96.1%) | 14 (3.9%) |
| 1 or 2 Children | 178 (86.8%) | 27 (13.2%) |
| 3 or 4 Children | 152 (93.2%) | 11 (6.8%) |
| 5 or more Children | 9 (100.0%) | 0 (0.0%) |
| Total | 687 (93.0%) | 52 (7.0%) |
Income Below Poverty Among Single-Parent Households in South Highpoint
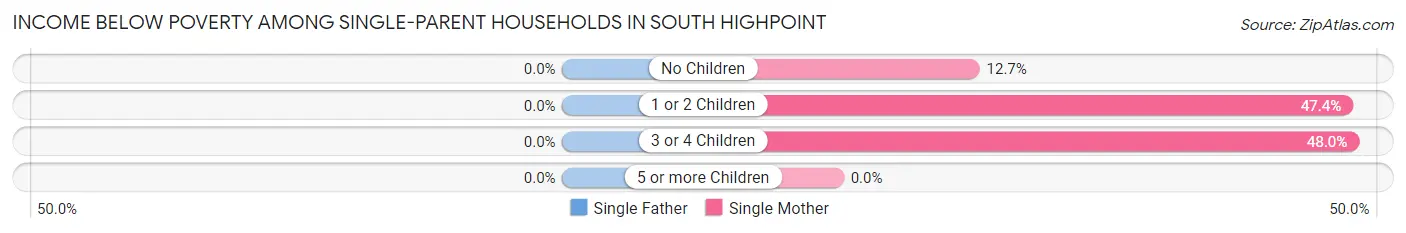
| Children | Single Father | Single Mother |
| No Children | 0 (0.0%) | 20 (12.7%) |
| 1 or 2 Children | 0 (0.0%) | 83 (47.4%) |
| 3 or 4 Children | 0 (0.0%) | 12 (48.0%) |
| 5 or more Children | 0 (0.0%) | 0 (0.0%) |
| Total | 0 (0.0%) | 115 (32.1%) |
Income Below Poverty Among Married-Couple vs Single-Parent Households in South Highpoint
The poverty data for South Highpoint shows that 52 of the married-couple family households (7.0%) and 115 of the single-parent households (26.1%) are living below the poverty level. Within the married-couple family households, those with 1 or 2 children have the highest poverty rate, with 27 households (13.2%) falling below the poverty line. Among the single-parent households, those with 3 or 4 children have the highest poverty rate, with 12 household (48.0%) living below poverty.
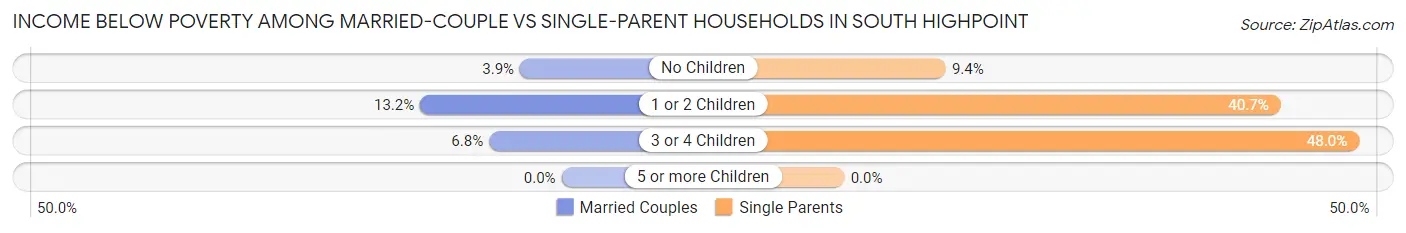
| Children | Married-Couple Families | Single-Parent Households |
| No Children | 14 (3.9%) | 20 (9.4%) |
| 1 or 2 Children | 27 (13.2%) | 83 (40.7%) |
| 3 or 4 Children | 11 (6.8%) | 12 (48.0%) |
| 5 or more Children | 0 (0.0%) | 0 (0.0%) |
| Total | 52 (7.0%) | 115 (26.1%) |
Race in South Highpoint
The most populous races in South Highpoint are White / Caucasian (3,379 | 63.5%), Hispanic or Latino (2,004 | 37.6%), and Black / African American (770 | 14.5%).
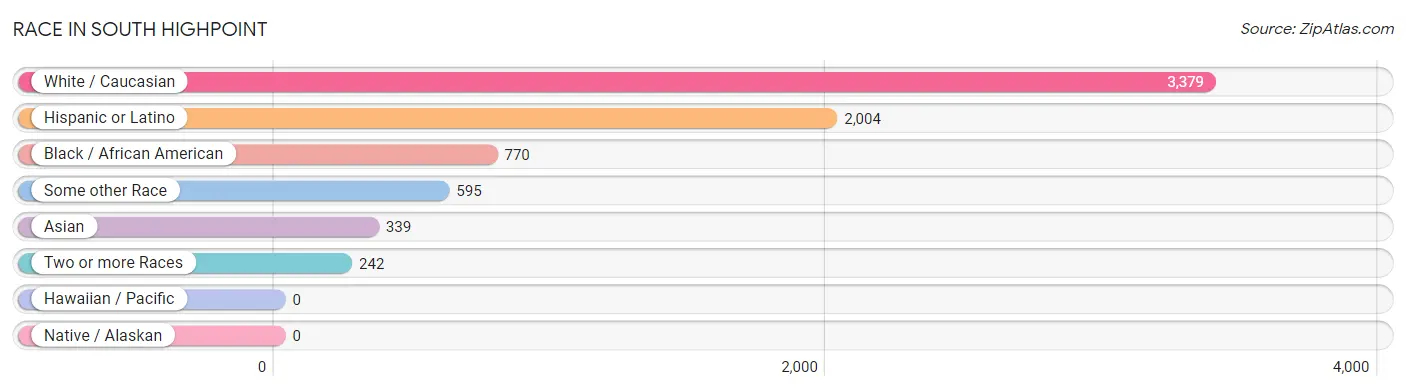
| Race | # Population | % Population |
| Asian | 339 | 6.4% |
| Black / African American | 770 | 14.5% |
| Hawaiian / Pacific | 0 | 0.0% |
| Hispanic or Latino | 2,004 | 37.6% |
| Native / Alaskan | 0 | 0.0% |
| White / Caucasian | 3,379 | 63.5% |
| Two or more Races | 242 | 4.5% |
| Some other Race | 595 | 11.2% |
| Total | 5,325 | 100.0% |
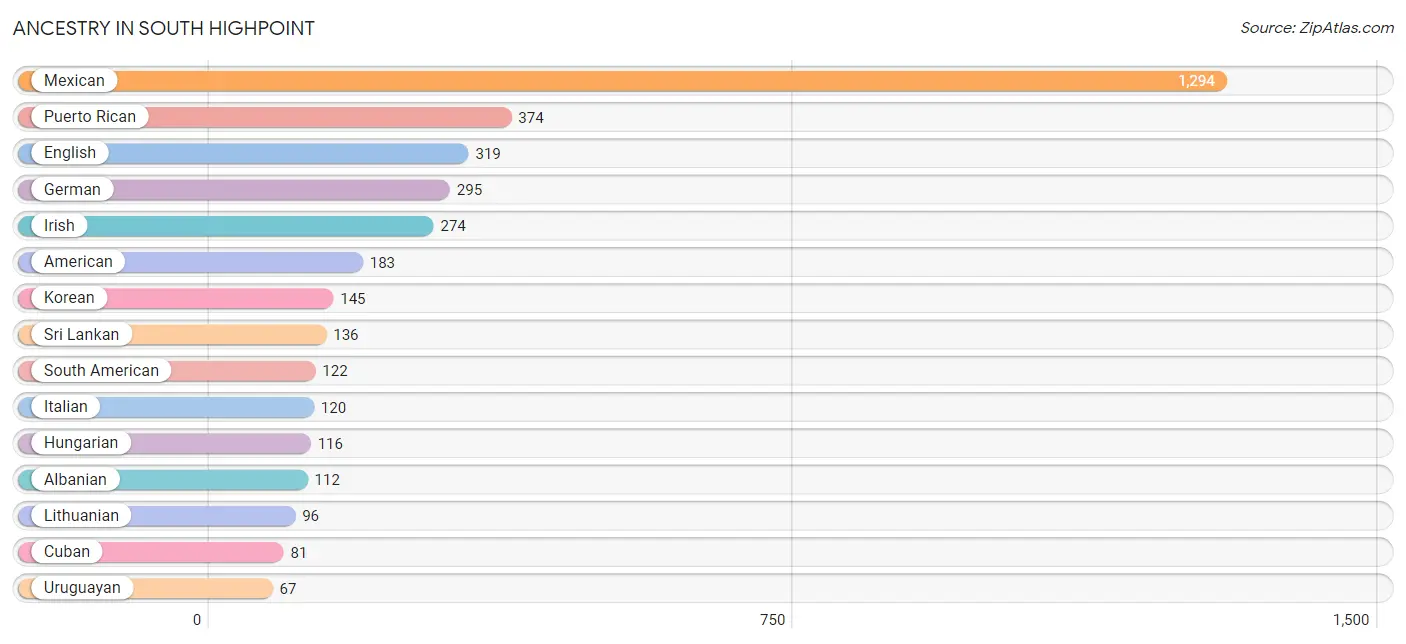
Ancestry in South Highpoint
The most populous ancestries reported in South Highpoint are Mexican (1,294 | 24.3%), Puerto Rican (374 | 7.0%), English (319 | 6.0%), German (295 | 5.5%), and Irish (274 | 5.1%), together accounting for 48.0% of all South Highpoint residents.
| Ancestry | # Population | % Population |
| African | 37 | 0.7% |
| Albanian | 112 | 2.1% |
| American | 183 | 3.4% |
| Bangladeshi | 30 | 0.6% |
| British | 54 | 1.0% |
| Burmese | 4 | 0.1% |
| Canadian | 23 | 0.4% |
| Central American | 66 | 1.2% |
| Central American Indian | 38 | 0.7% |
| Costa Rican | 21 | 0.4% |
| Cuban | 81 | 1.5% |
| Dutch | 41 | 0.8% |
| Eastern European | 5 | 0.1% |
| English | 319 | 6.0% |
| European | 17 | 0.3% |
| French | 33 | 0.6% |
| German | 295 | 5.5% |
| Ghanaian | 21 | 0.4% |
| Greek | 4 | 0.1% |
| Haitian | 13 | 0.2% |
| Hungarian | 116 | 2.2% |
| Indian (Asian) | 4 | 0.1% |
| Irish | 274 | 5.1% |
| Italian | 120 | 2.2% |
| Korean | 145 | 2.7% |
| Lithuanian | 96 | 1.8% |
| Malaysian | 17 | 0.3% |
| Mexican | 1,294 | 24.3% |
| Norwegian | 11 | 0.2% |
| Peruvian | 55 | 1.0% |
| Polish | 64 | 1.2% |
| Puerto Rican | 374 | 7.0% |
| Romanian | 5 | 0.1% |
| Salvadoran | 45 | 0.9% |
| Scotch-Irish | 23 | 0.4% |
| Scottish | 3 | 0.1% |
| South American | 122 | 2.3% |
| Sri Lankan | 136 | 2.5% |
| Subsaharan African | 58 | 1.1% |
| Thai | 39 | 0.7% |
| Uruguayan | 67 | 1.3% |
| Welsh | 31 | 0.6% |
| West Indian | 38 | 0.7% | View All 43 Rows |
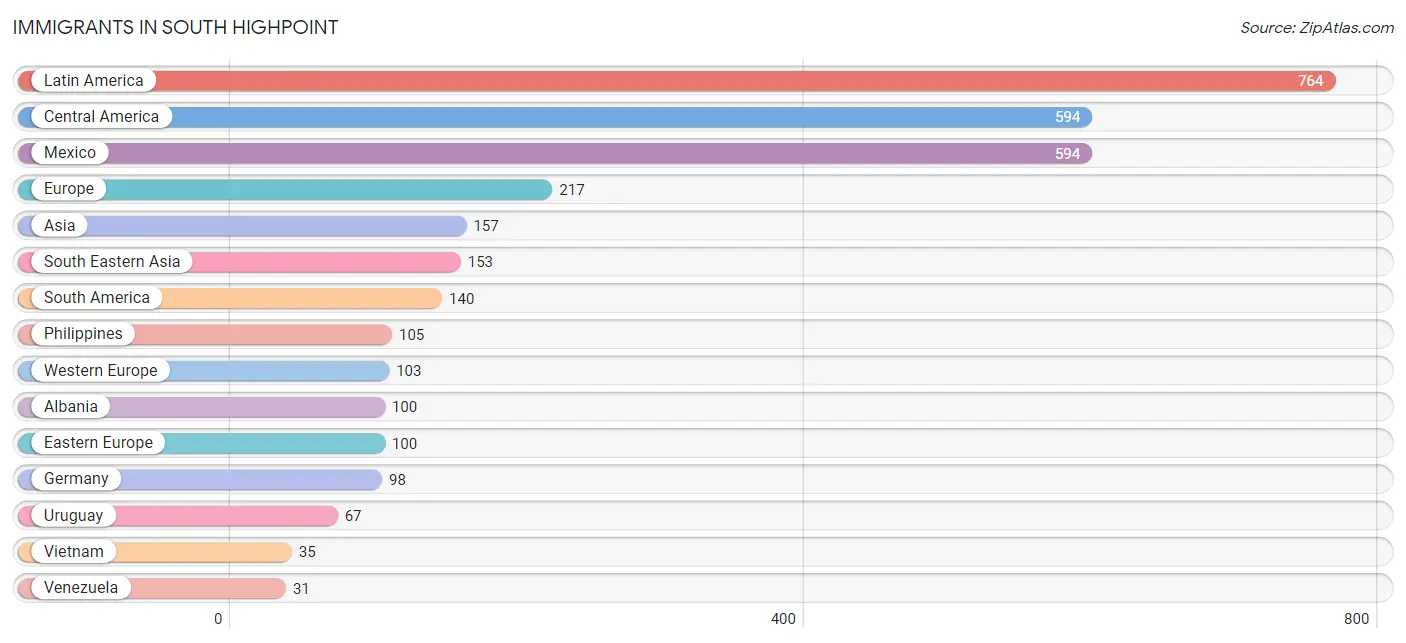
Immigrants in South Highpoint
The most numerous immigrant groups reported in South Highpoint came from Latin America (764 | 14.3%), Central America (594 | 11.2%), Mexico (594 | 11.2%), Europe (217 | 4.1%), and Asia (157 | 2.9%), together accounting for 43.7% of all South Highpoint residents.
| Immigration Origin | # Population | % Population |
| Africa | 21 | 0.4% |
| Albania | 100 | 1.9% |
| Asia | 157 | 2.9% |
| Bahamas | 18 | 0.3% |
| Canada | 14 | 0.3% |
| Caribbean | 30 | 0.6% |
| Central America | 594 | 11.2% |
| China | 4 | 0.1% |
| Colombia | 21 | 0.4% |
| Cuba | 7 | 0.1% |
| Eastern Asia | 4 | 0.1% |
| Eastern Europe | 100 | 1.9% |
| Ecuador | 5 | 0.1% |
| England | 5 | 0.1% |
| Europe | 217 | 4.1% |
| France | 5 | 0.1% |
| Germany | 98 | 1.8% |
| Ghana | 21 | 0.4% |
| Guyana | 16 | 0.3% |
| Haiti | 5 | 0.1% |
| Laos | 13 | 0.2% |
| Latin America | 764 | 14.3% |
| Mexico | 594 | 11.2% |
| Northern Europe | 14 | 0.3% |
| Philippines | 105 | 2.0% |
| South America | 140 | 2.6% |
| South Eastern Asia | 153 | 2.9% |
| Taiwan | 4 | 0.1% |
| Uruguay | 67 | 1.3% |
| Venezuela | 31 | 0.6% |
| Vietnam | 35 | 0.7% |
| Western Africa | 21 | 0.4% |
| Western Europe | 103 | 1.9% | View All 33 Rows |
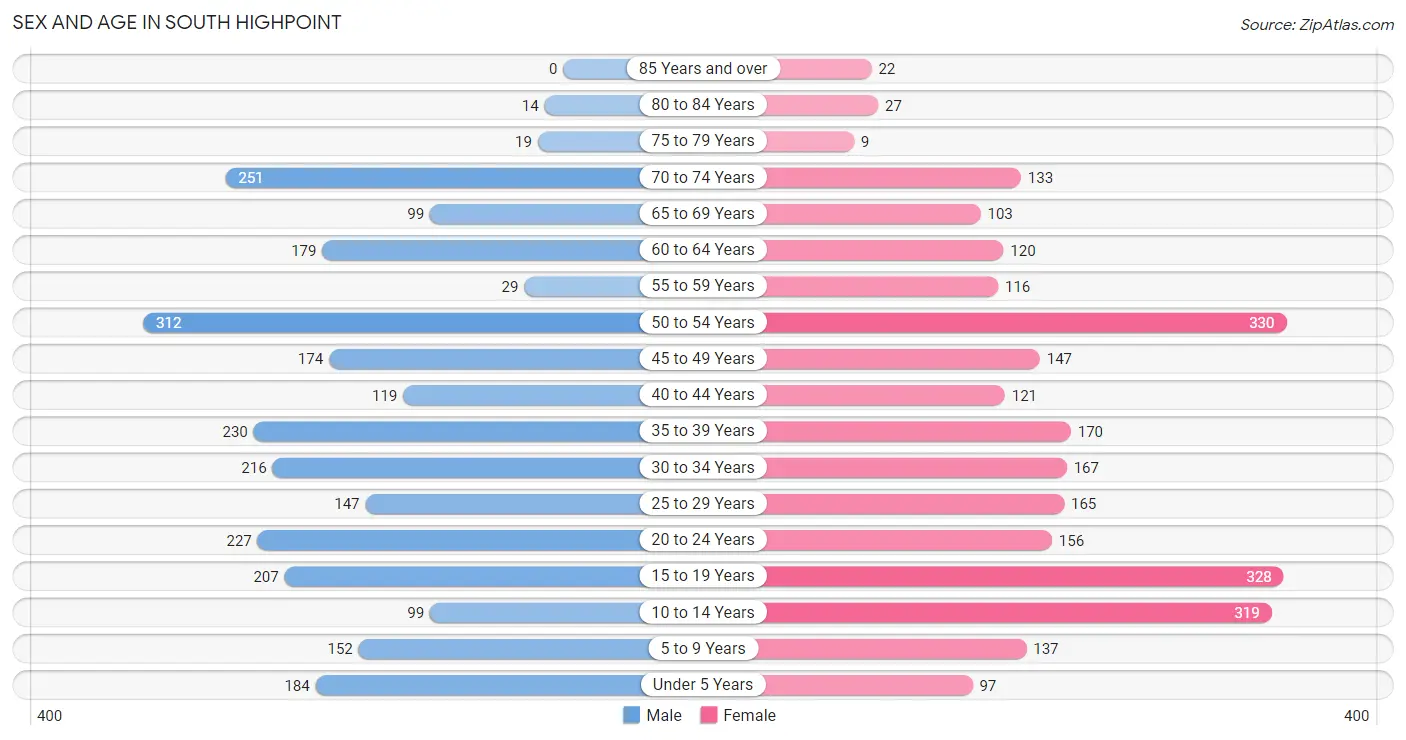
Sex and Age in South Highpoint
Sex and Age in South Highpoint
The most populous age groups in South Highpoint are 50 to 54 Years (312 | 11.7%) for men and 50 to 54 Years (330 | 12.4%) for women.
| Age Bracket | Male | Female |
| Under 5 Years | 184 (6.9%) | 97 (3.6%) |
| 5 to 9 Years | 152 (5.7%) | 137 (5.1%) |
| 10 to 14 Years | 99 (3.7%) | 319 (12.0%) |
| 15 to 19 Years | 207 (7.8%) | 328 (12.3%) |
| 20 to 24 Years | 227 (8.5%) | 156 (5.9%) |
| 25 to 29 Years | 147 (5.5%) | 165 (6.2%) |
| 30 to 34 Years | 216 (8.1%) | 167 (6.3%) |
| 35 to 39 Years | 230 (8.6%) | 170 (6.4%) |
| 40 to 44 Years | 119 (4.5%) | 121 (4.5%) |
| 45 to 49 Years | 174 (6.6%) | 147 (5.5%) |
| 50 to 54 Years | 312 (11.7%) | 330 (12.4%) |
| 55 to 59 Years | 29 (1.1%) | 116 (4.3%) |
| 60 to 64 Years | 179 (6.7%) | 120 (4.5%) |
| 65 to 69 Years | 99 (3.7%) | 103 (3.9%) |
| 70 to 74 Years | 251 (9.4%) | 133 (5.0%) |
| 75 to 79 Years | 19 (0.7%) | 9 (0.3%) |
| 80 to 84 Years | 14 (0.5%) | 27 (1.0%) |
| 85 Years and over | 0 (0.0%) | 22 (0.8%) |
| Total | 2,658 (100.0%) | 2,667 (100.0%) |
Families and Households in South Highpoint
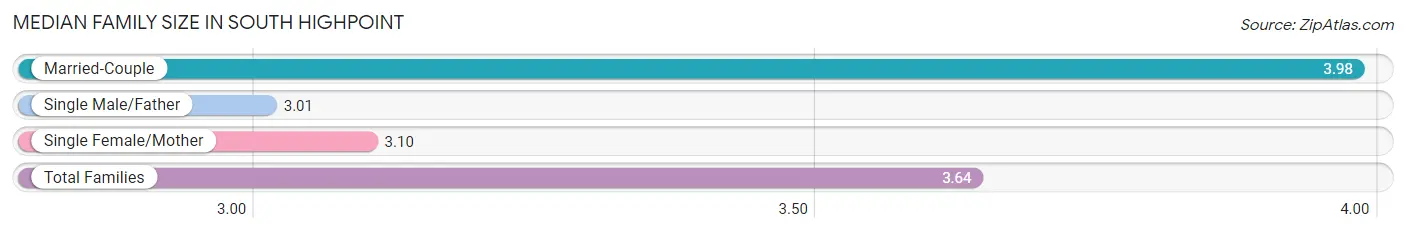
Median Family Size in South Highpoint
The median family size in South Highpoint is 3.64 persons per family, with married-couple families (739 | 62.6%) accounting for the largest median family size of 3.98 persons per family. On the other hand, single male/father families (83 | 7.0%) represent the smallest median family size with 3.01 persons per family.
| Family Type | # Families | Family Size |
| Married-Couple | 739 (62.6%) | 3.98 |
| Single Male/Father | 83 (7.0%) | 3.01 |
| Single Female/Mother | 358 (30.3%) | 3.10 |
| Total Families | 1,180 (100.0%) | 3.64 |
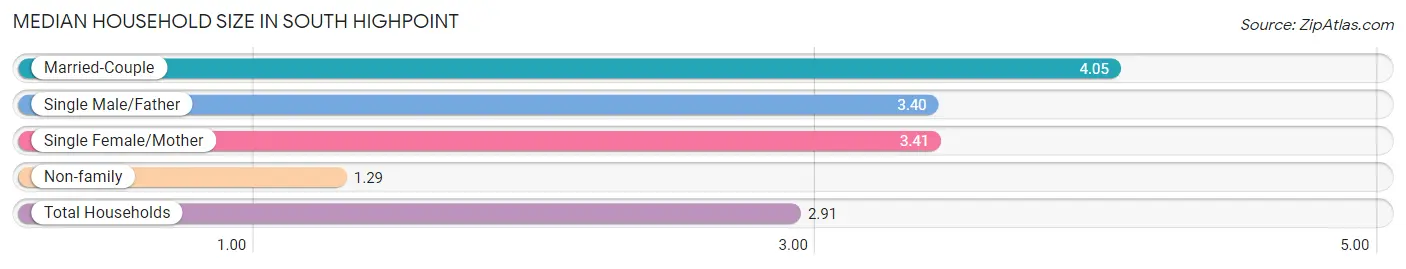
Median Household Size in South Highpoint
The median household size in South Highpoint is 2.91 persons per household, with married-couple households (739 | 40.4%) accounting for the largest median household size of 4.05 persons per household. non-family households (648 | 35.4%) represent the smallest median household size with 1.29 persons per household.
| Household Type | # Households | Household Size |
| Married-Couple | 739 (40.4%) | 4.05 |
| Single Male/Father | 83 (4.5%) | 3.40 |
| Single Female/Mother | 358 (19.6%) | 3.41 |
| Non-family | 648 (35.4%) | 1.29 |
| Total Households | 1,828 (100.0%) | 2.91 |
Household Size by Marriage Status in South Highpoint
Out of a total of 1,828 households in South Highpoint, 1,180 (64.5%) are family households, while 648 (35.4%) are nonfamily households. The most numerous type of family households are 2-person households, comprising 474, and the most common type of nonfamily households are 1-person households, comprising 520.
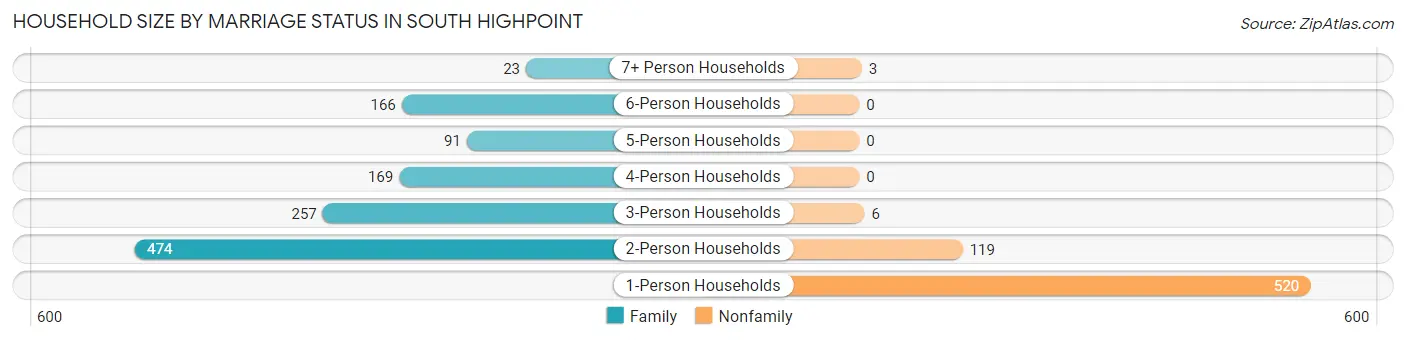
| Household Size | Family Households | Nonfamily Households |
| 1-Person Households | - | 520 (28.4%) |
| 2-Person Households | 474 (25.9%) | 119 (6.5%) |
| 3-Person Households | 257 (14.1%) | 6 (0.3%) |
| 4-Person Households | 169 (9.2%) | 0 (0.0%) |
| 5-Person Households | 91 (5.0%) | 0 (0.0%) |
| 6-Person Households | 166 (9.1%) | 0 (0.0%) |
| 7+ Person Households | 23 (1.3%) | 3 (0.2%) |
| Total | 1,180 (64.5%) | 648 (35.4%) |
Female Fertility in South Highpoint
Fertility by Age in South Highpoint
Average fertility rate in South Highpoint is 43.0 births per 1,000 women. Women in the age bracket of 20 to 34 years have the highest fertility rate with 92.0 births per 1,000 women. Women in the age bracket of 20 to 34 years acount for 80.4% of all women with births.
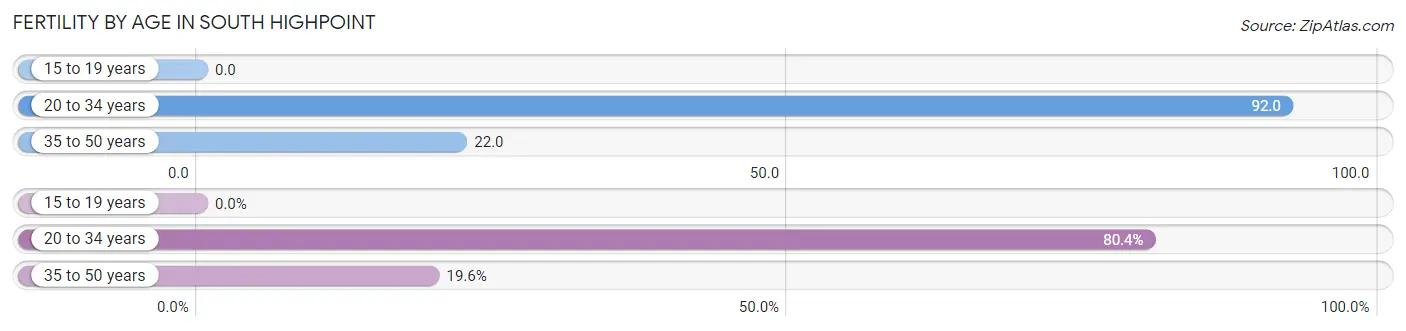
| Age Bracket | Women with Births | Births / 1,000 Women |
| 15 to 19 years | 0 (0.0%) | 0.0 |
| 20 to 34 years | 45 (80.4%) | 92.0 |
| 35 to 50 years | 11 (19.6%) | 22.0 |
| Total | 56 (100.0%) | 43.0 |
Fertility by Age by Marriage Status in South Highpoint
41.1% of women with births (56) in South Highpoint are married. The highest percentage of unmarried women with births falls into 20 to 34 years age bracket with 73.3% of them unmarried at the time of birth, while the lowest percentage of unmarried women with births belong to 35 to 50 years age bracket with 0.0% of them unmarried.
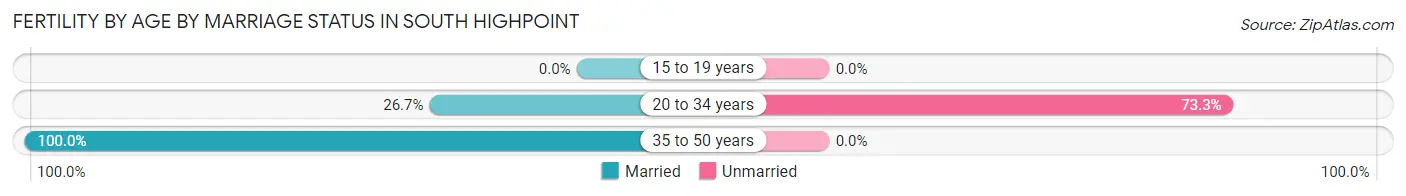
| Age Bracket | Married | Unmarried |
| 15 to 19 years | 0 (0.0%) | 0 (0.0%) |
| 20 to 34 years | 12 (26.7%) | 33 (73.3%) |
| 35 to 50 years | 11 (100.0%) | 0 (0.0%) |
| Total | 23 (41.1%) | 33 (58.9%) |
Fertility by Education in South Highpoint
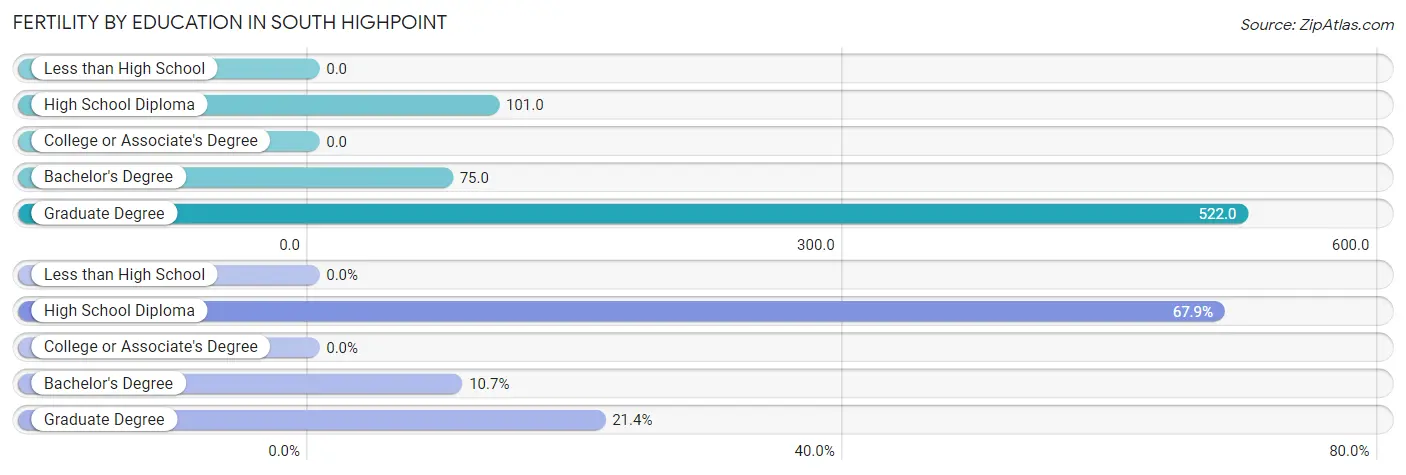
| Educational Attainment | Women with Births | Births / 1,000 Women |
| Less than High School | 0 (0.0%) | 0.0 |
| High School Diploma | 38 (67.9%) | 101.0 |
| College or Associate's Degree | 0 (0.0%) | 0.0 |
| Bachelor's Degree | 6 (10.7%) | 75.0 |
| Graduate Degree | 12 (21.4%) | 522.0 |
| Total | 56 (100.0%) | 43.0 |
Fertility by Education by Marriage Status in South Highpoint
58.9% of women with births in South Highpoint are unmarried. Women with the educational attainment of bachelor's degree are most likely to be married with 100.0% of them married at childbirth, while women with the educational attainment of high school diploma are least likely to be married with 86.8% of them unmarried at childbirth.
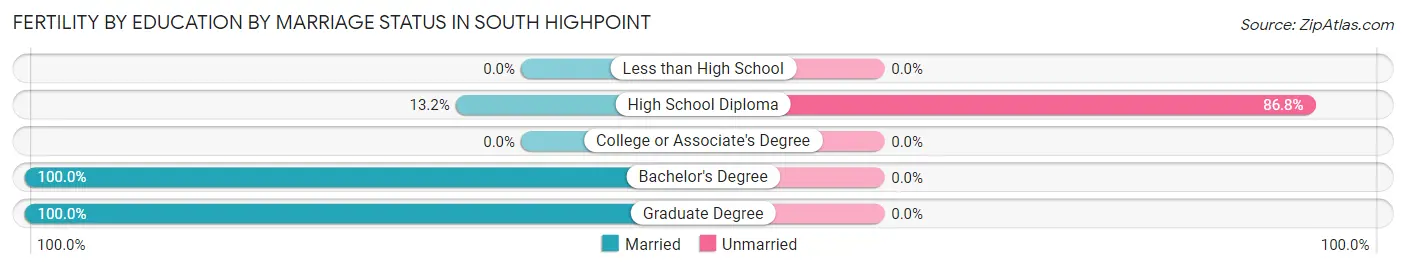
| Educational Attainment | Married | Unmarried |
| Less than High School | 0 (0.0%) | 0 (0.0%) |
| High School Diploma | 5 (13.2%) | 33 (86.8%) |
| College or Associate's Degree | 0 (0.0%) | 0 (0.0%) |
| Bachelor's Degree | 6 (100.0%) | 0 (0.0%) |
| Graduate Degree | 12 (100.0%) | 0 (0.0%) |
| Total | 23 (41.1%) | 33 (58.9%) |
Employment Characteristics in South Highpoint
Employment by Class of Employer in South Highpoint
Among the 2,594 employed individuals in South Highpoint, private company employees (2,010 | 77.5%), self-employed (not incorporated) (181 | 7.0%), and not-for-profit organizations (120 | 4.6%) make up the most common classes of employment.
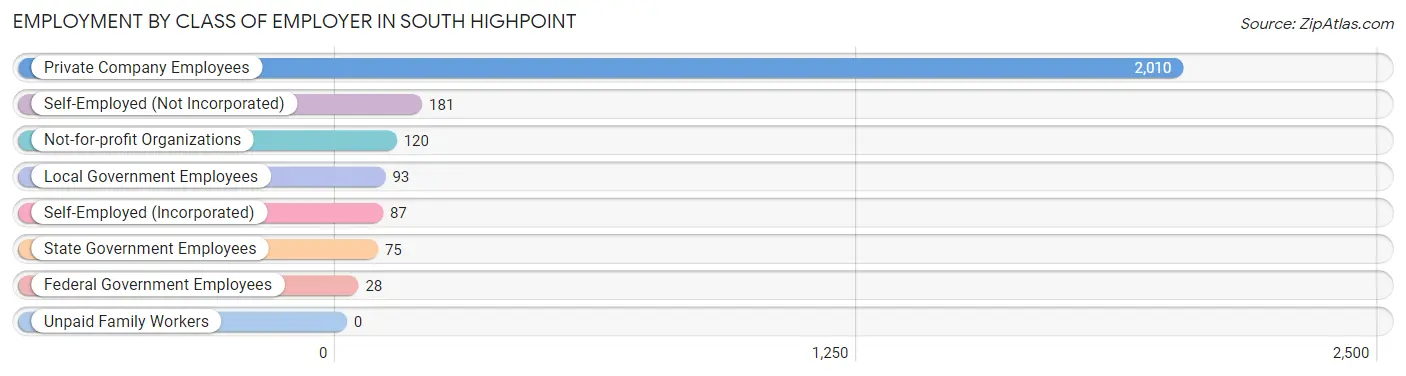
| Employer Class | # Employees | % Employees |
| Private Company Employees | 2,010 | 77.5% |
| Self-Employed (Incorporated) | 87 | 3.4% |
| Self-Employed (Not Incorporated) | 181 | 7.0% |
| Not-for-profit Organizations | 120 | 4.6% |
| Local Government Employees | 93 | 3.6% |
| State Government Employees | 75 | 2.9% |
| Federal Government Employees | 28 | 1.1% |
| Unpaid Family Workers | 0 | 0.0% |
| Total | 2,594 | 100.0% |
Employment Status by Age in South Highpoint
According to the labor force statistics for South Highpoint, out of the total population over 16 years of age (4,261), 68.6% or 2,923 individuals are in the labor force, with 10.7% or 313 of them unemployed. The age group with the highest labor force participation rate is 20 to 24 years, with 89.6% or 343 individuals in the labor force. Within the labor force, the 65 to 74 years age range has the highest percentage of unemployed individuals, with 39.0% or 98 of them being unemployed.
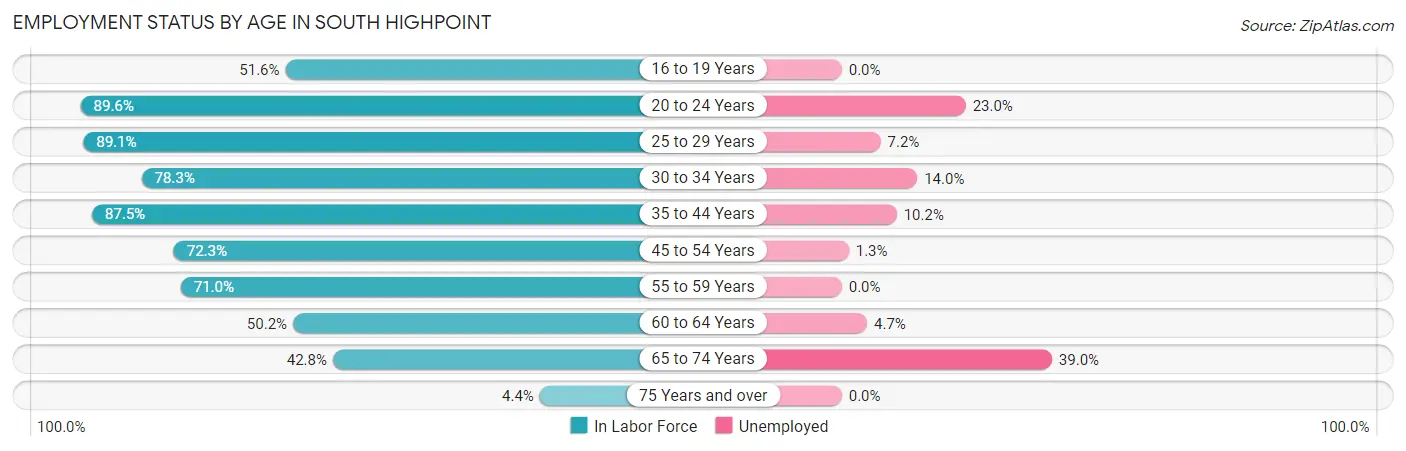
| Age Bracket | In Labor Force | Unemployed |
| 16 to 19 Years | 237 (51.6%) | 0 (0.0%) |
| 20 to 24 Years | 343 (89.6%) | 79 (23.0%) |
| 25 to 29 Years | 278 (89.1%) | 20 (7.2%) |
| 30 to 34 Years | 300 (78.3%) | 42 (14.0%) |
| 35 to 44 Years | 560 (87.5%) | 57 (10.2%) |
| 45 to 54 Years | 696 (72.3%) | 9 (1.3%) |
| 55 to 59 Years | 103 (71.0%) | 0 (0.0%) |
| 60 to 64 Years | 150 (50.2%) | 7 (4.7%) |
| 65 to 74 Years | 251 (42.8%) | 98 (39.0%) |
| 75 Years and over | 4 (4.4%) | 0 (0.0%) |
| Total | 2,923 (68.6%) | 313 (10.7%) |
Employment Status by Educational Attainment in South Highpoint
According to labor force statistics for South Highpoint, 76.1% of individuals (2,087) out of the total population between 25 and 64 years of age (2,742) are in the labor force, with 6.5% or 136 of them being unemployed. The group with the highest labor force participation rate are those with the educational attainment of bachelor's degree or higher, with 83.1% or 231 individuals in the labor force. Within the labor force, individuals with bachelor's degree or higher education have the highest percentage of unemployment, with 8.7% or 20 of them being unemployed.
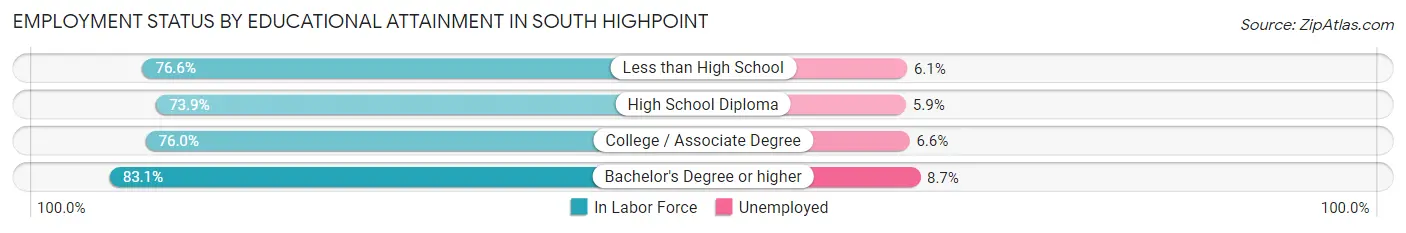
| Educational Attainment | In Labor Force | Unemployed |
| Less than High School | 508 (76.6%) | 40 (6.1%) |
| High School Diploma | 710 (73.9%) | 57 (5.9%) |
| College / Associate Degree | 638 (76.0%) | 55 (6.6%) |
| Bachelor's Degree or higher | 231 (83.1%) | 24 (8.7%) |
| Total | 2,087 (76.1%) | 178 (6.5%) |
Employment Occupations by Sex in South Highpoint
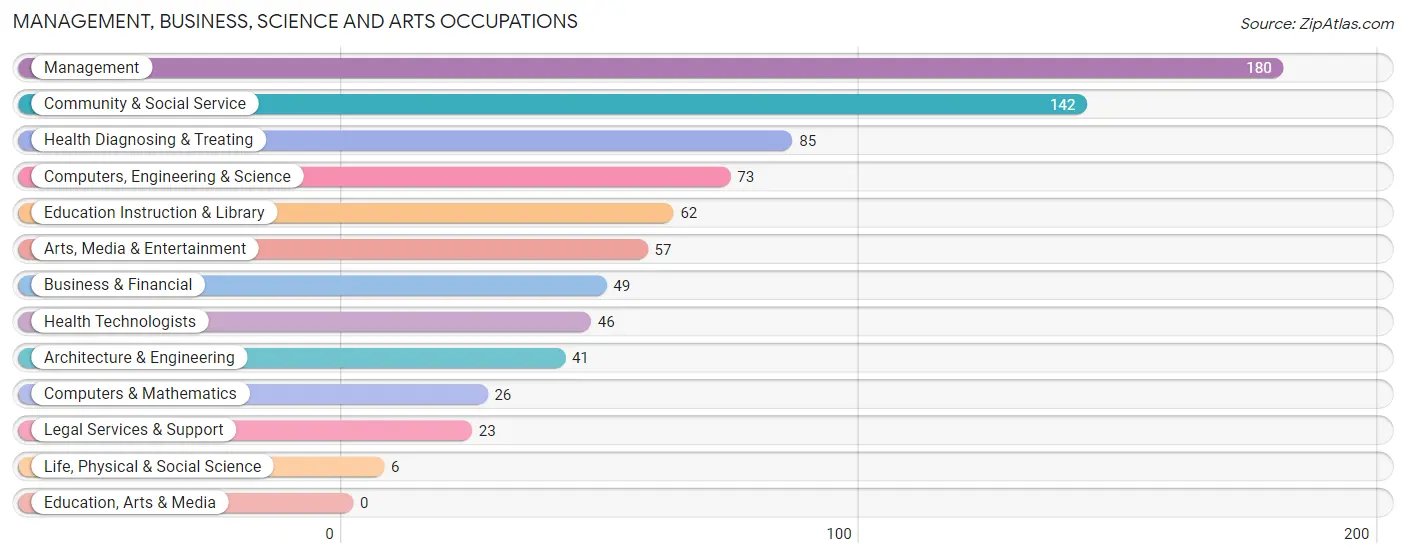
Management, Business, Science and Arts Occupations
The most common Management, Business, Science and Arts occupations in South Highpoint are Management (180 | 6.9%), Community & Social Service (142 | 5.4%), Health Diagnosing & Treating (85 | 3.3%), Computers, Engineering & Science (73 | 2.8%), and Education Instruction & Library (62 | 2.4%).
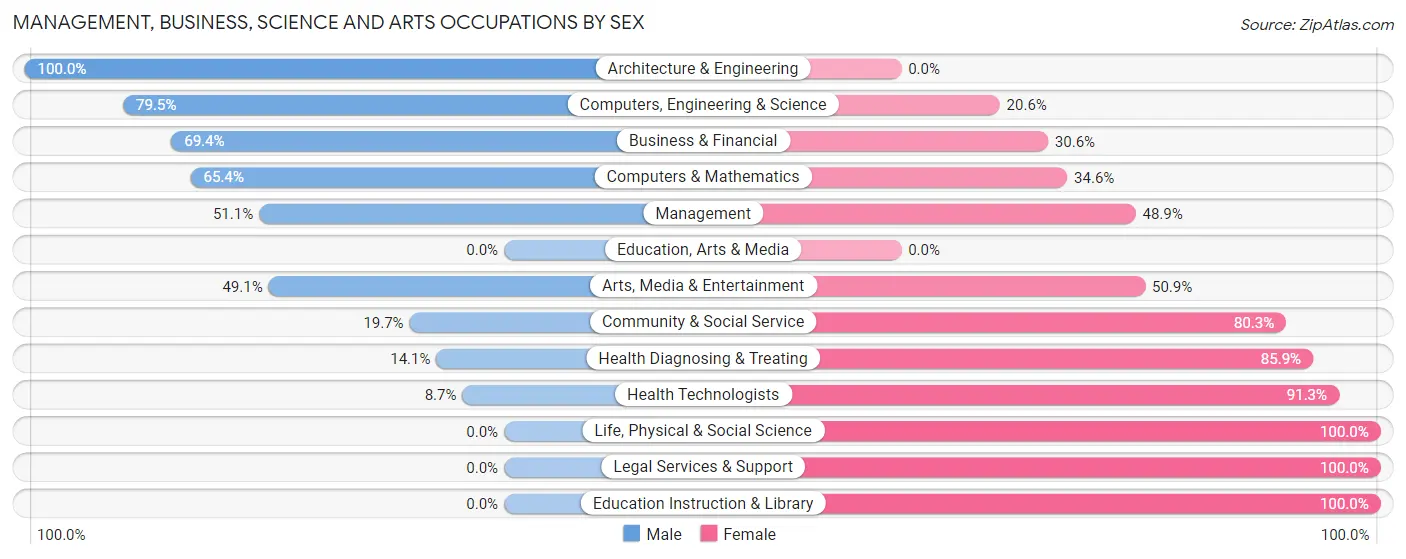
Management, Business, Science and Arts Occupations by Sex
Within the Management, Business, Science and Arts occupations in South Highpoint, the most male-oriented occupations are Architecture & Engineering (100.0%), Computers, Engineering & Science (79.4%), and Business & Financial (69.4%), while the most female-oriented occupations are Life, Physical & Social Science (100.0%), Legal Services & Support (100.0%), and Education Instruction & Library (100.0%).
| Occupation | Male | Female |
| Management | 92 (51.1%) | 88 (48.9%) |
| Business & Financial | 34 (69.4%) | 15 (30.6%) |
| Computers, Engineering & Science | 58 (79.4%) | 15 (20.5%) |
| Computers & Mathematics | 17 (65.4%) | 9 (34.6%) |
| Architecture & Engineering | 41 (100.0%) | 0 (0.0%) |
| Life, Physical & Social Science | 0 (0.0%) | 6 (100.0%) |
| Community & Social Service | 28 (19.7%) | 114 (80.3%) |
| Education, Arts & Media | 0 (0.0%) | 0 (0.0%) |
| Legal Services & Support | 0 (0.0%) | 23 (100.0%) |
| Education Instruction & Library | 0 (0.0%) | 62 (100.0%) |
| Arts, Media & Entertainment | 28 (49.1%) | 29 (50.9%) |
| Health Diagnosing & Treating | 12 (14.1%) | 73 (85.9%) |
| Health Technologists | 4 (8.7%) | 42 (91.3%) |
| Total (Category) | 224 (42.3%) | 305 (57.7%) |
| Total (Overall) | 1,280 (49.0%) | 1,330 (51.0%) |
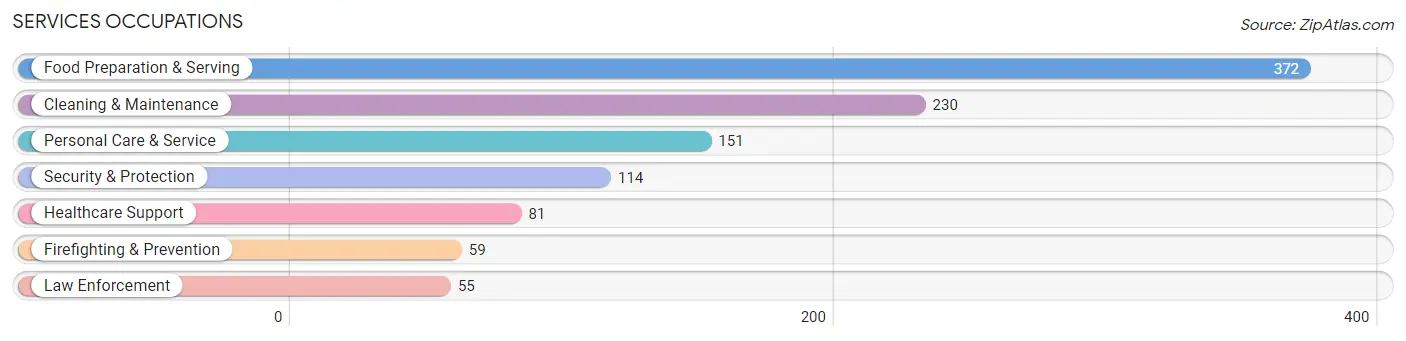
Services Occupations
The most common Services occupations in South Highpoint are Food Preparation & Serving (372 | 14.2%), Cleaning & Maintenance (230 | 8.8%), Personal Care & Service (151 | 5.8%), Security & Protection (114 | 4.4%), and Healthcare Support (81 | 3.1%).
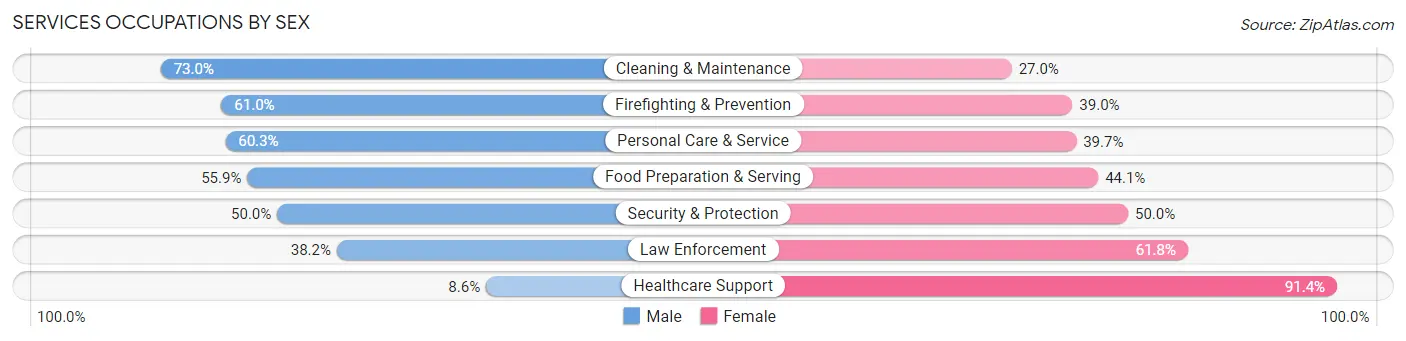
Services Occupations by Sex
Within the Services occupations in South Highpoint, the most male-oriented occupations are Cleaning & Maintenance (73.0%), Firefighting & Prevention (61.0%), and Personal Care & Service (60.3%), while the most female-oriented occupations are Healthcare Support (91.4%), Law Enforcement (61.8%), and Security & Protection (50.0%).
| Occupation | Male | Female |
| Healthcare Support | 7 (8.6%) | 74 (91.4%) |
| Security & Protection | 57 (50.0%) | 57 (50.0%) |
| Firefighting & Prevention | 36 (61.0%) | 23 (39.0%) |
| Law Enforcement | 21 (38.2%) | 34 (61.8%) |
| Food Preparation & Serving | 208 (55.9%) | 164 (44.1%) |
| Cleaning & Maintenance | 168 (73.0%) | 62 (27.0%) |
| Personal Care & Service | 91 (60.3%) | 60 (39.7%) |
| Total (Category) | 531 (56.0%) | 417 (44.0%) |
| Total (Overall) | 1,280 (49.0%) | 1,330 (51.0%) |
Sales and Office Occupations
The most common Sales and Office occupations in South Highpoint are Sales & Related (402 | 15.4%), and Office & Administration (283 | 10.8%).
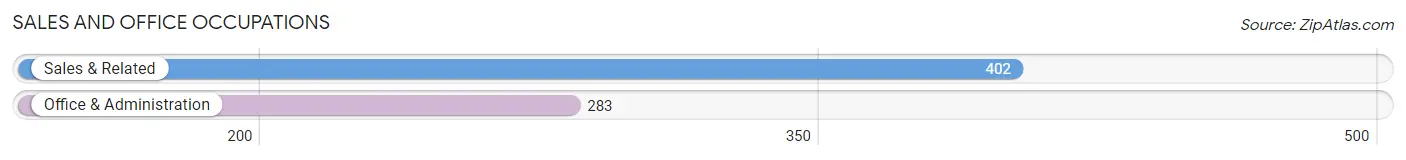
Sales and Office Occupations by Sex
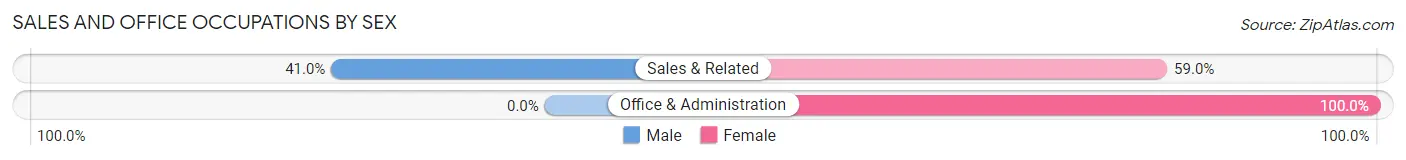
| Occupation | Male | Female |
| Sales & Related | 165 (41.0%) | 237 (59.0%) |
| Office & Administration | 0 (0.0%) | 283 (100.0%) |
| Total (Category) | 165 (24.1%) | 520 (75.9%) |
| Total (Overall) | 1,280 (49.0%) | 1,330 (51.0%) |
Natural Resources, Construction and Maintenance Occupations
The most common Natural Resources, Construction and Maintenance occupations in South Highpoint are Construction & Extraction (78 | 3.0%), Installation, Maintenance & Repair (42 | 1.6%), and Farming, Fishing & Forestry (16 | 0.6%).
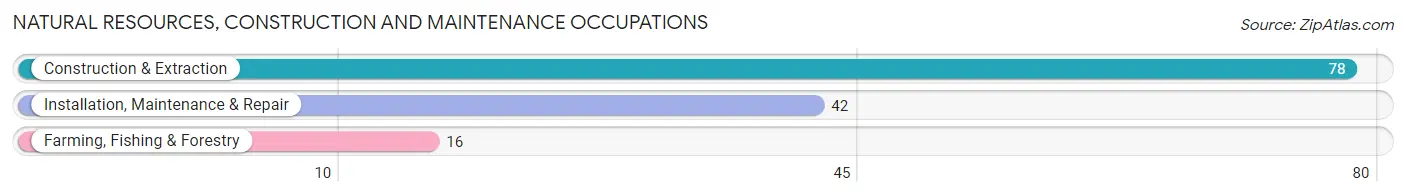
Natural Resources, Construction and Maintenance Occupations by Sex
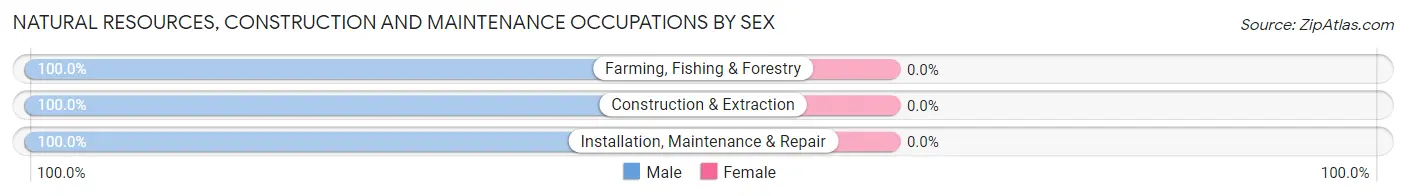
| Occupation | Male | Female |
| Farming, Fishing & Forestry | 16 (100.0%) | 0 (0.0%) |
| Construction & Extraction | 78 (100.0%) | 0 (0.0%) |
| Installation, Maintenance & Repair | 42 (100.0%) | 0 (0.0%) |
| Total (Category) | 136 (100.0%) | 0 (0.0%) |
| Total (Overall) | 1,280 (49.0%) | 1,330 (51.0%) |
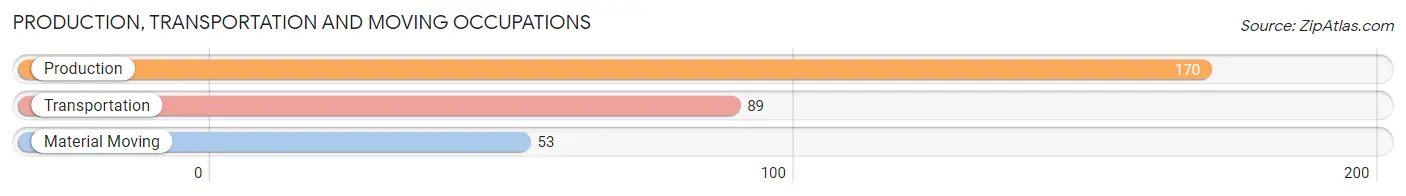
Production, Transportation and Moving Occupations
The most common Production, Transportation and Moving occupations in South Highpoint are Production (170 | 6.5%), Transportation (89 | 3.4%), and Material Moving (53 | 2.0%).
Production, Transportation and Moving Occupations by Sex
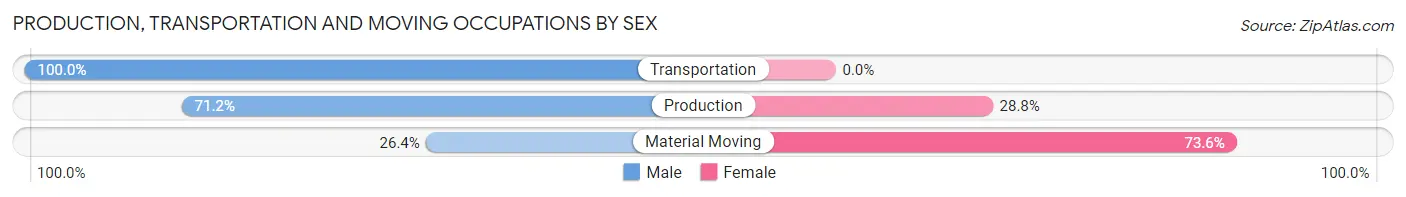
| Occupation | Male | Female |
| Production | 121 (71.2%) | 49 (28.8%) |
| Transportation | 89 (100.0%) | 0 (0.0%) |
| Material Moving | 14 (26.4%) | 39 (73.6%) |
| Total (Category) | 224 (71.8%) | 88 (28.2%) |
| Total (Overall) | 1,280 (49.0%) | 1,330 (51.0%) |
Employment Industries by Sex in South Highpoint
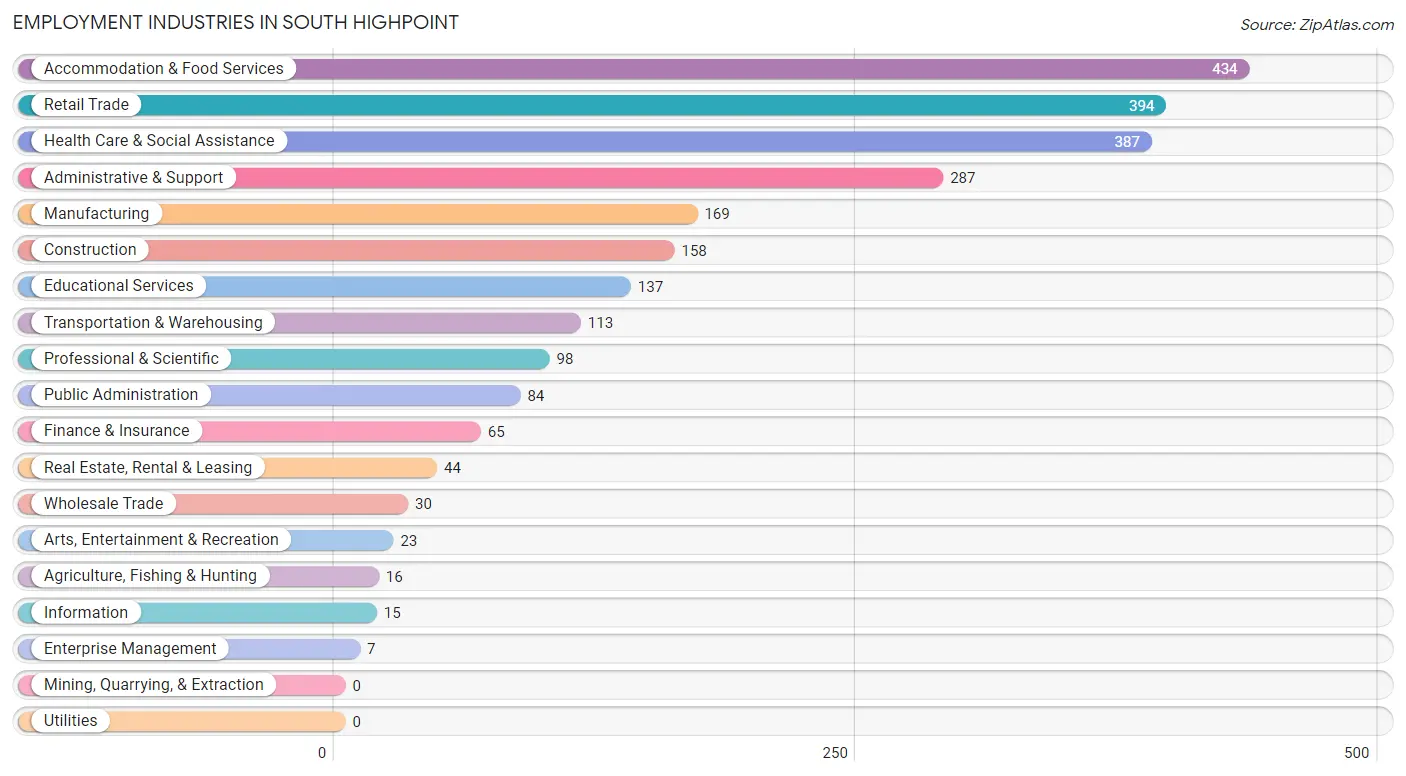
Employment Industries in South Highpoint
The major employment industries in South Highpoint include Accommodation & Food Services (434 | 16.6%), Retail Trade (394 | 15.1%), Health Care & Social Assistance (387 | 14.8%), Administrative & Support (287 | 11.0%), and Manufacturing (169 | 6.5%).
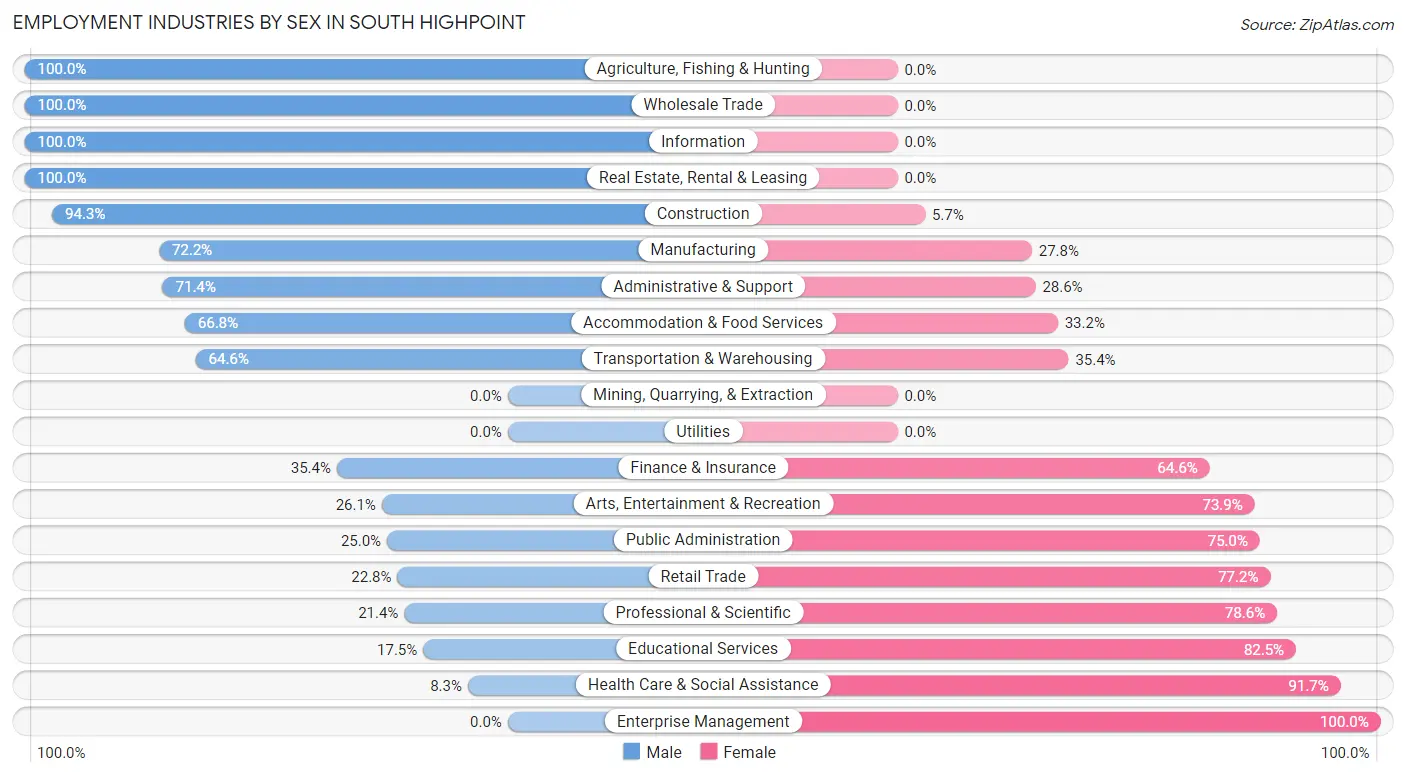
Employment Industries by Sex in South Highpoint
The South Highpoint industries that see more men than women are Agriculture, Fishing & Hunting (100.0%), Wholesale Trade (100.0%), and Information (100.0%), whereas the industries that tend to have a higher number of women are Enterprise Management (100.0%), Health Care & Social Assistance (91.7%), and Educational Services (82.5%).
| Industry | Male | Female |
| Agriculture, Fishing & Hunting | 16 (100.0%) | 0 (0.0%) |
| Mining, Quarrying, & Extraction | 0 (0.0%) | 0 (0.0%) |
| Construction | 149 (94.3%) | 9 (5.7%) |
| Manufacturing | 122 (72.2%) | 47 (27.8%) |
| Wholesale Trade | 30 (100.0%) | 0 (0.0%) |
| Retail Trade | 90 (22.8%) | 304 (77.2%) |
| Transportation & Warehousing | 73 (64.6%) | 40 (35.4%) |
| Utilities | 0 (0.0%) | 0 (0.0%) |
| Information | 15 (100.0%) | 0 (0.0%) |
| Finance & Insurance | 23 (35.4%) | 42 (64.6%) |
| Real Estate, Rental & Leasing | 44 (100.0%) | 0 (0.0%) |
| Professional & Scientific | 21 (21.4%) | 77 (78.6%) |
| Enterprise Management | 0 (0.0%) | 7 (100.0%) |
| Administrative & Support | 205 (71.4%) | 82 (28.6%) |
| Educational Services | 24 (17.5%) | 113 (82.5%) |
| Health Care & Social Assistance | 32 (8.3%) | 355 (91.7%) |
| Arts, Entertainment & Recreation | 6 (26.1%) | 17 (73.9%) |
| Accommodation & Food Services | 290 (66.8%) | 144 (33.2%) |
| Public Administration | 21 (25.0%) | 63 (75.0%) |
| Total | 1,280 (49.0%) | 1,330 (51.0%) |
Education in South Highpoint
School Enrollment in South Highpoint
The most common levels of schooling among the 1,233 students in South Highpoint are high school (333 | 27.0%), middle school (304 | 24.7%), and elementary school (301 | 24.4%).
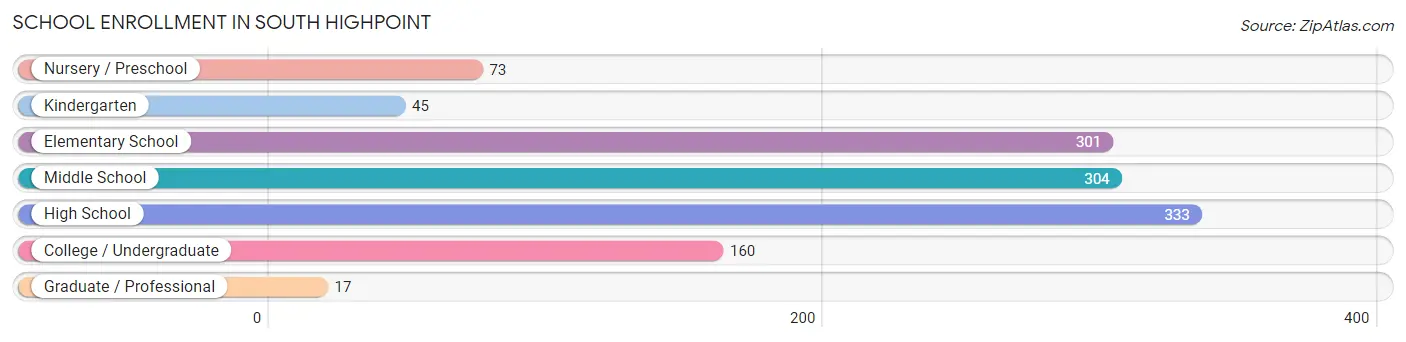
| School Level | # Students | % Students |
| Nursery / Preschool | 73 | 5.9% |
| Kindergarten | 45 | 3.6% |
| Elementary School | 301 | 24.4% |
| Middle School | 304 | 24.7% |
| High School | 333 | 27.0% |
| College / Undergraduate | 160 | 13.0% |
| Graduate / Professional | 17 | 1.4% |
| Total | 1,233 | 100.0% |
School Enrollment by Age by Funding Source in South Highpoint
Out of a total of 1,233 students who are enrolled in schools in South Highpoint, 39 (3.2%) attend a private institution, while the remaining 1,194 (96.8%) are enrolled in public schools. The age group of 20 to 24 year olds has the highest likelihood of being enrolled in private schools, with 8 (9.5% in the age bracket) enrolled. Conversely, the age group of 3 to 4 year olds has the lowest likelihood of being enrolled in a private school, with 53 (100.0% in the age bracket) attending a public institution.
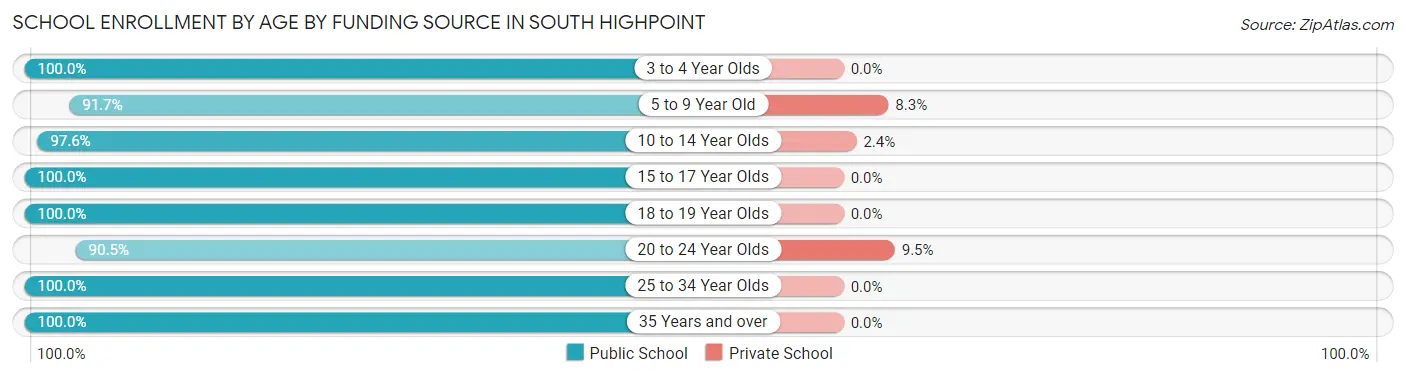
| Age Bracket | Public School | Private School |
| 3 to 4 Year Olds | 53 (100.0%) | 0 (0.0%) |
| 5 to 9 Year Old | 231 (91.7%) | 21 (8.3%) |
| 10 to 14 Year Olds | 408 (97.6%) | 10 (2.4%) |
| 15 to 17 Year Olds | 303 (100.0%) | 0 (0.0%) |
| 18 to 19 Year Olds | 47 (100.0%) | 0 (0.0%) |
| 20 to 24 Year Olds | 76 (90.5%) | 8 (9.5%) |
| 25 to 34 Year Olds | 20 (100.0%) | 0 (0.0%) |
| 35 Years and over | 56 (100.0%) | 0 (0.0%) |
| Total | 1,194 (96.8%) | 39 (3.2%) |
Educational Attainment by Field of Study in South Highpoint
Business (90 | 20.9%), education (54 | 12.5%), science & technology (51 | 11.8%), arts & humanities (50 | 11.6%), and computers & mathematics (47 | 10.9%) are the most common fields of study among 431 individuals in South Highpoint who have obtained a bachelor's degree or higher.
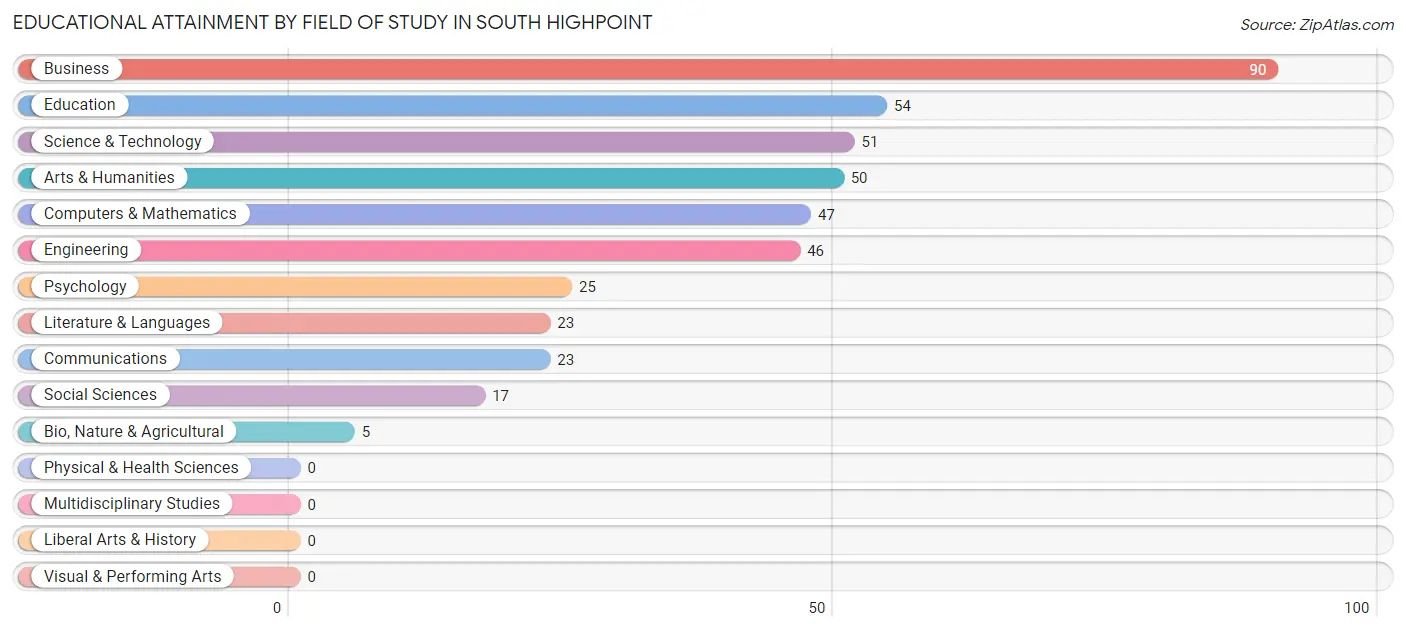
| Field of Study | # Graduates | % Graduates |
| Computers & Mathematics | 47 | 10.9% |
| Bio, Nature & Agricultural | 5 | 1.2% |
| Physical & Health Sciences | 0 | 0.0% |
| Psychology | 25 | 5.8% |
| Social Sciences | 17 | 3.9% |
| Engineering | 46 | 10.7% |
| Multidisciplinary Studies | 0 | 0.0% |
| Science & Technology | 51 | 11.8% |
| Business | 90 | 20.9% |
| Education | 54 | 12.5% |
| Literature & Languages | 23 | 5.3% |
| Liberal Arts & History | 0 | 0.0% |
| Visual & Performing Arts | 0 | 0.0% |
| Communications | 23 | 5.3% |
| Arts & Humanities | 50 | 11.6% |
| Total | 431 | 100.0% |
Transportation & Commute in South Highpoint
Vehicle Availability by Sex in South Highpoint
The most prevalent vehicle ownership categories in South Highpoint are males with 2 vehicles (479, accounting for 37.6%) and females with 2 vehicles (495, making up 36.3%).
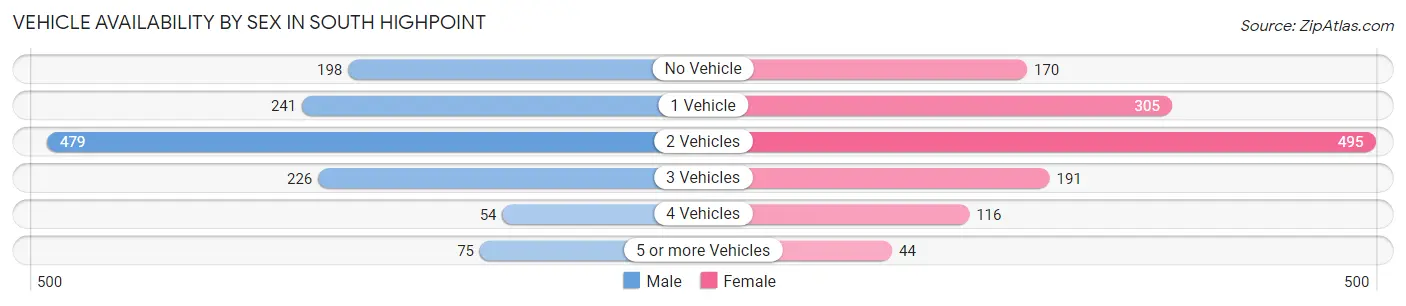
| Vehicles Available | Male | Female |
| No Vehicle | 198 (15.5%) | 170 (12.9%) |
| 1 Vehicle | 241 (18.9%) | 305 (23.1%) |
| 2 Vehicles | 479 (37.6%) | 495 (37.5%) |
| 3 Vehicles | 226 (17.7%) | 191 (14.5%) |
| 4 Vehicles | 54 (4.2%) | 116 (8.8%) |
| 5 or more Vehicles | 75 (5.9%) | 44 (3.3%) |
| Total | 1,273 (100.0%) | 1,321 (100.0%) |
Commute Time in South Highpoint
The most frequently occuring commute durations in South Highpoint are 10 to 14 minutes (539 commuters, 21.4%), 20 to 24 minutes (537 commuters, 21.4%), and 15 to 19 minutes (449 commuters, 17.9%).
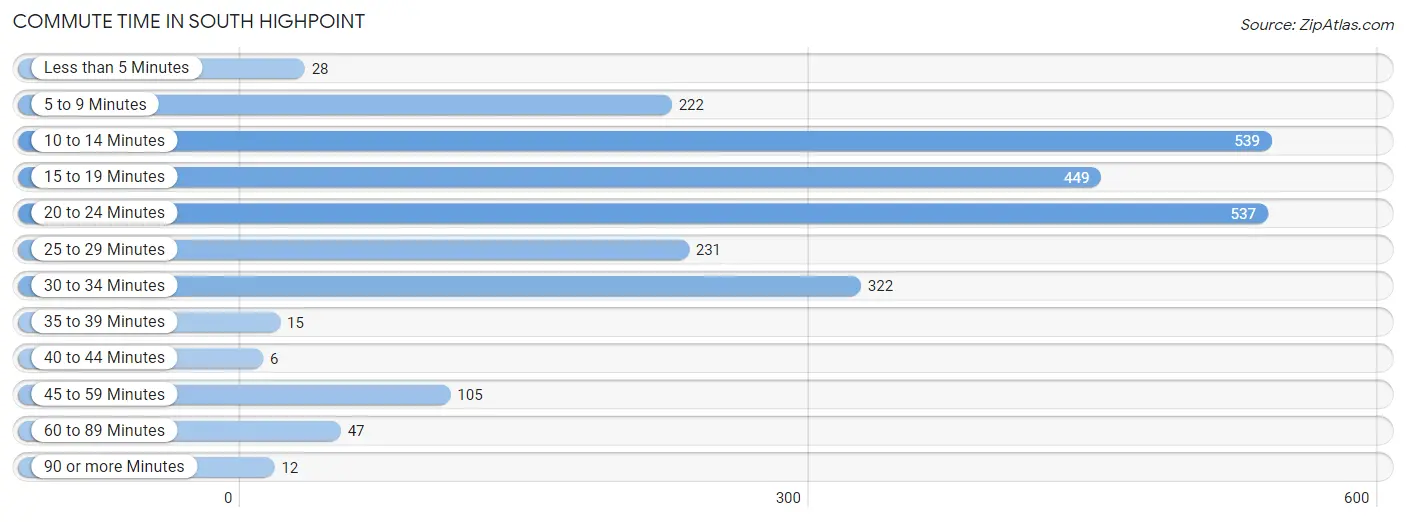
| Commute Time | # Commuters | % Commuters |
| Less than 5 Minutes | 28 | 1.1% |
| 5 to 9 Minutes | 222 | 8.8% |
| 10 to 14 Minutes | 539 | 21.4% |
| 15 to 19 Minutes | 449 | 17.9% |
| 20 to 24 Minutes | 537 | 21.4% |
| 25 to 29 Minutes | 231 | 9.2% |
| 30 to 34 Minutes | 322 | 12.8% |
| 35 to 39 Minutes | 15 | 0.6% |
| 40 to 44 Minutes | 6 | 0.2% |
| 45 to 59 Minutes | 105 | 4.2% |
| 60 to 89 Minutes | 47 | 1.9% |
| 90 or more Minutes | 12 | 0.5% |
Commute Time by Sex in South Highpoint
The most common commute times in South Highpoint are 10 to 14 minutes (275 commuters, 22.3%) for males and 20 to 24 minutes (316 commuters, 24.7%) for females.
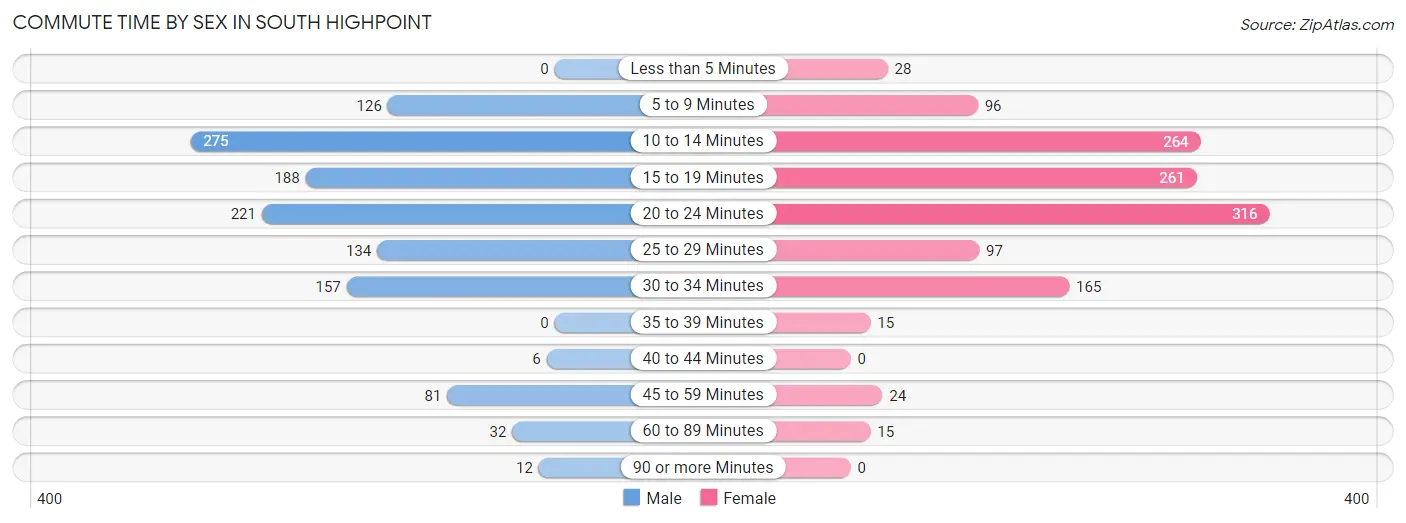
| Commute Time | Male | Female |
| Less than 5 Minutes | 0 (0.0%) | 28 (2.2%) |
| 5 to 9 Minutes | 126 (10.2%) | 96 (7.5%) |
| 10 to 14 Minutes | 275 (22.3%) | 264 (20.6%) |
| 15 to 19 Minutes | 188 (15.3%) | 261 (20.4%) |
| 20 to 24 Minutes | 221 (17.9%) | 316 (24.7%) |
| 25 to 29 Minutes | 134 (10.9%) | 97 (7.6%) |
| 30 to 34 Minutes | 157 (12.7%) | 165 (12.9%) |
| 35 to 39 Minutes | 0 (0.0%) | 15 (1.2%) |
| 40 to 44 Minutes | 6 (0.5%) | 0 (0.0%) |
| 45 to 59 Minutes | 81 (6.6%) | 24 (1.9%) |
| 60 to 89 Minutes | 32 (2.6%) | 15 (1.2%) |
| 90 or more Minutes | 12 (1.0%) | 0 (0.0%) |
Time of Departure to Work by Sex in South Highpoint
The most frequent times of departure to work in South Highpoint are 8:00 AM to 8:29 AM (194, 15.8%) for males and 7:00 AM to 7:29 AM (265, 20.7%) for females.
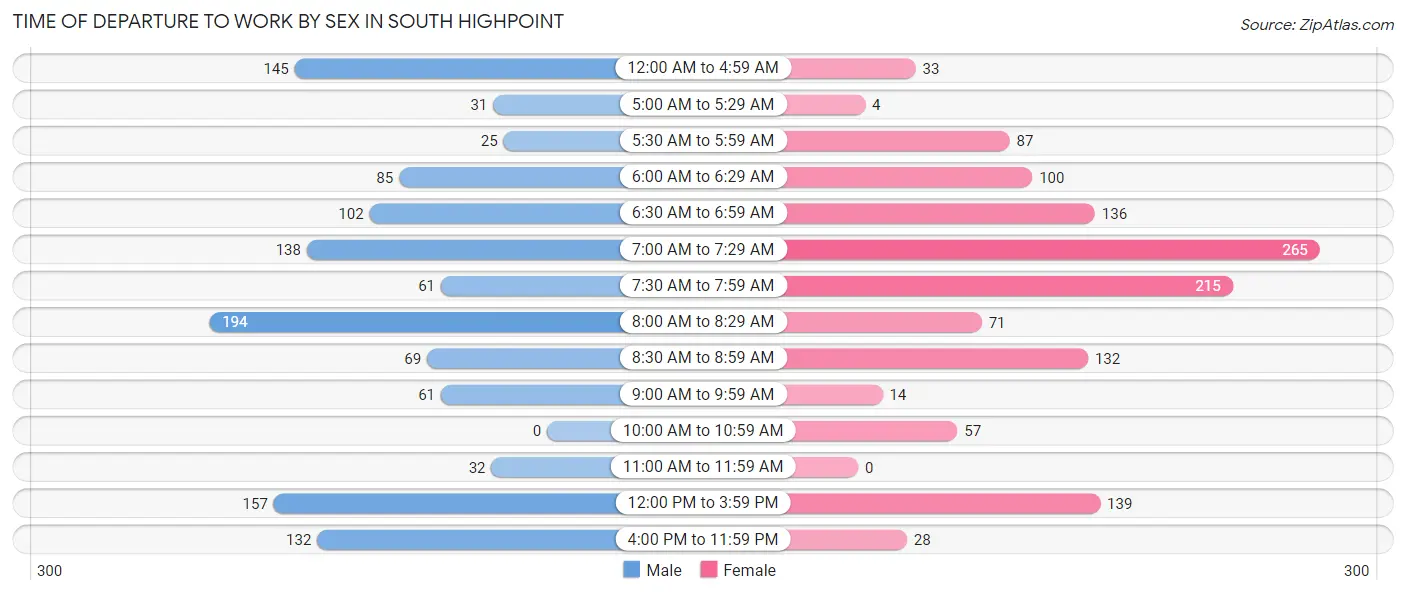
| Time of Departure | Male | Female |
| 12:00 AM to 4:59 AM | 145 (11.8%) | 33 (2.6%) |
| 5:00 AM to 5:29 AM | 31 (2.5%) | 4 (0.3%) |
| 5:30 AM to 5:59 AM | 25 (2.0%) | 87 (6.8%) |
| 6:00 AM to 6:29 AM | 85 (6.9%) | 100 (7.8%) |
| 6:30 AM to 6:59 AM | 102 (8.3%) | 136 (10.6%) |
| 7:00 AM to 7:29 AM | 138 (11.2%) | 265 (20.7%) |
| 7:30 AM to 7:59 AM | 61 (5.0%) | 215 (16.8%) |
| 8:00 AM to 8:29 AM | 194 (15.8%) | 71 (5.5%) |
| 8:30 AM to 8:59 AM | 69 (5.6%) | 132 (10.3%) |
| 9:00 AM to 9:59 AM | 61 (5.0%) | 14 (1.1%) |
| 10:00 AM to 10:59 AM | 0 (0.0%) | 57 (4.4%) |
| 11:00 AM to 11:59 AM | 32 (2.6%) | 0 (0.0%) |
| 12:00 PM to 3:59 PM | 157 (12.7%) | 139 (10.8%) |
| 4:00 PM to 11:59 PM | 132 (10.7%) | 28 (2.2%) |
| Total | 1,232 (100.0%) | 1,281 (100.0%) |
Housing Occupancy in South Highpoint
Occupancy by Ownership in South Highpoint
Of the total 1,828 dwellings in South Highpoint, owner-occupied units account for 867 (47.4%), while renter-occupied units make up 961 (52.6%).
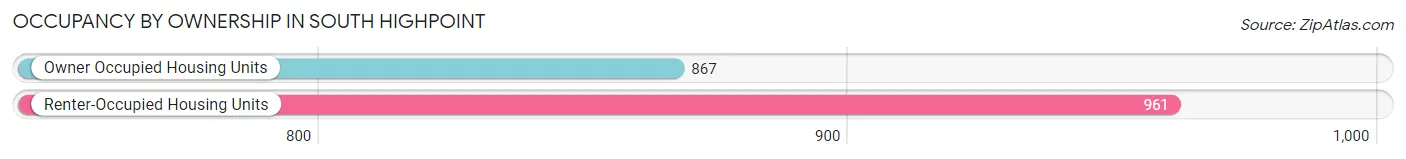
| Occupancy | # Housing Units | % Housing Units |
| Owner Occupied Housing Units | 867 | 47.4% |
| Renter-Occupied Housing Units | 961 | 52.6% |
| Total Occupied Housing Units | 1,828 | 100.0% |
Occupancy by Household Size in South Highpoint
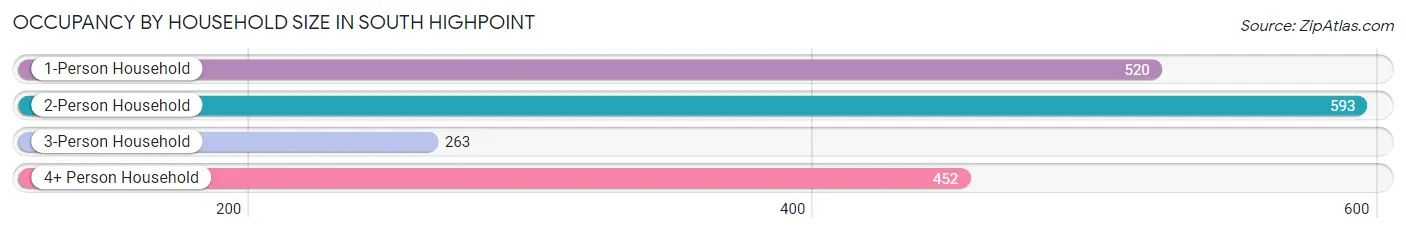
| Household Size | # Housing Units | % Housing Units |
| 1-Person Household | 520 | 28.4% |
| 2-Person Household | 593 | 32.4% |
| 3-Person Household | 263 | 14.4% |
| 4+ Person Household | 452 | 24.7% |
| Total Housing Units | 1,828 | 100.0% |
Occupancy by Ownership by Household Size in South Highpoint
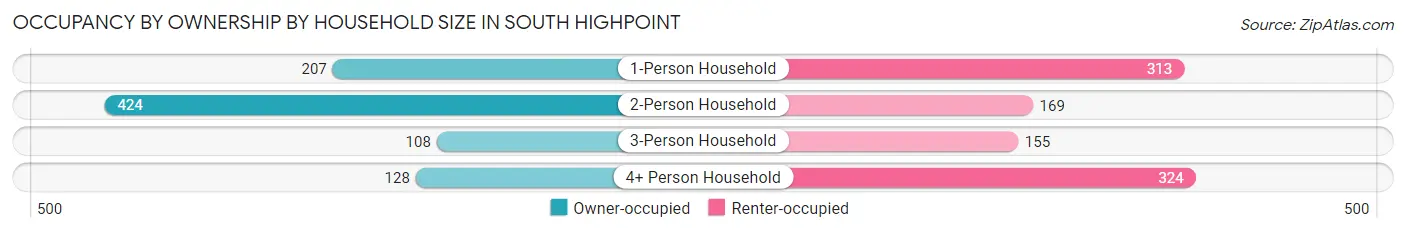
| Household Size | Owner-occupied | Renter-occupied |
| 1-Person Household | 207 (39.8%) | 313 (60.2%) |
| 2-Person Household | 424 (71.5%) | 169 (28.5%) |
| 3-Person Household | 108 (41.1%) | 155 (58.9%) |
| 4+ Person Household | 128 (28.3%) | 324 (71.7%) |
| Total Housing Units | 867 (47.4%) | 961 (52.6%) |
Occupancy by Educational Attainment in South Highpoint
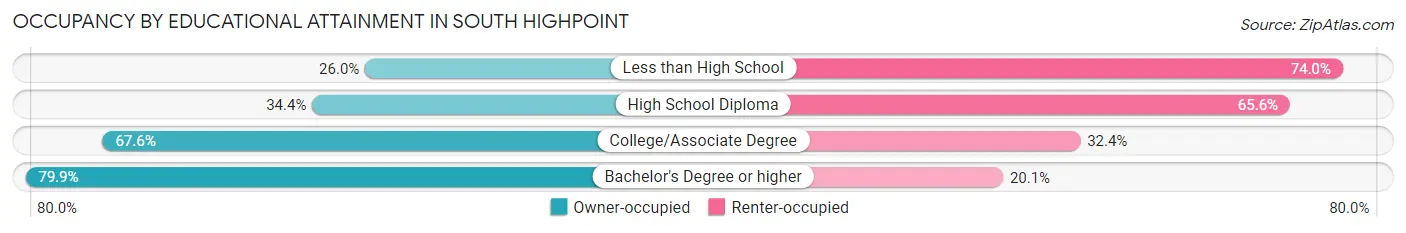
| Household Size | Owner-occupied | Renter-occupied |
| Less than High School | 119 (26.0%) | 339 (74.0%) |
| High School Diploma | 208 (34.4%) | 397 (65.6%) |
| College/Associate Degree | 393 (67.6%) | 188 (32.4%) |
| Bachelor's Degree or higher | 147 (79.9%) | 37 (20.1%) |
Occupancy by Age of Householder in South Highpoint
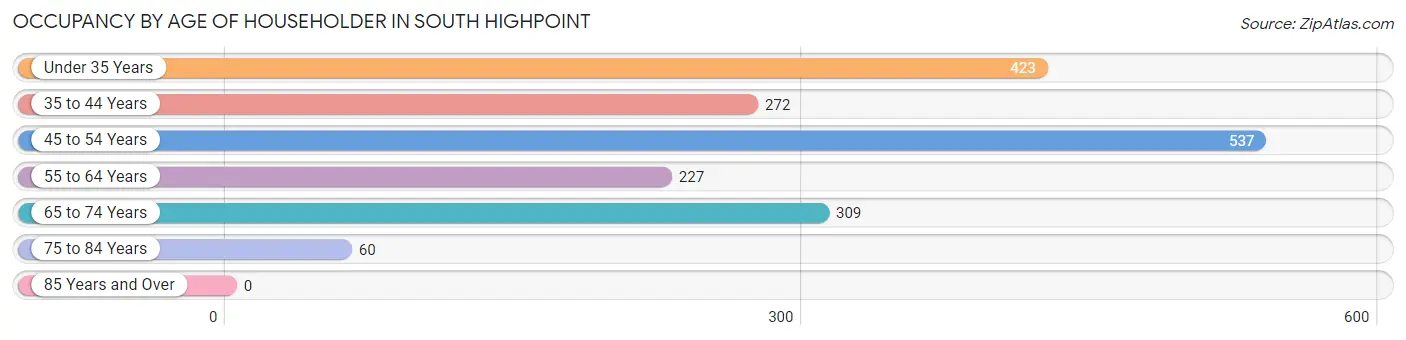
| Age Bracket | # Households | % Households |
| Under 35 Years | 423 | 23.1% |
| 35 to 44 Years | 272 | 14.9% |
| 45 to 54 Years | 537 | 29.4% |
| 55 to 64 Years | 227 | 12.4% |
| 65 to 74 Years | 309 | 16.9% |
| 75 to 84 Years | 60 | 3.3% |
| 85 Years and Over | 0 | 0.0% |
| Total | 1,828 | 100.0% |
Housing Finances in South Highpoint
Median Income by Occupancy in South Highpoint
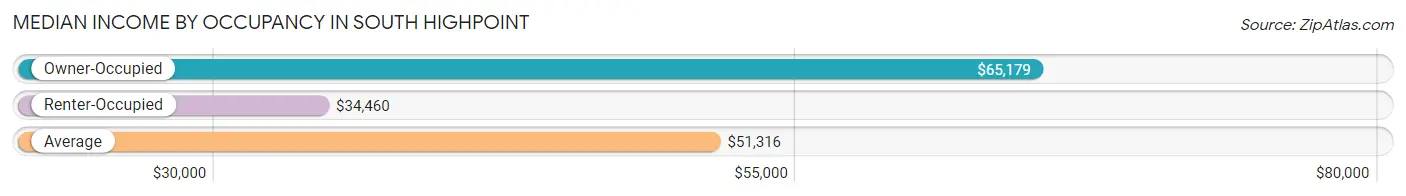
| Occupancy Type | # Households | Median Income |
| Owner-Occupied | 867 (47.4%) | $65,179 |
| Renter-Occupied | 961 (52.6%) | $34,460 |
| Average | 1,828 (100.0%) | $51,316 |
Occupancy by Householder Income Bracket in South Highpoint
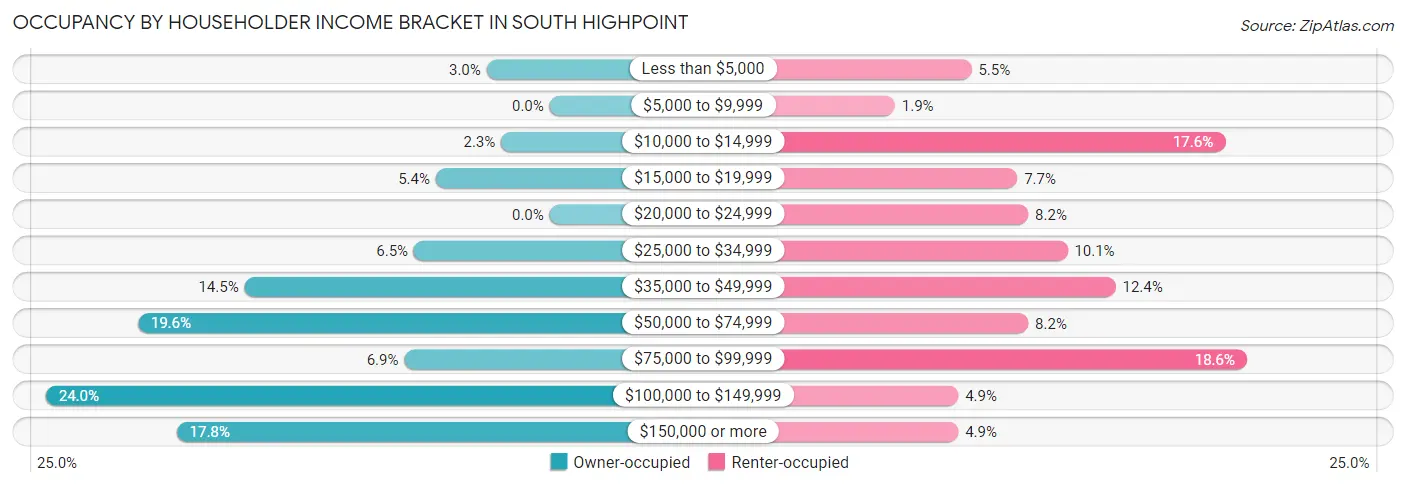
| Income Bracket | Owner-occupied | Renter-occupied |
| Less than $5,000 | 26 (3.0%) | 53 (5.5%) |
| $5,000 to $9,999 | 0 (0.0%) | 18 (1.9%) |
| $10,000 to $14,999 | 20 (2.3%) | 169 (17.6%) |
| $15,000 to $19,999 | 47 (5.4%) | 74 (7.7%) |
| $20,000 to $24,999 | 0 (0.0%) | 79 (8.2%) |
| $25,000 to $34,999 | 56 (6.5%) | 97 (10.1%) |
| $35,000 to $49,999 | 126 (14.5%) | 119 (12.4%) |
| $50,000 to $74,999 | 170 (19.6%) | 79 (8.2%) |
| $75,000 to $99,999 | 60 (6.9%) | 179 (18.6%) |
| $100,000 to $149,999 | 208 (24.0%) | 47 (4.9%) |
| $150,000 or more | 154 (17.8%) | 47 (4.9%) |
| Total | 867 (100.0%) | 961 (100.0%) |
Monthly Housing Cost Tiers in South Highpoint
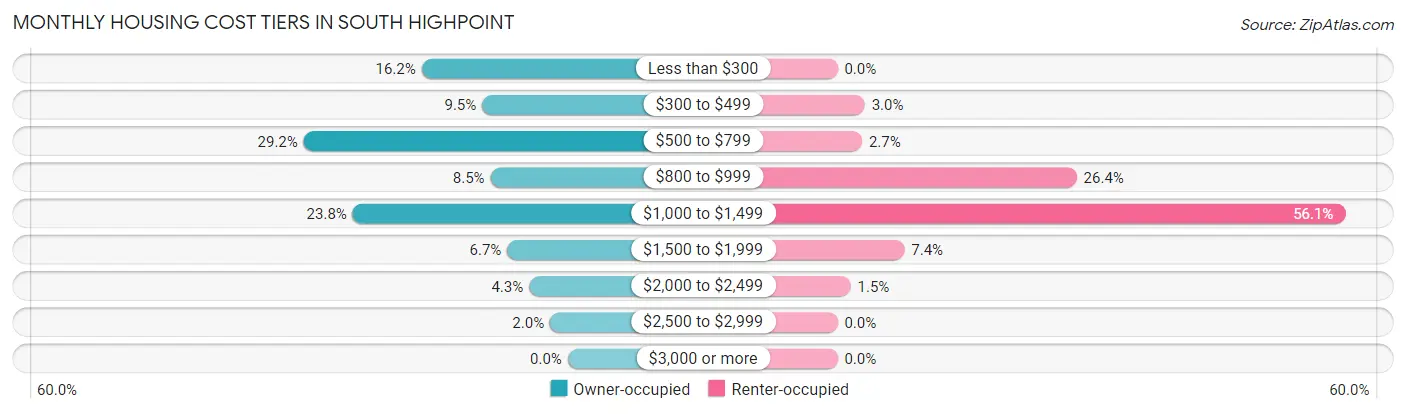
| Monthly Cost | Owner-occupied | Renter-occupied |
| Less than $300 | 140 (16.2%) | 0 (0.0%) |
| $300 to $499 | 82 (9.5%) | 29 (3.0%) |
| $500 to $799 | 253 (29.2%) | 26 (2.7%) |
| $800 to $999 | 74 (8.5%) | 254 (26.4%) |
| $1,000 to $1,499 | 206 (23.8%) | 539 (56.1%) |
| $1,500 to $1,999 | 58 (6.7%) | 71 (7.4%) |
| $2,000 to $2,499 | 37 (4.3%) | 14 (1.5%) |
| $2,500 to $2,999 | 17 (2.0%) | 0 (0.0%) |
| $3,000 or more | 0 (0.0%) | 0 (0.0%) |
| Total | 867 (100.0%) | 961 (100.0%) |
Physical Housing Characteristics in South Highpoint
Housing Structures in South Highpoint
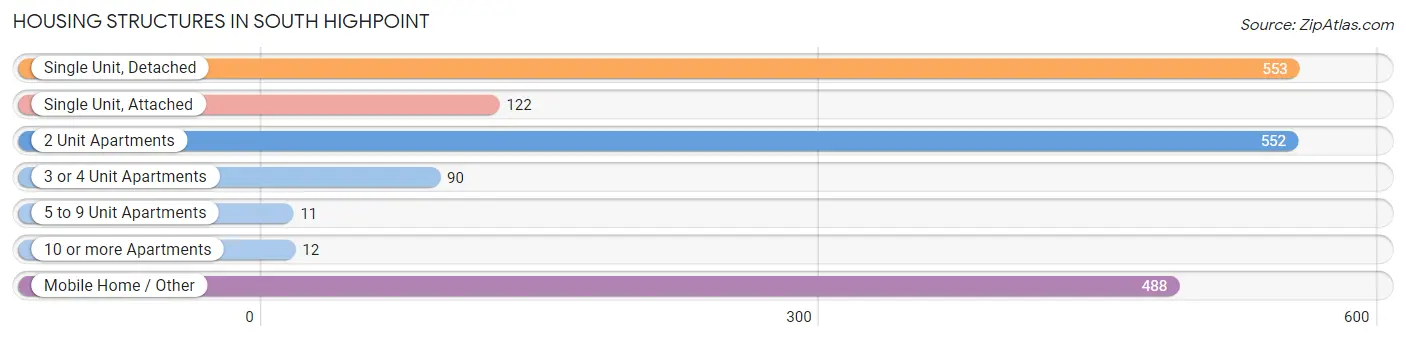
| Structure Type | # Housing Units | % Housing Units |
| Single Unit, Detached | 553 | 30.2% |
| Single Unit, Attached | 122 | 6.7% |
| 2 Unit Apartments | 552 | 30.2% |
| 3 or 4 Unit Apartments | 90 | 4.9% |
| 5 to 9 Unit Apartments | 11 | 0.6% |
| 10 or more Apartments | 12 | 0.7% |
| Mobile Home / Other | 488 | 26.7% |
| Total | 1,828 | 100.0% |
Housing Structures by Occupancy in South Highpoint
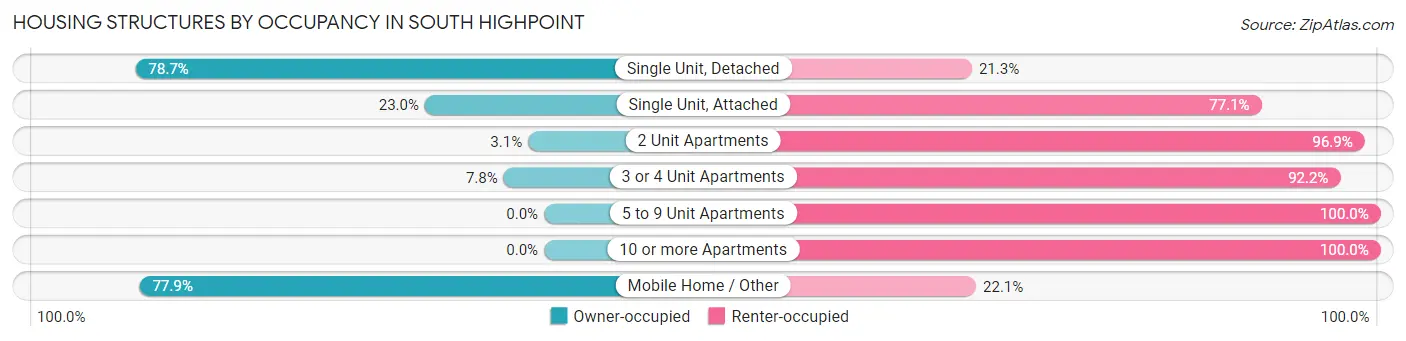
| Structure Type | Owner-occupied | Renter-occupied |
| Single Unit, Detached | 435 (78.7%) | 118 (21.3%) |
| Single Unit, Attached | 28 (23.0%) | 94 (77.0%) |
| 2 Unit Apartments | 17 (3.1%) | 535 (96.9%) |
| 3 or 4 Unit Apartments | 7 (7.8%) | 83 (92.2%) |
| 5 to 9 Unit Apartments | 0 (0.0%) | 11 (100.0%) |
| 10 or more Apartments | 0 (0.0%) | 12 (100.0%) |
| Mobile Home / Other | 380 (77.9%) | 108 (22.1%) |
| Total | 867 (47.4%) | 961 (52.6%) |
Housing Structures by Number of Rooms in South Highpoint
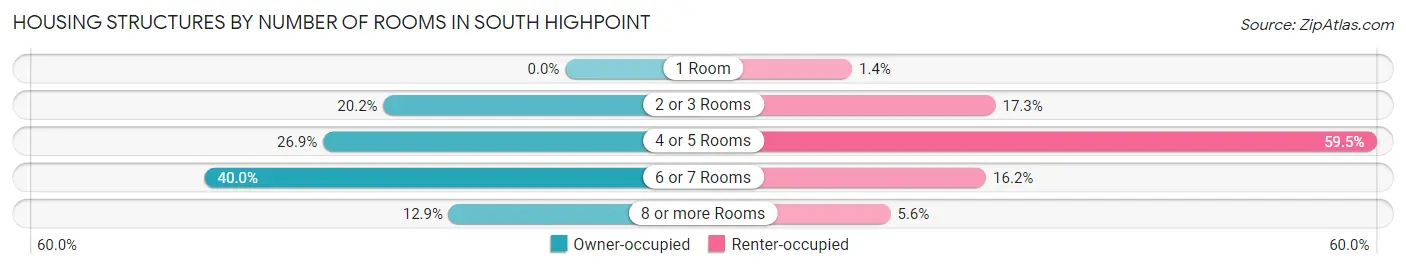
| Number of Rooms | Owner-occupied | Renter-occupied |
| 1 Room | 0 (0.0%) | 13 (1.3%) |
| 2 or 3 Rooms | 175 (20.2%) | 166 (17.3%) |
| 4 or 5 Rooms | 233 (26.9%) | 572 (59.5%) |
| 6 or 7 Rooms | 347 (40.0%) | 156 (16.2%) |
| 8 or more Rooms | 112 (12.9%) | 54 (5.6%) |
| Total | 867 (100.0%) | 961 (100.0%) |
Housing Structure by Heating Type in South Highpoint
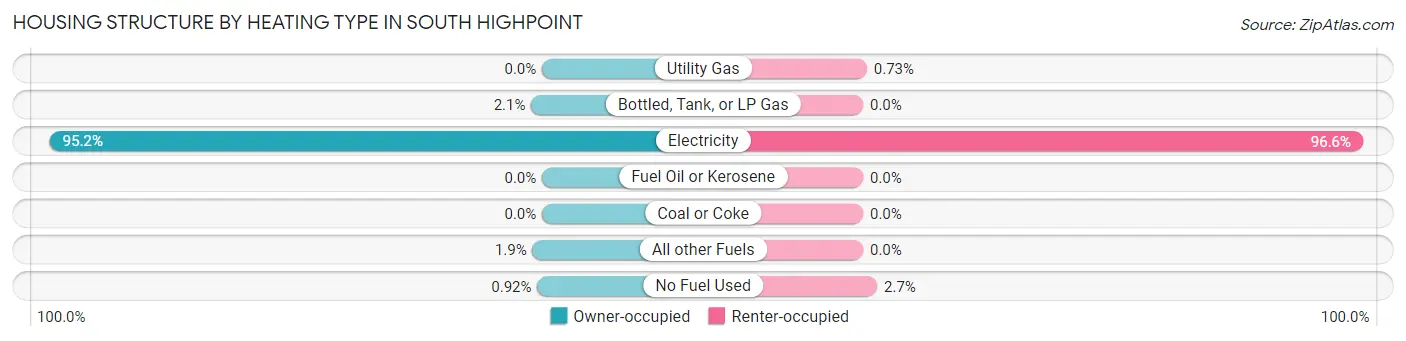
| Heating Type | Owner-occupied | Renter-occupied |
| Utility Gas | 0 (0.0%) | 7 (0.7%) |
| Bottled, Tank, or LP Gas | 18 (2.1%) | 0 (0.0%) |
| Electricity | 825 (95.2%) | 928 (96.6%) |
| Fuel Oil or Kerosene | 0 (0.0%) | 0 (0.0%) |
| Coal or Coke | 0 (0.0%) | 0 (0.0%) |
| All other Fuels | 16 (1.8%) | 0 (0.0%) |
| No Fuel Used | 8 (0.9%) | 26 (2.7%) |
| Total | 867 (100.0%) | 961 (100.0%) |
Household Vehicle Usage in South Highpoint
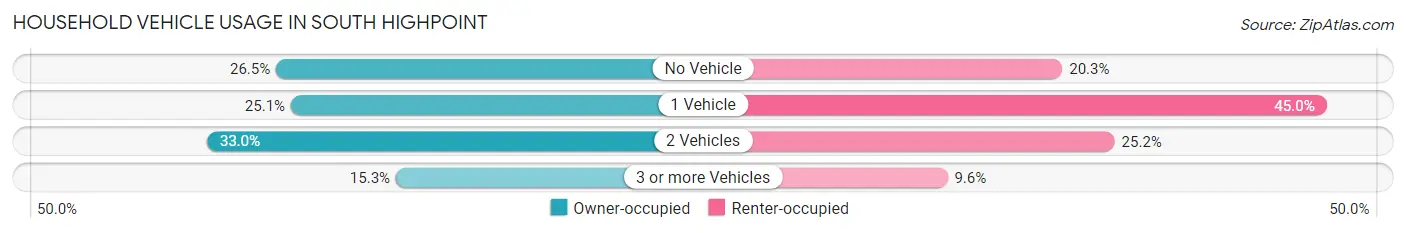
| Vehicles per Household | Owner-occupied | Renter-occupied |
| No Vehicle | 230 (26.5%) | 195 (20.3%) |
| 1 Vehicle | 218 (25.1%) | 432 (45.0%) |
| 2 Vehicles | 286 (33.0%) | 242 (25.2%) |
| 3 or more Vehicles | 133 (15.3%) | 92 (9.6%) |
| Total | 867 (100.0%) | 961 (100.0%) |
Real Estate & Mortgages in South Highpoint
Real Estate and Mortgage Overview in South Highpoint
| Characteristic | Without Mortgage | With Mortgage |
| Housing Units | 529 | 338 |
| Median Property Value | - | - |
| Median Household Income | - | - |
| Monthly Housing Costs | $702 | $0 |
| Real Estate Taxes | $1,413 | $21 |
Property Value by Mortgage Status in South Highpoint
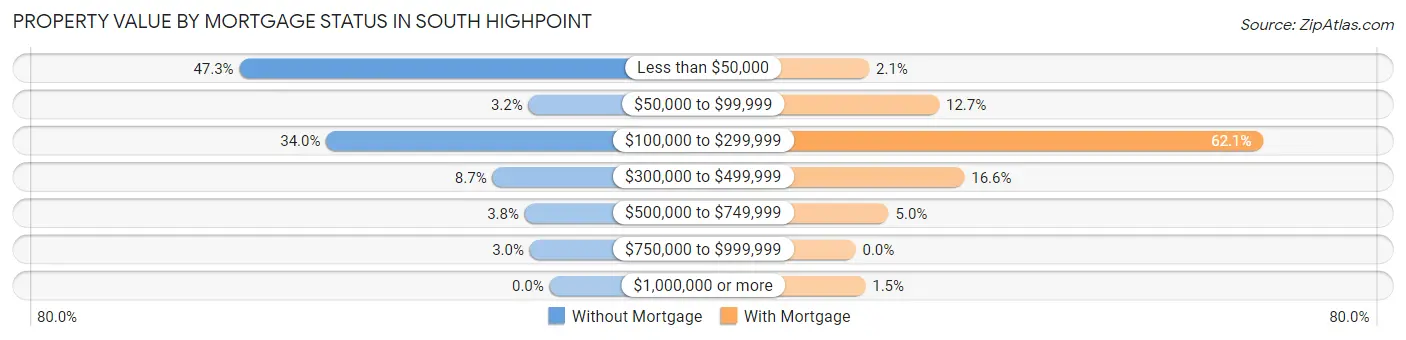
| Property Value | Without Mortgage | With Mortgage |
| Less than $50,000 | 250 (47.3%) | 7 (2.1%) |
| $50,000 to $99,999 | 17 (3.2%) | 43 (12.7%) |
| $100,000 to $299,999 | 180 (34.0%) | 210 (62.1%) |
| $300,000 to $499,999 | 46 (8.7%) | 56 (16.6%) |
| $500,000 to $749,999 | 20 (3.8%) | 17 (5.0%) |
| $750,000 to $999,999 | 16 (3.0%) | 0 (0.0%) |
| $1,000,000 or more | 0 (0.0%) | 5 (1.5%) |
| Total | 529 (100.0%) | 338 (100.0%) |
Household Income by Mortgage Status in South Highpoint
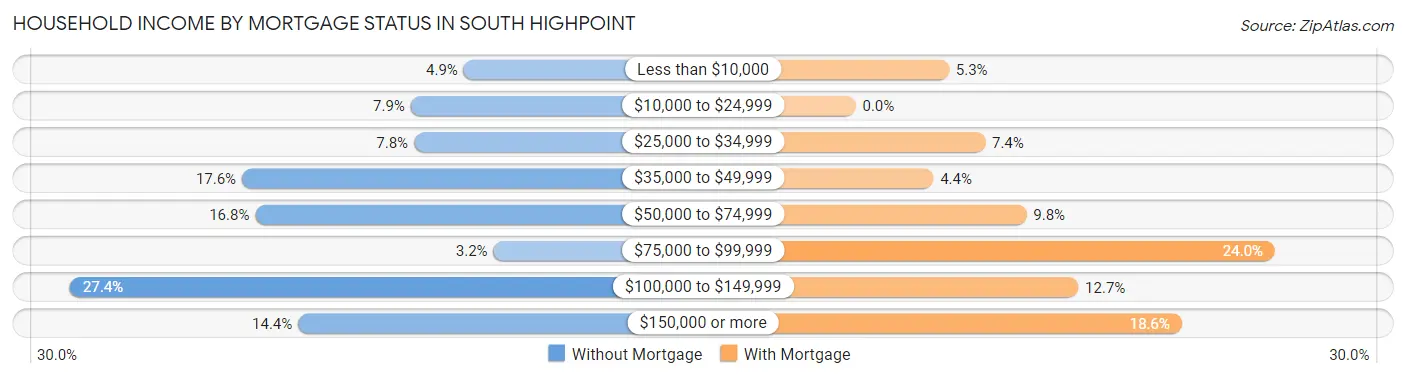
| Household Income | Without Mortgage | With Mortgage |
| Less than $10,000 | 26 (4.9%) | 18 (5.3%) |
| $10,000 to $24,999 | 42 (7.9%) | 0 (0.0%) |
| $25,000 to $34,999 | 41 (7.7%) | 25 (7.4%) |
| $35,000 to $49,999 | 93 (17.6%) | 15 (4.4%) |
| $50,000 to $74,999 | 89 (16.8%) | 33 (9.8%) |
| $75,000 to $99,999 | 17 (3.2%) | 81 (24.0%) |
| $100,000 to $149,999 | 145 (27.4%) | 43 (12.7%) |
| $150,000 or more | 76 (14.4%) | 63 (18.6%) |
| Total | 529 (100.0%) | 338 (100.0%) |
Property Value to Household Income Ratio in South Highpoint
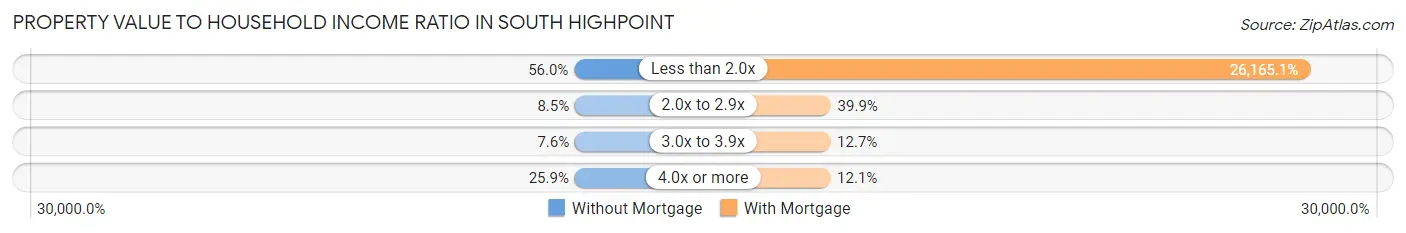
| Value-to-Income Ratio | Without Mortgage | With Mortgage |
| Less than 2.0x | 296 (55.9%) | 88,438 (26,165.1%) |
| 2.0x to 2.9x | 45 (8.5%) | 135 (39.9%) |
| 3.0x to 3.9x | 40 (7.6%) | 43 (12.7%) |
| 4.0x or more | 137 (25.9%) | 41 (12.1%) |
| Total | 529 (100.0%) | 338 (100.0%) |
Real Estate Taxes by Mortgage Status in South Highpoint
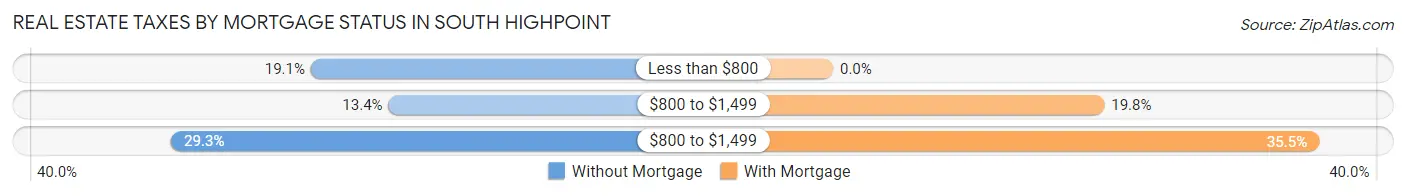
| Property Taxes | Without Mortgage | With Mortgage |
| Less than $800 | 101 (19.1%) | 0 (0.0%) |
| $800 to $1,499 | 71 (13.4%) | 67 (19.8%) |
| $800 to $1,499 | 155 (29.3%) | 120 (35.5%) |
| Total | 529 (100.0%) | 338 (100.0%) |
Health & Disability in South Highpoint
Health Insurance Coverage by Age in South Highpoint
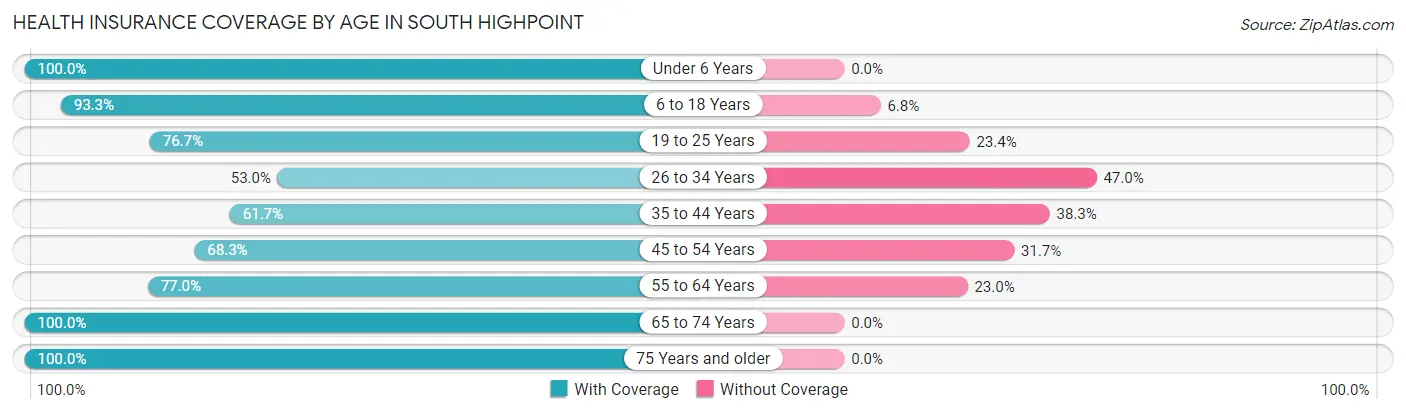
| Age Bracket | With Coverage | Without Coverage |
| Under 6 Years | 376 (100.0%) | 0 (0.0%) |
| 6 to 18 Years | 871 (93.2%) | 63 (6.8%) |
| 19 to 25 Years | 499 (76.6%) | 152 (23.4%) |
| 26 to 34 Years | 339 (53.0%) | 301 (47.0%) |
| 35 to 44 Years | 395 (61.7%) | 245 (38.3%) |
| 45 to 54 Years | 658 (68.3%) | 305 (31.7%) |
| 55 to 64 Years | 342 (77.0%) | 102 (23.0%) |
| 65 to 74 Years | 586 (100.0%) | 0 (0.0%) |
| 75 Years and older | 91 (100.0%) | 0 (0.0%) |
| Total | 4,157 (78.1%) | 1,168 (21.9%) |
Health Insurance Coverage by Citizenship Status in South Highpoint
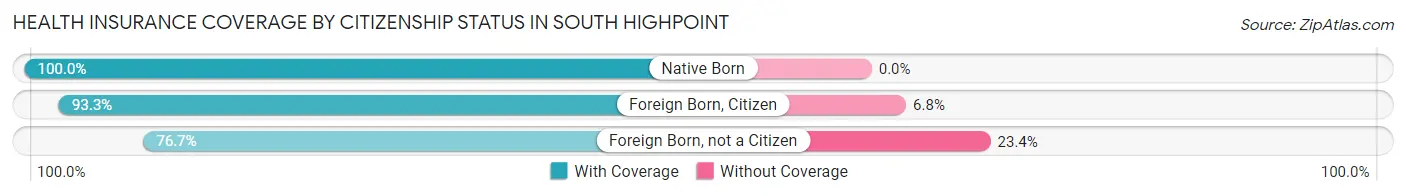
| Citizenship Status | With Coverage | Without Coverage |
| Native Born | 376 (100.0%) | 0 (0.0%) |
| Foreign Born, Citizen | 871 (93.2%) | 63 (6.8%) |
| Foreign Born, not a Citizen | 499 (76.6%) | 152 (23.4%) |
Health Insurance Coverage by Household Income in South Highpoint
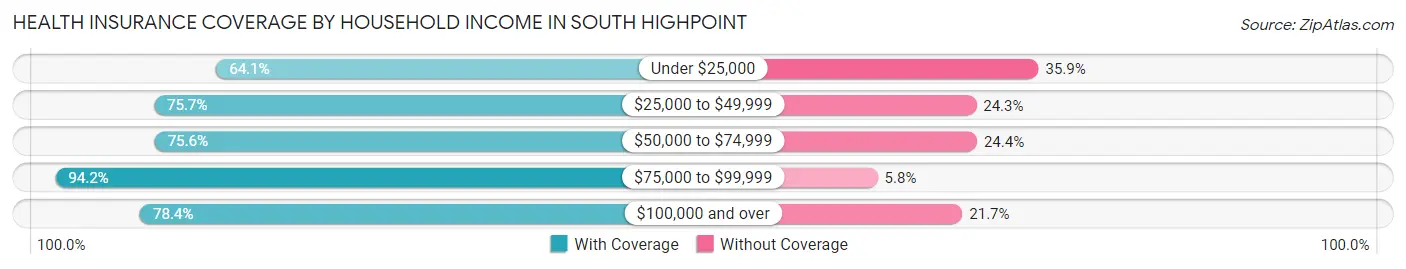
| Household Income | With Coverage | Without Coverage |
| Under $25,000 | 612 (64.1%) | 343 (35.9%) |
| $25,000 to $49,999 | 765 (75.7%) | 245 (24.3%) |
| $50,000 to $74,999 | 558 (75.6%) | 180 (24.4%) |
| $75,000 to $99,999 | 995 (94.2%) | 61 (5.8%) |
| $100,000 and over | 1,227 (78.3%) | 339 (21.6%) |
Public vs Private Health Insurance Coverage by Age in South Highpoint
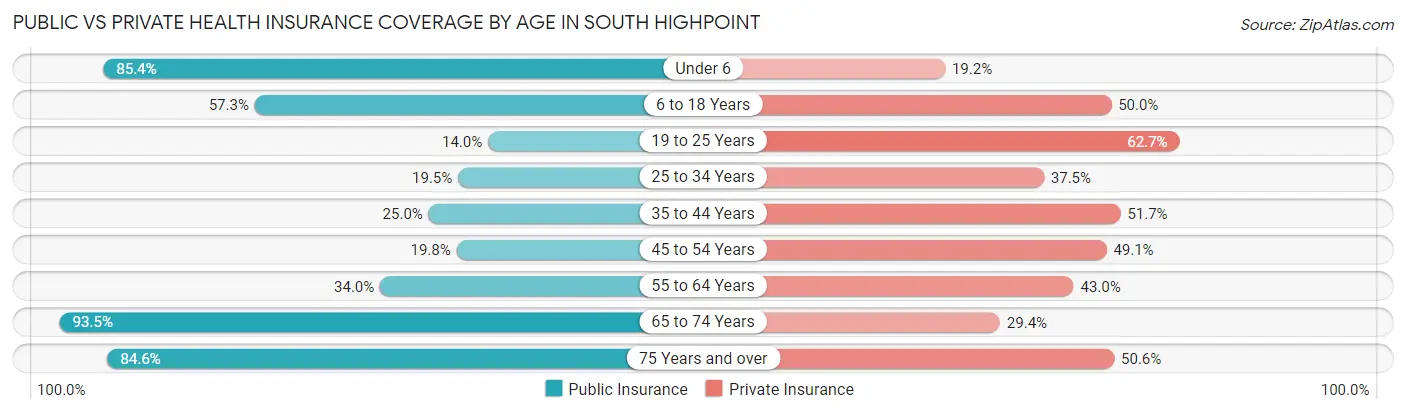
| Age Bracket | Public Insurance | Private Insurance |
| Under 6 | 321 (85.4%) | 72 (19.2%) |
| 6 to 18 Years | 535 (57.3%) | 467 (50.0%) |
| 19 to 25 Years | 91 (14.0%) | 408 (62.7%) |
| 25 to 34 Years | 125 (19.5%) | 240 (37.5%) |
| 35 to 44 Years | 160 (25.0%) | 331 (51.7%) |
| 45 to 54 Years | 191 (19.8%) | 473 (49.1%) |
| 55 to 64 Years | 151 (34.0%) | 191 (43.0%) |
| 65 to 74 Years | 548 (93.5%) | 172 (29.3%) |
| 75 Years and over | 77 (84.6%) | 46 (50.5%) |
| Total | 2,199 (41.3%) | 2,400 (45.1%) |
Disability Status by Sex by Age in South Highpoint
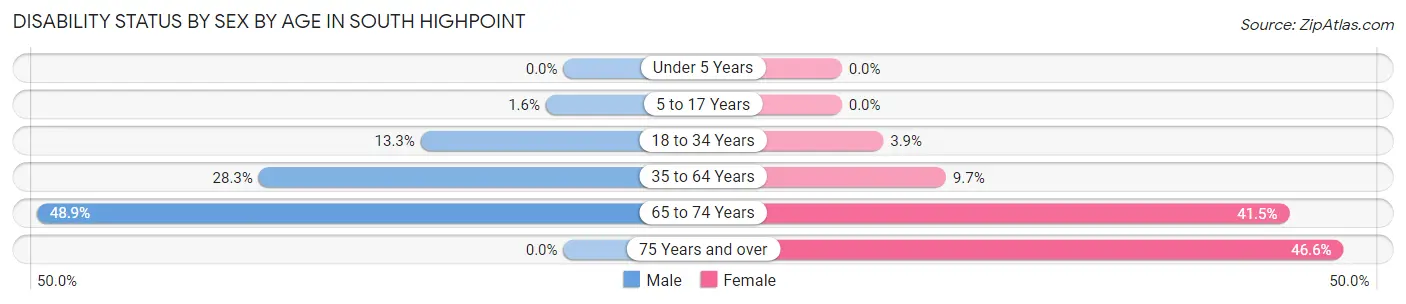
| Age Bracket | Male | Female |
| Under 5 Years | 0 (0.0%) | 0 (0.0%) |
| 5 to 17 Years | 7 (1.6%) | 0 (0.0%) |
| 18 to 34 Years | 82 (13.3%) | 26 (3.8%) |
| 35 to 64 Years | 295 (28.3%) | 97 (9.7%) |
| 65 to 74 Years | 171 (48.9%) | 98 (41.5%) |
| 75 Years and over | 0 (0.0%) | 27 (46.6%) |
Disability Class by Sex by Age in South Highpoint
Disability Class: Hearing Difficulty
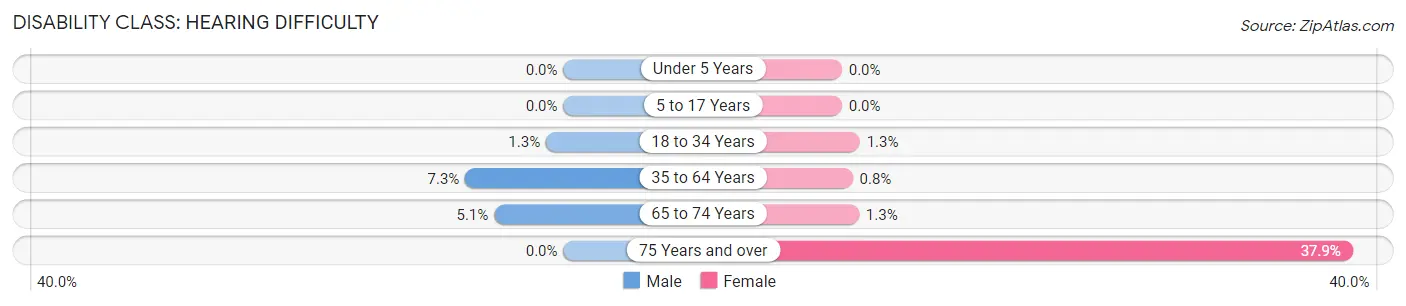
| Age Bracket | Male | Female |
| Under 5 Years | 0 (0.0%) | 0 (0.0%) |
| 5 to 17 Years | 0 (0.0%) | 0 (0.0%) |
| 18 to 34 Years | 8 (1.3%) | 9 (1.3%) |
| 35 to 64 Years | 76 (7.3%) | 8 (0.8%) |
| 65 to 74 Years | 18 (5.1%) | 3 (1.3%) |
| 75 Years and over | 0 (0.0%) | 22 (37.9%) |
Disability Class: Vision Difficulty
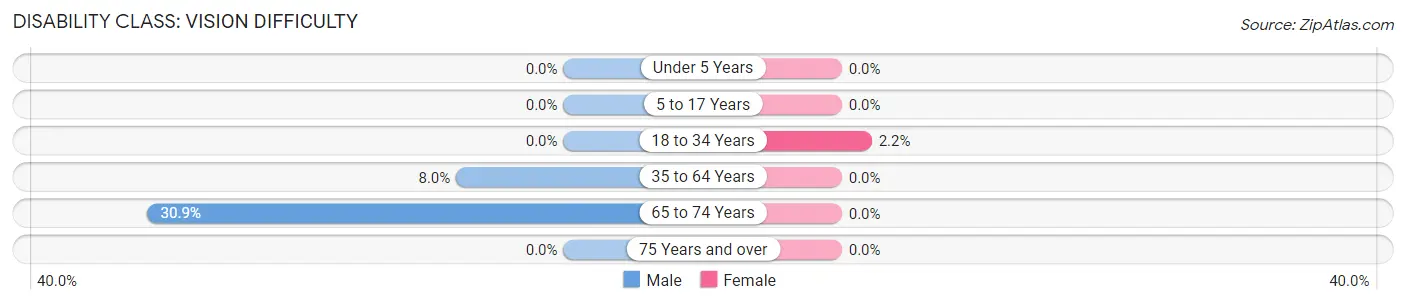
| Age Bracket | Male | Female |
| Under 5 Years | 0 (0.0%) | 0 (0.0%) |
| 5 to 17 Years | 0 (0.0%) | 0 (0.0%) |
| 18 to 34 Years | 0 (0.0%) | 15 (2.2%) |
| 35 to 64 Years | 83 (8.0%) | 0 (0.0%) |
| 65 to 74 Years | 108 (30.9%) | 0 (0.0%) |
| 75 Years and over | 0 (0.0%) | 0 (0.0%) |
Disability Class: Cognitive Difficulty
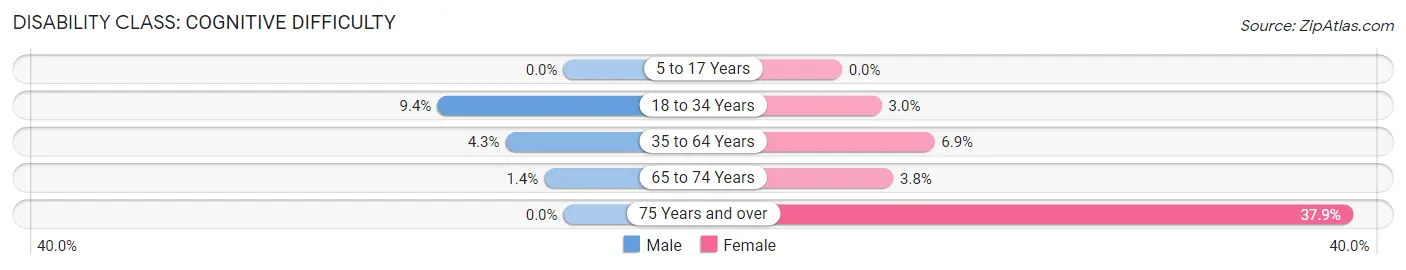
| Age Bracket | Male | Female |
| 5 to 17 Years | 0 (0.0%) | 0 (0.0%) |
| 18 to 34 Years | 58 (9.4%) | 20 (3.0%) |
| 35 to 64 Years | 45 (4.3%) | 69 (6.9%) |
| 65 to 74 Years | 5 (1.4%) | 9 (3.8%) |
| 75 Years and over | 0 (0.0%) | 22 (37.9%) |
Disability Class: Ambulatory Difficulty
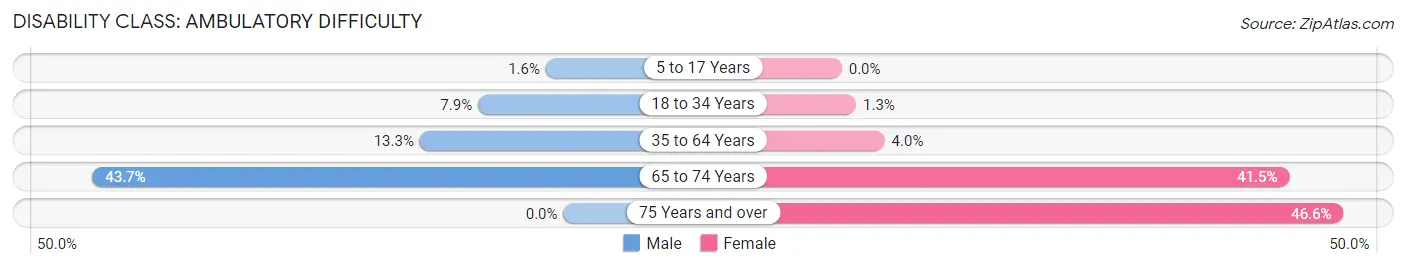
| Age Bracket | Male | Female |
| 5 to 17 Years | 7 (1.6%) | 0 (0.0%) |
| 18 to 34 Years | 49 (7.9%) | 9 (1.3%) |
| 35 to 64 Years | 139 (13.3%) | 40 (4.0%) |
| 65 to 74 Years | 153 (43.7%) | 98 (41.5%) |
| 75 Years and over | 0 (0.0%) | 27 (46.6%) |
Disability Class: Self-Care Difficulty
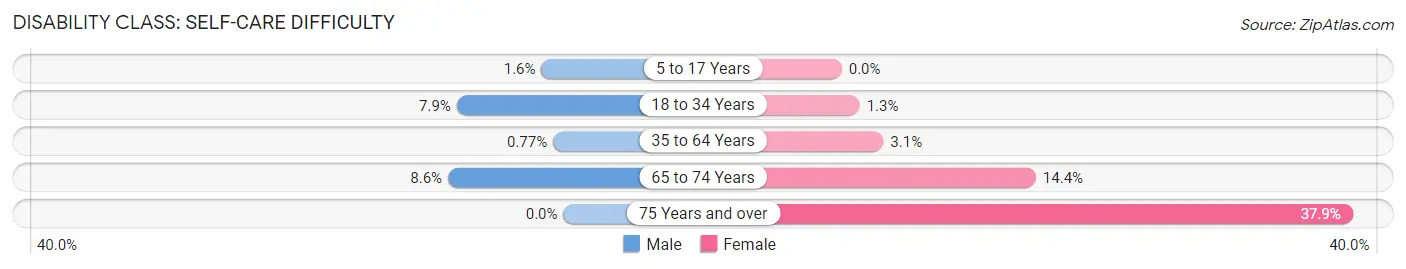
| Age Bracket | Male | Female |
| 5 to 17 Years | 7 (1.6%) | 0 (0.0%) |
| 18 to 34 Years | 49 (7.9%) | 9 (1.3%) |
| 35 to 64 Years | 8 (0.8%) | 31 (3.1%) |
| 65 to 74 Years | 30 (8.6%) | 34 (14.4%) |
| 75 Years and over | 0 (0.0%) | 22 (37.9%) |
Technology Access in South Highpoint
Computing Device Access in South Highpoint
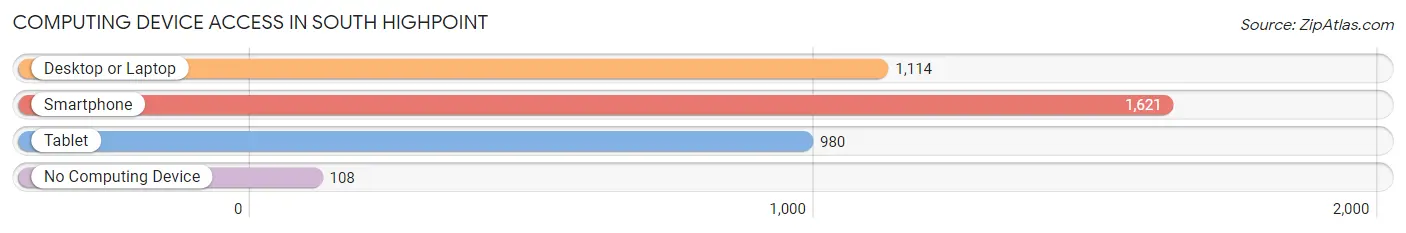
| Device Type | # Households | % Households |
| Desktop or Laptop | 1,114 | 60.9% |
| Smartphone | 1,621 | 88.7% |
| Tablet | 980 | 53.6% |
| No Computing Device | 108 | 5.9% |
| Total | 1,828 | 100.0% |
Internet Access in South Highpoint
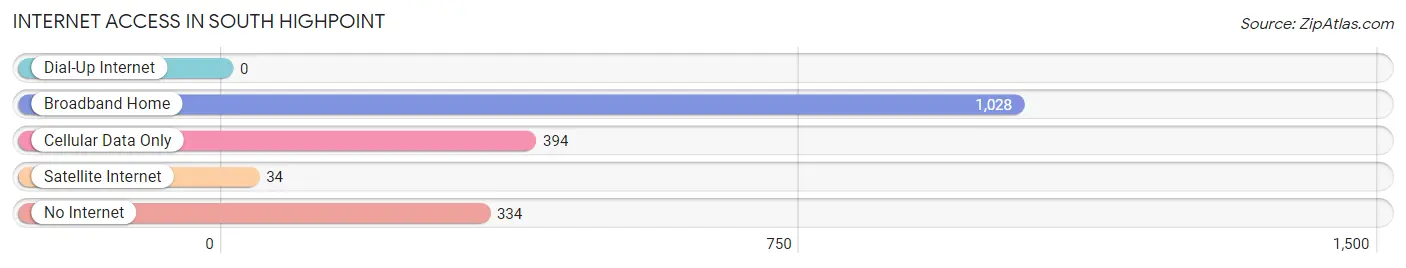
| Internet Type | # Households | % Households |
| Dial-Up Internet | 0 | 0.0% |
| Broadband Home | 1,028 | 56.2% |
| Cellular Data Only | 394 | 21.5% |
| Satellite Internet | 34 | 1.9% |
| No Internet | 334 | 18.3% |
| Total | 1,828 | 100.0% |
South Highpoint Summary
Highpoint is a census-designated place located in Hillsborough County, Florida. It is located in the southeastern part of the county, just north of Tampa. The population was 8,845 at the 2010 census.
History
Highpoint was first settled in the late 19th century by a group of settlers from Georgia. The area was originally known as "High Point" due to its elevation, which was higher than the surrounding area. The name was eventually changed to Highpoint. The area was largely rural until the 1950s, when it began to experience rapid growth due to its proximity to Tampa.
Geography
Highpoint is located at 28°1'25" North, 82°25'17" West (28.023, -82.421). It is situated in the southeastern part of Hillsborough County, just north of Tampa. The area is mostly flat, with an elevation of about 25 feet above sea level.
Economy
Highpoint has a diverse economy, with a mix of retail, manufacturing, and service industries. The largest employers in the area are the University of South Florida, Tampa General Hospital, and the Hillsborough County School District. Other major employers include Publix Super Markets, Walmart, and the Hillsborough County Sheriff's Office.
Demographics
As of the 2010 census, there were 8,845 people, 3,717 households, and 2,541 families residing in Highpoint. The population density was 1,845.3 people per square mile (715.3/km2). The racial makeup of the CDP was 68.2% White, 16.2% African American, 0.4% Native American, 5.2% Asian, 0.1% Pacific Islander, 5.3% from other races, and 4.6% from two or more races. Hispanic or Latino of any race were 16.2% of the population.
The median income for a household in Highpoint was $45,945, and the median income for a family was $54,945. Males had a median income of $37,945 versus $30,945 for females. The per capita income for the CDP was $22,945. About 8.2% of families and 10.2% of the population were below the poverty line, including 14.2% of those under age 18 and 6.2% of those age 65 or over.
Highpoint is a diverse community, with a mix of cultures and backgrounds. The area is home to a variety of churches, schools, and businesses. It is also home to a number of parks and recreational facilities, including the Highpoint Community Center.
Common Questions
What is Per Capita Income in South Highpoint?
Per Capita income in South Highpoint is $30,283.
What is the Median Family Income in South Highpoint?
Median Family Income in South Highpoint is $66,222.
What is the Median Household income in South Highpoint?
Median Household Income in South Highpoint is $51,316.
What is Income or Wage Gap in South Highpoint?
Income or Wage Gap in South Highpoint is 25.4%.
Women in South Highpoint earn 74.6 cents for every dollar earned by a man.
What is Family Income Deficit in South Highpoint?
Family Income Deficit in South Highpoint is $11,353.
Families that are below poverty line in South Highpoint earn $11,353 less on average than the poverty threshold level.
What is Inequality or Gini Index in South Highpoint?
Inequality or Gini Index in South Highpoint is 0.54.
What is the Total Population of South Highpoint?
Total Population of South Highpoint is 5,325.
What is the Total Male Population of South Highpoint?
Total Male Population of South Highpoint is 2,658.
What is the Total Female Population of South Highpoint?
Total Female Population of South Highpoint is 2,667.
What is the Ratio of Males per 100 Females in South Highpoint?
There are 99.66 Males per 100 Females in South Highpoint.
What is the Ratio of Females per 100 Males in South Highpoint?
There are 100.34 Females per 100 Males in South Highpoint.
What is the Median Population Age in South Highpoint?
Median Population Age in South Highpoint is 36.0 Years.
What is the Average Family Size in South Highpoint
Average Family Size in South Highpoint is 3.6 People.
What is the Average Household Size in South Highpoint
Average Household Size in South Highpoint is 2.9 People.
How Large is the Labor Force in South Highpoint?
There are 2,923 People in the Labor Forcein in South Highpoint.
What is the Percentage of People in the Labor Force in South Highpoint?
68.6% of People are in the Labor Force in South Highpoint.
What is the Unemployment Rate in South Highpoint?
Unemployment Rate in South Highpoint is 10.7%.