Palmyra, UT Map & Demographics
Palmyra Map
Palmyra Overview
$29,234
PER CAPITA INCOME
$69,750
AVG FAMILY INCOME
$69,000
AVG HOUSEHOLD INCOME
0.29
INEQUALITY / GINI INDEX
602
TOTAL POPULATION
356
MALE POPULATION
246
FEMALE POPULATION
144.72
MALES / 100 FEMALES
69.10
FEMALES / 100 MALES
29.6
MEDIAN AGE
3.4
AVG FAMILY SIZE
3.3
AVG HOUSEHOLD SIZE
224
LABOR FORCE [ PEOPLE ]
52.0%
PERCENT IN LABOR FORCE
5.4%
UNEMPLOYMENT RATE
Income in Palmyra
Income Overview in Palmyra
Per Capita Income in Palmyra is $29,234, while median incomes of families and households are $69,750 and $69,000 respectively.
| Characteristic | Number | Measure |
| Per Capita Income | 602 | $29,234 |
| Median Family Income | 172 | $69,750 |
| Mean Family Income | 172 | $96,577 |
| Median Household Income | 184 | $69,000 |
| Mean Household Income | 184 | $96,111 |
| Income Deficit | 172 | $0 |
| Wage / Income Gap (%) | 602 | 0.00% |
| Wage / Income Gap ($) | 602 | 100.00¢ per $1 |
| Gini / Inequality Index | 602 | 0.29 |
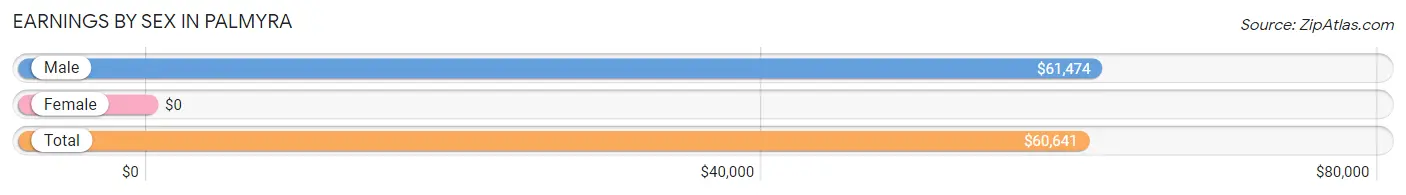
Earnings by Sex in Palmyra
| Sex | Number | Average Earnings |
| Male | 196 (81.0%) | $61,474 |
| Female | 46 (19.0%) | $0 |
| Total | 242 (100.0%) | $60,641 |
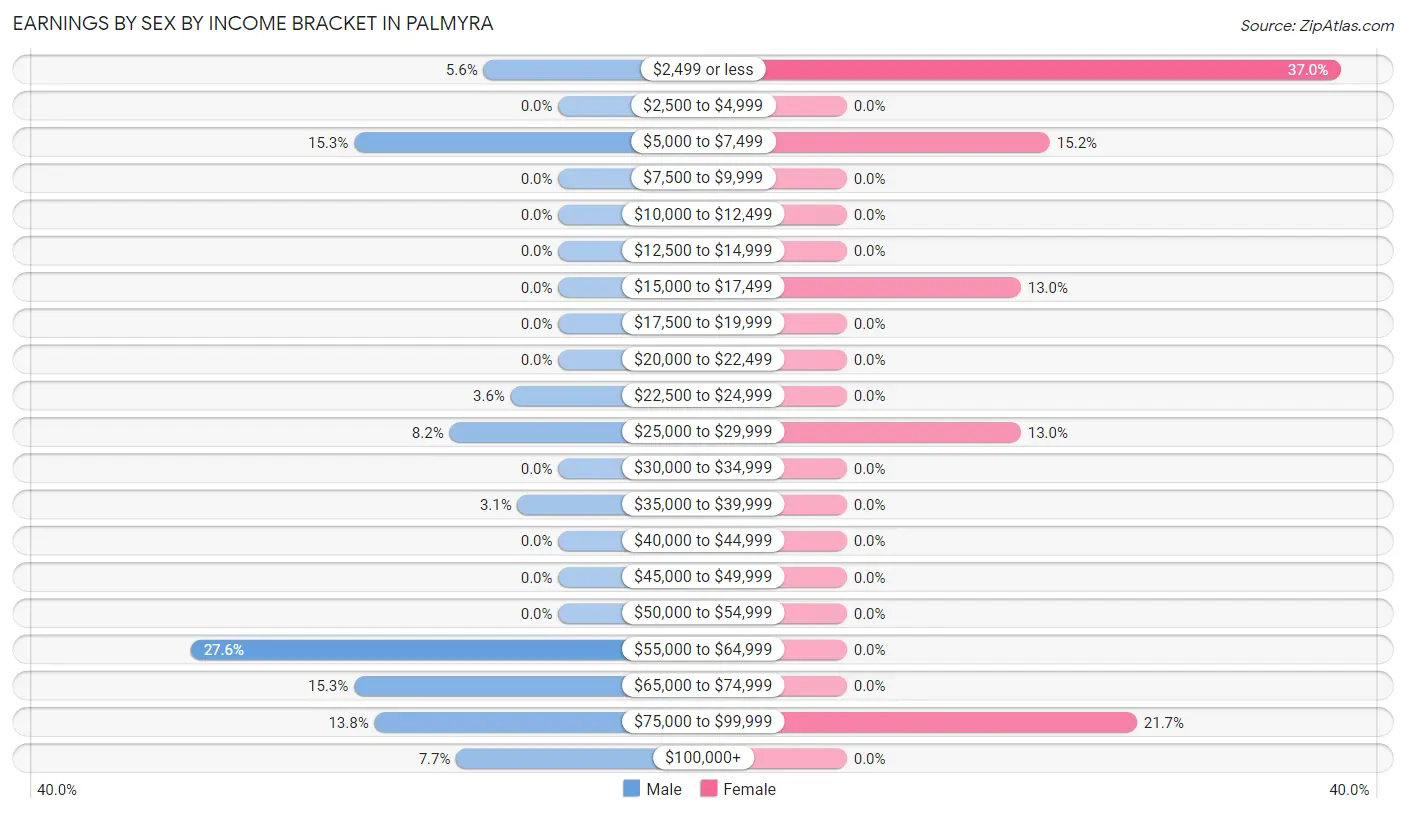
Earnings by Sex by Income Bracket in Palmyra
The most common earnings brackets in Palmyra are $55,000 to $64,999 for men (54 | 27.6%) and $2,499 or less for women (17 | 37.0%).
| Income | Male | Female |
| $2,499 or less | 11 (5.6%) | 17 (37.0%) |
| $2,500 to $4,999 | 0 (0.0%) | 0 (0.0%) |
| $5,000 to $7,499 | 30 (15.3%) | 7 (15.2%) |
| $7,500 to $9,999 | 0 (0.0%) | 0 (0.0%) |
| $10,000 to $12,499 | 0 (0.0%) | 0 (0.0%) |
| $12,500 to $14,999 | 0 (0.0%) | 0 (0.0%) |
| $15,000 to $17,499 | 0 (0.0%) | 6 (13.0%) |
| $17,500 to $19,999 | 0 (0.0%) | 0 (0.0%) |
| $20,000 to $22,499 | 0 (0.0%) | 0 (0.0%) |
| $22,500 to $24,999 | 7 (3.6%) | 0 (0.0%) |
| $25,000 to $29,999 | 16 (8.2%) | 6 (13.0%) |
| $30,000 to $34,999 | 0 (0.0%) | 0 (0.0%) |
| $35,000 to $39,999 | 6 (3.1%) | 0 (0.0%) |
| $40,000 to $44,999 | 0 (0.0%) | 0 (0.0%) |
| $45,000 to $49,999 | 0 (0.0%) | 0 (0.0%) |
| $50,000 to $54,999 | 0 (0.0%) | 0 (0.0%) |
| $55,000 to $64,999 | 54 (27.6%) | 0 (0.0%) |
| $65,000 to $74,999 | 30 (15.3%) | 0 (0.0%) |
| $75,000 to $99,999 | 27 (13.8%) | 10 (21.7%) |
| $100,000+ | 15 (7.6%) | 0 (0.0%) |
| Total | 196 (100.0%) | 46 (100.0%) |
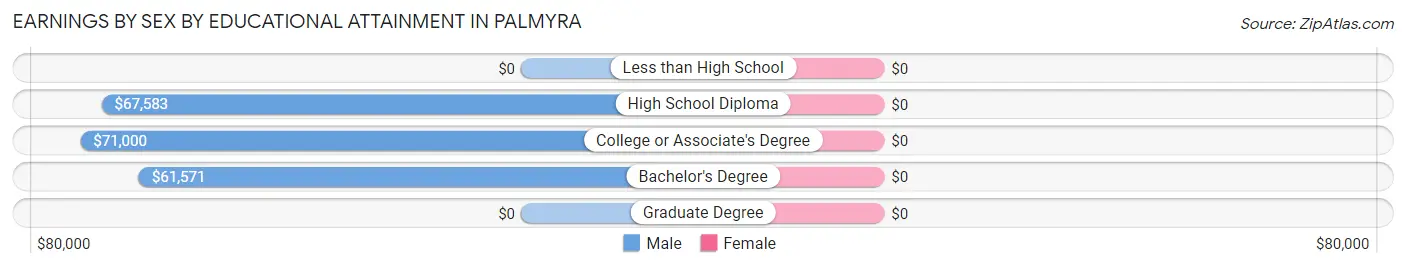
Earnings by Sex by Educational Attainment in Palmyra
| Educational Attainment | Male Income | Female Income |
| Less than High School | - | - |
| High School Diploma | $67,583 | $0 |
| College or Associate's Degree | $71,000 | $0 |
| Bachelor's Degree | $61,571 | $0 |
| Graduate Degree | - | - |
| Total | $62,404 | $0 |
Family Income in Palmyra
Family Income Brackets in Palmyra
According to the Palmyra family income data, there are 75 families falling into the $50,000 to $74,999 income range, which is the most common income bracket and makes up 43.6% of all families.
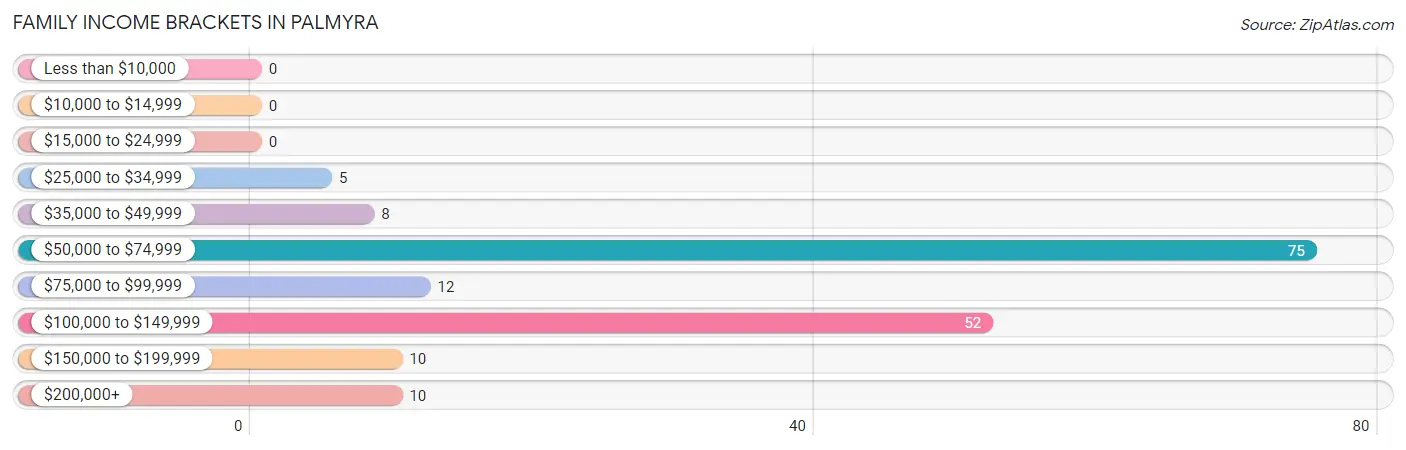
| Income Bracket | # Families | % Families |
| Less than $10,000 | 0 | 0.0% |
| $10,000 to $14,999 | 0 | 0.0% |
| $15,000 to $24,999 | 0 | 0.0% |
| $25,000 to $34,999 | 5 | 2.9% |
| $35,000 to $49,999 | 8 | 4.7% |
| $50,000 to $74,999 | 75 | 43.6% |
| $75,000 to $99,999 | 12 | 7.0% |
| $100,000 to $149,999 | 52 | 30.2% |
| $150,000 to $199,999 | 10 | 5.8% |
| $200,000+ | 10 | 5.8% |
Family Income by Famaliy Size in Palmyra
2-person families (60 | 34.9%) account for the highest median family income in Palmyra with $118,000 per family, while 2-person families (60 | 34.9%) have the highest median income of $59,000 per family member.
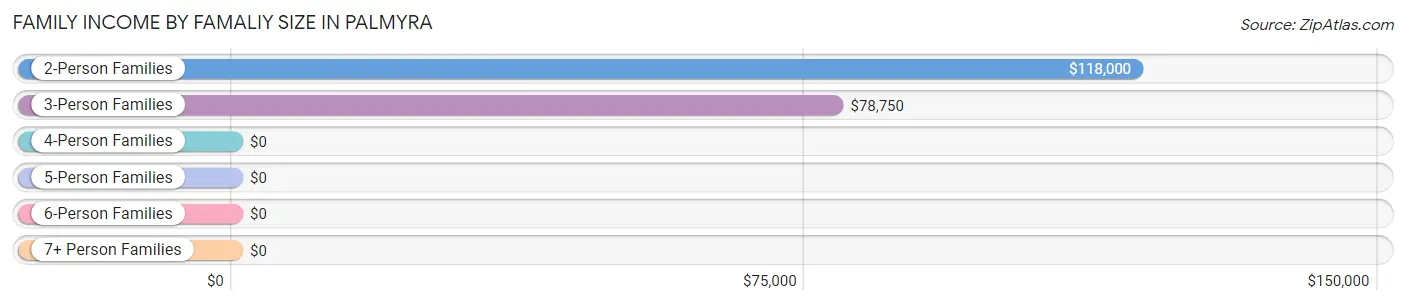
| Income Bracket | # Families | Median Income |
| 2-Person Families | 60 (34.9%) | $118,000 |
| 3-Person Families | 30 (17.4%) | $78,750 |
| 4-Person Families | 50 (29.1%) | $0 |
| 5-Person Families | 20 (11.6%) | $0 |
| 6-Person Families | 12 (7.0%) | $0 |
| 7+ Person Families | 0 (0.0%) | $0 |
| Total | 172 (100.0%) | $69,750 |
Family Income by Number of Earners in Palmyra
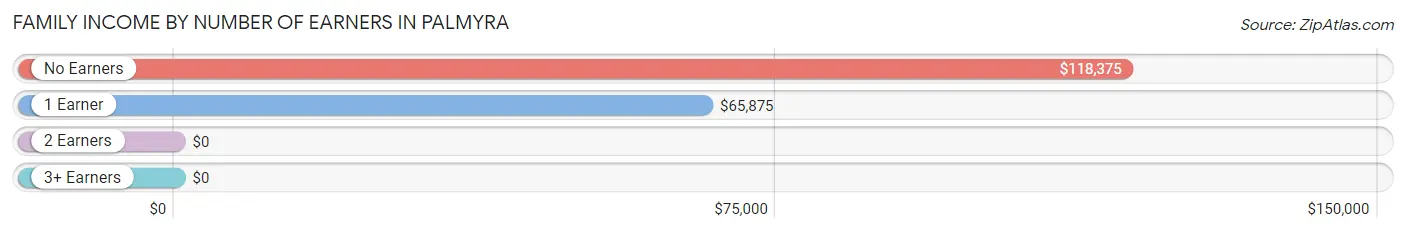
| Number of Earners | # Families | Median Income |
| No Earners | 23 (13.4%) | $118,375 |
| 1 Earner | 107 (62.2%) | $65,875 |
| 2 Earners | 20 (11.6%) | $0 |
| 3+ Earners | 22 (12.8%) | $0 |
| Total | 172 (100.0%) | $69,750 |
Household Income in Palmyra
Household Income Brackets in Palmyra
With 75 households falling in the category, the $50,000 to $74,999 income range is the most frequent in Palmyra, accounting for 40.8% of all households.
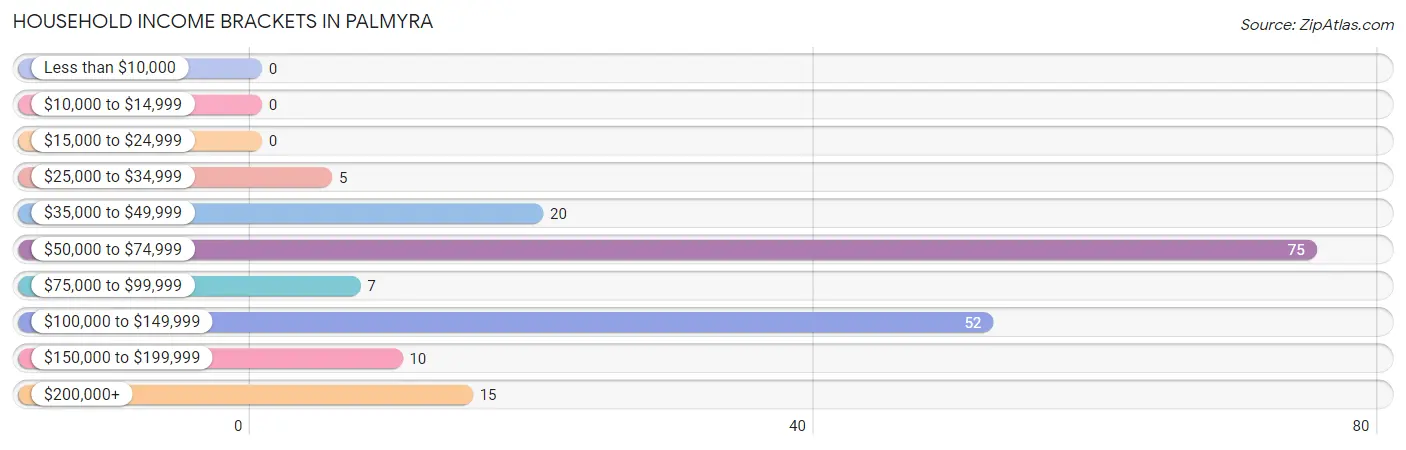
| Income Bracket | # Households | % Households |
| Less than $10,000 | 0 | 0.0% |
| $10,000 to $14,999 | 0 | 0.0% |
| $15,000 to $24,999 | 0 | 0.0% |
| $25,000 to $34,999 | 5 | 2.7% |
| $35,000 to $49,999 | 20 | 10.9% |
| $50,000 to $74,999 | 75 | 40.8% |
| $75,000 to $99,999 | 7 | 3.8% |
| $100,000 to $149,999 | 52 | 28.3% |
| $150,000 to $199,999 | 10 | 5.4% |
| $200,000+ | 15 | 8.2% |
Household Income by Householder Age in Palmyra
The median household income in Palmyra is $69,000, with the highest median household income of $131,985 found in the 45 to 64 years age bracket for the primary householder. A total of 47 households (25.5%) fall into this category.
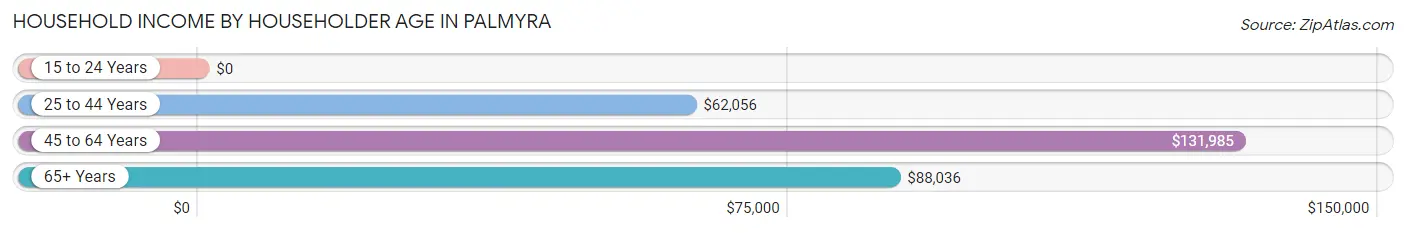
| Income Bracket | # Households | Median Income |
| 15 to 24 Years | 0 (0.0%) | $0 |
| 25 to 44 Years | 86 (46.7%) | $62,056 |
| 45 to 64 Years | 47 (25.5%) | $131,985 |
| 65+ Years | 51 (27.7%) | $88,036 |
| Total | 184 (100.0%) | $69,000 |
Poverty in Palmyra
Income Below Poverty by Sex and Age in Palmyra
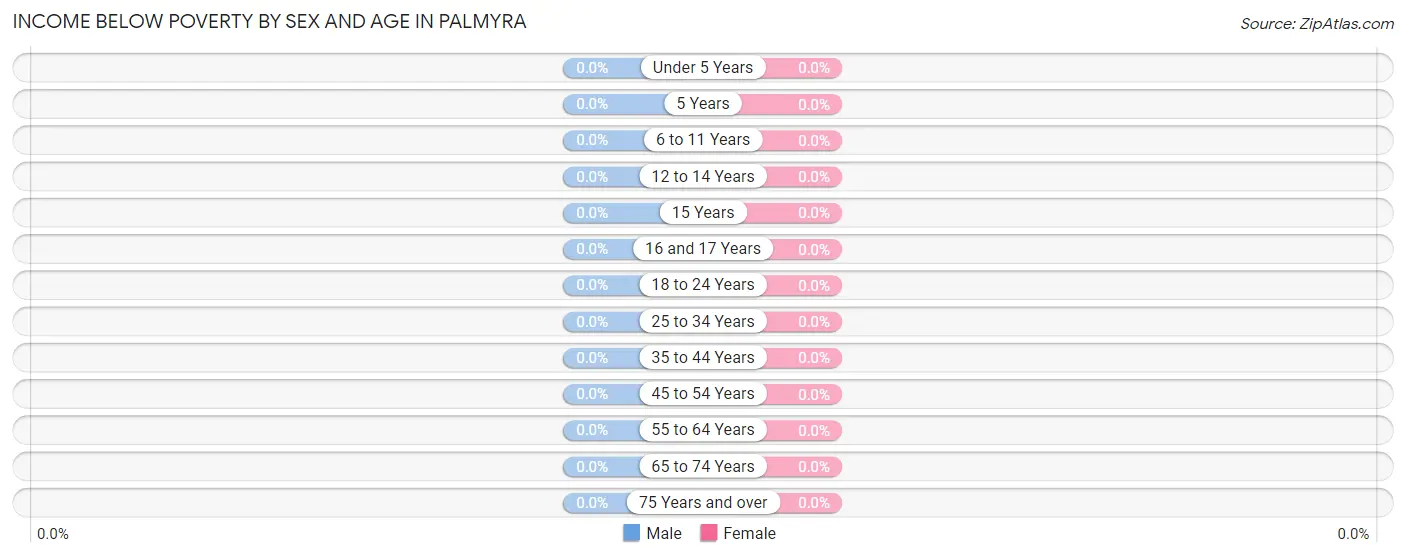
| Age Bracket | Male | Female |
| Under 5 Years | 0 (0.0%) | 0 (0.0%) |
| 5 Years | 0 (0.0%) | 0 (0.0%) |
| 6 to 11 Years | 0 (0.0%) | 0 (0.0%) |
| 12 to 14 Years | 0 (0.0%) | 0 (0.0%) |
| 15 Years | 0 (0.0%) | 0 (0.0%) |
| 16 and 17 Years | 0 (0.0%) | 0 (0.0%) |
| 18 to 24 Years | 0 (0.0%) | 0 (0.0%) |
| 25 to 34 Years | 0 (0.0%) | 0 (0.0%) |
| 35 to 44 Years | 0 (0.0%) | 0 (0.0%) |
| 45 to 54 Years | 0 (0.0%) | 0 (0.0%) |
| 55 to 64 Years | 0 (0.0%) | 0 (0.0%) |
| 65 to 74 Years | 0 (0.0%) | 0 (0.0%) |
| 75 Years and over | 0 (0.0%) | 0 (0.0%) |
| Total | 0 (0.0%) | 0 (0.0%) |
Income Above Poverty by Sex and Age in Palmyra
According to the poverty statistics in Palmyra, males aged under 5 years and females aged under 5 years are the age groups that are most secure financially, with 100.0% of males and 100.0% of females in these age groups living above the poverty line.
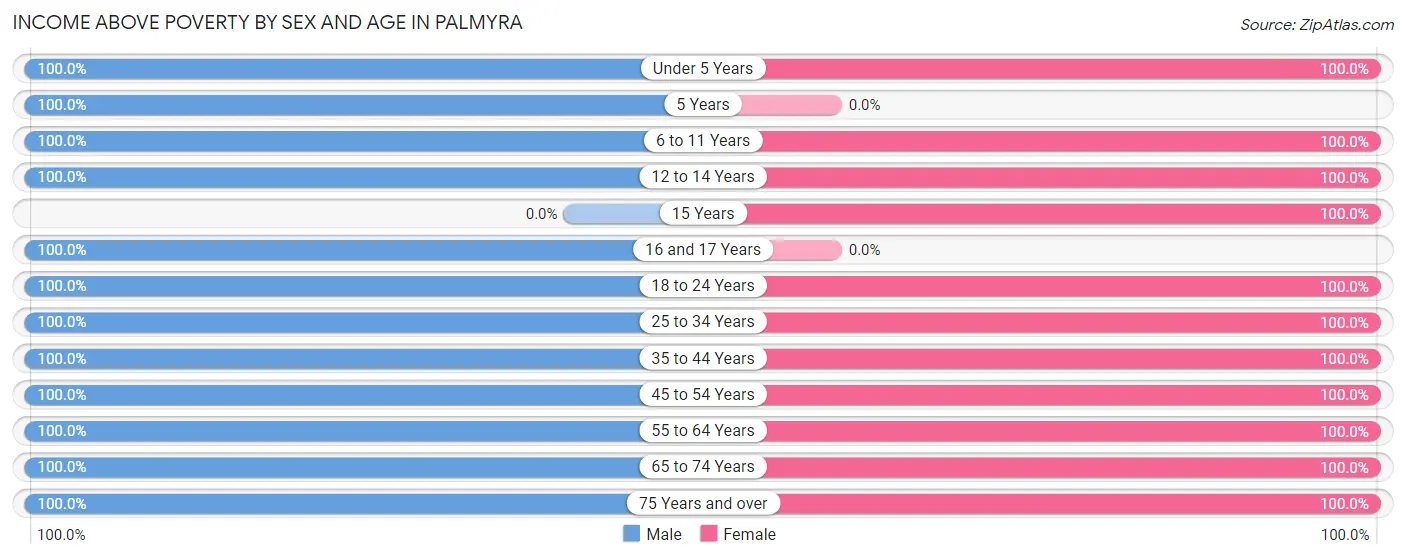
| Age Bracket | Male | Female |
| Under 5 Years | 86 (100.0%) | 43 (100.0%) |
| 5 Years | 6 (100.0%) | 0 (0.0%) |
| 6 to 11 Years | 10 (100.0%) | 5 (100.0%) |
| 12 to 14 Years | 5 (100.0%) | 11 (100.0%) |
| 15 Years | 0 (0.0%) | 5 (100.0%) |
| 16 and 17 Years | 6 (100.0%) | 0 (0.0%) |
| 18 to 24 Years | 31 (100.0%) | 34 (100.0%) |
| 25 to 34 Years | 76 (100.0%) | 50 (100.0%) |
| 35 to 44 Years | 20 (100.0%) | 30 (100.0%) |
| 45 to 54 Years | 27 (100.0%) | 5 (100.0%) |
| 55 to 64 Years | 32 (100.0%) | 31 (100.0%) |
| 65 to 74 Years | 39 (100.0%) | 27 (100.0%) |
| 75 Years and over | 18 (100.0%) | 5 (100.0%) |
| Total | 356 (100.0%) | 246 (100.0%) |
Income Below Poverty Among Married-Couple Families in Palmyra
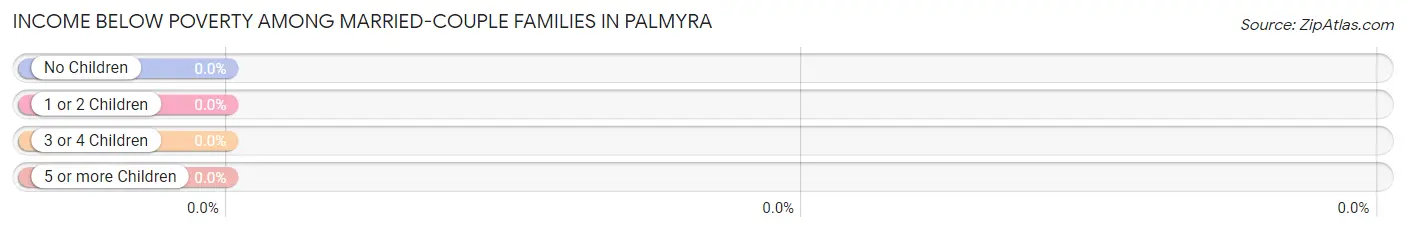
| Children | Above Poverty | Below Poverty |
| No Children | 62 (100.0%) | 0 (0.0%) |
| 1 or 2 Children | 75 (100.0%) | 0 (0.0%) |
| 3 or 4 Children | 15 (100.0%) | 0 (0.0%) |
| 5 or more Children | 0 (0.0%) | 0 (0.0%) |
| Total | 152 (100.0%) | 0 (0.0%) |
Income Below Poverty Among Single-Parent Households in Palmyra
| Children | Single Father | Single Mother |
| No Children | 0 (0.0%) | 0 (0.0%) |
| 1 or 2 Children | 0 (0.0%) | 0 (0.0%) |
| 3 or 4 Children | 0 (0.0%) | 0 (0.0%) |
| 5 or more Children | 0 (0.0%) | 0 (0.0%) |
| Total | 0 (0.0%) | 0 (0.0%) |
Income Below Poverty Among Married-Couple vs Single-Parent Households in Palmyra
| Children | Married-Couple Families | Single-Parent Households |
| No Children | 0 (0.0%) | 0 (0.0%) |
| 1 or 2 Children | 0 (0.0%) | 0 (0.0%) |
| 3 or 4 Children | 0 (0.0%) | 0 (0.0%) |
| 5 or more Children | 0 (0.0%) | 0 (0.0%) |
| Total | 0 (0.0%) | 0 (0.0%) |
Race in Palmyra
The most populous races in Palmyra are White / Caucasian (602 | 100.0%), and Hispanic or Latino (11 | 1.8%).
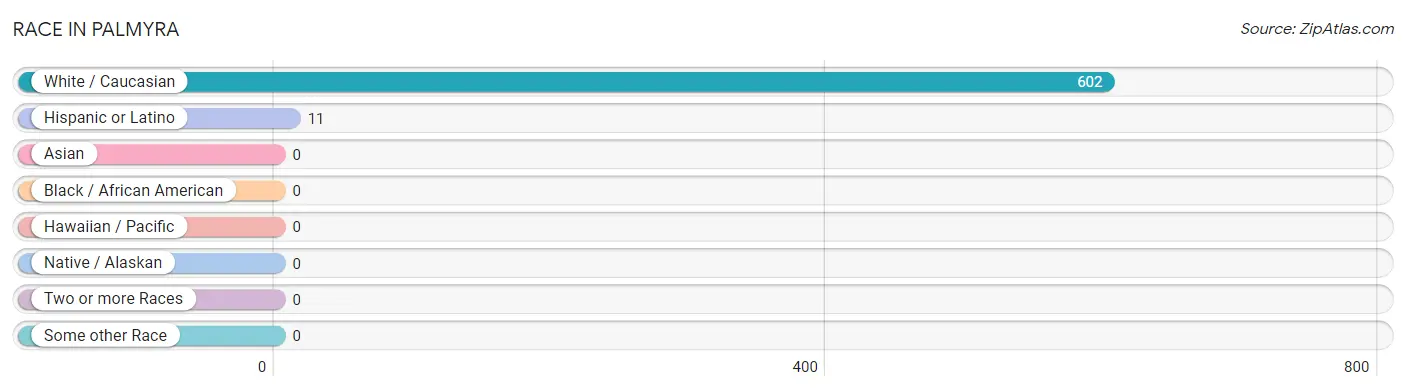
| Race | # Population | % Population |
| Asian | 0 | 0.0% |
| Black / African American | 0 | 0.0% |
| Hawaiian / Pacific | 0 | 0.0% |
| Hispanic or Latino | 11 | 1.8% |
| Native / Alaskan | 0 | 0.0% |
| White / Caucasian | 602 | 100.0% |
| Two or more Races | 0 | 0.0% |
| Some other Race | 0 | 0.0% |
| Total | 602 | 100.0% |
Ancestry in Palmyra
The most populous ancestries reported in Palmyra are English (311 | 51.7%), German (117 | 19.4%), Danish (55 | 9.1%), Norwegian (43 | 7.1%), and Irish (41 | 6.8%), together accounting for 94.2% of all Palmyra residents.
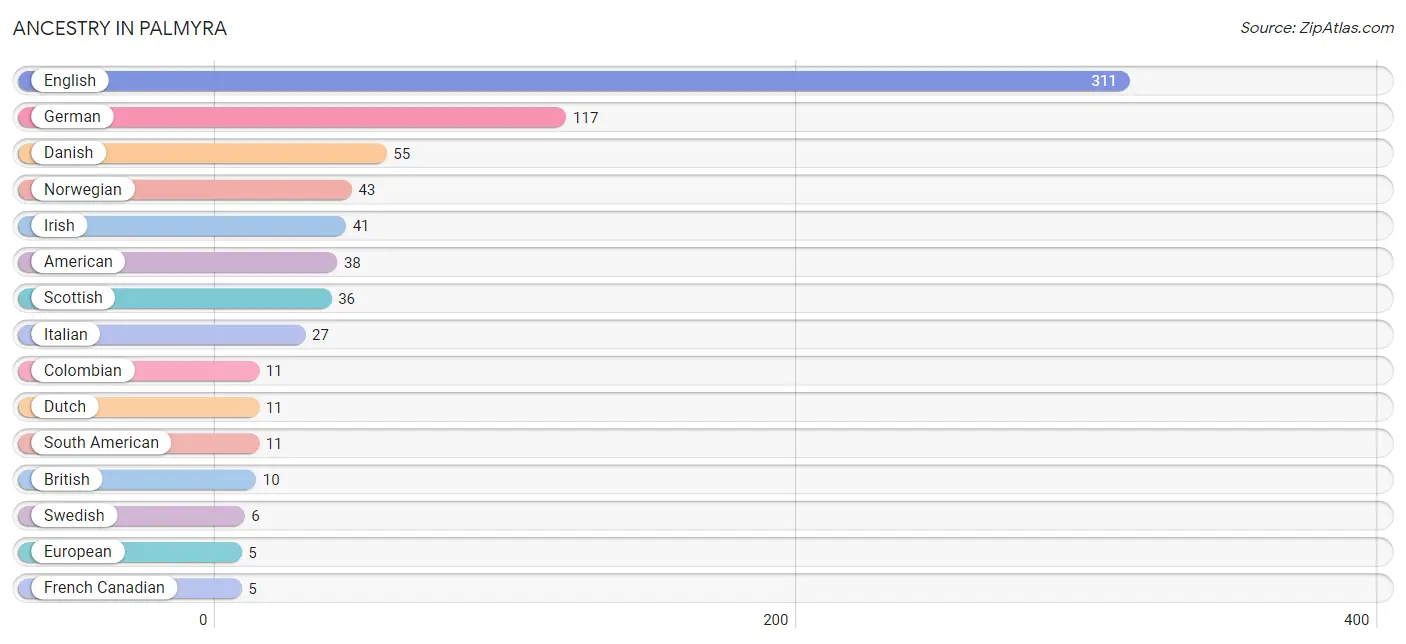
| Ancestry | # Population | % Population |
| American | 38 | 6.3% |
| British | 10 | 1.7% |
| Colombian | 11 | 1.8% |
| Danish | 55 | 9.1% |
| Dutch | 11 | 1.8% |
| English | 311 | 51.7% |
| European | 5 | 0.8% |
| French Canadian | 5 | 0.8% |
| German | 117 | 19.4% |
| Irish | 41 | 6.8% |
| Italian | 27 | 4.5% |
| Norwegian | 43 | 7.1% |
| Scottish | 36 | 6.0% |
| South American | 11 | 1.8% |
| Swedish | 6 | 1.0% | View All 15 Rows |
Immigrants in Palmyra
The most numerous immigrant groups reported in Palmyra came from Colombia (11 | 1.8%), Latin America (11 | 1.8%), and South America (11 | 1.8%), together accounting for 5.5% of all Palmyra residents.
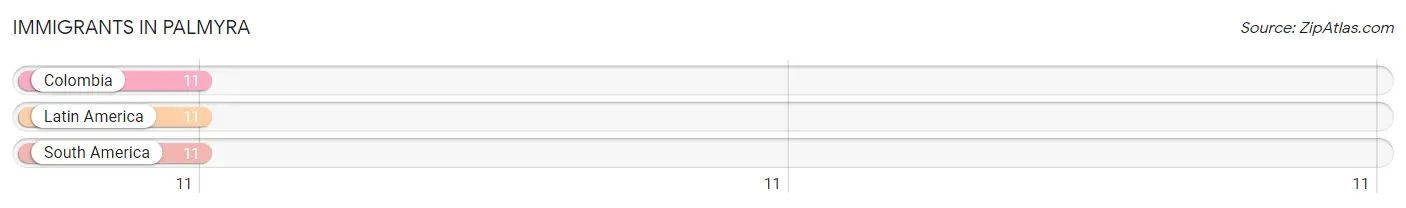
| Immigration Origin | # Population | % Population |
| Colombia | 11 | 1.8% |
| Latin America | 11 | 1.8% |
| South America | 11 | 1.8% | View All 3 Rows |
Sex and Age in Palmyra
Sex and Age in Palmyra
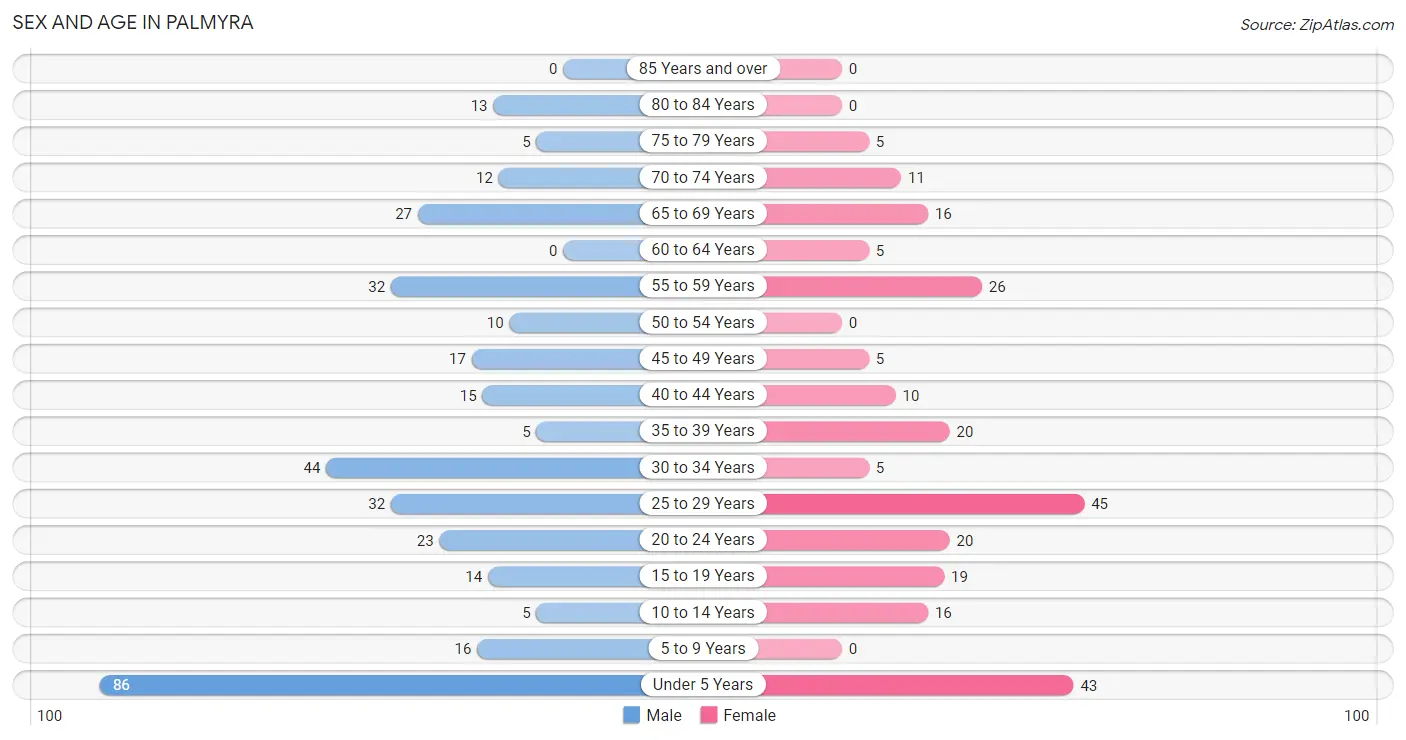
The most populous age groups in Palmyra are Under 5 Years (86 | 24.2%) for men and 25 to 29 Years (45 | 18.3%) for women.
| Age Bracket | Male | Female |
| Under 5 Years | 86 (24.2%) | 43 (17.5%) |
| 5 to 9 Years | 16 (4.5%) | 0 (0.0%) |
| 10 to 14 Years | 5 (1.4%) | 16 (6.5%) |
| 15 to 19 Years | 14 (3.9%) | 19 (7.7%) |
| 20 to 24 Years | 23 (6.5%) | 20 (8.1%) |
| 25 to 29 Years | 32 (9.0%) | 45 (18.3%) |
| 30 to 34 Years | 44 (12.4%) | 5 (2.0%) |
| 35 to 39 Years | 5 (1.4%) | 20 (8.1%) |
| 40 to 44 Years | 15 (4.2%) | 10 (4.1%) |
| 45 to 49 Years | 17 (4.8%) | 5 (2.0%) |
| 50 to 54 Years | 10 (2.8%) | 0 (0.0%) |
| 55 to 59 Years | 32 (9.0%) | 26 (10.6%) |
| 60 to 64 Years | 0 (0.0%) | 5 (2.0%) |
| 65 to 69 Years | 27 (7.6%) | 16 (6.5%) |
| 70 to 74 Years | 12 (3.4%) | 11 (4.5%) |
| 75 to 79 Years | 5 (1.4%) | 5 (2.0%) |
| 80 to 84 Years | 13 (3.6%) | 0 (0.0%) |
| 85 Years and over | 0 (0.0%) | 0 (0.0%) |
| Total | 356 (100.0%) | 246 (100.0%) |
Families and Households in Palmyra
Median Family Size in Palmyra
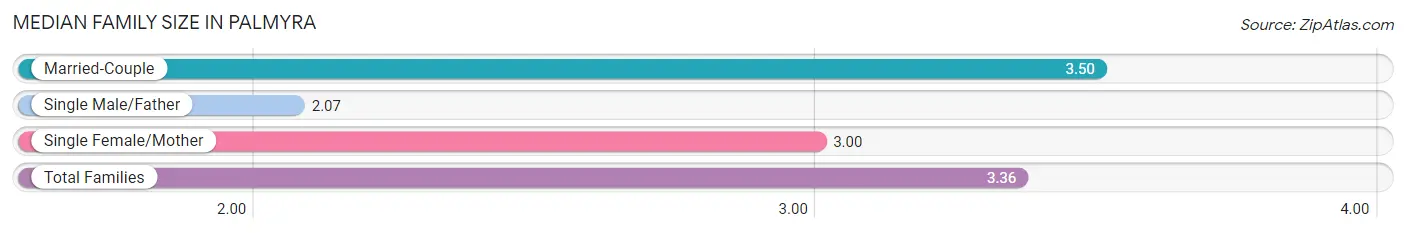
The median family size in Palmyra is 3.36 persons per family, with married-couple families (152 | 88.4%) accounting for the largest median family size of 3.5 persons per family. On the other hand, single male/father families (15 | 8.7%) represent the smallest median family size with 2.07 persons per family.
| Family Type | # Families | Family Size |
| Married-Couple | 152 (88.4%) | 3.50 |
| Single Male/Father | 15 (8.7%) | 2.07 |
| Single Female/Mother | 5 (2.9%) | 3.00 |
| Total Families | 172 (100.0%) | 3.36 |
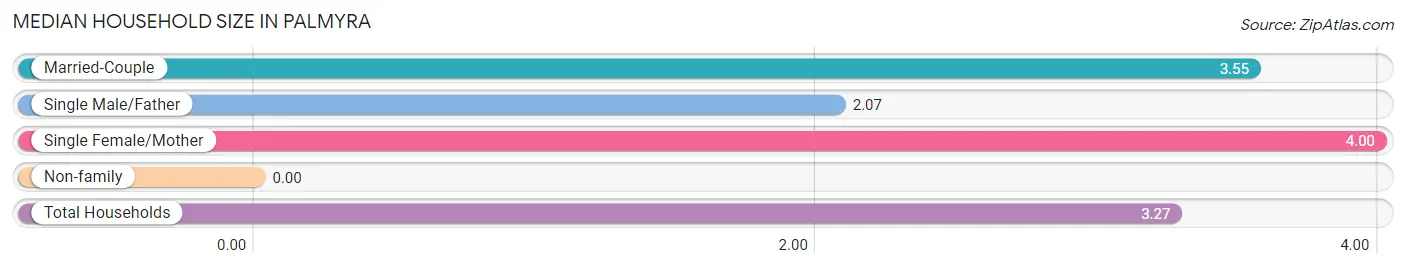
Median Household Size in Palmyra
| Household Type | # Households | Household Size |
| Married-Couple | 152 (82.6%) | 3.55 |
| Single Male/Father | 15 (8.2%) | 2.07 |
| Single Female/Mother | 5 (2.7%) | 4.00 |
| Non-family | 12 (6.5%) | - |
| Total Households | 184 (100.0%) | 3.27 |
Household Size by Marriage Status in Palmyra
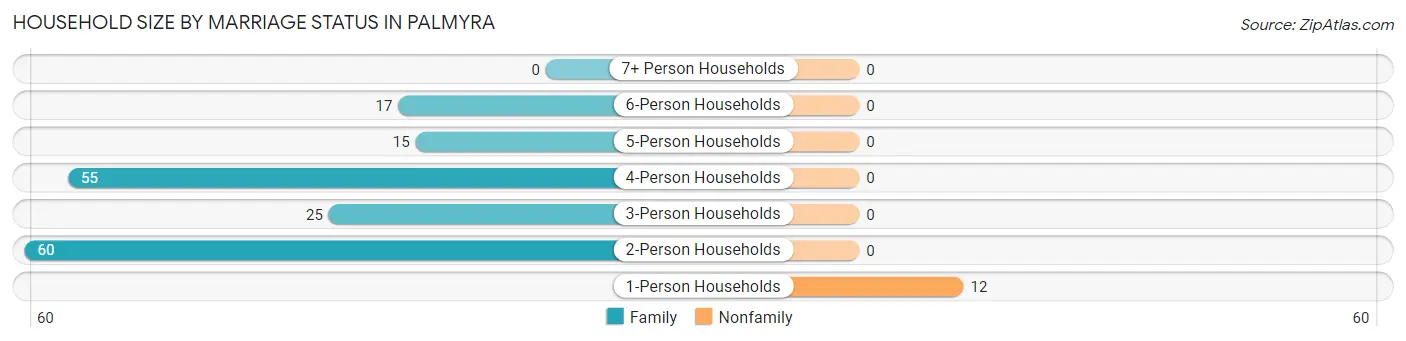
Out of a total of 184 households in Palmyra, 172 (93.5%) are family households, while 12 (6.5%) are nonfamily households. The most numerous type of family households are 2-person households, comprising 60, and the most common type of nonfamily households are 1-person households, comprising 12.
| Household Size | Family Households | Nonfamily Households |
| 1-Person Households | - | 12 (6.5%) |
| 2-Person Households | 60 (32.6%) | 0 (0.0%) |
| 3-Person Households | 25 (13.6%) | 0 (0.0%) |
| 4-Person Households | 55 (29.9%) | 0 (0.0%) |
| 5-Person Households | 15 (8.2%) | 0 (0.0%) |
| 6-Person Households | 17 (9.2%) | 0 (0.0%) |
| 7+ Person Households | 0 (0.0%) | 0 (0.0%) |
| Total | 172 (93.5%) | 12 (6.5%) |
Female Fertility in Palmyra
Fertility by Age in Palmyra
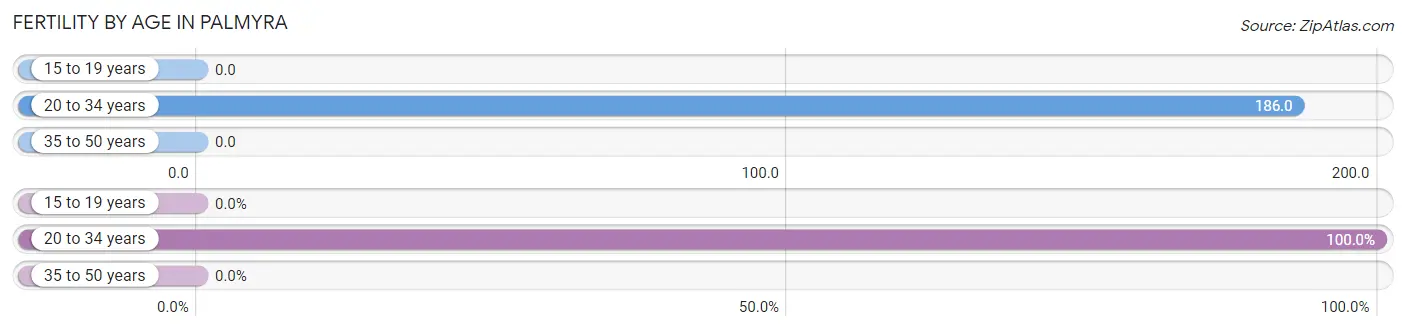
Average fertility rate in Palmyra is 105.0 births per 1,000 women. Women in the age bracket of 20 to 34 years have the highest fertility rate with 186.0 births per 1,000 women. Women in the age bracket of 20 to 34 years acount for 100.0% of all women with births.
| Age Bracket | Women with Births | Births / 1,000 Women |
| 15 to 19 years | 0 (0.0%) | 0.0 |
| 20 to 34 years | 13 (100.0%) | 186.0 |
| 35 to 50 years | 0 (0.0%) | 0.0 |
| Total | 13 (100.0%) | 105.0 |
Fertility by Age by Marriage Status in Palmyra
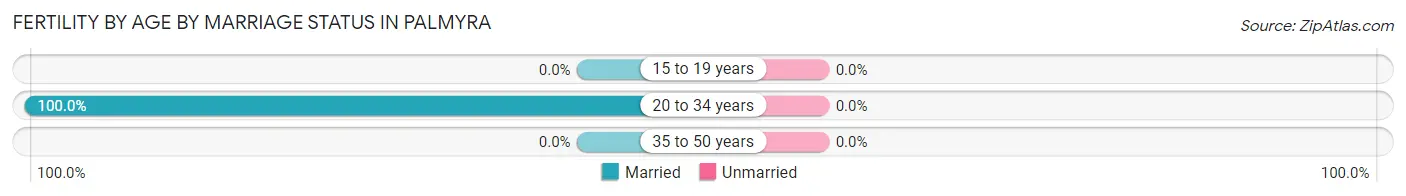
| Age Bracket | Married | Unmarried |
| 15 to 19 years | 0 (0.0%) | 0 (0.0%) |
| 20 to 34 years | 13 (100.0%) | 0 (0.0%) |
| 35 to 50 years | 0 (0.0%) | 0 (0.0%) |
| Total | 13 (100.0%) | 0 (0.0%) |
Fertility by Education in Palmyra
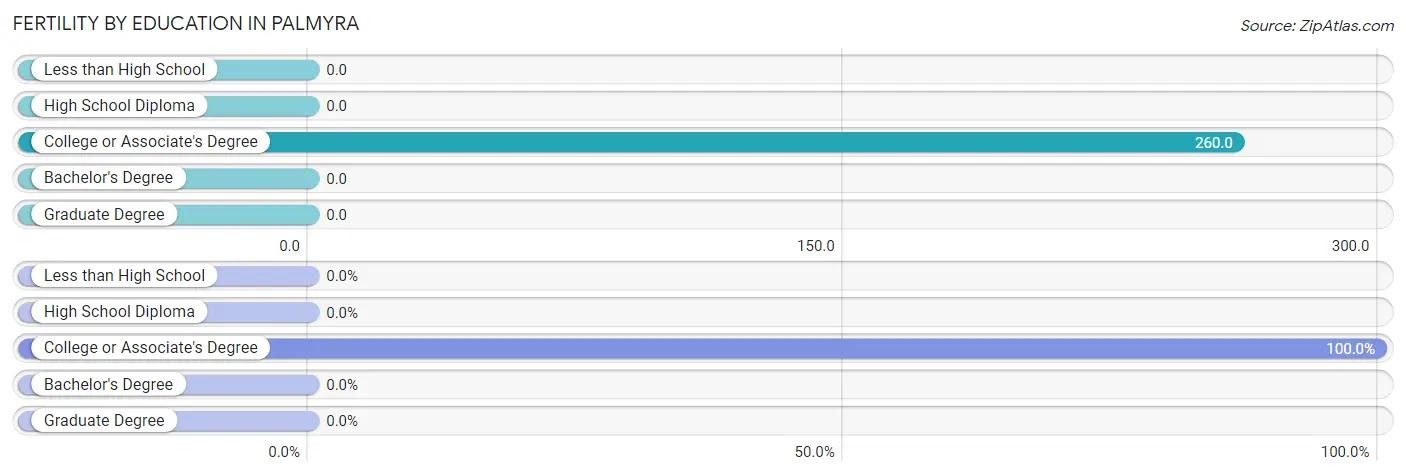
| Educational Attainment | Women with Births | Births / 1,000 Women |
| Less than High School | 0 (0.0%) | 0.0 |
| High School Diploma | 0 (0.0%) | 0.0 |
| College or Associate's Degree | 13 (100.0%) | 260.0 |
| Bachelor's Degree | 0 (0.0%) | 0.0 |
| Graduate Degree | 0 (0.0%) | 0.0 |
| Total | 13 (100.0%) | 105.0 |
Fertility by Education by Marriage Status in Palmyra
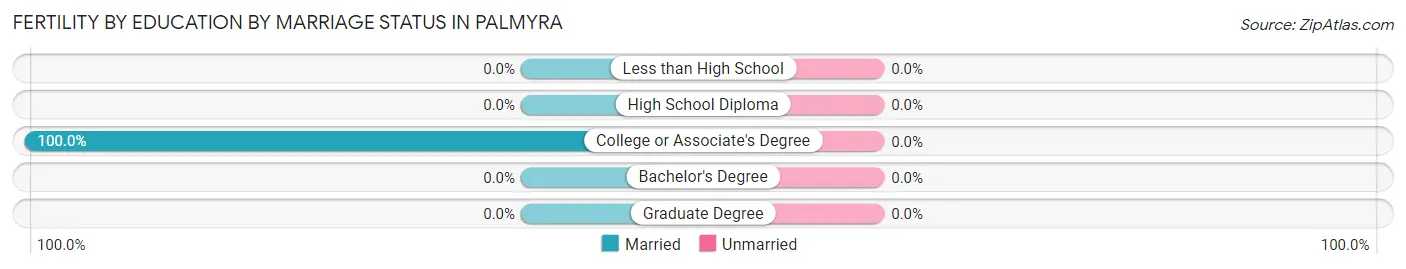
| Educational Attainment | Married | Unmarried |
| Less than High School | 0 (0.0%) | 0 (0.0%) |
| High School Diploma | 0 (0.0%) | 0 (0.0%) |
| College or Associate's Degree | 13 (100.0%) | 0 (0.0%) |
| Bachelor's Degree | 0 (0.0%) | 0 (0.0%) |
| Graduate Degree | 0 (0.0%) | 0 (0.0%) |
| Total | 13 (100.0%) | 0 (0.0%) |
Employment Characteristics in Palmyra
Employment by Class of Employer in Palmyra
Among the 205 employed individuals in Palmyra, private company employees (117 | 57.1%), local government employees (39 | 19.0%), and self-employed (not incorporated) (33 | 16.1%) make up the most common classes of employment.
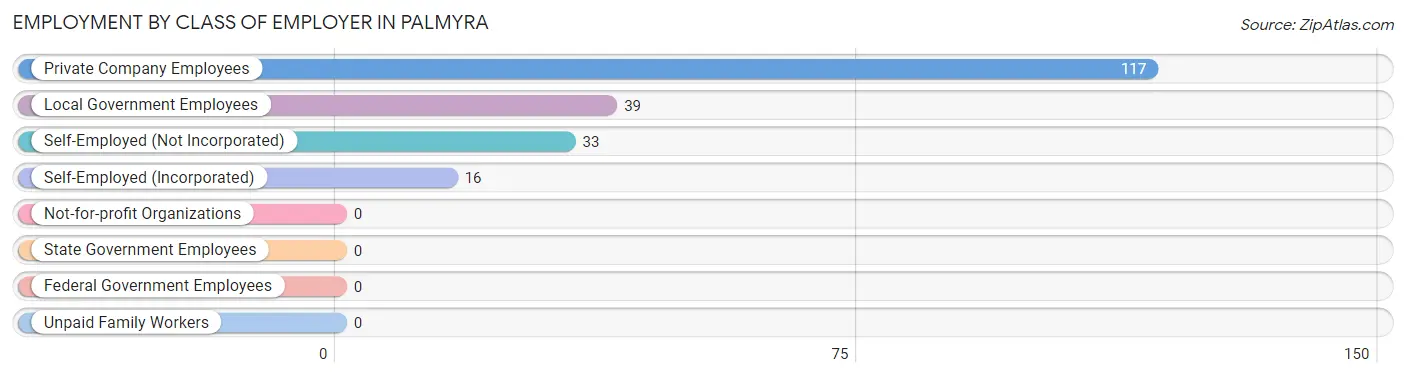
| Employer Class | # Employees | % Employees |
| Private Company Employees | 117 | 57.1% |
| Self-Employed (Incorporated) | 16 | 7.8% |
| Self-Employed (Not Incorporated) | 33 | 16.1% |
| Not-for-profit Organizations | 0 | 0.0% |
| Local Government Employees | 39 | 19.0% |
| State Government Employees | 0 | 0.0% |
| Federal Government Employees | 0 | 0.0% |
| Unpaid Family Workers | 0 | 0.0% |
| Total | 205 | 100.0% |
Employment Status by Age in Palmyra
According to the labor force statistics for Palmyra, out of the total population over 16 years of age (431), 52.0% or 224 individuals are in the labor force, with 5.4% or 12 of them unemployed. The age group with the highest labor force participation rate is 30 to 34 years, with 100.0% or 49 individuals in the labor force. Within the labor force, the 45 to 54 years age range has the highest percentage of unemployed individuals, with 25.9% or 7 of them being unemployed.
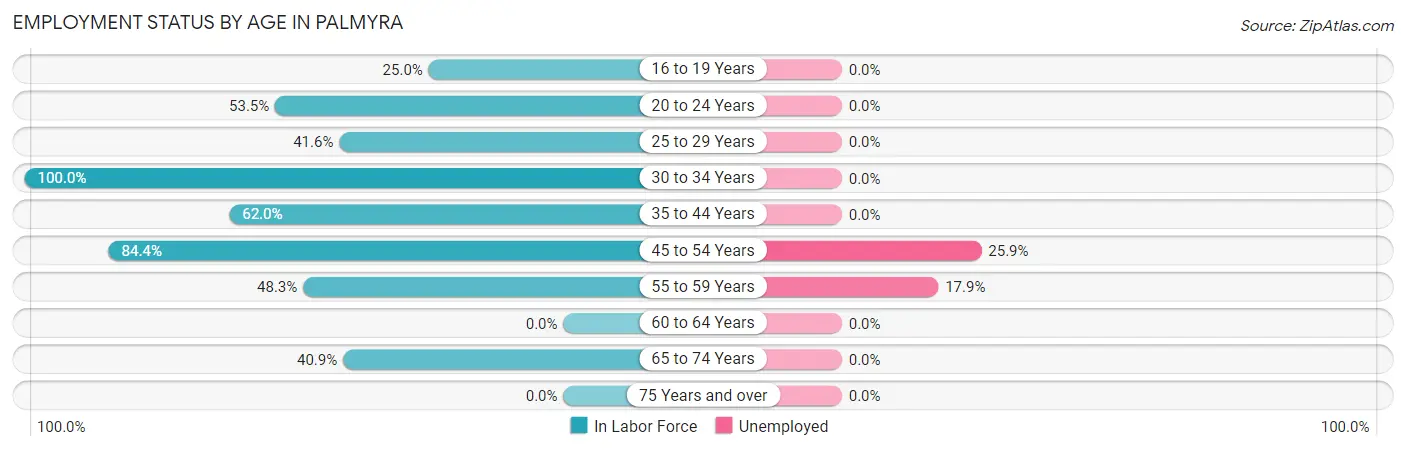
| Age Bracket | In Labor Force | Unemployed |
| 16 to 19 Years | 7 (25.0%) | 0 (0.0%) |
| 20 to 24 Years | 23 (53.5%) | 0 (0.0%) |
| 25 to 29 Years | 32 (41.6%) | 0 (0.0%) |
| 30 to 34 Years | 49 (100.0%) | 0 (0.0%) |
| 35 to 44 Years | 31 (62.0%) | 0 (0.0%) |
| 45 to 54 Years | 27 (84.4%) | 7 (25.9%) |
| 55 to 59 Years | 28 (48.3%) | 5 (17.9%) |
| 60 to 64 Years | 0 (0.0%) | 0 (0.0%) |
| 65 to 74 Years | 27 (40.9%) | 0 (0.0%) |
| 75 Years and over | 0 (0.0%) | 0 (0.0%) |
| Total | 224 (52.0%) | 12 (5.4%) |
Employment Status by Educational Attainment in Palmyra
According to labor force statistics for Palmyra, 61.6% of individuals (167) out of the total population between 25 and 64 years of age (271) are in the labor force, with 7.2% or 12 of them being unemployed. The group with the highest labor force participation rate are those with the educational attainment of less than high school, with 100.0% or 7 individuals in the labor force. Within the labor force, individuals with less than high school education have the highest percentage of unemployment, with 100.0% or 7 of them being unemployed.
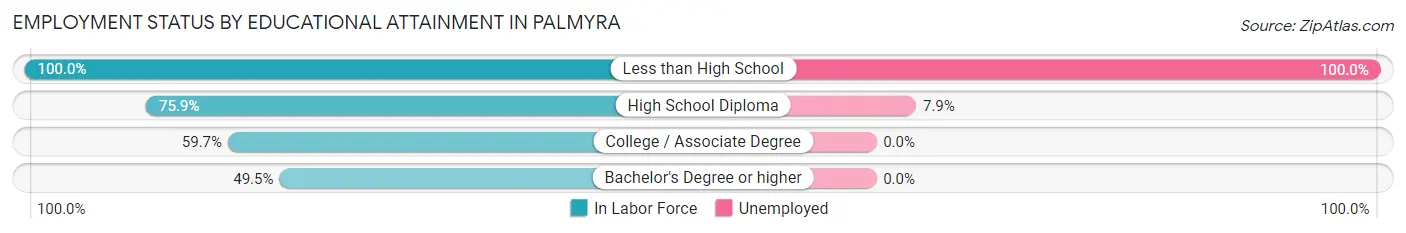
| Educational Attainment | In Labor Force | Unemployed |
| Less than High School | 7 (100.0%) | 7 (100.0%) |
| High School Diploma | 63 (75.9%) | 7 (7.9%) |
| College / Associate Degree | 43 (59.7%) | 0 (0.0%) |
| Bachelor's Degree or higher | 54 (49.5%) | 0 (0.0%) |
| Total | 167 (61.6%) | 20 (7.2%) |
Employment Occupations by Sex in Palmyra
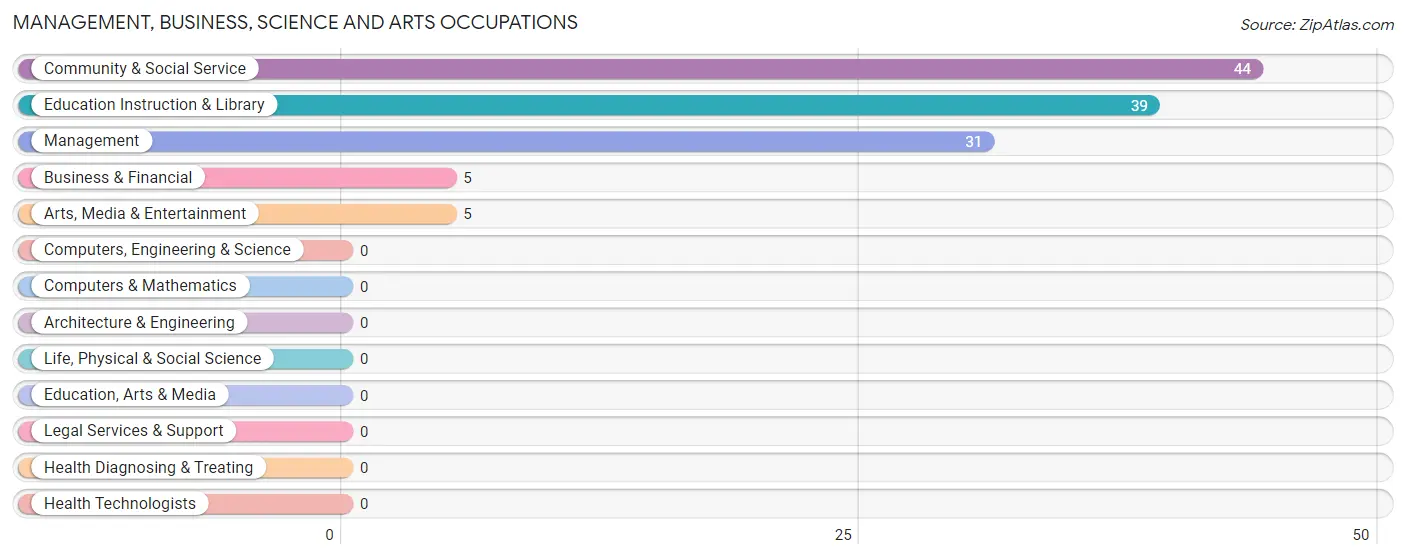
Management, Business, Science and Arts Occupations
The most common Management, Business, Science and Arts occupations in Palmyra are Community & Social Service (44 | 20.7%), Education Instruction & Library (39 | 18.4%), Management (31 | 14.6%), Business & Financial (5 | 2.4%), and Arts, Media & Entertainment (5 | 2.4%).
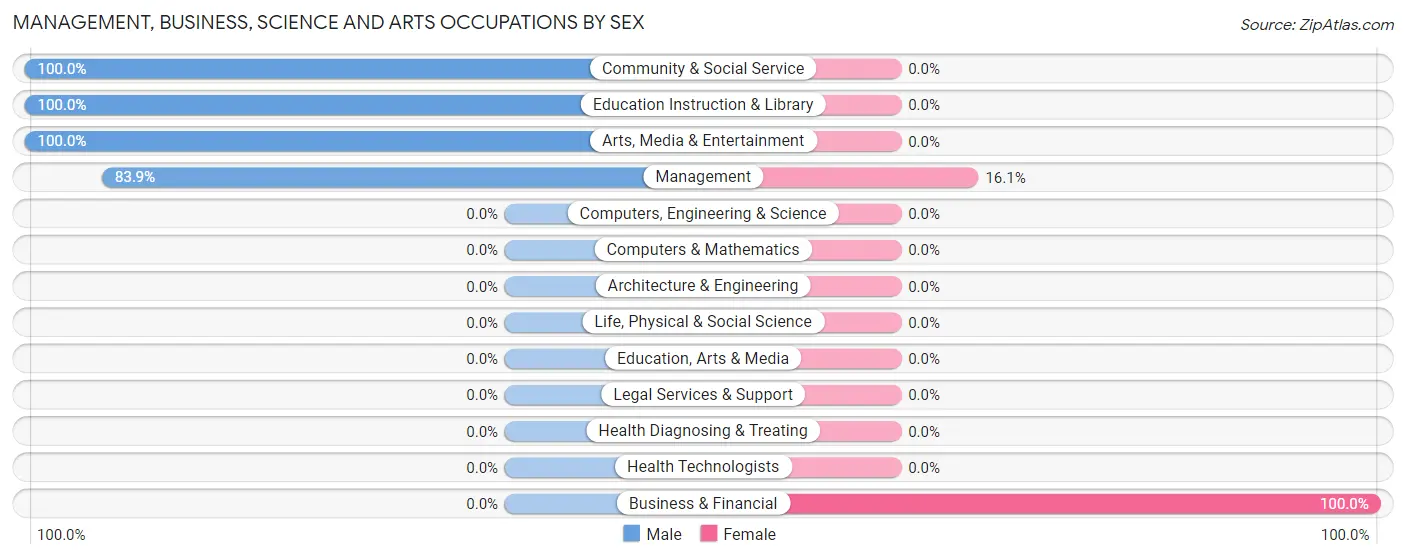
Management, Business, Science and Arts Occupations by Sex
Within the Management, Business, Science and Arts occupations in Palmyra, the most male-oriented occupations are Community & Social Service (100.0%), Education Instruction & Library (100.0%), and Arts, Media & Entertainment (100.0%), while the most female-oriented occupations are Business & Financial (100.0%), and Management (16.1%).
| Occupation | Male | Female |
| Management | 26 (83.9%) | 5 (16.1%) |
| Business & Financial | 0 (0.0%) | 5 (100.0%) |
| Computers, Engineering & Science | 0 (0.0%) | 0 (0.0%) |
| Computers & Mathematics | 0 (0.0%) | 0 (0.0%) |
| Architecture & Engineering | 0 (0.0%) | 0 (0.0%) |
| Life, Physical & Social Science | 0 (0.0%) | 0 (0.0%) |
| Community & Social Service | 44 (100.0%) | 0 (0.0%) |
| Education, Arts & Media | 0 (0.0%) | 0 (0.0%) |
| Legal Services & Support | 0 (0.0%) | 0 (0.0%) |
| Education Instruction & Library | 39 (100.0%) | 0 (0.0%) |
| Arts, Media & Entertainment | 5 (100.0%) | 0 (0.0%) |
| Health Diagnosing & Treating | 0 (0.0%) | 0 (0.0%) |
| Health Technologists | 0 (0.0%) | 0 (0.0%) |
| Total (Category) | 70 (87.5%) | 10 (12.5%) |
| Total (Overall) | 178 (84.0%) | 34 (16.0%) |
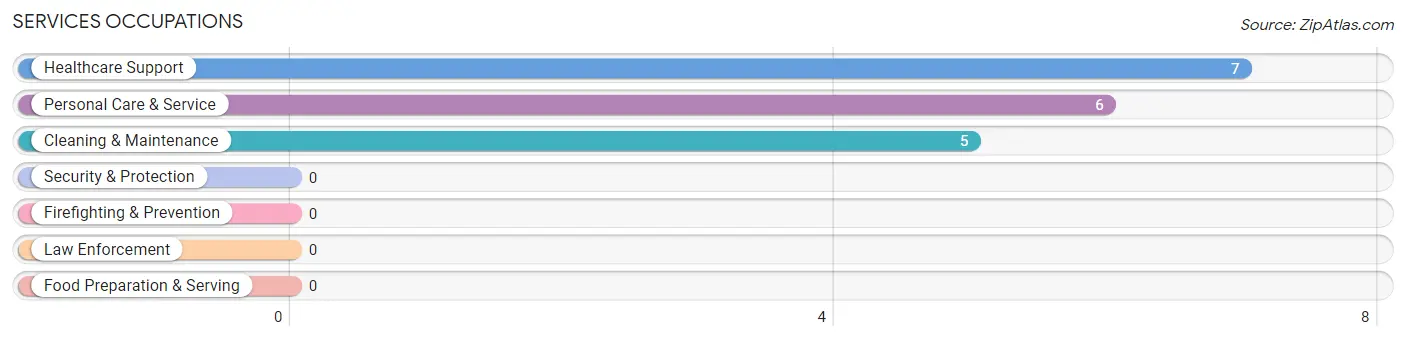
Services Occupations
The most common Services occupations in Palmyra are Healthcare Support (7 | 3.3%), Personal Care & Service (6 | 2.8%), and Cleaning & Maintenance (5 | 2.4%).
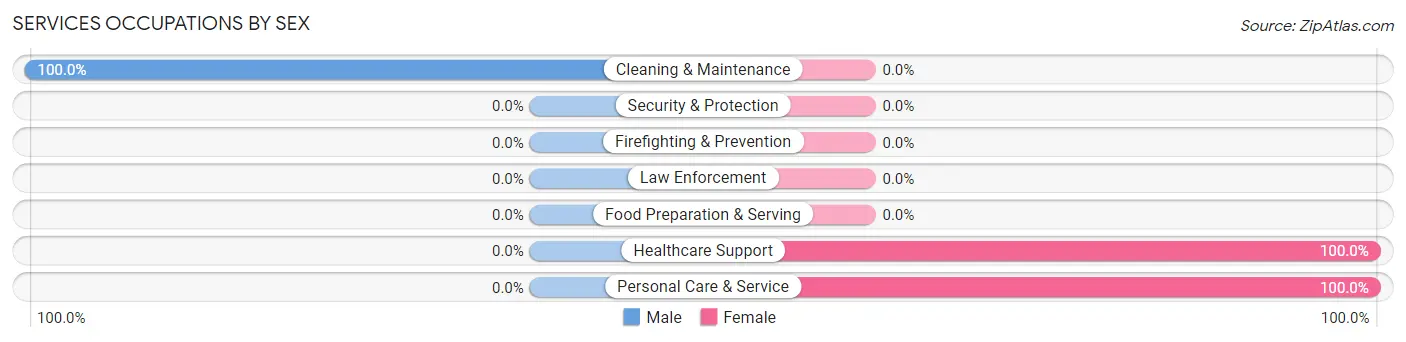
Services Occupations by Sex
| Occupation | Male | Female |
| Healthcare Support | 0 (0.0%) | 7 (100.0%) |
| Security & Protection | 0 (0.0%) | 0 (0.0%) |
| Firefighting & Prevention | 0 (0.0%) | 0 (0.0%) |
| Law Enforcement | 0 (0.0%) | 0 (0.0%) |
| Food Preparation & Serving | 0 (0.0%) | 0 (0.0%) |
| Cleaning & Maintenance | 5 (100.0%) | 0 (0.0%) |
| Personal Care & Service | 0 (0.0%) | 6 (100.0%) |
| Total (Category) | 5 (27.8%) | 13 (72.2%) |
| Total (Overall) | 178 (84.0%) | 34 (16.0%) |
Sales and Office Occupations
The most common Sales and Office occupations in Palmyra are Sales & Related (10 | 4.7%), and Office & Administration (6 | 2.8%).
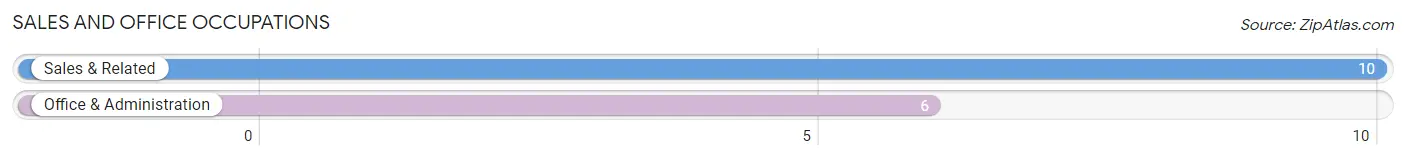
Sales and Office Occupations by Sex

| Occupation | Male | Female |
| Sales & Related | 10 (100.0%) | 0 (0.0%) |
| Office & Administration | 0 (0.0%) | 6 (100.0%) |
| Total (Category) | 10 (62.5%) | 6 (37.5%) |
| Total (Overall) | 178 (84.0%) | 34 (16.0%) |
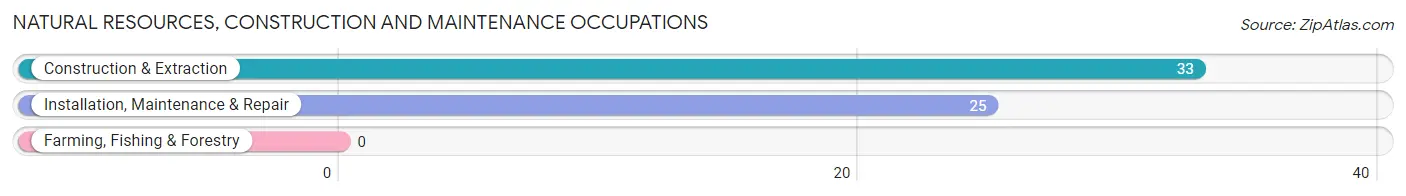
Natural Resources, Construction and Maintenance Occupations
The most common Natural Resources, Construction and Maintenance occupations in Palmyra are Construction & Extraction (33 | 15.6%), and Installation, Maintenance & Repair (25 | 11.8%).
Natural Resources, Construction and Maintenance Occupations by Sex
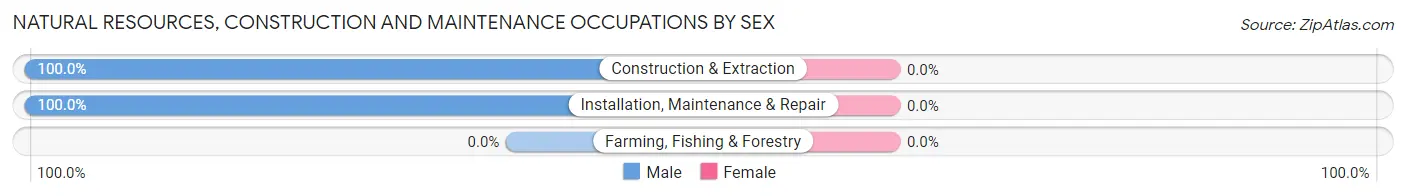
| Occupation | Male | Female |
| Farming, Fishing & Forestry | 0 (0.0%) | 0 (0.0%) |
| Construction & Extraction | 33 (100.0%) | 0 (0.0%) |
| Installation, Maintenance & Repair | 25 (100.0%) | 0 (0.0%) |
| Total (Category) | 58 (100.0%) | 0 (0.0%) |
| Total (Overall) | 178 (84.0%) | 34 (16.0%) |
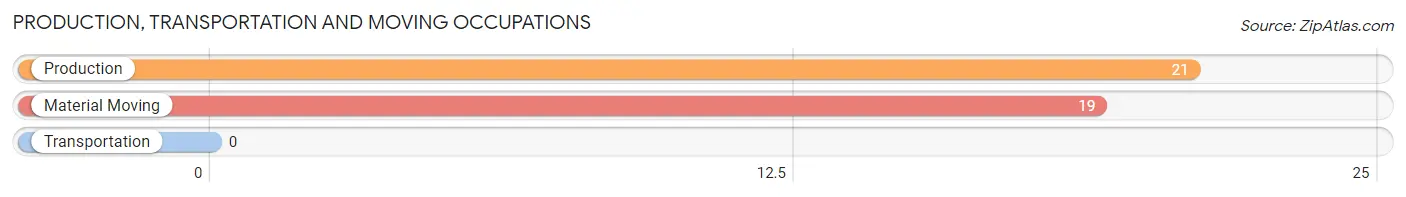
Production, Transportation and Moving Occupations
The most common Production, Transportation and Moving occupations in Palmyra are Production (21 | 9.9%), and Material Moving (19 | 9.0%).
Production, Transportation and Moving Occupations by Sex
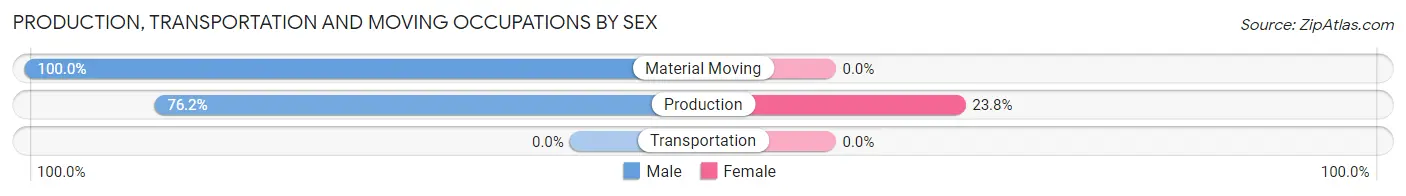
| Occupation | Male | Female |
| Production | 16 (76.2%) | 5 (23.8%) |
| Transportation | 0 (0.0%) | 0 (0.0%) |
| Material Moving | 19 (100.0%) | 0 (0.0%) |
| Total (Category) | 35 (87.5%) | 5 (12.5%) |
| Total (Overall) | 178 (84.0%) | 34 (16.0%) |
Employment Industries by Sex in Palmyra
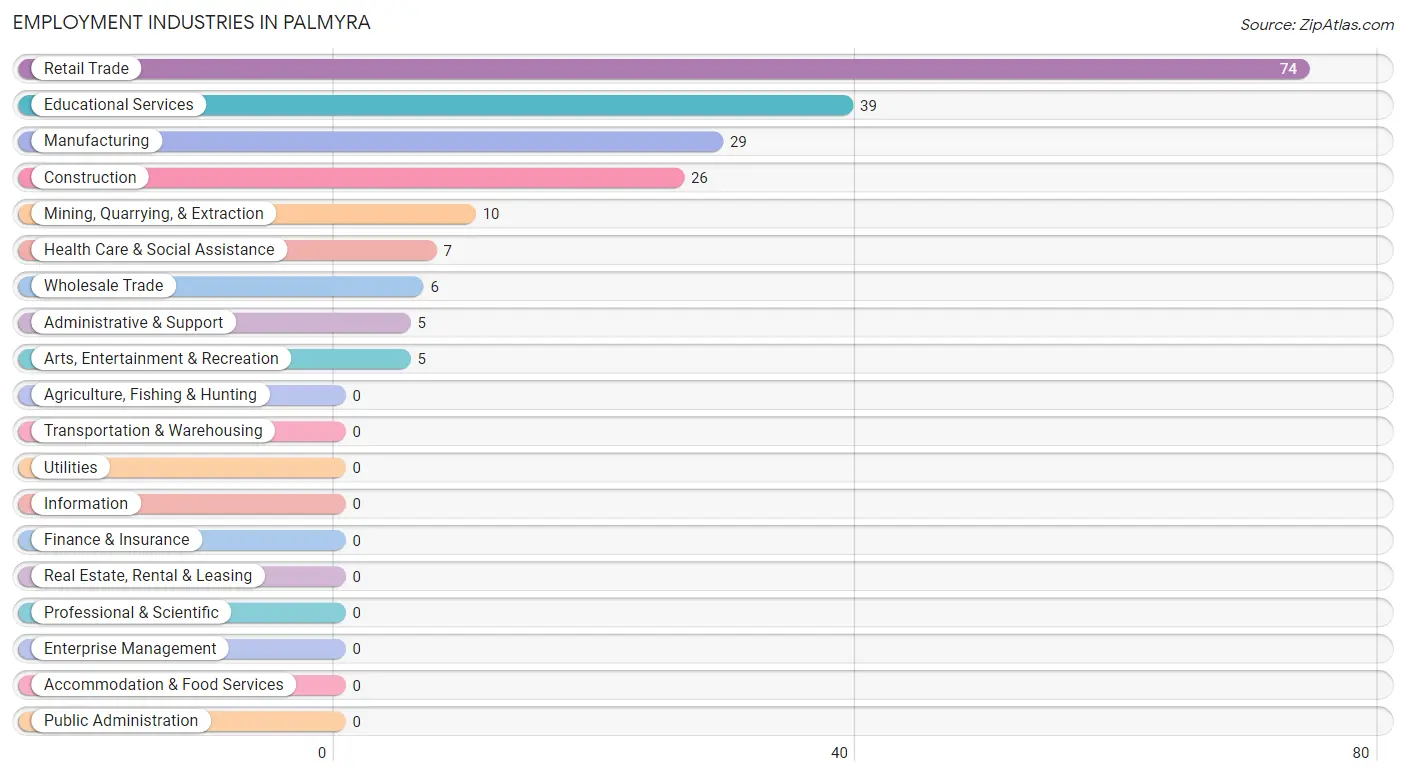
Employment Industries in Palmyra
The major employment industries in Palmyra include Retail Trade (74 | 34.9%), Educational Services (39 | 18.4%), Manufacturing (29 | 13.7%), Construction (26 | 12.3%), and Mining, Quarrying, & Extraction (10 | 4.7%).
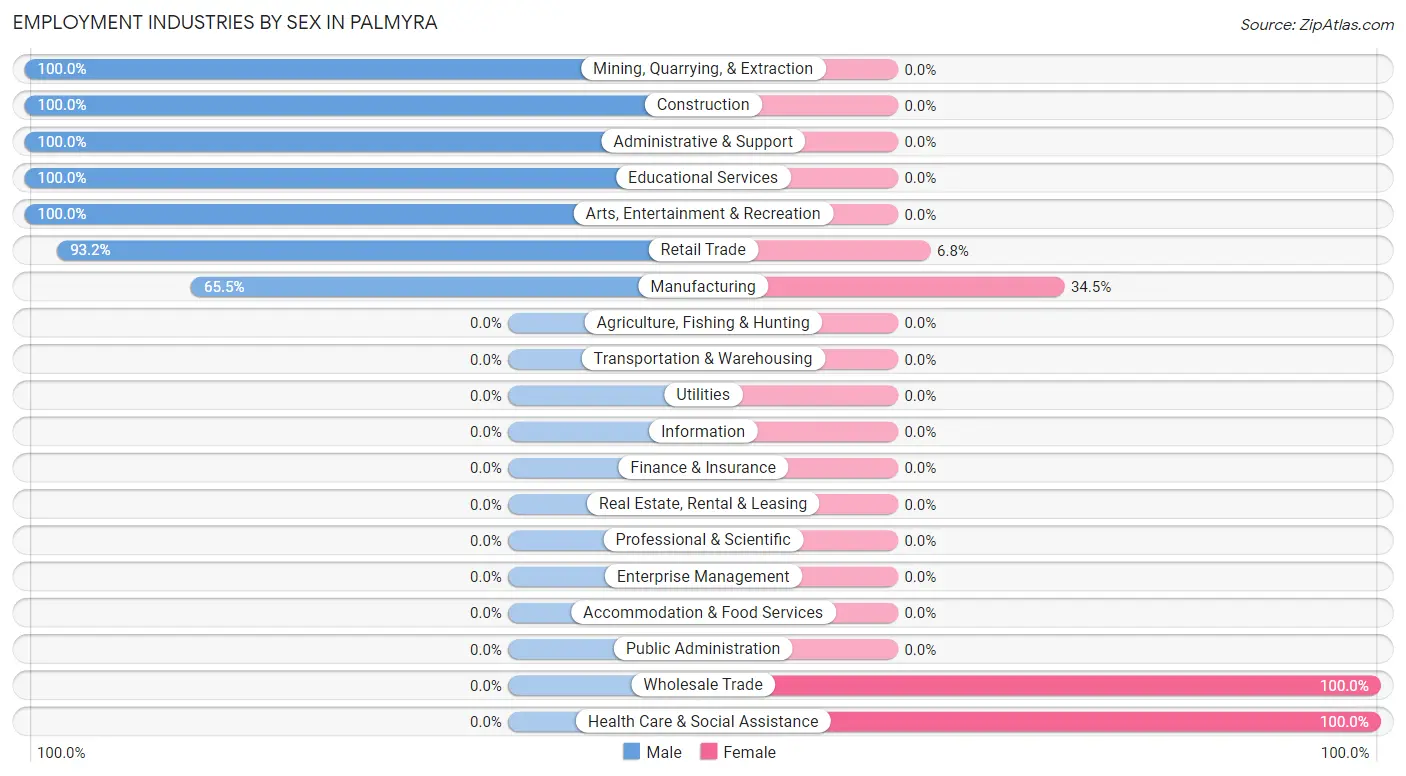
Employment Industries by Sex in Palmyra
The Palmyra industries that see more men than women are Mining, Quarrying, & Extraction (100.0%), Construction (100.0%), and Administrative & Support (100.0%), whereas the industries that tend to have a higher number of women are Wholesale Trade (100.0%), Health Care & Social Assistance (100.0%), and Manufacturing (34.5%).
| Industry | Male | Female |
| Agriculture, Fishing & Hunting | 0 (0.0%) | 0 (0.0%) |
| Mining, Quarrying, & Extraction | 10 (100.0%) | 0 (0.0%) |
| Construction | 26 (100.0%) | 0 (0.0%) |
| Manufacturing | 19 (65.5%) | 10 (34.5%) |
| Wholesale Trade | 0 (0.0%) | 6 (100.0%) |
| Retail Trade | 69 (93.2%) | 5 (6.8%) |
| Transportation & Warehousing | 0 (0.0%) | 0 (0.0%) |
| Utilities | 0 (0.0%) | 0 (0.0%) |
| Information | 0 (0.0%) | 0 (0.0%) |
| Finance & Insurance | 0 (0.0%) | 0 (0.0%) |
| Real Estate, Rental & Leasing | 0 (0.0%) | 0 (0.0%) |
| Professional & Scientific | 0 (0.0%) | 0 (0.0%) |
| Enterprise Management | 0 (0.0%) | 0 (0.0%) |
| Administrative & Support | 5 (100.0%) | 0 (0.0%) |
| Educational Services | 39 (100.0%) | 0 (0.0%) |
| Health Care & Social Assistance | 0 (0.0%) | 7 (100.0%) |
| Arts, Entertainment & Recreation | 5 (100.0%) | 0 (0.0%) |
| Accommodation & Food Services | 0 (0.0%) | 0 (0.0%) |
| Public Administration | 0 (0.0%) | 0 (0.0%) |
| Total | 178 (84.0%) | 34 (16.0%) |
Education in Palmyra
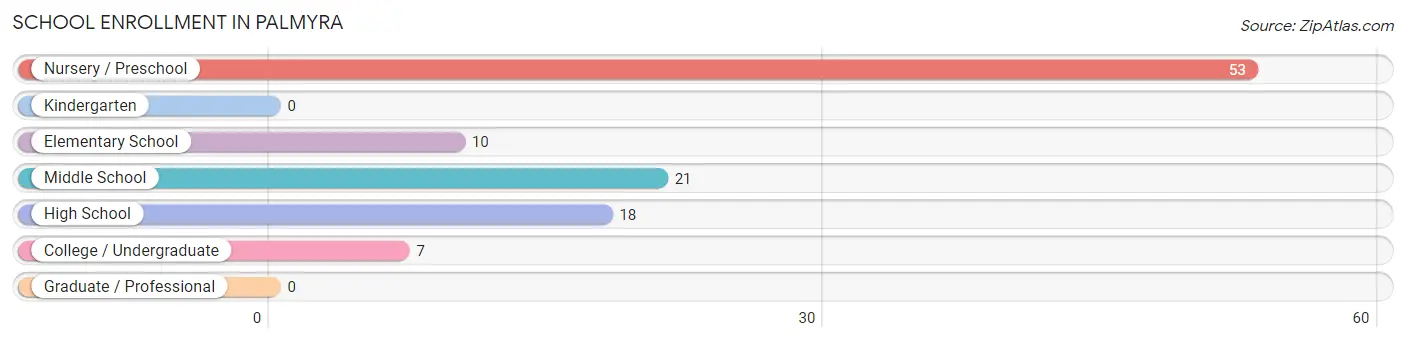
School Enrollment in Palmyra
The most common levels of schooling among the 109 students in Palmyra are nursery / preschool (53 | 48.6%), middle school (21 | 19.3%), and high school (18 | 16.5%).
| School Level | # Students | % Students |
| Nursery / Preschool | 53 | 48.6% |
| Kindergarten | 0 | 0.0% |
| Elementary School | 10 | 9.2% |
| Middle School | 21 | 19.3% |
| High School | 18 | 16.5% |
| College / Undergraduate | 7 | 6.4% |
| Graduate / Professional | 0 | 0.0% |
| Total | 109 | 100.0% |
School Enrollment by Age by Funding Source in Palmyra
Out of a total of 109 students who are enrolled in schools in Palmyra, 9 (8.3%) attend a private institution, while the remaining 100 (91.7%) are enrolled in public schools. The age group of 3 to 4 year olds has the highest likelihood of being enrolled in private schools, with 9 (19.2% in the age bracket) enrolled. Conversely, the age group of 5 to 9 year old has the lowest likelihood of being enrolled in a private school, with 16 (100.0% in the age bracket) attending a public institution.
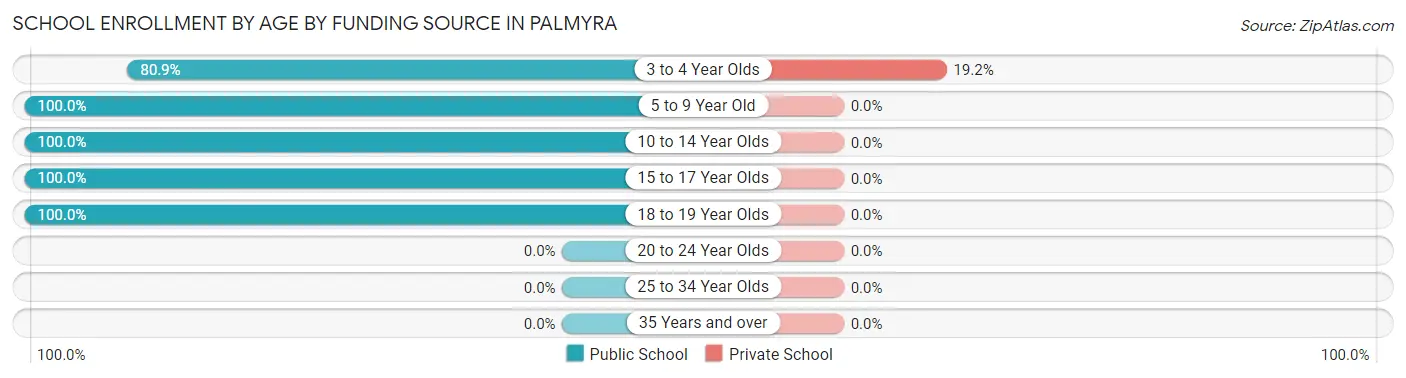
| Age Bracket | Public School | Private School |
| 3 to 4 Year Olds | 38 (80.8%) | 9 (19.2%) |
| 5 to 9 Year Old | 16 (100.0%) | 0 (0.0%) |
| 10 to 14 Year Olds | 21 (100.0%) | 0 (0.0%) |
| 15 to 17 Year Olds | 11 (100.0%) | 0 (0.0%) |
| 18 to 19 Year Olds | 14 (100.0%) | 0 (0.0%) |
| 20 to 24 Year Olds | 0 (0.0%) | 0 (0.0%) |
| 25 to 34 Year Olds | 0 (0.0%) | 0 (0.0%) |
| 35 Years and over | 0 (0.0%) | 0 (0.0%) |
| Total | 100 (91.7%) | 9 (8.3%) |
Educational Attainment by Field of Study in Palmyra
Social sciences (45 | 39.1%), computers & mathematics (39 | 33.9%), business (10 | 8.7%), arts & humanities (6 | 5.2%), and bio, nature & agricultural (5 | 4.3%) are the most common fields of study among 115 individuals in Palmyra who have obtained a bachelor's degree or higher.
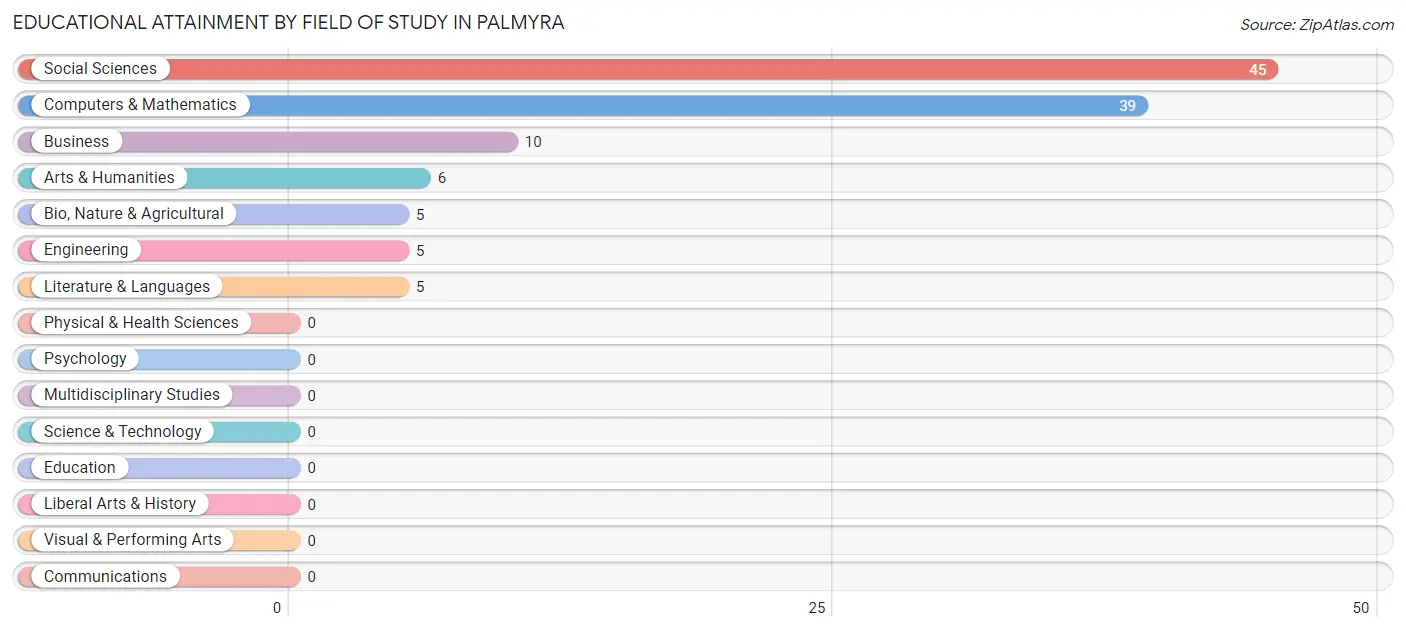
| Field of Study | # Graduates | % Graduates |
| Computers & Mathematics | 39 | 33.9% |
| Bio, Nature & Agricultural | 5 | 4.3% |
| Physical & Health Sciences | 0 | 0.0% |
| Psychology | 0 | 0.0% |
| Social Sciences | 45 | 39.1% |
| Engineering | 5 | 4.3% |
| Multidisciplinary Studies | 0 | 0.0% |
| Science & Technology | 0 | 0.0% |
| Business | 10 | 8.7% |
| Education | 0 | 0.0% |
| Literature & Languages | 5 | 4.3% |
| Liberal Arts & History | 0 | 0.0% |
| Visual & Performing Arts | 0 | 0.0% |
| Communications | 0 | 0.0% |
| Arts & Humanities | 6 | 5.2% |
| Total | 115 | 100.0% |
Transportation & Commute in Palmyra
Vehicle Availability by Sex in Palmyra
The most prevalent vehicle ownership categories in Palmyra are males with 2 vehicles (96, accounting for 53.9%) and females with 2 vehicles (11, making up 355.6%).
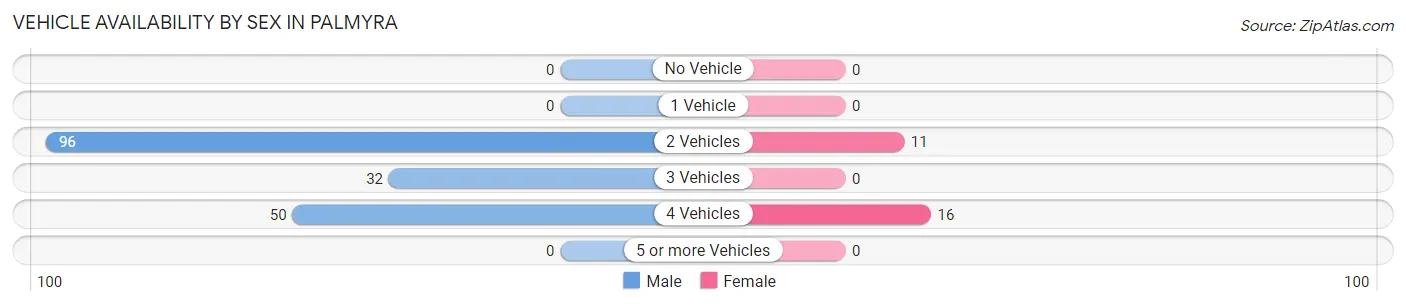
| Vehicles Available | Male | Female |
| No Vehicle | 0 (0.0%) | 0 (0.0%) |
| 1 Vehicle | 0 (0.0%) | 0 (0.0%) |
| 2 Vehicles | 96 (53.9%) | 11 (40.7%) |
| 3 Vehicles | 32 (18.0%) | 0 (0.0%) |
| 4 Vehicles | 50 (28.1%) | 16 (59.3%) |
| 5 or more Vehicles | 0 (0.0%) | 0 (0.0%) |
| Total | 178 (100.0%) | 27 (100.0%) |
Commute Time in Palmyra
The most frequently occuring commute durations in Palmyra are 10 to 14 minutes (72 commuters, 36.0%), 60 to 89 minutes (36 commuters, 18.0%), and 15 to 19 minutes (24 commuters, 12.0%).
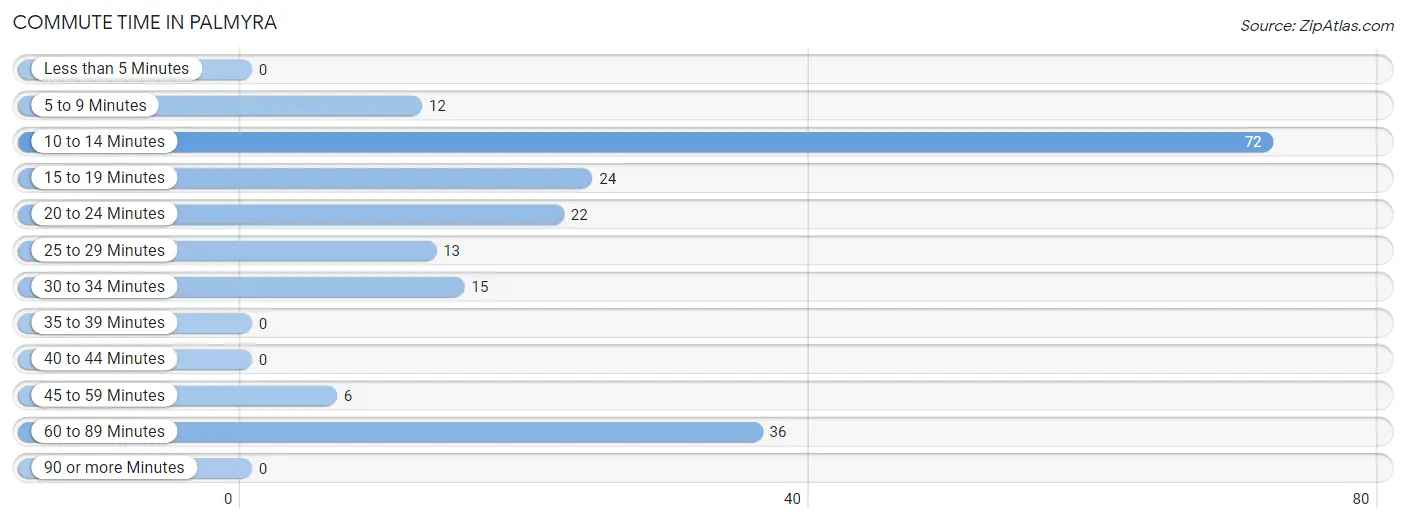
| Commute Time | # Commuters | % Commuters |
| Less than 5 Minutes | 0 | 0.0% |
| 5 to 9 Minutes | 12 | 6.0% |
| 10 to 14 Minutes | 72 | 36.0% |
| 15 to 19 Minutes | 24 | 12.0% |
| 20 to 24 Minutes | 22 | 11.0% |
| 25 to 29 Minutes | 13 | 6.5% |
| 30 to 34 Minutes | 15 | 7.5% |
| 35 to 39 Minutes | 0 | 0.0% |
| 40 to 44 Minutes | 0 | 0.0% |
| 45 to 59 Minutes | 6 | 3.0% |
| 60 to 89 Minutes | 36 | 18.0% |
| 90 or more Minutes | 0 | 0.0% |
Commute Time by Sex in Palmyra
The most common commute times in Palmyra are 10 to 14 minutes (72 commuters, 40.5%) for males and 15 to 19 minutes (6 commuters, 27.3%) for females.
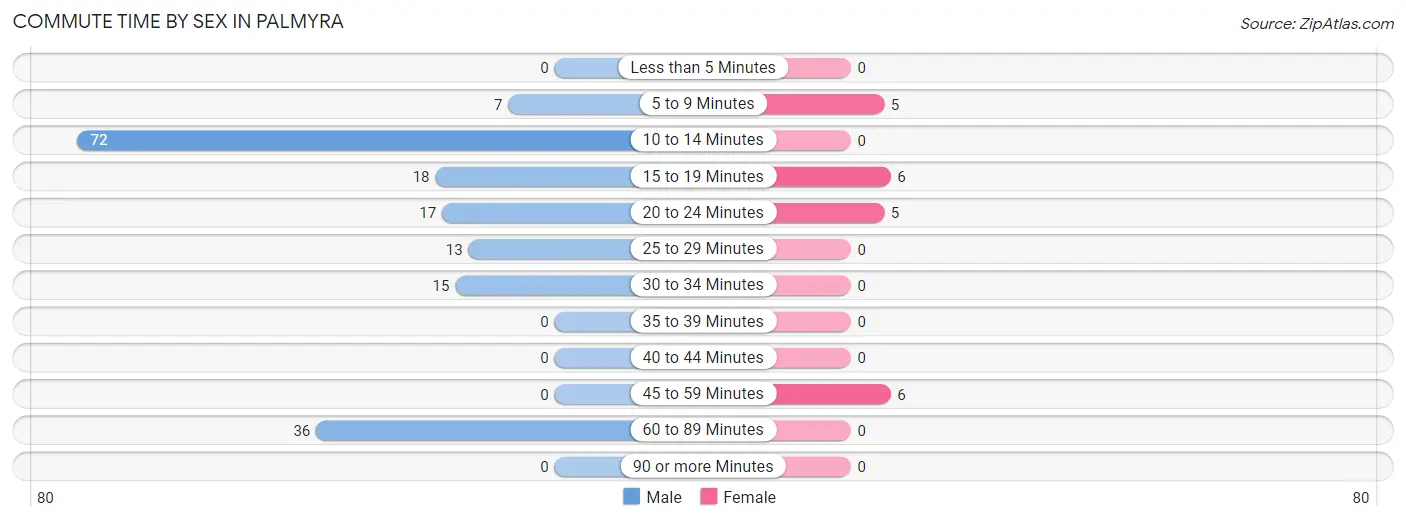
| Commute Time | Male | Female |
| Less than 5 Minutes | 0 (0.0%) | 0 (0.0%) |
| 5 to 9 Minutes | 7 (3.9%) | 5 (22.7%) |
| 10 to 14 Minutes | 72 (40.5%) | 0 (0.0%) |
| 15 to 19 Minutes | 18 (10.1%) | 6 (27.3%) |
| 20 to 24 Minutes | 17 (9.6%) | 5 (22.7%) |
| 25 to 29 Minutes | 13 (7.3%) | 0 (0.0%) |
| 30 to 34 Minutes | 15 (8.4%) | 0 (0.0%) |
| 35 to 39 Minutes | 0 (0.0%) | 0 (0.0%) |
| 40 to 44 Minutes | 0 (0.0%) | 0 (0.0%) |
| 45 to 59 Minutes | 0 (0.0%) | 6 (27.3%) |
| 60 to 89 Minutes | 36 (20.2%) | 0 (0.0%) |
| 90 or more Minutes | 0 (0.0%) | 0 (0.0%) |
Time of Departure to Work by Sex in Palmyra
The most frequent times of departure to work in Palmyra are 7:00 AM to 7:29 AM (54, 30.3%) for males and 6:00 AM to 6:29 AM (6, 27.3%) for females.
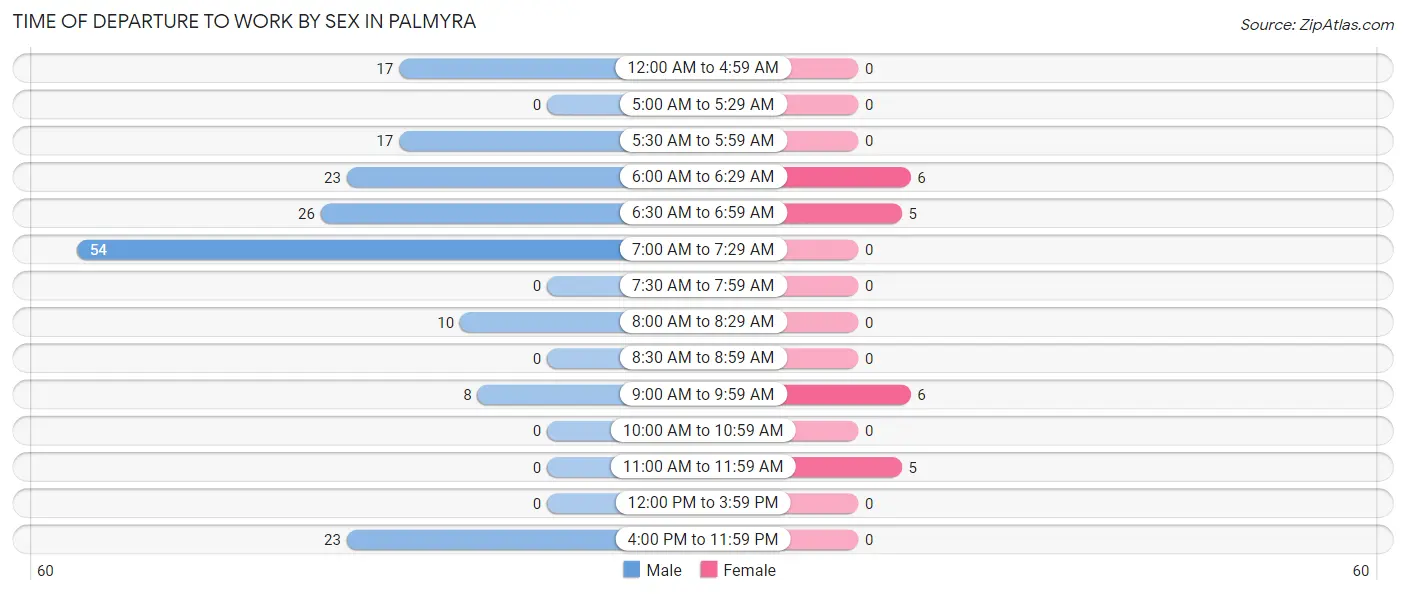
| Time of Departure | Male | Female |
| 12:00 AM to 4:59 AM | 17 (9.6%) | 0 (0.0%) |
| 5:00 AM to 5:29 AM | 0 (0.0%) | 0 (0.0%) |
| 5:30 AM to 5:59 AM | 17 (9.6%) | 0 (0.0%) |
| 6:00 AM to 6:29 AM | 23 (12.9%) | 6 (27.3%) |
| 6:30 AM to 6:59 AM | 26 (14.6%) | 5 (22.7%) |
| 7:00 AM to 7:29 AM | 54 (30.3%) | 0 (0.0%) |
| 7:30 AM to 7:59 AM | 0 (0.0%) | 0 (0.0%) |
| 8:00 AM to 8:29 AM | 10 (5.6%) | 0 (0.0%) |
| 8:30 AM to 8:59 AM | 0 (0.0%) | 0 (0.0%) |
| 9:00 AM to 9:59 AM | 8 (4.5%) | 6 (27.3%) |
| 10:00 AM to 10:59 AM | 0 (0.0%) | 0 (0.0%) |
| 11:00 AM to 11:59 AM | 0 (0.0%) | 5 (22.7%) |
| 12:00 PM to 3:59 PM | 0 (0.0%) | 0 (0.0%) |
| 4:00 PM to 11:59 PM | 23 (12.9%) | 0 (0.0%) |
| Total | 178 (100.0%) | 22 (100.0%) |
Housing Occupancy in Palmyra
Occupancy by Ownership in Palmyra
Of the total 184 dwellings in Palmyra, owner-occupied units account for 159 (86.4%), while renter-occupied units make up 25 (13.6%).
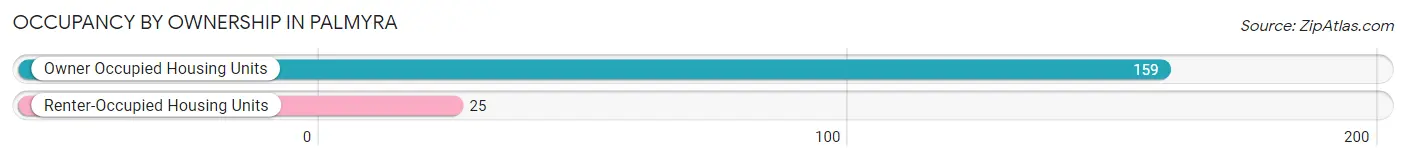
| Occupancy | # Housing Units | % Housing Units |
| Owner Occupied Housing Units | 159 | 86.4% |
| Renter-Occupied Housing Units | 25 | 13.6% |
| Total Occupied Housing Units | 184 | 100.0% |
Occupancy by Household Size in Palmyra
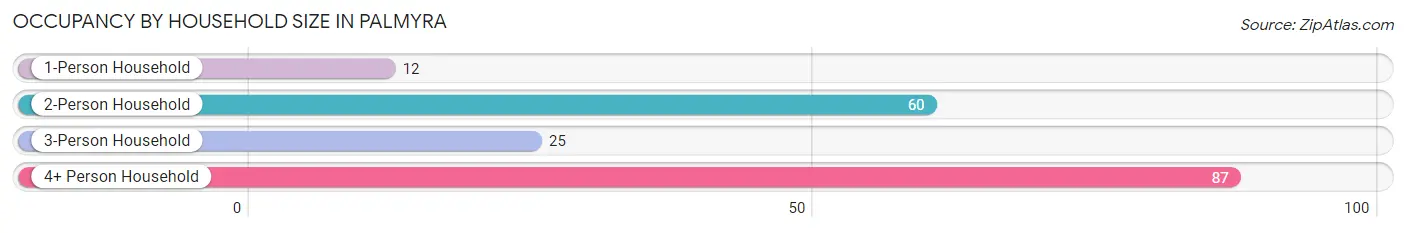
| Household Size | # Housing Units | % Housing Units |
| 1-Person Household | 12 | 6.5% |
| 2-Person Household | 60 | 32.6% |
| 3-Person Household | 25 | 13.6% |
| 4+ Person Household | 87 | 47.3% |
| Total Housing Units | 184 | 100.0% |
Occupancy by Ownership by Household Size in Palmyra
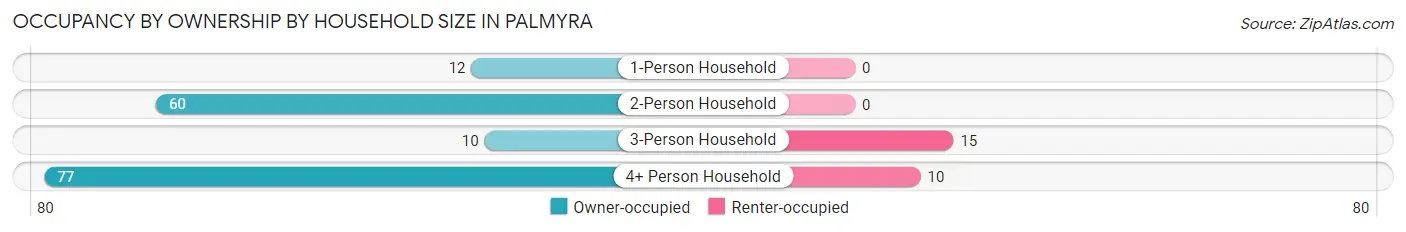
| Household Size | Owner-occupied | Renter-occupied |
| 1-Person Household | 12 (100.0%) | 0 (0.0%) |
| 2-Person Household | 60 (100.0%) | 0 (0.0%) |
| 3-Person Household | 10 (40.0%) | 15 (60.0%) |
| 4+ Person Household | 77 (88.5%) | 10 (11.5%) |
| Total Housing Units | 159 (86.4%) | 25 (13.6%) |
Occupancy by Educational Attainment in Palmyra
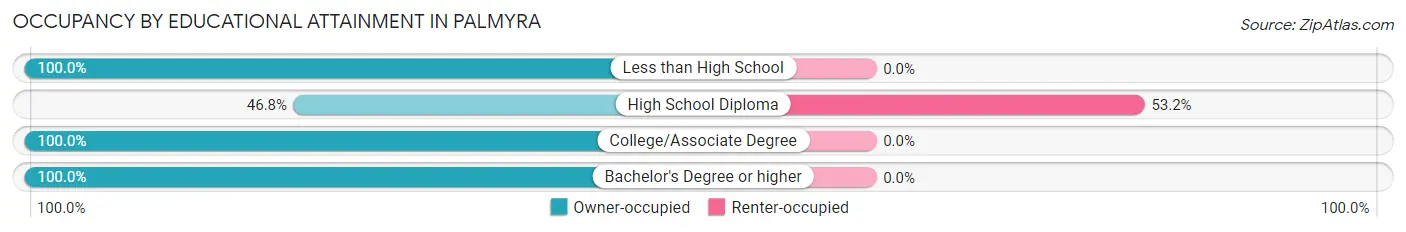
| Household Size | Owner-occupied | Renter-occupied |
| Less than High School | 8 (100.0%) | 0 (0.0%) |
| High School Diploma | 22 (46.8%) | 25 (53.2%) |
| College/Associate Degree | 69 (100.0%) | 0 (0.0%) |
| Bachelor's Degree or higher | 60 (100.0%) | 0 (0.0%) |
Occupancy by Age of Householder in Palmyra
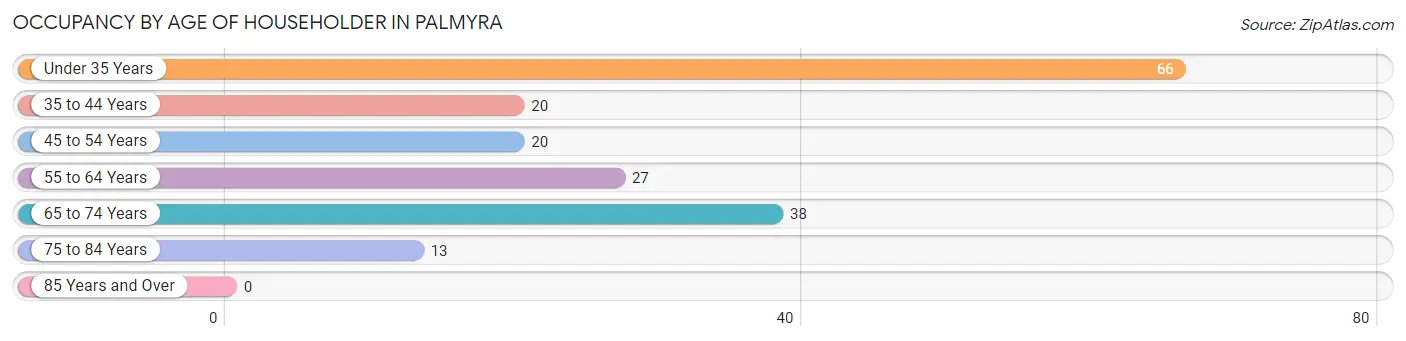
| Age Bracket | # Households | % Households |
| Under 35 Years | 66 | 35.9% |
| 35 to 44 Years | 20 | 10.9% |
| 45 to 54 Years | 20 | 10.9% |
| 55 to 64 Years | 27 | 14.7% |
| 65 to 74 Years | 38 | 20.6% |
| 75 to 84 Years | 13 | 7.1% |
| 85 Years and Over | 0 | 0.0% |
| Total | 184 | 100.0% |
Housing Finances in Palmyra
Median Income by Occupancy in Palmyra
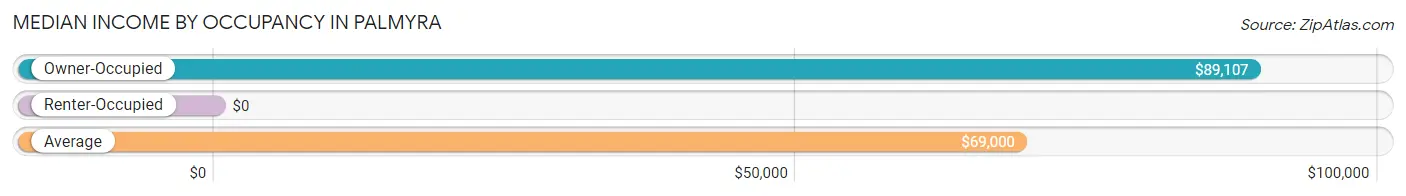
| Occupancy Type | # Households | Median Income |
| Owner-Occupied | 159 (86.4%) | $89,107 |
| Renter-Occupied | 25 (13.6%) | $0 |
| Average | 184 (100.0%) | $69,000 |
Occupancy by Householder Income Bracket in Palmyra
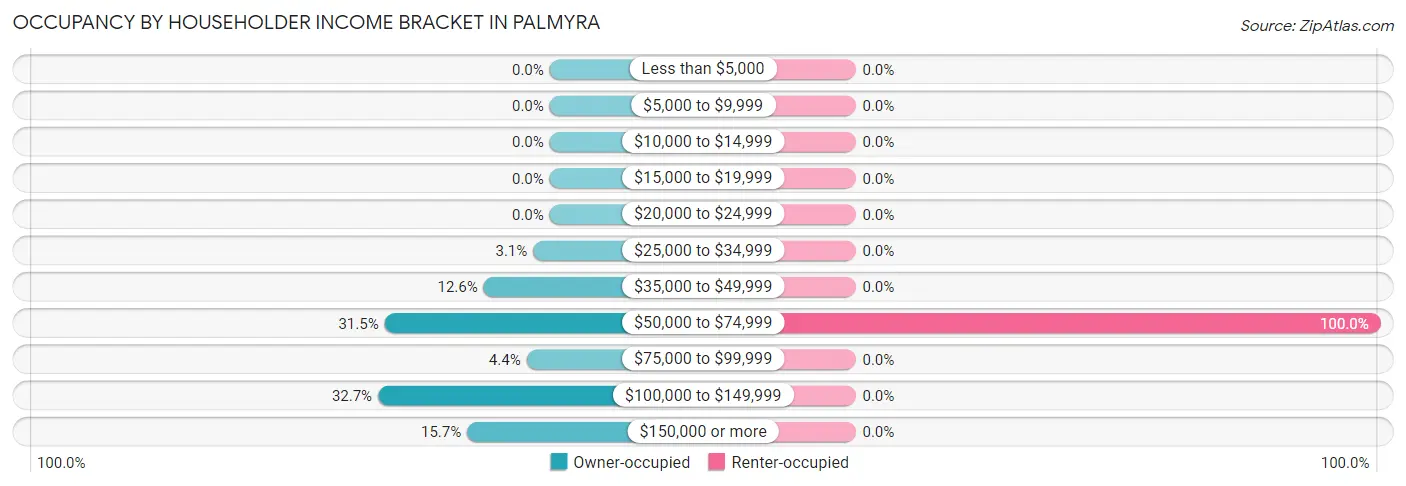
| Income Bracket | Owner-occupied | Renter-occupied |
| Less than $5,000 | 0 (0.0%) | 0 (0.0%) |
| $5,000 to $9,999 | 0 (0.0%) | 0 (0.0%) |
| $10,000 to $14,999 | 0 (0.0%) | 0 (0.0%) |
| $15,000 to $19,999 | 0 (0.0%) | 0 (0.0%) |
| $20,000 to $24,999 | 0 (0.0%) | 0 (0.0%) |
| $25,000 to $34,999 | 5 (3.1%) | 0 (0.0%) |
| $35,000 to $49,999 | 20 (12.6%) | 0 (0.0%) |
| $50,000 to $74,999 | 50 (31.5%) | 25 (100.0%) |
| $75,000 to $99,999 | 7 (4.4%) | 0 (0.0%) |
| $100,000 to $149,999 | 52 (32.7%) | 0 (0.0%) |
| $150,000 or more | 25 (15.7%) | 0 (0.0%) |
| Total | 159 (100.0%) | 25 (100.0%) |
Monthly Housing Cost Tiers in Palmyra
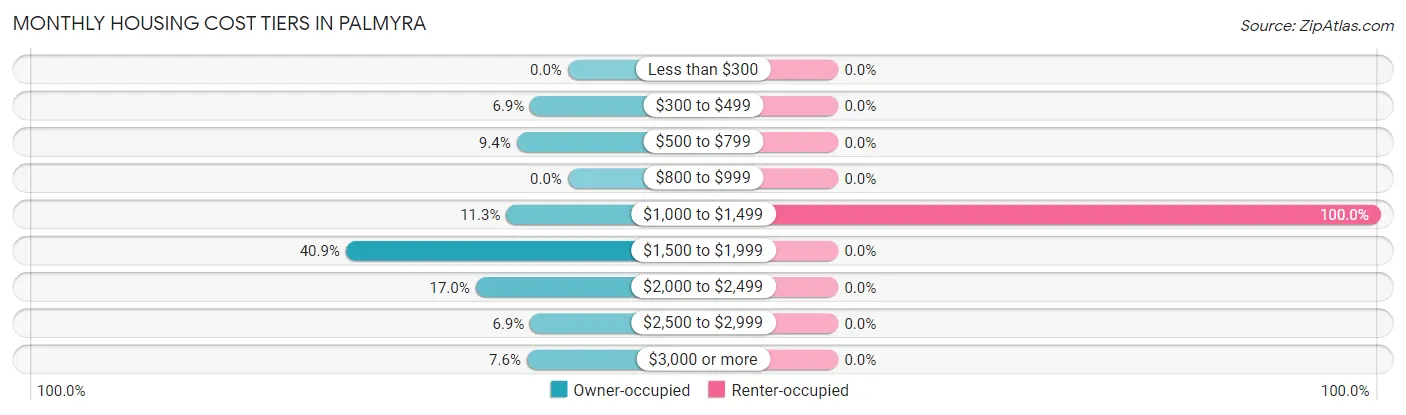
| Monthly Cost | Owner-occupied | Renter-occupied |
| Less than $300 | 0 (0.0%) | 0 (0.0%) |
| $300 to $499 | 11 (6.9%) | 0 (0.0%) |
| $500 to $799 | 15 (9.4%) | 0 (0.0%) |
| $800 to $999 | 0 (0.0%) | 0 (0.0%) |
| $1,000 to $1,499 | 18 (11.3%) | 25 (100.0%) |
| $1,500 to $1,999 | 65 (40.9%) | 0 (0.0%) |
| $2,000 to $2,499 | 27 (17.0%) | 0 (0.0%) |
| $2,500 to $2,999 | 11 (6.9%) | 0 (0.0%) |
| $3,000 or more | 12 (7.5%) | 0 (0.0%) |
| Total | 159 (100.0%) | 25 (100.0%) |
Physical Housing Characteristics in Palmyra
Housing Structures in Palmyra
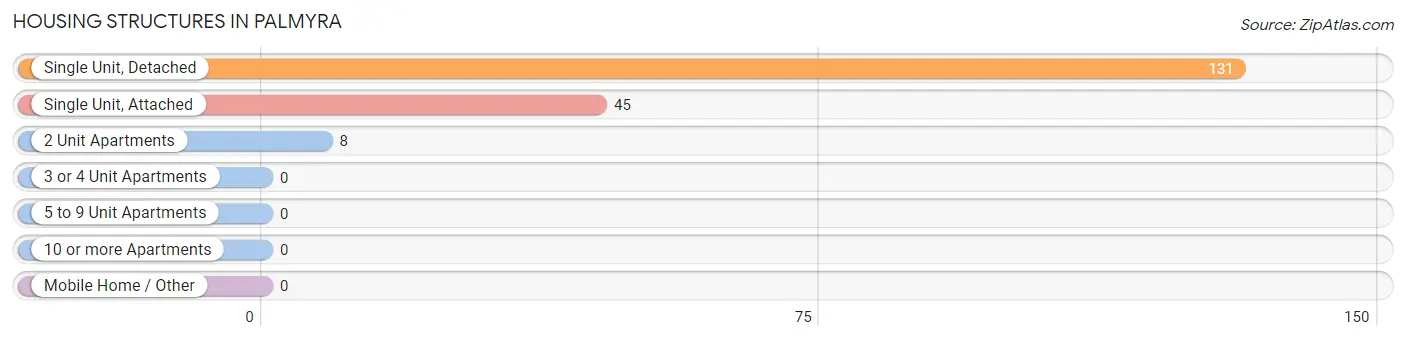
| Structure Type | # Housing Units | % Housing Units |
| Single Unit, Detached | 131 | 71.2% |
| Single Unit, Attached | 45 | 24.5% |
| 2 Unit Apartments | 8 | 4.3% |
| 3 or 4 Unit Apartments | 0 | 0.0% |
| 5 to 9 Unit Apartments | 0 | 0.0% |
| 10 or more Apartments | 0 | 0.0% |
| Mobile Home / Other | 0 | 0.0% |
| Total | 184 | 100.0% |
Housing Structures by Occupancy in Palmyra
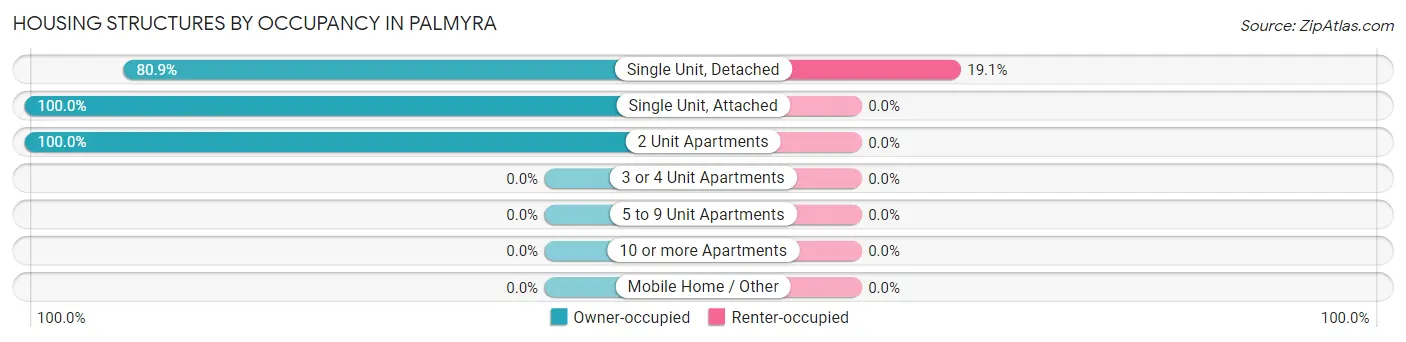
| Structure Type | Owner-occupied | Renter-occupied |
| Single Unit, Detached | 106 (80.9%) | 25 (19.1%) |
| Single Unit, Attached | 45 (100.0%) | 0 (0.0%) |
| 2 Unit Apartments | 8 (100.0%) | 0 (0.0%) |
| 3 or 4 Unit Apartments | 0 (0.0%) | 0 (0.0%) |
| 5 to 9 Unit Apartments | 0 (0.0%) | 0 (0.0%) |
| 10 or more Apartments | 0 (0.0%) | 0 (0.0%) |
| Mobile Home / Other | 0 (0.0%) | 0 (0.0%) |
| Total | 159 (86.4%) | 25 (13.6%) |
Housing Structures by Number of Rooms in Palmyra
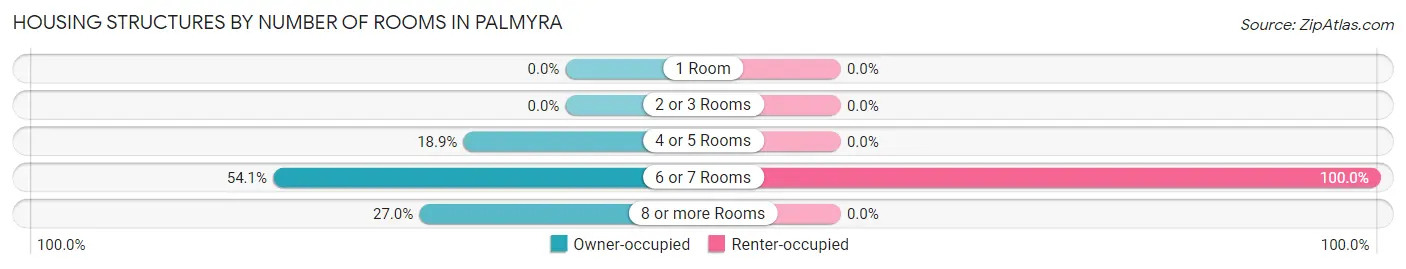
| Number of Rooms | Owner-occupied | Renter-occupied |
| 1 Room | 0 (0.0%) | 0 (0.0%) |
| 2 or 3 Rooms | 0 (0.0%) | 0 (0.0%) |
| 4 or 5 Rooms | 30 (18.9%) | 0 (0.0%) |
| 6 or 7 Rooms | 86 (54.1%) | 25 (100.0%) |
| 8 or more Rooms | 43 (27.0%) | 0 (0.0%) |
| Total | 159 (100.0%) | 25 (100.0%) |
Housing Structure by Heating Type in Palmyra
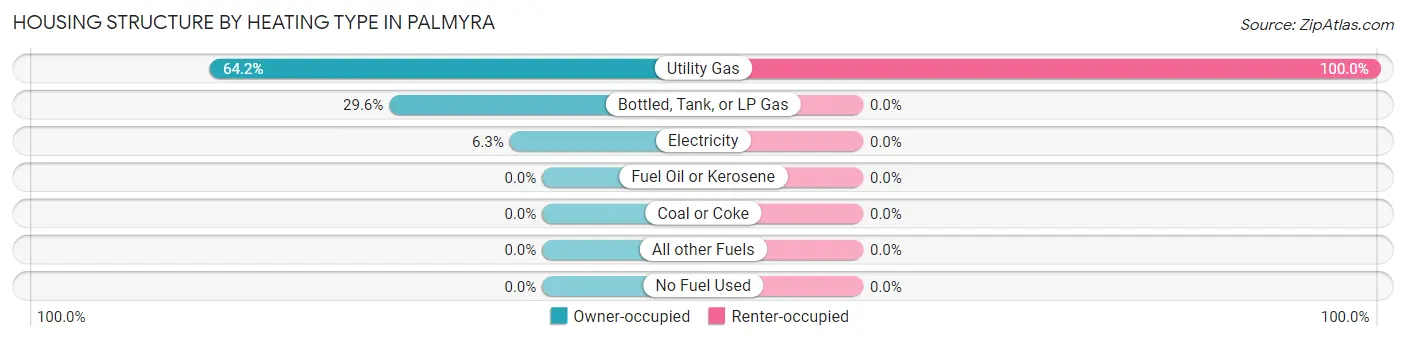
| Heating Type | Owner-occupied | Renter-occupied |
| Utility Gas | 102 (64.1%) | 25 (100.0%) |
| Bottled, Tank, or LP Gas | 47 (29.6%) | 0 (0.0%) |
| Electricity | 10 (6.3%) | 0 (0.0%) |
| Fuel Oil or Kerosene | 0 (0.0%) | 0 (0.0%) |
| Coal or Coke | 0 (0.0%) | 0 (0.0%) |
| All other Fuels | 0 (0.0%) | 0 (0.0%) |
| No Fuel Used | 0 (0.0%) | 0 (0.0%) |
| Total | 159 (100.0%) | 25 (100.0%) |
Household Vehicle Usage in Palmyra
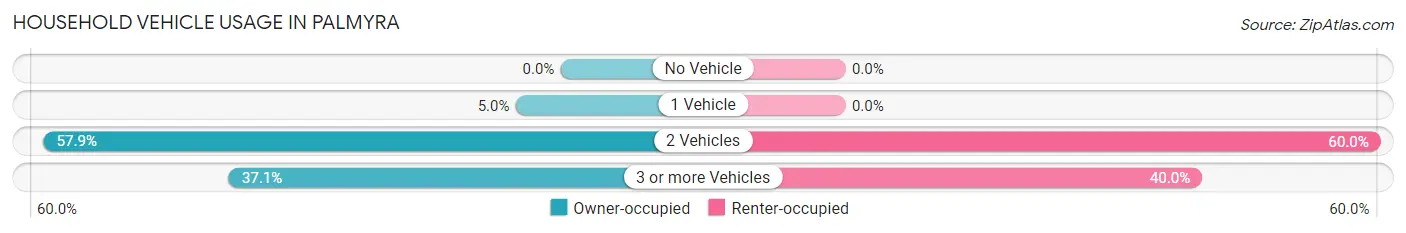
| Vehicles per Household | Owner-occupied | Renter-occupied |
| No Vehicle | 0 (0.0%) | 0 (0.0%) |
| 1 Vehicle | 8 (5.0%) | 0 (0.0%) |
| 2 Vehicles | 92 (57.9%) | 15 (60.0%) |
| 3 or more Vehicles | 59 (37.1%) | 10 (40.0%) |
| Total | 159 (100.0%) | 25 (100.0%) |
Real Estate & Mortgages in Palmyra
Real Estate and Mortgage Overview in Palmyra
| Characteristic | Without Mortgage | With Mortgage |
| Housing Units | 39 | 120 |
| Median Property Value | $496,700 | $423,800 |
| Median Household Income | - | - |
| Monthly Housing Costs | $557 | $12 |
| Real Estate Taxes | $2,654 | $0 |
Property Value by Mortgage Status in Palmyra
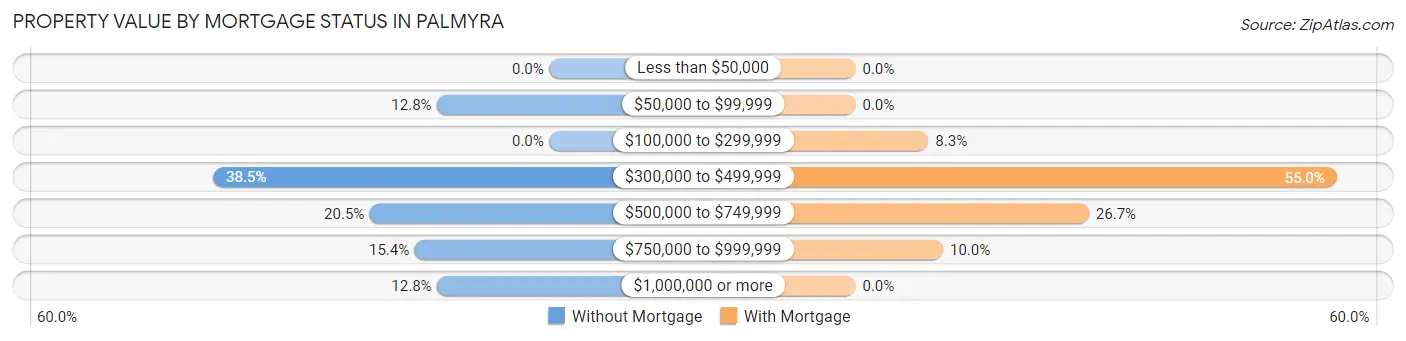
| Property Value | Without Mortgage | With Mortgage |
| Less than $50,000 | 0 (0.0%) | 0 (0.0%) |
| $50,000 to $99,999 | 5 (12.8%) | 0 (0.0%) |
| $100,000 to $299,999 | 0 (0.0%) | 10 (8.3%) |
| $300,000 to $499,999 | 15 (38.5%) | 66 (55.0%) |
| $500,000 to $749,999 | 8 (20.5%) | 32 (26.7%) |
| $750,000 to $999,999 | 6 (15.4%) | 12 (10.0%) |
| $1,000,000 or more | 5 (12.8%) | 0 (0.0%) |
| Total | 39 (100.0%) | 120 (100.0%) |
Household Income by Mortgage Status in Palmyra
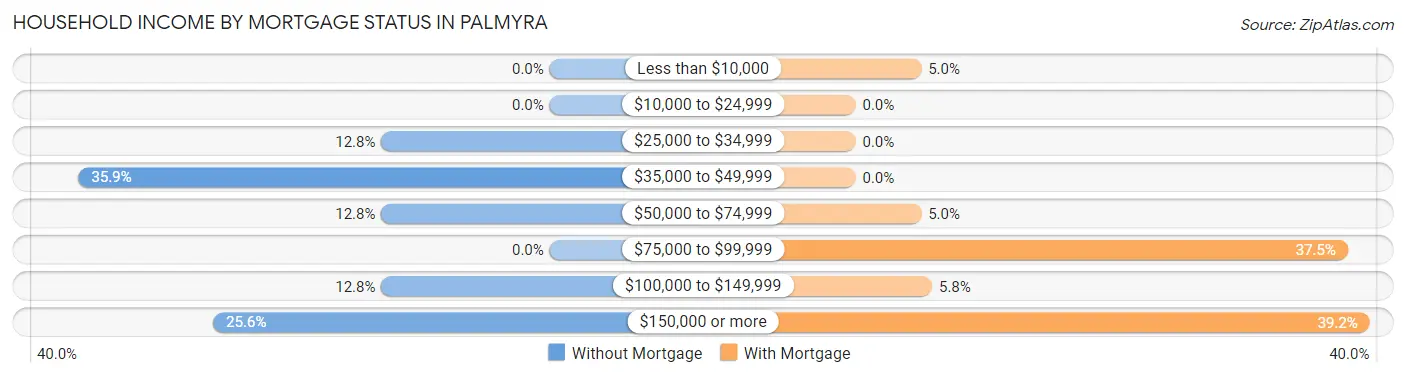
| Household Income | Without Mortgage | With Mortgage |
| Less than $10,000 | 0 (0.0%) | 6 (5.0%) |
| $10,000 to $24,999 | 0 (0.0%) | 0 (0.0%) |
| $25,000 to $34,999 | 5 (12.8%) | 0 (0.0%) |
| $35,000 to $49,999 | 14 (35.9%) | 0 (0.0%) |
| $50,000 to $74,999 | 5 (12.8%) | 6 (5.0%) |
| $75,000 to $99,999 | 0 (0.0%) | 45 (37.5%) |
| $100,000 to $149,999 | 5 (12.8%) | 7 (5.8%) |
| $150,000 or more | 10 (25.6%) | 47 (39.2%) |
| Total | 39 (100.0%) | 120 (100.0%) |
Property Value to Household Income Ratio in Palmyra
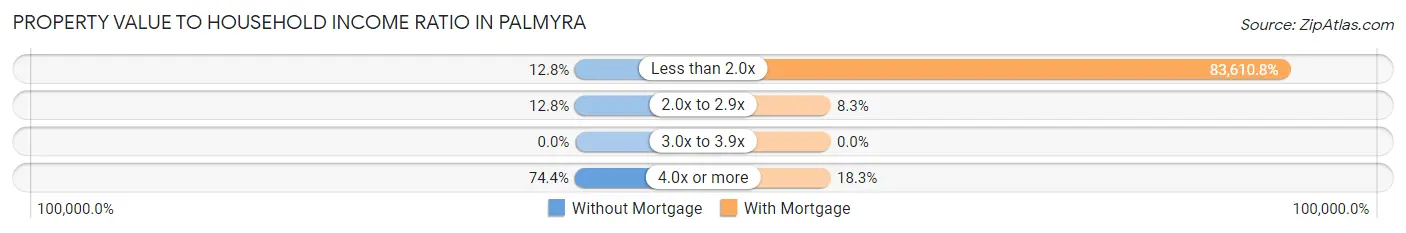
| Value-to-Income Ratio | Without Mortgage | With Mortgage |
| Less than 2.0x | 5 (12.8%) | 100,333 (83,610.8%) |
| 2.0x to 2.9x | 5 (12.8%) | 10 (8.3%) |
| 3.0x to 3.9x | 0 (0.0%) | 0 (0.0%) |
| 4.0x or more | 29 (74.4%) | 22 (18.3%) |
| Total | 39 (100.0%) | 120 (100.0%) |
Real Estate Taxes by Mortgage Status in Palmyra
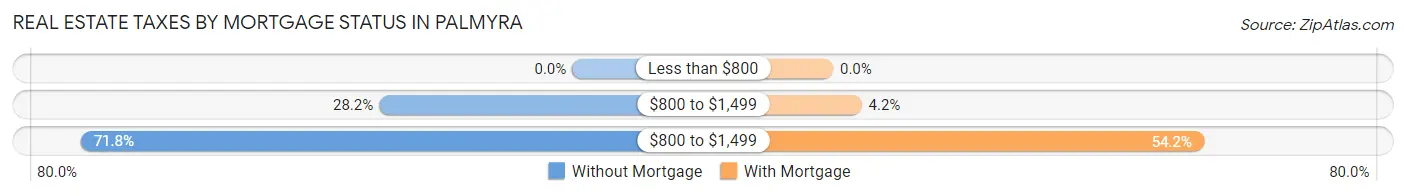
| Property Taxes | Without Mortgage | With Mortgage |
| Less than $800 | 0 (0.0%) | 0 (0.0%) |
| $800 to $1,499 | 11 (28.2%) | 5 (4.2%) |
| $800 to $1,499 | 28 (71.8%) | 65 (54.2%) |
| Total | 39 (100.0%) | 120 (100.0%) |
Health & Disability in Palmyra
Health Insurance Coverage by Age in Palmyra
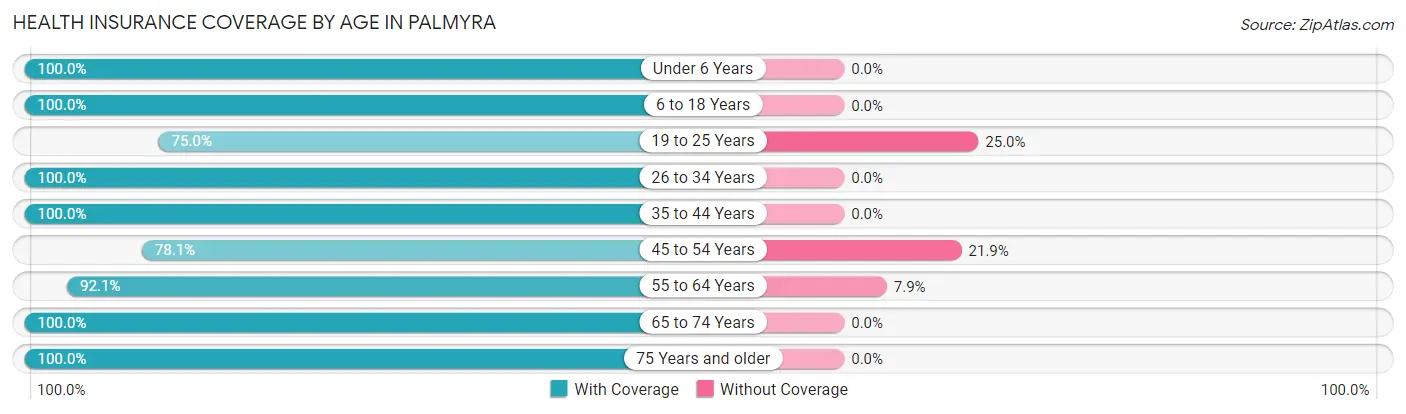
| Age Bracket | With Coverage | Without Coverage |
| Under 6 Years | 135 (100.0%) | 0 (0.0%) |
| 6 to 18 Years | 49 (100.0%) | 0 (0.0%) |
| 19 to 25 Years | 48 (75.0%) | 16 (25.0%) |
| 26 to 34 Years | 120 (100.0%) | 0 (0.0%) |
| 35 to 44 Years | 50 (100.0%) | 0 (0.0%) |
| 45 to 54 Years | 25 (78.1%) | 7 (21.9%) |
| 55 to 64 Years | 58 (92.1%) | 5 (7.9%) |
| 65 to 74 Years | 66 (100.0%) | 0 (0.0%) |
| 75 Years and older | 23 (100.0%) | 0 (0.0%) |
| Total | 574 (95.4%) | 28 (4.6%) |
Health Insurance Coverage by Citizenship Status in Palmyra
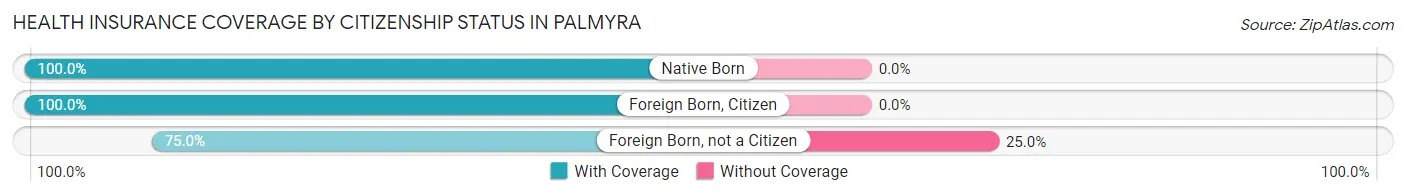
| Citizenship Status | With Coverage | Without Coverage |
| Native Born | 135 (100.0%) | 0 (0.0%) |
| Foreign Born, Citizen | 49 (100.0%) | 0 (0.0%) |
| Foreign Born, not a Citizen | 48 (75.0%) | 16 (25.0%) |
Health Insurance Coverage by Household Income in Palmyra
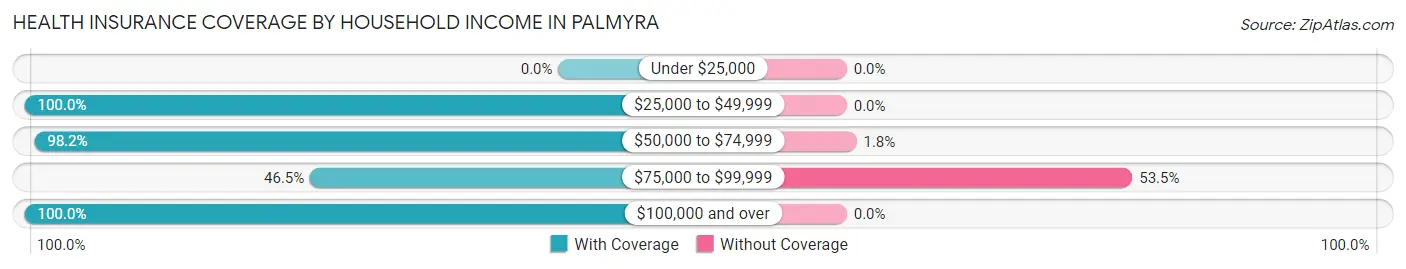
| Household Income | With Coverage | Without Coverage |
| Under $25,000 | 0 (0.0%) | 0 (0.0%) |
| $25,000 to $49,999 | 41 (100.0%) | 0 (0.0%) |
| $50,000 to $74,999 | 269 (98.2%) | 5 (1.8%) |
| $75,000 to $99,999 | 20 (46.5%) | 23 (53.5%) |
| $100,000 and over | 244 (100.0%) | 0 (0.0%) |
Public vs Private Health Insurance Coverage by Age in Palmyra
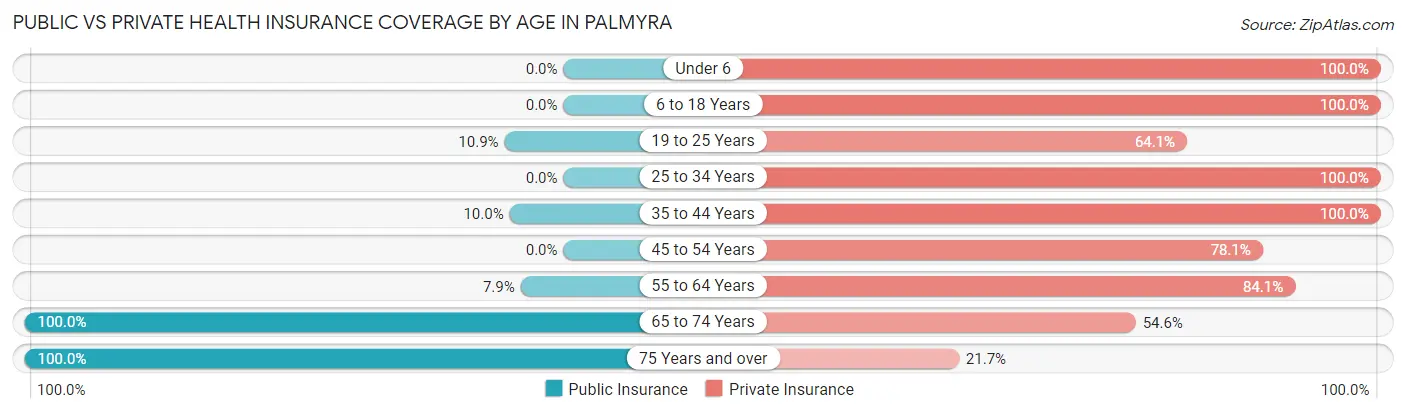
| Age Bracket | Public Insurance | Private Insurance |
| Under 6 | 0 (0.0%) | 135 (100.0%) |
| 6 to 18 Years | 0 (0.0%) | 49 (100.0%) |
| 19 to 25 Years | 7 (10.9%) | 41 (64.1%) |
| 25 to 34 Years | 0 (0.0%) | 120 (100.0%) |
| 35 to 44 Years | 5 (10.0%) | 50 (100.0%) |
| 45 to 54 Years | 0 (0.0%) | 25 (78.1%) |
| 55 to 64 Years | 5 (7.9%) | 53 (84.1%) |
| 65 to 74 Years | 66 (100.0%) | 36 (54.5%) |
| 75 Years and over | 23 (100.0%) | 5 (21.7%) |
| Total | 106 (17.6%) | 514 (85.4%) |
Disability Status by Sex by Age in Palmyra
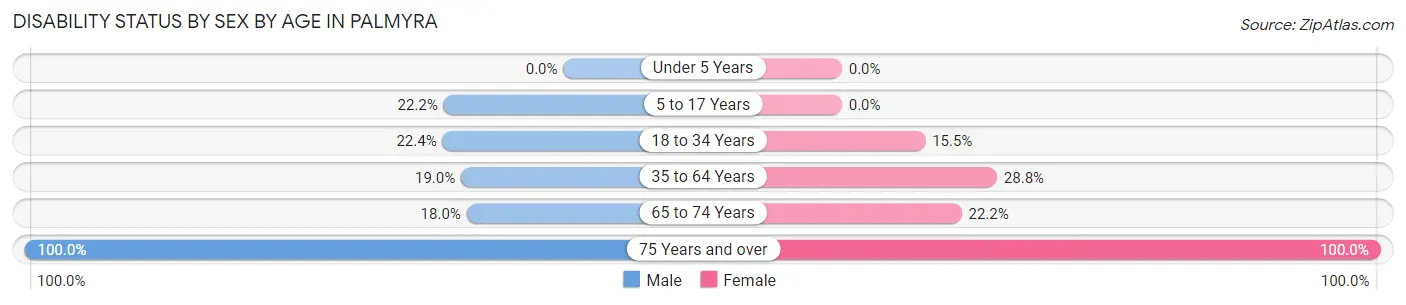
| Age Bracket | Male | Female |
| Under 5 Years | 0 (0.0%) | 0 (0.0%) |
| 5 to 17 Years | 6 (22.2%) | 0 (0.0%) |
| 18 to 34 Years | 24 (22.4%) | 13 (15.5%) |
| 35 to 64 Years | 15 (19.0%) | 19 (28.8%) |
| 65 to 74 Years | 7 (17.9%) | 6 (22.2%) |
| 75 Years and over | 18 (100.0%) | 5 (100.0%) |
Disability Class by Sex by Age in Palmyra
Disability Class: Hearing Difficulty
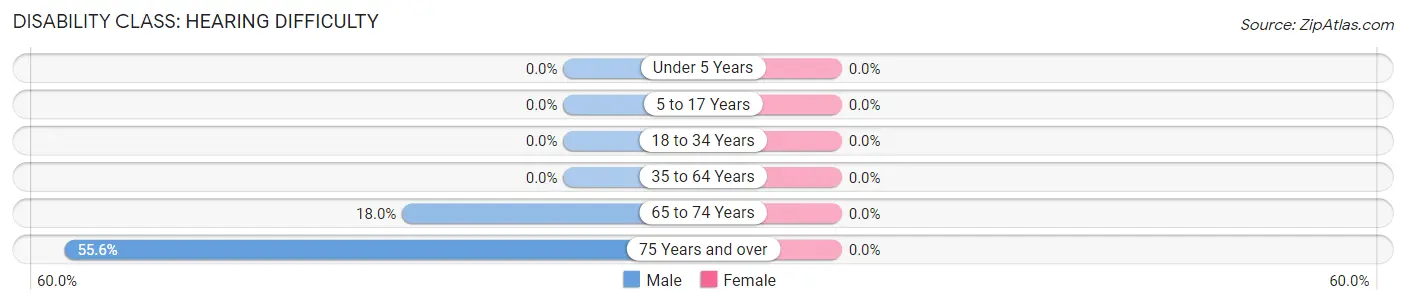
| Age Bracket | Male | Female |
| Under 5 Years | 0 (0.0%) | 0 (0.0%) |
| 5 to 17 Years | 0 (0.0%) | 0 (0.0%) |
| 18 to 34 Years | 0 (0.0%) | 0 (0.0%) |
| 35 to 64 Years | 0 (0.0%) | 0 (0.0%) |
| 65 to 74 Years | 7 (17.9%) | 0 (0.0%) |
| 75 Years and over | 10 (55.6%) | 0 (0.0%) |
Disability Class: Vision Difficulty
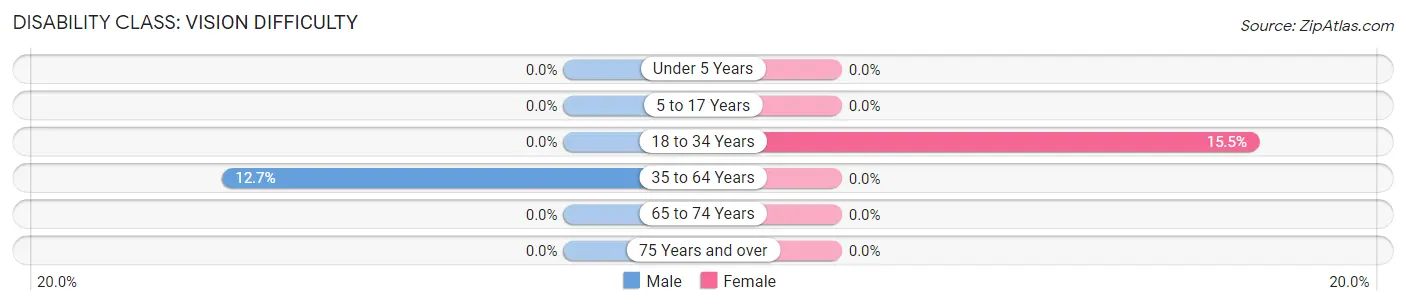
| Age Bracket | Male | Female |
| Under 5 Years | 0 (0.0%) | 0 (0.0%) |
| 5 to 17 Years | 0 (0.0%) | 0 (0.0%) |
| 18 to 34 Years | 0 (0.0%) | 13 (15.5%) |
| 35 to 64 Years | 10 (12.7%) | 0 (0.0%) |
| 65 to 74 Years | 0 (0.0%) | 0 (0.0%) |
| 75 Years and over | 0 (0.0%) | 0 (0.0%) |
Disability Class: Cognitive Difficulty
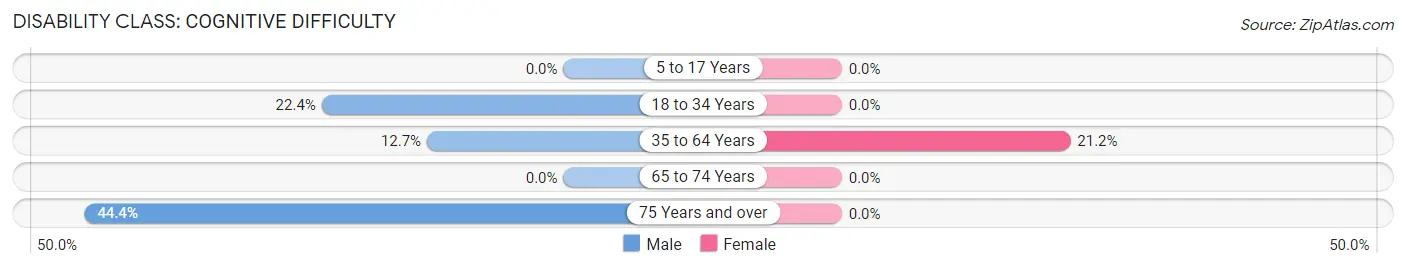
| Age Bracket | Male | Female |
| 5 to 17 Years | 0 (0.0%) | 0 (0.0%) |
| 18 to 34 Years | 24 (22.4%) | 0 (0.0%) |
| 35 to 64 Years | 10 (12.7%) | 14 (21.2%) |
| 65 to 74 Years | 0 (0.0%) | 0 (0.0%) |
| 75 Years and over | 8 (44.4%) | 0 (0.0%) |
Disability Class: Ambulatory Difficulty
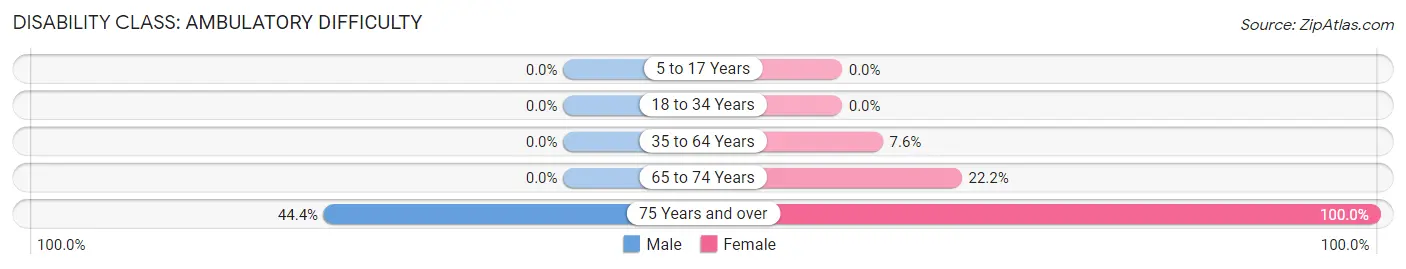
| Age Bracket | Male | Female |
| 5 to 17 Years | 0 (0.0%) | 0 (0.0%) |
| 18 to 34 Years | 0 (0.0%) | 0 (0.0%) |
| 35 to 64 Years | 0 (0.0%) | 5 (7.6%) |
| 65 to 74 Years | 0 (0.0%) | 6 (22.2%) |
| 75 Years and over | 8 (44.4%) | 5 (100.0%) |
Disability Class: Self-Care Difficulty
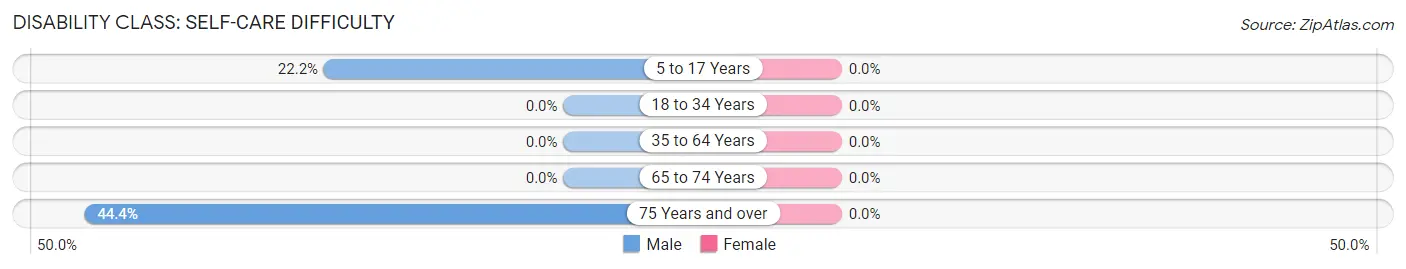
| Age Bracket | Male | Female |
| 5 to 17 Years | 6 (22.2%) | 0 (0.0%) |
| 18 to 34 Years | 0 (0.0%) | 0 (0.0%) |
| 35 to 64 Years | 0 (0.0%) | 0 (0.0%) |
| 65 to 74 Years | 0 (0.0%) | 0 (0.0%) |
| 75 Years and over | 8 (44.4%) | 0 (0.0%) |
Technology Access in Palmyra
Computing Device Access in Palmyra
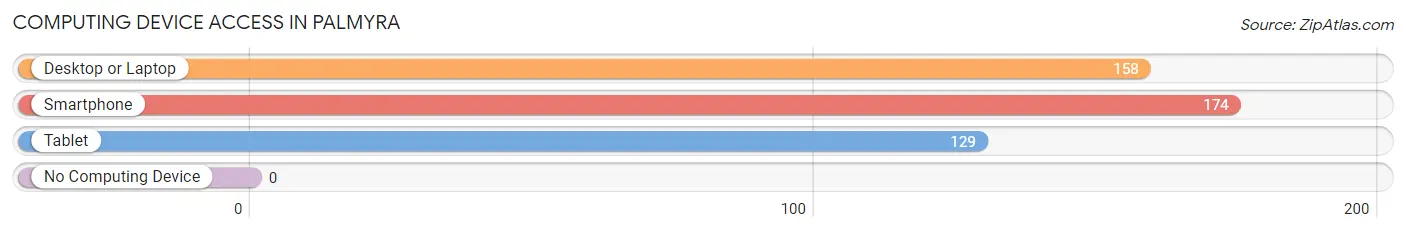
| Device Type | # Households | % Households |
| Desktop or Laptop | 158 | 85.9% |
| Smartphone | 174 | 94.6% |
| Tablet | 129 | 70.1% |
| No Computing Device | 0 | 0.0% |
| Total | 184 | 100.0% |
Internet Access in Palmyra
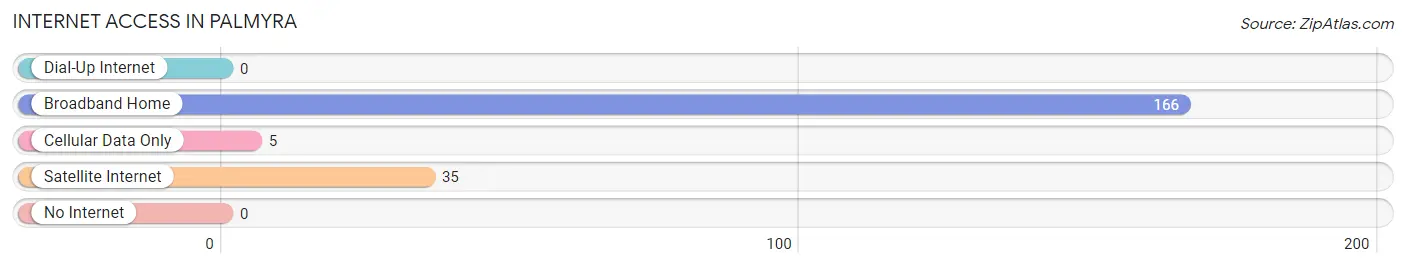
| Internet Type | # Households | % Households |
| Dial-Up Internet | 0 | 0.0% |
| Broadband Home | 166 | 90.2% |
| Cellular Data Only | 5 | 2.7% |
| Satellite Internet | 35 | 19.0% |
| No Internet | 0 | 0.0% |
| Total | 184 | 100.0% |
Palmyra Summary
Palmyra is a small town located in the southeastern corner of Utah, in the United States. It is situated in the San Rafael Swell, a large geological formation in the Colorado Plateau. The town is located in Emery County, and is the county seat. The population of Palmyra was estimated to be around 200 people in 2020.
History
The area around Palmyra was first settled by Mormon pioneers in the late 1800s. The town was originally known as “Little Muddy”, and was later renamed Palmyra in 1891. The name was chosen to honor the ancient city of Palmyra in Syria.
The town was initially a farming community, and the main crops grown were wheat, corn, and hay. In the early 1900s, the town began to grow and develop, and the first school was built in 1910.
In the 1920s, Palmyra was a popular tourist destination, and the town was known for its natural beauty. The town was also home to a number of businesses, including a hotel, a bank, and a movie theater.
Geography
Palmyra is located in the San Rafael Swell, a large geological formation in the Colorado Plateau. The town is situated at an elevation of 5,400 feet, and is surrounded by mountains and canyons. The climate in Palmyra is semi-arid, with hot summers and cold winters.
The town is located near the San Rafael River, and is also close to the Green River. The area is known for its scenic beauty, and is popular with hikers, campers, and other outdoor enthusiasts.
Economy
The economy of Palmyra is largely based on agriculture and tourism. The town is home to a number of farms, and the main crops grown are wheat, corn, and hay. The town is also home to a number of businesses, including a hotel, a bank, and a movie theater.
The town is also a popular tourist destination, and is known for its natural beauty. The area is popular with hikers, campers, and other outdoor enthusiasts.
Demographics
The population of Palmyra was estimated to be around 200 people in 2020. The town is predominantly white, with a small Hispanic population. The median household income in Palmyra is around $35,000, and the median home value is around $150,000. The town has a low unemployment rate, and the poverty rate is below the national average.
Common Questions
What is Per Capita Income in Palmyra?
Per Capita income in Palmyra is $29,234.
What is the Median Family Income in Palmyra?
Median Family Income in Palmyra is $69,750.
What is the Median Household income in Palmyra?
Median Household Income in Palmyra is $69,000.
What is Inequality or Gini Index in Palmyra?
Inequality or Gini Index in Palmyra is 0.29.
What is the Total Population of Palmyra?
Total Population of Palmyra is 602.
What is the Total Male Population of Palmyra?
Total Male Population of Palmyra is 356.
What is the Total Female Population of Palmyra?
Total Female Population of Palmyra is 246.
What is the Ratio of Males per 100 Females in Palmyra?
There are 144.72 Males per 100 Females in Palmyra.
What is the Ratio of Females per 100 Males in Palmyra?
There are 69.10 Females per 100 Males in Palmyra.
What is the Median Population Age in Palmyra?
Median Population Age in Palmyra is 29.6 Years.
What is the Average Family Size in Palmyra
Average Family Size in Palmyra is 3.4 People.
What is the Average Household Size in Palmyra
Average Household Size in Palmyra is 3.3 People.
How Large is the Labor Force in Palmyra?
There are 224 People in the Labor Forcein in Palmyra.
What is the Percentage of People in the Labor Force in Palmyra?
52.0% of People are in the Labor Force in Palmyra.
What is the Unemployment Rate in Palmyra?
Unemployment Rate in Palmyra is 5.4%.